
West Island Timberlands Sustainable Forest Management Plan2).pdf · West Island Timberlands...
77
Hishuk-ish-tsawalk (everything is one) Towards Sustainable Forest Management West Island Timberlands Sustainable Forest Management Plan 2005 Data Set May 2006
Transcript of West Island Timberlands Sustainable Forest Management Plan2).pdf · West Island Timberlands...
Hishuk-ish-tsawalk(everything is one)
TowardsSustainable Forest Management
West Island Timberlands
Sustainable Forest Management Plan
2005 Data Set
May 2006
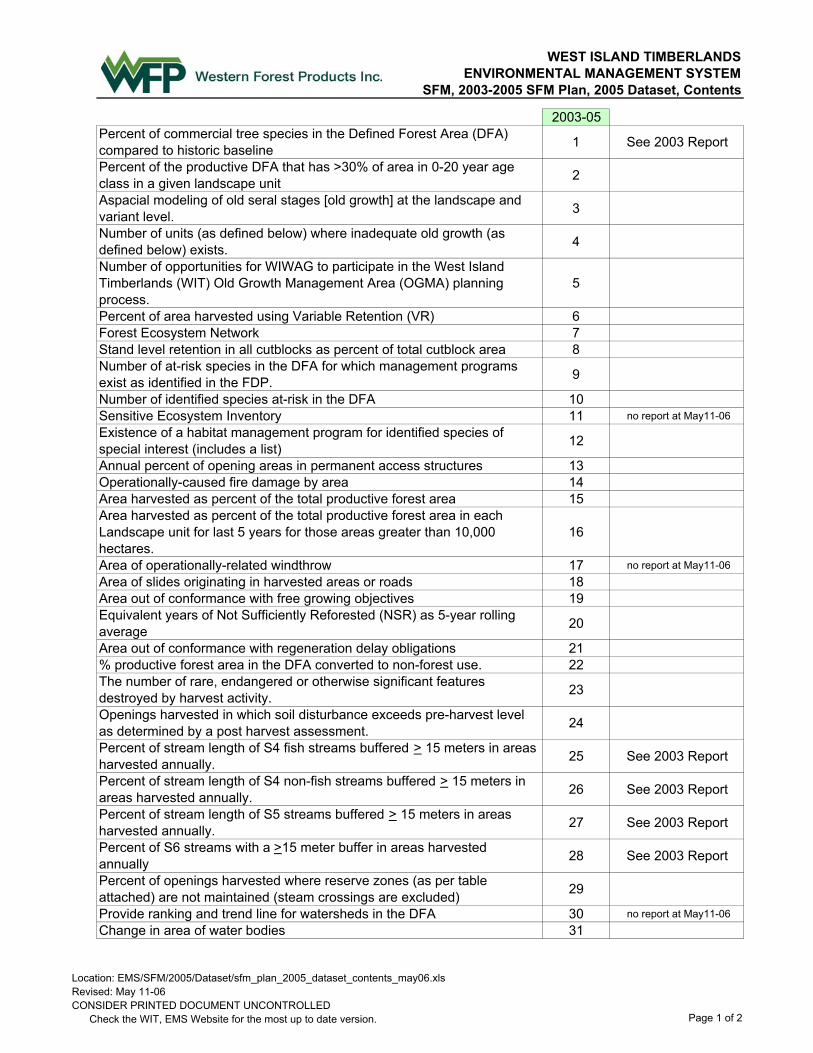
WEST ISLAND TIMBERLANDSENVIRONMENTAL MANAGEMENT SYSTEM
SFM, 2003-2005 SFM Plan, 2005 Dataset, Contents
2003-05Percent of commercial tree species in the Defined Forest Area (DFA) compared to historic baseline 1 See 2003 Report
Percent of the productive DFA that has >30% of area in 0-20 year age class in a given landscape unit 2
Aspacial modeling of old seral stages [old growth] at the landscape and variant level. 3
Number of units (as defined below) where inadequate old growth (as defined below) exists. 4
Number of opportunities for WIWAG to participate in the West Island Timberlands (WIT) Old Growth Management Area (OGMA) planning process.
5
Percent of area harvested using Variable Retention (VR) 6Forest Ecosystem Network 7Stand level retention in all cutblocks as percent of total cutblock area 8Number of at-risk species in the DFA for which management programs exist as identified in the FDP. 9
Number of identified species at-risk in the DFA 10Sensitive Ecosystem Inventory 11 no report at May11-06
Existence of a habitat management program for identified species of special interest (includes a list) 12
Annual percent of opening areas in permanent access structures 13Operationally-caused fire damage by area 14Area harvested as percent of the total productive forest area 15Area harvested as percent of the total productive forest area in each Landscape unit for last 5 years for those areas greater than 10,000 hectares.
16
Area of operationally-related windthrow 17 no report at May11-06
Area of slides originating in harvested areas or roads 18Area out of conformance with free growing objectives 19Equivalent years of Not Sufficiently Reforested (NSR) as 5-year rolling average 20
Area out of conformance with regeneration delay obligations 21% productive forest area in the DFA converted to non-forest use. 22The number of rare, endangered or otherwise significant features destroyed by harvest activity. 23
Openings harvested in which soil disturbance exceeds pre-harvest level as determined by a post harvest assessment. 24
Percent of stream length of S4 fish streams buffered > 15 meters in areas harvested annually. 25 See 2003 Report
Percent of stream length of S4 non-fish streams buffered > 15 meters in areas harvested annually. 26 See 2003 Report
Percent of stream length of S5 streams buffered > 15 meters in areas harvested annually. 27 See 2003 Report
Percent of S6 streams with a >15 meter buffer in areas harvested annually 28 See 2003 Report
Percent of openings harvested where reserve zones (as per table attached) are not maintained (steam crossings are excluded) 29
Provide ranking and trend line for watersheds in the DFA 30 no report at May11-06
Change in area of water bodies 31
Location: EMS/SFM/2005/Dataset/sfm_plan_2005_dataset_contents_may06.xlsRevised: May 11-06CONSIDER PRINTED DOCUMENT UNCONTROLLED Check the WIT, EMS Website for the most up to date version. Page 1 of 2

WEST ISLAND TIMBERLANDSENVIRONMENTAL MANAGEMENT SYSTEM
SFM, 2003-2005 SFM Plan, 2005 Dataset, Contents
2003-05Enhance the long term uptake and storage of carbon 32 See 2003 ReportForest management practices continue to provide opportunities for NTFP harvesting 33 See 2003 Report
Annual harvest (5 year average) as percent of LTHL 34Percent of harvesting adjacent to protected areas that is VR 35Percent of park perimeter harvested within previous 5 years. 36Percent of roads from recreation road inventory that are maintained. 37Percent of DFA covered by a recreational inventory 38Number of hectares in which visual condition fails to meet Visual Quality Objectives 39
$ of WIT wages, salaries, contracts compared to previous years 40The portion of employment spending in Indicator 41 that is within the Alberni Clayoquot Region 41 See 2003 Report
Employee and contractor (to include small bus, logging and silviculture contractors) jobs/cubic meter of fibre logged within the DFA. 42 See 2003 Report
The portion of jobs in Indicator 42 that are within the Alberni Clayoquot Region 43 See 2003 Report
Number of local (Alberni Clayoquot Region) processing jobs (including Coulson and Norske) that are associated with fibre from the DFA 44 See 2003 Report
Total percent of Major Contractor non-wage spending within the Alberni Clayoquot Region as a % of total non-wage expenditures. 45 See 2003 Report
Total % of Weyerhaeuser non-wage spending that is within the Alberni Clayoquot Region. 46 See 2003 Report
Number of all contracts let and their subcontractors and the portion of those that live in the Alberni Clayoquot Region 47 See 2003 Report
Annual harvest level compared to last 5 years 48Conversations with the Advisory around conversion of 2nd growth fibre locally have taken place. 49 See 2003 Report
Annual harvest compared to local log consumption that is provided by Weyerhaeuser. 50
Total $ spent on capitol improvements in Weyerhaeuser mill facilities. 51 See 2003 ReportNumber of First Nations that have requested a Cultural Heritage Resource contract vs. the number who have one 52
% of surveys conducted out of the number requested 53First Nations information sharing and referrals program 54Percent of blocks where agreement is reached around the management of Cultural Heritage Resource contracts. 55
Number of First Nations signing contracts. 56Contract $ paid to all First Nations contractors compared to previous years. 57
Percent of changes to operational plans as a result of responding to public comments. 58
The number of communication activities implemented compared to the communications plan list. 59
Percent of planners oriented to red/blue list species annually 60Number of programs or presentations that target youth for forest awareness/information. 61
Percent of workers that are trained/year in the First Nations Cultural Awareness Program. 62
Location: EMS/SFM/2005/Dataset/sfm_plan_2005_dataset_contents_may06.xlsRevised: May 11-06CONSIDER PRINTED DOCUMENT UNCONTROLLED Check the WIT, EMS Website for the most up to date version. Page 2 of 2
DFA 2005, SFM Data Set April 28/06
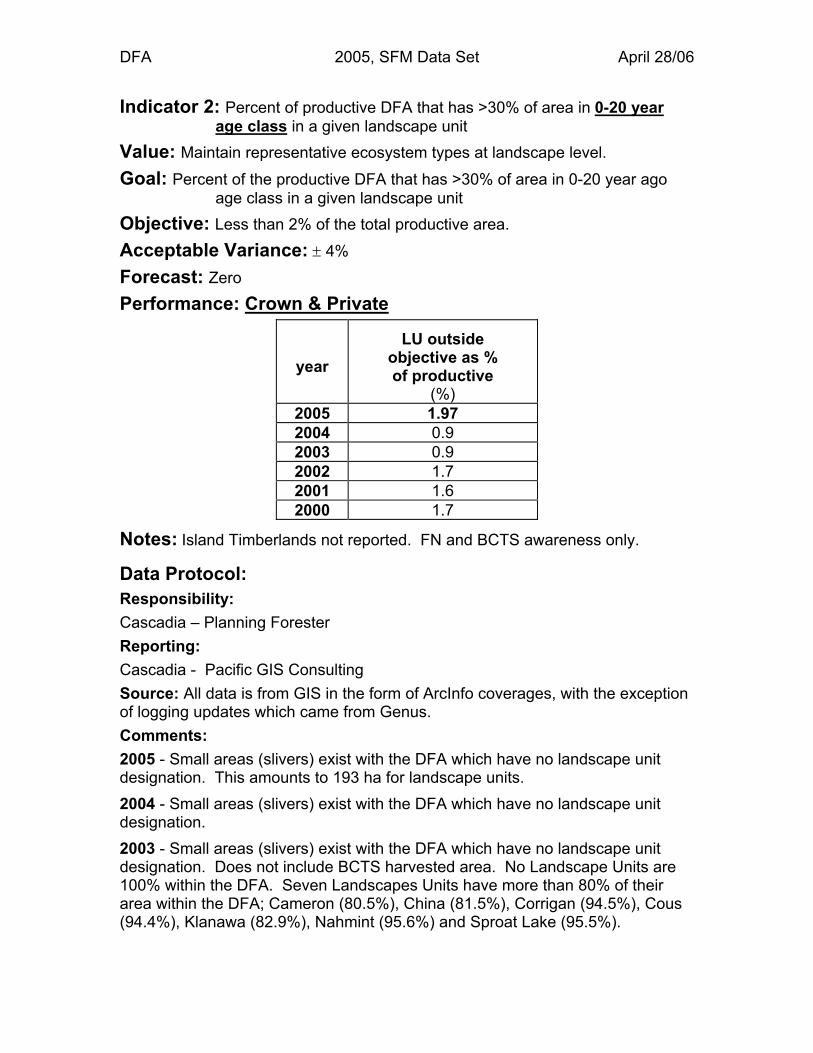
Indicator 2: Percent of productive DFA that has >30% of area in 0-20 yearage class in a given landscape unit
Value: Maintain representative ecosystem types at landscape level.
Goal: Percent of the productive DFA that has >30% of area in 0-20 year agoage class in a given landscape unit
Objective: Less than 2% of the total productive area.
Acceptable Variance: ± 4%
Forecast: Zero
Performance: Crown & Private
yearLU outside
objective as %of productive
(%)2005 1.972004 0.92003 0.92002 1.72001 1.62000 1.7
Notes: Island Timberlands not reported. FN and BCTS awareness only.
Data Protocol:Responsibility:Cascadia – Planning ForesterReporting:Cascadia - Pacific GIS ConsultingSource: All data is from GIS in the form of ArcInfo coverages, with the exceptionof logging updates which came from Genus.Comments:2005 - Small areas (slivers) exist with the DFA which have no landscape unitdesignation. This amounts to 193 ha for landscape units.2004 - Small areas (slivers) exist with the DFA which have no landscape unitdesignation.2003 - Small areas (slivers) exist with the DFA which have no landscape unitdesignation. Does not include BCTS harvested area. No Landscape Units are100% within the DFA. Seven Landscapes Units have more than 80% of theirarea within the DFA; Cameron (80.5%), China (81.5%), Corrigan (94.5%), Cous(94.4%), Klanawa (82.9%), Nahmint (95.6%) and Sproat Lake (95.5%).

DFA 2005, SFM Progress Report April 3/06
Indicator 3: The number of Landscape Units [LU] where non-contributinglandbase unit is analyzed.
Value: The representation of the non-contributing landbase.
Objective: The level of the non-contributing landbase is understood.
Target: In 2006, once OGMA designations are complete, analyze the non-contributing landbase in 4 landscape units.
Acceptable Variance: - 1 (or 3)
Forecast: all
2006 – 2009 SFM Plan: Indicator 2.
Performance: Crown only
year LU’sanalyzed(number)
2005 32004 0
Notes: Island Timberlands, FN, BCTS not reporting.
Data Protocol:Responsibility:Cascadia - Planning ForesterReporting:Source:Comments:2005 - Three landscape units (Caycuse, Nitinat and Walbran) were analyzed andpresented at a WIWAG eco-subcommittee meeting.2004 - The non-contributing landbase is analyzed following draft OGMAdesignations. This was done for Sproat in 2002. No others have been done.

DFA 2005, SFM Data Set April 28/06
Indicator 4: Number of units (as defined below) where inadequate old growth(as defined below) exists.
Value: Variety and patterns of ecosystem types at landscape level
Goal: Maintain representative ecosystems across the landscape
Definitions:Unit: Variant within a landscape unit within the DFA that is greater than 250
hectares.Inadequate old growth: inadequate is defined as per the provincial guidelines
Objective: Do not increase the number of units where inadequate old growthexists
Acceptable Variance: Two units increase
Forecast: Zero increase
2002 SFM Plan: Reported previously (in part) as Indicators # 3
Performance: Crown & Private
year inadequateold growth
(units)2005 (1) 0
2004 32003 3 (2) baseline2002 13 (3)
Notes:(1) Island Timberlands not reported. FN and BCTS awareness only.(2) landscape units greater than 250 hectares(3) includes all landscape unitsHarvested blocks are reported in the year that harvesting is completed.
Data Protocol:Responsibility:Cascadia - Planning ForesterIsland Timberlands - D. MedvesReporting:Cascadia - Pacific GIS Consulting

DFA 2005, SFM Data Set April 28/06
Indicator 4: Number of units (as defined below) where inadequate old growth(as defined below) exists cont.
Source: All data is from GIS in the form of ArcInfo coverages, with the exceptionof logging updates which came from Genus.
Comments:2004 – The productive forest area for Indicator 4 is less than the productive areareported in Indicator 2 as Indicator 4 does not report Landscape Units (LU) andBiogeoclimatic Ecosystem Classification (BEC) units with less than 250 hectares.Also “Slivers,” which are narrow gaps created when linework from TRIM basemapping (1:20,000) and Government BEC zones (1:250,000) do not matchexactly; do not show up in the data. And finally, areas with a BEC designation ofAlpine Tundra (AT) are not included.2003 – A unit is a variant within a landscape unit within the DFA that is greaterthan 250 hectares. Old growth stands are 250+ years for all species except forpine, alder and maple where stands are mature at 140+ years. LU/BEC Growthtargets were taken from: Table 2.8a Old Growth Retention Report, February 26,2004, Regional landscape Unit Planning Database v2.01. Old Growth targets inlandscape units with a Low BEO are reduced to 1/3 of the full target.

DFA 2005, SFM Data Set March 31/06
Indicator 5: Number of opportunities for WIWAG to participate in the West Island Timberlands (WIT) Old Growth Management Area (OGMA) planning process.
Value: Variety and patterns of ecosystem types at landscape level
Goal: Maintain representative ecosystems across the landscape
Objective: Invitations are extended to WIWAG for 100% of Landscape Unit planning meetings
Acceptable Variance: 25%
Forecast:Performance: Crown only
year meetings(number)
WIWAGattendance
(number)
WIWAGattendance
(percent)2005 3 3 100%2004 3 3 100%2003 4 3 75%
Notes: Island Timberlands, FN and BCTS awareness only.
Data Protocol:Responsibility:Cascadia - Planning ForesterReporting:Source:Comments:2005 - Four meetings (Renfrew Aggregate – 1, Central Aggregate – 3) were heldin 2005. WIWAG members were not invited to the introductory meeting for theCentral Aggregate as it dealt with methodology and data sources.2004 - Three meetings for the Renfrew Aggregate (Nitinat, Walbran and CaycuseLandscape Units) were held, with WIWAG member(s) present for all three.Meetings for the Barkley Aggregate (Henderson and Effingham Landscape Units)were held. WIWAG reps were invited, but declined. This area is now part of theBCTS takeback.
DFA 2005, SFM Data Set April 28/06
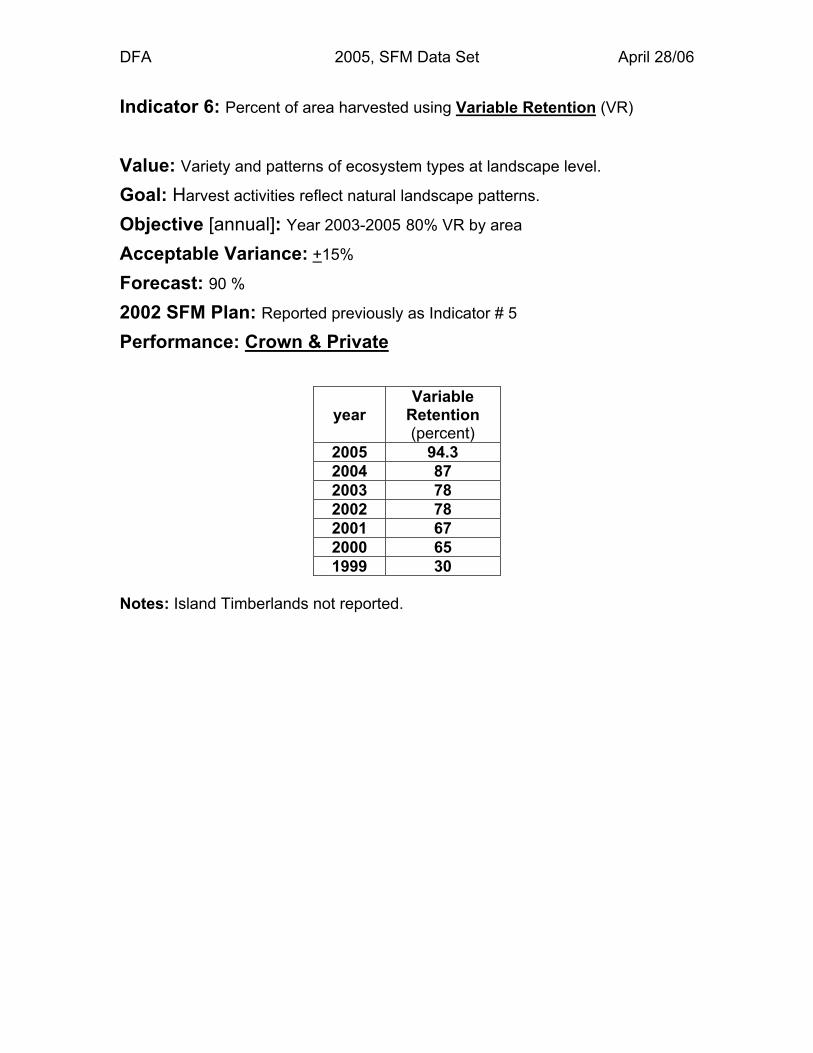
Indicator 6: Percent of area harvested using Variable Retention (VR)
Value: Variety and patterns of ecosystem types at landscape level.
Goal: Harvest activities reflect natural landscape patterns.
Objective [annual]: Year 2003-2005 80% VR by area
Acceptable Variance: +15%
Forecast: 90 %
2002 SFM Plan: Reported previously as Indicator # 5
Performance: Crown & Private
yearVariable
Retention(percent)
2005 94.32004 872003 782002 782001 672000 651999 30
Notes: Island Timberlands not reported.
DFA 2005, SFM Data Set April 28/06
Indicator 6: Percent of area harvested using Variable Retention (VR) cont.
Data Protocol:Responsibility:Cascadia - Planning ForesterReporting:Cascadia - D. Bryant (contractor)FN – D. Bryant (contractor)BCTS - Timber Sales Program ForesterSource: Variable Retention Tracking Spreadsheet -WeyerhaeuserComments:2004BCTS does not use VR, instead they use ‘Retention’ systems. The retentionsystem is defined under the Forest Practices Code as “a silvicultural system thatis designed to (a) retain individual trees or groups of trees to maintain structuraldiversity over the area of the cutblock for at least one rotation, and (b) leavemore than half the total area of the cutblock within one tree height from the baseof a tree or group of trees, whether or not the tree or group of trees is inside thecutblock.”
2003Hayes - The shortfall has been created by Hayes inheriting SP approvedcutblocks that were engineered prior to 2003. All of the remaining cutblocks are100% VR. In other words, all of 2003 engineering has been 100% VR with theexception of 862119. This cutblock will not be harvesting complete until 2004(hence not in current VR reporting). The FDP identified 862119 as havingsignificant windthrow challenges and therefore was not a suitable candidate forVR.
2002 - Small Business or roads not included. VR hectares are calculated byadding up the total hectares logged (within the year) of each block considered tobe a Variable Retention block. The retention system is defined under the ForestPractices Code as “a silvicultural system that is designed to (a) retain individualtrees or groups of trees to maintain structural diversity over the area of thecutblock for at least one rotation, and (b) leave more than half the total area ofthe cutblock within one tree height from the base of a tree or group of trees,whether or not the tree or group of trees is inside the cutblock.”

DFA 2005, SFM Data Set April 28/06
Indicator 7: Forest Ecosystem Network (FEN)
Value: Connectivity and fragmentation
Goal: Forest connectivity is maintained (in order to protect genetic and speciesmigration and relationships throughout the landscape unit)
Objective [annual]: Maintain the Forest Ecosystem Network in each LU untilsuch time as the LU planning process has identified OGMA’s
Acceptable Variance: Zero
Forecast:Performance: Crown & Private
year Connectivity(y/n)
2005 yes2004 yes2003 yes2002 yes
Notes: Island Timberlands not reporting. FN and BCTS awareness only.
Data Protocol:Responsibility:Cascadia - Planning ForesterReporting:Cascadia - Planning ForesterSource:Comments:Data for this indicator does not include the Park Trade or other minor private landholdings.
2004 – No changes were noted.

DFA 2005, SFM Data Set April 28/06
Indicator 8: Stand level retention in all cutblocks as percent of total cutblock area
Value: Stand level diversity
Goal: Structural diversity is maintained at the stand level
Objective [annual]: > 15% in 2003-2005
Acceptable Variance: 10% for a lower limit
Forecast: 30%
2002 SFM Plan: Reported previously as Indicator # 7
Performance: Crown & Private
yearstand retentionas % of TAUP
(percent)2005 29.32004 232003 222002 232001 382000 271999 18
DFA 2005, SFM Data Set April 28/06
Indicator 8: Stand level retention in all cutblocks as percent of total cutblockarea cont.
Data Protocol:Responsibility:Cascadia - Planning ForesterIsland Timberlands – D. MedvesReporting:Cascadia - Planning ForesterIsland Timberlands – Inventory ForesterFN – Planning Forester, CascadiaBCTS - Timber Sales Program ForesterSource: Variable Retention Tracking SpreadsheetComments:2005 – Island Timberlands harvested two cutblocks (not recorded) with singlestem. Another 100 hectare (gross) cutblock with a total TAUP of 23.2 ha, wasnot recorded as well.2002 - Data for this indicator does not include the Park Trade, other minor privateland holdings, Small Business, or roads.Stand level retention consists of all timber leave components designated to ablock, such as timber leave areas, riparian areas and wildlife tree patches. Thistotal retention may consist of more than 10% of the total area under prescription.However, a block may not be considered VR due to its slash areas not beingunder edge influence (more than 2 tree lengths from a timber edge).This indicator reflects the amount of retention areas which are linked to the SP.Target VR is 15%.

DFA 2005, SFM Data Set April 28/06
Indicator 9: Number of at-risk species in the DFA for which managementprograms exist as identified in the FDP.
Value: At-risk species
Goal: At-risk species are identified and their habitat needs are maintained.
Objective: Support habitat management programs in co-operation withregulatory agencies and others
Acceptable Variance: - 2Forecast: n/a
Performance: Crown & Private
year ManagementPrograms
2005 82004 62003 62002 62001 62000 4
Notes: Island Timberlands and FN not reporting.Identified Species of Special interest that are currently managed for include;
• Great Blue Heron• Keen’s Long-eared Myotis (Myotis keenii)• Marbled Murrelet• Northern (Queen Charlotte) Goshawk• Red-legged Frog• Roosevelt Elk• Scouler’s Corydalis (Cordalis scouleri)• Vancouver Island Marmot

DFA 2005, SFM Data Set April 28/06
Indicator 9: Number of at-risk species in the DFA for which managementprograms exist as identified in the FDP cont.
Data Protocol:Responsibility:Cascadia - Planning ForesterBCTS – Timber Sales Program ForesterReporting:Cascadia - Planning ForesterBCTS – Timber Sales Program ForesterSource:Comments:2005Two major amendments the 2001-2005 Alberni East FDP were approved in2005. As a result, one of the amendments added two at-risk species: Scouler’sCorydalis and Keen’s Long-eared Myotis.BCTS – Many of these [habitat management programs] are TFL wide programs.BCTS follows what is in the FDP/management plan. In addition, for cutblocks inthe BCTS FDP there are strategies for red-legged frogs. BCTS’ ISO EMSincludes objectives for SAR and IWMS.2004
BCTS – Many of these [habitat management programs] are TFL wide programs.BCTS follows what is in the FDP/management plan. For cutblocks in the BCTSFDP, there are strategies for red-legged frogs.
2003
BCTS - No new FDPs in 2003. FDP discusses red-legged frogs and MaMu.BCTS does not manage the TFL 44 landbase – by harvesting Cat. A cutblocksfrom Weyerhaeuser’s FDP, we assume that species requiring wide-rangingmanagement regimes are adequately considered for management.There were no new FDP’s for 2003. Major amendments for Alberni East andWest will be approved in 2004.
DFA 2005, SFM Data Set April 17/06
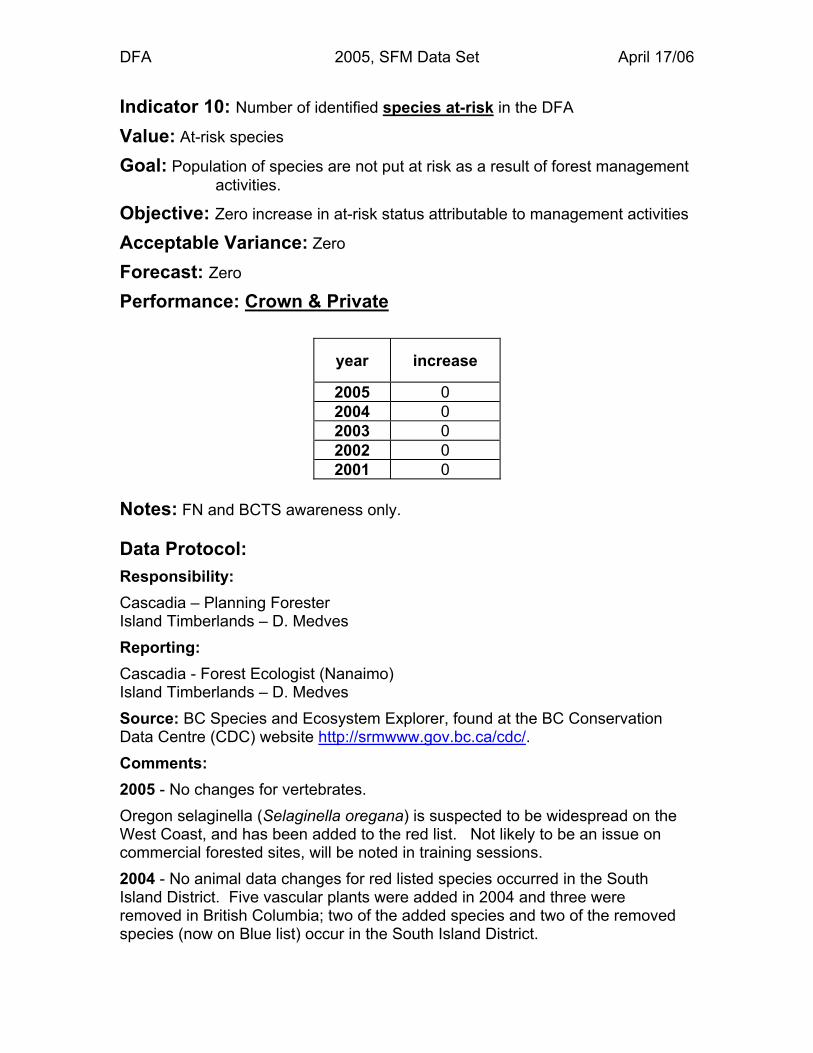
Indicator 10: Number of identified species at-risk in the DFA
Value: At-risk species
Goal: Population of species are not put at risk as a result of forest managementactivities.
Objective: Zero increase in at-risk status attributable to management activities
Acceptable Variance: Zero
Forecast: Zero
Performance: Crown & Private
year increase
2005 02004 02003 02002 02001 0
Notes: FN and BCTS awareness only.
Data Protocol:Responsibility:Cascadia – Planning ForesterIsland Timberlands – D. MedvesReporting:Cascadia - Forest Ecologist (Nanaimo)Island Timberlands – D. MedvesSource: BC Species and Ecosystem Explorer, found at the BC ConservationData Centre (CDC) website http://srmwww.gov.bc.ca/cdc/.Comments:2005 - No changes for vertebrates.Oregon selaginella (Selaginella oregana) is suspected to be widespread on theWest Coast, and has been added to the red list. Not likely to be an issue oncommercial forested sites, will be noted in training sessions.2004 - No animal data changes for red listed species occurred in the SouthIsland District. Five vascular plants were added in 2004 and three wereremoved in British Columbia; two of the added species and two of the removedspecies (now on Blue list) occur in the South Island District.

DFA 2005, SFM Data Set April 17/06
2003 - Thirty-one (31) Red List (extirpated, endangered or threatened) animalspecies.Ten (10) vascular plants occur or have the potential to occur. The vascular plantlistings were updated in March 2004, with the CDC additions for 2003.Mosses are not included.
2002 - (2) The 2002 Data Set showed 50 (fifty) animal species that were listed asspecies at risk.

DFA 2005, SFM Data Set April 17/06
Indicator 10: Number of identified species at-risk in the DFA (cont.)
VertebratesCurrently managed for (3)Northern Goshawk (laingi subspecies)Marbled MurreletVancouver Island Marmot
No active management plan (24)Brandt’s CormorantCommon MurreCommon Ringlet (butterfly, insulana subspecies)Common Water Shrew (brooksi subspecies)Double-crested CormorantEdith’s Checkerspot (butterfly)Greenish Blue (butterfly)Johnson’s Hairstreak (butterfly)Keen’s Long-Eared Myotis (bat)Killer Whale (Notheast Pacific resident population)Killer Whale (West Coast transient population)Large Marble (butterfly)Lewis’s Woodpecker (Georgia Depression)Leatherback TurtleNorthern Sea LionGopher SnakePeregrine Falcon (anatum subspecies)Purple MartinSea OtterSharp-tailed SnakeVesper Sparrow (affinis subspecies)Western Bluebird (Georgia Depression)Western Meadowlark (Georgia Depression)Wolverine
Not in DFA (4)Cowichan lake LampreyEnos Lake Benthic SticklebackEnos Lake Limnetic SticklebackYellow-billed Cuckoo
DFA 2005, SFM Data Set April 17/06
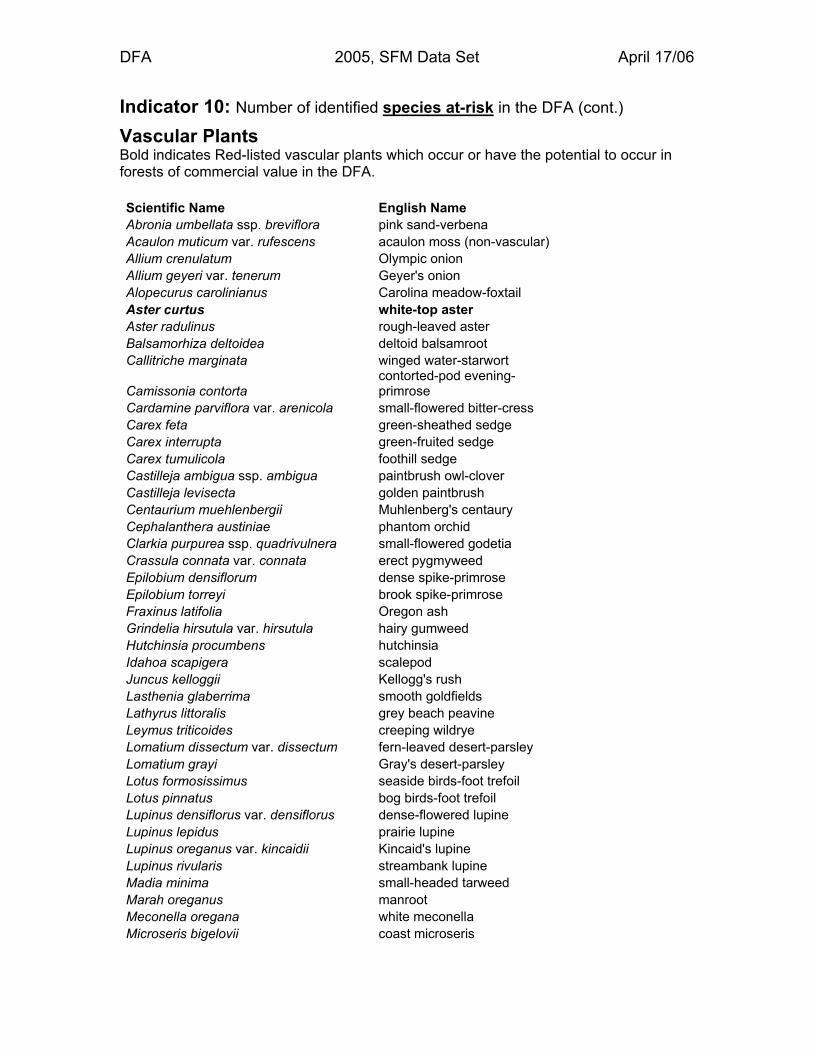
Indicator 10: Number of identified species at-risk in the DFA (cont.)
Vascular PlantsBold indicates Red-listed vascular plants which occur or have the potential to occur inforests of commercial value in the DFA.
Scientific Name English NameAbronia umbellata ssp. breviflora pink sand-verbenaAcaulon muticum var. rufescens acaulon moss (non-vascular)Allium crenulatum Olympic onionAllium geyeri var. tenerum Geyer's onionAlopecurus carolinianus Carolina meadow-foxtailAster curtus white-top asterAster radulinus rough-leaved asterBalsamorhiza deltoidea deltoid balsamrootCallitriche marginata winged water-starwort
Camissonia contortacontorted-pod evening-primrose
Cardamine parviflora var. arenicola small-flowered bitter-cressCarex feta green-sheathed sedgeCarex interrupta green-fruited sedgeCarex tumulicola foothill sedgeCastilleja ambigua ssp. ambigua paintbrush owl-cloverCastilleja levisecta golden paintbrushCentaurium muehlenbergii Muhlenberg's centauryCephalanthera austiniae phantom orchidClarkia purpurea ssp. quadrivulnera small-flowered godetiaCrassula connata var. connata erect pygmyweedEpilobium densiflorum dense spike-primroseEpilobium torreyi brook spike-primroseFraxinus latifolia Oregon ashGrindelia hirsutula var. hirsutula hairy gumweedHutchinsia procumbens hutchinsiaIdahoa scapigera scalepodJuncus kelloggii Kellogg's rushLasthenia glaberrima smooth goldfieldsLathyrus littoralis grey beach peavineLeymus triticoides creeping wildryeLomatium dissectum var. dissectum fern-leaved desert-parsleyLomatium grayi Gray's desert-parsleyLotus formosissimus seaside birds-foot trefoilLotus pinnatus bog birds-foot trefoilLupinus densiflorus var. densiflorus dense-flowered lupineLupinus lepidus prairie lupineLupinus oreganus var. kincaidii Kincaid's lupineLupinus rivularis streambank lupineMadia minima small-headed tarweedMarah oreganus manrootMeconella oregana white meconellaMicroseris bigelovii coast microseris

DFA 2005, SFM Data Set April 17/06
Indicator 10: Number of identified species at-risk in the DFA (cont.)
Vascular Plants
Microseris lindleyi Lindley's microseris
Mimulus dentatustooth-leaved monkey-flower
Minuartia pusilla dwarf sandwortMontia diffusa branching montiaNavarretia intertexta needle-leaved navarretiaOrobanche pinorum pine broomrapeOrthocarpus bracteosus rosy owl-cloverOrthocarpus imbricatus mountain owl-cloverOxalis oregana redwood sorrelPiperia candida white-lip rein orchidPlagiobothrys figuratus fragrant popcornflowerPlagiobothrys tenellus slender popcornflowerPleuricospora fimbriolata fringed pinesapPsilocarphus elatior tall woolly-headsPsilocarphus tenellus var. tenellus slender woolly-headsRanunculus alismifolius var. alismifolius water-plantain buttercupRanunculus californicus California buttercupRanunculus lobbii Lobb's water-buttercupRubus nivalis snow brambleSalix lemmonii Lemmon's willowSanicula arctopoides snake-root sanicleSanicula bipinnatifida purple sanicleSchoenoplectus americanus Olney's bulrushSelaginella oregana Oregon selaginellaSilene scouleri ssp. grandis Scouler's campionThelypteris nevadensis Nevada marsh fernTonella tenella small-flowered tonellaTrifolium cyathiferum cup cloverTriglochin concinna graceful arrow-grassTrillium ovatum var. hibbersonii dwarf trilliumTriphysaria versicolor ssp. versicolor bearded owl-cloverTriteleia howellii Howell's triteleiaUtricularia ochroleuca ochroleucous bladderwortVerbena hastata var. scabra blue vervainViola praemorsa ssp. praemorsa yellow montane violetWolffia columbiana Columbian water-mealYabea microcarpa California hedge-parsley

DFA 2005, SFM Data Set April 17/06
Indicator 12: Existence of a habitat management program for identifiedspecies of special interest (includes a list)
Value: Identified species of special interest
Goals: Identified species of special interest and localized populations areinventoried and strategies for their habitat needs are in effect
Objective: Support habitat programs in cooperation with regulatory agenciesand others
Acceptable Variance: Zero increase
Forecast: n/a
Performance: Crown & PrivateIdentified Species of Special interest that are currently managed for in the DFAinclude:
• Columbia Black-tailed Deer• Black Bear• Bald Eagle
yearcurrentlymanaged(number)
2005 32004 32003 32002 32001 32000 41999 4
Notes: FN did not report
DFA 2005, SFM Data Set April 17/06
Indicator 12: Existence of a habitat management program for identifiedspecies of special interest (includes a list) cont.
Data Protocol:Responsibility:Cascadia - Planning ForesterIsland Timberlands – D. MedvesReporting:Cascadia - Planning ForesterIsland Timberlands – D. MedvesBCTS – Timber Sales Program Forester
Source:Comments:
2005BCTS – Many of these [habitat management programs] are TFL wide programs.BCTS follows what is in the FDP/management plan. In addition, for cutblocks inthe BCTS FDP there are strategies for red-legged frogs. BCTS’ ISO EMSincludes objectives for SAR and IWMS.2004
BCTS – Many of these [habitat management programs] are TFL wide programs.BCTS follows what is in the FDP/management plan. For cutblocks in the BCTSFDP, there are strategies for red-legged frogs.2003
BCTS - BCTS does not manage the TFL 44 landbase – by harvesting Cat. Acutblocks from Weyerhaeuser’s FDP, we assume that species requiring wide-ranging management regimes are adequately considered for management.2002Species of Special Interest are those species identified by the MoF, MWLAP, orthe public as requiring special consideration in operational plans. These speciesof special interest are not considered at risk. The Forest Development Plannerannually reviews the correspondence from the agencies, and ensures thatmeasures to protect these species are incorporated into the Forest DevelopmentPlans.

DFA 2005, SFM Data Set April 17/06
Indicator 13: Annual percent of opening areas in permanent accessstructures
Value: Human induced-disturbance and stress
Goal: minimize impacts on forest health due to human-induced disturbance andstress
Objective: <7% of opening areas in permanent access structures
Acceptable Variance: + 1%
Forecast: 5%
Performance: Crown & Private
yearMeasured Access
as percent ofgross area
2005 5.42004 6.12003 5.92002 5.92001 6.02000 6.21999 6.71998 6.61997 6.61996 5.7
Notes: FN did not report.
DFA 2005, SFM Data Set April 17/06
Indicator 13: Annual percent of opening areas in permanent accessstructures cont.
Data Protocol:Responsibility:Cascadia - Planning ForesterIsland Timberlands – D. MedvesReporting:TM Pearson & Co. – Alberni East, Alberni WestIsland Timberlands – C. VukovicBCTS - Timber Sales Program ForesterSource:Measured Access - Genus Stocking Status (NP UNN), TAUP – GenusSilviculture Prescription TableComments:2003 - Blocks selected were based on harvest complete 2003BCTS - includes only roads within cutblocks, as all other roads are assumed tobe Weyerhaeuser’s responsibility.
2002 - If measured access was unavailable then SP Permanent access wasused. A harvest of start of 2002 was used, and includes blocks where harvestcomplete is still planned.Data includes SBFEP and R/W, does not include salvage operations, SproatPark Trade, or other minor private land holdings.This objective (indicator) reflects standards/regulations found in the ForestPractices Code of BC.

DFA 2005, SFM Data Set April 28/06
Indicator 14: Operationally-caused fire damage by area
Value: Human induced-disturbance and stress
Goal: minimize impacts on forest health due to human-induced disturbance andstress
Objective: Zero hectares
Acceptable Variance: +10 hectares
Forecast: 5 hectares
Performance: Crown & Private
year fires area(hectare)
2005 1 0.62004 0 02003 7 19.72002 3 5.12001 0 02000 0 01999 3 9.8
Notes: FN did not report.
Data Protocol:Responsibility:Cascadia - EMS / Planning ForesterIsland Timberlands – D. MedvesReporting:Cascadia - Planning ForesterIsland Timberlands – Inventory ForesterBCTS - Timber Sales Program ForesterSource:Comments:2003 - For all operational caused fires a post mortem fire analysis with theContract Supervisor, Silviculture Forester and Production Superintendent wascompleted in October 2003. A number of identified action item were determinedto prevent escaped slash fires. They are as follows; better assessment ofconditions before lighting of piles, and more aggressive mop-up.

DFA 2005, SFM Data Set April 28/06
Indicator 15: Area harvested as percent of total productive forest area
Value: Human-induced disturbance and stress
Goal: Minimize impacts on forest health due to human-induced disturbance andstress
Objective [annual]: < 1%
Acceptable Variance: + 0.5%
Forecast: 1%
2002 SFM Plan: Reported previously as Indicator # 13
Performance: Crown & Private
yeararea
harvestedas % of
productive2005 0.952004 1.042003 0.772002 0.92 (2)
2001 (3) 0.562000 0.741999 0.681998 0.491997 0.571996 0.64
Notes: Island Timberlands and FN did not report
(1) Does not include BCTS harvested area.(2) revised, excludes roaded area(3) 2001 and earlier includes roaded area

DFA 2005, SFM Data Set April 28/06
Indicator 15: Annual area harvested as percent of total productive forest areacont.
Data Protocol:Responsibility:Cascadia - EMS / Planning ForesterReporting:Cascadia - Pacific GISBCTS - Timber Sales Program ForesterSource: VR reports for area harvested.Comments:2004 – Increase due to MoF programs. Productive area excludes roads.2003 - DFA Boundary changed in 2002 and 2003, to reflect the transfer of theBarclay Unit. Roaded area is a 6.5 m buffer (13 m wide total) on FDP roads withthe following classes; main, non-main, perm, semi and temp.2002 - Data includes SBFEP and R/W, does not include salvage operations,Sproat Park Trade, or other minor private land holdings.The total productive area is determined from the current (1997) forest inventory.The forest inventory is updated periodically (usually every one or two years) forareas harvested, and stand assessments. The Inventory Analyst, NanaimoWoodlands, produces reports on the current inventory. No changes were madeto the inventory in 2002.There were two changes which resulted in less productive forest area beingreported for 2002;
(1) The DFA boundary changed.
(2) Road area is now excluded from the productive forest landbase. The road area is calculated by applying a buffer of 6.5metres on each side of the road centerline. This buffer wasapplied to roads with the status of maintained, non-maintained,permanent, semi-permanent and temporary.

DFA 2005, SFM Data Set April 28/06
Indicator 16: Area harvested as percent of the total productive forest area ineach Landscape Unit for last 5 years, for those areas greater than10,000 hectares.
Value: Human-induced disturbance and stress
Goal: Minimize impacts on forest health due to human-induced disturbance andstress
Objective [annual]: Establish baseline and trends in order to identify areas ofhigh impact
Acceptable Variance: n/a
Forecast: n/a
Performance: Crown & Private
Landscape Unitwith area > 10,000
hectares
Percent of Total ProductiveForest in Landscape Unit (%)
2005
Corrigan 5.58Great Central 3.60
Henderson 2.87Klanawa 9.49Nitinat 3.96Sarita 2.31
Notes:Island Timberlands and FN not reported.
Data Protocol:Responsibility:Cascadia - EMS / Planning ForesterReporting:Cascadia - Pacific GISBCTS - Timber Sales Program Forester
Indicator 16: Area harvested as percent of the total productive forest area ineach Landscape Unit for last 5 years, for those areas greater than10,000 hectares cont.

DFA 2005, SFM Data Set April 28/06
Source:Area harvested equals NAR (net area reforested) & PAS (permanent accessstructures)Harvested blocks are reported in the year that harvesting is completed.
Comments:2005 – BCTS; Corrigan 58 ha., Klanawa 79 ha., Nitinat 16 ha.

DFA 2005, SFM Data Set April 28/06
Indicator 17 Area of operationally-related windthrow
Value: Human-induced disturbance and stress
Goal: Minimize impacts on forest health due to human-induced disturbance andstress
Discussion: This indicator measures the relative area impact of disturbance of harvesting activities on an annual basis.
Objective: < 5% harvest area
Acceptable Variance: + 5%
Forecast: 2 %
Performance: Crown & Private
yearwindthrow as
% of areaharvested
2005 1.12004 0.22003 1.72002 3.72001 0.6
Notes: FN did not report
Data Protocol:Responsibility:Cascadia - Planning ForesterIsland Timberlands - D. MedvesReporting:Cascadia - Planning ForesterIsland Timberlands – D. MedvesBCTS - Timber Sales Program Forester
Source: VR reports for area harvested.Comments:2003 –Hayes - Any windthrow discovered was reported to DRH Consulting. DRH thenassessed the windthrow to determine if was salvageable (physical and economicconsiderations). If the timber was salvageable, DRH completed the planningrequirements, and the timber was salvaged under one of several salvagecontracts WIT has with different organizations.

DFA 2005, SFM Data Set April 20/06
Indicator 18: Area of slides originating in harvested areas or roads
Value: Human-induced disturbance and stress
Goal: minimize impacts on forest health due to human-induced disturbance andstress
Objective: < 10 hectares
Acceptable Variance: <20 hectares
Forecast: 2.0 hectares
2002 SFM Plan: Reported previously as Indicator # 15
Performance: Crown & Private
year slides(hectares)
2005 7.62004 2.32003 6.52002 6.12001 3.82000 0.6a1999 5.21998 1.0
Notes: FN did not report.
DFA 2005, SFM Data Set April 20/06
Indicator 18: Area of slides originating in harvested areas or roads cont.
Data Protocol:Responsibility:Cascadia - Planning ForesterIsland Timberlands – D. MedvesReporting:Cascadia - Planning ForesterIsland Timberlands – D. MedvesBCTS - Timber Sales Program ForesterSource:Comments:2003 & 2002 - Environmental Occurrence reports are completed for all slidesthat have occurred and are kept on file in the Planning Department. Copies aresent to Ministry of Forests, Ministry of Environment and the Department ofFisheries & Oceans.When two or more slides are reported in a drainage area, a recce flight will becarried out as soon as possible. At a minimum, a recce flight of the DFA will bedone after the winter months.Slides of significant size in harvested areas or initiated on roads will have aterrain assessment completed by a professional and any remedial action will bescheduled.Action Plan: Review each slide for preventative actions

DFA 2005, SFM Data Set April 17/06
Indicator 19: Area out of compliance with Free Growing [FG] objectives
Value: Human-induced disturbance and stress
Goal: Human-induced disturbance and stress is rehabilitated promptly
Discussion: This indicator measures the Unit’s success at achieving freegrowing commitments in Silviculture Prescriptions. Thesecommitments are derived from the MoF “Establishment to FreeGrowing Guidebook for the Vancouver Forest Region.” ASilviculture Prescription provides benchmarks for evaluatingregeneration success, the utilization of the productive areas and themaintenance of forest ecosystems. The objective reflectsrequirements of the Forest Practices Code of BC Act.
Objective [annual]: Identify and reduce the non-compliance area to below150 hectares
Acceptable Variance: 100 hectares
Forecast: Zero
2002 SFM Plan: Reported previously as Indicator # 16
Performance: Crown & Private
YearStandard Units
not declared FG in 2005(hectares / units)
2005 73 / not reported
2004 216.1 / 142003 29 / 42002 60 / 2
Notes: FN did not report
YearArea in
compliance(hectares)
Openingsin compliance
(number)
Area out ofcompliance(hectares)
Openings out ofcompliance
(number)2001 2,216 47 288 92000 832 23 743 211999 18

DFA 2005, SFM Data Set April 17/06
Indicator 19: Area out of compliance with Free Growing objectives cont.
Data Protocol:Responsibility:Cascadia - Planning ForestersIsland Timberlands – D. MedvesReporting:Cascadia, Alberni West - D. Bryant (contractor)Cascadia, Alberni East – Planning ForesterIsland Timberlands - KevinBCTS - Timber Sales Program ForesterSource: GenusComments:2005Alberni EastBlock 851204 (Br. 417B8) – This is a Franklin Forest Products cutblock, Onestratum of SU C is not 150% of competing vegetation. Another six growingseasons are required to achieve 150% in this stratum.Block 973106 (Coleman Road 210) – The failure to achieve the late free growingdate of July 2005, as documented in the RESULTS database, was due to a datediscrepancy in the GENUS database maintained by Cascadia Forest Products.The GENUS commencement date was March 1992, with a late free growing dateof March 2006. In July 1991, falling commenced on the wide right of way.Falling in the remainder of the setting began in March 1992. This later date wastracked in the FORKS system, with the likely thought that wide right of way wassimilar to falling the road right of way. However, the correct harvestcommencement date should be July 1991, resulting in a late free growing date ofJuly 2005 for all standard units within the cutblock. One stratum of SU A is not150% of the competing vegetation. Another 5 growing season is required toachieve 150% in this stratum. One stratum of SU B is not 150% of thecompeting vegetation. Another three growing seasons is required to achieve150% in this stratum.

DFA 2005, SFM Data Set April 17/06
Indicator 19: Area out of compliance with Free Growing objectives cont.2004Sproat – SP Amendments have been submitted for all of the nine SUs notdeclared Free Growing (the amendments were submitted prior to the expiry ofthe Late FG Assessment Period). Sproat includes crown, private inside TFL 44,and private outside TFL 44 (Park Trade)
Great Central Lake (contract) – An SP Amendment has been submitted for theone SU not declared Free Growing (it was submitted prior to the expiry of theLate FG Assessment Period).Alberni East – SP Amendments have been submitted for all of the four SU’s notdeclared Free Growing ( the amendments were submitted prior to the expiry ofthe Late FG Assessment Period). Includes Crown and private inside TFL 44.

DFA 2005, SFM Data Set April 28/06
Indicator 20: Equivalent years of Not Sufficiently Reforested (NSR) as 5-year rolling average
Value 7: Ecosystem recovery from disturbance and stress
Goal 10: Forest management activities do not compromise the ability of theecosystem to recover (see also Goals 12 & 13)
Objective: Maintain NSR equivalency at <3years harvest area
Acceptable Variance: Zero
Forecast: 1.5 years
Performance: Crown & Private
yearNSR
equivalency(years)
2005 0.572004 0.352003 1.02002 1.82001 1.72000 1.21999 1.41998 1.6
Notes: Island Timberlands and FN did not report
DFA 2005, SFM Data Set April 28/06
Indicator 20: Equivalent years of Not Sufficiently Reforested (NSR) as 5-year rolling average cont.
Data Protocol:Responsibility:Cascadia - Planning ForestersIsland Timberlands – D. MedvesReporting:Cascadia, Alberni West - TM Pearson & Co.Cascadia, Alberni East - Planning ForesterIsland Timberlands -BCTS - Timber Sales Program ForesterSource: GenusComments:2005 - Alberni West: Area Harvested includes Permanent Access Structures(PAS) hectares. Sproat (all) includes crown and mixed mark blocks that have notbeen amended.2004 - Alberni West: For blocks where stocking status has not been updated inGenus, the NAR was reduced by planted ha to calculate NSR. Blocks usingStanding Stem harvesting have no NAR so ha not included in NSR. Does notinclude Nootka/Port Eliza operating areas.All [BCTS] cutblocks are planted within 1 year of harvest completion.Sproat (all) includes crown, private inside TFL 44, and private outside TFL 44(Park Trade).Area Harvest does not include Permanent Access Structures (PAS) hectares.2003 - Sproat (all) includes crown, private inside TFL 44, and private outside TFL44 (Park Trade).Area Harvest does not include Permanent Access Structures (PAS) hectares.2002 - Data includes SBFEP and R/W. Data includes salvage operations,Sproat Park Trade, or other minor private land holdings. Blocks which werestarted and not completed (no stocking status) then logged hectares were usedfor NSR, which includes R/W.Blocks which are not complete and/or released for Waste and Residue or PostHarvest have no recorded stocking status.This objective (indicator) reflects standards/regulations found in the ForestPractices Code of BC.Franklin includes Alberni East and contract operations, located at great Centraland Uchucklesit.

DFA 2005, SFM Data Set April 24/06
Indicator 21: Area out of compliance with regeneration delay obligations
Value: Ecosystem recovery from disturbance and stress.
Goal: Area out of conformance with regeneration delay obligations.
Discussion:Objective: Zero
Acceptable Variance: < 40 hectares non-conformance, annually
Forecast: Zero
2002 SFM Plan: Reported as Indicator # 17
Performance: Crown & Private
YearArea out ofcompliance(hectares)
2005 312004 182003 372002 2
Notes: FN did not report.
Data Protocol:Responsibility:Cascadia - Planning ForestersIsland Timberlands – D. MedvesReporting:Cascadia - Planning ForestersBCTS - Timber Sales Program ForesterIsland Timberlands - KevinSource: Genus

DFA 2005, SFM Data Set April 24/06
Indicator 21: Area out of compliance with regeneration delay obligations cont.
Comments:2005One SU in cutblock 863107-8655 has a RG due of June 2005. The SU is withinan unharvested helicopter area. An SP Amendment was submitted January2005 to amend RG for this SU to June 2008. The Sp Amendment was rejectedby the MoF. The SU is stocked with mature timber.BCTS – The out of compliance SUs are found in two (of three) cutblocks in a TSLthat has not been harvested.2004Sproat - All three SUs have data issues (incorrect or missing pieces) in Genus,and are Private land blocks.Alberni East – An SP Amendment has been submitted for the SU dot declared(the amendment was submitted prior to the expiry delay). The SU area was notfelled until very close to the expiry of regeneration delay. The SU was planted inthe next available planting window (September 2004).2003 -Alberni EastIn three blocks (753203, 781312, 971215), three SUs (2.0 ha) are comprised ofrehabbed road, which could not be confirmed if completed. In two blocks(772206 and 973108), four SUs (34.6 ha) have species planted that do not matchthe SP. An SP Amendment is planned for blocks 772206 and 973108 for 2004 toaddress stocking standards.2002 - Compliance for regeneration and free growing status, both for EMS andMoF, are tracked by Standards Units (SU) through the use of Genus anintegrated resource management system. Previous years’ (2001 and earlier)tracking was done by block. A Standards Unit is an area of a SilviculturePrescription that is managed through the uniform application of a silviculturesystem, stocking standards and soil conservation standards. Data is based onthe year (2002) of compliance.Data does not include SBFEP, R/W, salvage operations, Sproat Park Trade, orother minor private land holdings.Hectares displayed are Net Area to be Reforested (NAR).This objective (indicator) reflects standards/regulations found in the ForestPractices Code of BC.
DFA 2005, SFM Data Set April 28/06
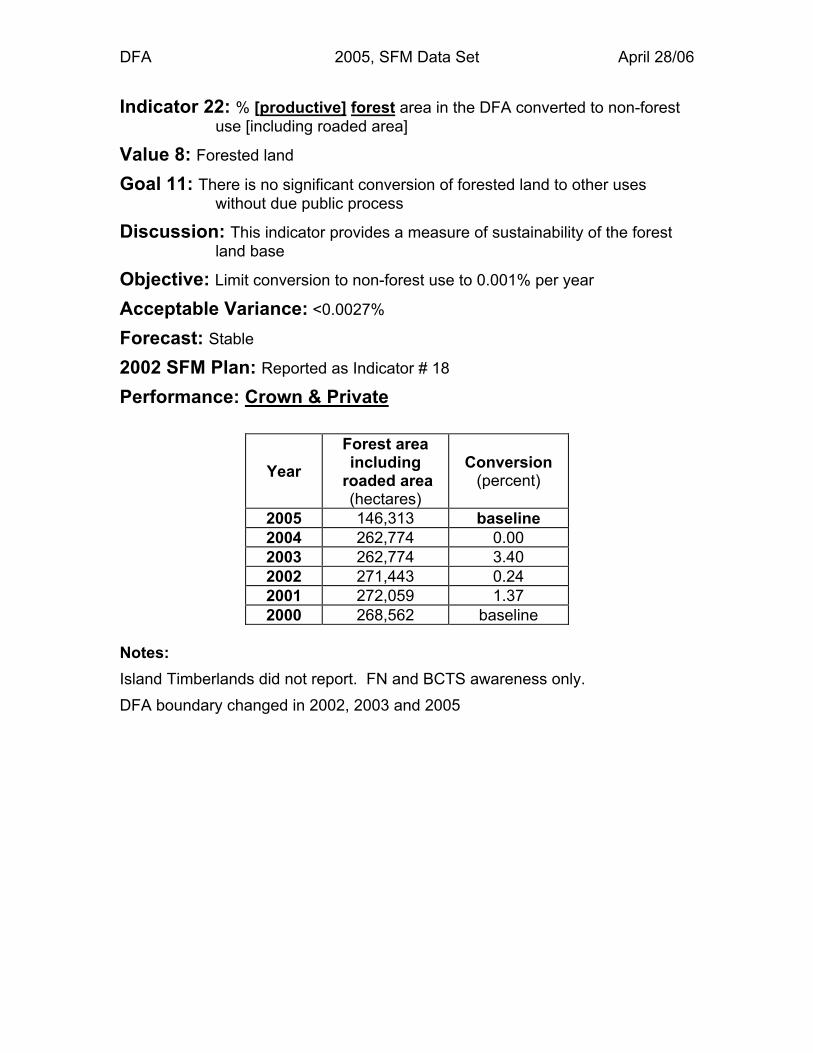
Indicator 22: % [productive] forest area in the DFA converted to non-forestuse [including roaded area]
Value 8: Forested land
Goal 11: There is no significant conversion of forested land to other useswithout due public process
Discussion: This indicator provides a measure of sustainability of the forestland base
Objective: Limit conversion to non-forest use to 0.001% per year
Acceptable Variance: <0.0027%
Forecast: Stable
2002 SFM Plan: Reported as Indicator # 18
Performance: Crown & Private
YearForest areaincluding
roaded area(hectares)
Conversion(percent)
2005 146,313 baseline2004 262,774 0.002003 262,774 3.402002 271,443 0.242001 272,059 1.372000 268,562 baseline
Notes:Island Timberlands did not report. FN and BCTS awareness only.DFA boundary changed in 2002, 2003 and 2005

DFA 2005, SFM Data Set April 28/06
Indicator 22: % productive forest area in the DFA converted to non-forest use cont.
Data Protocol:Responsibility:Cascadia - EMS / Planning ForesterIsland Timberlands -Reporting:Cascadia - Pacific GIS Consulting
Source: All data is from GIS in the form of ArcInfo coverages, with the exceptionof logging updates which came from Genus.
Comments:2003 - DFA productive forest withdrawn from the Barclay Unit is 8,418 hectares.DFA boundary changed in 2002 and 2003. Roaded area is 6.5 m buffer (13 mwide total) on FDP roads with the following classes; main, non-main, perm, semiand temp.
2002 - The total productive area is determined from the current (1997) forestinventory. The forest inventory is updated periodically (usually every one or twoyears) for areas harvested, and stand assessments. The Inventory Analyst,Nanaimo Woodlands, produces reports on the current inventory. No changeswere made to the inventory in 2002.There were two changes which resulted in less productive forest area beingreported for 2002;
• The DFA boundary changed.
• Exclusion of roaded area (13m buffer for roads), due to a change inthe definition of Productive Forest
DFA 2005, SFM Data Set April 20/06
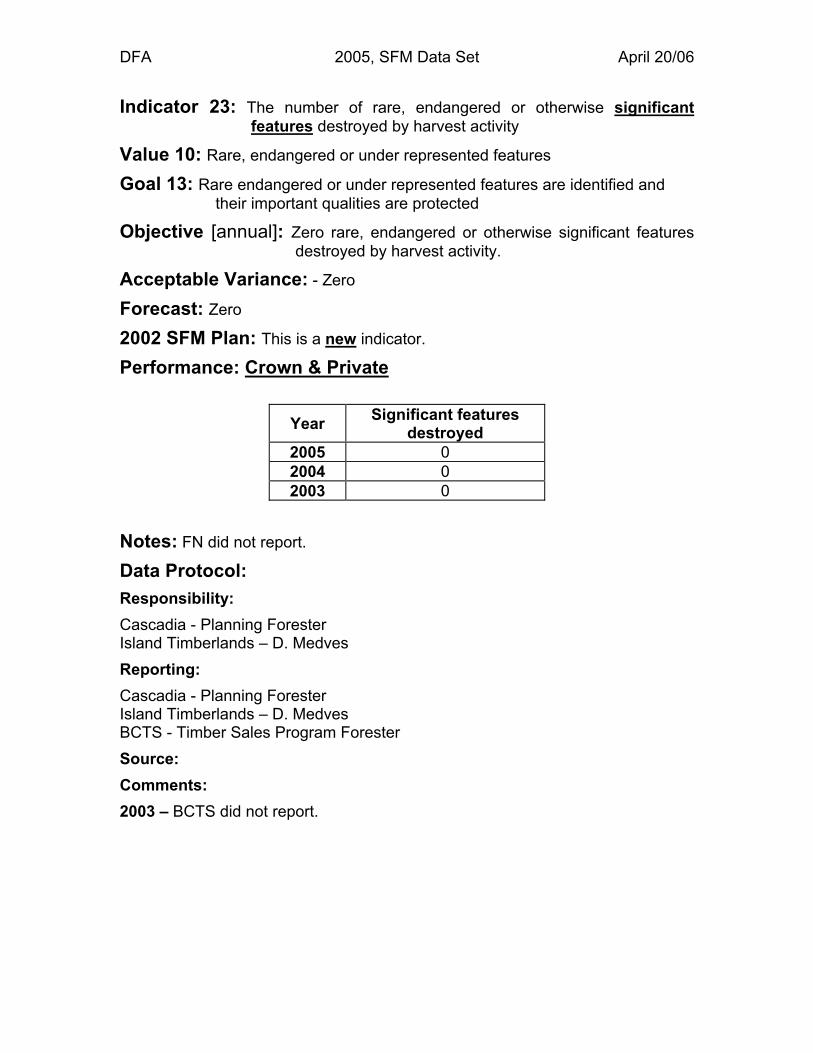
Indicator 23: The number of rare, endangered or otherwise significant features destroyed by harvest activity
Value 10: Rare, endangered or under represented features
Goal 13: Rare endangered or under represented features are identified andtheir important qualities are protected
Objective [annual]: Zero rare, endangered or otherwise significant features destroyed by harvest activity.
Acceptable Variance: - Zero
Forecast: Zero
2002 SFM Plan: This is a new indicator.
Performance: Crown & Private
Year Significant featuresdestroyed
2005 02004 02003 0
Notes: FN did not report.
Data Protocol:Responsibility:Cascadia - Planning ForesterIsland Timberlands – D. MedvesReporting:Cascadia - Planning ForesterIsland Timberlands – D. MedvesBCTS - Timber Sales Program ForesterSource:Comments:2003 – BCTS did not report.

DFA 2005, SFM Data Set April 28/06
Indicator 24: Openings harvested in which soil disturbance exceeds pre-harvest level as determined by a post-harvest assessment.
Value: Soil quality
Goal: Natural levels of soil productivity and stability are sustained.
Discussion:Objective: [No more than 5% of any opening, or] no more than 1 opening
Acceptable Variance: 1 opening
Forecast: Zero
Performance: Crown only
YearOpenings exceeding
allowable soil disturbance(number)
2005 02004 02003 02002 02001 02000 01999 01998 0
Notes: Island Timberlands awareness only. FN did not report.
Data Protocol:Responsibility:Cascadia - Planning ForestersReporting:Cascadia – Planning ForestersBCTS - Timber Sales Program ForesterSource:Comments:

DFA 2005, SFM Data Set April 28/06
Indicator 29: Percent of openings harvested where reserves zones are notmaintained (stream crossings are excluded)
Value 14: Riparian areas (fresh and marine)
Goal 17: Riparian areas are managed to protect water quality, water flow andthe habitat needs of land and aquatic species
Objective: Full reserve zones as per table attached.
Acceptable Variance: 2 %
Forecast: 100 %
Performance: Crown only
YearOpenings
reserve zonesnot maintained
(percent)2005 0.002004 0.882003 0.00
Notes: Island Timberlands, awareness only.
Previous:
Year FS 107write-up
2002 02001 02000 01999 0
DFA 2005, SFM Data Set April 28/06
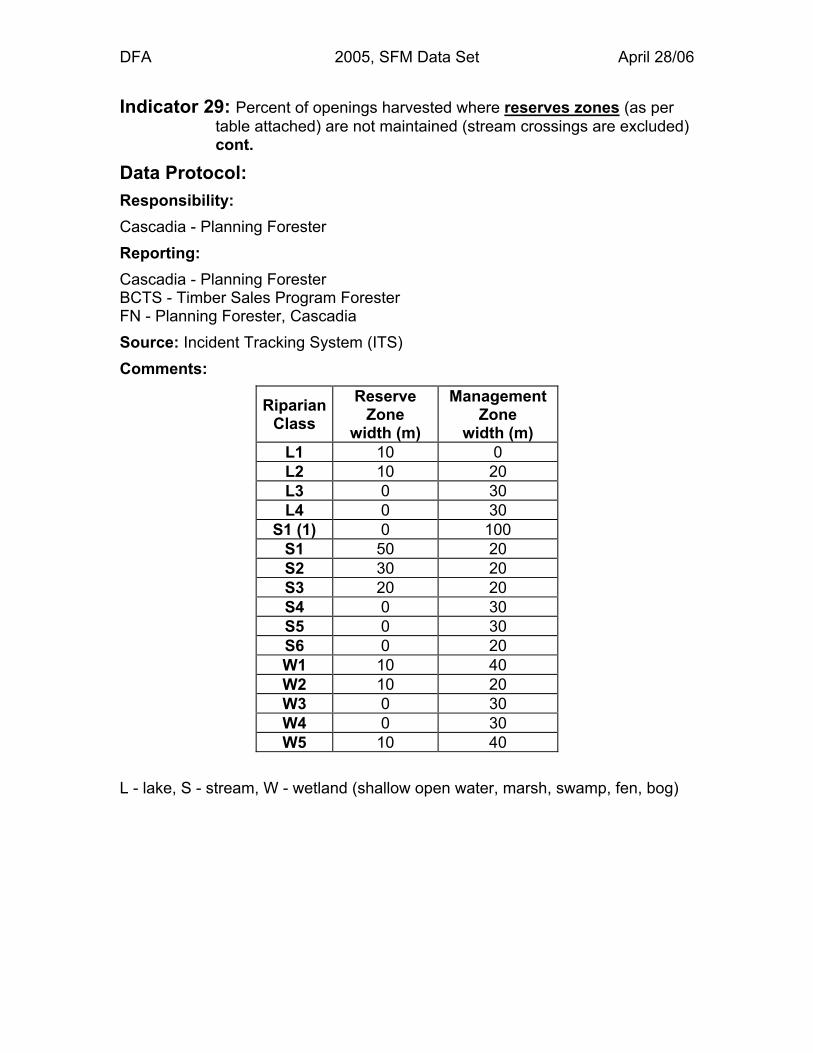
Indicator 29: Percent of openings harvested where reserves zones (as pertable attached) are not maintained (stream crossings are excluded)cont.
Data Protocol:Responsibility:Cascadia - Planning ForesterReporting:Cascadia - Planning ForesterBCTS - Timber Sales Program ForesterFN - Planning Forester, CascadiaSource: Incident Tracking System (ITS)Comments:
RiparianClass
ReserveZone
width (m)
ManagementZone
width (m)L1 10 0L2 10 20L3 0 30L4 0 30
S1 (1) 0 100S1 50 20S2 30 20S3 20 20S4 0 30S5 0 30S6 0 20W1 10 40W2 10 20W3 0 30W4 0 30W5 10 40
L - lake, S - stream, W - wetland (shallow open water, marsh, swamp, fen, bog)

DFA 2005, SFM Data Set April 28/06
Indicator 29: Percent of openings harvested where reserves zones (as pertable attached) are not maintained (stream crossings are excluded)cont.
Notes:2004 – Block 153108 (Henderson) – RRZ on Clemens Creek crossesHenderson Main and infringes on block edge. A variance was received from theMoF due to the existing road which was already in the RRZ, Leaving standingtrees on the top side of the road was determined to be unfeasible.2003 – Only BCTS reported.2002 - Reserve zones are established for wetlands, lakes and streams using thefollowing guidebooks; Riparian Management Area, Gully AssessmentProcedures, Fish Stream Identification, Channel Assessment Procedure, andCommunity Watershed.Reserve Zone requirements are audited by the prescribing Silviculture Foresterfor compliance. Silviculture prescriptions are not approved by the DistrictManager with reserve zones that do not meet the Forest Practices Code of BC.Data for this indicator does not include the Park Trade or other minor privateland holdings.This objective (indicator) reflects standards/regulations found in the ForestPractices Code of BC.
DFA 2005, SFM Data Set May 11/06
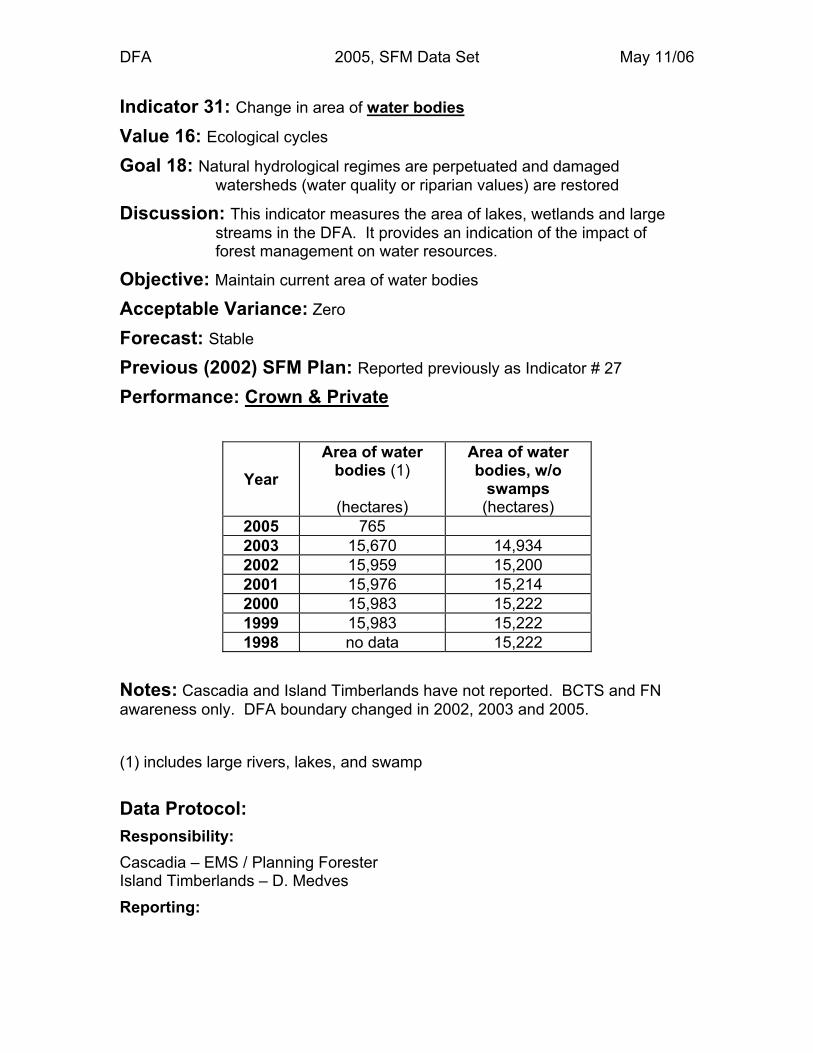
Indicator 31: Change in area of water bodies
Value 16: Ecological cycles
Goal 18: Natural hydrological regimes are perpetuated and damagedwatersheds (water quality or riparian values) are restored
Discussion: This indicator measures the area of lakes, wetlands and largestreams in the DFA. It provides an indication of the impact offorest management on water resources.
Objective: Maintain current area of water bodies
Acceptable Variance: Zero
Forecast: Stable
Previous (2002) SFM Plan: Reported previously as Indicator # 27
Performance: Crown & Private
YearArea of water
bodies (1)
(hectares)
Area of waterbodies, w/o
swamps(hectares)
2005 7652003 15,670 14,9342002 15,959 15,2002001 15,976 15,2142000 15,983 15,2221999 15,983 15,2221998 no data 15,222
Notes: Cascadia and Island Timberlands have not reported. BCTS and FNawareness only. DFA boundary changed in 2002, 2003 and 2005.
(1) includes large rivers, lakes, and swamp
Data Protocol:Responsibility:Cascadia – EMS / Planning ForesterIsland Timberlands – D. MedvesReporting:
DFA 2005, SFM Data Set May 11/06
Indicator 31: Change in area of water bodies cont.
Compilation:Source: All data is from GIS in the form of ArcInfo coverages, with the exceptionof logging updates which came from Genus.Inventory Section reports (1:20 000 scale) on the area of lakes, wetlands andlarge streams at each inventory update. This includes the inventory summariesin TFL Management Plans. No re-inventory of water bodies took place in 2002.Care needs to be taken in interpreting historical records of the area of waterbecause of changes in map standards and boundaries.Base line data is the 1997 Inventory area of 15,222 ha.
DFA 2005, SFM Data Set March 23/06
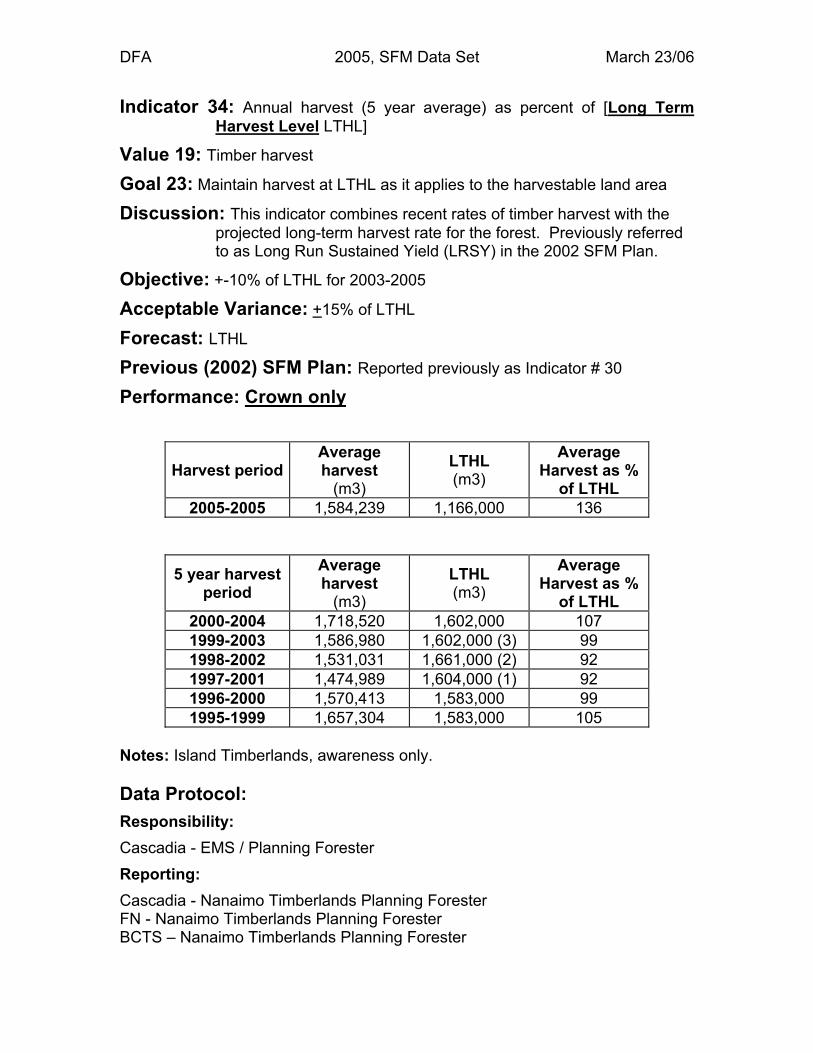
Indicator 34: Annual harvest (5 year average) as percent of [Long TermHarvest Level LTHL]
Value 19: Timber harvest
Goal 23: Maintain harvest at LTHL as it applies to the harvestable land area
Discussion: This indicator combines recent rates of timber harvest with theprojected long-term harvest rate for the forest. Previously referredto as Long Run Sustained Yield (LRSY) in the 2002 SFM Plan.
Objective: +-10% of LTHL for 2003-2005
Acceptable Variance: +15% of LTHL
Forecast: LTHL
Previous (2002) SFM Plan: Reported previously as Indicator # 30
Performance: Crown only
Harvest periodAverageharvest
(m3)
LTHL(m3)
AverageHarvest as %
of LTHL2005-2005 1,584,239 1,166,000 136
5 year harvestperiod
Averageharvest
(m3)
LTHL(m3)
AverageHarvest as %
of LTHL2000-2004 1,718,520 1,602,000 1071999-2003 1,586,980 1,602,000 (3) 991998-2002 1,531,031 1,661,000 (2) 921997-2001 1,474,989 1,604,000 (1) 921996-2000 1,570,413 1,583,000 991995-1999 1,657,304 1,583,000 105
Notes: Island Timberlands, awareness only.
Data Protocol:Responsibility:Cascadia - EMS / Planning ForesterReporting:Cascadia - Nanaimo Timberlands Planning ForesterFN - Nanaimo Timberlands Planning ForesterBCTS – Nanaimo Timberlands Planning Forester

DFA 2005, SFM Data Set March 23/06
Indicator 34: Annual harvest (5 year average) as percent of [Long TermHarvest Level LTHL] cont.
Source: Annual harvest volumes are based on official MoF scale volumes. Formore detail refer to Indicator 48.LTHL, the long term harvest level is dependent on area, the productivity of theforestland, level of silviculture (e.g. numbers of trees established per ha, controlof competing vegetation, fertilization etc.) and harvest constraints (e.g.restrictions on the rate of harvest). All of these factors are defined in thestrategic analysis.Comments:
2005
A small portion of the harvest came from the Sproat area in early 2005. Averageharvest as % of LTHL does not allow for Sproat Lake take-back areas. LTHL willbe reduced when recalculated due to a smaller DFA.
The DFA is undergoing significant change. The private land was removed in2004 and now the take-back areas are being removed from the DFA. It is notappropriate to compare the LTHL for a smaller DFA with previous year’s harvestfrom a significantly larger DFA. Therefore, this indicator has been reinitiated,starting in 2005.
The LTHL for 2005 is an estimate from the average m3/ha of Timber HarvestingLandbase (THLB) from the TFL 44 MP #4 analysis multiplied by the THLB areaafter excluding the private lands that were in the DFA (this is the area acrosswhich harvest occurred in 2005). Note that if in addition the take-back areas inthe Sproat Lake, Cous and Nahmint landscape areas are also excluded then theestimated LTHL decreases to 927,000 m3. These rough estimates will be revisedwhen the next analysis is completed. The 2005 harvest includes 173,727 m3
from a tenure awarded for under-cut volume from the 1995 to 1999 cut controlperiod. If this volume is excluded than the “regular” harvest of 1,410,510 is 121%of the estimated LTHL.
2003BCTS - harvest (net) on TFL 44 in 2003 was 84.9 ha. Much of the Ucluelet areawas removed from the DFA in 2003 – thereby reducing the LTHL.
DFA 2005, SFM Data Set April 20/06
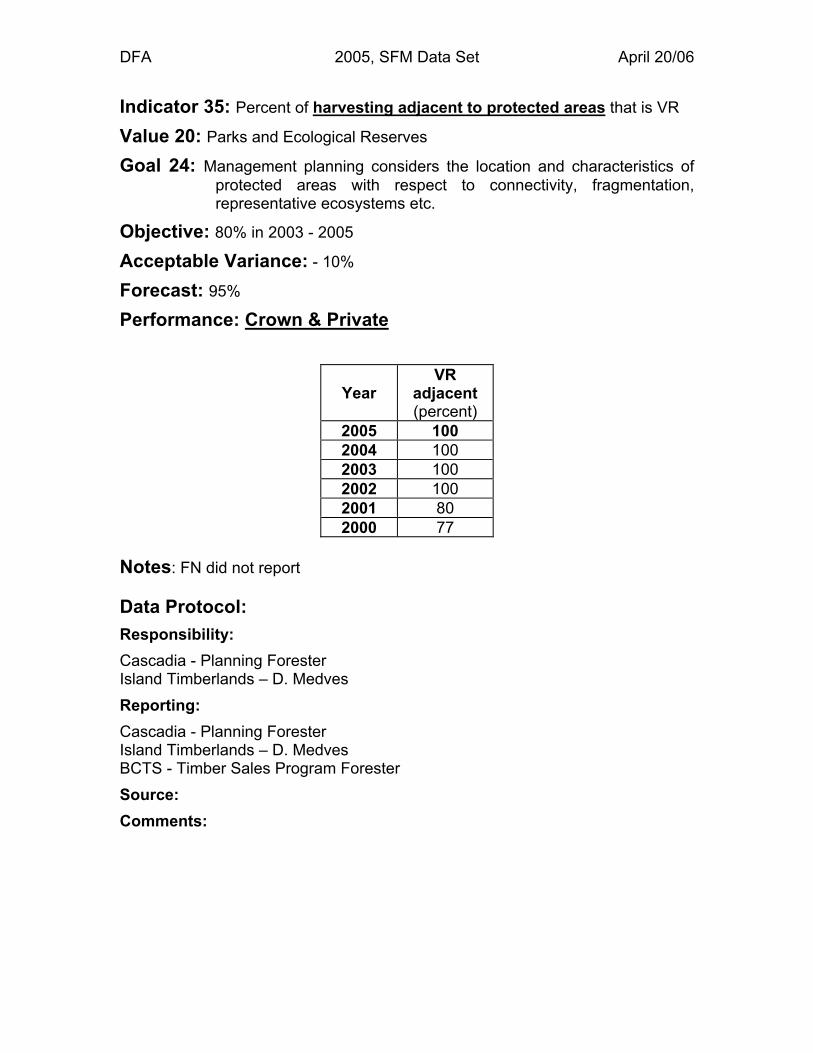
Indicator 35: Percent of harvesting adjacent to protected areas that is VR
Value 20: Parks and Ecological Reserves
Goal 24: Management planning considers the location and characteristics ofprotected areas with respect to connectivity, fragmentation,representative ecosystems etc.
Objective: 80% in 2003 - 2005
Acceptable Variance: - 10%
Forecast: 95%
Performance: Crown & Private
YearVR
adjacent(percent)
2005 1002004 1002003 1002002 1002001 802000 77
Notes: FN did not report
Data Protocol:Responsibility:Cascadia - Planning ForesterIsland Timberlands – D. MedvesReporting:Cascadia - Planning ForesterIsland Timberlands – D. MedvesBCTS - Timber Sales Program ForesterSource:Comments:

DFA 2005, SFM Data Set April 28/06
Indicator 36: Percent of protected area perimeter harvested within previous5 years
Value 20: Parks and Ecological Reserves
Goal 24: Management planning considers the location and characteristics ofprotected areas with respect to connectivity, fragmentation,representative ecosystems etc.
Objective: < 7%
Acceptable Variance: <9.5% within three years
Forecast: < 5%
2002 SFM Plan: Reported previously as Indicator # 31
Performance: Crown & Private
Year% of protectedarea perimeterharvested in
previous 5 yrs.2005 6.92004 8.002003 9.482002 9.102001 7.962000 10.11
Notes:FN did not report.Previous reporting (2000 to 2004) did not include the Pacific Rim National Park
Data Protocol:Responsibility:Cascadia - Planning ForesterIsland Timberlands – D. MedvesReporting:Cascadia - Pacific GIS ConsultingIsland Timberlands – D. MedvesBCTS - Timber Sales Program ForesterSource: All data is from GIS in the form of ArcInfo coverages, with the exceptionof logging updates which comes from Genus.

DFA 2005, SFM Data Set April 28/06
Indicator 36: Percent of protected area perimeter harvested within previous5 years cont.
Comments:2005 - Assumed same park perimeter (revised) as 20042004 - BCTS – 500m for 2004, 400m reported in 2003 [see 2003].2003 - The reduction is due to a significant amount of harvesting occurringadjacent to protected areas 6 years ago (i.e. in 1998). Does not include BCTSharvested area. DFA boundary changed in the Carmanah / Walbran area.Park perimeter for 2003 originally reported as 72 km..2002 - Current performance reflects a disproportionate amount of mature forestsadjacent to protected areas. This performance level will improve slowly overtimeThe percent of protected area perimeter harvested within the previous 5 years,will be calculated annually, utilizing the productive forest only. Themeasurement procedure is to use the GIS to buffer the park perimeters by 100meters, then intersect the buffered coverage with the forest cover. (1997 forestinventory).Select only those stands that are less than 5 years old and recalculate tocompute the percentage of protected area perimeter harvested within theprevious 5 years.No stand level reinventory took place in 2002. Changes that resulted indifferences between 2001 and 2002 dataset/reporting include;
• Exclusion of roaded area (13m buffer for roads), due to a change in thedefinition of Productive Forest
• Areas within 100m of the park perimeter were logged in 2002.The 2003 plan will be reviewed to ensure the performance is within variance.1999 – 1997 inventory

DFA 2005, SFM Data Set April 28/06
Indicator 37: The percent of roads identified in the Recreation AccessInventory that are accessible. (Inventory includes class of roadsby 2-wheel, 4-wheel, and foot access).
Value: Access to recreation areas.
Objective: To maintain public access to the recreation areas identified in theDFA, and outlined in the Recreation Access Inventory.
Target: The percent of identified roads accessible by 2-wheel, and 4-wheel is90%.
Forecast: 90 %
Variance: - 5%
2006 – 2009 SFM Plan: Indicator 34.
Performance: Crown & Private
YearIdentified
roadswith access
(%)2005 1002004 982003 972002 97
Notes: BCTS and FN awareness only.

DFA 2005, SFM Data Set April 28/06
Indicator 37: The percent of roads identified in the Recreation AccessInventory that are accessible. Inventory includes class of roads by2-wheel, 4-wheel, and foot cont..
Data Protocol:Responsibility:Cascadia - Planning ForesterIsland Timberlands – D. MedvesReporting:Cascadia - Planning ForesterIsland Timberlands – Inventory Forester
Source: Recreation Access Inventory (November 2004)Comments:2004H11/Spur 4 [Underwood Cove], deactivated - foot. Taylor 505/550 gated – 4W.Cous Creek Road gated in winter – 2W. Ash 113K and 113E, culverts failing,impassable near top – 4W.2003Recreation Access Inventory (April 2002)Alberni East - H11 bridge removedSproat crown – Katlum Creek bridge removed, Taylor 560 road not maintained.2002Recreation Access Inventory (April 2002)Two roads were identified as not having access, N600 (log pile) and KatlumCreek (slides).The Recreation Access Inventory (sector priority) was produced by the WestIsland Woodlands Advisory Group’s Recreation Sub-committee, and is locatedon the WIWAG’s website http://www.wiwag.org.Access, for purpose of this indicator, is defined as 4-wheel drive, within 500metres of the identified feature.‘Major’ recreation areas will need to be reviewed for 2003.

DFA 2005, SFM Data Set April 28/06
Indicator 38: Percent of DFA covered by a recreational inventory
Value: Recreation & tourism
Goal: [Company] is respectful of the high value of tourism and recreation andother user activities within the DFA
Objective [term]: Maintain inventory of recreational values and incorporateinto planning process.
Acceptable Variance: 95% of DFA inventoried
Forecast: 100%
2002 SFM Plan: Reported previously as Indicator # 33
Performance: Crown & Private
Year Inventoried(percent)
2005 98.92004 972003 972002 972001 972000 991999 99
Notes: Island Timberlands and FN not reported

DFA 2005, SFM Data Set April 28/06
Indicator 38: Percent of DFA covered by a recreational inventory cont.
Data Protocol:Responsibility:Cascadia - Planning ForesterIsland Timberlands – D. MedvesReporting:Cascadia - Pacific GIS ConsultingIsland Timberlands -BCTS – Timber Sales Program Forester
Source: All data is from GIS in the form of ArcInfo coverages, with the exceptionof logging updates which come from Genus.Comments:
2005
BCTS – Inventory is for TFL 44, BCTS has no recreational inventory.
Large lakes are not included in spatial fabric of the Recreation Inventory dataset.This indicator compares the gross DFA area with the gross inventory area,therefore lakes from the forest cover inventory have been included with the areareported as recreation inventory for this calculation.
2004
BCTS – Inventory is for TFL 44, BCTS has no recreational inventory.
2003 - The recreational inventory for the Park Trade) was completed in 2002.The data has yet to be loaded into GIS, and will be entered by December 31,2005.2002 - A Recreation Inventory was completed for TFL 44 in June 1995, withadditional information added in 1997. The Recreation Analysis andManagement Strategy Report (Juan De Fuca Consulting,) including theremaining portion of the DFA (Park Trade), was completed in 2002. However,as of December 31, 2002 it had not been entered into GIS format.Large lakes are not included in the area covered by the Recreation Inventorydataset. This indicator compares the gross DFA area with the gross RecreationInventory area. Inventory lakes were added to the Recreation Inventory area forthe 2002 calculation.The data is used for the Management Plan as well as the FDP.Data for this indicator does not include the Park Trade or other minor privateland holdings.

DFA 2005, SFM Data Set April 28/06
Indicator 39: Number of hectares in which visual condition fails to meetVisual Quality Objectives [VQO].
Value: Recreation & tourism
Goal: [Company] is respectful of the high value of tourism and recreation andother user activities within the DFA
Discussion: The purpose of a Visual Landscape Inventory is to provideinformation about the visual condition, characteristics andsensitivity to alteration of areas and travel corridors. A VisuallySensitive Area (VSA) may includes viewscapes visible fromcommunities, public use areas, travel corridors, including roadwaysand waterways, and any other viewpoint so identified through areferral or planning process.
Objective [term]: Reduce the number hectares from previous reports
Acceptable Variance: +5%
Forecast: Zero
Previous (2002) SFM Plan: Reported previously Indicator # 36
Performance: Crown & Private
Year Area of VQOfailure (percent)
2005 5.182002 7.042000 8.07
Notes: Island Timberlands and FN not reported.
Data Protocol:Responsibility:Cascadia - Planning ForesterIsland Timberlands – D. MedvesReporting:Cascadia - Pacific GIS ConsultingIsland Timberlands –BCTS – Timber Sales Program ForesterSource: All data is from GIS in the form of ArcInfo coverages, with the exceptionof logging updates which came from Genus.
DFA 2005, SFM Data Set April 28/06
Indicator 39: Number of hectares in which visual condition fails to meetVisual Quality Objectives [VQO] cont.
Comments:2005 – Site plans for all BCTS cutblocks requiring VIAs are consistent with theirresults and recommendations.2003 – No updates were done in 2003. All 2003 harvesting met VQOrequirements. Traditionally the inventory is updated at each Management Plansubmission. As MP's are likely disappearing, a system to update the inventoryon a continuous basis will need to be devised.
Not applicable to British Columbia Timber Sales (BCTS). Individual cutblocksharvested by BCTS are designed and harvested to meet VQOs. Weyerhaeuseris responsible for visual inventory.2002 - Data for this indicator does not include the Park Trade or other minorprivate land holdings. The visual inventory area within the DFA only was used.Existing Visual Condition (EVC) is a measure of the present level of landscapealteration caused by human activities. EVC values are taken from Form 15(EVC, Final Values) of the VQO inventory.The official inventory is updated periodically, not annually. Visual ImpactAssessments (VIA’s) for cutblocks, may influence a polygon’s EVC.

DFA 2005, SFM Data Set March 30/06
Indicator 40: The dollar value of harvest by [productive forest] hectares.
Value: The value of the annual harvest from the DFA.
Objective: The total harvest value is stable or increasing over time.
Target: The harvest value is stable or increasing over time.
Variance: – 4%
Forecast: inflation
2006 - 2009 SFM Plan: Indicator 39.
Performance: Crown only
YearAverage
harvest value($/hectare)
2005 916.652004 (1) 688.78
Notes: Island Timberlands, BCTS and First Nations awareness only.
(1) revised, as unable to verify source for 2004
Data Protocol:Responsibility:Cascadia - EMS / Planning ForesterReporting:Cascadia - JN Malbon & Associates (contractor)Source: Ministry of Forests and Range, Historical Coast Log Market Reports,One-month ending December 31.Comments:

DFA 2005, SFM Data Set April 28/06
Indicator 48: Annual harvest level compared to last 5 years
Value 22: Community stabilityGoal 28: Community stability is enhanced by a balanced annual extraction rateDiscussion: This indicator compares actual timber harvest with harvest
targets. It provides an indication of sustainability and ofcontribution to the local and provincial economies.
Objective: Annual cut is within -15% / +25%of previous 5 year average
Acceptable Variance: -20%, + 30%
Forecast: +5%
Previous (2002) SFM Plan: Reported previously as Indicator # 41
Performance: Crown only
YearAnnual harvest as
percent of 5 yr.average(percent)
2005 922004 (1) 1322003 (1) 101
2002 120
Notes:Island Timberlands awareness only.The DFA is undergoing significant change. The private land was removed in2004 and now the take-back areas are being removed from the DFA. It is notappropriate to compare the 2005 harvest with previous year’s harvests from asignificantly larger DFA.(1) Incorrectly reported as; 143% for 2004, and 100% for 2005.

DFA 2005, SFM Data Set April 28/06
Indicator 48: Annual harvest level compared to last 5 years cont.
Data Protocol:Responsibility:Cascadia - EMS / Planning ForesterReporting:Cascadia - Planning Forester, NanaimoFN – Planning Forester, Nanaimo (Cascadia)BCTS – Planning Forester, Nanaimo (Cascadia)
Source:Comments:DFA harvest includes BCTS and FN tenures (e.g. undercut volumes) andincludes residue.The Chief Forester determines the TFL 44 Allowable Annual Cut (AAC) everyfive years as part of the Management Plan process.Scaled harvest volumes are accumulated in the MoF harvest database. TheTFL 44 harvest is confirmed from the MoF “cut control” letter.2005Island Timberlands harvest was estimated.For most of 2005, the TFL 44 AAC was 1,327,000 m3. Effective December 5,2005 the AAC was reduced by 39,500 m3 to 1,287,500 m3 for the Maa-NulthDesignated Area. The weighted average AAC for the year was the 1,324,078m3. In the table this has been reduced by 20,000 (estimated Clayoquotcontribution) to 1,304,078.The definition of the DFA has changed to include areas in TFL 44, only in whichCascadia is involved (i.e. to exclude the take-back areas in the Sproat Lake,Cous and Nahmint landscape units). For this transition year, however, AAC andharvest are reported for all of TFL 44 except Clayoquot.
DFA 2005, SFM Data Set April 28/06
Indicator 48: Annual harvest level compared to last 5 years cont.
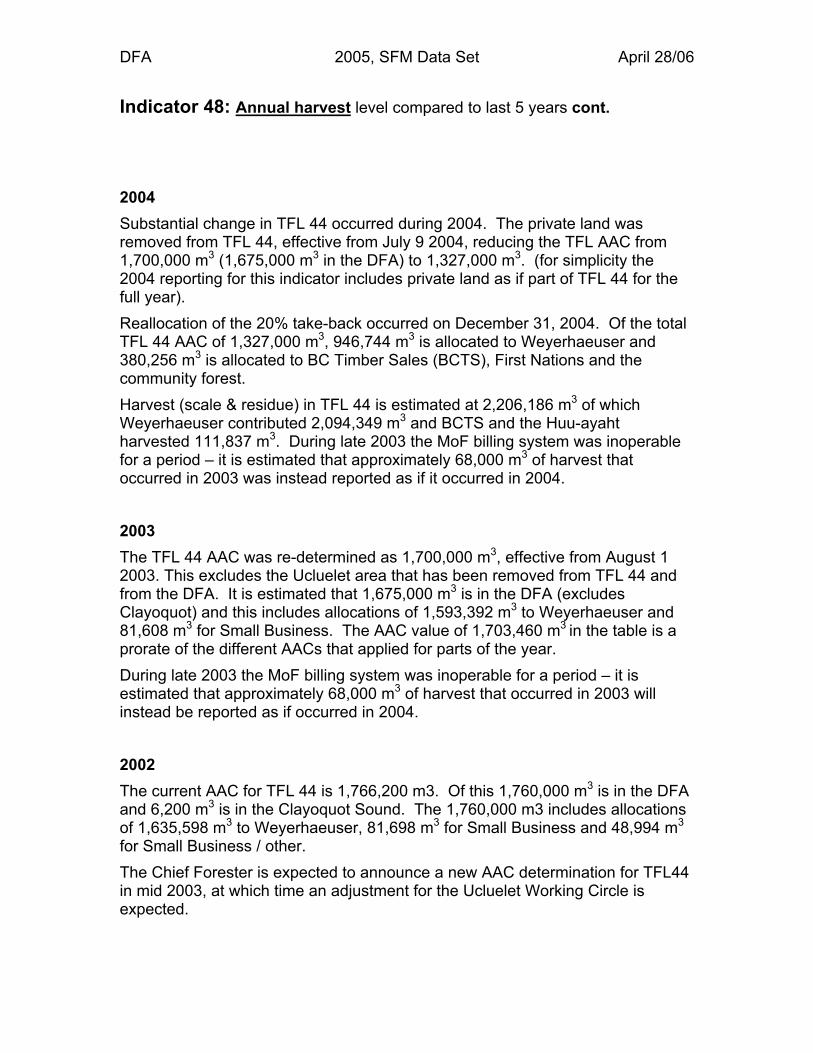
2004Substantial change in TFL 44 occurred during 2004. The private land wasremoved from TFL 44, effective from July 9 2004, reducing the TFL AAC from1,700,000 m3 (1,675,000 m3 in the DFA) to 1,327,000 m3. (for simplicity the2004 reporting for this indicator includes private land as if part of TFL 44 for thefull year).Reallocation of the 20% take-back occurred on December 31, 2004. Of the totalTFL 44 AAC of 1,327,000 m3, 946,744 m3 is allocated to Weyerhaeuser and380,256 m3 is allocated to BC Timber Sales (BCTS), First Nations and thecommunity forest.Harvest (scale & residue) in TFL 44 is estimated at 2,206,186 m3 of whichWeyerhaeuser contributed 2,094,349 m3 and BCTS and the Huu-ayahtharvested 111,837 m3. During late 2003 the MoF billing system was inoperablefor a period – it is estimated that approximately 68,000 m3 of harvest thatoccurred in 2003 was instead reported as if it occurred in 2004.
2003The TFL 44 AAC was re-determined as 1,700,000 m3, effective from August 12003. This excludes the Ucluelet area that has been removed from TFL 44 andfrom the DFA. It is estimated that 1,675,000 m3 is in the DFA (excludesClayoquot) and this includes allocations of 1,593,392 m3 to Weyerhaeuser and81,608 m3 for Small Business. The AAC value of 1,703,460 m3 in the table is aprorate of the different AACs that applied for parts of the year.During late 2003 the MoF billing system was inoperable for a period – it isestimated that approximately 68,000 m3 of harvest that occurred in 2003 willinstead be reported as if occurred in 2004.
2002The current AAC for TFL 44 is 1,766,200 m3. Of this 1,760,000 m3 is in the DFAand 6,200 m3 is in the Clayoquot Sound. The 1,760,000 m3 includes allocationsof 1,635,598 m3 to Weyerhaeuser, 81,698 m3 for Small Business and 48,994 m3
for Small Business / other.The Chief Forester is expected to announce a new AAC determination for TFL44in mid 2003, at which time an adjustment for the Ucluelet Working Circle isexpected.

DFA 2005, SFM Progress Report April 28/06
Indicator 50: [Five year average] Annual harvest compared to local logconsumption that is provided by [company].
Value: Community Stability
Goal: Contribute to and support local economic benefits
Objective: Maintain or increase ration of logs consumed locally by [company]operations versus WIT harvest
Variance: -10%
Forecast: even flow
Performance: Crown only
YearConverted
locally as %of harvest
5 yr. average2005 86.22004 86.12003 93.9
Notes: Island Timberlands, BCTS and FN awareness only.
Data Protocol:Responsibility:Cascadia - EMS / Planning ForesterReporting:Cascadia - Planning Forester, NanaimoComments:2005Harvest is scale (excludes residue) from Cascadia operations (only) in TFL 44.These preliminary estimates are from the harvest billing system – they will beconfirmed or revised when the TFL 44 Cut Control letter is received (expectedApril 2006).Cascadia wood to local mills includes harvest from all of Cascadia’s operationsin 2005 that went to the following mill/destinations: Alberni Pacific Division,Somass, Catalyst (Port Alberni), Coulsons, Ditidaht, Huu-ay-aht, Franklin forestPorducts, Coleman road Shake & Shingle, Marion Creek Forest Products,Nagaard Sawmills, Phil Woodfin.

DFA 2005, SFM Data Set April 28/06
Indicator 52: Number of First Nations that have requested a CulturalHeritage Resource [CHR] contract vs. the number who have one
Value: Aboriginal rights
Goal: Support First Nations’ ability to fully exercise their aboriginal rightsthrough the protection and provision of access to natural andcultural heritage resources
Objective: 100% of First Nations that want one have a CHR contract with WY
Acceptable Variance: 20%
Forecast: 100%
Previous (2002) SFM Plan: Reported previously as Indicator # 50
Performance: Crown only
YearContractsrequested(number)
Contracts(number)
Contracts(percent)
2005 5 1 202004 4 4 1002003 6 6 1002002 6 5 83
Notes: Island Timberlands, BCTS and FN awareness only.
Data Protocol:Responsibility:Cascadia - Planning ForesterReporting:Cascadia - Planning ForesterSource:Comments:2005 - Uchucklesaht, Tseshaht, Hupacasath, Huu-ay-aht, and Ditidaht2004 – Uchucklesaht, Tseshaht, Huu-ay-aht and Ditidaht

DFA 2005, SFM Data Set April 28/06
Indicator 53: Percent of surveys [Cultural Heritage Surveys] conducted vs.number requested
Value: Aboriginal rights
Goal: Support First Nations’ ability to fully exercise their aboriginal rightsthrough the protection and provision of access to natural andcultural heritage resources
Objective: 90% of requested surveys are conducted
Acceptable Variance: 10%
Forecast: 100 %
2002 SFM Plan: Reported previously as Indicator # 49.
Performance: Crown & Private
YearSurveys
conducted(percent)
2005 98.52004 1002003 1002002 100
Note: BCTS and FN did not report.
Data Protocol:Responsibility:Cascadia - Planning ForesterIsland Timberlands – D. Medves
Reporting:Cascadia - Planning ForesterIsland Timberlands – W. French
Comments:

DFA 2005, SFM Data Set April 28/06
Indicator 54: First Nations information sharing and referrals program
Value: Aboriginal rights
Goal: Support First Nations’ ability to fully exercise their aboriginal rightsthrough the protection and provision of access to natural andcultural heritage resources
Objective: Maintain 5 programs and increase based on those who are willing.
Acceptable Variance: Zero
Forecast: 100%
Performance: Crown only
YearFN’s with
information sharing andreferrals program(number/percent)
2005 8 / 1002004 10 / 1002003 10 / 1002002 10 / 1002001 10 / 1002000 10 / 1001999 10 / 100
Notes: Island Timberlands, BCTS and FN awareness only.
Data Protocol:Responsibility:Cascadia - Planning ForesterReporting:Cascadia - Planning ForesterComments:
2005
Cascadia – Level of interaction varied from simple notification to detailed blockreviews.
2004 – No progress has been made with the Ucluelet band.
2003 - Ucluelet has indicated a desire to participate, with correspondence and adraft CHR contract being forwarded.

DFA 2005, SFM Data Set April 28/06
Indicator 55: Percent of blocks by band where agreement is reachedaround the management of Cultural Heritage Resources [CHR].
Value: Aboriginal rights
Goal: Support First Nations’ ability to fully exercise their aboriginal rightsthrough the protection and provision of access to natural andcultural heritage resources
Discussion: Weyerhaeuser pursues agreements from all First Nation(s)that have traditional territory covering archaeological sites that may beimpacted by proposed forestry related activities. This includes theharvesting and/or the management of non-harvested cultural heritageresources. Consent on the management of significant features (as definedin the Heritage Conservation Act) is sought from First Nation(s) claiming thearea where modifications are proposed.
Objective: Achieve 100% First Nation consent on management and/orprotection of identified Cultural Heritage Resources
Acceptable Variance: -15%
Forecast: 100%
Performance: Crown only
YearConsent of
implementation plans(percent)
2005 100%2004 1002003 1002002 1002001 1002000 1001999 100
Notes: Island Timberlands, BCTS and FN awareness only
Data Protocol:Responsibility:Cascadia - Planning ForesterReporting:Cascadia – Planning ForesterComments:
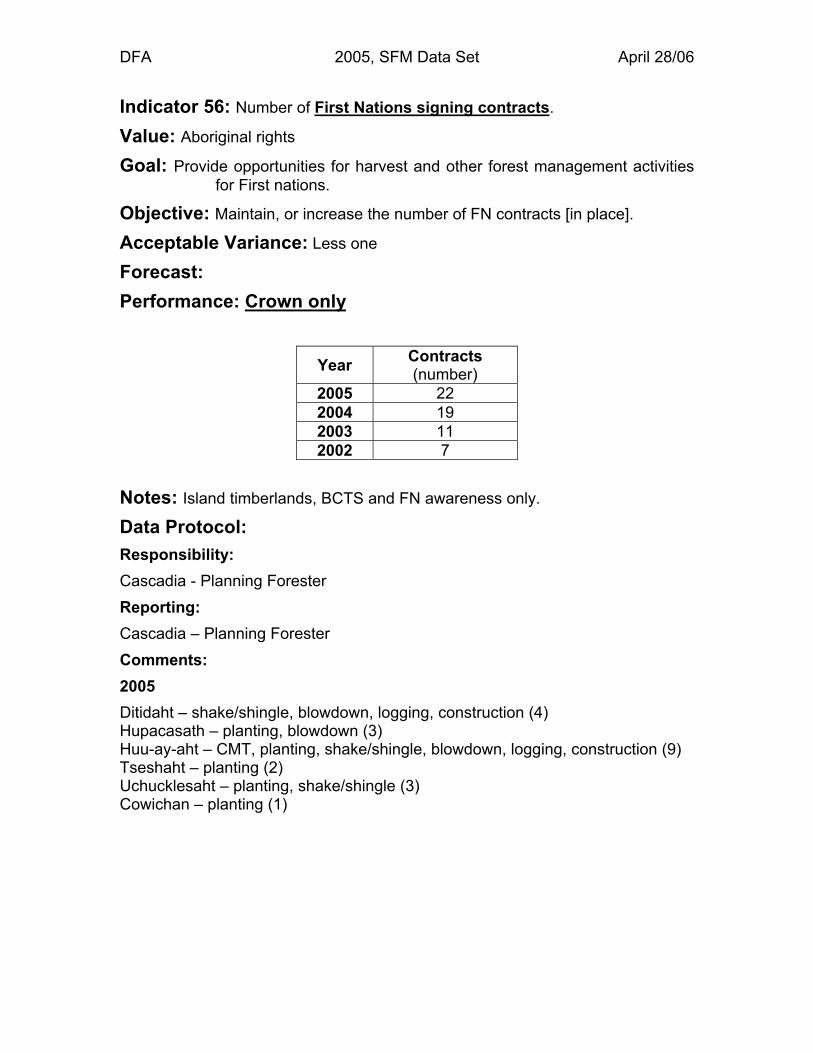
DFA 2005, SFM Data Set April 28/06
Indicator 56: Number of First Nations signing contracts.
Value: Aboriginal rights
Goal: Provide opportunities for harvest and other forest management activitiesfor First nations.
Objective: Maintain, or increase the number of FN contracts [in place].
Acceptable Variance: Less one
Forecast:Performance: Crown only
Year Contracts(number)
2005 222004 192003 112002 7
Notes: Island timberlands, BCTS and FN awareness only.
Data Protocol:Responsibility:Cascadia - Planning ForesterReporting:Cascadia – Planning ForesterComments:2005Ditidaht – shake/shingle, blowdown, logging, construction (4)Hupacasath – planting, blowdown (3)Huu-ay-aht – CMT, planting, shake/shingle, blowdown, logging, construction (9)Tseshaht – planting (2)Uchucklesaht – planting, shake/shingle (3)Cowichan – planting (1)

DFA 2005, SFM Data Set April 22/06
Indicator 57: Proportion of wood volume harvested by FN annually.
Value: First Nations’ derivation of economic benefits from the DFA.
Objective: To increase First Nation’s derivation of economic benefits from theDFA.
Target: Proportion of wood volume harvested by FN annually stays stable orincreases.
Variance: - 10 %
Forecast: stable
2006 – 2009 SFM Plan: Indicator 43.
Performance: Crown only
YearFN harvest as
percent ofharvest
(%)2005 14.72004 10.8 (1)
Notes:Island Timberlands, BCTS and FN awareness only.(1) reported incorrectly as 8.4%
Data Protocol:Responsibility:Cascadia - EMS / Planning ForesterReporting:Cascadia - Scaling SpecialistSource: Salvage and prime volumes tracked by monthly scale reports. Huu-Chuck volume obtained through MoF Harvest Billing System.Comments:2005 - Undercut awards for FN’s distort, and will continue to do so for the nextcouple of years, the data for this Indicator.2004 - FN harvest includes 159,196 m3 of salvage and prime logging, and31,896 m3 by Huu-Chuck.
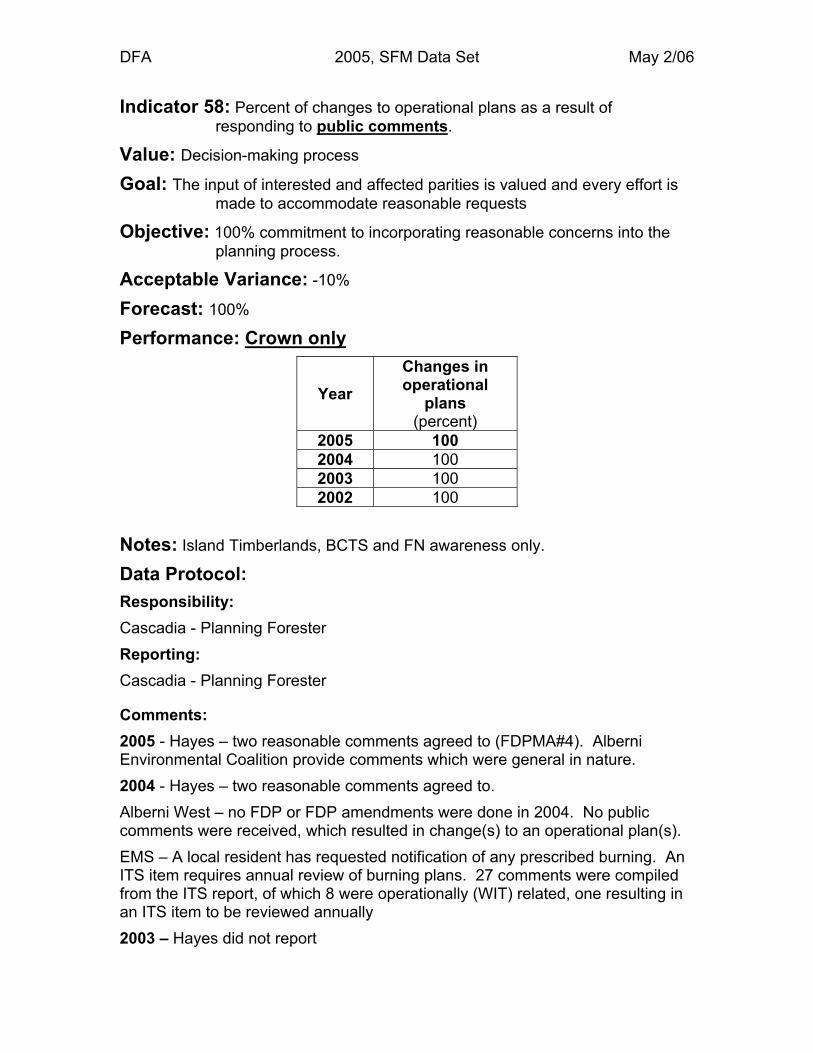
DFA 2005, SFM Data Set May 2/06
Indicator 58: Percent of changes to operational plans as a result ofresponding to public comments.
Value: Decision-making process
Goal: The input of interested and affected parities is valued and every effort ismade to accommodate reasonable requests
Objective: 100% commitment to incorporating reasonable concerns into theplanning process.
Acceptable Variance: -10%
Forecast: 100%
Performance: Crown only
YearChanges inoperational
plans(percent)
2005 1002004 1002003 1002002 100
Notes: Island Timberlands, BCTS and FN awareness only.
Data Protocol:Responsibility:Cascadia - Planning ForesterReporting:Cascadia - Planning Forester
Comments:2005 - Hayes – two reasonable comments agreed to (FDPMA#4). AlberniEnvironmental Coalition provide comments which were general in nature.2004 - Hayes – two reasonable comments agreed to.Alberni West – no FDP or FDP amendments were done in 2004. No publiccomments were received, which resulted in change(s) to an operational plan(s).EMS – A local resident has requested notification of any prescribed burning. AnITS item requires annual review of burning plans. 27 comments were compiledfrom the ITS report, of which 8 were operationally (WIT) related, one resulting inan ITS item to be reviewed annually2003 – Hayes did not report
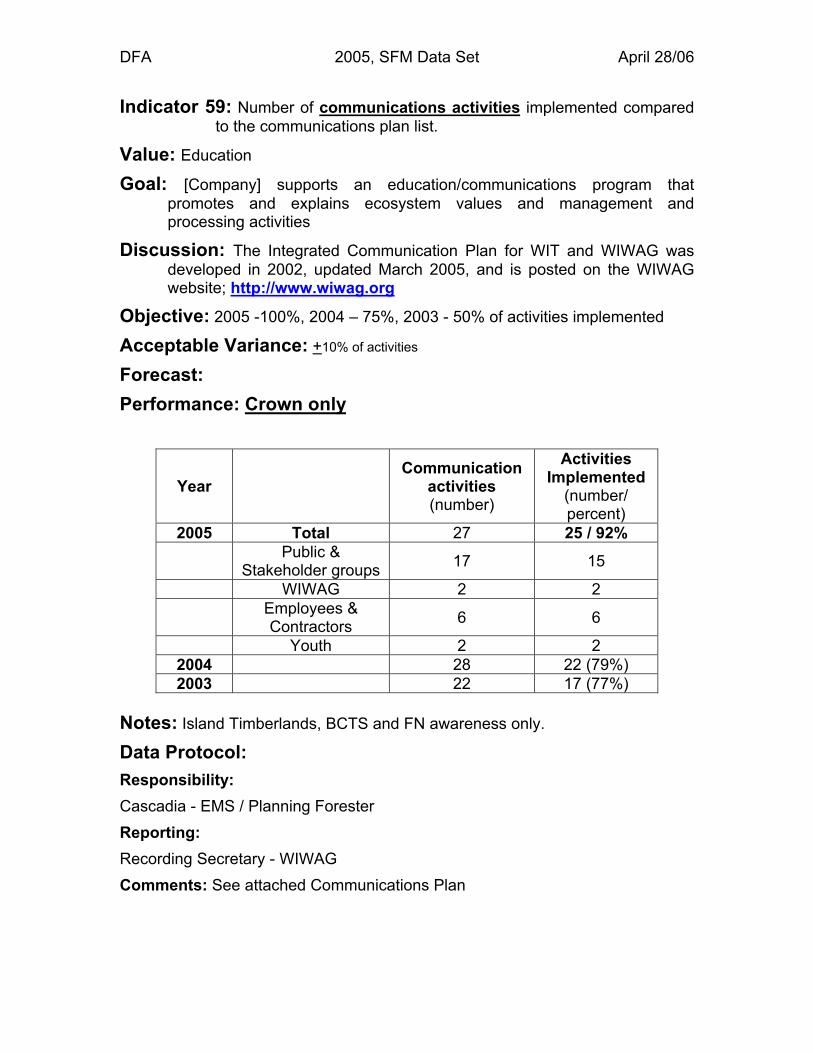
DFA 2005, SFM Data Set April 28/06
Indicator 59: Number of communications activities implemented comparedto the communications plan list.
Value: Education
Goal: [Company] supports an education/communications program thatpromotes and explains ecosystem values and management andprocessing activities
Discussion: The Integrated Communication Plan for WIT and WIWAG wasdeveloped in 2002, updated March 2005, and is posted on the WIWAGwebsite; http://www.wiwag.org
Objective: 2005 -100%, 2004 – 75%, 2003 - 50% of activities implemented
Acceptable Variance: +10% of activities
Forecast:Performance: Crown only
YearCommunication
activities(number)
ActivitiesImplemented
(number/percent)
2005 Total 27 25 / 92%Public &
Stakeholder groups 17 15
WIWAG 2 2Employees &Contractors 6 6
Youth 2 22004 28 22 (79%)2003 22 17 (77%)
Notes: Island Timberlands, BCTS and FN awareness only.
Data Protocol:Responsibility:Cascadia - EMS / Planning ForesterReporting:Recording Secretary - WIWAGComments: See attached Communications Plan

DFA 2005, SFM Data Set April 28/06
Indicator 59: Number of communications activities implemented comparedto the communications plan list cont.
Integrated Communications Plan for WIT Division & WIWAG
Possible Activities:
Directed at Public & Stakeholder Groups Y - Recreation Sector-based meetings or focus groups as required
(WIWAG) N - Public Open House and Annual Report (WIWAG) Y - Members share information between the Advisory & their interest
groups (WIWAG) N - Seminar series (WIWAG) Y - Website to include minutes, agendas, ToR, SFM Plan, FDPs,
brochure, etc. (WIT) Y - WIWAG Brochure Y - TFL 44 Logging Rd. & Recreation Guide (WIT)(printed 2002) Y - Fact sheets - what is certification, DFA, stumpage for dummies (WIT) Y - Distribution of WIWAG minutes (agendas etc.) to members, and others
(WIWAG) Y - Press releases and articles (AV Times, corporate newsletters)
promotion of WIWAG events and certificationaccomplishments/milestones (BOTH) (Certification Shorts - Jan/05,WIWAG brochure - July 05)
Y - Participate in community events, such National Forest Week and FallFair (WIT)(July 05 – Forest Fest, September 05 – Fall Fair)
Y- Promote Weyerhaeuser's public involvement processes, such as FDPpublic review/comment (WIT)
Y - Utilize a 'feedback form' at all public events (WIWAG) Y - Designate a WIWAG spokesperson & respond to media inquiries
(WIWAG) Y - Customer Tours (WIT) Y - Invite all FN with an interest in the TFL to host a WIWAG meeting
and/or make presentations(WIWAG) Y - Road closure notices to members and stakeholders/posted on website
(new 2004) n/a - Signage on logging roads replaced (new 2004)
Directed at WIWAG Members Y - Distribution of corporate newsletters to WIWAG members (WIT) Y - Tours, WIWAG members & press (WIT)

DFA 2005, SFM Data Set April 28/06
Indicator 59: Number of communications activities implemented comparedto the communications plan list cont.
Integrated Communications Plan for WIT Division & WIWAG
Possible Activities:
Directed at Employees & Contractors Y - EMS training (WIT) Y - FN Cultural Awareness Program (WIT) Y - Planners oriented to red/blue species (WIT) Y - WIWAG Minutes distributed (WIT) Y - Attendance at WIWAG meetings is encouraged (WIT) Y - Certification Shorts” newsletter developed & distributed
(WIWAG)(January 2005)
Directed at Youth Y - Funding for Forestry Awareness Program with SD #70 for Grade 5
students [Gently Down the Creek] (WIT) Y - ADSS Forestry Program Liaison (WIT/Hayes)
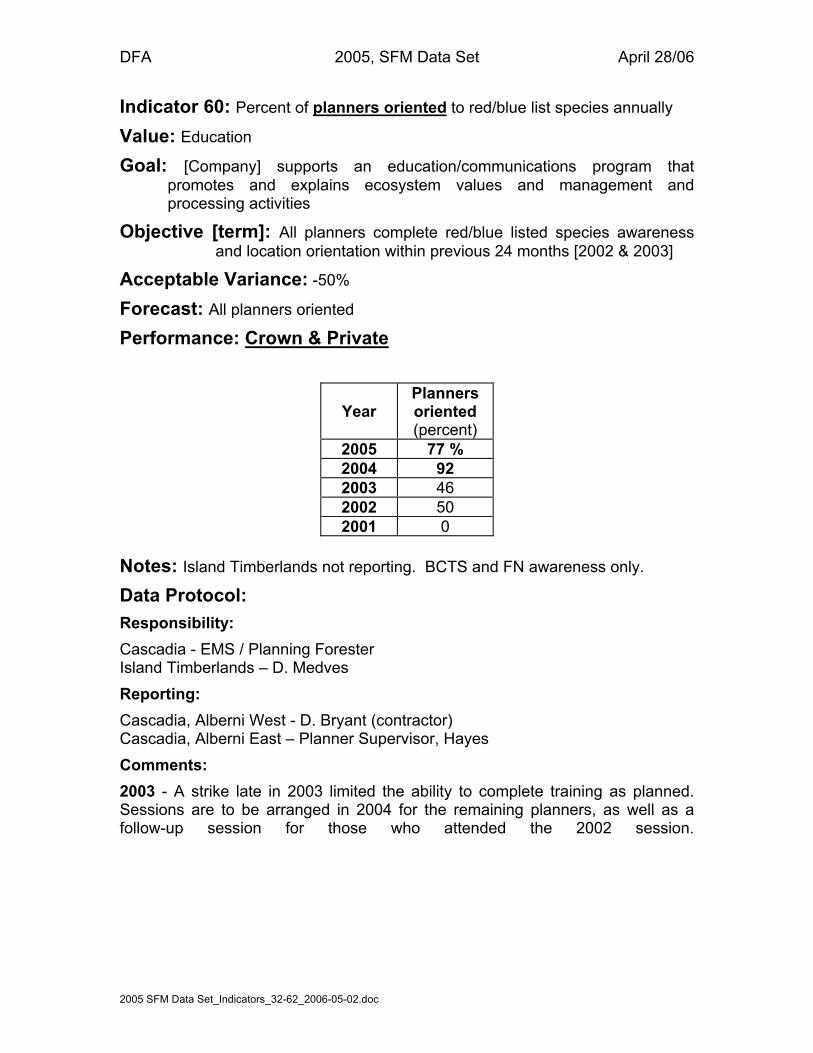
DFA 2005, SFM Data Set April 28/06
2005 SFM Data Set_Indicators_32-62_2006-05-02.doc
Indicator 60: Percent of planners oriented to red/blue list species annually
Value: Education
Goal: [Company] supports an education/communications program thatpromotes and explains ecosystem values and management andprocessing activities
Objective [term]: All planners complete red/blue listed species awarenessand location orientation within previous 24 months [2002 & 2003]
Acceptable Variance: -50%
Forecast: All planners oriented
Performance: Crown & Private
YearPlannersoriented(percent)
2005 77 %2004 922003 462002 502001 0
Notes: Island Timberlands not reporting. BCTS and FN awareness only.
Data Protocol:Responsibility:Cascadia - EMS / Planning ForesterIsland Timberlands – D. MedvesReporting:Cascadia, Alberni West - D. Bryant (contractor)Cascadia, Alberni East – Planner Supervisor, HayesComments:2003 - A strike late in 2003 limited the ability to complete training as planned.Sessions are to be arranged in 2004 for the remaining planners, as well as afollow-up session for those who attended the 2002 session.

DFA 2005, SFM Data Set April 28/06
2005 SFM Data Set_Indicators_32-62_2006-05-02.doc
Indicator 61: Programs or presentations that target youth forestawareness/information
Value: Education
Goal: [Company] supports an education/communications program thatpromotes and explains ecosystem values and management andprocessing activities
Objective [term]: Two strategies that target youth awareness andparticipation in forest management are developed
Acceptable Variance: Zero
Forecast:Performance: Crown only2005 – Twelve (12) Grade 5 classes participated in the Gently Down the Creekprogram, with Weyerhaeuser providing funding for the 2 of the four modules;Riparian Management/Forest Ecology and Forest Economics. ADSS instructor,Brian Laviolette, visited Cascadia’s Alberni East and West operations on anumber of occasions.2004 – Ten (10) Grade 5 classes participated in the Gently Down the Creekprogram, with Weyerhaeuser providing funding for the 2 of the four modules;Riparian Management/Forest Ecology and Forest Economics. The ADSSForestry Program is scheduled for commencement in 2005.2003 - At the November 13, 2003 WIWAG meeting, a Youth Forest Educationpaper was presented by Neil Malbon (Neil Malbon & Associates) and discussedby those in attendance. Subsequent meetings with Rick Avis (WIWAG), DaveChitty (Alberni Valley Enhancement Association), Steve Chambers(Weyerhaeuser) and Neil Malbon resulted in two proposals. The two proposals;Gently Down the Creek (Grade 5), and ADSS Forestry Program (Grade 12) willbe brought forward by Steve Chambers for funding approval.Weyerhaeuser approved funding for the Gently Down the Creek program.2002 - The Integrated Communication Plan for WIT and WIWAG was developedin 2002 and is posted on the WIWAG website; http://www.wiwag.org
Notes: Island Timberlands, BCTS and FN awareness only
Data Protocol:Responsibility: Cascadia - EMS / Planning ForesterReporting: Cascadia - JN Malbon & Associates (contractor)Comments:

DFA 2005, SFM Data Set April 28/06
2005 SFM Data Set_Indicators_32-62_2006-05-02.doc
Indicator 62: Workers trained in the FN Cultural Awareness Program
Value: Education
Goal: [Company] supports an education/communications program thatpromotes and explains ecosystem values and management andprocessing activities
Objective: Ensure that 70% of workers are trained each year
Acceptable Variance: -10%
Forecast: All employees
2002 SFM Plan: Reported previously (in part) as Indicator # 57
Performance: Crown & Private
YearEmployees
trained(percent)
2005 592004 852003 7
Notes: Island Timberlands not reported, BCTS and FN awareness only.
Data Protocol:Responsibility:Cascadia - EMS / Planning ForesterIsland Timberlands – D. MedvesReporting:Cascadia - D. Bryant (contractor) for other contractors and WITIsland Timberlands -Source:First Nations training was incorporated into EMS training. The McGhan TrainingSystem is a computer based program containing information and questions tobe reviewed and answered.
Comments:2004For 2005 Hayes will be covered for this indicator thru their own EMS awarenessreviews, and will not be reported here.For 2005 “Certification Shorts” (an information email briefing the WIWAGminutes) will be sent on a regular basis. This was arranged late in 2004


