West Fraser > Augusta Mill Continuous Kilns Construction ...
264
Environmental solutions delivered uncommonly well PROJECT REPORT West Fraser > Augusta Mill Continuous Kilns Construction Permit Application Prepared By: Justin Fickas – Managing Consultant Jake Stewart – Consultant TRINITY CONSULTANTS 53 Perimeter Center East, Suite 230 Atlanta, Georgia 30346 678‐441‐9977 December 2012 Project 121101.0016
Transcript of West Fraser > Augusta Mill Continuous Kilns Construction ...

Environmental solutions delivered uncommonly well
PROJECT REPORT West Fraser > Augusta Mill
Continuous Kilns Construction Permit Application
PreparedBy:
JustinFickas–ManagingConsultantJakeStewart–Consultant
TRINITYCONSULTANTS53PerimeterCenterEast,Suite230
Atlanta,Georgia30346678‐441‐9977
December2012
Project121101.0016

West Fraser, Inc. – Augusta Mill | Continuous Kiln Construction Permit Application Trinity Consultants i
TABLE OF CONTENTS
1. EXECUTIVE SUMMARY 1-1 1.1.ProposedProject...................................................................................................................................................1‐1 1.2.PermittingandRegulatoryRequirements....................................................................................................1‐2 1.3.BACTDetermination.............................................................................................................................................1‐4 1.4.ApplicationOrganization....................................................................................................................................1‐4
2. FACILITY AND PROJECT DESCRIPTION 2-1 2.1.CurrentFacilityDescription...............................................................................................................................2‐1
2.1.1.LogProcessingArea/Sawmill..............................................................................................................................................2‐1 2.1.2.LumberManufacturing..........................................................................................................................................................2‐1 2.1.3.By‐ProductsProcessing..........................................................................................................................................................2‐1 2.1.4.LumberFinishingArea...........................................................................................................................................................2‐2
2.2.ProjectDescription...............................................................................................................................................2‐2 2.2.1.ContinuousKilnInstallation................................................................................................................................................2‐2 2.2.2.AssociatedAncillaryEmissionUnits.................................................................................................................................2‐2 2.2.3.ExistingUnitShutdowns........................................................................................................................................................2‐3
3. EMISSION CALCULATION METHODOLOGY 3-1 3.1.NSRPermittingEvaluationMethodology.......................................................................................................3‐1
3.1.1.DefiningExistingversusNewEmissionUnits...............................................................................................................3‐1 3.1.2.AnnualEmissionIncreaseCalculationMethodology................................................................................................3‐1 3.1.3.BaselineActualEmissions(A).............................................................................................................................................3‐3 3.1.4.PotentialEmissions(D)..........................................................................................................................................................3‐3
3.2.ProposedProjectEmissionsIncreases...........................................................................................................3‐3 3.2.1.Direct‐FiredContinuousKilns(New)...............................................................................................................................3‐3 3.2.2.AncillaryEquipmentEmissionIncreases........................................................................................................................3‐5 3.2.3.ProjectEmissionsIncreases..................................................................................................................................................3‐6
3.3.ContemporaneousNettingAnalysis................................................................................................................3‐7 3.3.1.DirectFiredBatchKilnEmissionFactors.......................................................................................................................3‐8 3.3.2.ContemporaneousNetting....................................................................................................................................................3‐8
4. REGULATORY APPLICABILITY 4-1 4.1.NewSourceReviewApplicability.....................................................................................................................4‐1 4.2.FederalRegulatoryApplicability.....................................................................................................................4‐2
4.2.1.TitleVOperatingPermitProgram....................................................................................................................................4‐2 4.2.2.NewSourcePerformanceStandards................................................................................................................................4‐3 4.2.3.NationalEmissionStandardsforHazardousAirPollutants..................................................................................4‐4 4.2.4.ComplianceAssuranceMonitoringRegulations..........................................................................................................4‐6
4.3.StateRegulatoryApplicability...........................................................................................................................4‐6 4.3.1.GRAQC391‐3‐1‐.02‐(2)(b)–VisibleEmissions............................................................................................................4‐6 4.3.2.GRAQC391‐3‐1‐.02(2)(c)–Incinerators........................................................................................................................4‐6 4.3.3.GRAQC391‐3‐1‐.02(2)(d)–Fuel‐BurningEquipment..............................................................................................4‐6 4.3.4.GRAQC391‐3‐1‐.02(2)(e)–ParticulateEmissionsfromManufacturingProcesses....................................4‐7 4.3.5.GRAQC391‐3‐1‐.02(2)(g)–SulfurDioxide....................................................................................................................4‐7 4.3.6.GRAQC391‐3‐1‐.02(2)(n)–FugitiveDust......................................................................................................................4‐7 4.3.7.GRAQC391‐3‐1‐.02(2)(tt)–VOCEmissionsfromMajorSources........................................................................4‐7 4.3.8.GRAQC391‐3‐1‐.02(2)(uu)–VisibilityProtection.....................................................................................................4‐7

West Fraser, Inc. – Augusta Mill | Continuous Kiln Construction Permit Application Trinity Consultants ii
4.3.9.GRAQC391‐3‐1‐.02(2)(lll)–NOXfromFuel‐BurningEquipment........................................................................4‐8 4.3.10.GRAQC391‐3‐1‐.03(1)–Construction(SIP)Permitting.......................................................................................4‐8 4.3.11.GRAQC391‐3‐1‐.03(10)–TitleVOperatingPermits.............................................................................................4‐8 4.3.12.IncorporationofFederalRegulationsbyReference................................................................................................4‐8 4.3.13.Non‐ApplicabilityofOtherGRAQC..................................................................................................................................4‐8
5. BEST AVAILABLE CONTROL TECHNOLOGY ASSESSMENT 5-1 5.1.BACTDefinition......................................................................................................................................................5‐1
5.1.1.EmissionLimitation.................................................................................................................................................................5‐1 5.1.2.Case‐by‐CaseBasis....................................................................................................................................................................5‐2 5.1.3.Achievable....................................................................................................................................................................................5‐2 5.1.4.Floor................................................................................................................................................................................................5‐3
5.2.BACTRequirement................................................................................................................................................5‐4 5.3.BACTAssessmentMethodology........................................................................................................................5‐4
5.3.1.IdentificationofPotentialControlTechnologies........................................................................................................5‐4 5.3.2.EconomicFeasibilityCalculationProcess......................................................................................................................5‐4
5.4.LumberDryingKilns–VOCBACT.....................................................................................................................5‐5 5.4.1.IdentificationofPotentialControlTechniques(Step1)..........................................................................................5‐5 5.4.2.EliminationofTechnicallyInfeasibleControlOptions(Step2)............................................................................5‐8 5.4.3.RankofRemainingControlTechnologies(Step3)..................................................................................................5‐10 5.4.4.EvaluationofMostStringentControls(Step4)........................................................................................................5‐10 5.4.5.SelectionofBACT(Step5)..................................................................................................................................................5‐11
6. CLASS I AREA ANALYSIS 6-1
7. ADDITIONAL IMPACT ANALYSIS 7-1 7.1.AirQualityAnalysis..............................................................................................................................................7‐1 7.2.MobileSources.......................................................................................................................................................7‐1 7.3.GrowthImpacts......................................................................................................................................................7‐1 7.4.SoilsandVegetation.............................................................................................................................................7‐1 7.5.VisibilityImpairment...........................................................................................................................................7‐2 7.6.OzoneImpactAnalysis.........................................................................................................................................7‐2
8. TOXIC AIR POLLUTANTS ASSESSMENT 8-1 8.1.DerivationofAcceptableAmbientConcentration......................................................................................8‐1 8.2.DeterminationofToxicAirPollutionImpact...............................................................................................8‐2
8.2.1.ISCModelingResults................................................................................................................................................................8‐3
APPENDIX A: FACILITY PLOT PLAN AND PROCESS FLOW DIAGRAMS A
APPENDIX B: DETAILED EMISSION CALCULATIONS B
APPENDIX C: GEORGIA SIP PERMIT APPLICATION FORMS C
APPENDIX D: BACT SUPPORTING CALCULATIONS D
APPENDIX E: RACT/BACT/LAER CLEARING HOUSE DATABASE REPORT E
APPENDIX F: TOXICS MODELING F
APPENDIX G: TITLE V DATABASE G

West Fraser, Inc. – Augusta Mill | Continuous Kiln Construction Permit Application Trinity Consultants iii
APPENDIX H: REFERENCE DOCUMENTATION H
APPENDIX I: LETTERS TO FEDERAL LAND MANAGERS I

West Fraser, Inc. – Augusta Mill | Continuous Kiln Construction Permit Application Trinity Consultants iv
LIST OF FIGURES
Figure7‐1.UrbanizationEvaluationoftheRichmondCountyMonitorwithandwithouttheProject 7‐3

West Fraser, Inc. – Augusta Mill | Continuous Kiln Construction Permit Application Trinity Consultants v
LIST OF TABLES
Table1‐1.ProposedProjectNetEmissionIncreases 1‐3
Table1‐2.ProposedPrimaryBACTLimitSummary 1‐4
Table3‐1.ProjectEmissionsIncrease 3‐7
Table3‐2.ContemporaneousNettingAnalysis 3‐9
Table4‐1.ProposedProjectNetEmissionIncreases 4‐2
Table5‐1.RemainingVOCControlTechnologies 5‐10
Table6‐1.ClassIAreaswithin300kmofAugustaMill 6‐1
Table6‐2.SumofCombinedAnnualEmissionIncreases 6‐2
Table6‐3.SummaryofQ/DAnalysisforClassISites 6‐2
Table7‐1.OzoneConcentrationatRichmondCountyMonitor 7‐2
Table7‐2.UrbanizationDataforCountiesofInterest 7‐3
Table8‐1.ModeledSourceParameters 8‐2
Table8‐2.ModeledTAPEmissionRates 8‐3
Table8‐3.SummaryofModelingAnalysis 8‐3

West Fraser, Inc. – Augusta Mill | Continuous Kiln Construction Permit Application Trinity Consultants 1-1
1. EXECUTIVE SUMMARY
WestFraser,Inc.(WestFraser)ownsandoperatesalumbersawmillinAugusta,RichmondCounty,Georgia(AugustaMill).TheAugustaMillisamajorstationarysourceunderTitleVandNewSourceReview(NSR)asdefinedbytheGeorgiaEnvironmentalProtection(EPD)AirProtectionDivision.ThemillcurrentlyoperatesunderPart70OperatingPermitNo.2421‐245‐0047‐V‐04‐0,issuedbyEPD,effectiveJune13,2012.WestFraserisproposingmodificationstotheAugustaMillthatwillincreaseitsproductioncapacityofkilndriedlumberandimprovethequalityofthekilndriedlumberproduced.ThisapplicationpackagecontainsthenecessarystateairconstructionpermitapplicationandTitleVoperatingpermitmodificationelementsrelatedtotheproposedproject.TheMillislocatedinRichmondCounty,whichiscurrentlydesignatedas“attainment”or“unclassifiable”forallcriteriapollutant’sNationalAmbientAirQualityStandard(NAAQS).Therefore,theproposedprojectisnotsubjecttoNonattainmentNewSourceReview(NNSR)andispotentiallysubjecttoPreventionofSignificantDeterioration(PSD)permitting,whichisdiscussedinSection4.1ofthisapplication.Lumbermillsarenotonthelistof28namedsourcecategories.Therefore,thePSDmajorsourcethresholdis250tonperyear(tpy)ofacriteriaairpollutant.TheAugustaMillisanexistingmajorPSDsource,sincepotentialemissionsofseveralcriteriaairpollutantsexceedthe250tpythreshold.Thus,thenetemissionincreasesfromtheprojectmustbecomparedtothePSDSignificantEmissionRates(SER)todetermineifPSDpermittingisrequired.WestFraserhasdeterminedthatnetemissionsincreasefromtheprojectwillexceedtheSERforvolatileorganiccompounds(VOC).AdditionalinformationonthenetemissionincreasescanbefoundinSection3.2.AirDispersionModelingisrequiredforallpollutantsthatthenetemissionsincreasefromtheprojectexceedstheSERandthathaveaNAAQS.VOCdoesnothaveaNAAQStodetermineifthecountyisin“attainment”or“nonattainment,”therefore,modelingforcriteriapollutantswasnotcompletedforthisPSDapplication.However,astheprojectinvolvestheadditionofnewlumberdryingkilns,whichproducecertaintoxicairpollutants(TAP)regulatedbyEPD,toxicsmodelinghasbeenincludedaspartofthisapplication.Additionally,becausetheVOCincreaseasaresultoftheprojectisgreaterthan100tonsperyear,anozoneimpactsanalysiswasalsoconductedaspartofthisapplication.
1.1. PROPOSED PROJECT
WestFraserissubmittingthisapplicationtoinstalltwocontinuousdualpathdirectfireddrykilnsattheAugustaMillwhichwillincreasethetotalfacility‐wideproductionlimitto220MMBF/yr.Thethreeexistingdirectbatchlumberdryingkilns(KD01,KD02,andKD03),includingtheburnersassociatedwithallthreekilns,willbeshutdownaspartoftheproject.Thenewcontinuousdirect‐firedkilnswilleachoperatewithonegreensawdustgassifierburnerataheatinputcapacityof35MMBtu/hrforatotalheatinputcapacityof70MMBtu/hrforthetwokilns.Thereducedheatinputintheburnersrequiredforkilndrying,ascomparedtotheexistingsystem,isbecausethecontinuousdualpathkilndesignwillprovidemorethermallyefficientlumberdryingandwillreducethemill’senergyinputrequirements.Asstatedabove,thetotalmillpotentialproductionwillincreasefrom157MMBF/yrdriedlumberto220MMBF/yrafterthecompletionoftheproposedproject.1Therewillbenonewassociatedemissionunitsinstalledormodifiedaspartoftheproposedproject,andnoneoftheexistingancillaryequipmentwillbemodifiedorshutdown;however,therewillbeanincreasedthroughputforalloftheancillaryequipment,
1Pastpotentialthroughputof157MMBF/yrbasedoncurrentfacilitypermit.

West Fraser, Inc. – Augusta Mill | Continuous Kiln Construction Permit Application Trinity Consultants 1-2
includingthehogger,chipper,saws,debarkers,andtrucktrafficonthemillroads.Therefore,theseoperationswillbetreatedasassociatedemissionunitsinthePSDanalysis.Theanticipatedscheduleofinstallationandremovalofemissionunitsisexpectedtobegininthethirdquarterof2013.Atthattimethefirstcontinuouskilnwillbeinstalled.Oncethefirstcontinuouskilnhasbeentested,andfoundtobeworkingproperly,existingbatchkilnsandburnersystemswillberemoved.Thetimebetweentheinstallationofthefirstcontinuouskilnandtheshutdownoftheexistingbatchkilnsandburnerswillbeasminimalaspossible.Followingtheremovalofexistingequipment,thesecondcontinuouskilnwillbeinstalled.
1.2. PERMITTING AND REGULATORY REQUIREMENTS
WestFraserissubmittingthiscombinedconstructionpermitapplicationandTitleVsignificantmodificationapplicationtoEPDtorequestauthorizationtoinstallandoperatetheproposedcontinuouslumberdryingkilnsundertheprovisionsofEPDRulesforAirQualityControl,Chapter391‐3‐1.WestFraseranticipatesinitiatingconstructionoftheprojectduringthethirdquarterof2013.TheAugustaMillislocatedinRichmondCounty,whichisdesignatedas“attainment”or“unclassifiable”forallpollutants.Therefore,netemissionincreasesfromtheproposedprojectandassociatedemissionunitincreasesmustbeevaluatedandcomparedtothemajormodificationthresholdsforregulatedpollutantsforNewSourceReview(NSR)permittingapplicability.ThepollutantsevaluatedforNSRapplicabilityincludecarbonmonoxide(CO),oxidesofnitrogen(NOX),sulfurdioxide(SO2),VOC,particulatematter(PM),particulatematterlessthan10micronsindiameter(PM10),particulatematterlessthan2.5micronsindiameter(PM2.5),andgreenhousegases(GHGs)intheformofcarbondioxideequivalents(CO2e).asshowninTable1‐1.2
2PleasenotethatTotalVOC,asreferredtoinTable1‐1,isVOCasterpenesplusmethanolandformaldehydeasexplainedinSection3.2.1ofthisapplication.

West Fraser, Inc. – Augusta Mill | Continuous Kiln Construction Permit Application Trinity Consultants 1-3
Table1‐1.ProposedProjectNetEmissionIncreases
AsdetailedinSection3.2andsummarizedinTable1‐1,netemissionincreasesfromtheproposedprojectandnetemissionsincreasesordecreasesfromthecontemporaneousemissionperiod,willbebelowthePSDmajormodificationthresholdsforallpollutantsexceptVOC.OnMay13,2010,theU.S.EPAissuedtheTailoringRulewhichestablishesanapproachforaddressinggreenhousegases(GHGs)fromstationarysourcesundertheCleanAirAct(CAA)permittingprograms(PSDandTitleV).3PertheTailoringRule,astheproposedprojectrequiresNSRpermittingforacriteriapollutantandtherequiredPSDpermitwasnotissuedpriortoJanuary2,2011,PSDpermittingforGHGfortheproposedprojectmustalsobeconsidered.OnJuly20,2011,U.S.EPApublishedarulemakingtodeferGHGpermittingrequirementsforthreeyearsforcarbondioxide(CO2)emissionsfrombiomass‐firedandotherbiogenicsources.4Therefore,CO2eestimatesforthenetemissionsincreaseanalysisonlyaccountedforthemethane(CH4)andnitrousoxide(N2O)componentemissionsofbiomasscombustion.
3RulewaspublishedintheFederalRegisteronJune3,2010,andbecameeffectiveAugust2,2010.FederalRegisterVol.75,No.106,June3,2010,pages31541–31608.4FederalRegisterVol.76,No.139,July20,2011.
NetEmissionsIncrease
PSDSERThresholds
Pollutant (tpy) (tpy)
NSRPollutantsCO 28.50 100 NoFluorides N/A 3 N/AH2S N/A 10 N/ALead 5.83E‐04 1 NoNOX 10.93 40 NoReducedSulfurCompounds(includingH2S)
N/A 10 N/A
SO2 0.82 40 NoH2SO4 N/A 7 N/ATotalPM 24.53 25 NoTotalPM10 2.52 15 NoTotalPM2.5 ‐3.63 10 NoTotalReducedSulfur(includingH2S) N/A 10 N/A
TotalVOC 146.57 40 Yes
GreenhouseGasesCO2ebiomassdeferral 143.45 75,000 No
HAPsFormaldehyde 1.56 N/A N/AMethanol 6.25 N/A N/A
PSDPermittingTriggered?

West Fraser, Inc. – Augusta Mill | Continuous Kiln Construction Permit Application Trinity Consultants 1-4
AsaTitleVmajorsource,WestFraserisrequiredtosubmitaTitleVsignificantmodificationapplicationaspartofthePSDpermittingprocessinGeorgia.WestFraserissubmittingthisconstructionandoperatingapplicationinaccordancewithallfederalandstaterequirements.ForVOC,aBestAvailableControlTechnology(BACT)analysisisrequiredaspartofthePSDpermitapplicationsubmittal.NotethatnoPSDdispersionmodelinganalysisisincludedinthisapplication,asemissionsofallpollutantspotentiallyrequiringmodelingarebelowtheSERsfromtheproposedproject.TheproposedprojectwillpotentiallybesubjecttoNewSourcePerformanceStandards(NSPS),NationalEmissionsStandardsforHazardousAirPollutants(NESHAP),andseveralstateregulations.
1.3. BACT DETERMINATION
WestFraserperformedaBACTanalysisfortheonlyNSR‐regulatedpollutantthatexceededthemajormodificationthresholds,VOC,followingthe“top‐down”approachsuggestedbyU.S.EPA.Thetop‐downprocessbeginsbyidentifyingallpotentialcontroltechnologiesforthepollutantinquestion,andmakingadeterminationifthosecontroloptionsaretechnicallyfeasiblefortheprocessinquestion.Theapproachtheninvolvesrankingallpotentiallyrelevantcontroltechnologiesindescendingorderofcontroleffectiveness.Themoststringentor“top”controloptionisBACTunlesstheapplicantdemonstrates,andthepermittingauthorityinitsinformedopinionagrees,thatenergy,environmental,and/oreconomicimpactsjustifytheconclusionthatthemoststringentcontroloptiondoesnotmeetthedefinitionofBACT.WherethetopoptionisnotdeterminedtobeBACT,thenextmoststringentalternativeisevaluatedinthesamemanner.ThisprocesscontinuesuntilBACTisdetermined. BasedontheBACTreview,WestFraserhasdeterminedthatthetechnologyandlimitspresentedinTable1‐2areBACTfortheproposedcontinuouskilns.AdetailedVOCBACTanalysisispresentedinSection5.4ofthisapplication.
Table1‐2.ProposedPrimaryBACTLimitSummary
1.4. APPLICATION ORGANIZATION
Thefollowinginformationisincludedaspartofthisapplicationsubmittal:
Section2describesthecurrentfacilityandtheproposedproject; Section3summarizestheemissionscalculationmethodologiesandassessesNSRapplicability; Section4detailsthefederalandstateregulatoryapplicabilityanalysisfortheproposedproject; Section5containstherequiredBACTassessment; Section6containsthetoxicsmodelingassessment; AppendixAcontainsanareamap,facilitylayout,andprocessflowdiagramsofthefacility; AppendixBincludesdocumentationofemissionscalculations; AppendixCcontainsEPD(SIP)constructionpermitapplicationforms; AppendixDcontainsBACTsupportingcalculations; AppendixEcontainsRACT/BACT/LAERClearingHouseDatabaseReports; AppendixFincludestoxicsmodelinginformation;
Pollutant SelectedBACTEmission/
OperatingLimitComplianceMethod
VOC ProperMaintenanceandOperatingPractices 3.76lb/MBF Recordkeeping

West Fraser, Inc. – Augusta Mill | Continuous Kiln Construction Permit Application Trinity Consultants 1-5
AppendixGincludestheupdatedTitleVDatabase; AppendixHincludesthereferencematerialsusedtodeveloptheapplication;and AppendixIincludesletterssenttotheFederalLandManagersofsurroundingClassIareas.

West Fraser, Inc. – Augusta Mill | Continuous Kiln Construction Permit Application Trinity Consultants 2-1
2. FACILITY AND PROJECT DESCRIPTION
TheAugustaMillproducesdimensionallumberfromlogsandisclassifiedunderStandardIndustrialClassification(SIC)code2421.Therawmaterialfordimensionallumber,theprincipleproduct,issouthernpinelogs.Currentemissiongeneratingoperationsatthemillincludelogprocessing,lumbermanufacturing,by‐productsprocessing,andlumberprocessing.AfacilitysiteplanisincludedinAppendixAdetailingtheproposedlocationsofthecontinuouskilns.AprocessflowdiagramforthecurrentfacilityoperationsandthefacilityfollowingimplementationoftheproposedprojectarealsoprovidedinAppendixA.
2.1. CURRENT FACILITY DESCRIPTION
2.1.1. Log Processing Area/Sawmill
Thebasicfunctionoftheinitiallogprocessingareaistopreparelogsforfurtherprocessingwithinthelumberarea.Treelengthlogsaredeliveredbytrucktothemillonunpavedroads.Logsarecuttodesiredlengthbysaws,andmanuallyfedintothedebarker.Afterthedebarkingstage,logsarecutintoroughboardsusingaseriesofsawingtechniques.Themajorityofthesawdustthatisgeneratedinthesawmillispneumaticallyconveyedintothefurnacesystemsthatfirethebatchkilns.Followingthesawmill,boardsaretransportedtotheexistingbatchkilns.Thelogprocessing/sawmilloperationswillnotbechangedasaresultofthisproject.Existingequipmentmayoperateathigherproductionlevelsduetoincreasedhoursofoperation,however,therewillnotbeanadditionofanyequipmentthatwouldalterthepotential‐to‐emitforthisarea.
2.1.2. Lumber Manufacturing
Thedimensionallumbercutinthesawmillisdriedinoneofthethreeexistingdirectfiredkilnstoreducethemoisturecontentfromapproximately50percentdowntoapproximately15‐20percentmoisturecontent.Currently,therearetwodifferentburnersystemsthatprovideheattothethreedirectfiredbatchfiredkilnsatthefacility.Furnacesystem#3,asdefinedinthepermit,providesheattobothkilnsKD01andKD03whilefurnacesystem#2providesheatexclusivelytoKD02.Bothfurnacesystemsfiregreensawdustthatisgeneratedfromthesawmilloperations.Thecurrentheatinputcapacitiesofthespecifickilns(notthespecificfurnacesystems)KD01,KD02,andKD03are15.05,30.1,and49.45MMBtu/hr,respectively.Thecurrentmaximumlumberproductioncapacityfromthethreekilnslocatedatthemillis157.0MMBF/yr.Thebatchkilnsandtheexistingfurnacesystemswillallberemovedaspartofthisproject.Uponcompletionoftheproposedproject,themillwillhavetwocontinuouskilnswithdirectfiredkilnburners,withthecapacitytoproduce220MMBF/yrdriedlumberandeachoftheproposedcontinuouskilnswillhaveagreensawdustgasifierburner,ratedat35MMBTU/hr.
2.1.3. By-Products Processing
MultiplesecondaryproductsareproducedasaresultoftheoperationsattheAugustaMill.Theseproductscanincludewoodchips,sawdust,bark,andshavings.Althoughamajorityofthegreensawdustisusedasfuelfor

West Fraser, Inc. – Augusta Mill | Continuous Kiln Construction Permit Application Trinity Consultants 2-2
thedryingkilns,whatremainsofthesawdustandotherby‐productsisshippedoff‐site.Nophysicalchangesareplannedtothisareaaspartoftheproposedproject.
2.1.4. Lumber Finishing Area
Driedroughlumberissentfromthelumberkilnstobefinishedintheplanermill.Eachboardispassedthroughaplanertogradethesurfaceandfinishtheboardtoitsfinalthicknessandwidth.Theendsoftheboardarethentrimmedtoachievethefinalboardlength.Aftertrimming,eachboardisstampedandstackedforshipping.ShavingsarehoggedandroutedtothePlanerMillCyclone,whichWestFraserproposestoeliminateasanemissionsunitfromthisproject.WestFraserproposesthatthissourceberemovedfromthefacilitypermitbecauseitisnotanemissionsgeneratingsourceandisusedasamaterialrecoveryunit.Finishedproductisthenloadedontotrucksandshippedoff‐site.
2.2. PROJECT DESCRIPTION
WestFraserproposestocompleteseveralmodificationstotheAugustaMill.Thesemodificationsincludeinstallingtwonewcontinuousdirectfiredkilns(KD04andKD05),removingthethreeexistingdirectfiredbatchkilns(KD01,KD02,andKD03),andremovingtheexistingburnersassociatedwiththecurrentkilns.
2.2.1. Continuous Kiln Installation
Continuouslumberdryingkilnsareanemergingtechnologythatsignificantlyimprovesproductivity,lumbergrade,andenergyefficiencyascomparedtotheoperationofconventionalbatch‐fedkilns.Forexample,muchoftheheatthatislostbetweenbatchesinatraditionalkilnwhenthedoorsopenisretainedwithinacontinuouskiln.Sincethereisnodowntimebetweenbatches,thecontinuouskilnremainsatoperatingtemperatures,whichresultsinsignificantenergysavings.Additionalchambersareconstructedoneachendofthekilnheatingchamberandapushersystemoneachendconveysacontinuousfeedoflumberononetrackintothekilnandonasecondtrackintheoppositedirectionoutofthekiln.Theheatfromthedriedlumbercomingoutofthekilnpreheatsthegreenlumberenteringthekilnonthesecondtrack,resultinginadditionalefficiencygains.Theoperationiscontinuousanddoesnotshutdownexceptforunplannedmalfunctioneventsorplannedmaintenanceoutages.Thecontinuousoperatingfeaturesresultinimprovedenergyefficiencyandproductivityofthelumberdryingprocess.Inaddition,themoisturedrivenoffofthegreenlumberchargeconditionsthedriedlumberexitingthekilnheatingchamberresultinginimprovedproductquality.Thegasifiersystemwillhaveanabortstackwhichwillbeclosedandonlyusedduringperiodsofstartup/shutdown,whichwillhappeninfrequentlybasedoncurrentsystemdesign.Twonewcontinuouskilnswillbeinstalledinthegenerallocationoftheexistingbatchkilns.AfigureoftheproposedlocationsofthekilnsisincludedinAppendixA.
2.2.2. Associated Ancillary Emission Units
TheproposedprojectwillnotincludeanyadditionalmodificationstotheAugustaMill,withtheexceptionoftheinstallationofthecontinuousdirectfireddrykilnsandtheremovaloftheexistingin‐directbatchkilnsandcorrespondingburners.However,therewillbeanemissionsincreasefromancillaryequipmentatthemillbecausethepotentialkilnproductionwillbeincreasing,thusmorematerialwillbeprocessedthroughassociatedunits.Theassociatedancillaryemissionunitsincludesawinganddebarking,materialhandling/transfersources,hoggerandchipperemissions,andhaulroads.

West Fraser, Inc. – Augusta Mill | Continuous Kiln Construction Permit Application Trinity Consultants 2-3
Section3.2.2providesmoreinformationonemissionincreasesfromassociatedancillaryemissionunit(includingthesourcesfortheappropriateemissionfactors);AppendixBdetailstheemissioncalculationsforeachassociatedemissionunit.
2.2.3. Existing Unit Shutdowns
Theexistingbatchkilnsarebeingdecommissionedoncethenewcontinuouskilnsareinstalled.Additionally,theexistingburnersystemswillnolongerbenecessary,andthereforealsodecommissioned.Notethattheshutdownsoftheseequipmentunitsareaseparateprojectthatisoccurringwithinthesamecontemporaneousperiodasthecontinuouskilninstallation,andhavebeenproperlyaccountedforintheemissionnettingcalculations.

West Fraser, Inc. – Augusta Mill | Continuous Kiln Construction Permit Application Trinity Consultants 3-1
3. EMISSION CALCULATION METHODOLOGY
Thissectionaddressesthemethodologyusedtoquantifytheemissionsfromtheproposedprojectandassessesfederalnewsourcereview(NSR)permittingapplicability.Emissionsfromtheproposedprojectwillincludecarbonmonoxide(CO),oxidesofnitrogen(NOX),sulfurdioxide(SO2),volatileorganiccompounds(VOC),particulatematter(PM),particulatematterlessthan10micronsindiameter(PM10),particulatematterlessthan2.5micronsindiameter(PM2.5),greenhousegases(GHGs)intheformofcarbondioxideequivalents(CO2e),andhazardousairpollutants(HAP).Theseemissionsoccurasaresultofcombustioninthekilns,dryingoflumber,andotherprocessoperationsatthefacility.DetailedemissioncalculationsarepresentedinAppendixB.
3.1. NSR PERMITTING EVALUATION METHODOLOGY
TheNSRpermittingprogramgenerallyrequiresthatasourceobtainapermitpriortoconstructionofanyprojectatanindustrialfacilityiftheproposedprojectresultsinthepotentialtoemitairpollutioninexcessofcertainthresholdlevels.TheNSRprogramiscomprisedoftwoelements:nonattainmentNSR(NNSR)andPreventionofSignificantDeterioration(PSD).TheNNSRprogrampotentiallyappliestonewconstructionormodificationsthatresultinemissionincreasesofaparticularpollutantforwhichtheareathefacilityislocatedinisclassifiedas“nonattainment”forthatpollutant.ThePSDprogramappliestoprojectincreasesofthosepollutantsforwhichtheareathefacilityislocatedinisclassifiedas“attainment”or“unclassifiable”.TheAugustaMillislocatedinRichmondCounty,whichispresentlydesignatedas“attainment”or“unclassifiable”forallcriteriapollutants.ThefollowingsectionsdiscussthemethodologyusedintheprojectemissionsincreaseevaluationconductedtoassessPSDapplicabilityundertheNSRprogram.
3.1.1. Defining Existing versus New Emission Units
Differentcalculationmethodologiesareusedforexistingandnewunits;therefore,itisimportanttoclarifywhetherasourceaffectedbytheproposedprojectisconsideredaneworexistingemissionunit. 40CFR52.21(b)(7)(i)and(ii)definenewunitandexistingunits:
(i)Anewemissionsunitisanyemissionsunitthatis(orwillbe)newlyconstructedandthathasexistedforlessthan2yearsfromthedatesuchemissionsunitfirstoperated.(ii)Anexistingemissionsunitisanyunitthatdoesnotmeettherequirementsinparagraph(b)(7)(i)ofthissection.Areplacementunit,asdefinedinparagraph(b)(33)ofthissection,isanexistingemissionsunit.
Basedonthesedefinitions,theproposeddirect‐firedcontinuouswooddryingkilnswillbeclassifiedasnewunitsasWestFraserintendstocompletelyreplacetheexistingbatchkilninfrastructure(i.e.,dryingchambers,tracks)andincreaseoverallkilnproductioncapacity.
3.1.2. Annual Emission Increase Calculation Methodology
AsthemillisclassifiedasamajorsourceforPSD,iftheproposedprojectwereclassifiedasamajormodification,thenthefullPSDpermittingrequirementswouldapply.ProjectincreaseswereevaluatedtodetermineiftheproposedprojectisamajormodificationusingthecurrentNSRReformmethodology.

West Fraser, Inc. – Augusta Mill | Continuous Kiln Construction Permit Application Trinity Consultants 3-2
Forprojectsthatinvolveinstallingnewemissionunits,PSDapplicabilityusingtheactual‐to‐potentialapplicabilitytestisdefinedat40CFR52.21(a)(2)(iv)(d):
(d)Actual‐to‐potentialtestforprojectsthatonlyinvolveconstructionofanewemissionsunit(s).AsignificantemissionsincreaseofaregulatedNSRpollutantisprojectedtooccurifthesumofthedifferencebetweenthepotentialtoemit…fromeachnewemissionsunit…andthebaselineactualemissions…equalsorexceedsthesignificantrateforthatpollutant….
Majormodificationisdefinedby40CFR52.21(b)(2)(i):
“MajorModification”meansanyphysicalchangeinorchangeinthemethodofoperationofamajorstationarysourcethatwouldresultinasignificantemissionincrease…ofaregulatedNSRpollutant…andasignificantnetemissionsincreaseofthatpollutant…
Astheprojectisclassifiedasaphysicalchange,theprojectneedstobeanalyzedtodetermineifasignificantnetemissionsincreasewilloccur.Netemissionsincrease(NEI)isdefinedby40CFR52.21(b)(3)(i):
“NetEmissionsIncrease”means,withrespecttoanyregulatedNSRpollutant…theamountbywhichthesumofthefollowingexceedszero:
(a)Theincreaseinemissions…ascalculatedpursuanttoparagraph(a)(2)(iv)[forexistingunits,calculatedbyactual‐to‐projectedactualoractual‐to‐potential;fornewunits,calculatedbyactual‐to‐potential]ofthissection;and
(b)Anyotherincreasesordecreasesinactualemissions…thatarecontemporaneouswiththeparticularchangeandareotherwisecreditable.Baselineemissionsforcalculatingincreasesanddecreases…shallbedeterminedasprovided…
Thefirststep(A)iscommonlyreferredtoasthe“projectemissionincreases”asitaccountsonlyforemissionsrelatedtotheproposedprojectitself.Thisfirststepintheanalysisdoesnotincludetheproposedshutdownofequipmentassociatedwiththeproject.Iftheemissionincreasesestimatedperstep(A)exceedthemajormodificationthresholds,thentheapplicantmaymovetostep(B),commonlyreferredtoasthenettinganalysis.Thenettinganalysisincludesallprojectsforwhichemissionincreasesordecreases(i.e.,equipmentshutdown)occurred.Iftheresultingnetemissionincreasesexceedthemajormodificationthreshold,thenNSRpermittingisrequired.WhilethepriorquotationsonlyreferencethreecomponentsoftheNEIcalculation,thereareactuallyfourcalculatedcomponents,withtheadditionalcomponentbeingasubsetofthedefinitionforprojectedactual.Thefourcomponentsarelistedbelowandarediscussedindividually,asappropriate.
1. Baselineactualemissions(A)2. Projectedactualemissions(B)3. “Couldhaveaccommodated”emissionsexclusion(C)(commonlycalledthedemandgrowth
exclusion)4. Potentialemissions(D)
Forthisproject,WestFraserhasnotrelieduponprojectedactualemissionsorthe“couldhaveaccommodated”emissionsexclusionastheproposedprojectdoesnotincludeamodificationtoanexistingemissionunit.

West Fraser, Inc. – Augusta Mill | Continuous Kiln Construction Permit Application Trinity Consultants 3-3
3.1.3. Baseline Actual Emissions (A)
Baselineactualemissionsarethemoststraightforwardofthecomponents,andaredefinedin40CFR52.21(b)(48)(ii).
Foranexistingemissionsunit(otherthananelectricutilitysteamgeneratingunit),baselineactualemissionsmeanstheaveragerate,intonsperyear,atwhichtheemissionsunitactuallyemittedthepollutantduringanyconsecutive24‐monthperiodselectedbytheowneroroperatorwithinthe10‐yearperiodimmediatelyprecedingeitherthedatetheowneroroperatorbeginsactualconstructionoftheproject,orthedateacompletepermitapplicationisreceivedbytheAdministratorforapermitrequired…whicheverisearlier,exceptthatthe10‐yearperiodshallnotincludeanyperiodearlierthanNovember15,1990.
Per40CFR52.21(b)(48)(ii)(d)whenaprojectinvolvesmultipleemissionunits,onlyoneconsecutive24‐monthperiodmaybeusedtodeterminethebaselineactualemissionsforalloftheemissionunitstobemodified.However,adifferentconsecutive24‐monthperiodcanbeusedforeachpollutant.
3.1.4. Potential Emissions (D)
Potentialemissionsaredefinedby40CFR52.21(b)(4): …meansthemaximumcapacityofastationarysourcetoemitapollutantunderitsphysicalandoperationaldesign.Anyphysicaloroperationallimitationonthecapacityofthesourcetoemitapollutant,includingairpollutioncontrolequipmentandrestrictionsonhoursofoperationoronthetypeoramountofmaterialcombusted,stored,orprocessed,shallbetreatedaspartofitsdesignifthelimitationortheeffectitwouldhaveonemissionsisfederallyenforceable...
Anymodification(i.e.,aphysicalchangeorchangeinmethodofoperation)tothefacilitythathasthepotentialtoincreaseemissionsofanyairpollutant(s)regulatedunderthePSDorNNSRprogrammustbeevaluatedtodetermineifthechangesaresubjecttoPSDorNNSR.TheproposedprocesschangestotheAugustaMillqualifyasapotentialmodificationandrequireevaluationundertheNSRpermittingprogram.
3.2. PROPOSED PROJECT EMISSIONS INCREASES
ThefollowingsectionssummarizethemethodstoestimatetheemissionsincreasesfromtheproposedprojectforcomparisontotheNSRpermittingmajormodificationthresholds.5
3.2.1. Direct-Fired Continuous Kilns (New)
Potentialemissionsfromthenewdirect‐firedcontinuouskilnswereevaluatedusingthemaximumproductioncapacitiesofthekilns(MBF/yr)andtheburnerheatinputcapacities(MMBtu/yr)inconjunctionwitheitherNationalCouncilforAirandStreamImprovements(NCASI)emissionfactorsorAP‐42factors.6Continuouslumberkilnsrepresentrelativelynewprocesstechnology,particularlytoWestFraser.Theoreticaldesigncapacitiesofthekilnsaspresentedbyvendorshaveageneralrangebetween1–1.5MMBfannuallyperfootofprimarydryingchamberlength.Presently,WestFraserbelievesthatadesigncapacityof1.1MMBf/yr/ftofprimarydryingchamberlengthisarealisticestimateofwhatcanbeachieved.Hence,annualcapacitiesofthe 5AdditionalreferencedocumentationforthesourcesoftheemissionfactorsareincludedinAppendixH.6AllNCASIvaluesusedintheapplicationwereeitherprovidedtoTrinitybyWestFraserorwereobtainedfrompubliclyavailablesources(e.g.airpermitapplicationssubmittedbywoodlumberfacilitiestostateenvironmentalagencies).DetailedreferencesareprovidedinAppendixB.

West Fraser, Inc. – Augusta Mill | Continuous Kiln Construction Permit Application Trinity Consultants 3-4
kilnsarebasedonthe1.1MMBf/yr/ftofprimarydryingchamberlengthandthedesignlengthfortheprimarydryingchamberofeachnewcontinuouskiln.Potentialemissionsofacetaldehyde,formaldehyde,methanol,methylisobutylketone(MIBK),phenol,toluene,andallcriteriapollutants(exceptSO2)fromthedirect‐firedcontinuouskilnswerecalculatedbymultiplyingthemaximumproductioncapacityofdriedlumberfromthekilns(MBF/year)bytheappropriateemissionfactor(lb/MBF).PotentialemissionsofSO2andallotherHAP,exceptpolycyclicaromaticcompounds(PAC),werecalculatedbasedontheamountofwoodcombusted(MMBtu/year)multipliedbythepollutantemissionfactor(lb/MMBtu).PotentialPACemissionswerecalculatedbymultiplyingtheamountofwoodcombustedannually(MMBtu/year)bythepollutantemissionfactor(lb/ton)anddividingbytheaverageheatingvalueofthewood(MMBtu/ton).Allofthecriteriapollutantemissionfactors,withtheexceptionofSO2,arebasedonNCASIvaluesfordirect‐firedkilnsthatwereeitherprovidedtoTrinityConsultantsbyWestFraserorwereobtainedfrompubliclyavailablesources.TheemissionfactorforSO2isfromAP‐42,Section1.6,WoodResidueCombustionforaboilerwithnocontrols.7AppendixBprovidesadetailedlistofemissionfactorsandtheirsources.TheNCASIemissionfactorsthatareusedintheemissioncalculationswereinitiallydevelopedforbatchlumberkilns.Sincecontinuouskilnsareanewtechnology,thereislimitedtestingdata.NoNCASIreviewedtestingdatacurrentlyexistsforcontinuouskilns.8Theemissionfactorsforacontinuouskilnareexpectedtobeequaltoorlessthanthatofabatchkiln.TheexceptiontothiswouldbedatareviewedregardingparticulatematteremissionsaspartofthepreliminarydeterminationforSimpsonLumberCompany,LLC(ApplicationNumber20735).Basedonareviewofthepreliminarydeterminationdocument,thebestavailableemissionfactorsforparticulaterelatedemissionsarebasedontestsconductedatBiblerBrothersLumberCompany,Russelville,AR.TheBiblerBrothersdataisforfilterablePMonly.ThefilterablePMemissionfactoris0.068lb/MBF.CondensablePMisbasedonunpublisheddataprovidedbyNCASI.NCASIrecommendsaratioofCondensabletoFilterablePMof1.016.TheCondensablePMemissionfactorusedistherefore0.069lb/MBF.FilterablePM10isassumedtobe50%offilterablePM(basedonPermitNO.2421‐107‐0011‐V‐02‐3issuedtoRayonierWoodProductsLLC‐SwainsboroSawmill).FilterablePM2.5isassumedtobe87%ofPM10basedonAP‐42forwoodcombustion.AllcondensablePMisassumedtobePM10andPM2.5.TheresultingPM,PM10,andPM2.5emissionfactorsare0.138lb/MBF,0.104lb/MBF,and0.099lb/MBF,respectively.ThemajorityofVOCemittedbythelumberkilnsarearesultofcompoundsbeingreleasedfromthewoodduringthedryingprocess.RelativelyfewVOCsarearesultofcombustion.VOCemissionsfromdryingreleaseslikelydependonanumberoffactors,includingthetypeofwoodbeingdried,thesizeofthewood,theseasonoftheyear,kilnoperatingconditions,andtheoriginalandfinalmoisturecontentsofthewood.ThemaintypeofVOCemittedfromthewoodisintheformofterpenes,primarilyalpha‐pinene,fromsouthernyellowpine.TherearealsowatersolubleVOCreleasedfromthekilnssuchasmethanolandformaldehyde,whichcouldpotentiallybeentrainedinthesignificantquantitiesofwaterdischargedfromcontinuouskilns.9ForNSRpurposes,U.S.EPArequiresthetotalmassofVOCberelieduponforpermittingassessments.Giventheuniquenatureofexhauststreamsfromwoodproductfacilities,U.S.EPAhasestablishedaprotocolforadjustingtraditionalVOCascarbonemissionfactorstoatotalmassVOCbasis.Theprotocolisintendedtoaddress
7U.S.EPAAP‐42,Section13.2.2,WoodResidueCombustion,September2003.8Emissionstestinghasbeencompletedonacontinuousgasifier‐combustorkilnoperatedbyBiblerBros.inArkansas.AdditionaltestingwasconductedbyGeorgia‐PacificontheircontinuouskilnlocatedattheMcCormick,SouthCarolinaMill.However,thesetestingeventsrepresentlimiteddatasetsfromwhichoveralltrendscannotbereasonablyestablished.9Installedkilnshavebeengeneratingbetween2‐6gallonsofwaterperminuteattheendofthekiln.PerconversationwithMr.GaryVandeLinde(WestFraser)andMs.DeannaL.Duram(Trinity),March28,2012.

West Fraser, Inc. – Augusta Mill | Continuous Kiln Construction Permit Application Trinity Consultants 3-5
limitationsandchallengesinVOCtestingmethods.Perthemethodologyestablished,theVOCemissionfactorforcontinuouskilnsiscalculatedusingthefollowingequation:10,11
1.133 1 0.65 TheVOCascarbonemissionfactor(VOCasC,generallyfromaMethod25/25Atestmethod)ismultipliedby1.133,theratioofthemolecularweightofpinene(C10H16,136amu)tothemolecularweightofthecarboninpinene(120amu).AstheMethod25/25Atestmethoddoesnotregisteroxygenatedcompoundswell,emissionsofformaldehydeandmethanolmustbeaddedtoappropriatelyaccountfortheirpresenceinexhauststreamsfromwoodproductfacilities.Accordingly,U.S.EPAhasagreedto“responsefactors”forthesechemicalsthataccountforwhattheMethod25/25Atestswouldobserve.Forexample,formaldehydeisnottypically“recognized”intheVOCtestmethod.Therefore,ithasa0%responsefactor;whereas65%ofmethanolpresentinanexhauststreamiscapturedwithintheVOCasCemissionfactor.Hence,toavoiddouble‐countingofemissions,thespeciatedmethanolemissionfactorisreducedby65%.TheemissionfactorsforCO2eemissionsfromwoodcombustionwerebasedonfactorsestablishedintheGreenhouseGasMandatoryReporting(MRR)rulein40CFR98,TableC‐1andC‐2.Perthebiomassdeferral,theCO2eemissionfactorforthecombustionofbiomassexcludesemissionsofCO2.12
3.2.2. Ancillary Equipment Emission Increases
Inadditiontoemissionsfromthekilns,theproposedprojectwillresultinemissionsincreasesfromancillaryequipmentatthemillassociatedwiththekilns.NotethatonlyFilterablePM,FilterablePM10,andFilterablePM2.5areemittedfromtheancillaryequipmentassociatedwiththeproposedproject.DetailedemissioncalculationsforeachprocessareincludedinAppendixB.
3.2.2.1. Sawing and Debarking
IncreasesinfugitivePMemissionsfromsawinganddebarkingwerebasedontheincreasedlumberthroughputthroughthoseportionsofthefacility.Acontrolefficiencyof90percentwasappliedtoaccountfortheactivitiesbeingperformedindoors.13Notethatthiscontrolefficiencydoesnottakeintoaccountthatthewoodbeingcuthasahighmoisturecontentandwouldthereforegeneratelessemissionsthandrymaterials.ThePMemissionfactorsusedarefromU.S.EPA’sEIIPUncontrolledEmissionFactorsdocumentfortheprocessesofsawinganddebarking,respectively.14,15Theemissionfactorforsawing(0.35poundofTotalPMpertonofwoodprocessed)wasoriginallypublishedinAP‐42witha“D”rating.ItislikelythatthisnumberismuchhigherthanappropriateandresultsininaccuratePMemissioncalculations.ThemostrecentversionofAP‐42,Section10.5,PlywoodManufacturing(publishedinJanuary2002)doesnotlistanemissionfactorforsawing.GiventhelackofamoreaccuratevalueavailableforPMemissionsfromsawing,WestFraserhaschosentousethe0.35lb/tonvalueforconservatism,asastarting
10U.S.EPA,documententitled,“InterimVOCMeasurementProtocolfortheWoodProductsIndustry–July2007,”page2.11Throughouttheapplication,theterms“VOC”and“TotalVOC”areusedinterchangeably.Inallinstances,thebasis,forthepurposeofthisPSDapplication(includingattachments)isasterpenes.12FederalRegisterVol.76,No.139(pages43490–43508).13BasedonguidancebytheTexasCommissiononEnvironmentalQuality(TCEQ)entitled"RockCrushingPlants"(Feb.2002),acontrolefficiencyof90%shouldbeappliedforworkperformedfullyenclosed.14U.S.EPA’sEIIPUncontrolledEmissionFactors(July2001),pertheFactorInformationRetrieval(FIRE)databasemanagementsystem,version6.23forSCCCode3‐07‐008‐02,LogSawing.15U.S.EPA’sEIIPUncontrolledEmissionFactors(July2001),pertheFactorInformationRetrieval(FIRE)databasemanagementsystem,version6.23forSCCCode3‐07‐008‐01,LogDebarking.

West Fraser, Inc. – Augusta Mill | Continuous Kiln Construction Permit Application Trinity Consultants 3-6
point.BasedonobservationsandtestingsummarizedbytheNorthCarolinaDivisionofAirQuality(NCDAQ),itwasassumedthat1.89%ofPMisPM10andthatallPM10isconservativelyPM2.5.16
3.2.2.2. Material Transfer Sources
IncreasesinfugitivePMemissionsfromthetruckloadingandtransferofchips,bark,sawdust,andwoodshavingswerecalculatedusingemissionfactorsbasedonEquation1ofU.S.EPA’sAP‐42,Section13.2.4,AggregateHandlingandStoragePiles.17ThisestimateisexpectedtobeahighlyconservativeassessmentofthepotentialPMemissions.
3.2.2.3. Hogger and Chipper
TheincreaseinfugitivePMemissionsfromthehoggerandchipperwasbasedontheincreasedlumberthroughputforthoseunits.Acontrolefficiencyof90percentwasappliedtoaccountfortheactivitiesbeingperformedindoors.TheemissionfactorsusedforbothprocessesarefromU.S.EPA’sEIIPUncontrolledEmissionFactorsdocumentfordebarking.18
3.2.2.4. Roads
FugitivePMemissionsfromtheincreasedtrucktrafficonthefacilityroadwayswereestimatedbasedonthevehiclemilestravelled(VMT)bytrucksthatwilltransportadditionalmaterialstoandfromthefacility.Vehiclemilestraveledonsitewereestimatedbasedonthedistanceoftheanticipatedtruckrouteforeachmaterialandthenumberoftripsnecessarytosupportcontinuousoperationofthenewkilns.EmissioncalculationsforfugitivepavedroaddustemissionsweredevelopedbasedonAP‐42,Section13.2.1,PavedRoadsandforfugitiveunpavedroaddustfromSection13.2.2,UnpavedRoads.19,20
3.2.3. Project Emissions Increases
Table3‐1showsthetotalemissionsincreasefortheproposedprojectcomparedtotheNSRmajormodificationthresholds.
16Peradocumententitled"EstimatingEmissionsFromGenerationandCombustionof'Waste'Wood‐Draft"(July1998)bytheNCDAQ,thepercentageofPMemittedfromsawingoperationsthatisPM10is1.89%.Thisfactorwasdevelopedfordrywood;theamountofPMthatisPM10whensawingwetwoodismostlikelyevenlower.17U.S.EPAAP‐42,Section13.2.4,AggregateHandlingandStorageFiles,November2006.18Ibid.19U.S.EPAAP‐42,Section13.2.1,PavedRoads,January2011. 20U.S.EPAAP‐42,Section13.2.2,UnpavedRoads,November2006.

West Fraser, Inc. – Augusta Mill | Continuous Kiln Construction Permit Application Trinity Consultants 3-7
Table3‐1.ProjectEmissionsIncrease
AsillustratedinTable3‐1,theprojectemissionincreasesarebelowthemajormodificationthresholdsforCO,H2SO4,Lead,NOX,SO2,andCO2ebiomassdeferral,andPSDpermittingisnotrequiredforthosepollutants.However,projectemissionincreasesexceedthemajormodificationthresholdsforTotalPM,TotalPM10,TotalPM2.5,andTotalVOC.Therefore,theanalysisproceedstoStep(B),thecontemporaneousnettinganalysis.
3.3. CONTEMPORANEOUS NETTING ANALYSIS
WestFraserreviewedallprojectscompletedattheAugustaMillwithinthepastfiveyearstodeterminethenetemissionsincreasesforTotalPM,TotalPM10,TotalPM2.5,andTotalVOCforcomparisontotheapplicableNSRthresholdsforStep(B).Thefivecalendaryearperiodtoreviewincludes2008through2012.Anyunitsthatareshutdownduringthefive‐yearcalendarperiodpreceedingtheprojectareallowedtobeusedasareductioninprojectnetemissionincreasecalculationsprovidedthe10‐yearbaselineestablishedforthatsourceisused.Shouldthetotalemissionsincreasesofanypollutantwithinthecontemporaneousperiodexceedtherespectivemajormodificationthreshold,thentheproposedprojectissubjecttoNSRpermittingforthatpollutant.Theemissiondecreasefromtheshutdownofthecurrentindirectfiredbatchkilnsandburnersaspartoftheproposedprojectisaccountedforinthecontemporaneousnettinganalysis.ThebaselineemissionsfortheseunitsareprovidedinAppendixB.ThefollowingsectionsdescribetheemissionfactorsforTotalPM,TotalPM10,TotalPM2.5,andTotalVOCfortheunitsthatwillbeshutdown.AppendixBprovidesdetailedcalculationsandinformationforthesourcesoftheemissionfactorsused,includingpollutantsnotdescribedinSection3.3.
NewUnits AssociatedUnits Total(tpy) (tpy) (tpy) (tpy)
NSRPollutantsCO 80.30 N/A 80.30 100 NoFluorides N/A N/A N/A 3 NoH2S N/A N/A N/A 10 NoLead 0.01 N/A 0.01 1 NoNOX 30.80 N/A 30.80 40 NoReducedSulfurCompounds(includingH2S)
N/A N/A N/A 10 No
SO2 7.67 N/A 7.67 40 NoH2SO4 N/A N/A N/A 7 NoTotalPM 15.18 38.23 53.41 25 YesTotalPM10 11.44 8.61 20.05 15 YesTotalPM2.5 10.89 1.52 12.41 10 YesTotalReducedSulfur(includingH2S) N/A N/A N/A 10 No
TotalVOC 413.06 N/A 413.06 40 Yes
GreenhouseGasesCO2ebiomassdeferral 1,334.30 N/A 1,334.30 75,000 No
HAPsFormaldehyde 4.40 N/A 4.40 N/A N/AMethanol 17.60 N/A 17.60 N/A N/A
PSDPermittingTriggered?Pollutant
EmissionsIncrease PSDSERThresholds

West Fraser, Inc. – Augusta Mill | Continuous Kiln Construction Permit Application Trinity Consultants 3-8
Therewerenootherprojectsinthecontemporaneousperiodleadingtoanincreaseordecreaseinemissionsthatmustbeincludedinthenettinganalysis.
3.3.1. Direct Fired Batch Kiln Emission Factors
Theemissionsfromtheexistingfacilitydirect‐firedbatchkilnswereprimarilyparticulatematterandVOC.ThemethodologyforcalculatingaVOCemissionfactorfortheexistingkilnswasbasedonthesameVOCemissionfactorthatwaspresentedinSection3.2.1ofthisreport.AdditionaldetailscanbefoundinAppendixBofthisapplication.ThemethodologyforcalculatingPM,PM10,andPM2.5iscompletelydescribedinAppendixB.ThePMrelatedvaluesareprimarilybasedonunpublishedNCASIvaluesfordirect‐firedkilns,providedintheNCDAQAirPermitReview/PreliminaryDetermination(Page9)fortheWeyerhauserNRLumberMill(Plymouth,N.C.),May2010permitapplication.
3.3.2. Contemporaneous Netting
Table3‐2summarizesthetotalnetemissionschangesoverthecontemporaneousperiodforTotalPM,TotalPM10,TotalPM2.5,andTotalVOC,whichincludestheshutdownofemissionunitsasaresultoftheproposedproject.

West Fraser, Inc. – Augusta Mill | Continuous Kiln Construction Permit Application Trinity Consultants 3-9
Table3‐2.ContemporaneousNettingAnalysis
AsTable3‐2shows,theTotalPM,TotalPM10,TotalPM2.5emissionsarelessthantheapplicablemajormodificationthresholds,andthus,NSRpermittingisnotrequiredforthesepollutants.However,theTotalVOCemissionsincreasesexceedtheapplicablePSDmajormodificationthreshold,andthusNSRpermittingisrequiredforTotalVOC.DetailedcalculationsfortheabovediscussednettinganalysiscanbefoundinAppendixB.
Source TotalPM(tpy) TotalPM10(tpy) TotalPM2.5(tpy) TotalVOC(tpy)
PotentialEmissionsIncreasesPotentialEmissionsfromNewUnitsContinuousDirect‐firedKilns 15.18 11.44 10.89 413.06
ProjectedActualAssociatedEmissionsIncreasesSawingandDebarking 4.90 0.23 0.23 ‐MaterialTransfer/Chipper/Hogger
0.16 0.08 0.06‐
Roads 33.17 8.29 1.23 ‐
ContemporaneousDecreasesBaselineEmissionsfromDecommissionedUnitsBatchDirect‐firedKilns 28.88 17.53 16.04 266.49
TotalPotentialEmissionsIncreases 53.41 20.05 12.41 413.06
TotalContemporaneousEmissionDecreases 28.88 17.53 16.04 266.49
NetEmissionsIncrease 24.53 2.52 ‐3.63 146.57
PSDSERThresholds 25 15 10 40PSDPermittingTriggered? No No No Yes

West Fraser, Inc. – Augusta Mill | Continuous Kiln Construction Permit Application Trinity Consultants 4-1
4. REGULATORY APPLICABILITY
TheAugustaMillissubjecttocertainfederalandstateairregulations.Thissectionoftheapplicationsummarizestheairpermittingrequirementsandkeyairqualityregulationsthatwillapplytothefacilityunderbothfederalandstatepermittingprograms.ApplicabilitytoNewSourceReview(NSR),TitleV,NewSourcePerformanceStandards(NSPS),NationalEmissionsStandardsforHazardousAirPollutants(NESHAP),andEPDstaterulesareaddressed.
4.1. NEW SOURCE REVIEW APPLICABILITY
TheNSRpermittingprogramgenerallyrequiresasourcetoobtainapermitandundertakeotherobligationspriortoconstructionofanyprojectatanindustrialfacilityiftheproposedprojectresultsinthepotentialtoemitairpollutioninexcessofcertainthresholdlevels.TheNSRprogramiscomprisedoftwoelements:NonattainmentNSR(NNSR)andPreventionofSignificantDeterioration(PSD).TheNNSRprogrampotentiallyappliestonewconstructionormodificationsthatresultinemissionincreasesofaparticularpollutantforwhichtheareawherethefacilityislocatedisclassifiedas“nonattainment”forthatpollutant.ThePSDprogramappliestoprojectincreasesofthosepollutantsforwhichtheareathefacilityislocatedinisclassifiedas“attainment”or“unclassifiable.”ThefacilityislocatedinRichmondCounty,whichhasbeendesignatedbytheU.S.EPAas“attainment”or“unclassifiable”forallcriteriapollutantsincludingozone.21Therefore,thefacilityisnotsubjecttoNNSRpermittingrequirements.However,newconstructionormodificationsthatresultinemissionsincreasesarepotentiallysubjecttoPSDpermittingrequirements.ThePSDprogramonlyregulatesemissionsfrom“major”stationarysourcesofregulatedairpollutants.AstationarysourceisconsideredPSDmajorifpotentialemissionsofanyregulatedpollutantexceedthemajorsourcethresholds.ThePSDmajorsourcethresholdis250tpyofanon‐GHGcriteriapollutantand100,000tpyofGHGsintheformofCO2e.22 AstheAugustaMillisamajorPSDsource,thenetemissionsincreasefromtheproposedprojectmustbecomparedtothemajormodificationthresholdstodetermineifPSDpermittingisrequired.ThenetemissionincreaseanalysiswaspresentedinSection3.3ofthisreport.Table4‐1presentsasummaryoftheanalysis.
2140CFR81.311.22Woodproductmanufacturingfacilitiesarenotonthe“Listof28”sourceswhicharesubjecttoalowermajorsourcethresholdforcriteriapollutantsof100tpy.

West Fraser, Inc. – Augusta Mill | Continuous Kiln Construction Permit Application Trinity Consultants 4-2
Table4‐1.ProposedProjectNetEmissionIncreases
AsillustratedinTable4‐1,theproposedprojectnetemissionincreaseexceedsthemajormodificationthresholdforTotalVOC.Accordingly,PSDpermittingisrequiredforthatpollutant.
4.2. FEDERAL REGULATORY APPLICABILITY
40CFRPart70(TitleV),40CFRPart60(NSPS)and40CFRParts61and63(NESHAP)werereviewedtodetermineapplicabilitytoproposedemissionunitsatthefacility.
4.2.1. Title V Operating Permit Program
TheTitleVprogramwasestablishedaspartofthe1990CleanAirActAmendmentsandisinthefederalregulationsat40CFRPart70‐71.Georgiahasdevelopedtheirownprogramunder40CFRPart70,whichisprovidedinChapter391‐3‐1‐.03(10)oftheGeorgiaRulesforAirQualityControl.TitleVrequiresthatallnewandexistingmajorsourcesofairemissionsobtainfederallyapprovedstateadministeredoperatingpermits.AmajorsourceasdefinedundertheTitleVprogramisafacilitythathasthepotentialtoemiteithermorethan100tonsperyear(tpy)foranycriteriapollutant,morethan10tpyforanysinglehazardousairpollutant(HAP),andmorethan25tpyforallHAP.Additionally,40CFRPart70.2definesfacilitieswithpotentialemissions
NetEmissionsIncrease
PSDSERThresholds
Pollutant (tpy) (tpy)
NSRPollutantsCO 28.50 100 NoFluorides N/A 3 N/AH2S N/A 10 N/ALead 5.83E‐04 1 NoNOX 10.93 40 NoReducedSulfurCompounds(includingH2S)
N/A 10 N/A
SO2 0.82 40 NoH2SO4 N/A 7 N/ATotalPM 24.53 25 NoTotalPM10 2.52 15 NoTotalPM2.5 ‐3.63 10 NoTotalReducedSulfur(includingH2S) N/A 10 N/A
TotalVOC 146.57 40 Yes
GreenhouseGasesCO2ebiomassdeferral 143.45 75,000 No
HAPsFormaldehyde 1.56 N/A N/AMethanol 6.25 N/A N/A
PSDPermittingTriggered?

West Fraser, Inc. – Augusta Mill | Continuous Kiln Construction Permit Application Trinity Consultants 4-3
greaterthan100,000tpyofCO2earesubjecttoregulationundertheTitleVpermittingprogram.PotentialemissionsofmultiplepollutantsexceedtheTitleVmajorsourcethresholdandassuchtheAugustaMillwillcontinuetoberegulatedasaTitleVMajorSource.
4.2.2. New Source Performance Standards
NSPS,locatedin40CFR60,requirenew,modified,orreconstructedsourcestocontrolemissionstothelevelachievablebythebest‐demonstratedtechnologyasspecifiedintheapplicableprovisions.Moreover,anysourcesubjecttoanNSPSisalsosubjecttothegeneralprovisionsofNSPSSubpartA,exceptasnoted.
4.2.2.1. 40 CFR 60 Subpart Dc, Standards of Performance for Small Industrial-Commercial-Institutional Steam Generating Units
NSPSSubpartDc,SmallIndustrial‐Commercial‐InstitutionalSteamGeneratingUnits,appliestosteamgeneratingunitsratedbetween10and100MMBtu/hrconstructed,modified,orreconstructedafterJune9,1989NSPSSubpartDc(StandardsofPerformanceforSmallIndustrialCommercial‐InstitutionalSteamGeneratingUnits)appliestosteamgeneratingunitswithaheatinputcapacitygreaterthanorequalto10MMBtu/hrandlessthanorequalto100MMBtu/hrthathavebeenconstructed,modified,orreconstructedafterJune9,1989.Theterm“steamgeneratingunit”isdefinedunderthisregulationasshownbelow:
“Steamgeneratingunitmeansadevicethatcombustsanyfuelandproducessteamorheatswateroranyotherheattransfermedium.Thistermincludesanyductburnerthatcombustsfuelandispartofacombinedcyclesystem.Thistermdoesnotincludeprocessheatersasdefinedinthissubpart.”23
Thenewcontinuousdirect‐firedkilnswilleachoperatewithagreensawdustgasifierburnerataheatinputcapacityof35MMBtu/hr,andwillbeconstructedin2013.However,thegasifierburnerswillnotgeneratesteambecausethecombustiongasesfromthefuel(greensawdust)willdirectlycontactthelumberduringthedryingprocess.Therefore,SubpartDcisnotapplicablefortheproposedproject.
4.2.2.2. 40 CFR 60 Subpart CCCC, Standards of Performance for Commercial and Industrial Solid Waste Incineration Units for Which Construction is Commenced after November 30, 1999 or for which Modification or Reconstruction is Commenced on or After June 1, 2001
NSPSSubpartCCCCestablishesemissionlimitsandstandardsforoperationandmaintenanceofcommercialandindustrialsolidwasteincineration(CISWI)units.Astheproposedgasifierburnerswillcombustwoodwasteforfuel,thepotentialapplicabilityofthisregulationwasreviewed.40CFR241.2(partofthesolidwasteregulations)definesacleancellulosicbiomassas
….thoseresidualsthatareakintotraditionalcellulosicbiomasssuchasforest‐derivedbiomass(e.g.,greenwood,forestthinnings,cleanandunadulteratedbark,sawdust,trim,andtreeharvestingresidualsfromloggingandsawmillmaterials),cornstoverandotherbiomasscropsusedspecificallyforenergyproduction(e.g.,energycane,otherfastgrowinggrasses),bagasseandothercropresidues(e.g.,peanutshells),woodcollectedfromforestfireclearanceactivities,treesandcleanwoodfoundindisasterdebris,cleanbiomassfromlandclearingoperations,andcleanconstructionanddemolitionwood.Thesefuelsarenotsecondarymaterialsorsolidwastesunlessdiscarded.Cleanbiomassisbiomassthatdoesnotcontaincontaminantsatconcentrationsnotnormallyassociatedwithvirginbiomassmaterials.”
2340CFR60.41(c).

West Fraser, Inc. – Augusta Mill | Continuous Kiln Construction Permit Application Trinity Consultants 4-4
ThefuelforthegasifierburnerswillbegreensawdustproducedattheAugustaMill.Bythedefinitionprovidedabove,thegreensawdustisnotclassifiedassecondarymaterialsorsolidwasteinitsproposeduseatthemill.Assuch,thecombustionunitsarenotCISWIunits,andSubpartCCCCisnotapplicablefortheproposedproject.
4.2.2.3. Non-Applicability of All Other NSPS
NSPSstandardsaredevelopedforparticularindustrialsourcecategoriesandtheapplicabilityofaparticularNSPStoafacilitycanbereadilyascertainedbasedontheindustrialsourcecategorycovered.AllotherNSPSarecategoricallynotapplicabletotheproposedproject.
4.2.3. National Emission Standards for Hazardous Air Pollutants
NESHAP,locatedin40CFR63,havebeenpromulgatedforsourcecategoriesthatemithazardousairpollutants(HAP)totheatmosphere.AfacilitythatisamajorsourceofHAPisdefinedashavingpotentialemissionsgreaterthan25tpyoftotalHAPand/or10tpyofasingleHAP.FacilitieswithapotentialtoemitHAPatanamountlessthanthemajorsourcethresholdsareotherwiseconsideredanareasource.TheNESHAPallowableemissionlimitsaremostoftenestablishedonthebasisofamaximumachievablecontroltechnology(MACT)determinationfortheparticularsource.TheNESHAPapplytosourcesinspecificallyregulatedindustrialsourcecategories(CleanAirActSection112(d))oronacase‐by‐casebasis(Section112(g))forfacilitiesnotregulatedasaspecificindustrialsourcetype.TheAugustaMillisclassifiedasamajorsourceofHAPasthemillhaspotentialHAPemissionsgreaterthanthemajorsourcethresholds.ThedeterminationofapplicabilitytoNESHAPrequirementsaredetailedinthefollowingsections.
4.2.3.1. 40 CFR 63 Subpart A, General Provisions
NESHAPSubpartA,GeneralProvisions,containsnationalemissionstandardsforHAPdefinedinSection112(b)oftheCleanAirAct.Allaffectedsources,whicharesubjecttoanotherNESHAP,aresubjecttothegeneralprovisionsofNESHAPSubpartA,unlessspecificallyexcludedbythesource‐specificNESHAP.
4.2.3.2. 40 CFR 63 Subpart DDDD, Plywood and Composite Wood Products
40CFR63SubpartDDDDregulatesHAPemissionsfromplywoodandcompositewoodproducts(PCWP)manufacturingfacilitiesthataremajorHAPsources.ThePCWPMACTwasinitiallyfinalizedbyU.S.EPAonJuly30,2004,andwasreissuedandamendedafterreconsiderationonFebruary16,2006.TherulewaspartiallyvacatedandremandedbytheD.C.CircuitCourtofAppealsinJune2007.Lumberkilnsareprocessunitswithintheexisting“affectedsource”underthePCWPMACT,definedin40CFR63.2232(b)as
Thecollectionofdryers,refiners,blenders,formers,presses,boardcoolers,andotherprocessunitsassociatedwiththemanufacturingofplywoodandcompositewoodproducts.Theaffectedsourceincludes,butisnotlimitedto,greenendoperations,refining,dryingoperations(includinganycombustionunitexhauststreamroutinelyusedtodirectfireprocessunit(s)),resinpreparation,blendingandformingoperations,pressingandboardcoolingoperations,andmiscellaneousfinishingoperations(suchassanding,sawing,patching,edgesealing,andotherfinishingoperationsnotsubjecttoothernationalemissionstandardsforhazardousairpollutants(NESHAP)).Theaffectedsourcealsoincludesonsitestorageandpreparationofrawmaterialsusedinthemanufactureofplywoodand/orcompositewoodproducts,suchasresins;onsitewastewatertreatmentoperationsspecificallyassociatedwithplywoodand

West Fraser, Inc. – Augusta Mill | Continuous Kiln Construction Permit Application Trinity Consultants 4-5
compositewoodproductsmanufacturing;andmiscellaneouscoatingoperations(§63.2292).TheaffectedsourceincludeslumberkilnsatPCWPmanufacturingfacilitiesandatanyotherkindoffacility.
However,basedon§63.2252,forprocessunitsnotsubjecttothecomplianceoptionsorworkpracticerequirementsspecifiedin§63.2240(including,butnotlimitedto,lumberkilns),thefacilityisnotrequiredtocomplywiththecomplianceoptions;workpracticerequirements;performancetesting;monitoring;startup,shutdown,andmalfunction(SSM)plans;andrecordkeepingorreportingrequirementsofSubpartDDDD,oranyotherrequirementsinNESHAPSubpartA,GeneralProvisions,exceptfortheinitialnotificationrequirementsin§63.9(b).Althoughthelumberkilnsareanaffectedsource,therearenoapplicablerequirementsfortheproposeddirect‐firedkilnsatthemill.
4.2.3.3. 40 CFR 63 Subpart DDDDD, Industrial, Commercial, and Institutional Boilers and Process Heaters
40CFR63SubpartDDDDD,alsoknownasBoilerMACT,wasoriginallypromulgatedonSeptember13,2004,andregulatedHAPemissionsfromsolid,liquid,andgaseousfuel‐firedboilersandprocessheatersatfacilitiesthatareamajorsourceofHAP.However,inJune2007,theU.S.CourtofAppealsfortheDistrictofColumbiaCircuitruledtovacateSubpartDDDDDinitsentirety,andthemandatewasissuedJuly30,2007.24 BoilerMACTwasmostrecentlyfinalizedonMarch21,2011,withaneffectivedateofMay20,2011.However,onMay18,2011,theeffectivedateoftheBoilerMACTwasstayedpendingreconsiderationofelementsoftheregulation.25OnDecember23,2011,U.S.EPAissuedanoticeofproposedrevisionstotheNHSMrule.26WestFraserwillreviewapplicabilityandrequirementsuponpromulgationofthefinalstandardfollowingreconsiderationandwillcomplywithanyrequirementsthatareapplicable.However,underthemostrecentversionoftheBoilerMACT,aprocessheaterisdefinedin40CFR63.7570,as
…anencloseddeviceusingcontrolledflame,thatisnotaboiler,andtheunit'sprimarypurposeistotransferheatindirectlytoaprocessmaterial(liquid,gas,orsolid)ortoaheattransfermaterialforuseinaprocessunit,insteadofgeneratingsteam.Processheatersaredevicesinwhichthecombustiongasesdonotdirectlycomeintocontactwithprocessmaterials.Processheatersdonotincludeunitsusedforcomfortheatorspaceheat,foodpreparationforon‐siteconsumption,orautoclaves.
Thecontinuouslumberkilnswillbedirect‐fired,asthecombustiongasesfromthefuelwilldirectlycontactthelumberduringthedryingprocess.Therefore,thenewlumberkilnsarenotconsideredprocessheaters,andBoilerMACTisnotapplicableasitiscurrentlyproposedandeffective.
4.2.3.4. Non-Applicability of All Other NESHAP
NESHAPstandardsaredevelopedforparticularindustrialsourcecategories,andtheapplicabilityofaparticularNESHAPtoafacilitycanbereadilyascertainedbasedontheindustrialsourcecovered.AllotherNESHAParecategoricallynotapplicabletotheproposedproject.
24NaturalResourcesDefenseCouncil,SierraClub,EnvironmentalIntegrityProjectv.U.S.EPA,U.S.CourtofAppealsfortheDistrictofColumbiaCircuit,No.04‐1385,decidedJune8,2007:http://pacer.cadc.uscourts.gov/docs/common/opinions/200706/04‐1385a.pdf25FederalRegisterVolume76,No.96,pages28662–28664,publishedonMay18,2011.26Refertohttp://www.epa.gov/ttn/atw/boiler/fr23de11major.pdffortheproposedrulepre‐publicationversion.

West Fraser, Inc. – Augusta Mill | Continuous Kiln Construction Permit Application Trinity Consultants 4-6
4.2.4. Compliance Assurance Monitoring Regulations
Under40CFR64,theComplianceAssuranceMonitoring(CAM)Regulations,facilitiesarerequiredtoprepareandsubmitmonitoringplansforcertainemissionunitswithaTitleVapplication.TheCAMPlansprovideanon‐goingandreasonableassuranceofcompliancewithemissionlimits.Underthegeneralapplicabilitycriteria,thisregulationonlyappliestoemissionunitsthatuseacontroldevicetoachievecompliancewithanemissionlimitandwhosepre‐controlledemissionlevelsexceedthemajorsourcethresholdsundertheTitleVpermittingprogram.Theproposedprojectdoesnotincludetheinstallationofanynewadd‐oncontroldevicesorthemodificationofexistingonesatthefacility;therefore,itwillnotresultinanyCAMrequirements.
4.3. STATE REGULATORY APPLICABILITY
Inadditiontofederalairregulations,GeorgiaRulesforAirQualityControl(GRAQC)Chapter391‐3‐1,updatedAugust9,2012,establishesregulationsapplicableattheemissionunitlevel(sourcespecific)andatthefacilitylevel.Therulesalsocontainrequirementsrelatedtotheneedforconstructionand/oroperatingpermits.
4.3.1. GRAQC 391-3-1-.02-(2)(b) – Visible Emissions
Thisregulationlimitsthevisibleemissionsfromallsourcesto40%opacity,providedthatthesourceisnotsubjecttosomeotheremissionlimitationunderGRAQC391‐3‐1‐.02(2).27Allequipmentassociatedwiththeproposedprojectaresubjecttothisrule.
4.3.2. GRAQC 391-3-1-.02(2)(c) – Incinerators
ThisregulationlimitsthePMandvisibleemissionsfromincinerators.PertheGRAQC,anincineratorisdefinedasfollows:
…alldevicesintendedorusedforthereductionordestructionofsolid,liquid,orgaseouswastebyburning.28
Althoughtheproposedlumberkilnswillburnwoodwaste,themainpurposeofthekilnsisnotthedestructionofsolidwaste.Therefore,Rule(c)willnotapplytotheproposedkilns.
4.3.3. GRAQC 391-3-1-.02(2)(d) – Fuel-Burning Equipment
ThisregulationlimitsPMemissionsfromallfuel‐burningequipment.ItalsolimitsopacityandNOXemissionsfromequipmentconstructedormodifiedafterJanuary1,1972.Georgiadefinesfuel‐burningequipmentas:
…equipmenttheprimarypurposeofwhichistheproductionofthermalenergyfromthecombustionoffuel.Suchequipmentisgenerallythatusedfor,butnotlimitedto,heatingwater,generatingorsuperheatingsteam,heatingairasinwarmairfurnaces,furnishingprocessheatindirectly,throughtransferbyfluidsortransmissionsthroughprocessvesselwalls.29
Althoughthelumberdryingkilnswillbefuel‐burningunits,theprimarypurposeoftheunitsisnottoproducethermalenergy.Therefore,thekilnsarenotsubjecttoRule(d). 27GRAQC391‐3‐1‐.02(2)(b)128GRAQC391‐3‐1‐.01(hh)29GRAQC391‐3‐1‐.01(cc)

West Fraser, Inc. – Augusta Mill | Continuous Kiln Construction Permit Application Trinity Consultants 4-7
4.3.4. GRAQC 391-3-1-.02(2)(e) – Particulate Emissions from Manufacturing Processes
Thisregulation,commonlyknownastheprocessweightrule(PWR)establishesPMlimitsforallsourcesifnotspecifiedelsewhere.ThePMemissionsarelimitedbasedonthefollowingequations(forequipmentconstructedormodifiedafterJuly2,1968): E=4.1×P0.67 forP≤30ton/hr E=55×P0.11–40 forP>30ton/hr where: E=allowablePMemissionrate[lb/hr] P=processinputweightrate[tons/hr]Thisruleappliestoallequipmentassociatedwiththeproposedproject.Theinputrateofwoodintothefacilityis924,000ton/yr,makingtheallowablePMemissionsfromthefacility209.22tpy.ThecalculatedpotentialPMemissionsare119.53tpy;therefore,thefacilitywillcontinuetobeincompliancewiththisruleafterthecompletionoftheproposedproject.
4.3.5. GRAQC 391-3-1-.02(2)(g) – Sulfur Dioxide
ThisregulationestablishesSO2emissionlimitsforfuel‐burningsources.NewfuelburningsourcesconstructedafterJanuary1,1972,capableoffiringfossilfuelatarateexceeding250MMBtu/hraresubjecttoSO2emissionlimitations.Thekilnswillexclusivelycombustwoodwaste,whichisnotafossilfuel.Theyare,therefore,notsubjecttotheemissionlimitationintherule.However,therulealsospecifiesthatallfuelburningsourceswithheatinputcapacitieslessthan100MMBtu/hrshallnotburnfuelcontainingmorethan2.5%sulfurbyweight.TheWestFraserkilnsaresubjecttothislimitationandshallcontinuetocomplywithitaftertheconversionofthekilns.
4.3.6. GRAQC 391-3-1-.02(2)(n) – Fugitive Dust
Thisregulationrequiresfacilitiestotakereasonableprecautionstopreventfugitivedustfrombecomingairborne.Allunitspartoftheproposedprojectwillbecoveredbythisgenerallyapplicablerule.WestFraserwilltaketheappropriateprecautionstopreventfugitivedustfrombecomingairborneandtoensurethatthepercentopacityislessthan20percent.
4.3.7. GRAQC 391-3-1-.02(2)(tt) – VOC Emissions from Major Sources
Rule(tt)limitsVOCemissionsfromfacilitiesthatarelocatedinorneartheoriginalAtlanta1‐hourozonenonattainmentarea.TheAugustaMillisnotlocatedwithinthegeographicareacoveredbythisruleandis,therefore,notsubjecttothisregulation.
4.3.8. GRAQC 391-3-1-.02(2)(uu) – Visibility Protection
Rule(uu)requiresGeorgiaEPDtoprovideananalysisofaproposedmajorsourceoramajormodificationtoanexistingsource’santicipatedimpactonvisibilityinanyfederalClassIareatotheappropriateFederallandManager(FLM).Thisprojectdoesnotqualifyasamajormodificationforvisibility‐impactingpollutants(NOX,TotalPM10,SO2,andH2SO4),andthereforenovisibilityimpactmodelingwillbeperformed.

West Fraser, Inc. – Augusta Mill | Continuous Kiln Construction Permit Application Trinity Consultants 4-8
4.3.9. GRAQC 391-3-1-.02(2)(lll) – NOX from Fuel-Burning Equipment
Rule(lll)limitsNOXemissionsfromfuel‐burningequipmentwithcapacitiesbetween10and250MMBtu/hrthatarelocatedinorneartheoriginalAtlanta1‐hourozonenonattainmentarea.TheAugustaMillisnotlocatedwithinthegeographicareacoveredbythisruleandis,therefore,notsubjecttothisregulation.
4.3.10. GRAQC 391-3-1-.03(1) – Construction (SIP) Permitting
Theproposedprojectwillrequirephysicalconstructionactivitiestoallowconstructionofthenewcontinuouslumberdryingkilnsandremovaloftheexistingbatchkilns.EmissionincreasesassociatedwiththeproposedprojectareabovethedeminimisconstructionpermittingthresholdsspecifiedinGRAQC391‐3‐1‐.03(6)(i).30Further,asdiscussedinSection4.1,PSDpermittingisrequiredforVOC.Therefore,aconstructionpermitapplicationisnecessaryandtheappropriateformsareincludedinAppendixC.
4.3.11. GRAQC 391-3-1-.03(10) – Title V Operating Permits
TheAugustaMillisamajorstationarysource,sincethepotentialemissionsofregulatedpollutantsexceedthethresholdsestablishedbyGeorgia’sTitleVOperatingPermitProgram.ThemilloperatesunderitsrenewalTitleVpermit,PermitNo.2421‐245‐0047‐V‐04‐0,effectiveJune13,2012.ModificationstotheexistingpermitconditionswillberequiredaspartoftheproposedprojectaswellastheadditionofnewconditionstoallowtheprojecttoavoidNSRpermittingforcertainpollutantsandtoestablishappropriateBACTlimitsforpollutantsundergoingNSRpermitting.Additionally,aspartofthismodification,WestFraserwouldalsoliketorequestthattheplanermillcycloneberemovedfromthecurrentpermit.Theplanermillcycloneisanon‐emissionsgeneratingunitbecauseallemissionsarerecycledbackwithintheprocessandnoemissionsfromtheunitarereleasedfromtheatmosphere.Therefore,theproposedprojectconstitutesaTitleVmajormodification,andWestFraserhasincludedtheTitleVoperatingpermitapplicationdatabaseinAppendixG.
4.3.12. Incorporation of Federal Regulations by Reference
ThefollowingfederalregulationsareincorporatedintheGRAQCbyreferenceandwereaddressedpreviouslyintheapplication:
GRAQC391‐3‐1‐.02(7)–PSD GRAQC391‐3‐1‐.02(8)–NSPS GRAQC391‐3‐1‐.02(9)–NESHAP GRAQC391‐3‐1‐.02(11)–CAM
4.3.13. Non-Applicability of Other GRAQC
AthoroughexaminationoftheGRAQCapplicabilitytotheAugustaMillrevealsmanyGRAQCthatdonotapplyanddonotimposeadditionalrequirementsonoperations.SuchGRAQCrulesincludethosespecifictoaparticulartypeofindustrialoperationwhichisnotperformedattheAugustaMill.
30BasedonGeorgiaEPDguidance,usageofthedeminimispermittingexemptionthresholdsmustconsideractual‐to‐potentialemissionsincreases,notactual‐to‐projectedactualemissionsincreases.

West Fraser, Inc. – Augusta Mill | Continuous Kiln Construction Permit Application Trinity Consultants 5-1
5. BEST AVAILABLE CONTROL TECHNOLOGY ASSESSMENT
ThissectiondiscussestheregulatorybasisforBACT,approachusedincompletingtheBACTanalyses,andtheBACTanalysesfornewandmodifiedequipmentemittingpollutantstriggeringPSDreview.SupportingdocumentationisincludedinAppendicesDandE.
5.1. BACT DEFINITION
TherequirementtoconductaBACTanalysisissetforthinthePSDregulations[40CFR52.21(j)(2)]:
(j)ControlTechnologyReview.
(2)AnewmajorstationarysourceshallapplybestavailablecontroltechnologyforeachregulatedNSRpollutantthatitwouldhavethepotentialtoemitinsignificantamounts.
BACTisdefinedinthePSDregulations[40CFR52.21(b)(12)]as:
...anemissionslimitation(includingavisibleemissionstandard)basedonthemaximumdegreeofreductionforeachpollutantsubjecttoregulationunderActwhichwouldbeemittedfromanyproposedmajorstationarysourceormajormodificationwhichtheAdministrator,onacase‐by‐casebasis,takingintoaccountenergy,environmental,andeconomicimpactsandothercosts,determinesisachievableforsuchsourceormodificationthroughapplicationofproductionprocessesoravailablemethods,systems,andtechniques,includingfuelcleaningortreatmentorinnovativefuelcombustiontechniquesforcontrolofsuchpollutant.Innoeventshallapplicationofbestavailablecontroltechnologyresultinemissionsofanypollutantwhichwouldexceedtheemissionsallowedbyanyapplicablestandardunder40CFRparts60and61.[primaryBACTdefinition]IftheAdministratordeterminesthattechnologicaloreconomiclimitationsontheapplicationofmeasurementmethodologytoaparticularemissionsunitwouldmaketheimpositionofanemissionsstandardinfeasible,adesign,equipment,workpractice,operationalstandard,orcombinationthereof,maybeprescribedinsteadtosatisfytherequirementfortheapplicationofbestavailablecontroltechnology.Suchstandardshall,tothedegreepossible,setforththeemissionsreductionachievablebyimplementationofsuchdesign,equipment,workpracticeoroperation,andshallprovideforcompliancebymeanswhichachieveequivalentresults.[allowanceforsecondaryBACTstandardundercertainconditions]
TheprimaryBACTdefinitioncanbebestunderstoodbybreakingitapartintoitsseparatecomponents.
5.1.1. Emission Limitation
anemissionslimitationFirstandforemost,BACTisanemissionlimit.WhileBACTisprefacedupontheapplicationoftechnologiestoachievethatlimit,thefinalresultofBACTisalimit.Ingeneral,thislimitwouldbeanemissionratelimitofapollutant(i.e.,lb/hr).31
31Emissionlimitscanbebroadlydifferentiatedas“rate‐based”or“mass‐based.”Forakiln,arate‐basedlimitwouldtypicallybeinunitsoflb/ton(massemissionspertonmaterialinput).Incontrast,atypicalmass‐basedlimitwouldbeinunitsoflb/hr(massemissionspertime).

West Fraser, Inc. – Augusta Mill | Continuous Kiln Construction Permit Application Trinity Consultants 5-2
5.1.2. Case-by-Case Basis
acase‐by‐casebasis,takingintoaccountenergy,environmentalandeconomicimpactsandothercostUnlikemanyoftheCleanAirActprograms,thePSDprogram’sBACTevaluationiscase‐by‐case.AsnotedbyU.S.EPA,
Thecase‐by‐caseanalysisisfarmorecomplexthanmerelypointingtoaloweremissionslimitorhighercontrolefficiencyelsewhereinapermitorapermitapplication.TheBACTdeterminationmusttakeintoaccountallofthefactorsaffectingthefacility,suchasthechoiceof[fuel]…TheBACTanalysis,therefore,involvesjudgmentandbalancing.32
Toassistapplicantsandregulatorswiththecase‐by‐caseprocess,in1987U.S.EPAissuedamemorandumthatimplementedcertainprograminitiativestoimprovetheeffectivenessofthePSDprogramwithintheconfinesofexistingregulationsandstateimplementationplans.33Amongtheinitiativeswasa“top‐down”approachfordeterminingBACT.Inbrief,thetop‐downprocesssuggeststhatallavailablecontroltechnologiesberankedindescendingorderofcontroleffectiveness.Themoststringentor“top”controloptionisthedefaultBACTemissionlimitunlesstheapplicantdemonstrates,andthepermittingauthorityinitsinformedopinionagrees,thatenergy,environmental,and/oreconomicimpactsjustifytheconclusionthatthemoststringentcontroloptionisnotachievableinthatcase.Uponeliminationofthemoststringentcontroloptionbaseduponenergy,environmental,and/oreconomicconsiderations,thenextmoststringentalternativeisevaluatedinthesamemanner.ThisprocesscontinuesuntilBACTisselected.Thefivestepsinatop‐downBACTevaluationcanbesummarizedasfollows:
Step1.Identifyallpossiblecontroltechnologies;Step2.Eliminatetechnicallyinfeasibleoptions;Step3.Rankthetechnicallyfeasiblecontroltechnologiesbaseduponemissionreductionpotential;Step4.Evaluaterankedcontrolsbasedonenergy,environmental,and/oreconomicconsiderations;andStep5.SelectBACT.
Whilethetop‐downBACTanalysisisaproceduralapproachsuggestedbyU.S.EPApolicy,thisapproachisnotspecificallymandatedasastatutoryrequirementoftheBACTdetermination.34AsdiscussedinSection5.1.1,theBACTlimitisanemissionslimitationanddoesnotrequiretheinstallationofanyspecificcontroldevice.
5.1.3. Achievable
“basedonthemaximumdegreeofreduction…[thatDHEC]…determinesisachievable…throughapplicationofproductionprocessesoravailablemethods,systemsandtechniques,includingfuelcleaningortreatmentorinnovativefuelcombustiontechniques”
BACTistobesetatthelowestvaluethatisachievable.However,thereisanimportantdistinctionbetweenemissionratesachievedataspecifictimeonaspecificunit,andanemissionlimitationthataunitmustbeabletomeetcontinuouslyoveritsoperatinglife.
32U.S.EPAResponsestoPublicCommentsontheProposedPSDPermitfortheDesertRockEnergyFacility,July31,2008,p.41‐42.33MemodatedDecember1,1987,fromJ.CraigPotter(EPAHeadquarters)toEPARegionalAdministrators,titled“ImprovingNewSourceReviewImplementation.”34InNovember2010,theU.S.EPAissuedaguidancedocumentforthepermittingofGHGthatrecommendsthatpermittingauthoritiesusethesametop‐downBACTprocesstodetermineBACTforGHG.ArevisedguidancedocumentwasissuedinMarch2011.U.S.EPAOfficeofAirandRadiation,OfficeofAirQualityPlanningandStandards,PSDandTitleVPermittingGuidanceforGreenhouseGases,March2011,page17,http://www.epa.gov/air/nsr/ghgdocs/ghgpermittingguidance.pdf.

West Fraser, Inc. – Augusta Mill | Continuous Kiln Construction Permit Application Trinity Consultants 5-3
AsdiscussedbytheD.C.CircuitCourtofAppeals,
InNationalLimeAss'nv.EPA,627F.2d416,431n.46(D.C.Cir.1980),wesaidthatwhereastatuterequiresthatastandardbe“achievable,”itmustbeachievable“undermostadversecircumstanceswhichcanreasonablybeexpectedtorecur.”35
U.S.EPAhasreachedsimilarconclusionsinpriordeterminationsforPSDpermits.
Agencyguidanceandourpriordecisionsrecognizeadistinctionbetween,ontheonehand,measured‘emissionsrates,’whicharenecessarilydataobtainedfromaparticularfacilityataspecifictime,andontheotherhand,the‘emissionslimitation’determinedtobeBACTandsetforthinthepermit,whichthefacilityisrequiredtocontinuouslymeetthroughoutthefacility’slife.Statedsimply,ifthereisuncontrollablefluctuationorvariabilityinthemeasuredemissionrate,thenthelowestmeasuredemissionratewillnecessarilybemorestringentthanthe“emissionslimitation”thatis“achievable”forthatpollutioncontrolmethodoverthelifeofthefacility.Accordingly,becausethe“emissionslimitation”isapplicableforthefacility’slife,itiswhollyappropriateforthepermitissuertoconsider,aspartoftheBACTanalysis,theextenttowhichtheavailabledatademonstratewhethertheemissionsrateatissuehasbeenachievedbyotherfacilitiesoveralongterm.36
Thus,BACTmustbesetatthelowestfeasibleemissionraterecognizingthattheemissionunitmustbeincompliancewiththatlimitforthelifetimeoftheunitonacontinuousbasis.Thus,whileviewingindividualunitperformancecanbeinstructiveinevaluatingwhatBACTmightbe,anyactualperformancedatamustbeviewedcarefully,asrarelywillthedatabeadequatetotrulyassesstheperformancethataunitwillachieveduringitsentireoperatinglife.Whilestatisticalvariabilityofactualperformancecanbeusedtoinferwhatis“achievable,”suchtestingrequiresadetailedtestplanakintowhatteamsinU.S.EPAusetodevelopMACTstandardsoveraseveralyearperiod,andisfarbeyondwhatisreasonabletoexpectofanindividualsource.Incontrasttolimitedsnapshotsofactualperformancedata,emissionlimitsfromsimilarsourcescanreasonablybeusedtoinferwhatis“achievable”foragivenunit.37ToassistinmeetingtheBACTlimit,thesourcemustconsiderproductionprocessesoravailablemethods,systemsortechniques,aslongasthoseconsiderationsdonotredefinethesource.
5.1.4. Floor
Emissions[shallnot]exceed…40CFRParts60and61
TheleaststringentemissionrateallowableforBACTisanyapplicablelimitundereitherNewSourcePerformanceStandards(NSPS–Part60)orNationalEmissionStandardsforHazardousAirPollutants(NESHAP–Parts61and63).StateSIPlimitationsmustalsobeconsideredwhendeterminingtheemissionsfloor.
35AsquotedinSierraClubv.EPA(97‐1686).36U.S.EPAEnvironmentalAppealsBoarddecision,Inre:NewmontNevadaEnergyInvestmentL.L.C.PSDAppealNo.05‐04,decidedDecember21,2005.EnvironmentalAdministrativeDecisions,Volume12,Page442.37Emissionlimitsmustbeusedwithcareinassessingwhatis“achievable.”Limitsestablishedforfacilitieswhichwereneverbuiltmustbeviewedwithcare,astheyhaveneverbeendemonstratedandthatcompanynevertookasignificantliabilityinhavingtomeetthatlimit.Likewise,permittedunitswhichhavenotyetcommencedconstructionmustalsobeviewedwithspecialcareforsimilarreasons.

West Fraser, Inc. – Augusta Mill | Continuous Kiln Construction Permit Application Trinity Consultants 5-4
5.2. BACT REQUIREMENT
TheBACTrequirementappliestoeachnewormodifiedemissionunitfromwhichthereareemissionsincreasesofpollutantssubjecttoPSDreview.TheproposedprojectissubjecttoPSDpermittingforVOC,andthus,subjecttoBACTforthispollutant.38TheproposedcontinuouskilnsaresubjecttoBACTforeachpollutantrequiringPSDpermitting.Therewillbenoothernewormodifiedemissionsourcesatthefacility.
5.3. BACT ASSESSMENT METHODOLOGY
ThefollowingsectionsprovidedetailsontheassessmentmethodologyutilizedinpreparingtheBACTanalysesfortheproposedfacility.Aspreviouslynoted,theminimumcontrolefficiencytobeconsideredinaBACTassessmentmustresultinanemissionratelessthanorequaltoanyapplicableNSPSorNESHAPemissionrateforthesource.ThekilnsundergoingBACTarenotsubjecttoanyNSPSorNESHAPemissionlimitsforVOC.WhileaNESHAPexiststhatregulatesHAPemissionsfromPCWPsources,lumberkilnsarenotsubjecttoanynumericalHAPlimitationsorworkpracticestandardsthatcouldbeconsideredBACTforVOC.39
5.3.1. Identification of Potential Control Technologies
PotentiallyapplicableemissioncontroltechnologieswereidentifiedforthecontinuouslumberkilnsbyresearchingtheU.S.EPAcontroltechnologydatabase,technicalliterature,controlequipmentvendorinformation,statepermittingauthorityfiles,andbyusingprocessknowledgeandengineeringexperience.TheReasonablyAvailableControlTechnology(RACT)/BACT/LowestAchievableEmissionRate(LAER)Clearinghouse(RBLC),adatabasemadeavailabletothepublicthroughtheU.S.EPA’sOfficeofAirQualityPlanningandStandards(OAQPS)TechnologyTransferNetwork(TTN),liststechnologiesandcorrespondingemissionlimitsthathavebeenapprovedbyregulatoryagenciesinpermitactions.Thesetechnologiesaregroupedintocategoriesbyindustryandcanbereferencedindeterminingwhatemissionslevelswereproposedforsimilartypesofemissionunits. WestFraserperformedsearchesoftheRBLCdatabaseinNovember2012toidentifytheemissioncontroltechnologiesandemissionlimitsthatwereimposedbypermittingauthoritiesasBACTwithinthepasttenyearsforemissionsourcescomparabletotheproposedfacility.Thefollowingcategorywassearched:
WoodLumberKilns(RBLCCode30.800)Furthermore,theRBLCsearchresultsweresupplementedwithBACTdeterminationsfromseveralrecentlyissuedairpermits,andareincludedinAppendixE.Asnotedpreviously,nootherunitsaresubjecttoBACTreview.Therefore,noadditionalRBLCsearchesorothertechnicalreviewswereperformed.
5.3.2. Economic Feasibility Calculation Process
Economicanalysesareperformedtocomparetotalcosts(capitalandannual)pertonofpollutantremovedforvariouspotentialcontroltechnologiesthathavebeendeemedtechnicallyfeasible.Capitalcostsincludetheinitialcostofthecomponentsintrinsictothecompletecontrolsystem.Annualoperatingcostsincludethefinancialrequirementstooperatethecontrolsystemonanannualbasisincludingoverhead,maintenance,outages,rawmaterials,andutilities.
38Aspreviouslymentioned,thisapplicationusesthetwoterms“VOC”and“TotalVOC”interchangeably.Inallinstances,thebasis,forthepurposeofthisPSDapplicationandBACTAnalysis,isasterpenes(accountingformethanolandformaldehydeasappropriate).3940CFR63.223.

West Fraser, Inc. – Augusta Mill | Continuous Kiln Construction Permit Application Trinity Consultants 5-5
Thecapitalcostestimatingtechniqueusedisbasedonafactoredmethodofdeterminingdirectandindirectinstallationcosts.Thatis,installationcostsareexpressedasafunctionofknownequipmentcosts.ThismethodisconsistentwiththelatestU.S.EPAOAQPSguidancemanualonestimatingcontroltechnologycosts.40TotalPurchasedEquipmentCostrepresentsthedeliveredcostofthecontrolequipment,auxiliaryequipment,andinstrumentation.Auxiliaryequipmentconsistsofallthestructural,mechanical,andelectricalcomponentsrequiredfortheefficientoperationofthedevice.Auxiliaryequipmentcostsareestimatedasastraightpercentageoftheequipmentcost.Directinstallationcostsconsistofthedirectexpendituresformaterialsandlaborforsitepreparation,foundations,structuralsteel,erection,piping,electrical,paintingandfacilities.Indirectinstallationcostsincludeengineeringandsupervisionofcontractors,constructionandfieldexpenses,constructionfees,andcontingencies.Otherindirectcostsincludeequipmentstartup,performancetesting,workingcapital,andinterestduringconstruction.Annualcostsarecomprisedofdirectandindirectoperatingcosts.Directannualcostsincludelabor,maintenance,replacementparts,rawmaterials,utilities,andwastedisposal.Indirectoperatingcostsincludeplantoverhead,taxes,insurance,generaladministration,andcapitalcharges.Replacementpartcostswereincludedwhereapplicable,whilerawmaterialcostswereestimatedbasedupontheunitcostandannualconsumption.Withtheexceptionofoverhead,indirectoperatingcostswerecalculatedasapercentageofthetotalcapitalcosts.Theindirectcapitalcostswerebasedonthecapitalrecoveryfactor(CRF)definedas:
1
1 1
whereiistheannualinterestrateandnistheequipmentlifeinyears.Theequipmentlifeisbasedonthenormallifeofthecontrolequipmentandvariesonanequipmenttypebasis.Thesameinterestappliestoallcontrolequipmentcostcalculations.Forthisanalysis,aninterestrateof7%wasusedbasedoninformationprovidedinthemostrecentOAQPSControlCostManual.41NotethatalleconomiccalculationsarebasedonOctober2012dollars.DetailedcostcalculationsforeconomicanalysesprovidedwithinthisBACTanalysisarepresentedinAppendixD.
5.4. LUMBER DRYING KILNS – VOC BACT
5.4.1. Identification of Potential Control Techniques (Step 1)
CandidatecontroloptionsidentifiedfromtheRBLCsearchandtheliteraturereviewincludethoseclassifiedaspollutionreductiontechniques.VOCreductionoptionsinclude:
Adsorption Biofiltration Condensation ThermalOxidation WetScrubbing
40U.S.EPA,OAQPSControlCostManual,6thedition,EPA452/B‐02‐001,July2002.http://www.epa.gov/ttn/catc/dir1/c_allchs.pdf41U.S.EPA,OAQPSControlCostManual,6thedition,Section2,Chapter1,page1‐52.http://www.epa.gov/ttn/catc/dir1/c_allchs.pdf

West Fraser, Inc. – Augusta Mill | Continuous Kiln Construction Permit Application Trinity Consultants 5-6
ProperMaintenanceandOperatingPracticesThesecontroltechnologiesarebrieflydescribedinthefollowingsections.
5.4.1.1. Adsorption
Regenerativeadsorptionsystemsaretypicallyabatchoperationinvolvingtwoormorefixedadsorptionbeds.Oneormoreofthebedsoperatesinadsorptionmodewhiletheothersoperateinregenerationmode.Severaladsorbentmaterialswithsubstantialsurfaceareaperunitvolumecanbeusedinadsorbersincludingactivatedcarbon,organicresinpolymers,andinorganicmaterialssuchaszeolite.AninduceddraftfanistypicallyusedtoforcetheVOC‐ladengasthroughtheadsorptionbedwheretheVOCmoleculesarephysicallyboundtotheporespaceintheadsorbentbyVanderWaalsnuclearattractionforces.Therearemanytypesofcarbon,polymer,andzeoliteadsorbentsavailablewithdifferentaffinitiesforadsorbingvariousVOC.AkeyselectioncriterionfordeterminingtheappropriateadsorbentistherangeofporesizesrelativetothelargestmolecularsizeoftheVOCtobeadsorbed.ThebatchnatureoftheadsorptionprocessconcludeswhentheadsorbentbedbecomessaturatedwithVOCandmustberegenerated.Thegas‐solidinterfacewithinthebedatwhichadsorptionisoccurringisreferredtoasthemasstransferzone(MTZ),andthelocationofthisMTZwithinthebeddeterminesitslevelofbedsaturationandthetimeatwhichitmustberegenerated.WhentheMTZnearstheendofthebed,theVOCconcentrationoftheexhaustgaswillincreaseproducingaphenomenonreferredtoas“breakthrough.”Afterbreakthroughhasoccurredinanadsorbentbed,itmustberegeneratedusingathermalswingorvacuumprocess.ThermalswingregenerationusessteamtoraisethetemperatureoftheloadedadsorbentbedtotheboilingpointoftheVOCatwhichpointtheVOCisdesorbedandisdischargedfromthebedwiththesteam.TheVOC‐ladensteamisthenroutedtoacondensertoproducealiquidwater‐VOCmixture.TheVOCisthenseparatedfromthewaterusingadecantationordistillationprocessandcanberecycledbacktotheprocessfromwhichitwasgeneratedorroutedtoanappropriatedisposalsite.VacuumregenerationlowersthepressureoftheadsorbentbedbelowthevaporpressureoftheadsorbedVOCattheambienttemperatureofthebed.Atthisreducedpressure,theVOCboilsoffoftheadsorbentandcanbecollectedinacondenserorroutedtoanoxidizer.Essentially,adsorberscaptureVOCfromrelativelydiluteconcentrationstreamsandreleasetheseVOCintoahigherconcentrationstreamthatcanbereadilycontrolledusinganotherVOCdestructionorrecoverytechnology.Oncetheregenerationcycleiscomplete,thefreshadsorbentbedisreadytobegincapturingadditionalVOCinanotheradsorptioncycle.42ThetypicalVOCinletconcentrationrequiredforeffectiveadsorptionfallsintherangeof400to2,000ppmv,andadsorbersandtheirassociatedfollow‐upcontroldevices(i.e.,condenserordecanter)aretypicallycapableofachievingVOCcontrolefficienciesgreaterthan95percent.43
5.4.1.2. Biofiltration
Inbiofiltration,off‐gasescontainingbiodegradableorganiccompoundsarevented,undercontrolledtemperatureandhumidity,throughabiologicallyactivematerial.Theprocessusesabiofilmcontainingapopulationofmicroorganismsimmobilizedonaporoussubstratesuchaspeat,soil,sand,wood,compost,ornumeroussyntheticmedia.Asanairstreampassesthroughthebiofilter,thecontaminantsintheairstream
42U.S.EPA,CleanAirTechnologyCenter,TechnicalBulletinChoosinganAdsorptionSystemforVOC:Carbon,Zeolite,orPolymer?,EPA456/F‐99‐004,May1999.43Ibid.

West Fraser, Inc. – Augusta Mill | Continuous Kiln Construction Permit Application Trinity Consultants 5-7
partitionfromthegaseousphasetotheliquidphaseofthebiofilm.Oncecontaminantspassintotheliquidphase,theybecomeavailableforthecomplexoxidativeprocessbythemicroorganismsinhabitingthebiofilm.
5.4.1.3. Condensation
CondensersoperatebyloweringthetemperatureoftheexhaustgasstreamscontainingcondensableVOCtoatemperatureatwhichthetargetVOC’svaporpressureislowerthanitsenteringpartialpressure.Thisconditioniscommonlyreferredtoasthesaturationpoint.BeforetheVOCcancondense,anysensibleheatpresentintheexhaustgasabovethesaturationpointmustberemoved.CoolingtheexhauststreamtoatemperaturebelowthesaturationpointremovesthelatentheatfromtheexhaustandallowstheVOCtocondenseonthesurfaceofthecondensertubesforcollectionandrecycletotheprocessordisposaltoanappropriatelocation.Thetubeslocatedwithinthecondensercontainre‐circulatingcoolingliquidthatprovidesaheatsinkforrejectingbothsensibleandlatentheatfromthehotexhaustgasstream.Availablecoolingfluids(dependingonthenecessaryoutlettemperatureoftheexhauststreamtoachievehighlevelsofrecoveryforthecondensableVOC)includechilledwater,brine,orrefrigerants.Oncethecoolingliquidispassedthroughthecondenser,itischilledtotherequiredcondenserinlettemperatureandrecycledbacktothecoolingliquidinletofthecondenser.44 TheVOCefficiencyachievedbyacondenser,asasoleadd‐oncontroldevice,isafunctionof:1)theheatcapacityandtemperatureoftheinletexhauststream,2)theheattransfercharacteristicsofthecondenser(includingtheheattransferareaandtheheattransfercoefficient),and3)theoutlettemperatureoftheexhaustgasexitingthecondenser.CondensersaremosteffectiveinsinglecomponentsystemsinvolvingemissionstreamswithahighpercentageofacondensableVOC,becauselessheatmustberemovedfromtheexhaustgastoreducethesensibleheatofnon‐condensablegasesandtherequiredcondensertemperaturetoachievehighlevelsofrecovery.UnlikeotherVOCcontroldevicesforwhichquantifyingcontrolefficiencycanrequireemissionstesting,onlytheoutletexhaustgastemperatureisrequiredtoestimatetheVOCcontrolefficiencyofacondenserifthetemperature,VOCconcentration,andflowrateofthenon‐condensablesintheinletexhauststreamareallknown.SincethecontrolefficiencyofacondenserisdynamicbasedontheoutlettemperatureandinletconcentrationofVOCintheexhauststream,condensersexhibitawiderangeofVOCcontrolefficiencyfromaslowas50percenttoashighas99percent.45,46
5.4.1.4. Thermal Oxidation
AthermaloxidizersuppliessufficientcombustionairandsupplementalfuelatasuitabletemperaturetoallowforoxidationofVOCandothercombustiblecompoundspresentintheexhauststreamwithinthecombustionchamber.Oxidizersarecategorizedbyeitherathermalorcatalyticdesignandcanbefurthersubdividedintounitswithandwithoutexhaustgasheatrecovery.Straightthermaloxidizerswithoutheatrecoveryarereservedforapplicationswheretheheatingvalueoftheexhauststreamsroutedtotheoxidizerishighenoughthatlargeamountsofsupplementalfuelcombustionorhighlevelsofheatrecoveryarenotnecessarytobringtheexhaustgasestooxidationreactiontemperatures.InordertoprovideVOCcontrolinapracticalandefficientmanner,straightthermaloxidizersrequireaVOCinletconcentrationofgreaterthan1,500ppmv,becauseatthisconcentration,theheatofcombustionproducedfromoxidizingVOCpresentintheexhaustgasissufficienttosustainadequateoperatingtemperatureswithouttheadditionoflargequantitiesofexpensiveauxiliaryfuel.47
44U.S.EPA,OfficeofAirQualityPlanningandStandards,ControlofVolatileOrganiccompoundEmissionsfromBatchProcesses–AlternativeControlTechniqueInformationDocument,EPA‐450/R‐94‐020,February1994.45Ibid.46U.S.EPA,CleanAirTechnologyCenter,TechnicalBulletinRefrigeratedCondensersforControlofOrganicAirEmissions,EPA456/R‐01‐004,December2001.47U.S.EPA,AirPollutionControlTechnologyFactSheet–RecuperativeIncinerator.EPA‐452/F‐03‐020.

West Fraser, Inc. – Augusta Mill | Continuous Kiln Construction Permit Application Trinity Consultants 5-8
Oxidizerswithheatrecoveryareeitherconsideredrecuperativeorregenerativedependingonthedesignoftheincomingprocessgastoexhaustgasheatexchangesystem.Recuperativeoxidizers(labeledhereinasaTO)useplate‐to‐plateorshell‐and‐tubegasheatexchangerstorecoverupto70percentofthesensibleheatpresentinthehotexhausttotransferittotheincomingprocessgas.U.S.EPAexpectsthataTOcanachieveadestruction/removalefficiency(DRE)ofgreaterthan98percentdependingonthesystemrequirementsoftheaircontaminantstream.48Aregenerativethermaloxidizer(RTO)usesahigh‐densitypackedheattransfermedia,typicallyceramicrandomsaddlepackingorhoneycombmonolithstructures,topreheatincomingwastegasstreamsandtoachieve85to95percentheatrecovery.TheRTOconsistsofatleasttwomodulesthatarecycledbetweeninletandoutletservicetomaintainappropriateoperatingtemperaturesandtoconserveasmuchthermalenergyaspossible.ThehighlevelofheatintegrationofferedbyRTOsisparticularlysuitedforhighflowrateandlowVOCconcentrationwastegasstreamsthatdonotvaryincompositionorflowrateovertime.Whennecessary,thefeedgasstreaminanRTOcanalsobefurtherheatedtotheoxidizer’soperatingtemperatures(1,400to2,000°F)throughsupplementalfuelcombustion.RTOshavebeenusedeffectivelyinapplicationswheretheinletVOCconcentrationisaslowas100ppmv,and,therefore,theyarethepreferredoxidizerdesignforlowVOCconcentrationexhauststreams.49U.S.EPAexpectsthatanRTOcanachieveadestruction/removalefficiencyofgreaterthan95percentdependingonthesystem’srequirementsandthecharacteristicsofthecontaminatedstream.50Thermaloxidationsystemsdesignedtopassthegasstreamoveracatalystbed(usuallyanoblemetalsuchaspalladiumorplatinum),wherecombustiblecompoundscanbeoxidizedatafasterrateandatalowertemperaturethanispossiblewithaTOorRTO,arecalledcatalyticoxidationsystems(CatOx).Theprocessrequirestemperaturesof600to1,000°FtoachievehighdestructionefficienciesforVOC.51Belowthisrange,thereactionratedropssharplyandeffectiveoxidationofVOCisnolongerfeasible.
5.4.1.5. Wet Scrubbing
Wetscrubbingofgasorvaporpollutantsinagasstream,liketheexhaustthatwillexitthecontinuouskilns,isapotentialmethodforreducingVOCemissions.Wetscrubbingistypicallyconductedusingapackedcolumnwherepollutantsareabsorbedbyacounter‐currentflowofscrubbingliquid.WetscrubbingalsorequiresthattheVOCsthatareintheexhaustgasstreamarehighlysolubleinwater.
5.4.1.6. Proper Maintenance and Operating Practices
VOCemissionscanbereducedthroughpropermaintenanceandoperatingpracticesoftheproposedlumberdryingkilns.Themanufacturer’srecommendationsshouldbeusedwhendeterminingtheappropriateoperatingspecificationsanddevelopingascheduleforroutinemaintenanceofthekilns.
5.4.2. Elimination of Technically Infeasible Control Options (Step 2)
Aftertheidentificationofcontroloptions,thesecondstepintheBACTassessmentistoeliminateanytechnicallyinfeasibleoptions.Acontroloptioniseliminatedfromconsiderationifthereareprocess‐specificconditionsthatwouldprohibittheimplementationofthecontrolorifthehighestcontrolefficiencyoftheoptionwouldresultinanemissionlevelthatishigherthananyapplicableregulatorylimits.ThefollowingsectionsevaluatethefeasibilityoftheabovementionedcontroltechnologiesforreducingVOCemissionsfromtheproposed
48U.S.EPA,AirPollutionControlTechnologyFactSheet–RecuperativeIncinerator.EPA‐452/F‐03‐020.49U.S.EPA,AirPollutionControlTechnologyFactSheet–RegenerativeIncinerator.EPA‐452/F‐03‐021.50Ibid.51U.S.EPA,AirPollutionControlTechnologyFactSheet–CatalyticIncinerator.EPA‐452/F‐03‐018.
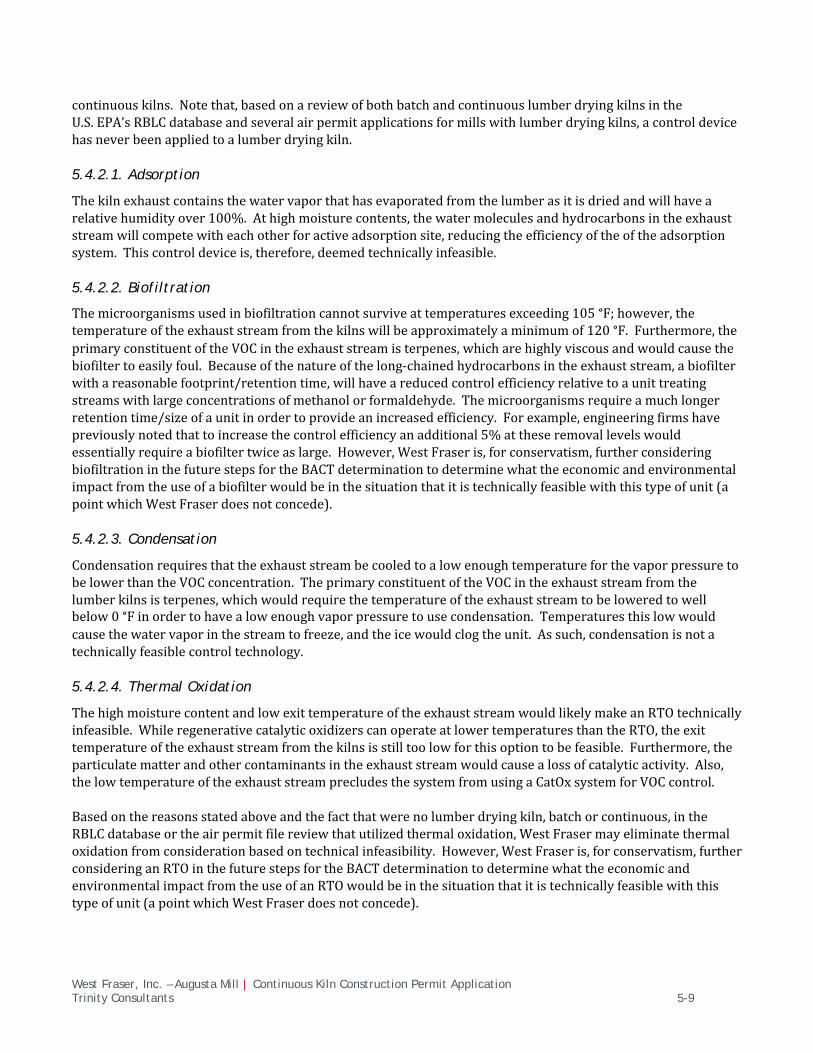
West Fraser, Inc. – Augusta Mill | Continuous Kiln Construction Permit Application Trinity Consultants 5-9
continuouskilns.Notethat,basedonareviewofbothbatchandcontinuouslumberdryingkilnsintheU.S.EPA’sRBLCdatabaseandseveralairpermitapplicationsformillswithlumberdryingkilns,acontroldevicehasneverbeenappliedtoalumberdryingkiln.
5.4.2.1. Adsorption
Thekilnexhaustcontainsthewatervaporthathasevaporatedfromthelumberasitisdriedandwillhavearelativehumidityover100%.Athighmoisturecontents,thewatermoleculesandhydrocarbonsintheexhauststreamwillcompetewitheachotherforactiveadsorptionsite,reducingtheefficiencyoftheoftheadsorptionsystem.Thiscontroldeviceis,therefore,deemedtechnicallyinfeasible.
5.4.2.2. Biofiltration
Themicroorganismsusedinbiofiltrationcannotsurviveattemperaturesexceeding105°F;however,thetemperatureoftheexhauststreamfromthekilnswillbeapproximatelyaminimumof120°F.Furthermore,theprimaryconstituentoftheVOCintheexhauststreamisterpenes,whicharehighlyviscousandwouldcausethebiofiltertoeasilyfoul.Becauseofthenatureofthelong‐chainedhydrocarbonsintheexhauststream,abiofilterwithareasonablefootprint/retentiontime,willhaveareducedcontrolefficiencyrelativetoaunittreatingstreamswithlargeconcentrationsofmethanolorformaldehyde.Themicroorganismsrequireamuchlongerretentiontime/sizeofaunitinordertoprovideanincreasedefficiency.Forexample,engineeringfirmshavepreviouslynotedthattoincreasethecontrolefficiencyanadditional5%attheseremovallevelswouldessentiallyrequireabiofiltertwiceaslarge.However,WestFraseris,forconservatism,furtherconsideringbiofiltrationinthefuturestepsfortheBACTdeterminationtodeterminewhattheeconomicandenvironmentalimpactfromtheuseofabiofilterwouldbeinthesituationthatitistechnicallyfeasiblewiththistypeofunit(apointwhichWestFraserdoesnotconcede).
5.4.2.3. Condensation
CondensationrequiresthattheexhauststreambecooledtoalowenoughtemperatureforthevaporpressuretobelowerthantheVOCconcentration.TheprimaryconstituentoftheVOCintheexhauststreamfromthelumberkilnsisterpenes,whichwouldrequirethetemperatureoftheexhauststreamtobeloweredtowellbelow0°Finordertohavealowenoughvaporpressuretousecondensation.Temperaturesthislowwouldcausethewatervaporinthestreamtofreeze,andtheicewouldclogtheunit.Assuch,condensationisnotatechnicallyfeasiblecontroltechnology.
5.4.2.4. Thermal Oxidation
ThehighmoisturecontentandlowexittemperatureoftheexhauststreamwouldlikelymakeanRTOtechnicallyinfeasible.WhileregenerativecatalyticoxidizerscanoperateatlowertemperaturesthantheRTO,theexittemperatureoftheexhauststreamfromthekilnsisstilltoolowforthisoptiontobefeasible.Furthermore,theparticulatematterandothercontaminantsintheexhauststreamwouldcausealossofcatalyticactivity.Also,thelowtemperatureoftheexhauststreamprecludesthesystemfromusingaCatOxsystemforVOCcontrol.Basedonthereasonsstatedaboveandthefactthatwerenolumberdryingkiln,batchorcontinuous,intheRBLCdatabaseortheairpermitfilereviewthatutilizedthermaloxidation,WestFrasermayeliminatethermaloxidationfromconsiderationbasedontechnicalinfeasibility.However,WestFraseris,forconservatism,furtherconsideringanRTOinthefuturestepsfortheBACTdeterminationtodeterminewhattheeconomicandenvironmentalimpactfromtheuseofanRTOwouldbeinthesituationthatitistechnicallyfeasiblewiththistypeofunit(apointwhichWestFraserdoesnotconcede).

West Fraser, Inc. – Augusta Mill | Continuous Kiln Construction Permit Application Trinity Consultants 5-10
5.4.2.5. Wet Scrubbing
WhilesomeVOCsthatwillbepresentintheexhauststreamarehighlysolubleinwater,otherVOCs,mostnotablyα‐pinene,areonlyveryslightlysolubleinwaterduetothelowerHenry’sLawconstantasdescribedinPerry’sChemicalEngineer’sHandbook.LowerHenry’sLawconstantVOCswouldrequiremuchlongerresidencetimewithinascrubberpackedcolumnandwouldeliminatethisasatechnicallyviablesolutionfortheconstantstreamthatwouldneedtobehandledbyacontinuouskiln.
5.4.2.6. Proper Maintenance and Operating Practices
PropermaintenanceandoperatingpracticesofthekilnsisatechnicallyfeasibleoptionforminimizingtheVOCemissionsfromthekilnsandwillbeconsideredfurtherinthefuturestepsforBACTdetermination.
5.4.3. Rank of Remaining Control Technologies (Step 3)
Thethirdofthefivestepsinthetop‐downBACTassessmentprocedureistoranktechnicallyfeasiblecontroltechnologiesbycontroleffectiveness.TheremainingcontroltechnologiesarepresentedinTable5‐1.AsdiscussedinStep2,WestFraserdoesnotconcedethattheuseofanRTOorbiofiltrationonalumberdryingkilnistechnicallyfeasible;however,thesecontroloptionsarebeingevaluatedinthisandthefuturestepsoftheBACTdeterminationforconservatism.
Table5‐1.RemainingVOCControlTechnologies
5.4.4. Evaluation of Most Stringent Controls (Step 4)
Thefourthofthefivestepsinthetop‐downBACTassessmentprocedureistoevaluatethemosteffectivecontrolanddocumenttheresults.Thishasbeenperformedfortheremainingcontroltechnologiesonthebasisofeconomic,energy,andenvironmentalconsiderations,andisdescribedherein.
5.4.4.1. Regenerative Thermal Oxidation
EveniftheuseofanRTOwastechnicallyfeasibleonalumberdryingkiln,thecostofusinganRTOexceedsthebenefitoftheVOCreductionitoffers.ThecurrentcostofcontrollingVOCwithanRTOisestimatedatapproximately$23,179pertonofVOCremoved.ThishighcostforVOCcontrolislargelyduetothehighmoisturecontentofthekilnexhauststreamandlowexhausttemperature,asheatingwatervaporintheexhauststreamtoRTOoperatingtemperaturessignificantlyincreasesthenaturalgasheatingrequirement.Therewouldalsobeassociatedenergyandenvironmentalimpactsresultantfromuseofthenaturalgas,includingadditionalpollutantemissionssuchasNOXfromnaturalgasfromcombustion.
Rank ControlTechnologyPotentialControlEfficiency(%)
1 RTO 98%2 Biofiltration1 65%3 ProperMaintenanceandOperatingPractices BaseCase
1.BiofiltrationcontrolefficiencybasedonNorthCarolinaDepartmentofEnvironmentandNaturalResourcesAirPermitReviewforWeyerhauser'sPlymouthfacilitycontinuouskilnconstructionapplication,whichreferencedanestimated60‐70%VOCcontrolefficiencyfrombiofilitration,basedonaconversationwithDavidWordofNCASI.

West Fraser, Inc. – Augusta Mill | Continuous Kiln Construction Permit Application Trinity Consultants 5-11
WestFraserhasdeterminedthatanRTOisnotBACTforthekilnsbasedonthetechnicalfeasibility,environmental,energy,andeconomicanalyses.DetailedcostcalculationscanbefoundinAppendixD.
5.4.4.2. Biofiltration
Eveniftheuseofbiofiltrationwastechnicallyfeasibleonalumberdryingkiln,thecostofbiofiltrationexceedsthebenefitoftheVOCreductionitoffers.ThecostofcontrollingVOCwithbiofiltrationisestimatedatapproximately$22,889pertonofVOCremoved.Despitetheconservativeassumptionthatbiofiltrationistechnicallyfeasible,itisnotcosteffective,andthereforeisnotBACTforthekilns.
5.4.4.3. Proper Maintenance and Operating Practices
Theonlyremainingtechnologyispropermaintenanceandoperatingpracticesofthekilns,alogicaloptionsinceaproperlymaintainedandoperatedkilncaneffectivelyminimizeVOCformation.ThiscontroloptionisconsideredBACTforVOCforthecontinuouskilns.
5.4.5. Selection of BACT (Step 5)
Basedonsteps1through4oftheBACTanalysis,WestFraserhasdeterminedthatpropermaintenanceandgoodoperatingpracticesaretheonlycontrolstechnicallyandeconomicallyfeasiblefortheproposedcontinuouslumberdryingkilns.Allotherpotentialcontroltechnologieswereeliminatedinearlierstepsoftheprocess.Therefore,WestFraserproposestheemissionrateof3.76lbTotalVOC(asterpene+methanol+formaldehyde)/MBFasBACT,calculatedfromtheequationdescribedinSection3.2.1andreproducedbelow.
1.133 1 0.65
ThebasisfortheVOCfactorisadjustedperEPAprotocolfromthetraditionalVOCascarbontoatotalmassVOCbasis.InordertocomplywithBACT,WestFraserwilldevelopanoperatingandmaintenanceplanforthenewcontinuouskilns.AppendixEcontainstheRBLCsearchresultswithlistedemissionfactorsinlbVOCperMBF.Ofthefactorslisted,thereislimiteddataandreferencesavailableonhowtheVOCfactorwasderivedandtheappropriatebasisofthefactor.Additionally,manyoftheemissionfactorslistedareforbatchkilns,ascontinuouskilnsarestillanemergingtechnology.

West Fraser, Inc. – Augusta Mill | Continuous Kiln Construction Permit Application Trinity Consultants 6-1
6. CLASS I AREA ANALYSIS
Sections160‐169oftheCAA,asamendedbytheCAAAmendmentsof1990,establishadetailedpolicyandregulatoryprogramtoprotectthequalityoftheairinregionsoftheUnitedStatesinwhichtheairiscleanerthanrequiredbytheNationalAmbientAirQualityStandards(NAAQS)toprotectpublichealthandwelfare.OneofthepurposesofthePSDprogramis“topreserve,protect,andenhancetheairqualityinnationalparks,nationalwildernessareas,nationalmonuments,nationalseashores,andotherareasofspecialnationalorregionalnatural,recreational,scenic,orhistoricvalue.”UnderthePSDprovisions,CongressestablishedalandclassificationschemeforthoseareasofthecountrywiththequalitybetterthantheNAAQS.ClassIallowsverylittledeteriorationofairqualityandincludes:
1. internationalparks;2. nationalwildernessareaswhichexceed5,000acresinsize;3. nationalmemorialparkswhichexceed5,000acresinsize;and4. nationalparkswhichexceedsixthousandacresinsize.
AllotherareasaredesignatedasClassIIareasanddonotrequireemissionsincrements.TheWestFraserAugustaMilllieswithina300kilometerradiusandoutsideofa50kilometerradiusofmultipledifferentClassIareasinthesoutheasternUnitedStates.Therefore,WestFraserhasperformedaQ/DanalysistodemonstratethatnovisibilityimpactswilloccuratthisClassIarea.ThelistofClassIareasthatarelocatedwithin300kmoftheAugustaMillareshowninTable6‐1below.
Table6‐1.ClassIAreaswithin300kmofAugustaMill
InaQ/Danalysis,thecombinedannualemissionsincreaseintonsperyear(Q)ofSO2,NOX,TotalPM10,andH2SO4isdividedbythedistance,inkilometers,fromthefacilitytotheClassIarea(D).52IfQ/Dislessthan10,thennoAirQualityRelatedValues(AQRV)analysisisrequired.AsshowninTable6‐2,thecombinedannualemissionsincreaseoftheaforementionedpollutantsis14.27tonsperyearasaresultoftheproposedproject.
52AspartofthePSDanalysis,theAugustaMillmustevaluatepossiblevisibilityimpactsofClassIareas;however,VOC(thepollutantwiththenetemissionsincreaseexceedingtheSER),isnotalistedpollutantwithknownimpactstotheAQRVsofClassIareas.
MinimumDistancefromSite
ClassIArea (km)*
JoyceKilmer‐SlickRockWilderness 289CapeRomainFish&Wildlife 221WolfIslandFish&Wildlife 225ShiningRockWilderness 237OkefenokeeFish&Wildlife 253GreatSmokyMountainsNationalPark 269LinvilleGorgeWilderness 276CohuttaWilderness 295

West Fraser, Inc. – Augusta Mill | Continuous Kiln Construction Permit Application Trinity Consultants 6-2
Table6‐2.SumofCombinedAnnualEmissionIncreases
Pollutant
Facility‐WideMaximum24‐hr
EmissionsIncrease(lb/hr)
FLAG2010ApproachAnnual
Emissions2(tpy)
NOX 2.50 10.93
DirectParticulate1 0.58 2.52
SO2 0.19 0.82
SumofEmissions(tpy) 14.271.DirectparticulateincludesallfilterableandcondensiblePM10.2.FLAG2010Approach:Q=Maximum24hourbasis*8,760/2000.
Table6‐3,below,providestheQ/Danalysisforallsiteslocatedwithin300km.
Table6‐3.SummaryofQ/DAnalysisforClassISites
TheprojectisonlytriggeringPSDforVOCwhichisnotconsideredavisibilityimpairingpollutant.Therefore,thatfactcombinedwiththelowQ/DimpactsindicatesthatClassIareaswillnotbeadverselyimpactedbythisproject.AsrequiredbythemostrecentEPDPSDguidance,WestFraserisprovidingletterstotheFederalLandManager(FLM)responsibleforeachClassIarealistedaboveconcurrentwiththisapplication.
MinimumDistance AnnualizedVAPfromSite Emissions
ClassIArea (km)* (tpy) Q/D
JoyceKilmer‐SlickRockWilderness 289 14.27 0.05CapeRomainFish&Wildlife 221 14.27 0.06WolfIslandFish&Wildlife 225 14.27 0.06ShiningRockWilderness 237 14.27 0.06OkefenokeeFish&Wildlife 253 14.27 0.06GreatSmokyMountainsNationalPark 269 14.27 0.05LinvilleGorgeWilderness 276 14.27 0.05CohuttaWilderness 295 14.27 0.05

West Fraser, Inc. – Augusta Mill | Continuous Kiln Construction Permit Application Trinity Consultants 7-1
7. ADDITIONAL IMPACT ANALYSIS
7.1. AIR QUALITY ANALYSIS
AnambientairimpactsanalysiswillnotbeperformedfortheprojectbecauseVOCarenotmodeledforNAAQSorPSDIncrementcompliancepurposes.Additionally,becausetheprojectisexclusivelyrelatedtoVOC,aClassIIvisibilityanalysisisalsonotrequired.
7.2. MOBILE SOURCES
AsshownindetailinAppendixB,WestFraserprojectsthattrucktrafficonunpavedroadswillincreasebyapproximately51,600vehiclemilestraveled(VMT)peryear.TheincreaseinTotalPM/PM10/PM2.5emissionshasbeenaccountedforintheapplicationandsupportingcalculations.Further,theincreaseintrucktrafficisexpectedtohaveaminimalimpactwhencomparedtothenetdecreaseinemissionsofTotalPM10,andTotalPM2.5fromtheshutdownofthebatchkilns.
7.3. GROWTH IMPACTS
Agrowthanalysisisintendedtoquantifytheamountofnewgrowththatislikelytooccurinsupportofthefacilityandtoestimateemissionsresultingfromthatassociatedgrowth.Associatedgrowthincludesresidentialandcommercial/industrialgrowthresultingfromthenewfacility.Residentialgrowthdependsonthenumberofnewemployeesandtheavailabilityofhousinginthearea,whileassociatedcommercialandindustrialgrowthconsistsofnewsourcesprovidingservicestothenewemployeesandthefacility.WestFraseranticipatesthatveryfewadditionalpersonnelwillbeemployedtoaidtheoperationofthecontinuouskilns.Therefore,additionalgrowthfromthisprojectisexpectedtobeminimal.
7.4. SOILS AND VEGETATION
Thefollowingdiscussionwillreviewtheproject’spotentialtoimpactitsagriculturalsurroundingsbasedonthefacility’sallowableemissionratesandresultinggroundlevelconcentrationsofVOC.Theeffectsofgaseousairpollutantsonvegetationmaybeclassifiedintothreeratherbroadcategories:acute,chronic,andlong‐term.Acuteeffectsarethosethatresultfromrelativelyshort(lessthan1month)exposurestohighconcentrationsofpollutants.Chroniceffectsoccurwhenorganismsareexposedformonthsorevenyearstocertainthresholdlevelsofpollutants.Long‐termeffectsincludeabnormalchangesinecosystemsandsubtlephysiologicalalterationsinorganisms.Acuteandchroniceffectsarecausedbythegaseouspollutantactingdirectlyontheorganism,whereaslong‐termeffectsmaybeindirectlycausedbysecondaryagentssuchaschangesinsoilpH. VOCareregulatedbytheU.S.EPAasprecursorstotroposphericozone.Elevatedground‐levelozoneconcentrationscandamageplantlifeandreducecropproduction.VOCinterferewiththeabilityofplantstoproduceandstorefood,makingthemmoresusceptibletodisease,insects,otherpollutants,andharshweather.OzoneisformedbytheinteractionofNOX,VOC,andsunlightintheatmosphere.TheAugustaMillislocatedinRichmondCounty,whichisdesignatedasattainment,orunclassifiableforNO2andozone.Also,theAugustaMillemitshigherquantitiesofVOCthanNOX,andtherefore,ozoneformationisprimarilydependentuponNOXemissionsandproperatmosphericconditions.SinceNOXemissionsareonlyincreasingslightlyasaresultofthisproject,ozoneproductionisexpectedtodecreaseaswell.ThusWestFraserdoesnotpredicttherewillbeanysignificantnegativeimpactonsoilorvegetationasaresultofthisproject.

West Fraser, Inc. – Augusta Mill | Continuous Kiln Construction Permit Application Trinity Consultants 7-2
7.5. VISIBILITY IMPAIRMENT
Theprojectisnotexpectedtoproduceanyperceptiblevisibilityimpactsintheimmediatevicinityoftheplant.Giventhelimitationof20%opacityofemissions,noimmediatevisibilityimpairmentisanticipated.AsthisprojectisnotevaluatingPSDforanycriteriapollutantsassociatedwithvisibilityimpacts,noClassIIvisibilityevaluationisrequired.
7.6. OZONE IMPACT ANALYSIS
Thissectionincludesananalysisofozoneimpactsfromtheproposedproject.ThereisoneexistingozonemonitorinRichmondCounty,wheretheAugustaMillislocated.The3‐yearrollingaverageozoneconcentration,whichisusedwhencomparingmonitorresultstodetermineattainmentstatus,isshowninTable7‐1.Pleasenotethatthemostrecentuptodatedataavailable(upto2011)wasincluded.
Table7‐1.OzoneConcentrationatRichmondCountyMonitor
OzoneisformedwhenNOXandVOCreactinthepresenceofsunlight.InGeorgia,thisreactionisNOXlimitedduetothepresenceofhighamountsofbiogenicVOC.NOXprimarilyisemittedfrommobilesourcesandindustrialsources.Therefore,ozoneformationisdirectlyimpactedbyNOXemissions,whichisareflectionofpopulationdensity,vehiclemilestravelled(VMT),andindustrialNOXemissions.
AnassessmentoftheRichmondCountymonitorwithandwithouttheprojectwasconducted.Astheprojectisnotexpectedtoalterpopulationdensityorvehiclemilestravelledbyasignificantamount,theonlychangeasaresultoftheprojectwouldbeindustrialNOXemissionsinthecounty.Expectedchangesinpopulationdensity,VMT,andNOXdensityforRichmondCountyasaresultoftheprojectarepresentedinTable7‐2.Inordertoindicatethisgraphically,thisdataisalsoshowninFigure7‐1.
2007‐2009 2008‐2010 2009‐2011
BunalowRoad Augusta Richmond 13 0.074 0.071 0.070
1.Ozoneconcentrationforeachyear2007through2011wereobtainedfromGeorgiaEPD'sAmbientAirSurveillanceReport,AppendixA,Ozone8‐HourAverage4thMaxvalueforeachrespectiveyear.The3‐yearrollingaveragereportstheaverageofthe3yearsindicated.
SiteName City CountyDistancetoFacility(km)
3‐YearRollingAverage(ppm)1

West Fraser, Inc. – Augusta Mill | Continuous Kiln Construction Permit Application Trinity Consultants 7-3
Table7‐2.UrbanizationDataforCountiesofInterest
Figure7‐1.UrbanizationEvaluationoftheRichmondCountyMonitorwithandwithouttheProject
TheVOCprojectemissionincreasesaregreaterthan100tpy,whichistheSignificantImpactLevel(SIL)triggerforozonewithrespecttomodeling.AsNOXandVOCareprecursorstoozoneformation,theproject’spotentialimpactonozoneformationisconsidered.ThesoutheasternU.S.isconsideredaNOX‐limitedatmospherewithrespecttoozoneformation,andwhileitispossiblethatincreasingNOXemissionsinaNOX‐limitedatmospherecouldcauseanincreaseinozoneproduction,thiseffectisminisculeonanindividualsource‐levelandforpracticalpurposescannotbequantified,butratherisqualitativelyaddressedasinsignificantforallbuttheverylargestsources.WestFraserassertsthatozonemonitoringisnotnecessaryinlightofthemagnitudeoftheNOXandVOCemissionsincreasesaswellasthepresenceoftheexistingmonitorsthatarenearby.Basedona
PopulationDensity1 VMT/Day2 NOXDensity
3,4
(people/sq.mile)(10,000
miles/day)(tpy/sq.mile)
Richmondpre‐project 620.4 512.3 43.7Richmondpost‐project 620.4 512.3 43.8
2.VMT/dayvaluesforRichmondobtainedfrom"NonattainmentAreaDesignationsforGeorgiaUnderthe2008Revised8‐hourOzoneNationalAmbientAirQualityStandardTechnicalAnalysis".
3.NOXdensitycalculatedusingNOXemissionsin"NonattainmentAreaDesignationsforGeorgiaUnderthe2008Revised8‐hourOzoneNationalAmbientAirQualityStandardTechnicalAnalysis"forRichmondcountyareaperthecounty'swebsite.
1.PopulationdensityforRichmondobtainedfrom:http://quickfacts.census.gov/qfd/states/13/13245.html
4.NOXdensityforRichmondpost‐projectcalculatedbysummingpotentialemissionsofNOXfromtheprojecttothe2008Non‐AttainmentData.
MonitorCounty
30.0
32.0
34.0
36.0
38.0
40.0
42.0
44.0
46.0
48.0
50.0
0.0
100.0
200.0
300.0
400.0
500.0
600.0
700.0
Richmondpre‐project Richmondpost‐project
NOXDensity(tpy/sq.m
ile)
PopulationDensity/VMT/Day
County
PopulationDensity(people/sq.mile)
VMT/Day(10,000miles/day)
NOxDensity(tpy/sq.mile)

West Fraser, Inc. – Augusta Mill | Continuous Kiln Construction Permit Application Trinity Consultants 7-4
comparisonofthefactorsinFigure7‐1,totheozoneconcentrationsinthecountiesofinterestbasedonpublishedmonitoringdata,theproposedprojectshouldnothaveanegativeimpactonozoneconcentrationswithinRichmondCounty.

West Fraser, Inc. – Augusta Mill | Continuous Kiln Construction Permit Application Trinity Consultants 8-1
8. TOXIC AIR POLLUTANTS ASSESSMENT
Thissectiondetailstheassumptionsusedforcompletingthetoxicairpollutant(TAP)modelinganalysis(i.e.,modelsetup)andtheresultsofmodelinganalysis.GeorgiaEPDregulatestheemissionsoftoxicairpollutant(TAP)emissionsthroughaprogramapprovedundertheprovisionsofGeorgiaRulesforAirQualityControl,391‐3‐1‐.02(2)(a)3(ii).ATAPisdefinedasanysubstancethatmayhaveanadverseeffectonpublichealth,excludinganyspecificsubstancethatiscoveredbyaStateorFederalambientairqualitystandard.ProceduresgoverningtheGeorgiaEPD’sreviewoftoxicairpollutantemissionsaspartofairpermitreviewsarecontainedintheagency’sGuidelineforAmbientImpactAssessmentofToxicAirPollutantEmissions(Guideline).53
8.1. DERIVATION OF ACCEPTABLE AMBIENT CONCENTRATION
AccordingtotheGuideline,dispersionmodelingshouldbecompletedforeachpotentiallytoxicpollutanthavingquantifiableemissionincreases.TheGuidelineinfersthatapollutantisidentifiedasatoxicpollutantifanyofthefollowingtoxicity‐determinedvalueshavebeenestablishedforthatpollutant:
EPAIntegratedRiskInformationSystem(IRIS)referenceconcentration(RfC)orunitrisk; OccupationalSafetyandHealthAdministration(OSHA)PermissibleExposureLimits(PEL); AmericanConferenceofGovernmentalIndustrialHygienists(ACGIH)ThresholdLimitValues(TLV); NationalInstituteforOccupationalSafetyandHealth(NIOSH)RecommendedExposureLimits(REL);and, LethalDose–50%(LD50)Standards.
TheGuidelinespecifiesthattheresourcesshouldbereferencedinthepriorityschedulelistedabovetodeterminelong‐termandshort‐termacceptableambientconcentrations(AACs)basedontheexposurelimitsthatareprovided. TheAACforeachtoxicpollutantiscalculatedfromthetoxicitydatapresentedintheresourceslistedabove.Foranypollutant,bothalong‐termandshort‐termAACmightbecalculated.IfapollutanthasanRfCand/orunitrisk,anannualaverage(long‐term)AACcanbecalculatedasfollows.TheRfCisanestimateofdailyinhalationexposurethatislikelytobewithoutanappreciableriskofdeleteriouseffectsduringalifetime.Theunitriskisaquantitativeassessmentofcancer‐causingpotentialperconcentrationofairinhaled.AnannualaverageAACisobtainedbydividingtheunitriskbyacancerriskfactorbasedontheweight‐of‐evidenceclassification,i.e.,1:1,000,000forknowncarcinogens(classA),1:100,000forprobablecarcinogens(classB),and1:10,000forsuspectedcarcinogens(classC).TheresultantisanannualaverageAACinunitsofmicrogramspercubicmeter(g/m3).RfCvaluesaregiveninunitsofmilligramspercubicmeter(mg/m3)andrequirenoconversion.IfRfCandunitriskdataarenotavailableintheIRISdatabase,thenanannualstandardcannotbecalculatedanda24‐hourAACmustbederived.Thebasesforthe24‐hourstandardsaretheOSHAPELgivenat29CFRPart1910SubpartZ,followedinprioritybytheACGIHTLV,NIOSHREL,andLD50databases.Theseresourcesprovideexposurelimitsastime‐weightedaverages(TWA)intermsofoccupationalexposureduration(i.e.,typicallyan8‐houraverage).IfaTWAvalueisprovidedforagivenpollutant,the24‐houraverageAACisderivedasfollows.First,anadjustmentfactor(i.e.,40dividedbythetotalweeklyemittinghours)isappliedtotheTWAtoaccountforexposureinexcessofoccupationalduration.Thisadjustmentfactorisassumedtobe
53 Guideline for Ambient Impact Assessment of Toxic Air Pollutant Emissions. Georgia Department of Natural Resources, Environmental Protection Division, Air Protection Branch, Revised, June 21, 1998.

West Fraser, Inc. – Augusta Mill | Continuous Kiln Construction Permit Application Trinity Consultants 8-2
168hoursperweekforcontinuousoperation.Second,theadjustedTWAisdividedbyasafetyfactortoaccountforhumancarcinogenicity:100forpollutantsthatarenotknownhumancarcinogens,300forpollutantsthatareknownhumancarcinogens.Theresultantvalueisadoptedasa24‐hourAAC.PertheGuideline,ifatoxicairpollutanthasanannualAAC,thenthederivationofandcomparisontoa24‐hourstandardisnotrequired.AnadditionalstandardmustbemetifagivenpollutanthaslistedaShortTermExposureLimit(STEL)orCeiling(C)inanyoneoftheabove‐namedresources.ASTELisa15‐minuteweightedaverageconcentrationthatshouldnotbeexceededatanytimeduringtheworkday.ACvalueisaconcentrationthatshouldnotbeexceededatanytimeduringoccupationalexposure.Thesevalueshavebeenestablishedforpollutantsthatareacutesensoryirritantsandapplyasa15‐minutestandard,alsoadjustedbyasafetyfactorof10asrecommendedbytheGuideline.NootheradjustmentfactorisappliedtoSTELorCvalues.A15‐minuteaveragestandard,ifapplicable,mustbemetinadditiontoanannualaverageand/or24‐houraveragestandard.TheGuidelineclearlystatesthateachofannual,24‐hour,and15‐minuteAACshouldbederivediftheappropriatetoxicityinformationisprovidedinanyofthelistedresources.WestFraserhasevaluatedtheavailablereferencematerialtodeterminetheapplicableAACstandardsforTAPidentifiedasbeingemittedatthefacility. TAPsmodeledaspartofthisassessmentwerebasedontheworst‐caseTAPsasdeterminedforpreviouscontinuouskilninstallationprojectsacceptedbyEPD.TheTAPsmodeledaspartofthisassessmentinclude:
Acetaldehyde Formaldehyde Propionaldehyde Methanol
ThetablesinAppendixFsummarizethederivationmethodologyfortheannual,24‐hourand15‐minuteAACsforthepollutantspotentiallyemittedbytheproposedfacility.
8.2. DETERMINATION OF TOXIC AIR POLLUTION IMPACT
WestFrasercompletedrefinedmodelingforthefourtoxicairpollutantslistedaboveusingtheISCdispersionmodel.Table8‐1presentsthemodeledemissionsourceparametersandTable8‐2Table8‐2presentsthemodeledemissionrates.
Table8‐1.ModeledSourceParameters
Forthepurposesofthisapplication,itisassumedthat100percentofallTAPemissionsfromthelumberdryingprocesswillbeemittedfromthetwostacksthathandleexhaustoneachendofeachcontinuouskiln.Inducedflowiscreatedattheoutletofeachkilninordertoexhaustallemissionsthroughthestacks.ItisalsoassumedthattheabortstacksthatarepresentoneachofthecontinuouskilnswillnotbeinvolvedwiththereleaseoftheTAPthatarebeingconsideredforthisproject.TheseTAPemissionsareexclusivelyconsideredduringwooddryingperiodsandarefocusedononlythestackspresentattheendofeachkiln.
CK01A ContinuousKiln#1‐StackA 410,518.7 3,688,446.2 42.19 10.67 100 35.93 0.69CK01B ContinuousKiln#1‐StackB 410,487.9 3,688,510.1 43.08 10.67 100 35.93 0.69CK02A ContinuousKiln#2‐StackA 410,551.5 3,688,460.2 42.07 10.67 100 35.93 0.69CK02B ContinuousKiln#2‐StackB 410,519.0 3,688,523.3 42.96 10.67 100 35.93 0.69
Height(m)
Temp.(F)
Velocity(m/s)
Diameter(m)ID Description
UTME(m)
UTMN(m)
Elevation(m)

West Fraser, Inc. – Augusta Mill | Continuous Kiln Construction Permit Application Trinity Consultants 8-3
Table8‐2.ModeledTAPEmissionRates
ThepollutantsmodeledforthisanalysisareconsistentwiththosemodeledforothersimilarapplicationsthathavebeenprovidedtoEPD.TotalkilnTAPpollutantemissionsareshowninTableB‐19.
8.2.1. ISC Modeling Results
Table8‐3presentstheresultsforeachpollutantandaveragingperiod.Notethatthemaximum15‐minuteimpactisbasedonthemaximum1‐hourpredictedimpactmultipliedby1.32.
Table8‐3.SummaryofModelingAnalysis
Asshowninthetableabove,impactsofallTAPfromtheproposedfacilityarebelowtherespectiveAACs
Methanol Formaldehyde Propionaldehyde Acetaldehyde
CK01A ContinuousKiln#1‐StackA 1.005 0.251 0.010 0.364CK01B ContinuousKiln#1‐StackB 1.005 0.251 0.010 0.364CK02A ContinuousKiln#2‐StackA 1.005 0.251 0.010 0.364CK02B ContinuousKiln#2‐StackB 1.005 0.251 0.010 0.364
ID DescriptionModeledEmissionRate(lb/hr)
Pollutant CAS
Maximum
1-Hour Impact1
(µg/m3)
Maximum
15-Min Impact2
(µg/m3)15-min AAC
(µg/m3)
Maximum
24-hr Impact1
(µg/m3)24-hr AAC
(µg/m3)
Maximum
Annual Impact1
(µg/m3)Annual AAC
(µg/m3)Exceed
Standard?
Methanol 67-56-1 57.49 75.89 32,750 26 619 No
Formaldehyde 50-00-0 16.87 22.27 246 0.50 1.11 NoPropionaldehyde 123-38-6 0.69 0.02 8.00 NoAcetaldehyde 75-07-0 24.46 32.29 4,500 0.73 9.00 No
1. First-high modeled impact over the five years of meteorological data.
2. Modeled 1-hour concentration multiplied by 1.32 to convert to 15-minute impact per GA Air Toxics Guidance (June 21, 1998).
None
None
Not RequiredNot RequiredNot Required

West Fraser, Inc. – Augusta Mill | Continuous Kiln Construction Permit Application Trinity Consultants A
APPENDIX A: FACILITY PLOT PLAN AND PROCESS FLOW DIAGRAMS

[
���520
���520
���520
404,000 405,000 406,000 407,000 408,000 409,000 410,000 411,000 412,000 413,000 414,000 415,000 416,000 417,000 418,000 419,000
3,680,000
3,681,000
3,682,000
3,683,000
3,684,000
3,685,000
3,686,000
3,687,000
3,688,000
3,689,000
3,690,000
3,691,000
3,692,000
3,693,000
3,694,000
3,695,000
3,696,000
3,697,000
3,698,000
Georgia
South Carolina
North Carolina
Facility Location
Figure A-1. Area Map
West Fraser Inc.
Augusta, Richmond County, Georgia
UTM Easting (m)
UT
M N
ort
hin
g (
m)
Coordinates reflect UTM projection Zone 17, NAD83.

Proposed Continuous Kilns

121101.0016December 2012
West Fraser, Inc. Augusta Lumber Mill, Georgia
Figure A-3Process Flow Diagram – Current Facility
DebarkerLog
Storage
Incoming Logs
Trucks
Logs LogsSawmill
Dried Lumber
Planer Mill Cyclone
Hogger
Shavings
Trimmer
Trucks
Lumber Sales
Dried LumberDirect-fired
Batch Kilns
Chip Sales KD01 KD02 KD03
Green Lumber Planer Mill
(PL01)
Dried Lumber
Dried Lumber Lumber Dry
Storage
Trucks
Shaving Sales
ShavingsShavings
Capture Cyclone
Shavings Sales
Trucks
Sawdust Fuel Storage
Silo
Green Sawdust
Trucks
Green Sawdust
Emissions
Process Material
Control Device
Process Equipment
Legend

121101.0016
December 2012
West Fraser, Inc.
Augusta Lumber Mill, Georgia
Figure A-4
Process Flow Diagram – Proposed Project
DebarkerLog
Storage
Incoming Logs
Trucks
Logs LogsSawmill
Dried Lumber
Planer Mill Cyclone
Hogger
Shavings
Trimmer
Trucks
Lumber Sales
Dried Lumber
Direct-fired Continuous
Kilns
Chip Sales KD04
Green Lumber Planer Mill
(PL01)
Dried Lumber
Dried Lumber Lumber
Dry Storage
Trucks
Shaving Sales
ShavingsShavings
Capture Cyclone
Shavings Sales
Trucks
Sawdust Fuel Storage
Silo
Green Sawdust
Trucks
Green Sawdust
KD05
Emissions
Process Material
Control Device
Process Equipment
Legend

West Fraser, Inc. – Augusta Mill | Continuous Kiln Construction Permit Application Trinity Consultants B
APPENDIX B: DETAILED EMISSION CALCULATIONS

AppendixB‐EmissionCalculationsWestFraser‐Augusta,Georgia
TableB‐1.CurrentOperatingCapacitiesforDirect‐FiredBatchKilns
MMBtu/hr BF/hr
KilnNo.1 15.05 3,889KilnNo.2 30.10 7,778KilnNo.3 49.45 12,778
TableB‐2.HeatingValueforWoodCombustion
HeatingValue1 4,500 Btu/lb
1.FromUSEPAAP‐42Paragraph1.6.1(Sept.2003).
OperatingCapacity1
Kiln
1.OperatingCapacity(MMBtu/hr)fromthefacility'sTitleVrenewalapplicationreviewnarrative(applicationreceivedbyEPDonOctober25,2004).OperatingCapacity(BF/hr)copiedduringtheAugustaLumberMillsitevisitonMarch06,2012byDeannaDuramandJakeStewart(Trinity),titled"WestFraserAugustaPermitRenewalForms"(datedMarch8,2011).
TrinityConsultants Page1of37AugustaExpansionProjectEmissionsAnalysis(2012126JSFinalUpdates)
OperatingData

AppendixB‐EmissionCalculationsWestFraser‐Augusta,Georgia
TableB‐3.ProductionInformationforDirect‐FiredBatchKilns1,2
Kiln1Production
WoodWasteCombusted
Kiln2Production
WoodWasteCombusted
Kiln3Production
WoodWasteCombusted
TotalKilnProduction
TotalWoodWaste
CombustedBF tons BF tons BF tons BF tons
Jan‐02 1,706,304 698.5 3,500,306 1,432.9 5,835,928 2,389.1 11,042,538 4,520.5Feb‐02 1,625,948 665.6 3,019,816 1,236.2 5,417,098 2,217.6 10,062,862 4,119.5Mar‐02 1,775,590 726.9 3,073,496 1,258.2 6,083,500 2,490.4 10,932,586 4,475.5Apr‐02 1,537,570 629.4 3,534,065 1,446.8 5,680,540 2,325.5 10,752,175 4,401.7May‐02 1,450,910 594.0 3,749,151 1,534.8 6,354,532 2,601.4 11,554,593 4,730.1Jun‐02 1,862,890 762.6 3,485,824 1,427.0 5,888,368 2,410.5 11,237,082 4,600.2Jul‐02 2,183,410 893.8 2,323,696 951.3 5,625,018 2,302.7 10,132,124 4,147.8Aug‐02 1,807,482 739.9 4,243,642 1,737.2 5,894,604 2,413.1 11,945,728 4,890.3Sep‐02 1,866,752 764.2 3,527,562 1,444.1 4,827,056 1,976.1 10,221,370 4,184.4Oct‐02 2,095,534 857.9 3,353,356 1,372.8 5,428,046 2,222.1 10,876,936 4,452.7Nov‐02 2,244,542 918.9 3,254,944 1,332.5 5,449,068 2,230.7 10,948,554 4,482.0Dec‐02 1,662,376 680.5 2,254,438 922.9 4,593,146 1,880.3 8,509,960 3,483.8Jan‐03 2,146,652 909.8 2,705,212 1,146.5 6,813,514 2,887.7 11,665,378 4,944.0Feb‐03 2,371,888 1,005.2 3,017,326 1,278.8 5,638,221 2,389.6 11,027,435 4,673.6Mar‐03 2,207,468 935.6 3,040,506 1,288.6 4,816,522 2,041.3 10,064,496 4,265.5Apr‐03 2,031,600 861.0 2,681,492 1,136.5 5,001,580 2,119.7 9,714,672 4,117.2May‐03 2,441,344 1,034.7 3,746,540 1,587.8 5,633,999 2,387.8 11,821,883 5,010.3Jun‐03 1,722,426 730.0 3,452,784 1,463.3 5,229,500 2,216.3 10,404,710 4,409.7Jul‐03 1,747,278 740.5 3,541,492 1,500.9 4,349,668 1,843.5 9,638,438 4,084.9Aug‐03 1,995,400 845.7 3,015,438 1,278.0 5,877,926 2,491.2 10,888,764 4,614.8Sep‐03 1,843,282 781.2 2,915,530 1,235.6 5,675,664 2,405.4 10,434,476 4,422.3Oct‐03 2,267,162 960.9 1,937,386 821.1 5,911,816 2,505.5 10,116,364 4,287.5Nov‐03 1,680,946 712.4 3,592,858 1,522.7 4,853,120 2,056.8 10,126,924 4,291.9Dec‐03 1,820,894 771.7 1,981,298 839.7 5,167,128 2,189.9 8,969,320 3,801.3Jan‐04 1,853,986 757.3 2,930,912 1,197.1 6,123,336 2,501.1 10,908,234 4,455.5Feb‐04 1,597,760 652.6 2,712,414 1,107.9 5,210,972 2,128.4 9,521,146 3,888.9Mar‐04 1,401,452 572.4 4,065,630 1,660.6 5,083,346 2,076.3 10,550,428 4,309.3Apr‐04 1,709,896 698.4 3,063,816 1,251.4 5,970,034 2,438.5 10,743,746 4,388.3May‐04 1,530,864 625.3 4,281,953 1,749.0 5,102,926 2,084.3 10,915,743 4,458.5Jun‐04 1,829,738 747.4 3,181,436 1,299.5 6,104,291 2,493.3 11,115,465 4,540.1Jul‐04 756,880 309.1 1,617,994 660.9 2,325,608 949.9 4,700,482 1,919.9Aug‐04 2,657,206 1,085.3 3,880,670 1,585.1 660,192 269.7 7,198,068 2,940.0Sep‐04 2,201,086 899.0 2,327,848 950.8 5,232,316 2,137.1 9,761,250 3,987.0Oct‐04 2,363,645 965.4 3,451,140 1,409.6 5,657,126 2,310.6 11,471,911 4,685.7Nov‐04 2,195,334 896.7 2,902,298 1,185.4 4,783,126 1,953.7 9,880,758 4,035.8Dec‐04 2,427,570 991.5 3,421,188 1,397.4 5,156,958 2,106.4 11,005,716 4,495.3Jan‐05 2,409,290 988.7 3,089,728 1,268.0 5,453,806 2,238.1 10,952,824 4,494.8Feb‐05 2,336,156 958.7 2,316,298 950.6 5,232,222 2,147.2 9,884,676 4,056.5Mar‐05 2,559,012 1,050.2 3,936,476 1,615.4 5,811,080 2,384.7 12,306,568 5,050.4Apr‐05 2,437,168 1,000.2 3,900,888 1,600.8 6,498,880 2,667.0 12,836,936 5,268.0May‐05 2,499,247 1,025.6 3,540,382 1,452.9 7,133,632 2,927.5 13,173,261 5,406.0Jun‐05 2,017,093 827.8 3,679,018 1,509.8 5,463,328 2,242.0 11,159,439 4,579.6Jul‐05 2,402,774 986.0 3,925,004 1,610.7 6,820,098 2,798.8 13,147,876 5,395.6Aug‐05 2,518,210 1,033.4 3,495,898 1,434.6 6,576,574 2,698.9 12,590,682 5,167.0Sep‐05 2,511,306 1,030.6 3,372,864 1,384.2 6,563,740 2,693.6 12,447,910 5,108.4Oct‐05 2,491,870 1,022.6 3,190,974 1,309.5 6,256,514 2,567.5 11,939,358 4,899.7Nov‐05 2,288,540 939.2 2,593,756 1,064.4 5,222,020 2,143.0 10,104,316 4,146.6Dec‐05 2,858,442 1,173.0 3,528,420 1,448.0 7,214,870 2,960.8 13,601,732 5,581.9Jan‐06 2,555,874 937.1 2,891,330 1,060.1 6,048,860 2,217.8 11,496,064 4,214.9Feb‐06 1,945,764 713.4 2,821,958 1,034.7 5,226,860 1,916.4 9,994,582 3,664.4Mar‐06 3,193,118 1,170.7 4,010,188 1,470.3 7,397,490 2,712.2 14,600,796 5,353.3Apr‐06 2,407,108 882.5 4,006,922 1,469.1 5,865,858 2,150.7 12,279,888 4,502.3May‐06 2,816,904 1,032.8 3,568,262 1,308.3 7,400,710 2,713.4 13,785,876 5,054.5Jun‐06 2,641,028 968.3 3,534,416 1,295.9 6,291,696 2,306.8 12,467,140 4,571.0Jul‐06 2,694,274 987.8 2,862,368 1,049.5 6,744,888 2,473.0 12,301,530 4,510.3Aug‐06 2,445,014 896.4 2,339,514 857.8 5,862,330 2,149.4 10,646,858 3,903.6Sep‐06 2,516,562 922.7 966,782 354.5 5,922,546 2,171.5 9,405,890 3,448.6Oct‐06 2,233,781 819.0 1,647,306 604.0 4,593,054 1,684.0 8,474,141 3,107.0Nov‐06 1,921,870 704.6 2,465,380 903.9 5,015,288 1,838.8 9,402,538 3,447.4Dec‐06 1,707,114 625.9 1,204,904 441.8 4,978,026 1,825.2 7,890,044 2,892.8Jan‐07 2,027,982 508.0 2,779,818 1,734.6 5,237,284 1,311.9 10,045,084 3,554.6Feb‐07 1,637,807 410.3 2,575,524 1,607.1 5,212,020 1,305.6 9,425,351 3,323.0Mar‐07 1,667,218 417.6 2,368,914 1,478.2 5,468,112 1,369.8 9,504,244 3,265.6Apr‐07 1,515,324 379.6 3,526,046 2,200.3 5,451,454 1,365.6 10,492,824 3,945.5May‐07 2,297,662 575.6 861,126 537.3 7,385,806 1,850.2 10,544,594 2,963.1Jun‐07 1,867,886 467.9 3,294,152 2,055.6 6,542,706 1,639.0 11,704,744 4,162.4Jul‐07 1,976,868 495.2 3,434,446 2,143.1 6,571,054 1,646.1 11,982,368 4,284.4Aug‐07 3,005,236 752.8 2,183,506 1,362.5 7,621,556 1,909.2 12,810,298 4,024.5Sep‐07 1,663,814 416.8 3,601,340 2,247.2 5,223,760 1,308.6 10,488,914 3,972.6Oct‐07 1,693,582 424.2 3,313,472 2,067.6 6,092,654 1,526.2 11,099,708 4,018.1Nov‐07 1,039,554 260.4 1,798,646 1,122.4 6,498,108 1,627.8 9,336,308 3,010.6Dec‐07 1,310,152 328.2 2,776,514 1,732.6 4,147,038 1,038.8 8,233,704 3,099.6Jan‐08 639,662 174.4 3,159,501 3,352.4 6,126,142 1,670.6 9,925,305 5,197.4Feb‐08 1,314,024 358.3 1,837,270 1,949.4 5,020,256 1,369.0 8,171,550 3,676.8Mar‐08 578,720 157.8 2,457,044 2,607.1 4,989,436 1,360.6 8,025,200 4,125.5Apr‐08 2,108,386 575.0 0 0.0 5,853,086 1,596.1 7,961,472 2,171.1May‐08 2,224,620 606.7 0 0.0 6,478,364 1,766.7 8,702,984 2,373.3Jun‐08 1,872,784 510.7 0 0.0 6,101,118 1,663.8 7,973,902 2,174.5Jul‐08 2,162,420 589.7 0 0.0 7,174,114 1,956.4 9,336,534 2,546.1Aug‐08 2,693,958 734.6 0 0.0 8,059,982 2,198.0 10,753,940 2,932.6Sep‐08 943,454 257.3 2,475,900 2,627.1 6,348,000 1,731.1 9,767,354 4,615.4Oct‐08 866,952 236.4 2,905,210 3,082.6 5,000,798 1,363.7 8,772,960 4,682.7Nov‐08 1,990,380 542.8 931,510 988.4 5,452,104 1,486.8 8,373,994 3,018.0Dec‐08 1,485,202 405.0 834,581 885.5 3,722,596 1,015.2 6,042,379 2,305.7Jan‐09 1,285,454 372.5 555,450 617.7 3,869,904 1,121.6 5,710,808 2,111.8Feb‐09 1,552,726 450.0 0 0.0 4,341,464 1,258.2 5,894,190 1,708.2Mar‐09 1,930,246 559.4 2,219,730 2,468.5 6,108,386 1,770.3 10,258,362 4,798.3Apr‐09 2,296,366 665.5 1,665,982 1,852.7 6,990,298 2,025.9 10,952,646 4,544.1May‐09 1,724,148 499.7 1,940,418 2,157.9 5,886,528 1,706.0 9,551,094 4,363.6Jun‐09 1,816,076 526.3 2,357,946 2,622.3 5,887,494 1,706.3 10,061,516 4,854.9Jul‐09 2,089,273 605.5 1,111,038 1,235.6 6,146,106 1,781.2 9,346,417 3,622.3Aug‐09 2,143,720 621.3 2,082,558 2,316.0 5,479,244 1,588.0 9,705,522 4,525.3Sep‐09 1,713,254 496.5 1,247,658 1,387.5 4,826,182 1,398.7 7,787,094 3,282.7Oct‐09 2,138,356 619.7 1,828,316 2,033.3 6,365,940 1,844.9 10,332,612 4,497.9Nov‐09 1,731,756 501.9 1,116,190 1,241.3 5,465,399 1,584.0 8,313,345 3,327.2Dec‐09 1,556,778 451.2 972,302 1,081.3 5,027,248 1,457.0 7,556,328 2,989.4Jan‐10 1,850,166 598.5 622,978 793.0 5,657,172 1,830.1 8,130,316 3,221.7Feb‐10 1,107,634 358.3 1,116,926 1,421.8 3,271,198 1,058.3 5,495,758 2,838.4Mar‐10 2,044,838 661.5 3,197,276 4,070.0 4,789,566 1,549.5 10,031,680 6,281.0Apr‐10 2,223,732 719.4 1,673,434 2,130.2 7,451,862 2,410.7 11,349,028 5,260.4May‐10 2,138,494 691.8 2,099,302 2,672.3 6,767,750 2,189.4 11,005,546 5,553.6Jun‐10 2,264,715 732.7 0 0.0 6,746,038 2,182.4 9,010,753 2,915.0Jul‐10 2,431,560 786.6 1,093,972 1,392.6 6,572,572 2,126.3 10,098,104 4,305.5Aug‐10 0 0.0 3,346,362 4,259.8 6,115,102 1,978.3 9,461,464 6,238.1Sep‐10 1,254,604 405.9 2,361,088 3,005.6 6,095,276 1,971.9 9,710,968 5,383.3Oct‐10 2,379,136 769.7 2,902,186 3,694.4 5,720,928 1,850.8 11,002,250 6,314.8Nov‐10 1,765,756 571.2 1,813,182 2,308.1 4,562,648 1,476.1 8,141,586 4,355.4Dec‐10 1,679,417 543.3 2,625,496 3,342.2 6,158,300 1,992.3 10,463,213 5,877.7Jan‐11 1,998,332 830.9 1,651,446 1,800.9 5,680,724 2,362.1 9,330,502 4,993.9Feb‐11 1,843,680 766.6 2,974,682 3,243.9 5,497,046 2,285.7 10,315,408 6,296.3Mar‐11 2,387,748 992.8 3,286,792 3,584.3 5,739,248 2,386.4 11,413,788 6,963.6Apr‐11 2,655,948 1,104.4 2,766,302 3,016.7 6,151,488 2,557.8 11,573,738 6,678.9May‐11 2,791,096 1,160.6 2,349,128 2,561.8 6,400,992 2,661.6 11,541,216 6,383.9Jun‐11 2,309,108 960.1 2,854,806 3,113.2 5,698,848 2,369.6 10,862,762 6,443.0Jul‐11 1,859,964 773.4 1,644,684 1,793.6 5,060,736 2,104.3 8,565,384 4,671.2Aug‐11 2,371,806 986.2 1,062,922 1,159.1 5,698,618 2,369.5 9,133,346 4,514.9Sep‐11 1,559,492 648.4 693,266 756.0 4,381,500 1,821.9 6,634,258 3,226.3Oct‐11 2,078,556 864.3 2,175,018 2,371.9 5,715,776 2,376.7 9,969,350 5,612.8Nov‐11 1,025,524 426.4 828,276 903.2 2,632,718 1,094.7 4,486,518 2,424.4Dec‐11 2,077,340 863.8 1,507,742 1,644.2 5,661,864 2,354.2 9,246,946 4,862.2
Month
1.Monthlykilnproductiondatafromselectyearsarefromthefile"MonthlyKilnVolume‐2004‐2012.pdf"copiedduringtheAugustaLumberMillsitevisitonMarch06,2012byDeannaDuramandJakeStewart(Trinity).Theremainingmonth'sprooductiondataweretakenfromdocumentsonfileatGeorgiaEPDinAtlanta,Georgia.
2.AnnualdataforwoodwastecombustedwasprovidedviaemailfromWestFrasertoTrinityonApril9,2012.Theannualvalueswereconvertedtomonthlyvaluesbytakingtheratioofthelumberproducedinagivenmonthtotheamountoflumberproducedintheentireyear.
TrinityConsultants Page2of37AugustaExpansionProjectEmissionsAnalysis(2012126JSFinalUpdates)
ProductionData

AppendixB‐EmissionCalculationsWestFraser‐Augusta,Georgia
TableB‐4.EmissionFactorsforDirect‐FiredBatchKilns
Pollutant Reference
NSRPollutantsCO 0.73 lb/MBF 1Fluorides N/A N/A 2H2S N/A N/A 2Lead 1.77E‐05 lb/MMBtu 3NOX 0.28 lb/MBF 4ReducedSulfurCompounds(includingH2S) N/A N/A 2SO2 0.025 lb/MMBtu 5H2SO4 N/A N/A 2TotalPM 0.41 lb/MBF 6TotalPM10 0.25 lb/MBF 6TotalPM2.5 0.226 lb/MBF 6TotalReducedSulfur(includingH2S) N/A N/A 2TotalVOC 3.76 lb/MBF 7
GreenhouseGasesCO2 206.79 lb/MMBtu 8CH4 7.1E‐02 lb/MMBtu 8
EmissionFactor
TrinityConsultants Page3of37AugustaExpansionProjectEmissionsAnalysis(2012126JSFinalUpdates)
BatchKilnEFs
4 /N2O 9.3E‐03 lb/MMBtu 8CO2e 211.15 lb/MMBtu 9CO2ebiomassdeferral 4.35 lb/MMBtu 10
HAPsFormaldehyde 0.04 lb/MBF 3Methanol 0.16 lb/MBF 3
6.BasedonpreliminarydeterminationforSimpsonLumberCompany,LLC,thebestavailableemissionfactorsforparticulaterelatedemissionsfrombatchkilnsarebasedonNCASIdatafromtheNCASIEnvironmentalResourceHandbookforWoodProductsPlants.ThefilterablePMemissionfactoris0.32lb/MBF.CondensablePMisbasedonunpublisheddataprovidedbyNCASI.TheCondensablePMemissionfactoris0.087lb/MBF.FilterablePM 10isassumedtobe50%offilterablePM(basedon
1.BasedontheaverageofNCASItestresultsasprovidedviaemailfromDr.WordofNCASItotheNorthCarolinaDepartmentofAirQuality(NCDAQ),publishedintheAirPermitReview/PreliminaryDetermination,p.8fortheWeyerhaeuserNRLumberMill(Plymouth,N.C.)applicationsubmittedinMay2010entitled"FinalReport‐RevisedAirPermitApplicatinforEnergyProject."
2.EmissionsofthesepollutantsarenotexpectedattheWestFraserAugusta,GAsite.
3.PerNCASISARA313Guidance‐WoodProducts‐April2009,aspublishedintheWeyerhaeuserNRLumberMill(Plymouth,N.C.)revisedairpermitapplicationentitled"FinalReport‐RevisedAirPermitApplicatinforEnergyProject,"datedMay2010.
4.ProvidedbyDr.DavidWordofNCASItotheWeyerhaeuserfacilityinFebruary2008,aspublishedintheAirPermitReview/PreliminaryDetermination,p.5fortheWeyerhaeuserNRLumberMill(Plymouth,N.C.)fortheMay2010permitapplication.
5.PerU.S.EPA'sAP‐42,Section1.6,Table1.6‐2,WoodResidueCombustioninBoilers (September2003).
CO2 1
CH4 21
N2O 310
10.Pursuantto40CFRPart98.2(b)(2),biogeniccarbondioxideemissions(e.g.,frombiomass)areexcludedfromthecombustionofbiomass.
8.Per40CFRPart98,SubpartC,TablesC‐1andC‐2.TheCO2emissionfactoristhedefaultfactorforwoodandwoodresiduals,andtheCH4andN2Oemissionfactorsarethedefaultfactorsforallsolidbiomassfuels.
VOCasterpene+methanol+formaldehyde=VOCasCarbon[lb/MBF]*1.133+(1‐0.65)*Methanol[lb/MBF]+Formaldehyde[lb/MBF].
TheVOCasCarbonemissionfactorisbasedontheaverageofunpublishedandpublishedNCASItestresultsasprovidedbyDr.DavidWordofNCASItoNCDAQandpublishedintheNCDAQAirPermitReview/PreliminaryDeterminationfortheWeyerhaeuserNRLumberMill(Plymouth,N.C.)application,pp.7‐8.Itismultipliedby1.133,whichistheratioofthemolecularweightofpinene(C10H16,136amu)tothemolecularweightofcarboninpinene(120amu).Thefactorsformethanolandformaldehydearemultipliedbytheresponsefactors,definedastheFIAresponsedividedbytheactualcompoundconcentration.AccordingtoanNCASIstudyandasprintedintheNCDAQAirPermitReview/PreliminaryDetermination,theresponsefactorsforformaldehydeandmethanolare0%and65%,respectively.ThismethodologyissupportedinanEPAdocumententitledInterimVOCMeasurementProtocolfortheWoodProductsIndustry(July2007).
9.TheCO2efactoriscalculatedbasedontheemissionfactorsforCO 2,CH4,andN2Oandtheglobalwarmingpotential(GWP)foreachpollutantper40CFR98,SubpartA,TableA‐1:
NCASI.TheCondensablePMemissionfactoris0.087lb/MBF.FilterablePM 10 isassumedtobe50%offilterablePM(basedonPermitNO.2421‐107‐0011‐V‐02‐3issuedtoRayonierWoodProductsLLC‐SwainsboroSawmill).FilterablePM 2.5isassumedtobe87%ofPM10basedonAP‐42forwoodcombustion.AllcondensablePMisassumedtobePM 10andPM2.5.
7.TotalVOC(lb/MBF)iscomputedbasedonthefollowingequation:
TrinityConsultants Page3of37AugustaExpansionProjectEmissionsAnalysis(2012126JSFinalUpdates)
BatchKilnEFs

AppendixB‐EmissionCalculationsWestFraser‐Augusta,Georgia
TableB‐5.BaselineMonthlyEmissionsforKiln1(tonspermonth)
Month CO Fluorides H2S Lead NOX
ReducedSulfurCompounds
(includingH2S) SO2 H2SO4 TotalPM TotalPM10 TotalPM2.5
TotalReducedSulfur
(includingH2S) TotalVOC CO2ebiomassdeferral Formaldehyde Methanol
Jan‐02 0.62 N/A N/A 5.56E‐05 0.24 N/A 0.08 N/A 0.35 0.21 0.19 N/A 3.20 13.68 0.03 0.14Feb‐02 0.59 N/A N/A 5.30E‐05 0.23 N/A 0.07 N/A 0.33 0.20 0.18 N/A 3.05 13.04 0.03 0.13Mar‐02 0.65 N/A N/A 5.79E‐05 0.25 N/A 0.08 N/A 0.36 0.22 0.20 N/A 3.33 14.23 0.04 0.14Apr‐02 0.56 N/A N/A 5.01E‐05 0.22 N/A 0.07 N/A 0.31 0.19 0.17 N/A 2.89 12.33 0.03 0.12May‐02 0.53 N/A N/A 4.73E‐05 0.20 N/A 0.07 N/A 0.30 0.18 0.16 N/A 2.72 11.63 0.03 0.12Jun‐02 0.68 N/A N/A 6.07E‐05 0.26 N/A 0.09 N/A 0.38 0.23 0.21 N/A 3.50 14.93 0.04 0.15Jul‐02 0.80 N/A N/A 7.12E‐05 0.31 N/A 0.10 N/A 0.44 0.27 0.25 N/A 4.10 17.50 0.04 0.17Aug‐02 0.66 N/A N/A 5.89E‐05 0.25 N/A 0.08 N/A 0.37 0.22 0.20 N/A 3.39 14.49 0.04 0.14Sep‐02 0.68 N/A N/A 6.09E‐05 0.26 N/A 0.09 N/A 0.38 0.23 0.21 N/A 3.51 14.97 0.04 0.15Oct‐02 0.76 N/A N/A 6.83E‐05 0.29 N/A 0.10 N/A 0.43 0.26 0.24 N/A 3.93 16.80 0.04 0.17Nov‐02 0.82 N/A N/A 7.32E‐05 0.31 N/A 0.10 N/A 0.46 0.28 0.25 N/A 4.21 17.99 0.04 0.18Dec‐02 0.61 N/A N/A 5.42E‐05 0.23 N/A 0.08 N/A 0.34 0.21 0.19 N/A 3.12 13.33 0.03 0.13Jan‐03 0.78 N/A N/A 7.25E‐05 0.30 N/A 0.10 N/A 0.44 0.27 0.24 N/A 4.03 17.82 0.04 0.17Feb‐03 0.87 N/A N/A 8.01E‐05 0.33 N/A 0.11 N/A 0.48 0.29 0.27 N/A 4.45 19.69 0.05 0.19Mar‐03 0.81 N/A N/A 7.45E‐05 0.31 N/A 0.11 N/A 0.45 0.27 0.25 N/A 4.15 18.32 0.04 0.18Apr‐03 0.74 N/A N/A 6.86E‐05 0.28 N/A 0.10 N/A 0.41 0.25 0.23 N/A 3.81 16.86 0.04 0.16May‐03 0.89 N/A N/A 8.24E‐05 0.34 N/A 0.12 N/A 0.50 0.30 0.28 N/A 4.58 20.26 0.05 0.20Jun‐03 0.63 N/A N/A 5.81E‐05 0.24 N/A 0.08 N/A 0.35 0.21 0.19 N/A 3.23 14.30 0.03 0.14Jul‐03 0.64 N/A N/A 5.90E‐05 0.24 N/A 0.08 N/A 0.36 0.22 0.20 N/A 3.28 14.50 0.03 0.14Aug‐03 0.73 N/A N/A 6.74E‐05 0.28 N/A 0.10 N/A 0.41 0.25 0.23 N/A 3.75 16.56 0.04 0.16Sep‐03 0.67 N/A N/A 6.22E‐05 0.26 N/A 0.09 N/A 0.38 0.23 0.21 N/A 3.46 15.30 0.04 0.15Oct‐03 0.83 N/A N/A 7.65E‐05 0.32 N/A 0.11 N/A 0.46 0.28 0.26 N/A 4.26 18.82 0.05 0.18Nov‐03 0.61 N/A N/A 5.67E‐05 0.24 N/A 0.08 N/A 0.34 0.21 0.19 N/A 3.16 13.95 0.03 0.13Dec‐03 0.66 N/A N/A 6.15E‐05 0.25 N/A 0.09 N/A 0.37 0.22 0.21 N/A 3.42 15.11 0.04 0.15Jan‐04 0.68 N/A N/A 6.03E‐05 0.26 N/A 0.09 N/A 0.38 0.23 0.21 N/A 3.48 14.83 0.04 0.15Feb‐04 0.58 N/A N/A 5.20E‐05 0.22 N/A 0.07 N/A 0.33 0.20 0.18 N/A 3.00 12.78 0.03 0.13Mar‐04 0.51 N/A N/A 4.56E‐05 0.20 N/A 0.06 N/A 0.29 0.17 0.16 N/A 2.63 11.21 0.03 0.11Apr‐04 0.62 N/A N/A 5.56E‐05 0.24 N/A 0.08 N/A 0.35 0.21 0.19 N/A 3.21 13.68 0.03 0.14May‐04 0.56 N/A N/A 4.98E‐05 0.21 N/A 0.07 N/A 0.31 0.19 0.17 N/A 2.87 12.25 0.03 0.12Jun‐04 0.67 N/A N/A 5.95E‐05 0.26 N/A 0.08 N/A 0.37 0.23 0.21 N/A 3.44 14.64 0.04 0.15Jul‐04 0.28 N/A N/A 2.46E‐05 0.11 N/A 0.03 N/A 0.15 0.09 0.09 N/A 1.42 6.05 0.02 0.06Aug‐04 0.97 N/A N/A 8.64E‐05 0.37 N/A 0.12 N/A 0.54 0.33 0.30 N/A 4.99 21.25 0.05 0.21Sep‐04 0.80 N/A N/A 7.16E‐05 0.31 N/A 0.10 N/A 0.45 0.27 0.25 N/A 4.13 17.61 0.04 0.18Oct‐04 0.86 N/A N/A 7.69E‐05 0.33 N/A 0.11 N/A 0.48 0.29 0.27 N/A 4.44 18.91 0.05 0.19Nov‐04 0.80 N/A N/A 7.14E‐05 0.31 N/A 0.10 N/A 0.45 0.27 0.25 N/A 4.12 17.56 0.04 0.18Dec‐04 0.89 N/A N/A 7.90E‐05 0.34 N/A 0.11 N/A 0.49 0.30 0.27 N/A 4.56 19.42 0.05 0.19Jan‐05 0.88 N/A N/A 7.88E‐05 0.34 N/A 0.11 N/A 0.49 0.30 0.27 N/A 4.52 19.36 0.05 0.19Feb‐05 0.85 N/A N/A 7.64E‐05 0.33 N/A 0.11 N/A 0.48 0.29 0.26 N/A 4.39 18.78 0.05 0.19Mar‐05 0.93 N/A N/A 8.36E‐05 0.36 N/A 0.12 N/A 0.52 0.32 0.29 N/A 4.81 20.57 0.05 0.20Apr‐05 0.89 N/A N/A 7.97E‐05 0.34 N/A 0.11 N/A 0.50 0.30 0.28 N/A 4.58 19.59 0.05 0.19May‐05 0.91 N/A N/A 8.17E‐05 0.35 N/A 0.12 N/A 0.51 0.31 0.28 N/A 4.69 20.09 0.05 0.20Jun‐05 0.74 N/A N/A 6.59E‐05 0.28 N/A 0.09 N/A 0.41 0.25 0.23 N/A 3.79 16.21 0.04 0.16Jul‐05 0.88 N/A N/A 7.85E‐05 0.34 N/A 0.11 N/A 0.49 0.30 0.27 N/A 4.51 19.31 0.05 0.19Aug‐05 0.92 N/A N/A 8.23E‐05 0.35 N/A 0.12 N/A 0.51 0.31 0.28 N/A 4.73 20.24 0.05 0.20Sep‐05 0.92 N/A N/A 8.21E‐05 0.35 N/A 0.12 N/A 0.51 0.31 0.28 N/A 4.72 20.18 0.05 0.20Oct‐05 0.91 N/A N/A 8.15E‐05 0.35 N/A 0.12 N/A 0.51 0.31 0.28 N/A 4.68 20.03 0.05 0.20Nov‐05 0.84 N/A N/A 7.48E‐05 0.32 N/A 0.11 N/A 0.47 0.28 0.26 N/A 4.30 18.39 0.05 0.18Dec‐05 1.04 N/A N/A 9.34E‐05 0.40 N/A 0.13 N/A 0.58 0.35 0.32 N/A 5.37 22.97 0.06 0.23
TrinityConsultants Page4of37AugustaExpansionProjectEmissionsAnalysis(2012126JSFinalUpdates)
Kiln1Emissions

AppendixB‐EmissionCalculationsWestFraser‐Augusta,Georgia
TableB‐5.BaselineMonthlyEmissionsforKiln1(tonspermonth)
Month CO Fluorides H2S Lead NOX
ReducedSulfurCompounds
(includingH2S) SO2 H2SO4 TotalPM TotalPM10 TotalPM2.5
TotalReducedSulfur
(includingH2S) TotalVOC CO2ebiomassdeferral Formaldehyde Methanol
Jan‐06 0.93 N/A N/A 7.46E‐05 0.36 N/A 0.11 N/A 0.52 0.32 0.29 N/A 4.80 18.35 0.05 0.20Feb‐06 0.71 N/A N/A 5.68E‐05 0.27 N/A 0.08 N/A 0.40 0.24 0.22 N/A 3.65 13.97 0.04 0.16Mar‐06 1.17 N/A N/A 9.32E‐05 0.45 N/A 0.13 N/A 0.65 0.39 0.36 N/A 6.00 22.93 0.06 0.26Apr‐06 0.88 N/A N/A 7.03E‐05 0.34 N/A 0.10 N/A 0.49 0.30 0.27 N/A 4.52 17.28 0.05 0.19May‐06 1.03 N/A N/A 8.23E‐05 0.39 N/A 0.12 N/A 0.57 0.35 0.32 N/A 5.29 20.23 0.06 0.23Jun‐06 0.96 N/A N/A 7.71E‐05 0.37 N/A 0.11 N/A 0.54 0.33 0.30 N/A 4.96 18.96 0.05 0.21Jul‐06 0.98 N/A N/A 7.87E‐05 0.38 N/A 0.11 N/A 0.55 0.33 0.30 N/A 5.06 19.35 0.05 0.22Aug‐06 0.89 N/A N/A 7.14E‐05 0.34 N/A 0.10 N/A 0.50 0.30 0.28 N/A 4.59 17.56 0.05 0.20Sep‐06 0.92 N/A N/A 7.35E‐05 0.35 N/A 0.10 N/A 0.51 0.31 0.28 N/A 4.73 18.07 0.05 0.20Oct‐06 0.82 N/A N/A 6.52E‐05 0.31 N/A 0.09 N/A 0.45 0.28 0.25 N/A 4.19 16.04 0.04 0.18Nov‐06 0.70 N/A N/A 5.61E‐05 0.27 N/A 0.08 N/A 0.39 0.24 0.22 N/A 3.61 13.80 0.04 0.15Dec‐06 0.62 N/A N/A 4.99E‐05 0.24 N/A 0.07 N/A 0.35 0.21 0.19 N/A 3.21 12.26 0.03 0.14Jan‐07 0.74 N/A N/A 4.05E‐05 0.28 N/A 0.06 N/A 0.41 0.25 0.23 N/A 3.81 9.95 0.04 0.16Feb‐07 0.60 N/A N/A 3.27E‐05 0.23 N/A 0.05 N/A 0.33 0.20 0.19 N/A 3.08 8.03 0.03 0.13Mar‐07 0.61 N/A N/A 3.33E‐05 0.23 N/A 0.05 N/A 0.34 0.21 0.19 N/A 3.13 8.18 0.03 0.13Apr‐07 0.55 N/A N/A 3.02E‐05 0.21 N/A 0.04 N/A 0.31 0.19 0.17 N/A 2.85 7.43 0.03 0.12May‐07 0.84 N/A N/A 4.58E‐05 0.32 N/A 0.06 N/A 0.47 0.28 0.26 N/A 4.31 11.27 0.05 0.18Jun‐07 0.68 N/A N/A 3.73E‐05 0.26 N/A 0.05 N/A 0.38 0.23 0.21 N/A 3.51 9.16 0.04 0.15Jul‐07 0.72 N/A N/A 3.94E‐05 0.28 N/A 0.06 N/A 0.40 0.24 0.22 N/A 3.71 9.70 0.04 0.16Aug‐07 1.10 N/A N/A 6.00E‐05 0.42 N/A 0.08 N/A 0.61 0.37 0.34 N/A 5.64 14.74 0.06 0.24Sep‐07 0.61 N/A N/A 3.32E‐05 0.23 N/A 0.05 N/A 0.34 0.21 0.19 N/A 3.12 8.16 0.03 0.13Oct‐07 0.62 N/A N/A 3.38E‐05 0.24 N/A 0.05 N/A 0.34 0.21 0.19 N/A 3.18 8.31 0.03 0.14Nov‐07 0.38 N/A N/A 2.07E‐05 0.15 N/A 0.03 N/A 0.21 0.13 0.12 N/A 1.95 5.10 0.02 0.08Dec‐07 0.48 N/A N/A 2.61E‐05 0.18 N/A 0.04 N/A 0.27 0.16 0.15 N/A 2.46 6.43 0.03 0.10Jan‐08 0.23 N/A N/A 1.39E‐05 0.09 N/A 0.02 N/A 0.13 0.08 0.07 N/A 1.20 3.42 0.01 0.05Feb‐08 0.48 N/A N/A 2.85E‐05 0.18 N/A 0.04 N/A 0.27 0.16 0.15 N/A 2.47 7.02 0.03 0.11Mar‐08 0.21 N/A N/A 1.26E‐05 0.08 N/A 0.02 N/A 0.12 0.07 0.07 N/A 1.09 3.09 0.01 0.05Apr‐08 0.77 N/A N/A 4.58E‐05 0.30 N/A 0.06 N/A 0.43 0.26 0.24 N/A 3.96 11.26 0.04 0.17May‐08 0.81 N/A N/A 4.83E‐05 0.31 N/A 0.07 N/A 0.45 0.27 0.25 N/A 4.18 11.88 0.04 0.18Jun‐08 0.68 N/A N/A 4.07E‐05 0.26 N/A 0.06 N/A 0.38 0.23 0.21 N/A 3.52 10.00 0.04 0.15Jul‐08 0.79 N/A N/A 4.70E‐05 0.30 N/A 0.07 N/A 0.44 0.27 0.24 N/A 4.06 11.55 0.04 0.17Aug‐08 0.98 N/A N/A 5.85E‐05 0.38 N/A 0.08 N/A 0.55 0.33 0.30 N/A 5.06 14.39 0.05 0.22Sep‐08 0.34 N/A N/A 2.05E‐05 0.13 N/A 0.03 N/A 0.19 0.12 0.11 N/A 1.77 5.04 0.02 0.08Oct‐08 0.32 N/A N/A 1.88E‐05 0.12 N/A 0.03 N/A 0.18 0.11 0.10 N/A 1.63 4.63 0.02 0.07Nov‐08 0.73 N/A N/A 4.32E‐05 0.28 N/A 0.06 N/A 0.41 0.25 0.22 N/A 3.74 10.63 0.04 0.16Dec‐08 0.54 N/A N/A 3.23E‐05 0.21 N/A 0.05 N/A 0.30 0.18 0.17 N/A 2.79 7.93 0.03 0.12Jan‐09 0.47 N/A N/A 2.97E‐05 0.18 N/A 0.04 N/A 0.26 0.16 0.15 N/A 2.41 7.30 0.03 0.10Feb‐09 0.57 N/A N/A 3.58E‐05 0.22 N/A 0.05 N/A 0.32 0.19 0.18 N/A 2.92 8.81 0.03 0.12Mar‐09 0.70 N/A N/A 4.46E‐05 0.27 N/A 0.06 N/A 0.39 0.24 0.22 N/A 3.62 10.96 0.04 0.15Apr‐09 0.84 N/A N/A 5.30E‐05 0.32 N/A 0.07 N/A 0.47 0.28 0.26 N/A 4.31 13.03 0.05 0.18May‐09 0.63 N/A N/A 3.98E‐05 0.24 N/A 0.06 N/A 0.35 0.21 0.19 N/A 3.24 9.79 0.03 0.14Jun‐09 0.66 N/A N/A 4.19E‐05 0.25 N/A 0.06 N/A 0.37 0.22 0.21 N/A 3.41 10.31 0.04 0.15Jul‐09 0.76 N/A N/A 4.82E‐05 0.29 N/A 0.07 N/A 0.43 0.26 0.24 N/A 3.92 11.86 0.04 0.17Aug‐09 0.78 N/A N/A 4.95E‐05 0.30 N/A 0.07 N/A 0.44 0.26 0.24 N/A 4.03 12.17 0.04 0.17Sep‐09 0.63 N/A N/A 3.95E‐05 0.24 N/A 0.06 N/A 0.35 0.21 0.19 N/A 3.22 9.72 0.03 0.14Oct‐09 0.78 N/A N/A 4.94E‐05 0.30 N/A 0.07 N/A 0.44 0.26 0.24 N/A 4.02 12.14 0.04 0.17Nov‐09 0.63 N/A N/A 4.00E‐05 0.24 N/A 0.06 N/A 0.35 0.21 0.20 N/A 3.25 9.83 0.03 0.14
TrinityConsultants Page5of37AugustaExpansionProjectEmissionsAnalysis(2012126JSFinalUpdates)
Kiln1Emissions

AppendixB‐EmissionCalculationsWestFraser‐Augusta,Georgia
TableB‐5.BaselineMonthlyEmissionsforKiln1(tonspermonth)
Month CO Fluorides H2S Lead NOX
ReducedSulfurCompounds
(includingH2S) SO2 H2SO4 TotalPM TotalPM10 TotalPM2.5
TotalReducedSulfur
(includingH2S) TotalVOC CO2ebiomassdeferral Formaldehyde Methanol
Dec‐09 0.57 N/A N/A 3.59E‐05 0.22 N/A 0.05 N/A 0.32 0.19 0.18 N/A 2.92 8.84 0.03 0.12Jan‐10 0.68 N/A N/A 4.77E‐05 0.26 N/A 0.07 N/A 0.38 0.23 0.21 N/A 3.47 11.72 0.04 0.15Feb‐10 0.40 N/A N/A 2.85E‐05 0.16 N/A 0.04 N/A 0.23 0.14 0.13 N/A 2.08 7.02 0.02 0.09Mar‐10 0.75 N/A N/A 5.27E‐05 0.29 N/A 0.07 N/A 0.42 0.25 0.23 N/A 3.84 12.95 0.04 0.16Apr‐10 0.81 N/A N/A 5.73E‐05 0.31 N/A 0.08 N/A 0.45 0.27 0.25 N/A 4.18 14.09 0.04 0.18May‐10 0.78 N/A N/A 5.51E‐05 0.30 N/A 0.08 N/A 0.44 0.26 0.24 N/A 4.02 13.55 0.04 0.17Jun‐10 0.83 N/A N/A 5.84E‐05 0.32 N/A 0.08 N/A 0.46 0.28 0.26 N/A 4.25 14.35 0.05 0.18Jul‐10 0.89 N/A N/A 6.27E‐05 0.34 N/A 0.09 N/A 0.49 0.30 0.27 N/A 4.57 15.41 0.05 0.19Aug‐10 0.00 N/A N/A 0.00E+00 0.00 N/A 0.00 N/A 0.00 0.00 0.00 N/A 0.00 0.00 0.00 0.00Sep‐10 0.46 N/A N/A 3.23E‐05 0.18 N/A 0.05 N/A 0.26 0.15 0.14 N/A 2.36 7.95 0.03 0.10Oct‐10 0.87 N/A N/A 6.13E‐05 0.33 N/A 0.09 N/A 0.48 0.29 0.27 N/A 4.47 15.07 0.05 0.19Nov‐10 0.64 N/A N/A 4.55E‐05 0.25 N/A 0.06 N/A 0.36 0.22 0.20 N/A 3.32 11.19 0.04 0.14Dec‐10 0.61 N/A N/A 4.33E‐05 0.24 N/A 0.06 N/A 0.34 0.21 0.19 N/A 3.15 10.64 0.03 0.13Jan‐11 0.73 N/A N/A 6.62E‐05 0.28 N/A 0.09 N/A 0.41 0.25 0.23 N/A 3.75 16.27 0.04 0.16Feb‐11 0.67 N/A N/A 6.11E‐05 0.26 N/A 0.09 N/A 0.38 0.23 0.21 N/A 3.46 15.01 0.04 0.15Mar‐11 0.87 N/A N/A 7.91E‐05 0.33 N/A 0.11 N/A 0.49 0.29 0.27 N/A 4.48 19.44 0.05 0.19Apr‐11 0.97 N/A N/A 8.80E‐05 0.37 N/A 0.12 N/A 0.54 0.33 0.30 N/A 4.99 21.63 0.05 0.21May‐11 1.02 N/A N/A 9.24E‐05 0.39 N/A 0.13 N/A 0.57 0.34 0.32 N/A 5.24 22.73 0.06 0.22Jun‐11 0.84 N/A N/A 7.65E‐05 0.32 N/A 0.11 N/A 0.47 0.29 0.26 N/A 4.34 18.80 0.05 0.18Jul‐11 0.68 N/A N/A 6.16E‐05 0.26 N/A 0.09 N/A 0.38 0.23 0.21 N/A 3.49 15.15 0.04 0.15Aug‐11 0.87 N/A N/A 7.86E‐05 0.33 N/A 0.11 N/A 0.48 0.29 0.27 N/A 4.45 19.31 0.05 0.19Sep‐11 0.57 N/A N/A 5.16E‐05 0.22 N/A 0.07 N/A 0.32 0.19 0.18 N/A 2.93 12.70 0.03 0.12Oct‐11 0.76 N/A N/A 6.88E‐05 0.29 N/A 0.10 N/A 0.42 0.26 0.23 N/A 3.90 16.93 0.04 0.17Nov‐11 0.37 N/A N/A 3.40E‐05 0.14 N/A 0.05 N/A 0.21 0.13 0.12 N/A 1.93 8.35 0.02 0.08Dec‐11 0.76 N/A N/A 6.88E‐05 0.29 N/A 0.10 N/A 0.42 0.26 0.23 N/A 3.90 16.92 0.04 0.17
1.Baselinemonthlyemissionsarecalculatedtwowaysdependingontheunitsoftheemissionfactorofinterest.
Iftheemissionfactorisinunitsoflb/MBF,thefollowingderivationisused:ActualEmissions[ton/month]=EmissionFactor[lb/MBF]*MonthlyKilnProduction[BF/month]/2,000lb/ton/1,000BF/MBFIftheemissionfactorisinunitsoflb/MMBtu,thefollowingderivationisused:ActualEmissions[ton/month]=EmissionFactor[lb/MMBtu]*MonthlyWoodCombusted[tons/month]*HeatingValue[4,500Btu/lbwoodcombusted]/1,000,000Btu/MMBtu
TrinityConsultants Page6of37AugustaExpansionProjectEmissionsAnalysis(2012126JSFinalUpdates)
Kiln1Emissions

AppendixB‐EmissionCalculationsWestFraser‐Augusta,Georgia
TableB‐6.Total24‐MonthRollingAverageActualAnnualEmissionsforKilns1(tpy)
CO Fluorides H2S Lead NOX
ReducedSulfurCompounds
(includingH2S) SO2 H2SO4 TotalPM TotalPM10 TotalPM2.5
TotalReducedSulfur
(includingH2S) TotalVOC CO2ebiomassdeferral Formaldehyde Methanol
Jan‐02 ‐ Dec‐03 8.41 N/A N/A 7.65E‐04 3.23 N/A 1.08 N/A 4.69 2.85 2.60 N/A 43.28 188.21 0.46 1.84Feb‐02 ‐ Jan‐04 8.44 N/A N/A 7.68E‐04 3.24 N/A 1.08 N/A 4.71 2.86 2.61 N/A 43.42 188.78 0.46 1.85Mar‐02 ‐ Feb‐04 8.43 N/A N/A 7.67E‐04 3.24 N/A 1.08 N/A 4.70 2.85 2.61 N/A 43.39 188.66 0.46 1.85Apr‐02 ‐ Mar‐04 8.37 N/A N/A 7.61E‐04 3.21 N/A 1.08 N/A 4.66 2.83 2.59 N/A 43.04 187.14 0.46 1.83May‐02 ‐ Apr‐04 8.40 N/A N/A 7.64E‐04 3.22 N/A 1.08 N/A 4.68 2.84 2.60 N/A 43.20 187.82 0.46 1.84Jun‐02 ‐ May‐04 8.41 N/A N/A 7.65E‐04 3.23 N/A 1.08 N/A 4.69 2.85 2.60 N/A 43.28 188.13 0.46 1.84Jul‐02 ‐ Jun‐04 8.41 N/A N/A 7.65E‐04 3.22 N/A 1.08 N/A 4.69 2.84 2.60 N/A 43.25 187.98 0.46 1.84Aug‐02 ‐ Jul‐04 8.15 N/A N/A 7.41E‐04 3.12 N/A 1.05 N/A 4.54 2.76 2.52 N/A 41.91 182.25 0.45 1.79Sep‐02 ‐ Aug‐04 8.30 N/A N/A 7.55E‐04 3.18 N/A 1.07 N/A 4.63 2.81 2.57 N/A 42.70 185.63 0.45 1.82Oct‐02 ‐ Sep‐04 8.36 N/A N/A 7.60E‐04 3.21 N/A 1.07 N/A 4.66 2.83 2.59 N/A 43.02 186.95 0.46 1.83Nov‐02 ‐ Oct‐04 8.41 N/A N/A 7.65E‐04 3.23 N/A 1.08 N/A 4.69 2.85 2.60 N/A 43.27 188.01 0.46 1.84Dec‐02 ‐ Nov‐04 8.40 N/A N/A 7.64E‐04 3.22 N/A 1.08 N/A 4.68 2.84 2.60 N/A 43.22 187.79 0.46 1.84Jan‐03 ‐ Dec‐04 8.54 N/A N/A 7.76E‐04 3.28 N/A 1.10 N/A 4.76 2.89 2.64 N/A 43.94 190.83 0.47 1.87Feb‐03 ‐ Jan‐05 8.59 N/A N/A 7.79E‐04 3.29 N/A 1.10 N/A 4.79 2.91 2.66 N/A 44.19 191.61 0.47 1.88Mar‐03 ‐ Feb‐05 8.58 N/A N/A 7.77E‐04 3.29 N/A 1.10 N/A 4.79 2.90 2.66 N/A 44.16 191.15 0.47 1.88Apr‐03 ‐ Mar‐05 8.65 N/A N/A 7.82E‐04 3.32 N/A 1.10 N/A 4.82 2.93 2.68 N/A 44.49 192.27 0.47 1.90May‐03 ‐ Apr‐05 8.72 N/A N/A 7.88E‐04 3.35 N/A 1.11 N/A 4.86 2.95 2.70 N/A 44.87 193.64 0.48 1.91Jun‐03 ‐ May‐05 8.73 N/A N/A 7.87E‐04 3.35 N/A 1.11 N/A 4.87 2.95 2.70 N/A 44.92 193.55 0.48 1.91Jul‐03 ‐ Jun‐05 8.79 N/A N/A 7.91E‐04 3.37 N/A 1.12 N/A 4.90 2.97 2.72 N/A 45.20 194.51 0.48 1.93Aug‐03 ‐ Jul‐05 8.90 N/A N/A 8.01E‐04 3.42 N/A 1.13 N/A 4.96 3.01 2.76 N/A 45.81 196.91 0.49 1.95Sep‐03 ‐ Aug‐05 9.00 N/A N/A 8.08E‐04 3.45 N/A 1.14 N/A 5.02 3.05 2.79 N/A 46.30 198.75 0.49 1.97Oct‐03 ‐ Sep‐05 9.12 N/A N/A 8.18E‐04 3.50 N/A 1.16 N/A 5.09 3.09 2.82 N/A 46.93 201.19 0.50 2.00Nov‐03 ‐ Oct‐05 9.16 N/A N/A 8.21E‐04 3.51 N/A 1.16 N/A 5.11 3.10 2.84 N/A 47.14 201.79 0.50 2.01Dec‐03 ‐ Nov‐05 9.27 N/A N/A 8.30E‐04 3.56 N/A 1.17 N/A 5.17 3.14 2.87 N/A 47.71 204.01 0.51 2.03Jan‐04 ‐ Dec‐05 9.46 N/A N/A 8.46E‐04 3.63 N/A 1.19 N/A 5.28 3.20 2.93 N/A 48.69 207.94 0.52 2.07Feb‐04 ‐ Jan‐06 9.59 N/A N/A 8.53E‐04 3.68 N/A 1.20 N/A 5.35 3.25 2.97 N/A 49.35 209.71 0.53 2.10Mar‐04 ‐ Feb‐06 9.66 N/A N/A 8.55E‐04 3.70 N/A 1.21 N/A 5.38 3.27 2.99 N/A 49.67 210.30 0.53 2.12Apr‐04 ‐ Mar‐06 9.98 N/A N/A 8.79E‐04 3.83 N/A 1.24 N/A 5.57 3.38 3.09 N/A 51.35 216.16 0.55 2.19May‐04 ‐ Apr‐06 10.11 N/A N/A 8.86E‐04 3.88 N/A 1.25 N/A 5.64 3.42 3.13 N/A 52.01 217.96 0.55 2.22Jun‐04 ‐ May‐06 10.34 N/A N/A 9.03E‐04 3.97 N/A 1.28 N/A 5.77 3.50 3.20 N/A 53.22 221.95 0.57 2.27Jul‐04 ‐ Jun‐06 10.49 N/A N/A 9.12E‐04 4.02 N/A 1.29 N/A 5.85 3.55 3.25 N/A 53.98 224.12 0.57 2.30Aug‐04 ‐ Jul‐06 10.85 N/A N/A 9.39E‐04 4.16 N/A 1.33 N/A 6.05 3.67 3.36 N/A 55.80 230.76 0.59 2.38Sep‐04 ‐ Aug‐06 10.81 N/A N/A 9.31E‐04 4.15 N/A 1.32 N/A 6.03 3.66 3.35 N/A 55.60 228.91 0.59 2.37Oct‐04 ‐ Sep‐06 10.86 N/A N/A 9.32E‐04 4.17 N/A 1.32 N/A 6.06 3.68 3.36 N/A 55.89 229.14 0.60 2.38Nov‐04 ‐ Oct‐06 10.84 N/A N/A 9.26E‐04 4.16 N/A 1.31 N/A 6.04 3.67 3.36 N/A 55.77 227.71 0.59 2.38Dec‐04 ‐ Nov‐06 10.79 N/A N/A 9.18E‐04 4.14 N/A 1.30 N/A 6.02 3.65 3.34 N/A 55.52 225.83 0.59 2.37Jan‐05 ‐ Dec‐06 10.66 N/A N/A 9.04E‐04 4.09 N/A 1.28 N/A 5.94 3.61 3.30 N/A 54.84 222.25 0.58 2.34Feb‐05 ‐ Jan‐07 10.59 N/A N/A 8.85E‐04 4.06 N/A 1.25 N/A 5.90 3.58 3.28 N/A 54.48 217.54 0.58 2.32Mar‐05 ‐ Feb‐07 10.46 N/A N/A 8.63E‐04 4.01 N/A 1.22 N/A 5.83 3.54 3.24 N/A 53.82 212.17 0.57 2.29Apr‐05 ‐ Mar‐07 10.30 N/A N/A 8.38E‐04 3.95 N/A 1.18 N/A 5.74 3.48 3.19 N/A 52.99 205.98 0.56 2.26May‐05 ‐ Apr‐07 10.13 N/A N/A 8.13E‐04 3.89 N/A 1.15 N/A 5.65 3.43 3.14 N/A 52.12 199.90 0.56 2.22Jun‐05 ‐ May‐07 10.09 N/A N/A 7.95E‐04 3.87 N/A 1.12 N/A 5.63 3.42 3.13 N/A 51.93 195.50 0.55 2.21Jul‐05 ‐ Jun‐07 10.07 N/A N/A 7.81E‐04 3.86 N/A 1.10 N/A 5.61 3.41 3.12 N/A 51.79 191.97 0.55 2.21Aug‐05 ‐ Jul‐07 9.99 N/A N/A 7.61E‐04 3.83 N/A 1.08 N/A 5.57 3.38 3.09 N/A 51.39 187.17 0.55 2.19Sep‐05 ‐ Aug‐07 10.08 N/A N/A 7.50E‐04 3.87 N/A 1.06 N/A 5.62 3.41 3.12 N/A 51.85 184.42 0.55 2.21Oct‐05 ‐ Sep‐07 9.92 N/A N/A 7.26E‐04 3.81 N/A 1.02 N/A 5.53 3.36 3.07 N/A 51.05 178.41 0.54 2.18Nov‐05 ‐ Oct‐07 9.78 N/A N/A 7.02E‐04 3.75 N/A 0.99 N/A 5.45 3.31 3.03 N/A 50.30 172.55 0.54 2.14Dec‐05 ‐ Nov‐07 9.55 N/A N/A 6.75E‐04 3.66 N/A 0.95 N/A 5.32 3.23 2.96 N/A 49.13 165.90 0.52 2.09
24MonthPeriod
TrinityConsultants Page7of37AugustaExpansionProjectEmissionsAnalysis(2012126JSFinalUpdates)
24‐MonRollingAvg‐Kiln1

AppendixB‐EmissionCalculationsWestFraser‐Augusta,Georgia
TableB‐6.Total24‐MonthRollingAverageActualAnnualEmissionsforKilns1(tpy)
CO Fluorides H2S Lead NOX
ReducedSulfurCompounds
(includingH2S) SO2 H2SO4 TotalPM TotalPM10 TotalPM2.5
TotalReducedSulfur
(includingH2S) TotalVOC CO2ebiomassdeferral Formaldehyde Methanol24MonthPeriod
Jan‐06 ‐ Dec‐07 9.27 N/A N/A 6.41E‐04 3.55 N/A 0.91 N/A 5.17 3.14 2.87 N/A 47.68 157.63 0.51 2.03Feb‐06 ‐ Jan‐08 8.92 N/A N/A 6.11E‐04 3.42 N/A 0.86 N/A 4.97 3.02 2.76 N/A 45.88 150.16 0.49 1.95Mar‐06 ‐ Feb‐08 8.80 N/A N/A 5.97E‐04 3.38 N/A 0.84 N/A 4.91 2.98 2.73 N/A 45.29 146.68 0.48 1.93Apr‐06 ‐ Mar‐08 8.33 N/A N/A 5.56E‐04 3.19 N/A 0.79 N/A 4.64 2.82 2.58 N/A 42.83 136.77 0.46 1.82May‐06 ‐ Apr‐08 8.27 N/A N/A 5.44E‐04 3.17 N/A 0.77 N/A 4.61 2.80 2.56 N/A 42.55 133.75 0.45 1.81Jun‐06 ‐ May‐08 8.16 N/A N/A 5.27E‐04 3.13 N/A 0.74 N/A 4.55 2.76 2.53 N/A 42.00 129.58 0.45 1.79Jul‐06 ‐ Jun‐08 8.02 N/A N/A 5.09E‐04 3.08 N/A 0.72 N/A 4.47 2.71 2.48 N/A 41.27 125.10 0.44 1.76Aug‐06 ‐ Jul‐08 7.93 N/A N/A 4.93E‐04 3.04 N/A 0.70 N/A 4.42 2.68 2.45 N/A 40.77 121.20 0.43 1.74Sep‐06 ‐ Aug‐08 7.97 N/A N/A 4.87E‐04 3.06 N/A 0.69 N/A 4.44 2.70 2.47 N/A 41.01 119.62 0.44 1.75Oct‐06 ‐ Sep‐08 7.68 N/A N/A 4.60E‐04 2.95 N/A 0.65 N/A 4.28 2.60 2.38 N/A 39.53 113.10 0.42 1.68Nov‐06 ‐ Oct‐08 7.43 N/A N/A 4.37E‐04 2.85 N/A 0.62 N/A 4.14 2.52 2.30 N/A 38.25 107.40 0.41 1.63Dec‐06 ‐ Nov‐08 7.45 N/A N/A 4.30E‐04 2.86 N/A 0.61 N/A 4.15 2.52 2.31 N/A 38.31 105.81 0.41 1.63Jan‐07 ‐ Dec‐08 7.41 N/A N/A 4.22E‐04 2.84 N/A 0.60 N/A 4.13 2.51 2.29 N/A 38.10 103.65 0.41 1.62Feb‐07 ‐ Jan‐09 7.27 N/A N/A 4.16E‐04 2.79 N/A 0.59 N/A 4.05 2.46 2.25 N/A 37.41 102.32 0.40 1.59Mar‐07 ‐ Feb‐09 7.26 N/A N/A 4.18E‐04 2.78 N/A 0.59 N/A 4.05 2.45 2.25 N/A 37.33 102.71 0.40 1.59Apr‐07 ‐ Mar‐09 7.30 N/A N/A 4.23E‐04 2.80 N/A 0.60 N/A 4.07 2.47 2.26 N/A 37.57 104.10 0.40 1.60May‐07 ‐ Apr‐09 7.45 N/A N/A 4.35E‐04 2.86 N/A 0.61 N/A 4.15 2.52 2.31 N/A 38.31 106.90 0.41 1.63Jun‐07 ‐ May‐09 7.34 N/A N/A 4.32E‐04 2.82 N/A 0.61 N/A 4.09 2.48 2.27 N/A 37.77 106.16 0.40 1.61Jul‐07 ‐ Jun‐09 7.33 N/A N/A 4.34E‐04 2.81 N/A 0.61 N/A 4.09 2.48 2.27 N/A 37.72 106.73 0.40 1.61Aug‐07 ‐ Jul‐09 7.35 N/A N/A 4.38E‐04 2.82 N/A 0.62 N/A 4.10 2.49 2.28 N/A 37.83 107.81 0.40 1.61Sep‐07 ‐ Aug‐09 7.20 N/A N/A 4.33E‐04 2.76 N/A 0.61 N/A 4.01 2.43 2.23 N/A 37.02 106.52 0.39 1.58Oct‐07 ‐ Sep‐09 7.20 N/A N/A 4.36E‐04 2.76 N/A 0.62 N/A 4.02 2.44 2.23 N/A 37.06 107.30 0.39 1.58Nov‐07 ‐ Oct‐09 7.29 N/A N/A 4.44E‐04 2.79 N/A 0.63 N/A 4.06 2.47 2.26 N/A 37.48 109.22 0.40 1.60Dec‐07 ‐ Nov‐09 7.41 N/A N/A 4.54E‐04 2.84 N/A 0.64 N/A 4.13 2.51 2.29 N/A 38.13 111.58 0.41 1.62Jan‐08 ‐ Dec‐09 7.46 N/A N/A 4.59E‐04 2.86 N/A 0.65 N/A 4.16 2.52 2.31 N/A 38.36 112.79 0.41 1.63Feb‐08 ‐ Jan‐10 7.68 N/A N/A 4.76E‐04 2.94 N/A 0.67 N/A 4.28 2.60 2.38 N/A 39.50 116.94 0.42 1.68Mar‐08 ‐ Feb‐10 7.64 N/A N/A 4.76E‐04 2.93 N/A 0.67 N/A 4.26 2.59 2.37 N/A 39.30 116.94 0.42 1.67Apr‐08 ‐ Mar‐10 7.91 N/A N/A 4.96E‐04 3.03 N/A 0.70 N/A 4.41 2.68 2.45 N/A 40.68 121.87 0.43 1.73May‐08 ‐ Apr‐10 7.93 N/A N/A 5.01E‐04 3.04 N/A 0.71 N/A 4.42 2.68 2.45 N/A 40.79 123.28 0.43 1.74Jun‐08 ‐ May‐10 7.91 N/A N/A 5.05E‐04 3.04 N/A 0.71 N/A 4.41 2.68 2.45 N/A 40.71 124.12 0.43 1.73Jul‐08 ‐ Jun‐10 7.98 N/A N/A 5.14E‐04 3.06 N/A 0.73 N/A 4.45 2.70 2.47 N/A 41.08 126.29 0.44 1.75Aug‐08 ‐ Jul‐10 8.03 N/A N/A 5.21E‐04 3.08 N/A 0.74 N/A 4.48 2.72 2.49 N/A 41.33 128.22 0.44 1.76Sep‐08 ‐ Aug‐10 7.54 N/A N/A 4.92E‐04 2.89 N/A 0.70 N/A 4.20 2.55 2.33 N/A 38.80 121.03 0.41 1.65Oct‐08 ‐ Sep‐10 7.60 N/A N/A 4.98E‐04 2.91 N/A 0.70 N/A 4.24 2.57 2.35 N/A 39.09 122.48 0.42 1.67Nov‐08 ‐ Oct‐10 7.87 N/A N/A 5.19E‐04 3.02 N/A 0.73 N/A 4.39 2.66 2.44 N/A 40.51 127.70 0.43 1.73Dec‐08 ‐ Nov‐10 7.83 N/A N/A 5.21E‐04 3.00 N/A 0.74 N/A 4.37 2.65 2.43 N/A 40.30 127.98 0.43 1.72Jan‐09 ‐ Dec‐10 7.87 N/A N/A 5.26E‐04 3.02 N/A 0.74 N/A 4.39 2.66 2.44 N/A 40.48 129.34 0.43 1.72Feb‐09 ‐ Jan‐11 8.00 N/A N/A 5.44E‐04 3.07 N/A 0.77 N/A 4.46 2.71 2.48 N/A 41.15 133.82 0.44 1.75Mar‐09 ‐ Feb‐11 8.05 N/A N/A 5.57E‐04 3.09 N/A 0.79 N/A 4.49 2.72 2.49 N/A 41.43 136.92 0.44 1.76Apr‐09 ‐ Mar‐11 8.14 N/A N/A 5.74E‐04 3.12 N/A 0.81 N/A 4.54 2.75 2.52 N/A 41.86 141.17 0.45 1.78May‐09 ‐ Apr‐11 8.20 N/A N/A 5.92E‐04 3.15 N/A 0.84 N/A 4.57 2.77 2.54 N/A 42.19 145.47 0.45 1.80Jun‐09 ‐ May‐11 8.40 N/A N/A 6.18E‐04 3.22 N/A 0.87 N/A 4.68 2.84 2.60 N/A 43.19 151.94 0.46 1.84Jul‐09 ‐ Jun‐11 8.49 N/A N/A 6.35E‐04 3.25 N/A 0.90 N/A 4.73 2.87 2.63 N/A 43.66 156.18 0.46 1.86Aug‐09 ‐ Jul‐11 8.44 N/A N/A 6.42E‐04 3.24 N/A 0.91 N/A 4.71 2.86 2.61 N/A 43.44 157.83 0.46 1.85Sep‐09 ‐ Aug‐11 8.49 N/A N/A 6.56E‐04 3.25 N/A 0.93 N/A 4.73 2.87 2.63 N/A 43.66 161.40 0.46 1.86Oct‐09 ‐ Sep‐11 8.46 N/A N/A 6.62E‐04 3.24 N/A 0.94 N/A 4.72 2.86 2.62 N/A 43.51 162.89 0.46 1.85Nov‐09 ‐ Oct‐11 8.45 N/A N/A 6.72E‐04 3.24 N/A 0.95 N/A 4.71 2.86 2.62 N/A 43.46 165.28 0.46 1.85Dec‐09 ‐ Nov‐11 8.32 N/A N/A 6.69E‐04 3.19 N/A 0.95 N/A 4.64 2.81 2.58 N/A 42.79 164.54 0.46 1.82Jan‐10 ‐ Dec‐11 8.41 N/A N/A 6.86E‐04 3.23 N/A 0.97 N/A 4.69 2.85 2.60 N/A 43.28 168.58 0.46 1.84
TrinityConsultants Page8of37AugustaExpansionProjectEmissionsAnalysis(2012126JSFinalUpdates)
24‐MonRollingAvg‐Kiln1

AppendixB‐EmissionCalculationsWestFraser‐Augusta,Georgia
TableB‐7.BaselineMonthlyEmissionsforKiln2(tonspermonth)
Month CO Fluorides H2S Lead NOX
ReducedSulfurCompounds
(includingH2S) SO2 H2SO4 TotalPM TotalPM10 TotalPM2.5
TotalReducedSulfur
(includingH2S) TotalVOC CO2ebiomassdeferral Formaldehyde Methanol
Jan‐02 1.28 N/A N/A 1.14E‐04 0.49 N/A 0.16 N/A 0.71 0.43 0.40 N/A 6.57 28.06 0.07 0.28Feb‐02 1.10 N/A N/A 9.85E‐05 0.42 N/A 0.14 N/A 0.61 0.37 0.34 N/A 5.67 24.21 0.06 0.24Mar‐02 1.12 N/A N/A 1.00E‐04 0.43 N/A 0.14 N/A 0.63 0.38 0.35 N/A 5.77 24.64 0.06 0.25Apr‐02 1.29 N/A N/A 1.15E‐04 0.49 N/A 0.16 N/A 0.72 0.44 0.40 N/A 6.64 28.33 0.07 0.28May‐02 1.37 N/A N/A 1.22E‐04 0.52 N/A 0.17 N/A 0.76 0.46 0.42 N/A 7.04 30.06 0.07 0.30Jun‐02 1.27 N/A N/A 1.14E‐04 0.49 N/A 0.16 N/A 0.71 0.43 0.39 N/A 6.55 27.95 0.07 0.28Jul‐02 0.85 N/A N/A 7.58E‐05 0.33 N/A 0.11 N/A 0.47 0.29 0.26 N/A 4.36 18.63 0.05 0.19Aug‐02 1.55 N/A N/A 1.38E‐04 0.59 N/A 0.20 N/A 0.86 0.52 0.48 N/A 7.97 34.02 0.08 0.34Sep‐02 1.29 N/A N/A 1.15E‐04 0.49 N/A 0.16 N/A 0.72 0.44 0.40 N/A 6.62 28.28 0.07 0.28Oct‐02 1.22 N/A N/A 1.09E‐04 0.47 N/A 0.15 N/A 0.68 0.41 0.38 N/A 6.30 26.88 0.07 0.27Nov‐02 1.19 N/A N/A 1.06E‐04 0.46 N/A 0.15 N/A 0.66 0.40 0.37 N/A 6.11 26.09 0.07 0.26Dec‐02 0.82 N/A N/A 7.35E‐05 0.32 N/A 0.10 N/A 0.46 0.28 0.25 N/A 4.23 18.07 0.05 0.18Jan‐03 0.99 N/A N/A 9.13E‐05 0.38 N/A 0.13 N/A 0.55 0.33 0.31 N/A 5.08 22.45 0.05 0.22Feb‐03 1.10 N/A N/A 1.02E‐04 0.42 N/A 0.14 N/A 0.61 0.37 0.34 N/A 5.67 25.04 0.06 0.24Mar‐03 1.11 N/A N/A 1.03E‐04 0.43 N/A 0.14 N/A 0.62 0.38 0.34 N/A 5.71 25.24 0.06 0.24Apr‐03 0.98 N/A N/A 9.05E‐05 0.38 N/A 0.13 N/A 0.55 0.33 0.30 N/A 5.04 22.26 0.05 0.21May‐03 1.37 N/A N/A 1.26E‐04 0.52 N/A 0.18 N/A 0.76 0.46 0.42 N/A 7.04 31.10 0.07 0.30Jun‐03 1.26 N/A N/A 1.17E‐04 0.48 N/A 0.16 N/A 0.70 0.43 0.39 N/A 6.48 28.66 0.07 0.28Jul‐03 1.29 N/A N/A 1.20E‐04 0.50 N/A 0.17 N/A 0.72 0.44 0.40 N/A 6.65 29.39 0.07 0.28Aug‐03 1.10 N/A N/A 1.02E‐04 0.42 N/A 0.14 N/A 0.61 0.37 0.34 N/A 5.66 25.03 0.06 0.24Sep‐03 1.06 N/A N/A 9.84E‐05 0.41 N/A 0.14 N/A 0.59 0.36 0.33 N/A 5.47 24.20 0.06 0.23Oct‐03 0.71 N/A N/A 6.54E‐05 0.27 N/A 0.09 N/A 0.39 0.24 0.22 N/A 3.64 16.08 0.04 0.15Nov‐03 1.31 N/A N/A 1.21E‐04 0.50 N/A 0.17 N/A 0.73 0.44 0.41 N/A 6.75 29.82 0.07 0.29Dec‐03 0.72 N/A N/A 6.69E‐05 0.28 N/A 0.09 N/A 0.40 0.24 0.22 N/A 3.72 16.44 0.04 0.16Jan‐04 1.07 N/A N/A 9.54E‐05 0.41 N/A 0.13 N/A 0.60 0.36 0.33 N/A 5.50 23.44 0.06 0.23Feb‐04 0.99 N/A N/A 8.82E‐05 0.38 N/A 0.12 N/A 0.55 0.33 0.31 N/A 5.09 21.70 0.05 0.22Mar‐04 1.48 N/A N/A 1.32E‐04 0.57 N/A 0.19 N/A 0.83 0.50 0.46 N/A 7.63 32.52 0.08 0.33Apr‐04 1.12 N/A N/A 9.97E‐05 0.43 N/A 0.14 N/A 0.62 0.38 0.35 N/A 5.75 24.51 0.06 0.25May‐04 1.56 N/A N/A 1.39E‐04 0.60 N/A 0.20 N/A 0.87 0.53 0.48 N/A 8.04 34.25 0.09 0.34Jun‐04 1.16 N/A N/A 1.04E‐04 0.45 N/A 0.15 N/A 0.65 0.39 0.36 N/A 5.97 25.45 0.06 0.25Jul‐04 0.59 N/A N/A 5.26E‐05 0.23 N/A 0.07 N/A 0.33 0.20 0.18 N/A 3.04 12.94 0.03 0.13Aug‐04 1.42 N/A N/A 1.26E‐04 0.54 N/A 0.18 N/A 0.79 0.48 0.44 N/A 7.29 31.04 0.08 0.31Sep‐04 0.85 N/A N/A 7.57E‐05 0.33 N/A 0.11 N/A 0.47 0.29 0.26 N/A 4.37 18.62 0.05 0.19Oct‐04 1.26 N/A N/A 1.12E‐04 0.48 N/A 0.16 N/A 0.70 0.43 0.39 N/A 6.48 27.61 0.07 0.28Nov‐04 1.06 N/A N/A 9.44E‐05 0.41 N/A 0.13 N/A 0.59 0.36 0.33 N/A 5.45 23.22 0.06 0.23Dec‐04 1.25 N/A N/A 1.11E‐04 0.48 N/A 0.16 N/A 0.70 0.42 0.39 N/A 6.42 27.37 0.07 0.27Jan‐05 1.13 N/A N/A 1.01E‐04 0.43 N/A 0.14 N/A 0.63 0.38 0.35 N/A 5.80 24.83 0.06 0.25Feb‐05 0.85 N/A N/A 7.57E‐05 0.32 N/A 0.11 N/A 0.47 0.29 0.26 N/A 4.35 18.62 0.05 0.19Mar‐05 1.44 N/A N/A 1.29E‐04 0.55 N/A 0.18 N/A 0.80 0.49 0.44 N/A 7.39 31.64 0.08 0.31Apr‐05 1.42 N/A N/A 1.28E‐04 0.55 N/A 0.18 N/A 0.79 0.48 0.44 N/A 7.33 31.35 0.08 0.31May‐05 1.29 N/A N/A 1.16E‐04 0.50 N/A 0.16 N/A 0.72 0.44 0.40 N/A 6.65 28.45 0.07 0.28Jun‐05 1.34 N/A N/A 1.20E‐04 0.52 N/A 0.17 N/A 0.75 0.45 0.42 N/A 6.91 29.57 0.07 0.29Jul‐05 1.43 N/A N/A 1.28E‐04 0.55 N/A 0.18 N/A 0.80 0.48 0.44 N/A 7.37 31.54 0.08 0.31Aug‐05 1.28 N/A N/A 1.14E‐04 0.49 N/A 0.16 N/A 0.71 0.43 0.40 N/A 6.56 28.10 0.07 0.28
TrinityConsultants Page9of37AugustaExpansionProjectEmissionsAnalysis(2012126JSFinalUpdates)
Kiln2Emissions

AppendixB‐EmissionCalculationsWestFraser‐Augusta,Georgia
TableB‐7.BaselineMonthlyEmissionsforKiln2(tonspermonth)
Month CO Fluorides H2S Lead NOX
ReducedSulfurCompounds
(includingH2S) SO2 H2SO4 TotalPM TotalPM10 TotalPM2.5
TotalReducedSulfur
(includingH2S) TotalVOC CO2ebiomassdeferral Formaldehyde Methanol
Sep‐05 1.23 N/A N/A 1.10E‐04 0.47 N/A 0.16 N/A 0.69 0.42 0.38 N/A 6.33 27.11 0.07 0.27Oct‐05 1.16 N/A N/A 1.04E‐04 0.45 N/A 0.15 N/A 0.65 0.39 0.36 N/A 5.99 25.64 0.06 0.26Nov‐05 0.95 N/A N/A 8.48E‐05 0.36 N/A 0.12 N/A 0.53 0.32 0.29 N/A 4.87 20.85 0.05 0.21Dec‐05 1.29 N/A N/A 1.15E‐04 0.49 N/A 0.16 N/A 0.72 0.44 0.40 N/A 6.63 28.36 0.07 0.28Jan‐06 1.06 N/A N/A 8.44E‐05 0.40 N/A 0.12 N/A 0.59 0.36 0.33 N/A 5.43 20.76 0.06 0.23Feb‐06 1.03 N/A N/A 8.24E‐05 0.40 N/A 0.12 N/A 0.57 0.35 0.32 N/A 5.30 20.26 0.06 0.23Mar‐06 1.46 N/A N/A 1.17E‐04 0.56 N/A 0.17 N/A 0.82 0.50 0.45 N/A 7.53 28.79 0.08 0.32Apr‐06 1.46 N/A N/A 1.17E‐04 0.56 N/A 0.17 N/A 0.82 0.49 0.45 N/A 7.52 28.77 0.08 0.32May‐06 1.30 N/A N/A 1.04E‐04 0.50 N/A 0.15 N/A 0.73 0.44 0.40 N/A 6.70 25.62 0.07 0.29Jun‐06 1.29 N/A N/A 1.03E‐04 0.49 N/A 0.15 N/A 0.72 0.44 0.40 N/A 6.64 25.38 0.07 0.28Jul‐06 1.04 N/A N/A 8.36E‐05 0.40 N/A 0.12 N/A 0.58 0.35 0.32 N/A 5.37 20.55 0.06 0.23Aug‐06 0.85 N/A N/A 6.83E‐05 0.33 N/A 0.10 N/A 0.48 0.29 0.26 N/A 4.39 16.80 0.05 0.19Sep‐06 0.35 N/A N/A 2.82E‐05 0.14 N/A 0.04 N/A 0.20 0.12 0.11 N/A 1.82 6.94 0.02 0.08Oct‐06 0.60 N/A N/A 4.81E‐05 0.23 N/A 0.07 N/A 0.34 0.20 0.19 N/A 3.09 11.83 0.03 0.13Nov‐06 0.90 N/A N/A 7.20E‐05 0.35 N/A 0.10 N/A 0.50 0.30 0.28 N/A 4.63 17.70 0.05 0.20Dec‐06 0.44 N/A N/A 3.52E‐05 0.17 N/A 0.05 N/A 0.25 0.15 0.14 N/A 2.26 8.65 0.02 0.10Jan‐07 1.01 N/A N/A 1.38E‐04 0.39 N/A 0.20 N/A 0.57 0.34 0.31 N/A 5.22 33.97 0.06 0.22Feb‐07 0.94 N/A N/A 1.28E‐04 0.36 N/A 0.18 N/A 0.52 0.32 0.29 N/A 4.84 31.47 0.05 0.21Mar‐07 0.86 N/A N/A 1.18E‐04 0.33 N/A 0.17 N/A 0.48 0.29 0.27 N/A 4.45 28.95 0.05 0.19Apr‐07 1.29 N/A N/A 1.75E‐04 0.49 N/A 0.25 N/A 0.72 0.44 0.40 N/A 6.62 43.09 0.07 0.28May‐07 0.31 N/A N/A 4.28E‐05 0.12 N/A 0.06 N/A 0.18 0.11 0.10 N/A 1.62 10.52 0.02 0.07Jun‐07 1.20 N/A N/A 1.64E‐04 0.46 N/A 0.23 N/A 0.67 0.41 0.37 N/A 6.19 40.26 0.07 0.26Jul‐07 1.25 N/A N/A 1.71E‐04 0.48 N/A 0.24 N/A 0.70 0.42 0.39 N/A 6.45 41.97 0.07 0.27Aug‐07 0.80 N/A N/A 1.09E‐04 0.31 N/A 0.15 N/A 0.44 0.27 0.25 N/A 4.10 26.68 0.04 0.17Sep‐07 1.31 N/A N/A 1.79E‐04 0.50 N/A 0.25 N/A 0.73 0.44 0.41 N/A 6.76 44.01 0.07 0.29Oct‐07 1.21 N/A N/A 1.65E‐04 0.46 N/A 0.23 N/A 0.67 0.41 0.37 N/A 6.22 40.49 0.07 0.27Nov‐07 0.66 N/A N/A 8.94E‐05 0.25 N/A 0.13 N/A 0.37 0.22 0.20 N/A 3.38 21.98 0.04 0.14Dec‐07 1.01 N/A N/A 1.38E‐04 0.39 N/A 0.19 N/A 0.57 0.34 0.31 N/A 5.21 33.93 0.06 0.22Jan‐08 1.15 N/A N/A 2.67E‐04 0.44 N/A 0.38 N/A 0.64 0.39 0.36 N/A 5.93 65.65 0.06 0.25Feb‐08 0.67 N/A N/A 1.55E‐04 0.26 N/A 0.22 N/A 0.37 0.23 0.21 N/A 3.45 38.18 0.04 0.15Mar‐08 0.90 N/A N/A 2.08E‐04 0.34 N/A 0.29 N/A 0.50 0.30 0.28 N/A 4.61 51.06 0.05 0.20Apr‐08 0.00 N/A N/A 0.00E+00 0.00 N/A 0.00 N/A 0.00 0.00 0.00 N/A 0.00 0.00 0.00 0.00May‐08 0.00 N/A N/A 0.00E+00 0.00 N/A 0.00 N/A 0.00 0.00 0.00 N/A 0.00 0.00 0.00 0.00Jun‐08 0.00 N/A N/A 0.00E+00 0.00 N/A 0.00 N/A 0.00 0.00 0.00 N/A 0.00 0.00 0.00 0.00Jul‐08 0.00 N/A N/A 0.00E+00 0.00 N/A 0.00 N/A 0.00 0.00 0.00 N/A 0.00 0.00 0.00 0.00Aug‐08 0.00 N/A N/A 0.00E+00 0.00 N/A 0.00 N/A 0.00 0.00 0.00 N/A 0.00 0.00 0.00 0.00Sep‐08 0.90 N/A N/A 2.09E‐04 0.35 N/A 0.30 N/A 0.50 0.31 0.28 N/A 4.65 51.45 0.05 0.20Oct‐08 1.06 N/A N/A 2.46E‐04 0.41 N/A 0.35 N/A 0.59 0.36 0.33 N/A 5.46 60.37 0.06 0.23Nov‐08 0.34 N/A N/A 7.87E‐05 0.13 N/A 0.11 N/A 0.19 0.12 0.11 N/A 1.75 19.36 0.02 0.07Dec‐08 0.30 N/A N/A 7.05E‐05 0.12 N/A 0.10 N/A 0.17 0.10 0.09 N/A 1.57 17.34 0.02 0.07Jan‐09 0.20 N/A N/A 4.92E‐05 0.08 N/A 0.07 N/A 0.11 0.07 0.06 N/A 1.04 12.10 0.01 0.04Feb‐09 0.00 N/A N/A 0.00E+00 0.00 N/A 0.00 N/A 0.00 0.00 0.00 N/A 0.00 0.00 0.00 0.00Mar‐09 0.81 N/A N/A 1.97E‐04 0.31 N/A 0.28 N/A 0.45 0.27 0.25 N/A 4.17 48.34 0.04 0.18Apr‐09 0.61 N/A N/A 1.48E‐04 0.23 N/A 0.21 N/A 0.34 0.21 0.19 N/A 3.13 36.28 0.03 0.13May‐09 0.71 N/A N/A 1.72E‐04 0.27 N/A 0.24 N/A 0.39 0.24 0.22 N/A 3.64 42.26 0.04 0.16Jun‐09 0.86 N/A N/A 2.09E‐04 0.33 N/A 0.30 N/A 0.48 0.29 0.27 N/A 4.43 51.35 0.05 0.19Jul‐09 0.41 N/A N/A 9.84E‐05 0.16 N/A 0.14 N/A 0.23 0.14 0.13 N/A 2.09 24.20 0.02 0.09Aug‐09 0.76 N/A N/A 1.84E‐04 0.29 N/A 0.26 N/A 0.42 0.26 0.24 N/A 3.91 45.36 0.04 0.17
TrinityConsultants Page10of37AugustaExpansionProjectEmissionsAnalysis(2012126JSFinalUpdates)
Kiln2Emissions

AppendixB‐EmissionCalculationsWestFraser‐Augusta,Georgia
TableB‐7.BaselineMonthlyEmissionsforKiln2(tonspermonth)
Month CO Fluorides H2S Lead NOX
ReducedSulfurCompounds
(includingH2S) SO2 H2SO4 TotalPM TotalPM10 TotalPM2.5
TotalReducedSulfur
(includingH2S) TotalVOC CO2ebiomassdeferral Formaldehyde Methanol
Sep‐09 0.46 N/A N/A 1.11E‐04 0.17 N/A 0.16 N/A 0.25 0.15 0.14 N/A 2.34 27.17 0.02 0.10Oct‐09 0.67 N/A N/A 1.62E‐04 0.26 N/A 0.23 N/A 0.37 0.23 0.21 N/A 3.43 39.82 0.04 0.15Nov‐09 0.41 N/A N/A 9.89E‐05 0.16 N/A 0.14 N/A 0.23 0.14 0.13 N/A 2.10 24.31 0.02 0.09Dec‐09 0.35 N/A N/A 8.61E‐05 0.14 N/A 0.12 N/A 0.20 0.12 0.11 N/A 1.83 21.18 0.02 0.08Jan‐10 0.23 N/A N/A 6.32E‐05 0.09 N/A 0.09 N/A 0.13 0.08 0.07 N/A 1.17 15.53 0.01 0.05Feb‐10 0.41 N/A N/A 1.13E‐04 0.16 N/A 0.16 N/A 0.23 0.14 0.13 N/A 2.10 27.84 0.02 0.09Mar‐10 1.17 N/A N/A 3.24E‐04 0.45 N/A 0.46 N/A 0.65 0.39 0.36 N/A 6.00 79.71 0.06 0.26Apr‐10 0.61 N/A N/A 1.70E‐04 0.23 N/A 0.24 N/A 0.34 0.21 0.19 N/A 3.14 41.72 0.03 0.13May‐10 0.77 N/A N/A 2.13E‐04 0.29 N/A 0.30 N/A 0.43 0.26 0.24 N/A 3.94 52.33 0.04 0.17Jun‐10 0.00 N/A N/A 0.00E+00 0.00 N/A 0.00 N/A 0.00 0.00 0.00 N/A 0.00 0.00 0.00 0.00Jul‐10 0.40 N/A N/A 1.11E‐04 0.15 N/A 0.16 N/A 0.22 0.14 0.12 N/A 2.05 27.27 0.02 0.09Aug‐10 1.22 N/A N/A 3.39E‐04 0.47 N/A 0.48 N/A 0.68 0.41 0.38 N/A 6.28 83.42 0.07 0.27Sep‐10 0.86 N/A N/A 2.39E‐04 0.33 N/A 0.34 N/A 0.48 0.29 0.27 N/A 4.43 58.86 0.05 0.19Oct‐10 1.06 N/A N/A 2.94E‐04 0.41 N/A 0.42 N/A 0.59 0.36 0.33 N/A 5.45 72.35 0.06 0.23Nov‐10 0.66 N/A N/A 1.84E‐04 0.25 N/A 0.26 N/A 0.37 0.22 0.20 N/A 3.40 45.20 0.04 0.15Dec‐10 0.96 N/A N/A 2.66E‐04 0.37 N/A 0.38 N/A 0.53 0.32 0.30 N/A 4.93 65.45 0.05 0.21Jan‐11 0.60 N/A N/A 1.43E‐04 0.23 N/A 0.20 N/A 0.34 0.20 0.19 N/A 3.10 35.27 0.03 0.13Feb‐11 1.09 N/A N/A 2.58E‐04 0.42 N/A 0.36 N/A 0.61 0.37 0.34 N/A 5.59 63.53 0.06 0.24Mar‐11 1.20 N/A N/A 2.85E‐04 0.46 N/A 0.40 N/A 0.67 0.41 0.37 N/A 6.17 70.19 0.07 0.26Apr‐11 1.01 N/A N/A 2.40E‐04 0.39 N/A 0.34 N/A 0.56 0.34 0.31 N/A 5.19 59.08 0.06 0.22May‐11 0.86 N/A N/A 2.04E‐04 0.33 N/A 0.29 N/A 0.48 0.29 0.27 N/A 4.41 50.17 0.05 0.19Jun‐11 1.04 N/A N/A 2.48E‐04 0.40 N/A 0.35 N/A 0.58 0.35 0.32 N/A 5.36 60.97 0.06 0.23Jul‐11 0.60 N/A N/A 1.43E‐04 0.23 N/A 0.20 N/A 0.33 0.20 0.19 N/A 3.09 35.12 0.03 0.13Aug‐11 0.39 N/A N/A 9.23E‐05 0.15 N/A 0.13 N/A 0.22 0.13 0.12 N/A 2.00 22.70 0.02 0.09Sep‐11 0.25 N/A N/A 6.02E‐05 0.10 N/A 0.09 N/A 0.14 0.09 0.08 N/A 1.30 14.81 0.01 0.06Oct‐11 0.79 N/A N/A 1.89E‐04 0.30 N/A 0.27 N/A 0.44 0.27 0.25 N/A 4.08 46.45 0.04 0.17Nov‐11 0.30 N/A N/A 7.19E‐05 0.12 N/A 0.10 N/A 0.17 0.10 0.09 N/A 1.56 17.69 0.02 0.07Dec‐11 0.55 N/A N/A 1.31E‐04 0.21 N/A 0.18 N/A 0.31 0.19 0.17 N/A 2.83 32.20 0.03 0.12
1.Baselinemonthlyemissionsarecalculatedtwowaysdependingontheunitsoftheemissionfactorofinterest.
Iftheemissionfactorisinunitsoflb/MBF,thefollowingderivationisused:ActualEmissions[ton/month]=EmissionFactor[lb/MBF]*MonthlyKilnProduction[BF/month]/2,000lb/ton/1,000BF/MBFIftheemissionfactorisinunitsoflb/MMBtu,thefollowingderivationisused:ActualEmissions[ton/month]=EmissionFactor[lb/MMBtu]*MonthlyWoodCombusted[tons/month]*HeatingValue[4,500Btu/lbwoodcombusted]/1,000,000Btu/MMBtu
TrinityConsultants Page11of37AugustaExpansionProjectEmissionsAnalysis(2012126JSFinalUpdates)
Kiln2Emissions

AppendixB‐EmissionCalculationsWestFraser‐Augusta,Georgia
TableB‐8.Total24‐MonthRollingAverageActualAnnualEmissionsforKiln2(tpy)
CO Fluorides H2S Lead NOX
ReducedSulfurCompounds
(includingH2S) SO2 H2SO4 TotalPM TotalPM10 TotalPM2.5
TotalReducedSulfur
(includingH2S) TotalVOC CO2ebiomassdeferral Formaldehyde Methanol
Jan‐02 ‐ Dec‐03 13.68 N/A N/A 1.24E‐03 5.25 N/A 1.75 N/A 7.63 4.63 4.23 N/A 70.37 305.47 0.75 3.00Feb‐02 ‐ Jan‐04 13.57 N/A N/A 1.23E‐03 5.21 N/A 1.74 N/A 7.57 4.59 4.20 N/A 69.83 303.16 0.74 2.98Mar‐02 ‐ Feb‐04 13.52 N/A N/A 1.23E‐03 5.18 N/A 1.73 N/A 7.54 4.57 4.19 N/A 69.55 301.90 0.74 2.96Apr‐02 ‐ Mar‐04 13.70 N/A N/A 1.24E‐03 5.25 N/A 1.76 N/A 7.64 4.64 4.24 N/A 70.48 305.84 0.75 3.00May‐02 ‐ Apr‐04 13.61 N/A N/A 1.24E‐03 5.22 N/A 1.75 N/A 7.59 4.61 4.21 N/A 70.04 303.93 0.75 2.98Jun‐02 ‐ May‐04 13.71 N/A N/A 1.24E‐03 5.26 N/A 1.76 N/A 7.64 4.64 4.24 N/A 70.54 306.03 0.75 3.01Jul‐02 ‐ Jun‐04 13.65 N/A N/A 1.24E‐03 5.24 N/A 1.75 N/A 7.61 4.62 4.23 N/A 70.25 304.78 0.75 2.99Aug‐02 ‐ Jul‐04 13.53 N/A N/A 1.23E‐03 5.19 N/A 1.73 N/A 7.54 4.58 4.19 N/A 69.59 301.94 0.74 2.96Sep‐02 ‐ Aug‐04 13.46 N/A N/A 1.22E‐03 5.16 N/A 1.73 N/A 7.50 4.55 4.17 N/A 69.25 300.45 0.74 2.95Oct‐02 ‐ Sep‐04 13.24 N/A N/A 1.20E‐03 5.08 N/A 1.70 N/A 7.38 4.48 4.10 N/A 68.12 295.61 0.73 2.90Nov‐02 ‐ Oct‐04 13.26 N/A N/A 1.20E‐03 5.09 N/A 1.70 N/A 7.39 4.49 4.10 N/A 68.21 295.98 0.73 2.91Dec‐02 ‐ Nov‐04 13.19 N/A N/A 1.20E‐03 5.06 N/A 1.69 N/A 7.36 4.46 4.08 N/A 67.88 294.54 0.72 2.89Jan‐03 ‐ Dec‐04 13.41 N/A N/A 1.22E‐03 5.14 N/A 1.72 N/A 7.48 4.54 4.15 N/A 68.98 299.18 0.73 2.94Feb‐03 ‐ Jan‐05 13.48 N/A N/A 1.22E‐03 5.17 N/A 1.73 N/A 7.51 4.56 4.17 N/A 69.34 300.37 0.74 2.95Mar‐03 ‐ Feb‐05 13.35 N/A N/A 1.21E‐03 5.12 N/A 1.71 N/A 7.44 4.52 4.13 N/A 68.68 297.16 0.73 2.93Apr‐03 ‐ Mar‐05 13.51 N/A N/A 1.22E‐03 5.18 N/A 1.73 N/A 7.53 4.57 4.18 N/A 69.52 300.36 0.74 2.96May‐03 ‐ Apr‐05 13.74 N/A N/A 1.24E‐03 5.27 N/A 1.75 N/A 7.66 4.65 4.25 N/A 70.67 304.90 0.75 3.01Jun‐03 ‐ May‐05 13.70 N/A N/A 1.23E‐03 5.25 N/A 1.74 N/A 7.64 4.63 4.24 N/A 70.47 303.58 0.75 3.00Jul‐03 ‐ Jun‐05 13.74 N/A N/A 1.24E‐03 5.27 N/A 1.75 N/A 7.66 4.65 4.25 N/A 70.68 304.04 0.75 3.01Aug‐03 ‐ Jul‐05 13.81 N/A N/A 1.24E‐03 5.30 N/A 1.75 N/A 7.70 4.67 4.28 N/A 71.04 305.11 0.76 3.03Sep‐03 ‐ Aug‐05 13.90 N/A N/A 1.25E‐03 5.33 N/A 1.76 N/A 7.75 4.70 4.30 N/A 71.50 306.65 0.76 3.05Oct‐03 ‐ Sep‐05 13.98 N/A N/A 1.25E‐03 5.36 N/A 1.77 N/A 7.79 4.73 4.33 N/A 71.92 308.10 0.77 3.06Nov‐03 ‐ Oct‐05 14.21 N/A N/A 1.27E‐03 5.45 N/A 1.80 N/A 7.92 4.81 4.40 N/A 73.10 312.88 0.78 3.11Dec‐03 ‐ Nov‐05 14.03 N/A N/A 1.25E‐03 5.38 N/A 1.77 N/A 7.82 4.75 4.34 N/A 72.16 308.40 0.77 3.07Jan‐04 ‐ Dec‐05 14.31 N/A N/A 1.28E‐03 5.49 N/A 1.81 N/A 7.98 4.84 4.43 N/A 73.62 314.35 0.78 3.14Feb‐04 ‐ Jan‐06 14.30 N/A N/A 1.27E‐03 5.49 N/A 1.80 N/A 7.97 4.84 4.43 N/A 73.58 313.01 0.78 3.13Mar‐04 ‐ Feb‐06 14.32 N/A N/A 1.27E‐03 5.49 N/A 1.79 N/A 7.99 4.85 4.43 N/A 73.68 312.29 0.78 3.14Apr‐04 ‐ Mar‐06 14.31 N/A N/A 1.26E‐03 5.49 N/A 1.78 N/A 7.98 4.84 4.43 N/A 73.63 310.43 0.78 3.14May‐04 ‐ Apr‐06 14.48 N/A N/A 1.27E‐03 5.56 N/A 1.80 N/A 8.08 4.90 4.48 N/A 74.52 312.56 0.79 3.17Jun‐04 ‐ May‐06 14.35 N/A N/A 1.25E‐03 5.51 N/A 1.77 N/A 8.00 4.86 4.44 N/A 73.85 308.25 0.79 3.15Jul‐04 ‐ Jun‐06 14.42 N/A N/A 1.25E‐03 5.53 N/A 1.77 N/A 8.04 4.88 4.46 N/A 74.18 308.21 0.79 3.16Aug‐04 ‐ Jul‐06 14.65 N/A N/A 1.27E‐03 5.62 N/A 1.79 N/A 8.17 4.96 4.53 N/A 75.34 312.02 0.80 3.21Sep‐04 ‐ Aug‐06 14.36 N/A N/A 1.24E‐03 5.51 N/A 1.75 N/A 8.01 4.86 4.45 N/A 73.90 304.90 0.79 3.15Oct‐04 ‐ Sep‐06 14.12 N/A N/A 1.22E‐03 5.41 N/A 1.72 N/A 7.87 4.78 4.37 N/A 72.62 299.06 0.77 3.09Nov‐04 ‐ Oct‐06 13.79 N/A N/A 1.18E‐03 5.29 N/A 1.67 N/A 7.69 4.66 4.27 N/A 70.93 291.17 0.76 3.02Dec‐04 ‐ Nov‐06 13.71 N/A N/A 1.17E‐03 5.26 N/A 1.66 N/A 7.64 4.64 4.24 N/A 70.52 288.41 0.75 3.00Jan‐05 ‐ Dec‐06 13.30 N/A N/A 1.13E‐03 5.10 N/A 1.60 N/A 7.42 4.50 4.12 N/A 68.44 279.05 0.73 2.92Feb‐05 ‐ Jan‐07 13.25 N/A N/A 1.15E‐03 5.08 N/A 1.63 N/A 7.38 4.48 4.10 N/A 68.14 283.62 0.73 2.90Mar‐05 ‐ Feb‐07 13.29 N/A N/A 1.18E‐03 5.10 N/A 1.67 N/A 7.41 4.50 4.12 N/A 68.39 290.05 0.73 2.91Apr‐05 ‐ Mar‐07 13.01 N/A N/A 1.17E‐03 4.99 N/A 1.66 N/A 7.25 4.40 4.03 N/A 66.92 288.71 0.71 2.85May‐05 ‐ Apr‐07 12.94 N/A N/A 1.20E‐03 4.96 N/A 1.69 N/A 7.21 4.38 4.01 N/A 66.56 294.58 0.71 2.84Jun‐05 ‐ May‐07 12.45 N/A N/A 1.16E‐03 4.78 N/A 1.64 N/A 6.94 4.21 3.85 N/A 64.05 285.61 0.68 2.73Jul‐05 ‐ Jun‐07 12.38 N/A N/A 1.18E‐03 4.75 N/A 1.67 N/A 6.90 4.19 3.83 N/A 63.69 290.96 0.68 2.71Aug‐05 ‐ Jul‐07 12.29 N/A N/A 1.20E‐03 4.71 N/A 1.70 N/A 6.85 4.16 3.80 N/A 63.23 296.17 0.67 2.69Sep‐05 ‐ Aug‐07 12.05 N/A N/A 1.20E‐03 4.62 N/A 1.70 N/A 6.72 4.08 3.73 N/A 61.99 295.46 0.66 2.64Oct‐05 ‐ Sep‐07 12.09 N/A N/A 1.24E‐03 4.64 N/A 1.75 N/A 6.74 4.09 3.74 N/A 62.21 303.91 0.66 2.65Nov‐05 ‐ Oct‐07 12.11 N/A N/A 1.27E‐03 4.65 N/A 1.79 N/A 6.75 4.10 3.75 N/A 62.32 311.34 0.66 2.66Dec‐05 ‐ Nov‐07 11.97 N/A N/A 1.27E‐03 4.59 N/A 1.79 N/A 6.67 4.05 3.71 N/A 61.58 311.90 0.66 2.62
24MonthPeriod
TrinityConsultants Page12of37AugustaExpansionProjectEmissionsAnalysis(2012126JSFinalUpdates)
24‐MonRollingAvg‐Kiln2

AppendixB‐EmissionCalculationsWestFraser‐Augusta,Georgia
TableB‐8.Total24‐MonthRollingAverageActualAnnualEmissionsforKiln2(tpy)
CO Fluorides H2S Lead NOX
ReducedSulfurCompounds
(includingH2S) SO2 H2SO4 TotalPM TotalPM10 TotalPM2.5
TotalReducedSulfur
(includingH2S) TotalVOC CO2ebiomassdeferral Formaldehyde Methanol24MonthPeriod
Jan‐06 ‐ Dec‐07 11.83 N/A N/A 1.28E‐03 4.54 N/A 1.81 N/A 6.60 4.00 3.66 N/A 60.87 314.69 0.65 2.59Feb‐06 ‐ Jan‐08 11.88 N/A N/A 1.37E‐03 4.56 N/A 1.94 N/A 6.62 4.02 3.68 N/A 61.12 337.14 0.65 2.60Mar‐06 ‐ Feb‐08 11.70 N/A N/A 1.41E‐03 4.49 N/A 1.99 N/A 6.52 3.96 3.62 N/A 60.20 346.09 0.64 2.56Apr‐06 ‐ Mar‐08 11.42 N/A N/A 1.45E‐03 4.38 N/A 2.05 N/A 6.37 3.86 3.53 N/A 58.74 357.23 0.63 2.50May‐06 ‐ Apr‐08 10.69 N/A N/A 1.39E‐03 4.10 N/A 1.97 N/A 5.96 3.62 3.31 N/A 54.98 342.84 0.59 2.34Jun‐06 ‐ May‐08 10.04 N/A N/A 1.34E‐03 3.85 N/A 1.90 N/A 5.60 3.40 3.11 N/A 51.63 330.03 0.55 2.20Jul‐06 ‐ Jun‐08 9.39 N/A N/A 1.29E‐03 3.60 N/A 1.82 N/A 5.24 3.18 2.91 N/A 48.31 317.34 0.51 2.06Aug‐06 ‐ Jul‐08 8.87 N/A N/A 1.25E‐03 3.40 N/A 1.76 N/A 4.94 3.00 2.75 N/A 45.62 307.06 0.49 1.94Sep‐06 ‐ Aug‐08 8.44 N/A N/A 1.21E‐03 3.24 N/A 1.72 N/A 4.71 2.86 2.61 N/A 43.43 298.67 0.46 1.85Oct‐06 ‐ Sep‐08 8.72 N/A N/A 1.31E‐03 3.34 N/A 1.84 N/A 4.86 2.95 2.70 N/A 44.84 320.92 0.48 1.91Nov‐06 ‐ Oct‐08 8.95 N/A N/A 1.40E‐03 3.43 N/A 1.98 N/A 4.99 3.03 2.77 N/A 46.02 345.19 0.49 1.96Dec‐06 ‐ Nov‐08 8.67 N/A N/A 1.41E‐03 3.32 N/A 1.99 N/A 4.83 2.93 2.68 N/A 44.58 346.02 0.47 1.90Jan‐07 ‐ Dec‐08 8.60 N/A N/A 1.42E‐03 3.30 N/A 2.01 N/A 4.79 2.91 2.66 N/A 44.24 350.36 0.47 1.88Feb‐07 ‐ Jan‐09 8.19 N/A N/A 1.38E‐03 3.14 N/A 1.95 N/A 4.57 2.77 2.54 N/A 42.15 339.42 0.45 1.80Mar‐07 ‐ Feb‐09 7.72 N/A N/A 1.32E‐03 2.96 N/A 1.86 N/A 4.31 2.61 2.39 N/A 39.73 323.69 0.42 1.69Apr‐07 ‐ Mar‐09 7.70 N/A N/A 1.36E‐03 2.95 N/A 1.92 N/A 4.29 2.60 2.38 N/A 39.59 333.39 0.42 1.69May‐07 ‐ Apr‐09 7.36 N/A N/A 1.34E‐03 2.82 N/A 1.90 N/A 4.10 2.49 2.28 N/A 37.84 329.98 0.40 1.61Jun‐07 ‐ May‐09 7.55 N/A N/A 1.41E‐03 2.90 N/A 1.99 N/A 4.21 2.56 2.34 N/A 38.86 345.85 0.41 1.66Jul‐07 ‐ Jun‐09 7.38 N/A N/A 1.43E‐03 2.83 N/A 2.02 N/A 4.12 2.50 2.29 N/A 37.98 351.40 0.40 1.62Aug‐07 ‐ Jul‐09 6.96 N/A N/A 1.39E‐03 2.67 N/A 1.97 N/A 3.88 2.35 2.15 N/A 35.80 342.51 0.38 1.53Sep‐07 ‐ Aug‐09 6.94 N/A N/A 1.43E‐03 2.66 N/A 2.02 N/A 3.87 2.35 2.15 N/A 35.70 351.85 0.38 1.52Oct‐07 ‐ Sep‐09 6.51 N/A N/A 1.40E‐03 2.50 N/A 1.97 N/A 3.63 2.20 2.02 N/A 33.49 343.43 0.36 1.43Nov‐07 ‐ Oct‐09 6.24 N/A N/A 1.40E‐03 2.39 N/A 1.97 N/A 3.48 2.11 1.93 N/A 32.10 343.09 0.34 1.37Dec‐07 ‐ Nov‐09 6.11 N/A N/A 1.40E‐03 2.35 N/A 1.98 N/A 3.41 2.07 1.89 N/A 31.46 344.26 0.34 1.34Jan‐08 ‐ Dec‐09 5.78 N/A N/A 1.37E‐03 2.22 N/A 1.94 N/A 3.23 1.96 1.79 N/A 29.76 337.88 0.32 1.27Feb‐08 ‐ Jan‐10 5.32 N/A N/A 1.27E‐03 2.04 N/A 1.80 N/A 2.97 1.80 1.65 N/A 27.38 312.82 0.29 1.17Mar‐08 ‐ Feb‐10 5.19 N/A N/A 1.25E‐03 1.99 N/A 1.77 N/A 2.89 1.76 1.61 N/A 26.70 307.65 0.28 1.14Apr‐08 ‐ Mar‐10 5.33 N/A N/A 1.31E‐03 2.04 N/A 1.85 N/A 2.97 1.80 1.65 N/A 27.40 321.98 0.29 1.17May‐08 ‐ Apr‐10 5.63 N/A N/A 1.39E‐03 2.16 N/A 1.97 N/A 3.14 1.91 1.74 N/A 28.97 342.84 0.31 1.23Jun‐08 ‐ May‐10 6.01 N/A N/A 1.50E‐03 2.31 N/A 2.12 N/A 3.35 2.03 1.86 N/A 30.94 369.01 0.33 1.32Jul‐08 ‐ Jun‐10 6.01 N/A N/A 1.50E‐03 2.31 N/A 2.12 N/A 3.35 2.03 1.86 N/A 30.94 369.01 0.33 1.32Aug‐08 ‐ Jul‐10 6.21 N/A N/A 1.56E‐03 2.38 N/A 2.20 N/A 3.46 2.10 1.92 N/A 31.97 382.64 0.34 1.36Sep‐08 ‐ Aug‐10 6.82 N/A N/A 1.73E‐03 2.62 N/A 2.44 N/A 3.80 2.31 2.11 N/A 35.11 424.35 0.37 1.50Oct‐08 ‐ Sep‐10 6.80 N/A N/A 1.74E‐03 2.61 N/A 2.46 N/A 3.79 2.30 2.11 N/A 35.00 428.06 0.37 1.49Nov‐08 ‐ Oct‐10 6.80 N/A N/A 1.77E‐03 2.61 N/A 2.49 N/A 3.79 2.30 2.11 N/A 35.00 434.05 0.37 1.49Dec‐08 ‐ Nov‐10 6.96 N/A N/A 1.82E‐03 2.67 N/A 2.57 N/A 3.88 2.36 2.16 N/A 35.83 446.97 0.38 1.53Jan‐09 ‐ Dec‐10 7.29 N/A N/A 1.92E‐03 2.80 N/A 2.71 N/A 4.06 2.47 2.26 N/A 37.51 471.03 0.40 1.60Feb‐09 ‐ Jan‐11 7.49 N/A N/A 1.96E‐03 2.87 N/A 2.77 N/A 4.18 2.53 2.32 N/A 38.54 482.61 0.41 1.64Mar‐09 ‐ Feb‐11 8.03 N/A N/A 2.09E‐03 3.08 N/A 2.95 N/A 4.48 2.72 2.49 N/A 41.33 514.38 0.44 1.76Apr‐09 ‐ Mar‐11 8.23 N/A N/A 2.14E‐03 3.16 N/A 3.02 N/A 4.59 2.78 2.55 N/A 42.33 525.30 0.45 1.80May‐09 ‐ Apr‐11 8.43 N/A N/A 2.18E‐03 3.23 N/A 3.08 N/A 4.70 2.85 2.61 N/A 43.37 536.70 0.46 1.85Jun‐09 ‐ May‐11 8.50 N/A N/A 2.20E‐03 3.26 N/A 3.11 N/A 4.74 2.88 2.63 N/A 43.75 540.65 0.47 1.86Jul‐09 ‐ Jun‐11 8.59 N/A N/A 2.22E‐03 3.30 N/A 3.13 N/A 4.79 2.91 2.66 N/A 44.22 545.46 0.47 1.88Aug‐09 ‐ Jul‐11 8.69 N/A N/A 2.24E‐03 3.33 N/A 3.16 N/A 4.85 2.94 2.69 N/A 44.72 550.93 0.48 1.91Sep‐09 ‐ Aug‐11 8.51 N/A N/A 2.19E‐03 3.26 N/A 3.10 N/A 4.74 2.88 2.63 N/A 43.76 539.60 0.47 1.86Oct‐09 ‐ Sep‐11 8.40 N/A N/A 2.17E‐03 3.22 N/A 3.06 N/A 4.69 2.84 2.60 N/A 43.24 533.41 0.46 1.84Nov‐09 ‐ Oct‐11 8.47 N/A N/A 2.18E‐03 3.25 N/A 3.08 N/A 4.72 2.87 2.62 N/A 43.56 536.73 0.46 1.86Dec‐09 ‐ Nov‐11 8.42 N/A N/A 2.17E‐03 3.23 N/A 3.06 N/A 4.69 2.85 2.61 N/A 43.29 533.42 0.46 1.84Jan‐10 ‐ Dec‐11 8.51 N/A N/A 2.19E‐03 3.27 N/A 3.10 N/A 4.75 2.88 2.64 N/A 43.80 538.93 0.47 1.87
TrinityConsultants Page13of37AugustaExpansionProjectEmissionsAnalysis(2012126JSFinalUpdates)
24‐MonRollingAvg‐Kiln2

AppendixB‐EmissionCalculationsWestFraser‐Augusta,Georgia
TableB‐9.BaselineMonthlyEmissionsforKiln3(tonspermonth)
Month CO Fluorides H2S Lead NOX
ReducedSulfurCompounds
(includingH2S) SO2 H2SO4 TotalPM TotalPM10 TotalPM2.5
TotalReducedSulfur
(includingH2S) TotalVOC CO2ebiomassdeferral Formaldehyde Methanol
Jan‐02 2.13 N/A N/A 1.90E‐04 0.82 N/A 0.27 N/A 1.19 0.72 0.66 N/A 10.96 46.79 0.12 0.47Feb‐02 1.98 N/A N/A 1.77E‐04 0.76 N/A 0.25 N/A 1.10 0.67 0.61 N/A 10.17 43.43 0.11 0.43Mar‐02 2.22 N/A N/A 1.98E‐04 0.85 N/A 0.28 N/A 1.24 0.75 0.69 N/A 11.42 48.77 0.12 0.49Apr‐02 2.07 N/A N/A 1.85E‐04 0.80 N/A 0.26 N/A 1.16 0.70 0.64 N/A 10.67 45.54 0.11 0.45May‐02 2.32 N/A N/A 2.07E‐04 0.89 N/A 0.29 N/A 1.29 0.78 0.72 N/A 11.93 50.94 0.13 0.51Jun‐02 2.15 N/A N/A 1.92E‐04 0.82 N/A 0.27 N/A 1.20 0.73 0.67 N/A 11.06 47.21 0.12 0.47Jul‐02 2.05 N/A N/A 1.83E‐04 0.79 N/A 0.26 N/A 1.14 0.69 0.64 N/A 10.56 45.10 0.11 0.45Aug‐02 2.15 N/A N/A 1.92E‐04 0.83 N/A 0.27 N/A 1.20 0.73 0.67 N/A 11.07 47.26 0.12 0.47Sep‐02 1.76 N/A N/A 1.57E‐04 0.68 N/A 0.22 N/A 0.98 0.60 0.55 N/A 9.06 38.70 0.10 0.39Oct‐02 1.98 N/A N/A 1.77E‐04 0.76 N/A 0.25 N/A 1.10 0.67 0.61 N/A 10.19 43.52 0.11 0.43Nov‐02 1.99 N/A N/A 1.78E‐04 0.76 N/A 0.25 N/A 1.11 0.67 0.62 N/A 10.23 43.69 0.11 0.44Dec‐02 1.68 N/A N/A 1.50E‐04 0.64 N/A 0.21 N/A 0.93 0.57 0.52 N/A 8.62 36.82 0.09 0.37Jan‐03 2.49 N/A N/A 2.30E‐04 0.95 N/A 0.32 N/A 1.39 0.84 0.77 N/A 12.79 56.55 0.14 0.55Feb‐03 2.06 N/A N/A 1.90E‐04 0.79 N/A 0.27 N/A 1.15 0.70 0.64 N/A 10.59 46.80 0.11 0.45Mar‐03 1.76 N/A N/A 1.63E‐04 0.67 N/A 0.23 N/A 0.98 0.59 0.54 N/A 9.04 39.98 0.10 0.39Apr‐03 1.83 N/A N/A 1.69E‐04 0.70 N/A 0.24 N/A 1.02 0.62 0.57 N/A 9.39 41.51 0.10 0.40May‐03 2.06 N/A N/A 1.90E‐04 0.79 N/A 0.27 N/A 1.15 0.70 0.64 N/A 10.58 46.76 0.11 0.45Jun‐03 1.91 N/A N/A 1.77E‐04 0.73 N/A 0.25 N/A 1.06 0.65 0.59 N/A 9.82 43.40 0.10 0.42Jul‐03 1.59 N/A N/A 1.47E‐04 0.61 N/A 0.21 N/A 0.89 0.54 0.49 N/A 8.17 36.10 0.09 0.35Aug‐03 2.15 N/A N/A 1.98E‐04 0.82 N/A 0.28 N/A 1.20 0.73 0.66 N/A 11.04 48.79 0.12 0.47Sep‐03 2.07 N/A N/A 1.92E‐04 0.79 N/A 0.27 N/A 1.15 0.70 0.64 N/A 10.66 47.11 0.11 0.45Oct‐03 2.16 N/A N/A 2.00E‐04 0.83 N/A 0.28 N/A 1.20 0.73 0.67 N/A 11.10 49.07 0.12 0.47Nov‐03 1.77 N/A N/A 1.64E‐04 0.68 N/A 0.23 N/A 0.99 0.60 0.55 N/A 9.11 40.28 0.10 0.39Dec‐03 1.89 N/A N/A 1.74E‐04 0.72 N/A 0.25 N/A 1.05 0.64 0.58 N/A 9.70 42.89 0.10 0.41Jan‐04 2.24 N/A N/A 1.99E‐04 0.86 N/A 0.28 N/A 1.25 0.76 0.69 N/A 11.50 48.98 0.12 0.49Feb‐04 1.90 N/A N/A 1.70E‐04 0.73 N/A 0.24 N/A 1.06 0.64 0.59 N/A 9.79 41.68 0.10 0.42Mar‐04 1.86 N/A N/A 1.65E‐04 0.71 N/A 0.23 N/A 1.03 0.63 0.57 N/A 9.55 40.66 0.10 0.41Apr‐04 2.18 N/A N/A 1.94E‐04 0.84 N/A 0.27 N/A 1.21 0.74 0.67 N/A 11.21 47.75 0.12 0.48May‐04 1.86 N/A N/A 1.66E‐04 0.71 N/A 0.23 N/A 1.04 0.63 0.58 N/A 9.58 40.82 0.10 0.41Jun‐04 2.23 N/A N/A 1.99E‐04 0.85 N/A 0.28 N/A 1.24 0.75 0.69 N/A 11.46 48.83 0.12 0.49Jul‐04 0.85 N/A N/A 7.57E‐05 0.33 N/A 0.11 N/A 0.47 0.29 0.26 N/A 4.37 18.60 0.05 0.19Aug‐04 0.24 N/A N/A 2.15E‐05 0.09 N/A 0.03 N/A 0.13 0.08 0.07 N/A 1.24 5.28 0.01 0.05Sep‐04 1.91 N/A N/A 1.70E‐04 0.73 N/A 0.24 N/A 1.06 0.65 0.59 N/A 9.83 41.85 0.10 0.42Oct‐04 2.06 N/A N/A 1.84E‐04 0.79 N/A 0.26 N/A 1.15 0.70 0.64 N/A 10.62 45.25 0.11 0.45Nov‐04 1.75 N/A N/A 1.56E‐04 0.67 N/A 0.22 N/A 0.97 0.59 0.54 N/A 8.98 38.26 0.10 0.38Dec‐04 1.88 N/A N/A 1.68E‐04 0.72 N/A 0.24 N/A 1.05 0.64 0.58 N/A 9.68 41.25 0.10 0.41Jan‐05 1.99 N/A N/A 1.78E‐04 0.76 N/A 0.25 N/A 1.11 0.67 0.62 N/A 10.24 43.83 0.11 0.44Feb‐05 1.91 N/A N/A 1.71E‐04 0.73 N/A 0.24 N/A 1.06 0.65 0.59 N/A 9.83 42.05 0.10 0.42Mar‐05 2.12 N/A N/A 1.90E‐04 0.81 N/A 0.27 N/A 1.18 0.72 0.66 N/A 10.91 46.70 0.12 0.46Apr‐05 2.37 N/A N/A 2.12E‐04 0.91 N/A 0.30 N/A 1.32 0.80 0.73 N/A 12.20 52.23 0.13 0.52May‐05 2.60 N/A N/A 2.33E‐04 1.00 N/A 0.33 N/A 1.45 0.88 0.81 N/A 13.40 57.33 0.14 0.57Jun‐05 1.99 N/A N/A 1.79E‐04 0.76 N/A 0.25 N/A 1.11 0.67 0.62 N/A 10.26 43.91 0.11 0.44Jul‐05 2.49 N/A N/A 2.23E‐04 0.95 N/A 0.31 N/A 1.39 0.84 0.77 N/A 12.81 54.81 0.14 0.55Aug‐05 2.40 N/A N/A 2.15E‐04 0.92 N/A 0.30 N/A 1.34 0.81 0.74 N/A 12.35 52.85 0.13 0.53Sep‐05 2.40 N/A N/A 2.15E‐04 0.92 N/A 0.30 N/A 1.34 0.81 0.74 N/A 12.33 52.75 0.13 0.53
TrinityConsultants Page14of37AugustaExpansionProjectEmissionsAnalysis(2012126JSFinalUpdates)
Kiln3Emissions

AppendixB‐EmissionCalculationsWestFraser‐Augusta,Georgia
TableB‐9.BaselineMonthlyEmissionsforKiln3(tonspermonth)
Month CO Fluorides H2S Lead NOX
ReducedSulfurCompounds
(includingH2S) SO2 H2SO4 TotalPM TotalPM10 TotalPM2.5
TotalReducedSulfur
(includingH2S) TotalVOC CO2ebiomassdeferral Formaldehyde Methanol
Oct‐05 2.28 N/A N/A 2.05E‐04 0.88 N/A 0.29 N/A 1.27 0.77 0.71 N/A 11.75 50.28 0.13 0.50Nov‐05 1.91 N/A N/A 1.71E‐04 0.73 N/A 0.24 N/A 1.06 0.64 0.59 N/A 9.81 41.97 0.10 0.42Dec‐05 2.63 N/A N/A 2.36E‐04 1.01 N/A 0.33 N/A 1.47 0.89 0.82 N/A 13.55 57.98 0.14 0.58Jan‐06 2.21 N/A N/A 1.77E‐04 0.85 N/A 0.25 N/A 1.23 0.75 0.68 N/A 11.36 43.43 0.12 0.48Feb‐06 1.91 N/A N/A 1.53E‐04 0.73 N/A 0.22 N/A 1.06 0.65 0.59 N/A 9.81 37.53 0.10 0.42Mar‐06 2.70 N/A N/A 2.16E‐04 1.04 N/A 0.31 N/A 1.51 0.91 0.84 N/A 13.89 53.12 0.15 0.59Apr‐06 2.14 N/A N/A 1.71E‐04 0.82 N/A 0.24 N/A 1.19 0.72 0.66 N/A 11.01 42.12 0.12 0.47May‐06 2.70 N/A N/A 2.16E‐04 1.04 N/A 0.31 N/A 1.51 0.91 0.84 N/A 13.90 53.14 0.15 0.59Jun‐06 2.30 N/A N/A 1.84E‐04 0.88 N/A 0.26 N/A 1.28 0.78 0.71 N/A 11.81 45.18 0.13 0.50Jul‐06 2.46 N/A N/A 1.97E‐04 0.94 N/A 0.28 N/A 1.37 0.83 0.76 N/A 12.67 48.43 0.13 0.54Aug‐06 2.14 N/A N/A 1.71E‐04 0.82 N/A 0.24 N/A 1.19 0.72 0.66 N/A 11.01 42.09 0.12 0.47Sep‐06 2.16 N/A N/A 1.73E‐04 0.83 N/A 0.24 N/A 1.21 0.73 0.67 N/A 11.12 42.53 0.12 0.47Oct‐06 1.68 N/A N/A 1.34E‐04 0.64 N/A 0.19 N/A 0.93 0.57 0.52 N/A 8.62 32.98 0.09 0.37Nov‐06 1.83 N/A N/A 1.46E‐04 0.70 N/A 0.21 N/A 1.02 0.62 0.57 N/A 9.42 36.01 0.10 0.40Dec‐06 1.82 N/A N/A 1.45E‐04 0.70 N/A 0.21 N/A 1.01 0.61 0.56 N/A 9.35 35.74 0.10 0.40Jan‐07 1.91 N/A N/A 1.04E‐04 0.73 N/A 0.15 N/A 1.07 0.65 0.59 N/A 9.83 25.69 0.10 0.42Feb‐07 1.90 N/A N/A 1.04E‐04 0.73 N/A 0.15 N/A 1.06 0.64 0.59 N/A 9.79 25.57 0.10 0.42Mar‐07 2.00 N/A N/A 1.09E‐04 0.77 N/A 0.15 N/A 1.11 0.68 0.62 N/A 10.27 26.83 0.11 0.44Apr‐07 1.99 N/A N/A 1.09E‐04 0.76 N/A 0.15 N/A 1.11 0.67 0.62 N/A 10.24 26.74 0.11 0.44May‐07 2.70 N/A N/A 1.47E‐04 1.03 N/A 0.21 N/A 1.50 0.91 0.83 N/A 13.87 36.23 0.15 0.59Jun‐07 2.39 N/A N/A 1.31E‐04 0.92 N/A 0.18 N/A 1.33 0.81 0.74 N/A 12.29 32.10 0.13 0.52Jul‐07 2.40 N/A N/A 1.31E‐04 0.92 N/A 0.19 N/A 1.34 0.81 0.74 N/A 12.34 32.24 0.13 0.53Aug‐07 2.78 N/A N/A 1.52E‐04 1.07 N/A 0.21 N/A 1.55 0.94 0.86 N/A 14.31 37.39 0.15 0.61Sep‐07 1.91 N/A N/A 1.04E‐04 0.73 N/A 0.15 N/A 1.06 0.65 0.59 N/A 9.81 25.63 0.10 0.42Oct‐07 2.22 N/A N/A 1.22E‐04 0.85 N/A 0.17 N/A 1.24 0.75 0.69 N/A 11.44 29.89 0.12 0.49Nov‐07 2.37 N/A N/A 1.30E‐04 0.91 N/A 0.18 N/A 1.32 0.80 0.73 N/A 12.20 31.88 0.13 0.52Dec‐07 1.51 N/A N/A 8.27E‐05 0.58 N/A 0.12 N/A 0.84 0.51 0.47 N/A 7.79 20.34 0.08 0.33Jan‐08 2.24 N/A N/A 1.33E‐04 0.86 N/A 0.19 N/A 1.25 0.76 0.69 N/A 11.50 32.72 0.12 0.49Feb‐08 1.83 N/A N/A 1.09E‐04 0.70 N/A 0.15 N/A 1.02 0.62 0.57 N/A 9.43 26.81 0.10 0.40Mar‐08 1.82 N/A N/A 1.08E‐04 0.70 N/A 0.15 N/A 1.02 0.62 0.56 N/A 9.37 26.65 0.10 0.40Apr‐08 2.14 N/A N/A 1.27E‐04 0.82 N/A 0.18 N/A 1.19 0.72 0.66 N/A 10.99 31.26 0.12 0.47May‐08 2.36 N/A N/A 1.41E‐04 0.91 N/A 0.20 N/A 1.32 0.80 0.73 N/A 12.17 34.60 0.13 0.52Jun‐08 2.23 N/A N/A 1.33E‐04 0.85 N/A 0.19 N/A 1.24 0.75 0.69 N/A 11.46 32.58 0.12 0.49Jul‐08 2.62 N/A N/A 1.56E‐04 1.00 N/A 0.22 N/A 1.46 0.89 0.81 N/A 13.47 38.31 0.14 0.57Aug‐08 2.94 N/A N/A 1.75E‐04 1.13 N/A 0.25 N/A 1.64 1.00 0.91 N/A 15.13 43.04 0.16 0.64Sep‐08 2.32 N/A N/A 1.38E‐04 0.89 N/A 0.19 N/A 1.29 0.78 0.72 N/A 11.92 33.90 0.13 0.51Oct‐08 1.83 N/A N/A 1.09E‐04 0.70 N/A 0.15 N/A 1.02 0.62 0.57 N/A 9.39 26.71 0.10 0.40Nov‐08 1.99 N/A N/A 1.18E‐04 0.76 N/A 0.17 N/A 1.11 0.67 0.62 N/A 10.24 29.12 0.11 0.44Dec‐08 1.36 N/A N/A 8.09E‐05 0.52 N/A 0.11 N/A 0.76 0.46 0.42 N/A 6.99 19.88 0.07 0.30Jan‐09 1.41 N/A N/A 8.93E‐05 0.54 N/A 0.13 N/A 0.79 0.48 0.44 N/A 7.27 21.96 0.08 0.31Feb‐09 1.58 N/A N/A 1.00E‐04 0.61 N/A 0.14 N/A 0.88 0.54 0.49 N/A 8.15 24.64 0.09 0.35Mar‐09 2.23 N/A N/A 1.41E‐04 0.86 N/A 0.20 N/A 1.24 0.75 0.69 N/A 11.47 34.67 0.12 0.49Apr‐09 2.55 N/A N/A 1.61E‐04 0.98 N/A 0.23 N/A 1.42 0.86 0.79 N/A 13.13 39.67 0.14 0.56May‐09 2.15 N/A N/A 1.36E‐04 0.82 N/A 0.19 N/A 1.20 0.73 0.67 N/A 11.05 33.41 0.12 0.47Jun‐09 2.15 N/A N/A 1.36E‐04 0.82 N/A 0.19 N/A 1.20 0.73 0.67 N/A 11.06 33.42 0.12 0.47Jul‐09 2.24 N/A N/A 1.42E‐04 0.86 N/A 0.20 N/A 1.25 0.76 0.69 N/A 11.54 34.88 0.12 0.49Aug‐09 2.00 N/A N/A 1.26E‐04 0.77 N/A 0.18 N/A 1.12 0.68 0.62 N/A 10.29 31.10 0.11 0.44Sep‐09 1.76 N/A N/A 1.11E‐04 0.68 N/A 0.16 N/A 0.98 0.60 0.55 N/A 9.06 27.39 0.10 0.39Oct‐09 2.32 N/A N/A 1.47E‐04 0.89 N/A 0.21 N/A 1.30 0.79 0.72 N/A 11.95 36.13 0.13 0.51Nov‐09 1.99 N/A N/A 1.26E‐04 0.77 N/A 0.18 N/A 1.11 0.67 0.62 N/A 10.26 31.02 0.11 0.44
TrinityConsultants Page15of37AugustaExpansionProjectEmissionsAnalysis(2012126JSFinalUpdates)
Kiln3Emissions

AppendixB‐EmissionCalculationsWestFraser‐Augusta,Georgia
TableB‐9.BaselineMonthlyEmissionsforKiln3(tonspermonth)
Month CO Fluorides H2S Lead NOX
ReducedSulfurCompounds
(includingH2S) SO2 H2SO4 TotalPM TotalPM10 TotalPM2.5
TotalReducedSulfur
(includingH2S) TotalVOC CO2ebiomassdeferral Formaldehyde Methanol
Dec‐09 1.83 N/A N/A 1.16E‐04 0.70 N/A 0.16 N/A 1.02 0.62 0.57 N/A 9.44 28.53 0.10 0.40Jan‐10 2.06 N/A N/A 1.46E‐04 0.79 N/A 0.21 N/A 1.15 0.70 0.64 N/A 10.62 35.84 0.11 0.45Feb‐10 1.19 N/A N/A 8.43E‐05 0.46 N/A 0.12 N/A 0.67 0.40 0.37 N/A 6.14 20.72 0.07 0.26Mar‐10 1.75 N/A N/A 1.23E‐04 0.67 N/A 0.17 N/A 0.97 0.59 0.54 N/A 8.99 30.34 0.10 0.38Apr‐10 2.72 N/A N/A 1.92E‐04 1.04 N/A 0.27 N/A 1.52 0.92 0.84 N/A 13.99 47.21 0.15 0.60May‐10 2.47 N/A N/A 1.74E‐04 0.95 N/A 0.25 N/A 1.38 0.84 0.76 N/A 12.71 42.88 0.14 0.54Jun‐10 2.46 N/A N/A 1.74E‐04 0.94 N/A 0.25 N/A 1.37 0.83 0.76 N/A 12.67 42.74 0.13 0.54Jul‐10 2.40 N/A N/A 1.69E‐04 0.92 N/A 0.24 N/A 1.34 0.81 0.74 N/A 12.34 41.64 0.13 0.53Aug‐10 2.23 N/A N/A 1.58E‐04 0.86 N/A 0.22 N/A 1.24 0.76 0.69 N/A 11.48 38.74 0.12 0.49Sep‐10 2.22 N/A N/A 1.57E‐04 0.85 N/A 0.22 N/A 1.24 0.75 0.69 N/A 11.45 38.62 0.12 0.49Oct‐10 2.09 N/A N/A 1.47E‐04 0.80 N/A 0.21 N/A 1.16 0.71 0.65 N/A 10.74 36.24 0.11 0.46Nov‐10 1.67 N/A N/A 1.18E‐04 0.64 N/A 0.17 N/A 0.93 0.56 0.52 N/A 8.57 28.91 0.09 0.37Dec‐10 2.25 N/A N/A 1.59E‐04 0.86 N/A 0.22 N/A 1.25 0.76 0.70 N/A 11.56 39.02 0.12 0.49Jan‐11 2.07 N/A N/A 1.88E‐04 0.80 N/A 0.27 N/A 1.16 0.70 0.64 N/A 10.67 46.26 0.11 0.45Feb‐11 2.01 N/A N/A 1.82E‐04 0.77 N/A 0.26 N/A 1.12 0.68 0.62 N/A 10.32 44.76 0.11 0.44Mar‐11 2.09 N/A N/A 1.90E‐04 0.80 N/A 0.27 N/A 1.17 0.71 0.65 N/A 10.78 46.73 0.11 0.46Apr‐11 2.25 N/A N/A 2.04E‐04 0.86 N/A 0.29 N/A 1.25 0.76 0.70 N/A 11.55 50.09 0.12 0.49May‐11 2.34 N/A N/A 2.12E‐04 0.90 N/A 0.30 N/A 1.30 0.79 0.72 N/A 12.02 52.12 0.13 0.51Jun‐11 2.08 N/A N/A 1.89E‐04 0.80 N/A 0.27 N/A 1.16 0.70 0.64 N/A 10.70 46.41 0.11 0.46Jul‐11 1.85 N/A N/A 1.68E‐04 0.71 N/A 0.24 N/A 1.03 0.63 0.57 N/A 9.50 41.21 0.10 0.40Aug‐11 2.08 N/A N/A 1.89E‐04 0.80 N/A 0.27 N/A 1.16 0.70 0.64 N/A 10.70 46.40 0.11 0.46Sep‐11 1.60 N/A N/A 1.45E‐04 0.61 N/A 0.20 N/A 0.89 0.54 0.50 N/A 8.23 35.68 0.09 0.35Oct‐11 2.09 N/A N/A 1.89E‐04 0.80 N/A 0.27 N/A 1.16 0.71 0.65 N/A 10.73 46.54 0.11 0.46Nov‐11 0.96 N/A N/A 8.72E‐05 0.37 N/A 0.12 N/A 0.54 0.33 0.30 N/A 4.94 21.44 0.05 0.21Dec‐11 2.07 N/A N/A 1.88E‐04 0.79 N/A 0.26 N/A 1.15 0.70 0.64 N/A 10.63 46.10 0.11 0.45
1.Baselinemonthlyemissionsarecalculatedtwowaysdependingontheunitsoftheemissionfactorofinterest.
Iftheemissionfactorisinunitsoflb/MBF,thefollowingderivationisused:ActualEmissions[ton/month]=EmissionFactor[lb/MBF]*MonthlyKilnProduction[BF/month]/2,000lb/ton/1,000BF/MBFIftheemissionfactorisinunitsoflb/MMBtu,thefollowingderivationisused:ActualEmissions[ton/month]=EmissionFactor[lb/MMBtu]*MonthlyWoodCombusted[tons/month]*HeatingValue[4,500Btu/lbwoodcombusted]/1,000,000Btu/MMBtu
TrinityConsultants Page16of37AugustaExpansionProjectEmissionsAnalysis(2012126JSFinalUpdates)
Kiln3Emissions

AppendixB‐EmissionCalculationsWestFraser‐Augusta,Georgia
TableB‐10.Total24‐MonthRollingAverageActualAnnualEmissionsforKiln3(tpy)
CO Fluorides H2S Lead NOX
ReducedSulfurCompounds
(includingH2S) SO2 H2SO4 TotalPM TotalPM10 TotalPM2.5
TotalReducedSulfur
(includingH2S) TotalVOC CO2ebiomassdeferral Formaldehyde Methanol
Jan‐02 ‐ Dec‐03 24.10 N/A N/A 2.19E‐03 9.24 N/A 3.09 N/A 13.44 8.15 7.46 N/A 123.98 538.49 1.32 5.28Feb‐02 ‐ Jan‐04 24.15 N/A N/A 2.19E‐03 9.26 N/A 3.10 N/A 13.46 8.17 7.48 N/A 124.25 539.59 1.32 5.29Mar‐02 ‐ Feb‐04 24.11 N/A N/A 2.19E‐03 9.25 N/A 3.09 N/A 13.44 8.16 7.47 N/A 124.05 538.72 1.32 5.29Apr‐02 ‐ Mar‐04 23.93 N/A N/A 2.17E‐03 9.18 N/A 3.07 N/A 13.34 8.10 7.41 N/A 123.11 534.66 1.31 5.25May‐02 ‐ Apr‐04 23.98 N/A N/A 2.18E‐03 9.20 N/A 3.08 N/A 13.37 8.11 7.43 N/A 123.39 535.77 1.31 5.26Jun‐02 ‐ May‐04 23.76 N/A N/A 2.16E‐03 9.11 N/A 3.05 N/A 13.24 8.04 7.35 N/A 122.21 530.70 1.30 5.21Jul‐02 ‐ Jun‐04 23.79 N/A N/A 2.16E‐03 9.13 N/A 3.05 N/A 13.27 8.05 7.37 N/A 122.41 531.52 1.30 5.22Aug‐02 ‐ Jul‐04 23.19 N/A N/A 2.11E‐03 8.90 N/A 2.98 N/A 12.93 7.85 7.18 N/A 119.32 518.27 1.27 5.08Sep‐02 ‐ Aug‐04 22.24 N/A N/A 2.02E‐03 8.53 N/A 2.86 N/A 12.40 7.52 6.88 N/A 114.40 497.28 1.22 4.87Oct‐02 ‐ Sep‐04 22.31 N/A N/A 2.03E‐03 8.56 N/A 2.87 N/A 12.44 7.55 6.91 N/A 114.78 498.86 1.22 4.89Nov‐02 ‐ Oct‐04 22.35 N/A N/A 2.03E‐03 8.57 N/A 2.87 N/A 12.46 7.56 6.92 N/A 115.00 499.72 1.22 4.90Dec‐02 ‐ Nov‐04 22.23 N/A N/A 2.02E‐03 8.53 N/A 2.86 N/A 12.39 7.52 6.88 N/A 114.37 497.01 1.22 4.87Jan‐03 ‐ Dec‐04 22.33 N/A N/A 2.03E‐03 8.57 N/A 2.87 N/A 12.45 7.56 6.91 N/A 114.90 499.23 1.22 4.90Feb‐03 ‐ Jan‐05 22.09 N/A N/A 2.00E‐03 8.47 N/A 2.83 N/A 12.31 7.47 6.84 N/A 113.62 492.86 1.21 4.84Mar‐03 ‐ Feb‐05 22.01 N/A N/A 1.99E‐03 8.44 N/A 2.82 N/A 12.27 7.45 6.81 N/A 113.24 490.49 1.21 4.82Apr‐03 ‐ Mar‐05 22.19 N/A N/A 2.01E‐03 8.51 N/A 2.84 N/A 12.37 7.51 6.87 N/A 114.18 493.85 1.22 4.86May‐03 ‐ Apr‐05 22.47 N/A N/A 2.03E‐03 8.62 N/A 2.87 N/A 12.53 7.60 6.96 N/A 115.58 499.21 1.23 4.92Jun‐03 ‐ May‐05 22.74 N/A N/A 2.05E‐03 8.72 N/A 2.90 N/A 12.68 7.69 7.04 N/A 116.99 504.50 1.25 4.98Jul‐03 ‐ Jun‐05 22.78 N/A N/A 2.05E‐03 8.74 N/A 2.90 N/A 12.70 7.71 7.05 N/A 117.21 504.75 1.25 4.99Aug‐03 ‐ Jul‐05 23.23 N/A N/A 2.09E‐03 8.91 N/A 2.95 N/A 12.95 7.86 7.19 N/A 119.53 514.10 1.27 5.09Sep‐03 ‐ Aug‐05 23.36 N/A N/A 2.10E‐03 8.96 N/A 2.97 N/A 13.02 7.90 7.23 N/A 120.19 516.14 1.28 5.12Oct‐03 ‐ Sep‐05 23.52 N/A N/A 2.11E‐03 9.02 N/A 2.98 N/A 13.12 7.96 7.28 N/A 121.02 518.96 1.29 5.16Nov‐03 ‐ Oct‐05 23.59 N/A N/A 2.11E‐03 9.05 N/A 2.98 N/A 13.15 7.98 7.30 N/A 121.34 519.57 1.29 5.17Dec‐03 ‐ Nov‐05 23.65 N/A N/A 2.12E‐03 9.07 N/A 2.99 N/A 13.19 8.00 7.32 N/A 121.69 520.41 1.30 5.18Jan‐04 ‐ Dec‐05 24.03 N/A N/A 2.15E‐03 9.22 N/A 3.03 N/A 13.40 8.13 7.44 N/A 123.61 527.96 1.32 5.27Feb‐04 ‐ Jan‐06 24.01 N/A N/A 2.14E‐03 9.21 N/A 3.02 N/A 13.39 8.13 7.43 N/A 123.54 525.19 1.32 5.26Mar‐04 ‐ Feb‐06 24.02 N/A N/A 2.13E‐03 9.21 N/A 3.01 N/A 13.39 8.13 7.44 N/A 123.56 523.11 1.32 5.26Apr‐04 ‐ Mar‐06 24.44 N/A N/A 2.15E‐03 9.37 N/A 3.04 N/A 13.63 8.27 7.57 N/A 125.73 529.34 1.34 5.36May‐04 ‐ Apr‐06 24.42 N/A N/A 2.14E‐03 9.37 N/A 3.02 N/A 13.62 8.26 7.56 N/A 125.63 526.52 1.34 5.35Jun‐04 ‐ May‐06 24.84 N/A N/A 2.17E‐03 9.53 N/A 3.06 N/A 13.85 8.40 7.69 N/A 127.79 532.68 1.36 5.44Jul‐04 ‐ Jun‐06 24.87 N/A N/A 2.16E‐03 9.54 N/A 3.05 N/A 13.87 8.42 7.70 N/A 127.97 530.85 1.36 5.45Aug‐04 ‐ Jul‐06 25.68 N/A N/A 2.22E‐03 9.85 N/A 3.14 N/A 14.32 8.69 7.95 N/A 132.11 545.77 1.41 5.63Sep‐04 ‐ Aug‐06 26.63 N/A N/A 2.29E‐03 10.21 N/A 3.24 N/A 14.85 9.01 8.24 N/A 137.00 564.17 1.46 5.84Oct‐04 ‐ Sep‐06 26.76 N/A N/A 2.30E‐03 10.26 N/A 3.24 N/A 14.92 9.05 8.28 N/A 137.65 564.51 1.47 5.86Nov‐04 ‐ Oct‐06 26.56 N/A N/A 2.27E‐03 10.19 N/A 3.21 N/A 14.81 8.99 8.22 N/A 136.65 558.37 1.46 5.82Dec‐04 ‐ Nov‐06 26.60 N/A N/A 2.27E‐03 10.20 N/A 3.20 N/A 14.83 9.00 8.24 N/A 136.87 557.25 1.46 5.83Jan‐05 ‐ Dec‐06 26.57 N/A N/A 2.26E‐03 10.19 N/A 3.19 N/A 14.81 8.99 8.23 N/A 136.70 554.50 1.46 5.82Feb‐05 ‐ Jan‐07 26.53 N/A N/A 2.22E‐03 10.18 N/A 3.13 N/A 14.79 8.98 8.21 N/A 136.49 545.43 1.45 5.82Mar‐05 ‐ Feb‐07 26.53 N/A N/A 2.18E‐03 10.18 N/A 3.09 N/A 14.79 8.98 8.21 N/A 136.48 537.19 1.45 5.81Apr‐05 ‐ Mar‐07 26.47 N/A N/A 2.14E‐03 10.15 N/A 3.03 N/A 14.76 8.95 8.19 N/A 136.15 527.25 1.45 5.80May‐05 ‐ Apr‐07 26.27 N/A N/A 2.09E‐03 10.08 N/A 2.96 N/A 14.65 8.89 8.13 N/A 135.17 514.50 1.44 5.76Jun‐05 ‐ May‐07 26.32 N/A N/A 2.05E‐03 10.10 N/A 2.90 N/A 14.67 8.91 8.15 N/A 135.41 503.96 1.44 5.77Jul‐05 ‐ Jun‐07 26.52 N/A N/A 2.03E‐03 10.17 N/A 2.86 N/A 14.78 8.97 8.21 N/A 136.42 498.05 1.45 5.81Aug‐05 ‐ Jul‐07 26.47 N/A N/A 1.98E‐03 10.15 N/A 2.80 N/A 14.76 8.96 8.20 N/A 136.19 486.76 1.45 5.80Sep‐05 ‐ Aug‐07 26.66 N/A N/A 1.95E‐03 10.23 N/A 2.75 N/A 14.87 9.02 8.25 N/A 137.17 479.03 1.46 5.84Oct‐05 ‐ Sep‐07 26.42 N/A N/A 1.89E‐03 10.13 N/A 2.67 N/A 14.73 8.94 8.18 N/A 135.91 465.47 1.45 5.79Nov‐05 ‐ Oct‐07 26.39 N/A N/A 1.85E‐03 10.12 N/A 2.62 N/A 14.71 8.93 8.17 N/A 135.76 455.27 1.45 5.78Dec‐05 ‐ Nov‐07 26.62 N/A N/A 1.83E‐03 10.21 N/A 2.59 N/A 14.84 9.01 8.24 N/A 136.95 450.23 1.46 5.83
24MonthPeriod
TrinityConsultants Page17of37AugustaExpansionProjectEmissionsAnalysis(2012126JSFinalUpdates)
24‐MonRollingAvg‐Kiln3

AppendixB‐EmissionCalculationsWestFraser‐Augusta,Georgia
TableB‐10.Total24‐MonthRollingAverageActualAnnualEmissionsforKiln3(tpy)
CO Fluorides H2S Lead NOX
ReducedSulfurCompounds
(includingH2S) SO2 H2SO4 TotalPM TotalPM10 TotalPM2.5
TotalReducedSulfur
(includingH2S) TotalVOC CO2ebiomassdeferral Formaldehyde Methanol24MonthPeriod
Jan‐06 ‐ Dec‐07 26.06 N/A N/A 1.75E‐03 10.00 N/A 2.48 N/A 14.53 8.82 8.07 N/A 134.07 431.41 1.43 5.71Feb‐06 ‐ Jan‐08 26.07 N/A N/A 1.73E‐03 10.00 N/A 2.45 N/A 14.54 8.82 8.07 N/A 134.15 426.05 1.43 5.72Mar‐06 ‐ Feb‐08 26.04 N/A N/A 1.71E‐03 9.99 N/A 2.42 N/A 14.52 8.81 8.06 N/A 133.95 420.69 1.43 5.71Apr‐06 ‐ Mar‐08 25.60 N/A N/A 1.66E‐03 9.82 N/A 2.34 N/A 14.27 8.66 7.92 N/A 131.69 407.45 1.40 5.61May‐06 ‐ Apr‐08 25.60 N/A N/A 1.64E‐03 9.82 N/A 2.31 N/A 14.27 8.66 7.92 N/A 131.68 402.02 1.40 5.61Jun‐06 ‐ May‐08 25.43 N/A N/A 1.60E‐03 9.75 N/A 2.26 N/A 14.18 8.60 7.87 N/A 130.81 392.75 1.39 5.57Jul‐06 ‐ Jun‐08 25.39 N/A N/A 1.57E‐03 9.74 N/A 2.22 N/A 14.16 8.59 7.86 N/A 130.63 386.46 1.39 5.57Aug‐06 ‐ Jul‐08 25.47 N/A N/A 1.55E‐03 9.77 N/A 2.19 N/A 14.20 8.62 7.89 N/A 131.04 381.40 1.40 5.58Sep‐06 ‐ Aug‐08 25.87 N/A N/A 1.55E‐03 9.92 N/A 2.19 N/A 14.42 8.75 8.01 N/A 133.10 381.87 1.42 5.67Oct‐06 ‐ Sep‐08 25.95 N/A N/A 1.54E‐03 9.95 N/A 2.17 N/A 14.47 8.78 8.03 N/A 133.50 377.56 1.42 5.69Nov‐06 ‐ Oct‐08 26.02 N/A N/A 1.52E‐03 9.98 N/A 2.15 N/A 14.51 8.81 8.06 N/A 133.88 374.43 1.43 5.70Dec‐06 ‐ Nov‐08 26.10 N/A N/A 1.51E‐03 10.01 N/A 2.13 N/A 14.55 8.83 8.08 N/A 134.29 370.98 1.43 5.72Jan‐07 ‐ Dec‐08 25.87 N/A N/A 1.48E‐03 9.92 N/A 2.09 N/A 14.43 8.75 8.01 N/A 133.11 363.05 1.42 5.67Feb‐07 ‐ Jan‐09 25.62 N/A N/A 1.47E‐03 9.83 N/A 2.07 N/A 14.29 8.67 7.93 N/A 131.83 361.18 1.40 5.62Mar‐07 ‐ Feb‐09 25.47 N/A N/A 1.47E‐03 9.77 N/A 2.07 N/A 14.20 8.62 7.88 N/A 131.01 360.72 1.40 5.58Apr‐07 ‐ Mar‐09 25.58 N/A N/A 1.48E‐03 9.81 N/A 2.09 N/A 14.26 8.66 7.92 N/A 131.61 364.64 1.40 5.61May‐07 ‐ Apr‐09 25.86 N/A N/A 1.51E‐03 9.92 N/A 2.13 N/A 14.42 8.75 8.01 N/A 133.06 371.11 1.42 5.67Jun‐07 ‐ May‐09 25.59 N/A N/A 1.50E‐03 9.82 N/A 2.12 N/A 14.27 8.66 7.92 N/A 131.65 369.70 1.40 5.61Jul‐07 ‐ Jun‐09 25.47 N/A N/A 1.51E‐03 9.77 N/A 2.13 N/A 14.20 8.62 7.89 N/A 131.04 370.36 1.40 5.58Aug‐07 ‐ Jul‐09 25.39 N/A N/A 1.51E‐03 9.74 N/A 2.14 N/A 14.16 8.59 7.86 N/A 130.64 371.68 1.39 5.57Sep‐07 ‐ Aug‐09 25.00 N/A N/A 1.50E‐03 9.59 N/A 2.12 N/A 13.94 8.46 7.74 N/A 128.63 368.53 1.37 5.48Oct‐07 ‐ Sep‐09 24.93 N/A N/A 1.50E‐03 9.56 N/A 2.12 N/A 13.90 8.44 7.72 N/A 128.25 369.42 1.37 5.46Nov‐07 ‐ Oct‐09 24.98 N/A N/A 1.52E‐03 9.58 N/A 2.14 N/A 13.93 8.45 7.73 N/A 128.51 372.54 1.37 5.47Dec‐07 ‐ Nov‐09 24.79 N/A N/A 1.51E‐03 9.51 N/A 2.14 N/A 13.82 8.39 7.67 N/A 127.54 372.11 1.36 5.43Jan‐08 ‐ Dec‐09 24.95 N/A N/A 1.53E‐03 9.57 N/A 2.16 N/A 13.91 8.44 7.72 N/A 128.37 376.20 1.37 5.47Feb‐08 ‐ Jan‐10 24.87 N/A N/A 1.54E‐03 9.54 N/A 2.17 N/A 13.86 8.41 7.70 N/A 127.93 377.76 1.36 5.45Mar‐08 ‐ Feb‐10 24.55 N/A N/A 1.52E‐03 9.42 N/A 2.15 N/A 13.69 8.31 7.60 N/A 126.28 374.72 1.35 5.38Apr‐08 ‐ Mar‐10 24.51 N/A N/A 1.53E‐03 9.40 N/A 2.16 N/A 13.67 8.29 7.59 N/A 126.10 376.57 1.34 5.37May‐08 ‐ Apr‐10 24.80 N/A N/A 1.56E‐03 9.51 N/A 2.21 N/A 13.83 8.39 7.68 N/A 127.60 384.55 1.36 5.44Jun‐08 ‐ May‐10 24.85 N/A N/A 1.58E‐03 9.53 N/A 2.23 N/A 13.86 8.41 7.69 N/A 127.87 388.69 1.36 5.45Jul‐08 ‐ Jun‐10 24.97 N/A N/A 1.60E‐03 9.58 N/A 2.26 N/A 13.92 8.45 7.73 N/A 128.47 393.76 1.37 5.47Aug‐08 ‐ Jul‐10 24.86 N/A N/A 1.61E‐03 9.54 N/A 2.27 N/A 13.86 8.41 7.70 N/A 127.91 395.43 1.36 5.45Sep‐08 ‐ Aug‐10 24.51 N/A N/A 1.60E‐03 9.40 N/A 2.26 N/A 13.66 8.29 7.59 N/A 126.08 393.28 1.34 5.37Oct‐08 ‐ Sep‐10 24.46 N/A N/A 1.61E‐03 9.38 N/A 2.27 N/A 13.64 8.28 7.57 N/A 125.85 395.63 1.34 5.36Nov‐08 ‐ Oct‐10 24.59 N/A N/A 1.63E‐03 9.43 N/A 2.30 N/A 13.71 8.32 7.61 N/A 126.52 400.40 1.35 5.39Dec‐08 ‐ Nov‐10 24.43 N/A N/A 1.63E‐03 9.37 N/A 2.30 N/A 13.62 8.27 7.56 N/A 125.69 400.30 1.34 5.35Jan‐09 ‐ Dec‐10 24.88 N/A N/A 1.67E‐03 9.54 N/A 2.35 N/A 13.87 8.42 7.70 N/A 127.97 409.87 1.36 5.45Feb‐09 ‐ Jan‐11 25.21 N/A N/A 1.72E‐03 9.67 N/A 2.42 N/A 14.05 8.53 7.80 N/A 129.67 422.01 1.38 5.52Mar‐09 ‐ Feb‐11 25.42 N/A N/A 1.76E‐03 9.75 N/A 2.48 N/A 14.17 8.60 7.87 N/A 130.76 432.07 1.39 5.57Apr‐09 ‐ Mar‐11 25.35 N/A N/A 1.78E‐03 9.72 N/A 2.52 N/A 14.13 8.58 7.85 N/A 130.41 438.11 1.39 5.56May‐09 ‐ Apr‐11 25.20 N/A N/A 1.80E‐03 9.66 N/A 2.55 N/A 14.05 8.53 7.80 N/A 129.63 443.32 1.38 5.52Jun‐09 ‐ May‐11 25.29 N/A N/A 1.84E‐03 9.70 N/A 2.60 N/A 14.10 8.56 7.83 N/A 130.11 452.67 1.39 5.54Jul‐09 ‐ Jun‐11 25.26 N/A N/A 1.87E‐03 9.69 N/A 2.64 N/A 14.08 8.55 7.82 N/A 129.93 459.17 1.38 5.54Aug‐09 ‐ Jul‐11 25.06 N/A N/A 1.88E‐03 9.61 N/A 2.66 N/A 13.97 8.48 7.76 N/A 128.91 462.33 1.37 5.49Sep‐09 ‐ Aug‐11 25.10 N/A N/A 1.91E‐03 9.63 N/A 2.70 N/A 13.99 8.49 7.77 N/A 129.12 469.98 1.38 5.50Oct‐09 ‐ Sep‐11 25.02 N/A N/A 1.93E‐03 9.60 N/A 2.72 N/A 13.95 8.46 7.74 N/A 128.70 474.13 1.37 5.48Nov‐09 ‐ Oct‐11 24.90 N/A N/A 1.95E‐03 9.55 N/A 2.75 N/A 13.88 8.42 7.71 N/A 128.09 479.33 1.36 5.46Dec‐09 ‐ Nov‐11 24.38 N/A N/A 1.93E‐03 9.35 N/A 2.73 N/A 13.59 8.25 7.55 N/A 125.43 474.54 1.34 5.34Jan‐10 ‐ Dec‐11 24.50 N/A N/A 1.97E‐03 9.40 N/A 2.78 N/A 13.66 8.29 7.58 N/A 126.03 483.33 1.34 5.37
TrinityConsultants Page18of37AugustaExpansionProjectEmissionsAnalysis(2012126JSFinalUpdates)
24‐MonRollingAvg‐Kiln3

AppendixB‐EmissionCalculationsWestFraser‐Augusta,Georgia
TableB‐11.Total24‐MonthRollingAverageActualAnnualEmissionsforAllKilns(tpy)
CO Fluorides H2S Lead NOX
ReducedSulfurCompounds
(includingH2S) SO2 H2SO4 TotalPM TotalPM10 TotalPM2.5
TotalReducedSulfur
(includingH2S) TotalVOC CO2ebiomassdeferral
Form‐aldehyde Methanol
Jan‐02 ‐ Dec‐03 46.19 N/A N/A 4.20E‐03 17.72 N/A 5.93 N/A 25.75 15.63 14.30 N/A 237.62 1,032.17 2.53 10.12Feb‐02 ‐ Jan‐04 46.16 N/A N/A 4.20E‐03 17.71 N/A 5.93 N/A 25.74 15.62 14.29 N/A 237.50 1,031.53 2.53 10.12Mar‐02 ‐ Feb‐04 46.07 N/A N/A 4.19E‐03 17.67 N/A 5.91 N/A 25.68 15.59 14.26 N/A 236.99 1,029.28 2.52 10.10Apr‐02 ‐ Mar‐04 46.00 N/A N/A 4.18E‐03 17.64 N/A 5.90 N/A 25.64 15.56 14.24 N/A 236.63 1,027.65 2.52 10.08May‐02 ‐ Apr‐04 45.99 N/A N/A 4.18E‐03 17.64 N/A 5.90 N/A 25.64 15.56 14.24 N/A 236.62 1,027.52 2.52 10.08Jun‐02 ‐ May‐04 45.88 N/A N/A 4.17E‐03 17.60 N/A 5.89 N/A 25.58 15.52 14.20 N/A 236.02 1,024.86 2.51 10.06Jul‐02 ‐ Jun‐04 45.86 N/A N/A 4.17E‐03 17.59 N/A 5.88 N/A 25.57 15.52 14.20 N/A 235.91 1,024.27 2.51 10.05Aug‐02 ‐ Jul‐04 44.86 N/A N/A 4.08E‐03 17.21 N/A 5.76 N/A 25.01 15.18 13.89 N/A 230.81 1,002.45 2.46 9.83Sep‐02 ‐ Aug‐04 44.00 N/A N/A 4.00E‐03 16.88 N/A 5.65 N/A 24.53 14.89 13.62 N/A 226.35 983.36 2.41 9.64Oct‐02 ‐ Sep‐04 43.91 N/A N/A 3.99E‐03 16.84 N/A 5.64 N/A 24.48 14.86 13.60 N/A 225.92 981.43 2.41 9.62Nov‐02 ‐ Oct‐04 44.02 N/A N/A 4.00E‐03 16.89 N/A 5.65 N/A 24.54 14.90 13.63 N/A 226.48 983.71 2.41 9.65Dec‐02 ‐ Nov‐04 43.83 N/A N/A 3.98E‐03 16.81 N/A 5.63 N/A 24.44 14.83 13.57 N/A 225.48 979.34 2.40 9.61Jan‐03 ‐ Dec‐04 44.28 N/A N/A 4.02E‐03 16.99 N/A 5.68 N/A 24.69 14.98 13.71 N/A 227.82 989.24 2.43 9.71Feb‐03 ‐ Jan‐05 44.15 N/A N/A 4.01E‐03 16.94 N/A 5.66 N/A 24.62 14.94 13.67 N/A 227.15 984.84 2.42 9.68Mar‐03 ‐ Feb‐05 43.94 N/A N/A 3.98E‐03 16.86 N/A 5.62 N/A 24.50 14.87 13.60 N/A 226.08 978.80 2.41 9.63Apr‐03 ‐ Mar‐05 44.35 N/A N/A 4.01E‐03 17.01 N/A 5.67 N/A 24.73 15.01 13.73 N/A 228.18 986.49 2.43 9.72May‐03 ‐ Apr‐05 44.92 N/A N/A 4.06E‐03 17.23 N/A 5.73 N/A 25.05 15.20 13.91 N/A 231.11 997.75 2.46 9.85Jun‐03 ‐ May‐05 45.17 N/A N/A 4.07E‐03 17.33 N/A 5.75 N/A 25.18 15.28 13.98 N/A 232.38 1,001.63 2.48 9.90Jul‐03 ‐ Jun‐05 45.31 N/A N/A 4.08E‐03 17.38 N/A 5.76 N/A 25.26 15.33 14.03 N/A 233.09 1,003.29 2.48 9.93Aug‐03 ‐ Jul‐05 45.95 N/A N/A 4.13E‐03 17.62 N/A 5.84 N/A 25.62 15.55 14.23 N/A 236.39 1,016.13 2.52 10.07Sep‐03 ‐ Aug‐05 46.26 N/A N/A 4.15E‐03 17.74 N/A 5.87 N/A 25.79 15.65 14.32 N/A 237.98 1,021.53 2.53 10.14Oct‐03 ‐ Sep‐05 46.63 N/A N/A 4.18E‐03 17.88 N/A 5.91 N/A 26.00 15.78 14.43 N/A 239.87 1,028.25 2.55 10.22Nov‐03 ‐ Oct‐05 46.96 N/A N/A 4.21E‐03 18.01 N/A 5.94 N/A 26.18 15.89 14.54 N/A 241.59 1,034.25 2.57 10.29Dec‐03 ‐ Nov‐05 46.95 N/A N/A 4.20E‐03 18.01 N/A 5.93 N/A 26.18 15.89 14.54 N/A 241.57 1,032.82 2.57 10.29Jan‐04 ‐ Dec‐05 47.80 N/A N/A 4.27E‐03 18.33 N/A 6.03 N/A 26.65 16.17 14.80 N/A 245.91 1,050.26 2.62 10.48Feb‐04 ‐ Jan‐06 47.91 N/A N/A 4.26E‐03 18.38 N/A 6.02 N/A 26.71 16.21 14.83 N/A 246.47 1,047.90 2.63 10.50Mar‐04 ‐ Feb‐06 47.99 N/A N/A 4.25E‐03 18.41 N/A 6.01 N/A 26.76 16.24 14.86 N/A 246.91 1,045.70 2.63 10.52Apr‐04 ‐ Mar‐06 48.73 N/A N/A 4.29E‐03 18.69 N/A 6.07 N/A 27.17 16.49 15.09 N/A 250.71 1,055.93 2.67 10.68May‐04 ‐ Apr‐06 49.01 N/A N/A 4.30E‐03 18.80 N/A 6.07 N/A 27.33 16.58 15.17 N/A 252.16 1,057.04 2.69 10.74Jun‐04 ‐ May‐06 49.54 N/A N/A 4.32E‐03 19.00 N/A 6.11 N/A 27.62 16.76 15.34 N/A 254.85 1,062.88 2.71 10.86Jul‐04 ‐ Jun‐06 49.78 N/A N/A 4.32E‐03 19.10 N/A 6.11 N/A 27.76 16.84 15.41 N/A 256.12 1,063.18 2.73 10.91Aug‐04 ‐ Jul‐06 51.17 N/A N/A 4.43E‐03 19.63 N/A 6.25 N/A 28.53 17.31 15.84 N/A 263.26 1,088.55 2.80 11.22Sep‐04 ‐ Aug‐06 51.80 N/A N/A 4.47E‐03 19.87 N/A 6.31 N/A 28.88 17.53 16.04 N/A 266.49 1,097.98 2.84 11.35Oct‐04 ‐ Sep‐06 51.74 N/A N/A 4.44E‐03 19.84 N/A 6.28 N/A 28.84 17.51 16.02 N/A 266.16 1,092.71 2.83 11.34Nov‐04 ‐ Oct‐06 51.19 N/A N/A 4.38E‐03 19.63 N/A 6.19 N/A 28.54 17.32 15.85 N/A 263.35 1,077.25 2.80 11.22Dec‐04 ‐ Nov‐06 51.10 N/A N/A 4.36E‐03 19.60 N/A 6.16 N/A 28.49 17.29 15.82 N/A 262.90 1,071.49 2.80 11.20Jan‐05 ‐ Dec‐06 50.53 N/A N/A 4.29E‐03 19.38 N/A 6.07 N/A 28.17 17.10 15.64 N/A 259.97 1,055.80 2.77 11.08Feb‐05 ‐ Jan‐07 50.37 N/A N/A 4.26E‐03 19.32 N/A 6.01 N/A 28.08 17.04 15.59 N/A 259.12 1,046.59 2.76 11.04Mar‐05 ‐ Feb‐07 50.28 N/A N/A 4.23E‐03 19.29 N/A 5.97 N/A 28.03 17.01 15.57 N/A 258.69 1,039.41 2.76 11.02Apr‐05 ‐ Mar‐07 49.77 N/A N/A 4.16E‐03 19.09 N/A 5.87 N/A 27.75 16.84 15.41 N/A 256.06 1,021.93 2.73 10.91May‐05 ‐ Apr‐07 49.34 N/A N/A 4.10E‐03 18.93 N/A 5.80 N/A 27.51 16.70 15.28 N/A 253.86 1,008.98 2.70 10.82Jun‐05 ‐ May‐07 48.86 N/A N/A 4.01E‐03 18.74 N/A 5.66 N/A 27.24 16.53 15.13 N/A 251.39 985.06 2.68 10.71Jul‐05 ‐ Jun‐07 48.96 N/A N/A 3.99E‐03 18.78 N/A 5.64 N/A 27.30 16.57 15.16 N/A 251.90 980.98 2.68 10.73Aug‐05 ‐ Jul‐07 48.75 N/A N/A 3.95E‐03 18.70 N/A 5.57 N/A 27.18 16.50 15.09 N/A 250.81 970.10 2.67 10.69Sep‐05 ‐ Aug‐07 48.79 N/A N/A 3.90E‐03 18.71 N/A 5.51 N/A 27.20 16.51 15.11 N/A 251.01 958.91 2.67 10.69Oct‐05 ‐ Sep‐07 48.43 N/A N/A 3.85E‐03 18.58 N/A 5.44 N/A 27.00 16.39 14.99 N/A 249.17 947.79 2.65 10.62Nov‐05 ‐ Oct‐07 48.28 N/A N/A 3.82E‐03 18.52 N/A 5.40 N/A 26.92 16.34 14.95 N/A 248.38 939.16 2.65 10.58Dec‐05 ‐ Nov‐07 48.14 N/A N/A 3.77E‐03 18.46 N/A 5.33 N/A 26.84 16.29 14.90 N/A 247.66 928.03 2.64 10.55
24MonthPeriod
TrinityConsultants Page19of37AugustaExpansionProjectEmissionsAnalysis(2012126JSFinalUpdates)
24‐MonRollingAvg‐Kilns1‐3

AppendixB‐EmissionCalculationsWestFraser‐Augusta,Georgia
TableB‐11.Total24‐MonthRollingAverageActualAnnualEmissionsforAllKilns(tpy)
CO Fluorides H2S Lead NOX
ReducedSulfurCompounds
(includingH2S) SO2 H2SO4 TotalPM TotalPM10 TotalPM2.5
TotalReducedSulfur
(includingH2S) TotalVOC CO2ebiomassdeferral
Form‐aldehyde Methanol24MonthPeriod
Jan‐06 ‐ Dec‐07 47.16 N/A N/A 3.68E‐03 18.09 N/A 5.19 N/A 26.29 15.96 14.60 N/A 242.62 903.73 2.58 10.34Feb‐06 ‐ Jan‐08 46.87 N/A N/A 3.71E‐03 17.98 N/A 5.25 N/A 26.13 15.86 14.51 N/A 241.15 913.35 2.57 10.27Mar‐06 ‐ Feb‐08 46.54 N/A N/A 3.72E‐03 17.85 N/A 5.25 N/A 25.95 15.75 14.41 N/A 239.44 913.47 2.55 10.20Apr‐06 ‐ Mar‐08 45.34 N/A N/A 3.67E‐03 17.39 N/A 5.18 N/A 25.28 15.34 14.04 N/A 233.26 901.45 2.48 9.94May‐06 ‐ Apr‐08 44.55 N/A N/A 3.57E‐03 17.09 N/A 5.05 N/A 24.84 15.07 13.79 N/A 229.21 878.62 2.44 9.77Jun‐06 ‐ May‐08 43.63 N/A N/A 3.47E‐03 16.73 N/A 4.90 N/A 24.32 14.76 13.51 N/A 224.44 852.37 2.39 9.56Jul‐06 ‐ Jun‐08 42.81 N/A N/A 3.37E‐03 16.42 N/A 4.76 N/A 23.87 14.48 13.25 N/A 220.22 828.90 2.35 9.38Aug‐06 ‐ Jul‐08 42.26 N/A N/A 3.29E‐03 16.21 N/A 4.65 N/A 23.56 14.30 13.08 N/A 217.43 809.67 2.32 9.26Sep‐06 ‐ Aug‐08 42.28 N/A N/A 3.25E‐03 16.22 N/A 4.60 N/A 23.57 14.31 13.09 N/A 217.53 800.16 2.32 9.27Oct‐06 ‐ Sep‐08 42.35 N/A N/A 3.30E‐03 16.24 N/A 4.66 N/A 23.61 14.33 13.11 N/A 217.87 811.58 2.32 9.28Nov‐06 ‐ Oct‐08 42.40 N/A N/A 3.36E‐03 16.26 N/A 4.75 N/A 23.64 14.35 13.13 N/A 218.15 827.01 2.32 9.29Dec‐06 ‐ Nov‐08 42.22 N/A N/A 3.35E‐03 16.19 N/A 4.73 N/A 23.54 14.28 13.07 N/A 217.19 822.81 2.31 9.25Jan‐07 ‐ Dec‐08 41.88 N/A N/A 3.32E‐03 16.06 N/A 4.69 N/A 23.35 14.17 12.97 N/A 215.45 817.06 2.29 9.18Feb‐07 ‐ Jan‐09 41.09 N/A N/A 3.27E‐03 15.76 N/A 4.61 N/A 22.91 13.90 12.72 N/A 211.38 802.93 2.25 9.01Mar‐07 ‐ Feb‐09 40.44 N/A N/A 3.20E‐03 15.51 N/A 4.52 N/A 22.55 13.68 12.52 N/A 208.07 787.12 2.22 8.86Apr‐07 ‐ Mar‐09 40.58 N/A N/A 3.26E‐03 15.57 N/A 4.61 N/A 22.63 13.73 12.56 N/A 208.78 802.13 2.22 8.89May‐07 ‐ Apr‐09 40.67 N/A N/A 3.29E‐03 15.60 N/A 4.64 N/A 22.67 13.76 12.59 N/A 209.21 807.99 2.23 8.91Jun‐07 ‐ May‐09 40.48 N/A N/A 3.34E‐03 15.53 N/A 4.72 N/A 22.57 13.70 12.53 N/A 208.28 821.70 2.22 8.87Jul‐07 ‐ Jun‐09 40.18 N/A N/A 3.37E‐03 15.41 N/A 4.76 N/A 22.40 13.60 12.44 N/A 206.73 828.48 2.20 8.81Aug‐07 ‐ Jul‐09 39.70 N/A N/A 3.34E‐03 15.23 N/A 4.72 N/A 22.14 13.43 12.29 N/A 204.26 822.00 2.18 8.70Sep‐07 ‐ Aug‐09 39.14 N/A N/A 3.36E‐03 15.01 N/A 4.75 N/A 21.82 13.24 12.12 N/A 201.34 826.90 2.14 8.58Oct‐07 ‐ Sep‐09 38.64 N/A N/A 3.34E‐03 14.82 N/A 4.71 N/A 21.55 13.08 11.96 N/A 198.81 820.15 2.12 8.47Nov‐07 ‐ Oct‐09 38.50 N/A N/A 3.35E‐03 14.77 N/A 4.74 N/A 21.47 13.03 11.92 N/A 198.09 824.85 2.11 8.44Dec‐07 ‐ Nov‐09 38.32 N/A N/A 3.37E‐03 14.70 N/A 4.76 N/A 21.36 12.96 11.86 N/A 197.13 827.95 2.10 8.40Jan‐08 ‐ Dec‐09 38.19 N/A N/A 3.36E‐03 14.65 N/A 4.75 N/A 21.29 12.92 11.82 N/A 196.49 826.87 2.09 8.37Feb‐08 ‐ Jan‐10 37.87 N/A N/A 3.28E‐03 14.52 N/A 4.64 N/A 21.11 12.81 11.72 N/A 194.80 807.52 2.07 8.30Mar‐08 ‐ Feb‐10 37.38 N/A N/A 3.25E‐03 14.34 N/A 4.59 N/A 20.84 12.65 11.57 N/A 192.29 799.31 2.05 8.19Apr‐08 ‐ Mar‐10 37.74 N/A N/A 3.34E‐03 14.48 N/A 4.71 N/A 21.04 12.77 11.68 N/A 194.18 820.42 2.07 8.27May‐08 ‐ Apr‐10 38.36 N/A N/A 3.46E‐03 14.71 N/A 4.89 N/A 21.39 12.98 11.88 N/A 197.36 850.67 2.10 8.41Jun‐08 ‐ May‐10 38.78 N/A N/A 3.59E‐03 14.88 N/A 5.07 N/A 21.62 13.12 12.01 N/A 199.52 881.81 2.13 8.50Jul‐08 ‐ Jun‐10 38.97 N/A N/A 3.62E‐03 14.95 N/A 5.11 N/A 21.73 13.19 12.07 N/A 200.49 889.06 2.14 8.54Aug‐08 ‐ Jul‐10 39.11 N/A N/A 3.69E‐03 15.00 N/A 5.21 N/A 21.81 13.23 12.11 N/A 201.21 906.29 2.14 8.57Sep‐08 ‐ Aug‐10 38.87 N/A N/A 3.82E‐03 14.91 N/A 5.39 N/A 21.67 13.15 12.04 N/A 199.99 938.66 2.13 8.52Oct‐08 ‐ Sep‐10 38.86 N/A N/A 3.85E‐03 14.91 N/A 5.44 N/A 21.67 13.15 12.03 N/A 199.94 946.18 2.13 8.52Nov‐08 ‐ Oct‐10 39.27 N/A N/A 3.91E‐03 15.06 N/A 5.53 N/A 21.89 13.29 12.16 N/A 202.03 962.16 2.15 8.61Dec‐08 ‐ Nov‐10 39.23 N/A N/A 3.97E‐03 15.05 N/A 5.60 N/A 21.87 13.27 12.14 N/A 201.82 975.25 2.15 8.60Jan‐09 ‐ Dec‐10 40.04 N/A N/A 4.11E‐03 15.36 N/A 5.80 N/A 22.32 13.55 12.39 N/A 205.97 1,010.23 2.19 8.77Feb‐09 ‐ Jan‐11 40.70 N/A N/A 4.22E‐03 15.61 N/A 5.97 N/A 22.69 13.77 12.60 N/A 209.37 1,038.45 2.23 8.92Mar‐09 ‐ Feb‐11 41.50 N/A N/A 4.41E‐03 15.92 N/A 6.22 N/A 23.14 14.04 12.85 N/A 213.52 1,083.38 2.27 9.10Apr‐09 ‐ Mar‐11 41.71 N/A N/A 4.49E‐03 16.00 N/A 6.35 N/A 23.26 14.11 12.91 N/A 214.60 1,104.58 2.29 9.14May‐09 ‐ Apr‐11 41.83 N/A N/A 4.58E‐03 16.04 N/A 6.47 N/A 23.32 14.15 12.95 N/A 215.18 1,125.48 2.29 9.17Jun‐09 ‐ May‐11 42.19 N/A N/A 4.66E‐03 16.18 N/A 6.58 N/A 23.52 14.28 13.06 N/A 217.05 1,145.26 2.31 9.25Jul‐09 ‐ Jun‐11 42.34 N/A N/A 4.72E‐03 16.24 N/A 6.67 N/A 23.60 14.32 13.11 N/A 217.80 1,160.81 2.32 9.28Aug‐09 ‐ Jul‐11 42.19 N/A N/A 4.76E‐03 16.18 N/A 6.73 N/A 23.52 14.28 13.06 N/A 217.07 1,171.08 2.31 9.25Sep‐09 ‐ Aug‐11 42.09 N/A N/A 4.76E‐03 16.14 N/A 6.73 N/A 23.47 14.24 13.03 N/A 216.53 1,170.98 2.31 9.23Oct‐09 ‐ Sep‐11 41.88 N/A N/A 4.76E‐03 16.06 N/A 6.72 N/A 23.35 14.17 12.97 N/A 215.45 1,170.43 2.29 9.18Nov‐09 ‐ Oct‐11 41.81 N/A N/A 4.80E‐03 16.04 N/A 6.79 N/A 23.31 14.15 12.94 N/A 215.11 1,181.35 2.29 9.16Dec‐09 ‐ Nov‐11 41.11 N/A N/A 4.77E‐03 15.77 N/A 6.74 N/A 22.92 13.91 12.73 N/A 211.52 1,172.51 2.25 9.01Jan‐10 ‐ Dec‐11 41.42 N/A N/A 4.84E‐03 15.89 N/A 6.84 N/A 23.09 14.02 12.82 N/A 213.11 1,190.84 2.27 9.08
TrinityConsultants Page20of37AugustaExpansionProjectEmissionsAnalysis(2012126JSFinalUpdates)
24‐MonRollingAvg‐Kilns1‐3

AppendixB‐EmissionCalculationsWestFraser‐Augusta,Georgia
TableB‐12.SummaryofSelectedBaselinePeriodsandEmissions
StartMonth EndMonth
NSRPollutantsCO Sep‐05 Aug‐06 51.80Fluorides N/A N/A N/AH2S N/A N/A N/ALead Jan‐10 Dec‐11 4.84E‐03NOX Sep‐05 Aug‐06 19.87ReducedSulfurCompounds(includingH2S) N/A N/A N/ASO2 Jan‐10 Dec‐11 6.84H2SO4 N/A N/A N/ATotalPM Sep‐05 Aug‐06 28.88TotalPM10 Sep‐05 Aug‐06 17.53TotalPM2.5 Sep‐05 Aug‐06 16.04TotalReducedSulfur(includingH2S) N/A N/A N/ATotalVOC Sep‐05 Aug‐06 266.49
GreenhouseGases
CO2ebiomassdeferral Jan‐10 Dec‐11 1190.84
HAPsFormaldehyde Sep‐05 Aug‐06 2.84Methanol Sep‐05 Aug‐06 11.35
Pollutant
TotalEmissionsforKilns1‐3BaselinePeriod Baseline
Emissions(tpy)
TrinityConsultants Page21of37AugustaExpansionProjectEmissionsAnalysis(2012126JSFinalUpdates)
SelectionofBaseline

AppendixB‐EmissionCalculationsWestFraser‐Augusta,Georgia
TableB‐13.NCASIEmissionFactorsforDirect‐FiredContinuousKilns
Pollutant Reference
CriteriaNOX 0.28 lb/MBF 3TotalVOC 3.76 lb/MBF 4CO 0.73 lb/MBF 5TotalPM 0.14 lb/MBF 6TotalPM10 0.104 lb/MBF 6TotalPM2.5 0.099 lb/MBF 6SO2 0.025 lb/MMBtu 7
GreenhouseGasesCO2 206.79 lb/MMBtu 8CH4 7.1E‐02 lb/MMBtu 8N2O 9.3E‐03 lb/MMBtu 8
CO2e 211.15 lb/MMBtu 9CO2ebiomassdeferral 4.35 lb/MMBtu 10
3.ProvidedbyDr.DavidWordofNCASItotheWeyerhaeuserfacility.
4.TotalVOC(lb/MBF)iscomputedbasedonthefollowingequation:
VOCasterpene+methanol+formaldehyde=VOCasCarbon[lb/MBF]*1.133+(1‐0.65)*Methanol[lb/MBF]+Formaldehyde[lb/MBF]
8.PerU.S.EPA'sAP‐42,Section1‐6,WoodResidueCombustioninBoiler s(Sept.2003).
CO2 1
CH4 21
N2O 310
12.Pursuantto40CFRPart98.2(b)(2),biogeniccarbondioxideemissions(e.g.,frombiomass)areexcluded.
5.BasedontheaverageofNCASItestresultsasprovidedviaemailfromDr.WordofNCASItoNCDAQ,aspublishedintheAirPermitReview/PreliminaryDetermination,p.8.
9.Per40CFRPart98,SubpartC,TablesC‐1andC‐2.TheCO2emissionfactoristhedefaultfactorforwoodandwoodresiduals,andtheCH4andN2Oemissionfactorsarethedefaultfactorsforallsolidbiomassfuels.10.TheCO2efactoriscalculatedbasedontheemissionfactorsforCO 2,CH4,andN2Oandtheglobalwarmingpotential(GWP)foreachpollutantper40CFR98,SubpartA,TableA‐1:
6.BasedonpreliminarydeterminationforSimpsonLumberCompany,LLC,thebestavailableemissionfactorsforparticulaterelatedemissionsarebasedontestsconductedatBiblerBrothersLumberCompany,Russelville,AR.TheBiblerBrothersdataisforfilterablePMonly.ThefilterablePMemissionfactoris0.068lb/MBF.CondensablePMisbasedonunpublisheddataprovidedbyNCASI.NCASIrecommendsaratioofCondensabletoFilterablePMof1.016.TheCondensablePMemissionfactorusedistherefore0.069lb/MBF.FilterablePM10isassumedtobe50%offilterablePM(basedonPermitNO.2421‐107‐0011‐V‐02‐3issuedtoRayonierWoodProductsLLC‐SwainsboroSawmill).FilterablePM2.5isassumedtobe87%ofPM10basedonAP‐42forwoodcombustion.AllcondensablePMisassumedtobePM10andPM2.5.
AsprintedintheMay2010Weyerhaeuser‐Plymouth,NCpermitapplication 1 andtheNCDAQAirPermitReview/PreliminaryDeterminationdocument 2 unlessotherwisenotedbelow(PM)
EmissionFactor
1."FinalReport‐RevisedAirPermitApplicationforEnergyProject,"WeyerhaeuserNRCompany‐LumberTechnologies,Plymouth,NC,May2010(Permit#06389/T19).2.NorthCarolinaDivisionofAirQuality(NCDAQ)AirPermitReview/PreliminaryDeterminationfortheWeyerhaeuserNRCompany,Plymouth,NCfacilitypermitapplication(May2010),writtenbyJennyKelvingtonofNCDAQ.
TheVOCasCarbonemissionfactorisbasedontheaverageofunpublishedandpublishedNCASItestresultsasprovidedbyDr.DavidWordofNCASItoNCDAQandpublishedintheNCDAQAirPermitReview/PreliminaryDeterminationfortheWeyerhaeuserapplication,pp.7‐8.Itismultipliedby1.133,whichistheratioofthemolecularweightofpinene(C 10H16,136amu)tothemolecularweightofcarboninpinene(120amu).Thefactorsformethanolandformaldehydearemultipliedbytheresponsefactors,definedastheFIAresponsedividedbytheactualcompoundconcentration.AccordingtoanNCASIstudyandasprintedintheNCDAQAirPermitReview/PreliminaryDetermination,theresponsefactorsforformaldehydeandmethanolare0%and65%,respectively.ThismethodologyissupportedinanEPAdocumententitled InterimVOCMeasurementProtocolfortheWoodProductsIndustry (July2007).
TrinityConsultants Page22of37AugustaExpansionProjectEmissionsAnalysis(2012126JSFinalUpdates)
ContinuousKilnEFs
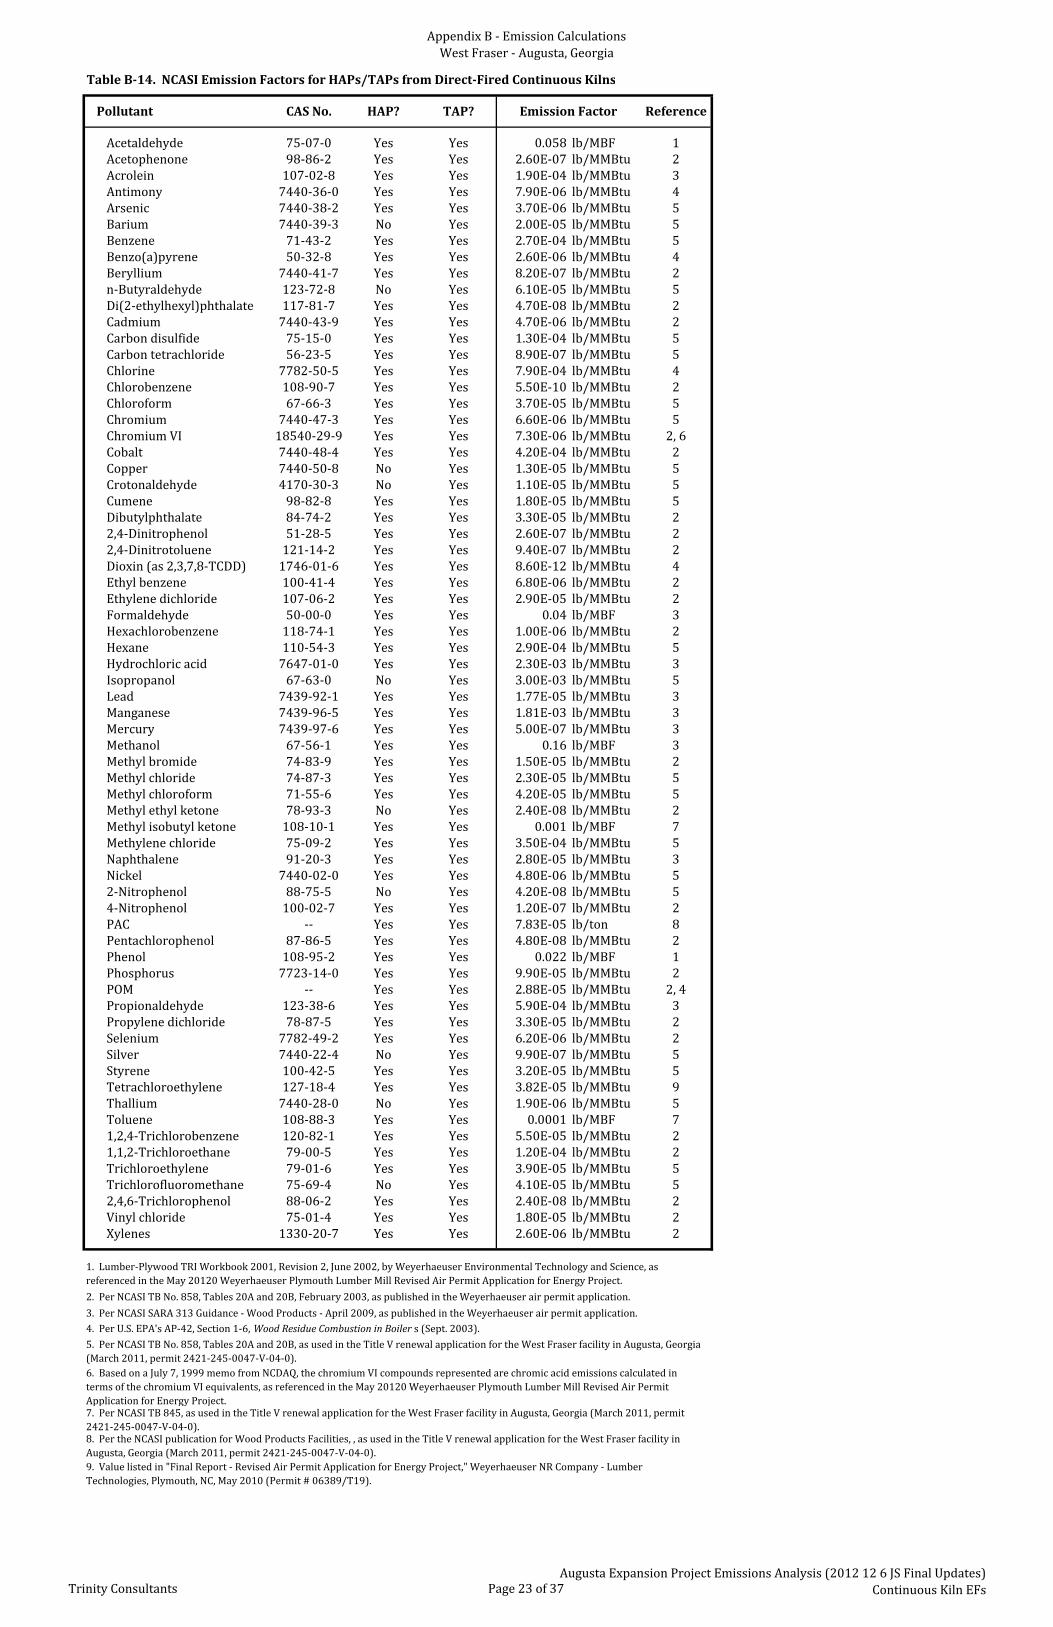
AppendixB‐EmissionCalculationsWestFraser‐Augusta,Georgia
TableB‐14.NCASIEmissionFactorsforHAPs/TAPsfromDirect‐FiredContinuousKilns
Pollutant CASNo. HAP? TAP? Reference
Acetaldehyde 75‐07‐0 Yes Yes 0.058 lb/MBF 1Acetophenone 98‐86‐2 Yes Yes 2.60E‐07 lb/MMBtu 2Acrolein 107‐02‐8 Yes Yes 1.90E‐04 lb/MMBtu 3Antimony 7440‐36‐0 Yes Yes 7.90E‐06 lb/MMBtu 4Arsenic 7440‐38‐2 Yes Yes 3.70E‐06 lb/MMBtu 5Barium 7440‐39‐3 No Yes 2.00E‐05 lb/MMBtu 5Benzene 71‐43‐2 Yes Yes 2.70E‐04 lb/MMBtu 5Benzo(a)pyrene 50‐32‐8 Yes Yes 2.60E‐06 lb/MMBtu 4Beryllium 7440‐41‐7 Yes Yes 8.20E‐07 lb/MMBtu 2n‐Butyraldehyde 123‐72‐8 No Yes 6.10E‐05 lb/MMBtu 5Di(2‐ethylhexyl)phthalate 117‐81‐7 Yes Yes 4.70E‐08 lb/MMBtu 2Cadmium 7440‐43‐9 Yes Yes 4.70E‐06 lb/MMBtu 2Carbondisulfide 75‐15‐0 Yes Yes 1.30E‐04 lb/MMBtu 5Carbontetrachloride 56‐23‐5 Yes Yes 8.90E‐07 lb/MMBtu 5Chlorine 7782‐50‐5 Yes Yes 7.90E‐04 lb/MMBtu 4Chlorobenzene 108‐90‐7 Yes Yes 5.50E‐10 lb/MMBtu 2Chloroform 67‐66‐3 Yes Yes 3.70E‐05 lb/MMBtu 5Chromium 7440‐47‐3 Yes Yes 6.60E‐06 lb/MMBtu 5ChromiumVI 18540‐29‐9 Yes Yes 7.30E‐06 lb/MMBtu 2,6Cobalt 7440‐48‐4 Yes Yes 4.20E‐04 lb/MMBtu 2Copper 7440‐50‐8 No Yes 1.30E‐05 lb/MMBtu 5Crotonaldehyde 4170‐30‐3 No Yes 1.10E‐05 lb/MMBtu 5Cumene 98‐82‐8 Yes Yes 1.80E‐05 lb/MMBtu 5Dibutylphthalate 84‐74‐2 Yes Yes 3.30E‐05 lb/MMBtu 22,4‐Dinitrophenol 51‐28‐5 Yes Yes 2.60E‐07 lb/MMBtu 22,4‐Dinitrotoluene 121‐14‐2 Yes Yes 9.40E‐07 lb/MMBtu 2Dioxin(as2,3,7,8‐TCDD) 1746‐01‐6 Yes Yes 8.60E‐12 lb/MMBtu 4Ethylbenzene 100‐41‐4 Yes Yes 6.80E‐06 lb/MMBtu 2Ethylenedichloride 107‐06‐2 Yes Yes 2.90E‐05 lb/MMBtu 2Formaldehyde 50‐00‐0 Yes Yes 0.04 lb/MBF 3Hexachlorobenzene 118‐74‐1 Yes Yes 1.00E‐06 lb/MMBtu 2Hexane 110‐54‐3 Yes Yes 2.90E‐04 lb/MMBtu 5Hydrochloricacid 7647‐01‐0 Yes Yes 2.30E‐03 lb/MMBtu 3Isopropanol 67‐63‐0 No Yes 3.00E‐03 lb/MMBtu 5Lead 7439‐92‐1 Yes Yes 1.77E‐05 lb/MMBtu 3Manganese 7439‐96‐5 Yes Yes 1.81E‐03 lb/MMBtu 3Mercury 7439‐97‐6 Yes Yes 5.00E‐07 lb/MMBtu 3Methanol 67‐56‐1 Yes Yes 0.16 lb/MBF 3Methylbromide 74‐83‐9 Yes Yes 1.50E‐05 lb/MMBtu 2Methylchloride 74‐87‐3 Yes Yes 2.30E‐05 lb/MMBtu 5Methylchloroform 71‐55‐6 Yes Yes 4.20E‐05 lb/MMBtu 5Methylethylketone 78‐93‐3 No Yes 2.40E‐08 lb/MMBtu 2Methylisobutylketone 108‐10‐1 Yes Yes 0.001 lb/MBF 7Methylenechloride 75‐09‐2 Yes Yes 3.50E‐04 lb/MMBtu 5Naphthalene 91‐20‐3 Yes Yes 2.80E‐05 lb/MMBtu 3Nickel 7440‐02‐0 Yes Yes 4.80E‐06 lb/MMBtu 52‐Nitrophenol 88‐75‐5 No Yes 4.20E‐08 lb/MMBtu 54‐Nitrophenol 100‐02‐7 Yes Yes 1.20E‐07 lb/MMBtu 2PAC ‐‐ Yes Yes 7.83E‐05 lb/ton 8Pentachlorophenol 87‐86‐5 Yes Yes 4.80E‐08 lb/MMBtu 2Phenol 108‐95‐2 Yes Yes 0.022 lb/MBF 1Phosphorus 7723‐14‐0 Yes Yes 9.90E‐05 lb/MMBtu 2POM ‐‐ Yes Yes 2.88E‐05 lb/MMBtu 2,4Propionaldehyde 123‐38‐6 Yes Yes 5.90E‐04 lb/MMBtu 3Propylenedichloride 78‐87‐5 Yes Yes 3.30E‐05 lb/MMBtu 2Selenium 7782‐49‐2 Yes Yes 6.20E‐06 lb/MMBtu 2Silver 7440‐22‐4 No Yes 9.90E‐07 lb/MMBtu 5Styrene 100‐42‐5 Yes Yes 3.20E‐05 lb/MMBtu 5Tetrachloroethylene 127‐18‐4 Yes Yes 3.82E‐05 lb/MMBtu 9Thallium 7440‐28‐0 No Yes 1.90E‐06 lb/MMBtu 5Toluene 108‐88‐3 Yes Yes 0.0001 lb/MBF 71,2,4‐Trichlorobenzene 120‐82‐1 Yes Yes 5.50E‐05 lb/MMBtu 21,1,2‐Trichloroethane 79‐00‐5 Yes Yes 1.20E‐04 lb/MMBtu 2Trichloroethylene 79‐01‐6 Yes Yes 3.90E‐05 lb/MMBtu 5Trichlorofluoromethane 75‐69‐4 No Yes 4.10E‐05 lb/MMBtu 52,4,6‐Trichlorophenol 88‐06‐2 Yes Yes 2.40E‐08 lb/MMBtu 2Vinylchloride 75‐01‐4 Yes Yes 1.80E‐05 lb/MMBtu 2Xylenes 1330‐20‐7 Yes Yes 2.60E‐06 lb/MMBtu 2
2.PerNCASITBNo.858,Tables20Aand20B,February2003,aspublishedintheWeyerhaeuserairpermitapplication.
3.PerNCASISARA313Guidance‐WoodProducts‐April2009,aspublishedintheWeyerhaeuserairpermitapplication.4.PerU.S.EPA'sAP‐42,Section1‐6,WoodResidueCombustioninBoiler s(Sept.2003).
9.Valuelistedin"FinalReport‐RevisedAirPermitApplicationforEnergyProject,"WeyerhaeuserNRCompany‐LumberTechnologies,Plymouth,NC,May2010(Permit#06389/T19).
EmissionFactor
1.Lumber‐PlywoodTRIWorkbook2001,Revision2,June2002,byWeyerhaeuserEnvironmentalTechnologyandScience,asreferencedintheMay20120WeyerhaeuserPlymouthLumberMillRevisedAirPermitApplicationforEnergyProject.
5.PerNCASITBNo.858,Tables20Aand20B,asusedintheTitleVrenewalapplicationfortheWestFraserfacilityinAugusta,Georgia(March2011,permit2421‐245‐0047‐V‐04‐0).6.BasedonaJuly7,1999memofromNCDAQ,thechromiumVIcompoundsrepresentedarechromicacidemissionscalculatedintermsofthechromiumVIequivalents,asreferencedintheMay20120WeyerhaeuserPlymouthLumberMillRevisedAirPermitApplicationforEnergyProject.7.PerNCASITB845,asusedintheTitleVrenewalapplicationfortheWestFraserfacilityinAugusta,Georgia(March2011,permit2421‐245‐0047‐V‐04‐0).8.PertheNCASIpublicationforWoodProductsFacilities,,asusedintheTitleVrenewalapplicationfortheWestFraserfacilityinAugusta,Georgia(March2011,permit2421‐245‐0047‐V‐04‐0).
TrinityConsultants Page23of37AugustaExpansionProjectEmissionsAnalysis(2012126JSFinalUpdates)
ContinuousKilnEFs

AppendixB‐EmissionCalculationsWestFraser‐Augusta,Georgia
TableB‐15.VOCasCarbonEmissionsfromDirect‐FiredDryingKilns1
Number
Test1Test2Test3Test4Test5Test6Test7Test8Test9Test10Test11Test12Test13Test14Test15Test16Test17
Test1Test2Test3
Test1Test2Test3
Avg.ofNCASINumbersMax.ofNCASINumbers
TableB‐16.CarbonMonoxideEmissionsfromDirect‐FiredDryingKilns1
NumberCO
(lb/MBF)
Test1 0.75Test2 0.44Test3 0.51Test4 0.57Test5 0.92Test6 1.0Test7 0.92
Avg.ofNCASINumbers 0.73Max.ofNCASINumbers 1.0
1.DatatakenfromtheNCDAQAirPermitReview/PreliminaryDeterminationfortheWeyerhaueserapplication,providedtoNCDAQbyDr.DavidWordofNCASI.Valuesexcludetestdatathatdoesnotspecifythedryingofsouthernyellowpine.
1.DatatakenfromtheNCDAQAirPermitReview/PreliminaryDeterminationfortheWeyerhaueserapplication,providedtoNCDAQbyDr.DavidWordofNCASI.
2.93.43.6
3.234.99
OtherUnpublishedNCASITestData
3.162.072.891.612.852.782.82
PublishedNCASITestData4.24.74.2
2.83
VOCasCarbon(lb/MBF)
UnpublishedNCASITestData3.662.462.752.724.994.73.72.872.42
TrinityConsultants Page24of37AugustaExpansionProjectEmissionsAnalysis(2012126JSFinalUpdates)
ContinuousKilnEFs

AppendixB‐EmissionCalculationsWestFraser‐Augusta,Georgia
TableB‐17.ContinuousKilnInformation
BurnerCapacity1 FuelHHV2
AnnualHoursofOperation
KilnID (MMBtu/hr) (Btu/lb) (hrs/yr) (MBF/hr) (MMBF/yr)
ContinuousKiln1(KD04) 35 4,500 8,760 12.6 110ContinuousKiln2(KD05) 35 4,500 8,760 12.6 110
1.BurnercapacityprovidedtoDeannaDuramandJakeStewart(Trinity)onApril23,2012.2.Theaveragehighheatingvalueforwood/bark/finesis4,500Btu/lb,perU.S.EPA'sAP‐42,Section1.6,WoodResidueCombustioninBoilers (Sept.2003).
TableB‐18.PotentialEmissionsfromDirect‐FiredContinuousKilns1
Pollutant (lb/hr) (tpy) (lb/hr) (tpy) (lb/hr) (tpy)
Criteria 2,3
NOX 3.52 15.40 3.52 15.40 7.03 30.80TotalVOC 47.15 206.53 47.15 206.53 94.31 413.06CO 9.17 40.15 9.17 40.15 18.33 80.30TotalPM 1.73 7.59 1.73 7.59 3.47 15.18TotalPM10 1.31 5.72 1.31 5.72 2.61 11.44TotalPM2.5 1.24 5.45 1.24 5.45 2.49 10.89SO2 0.88 3.83 0.88 3.83 1.75 7.67
GreenhouseGases 4
CO2e 7,390 32,369 7,390 32,369 14,780.17 64,737.14CO2ebiomassdeferral 152.32 667.15 152.32 667.15 304.63 1,334.30
1.Potentialannualemissionswerecalculatedusingthefollowingequationsbasedontheunitsoftheemissionfactor:
Potentialemissions[tpy]=Emissionfactor[lb/MBF]*Annualproductioncapacity[MMBF/yr]*1,000/2,000lb/ton
Potentialemissions[tpy]=Emissionfactor[lb/MMBtu]*Heatinputcapacity[MMBtu/hr]*Annualhoursofoperation[hrs/yr]/2,000lb/ton
2.VOCiscomputedasterpene+methanol+formaldehyde
3.TotalPM/PM10/PM2.5emissionsarethesumoffilterableandcondensableparticulate.
4.CO2ebasedonthebiomassdeferralexcludesbiogenicCO 2emissions(e.g.,frombiomass)pertheBiomassDeferralpublishedinFederalRegisterVol.76,No.139,onJuly20,2011.
3.Theannualproductioncapacityisbasedontheprojectedlengthsofthecenterchambersfortheproposedkilnsandalumberproductionvalueof1.1MMBF/year/footlengthofthecenterchamber.Thehourlyproductioncapacitywascalculatedbasedontheannualhoursofoperationofthekilns.
ProductionCapacity3
KD04Emissions KD05Emissions TotalKilnPTE
TrinityConsultants Page25of37AugustaExpansionProjectEmissionsAnalysis(2012126JSFinalUpdates)
KD04&KD05PTE
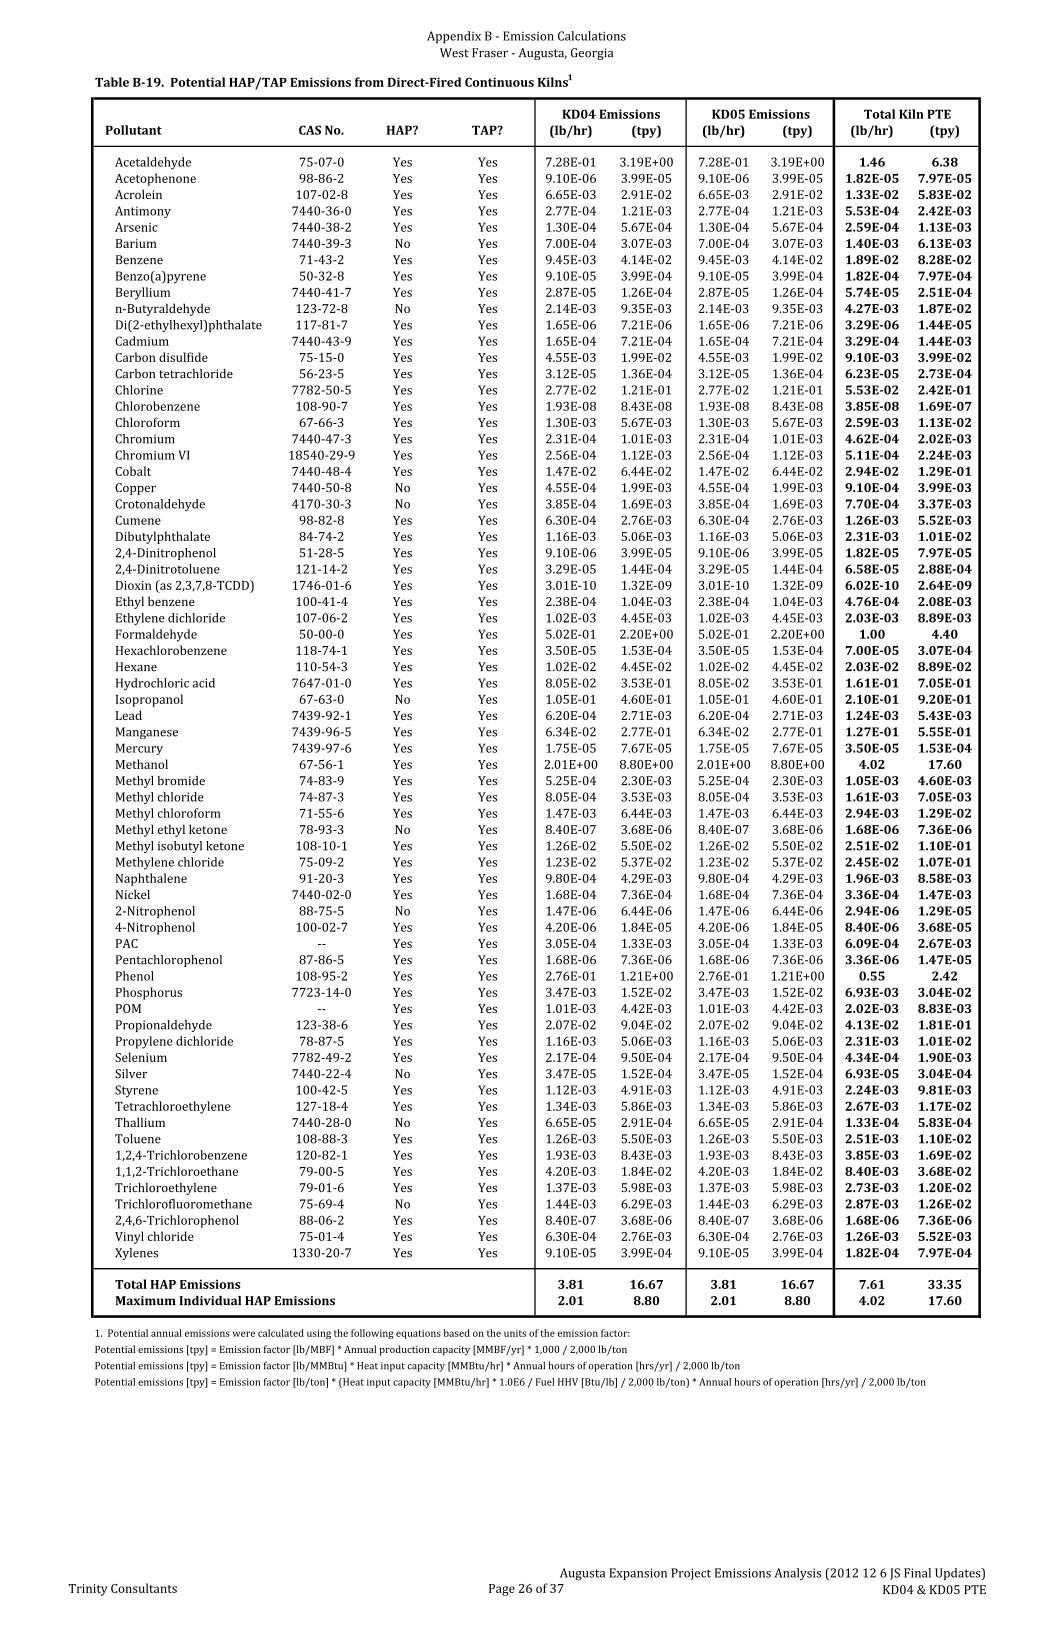
AppendixB‐EmissionCalculationsWestFraser‐Augusta,Georgia
TableB‐19.PotentialHAP/TAPEmissionsfromDirect‐FiredContinuousKilns1
Pollutant CASNo. HAP? TAP? (lb/hr) (tpy) (lb/hr) (tpy) (lb/hr) (tpy)
Acetaldehyde 75‐07‐0 Yes Yes 7.28E‐01 3.19E+00 7.28E‐01 3.19E+00 1.46 6.38Acetophenone 98‐86‐2 Yes Yes 9.10E‐06 3.99E‐05 9.10E‐06 3.99E‐05 1.82E‐05 7.97E‐05Acrolein 107‐02‐8 Yes Yes 6.65E‐03 2.91E‐02 6.65E‐03 2.91E‐02 1.33E‐02 5.83E‐02Antimony 7440‐36‐0 Yes Yes 2.77E‐04 1.21E‐03 2.77E‐04 1.21E‐03 5.53E‐04 2.42E‐03Arsenic 7440‐38‐2 Yes Yes 1.30E‐04 5.67E‐04 1.30E‐04 5.67E‐04 2.59E‐04 1.13E‐03Barium 7440‐39‐3 No Yes 7.00E‐04 3.07E‐03 7.00E‐04 3.07E‐03 1.40E‐03 6.13E‐03Benzene 71‐43‐2 Yes Yes 9.45E‐03 4.14E‐02 9.45E‐03 4.14E‐02 1.89E‐02 8.28E‐02Benzo(a)pyrene 50‐32‐8 Yes Yes 9.10E‐05 3.99E‐04 9.10E‐05 3.99E‐04 1.82E‐04 7.97E‐04Beryllium 7440‐41‐7 Yes Yes 2.87E‐05 1.26E‐04 2.87E‐05 1.26E‐04 5.74E‐05 2.51E‐04n‐Butyraldehyde 123‐72‐8 No Yes 2.14E‐03 9.35E‐03 2.14E‐03 9.35E‐03 4.27E‐03 1.87E‐02Di(2‐ethylhexyl)phthalate 117‐81‐7 Yes Yes 1.65E‐06 7.21E‐06 1.65E‐06 7.21E‐06 3.29E‐06 1.44E‐05Cadmium 7440‐43‐9 Yes Yes 1.65E‐04 7.21E‐04 1.65E‐04 7.21E‐04 3.29E‐04 1.44E‐03Carbondisulfide 75‐15‐0 Yes Yes 4.55E‐03 1.99E‐02 4.55E‐03 1.99E‐02 9.10E‐03 3.99E‐02Carbontetrachloride 56‐23‐5 Yes Yes 3.12E‐05 1.36E‐04 3.12E‐05 1.36E‐04 6.23E‐05 2.73E‐04Chlorine 7782‐50‐5 Yes Yes 2.77E‐02 1.21E‐01 2.77E‐02 1.21E‐01 5.53E‐02 2.42E‐01Chlorobenzene 108‐90‐7 Yes Yes 1.93E‐08 8.43E‐08 1.93E‐08 8.43E‐08 3.85E‐08 1.69E‐07Chloroform 67‐66‐3 Yes Yes 1.30E‐03 5.67E‐03 1.30E‐03 5.67E‐03 2.59E‐03 1.13E‐02Chromium 7440‐47‐3 Yes Yes 2.31E‐04 1.01E‐03 2.31E‐04 1.01E‐03 4.62E‐04 2.02E‐03ChromiumVI 18540‐29‐9 Yes Yes 2.56E‐04 1.12E‐03 2.56E‐04 1.12E‐03 5.11E‐04 2.24E‐03Cobalt 7440‐48‐4 Yes Yes 1.47E‐02 6.44E‐02 1.47E‐02 6.44E‐02 2.94E‐02 1.29E‐01Copper 7440‐50‐8 No Yes 4.55E‐04 1.99E‐03 4.55E‐04 1.99E‐03 9.10E‐04 3.99E‐03Crotonaldehyde 4170‐30‐3 No Yes 3.85E‐04 1.69E‐03 3.85E‐04 1.69E‐03 7.70E‐04 3.37E‐03Cumene 98‐82‐8 Yes Yes 6.30E‐04 2.76E‐03 6.30E‐04 2.76E‐03 1.26E‐03 5.52E‐03Dibutylphthalate 84‐74‐2 Yes Yes 1.16E‐03 5.06E‐03 1.16E‐03 5.06E‐03 2.31E‐03 1.01E‐022,4‐Dinitrophenol 51‐28‐5 Yes Yes 9.10E‐06 3.99E‐05 9.10E‐06 3.99E‐05 1.82E‐05 7.97E‐052,4‐Dinitrotoluene 121‐14‐2 Yes Yes 3.29E‐05 1.44E‐04 3.29E‐05 1.44E‐04 6.58E‐05 2.88E‐04Dioxin(as2,3,7,8‐TCDD) 1746‐01‐6 Yes Yes 3.01E‐10 1.32E‐09 3.01E‐10 1.32E‐09 6.02E‐10 2.64E‐09Ethylbenzene 100‐41‐4 Yes Yes 2.38E‐04 1.04E‐03 2.38E‐04 1.04E‐03 4.76E‐04 2.08E‐03Ethylenedichloride 107‐06‐2 Yes Yes 1.02E‐03 4.45E‐03 1.02E‐03 4.45E‐03 2.03E‐03 8.89E‐03Formaldehyde 50‐00‐0 Yes Yes 5.02E‐01 2.20E+00 5.02E‐01 2.20E+00 1.00 4.40Hexachlorobenzene 118‐74‐1 Yes Yes 3.50E‐05 1.53E‐04 3.50E‐05 1.53E‐04 7.00E‐05 3.07E‐04Hexane 110‐54‐3 Yes Yes 1.02E‐02 4.45E‐02 1.02E‐02 4.45E‐02 2.03E‐02 8.89E‐02Hydrochloricacid 7647‐01‐0 Yes Yes 8.05E‐02 3.53E‐01 8.05E‐02 3.53E‐01 1.61E‐01 7.05E‐01Isopropanol 67‐63‐0 No Yes 1.05E‐01 4.60E‐01 1.05E‐01 4.60E‐01 2.10E‐01 9.20E‐01Lead 7439‐92‐1 Yes Yes 6.20E‐04 2.71E‐03 6.20E‐04 2.71E‐03 1.24E‐03 5.43E‐03Manganese 7439‐96‐5 Yes Yes 6.34E‐02 2.77E‐01 6.34E‐02 2.77E‐01 1.27E‐01 5.55E‐01Mercury 7439‐97‐6 Yes Yes 1.75E‐05 7.67E‐05 1.75E‐05 7.67E‐05 3.50E‐05 1.53E‐04Methanol 67‐56‐1 Yes Yes 2.01E+00 8.80E+00 2.01E+00 8.80E+00 4.02 17.60Methylbromide 74‐83‐9 Yes Yes 5.25E‐04 2.30E‐03 5.25E‐04 2.30E‐03 1.05E‐03 4.60E‐03Methylchloride 74‐87‐3 Yes Yes 8.05E‐04 3.53E‐03 8.05E‐04 3.53E‐03 1.61E‐03 7.05E‐03Methylchloroform 71‐55‐6 Yes Yes 1.47E‐03 6.44E‐03 1.47E‐03 6.44E‐03 2.94E‐03 1.29E‐02Methylethylketone 78‐93‐3 No Yes 8.40E‐07 3.68E‐06 8.40E‐07 3.68E‐06 1.68E‐06 7.36E‐06Methylisobutylketone 108‐10‐1 Yes Yes 1.26E‐02 5.50E‐02 1.26E‐02 5.50E‐02 2.51E‐02 1.10E‐01Methylenechloride 75‐09‐2 Yes Yes 1.23E‐02 5.37E‐02 1.23E‐02 5.37E‐02 2.45E‐02 1.07E‐01Naphthalene 91‐20‐3 Yes Yes 9.80E‐04 4.29E‐03 9.80E‐04 4.29E‐03 1.96E‐03 8.58E‐03Nickel 7440‐02‐0 Yes Yes 1.68E‐04 7.36E‐04 1.68E‐04 7.36E‐04 3.36E‐04 1.47E‐032‐Nitrophenol 88‐75‐5 No Yes 1.47E‐06 6.44E‐06 1.47E‐06 6.44E‐06 2.94E‐06 1.29E‐054‐Nitrophenol 100‐02‐7 Yes Yes 4.20E‐06 1.84E‐05 4.20E‐06 1.84E‐05 8.40E‐06 3.68E‐05PAC ‐‐ Yes Yes 3.05E‐04 1.33E‐03 3.05E‐04 1.33E‐03 6.09E‐04 2.67E‐03Pentachlorophenol 87‐86‐5 Yes Yes 1.68E‐06 7.36E‐06 1.68E‐06 7.36E‐06 3.36E‐06 1.47E‐05Phenol 108‐95‐2 Yes Yes 2.76E‐01 1.21E+00 2.76E‐01 1.21E+00 0.55 2.42Phosphorus 7723‐14‐0 Yes Yes 3.47E‐03 1.52E‐02 3.47E‐03 1.52E‐02 6.93E‐03 3.04E‐02POM ‐‐ Yes Yes 1.01E‐03 4.42E‐03 1.01E‐03 4.42E‐03 2.02E‐03 8.83E‐03Propionaldehyde 123‐38‐6 Yes Yes 2.07E‐02 9.04E‐02 2.07E‐02 9.04E‐02 4.13E‐02 1.81E‐01Propylenedichloride 78‐87‐5 Yes Yes 1.16E‐03 5.06E‐03 1.16E‐03 5.06E‐03 2.31E‐03 1.01E‐02Selenium 7782‐49‐2 Yes Yes 2.17E‐04 9.50E‐04 2.17E‐04 9.50E‐04 4.34E‐04 1.90E‐03Silver 7440‐22‐4 No Yes 3.47E‐05 1.52E‐04 3.47E‐05 1.52E‐04 6.93E‐05 3.04E‐04Styrene 100‐42‐5 Yes Yes 1.12E‐03 4.91E‐03 1.12E‐03 4.91E‐03 2.24E‐03 9.81E‐03Tetrachloroethylene 127‐18‐4 Yes Yes 1.34E‐03 5.86E‐03 1.34E‐03 5.86E‐03 2.67E‐03 1.17E‐02Thallium 7440‐28‐0 No Yes 6.65E‐05 2.91E‐04 6.65E‐05 2.91E‐04 1.33E‐04 5.83E‐04Toluene 108‐88‐3 Yes Yes 1.26E‐03 5.50E‐03 1.26E‐03 5.50E‐03 2.51E‐03 1.10E‐021,2,4‐Trichlorobenzene 120‐82‐1 Yes Yes 1.93E‐03 8.43E‐03 1.93E‐03 8.43E‐03 3.85E‐03 1.69E‐021,1,2‐Trichloroethane 79‐00‐5 Yes Yes 4.20E‐03 1.84E‐02 4.20E‐03 1.84E‐02 8.40E‐03 3.68E‐02Trichloroethylene 79‐01‐6 Yes Yes 1.37E‐03 5.98E‐03 1.37E‐03 5.98E‐03 2.73E‐03 1.20E‐02Trichlorofluoromethane 75‐69‐4 No Yes 1.44E‐03 6.29E‐03 1.44E‐03 6.29E‐03 2.87E‐03 1.26E‐022,4,6‐Trichlorophenol 88‐06‐2 Yes Yes 8.40E‐07 3.68E‐06 8.40E‐07 3.68E‐06 1.68E‐06 7.36E‐06Vinylchloride 75‐01‐4 Yes Yes 6.30E‐04 2.76E‐03 6.30E‐04 2.76E‐03 1.26E‐03 5.52E‐03Xylenes 1330‐20‐7 Yes Yes 9.10E‐05 3.99E‐04 9.10E‐05 3.99E‐04 1.82E‐04 7.97E‐04
TotalHAPEmissions 3.81 16.67 3.81 16.67 7.61 33.35MaximumIndividualHAPEmissions 2.01 8.80 2.01 8.80 4.02 17.60
1.Potentialannualemissionswerecalculatedusingthefollowingequationsbasedontheunitsoftheemissionfactor:
Potentialemissions[tpy]=Emissionfactor[lb/MBF]*Annualproductioncapacity[MMBF/yr]*1,000/2,000lb/ton
Potentialemissions[tpy]=Emissionfactor[lb/MMBtu]*Heatinputcapacity[MMBtu/hr]*Annualhoursofoperation[hrs/yr]/2,000lb/ton
Potentialemissions[tpy]=Emissionfactor[lb/ton]*(Heatinputcapacity[MMBtu/hr]*1.0E6/FuelHHV[Btu/lb]/2,000lb/ton)*Annualhoursofoperation[hrs/yr]/2,000lb/ton
KD04Emissions KD05Emissions TotalKilnPTE
TrinityConsultants Page26of37AugustaExpansionProjectEmissionsAnalysis(2012126JSFinalUpdates)
KD04&KD05PTE

AppendixB‐EmissionCalculationsWestFraser‐Augusta,Georgia
TableB‐20.ProposedLumberIncreasesviaProject
MaterialPastPotentialThroughput1
FuturePotential
Throughput
ThroughputIncrease(tpy)
Wood/Lumber(MMBF/yr) 157 220 63.00Wood/Lumber(tpy)2 659,400 924,000 264,600
TableB‐21.EmissionIncreasesforSawingandDebarking
Emission ControlFactor Efficiency1
EmissionSource Pollutant (lb/ton) (%) (lb/hr)2 (tpy)3
LogSawing4 8,760 PM 0.350 90% 1.06 4.63PM10
6 0.007 90% 0.02 0.09
PM2.57 0.007 90% 0.02 0.09
Debarking5 8,760 PM 0.020 90% 0.06 0.26PM10 0.011 90% 0.03 0.15
PM2.57 0.011 90% 0.03 0.15
7.ItisassumedthatPM10=PM2.5.
4.EmissionfactorsfromEIIPUncontrolledEmissionFactors(July2001),pertheFactorInformationRetrieval(FIRE)databasemanagementsystem,version6.23forSCCCode3‐07‐008‐02,LogSawing.5.EmissionfactorsfromEIIPUncontrolledEmissionFactors(July2001),pertheFactorInformationRetrieval(FIRE)databasemanagementsystem,version6.23forSCCCode3‐07‐008‐01,LogDebarking.6.Perthedocumententitled"EstimatingEmissionsFromGenerationandCombustionof'Waste'Wood‐Draft"(July1998)bytheNorthCarolinaDivisionofAirQuality(NCDAQ),thepercentageofPMemittedfromsawingoperationsthatisPM10is1.89%.
1.Pastpotentialthroughputisthemaximumlumberdryingcapacityofthemill,asstatedintheirmostrecentTitleVPermitNo.2421‐245‐0047‐V‐04‐0,issuedJune2012.
2.Wood/Lumber[tpy]=Wood/Lumber[MMBF/yr]×4.2tons/MBF×1,000MBF/MMBF.Afactorof4.2tons/MBFwasprovidedbythemill.
AnnualHoursofOperation
PotentialEmissionsIncrease
1.BasedonguidancebytheTexasCommissiononEnvironmentalQuality(TCEQ)entitled"RockCrushingPlants"(Feb.2002),acontrolefficiencyof90%shouldbeappliedforworkperformedfullyenclosed.
2.PotentialHourlyEmissionsIncrease[lb/hr]=PotentialAnnualEmissionsIncrease[tpy]×2,000lb/ton/AnnualHoursofOperation[hr/yr]3.PotentialAnnualEmissionsIncrease[tpy]=Emissionfactor[lb/ton]×(1‐ControlEfficiency[%])×AssociatedThroughputIncrease[ton/yr]/2,000lb/ton
TrinityConsultants Page27of37AugustaExpansionProjectEmissionsAnalysis(2012126JSFinalUpdates)
SawingandDebarking

AppendixB‐EmissionCalculationsWestFraser‐Augusta,Georgia
TableB‐22.ProposedByproductIncreasesviaProject
Material
PastPotential
Throughput1
(tpy)
FuturePotential
Throughput1
(tpy)Increase(tpy)
Chips 191,226 267,960 76,734Bark 39,564 55,440 15,876Sawdust 65,940 92,400 26,460Shavings 59,346 83,160 23,814
1.Ratiosofbyproductproductiontolumberproductionarebasedonthemill'sMarch2011TitleVrenewalapplication.
TableB‐23.EmissionIncreasesforMaterialTransferSources
EmissionSource PM PM10 PM2.5 PM PM10 PM2.5 PM PM10 PM2.5
ChipTruckLoading 8,760 3.98E‐04 1.88E‐04 2.85E‐05 3.49E‐03 1.65E‐03 2.50E‐04 1.53E‐02 7.22E‐03 1.09E‐03BarkTruckLoading 8,760 3.98E‐04 1.88E‐04 2.85E‐05 7.21E‐04 3.41E‐04 5.17E‐05 3.16E‐03 1.49E‐03 2.26E‐04SawdustTruckLoading 8,760 3.98E‐04 1.88E‐04 2.85E‐05 1.20E‐03 5.69E‐04 8.61E‐05 5.27E‐03 2.49E‐03 3.77E‐04ShavingsTruckLoading 8,760 3.98E‐04 1.88E‐04 2.85E‐05 1.08E‐03 5.12E‐04 7.75E‐05 4.74E‐03 2.24E‐03 3.39E‐04
BarkTransfer 8,760 3.98E‐04 1.88E‐04 2.85E‐05 7.21E‐04 3.41E‐04 5.17E‐05 3.16E‐03 1.49E‐03 2.26E‐04SawdustTransfer 8,760 3.98E‐04 1.88E‐04 2.85E‐05 1.20E‐03 5.69E‐04 8.61E‐05 5.27E‐03 2.49E‐03 3.77E‐04ChipsTransfer 8,760 3.98E‐04 1.88E‐04 2.85E‐05 3.49E‐03 1.65E‐03 2.50E‐04 1.53E‐02 7.22E‐03 1.09E‐03ShavingsTransfer 8,760 3.98E‐04 1.88E‐04 2.85E‐05 1.08E‐03 5.12E‐04 7.75E‐05 4.74E‐03 2.24E‐03 3.39E‐04
1.EmissionfactorperAP‐42Section13.2.4,AggregateHandlingandStoragePiles (Nov.2006),Equation1,asfollows:
E=k(0.0032)[(U/5)^1.3]/[(M/2)^1.4]
where E= emissionfactorinpoundspertonk= particlesizemultiplierasfollows:
0.74 forPM0.35 forPM10
0.053 forPM2.5
U= 6.408 mph;averagewindspeedforAugusta,GAfromTANKS4.0.9dM= 9 %;materialmoisturecontent(engineeringestimate,asnotedintheMarch2011TitleVrenewalapplication)
2.PotentialHourlyEmissionsIncrease[lb/hr]=PotentialAnnualEmissionsIncrease[tpy]×2,000lb/ton/AnnualHoursofOperation[hrs/yr]
3.PotentialAnnualEmissionsIncrease[tpy]=EmissionFactor[lb/ton]×AssociatedThroughputIncrease[ton/year]/2,000lb/ton
AnnualHoursofOperation
CalculatedEmissionFactors1PotentialHourlyEmissions
Increase2PotentialAnnualEmissions
Increase3
(lb/ton) (lb/hr) (tpy)
TrinityConsultants Page28of37AugustaExpansionProjectEmissionsAnalysis(2012126JSFinalUpdates)
MaterialTransfer,Chip,Hog

AppendixB‐EmissionCalculationsWestFraser‐Augusta,Georgia
TableB‐24.ProposedLumberIncreasesviaProject
Material
PastPotential
Throughput1
(tpy)
FuturePotential
Throughput1
(tpy)Increase(tpy)
Chipper 191,226 267,960 76,734Hogger 65,940 92,400 26,460
1.Throughputsforthechipperandhoggerarebasedonthepastpotentialandfuturepotentialproductionofchipsandsawdustatthefacility,respectively.
TableB‐25.EmissionIncreasesforHoggerandChipper
Emission ControlFactor1 Efficiency2
EmissionSource Pollutant (lb/ton) (%) (lb/hr)3 (tpy)4
Chipper 8,760 PM 0.020 90% 1.75E‐02 7.67E‐02PM10 0.011 90% 9.64E‐03 4.22E‐02
PM2.55 0.011 90% 9.64E‐03 4.22E‐02
Hogger 8,760 PM 0.020 90% 6.04E‐03 2.65E‐02PM10 0.011 90% 3.32E‐03 1.46E‐02
PM2.55 0.011 90% 3.32E‐03 1.46E‐02
3.PotentialHourlyEmissionsIncrease[lb/hr]=PotentialAnnualEmissionsIncrease[tpy]×2,000lb/ton/AnnualHoursofOperation[hr/yr]
4.PotentialEmissionsIncrease[tpy]=Emissionfactor[lb/ton]×(1‐ControlEfficiency[%])×AssociatedThroughputIncrease[ton/yr]/2,000lb/ton
5.ItisassumedthatPM10=PM2.5.
AnnualHoursofOperation
EmissionsIncrease
1.EmissionfactorsfromEIIPUncontrolledEmissionFactors(July2001),pertheFactorInformationRetrieval(FIRE)databasemanagementsystem,version6.23forSCCCode3‐07‐008‐01,LogDebarking.2.BasedonguidancefromtheTexasCommissiononEnvironmentalQuality(TCEQ)entitled"RockCrushingPlants"(Feb.2002),acontrolefficiencyof90%shouldbeappliedforworkperformedfullyenclosed.
TrinityConsultants Page29of37AugustaExpansionProjectEmissionsAnalysis(2012126JSFinalUpdates)
MaterialTransfer,Chip,Hog

AppendixB‐EmissionCalculationsWestFraser‐Augusta,Georgia
TableB‐26.ProposedRoadTrafficIncreases
Material
PastPotentialNumberofTrucksPerYear1
FuturePotentialNumberofTrucksPerYear2
TruckIncreasePerYear
LogTruck 24,500 34,331 9,831LumberTruck 6,800 9,529 2,729BarkTruck 3,600 5,045 1,445ChipTruck 17,400 24,382 6,982ShavingsTruck 5,400 7,567 2,167SawdustTruck 180 252 72Forklift 7 8 1Bobcat 2 2 0
1.Pastpotentialnumberoftrucksperyeardatafromthemill'sMarch2011TitleVrenewalapplication.2.Futurepotentialtrucksperyear=Pastpotentialtrucksperyear×(Futurepotentialproduction[MMBF/yr]/Pastpotentialproduction[MMBF/yr]).
TableB‐27.InputsforIncreasedEmissionsfromRoadTravel
PavedRoads UnpavedRoadsSource (tons) (tons) (tons) (ft) (ft) (Days) (VMT/day) (VMT/yr) (VMT/day) (VMT/yr)
LogTruck 16 43 29.5 2,640 365 26.93 ‐ ‐ 13.47 4,916LumberTruck 16 39 27.5 2,640 365 7.48 ‐ ‐ 3.74 1,364BarkTruck 16 27 21.5 2,640 365 3.96 ‐ ‐ 1.98 722ChipTruck 16 27 21.5 2,640 365 19.13 ‐ ‐ 9.56 3,491ShavingsTruck 16 27 21.5 2,640 365 5.94 ‐ ‐ 2.97 1,083SawdustTruck 16 27 21.5 2,640 365 0.20 ‐ ‐ 0.10 36.11Forklift ‐ ‐ 16.5 N/A ‐ 365 0.00 109.59 40,000 ‐ ‐Bobcat ‐ ‐ 16.5 N/A ‐ 365 ‐ 0.00 0 ‐ ‐
1.Datatakenfromthemill'sMarch2011TitleVrenewalapplication.
Futurepotentialvehiclemilestraveled[VMT/yr]=Pastpotentialvehiclemilestraveled[VMT/yr]×(Futurepotentialthroughput[MMBF/yr]/Pastpotentialthroughput[MMBF/yr]‐1).
ThevaluesshownhererepresenttheincreasefrompastpotentialVMT/yrtofuturepotentialVMT/yr.
EventsPerYear1
IncreaseinNumberofTrucksPer
Day
2.Thepastpotentialvehiclemilestraveled(VMT)peryearvaluefortheforkliftsandbobcatsattheAugustaMillare198,750VMT/yrforthealltheforkliftsand25,000VMT/yrforallthebobcats.Thevalueswereroundeduptoaccountfortheincreaseinproductionusingthefollowingequation:
IncreaseinVehicleMilesTraveled
PavedRoads2 UnpavedRoads
TruckWeightEmpty1
TruckWeightLoaded1
AverageWeight(W)
DistanceTraveledperRoundTrip1
TrinityConsultants Page30of37AugustaExpansionProjectEmissionsAnalysis(2012126JSFinalUpdates)
Roads

AppendixB‐EmissionCalculationsWestFraser‐Augusta,Georgia
TableB‐28.PotentialHourlyFugitiveEmissionIncreasesfromRoadTravel
FilterablePM FilterablePM10 FilterablePM2.5
Source PM PM10 PM2.5 (lb/hr) (lb/hr) (lb/hr)
PavedRoadTravelLogTruck 1.35 0.27 0.07 ‐ ‐ ‐LumberTruck 1.26 0.25 0.06 ‐ ‐ ‐BarkTruck 0.98 0.20 0.05 ‐ ‐ ‐ChipTruck 0.98 0.20 0.05 ‐ ‐ ‐ShavingsTruck 0.98 0.20 0.05 ‐ ‐ ‐SawdustTruck 0.98 0.20 0.05 ‐ ‐ ‐Forklift 0.75 0.15 0.04 3.41 0.68 0.17Bobcat 0.75 0.15 0.04 0.00 0.00 0.00TotalPaved 3.41 0.68 0.17
UnpavedRoadTravelLogTruck 5.34 1.52 0.15 3.00 0.85 0.09LumberTruck 5.17 1.47 0.15 0.81 0.23 0.02BarkTruck 4.63 1.32 0.13 0.38 0.11 0.01ChipTruck 4.63 1.32 0.13 1.85 0.53 0.05ShavingsTruck 4.63 1.32 0.13 0.57 0.16 0.02SawdustTruck 4.63 1.32 0.13 0.02 5.44E‐03 5.44E‐04Forklift 4.11 1.17 0.12 ‐ ‐ ‐Bobcat 4.11 1.17 0.12 ‐ ‐ ‐TotalUnpaved 6.62 1.89 0.19
TotalRoadEmissions 10.03 2.57 0.36
1.PavedRoadsEmissionFactor(lb/VMT)=k(sL)^0.91×(W)^1.02,perAP‐42Section13.2.1, PavedRoads (Jan.2011),Equation1,withvariablesdefinedasfollows:PM‐k(lb/VMT)= 0.011 ParticlesizemultiplierforPMperAP‐42,Table13.2.1‐1
PM10‐k(lb/VMT)= 0.0022 ParticlesizemultiplierforPM10perAP‐42,Table13.2.1‐1
PM2.5‐k(lb/VMT)= 0.00054 ParticlesizemultiplierforPM2.5perAP‐42,Table13.2.1‐1
sL(g/m2)= 4.45 Basedonsite‐specificdataforsiltloadingfromthemill'sMarch2011TitleVrenewalapplication2.UnpavedRoadsEmissionFactor(lb/VMT)=[k(s/12)^a×(W/3)^b]×(100%‐%controlefficiency),perAP‐42Section13.2.2,UnpavedRoads(Nov.2006),Equation1a,withvariablesdefinedasfollows:
PM‐k(lb/VMT)= 4.9 ParticlesizemultiplierforPMperAP‐42,Table13.2.2‐2PM10‐k(lb/VMT)= 1.5 ParticlesizemultiplierforPM10perAP‐42,Table13.2.2‐2
PM2.5‐k(lb/VMT)= 0.15 ParticlesizemultiplierforPM2.5perAP‐42,Table13.2.2‐2
PM‐a= 0.7 EmpiricalconstantforPMperAP‐42,Table13.2.2‐2
PM10andPM2.5‐a= 0.9 EmpiricalconstantforPM10andPM2.5perAP‐42,Table13.2.2‐2
b= 0.45 EmpiricalconstantforindustrialroadsperAP‐42,Table13.2.2‐2s(%)= 8.4 SurfacesiltcontentbasedonmedianvalueforlumbersawmillsperAP‐42,Table13.2.2‐1
%controlefficiency= 50.0 %controlefficiency3.Potentialemissionscalculatedasappropriateemissionfactormultipliedbyvehiclemilestraveledpertimeperiod.Note,WestFraserconservativelyestimatedhourlyemissionsusingtheemissionfactoronadailybasisbecauseanemissionfactoronanhourlybasiscalculatedperEquation3resultsinlowerpotentialemissions.
EmissionFactor1,2
(lb/VMT)IncreaseinPotentialFugitiveEmissions3
TrinityConsultants Page31of37AugustaExpansionProjectEmissionsAnalysis(2012126JSFinalUpdates)
Roads

AppendixB‐EmissionCalculationsWestFraser‐Augusta,Georgia
TableB‐29.PotentialAnnualFugitiveEmissionIncreasesfromRoadTravel
FilterablePM FilterablePM10 FilterablePM2.5
Source PM PM10 PM2.5 (tpy) (tpy) (tpy)
PavedRoadTravelLogTruck 1.24 0.25 0.06 ‐ ‐ ‐LumberTruck 1.15 0.23 0.06 ‐ ‐ ‐BarkTruck 0.90 0.18 0.04 ‐ ‐ ‐ChipTruck 0.90 0.18 0.04 ‐ ‐ ‐ShavingsTruck 0.90 0.18 0.04 ‐ ‐ ‐SawdustTruck 0.90 0.18 0.04 ‐ ‐ ‐Forklift 0.69 0.14 0.03 13.71 2.74 0.67Bobcat 0.69 0.14 0.03 0.00 0.00 0.00TotalPaved 13.71 2.74 0.67
UnpavedRoadTravelLogTruck 3.58 1.02 0.10 8.81 2.51 0.25LumberTruck 3.47 0.99 0.10 2.37 0.68 0.07BarkTruck 3.11 0.89 0.09 1.12 0.32 0.03ChipTruck 3.11 0.89 0.09 5.43 1.55 0.15ShavingsTruck 3.11 0.89 0.09 1.68 0.48 0.05SawdustTruck 3.11 0.89 0.09 0.06 0.02 0.00Forklift 2.76 0.79 0.08 ‐ ‐ ‐Bobcat 2.76 0.79 0.08 ‐ ‐ ‐TotalUnpaved 19.46 5.55 0.55
TotalRoadEmissions 33.17 8.29 1.23
1.PavedRoadsEmissionFactor(lb/VMT)=[k(sL)^0.91×(W)^1.02]×[1‐P/(4N)],perAP‐42Section13.2.1, PavedRoads (Jan.2011),Equation2,withvariablesdefinedasfollows:
PM‐k(lb/VMT)= 0.011 ParticlesizemultiplierforPMperAP‐42,Table13.2.1‐1PM10‐k(lb/VMT)= 0.0022 ParticlesizemultiplierforPM10perAP‐42,Table13.2.1‐1
PM2.5‐k(lb/VMT)= 0.00054 ParticlesizemultiplierforPM2.5perAP‐42,Table13.2.1‐1
sL(g/m2)= 4.45 Basedonsite‐specificdataforsiltloadingfromthemill'sMarch2011TitleVrenewalapplicationP= 120 No.dayswithrainfallgreaterthan0.01inch,PerAP‐42,Figure13.2.1‐2N= 365 Daysinaveragingperiod
PM‐k(lb/VMT)= 4.9 ParticlesizemultiplierforPMperAP‐42,Table13.2.2‐2PM10‐k(lb/VMT)= 1.5 ParticlesizemultiplierforPM10perAP‐42,Table13.2.2‐2
PM2.5‐k(lb/VMT)= 0.15 ParticlesizemultiplierforPM2.5perAP‐42,Table13.2.2‐2
PM‐a= 0.7 EmpiricalconstantforPMperAP‐42,Table13.2.2‐2
PM10andPM2.5‐a= 0.9 EmpiricalconstantforPM10andPM2.5perAP‐42,Table13.2.2‐2
b= 0.45 EmpiricalconstantforindustrialroadsperAP‐42,Table13.2.2‐2s(%)= 8.4 SurfacesiltcontentbasedonmedianvalueforlumbersawmillsperAP‐42,Table13.2.2‐1
P= 120 No.dayswithrainfallgreaterthan0.01inch,PerAP‐42,Figure13.2.2‐1%controlefficiency= 50.0 %controlefficiency
EmissionFactor1,2
(lb/VMT)IncreaseinPotentialFugitiveEmissions3
2.UnpavedRoadsEmissionFactor(lb/VMT)=[k(s/12)^a×(W/3)^b]×[(365‐P)/365]×(100%‐%controlefficiency),perAP‐42Section13.2.2, UnpavedRoads (Nov.2006),Equations1aand2,withvariablesdefinedasfollows:
3.Potentialemissionscalculatedasappropriateemissionfactormultipliedbyvehiclemilestraveledpertimeperiod.Note,WestFraserconservativelyestimatedhourlyandannualemissionsusingtheemissionfactoronadailybasisbecauseanemissionfactoronanhourlybasiscalculatedperEquation3resultsinlowerpotentialemissions.
TrinityConsultants Page32of37AugustaExpansionProjectEmissionsAnalysis(2012126JSFinalUpdates)
Roads

AppendixB‐EmissionCalculationsWestFraser‐Augusta,Georgia
TableB‐30.TotalEmissionsIncreasefromNewUnits
KD04 KD05 (tpy)
NSRPollutantsCO 40.15 40.15 80.30Fluorides N/A N/A N/AH2S N/A N/A N/ALead 2.71E‐03 2.71E‐03 5.43E‐03NOX 15.40 15.40 30.80ReducedSulfurCompounds(includingH2S) N/A N/A N/ASO2 3.83 3.83 7.67H2SO4 N/A N/A N/ATotalPM 7.59 7.59 15.18TotalPM10 5.72 5.72 11.44TotalPM2.5 5.45 5.45 10.89TotalReducedSulfur(includingH2S) N/A N/A N/ATotalVOC 206.53 206.53 413.06
GreenhouseGasesCO2ebiomassdeferral 667.15 667.15 1,334
HAPsFormaldehyde 2.20 2.20 4.40Methanol 8.80 8.80 17.60
PotentialEmissions(tpy)
Pollutant
EmissionsIncrease
TrinityConsultants Page33of37AugustaExpansionProjectEmissionsAnalysis(2012126JSFinalUpdates)
EmissionsIncSummary(Step1)

AppendixB‐EmissionCalculationsWestFraser‐Augusta,Georgia
TableB‐31.TotalEmissionsIncreasefromAssociatedUn
(tpy)
NSRPollutantsCO N/AFluorides N/AH2S N/ALead N/ANOX N/AReducedSulfurCompounds(includingH2S) N/ASO2 N/AH2SO4 N/ATotalPM 38.23TotalPM10 8.61TotalPM2.5 1.52TotalReducedSulfur(includingH2S) N/ATotalVOC N/A
GreenhouseGasesCO2ebiomassdeferral N/A
HAPsFormaldehyde N/AMethanol N/A
Pollutant
PotentialEmissionsIncrease
TrinityConsultants Page34of37AugustaExpansionProjectEmissionsAnalysis(2012126JSFinalUpdates)
EmissionsIncSummary(Step1)
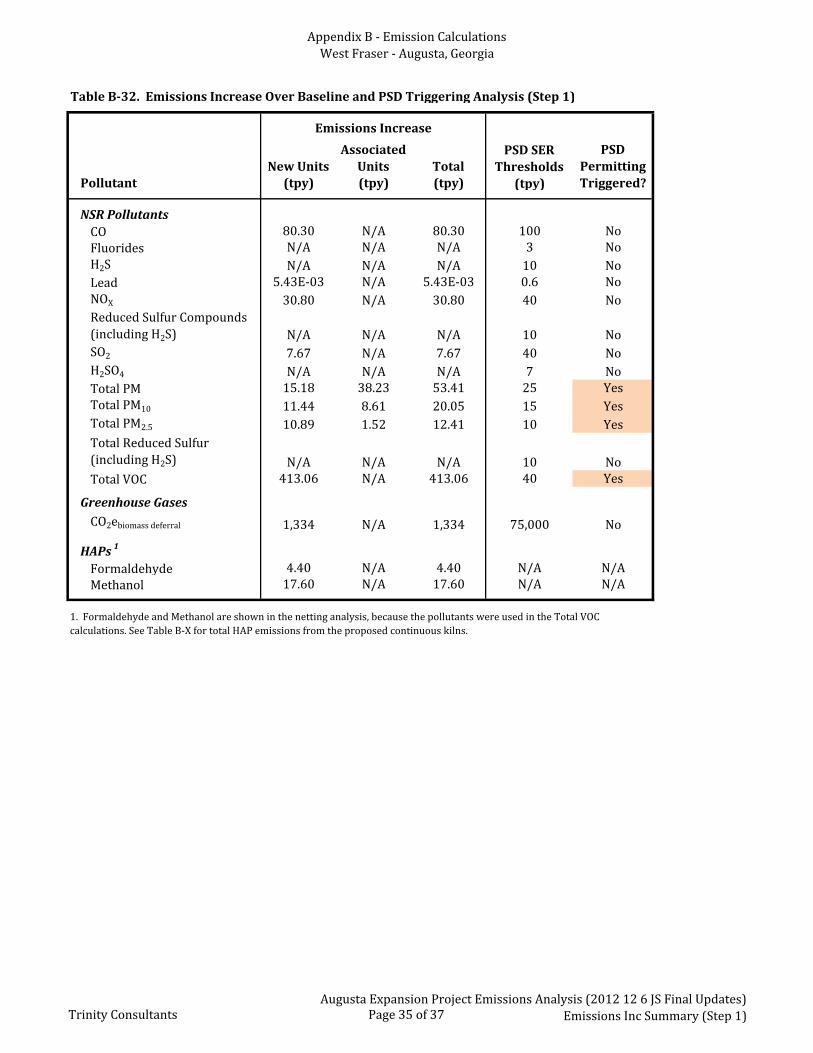
AppendixB‐EmissionCalculationsWestFraser‐Augusta,Georgia
TableB‐32.EmissionsIncreaseOverBaselineandPSDTriggeringAnalysis(Step1)
NewUnitsAssociatedUnits Total
(tpy) (tpy) (tpy) (tpy)
NSRPollutantsCO 80.30 N/A 80.30 100 NoFluorides N/A N/A N/A 3 NoH2S N/A N/A N/A 10 NoLead 5.43E‐03 N/A 5.43E‐03 0.6 NoNOX 30.80 N/A 30.80 40 NoReducedSulfurCompounds(includingH2S) N/A N/A N/A 10 NoSO2 7.67 N/A 7.67 40 NoH2SO4 N/A N/A N/A 7 NoTotalPM 15.18 38.23 53.41 25 YesTotalPM10 11.44 8.61 20.05 15 YesTotalPM2.5 10.89 1.52 12.41 10 YesTotalReducedSulfur(includingH2S) N/A N/A N/A 10 NoTotalVOC 413.06 N/A 413.06 40 Yes
GreenhouseGasesCO2ebiomassdeferral 1,334 N/A 1,334 75,000 No
HAPs 1
Formaldehyde 4.40 N/A 4.40 N/A N/AMethanol 17.60 N/A 17.60 N/A N/A
1.FormaldehydeandMethanolareshowninthenettinganalysis,becausethepollutantswereusedintheTotalVOCcalculations.SeeTableB‐XfortotalHAPemissionsfromtheproposedcontinuouskilns.
PSDPermittingTriggered?
PSDSERThresholds
EmissionsIncrease
Pollutant
TrinityConsultants Page35of37AugustaExpansionProjectEmissionsAnalysis(2012126JSFinalUpdates)
EmissionsIncSummary(Step1)
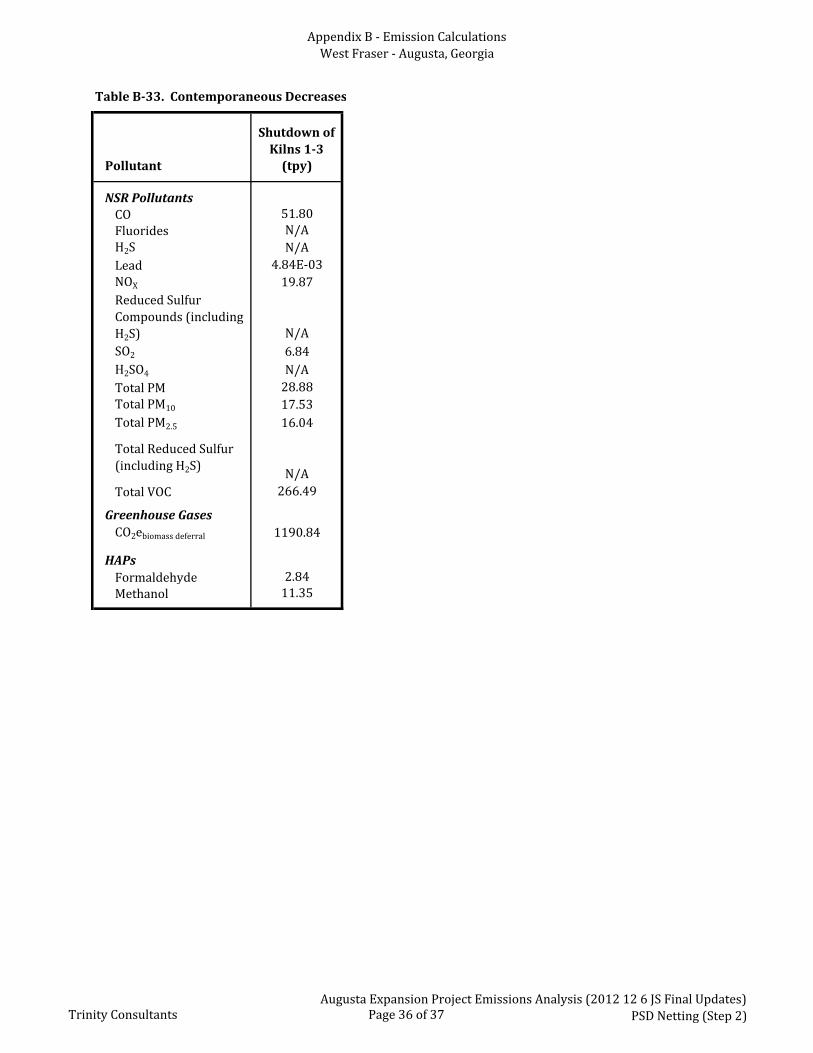
AppendixB‐EmissionCalculationsWestFraser‐Augusta,Georgia
TableB‐33.ContemporaneousDecreases
ShutdownofKilns1‐3(tpy)
NSRPollutantsCO 51.80Fluorides N/AH2S N/ALead 4.84E‐03NOX 19.87ReducedSulfurCompounds(includingH2S) N/ASO2 6.84H2SO4 N/ATotalPM 28.88TotalPM10 17.53TotalPM2.5 16.04
TotalReducedSulfur(includingH2S) N/ATotalVOC 266.49
GreenhouseGasesCO2ebiomassdeferral 1190.84
HAPsFormaldehyde 2.84Methanol 11.35
Pollutant
TrinityConsultants Page36of37AugustaExpansionProjectEmissionsAnalysis(2012126JSFinalUpdates)
PSDNetting(Step2)

AppendixB‐EmissionCalculationsWestFraser‐Augusta,Georgia
TableB‐34.NettingAnalysis
NetEmissionsChange
PSDSERThresholds
(tpy) (tpy)
NSRPollutantsCO 28.50 100 NoFluorides N/A 3 NoH2S N/A 10 NoLead 0.00 0.6 NoNOX 10.93 40 NoReducedSulfurCompounds(includingH2S) N/A 10 NoSO2 0.82 40 NoH2SO4 N/A 7 NoTotalPM 24.53 25 NoTotalPM10 2.52 15 NoTotalPM2.5 ‐3.63 10 No
TotalReducedSulfur(includingH2S) N/A 10 NoTotalVOC 146.57 40 Yes
GreenhouseGasesCO2ebiomassdeferral 143.45 75,000 No
HAPs 2
Formaldehyde 1.56 N/A N/AMethanol 6.25 N/A N/A
Pollutant
PSDPermittingTriggered?
TrinityConsultants Page37of37AugustaExpansionProjectEmissionsAnalysis(2012126JSFinalUpdates)
PSDNetting(Step2)

West Fraser, Inc. – Augusta Mill | Continuous Kiln Construction Permit Application Trinity Consultants C
APPENDIX C: GEORGIA SIP PERMIT APPLICATION FORMS


Georgia SIP Application Form 1.00, rev. October 2012 Page 2 of 4
6. Reason for Application: (Check all that apply)
New Facility (to be constructed) Revision of Data Submitted in an Earlier Application
Existing Facility (initial or modification application) Application No.:
Permit to Construct Date of Original Submittal: Permit to Operate
Change of Location
Permit to Modify Existing Equipment: Affected Permit No.:
7. Permitting Exemption Activities (for permitted facilities only):
Have any exempt modifications based on emission level per Georgia Rule 391-3-1-.03(6)(i)(3) been performed at the facility that have not been previously incorporated in a permit?
No Yes, please fill out the SIP Exemption Attachment (See Instructions for the attachment download)
8. Has assistance been provided to you for any part of this application?
No Yes, SBAP Yes, a consultant has been employed or will be employed.
If yes, please provide the following information:
Name of Consulting Company: Trinity Consultants
Name of Contact: Justin Fickas
Telephone No.: 678-441-9977 Fax No.: 678-441-9978
Email Address: [email protected]
Mailing Address: Street: 53 Perimeter Center East, Suite 230
City: Atlanta State: GA Zip: 30346
Describe the Consultant’s Involvement:
Prepared the PSD Application.
9. Submitted Application Forms: Select only the necessary forms for the facility application that will be submitted.
No. of Forms Form
1 2.00 Emission Unit List 1 2.01 Boilers and Fuel Burning Equipment
2.02 Storage Tank Physical Data 2.03 Printing Operations 2.04 Surface Coating Operations 2.05 Waste Incinerators (solid/liquid waste destruction)
1 2.06 Manufacturing and Operational Data 3.00 Air Pollution Control Devices (APCD) 3.01 Scrubbers 3.02 Baghouses & Other Filter Collectors 3.03 Electrostatic Precipitators
1 4.00 Emissions Data 5.00 Monitoring Information
1 6.00 Fugitive Emission Sources 1 7.00 Air Modeling Information
10. Construction or Modification Date
Estimated Start Date: Start of Third Quarter 2013

Georgia SIP Application Form 1.00, rev. October 2012 Page 3 of 4
11. If confidential information is being submitted in this application, were the guidelines followed in the “Procedures for Requesting that Submitted Information be treated as Confidential”?
No Yes
N/A
12. New Facility Emissions Summary
Criteria Pollutant New Facility
Potential (tpy) Actual (tpy)
Carbon monoxide (CO)
Nitrogen oxides (NOx)
Particulate Matter (PM) (filterable only)
PM <10 microns (PM10)
PM <2.5 microns (PM2.5)
Sulfur dioxide (SO2)
Volatile Organic Compounds (VOC)
Greenhouse Gases (GHGs) (in CO2e)
Total Hazardous Air Pollutants (HAPs)
Individual HAPs Listed Below:
13. Existing Facility Emissions Summary
Criteria Pollutant Current Facility After Modification
Potential (tpy) Actual (tpy) Potential (tpy) Actual (tpy)
Carbon monoxide (CO) 78.16 78.16 80.30 80.30
Nitrogen oxides (NOx) 29.98 29.98 30.80 30.80
Particulate Matter (PM) (filterable only)* 207.5 207.5 217.33 217.33
PM <10 microns (PM10) 61.63 61.63 55.23 55.23
PM <2.5 microns (PM2.5) 31.36 31.36 19.57 19.57
Sulfur dioxide (SO2) 10.36 10.36 7.67 7.67
Volatile Organic Compounds (VOC) 402.4 402.4 413.3 413.3
Greenhouse Gases (GHGs) (in CO2e)*
1,803 1,803 1,334 1,334
Total Hazardous Air Pollutants (HAPs)*
21.41 21.41 33.35 33.35
Individual HAPs Listed Below:
Formaldehyde 4.28 4.28 4.40 4.40
Methanol 17.13 17.13 17.60 17.60 *PM is listed as Total PM, as the Filterable and Condensable PM emission factors for the kilns cannot be determined from the source. The sources (quoted in the emission calculations) list a Total PM factor. All fugitive sources however only emit Filterable PM (as Condensable PM from those sources is negligible). *Biomass deferral. * HAP for existing only includes methanol plus formaldehyde.

Georgia SIP Application Form 1.00, rev. October 2012 Page 4 of 4
14. 4-Digit Facility Identification Code:
SIC Code: 2421 SIC Description: Sawmills and Planing Mills, General
NAICS Code: 321113 NAICS Description: Sawmills
15. Description of general production process and operation for which a permit is being requested. If necessary,
attach additional sheets to give an adequate description. Include layout drawings, as necessary, to describe each process. References should be made to source codes used in the application.
West Fraser is submitting this application to install two continuous dual path direct fired dry kilns at the Augusta Mill which will increase the total facility-wide production limit to 220 MMBF/yr. The three existing direct batch lumber drying kilns (KD01, KD02, and KD03), including the burners associated with all three kilns, will be shut down as part of the project. The new continuous direct-fired kilns will each operate with one green sawdust gassifier burner at a heat input capacity of 35 MMBtu/hr for a total heat input capacity of 70 MMBtu/hr for the two kilns.
16. Additional information provided in attachments as listed below:
Attachment A - Facility Plot Plan and Process Flow Diagrams
Attachment B - Detailed Emission Calculations
Attachment C - Georgia SIP Permit Application Forms
Attachment D - BACT Supporting Calculations
Attachment E - RBLC Database Report
Attachment F - Toxics Modeling
Attachment G - Title V Database
Attachment H - References
Attachment I - Letters to FLM for Class I Areas
17. Additional Information: Unless previously submitted, include the following two items:
Plot plan/map of facility location or date of previous submittal:
Flow Diagram or date of previous submittal:
18. Other Environmental Permitting Needs:
Will this facility/modification trigger the need for environmental permits/approvals (other than air) such as Hazardous Waste Generation, Solid Waste Handling, Water withdrawal, water discharge, SWPPP, mining, landfill, etc.?
No Yes, please list below:

Georgia SIP Application Form 2.00, rev. June 2005 Page 1 of 1
Facility Name: West Fraser – Augusta Lumber Mill Date of Application: December 2012
FORM 2.00 – EMISSION UNIT LIST
Emission
Unit ID Name Manufacturer and Model Number Description
KD04 Continuous Kiln 1 Custom Continuous Dual Path Direct Fired Dry Kiln No. 1
KD05 Continuous Kiln 2 Custom Continuous Dual Path Direct Fired Dry Kiln No. 2

Georgia SIP Application Form 2.01, rev. June 2005 Page 1 of 2
Facility Name: West Fraser – Augusta Lumber Mill Date of Application: December 2012
FORM 2.01 – BOILERS AND FUEL BURNING EQUIPMENT
Emission Unit ID Type of Burner Type of Draft1
Design Capacity of Unit
(MMBtu/hr Input)
Percent Excess
Air
Dates Date & Description of Last Modification
Construction Installation
KD04 Green Sawdust Gassifier Other 35 TBD 2013 2013 N/A
KD05 Green Sawdust Gassifier Other 35 TBD 2013 2013 N/A
1 This column does not have to be completed for natural gas only fired equipment.

Georgia SIP Application Form 2.01, rev. June 2005 Page 2 of 2
Facility Name: West Fraser – Augusta Lumber Mill Date of Application: December 2012
FUEL DATA
Emission Unit ID
Fuel Type
Potential Annual Consumption Hourly
Consumption Heat
Content Percent Sulfur
Percent Ash in Solid Fuel
Total Quantity Percent Use by Season
Max. Avg. Min. Avg. Max. Avg. Max. Avg. Amount Units
Ozone Season May 1 - Sept 30
Non-ozone Season
Oct 1 - Apr 30
KD04 Green
Sawdust 34,067 Ton/yr 42% 58%
7,778 lb/hr
7,778 lb/hr
4,500 Btu/lb
4,500 Btu/lb
N/A N/A N/A N/A
KD05 Green
Sawdust 34,067 Ton/yr 42% 58%
7,778 lb/hr
7,778 lb/hr
4,500 Btu/lb
4,500 Btu/lb
N/A N/A N/A N/A
Fuel Supplier Information
Fuel Type Name of Supplier Phone Number Supplier Location
Address City State Zip
N/A

Georgia SIP Application Form 2.06, rev. June 2005 Page 1 of 1
Facility Name: West Fraser – Augusta Lumber Mill Date of Application: December 2012
FORM 2.06 – MANUFACTURING AND OPERATIONAL DATA Normal Operating Schedule: 24 hours/day 7 days/week 52 weeks/yr
Additional Data Attached? - No - Yes, please include the attachment in list on Form 1.00, Item 16.
Seasonal and/or Peak Operating Periods:
N/A
Dates of Annually Occurring Shutdowns: N/A
PRODUCTION INPUT FACTORS
Emission Unit ID
Emission Unit Name Const. Date
Input Raw Material(s)
Annual Input Hourly Process Input Rate
Design Normal Maximum
KD04 Continuous Kiln 2 2013 Green Sawdust 34,067 ton/yr 7,778 lb/hr
7,778 lb/hr
7,778 lb/hr
KD05 Continuous Kiln 3 2013 Green Sawdust 34,067 ton/yr 7,778 lb/hr
7,778 lb/hr
7,778 lb/hr
PRODUCTS OF MANUFACTURING
Emission Unit ID
Description of Product Production Schedule Hourly Production Rate
(Give units: e.g. lb/hr, ton/hr)
Tons/yr Hr/yr Design Normal Maximum Units
KD04 Dimensional Lumber 462,000 8,760 52.74 52.74 52.74 Ton/hr
KD05 Dimensional Lumber 462,000 8,760 52.74 52.74 52.74 Ton/hr

Georgia SIP Application Form 4.00, rev. June 2011 Page 1 of 2
Facility Name: West Fraser – Augusta Lumber Mill Date of Application: December 2012
FORM 4.00 – EMISSION INFORMATION
Emission Unit ID
Air Pollution Control
Device ID
Stack ID
Pollutant Emitted
Emission Rates
Hourly Actual Emissions
(lb/hr)
Hourly Potential
Emissions (lb/hr)
Actual Annual
Emission (tpy)
Potential Annual
Emission (tpy)
Method of Determination
KD04 N/A N/A Total PM 1.73 1.73 7.59 7.59 NCASI Factor, from publically available document
KD04 N/A N/A
Total PM10 1.31 1.31 5.72 5.72 NCASI Factor, from publically available document
KD04 N/A N/A
Total PM2.5 1.24 1.24 5.45 5.45 NCASI Factor, from publically available document
KD04 N/A N/A
CO 9.17 9.17 40.15 40.15 NCASI Factor, from publically available document
KD04 N/A N/A
NOX 3.52 3.52 15.40 15.40 NCASI Factor, from publically available document
KD04 N/A N/A SO2 0.88 0.88 3.83 3.83 AP-42
KD04 N/A N/A
VOC 47.15 47.15 206.53 206.53 NCASI Factors, from publically available document
KD04 N/A N/A CO2ebiomass deferral 152.32 152.32 667.15 667.15
40 CFR Part 98 Subpart C
KD04 N/A N/A
Formaldehyde 0.50 0.50 2.20 2.20 NCASI Factor, from publically available document
KD04 N/A N/A
Methanol 2.01 2.01 8.80 8.80 NCASI Factor, from publically available document
KD05 N/A N/A Total PM 1.73 1.73 7.59 7.59 NCASI Factor, from publically available document

Georgia SIP Application Form 4.00, rev. June 2011 Page 2 of 2
KD05 N/A N/A
Total PM10 1.31 1.31 5.72 5.72 NCASI Factor, from publically available document
KD05 N/A N/A
Total PM2.5 1.24 1.24 5.45 5.45 NCASI Factor, from publically available document
KD05 N/A N/A
CO 9.17 9.17 40.15 40.15 NCASI Factor, from publically available document
KD05 N/A N/A
NOX 3.52 3.52 15.40 15.40 NCASI Factor, from publically available document
KD05 N/A N/A SO2 0.88 0.88 3.83 3.83 AP-42
KD05 N/A N/A
VOC 47.15 47.15 206.53 206.53 NCASI Factors, from publically available document
KD05 N/A N/A CO2ebiomass deferral 152.32 152.32 667.15 667.15
40 CFR Part 98 Subpart C
KD05 N/A N/A
Formaldehyde 0.50 0.50 2.20 2.20 NCASI Factor, from publically available document
KD05 N/A N/A
Methanol 2.01 2.01 8.80 8.80 NCASI Factor, from publically available document

Georgia SIP Application Form 6.00, rev. June 2005 Page 1 of 1
Facility Name: West Fraser – Augusta Lumber Mill Date of Application: December 2012
FORM 6.00 – FUGITIVE EMISSION SOURCES
Fugitive Emission Source ID
Description of Source Emission Reduction Precautions
Pot. Fugitive Emissions*
Amount (tpy)
Pollutant
NA Log Sawing N/A 16.17 PM
NA Log Sawing N/A 0.31 PM10/ PM2.5
NA Debarking N/A 0.92 PM
NA Debarking N/A 0.51 PM10/ PM2.5
NA Truck Unloading N/A 9.93E-02 PM
NA Truck Unloading N/A 4.70E-02 PM10
NA Truck Unloading N/A 7.11E-03 PM2.5
NA Material Transfer N/A 9.93E-02 PM
NA Material Transfer N/A 4.70E-02 PM10
NA Material Transfer N/A 7.11E-03 PM2.5
NA Chipper N/A 0.27 PM
NA Chipper N/A 0.15 PM10/ PM2.5
NA Hogger N/A 0.09 PM
NA Hogger N/A 0.05 PM10/ PM2.5
RF01/ RF02
Road Travel Periodically spraying water on the roads 184.5 PM
RF01/ RF02
Road Travel Periodically spraying water on the roads 42.68 PM10
RF01/ RF02
Road Travel Periodically spraying water on the roads 7.66 PM2.5
*Note that all numbers shown are future potential emissions for the source following the project.

Georgia SIP Application Form 7.00, rev. June 2005 Page 1 of 2
Facility Name: West Fraser – Augusta Lumber Mill Date of Application: December 2012
FORM 7.00 – AIR MODELING INFORMATION: Stack Data
Stack ID
Emission Unit ID(s)
Stack Information Dimensions of largest Structure Near Stack
Exit Gas Conditions at Maximum Emission Rate
Height Above
Grade (ft)
Inside Diameter
(ft)
Exhaust Direction
Height (ft)
Longest Side (ft)
Velocity (ft/sec)
Temperature (F)
Flow Rate (acfm)
Average Maximum
CK01A
Cont. Kiln #1 – Stack
A 35 2.26 Vertical N/A N/A 117.89 100 12,500 12,500
CK01B
Cont. Kiln #1 – Stack
B 35 2.26 Vertical N/A N/A 117.89 100 12,500 12,500
CK02A
Cont. Kiln #2 – Stack
A 35 2.26 Vertical N/A N/A 117.89 100 12,500 12,500
CK02B
Cont. Kiln #2 – Stack
B 35 2.26 Vertical N/A N/A 117.89 100 12,500 12,500
NOTE: If emissions are not vented through a stack, describe point of discharge below and, if necessary, include an attachment. List the attachment in Form 1.00 General Information, Item 16.

Georgia SIP Application Form 7.00, rev. June 2005 Page 2 of 2
Facility Name: West Fraser – Augusta Lumber Mill Date of Application: December 2012
FORM 7.00 AIR MODELING INFORMATION: Chemicals Data
Chemical Potential
Emission Rate (lb/hr)
Toxicity Reference MSDS
Attached
Methanol 4.02 See Attached See Attached
Formaldehyde 1.004 See Attached See Attached
Propionaldehyde 0.04 See Attached See Attached
Acetaldehyde 1.456 See Attached See Attached

West Fraser, Inc. – Augusta Mill | Continuous Kiln Construction Permit Application Trinity Consultants D
APPENDIX D: BACT SUPPORTING CALCULATIONS
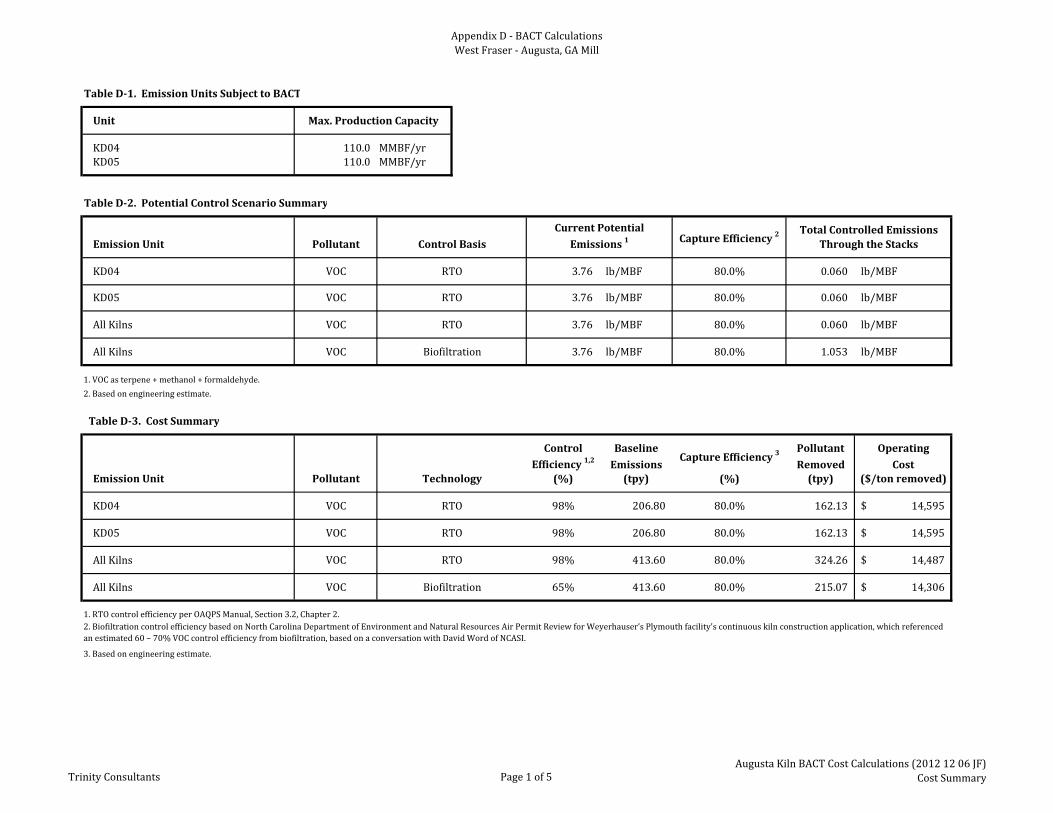
AppendixD‐BACTCalculationsWestFraser‐Augusta,GAMill
TableD‐1.EmissionUnitsSubjecttoBACT
Unit
KD04 110.0 MMBF/yrKD05 110.0 MMBF/yr
TableD‐2.PotentialControlScenarioSummary
EmissionUnit Pollutant CaptureEfficiency2
KD04 VOC 3.76 lb/MBF 80.0% 0.060 lb/MBF
KD05 VOC 3.76 lb/MBF 80.0% 0.060 lb/MBF
AllKilns VOC 3.76 lb/MBF 80.0% 0.060 lb/MBF
AllKilns VOC 3.76 lb/MBF 80.0% 1.053 lb/MBF
1.VOCasterpene+methanol+formaldehyde.
TableD‐3.CostSummary
Control Baseline Pollutant OperatingEfficiency1,2 Emissions Removed Cost
EmissionUnit Pollutant (%) (tpy) (%) (tpy) ($/tonremoved)
KD04 VOC 98% 206.80 80.0% 162.13 14,595$
KD05 VOC 98% 206.80 80.0% 162.13 14,595$
AllKilns VOC 98% 413.60 80.0% 324.26 14,487$
AllKilns VOC 65% 413.60 80.0% 215.07 14,306$
1.RTOcontrolefficiencyperOAQPSManual,Section3.2,Chapter2.
Max.ProductionCapacity
ControlBasis
RTO
2.Basedonengineeringestimate.
TotalControlledEmissionsThroughtheStacks
CurrentPotential
Emissions1
3.Basedonengineeringestimate.
Biofiltration
RTO
2.BiofiltrationcontrolefficiencybasedonNorthCarolinaDepartmentofEnvironmentandNaturalResourcesAirPermitReviewforWeyerhauser’sPlymouthfacility'scontinuouskilnconstructionapplication,whichreferencedanestimated60–70%VOCcontrolefficiencyfrombiofiltration,basedonaconversationwithDavidWordofNCASI.
CaptureEfficiency3
RTO
RTO
Technology
RTO
RTO
Biofiltration
TrinityConsultants Page1of5AugustaKilnBACTCostCalculations(20121206JF)
CostSummary

AppendixD‐BACTCalculationsWestFraser‐Augusta,GAMill
TableD‐4.CostAnalysisSupportingInformationforRTO
ParameterKiln4(KD04)
Kiln5(KD05)
2Kilnsto1RTO Units Note(s)
MaximumProductionCapacity 110 110 220 MMBF/yrUncontrolledStackInletEmissions(VOC) 165.44 165.44 330.88 tpy 1RemovalEfficiency 98 98 98 % 2VOCRemoved 162.13 162.13 324.26 tpy 3
ControlEquip.OutletTemperature 1,450 1,450 1,450 °F 4Airflow 40,471 40,471 80,942 acfm 5AirflowCaptureEfficiency 50 50 50 % 6ExhaustTemperature 130 130 130 °F 5AirMoistureContent 13.6 13.6 13.6 % 5ExhaustGasFlowRate 35,667 35,667 71,333 scfm 7SpecificHeatofDryAir 6.85 6.85 6.85 Btu/lb‐mole·°F 8SpecificHeatofWater 17.99 17.99 17.99 Btu/lb‐mole·°F 8PressureDrop 19 19 19 inchesofH2O 9FanMotorEfficiency 70 70 70 % 10FanElectricityUsage 64.3 64.3 128.5 kW‐hr 11EnergyRequiredFromFuel 61.44 61.44 122.88 MMBtu/hr 12NaturalGasHeatCapacity 1,020 1,020 1,020 MMBtu/MMscf 13
OperatingLaborCost 12.0 12.0 12.0 $/hr 14MaintenanceLaborCost 13.2 13.2 13.2 $/hr 14ElectricityCost 0.06 0.1 0.06 $/kW‐hr 15NaturalGasCost 3.3 3.3 3.3 $/1,000scf 16
RTOEquipmentLife 10 10 10 years 17InterestRate 7.0 7.0 7.0 % 17
2002$ 179.9 179.9 179.9 n/a 182012$(October) 231.3 231.3 231.3 n/a 18
1.Potentialinletemissionsbasedonmaximumcapacityandemissions.VOCasterpene+methanol+formaldehyde.
2.PerOAQPSManual,Section3.2,Chapter2.
3.VOCRemoved(tpy)=RemovalEfficiency(%)×UncontrolledStackInletEmissions(tpy).
4.Basedonaverageoperatingtemperature(1,400°F‐1,500°F)inEPAFactSheet:http://www.epa.gov/ttn/catc/dir1/fregen.pdf
5.ValuesbasedstacktestperformedonBiblerBrothersLumberCompanycontinuouslumberkilninRussellville,ARonMarch12,2009.
8.Standardvalue.
9.BasedonexampleprobleminOAQPSManual,Section3.2,Chapter2,page2‐43.
10.PerOAQPSManual,Section3.2,Chapter2,page2‐41,efficiencyrangesfrom40to70%.70%isconservativelychosen.
11.TotalFanElectricityUsagebasedonEquation2.42ofOAQPSManual,Section3.2,Chapter2,page2‐41.
13.AveragenaturalgasheatingvalueperAP‐42Section1.4NaturalGasCombustion (July1998).
14.LaborcostsperOAQPSManual,Section3.1,Chapter1,pages1‐29and1‐37.
15.BasedonOAQPS,Section2,Chapter3,page3‐32.
16.BasedonOAQPS,Section3.2,Chapter,2,page2‐46
17.BasedonexampleprobleminOAQPSManual,Section3.2,Chapter2,page2‐45.
18.ValuesbasedonU.S.HistoricalConsumerPriceIndex:ftp://ftp.bls.gov/pub/special.requests/cpi/cpiai.txt.
12.EstimatedasExhaustGasFlowRate,scfm*60,min/hr*Density(Air),0.0026lb‐mole/scf*SpecificHeat(Btu/lb‐mole·°F)*(OutletTemp‐ExhaustTemp,°F)/10 6,basedonthesensibleheatintegral,Q=mCp(T1‐T2),whereQistheheatrequired,misthemassflowrateoftheair,Cpisthespecificheatofair,T 1istheoutlettemperatureoftheRTO,andT2istheexhausttemperaturefromtheequipment.Alsoincorporatesenergyrequiredtoheatwatervapor.
7.CalculatedbasedonfuelF‐factorof11,936Btu/CF,andaccountingfor18.86percentoxygenbasedoninformationfromBiblerBrothersLumberCompanyMarch12,2009stacktestresultandmultipliedbythecaptureefficiencyof50%.
6.EngineeringestimatebasedonNorthCarolinaDepartmentofEnvironmentandNaturalResourcesAirPermitReviewforWeyerhauser’sPlymouthfacility'scontinuouskilnconstructionapplication,whichestimateda50%captureefficiencyforemissionsfromacontinuouslumberkiln.
TrinityConsultants Page2of5AugustaKilnBACTCostCalculations(20121206JF)
RTOInfo

AppendixD‐BACTCalculationsWestFraser‐Augusta,GAMill
TableD‐5.CapitalCostAnalysisforRTOforVOCControl
Kiln4(KD04) Kiln5(KD05)2Kilnsto1RTO OAQPSNotation1
PurchasedEquipmentCostsTotalEquipmentCost2 1,605,115 1,605,115 3,210,230 AInstrumentation 160,512 160,512 321,023 0.10×ASalesTax 48,153 48,153 96,307 0.03×AFreight 80,256 80,256 160,512 0.05×A
TotalPurchasedEquipmentCosts 1,894,036 1,894,036 3,788,071 B=1.18×A
DirectInstallationCostsFoundationsandSupports 151,523 151,523 303,046 0.08×BHandlingandErection 265,165 265,165 530,330 0.14×BElectrical 75,761 75,761 151,523 0.04×BPiping 37,881 37,881 75,761 0.02×BInsulation 18,940 18,940 37,881 0.01×BPainting 18,940 18,940 37,881 0.01×BSitePreparation&Buildings ‐ ‐ ‐ ‐Additionalductwork ‐ ‐ ‐ ‐
TotalDirectInstallationCosts 568,211 568,211 1,136,421 C=0.30×B
IndirectInstallationCostsEngineering 189,404 189,404 378,807 0.10×BConstructionandFieldExpense 94,702 94,702 189,404 0.05×BContractorFees 189,404 189,404 378,807 0.10×BStart‐up 37,881 37,881 75,761 0.02×BPerformanceTest 18,940 18,940 37,881 0.01×BProcessContingencies 56,821 56,821 113,642 0.03×B
TotalIndirectInstallationCosts 587,151 587,151 1,174,302 D=0.31×B
TotalCapitalInvestment($) 3,049,398 3,049,398 6,098,795 TCI=B+C+D
1.U.S.EPAOAQPS,EPAAirPollutionControlCostManual(6thEdition) ,January2002,Section3.2(VOCDestructionControls),Chapter2(Incinerators).
Minimumregenerativethermaloxidizercost 35 2002dollars/scfm
Conversionfrom2002toOctober2012dollars 1.29 October2012dollarsper2002dollar
Minimumregenerativeincineratorcost 45.00 August2012dollars/scfm
TableD‐6.OperatingCostAnalysisforRTOforVOCcontrol
Kiln4(KD04) Kiln5(KD05)2Kilnsto1RTO OAQPSNotation1
DirectAnnualCostsOperatingLabor(0.5hr,per8‐hrshift) 6,570 6,570 6,570 ESupervisoryLabor 986 986 986 F=0.15×EMaintenanceLabor(0.5hr,per8‐hrshift) 7,227 7,227 7,227 GMaintenanceMaterials 7,227 7,227 7,227 H=GElectricity 33,776 33,776 67,552 INaturalGas 1,741,248 1,741,248 3,482,495 J
TotalDirectAnnualCosts 1,797,033 1,797,033 3,572,057 DAC=E+F+G+H+I+J
IndirectAnnualCostsOverhead 13,206 13,206 13,206 K=0.60×(E+F+G+H)AdministrativeCharges 60,988 60,988 121,976 L=0.02×TCIPropertyTax 30,494 30,494 60,988 M=0.01×TCIInsurance 30,494 30,494 60,988 N=0.01×TCICapitalRecovery2 434,166 434,166 868,331 O
TotalIndirectAnnualCosts 569,347 569,347 1,125,489 IDAC=K+L+M+N+O
TotalAnnualCost($) 2,366,380 2,366,380 4,697,546 TAC=DAC+IDAC
PollutantRemoved(tpy) 162.13 162.13 324.26
CostpertonofPollutantRemoved($) 14,595 14,595 14,487 $/ton=TAC/PollutantRemoved
1.U.S.EPAOAQPS,EPAAirPollutionControlCostManual(6thEdition) ,January2002,Section3.2(VOCDestructionControls),Chapter2(Incinerators).
OperatingCost
CapitalCost
2.CapitalRecoveryfactorcalculatedbasedonEquation2.8a(Section1,Chapter2,page2‐21)andTable1.13(Section2,Chapter1,page1‐52)ofU.S.EPAOAQPS,EPAAirPollutionControlCostManual(6thEdition),January2002.
2.CapitalCostsarebasedtheEPACATCRegenerativeIncineratorFactSheet(EPA‐452/F‐03‐021)average$/scfmcapitalcost,scaledfrom2002$to2012$.
TrinityConsultants Page3of5AugustaKilnBACTCostCalculations(20121206JF)
RTOCost

AppendixD‐BACTCalculationsWestFraser‐Augusta,GAMill
TableD‐7.CostAnalysisSupportingInformationforBiofilterandKilnExhaustSystem
Parameter AllKilns Units Note(s)
MaximumProductionCapacity 220 MMBF/yrUncontrolledStackInletEmissions(VOC) 330.88 tpy 1RemovalEfficiency 65 % 2VOCRemoved 215.07 tpy 3
AirflowCaptureEfficiency 80 % 4PressureDrop 19 inchesofH2O 5FanMotorEfficiency 70.00 % 6
OperatingLaborCost 12.00 $/hr 7MaintenanceLaborCost 13.20 $/hr 7ElectricityCost 0.06 $/kW‐hr 8WaterCost 0.00 $/gal 9
KilnExhaustSystemEquipmentLife 10 years 10InterestRate 7.0 % 10
2010$(March) 217.6 n/a 112012$(October) 231.3 n/a 11
1.Potentialinletemissionsbasedonmaximumcapacityandemissions,routingbothkilnsintoonebiofilter.
5.BasedonexampleprobleminOAQPSManual,Section3.2,Chapter2,page2‐43.
6.PerOAQPSManual,Section3.2,Chapter2,page2‐41,efficiencyrangesfrom40to70%.70%isconservativelychosen.
7.LaborcostsperOAQPSManual,Section3.1,Chapter1,pages1‐29and1‐37.
8.BasedonOAQPS,Section2,Chapter3,page3‐32.
9.BasedonOAQPS,Section4.2,Chapter1,page1‐39.
10.BasedonexampleprobleminOAQPSManual,Section3.2,Chapter2,page2‐45.
11.ValuesbasedonU.S.HistoricalConsumerPriceIndex:ftp://ftp.bls.gov/pub/special.requests/cpi/cpiai.txt.
2.BiofiltrationcontrolefficiencybasedonNorthCarolinaDepartmentofEnvironmentandNaturalResourcesAirPermitReviewforWeyerhauser’sPlymouthfacilitycontinuouskilnconstructionapplication,whichreferencedanestimated60–70%VOCcontrolefficiencyfrombiofiltration,basedonaconversationwithDavidWordofNCASI.3.VOCRemoved(tpy)=RemovalEfficiency(%)×UncontrolledStackInletEmissions(tpy).VOCasterpene+methanol+formaldehyde.4.EngineeringestimatebasedonNorthCarolinaDepartmentofEnvironmentandNaturalResourcesAirPermitReviewforWeyerhauser’sPlymouthfacility'scontinuouskilnconstructionapplication,whichestimateda50%captureefficiencyforemissionsfromacontinuouslumberkiln.
TrinityConsultants Page4of5AugustaKilnBACTCostCalculations(20121206JF)
BiofiltrationInfo

AppendixD‐BACTCalculationsWestFraser‐Augusta,GAMill
TableD‐8.CapitalCostAnalysisforBiofilterandKilnExhaustSystemforVOCcontrol
AllKilns OAQPSNotation
TotalCapitalInvestment1 13,763,885 TCI
TableD‐9.OperatingCostAnalysisforBiofilterandKilnExhaustSystemforVOCcontrol
AllKilns OAQPSNotation
TotalDirectAnnualCosts 1 210,633 DAC
IndirectAnnualCosts1 342,727CapitalRecovery2 1,959,668
TotalIndirectAnnualCosts 2,866,155 IDAC
TotalAnnualCost($) 3,076,788 TAC=DAC+IDAC
PollutantRemoved(tpy) 215.07
CostpertonofPollutantRemoved($) 14,306 $/ton=TAC/PollutantRemoved
CapitalCost
OperatingCost
1.CalculatedfromtheNorthCarolinaDivisionofAirQuality(NCDAQ)AirPermitReview/PreliminaryDeterminationfortheWeyerhaeuserNRCompany,Plymouth,NCfacilitypermitapplication(May2010),writtenbyJennyKelvingtonofNCDAQ,forthecostestimatesofabiofiltrationsystemforsimilarkilnstothoseWestFraserisproposing.Thecostsincludeachillerthatwouldbeneededtocooltheexhausttemperaturetoatleast110°F,themaximumtemperaturethatcangothroughthebiofiltrationsystemwithoutkillingthebugs.Relianceonthisvalueisreasonableasthequotedunitwassizedforcontrollingtwocontinuouskilnsaswell(atapermittedthroughputof117MMBF/yr).However,thecostwasscaleduptoaccountfortheMaplesvilleMill'spotentialproductionthroughputof200MMBF/yr.AllcostshavebeenadjustedfromMarch2010dollarstoOctober2012dollars.
2.CapitalRecoveryfactorcalculatedbasedonEquation2.8a(Section1,Chapter2,page2‐21)andTable1.13(Section2,Chapter1,page1‐52)ofU.S.EPAOAQPS,EPAAirPollutionControlCostManual (6thEdition),January2002.
1.CalculatedfromtheNorthCarolinaDivisionofAirQuality(NCDAQ)AirPermitReview/PreliminaryDeterminationfortheWeyerhaeuserNRCompany,Plymouth,NCfacilitypermitapplication(May2010),writtenbyJennyKelvingtonofNCDAQ,forthecostestimatesofabiofiltrationsystemforsimilarkilnstothoseWestFraserisproposing.Thecostsincludeachillerthatwouldbeneededtocooltheexhausttemperaturetoatleast110°F,themaximumtemperaturethatcangothroughthebiofiltrationsystemwithoutkillingthebugs.Relianceonthisvalueisreasonableasthequotedunitwassizedforcontrollingtwocontinuouskilnsaswell(atapermittedthroughputof117MMBF/yr).However,thecostwasscaleduptoaccountfortheMaplesvilleMill'spotentialproductionthroughputof200MMBF/yr.AllcostshavebeenadjustedfromMarch2010dollarstoOctober 2012dollars.
TrinityConsultants Page5of5AugustaKilnBACTCostCalculations(20121206JF)
BiofiltrationCost

West Fraser, Inc. – Augusta Mill | Continuous Kiln Construction Permit Application Trinity Consultants E
APPENDIX E: RACT/BACT/LAER CLEARING HOUSE DATABASE REPORT

AppendixE‐RBLCSearchWestFraser‐Augusta,GAMill
RBLCSearchResultsforWoodLumberKilns‐VOCControl
CompanyName FacilityName State
BatchorContinuous
Kiln?Permit
IssuanceDate ProcessNamePrimaryFuel Throughput
ThroughputUnits
ControlMethodDescription
EmissionLimit1
EmissionLimit1Unit
EmissionLimit1
AveragingPeriod
EmissionLimit2
EmissionLimit2Unit
EmissionLimit2
AveragingPeriod
EmissionLimit
(lb/MBF)
INTERFORPACIFIC,INC. GILCHRISTFACILITY OR Batch 5/22/2006LUMBERDRY
KILNS‐ ‐ ‐ PROPERWORKPRACTICES 1.69 LB/MBF ‐ ‐ ‐ ‐ 1.69
TININCTEMPLEINLANDPINELANDMANUFACTURINGCOMPLEX
TX Batch 8/12/2011Drystudmillkilns1
and2wood 156,000
boardfeetpercharge
goodoperatingpracticeandmaintenance
2.49LB
VOC/1000BOARDFEE
‐ ‐ ‐ ‐ 2.49
SIERRAPACIFICINDUSTRIESSKAGITCOUNTYLUMBERMILL
WA Batch 1/25/2006 7DRYKILNS ‐ 300MMBOARD
F/YRCOMPUTERIZEDSTEAMMANAGEMENTSYSTEM
378 T/YR12MONTHROLLINGAVERAGE
‐ ‐ ‐ 2.52
NORTHFLORIDALUMBERNORTHFLORIDALUMBER/BRISTOLSAWMILL
FL Batch 8/4/2009 Woodlumberkilnsteamheated
92,000,000board‐f
lumber/yr
Bestoperatingpractices:1)minimizeover‐dryinglumber;2)maintain
consistentmoisturecontentforprocessedlumbercharge;and3)dryattheminimum
temperature.
116.93 T/YR ‐ ‐ ‐ ‐ 2.54
WESTFRASER(SOUTH),INC.WESTFRASER(SOUTH),INC.‐HUTTIGMILL
AR Batch 11/7/2002LUMBERDRYING
KILN‐ 230,000 MBF/YR ‐ 3.5 LB/MBF
MillionBoardFeet
91.9 LB/H ‐ 3.50
DELTICTIMBERCORPORATION
WALDO AR Batch 1/12/2005STEAMHEATEDLUMBERDRYING
KILNS‐ ‐ ‐ ‐ 3.5 LB/MBF ‐ ‐ ‐ ‐ 3.50
POTLATCHCORPORATIONPOTLATCHCORPORATION‐OZANUNIT
AR Batch 7/26/2005 KILNS1‐4STEAMHEATED
265MMBF
ANNUALLYPROPEROPERATION 3.5 LB/MBF ‐ 119 LB/H ‐ 3.50
POTLATCHCORPORATIONPOTLATCHCORPORATION‐OZANUNIT
AR Batch 7/26/2005 KILNS1‐4STEAMHEATED
265MMBF
ANNUALLYPROPEROPERATION 3.5 LB/MBF ‐ 119 LB/H ‐ 3.50
WESTFRASER,INC. LUMBERMILL TX Continuous 12/15/2011Continuouslumber
kilns(2)wood 275 MMBF/YR
propertemperatureandprocessmanagement;dryingtoappropriatemoisture
content
3.5 LB/MBF ‐ ‐ ‐ ‐ 3.50
WEYERHAEUSERCOMPANYHOLDENWOODPRODUCTSMILL
LA Batch 6/18/2003 KILNNO.5(1‐01)WOODRESIDUE
44,000 MBF/YR ‐ 66 LB/HHOURLYMAXIMUM
79.58 TYRANNUALMAXIMUM
3.62
WEYERHAEUSERCOMPANYHOLDENWOODPRODUCTSMILL
LA Batch 6/18/2003 KILNNO.4(1‐93)WOODRESIDUE
33,000 MBF/YR ‐ 66 LB/HHOURLYMAXIMUM
59.69 T/YRANNUALMAXIMUM
3.62
WEYERHAEUSERCOMPANYHOLDENWOODPRODUCTSMILL
LA Batch 6/18/2003 KILNNO.3(1‐89)WOODRESIDUE
33,000 MBF/YR ‐ 66 LB/HHOURLYMAXIMUM
59.69 T/YRANNUALMAXIMUM
3.62
BIBLERBROTHERSLUMBERCOMPANY
BIBLERBROTHERSLUMBERCOMPANY
AR Continuous 8/25/2008SN‐07GANDSN‐13GCONTINOUSOPERATINGKILNS
WOODRESIDUE
25 MMBTU/H ‐ 3.8 LB/MBFVOC ‐ 46.50LB
VOC/H/KILN
‐ 3.80
SIMPSONLUMBERCO.SIMPSONLUMBERCO,LLCMELDRIMOPERATIONS
GA Continuous 4/25/2012 KILN3WASTEWOOD
65,000,000 BF/YRPROPERMAINTENANCE
ANDOPERATION3.83 LB/MBF DAILY ‐ ‐ ‐ 3.83
SIMPSONLUMBERCO.SIMPSONLUMBERCO,LLCMELDRIMOPERATIONS
GA Batch 4/25/2012 KILN4WASTEWOOD
73,000,000 BF/YRPROPERMAINTENANCE
ANDOPERATION3.93 LB/MBF DAILY ‐ ‐ ‐ 3.93
WEYERHAEUSERCOMPANY PlymouthLumberMill NC Continuous 2010Direct‐FiredKilns
(2)WOODRESIDUE
234,000 MBF/YRMaintainthedrybulbset
temperatureatorbelow260°F
3.85 lb/MBF 3.85
TrinityConsultants Page1of3AugustaRBLCSearch(20121114LH)
VOCResults

AppendixE‐RBLCSearchWestFraser‐Augusta,GAMill
RBLCSearchResultsforWoodLumberKilns‐VOCControl
CompanyName FacilityName State
BatchorContinuous
Kiln?Permit
IssuanceDate ProcessNamePrimaryFuel Throughput
ThroughputUnits
ControlMethodDescription
EmissionLimit1
EmissionLimit1Unit
EmissionLimit1
AveragingPeriod
EmissionLimit2
EmissionLimit2Unit
EmissionLimit2
AveragingPeriod
EmissionLimit
(lb/MBF)
WEYERHAEUSERCOMPANYHOLDENWOODPRODUCTSMILL
LA Batch 6/18/2003 KILNNO.1(1‐79)WOODRESIDUE
44,000 MBF/YR ‐ 89.15 LB/HHOURLYMAXIMUM
89.8 T/YRANNUALMAXIMUM
4.08
WEYERHAEUSERCOMPANYHOLDENWOODPRODUCTSMILL
LA Batch 6/18/2003 KILNNO.2(2‐79)WOODRESIDUE
44,000 MBF/YR ‐ 89.15 LB/HHOURLYMAXIMUM
89.8 T/YRANNUALMAXIMUM
4.08
WestFraser,Inc. ArmourLumberMill NC Continuous N/A CDPKilnNo.1WOODRESIDUE
137,415 MBF/YR
Limitthedryingcapacityto137,415MBFperyear,and
followeitherthemanufacturer's
recommendationsorasitespecificplanforproper
operationandmaintenanceof the kiln
4.11 LB/MBF 282.4 T/YR 4.11
WestFraser,Inc. ArmourLumberMill NC Continuous N/A CDPKilnNo.2WOODRESIDUE
137,415 MBF/YR
Limitthedryingcapacityto137,415MBFperyear,and
followeitherthemanufacturer's
recommendationsorasitespecificplanforproper
operationandmaintenanceof the kiln
4.11 LB/MBF 282.4 T/YR 4.11
NEWSOUTHLUMBERCOMPANY,INC.
NEWSOUTHLUMBERCOMPANY,INC‐CAMDENPLANT
SC Batch 3/7/2003LUMBERDRYINGKILNS,FIVE(5),STEAM‐HEATED
WOODWASTE
182 MMBF/YRWORKPRACTICESANDPRODUCTIONLIMIT
4.2 LB/MBFper1000boardft
182.1 MMBF/YRProduction
Limit4.20
NEWSOUTHLUMBERCOMPANY,INC.
NEWSOUTHLUMBERCOMPANY,INC.‐CONWAYPLANT
SC Batch 9/5/2003LUMBERDRYING
KILNS‐ ‐ ‐ WORKPRACTICES 4.2 LB/1000BF
lb/1000boardfeet
363.7 T/YRLimitforall5kilns
4.20
ELLIOTSAWMILLINGCOMPANY
ELLIOTSAWMILLINGCOMPANY
SC Batch 5/23/2004LUMBERDRYING
KILNWOODWASTE
53 MMBFT/H WORKPRACTICES 4.5 LB/1000BF ‐ ‐ ‐ ‐ 4.50
RayonierWoodProducts,LLC SwainsboroSawmill GA Continuous 6/16/2007Direct‐firedlumber
kilns(2)Wood 220 MMBF/YR Goodcombustionpractices 4.6 lb/MBF 4.6
WEYERHAEUSER WRIGHTCITYCOMPLEX OK Batch 7/21/2006 LUMBERKILNS ‐ ‐ ‐ ‐ 4.8 LB/MBF ‐ ‐ ‐ ‐ 4.80
INTERNATIONALPAPERCOMPANY
LEOLALUMBERMILL AR Batch 11/1/2002LUMBERDRYING
KILN‐ 29,410 MBF/YR ‐ 423 LB/CHARGE OfLumber 88.2 T/YR ‐ 6.00
WESTFRASERTIMBERCOMPANY,LTD
JOYCEMILL LA Continuous 8/16/2011 Lumberkilns ‐ 300millionboard
feet/yrproperlydesignand
operation930 T/YR ‐ ‐ ‐ ‐ 6.20
T.R.MILLERMILLCOMPANY T.R.MILLERMILL AL Batch 5/16/2002 LUMBERDRYKILN ‐ 125 MBFGOODENGINEERING
PRACTICES6.78 LB/MBF ‐ ‐ ‐ ‐ 6.78
TrinityConsultants Page2of3AugustaRBLCSearch(20121114LH)
VOCResults

AppendixE‐RBLCSearchWestFraser‐Augusta,GAMill
RBLCSearchResultsforWoodLumberKilns‐VOCControl
CompanyName FacilityName State
BatchorContinuous
Kiln?Permit
IssuanceDate ProcessNamePrimaryFuel Throughput
ThroughputUnits
ControlMethodDescription
EmissionLimit1
EmissionLimit1Unit
EmissionLimit1
AveragingPeriod
EmissionLimit2
EmissionLimit2Unit
EmissionLimit2
AveragingPeriod
EmissionLimit
(lb/MBF)
COLLUM'SLUMBERMILL COLLUM'SLUMBERMILL SC Batch 4/8/2002KILN,2STEAM
HEATED,LUMBERWOODWASTE
56 MMBF/YR ‐ 195 T/YRtotalfor2kilns
‐ ‐ ‐ 7.00
BOWATER,INC. ALBERTVILLESAWMILL AL Batch 6/4/2003STEAM‐HEATEDLUMBERDRYKILNS,(2)
‐ 150 MBF
GOODOPERATINGPRACTICES,ROUTINE
EQUIPMENTINSPECTIONS,
RECORDKEEPING
7 LB/MBF ‐ 125000 MBF/YR2UNITS
COMBINED7.00
BOWATER(ALABAMA)INC.FORESTPRODUCTDIVISION
ALBERTVILLESAWMILL AL Batch 4/9/2008
TWO182.14MBF,STEAM‐HEADEDLUMBERDRY
KILNS(NORTH&SOUTH‐
K100/K101)
‐ 182 MBF
OPERATEW/WETBULBSETPOINTDRYING
SCHEDULEOFLESSTHANOREQUALTO185F;DAILYANDMONTHLYKILNI/M
PROCEDURES
7 LB/MBF
KILNCHARGECYCLONE(PINENE)
‐ ‐ ‐ 7.00
GEORGIA‐PACIFICCORP.GEORGIA‐PACIFICCORP.‐ELDORADOSAWMILL
AR Batch 11/7/2002LUMBERDRYING
KILN‐ ‐ ‐
BACTFORVOCEMISSIONSFROMTHEKILNWOULDBE
PROPERMAINTENANCEANDOPERATIONOFTHE
DRYINGKILN,SINCEALLAVAILABLECONTROLTECHNOLOGIESHAVEBEENELIMINATEDDUETOTECHNICAL
INFEASIBLITY.
5,572 LB/CHARGE OfLumber 304 T/YR ‐ ‐‐
WESTFRASER(SOUTH),INC. JOYCEMILL LA Batch 7/19/2004WOODLUMBERKILNS(INDIRECT
FIRED)N/A ‐ ‐
PROPERKILNDESIGNANDOPERATION
367.77 LB/HMAXIMUMHOURLY
750 T/YRANNUALMAXIMUM
‐‐
HOODINDUSTRIES,INC. COUSHATTASAWMILL LA Batch 7/13/2005WOODLUMBERKILNS(INDIRECT
FIRED)N/A ‐ ‐ ‐ 28 LB/H
HOURLYMAXIMUM
122.6 T/YRANNUALMAXIMUM
‐‐
TEMPLE‐INLANDFORESTPRODUCTSCORPORATION
TEMPLE‐INLANDDIBOLLOPERATIONS
TX Batch 11/1/2004EASTLUMBERKILNS1&2(4)
‐ ‐ ‐ ‐ 30.6 LB/H ‐ 85.35 T/YR ‐ ‐‐
TEMPLE‐INLANDFORESTPRODUCTSCORPORATION
TEMPLE‐INLANDDIBOLLOPERATIONS
TX Batch 11/1/2004WESTLUMBERKILNS1&2(4)
‐ ‐ ‐ ‐ 30.6 LB/H ‐ 85.35 T/YR ‐ ‐‐
TrinityConsultants Page3of3AugustaRBLCSearch(20121114LH)
VOCResults

West Fraser, Inc. – Augusta Mill | Continuous Kiln Construction Permit Application Trinity Consultants F
APPENDIX F: TOXICS MODELING

West FraserAugusta, GA Mill
Toxic Air Pollutants Impact Analysis
Table F-1. Derivation of Acceptable Ambient Concentrations (AAC) for Georgia EPD
Inhalation Annual 24-hour Mol. Wt. Unit Risk1 RBAC1, 2 RfC1 AAC AAC5,6
Pollutant CAS No. Formula (g/mol) (g/m3)-1 (µg/m3) (mg/m3) (g/m3) (ppm) (mg/m3) (ppm) (mg/m3) (µg/m3) (ppm) (mg/m3) (ppm) (mg/m3) (ppm) (mg/m3) (mg/m3) (g/m3)
Methanol 67-56-1 CH4O 32.04 None 200 260 200 262 619 250 328 250 325 328 32,750Formaldehyde 50-00-0 CH2O 30.03 - 1.11 NA 2 2.46 0.3 0.4 2.46 246Propionaldehyde 123-38-6 C3H6O 58.08 0.01 8.00 NA None NoneAcetaldehyde 75-07-0 C2H4O 44.05 0.009 9.00 NA 25 45 45 4,500
1. Unit risk and Inhalation RfC values obtained from EPA IRIS database. Annual AAC for formaldehyde based on data from Georgia EPD.
2. Risk Based Acceptable Concentration (RBAC) is calculated based on the weight of evidence of the unit risk.
3. OSHA TWA values obtained from 29 CFR 1910 Subpart Z
4. ACGIH TWA values obtained from 03-2010-CS-Adopted Threshold Limit Values.pdf
5. Adjusted for occupational exposure. Applied safety factor of 100 for pollutants which are not known human carcinogens and safety factor of 300 for known human carcinogens per GA Air Toxics Guidance (June 21, 1998).
6. Values derived assuming up to a 168 hour work week.
7. OSHA Ceiling values obtained from 29 CFR 1910 Subpart Z
8. ACGIH STEL values obtained from 03-2010-CS-Adopted Threshold Limit Values.pdf
9. NIOSH STEL values obtained from www.cdc.gov/niosh/npg
10. Adjusted by safety factor of 10 per GA Air Toxics Guidance (June 21, 1998).
Not Required
Not RequiredNot Required
Not RequiredNot RequiredNot Required
Weight of
Evidence1
OSHA TWA3 ACGIH TWA4 OSHA Ceiling7 Ceiling or
STEL
15-minute
AAC10NIOSH STEL9ACGIH STEL824-hr Rating 1. 24-hr Rating 2.
Trinity Consultants121101.0016 12/17/2012

West FraserAugusta, GA Mill
Toxic Air Pollutants Impact Analysis Table F-2. Derivation of Long-term Acceptable Ambient Concentrations (AAC) for Georgia EPD
Mol. Wt. Unit Risk1 RBAC2 Inhalation RfC1 Annual AAC
Pollutant CAS No. Formula (g/mol) (g/m3)-1 (µg/m3) (mg/m3) (g/m3)
Methanol 67-56-1 CH4O 32.04 None Need 24-hr TWAFormaldehyde 50-00-0 CH2O 30.03 - 1.11 Not RequiredPropionaldehyde 123-38-6 C3H6O 58.08 0.008 8.00 Not RequiredAcetaldehyde 75-07-0 C2H4O 44.05 0.009 9.00 Not Required
1. Unit risk and Inhalation RfC values obtained from EPA IRIS database.
2. Risk Based Acceptable Concentration (RBAC) is calculated based on the weight of evidence of the unit risk.
3. Formaldehyde annual AAC as prescribed by Georgia EPD.
Weight of Evidence
24-hour AAC Required?
Trinity Consultants121101.0016 12/17/2012

West FraserAugusta, GA Mill
Toxic Air Pollutants Impact Analysis
Table F-3. Derivation of 24-hr Acceptable Ambient Concentrations (AAC) for Georgia EPD
24-hr Rating 4. 24-hourMol. Wt. LD50 (rat) AAC4
Pollutant CAS No. Formula (g/mol) (ppm) (mg/m3) (ppm) (mg/m3) (ppm) (mg/m3) (mg/kg) (mg/m3) (µg/m3)
Methanol Need 24-hr TWA 67-56-1 CH4O 32.04 200 260 200 262 260 619Formaldehyde Not Required 50-00-0 CH2O 30.03 Not Required Not RequiredPropionaldehyde Not Required 123-38-6 C3H6O 58.08 Not Required Not RequiredAcetaldehyde Not Required 75-07-0 C2H4O 44.05 Not Required Not Required
1. Per the Guidelines , one long-term value is required; TAP with an annual AAC do not require a 24-hr AAC.
2. OSHA TWA values obtained from 29 CFR 1910 Subpart Z
3. ACGIH TWA values obtained from 03-2004-TLVs.doc
4. Adjusted for occupational exposure. Applied safety factor of 100 for pollutants which are not known human carcinogens and safety factor of 300 for known human carcinogens per GA Air Toxics Guidance (June 21, 1998).
Not Required Not RequiredNot Required Not Required
OSHA TWA ACGIH TWA NIOSH TWA
Not Required Not Required
24-hr AAC
Required1?
24-hr Rating 1. 24-hr Rating 2. 24-hr Rating 3. Rating Available 24-hour TWA
Trinity Consultants121101.0016 12/17/2012

West FraserAugusta, GA Mill
Toxic Air Pollutants Impact Analysis
Table F-4. Derivation of 15-minute Acceptable Ambient Concentrations (AAC) for Georgia EPD
Mol. Wt.Ceiling or
STEL
15-minute
AAC4
Pollutant CAS No. Formula (g/mol) (ppm) (mg/m3) (ppm) (mg/m3) (ppm) (mg/m3) (mg/m3) (g/m3)
Methanol 67-56-1 CH4O 32.04 250 328 250 325 328 32,750Formaldehyde 50-00-0 CH2O 30.03 2 2.46 0.3 0.4 2.46 246Propionaldehyde 123-38-6 C3H6O 58.08 None NoneAcetaldehyde 75-07-0 C2H4O 44.05 25 45.00 45 4500
1. OSHA Ceiling values obtained from 29 CFR 1910 Subpart Z
2. ACGIH STEL values obtained from 03-2004-TLVs.doc
3. NIOSH STEL values obtained from www.cdc.gov/niosh/npg
4. Adjusted by safety factor of 10 per GA Air Toxics Guidance (June 21, 1998).
OSHA Ceiling1 ACGIH STEL2 NIOSH STEL3
Trinity Consultants121101.0016 12/17/2012
West Fraser, Inc. – Augusta Mill | Continuous Kiln Construction Permit Application Trinity Consultants G
APPENDIX G: TITLE V DATABASE

A - Facility Information
Facility: West Fraser Inc. Application: 2012 PSD Application for Continuous Kilns
Parent/Holding Company Name: West Fraser Inc.
Facility Location: 4206 Mike Padgett Hwy
Augusta, GA 30906-
RichmondCounty:
Location of Center of Production Area:
33 deg N 20 min 0 sec Latitude:
Longitude: 81 deg W 57 min 30 sec
Reason for Application Submittal:
Modification of Existing Title V Permit
Application Submitted for:
All facilities under common control at a Part 70 site.
Other ID Numbers:
FEI Number: 72-148-9951
Dun and Bradstreet Number: 01834255
A6 - Current Permits And Amendments (And Deferred Modifications Under State Rule 391-
3-1-.03(6)(i) )
All significant Processes at this Facility:
A8 - Required Documents:
UTM Zone: 0
UTM Vertical Meters: 0
UTM Horizontal Meters: 0
2421-245-0047-V-04-0
June 13, 2012
Title V Renewal
Permit or Amendment Number:
Original Issue Date and Amendment Date:
Permit or Amendment Description:
Overall Facility Description
Lumber mill producing southern yellow pine dimension lumber
Process
Description
These corresponding attachments are submitted in electronic form (.doc, .pdf, .jpg, or similar format).
Corresponding Attachments Number
Submitted
Tuesday, December 04, 2012 Page 1 of 2

A - Facility Information
Facility: West Fraser Inc. Application: 2012 PSD Application for Continuous Kilns
0
0
0
0
0
Building layout (overhead view), indicating location of emission units and stacks. (Only stacks that are listed in this application need to be located on the
Plant site map detailing property lines, latitude/longitude or UTM location provided in this application, any outdoor storage piles (indicating material), roads (include paved and unpaved), and areas of company property to which the public has unrestricted access.
General area map showing specific location of plant in relation to surrounding areas.
Process flow diagram(s) for the plant, including emission flow. (These do not have to include material input/output flow rates.)
Compliance Assurance Monitoring plans as required by 40 CFR Part 64. This document MUST be submitted in electronic form.
Comments: See the PSD permit application's appendices for additional figures.
Tuesday, December 04, 2012 Page 2 of 2

A2, A3, A4 - Contact Names and Addresses by Responsibilities
Facility: West Fraser Inc. Application: 2012 PSD Application for Continuous
Legal Owner (legal actions, etc.)
Permits (granted permits, permit amendments, etc.)
Permit Applications (requests for additional information, etc.)
Surveys, Questionaires (emission inventories, etc.)
Primary Contact:
Mailing Address:
Primary Contact:
Mailing Address:
Primary Contact:
Mailing Address:
Primary Contact:
Facility Contact
Primary Contact:
Mailing Address:
George Winfrey, Mill Manager
(706) 793-8753 (706) 798-2239
Phone: Fax:
E-Mail:
EXT:
4206 Mike Padgett Hwy
Augusta, GA 30906
West Fraser - Augusta Lumber Mill
George Winfrey, Mill Manager
(706) 793-8753 (706) 798-2239
Phone: Fax:
E-Mail:
EXT:
4206 Mike Padgett Hwy
Augusta, GA 30906
West Fraser - Augusta Lumber Mill
Lamar Youmans, EHS Coordinator
(706) 793-8753 (706) 798-2239
Phone: Fax:
E-Mail:
EXT: 213
4206 Mike Padgett Hwy
Augusta, GA 30906
West Fraser - Augusta Lumber Mill
Lamar Youmans, EHS Coordinator
George Winfrey, Mill Manager
(706) 793-8753 (706) 798-2239
Phone: Fax:
E-Mail:
EXT:
4206 Mike Padgett Hwy
Augusta, GA 30906
West Fraser - Augusta Lumber Mill
Tuesday, December 04, 2012 Page 1 of 2

A2, A3, A4 - Contact Names and Addresses by Responsibilities
Facility: West Fraser Inc. Application: 2012 PSD Application for Continuous
Enforcement Actions (non-compliance letters, notices of violation, etc.)
Fees (fee manuals, fee forms, audit notices, etc.)
Monitoring (CEM certification applications, requests for monitoring and testing information, etc.)
Mailing Address:
Primary Contact:
Mailing Address:
Primary Contact:
Mailing Address:
Primary Contact:
Mailing Address:
(706) 793-8753 (706) 798-2239
Phone: Fax:
E-Mail:
EXT: 213
4206 Mike Padgett Hwy
Augusta, GA 30906
West Fraser - Augusta Lumber Mill
Lamar Youmans, EHS Coordinator
(706) 793-8753 (706) 798-2239
Phone: Fax:
E-Mail:
EXT: 213
4206 Mike Padgett Hwy
Augusta, GA 30906
West Fraser - Augusta Lumber Mill
Lamar Youmans, EHS Coordinator
(706) 793-8753 (706) 798-2239
Phone: Fax:
E-Mail:
EXT: 213
4206 Mike Padgett Hwy
Augusta, GA 30906
West Fraser - Augusta Lumber Mill
Lamar Youmans, EHS Coordinator
(706) 793-8753 (706) 798-2239
Phone: Fax:
E-Mail:
EXT: 213
4206 Mike Padgett Hwy
Augusta, GA 30906
West Fraser - Augusta Lumber Mill
Tuesday, December 04, 2012 Page 2 of 2
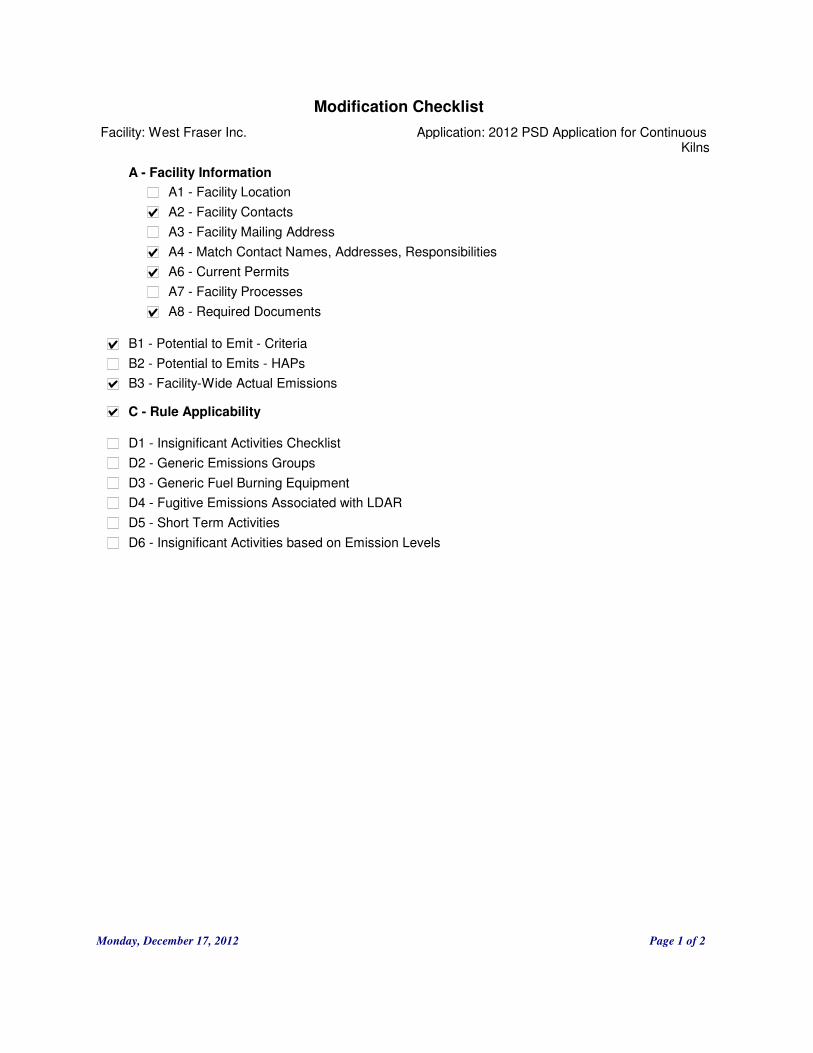
Modification Checklist
Facility: West Fraser Inc. Application: 2012 PSD Application for Continuous Kilns
A1 - Facility Location
A2 - Facility Contacts
A3 - Facility Mailing Address
A4 - Match Contact Names, Addresses, Responsibilities
A6 - Current Permits
A7 - Facility Processes
A8 - Required Documents
B1 - Potential to Emit - Criteria
B2 - Potential to Emits - HAPs
B3 - Facility-Wide Actual Emissions
C - Rule Applicability
D1 - Insignificant Activities Checklist
D2 - Generic Emissions Groups
D4 - Fugitive Emissions Associated with LDAR
D5 - Short Term Activities
D6 - Insignificant Activities based on Emission Levels
D3 - Generic Fuel Burning Equipment
A - Facility Information
Monday, December 17, 2012 Page 1 of 2

Modification Checklist
Facility: West Fraser Inc. Application: 2012 PSD Application for Continuous Kilns
D7 - Significant Emission Units
D8 - Fugitive Emission Sources
D9 - Emission Groups
D10 - Control Devices
D11 - Associate Emission Units with Control Devices
D12 - Stack and Process Vent Summary
D13 - Compliance Assurance Monitoring
E - Summary Of Emissions
F - Facility Compliance
D7-1 Boilers, Furnaces Other Indirect Contact Heat Generating Equipment
D7-2 Chromium Electroplating Chromium Anodizing Tanks
D7-3 Crushing, Milling Grinding
D7-4 Dryers, Calciners, Kilns Ovens
D7-5 Fiber Reinforced Plastic Manufacturing Operations
D7-6 Internal Combustion Engines Combustion Turbines
D7-7 Landfills
D7-8 Liquid Storage Vessels
D7-9 Miscellaneous
D7-10 Non-Reactive Bulk Mixing
D7-11 Painting Coating Operations
D7-12 Perchloroethylene Dry Cleaners
D7-13 Printing Operations
D7-14 Reactor Vessel
D7-15 Separation Process
D7-16 Solid/Liquid Waste Destruction - Incineration
D7-17 Solvent Cleaning Machines
D7-18 Textile Coater
D10-1 Adsorber/Carbon Drum
D10-2 Biofilter/Bioscrubber
D10-3 Condenser/Refrigeration Unit
D10-4 Cyclone/Multiclone/Settling Chamber
D10-5 Electrostatic Precipitator
D10-6 Filter Media
D10-7 Miscellaneous Device
D10-8 Oxidizer
D10-9 Scrubber
Monday, December 17, 2012 Page 2 of 2
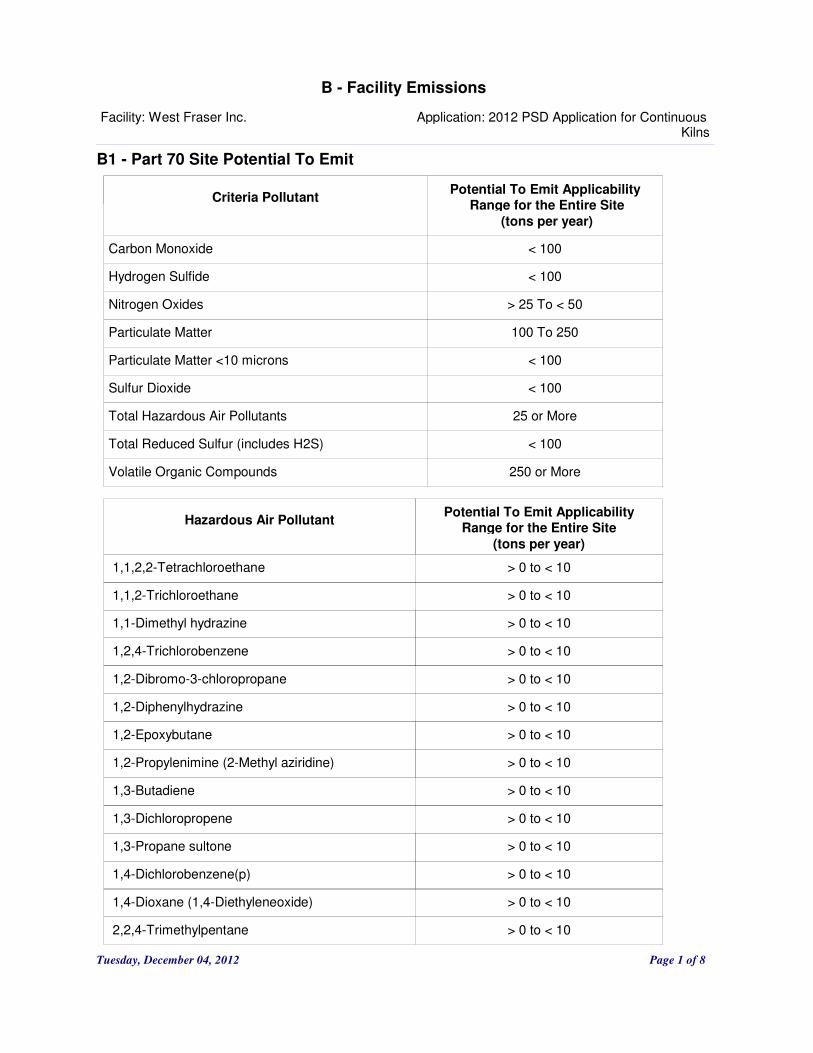
B - Facility Emissions
Facility: West Fraser Inc. Application: 2012 PSD Application for Continuous Kilns
B1 - Part 70 Site Potential To Emit
Potential To Emit Applicability
Range for the Entire SiteCriteria Pollutant
(tons per year)
Carbon Monoxide < 100
Hydrogen Sulfide < 100
Nitrogen Oxides > 25 To < 50
Particulate Matter 100 To 250
Particulate Matter <10 microns < 100
Sulfur Dioxide < 100
Total Hazardous Air Pollutants 25 or More
Total Reduced Sulfur (includes H2S) < 100
Volatile Organic Compounds 250 or More
Potential To Emit Applicability
Range for the Entire SiteHazardous Air Pollutant
(tons per year)
1,1,2,2-Tetrachloroethane > 0 to < 10
1,1,2-Trichloroethane > 0 to < 10
1,1-Dimethyl hydrazine > 0 to < 10
1,2,4-Trichlorobenzene > 0 to < 10
1,2-Dibromo-3-chloropropane > 0 to < 10
1,2-Diphenylhydrazine > 0 to < 10
1,2-Epoxybutane > 0 to < 10
1,2-Propylenimine (2-Methyl aziridine) > 0 to < 10
1,3-Butadiene > 0 to < 10
1,3-Dichloropropene > 0 to < 10
1,3-Propane sultone > 0 to < 10
1,4-Dichlorobenzene(p) > 0 to < 10
1,4-Dioxane (1,4-Diethyleneoxide) > 0 to < 10
2,2,4-Trimethylpentane > 0 to < 10
Tuesday, December 04, 2012 Page 1 of 8

B - Facility Emissions
Facility: West Fraser Inc. Application: 2012 PSD Application for Continuous Kilns
2,3,7,8-Tetrachlorodibenzo-p-dioxin > 0 to < 10
2,4,5-Trichlorophenol > 0 to < 10
2,4,6-Trichlorophenol > 0 to < 10
2,4-D, salts and esters > 0 to < 10
2,4-Dinitrophenol > 0 to < 10
2,4-Dinitrotoluene > 0 to < 10
2,4-Toluene diamine > 0 to < 10
2,4-Toluene diisocyanate > 0 to < 10
2-Acetylaminofluorine > 0 to < 10
2-Chloroacetophenone > 0 to < 10
2-Nitropropane > 0 to < 10
3,3-Dichlorobenzidene > 0 to < 10
3,3-Dimethoxybenzidine > 0 to < 10
3,3-Dimethyl benzidine > 0 to < 10
4,4-Methylene bis (2-Chloroaniline) > 0 to < 10
4,4-Methylenedianiline > 0 to < 10
4,6-Dinitro-o-cresol, and salts > 0 to < 10
4-Aminobiphenyl > 0 to < 10
4-Nitrobiphenyl > 0 to < 10
4-Nitrophenol > 0 to < 10
Acetaldehyde > 0 to < 10
Acetamide > 0 to < 10
Acetonitrile > 0 to < 10
Acetophenone > 0 to < 10
Acrolein > 0 to < 10
Acrylamide > 0 to < 10
Acrylic Acid > 0 to < 10
Acrylonitrile > 0 to < 10
Tuesday, December 04, 2012 Page 2 of 8

B - Facility Emissions
Facility: West Fraser Inc. Application: 2012 PSD Application for Continuous Kilns
Allyl chloride > 0 to < 10
Aniline > 0 to < 10
Antimony Compounds > 0 to < 10
Arsenic Compounds (inorganic including arsine) > 0 to < 10
Asbestos > 0 to < 10
Benzene (including benzene from gasoline) > 0 to < 10
Benzidine > 0 to < 10
Benzotrichloride > 0 to < 10
Benzyl chloride > 0 to < 10
Beryllium Compounds > 0 to < 10
beta-Propiolactone > 0 to < 10
Biphenyl > 0 to < 10
Bis(2-ethylhexyl)phthalate (DEHP) > 0 to < 10
Bis(chloromethyl)ether > 0 to < 10
Bromoform > 0 to < 10
Cadmium Compounds > 0 to < 10
Calcium cyanamide > 0 to < 10
Captan > 0 to < 10
Carbaryl > 0 to < 10
Carbon disulfide > 0 to < 10
Carbon tetrachloride > 0 to < 10
Carbonyl sulfide > 0 to < 10
Catechol > 0 to < 10
Chloramben > 0 to < 10
Chlordane > 0 to < 10
Chlorine > 0 to < 10
Chloroacetic acid > 0 to < 10
Chlorobenzene > 0 to < 10
Tuesday, December 04, 2012 Page 3 of 8

B - Facility Emissions
Facility: West Fraser Inc. Application: 2012 PSD Application for Continuous Kilns
Chlorobenzilate > 0 to < 10
Chloroform > 0 to < 10
Chloromethyl methyl ether > 0 to < 10
Chloroprene > 0 to < 10
Chromium Compounds > 0 to < 10
Cobalt Compounds > 0 to < 10
Coke Oven Emissions > 0 to < 10
Cresols/Cresylic acid (isomers and mixture) > 0 to < 10
Cumene > 0 to < 10
Cyanide Compounds > 0 to < 10
DDE > 0 to < 10
Dibenzofurans > 0 to < 10
Dibutylphthalate > 0 to < 10
Dichloroethyl ether (Bis(2-chloroethyl) ether) > 0 to < 10
Dichlorvos > 0 to < 10
Diethanolamine > 0 to < 10
Diethyl sulfate > 0 to < 10
Dimethyl aminoazobenzene > 0 to < 10
Dimethyl carbamoyl chloride > 0 to < 10
Dimethyl formamide > 0 to < 10
Dimethyl phthalate > 0 to < 10
Dimethyl sulfate > 0 to < 10
Epichlorohydrin (1-Chloro-2,3-epoxypropane) > 0 to < 10
Ethyl acrylate > 0 to < 10
Ethyl benzene > 0 to < 10
Ethyl carbamate (Urethane) > 0 to < 10
Ethyl chloride (Chloroethane) > 0 to < 10
Ethylene dibromide (Dibromoethane) > 0 to < 10
Tuesday, December 04, 2012 Page 4 of 8

B - Facility Emissions
Facility: West Fraser Inc. Application: 2012 PSD Application for Continuous Kilns
Ethylene dichloride (1,2-Dichloroethane) > 0 to < 10
Ethylene glycol > 0 to < 10
Ethylene imine (Aziridine) > 0 to < 10
Ethylene oxide > 0 to < 10
Ethylene thiourea > 0 to < 10
Ethylidene dichloride (1,1-Dichloroethane) > 0 to < 10
Fine mineral fibers > 0 to < 10
Formaldehyde > 0 to < 10
Glycol ethers > 0 to < 10
HAP Metals > 0 to < 10
Heptachlor > 0 to < 10
Hexachlorobenzene > 0 to < 10
Hexachlorobutadiene > 0 to < 10
Hexachlorocyclopentadiene > 0 to < 10
Hexachloroethane > 0 to < 10
Hexamethylene-1 > 0 to < 10
Hexamethylphosphoramide > 0 to < 10
Hexane > 0 to < 10
Hydrazine > 0 to < 10
Hydrochloric acid > 0 to < 10
Hydrogen fluoride (Hydrofluoric acid) > 0 to < 10
Hydroquinone > 0 to < 10
Isophorone > 0 to < 10
Lead Compounds > 0 to < 10
Lindane (all isomers) > 0 to < 10
Maleic anhydride > 0 to < 10
Manganese Compounds > 0 to < 10
m-Cresol > 0 to < 10
Tuesday, December 04, 2012 Page 5 of 8

B - Facility Emissions
Facility: West Fraser Inc. Application: 2012 PSD Application for Continuous Kilns
Mercury Compounds > 0 to < 10
Methanol 10 To < 25
Methoxychlor > 0 to < 10
Methyl bromide (Bromomethane) > 0 to < 10
Methyl chloride (Chloromethane) > 0 to < 10
Methyl chloroform (1,1,1-Trichloroethane) > 0 to < 10
Methyl ethyl ketone (2-Butanone) > 0 to < 10
Methyl hydrazine > 0 to < 10
Methyl iodide (Iodomethane) > 0 to < 10
Methyl isobutyl ketone (Hexone) > 0 to < 10
Methyl isocyanate > 0 to < 10
Methyl methacrylate > 0 to < 10
Methyl tert butyl ether (MTBE) > 0 to < 10
Methylene chloride (Dichloromethane) > 0 to < 10
Methylene diphenye diisocyanate (MDI) > 0 to < 10
m-Xylenes > 0 to < 10
N,N-Diethyl aniline (N,N-Dimethylaniline) > 0 to < 10
Napthalene > 0 to < 10
Nickel Compounds > 0 to < 10
Nitrobenzene > 0 to < 10
N-Nitrosodimethylamine > 0 to < 10
N-Nitrosomorpholine > 0 to < 10
N-Nitroso-N-methylurea > 0 to < 10
o-Anisidine > 0 to < 10
o-Cresol > 0 to < 10
o-Toluidine > 0 to < 10
o-Xylenes > 0 to < 10
Parathion > 0 to < 10
Tuesday, December 04, 2012 Page 6 of 8

B - Facility Emissions
Facility: West Fraser Inc. Application: 2012 PSD Application for Continuous Kilns
p-Cresol > 0 to < 10
Pentachloronitrobenzene (Quintobenzene) > 0 to < 10
Pentachlorophenol > 0 to < 10
Phenol > 0 to < 10
Phosgene > 0 to < 10
Phosphine > 0 to < 10
Phosphorus > 0 to < 10
Phthalic anhydride > 0 to < 10
Polychlorinated biphenyls (Aroclors) > 0 to < 10
Polycyclic Organic Matter > 0 to < 10
p-Phenylenediamine > 0 to < 10
Propionaldehyde > 0 to < 10
Propoxur (Baygon) > 0 to < 10
Propylene dichloride > 0 to < 10
Propylene oxide > 0 to < 10
p-Xylenes > 0 to < 10
Quinoline > 0 to < 10
Quinone > 0 to < 10
Radionuclides (including radon) > 0 to < 10
Selenium Compounds > 0 to < 10
Styrene > 0 to < 10
Styrene oxide > 0 to < 10
Tetrachloroethylene (Perchloroethylene) > 0 to < 10
Titanium tetrachloride > 0 to < 10
Toluene > 0 to < 10
Toxaphene (chlorinated camphene) > 0 to < 10
Trichloroethylene > 0 to < 10
Triethylamine > 0 to < 10
Tuesday, December 04, 2012 Page 7 of 8

B - Facility Emissions
Facility: West Fraser Inc. Application: 2012 PSD Application for Continuous Kilns
B2 - Facility-Wide Actual Emissions Estimates
Trifluralin > 0 to < 10
Vinyl acetate > 0 to < 10
Vinyl bromide > 0 to < 10
Vinyl chloride > 0 to < 10
Vinylidene chloride (1,1-Dichloroethylene) > 0 to < 10
Volatile Hazardous Air Pollutants > 0 to < 10
Xylenes (isomers and mixture) > 0 to < 10
5 Year Average Actual
(tons per year) Pollutant Maximum Actual
Annual (tons per year)
Nitrogen Oxides 30.8 30.8
Particulate Matter 217.3 217.3
Particulate Matter <10 microns 55.2 55.2
Sulfur Dioxide 7.7 7.7
Total Hazardous Air Pollutants 33.4 33.4
Volatile Organic Compounds 413.3 413.3
Tuesday, December 04, 2012 Page 8 of 8

C - RULE APPLICABILITY
Facility: West Fraser Inc. Application: 2012 PSD Application for Continuous Kilns
C1 - Regulatory Applicability
The following regulations have been identified as APPLICABLE:
FEDERAL 40 CFR 63 Subpart A - (excluding 63.13 and 63.15(a)(2)) General Provisions [391-3-1-.02(9)(b)15]
FEDNEW - Enter into the comment field any newly promulgated Federal regulations that is applicable or potentially applicable to your facility that has not already been listed here.
40 CFR Part 63, Subpart DDDD - National Emission Standards for HazardousAir Pollutants: Plywood and Composite Wood Products. (APPLICABLE)
40 CFR 60 Subpart CCCC - NSPS for Commercial and Industrial Solid Waste Incineration units for which Construction is Commenced after November 30, 1999 or for which Modification or Reconstruction is Commenced on or After June 1, 2001 (NOT APPLICABLE)40 CFR 63 Subpart DDDDD - NESHAP for Industrial, Commercial, and Institutional Boilers and Process Heaters (NOT APPLICABLE)
SIP 391-3-1-.02(2) (b) - Visible Emissions
SIP 391-3-1-.02(2) (d) - Fuel-burning Equipment
SIP 391-3-1-.02(2) (e) - Particulate Emission from Manufacturing Processes
SIP 391-3-1-.02(2) (g) - Sulfur Dioxide
SIP 391-3-1-.02(2) (n) - Fugitive Dust
SIP 391-3-1-.02(5) - Open Burning
C1 - Regulatory Applicability
The following regulations have been identified as NOT APPLICABLE:
FEDERAL 40 CFR 60 Subpart A - General Provisions [391-3-1-.02(8)(b)1]
FEDERAL 40 CFR 60 Subpart AA - NSPS for Steel Plants: Electric Arc Furnaces [391-3-1-.02(8)(b)32]
FEDERAL 40 CFR 60 Subpart AAa - NSPS for Steel Plants. Electric Arc Furnaces and Argon-Oxygen Decarburization Vessels Constructed After August 17 [391-3-1-.02(8)(b)33]
FEDERAL 40 CFR 60 Subpart AAAA - NSPS for Small Municipal Waste Combustion Units for Which Construction is Commenced After August 30, 1999 [391-3-1-.02(8)(b)74]
FEDERAL 40 CFR 60 Subpart BB - NSPS for Kraft Pulp Mills [391-3-1-.02(8)(b)34]
FEDERAL 40 CFR 60 Subpart BBB - NSPS for Rubber Tire Manufacturing Industry [391-3-1-.02(8)(b)53]
FEDERAL 40 CFR 60 Subpart CC - NSPS for Glass Manufacturing Plants [391-3-1-.02(8)(b)35]
Tuesday, December 04, 2012 Page 1 of 12

Facility: West Fraser Inc. Application: 2012 PSD Application for Continuous Kilns
FEDERAL 40 CFR 60 Subpart CCCC - NSPS for Commercial and Industrial Solid Waste Incineration Units for Which Construction is Commenced After November 30, 1999 [391-3-1-.02(8)(b)75]
FEDERAL 40 CFR 60 Subpart D - NSPS for Fossil-fuel Fired Steam Generators [391-3-1-.02(8)(b)2]
FEDERAL 40 CFR 60 Subpart Da - NSPS for Electric Utility Steam Generating Units [391-3-1-.02(8)(b)3]
FEDERAL 40 CFR 60 Subpart Db - NSPS for Industrial-Commercial-Institutional Steam Generating Units [391-3-1-.02(8)(b)4]
FEDERAL 40 CFR 60 Subpart Dc - NSPS for Small Industrial -Commercial-Institutional Steam Generating Units [391-3-1-.02(8)(b)5]
FEDERAL 40 CFR 60 Subpart DD - NSPS for Grain Elevators [391-3-1-.02(8)(b)36]
FEDERAL 40 CFR 60 Subpart DDD - NSPS for Volatile Organic Compound (VOC) Emission from Polymer Manufacturing Industry [391-3-1-.02(8)(b)54]
FEDERAL 40 CFR 60 Subpart E - NSPS for Incinerators [391-3-1-.02(8)(b)6]
FEDERAL 40 CFR 60 Subpart Ea - NSPS for Municipal Waste Combustors [391-3-1-.02(8)(b)7]
FEDERAL 40 CFR 60 Subpart Eb - NSPS for Municipal Waste Combustors for Which Construction is Commenced after September 20, 1994 [391-3-1-.02(8)(b)71]
FEDERAL 40 CFR 60 Subpart Ec - NSPS for Hospital/Medical/Infectious Waste Incinerators for which construction is commenced after June 20, 1996 [391-3-1-.02(8)(b)73]
FEDERAL 40 CFR 60 Subpart EE - NSPS for Surface Coating of Metal Furniture [391-3-1-.02(8)(b)37]
FEDERAL 40 CFR 60 Subpart F - NSPS for Portland Cement Plants [391-3-1-.02(8)(b)8]
FEDERAL 40 CFR 60 Subpart FFF - NSPS for Flexible Vinyl and Urethane Printing and Coating [391-3-1-.02(8)(b)55]
FEDERAL 40 CFR 60 Subpart G - NSPS for Nitric Acid Plants [391-3-1-.02(8)(b)9]
FEDERAL 40 CFR 60 Subpart GG - NSPS for Stationary Gas Turbines [391-3-1-.02(8)(b)38]
FEDERAL 40 CFR 60 Subpart GGG - NSPS for Equipment Leaks of VOC in Petroleum Refineries [391-3-1-.02(8)(b)56]
FEDERAL 40 CFR 60 Subpart H - NSPS for Sulfuric Acid Plants [391-3-1-.02(8)(b)10]
FEDERAL 40 CFR 60 Subpart HH - NSPS for Lime Manufacturing Plants [391-3-1-.02(8)(b)39]
FEDERAL 40 CFR 60 Subpart HHH - NSPS for Synthetic Fiber Production Facilities [391-3-1-.02(8)(b)57]
FEDERAL 40 CFR 60 Subpart I - NSPS for Asphalt Concrete Plants [391-3-1-.02(8)(b)11]
FEDERAL 40 CFR 60 Subpart III - NSPS for Volatile Organic Compounds (VOC) Emissions From the Synthetic Organic Chemical Manufacturing Industry (SOCMI) Air Oxidation Unit
Tuesday, December 04, 2012 Page 2 of 12

Facility: West Fraser Inc. Application: 2012 PSD Application for Continuous Kilns
Processes [391-3-1-.02(8)(b)58]
FEDERAL 40 CFR 60 Subpart J - NSPS for Petroleum Refineries [391-3-1-.02(8)(b)12]
FEDERAL 40 CFR 60 Subpart JJJ - NSPS for Petroleum Dry Cleaners [391-3-1-.02(8)(b)59]
FEDERAL 40 CFR 60 Subpart K - NSPS for Storage Vessels for Petroleum Liquids [391-3-1-.02(8)(b)13]
FEDERAL 40 CFR 60 Subpart Ka - NSPS for Storage Vessels for Petroleum Liquids [391-3-1-.02(8)(b)14]
FEDERAL 40 CFR 60 Subpart Kb - NSPS for Volatile Organic Liquid Storage Vessels [391-3-1-.02(8)(b)15]
FEDERAL 40 CFR 60 Subpart KK - NSPS for Lead-Acid Battery Manufacturing Plants [391-3-1-.02(8)(b)40]
FEDERAL 40 CFR 60 Subpart KKK - NSPS for Equipment Leaks of VOC from Onshore Natural Gas Processing Plants [391-3-1-.02(8)(b)60]
FEDERAL 40 CFR 60 Subpart L - NSPS for Secondary Lead Smelters [391-3-1-.02(8)(b)16]
FEDERAL 40 CFR 60 Subpart LL - NSPS for Metallic Mineral Processing Plants [391-3-1-.02(8)(b)41]
FEDERAL 40 CFR 60 Subpart LLL - NSPS for Onshore Natural Gas Processing [391-3-1-.02(8)(b)61]
FEDERAL 40 CFR 60 Subpart M - NSPS for Secondary Brass and Bronze Ingot Production Plants [391-3-1-.02(8)(b)17]
FEDERAL 40 CFR 60 Subpart MM - NSPS for Automobile and Light-Duty Truck Coating Operations [391-3-1-.02(8)(b)42]
FEDERAL 40 CFR 60 Subpart N - NSPS for Iron and Steel Plants [391-3-1-.02(8)(b)18]
FEDERAL 40 CFR 60 Subpart Na - NSPS for Secondary Emissions from Basic Oxygen Process Steelmaking Facilities for Which Construction is Commenced After January 20 [391-3-1-.02(8)(b)19]
FEDERAL 40 CFR 60 Subpart NN - NSPS for Phosphate Rock Plants [391-3-1-.02(8)(b)43]
FEDERAL 40 CFR 60 Subpart NNN - NSPS for Volatile Organic Compounds (VOC) Emissions From the Synthetic Organic Chemical Manufacturing Industry (SOCMI) Distillation Operation [391-3-1-.02(8)(b)62]
FEDERAL 40 CFR 60 Subpart O - NSPS for Sewage Treatment Plants [391-3-1-.02(8)(b)20]
FEDERAL 40 CFR 60 Subpart OOO - NSPS for Nonmetallic Mineral Processing Plants [391-3-1-.02(8)(b)63]
FEDERAL 40 CFR 60 Subpart P - NSPS for Primary Copper Smelters [391-3-1-.02(8)(b)21]
FEDERAL 40 CFR 60 Subpart PP - NSPS for Ammonium Sulfate Manufacture [391-3-1-.02(8)(b)44]
Tuesday, December 04, 2012 Page 3 of 12

Facility: West Fraser Inc. Application: 2012 PSD Application for Continuous Kilns
FEDERAL 40 CFR 60 Subpart PPP - NSPS for Wool Fiberglass Insulation Manufacturing Plants [391-3-1-.02(8)(b)64]
FEDERAL 40 CFR 60 Subpart Q - NSPS for Primary Zinc Smelters [391-3-1-.02(8)(b)22]
FEDERAL 40 CFR 60 Subpart QQ - NSPS for Graphic Arts Industry: Publication Rotogravure Printing [391-3-1-.02(8)(b)45]
FEDERAL 40 CFR 60 Subpart QQQ - NSPS for VOC Emissions from Petroleum Refinery Wastewater Systems [391-3-1-.02(8)(b)65]
FEDERAL 40 CFR 60 Subpart R - NSPS for Primary Lead Smelters [391-3-1-.02(8)(b)23]
FEDERAL 40 CFR 60 Subpart RR - NSPS for Pressure Sensitive Tape and Label Surface Coating Operations [391-3-1-.02(8)(b)46]
FEDERAL 40 CFR 60 Subpart RRR - NSPS for VOC Emissions from Synthethic Organic Chemical Manufacturing Industry (SOCMI) Reactor Process [391-3-1-.02(b)66]
FEDERAL 40 CFR 60 Subpart S - NSPS for Primary Aluminum Reduction [391-3-1-.02(8)(b)24]
FEDERAL 40 CFR 60 Subpart SS - NSPS for Industrial Surface Coating: Large Appliances [391-3-1-.02(8)(b)47]
FEDERAL 40 CFR 60 Subpart SSS - NSPS for Magnetic Tape Coating [391-3-1-.02(8)(b)67]
FEDERAL 40 CFR 60 Subpart T - NSPS for the Phosphate Fertilizer Industry: Wet-Process Phosphoric Acid Plants [391-3-1-.02(8)(b)25]
FEDERAL 40 CFR 60 Subpart TT - NSPS for Metal Coil Surface Coating [391-3-1-.02(8)(b)48]
FEDERAL 40 CFR 60 Subpart TTT - NSPS for Plastic Parts for Business Machine Coatings [391-3-1-.02(8)(b)68]
FEDERAL 40 CFR 60 Subpart U - NSPS for the Phosphate Fertilizer Industry: Superphosphoric Acid Plants [391-3-1-.02(8)(b)26]
FEDERAL 40 CFR 60 Subpart UU - NSPS for Asphalt Processing and Asphalt Roofing Manufacture [391-3-1-.02(8)(b)49]
FEDERAL 40 CFR 60 Subpart UUU - NSPS for Calciners and Dryers in Mineral Industries [391-3-1-.02(8)(b)69]
FEDERAL 40 CFR 60 Subpart V - NSPS for the Phosphate Fertilizer Industry: Diammonium Phosphate Plants [391-3-1-.02(8)(b)27]
FEDERAL 40 CFR 60 Subpart VV - NSPS for Equipment Leaks of VOC in the Synthetic Organic Chemicals Manufacturing Industry [391-3-1-.02(8)(b)50]
FEDERAL 40 CFR 60 Subpart VVV - NSPS for Polymeric Coating of Supporting Substrates Facilities [391-3-1-.02(8)(b)70]
FEDERAL 40 CFR 60 Subpart W - NSPS for the Phosphate Fertilizer Industry: Triple Superphosphate Plants [391-3-1-.02(8)(b)28]
FEDERAL 40 CFR 60 Subpart WW - NSPS for Beverage Can Surface Coating Industry [391-3-1-.02(8)(b)51]
Tuesday, December 04, 2012 Page 4 of 12

Facility: West Fraser Inc. Application: 2012 PSD Application for Continuous Kilns
FEDERAL 40 CFR 60 Subpart WWW - NSPS for Municipal Solid Waste Landfills [391-3-1-.02(8)(b)72]
FEDERAL 40 CFR 60 Subpart X - NSPS for the Phosphate Fertilizer Industry: Granular Triple Superphosphate Storage Facilities [391-3-1-.02(8)(b)29]
FEDERAL 40 CFR 60 Subpart XX - NSPS for Bulk Gasoline Terminals [391-3-1-.02(8)(b)52]
FEDERAL 40 CFR 60 Subpart Y - NSPS for Coal Preparation Plants [391-3-1-.02(8)(b)30]
FEDERAL 40 CFR 60 Subpart Z - NSPS for Ferroalloy Production Facilities [391-3-1-.02(8)(b)31]
FEDERAL 40 CFR 61 Subpart BB - NESHAP for Benzene Emissions from Benzene Transfer Operations [391-3-1-.02(9)(b)13]
FEDERAL 40 CFR 61 Subpart C - NESHAP for Beryllium [391-3-1-.02(9)(b)1]
FEDERAL 40 CFR 61 Subpart D - NESHAP for Beryllium Rocket Motor Firing [391-3-1-.02(9)(b)2]
FEDERAL 40 CFR 61 Subpart E - NESHAP for Mercury [391-3-1-.02(9)(b)3]
FEDERAL 40 CFR 61 Subpart F - NESHAP for Vinyl Chloride [391-3-1-.02(9)(b)4]
FEDERAL 40 CFR 61 Subpart FF - NESHAP for Benzene Waste Operations [391-3-1-.02(9)(b)14]
FEDERAL 40 CFR 61 Subpart J - NESHAP for Equipment Leaks (Fugitive Emission Sources) of Benzene [391-3-1-.02(9)(b)5]
FEDERAL 40 CFR 61 Subpart L - NESHAP for Benzene Emissions from Coke Byproduct Recovery Plants [391-3-1-.02(9)(b)6]
FEDERAL 40 CFR 61 Subpart M - NESHAP for Asbestos (inc. work practices) [391-3-1-.02(9)(b)7]
FEDERAL 40 CFR 61 Subpart N - NESHAP for Inorganic Arsenic Emissions from Glass Manufacturing Plants [391-3-1-.02(9)(b)8]
FEDERAL 40 CFR 61 Subpart O - NESHAP for Inorganic Arsenic Emissions from Primary Copper Smelters [391-3-1-.02(9)(b)9]
FEDERAL 40 CFR 61 Subpart P - NESHAP for Inorganic Arsenic Emissions from Arsenic Trioxide and Metallic Arsenic Production Facilities [391-3-1-.02(9)(b)10]
FEDERAL 40 CFR 61 Subpart V - NESHAP for Equipment Leaks (Fugitive Emission Sources) of VHAP [391-3-1-.02(9)(b)11]
FEDERAL 40 CFR 61 Subpart Y - NESHAP for Benzene Emissions from Benzene Storage Vessels [391-3-1-.02(9)(b)12]
FEDERAL 40 CFR 63 Subpart AA - NESHAP for Phosphoric Acid Manufacturing Plants [391-3-1-.02(9)(b)41]
FEDERAL 40 CFR 63 Subpart B - Sections 63.40 through 63.44, Requirements for Control Technology Determinations for Major Sources in Accordance with the Clean Air Act sections 112(g) [391-3-1-.02(9)(b)16]
FEDERAL 40 CFR 63 Subpart B - Sections 63.50 through 63.56, Requirements for Control Technology Determinations for Major Sources in Accordance with the Clean Air Act
Tuesday, December 04, 2012 Page 5 of 12

Facility: West Fraser Inc. Application: 2012 PSD Application for Continuous Kilns
sections 112(g) [391-3-1-.02(9)(b)17]
FEDERAL 40 CFR 63 Subpart BB - NESHAP for Phosphate Fertilizer Production Plants [391-3-1-.02(9)(b)42]
FEDERAL 40 CFR 63 Subpart CC - NESHAP for Emission Standards for Hazardous Air Pollutants from Petroleum Refineries - 63.642(k)procedures for 63.642(g) [391-3-1-.02(9)(b)43]
FEDERAL 40 CFR 63 Subpart CCC - NESHAP for Steel Pickling – HCl Process Facilities and HCl Regeneration Plants [391-3-1-.02(9)(b)65]
FEDERAL 40 CFR 63 Subpart CCCC - NESHAP for Nutritional Yeast Manufacturing [391-3-1-.02(9)(b)91]
FEDERAL 40 CFR 63 Subpart D - Compliance Extensions for Early Reductions [391-3-1-.02(9)(b)19]
FEDERAL 40 CFR 63 Subpart DDD - NESHAP for Mineral Wool Production [391-3-1-.02(9)(b)66]
FEDERAL 40 CFR 63 Subpart EE - NESHAP for Magnetic Tape Manufacturing Operations [391-3-1-.02(9)(b)45]
FEDERAL 40 CFR 63 Subpart EEE - NESHAP for Hazardous Waste Combustors [391-3-1-.02(9)(b)67]
FEDERAL 40 CFR 63 Subpart F - NESHAP for Organic Hazardous Air Pollutants from the Synthetic Organic Chemical Manufacturing Industry [391-3-1-.02(9)(b)20]
FEDERAL 40 CFR 63 Subpart G - NESHAP for Organic Hazardous Air Pollutants from Synthetic Organic Chemical Manufacturing Industry for Process Vents, Storage Vessels, Transfer Operations, and Wastewater. [391-3-1-.02(9)(b)21]
FEDERAL 40 CFR 63 Subpart GG - NESHAP for Emission Standards for Aerospace Manufacturing and Rework Facilities [391-3-1-.02(9)(b)47]
FEDERAL 40 CFR 63 Subpart GGG - NESHAP for Pharmaceuticals Production [391-3-1-.02(9)(b)69]
FEDERAL 40 CFR 63 Subpart GGGG - NESHAP for Vegetable Oil Production [391-3-1-.02(9)(b)95]
FEDERAL 40 CFR 63 Subpart H - NESHAP for Organic Hazardous Air Pollutants for Equipment Leaks [391-3-1-.02(9)(b)22]
FEDERAL 40 CFR 63 Subpart HH - NESHAP for Oil and Natural Gas Production Facilities [391-3-1-.02(9)(b)48]
FEDERAL 40 CFR 63 Subpart HHH - NESHAP for Natural Gas Transmission and Storage Facilities [391-3-1-.02(9)(b)70]
FEDERAL 40 CFR 63 Subpart HHHH - NESHAP for Wet Formed Fiberglass Mat Production [391-3-1-.02(9)(b)96]
FEDERAL 40 CFR 63 Subpart I - NESHAP for Organic Hazardous Air Pollutants for Certain Processes Subject to the Negotiated Regulation for Equipment Leaks [391-3-1-.02(9)(b)23]
FEDERAL 40 CFR 63 Subpart II - NESHAP for Emission Standards for Shipbuilding and
Tuesday, December 04, 2012 Page 6 of 12
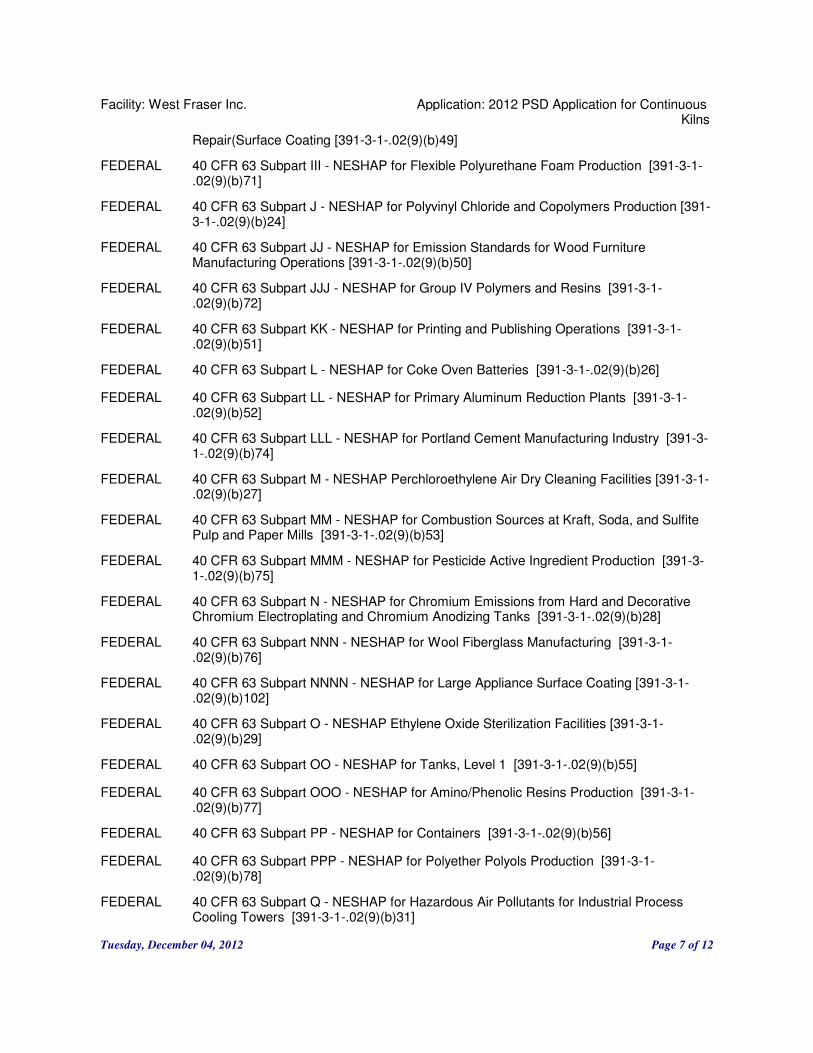
Facility: West Fraser Inc. Application: 2012 PSD Application for Continuous Kilns
Repair(Surface Coating [391-3-1-.02(9)(b)49]
FEDERAL 40 CFR 63 Subpart III - NESHAP for Flexible Polyurethane Foam Production [391-3-1-.02(9)(b)71]
FEDERAL 40 CFR 63 Subpart J - NESHAP for Polyvinyl Chloride and Copolymers Production [391-3-1-.02(9)(b)24]
FEDERAL 40 CFR 63 Subpart JJ - NESHAP for Emission Standards for Wood Furniture Manufacturing Operations [391-3-1-.02(9)(b)50]
FEDERAL 40 CFR 63 Subpart JJJ - NESHAP for Group IV Polymers and Resins [391-3-1-.02(9)(b)72]
FEDERAL 40 CFR 63 Subpart KK - NESHAP for Printing and Publishing Operations [391-3-1-.02(9)(b)51]
FEDERAL 40 CFR 63 Subpart L - NESHAP for Coke Oven Batteries [391-3-1-.02(9)(b)26]
FEDERAL 40 CFR 63 Subpart LL - NESHAP for Primary Aluminum Reduction Plants [391-3-1-.02(9)(b)52]
FEDERAL 40 CFR 63 Subpart LLL - NESHAP for Portland Cement Manufacturing Industry [391-3-1-.02(9)(b)74]
FEDERAL 40 CFR 63 Subpart M - NESHAP Perchloroethylene Air Dry Cleaning Facilities [391-3-1-.02(9)(b)27]
FEDERAL 40 CFR 63 Subpart MM - NESHAP for Combustion Sources at Kraft, Soda, and Sulfite Pulp and Paper Mills [391-3-1-.02(9)(b)53]
FEDERAL 40 CFR 63 Subpart MMM - NESHAP for Pesticide Active Ingredient Production [391-3-1-.02(9)(b)75]
FEDERAL 40 CFR 63 Subpart N - NESHAP for Chromium Emissions from Hard and Decorative Chromium Electroplating and Chromium Anodizing Tanks [391-3-1-.02(9)(b)28]
FEDERAL 40 CFR 63 Subpart NNN - NESHAP for Wool Fiberglass Manufacturing [391-3-1-.02(9)(b)76]
FEDERAL 40 CFR 63 Subpart NNNN - NESHAP for Large Appliance Surface Coating [391-3-1-.02(9)(b)102]
FEDERAL 40 CFR 63 Subpart O - NESHAP Ethylene Oxide Sterilization Facilities [391-3-1-.02(9)(b)29]
FEDERAL 40 CFR 63 Subpart OO - NESHAP for Tanks, Level 1 [391-3-1-.02(9)(b)55]
FEDERAL 40 CFR 63 Subpart OOO - NESHAP for Amino/Phenolic Resins Production [391-3-1-.02(9)(b)77]
FEDERAL 40 CFR 63 Subpart PP - NESHAP for Containers [391-3-1-.02(9)(b)56]
FEDERAL 40 CFR 63 Subpart PPP - NESHAP for Polyether Polyols Production [391-3-1-.02(9)(b)78]
FEDERAL 40 CFR 63 Subpart Q - NESHAP for Hazardous Air Pollutants for Industrial Process Cooling Towers [391-3-1-.02(9)(b)31]
Tuesday, December 04, 2012 Page 7 of 12

Facility: West Fraser Inc. Application: 2012 PSD Application for Continuous Kilns
FEDERAL 40 CFR 63 Subpart QQ - NESHAP for Surface Impoundments [391-3-1-.02(9)(b)57]
FEDERAL 40 CFR 63 Subpart QQQ - NESHAP for Primary Copper Smelting [391-3-1-.02(9)(b)79]
FEDERAL 40 CFR 63 Subpart QQQQQ - NESHAP for Friction Products Manufacturing [391-3-1-.02(9)(b)131]
FEDERAL 40 CFR 63 Subpart R - NESHAP for Gasoline Distribution Facilities (Bulk Gasoline Terminals and Pipeline Breakout Stations) [391-3-1-.02(9)(b)32]
FEDERAL 40 CFR 63 Subpart RR - NESHAP for Individual Drain Systems [391-3-1-.02(9)(b)58]
FEDERAL 40 CFR 63 Subpart RRR - NESHAP for Secondary Aluminum Production [391-3-1-.02(9)(b)80]
FEDERAL 40 CFR 63 Subpart S - NESHAP for Pulp and Paper Industries [391-3-1-.02(9)(b)33]
FEDERAL 40 CFR 63 Subpart SS - NESHAP for Closed Vent Systems, Control Devices, Recovery Devices and Routing to a Fuel Gas System or a Process [391-3-1-.02(9)(b)59]
FEDERAL 40 CFR 63 Subpart SSSS - NESHAP for Metal Coil Surface Coating [391-3-1-.02(9)(b)107]
FEDERAL 40 CFR 63 Subpart T - NESHAP for Halogenated Solvent Cleaning [391-3-1-.02(9)(b)34]
FEDERAL 40 CFR 63 Subpart TT - NESHAP for Equipment Leaks, Control Level 1 [391-3-1-.02(9)(b)60]
FEDERAL 40 CFR 63 Subpart TTT - NESHAP for Primary Lead Smelting [391-3-1-.02(9)(b)82]
FEDERAL 40 CFR 63 Subpart TTTT - NESHAP for Leather Finishings Operations [391-3-1-.02(9)(b)108]
FEDERAL 40 CFR 63 Subpart U - NESHAP for Group I Polymers and Resins [391-3-1-.02(9)(b)35]
FEDERAL 40 CFR 63 Subpart UU - NESHAP for Equipment Leaks, Control Level 2 [391-3-1-.02(9)(b)61]
FEDERAL 40 CFR 63 Subpart UUU - NESHAP for Petroleum Refineries: Catalytic Cracking, Catalytic Reforming, and Sulfur Plant Units [391-3-1-.02(9)(b)83]
FEDERAL 40 CFR 63 Subpart UUUU - NESHAP for Cellulose Production Manufacturing [391-3-1-.02(9)(b)109]
FEDERAL 40 CFR 63 Subpart VV - NESHAP for Oil-Water Separators and Organic-Water Separators [391-3-1-.02(9)(b)62]
FEDERAL 40 CFR 63 Subpart VVV - NESHAP for Publicly Owned Treatment Works [391-3-1-.02(9)(b)84]
FEDERAL 40 CFR 63 Subpart VVVV - NESHAP for Boat Manufacturing [391-3-1-.02(9)(b)110]
FEDERAL 40 CFR 63 Subpart W - NESHAP for Hazardous Air Pollutants for Epoxy Resins Production and Non-Nylon Polyamides Production [391-3-1-.02(9)(b)37]
FEDERAL 40 CFR 63 Subpart WW - NESHAP for Storage Vessels (Tanks) Control Level 2 [391-3-1-.02(9)(b)63]
Tuesday, December 04, 2012 Page 8 of 12

Facility: West Fraser Inc. Application: 2012 PSD Application for Continuous Kilns
FEDERAL 40 CFR 63 Subpart X - NESHAP for Hazardous Air Pollutants From Secondary Lead Smelting [391-3-1-.02(9)(b)38]
FEDERAL 40 CFR 63 Subpart XXX - NESHAP for Ferroalloys Production: Ferromanganese and Silicomanganese [391-3-1-.02(9)(b)86]
FEDERAL 40 CFR 63 Subpart XXXX - NESHAP for Tire Manufacturing [391-3-1-.02(9)(b)112]
FEDERAL 40 CFR 63 Subpart Y - NESHAP for Emission Standards for Marine Tank Vessel Loading Operations [391-3-1-.02(9)(b)39]
FEDERAL 40 CFR 63 Subpart YY - NESHAP for Generic MACT Standards [391-3-1-.02(9)(b)64]
FEDERAL 40 CFR 64 - Compliance Assurance Monitoring [391-3-1-.02((11)]
FEDERAL 40 CFR 68 - Chemical Accident Prevention Provisions [391-3-1-.02(10)]
FEDERAL 40 CFR 72 - Permit Regulations [391-3-1-.13]
FEDERAL 40 CFR 73 - Allowance System
FEDERAL 40 CFR 75 - Continuous Emission Monitoring
FEDERAL 40 CFR 76 - Acid Rain Nitrogen Oxides Emission Reduction Program
FEDERAL 40 CFR 77 - Excess Emissions
FEDERAL 40 CFR 82 Subpart A - Production and Consumption Controls
FEDERAL 40 CFR 82 Subpart B - Servicing of Motor Vehicle Air Conditioners
FEDERAL 40 CFR 82 Subpart C - Ban on Nonessential Products Containing Class I Substances and Ban on Nonessential Products Containing or Manufactured with Class II Substances
FEDERAL 40 CFR 82 Subpart D - Federal Procurement
FEDERAL 40 CFR 82 Subpart E - The Labeling of Products Using Ozone Depleting Substances
FEDERAL 40 CFR 82 Subpart F - Recycling and Emissions Reduction
FEDERAL 40 CFR 82 Subpart F - Refrigerant Recycling Rule
FEDERAL 40 CFR 82 Subpart G - Significant New Alternative Program
FEDERAL 40 CFR 82 Subpart G - Significant New Alternatives Policy Program
Other - Other regulation - List additional regulations in the Comment blank.
PBR 391-3-1-.03(11) (b)1 - Fuel-burning Equipment Burning Natural Gas/LPG and/or Distillate Oil
PBR 391-3-1-.03(11) (b)10 - Fiberglas Molding and Forming Operations
PBR 391-3-1-.03(11) (b)11 - Peanut/Nut Shelling Operation
PBR 391-3-1-.03(11) (b)2 - Fuel-burning Equipment Burning Natural Gas/LPG and/or Residual Oil
Tuesday, December 04, 2012 Page 9 of 12

Facility: West Fraser Inc. Application: 2012 PSD Application for Continuous Kilns
PBR 391-3-1-.03(11) (b)3 - On-Site Power Generation
PBR 391-3-1-.03(11) (b)4 - Concrete Mixing Plants
PBR 391-3-1-.03(11) (b)5 - Hot Mix Asphalt Plants
PBR 391-3-1-.03(11) (b)6 - Cotton Ginning Operations
PBR 391-3-1-.03(11) (b)7 - Coating and/or Gluing Operations
PBR 391-3-1-.03(11) (b)8 - Printing Operations
PBR 391-3-1-.03(11) (b)9 - Non-reactive Mixing Operations
SIP 391-3-1-.02(2) (aa) - VOC Emissions from Wire Coating
SIP 391-3-1-.02(2) (aaa) - Consumer and Commercial Products
SIP 391-3-1-.02(2) (bb) - Petroleum Liquid Storage
SIP 391-3-1-.02(2) (bbb) - Gasoline Marketing
SIP 391-3-1-.02(2) (c) - Incinerators
SIP 391-3-1-.02(2) (cc) - Bulk Gasoline Terminals
SIP 391-3-1-.02(2) (ccc) - VOC Emissions from Bulk Mixing Tanks
SIP 391-3-1-.02(2) (dd) - Cutback Asphalt
SIP 391-3-1-.02(2) (ddd) - VOC Emissions from Offset Lithography
SIP 391-3-1-.02(2) (ee) - Petroleum Refinery
SIP 391-3-1-.02(2) (eee) - VOC Emissions from Expanded Polystyrene Products Manufacturing
SIP 391-3-1-.02(2) (f) - Normal Superphosphate Facilities
SIP 391-3-1-.02(2) (fff) - Particulate Emissions from Yarn Spinning Operations
SIP 391-3-1-.02(2) (gg) - Kraft Pulp Mills
SIP 391-3-1-.02(2) (ggg) - Existing Municipal Solid Waste Landfills
SIP 391-3-1-.02(2) (h) - Portland Cement Plants
SIP 391-3-1-.02(2) (hh) - Petroleum Refinery Equipment Leaks
SIP 391-3-1-.02(2) (hhh) - Wood Furniture Finishing and Cleaning Operations
SIP 391-3-1-.02(2) (i) - Nitric Acid Plants
SIP 391-3-1-.02(2) (ii) - VOC Emissions from Surface Coating of Miscellaneous Metal Parts and Products
SIP 391-3-1-.02(2) (iii) - Hospital/Medical/Infectious Waste Incinerators Constructed
Tuesday, December 04, 2012 Page 10 of 12

Facility: West Fraser Inc. Application: 2012 PSD Application for Continuous Kilns
SIP 391-3-1-.02(2) (j) - Sulfuric Acid Plants
SIP 391-3-1-.02(2) (jj) - VOC Emissions from Surface Coating of Flat Wood Paneling
SIP 391-3-1-.02(2) (jjj) - NOx Emissions from Electric Utility Steam Generating Units
SIP 391-3-1-.02(2) (k) - Asphaltic Concrete Hot Mix Plants
SIP 391-3-1-.02(2) (kk) - VOC Emissions from Synthesized Pharmaceutical Manufacturing
SIP 391-3-1-.02(2) (kkk) - VOC Emissions from Aerospace Manufacturing and Rework Faci
SIP 391-3-1-.02(2) (l) - Conical Burners
SIP 391-3-1-.02(2) (ll) - VOC Emissions from the Manufacture of Pneumatic Rubber Tire
SIP 391-3-1-.02(2) (lll) - NOx Emissions from Fuel-burning Equipment
SIP 391-3-1-.02(2) (mm) - VOC Emissions from Graphic Arts Systems
SIP 391-3-1-.02(2) (mmm) - NOx Emissions from Stationary Gas Turbines and Stationary
SIP 391-3-1-.02(2) (nn) - VOC Emissions from External Floating Roof Tanks
SIP 391-3-1-.02(2) (nnn) - NOx Emissions from Large Stationary Gas Turbines
SIP 391-3-1-.02(2) (o) - Cupola Furnaces for Metallurgical Melting
SIP 391-3-1-.02(2) (oo) - Fiberglass Insulation Manufacturing Plants
SIP 391-3-1-.02(2) (ooo) - Heavy-Duty Diesel Engine Requirements
SIP 391-3-1-.02(2) (p) - Kaolin and Fuller's Earth Processes
SIP 391-3-1-.02(2) (pp) - Bulk Gasoline Plants
SIP 391-3-1-.02(2) (ppp) - Commercial/Industrial/Solid Waste Incinerators Constructed
SIP 391-3-1-.02(2) (q) - Cotton Gins
SIP 391-3-1-.02(2) (qq) - VOC Emissions from Large Petroleum Dry Cleaners
SIP 391-3-1-.02(2) (r) - Granular and Mixed Fertilizer Manufacturing Units
SIP 391-3-1-.02(2) (rr) - Gasoline Dispensing Facility - Stage I
SIP 391-3-1-.02(2) (ss) - Gasoline Transport Vehicles and Vapor Collection Systems
SIP 391-3-1-.02(2) (t) - VOC Emissions from Automobile and Light-Duty Truck Manufacturing
SIP 391-3-1-.02(2) (tt) - VOC Emissions From Major Sources
SIP 391-3-1-.02(2) (u) - VOC Emissions from Can Coating
SIP 391-3-1-.02(2) (uu) - Visibility Protection
Tuesday, December 04, 2012 Page 11 of 12

Facility: West Fraser Inc. Application: 2012 PSD Application for Continuous Kilns
SIP 391-3-1-.02(2) (v) - VOC Emissions from Coil Coating
SIP 391-3-1-.02(2) (vv) - Volatile Organic Liquid Handling and Storage
SIP 391-3-1-.02(2) (w) - VOC Emissions from Paper Coating
SIP 391-3-1-.02(2) (x) - VOC Emissions from Fabric and Vinyl Coating
SIP 391-3-1-.02(2) (y) - VOC Emissions from Metal Furniture Coating
SIP 391-3-1-.02(2) (yy) - Nitrogen Oxide Emissions From Major Sources
SIP 391-3-1-.02(2) (z) - VOC Emissions from Large Appliance Surface Coating
SIP 391-3-1-.02(2) (zz) - Gasoline Dispensing Facilities--Stage II
SIP 391-3-1-.02(3) - Sampling
SIP 391-3-1-.02(6) - Source Monitoring
SIPNEW - Enter into the comment field any newly promulgated SIP regulations that is applicable or potentially applicable to your facility that has not already been listed here.
C1 - Regulatory Applicability
The following regulations have been identified as POTENTIALLY APPLICABLE:
FEDERAL 40 CFR 61 Subpart A - General Provisions
SIP 391-3-1-.02(2) (ff) - Solvent Metal Cleaning
Does your facility have any air conditioners or refrigeration equipment that uses CFC's, HFC's or other stratospheric ozone-depleting substances listed in 40 CFR Part 82, Subpart A, Appendices A and B?
Does any air conditioner or any piece of refrigeration equipment contain a refrigerant charge of greater than 50 lbs?
Does your facility maintain, service, repair, or dispose of any motor vehicle air conditioners (MVAC's) or appliances?
C2 - Title VI Applicability
Comments:
No
No
Yes
Tuesday, December 04, 2012 Page 12 of 12

D1 - Insignificant Activities
Facility: West Fraser Inc. Application: 2012 PSD Application for Continuous Kilns
Category: Industrial Operations
Insignificant Activity: Carving, cutting, routing, turning, drilling, machining, sawing, surface grinding, sanding, planing, buffing, shot blasting, shot peening, or polishing; ceramics, glass, leather, metals, plastics, rubber, concrete, paper stock or wood, also including roll grinding and ground wood pulping stone sharpening, provided that: Activity is performed indoors; and No significant fugitive particulate emissions enter the outdoor atmosphere; and No visible emissions enter the outdoor atmosphere.
Quantity: 1
Comment: Various activities
Category: Maintenance, Cleaning, and Housekeeping
Insignificant Activity: Cold cleaners having an air/vapor interface of not more than 10 square feet and that do not use a halogenated solvent.
Quantity: 5
Comment:
Category: Mobile Sources
Insignificant Activity: Cleaning and sweeping of streets and paved surfaces
Quantity: 1
Comment:
Category: Storage Tanks and Equipment
Insignificant Activity: All petroleum liquid storage tanks with a capacity of less than 10,000 gallons storing a petroleum liquid.
Quantity: 14
Comment:
Category: Storage Tanks and Equipment
Insignificant Activity: Portable drums, barrels and totes provided that the volume of each container does not exceed 550 gallons.
Quantity: 1
Comment: Various
Tuesday, December 04, 2012 Page 1 of 1

D2 - Generic Emissions Grouping
Facility: West Fraser Inc. Application: 2012 PSD Application for Continuous Kilns
This table lists the Generic Emissions Grouping information for groups of emission units that are subject to one or more of the three Georgia Rules, 391-3-1-.02(2)(b), (e), and (n) and the potential emissions of particulate matter, based on TSP, are less than 25 tons per year per process line or unit in each group. Any Emissions Unit subject to a NESHAP, NSPS, or any specific Air Quality Permit condition(s) is not included.
DB01
1
1
Yes
Yes
No
Unit ID:
Number of Units:
Number of Units in Compliance:
Applicable Ga Rule(b):
Applicable Ga Rule(e):
Applicable Ga Rule(n):
Comments:
LC01
1
1
Yes
Yes
No
Unit ID:
Number of Units:
Number of Units in Compliance:
Applicable Ga Rule(b):
Applicable Ga Rule(e):
Applicable Ga Rule(n):
Comments:
LM01
1
1
Yes
Yes
No
Unit ID:
Number of Units:
Number of Units in Compliance:
Applicable Ga Rule(b):
Applicable Ga Rule(e):
Applicable Ga Rule(n):
Comments:
Tuesday, December 04, 2012 Page 1 of 2

D2 - Generic Emissions Grouping
Facility: West Fraser Inc. Application: 2012 PSD Application for Continuous Kilns
WH01
1
1
Yes
Yes
No
Unit ID:
Number of Units:
Number of Units in Compliance:
Applicable Ga Rule(b):
Applicable Ga Rule(e):
Applicable Ga Rule(n):
Comments:
Tuesday, December 04, 2012 Page 2 of 2

D3 - Generic Fuel Burning Equipment
Facility: West Fraser Inc. Application: 2012 PSD Application for Continuous Kilns
This table lists the groups of fuel burning emission units indicating the number of units in each group and the number of units in compliance with Georgia Rules 391-3-1-.02(2) (d) and possibly (b):
Number of Units
Number of Units in
Compliance
0 0Any fuel burning equipment with a rated heat input capacity of 1 million BTU/hr or less.
0 0Fuel burning equipment with a rated heat input capacity of less than 10 million BTU/hr burning only natural gas and/or LPG.
0 0Fuel burning equipment with a rated heat input capacity of less than 5 million BTU/hr, burning only distillate fuel oil, natural gas and/or LPG.
Tuesday, December 04, 2012 Page 1 of 1

D6 - Insignificant Activities based on Emission Levels
Facility: West Fraser Inc. Application: 2012 PSD Application for Continuous Kilns
These Emission Units or Activities are not listed elsewhere in the application and whose potential emissions are:
1) less than 10,000 lb. per year of any regulated air pollutant; AND2) less than 1,000 lb. per year of any regulated HAP and less than 2,500 lb. per year of any combination of regulated HAPs; AND3) less than 5,000 lb. per year of volatile organic compounds and oxides of nitrogen in the non-attainment area; AND4) not subject to any specific state or federal standards or permit conditions.
Activity No. of Units
1For recreational purposes or cooking food for immediate human consumption
1Planer Mill and inherent cyclone - planes, cuts, sorts, and packages lumber
Tuesday, December 04, 2012 Page 1 of 1

D7 - Significant Emission Units
Dryers, Calciners, Kilns and Ovens
Emission Unit: KD04 Continuous Kiln #1
Facility: West Fraser Inc. Application: 2012 PSD Application for Continuous Kilns
Unit ID: KD04
Unit Name: Continuous Kiln #1
Emission Unit
Model Information
Custom
Custom
Date Manufactured or Reconstructed: 2012/2013
Installation Date: 2013
Description
Direct-fired Continuous Lumber Kiln
Comments
Equipment Type
This unit is a type of:
Type of Emission Unit: Kiln
Other:
Manufacturer:
Model Number:
Direct-fired Continuous Lumber Kiln
Fuels and Firing Conditions:
7778 lbs
35 MMBtu/hr
34067 tons
4500 Btu/lb
2.5 %
Fuel: Sawdust
Maximum Hourly Consumption:
Maximum Annual Consumption:
Maximum Fuel Heating Value:
Maximum Heat Input:
Maximum Allowable Sulfur Percentage:
Material: Southern Yellow Pine Lumber
12600 bf/hr
50 %
Maximum Hourly Input Rate:
Average Free Moisture Content:
Tuesday, December 04, 2012 Page 1 of 2

Dryers, Calciners, Kilns and Ovens
Emission Unit: KD05 Continuous Kiln #2
Facility: West Fraser Inc. Application: 2012 PSD Application for Continuous Kilns
Unit ID: KD05
Unit Name: Continuous Kiln #2
Emission Unit
Model Information
Custom
Custom
Date Manufactured or Reconstructed: 2012/2013
Installation Date: 2013
Description
Direct-fired Continuous Lumber Kiln
Comments
Equipment Type
This unit is a type of:
Type of Emission Unit: Kiln
Other:
Manufacturer:
Model Number:
Direct-fired Continuous Lumber Kiln
Fuels and Firing Conditions:
7778 lbs
35 MMBtu/hr
34067 tons
4500 Btu/lb
2.5 %
Fuel: Sawdust
Maximum Hourly Consumption:
Maximum Annual Consumption:
Maximum Fuel Heating Value:
Maximum Heat Input:
Maximum Allowable Sulfur Percentage:
Material: Southern Yellow Pine lumber
12600 bf/hr
50 %
Maximum Hourly Input Rate:
Average Free Moisture Content:
Tuesday, December 04, 2012 Page 2 of 2

D8 - Fugitive Emissions
These Fugitive Emissions Sources are not listed elsewhere in this application including Insignificant Activities and Fugitive Emissions Associated with Leak Detection and Repair (LDAR).
Facility: West Fraser Inc. Application: 2012 PSD Application for Continuous Kilns
Emission Unit ID: RF01
Name of the Source: Unpaved Road Dust
Description of the Emissions: Fugitive dust from vehicle traffic
Emission Unit ID: RF02
Name of the Source: Paved Road Dust
Description of the Emissions: Fugitive dust from vehicle traffic
Tuesday, December 04, 2012 Page 1 of 1

D12 - Stack and Process Vent Summary
Facility: West Fraser Inc. Application: 2012 PSD Application for Continuous Kilns
KD04
Continuous Kiln 1 - Stack A
35 feet
KD04
N/A
Stack ID
Stack Name
Stack Height
All Emission Units Exhausting throught this Stack
All Pollution Control Devices Exhuasting through this Stack
KD04
Continuous Kiln 1 - Stack B
35 feet
KD04
N/A
Stack ID
Stack Name
Stack Height
All Emission Units Exhausting throught this Stack
All Pollution Control Devices Exhuasting through this Stack
KD05
Continuous Kiln 2 - Stack A
35 feet
KD05
N/A
Stack ID
Stack Name
Stack Height
All Emission Units Exhausting throught this Stack
All Pollution Control Devices Exhuasting through this Stack
KD05
Continuous Kiln 2 - Stack B
35 feet
KD05
N/A
Stack ID
Stack Name
Stack Height
All Emission Units Exhausting throught this Stack
All Pollution Control Devices Exhuasting through this Stack
Tuesday, December 04, 2012 Page 1 of 1

Summary of Emissions - Units, Groups
Facility: West Fraser Inc. Application: 2012 PSD Application for Continuous
Pollutant Carbon Monoxide
Maximum Actual Emissions in Tons per Year: 40.15 tons/yr
Method the Emissions were determined (CEM, Stack Testing, Mass Balance, etc.):
NCASI Factor, from publically available document
Applicable Federal Standard:
Applicable State Standard:
Applicable Permit Condition(s):
Is this a Proposed Voluntary Limit?
Is there a Work Practice or Design Standard?
Is this in Compliance with the Standard(s) ?
No
No
No
Numerical Emission Limit or Standard:
Maximum Actual Emissions in Units of the Standard:
Emission Unit: KD04 Continuous Kiln #1
Pollutant Nitrogen Oxides
Maximum Actual Emissions in Tons per Year: 15.4 tons/yr
Method the Emissions were determined (CEM, Stack Testing, Mass Balance, etc.):
NCASI Factor, from publically available document
Applicable Federal Standard:
Applicable State Standard:
Applicable Permit Condition(s):
Is this a Proposed Voluntary Limit?
Is there a Work Practice or Design Standard?
Is this in Compliance with the Standard(s) ?
No
No
No
Numerical Emission Limit or Standard:
Maximum Actual Emissions in Units of the Standard:
Emission Unit: KD04 Continuous Kiln #1
Tuesday, December 04, 2012 Page 1 of 8

Facility: West Fraser Inc. Application: 2012 PSD Application for Continuous
Pollutant Particulate Matter
Maximum Actual Emissions in Tons per Year: 7.59 tons/yr
Method the Emissions were determined (CEM, Stack Testing, Mass Balance, etc.):
NCASI Factor, from publically available document
Applicable Federal Standard:
Applicable State Standard:
Applicable Permit Condition(s):
Is this a Proposed Voluntary Limit?
Is there a Work Practice or Design Standard?
Is this in Compliance with the Standard(s) ?
No
No
No
Numerical Emission Limit or Standard: 0
Maximum Actual Emissions in Units of the Standard:
0
Emission Unit: KD04 Continuous Kiln #1
Pollutant Particulate Matter <10 microns
Maximum Actual Emissions in Tons per Year: 5.72 tons/yr
Method the Emissions were determined (CEM, Stack Testing, Mass Balance, etc.):
NCASI Factor, from publically available document
Applicable Federal Standard:
Applicable State Standard:
Applicable Permit Condition(s):
Is this a Proposed Voluntary Limit?
Is there a Work Practice or Design Standard?
Is this in Compliance with the Standard(s) ?
No
No
No
Numerical Emission Limit or Standard: 0
Maximum Actual Emissions in Units of the Standard:
0
Emission Unit: KD04 Continuous Kiln #1
Tuesday, December 04, 2012 Page 2 of 8
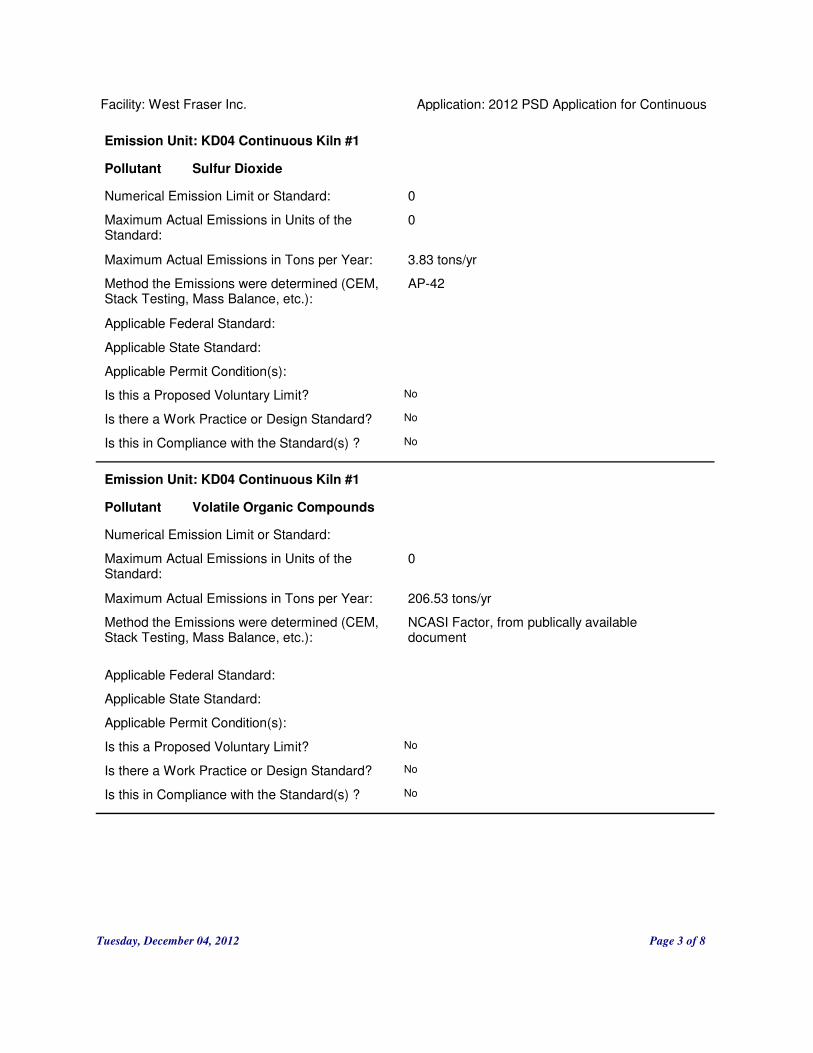
Facility: West Fraser Inc. Application: 2012 PSD Application for Continuous
Pollutant Sulfur Dioxide
Maximum Actual Emissions in Tons per Year: 3.83 tons/yr
Method the Emissions were determined (CEM, Stack Testing, Mass Balance, etc.):
AP-42
Applicable Federal Standard:
Applicable State Standard:
Applicable Permit Condition(s):
Is this a Proposed Voluntary Limit?
Is there a Work Practice or Design Standard?
Is this in Compliance with the Standard(s) ?
No
No
No
Numerical Emission Limit or Standard: 0
Maximum Actual Emissions in Units of the Standard:
0
Emission Unit: KD04 Continuous Kiln #1
Pollutant Volatile Organic Compounds
Maximum Actual Emissions in Tons per Year: 206.53 tons/yr
Method the Emissions were determined (CEM, Stack Testing, Mass Balance, etc.):
NCASI Factor, from publically available document
Applicable Federal Standard:
Applicable State Standard:
Applicable Permit Condition(s):
Is this a Proposed Voluntary Limit?
Is there a Work Practice or Design Standard?
Is this in Compliance with the Standard(s) ?
No
No
No
Numerical Emission Limit or Standard:
Maximum Actual Emissions in Units of the Standard:
0
Emission Unit: KD04 Continuous Kiln #1
Tuesday, December 04, 2012 Page 3 of 8

Facility: West Fraser Inc. Application: 2012 PSD Application for Continuous
Pollutant Carbon Monoxide
Maximum Actual Emissions in Tons per Year: 40.15 tons/yr
Method the Emissions were determined (CEM, Stack Testing, Mass Balance, etc.):
NCASI Factor, from publically available document
Applicable Federal Standard:
Applicable State Standard:
Applicable Permit Condition(s):
Is this a Proposed Voluntary Limit?
Is there a Work Practice or Design Standard?
Is this in Compliance with the Standard(s) ?
No
No
No
Numerical Emission Limit or Standard:
Maximum Actual Emissions in Units of the Standard:
0
Emission Unit: KD05 Continuous Kiln #2
Pollutant Nitrogen Oxides
Maximum Actual Emissions in Tons per Year: 15.4 tons/yr
Method the Emissions were determined (CEM, Stack Testing, Mass Balance, etc.):
NCASI Factor, from publically available document
Applicable Federal Standard:
Applicable State Standard:
Applicable Permit Condition(s):
Is this a Proposed Voluntary Limit?
Is there a Work Practice or Design Standard?
Is this in Compliance with the Standard(s) ?
No
No
No
Numerical Emission Limit or Standard:
Maximum Actual Emissions in Units of the Standard:
0
Emission Unit: KD05 Continuous Kiln #2
Tuesday, December 04, 2012 Page 4 of 8

Facility: West Fraser Inc. Application: 2012 PSD Application for Continuous
Pollutant Particulate Matter
Maximum Actual Emissions in Tons per Year: 7.59 tons/yr
Method the Emissions were determined (CEM, Stack Testing, Mass Balance, etc.):
NCASI Factor, from publically available document
Applicable Federal Standard:
Applicable State Standard:
Applicable Permit Condition(s):
Is this a Proposed Voluntary Limit?
Is there a Work Practice or Design Standard?
Is this in Compliance with the Standard(s) ?
No
No
No
Numerical Emission Limit or Standard: 0
Maximum Actual Emissions in Units of the Standard:
0
Emission Unit: KD05 Continuous Kiln #2
Pollutant Particulate Matter <10 microns
Maximum Actual Emissions in Tons per Year: 5.72 tons/yr
Method the Emissions were determined (CEM, Stack Testing, Mass Balance, etc.):
NCASI Factor, from publically available document
Applicable Federal Standard:
Applicable State Standard:
Applicable Permit Condition(s):
Is this a Proposed Voluntary Limit?
Is there a Work Practice or Design Standard?
Is this in Compliance with the Standard(s) ?
No
No
No
Numerical Emission Limit or Standard: 0
Maximum Actual Emissions in Units of the Standard:
0
Emission Unit: KD05 Continuous Kiln #2
Tuesday, December 04, 2012 Page 5 of 8

Facility: West Fraser Inc. Application: 2012 PSD Application for Continuous
Pollutant Sulfur Dioxide
Maximum Actual Emissions in Tons per Year: 3.83 tons/yr
Method the Emissions were determined (CEM, Stack Testing, Mass Balance, etc.):
AP-42
Applicable Federal Standard:
Applicable State Standard:
Applicable Permit Condition(s):
Is this a Proposed Voluntary Limit?
Is there a Work Practice or Design Standard?
Is this in Compliance with the Standard(s) ?
No
No
No
Numerical Emission Limit or Standard: 0
Maximum Actual Emissions in Units of the Standard:
0
Emission Unit: KD05 Continuous Kiln #2
Pollutant Volatile Organic Compounds
Maximum Actual Emissions in Tons per Year: 206.53 tons/yr
Method the Emissions were determined (CEM, Stack Testing, Mass Balance, etc.):
NCASI Factor, from publically available document
Applicable Federal Standard:
Applicable State Standard:
Applicable Permit Condition(s):
Is this a Proposed Voluntary Limit?
Is there a Work Practice or Design Standard?
Is this in Compliance with the Standard(s) ?
No
No
No
Numerical Emission Limit or Standard:
Maximum Actual Emissions in Units of the Standard:
0
Emission Unit: KD05 Continuous Kiln #2
Tuesday, December 04, 2012 Page 6 of 8

Facility: West Fraser Inc. Application: 2012 PSD Application for Continuous
Pollutant Particulate Matter
Maximum Actual Emissions in Tons per Year: 67.97 tons/yr
Method the Emissions were determined (CEM, Stack Testing, Mass Balance, etc.):
AP-42
Applicable Federal Standard:
Applicable State Standard:
Applicable Permit Condition(s):
Is this a Proposed Voluntary Limit?
Is there a Work Practice or Design Standard?
Is this in Compliance with the Standard(s) ?
No
No
No
Numerical Emission Limit or Standard:
Maximum Actual Emissions in Units of the Standard:
0
Emission Unit: RF01 Unpaved Road Dust
Pollutant Particulate Matter <10 microns
Maximum Actual Emissions in Tons per Year: 19.37 tons/yr
Method the Emissions were determined (CEM, Stack Testing, Mass Balance, etc.):
AP-42
Applicable Federal Standard:
Applicable State Standard:
Applicable Permit Condition(s):
Is this a Proposed Voluntary Limit?
Is there a Work Practice or Design Standard?
Is this in Compliance with the Standard(s) ?
No
No
No
Numerical Emission Limit or Standard: 0
Maximum Actual Emissions in Units of the Standard:
0
Emission Unit: RF01 Unpaved Road Dust
Tuesday, December 04, 2012 Page 7 of 8

Facility: West Fraser Inc. Application: 2012 PSD Application for Continuous
Pollutant Particulate Matter
Maximum Actual Emissions in Tons per Year: 116.53 tons/yr
Method the Emissions were determined (CEM, Stack Testing, Mass Balance, etc.):
AP-42
Applicable Federal Standard:
Applicable State Standard:
Applicable Permit Condition(s):
Is this a Proposed Voluntary Limit?
Is there a Work Practice or Design Standard?
Is this in Compliance with the Standard(s) ?
No
No
No
Numerical Emission Limit or Standard:
Maximum Actual Emissions in Units of the Standard:
0
Emission Unit: RF02 Paved Road Dust
Pollutant Particulate Matter <10 microns
Maximum Actual Emissions in Tons per Year: 23.31 tons/yr
Method the Emissions were determined (CEM, Stack Testing, Mass Balance, etc.):
AP-42
Applicable Federal Standard:
Applicable State Standard:
Applicable Permit Condition(s):
Is this a Proposed Voluntary Limit?
Is there a Work Practice or Design Standard?
Is this in Compliance with the Standard(s) ?
No
No
No
Numerical Emission Limit or Standard: 0
Maximum Actual Emissions in Units of the Standard:
0
Emission Unit: RF02 Paved Road Dust
Tuesday, December 04, 2012 Page 8 of 8

F - Facility Compliance
The following list contains all of the emissions units and groups that have been entered for this project:
Type ID Emission Group Name
Facility: West Fraser Inc. Application: 2012 PSD Application for Continuous Kilns
Facility-Wide Facility-Wide Emissions
Emission Unit KD05 Continuous Kiln #2
Emission Unit KD04 Continuous Kiln #1
Fugitive Emissions Gro RF02 Paved Road Dust
Fugitive Emissions Gro RF01 Unpaved Road Dust
Tuesday, December 04, 2012 Page 1 of 1

F - Facility Compliance
Facility: West Fraser Inc. Application: 2012 PSD Application for Continuous Kilns
Compliance Determination Procedures: Monitoring
Monitoring Code: M24
Location Where Monitoring is Taking Place: Lumber kiln production
Averaging Time: 1 Months
Data Acquisition Frequency: 1 Months
Description of the Types of Records Being Kept with this Monitoring:
Total Lumber Kiln production for any 12 consecutive months
Reporting Frequency: 6 Months
Regulation or Permit Condition that Requires this Monitoring:
Comments or Other Information:
Pollutant: Volatile Organic Compounds
Monitoring Code Description: Recordkeeping of production, raw material, or process input related information.
NoIs this Monitoring Already Taking Place and Being Performed?
Emission Unit: KD04Continuous Kiln #1
Monitoring Code: M25
Location Where Monitoring is Taking Place: Continuous Kiln #1
Averaging Time: 1 Days
Data Acquisition Frequency: 1 Days
Description of the Types of Records Being Kept with this Monitoring:
Work Practice and Preventative Maintenance Program for Kilns.
Reporting Frequency: 6 Months
Regulation or Permit Condition that Requires this Monitoring:
Comments or Other Information: Daily, weekly, monthly, semi-annual and annual routines are to be performed on two kilns.
Pollutant: Other
Monitoring Code Description: Monitoring of work practice factors [Note: For this entry, in addition to giving the code, list all work practice factors which will have specific compliance related provisions.]
NoIs this Monitoring Already Taking Place and Being Performed?
Emission Unit: KD04Continuous Kiln #1
Tuesday, December 04, 2012 Page 1 of 3
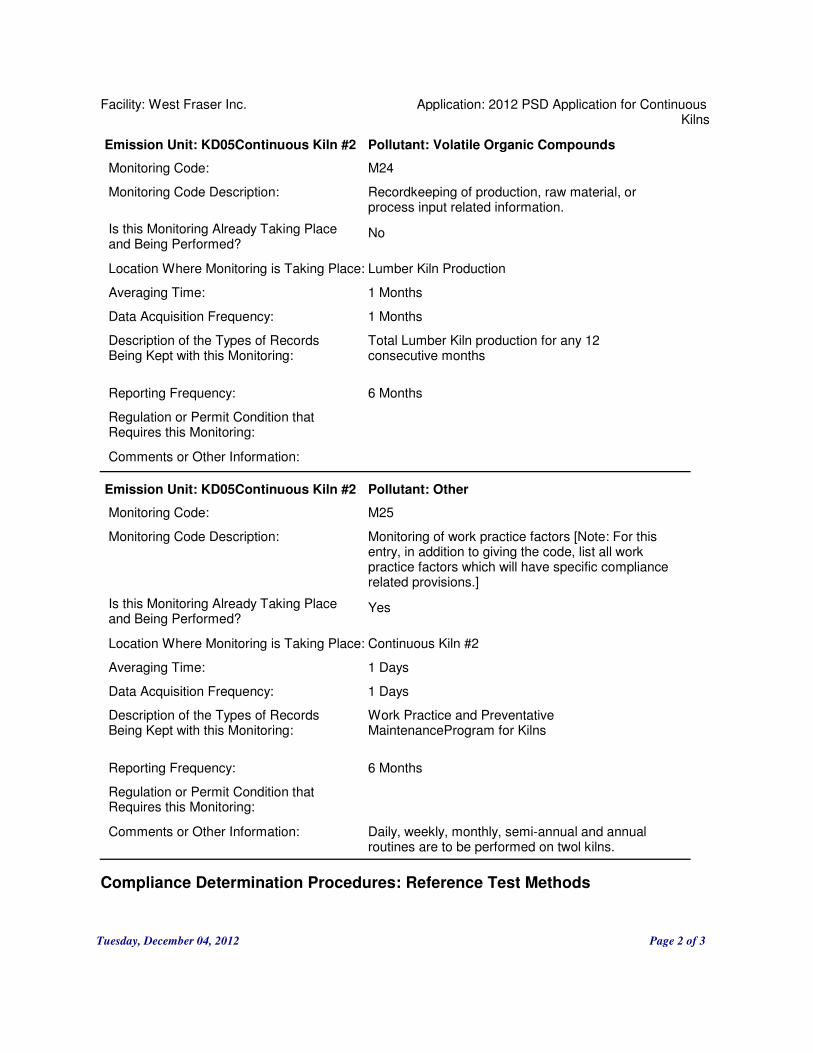
Facility: West Fraser Inc. Application: 2012 PSD Application for Continuous Kilns
Compliance Determination Procedures: Reference Test Methods
Monitoring Code: M24
Location Where Monitoring is Taking Place: Lumber Kiln Production
Averaging Time: 1 Months
Data Acquisition Frequency: 1 Months
Description of the Types of Records Being Kept with this Monitoring:
Total Lumber Kiln production for any 12 consecutive months
Reporting Frequency: 6 Months
Regulation or Permit Condition that Requires this Monitoring:
Comments or Other Information:
Pollutant: Volatile Organic Compounds
Monitoring Code Description: Recordkeeping of production, raw material, or process input related information.
NoIs this Monitoring Already Taking Place and Being Performed?
Emission Unit: KD05Continuous Kiln #2
Monitoring Code: M25
Location Where Monitoring is Taking Place: Continuous Kiln #2
Averaging Time: 1 Days
Data Acquisition Frequency: 1 Days
Description of the Types of Records Being Kept with this Monitoring:
Work Practice and Preventative MaintenanceProgram for Kilns
Reporting Frequency: 6 Months
Regulation or Permit Condition that Requires this Monitoring:
Comments or Other Information: Daily, weekly, monthly, semi-annual and annual routines are to be performed on twol kilns.
Pollutant: Other
Monitoring Code Description: Monitoring of work practice factors [Note: For this entry, in addition to giving the code, list all work practice factors which will have specific compliance related provisions.]
YesIs this Monitoring Already Taking Place and Being Performed?
Emission Unit: KD05Continuous Kiln #2
Tuesday, December 04, 2012 Page 2 of 3

Facility: West Fraser Inc. Application: 2012 PSD Application for Continuous Kilns
Compliance Plan for a non-Compliant Emission Unit or Group
Tuesday, December 04, 2012 Page 3 of 3
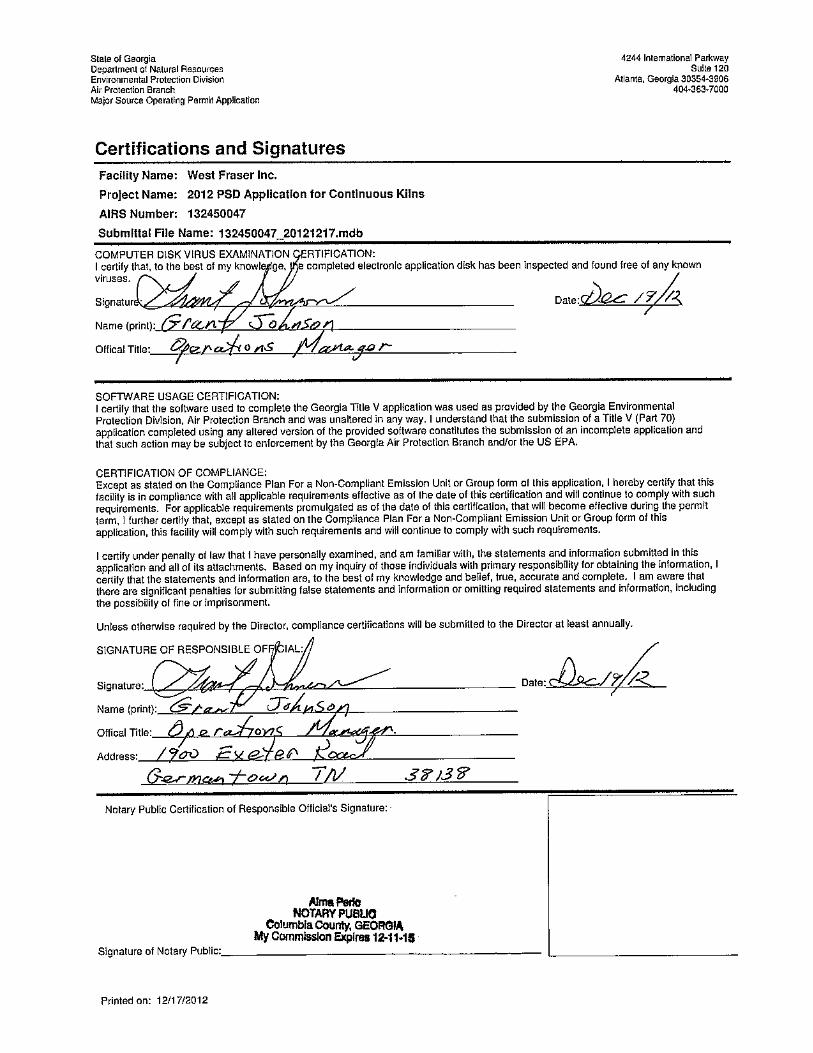

West Fraser, Inc. – Augusta Mill | Continuous Kiln Construction Permit Application Trinity Consultants H
APPENDIX H: REFERENCE DOCUMENTATION
West Fraser, Inc. – Augusta Mill | Continuous Kiln Construction Permit Application Trinity Consultants I
APPENDIX I: LETTERS TO FEDERAL LAND MANAGERS

December,17,2012Ms.AndreaStacyNationalParkServiceAirResourcesDivision12795W.AlamedaParkwayP.O.Box25287Denver,[email protected]: WestFraser,Inc.–Augusta,GA
NotificationofPSDProjectinReferencetoNPSClassIAreasDearMs.Stacy,TrinityConsultants(Trinity)issubmittingthislettertoyourattentiononbehalfofourclientWestFraser,Inc.(WestFraser)foraproposedmodificationattheirfacilitylocatedsouthofAugusta,Georgia(RichmondCounty).WestFraserintendstoinstalltwocontinuousdualpathdirectfiredlumberdryingkilnsattheAugustaMillwhichwillincreasetotalfacility‐wideproductiontoalimitof220MMBF/yr.TheexistingbatchkilnsattheAugustaMillwillberemovedaspartofthisproject.ExpectedemissionsfromthefacilityareNOX,CO,PM,PM10,PM2.5,SO2,VOC,GHGandcombustionemissionsassociatedwithlumberdrying.TheproposedprojectrequiresPreventionofSignificantDeterioration(PSD)permittingforVOConly.APSDconstructionpermitapplicationwassubmittedtotheGeorgiaEnvironmentalProtectionDivision(EPD)inDecember2012.AspartofthePSDapplicationprocess,WestFraserhasqualitativelyevaluateditsimpactsonfederally‐protectedClassIareas.ThepurposeofthisletteristoprovidetheFederalLandManager(FLM)withpreliminaryinformationontheproposedprojectandtorequestconcurrencefromtheFLMonthefindingspresented.
Q/D SCREENING ANALYSIS
AQ/DscreeninganalysiswasperformedinamannerconsistentwiththeapproachdiscussedinthemostrecentFederalLandManagers’AirQualityRelatedValuesWorkGroup(FLAG)guidancedocument(FLAG2010),whichcomparestheratioofvisibilityaffectingpollutantemissionstothedistancefromtheClassIarea(i.e.,referencedhereinastheFLAG2010Approach).1“Q”isthesumoftheannualNOX,PM10,SO2,andH2SO4emissions,intonsperyear(tpy)2and“D”isthedistance,inkilometers(km),fromtheproposedfacilitytothecorrespondingClassIarea.Thetotalemissionsforthis“project”includeemissionsincreasesfromallpossiblesourcesatthefacility.Asummaryofthevisibility‐affectingpollutant(VAP)emissionsresultingfromtheproposedprojectareshowninTable1usingtheFLAG2010Approach.
1 Federal Land Managers’ Air Quality Related Values Work Group (FLAG) Phase I Report – Revised 2010, October 7, 2010. 2 It is specified within the Flag 2010 Report that “Q” be calculated as the sum of the worst-case 24-hour emissions converted to an annual basis.

Ms.AndreaStacy‐Page2DecemberXX,2012
Table1.SummaryofVisibility‐AffectingPollutantEmissionIncreases
Pollutant
Facility‐WideMaximum24‐hr
EmissionsIncrease(lb/hr)
FLAG2010ApproachAnnual
Emissions2(tpy)
NOX 2.50 10.93
DirectParticulate1 0.58 2.52
SO2 0.19 0.82
SumofEmissions(tpy) 14.271.DirectparticulateincludesallfilterableandcondensiblePM10.2.FLAG2010Approach:Q=Maximum24hourbasis*8,760/2000.
AsshowninTable2,eight(8)ClassIareasarelocatedwithin300kmoftheproposedprojectinJeffersonCounty,Georgia.TheonlyClassIareawithin300kmoftheproposedfacilitymanagedbytheNationalParkService(NPS)isGreatSmokyMountainsNationalPark,whichis269kilometersaway.
Table2.SummaryofClassIAreaswithin300kmoftheProposedProject
Table2showstheresultsoftheQ/DscreeninganalysisfortheFLAG2010Approach.AsshowninTable2,alloftheeightClassIareaswithin300kmoftheproject(consideringsource‐wideemissions)haveaQ/Dwellbelowten.ThissuggeststhattheproposedprojectwillhavenoadverseimpactstoanyAQRVsatnear‐byClassIareas;therefore,WestFraserplansnoAQRVanalysesfortheproposedproject.BasedonTable2,WestFraserrequeststhattheNPSprovidewrittenconcurrenceofthisfindingofnoimpact.
~~~~~~~~~~~~~~~~~~~~~~~~~~~~~~~~~~~~~~~~~~~~~~~~~~~~WestFrasergreatlyappreciatesyourfeedbackonthisconclusionregardingnopresumptiveimpactstoAQRVsatClassIareasundermanagementoftheNPS.Pleasefeelfreetocontactmeat678‐441‐9977withanyquestionsthatyouhave.Sincerely,
MinimumDistance AnnualizedVAPResponsible fromSite Emissions
ClassIArea FLM (km)* (tpy) Q/D
JoyceKilmer‐SlickRockWilderness FS 289 14.27 0.05CapeRomainFish&Wildlife FWS 221 14.27 0.06WolfIslandFish&Wildlife FWS 225 14.27 0.06ShiningRockWilderness FS 237 14.27 0.06OkefenokeeFish&Wildlife FWS 253 14.27 0.06GreatSmokyMountainsNationalPark NPS 269 14.27 0.05LinvilleGorgeWilderness FS 276 14.27 0.05CohuttaWilderness FS 295 14.27 0.05

Ms.AndreaStacy‐Page3DecemberXX,2012
TRINITYCONSULTANTS
JustinFickasManagingConsultantcc: Mr.EricCornwell(GeorgiaEPD)
Mr.BillJackson(ForestService)Ms.CatherineCollins(FishandWildlifeService)Mr.MackWinfrey(WestFraser)
December17,2012Ms.CatherineCollinsEnvironmentalEngineerUnitedStatesFishandWildlifeService(FWS)BranchofAirQuality7333WestJeffersonAvenue,Suite375Lakewood,CO80235‐[email protected]: WestFraser,Inc.–Augusta,GA
NotificationofPSDProjectinReferencetoFWSClassIAreasDearMs.Collins,TrinityConsultants(Trinity)issubmittingthislettertoyourattentiononbehalfofourclientWestFraser,Inc.(WestFraser)foraproposedmodificationattheirfacilitylocatedsouthofAugusta,Georgia(RichmondCounty).WestFraserintendstoinstalltwocontinuousdualpathdirectfiredlumberdryingkilnsattheAugustaMillwhichwillincreasetotalfacility‐wideproductiontoalimitof220MMBF/yr.TheexistingbatchkilnsattheAugustaMillwillberemovedaspartofthisproject.ExpectedemissionsfromthefacilityareNOX,CO,PM,PM10,PM2.5,SO2,VOC,GHGandcombustionemissionsassociatedwithlumberdrying.TheproposedprojectrequiresPreventionofSignificantDeterioration(PSD)permittingforVOConly.APSDconstructionpermitapplicationwassubmittedtotheGeorgiaEnvironmentalProtectionDivision(EPD)inDecember2012.AspartofthePSDapplicationprocess,WestFraserhasqualitativelyevaluateditsimpactsonfederally‐protectedClassIareas.ThepurposeofthisletteristoprovidetheFederalLandManager(FLM)withpreliminaryinformationontheproposedprojectandtorequestconcurrencefromtheFLMonthefindingspresented.
Q/D SCREENING ANALYSIS
AQ/DscreeninganalysiswasperformedinamannerconsistentwiththeapproachdiscussedinthemostrecentFederalLandManagers’AirQualityRelatedValuesWorkGroup(FLAG)guidancedocument(FLAG2010),whichcomparestheratioofvisibilityaffectingpollutantemissionstothedistancefromtheClassIarea(i.e.,referencedhereinastheFLAG2010Approach).1“Q”isthesumoftheannualNOX,PM10,SO2,andH2SO4emissions,intonsperyear(tpy)2and“D”isthedistance,inkilometers(km),fromtheproposedfacilitytothecorrespondingClassIarea.Thetotalemissionsforthis“project”includeemissionsincreasesfromallpossiblesourcesatthefacility.Asummaryofthevisibility‐affectingpollutant(VAP)emissionsresultingfromtheproposedprojectareshowninTable1usingtheFLAG2010Approach.
1 Federal Land Managers’ Air Quality Related Values Work Group (FLAG) Phase I Report – Revised 2010, October 7, 2010. 2 It is specified within the Flag 2010 Report that “Q” be calculated as the sum of the worst-case 24-hour emissions converted to an annual basis.

Ms.CatherineCollins‐Page2DecemberXX,2012
Table1.SummaryofVisibility‐AffectingPollutantEmissionIncreases
Pollutant
Facility‐WideMaximum24‐hr
EmissionsIncrease(lb/hr)
FLAG2010ApproachAnnual
Emissions2(tpy)
NOX 2.50 10.93
DirectParticulate1 0.58 2.52
SO2 0.19 0.82
SumofEmissions(tpy) 14.271.DirectparticulateincludesallfilterableandcondensiblePM10.2.FLAG2010Approach:Q=Maximum24hourbasis*8,760/2000.
AsshowninTable2,eight(8)ClassIareasarelocatedwithin300kmoftheproposedprojectinJeffersonCounty,Georgia.TheonlyClassIareaswithin300kmoftheproposedfacilitymanagedbytheFishandWildlifeService(FWS)areWolfIsland,Okefenokee,andCapeRomain,whicharebetween221and253kilometersaway.
Table2.SummaryofClassIAreaswithin300kmoftheProposedProject
Table2showstheresultsoftheQ/DscreeninganalysisfortheFLAG2010Approach.AsshowninTable2,alloftheeightClassIareaswithin300kmoftheproject(consideringsource‐wideemissions)haveaQ/Dwellbelowten.ThissuggeststhattheproposedprojectwillhavenoadverseimpactstoanyAQRVsatnear‐byClassIareas;therefore,WestFraserplansnoAQRVanalysesfortheproposedproject.BasedonTable2,WestFraserrequeststhattheFWSprovidewrittenconcurrenceofthisfindingofnoimpact.
~~~~~~~~~~~~~~~~~~~~~~~~~~~~~~~~~~~~~~~~~~~~~~~~~~~~WestFrasergreatlyappreciatesyourfeedbackonthisconclusionregardingnopresumptiveimpactstoAQRVsatClassIareasundermanagementoftheFWS.Pleasefeelfreetocontactmeat678‐441‐9977withanyquestionsthatyouhave.Sincerely,
MinimumDistance AnnualizedVAPResponsible fromSite Emissions
ClassIArea FLM (km)* (tpy) Q/D
JoyceKilmer‐SlickRockWilderness FS 289 14.27 0.05CapeRomainFish&Wildlife FWS 221 14.27 0.06WolfIslandFish&Wildlife FWS 225 14.27 0.06ShiningRockWilderness FS 237 14.27 0.06OkefenokeeFish&Wildlife FWS 253 14.27 0.06GreatSmokyMountainsNationalPark NPS 269 14.27 0.05LinvilleGorgeWilderness FS 276 14.27 0.05CohuttaWilderness FS 295 14.27 0.05

Ms.CatherineCollins‐Page3DecemberXX,2012
TRINITYCONSULTANTS
JustinFickasManagingConsultantcc: Mr.EricCornwell(GeorgiaEPD)
Ms.AndreaStacy(NationalParkService)Mr.BillJackson(ForestService)Mr.MackWinfrey(WestFraser)

December17,2012Mr.BillJacksonAirProgramStaffUSDAForestService(FS)NationalForestsinNorthCarolinaP.O.Box2750Ashville,[email protected]: WestFraser,Inc.–Augusta,GA
NotificationofPSDProjectinReferencetoFSClassIAreasDearMr.Jackson,TrinityConsultants(Trinity)issubmittingthislettertoyourattentiononbehalfofourclientWestFraser,Inc.(WestFraser)foraproposedmodificationattheirfacilitylocatedsouthofAugusta,Georgia(RichmondCounty).WestFraserintendstoinstalltwocontinuousdualpathdirectfiredlumberdryingkilnsattheAugustaMillwhichwillincreasetotalfacility‐wideproductiontoalimitof220MMBF/yr.TheexistingbatchkilnsattheAugustaMillwillberemovedaspartofthisproject.ExpectedemissionsfromthefacilityareNOX,CO,PM,PM10,PM2.5,SO2,VOC,GHGandcombustionemissionsassociatedwithlumberdrying.TheproposedprojectrequiresPreventionofSignificantDeterioration(PSD)permittingforVOConly.APSDconstructionpermitapplicationwassubmittedtotheGeorgiaEnvironmentalProtectionDivision(EPD)inDecember2012.AspartofthePSDapplicationprocess,WestFraserhasqualitativelyevaluateditsimpactsonfederally‐protectedClassIareas.ThepurposeofthisletteristoprovidetheFederalLandManager(FLM)withpreliminaryinformationontheproposedprojectandtorequestconcurrencefromtheFLMonthefindingspresented.
Q/D SCREENING ANALYSIS
AQ/DscreeninganalysiswasperformedinamannerconsistentwiththeapproachdiscussedinthemostrecentFederalLandManagers’AirQualityRelatedValuesWorkGroup(FLAG)guidancedocument(FLAG2010),whichcomparestheratioofvisibilityaffectingpollutantemissionstothedistancefromtheClassIarea(i.e.,referencedhereinastheFLAG2010Approach).1“Q”isthesumoftheannualNOX,PM10,SO2,andH2SO4emissions,intonsperyear(tpy)2and“D”isthedistance,inkilometers(km),fromtheproposedfacilitytothecorrespondingClassIarea.Thetotalemissionsforthis“project”includeemissionsincreasesfromallpossiblesourcesatthefacility.Asummaryofthevisibility‐affectingpollutant(VAP)emissionsresultingfromtheproposedprojectareshowninTable1usingtheFLAG2010Approach.
1 Federal Land Managers’ Air Quality Related Values Work Group (FLAG) Phase I Report – Revised 2010, October 7, 2010. 2 It is specified within the Flag 2010 Report that “Q” be calculated as the sum of the worst-case 24-hour emissions converted to an annual basis.

Mr.BillJackson‐Page2December7,2012
Table1.SummaryofVisibility‐AffectingPollutantEmissionIncreases
Pollutant
Facility‐WideMaximum24‐hr
EmissionsIncrease(lb/hr)
FLAG2010ApproachAnnual
Emissions2(tpy)
NOX 2.50 10.93
DirectParticulate1 0.58 2.52
SO2 0.19 0.82
SumofEmissions(tpy) 14.271.DirectparticulateincludesallfilterableandcondensiblePM10.2.FLAG2010Approach:Q=Maximum24hourbasis*8,760/2000.
AsshowninTable2,eight(8)ClassIareasarelocatedwithin300kmoftheproposedprojectinRichmondCounty,Georgia.TheonlyClassIareaswithin300kmoftheproposedfacilitymanagedbytheForestService(FS)areShiningRock,Cohutta,JoyceKilmer/Slickrock,andLinvilleGorge,whicharebetween237and295kilometersaway.
Table2.SummaryofClassIAreaswithin300kmoftheProposedProject
Table2showstheresultsoftheQ/DscreeninganalysisfortheFLAG2010Approach.AsshowninTable2,alloftheeightClassIareaswithin300kmoftheproject(consideringsource‐wideemissions)haveaQ/Dwellbelowten.ThissuggeststhattheproposedprojectwillhavenoadverseimpactstoanyAQRVsatnear‐byClassIareas;therefore,WestFraserplansnoAQRVanalysesfortheproposedproject.BasedonTable2,WestFraserrequeststhattheFSprovidewrittenconcurrenceofthisfindingofnoimpact.
~~~~~~~~~~~~~~~~~~~~~~~~~~~~~~~~~~~~~~~~~~~~~~~~~~~~WestFrasergreatlyappreciatesyourfeedbackonthisconclusionregardingnopresumptiveimpactstoAQRVsatClassIareasundermanagementoftheFS.Pleasefeelfreetocontactmeat678‐441‐9977withanyquestionsthatyouhave.Sincerely,
MinimumDistance AnnualizedVAPResponsible fromSite Emissions
ClassIArea FLM (km)* (tpy) Q/D
JoyceKilmer‐SlickRockWilderness FS 289 14.27 0.05CapeRomainFish&Wildlife FWS 221 14.27 0.06WolfIslandFish&Wildlife FWS 225 14.27 0.06ShiningRockWilderness FS 237 14.27 0.06OkefenokeeFish&Wildlife FWS 253 14.27 0.06GreatSmokyMountainsNationalPark NPS 269 14.27 0.05LinvilleGorgeWilderness FS 276 14.27 0.05CohuttaWilderness FS 295 14.27 0.05

Mr.BillJackson‐Page3December7,2012
TRINITYCONSULTANTS
JustinFickasManagingConsultantcc: Mr.EricCornwell(GeorgiaEPD)
Ms.AndreaStacy(NationalParkService)Ms.CatherineCollins(FishandWildlifeService)Mr.MackWinfrey(WestFraser)

February 1, 2013 Response

February 1, 2013
Ms. Susan Jenkins
Georgia Environmental Protection Division
Air Protection Branch
4244 International Parkway, Suite 120
Atlanta, Georgia 30354
RE: West Fraser, Inc. – Augusta, Georgia
PSD Permit Application – Continuous Kiln Project – Application Updated Requested by EPD
Dear Ms. Jenkins:
On January 16, 2013, Georgia Environmental Protection Division (EPD) notified Trinity Consultants (Trinity)
that upon Administrative Review of the West Fraser, Inc. (West Fraser) Augusta Lumber Mill PSD Application
(Assigned #21615) additional information was requested. EPD requested additional information on the scope of
the stationary source in addition to requests for various diagrams that show the location of the facility/exhaust
points in relation to the nearby IP Paper Mill. On behalf of our client, West Fraser, please find below and
attached responses to the requested information.
The production processes at the West Fraser Augusta Lumber Mill and the IP Paper Mill are independent of each
other. Also, as taken directly from the permit narrative for the facility’s Title V Permit:
The Title V site included two plants owned by International Paper Company, Inc., a lumber mill (now
operating as West Frazer- Augusta Lumber Mill) and a paper mill, which were contiguous or adjacent
and under common control.
On March 31, 2007, International Paper Company, Inc. – Augusta Lumber Mill sold this facility to West
Fraser. An Amendment was submitted for an ownership and name change; the facility name changed to
West Fraser – Augusta Lumber Mill by Permit No. 2421-245-0047-V-03-0, issued on April 09, 2007.
Note that the amended permit specified that the Title V site that is subject to this permit now consists of
only the Augusta Lumber Mill. Until the end of March 2007, the Title V site consisted of this lumber mill
and an adjacent paper mill, both of which were then owned by International Paper Company, Inc.
Though the lumber mill has been sold to West Fraser, the paper mill continues to be owned by
International Paper Company, Inc. These sites are now separate with regard to Title V and New Source
Review.
Attached, please find several diagrams that provide the information EPD requested, with the exception of
documentation regarding facility buildings. As only toxics modeling was required for this project, no building
information was required for the modeling analysis, per the Georgia Guideline for Ambient Impact Assessment of
Toxic Air Pollutant Emissions (June 1998). This documentation could potentially be developed if otherwise
needed by EPD, however, it should not be necessary for this particular project and application.

Ms. Susan Jenkins
Page 2
Please do not hesitate to contact me at (678) 441-9977 to review preliminary questions or comments concerning
this submittal.
Sincerely,
TRINITY CONSULTANTS
Justin Fickas, P.E.
Managing Consultant
Enclosures
cc: Mr. Mack Winfrey (West Fraser)
Mr. Lamar Youmans (West Fraser)
Ms. Margaret Ndetti (EPD)

Attachments

CK01B
CK01A
CK02B
CK02A

WestFraserAugustaModeledObjects
Fenceline
CK02A
CK01B
410,300 410,400 410,500 410,600 410,700 410,800 410,900 411,000
UTMEast(m)
3,688,300
3,688,400
3,688,500
3,688,600
3,688,700
3,688,800
3,688,900
UTMNorth(m)
CK02B
CK01A
IP Mill

March 8, 2013 Response

March 8, 2013 Mr. Eric Cornwell Georgia Environmental Protection Division Air Protection Branch 4244 International Parkway, Suite 120 Atlanta, Georgia 30354
RE: West Fraser, Inc. – Augusta, Georgia PSD Permit Application – Continuous Kiln Project – Application Updated Requested by EPD Dear Mr. Cornwell: On February 20, 2013, Georgia Environmental Protection Division (EPD) notified West Fraser, Inc. (West Fraser) that technical and regulatory review of the recent application had begun and EPD offered various comments that needed clarification and/or correction. On behalf of our client, West Fraser, Trinity Consultants (Trinity) has included responses to all comments along with applicable application updates (both in hardcopy and electronic format). Emission Calculation Methodology The first comment provided by EPD requested that the facility use a VOC emission factor of 3.83 lb/MBF for the kilns. West Fraser agrees, and application documentation has been modified accordingly. The updated sections of the application where the old emission factor was referenced are included as attachments to this response. EPD also requested that the PM10 emission factor of 0.20 lb/ton for log sawing operations be used in place of the factor submitted with the original application. Although West Fraser believes the factor presented in the original copy of the application was valid, the application materials have been updated to reflect 0.20 lb/ton for both PM10 and PM2.5 emissions from sawing operations. Toxic Air Pollutants Assessment The Division requested an updated Toxic Impact Assessment that includes any TAPs that are emitted at a rate of more than 1% of the total TAPs emitted. The additional TAPs modeled were hydrochloric acid, isopropanol, manganese, and phenol. It is important to note that HAP emissions for the continuous kilns were updated to include a 50% control factor for particle-bound metals based on commentary from EPD in previous permitting actions.1 Please see the updated emission calculations for the new calculation methodology.
1 Control efficiency for particle-bound metal HAPs is based on EPD’s SIP Application Review document (Application No. 19470) that states that kilns act as settling chambers and the minimum expected control for particulate emissions from kilns acting as settling chambers is 50%.

Mr. Eric Cornwell Page 2
Attached Document Updates Attached, please find the following items, which reflect updated application sections to address the items noted above:
Updated narrative pages o Page 1-3: Table updated to reflect new emissions o Page 1-4: Table updated to reflect new emissions o Pages 3-5/6: Updated language on sawing emission factors o Page 3-7: Table updated to reflect new emissions o Page 3-9: Table updated to reflect new emissions o Page 4-2: Table updated to reflect new emissions o Page 5-18: Updated BACT cost number o Page 5-19: Updated BACT cost number o Page 8-2: Updated toxics analysis o Page 8-3: Updated toxics analysis
Updated Appendix B calculations
Updated Appendix D BACT calculations
Updated Appendix F for toxic thresholds, including updated electronic modeling files
Updated SIP forms
Updated Title V Database Please do not hesitate to contact me at (678) 441-9977 with any questions or comments pertaining to the materials provided. Sincerely,
TRINITY CONSULTANTS Justin Fickas, P.E. Managing Consultant
Enclosures cc: Mr. Mack Winfrey (West Fraser) Mr. Lamar Youmans (West Fraser) Ms. Margaret Ndetti (EPD)

Narrative Updates

West Fraser, Inc. – Augusta Mill | Continuous Kiln Construction Permit Application Trinity Consultants 1-3
Table1‐1.ProposedProjectNetEmissionIncreases
AsdetailedinSection3.2andsummarizedinTable1‐1,netemissionincreasesfromtheproposedprojectandnetemissionsincreasesordecreasesfromthecontemporaneousemissionperiod,willbebelowthePSDmajormodificationthresholdsforallpollutantsexceptVOC.OnMay13,2010,theU.S.EPAissuedtheTailoringRulewhichestablishesanapproachforaddressinggreenhousegases(GHGs)fromstationarysourcesundertheCleanAirAct(CAA)permittingprograms(PSDandTitleV).3PertheTailoringRule,astheproposedprojectrequiresNSRpermittingforacriteriapollutantandtherequiredPSDpermitwasnotissuedpriortoJanuary2,2011,PSDpermittingforGHGfortheproposedprojectmustalsobeconsidered.OnJuly20,2011,U.S.EPApublishedarulemakingtodeferGHGpermittingrequirementsforthreeyearsforcarbondioxide(CO2)emissionsfrombiomass‐firedandotherbiogenicsources.4Therefore,CO2eestimatesforthenetemissionsincreaseanalysisonlyaccountedforthemethane(CH4)andnitrousoxide(N2O)componentemissionsofbiomasscombustion.AsaTitleVmajorsource,WestFraserisrequiredtosubmitaTitleVsignificantmodificationapplicationaspartofthePSDpermittingprocessinGeorgia.WestFraserissubmittingthisconstructionandoperatingapplication 3RulewaspublishedintheFederalRegisteronJune3,2010,andbecameeffectiveAugust2,2010.FederalRegisterVol.75,No.106,June3,2010,pages31541–31608.4FederalRegisterVol.76,No.139,July20,2011.
NetEmissionsChange
PSDSERThresholds
(tpy) (tpy)
NSRPollutantsCO 28.50 100 NoFluorides N/A 3 NoH2S N/A 10 NoLead 0.00 0.6 NoNOX 10.93 40 NoReducedSulfurCompounds(includingH2S) N/A 10 NoSO2 0.82 40 NoH2SO4 N/A 7 NoTotalPM 24.53 25 NoTotalPM10 5.08 15 NoTotalPM2.5 ‐1.07 10 No
TotalReducedSulfur(includingH2S) N/A 10 NoTotalVOC 149.53 40 Yes
GreenhouseGasesCO2ebiomassdeferral 143.45 75,000 No
HAPs 2
Formaldehyde ‐1.83 N/A N/AMethanol ‐7.34 N/A N/A
Pollutant
PSDPermittingTriggered?

West Fraser, Inc. – Augusta Mill | Continuous Kiln Construction Permit Application Trinity Consultants 1-4
inaccordancewithallfederalandstaterequirements.ForVOC,aBestAvailableControlTechnology(BACT)analysisisrequiredaspartofthePSDpermitapplicationsubmittal.NotethatnoPSDdispersionmodelinganalysisisincludedinthisapplication,asemissionsofallpollutantspotentiallyrequiringmodelingarebelowtheSERsfromtheproposedproject.TheproposedprojectwillpotentiallybesubjecttoNewSourcePerformanceStandards(NSPS),NationalEmissionsStandardsforHazardousAirPollutants(NESHAP),andseveralstateregulations.
1.3. BACT DETERMINATION
WestFraserperformedaBACTanalysisfortheonlyNSR‐regulatedpollutantthatexceededthemajormodificationthresholds,VOC,followingthe“top‐down”approachsuggestedbyU.S.EPA.Thetop‐downprocessbeginsbyidentifyingallpotentialcontroltechnologiesforthepollutantinquestion,andmakingadeterminationifthosecontroloptionsaretechnicallyfeasiblefortheprocessinquestion.Theapproachtheninvolvesrankingallpotentiallyrelevantcontroltechnologiesindescendingorderofcontroleffectiveness.Themoststringentor“top”controloptionisBACTunlesstheapplicantdemonstrates,andthepermittingauthorityinitsinformedopinionagrees,thatenergy,environmental,and/oreconomicimpactsjustifytheconclusionthatthemoststringentcontroloptiondoesnotmeetthedefinitionofBACT.WherethetopoptionisnotdeterminedtobeBACT,thenextmoststringentalternativeisevaluatedinthesamemanner.ThisprocesscontinuesuntilBACTisdetermined. BasedontheBACTreview,WestFraserhasdeterminedthatthetechnologyandlimitspresentedinTable1‐2areBACTfortheproposedcontinuouskilns.AdetailedVOCBACTanalysisispresentedinSection5.4ofthisapplication.
Table1‐2.ProposedPrimaryBACTLimitSummary
1.4. APPLICATION ORGANIZATION
Thefollowinginformationisincludedaspartofthisapplicationsubmittal:
Section2describesthecurrentfacilityandtheproposedproject; Section3summarizestheemissionscalculationmethodologiesandassessesNSRapplicability; Section4detailsthefederalandstateregulatoryapplicabilityanalysisfortheproposedproject; Section5containstherequiredBACTassessment; Section6containsthetoxicsmodelingassessment; AppendixAcontainsanareamap,facilitylayout,andprocessflowdiagramsofthefacility; AppendixBincludesdocumentationofemissionscalculations; AppendixCcontainsEPD(SIP)constructionpermitapplicationforms; AppendixDcontainsBACTsupportingcalculations; AppendixEcontainsRACT/BACT/LAERClearingHouseDatabaseReports; AppendixFincludestoxicsmodelinginformation; AppendixGincludestheupdatedTitleVDatabase; AppendixHincludesthereferencematerialsusedtodeveloptheapplication;and
Pollutant SelectedBACTEmission/
OperatingLimitComplianceMethod
VOC ProperMaintenanceandOperatingPractices 3.83lb/MBF Recordkeeping

West Fraser, Inc. – Augusta Mill | Continuous Kiln Construction Permit Application Trinity Consultants 3-5
limitationsandchallengesinVOCtestingmethods.Perthemethodologyestablished,theVOCemissionfactorforcontinuouskilnsiscalculatedusingthefollowingequation:10,11
1.133 1 0.65 TheVOCascarbonemissionfactor(VOCasC,generallyfromaMethod25/25Atestmethod)ismultipliedby1.133,theratioofthemolecularweightofpinene(C10H16,136amu)tothemolecularweightofthecarboninpinene(120amu).AstheMethod25/25Atestmethoddoesnotregisteroxygenatedcompoundswell,emissionsofformaldehydeandmethanolmustbeaddedtoappropriatelyaccountfortheirpresenceinexhauststreamsfromwoodproductfacilities.Accordingly,U.S.EPAhasagreedto“responsefactors”forthesechemicalsthataccountforwhattheMethod25/25Atestswouldobserve.Forexample,formaldehydeisnottypically“recognized”intheVOCtestmethod.Therefore,ithasa0%responsefactor;whereas65%ofmethanolpresentinanexhauststreamiscapturedwithintheVOCasCemissionfactor.Hence,toavoiddouble‐countingofemissions,thespeciatedmethanolemissionfactorisreducedby65%.TheemissionfactorsforCO2eemissionsfromwoodcombustionwerebasedonfactorsestablishedintheGreenhouseGasMandatoryReporting(MRR)rulein40CFR98,TableC‐1andC‐2.Perthebiomassdeferral,theCO2eemissionfactorforthecombustionofbiomassexcludesemissionsofCO2.12
3.2.2. Ancillary Equipment Emission Increases
Inadditiontoemissionsfromthekilns,theproposedprojectwillresultinemissionsincreasesfromancillaryequipmentatthemillassociatedwiththekilns.NotethatonlyFilterablePM,FilterablePM10,andFilterablePM2.5areemittedfromtheancillaryequipmentassociatedwiththeproposedproject.DetailedemissioncalculationsforeachprocessareincludedinAppendixB.
3.2.2.1. Sawing and Debarking
IncreasesinfugitivePMemissionsfromsawinganddebarkingwerebasedontheincreasedlumberthroughputthroughthoseportionsofthefacility.Acontrolefficiencyof90percentwasappliedtoaccountfortheactivitiesbeingperformedindoors.13Notethatthiscontrolefficiencydoesnottakeintoaccountthatthewoodbeingcuthasahighmoisturecontentandwouldthereforegeneratelessemissionsthandrymaterials.ThePMemissionfactorsusedarefromU.S.EPA’sEIIPUncontrolledEmissionFactorsdocumentfortheprocessesofsawinganddebarking,respectively.14,15Theemissionfactorforsawing(0.35poundofTotalPMpertonofwoodprocessed)wasoriginallypublishedinAP‐42witha“D”rating.ItislikelythatthisnumberismuchhigherthanappropriateandresultsininaccuratePMemissioncalculations.ThemostrecentversionofAP‐42,Section10.5,PlywoodManufacturing(publishedinJanuary2002)doesnotlistanemissionfactorforsawing.GiventhelackofamoreaccuratevalueavailableforPMemissionsfromsawing,WestFraserhaschosentousethe0.35lb/tonvalueforconservatism,asastartingpoint.
10U.S.EPA,documententitled,“InterimVOCMeasurementProtocolfortheWoodProductsIndustry–July2007,”page2.11Throughouttheapplication,theterms“VOC”and“TotalVOC”areusedinterchangeably.Inallinstances,thebasis,forthepurposeofthisPSDapplication(includingattachments)isasterpenes.12FederalRegisterVol.76,No.139(pages43490–43508).13BasedonguidancebytheTexasCommissiononEnvironmentalQuality(TCEQ)entitled"RockCrushingPlants"(Feb.2002),acontrolefficiencyof90%shouldbeappliedforworkperformedfullyenclosed.14U.S.EPA’sEIIPUncontrolledEmissionFactors(July2001),pertheFactorInformationRetrieval(FIRE)databasemanagementsystem,version6.23forSCCCode3‐07‐008‐02,LogSawing.15U.S.EPA’sEIIPUncontrolledEmissionFactors(July2001),pertheFactorInformationRetrieval(FIRE)databasemanagementsystem,version6.23forSCCCode3‐07‐008‐01,LogDebarking.
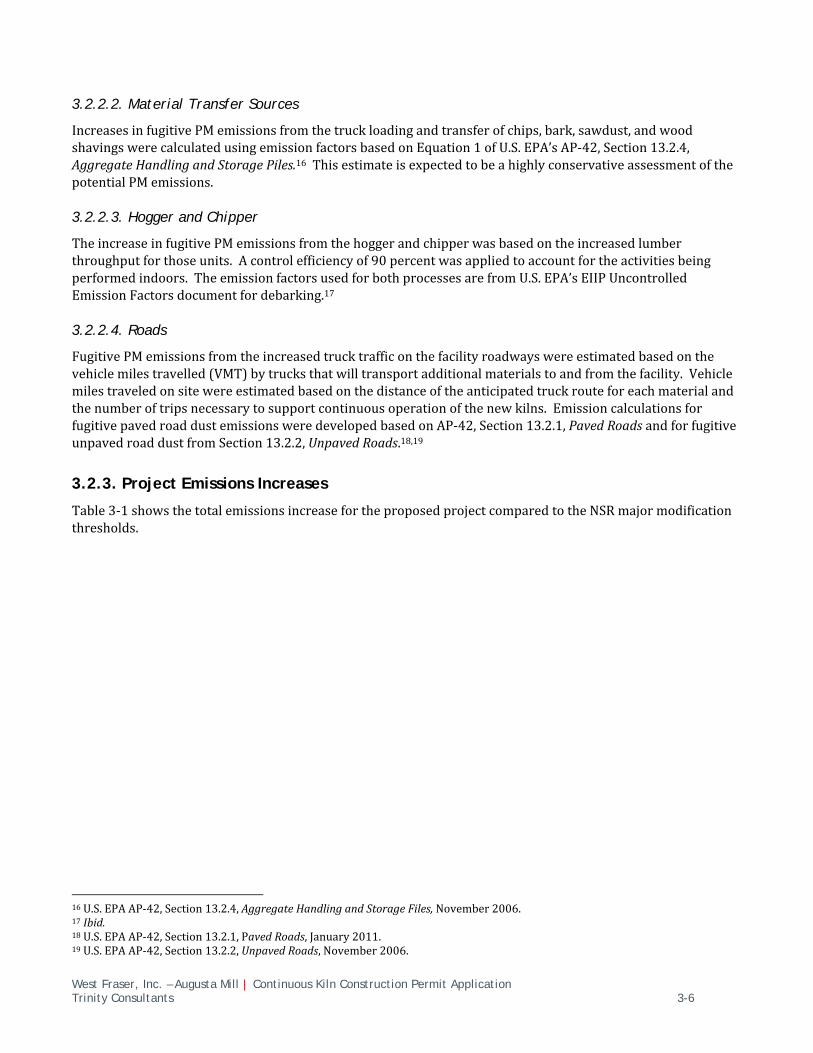
West Fraser, Inc. – Augusta Mill | Continuous Kiln Construction Permit Application Trinity Consultants 3-6
3.2.2.2. Material Transfer Sources
IncreasesinfugitivePMemissionsfromthetruckloadingandtransferofchips,bark,sawdust,andwoodshavingswerecalculatedusingemissionfactorsbasedonEquation1ofU.S.EPA’sAP‐42,Section13.2.4,AggregateHandlingandStoragePiles.16ThisestimateisexpectedtobeahighlyconservativeassessmentofthepotentialPMemissions.
3.2.2.3. Hogger and Chipper
TheincreaseinfugitivePMemissionsfromthehoggerandchipperwasbasedontheincreasedlumberthroughputforthoseunits.Acontrolefficiencyof90percentwasappliedtoaccountfortheactivitiesbeingperformedindoors.TheemissionfactorsusedforbothprocessesarefromU.S.EPA’sEIIPUncontrolledEmissionFactorsdocumentfordebarking.17
3.2.2.4. Roads
FugitivePMemissionsfromtheincreasedtrucktrafficonthefacilityroadwayswereestimatedbasedonthevehiclemilestravelled(VMT)bytrucksthatwilltransportadditionalmaterialstoandfromthefacility.Vehiclemilestraveledonsitewereestimatedbasedonthedistanceoftheanticipatedtruckrouteforeachmaterialandthenumberoftripsnecessarytosupportcontinuousoperationofthenewkilns.EmissioncalculationsforfugitivepavedroaddustemissionsweredevelopedbasedonAP‐42,Section13.2.1,PavedRoadsandforfugitiveunpavedroaddustfromSection13.2.2,UnpavedRoads.18,19
3.2.3. Project Emissions Increases
Table3‐1showsthetotalemissionsincreasefortheproposedprojectcomparedtotheNSRmajormodificationthresholds.
16U.S.EPAAP‐42,Section13.2.4,AggregateHandlingandStorageFiles,November2006.17Ibid.18U.S.EPAAP‐42,Section13.2.1,PavedRoads,January2011. 19U.S.EPAAP‐42,Section13.2.2,UnpavedRoads,November2006.

West Fraser, Inc. – Augusta Mill | Continuous Kiln Construction Permit Application Trinity Consultants 3-7
Table3‐1.ProjectEmissionsIncrease
AsillustratedinTable3‐1,theprojectemissionincreasesarebelowthemajormodificationthresholdsforCO,H2SO4,Lead,NOX,SO2,andCO2ebiomassdeferral,andPSDpermittingisnotrequiredforthosepollutants.However,projectemissionincreasesexceedthemajormodificationthresholdsforTotalPM,TotalPM10,TotalPM2.5,andTotalVOC.Therefore,theanalysisproceedstoStep(B),thecontemporaneousnettinganalysis.
3.3. CONTEMPORANEOUS NETTING ANALYSIS
WestFraserreviewedallprojectscompletedattheAugustaMillwithinthepastfiveyearstodeterminethenetemissionsincreasesforTotalPM,TotalPM10,TotalPM2.5,andTotalVOCforcomparisontotheapplicableNSRthresholdsforStep(B).Thefivecalendaryearperiodtoreviewincludes2008through2012.Anyunitsthatareshutdownduringthefive‐yearcalendarperiodpreceedingtheprojectareallowedtobeusedasareductioninprojectnetemissionincreasecalculationsprovidedthe10‐yearbaselineestablishedforthatsourceisused.Shouldthetotalemissionsincreasesofanypollutantwithinthecontemporaneousperiodexceedtherespectivemajormodificationthreshold,thentheproposedprojectissubjecttoNSRpermittingforthatpollutant.Theemissiondecreasefromtheshutdownofthecurrentindirectfiredbatchkilnsandburnersaspartoftheproposedprojectisaccountedforinthecontemporaneousnettinganalysis.ThebaselineemissionsfortheseunitsareprovidedinAppendixB.ThefollowingsectionsdescribetheemissionfactorsforTotalPM,TotalPM10,
NewUnitsAssociatedUnits Total
(tpy) (tpy) (tpy) (tpy)
NSRPollutantsCO 80.30 N/A 80.30 100 NoFluorides N/A N/A N/A 3 NoH2S N/A N/A N/A 10 NoLead 6.20E‐04 N/A 6.20E‐04 0.6 NoNOX 30.80 N/A 30.80 40 NoReducedSulfurCompounds(includingH2S) N/A N/A N/A 10 NoSO2 7.67 N/A 7.67 40 NoH2SO4 N/A N/A N/A 7 NoTotalPM 15.18 38.23 53.41 25 YesTotalPM10 11.44 11.17 22.61 15 YesTotalPM2.5 10.89 4.08 14.97 10 YesTotalReducedSulfur(includingH2S) N/A N/A N/A 10 NoTotalVOC 421.30 N/A 421.30 40 Yes
GreenhouseGasesCO2ebiomassdeferral 1,334 N/A 1,334 75,000 No
HAPs 1
Formaldehyde 1.00 N/A 1.00 N/A N/AMethanol 4.02 N/A 4.02 N/A N/A
PSDPermittingTriggered?
PSDSERThresholds
EmissionsIncrease
Pollutant

West Fraser, Inc. – Augusta Mill | Continuous Kiln Construction Permit Application Trinity Consultants 3-9
Table3‐2.ContemporaneousNettingAnalysis
AsTable3‐2shows,theTotalPM,TotalPM10,TotalPM2.5emissionsarelessthantheapplicablemajormodificationthresholds,andthus,NSRpermittingisnotrequiredforthesepollutants.However,theTotalVOCemissionsincreasesexceedtheapplicablePSDmajormodificationthreshold,andthusNSRpermittingisrequiredforTotalVOC.DetailedcalculationsfortheabovediscussednettinganalysiscanbefoundinAppendixB.
Source TotalPM(tpy) TotalPM10(tpy) TotalPM2.5(tpy) TotalVOC(tpy)
PotentialEmissionsIncreasesPotentialEmissionsfromNewUnitsContinuousDirect‐firedKilns 15.18 11.44 10.89 421.30
ProjectedActualAssociatedEmissionsIncreasesSawingandDebarking 4.90 2.79 2.79 ‐MaterialTransfer/Chipper/Hogger
0.16 0.08 0.06‐
Roads 33.17 8.29 1.23 ‐
ContemporaneousDecreasesBaselineEmissionsfromDecommissionedUnitsBatchDirect‐firedKilns 28.88 17.53 16.04 271.77
TotalPotentialEmissionsIncreases 53.41 22.61 14.97 421.30
TotalContemporaneousEmissionDecreases 28.88 17.53 16.04 271.77
NetEmissionsIncrease 24.53 5.08 ‐1.07 149.53
PSDSERThresholds 25 15 10 40PSDPermittingTriggered? No No No Yes

West Fraser, Inc. – Augusta Mill | Continuous Kiln Construction Permit Application Trinity Consultants 4-2
Table4‐1.ProposedProjectNetEmissionIncreases
AsillustratedinTable4‐1,theproposedprojectnetemissionincreaseexceedsthemajormodificationthresholdforTotalVOC.Accordingly,PSDpermittingisrequiredforthatpollutant.
4.2. FEDERAL REGULATORY APPLICABILITY
40CFRPart70(TitleV),40CFRPart60(NSPS)and40CFRParts61and63(NESHAP)werereviewedtodetermineapplicabilitytoproposedemissionunitsatthefacility.
4.2.1. Title V Operating Permit Program
TheTitleVprogramwasestablishedaspartofthe1990CleanAirActAmendmentsandisinthefederalregulationsat40CFRPart70‐71.Georgiahasdevelopedtheirownprogramunder40CFRPart70,whichisprovidedinChapter391‐3‐1‐.03(10)oftheGeorgiaRulesforAirQualityControl.TitleVrequiresthatallnewandexistingmajorsourcesofairemissionsobtainfederallyapprovedstateadministeredoperatingpermits.AmajorsourceasdefinedundertheTitleVprogramisafacilitythathasthepotentialtoemiteithermorethan100tonsperyear(tpy)foranycriteriapollutant,morethan10tpyforanysinglehazardousairpollutant(HAP),andmorethan25tpyforallHAP.Additionally,40CFRPart70.2definesfacilitieswithpotentialemissionsgreaterthan100,000tpyofCO2earesubjecttoregulationundertheTitleVpermittingprogram.Potential
NetEmissionsChange
PSDSERThresholds
(tpy) (tpy)
NSRPollutantsCO 28.50 100 NoFluorides N/A 3 NoH2S N/A 10 NoLead 0.00 0.6 NoNOX 10.93 40 NoReducedSulfurCompounds(includingH2S) N/A 10 NoSO2 0.82 40 NoH2SO4 N/A 7 NoTotalPM 24.53 25 NoTotalPM10 5.08 15 NoTotalPM2.5 ‐1.07 10 No
TotalReducedSulfur(includingH2S) N/A 10 NoTotalVOC 149.53 40 Yes
GreenhouseGasesCO2ebiomassdeferral 143.45 75,000 No
HAPs 2
Formaldehyde ‐1.83 N/A N/AMethanol ‐7.34 N/A N/A
Pollutant
PSDPermittingTriggered?

West Fraser, Inc. – Augusta Mill | Continuous Kiln Construction Permit Application Trinity Consultants 5-18
5.4.2.5. Wet Scrubbing
WhilesomeVOCsthatwillbepresentintheexhauststreamarehighlysolubleinwater,otherVOCs,mostnotablyα‐pinene,areonlyveryslightlysolubleinwaterduetothelowerHenry’sLawconstantasdescribedinPerry’sChemicalEngineer’sHandbook.LowerHenry’sLawconstantVOCswouldrequiremuchlongerresidencetimewithinascrubberpackedcolumnandwouldeliminatethisasatechnicallyviablesolutionfortheconstantstreamthatwouldneedtobehandledbyacontinuouskiln.
5.4.2.6. Proper Maintenance and Operating Practices
PropermaintenanceandoperatingpracticesofthekilnsisatechnicallyfeasibleoptionforminimizingtheVOCemissionsfromthekilnsandwillbeconsideredfurtherinthefuturestepsforBACTdetermination.
5.4.3. Rank of Remaining Control Technologies (Step 3)
Thethirdofthefivestepsinthetop‐downBACTassessmentprocedureistoranktechnicallyfeasiblecontroltechnologiesbycontroleffectiveness.TheremainingcontroltechnologiesarepresentedinTable5‐1.AsdiscussedinStep2,WestFraserdoesnotconcedethattheuseofanRTOorbiofiltrationonalumberdryingkilnistechnicallyfeasible;however,thesecontroloptionsarebeingevaluatedinthisandthefuturestepsoftheBACTdeterminationforconservatism.
Table5‐1.RemainingVOCControlTechnologies
5.4.4. Evaluation of Most Stringent Controls (Step 4)
Thefourthofthefivestepsinthetop‐downBACTassessmentprocedureistoevaluatethemosteffectivecontrolanddocumenttheresults.Thishasbeenperformedfortheremainingcontroltechnologiesonthebasisofeconomic,energy,andenvironmentalconsiderations,andisdescribedherein.
5.4.4.1. Regenerative Thermal Oxidation
EveniftheuseofanRTOwastechnicallyfeasibleonalumberdryingkiln,thecostofusinganRTOexceedsthebenefitoftheVOCreductionitoffers.ThecurrentcostofcontrollingVOCwithanRTOisestimatedatapproximately$14,222pertonofVOCremoved.ThishighcostforVOCcontrolislargelyduetothehighmoisturecontentofthekilnexhauststreamandlowexhausttemperature,asheatingwatervaporintheexhauststreamtoRTOoperatingtemperaturessignificantlyincreasesthenaturalgasheatingrequirement.Therewouldalsobeassociatedenergyandenvironmentalimpactsresultantfromuseofthenaturalgas,includingadditionalpollutantemissionssuchasNOXfromnaturalgasfromcombustion.
Rank ControlTechnologyPotentialControlEfficiency(%)
1 RTO 98%2 Biofiltration1 65%3 ProperMaintenanceandOperatingPractices BaseCase
1.BiofiltrationcontrolefficiencybasedonNorthCarolinaDepartmentofEnvironmentandNaturalResourcesAirPermitReviewforWeyerhauser'sPlymouthfacilitycontinuouskilnconstructionapplication,whichreferencedanestimated60‐70%VOCcontrolefficiencyfrombiofilitration,basedonaconversationwithDavidWordofNCASI.

West Fraser, Inc. – Augusta Mill | Continuous Kiln Construction Permit Application Trinity Consultants 5-19
WestFraserhasdeterminedthatanRTOisnotBACTforthekilnsbasedonthetechnicalfeasibility,environmental,energy,andeconomicanalyses.DetailedcostcalculationscanbefoundinAppendixD.
5.4.4.2. Biofiltration
Eveniftheuseofbiofiltrationwastechnicallyfeasibleonalumberdryingkiln,thecostofbiofiltrationexceedsthebenefitoftheVOCreductionitoffers.ThecostofcontrollingVOCwithbiofiltrationisestimatedatapproximately$14,044pertonofVOCremoved.Despitetheconservativeassumptionthatbiofiltrationistechnicallyfeasible,itisnotcosteffective,andthereforeisnotBACTforthekilns.
5.4.4.3. Proper Maintenance and Operating Practices
Theonlyremainingtechnologyispropermaintenanceandoperatingpracticesofthekilns,alogicaloptionsinceaproperlymaintainedandoperatedkilncaneffectivelyminimizeVOCformation.ThiscontroloptionisconsideredBACTforVOCforthecontinuouskilns.
5.4.5. Selection of BACT (Step 5)
Basedonsteps1through4oftheBACTanalysis,WestFraserhasdeterminedthatpropermaintenanceandgoodoperatingpracticesaretheonlycontrolstechnicallyandeconomicallyfeasiblefortheproposedcontinuouslumberdryingkilns.Allotherpotentialcontroltechnologieswereeliminatedinearlierstepsoftheprocess.Therefore,WestFraserproposestheemissionrateof3.76lbTotalVOC(asterpene+methanol+formaldehyde)/MBFasBACT,calculatedfromtheequationdescribedinSection3.2.1andreproducedbelow.
1.133 1 0.65
ThebasisfortheVOCfactorisadjustedperEPAprotocolfromthetraditionalVOCascarbontoatotalmassVOCbasis.InordertocomplywithBACT,WestFraserwilldevelopanoperatingandmaintenanceplanforthenewcontinuouskilns.AppendixEcontainstheRBLCsearchresultswithlistedemissionfactorsinlbVOCperMBF.Ofthefactorslisted,thereislimiteddataandreferencesavailableonhowtheVOCfactorwasderivedandtheappropriatebasisofthefactor.Additionally,manyoftheemissionfactorslistedareforbatchkilns,ascontinuouskilnsarestillanemergingtechnology.
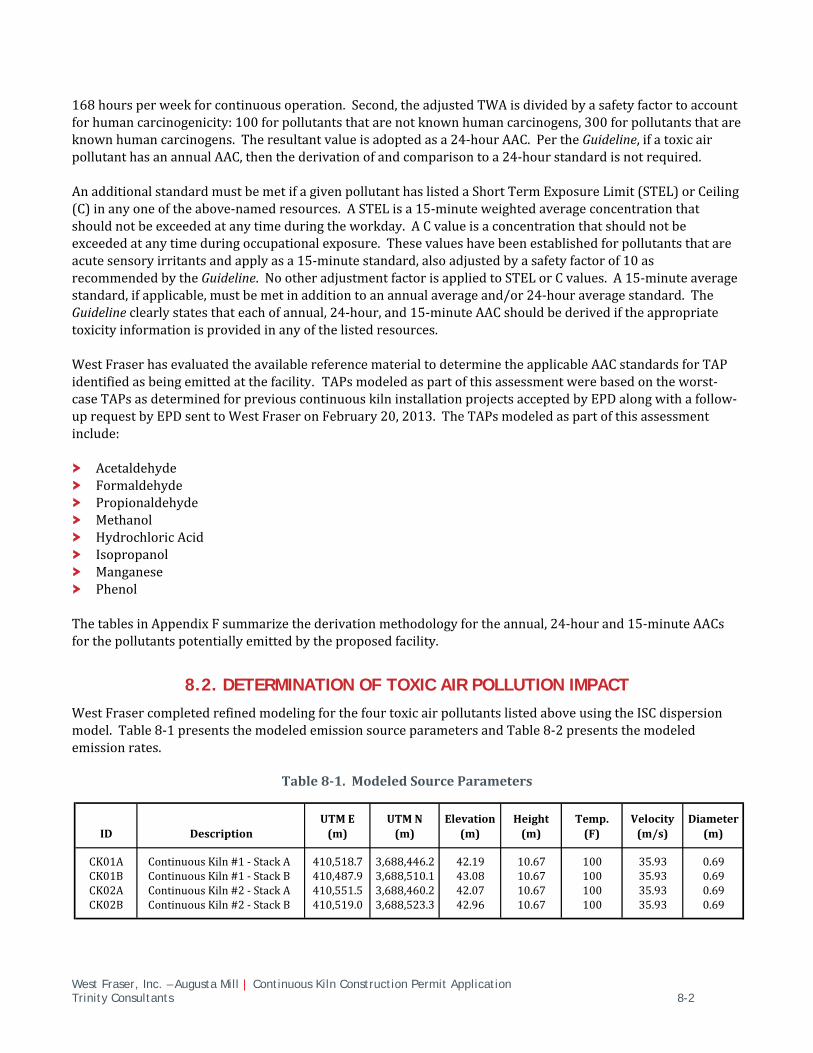
West Fraser, Inc. – Augusta Mill | Continuous Kiln Construction Permit Application Trinity Consultants 8-2
168hoursperweekforcontinuousoperation.Second,theadjustedTWAisdividedbyasafetyfactortoaccountforhumancarcinogenicity:100forpollutantsthatarenotknownhumancarcinogens,300forpollutantsthatareknownhumancarcinogens.Theresultantvalueisadoptedasa24‐hourAAC.PertheGuideline,ifatoxicairpollutanthasanannualAAC,thenthederivationofandcomparisontoa24‐hourstandardisnotrequired.AnadditionalstandardmustbemetifagivenpollutanthaslistedaShortTermExposureLimit(STEL)orCeiling(C)inanyoneoftheabove‐namedresources.ASTELisa15‐minuteweightedaverageconcentrationthatshouldnotbeexceededatanytimeduringtheworkday.ACvalueisaconcentrationthatshouldnotbeexceededatanytimeduringoccupationalexposure.Thesevalueshavebeenestablishedforpollutantsthatareacutesensoryirritantsandapplyasa15‐minutestandard,alsoadjustedbyasafetyfactorof10asrecommendedbytheGuideline.NootheradjustmentfactorisappliedtoSTELorCvalues.A15‐minuteaveragestandard,ifapplicable,mustbemetinadditiontoanannualaverageand/or24‐houraveragestandard.TheGuidelineclearlystatesthateachofannual,24‐hour,and15‐minuteAACshouldbederivediftheappropriatetoxicityinformationisprovidedinanyofthelistedresources.WestFraserhasevaluatedtheavailablereferencematerialtodeterminetheapplicableAACstandardsforTAPidentifiedasbeingemittedatthefacility. TAPsmodeledaspartofthisassessmentwerebasedontheworst‐caseTAPsasdeterminedforpreviouscontinuouskilninstallationprojectsacceptedbyEPDalongwithafollow‐uprequestbyEPDsenttoWestFraseronFebruary20,2013.TheTAPsmodeledaspartofthisassessmentinclude:
Acetaldehyde Formaldehyde Propionaldehyde Methanol HydrochloricAcid Isopropanol Manganese Phenol
ThetablesinAppendixFsummarizethederivationmethodologyfortheannual,24‐hourand15‐minuteAACsforthepollutantspotentiallyemittedbytheproposedfacility.
8.2. DETERMINATION OF TOXIC AIR POLLUTION IMPACT
WestFrasercompletedrefinedmodelingforthefourtoxicairpollutantslistedaboveusingtheISCdispersionmodel.Table8‐1presentsthemodeledemissionsourceparametersandTable8‐2presentsthemodeledemissionrates.
Table8‐1.ModeledSourceParameters
CK01A ContinuousKiln#1‐StackA 410,518.7 3,688,446.2 42.19 10.67 100 35.93 0.69CK01B ContinuousKiln#1‐StackB 410,487.9 3,688,510.1 43.08 10.67 100 35.93 0.69CK02A ContinuousKiln#2‐StackA 410,551.5 3,688,460.2 42.07 10.67 100 35.93 0.69CK02B ContinuousKiln#2‐StackB 410,519.0 3,688,523.3 42.96 10.67 100 35.93 0.69
Height(m)
Temp.(F)
Velocity(m/s)
Diameter(m)ID Description
UTME(m)
UTMN(m)
Elevation(m)

West Fraser, Inc. – Augusta Mill | Continuous Kiln Construction Permit Application Trinity Consultants 8-3
Forthepurposesofthisapplication,itisassumedthat100percentofallTAPemissionsfromthelumberdryingprocesswillbeemittedfromthetwostacksthathandleexhaustoneachendofeachcontinuouskiln.Inducedflowiscreatedattheoutletofeachkilninordertoexhaustallemissionsthroughthestacks.ItisalsoassumedthattheabortstacksthatarepresentoneachofthecontinuouskilnswillnotbeinvolvedwiththereleaseoftheTAPthatarebeingconsideredforthisproject.TheseTAPemissionsareexclusivelyconsideredduringwooddryingperiodsandarefocusedononlythestackspresentattheendofeachkiln.
Table8‐2.ModeledTAPEmissionRates
ThepollutantsmodeledforthisanalysisareconsistentwiththosemodeledforothersimilarapplicationsthathavebeenprovidedtoEPD.TotalkilnTAPpollutantemissionsareshowninTableB‐19.
8.2.1. ISC Modeling Results
Table8‐3presentstheresultsforeachpollutantandaveragingperiod.Notethatthemaximum15‐minuteimpactisbasedonthemaximum1‐hourpredictedimpactmultipliedby1.32.
Table8‐3.SummaryofModelingAnalysis
Asshowninthetableabove,impactsofallTAPfromtheproposedfacilityarebelowtherespectiveAACs
Methanol Formaldehyde Propionaldehyde Acetaldehyde HydrochloricAcid Isopropanol Manganese Phenol
CK01A 1.005 0.251 0.010 0.364 0.040 0.053 0.016 0.138CK01B 1.005 0.251 0.010 0.364 0.040 0.053 0.016 0.138CK02A 1.005 0.251 0.010 0.364 0.040 0.053 0.016 0.138CK02B 1.005 0.251 0.010 0.364 0.040 0.053 0.016 0.138
ID
ModeledEmissionRate(lb/hr)
Pollutant CAS
Maximum
1-Hour Impact1
(µg/m3)
Maximum
15-Min Impact2
(µg/m3)15-min AAC
(µg/m3)
Maximum
24-hr Impact1
(µg/m3)24-hr AAC
(µg/m3)
Maximum
Annual Impact1
(µg/m3)Annual AAC
(µg/m3)Exceed
Standard?
Methanol 67-56-1 57.49 75.89 32,750 26 619 No
Formaldehyde 50-00-0 16.87 22.27 246 0.50 1.11 NoPropionaldehyde 123-38-6 0.69 0.02 8.00 NoAcetaldehyde 75-07-0 24.46 32.29 4,500 0.73 9.00 NoHydrochloric Acid 7647-01-0 2.70 3.57 700 0.08 20.00 NoIsopropanol 67-63-0 3.53 4.66 98,400 1.36 2333 NoManganese 7439-96-5 1.06 1.40 500 0.0317 0.0500 NoPhenol 108-95-2 9.28 12.25 1,900 3.58 45 No
1. First-high modeled impact over the five years of meteorological data.
2. Modeled 1-hour concentration multiplied by 1.32 to convert to 15-minute impact per GA Air Toxics Guidance (June 21, 1998).
Not RequiredNone
None
None
None
Not RequiredNot RequiredNot RequiredNot Required

Appendix B Updates

AppendixB‐EmissionCalculationsWestFraser‐Augusta,Georgia
TableB‐1.CurrentOperatingCapacitiesforDirect‐FiredBatchKilns
MMBtu/hr BF/hr
KilnNo.1 15.05 3,889KilnNo.2 30.10 7,778KilnNo.3 49.45 12,778
TableB‐2.HeatingValueforWoodCombustion
HeatingValue1 4,500 Btu/lb
1.FromUSEPAAP‐42Paragraph1.6.1(Sept.2003).
OperatingCapacity1
Kiln
1.OperatingCapacity(MMBtu/hr)fromthefacility'sTitleVrenewalapplicationreviewnarrative(applicationreceivedbyEPDonOctober25,2004).OperatingCapacity(BF/hr)copiedduringtheAugustaLumberMillsitevisitonMarch06,2012byDeannaDuramandJakeStewart(Trinity),titled"WestFraserAugustaPermitRenewalForms"(datedMarch8,2011).
TrinityConsultants Page1of37AugustaExpansionProjectEmissionsAnalysis(20130306JF)
OperatingData

AppendixB‐EmissionCalculationsWestFraser‐Augusta,Georgia
TableB‐3.ProductionInformationforDirect‐FiredBatchKilns1,2
Kiln1Production
WoodWasteCombusted
Kiln2Production
WoodWasteCombusted
Kiln3Production
WoodWasteCombusted
TotalKilnProduction
TotalWoodWaste
CombustedBF tons BF tons BF tons BF tons
Jan‐02 1,706,304 698.5 3,500,306 1,432.9 5,835,928 2,389.1 11,042,538 4,520.5Feb‐02 1,625,948 665.6 3,019,816 1,236.2 5,417,098 2,217.6 10,062,862 4,119.5Mar‐02 1,775,590 726.9 3,073,496 1,258.2 6,083,500 2,490.4 10,932,586 4,475.5Apr‐02 1,537,570 629.4 3,534,065 1,446.8 5,680,540 2,325.5 10,752,175 4,401.7May‐02 1,450,910 594.0 3,749,151 1,534.8 6,354,532 2,601.4 11,554,593 4,730.1Jun‐02 1,862,890 762.6 3,485,824 1,427.0 5,888,368 2,410.5 11,237,082 4,600.2Jul‐02 2,183,410 893.8 2,323,696 951.3 5,625,018 2,302.7 10,132,124 4,147.8Aug‐02 1,807,482 739.9 4,243,642 1,737.2 5,894,604 2,413.1 11,945,728 4,890.3Sep‐02 1,866,752 764.2 3,527,562 1,444.1 4,827,056 1,976.1 10,221,370 4,184.4Oct‐02 2,095,534 857.9 3,353,356 1,372.8 5,428,046 2,222.1 10,876,936 4,452.7Nov‐02 2,244,542 918.9 3,254,944 1,332.5 5,449,068 2,230.7 10,948,554 4,482.0Dec‐02 1,662,376 680.5 2,254,438 922.9 4,593,146 1,880.3 8,509,960 3,483.8Jan‐03 2,146,652 909.8 2,705,212 1,146.5 6,813,514 2,887.7 11,665,378 4,944.0Feb‐03 2,371,888 1,005.2 3,017,326 1,278.8 5,638,221 2,389.6 11,027,435 4,673.6Mar‐03 2,207,468 935.6 3,040,506 1,288.6 4,816,522 2,041.3 10,064,496 4,265.5Apr‐03 2,031,600 861.0 2,681,492 1,136.5 5,001,580 2,119.7 9,714,672 4,117.2May‐03 2,441,344 1,034.7 3,746,540 1,587.8 5,633,999 2,387.8 11,821,883 5,010.3Jun‐03 1,722,426 730.0 3,452,784 1,463.3 5,229,500 2,216.3 10,404,710 4,409.7Jul‐03 1,747,278 740.5 3,541,492 1,500.9 4,349,668 1,843.5 9,638,438 4,084.9Aug‐03 1,995,400 845.7 3,015,438 1,278.0 5,877,926 2,491.2 10,888,764 4,614.8Sep‐03 1,843,282 781.2 2,915,530 1,235.6 5,675,664 2,405.4 10,434,476 4,422.3Oct‐03 2,267,162 960.9 1,937,386 821.1 5,911,816 2,505.5 10,116,364 4,287.5Nov‐03 1,680,946 712.4 3,592,858 1,522.7 4,853,120 2,056.8 10,126,924 4,291.9Dec‐03 1,820,894 771.7 1,981,298 839.7 5,167,128 2,189.9 8,969,320 3,801.3Jan‐04 1,853,986 757.3 2,930,912 1,197.1 6,123,336 2,501.1 10,908,234 4,455.5Feb‐04 1,597,760 652.6 2,712,414 1,107.9 5,210,972 2,128.4 9,521,146 3,888.9Mar‐04 1,401,452 572.4 4,065,630 1,660.6 5,083,346 2,076.3 10,550,428 4,309.3Apr‐04 1,709,896 698.4 3,063,816 1,251.4 5,970,034 2,438.5 10,743,746 4,388.3May‐04 1,530,864 625.3 4,281,953 1,749.0 5,102,926 2,084.3 10,915,743 4,458.5Jun‐04 1,829,738 747.4 3,181,436 1,299.5 6,104,291 2,493.3 11,115,465 4,540.1Jul‐04 756,880 309.1 1,617,994 660.9 2,325,608 949.9 4,700,482 1,919.9Aug‐04 2,657,206 1,085.3 3,880,670 1,585.1 660,192 269.7 7,198,068 2,940.0Sep‐04 2,201,086 899.0 2,327,848 950.8 5,232,316 2,137.1 9,761,250 3,987.0Oct‐04 2,363,645 965.4 3,451,140 1,409.6 5,657,126 2,310.6 11,471,911 4,685.7Nov‐04 2,195,334 896.7 2,902,298 1,185.4 4,783,126 1,953.7 9,880,758 4,035.8Dec‐04 2,427,570 991.5 3,421,188 1,397.4 5,156,958 2,106.4 11,005,716 4,495.3Jan‐05 2,409,290 988.7 3,089,728 1,268.0 5,453,806 2,238.1 10,952,824 4,494.8Feb‐05 2,336,156 958.7 2,316,298 950.6 5,232,222 2,147.2 9,884,676 4,056.5Mar‐05 2,559,012 1,050.2 3,936,476 1,615.4 5,811,080 2,384.7 12,306,568 5,050.4Apr‐05 2,437,168 1,000.2 3,900,888 1,600.8 6,498,880 2,667.0 12,836,936 5,268.0May‐05 2,499,247 1,025.6 3,540,382 1,452.9 7,133,632 2,927.5 13,173,261 5,406.0Jun‐05 2,017,093 827.8 3,679,018 1,509.8 5,463,328 2,242.0 11,159,439 4,579.6Jul‐05 2,402,774 986.0 3,925,004 1,610.7 6,820,098 2,798.8 13,147,876 5,395.6Aug‐05 2,518,210 1,033.4 3,495,898 1,434.6 6,576,574 2,698.9 12,590,682 5,167.0Sep‐05 2,511,306 1,030.6 3,372,864 1,384.2 6,563,740 2,693.6 12,447,910 5,108.4Oct‐05 2,491,870 1,022.6 3,190,974 1,309.5 6,256,514 2,567.5 11,939,358 4,899.7Nov‐05 2,288,540 939.2 2,593,756 1,064.4 5,222,020 2,143.0 10,104,316 4,146.6Dec‐05 2,858,442 1,173.0 3,528,420 1,448.0 7,214,870 2,960.8 13,601,732 5,581.9Jan‐06 2,555,874 937.1 2,891,330 1,060.1 6,048,860 2,217.8 11,496,064 4,214.9Feb‐06 1,945,764 713.4 2,821,958 1,034.7 5,226,860 1,916.4 9,994,582 3,664.4Mar‐06 3,193,118 1,170.7 4,010,188 1,470.3 7,397,490 2,712.2 14,600,796 5,353.3Apr‐06 2,407,108 882.5 4,006,922 1,469.1 5,865,858 2,150.7 12,279,888 4,502.3May‐06 2,816,904 1,032.8 3,568,262 1,308.3 7,400,710 2,713.4 13,785,876 5,054.5Jun‐06 2,641,028 968.3 3,534,416 1,295.9 6,291,696 2,306.8 12,467,140 4,571.0Jul‐06 2,694,274 987.8 2,862,368 1,049.5 6,744,888 2,473.0 12,301,530 4,510.3Aug‐06 2,445,014 896.4 2,339,514 857.8 5,862,330 2,149.4 10,646,858 3,903.6Sep‐06 2,516,562 922.7 966,782 354.5 5,922,546 2,171.5 9,405,890 3,448.6Oct‐06 2,233,781 819.0 1,647,306 604.0 4,593,054 1,684.0 8,474,141 3,107.0Nov‐06 1,921,870 704.6 2,465,380 903.9 5,015,288 1,838.8 9,402,538 3,447.4Dec‐06 1,707,114 625.9 1,204,904 441.8 4,978,026 1,825.2 7,890,044 2,892.8Jan‐07 2,027,982 508.0 2,779,818 1,734.6 5,237,284 1,311.9 10,045,084 3,554.6Feb‐07 1,637,807 410.3 2,575,524 1,607.1 5,212,020 1,305.6 9,425,351 3,323.0Mar‐07 1,667,218 417.6 2,368,914 1,478.2 5,468,112 1,369.8 9,504,244 3,265.6Apr‐07 1,515,324 379.6 3,526,046 2,200.3 5,451,454 1,365.6 10,492,824 3,945.5May‐07 2,297,662 575.6 861,126 537.3 7,385,806 1,850.2 10,544,594 2,963.1Jun‐07 1,867,886 467.9 3,294,152 2,055.6 6,542,706 1,639.0 11,704,744 4,162.4Jul‐07 1,976,868 495.2 3,434,446 2,143.1 6,571,054 1,646.1 11,982,368 4,284.4Aug‐07 3,005,236 752.8 2,183,506 1,362.5 7,621,556 1,909.2 12,810,298 4,024.5Sep‐07 1,663,814 416.8 3,601,340 2,247.2 5,223,760 1,308.6 10,488,914 3,972.6Oct‐07 1,693,582 424.2 3,313,472 2,067.6 6,092,654 1,526.2 11,099,708 4,018.1Nov‐07 1,039,554 260.4 1,798,646 1,122.4 6,498,108 1,627.8 9,336,308 3,010.6Dec‐07 1,310,152 328.2 2,776,514 1,732.6 4,147,038 1,038.8 8,233,704 3,099.6Jan‐08 639,662 174.4 3,159,501 3,352.4 6,126,142 1,670.6 9,925,305 5,197.4Feb‐08 1,314,024 358.3 1,837,270 1,949.4 5,020,256 1,369.0 8,171,550 3,676.8Mar‐08 578,720 157.8 2,457,044 2,607.1 4,989,436 1,360.6 8,025,200 4,125.5Apr‐08 2,108,386 575.0 0 0.0 5,853,086 1,596.1 7,961,472 2,171.1May‐08 2,224,620 606.7 0 0.0 6,478,364 1,766.7 8,702,984 2,373.3Jun‐08 1,872,784 510.7 0 0.0 6,101,118 1,663.8 7,973,902 2,174.5Jul‐08 2,162,420 589.7 0 0.0 7,174,114 1,956.4 9,336,534 2,546.1Aug‐08 2,693,958 734.6 0 0.0 8,059,982 2,198.0 10,753,940 2,932.6Sep‐08 943,454 257.3 2,475,900 2,627.1 6,348,000 1,731.1 9,767,354 4,615.4Oct‐08 866,952 236.4 2,905,210 3,082.6 5,000,798 1,363.7 8,772,960 4,682.7Nov‐08 1,990,380 542.8 931,510 988.4 5,452,104 1,486.8 8,373,994 3,018.0Dec‐08 1,485,202 405.0 834,581 885.5 3,722,596 1,015.2 6,042,379 2,305.7Jan‐09 1,285,454 372.5 555,450 617.7 3,869,904 1,121.6 5,710,808 2,111.8Feb‐09 1,552,726 450.0 0 0.0 4,341,464 1,258.2 5,894,190 1,708.2Mar‐09 1,930,246 559.4 2,219,730 2,468.5 6,108,386 1,770.3 10,258,362 4,798.3Apr‐09 2,296,366 665.5 1,665,982 1,852.7 6,990,298 2,025.9 10,952,646 4,544.1May‐09 1,724,148 499.7 1,940,418 2,157.9 5,886,528 1,706.0 9,551,094 4,363.6Jun‐09 1,816,076 526.3 2,357,946 2,622.3 5,887,494 1,706.3 10,061,516 4,854.9Jul‐09 2,089,273 605.5 1,111,038 1,235.6 6,146,106 1,781.2 9,346,417 3,622.3Aug‐09 2,143,720 621.3 2,082,558 2,316.0 5,479,244 1,588.0 9,705,522 4,525.3Sep‐09 1,713,254 496.5 1,247,658 1,387.5 4,826,182 1,398.7 7,787,094 3,282.7Oct‐09 2,138,356 619.7 1,828,316 2,033.3 6,365,940 1,844.9 10,332,612 4,497.9Nov‐09 1,731,756 501.9 1,116,190 1,241.3 5,465,399 1,584.0 8,313,345 3,327.2Dec‐09 1,556,778 451.2 972,302 1,081.3 5,027,248 1,457.0 7,556,328 2,989.4Jan‐10 1,850,166 598.5 622,978 793.0 5,657,172 1,830.1 8,130,316 3,221.7Feb‐10 1,107,634 358.3 1,116,926 1,421.8 3,271,198 1,058.3 5,495,758 2,838.4Mar‐10 2,044,838 661.5 3,197,276 4,070.0 4,789,566 1,549.5 10,031,680 6,281.0Apr‐10 2,223,732 719.4 1,673,434 2,130.2 7,451,862 2,410.7 11,349,028 5,260.4May‐10 2,138,494 691.8 2,099,302 2,672.3 6,767,750 2,189.4 11,005,546 5,553.6Jun‐10 2,264,715 732.7 0 0.0 6,746,038 2,182.4 9,010,753 2,915.0Jul‐10 2,431,560 786.6 1,093,972 1,392.6 6,572,572 2,126.3 10,098,104 4,305.5Aug‐10 0 0.0 3,346,362 4,259.8 6,115,102 1,978.3 9,461,464 6,238.1Sep‐10 1,254,604 405.9 2,361,088 3,005.6 6,095,276 1,971.9 9,710,968 5,383.3Oct‐10 2,379,136 769.7 2,902,186 3,694.4 5,720,928 1,850.8 11,002,250 6,314.8Nov‐10 1,765,756 571.2 1,813,182 2,308.1 4,562,648 1,476.1 8,141,586 4,355.4Dec‐10 1,679,417 543.3 2,625,496 3,342.2 6,158,300 1,992.3 10,463,213 5,877.7Jan‐11 1,998,332 830.9 1,651,446 1,800.9 5,680,724 2,362.1 9,330,502 4,993.9Feb‐11 1,843,680 766.6 2,974,682 3,243.9 5,497,046 2,285.7 10,315,408 6,296.3Mar‐11 2,387,748 992.8 3,286,792 3,584.3 5,739,248 2,386.4 11,413,788 6,963.6Apr‐11 2,655,948 1,104.4 2,766,302 3,016.7 6,151,488 2,557.8 11,573,738 6,678.9May‐11 2,791,096 1,160.6 2,349,128 2,561.8 6,400,992 2,661.6 11,541,216 6,383.9Jun‐11 2,309,108 960.1 2,854,806 3,113.2 5,698,848 2,369.6 10,862,762 6,443.0Jul‐11 1,859,964 773.4 1,644,684 1,793.6 5,060,736 2,104.3 8,565,384 4,671.2Aug‐11 2,371,806 986.2 1,062,922 1,159.1 5,698,618 2,369.5 9,133,346 4,514.9Sep‐11 1,559,492 648.4 693,266 756.0 4,381,500 1,821.9 6,634,258 3,226.3Oct‐11 2,078,556 864.3 2,175,018 2,371.9 5,715,776 2,376.7 9,969,350 5,612.8Nov‐11 1,025,524 426.4 828,276 903.2 2,632,718 1,094.7 4,486,518 2,424.4Dec‐11 2,077,340 863.8 1,507,742 1,644.2 5,661,864 2,354.2 9,246,946 4,862.2
Month
1.Monthlykilnproductiondatafromselectyearsarefromthefile"MonthlyKilnVolume‐2004‐2012.pdf"copiedduringtheAugustaLumberMillsitevisitonMarch06,2012byDeannaDuramandJakeStewart(Trinity).Theremainingmonth'sprooductiondataweretakenfromdocumentsonfileatGeorgiaEPDinAtlanta,Georgia.
2.AnnualdataforwoodwastecombustedwasprovidedviaemailfromWestFrasertoTrinityonApril9,2012.Theannualvalueswereconvertedtomonthlyvaluesbytakingtheratioofthelumberproducedinagivenmonthtotheamountoflumberproducedintheentireyear.
TrinityConsultants Page2of37AugustaExpansionProjectEmissionsAnalysis(20130306JF)
ProductionData

AppendixB‐EmissionCalculationsWestFraser‐Augusta,Georgia
TableB‐4.EmissionFactorsforDirect‐FiredBatchKilns
Pollutant Reference
NSRPollutantsCO 0.73 lb/MBF 1Fluorides N/A N/A 2H2S N/A N/A 2Lead 1.77E‐05 lb/MMBtu 3NOX 0.28 lb/MBF 4ReducedSulfurCompounds(includingH2S) N/A N/A 2SO2 0.025 lb/MMBtu 5H2SO4 N/A N/A 2TotalPM 0.41 lb/MBF 6TotalPM10 0.25 lb/MBF 6,7TotalPM2.5 0.226 lb/MBF 6,8TotalReducedSulfur(includingH2S) N/A N/A 2TotalVOC 3.83 lb/MBF 9
GreenhouseGasesCO2 206.79 lb/MMBtu 10CH4 7.1E‐02 lb/MMBtu 10N2O 9.3E‐03 lb/MMBtu 10CO2e 211.15 lb/MMBtu 11CO2ebiomassdeferral 4.35 lb/MMBtu 12
HAPsFormaldehyde 0.04 lb/MBF 3Methanol 0.16 lb/MBF 3
CO2 1
CH4 21
N2O 310
12.Pursuantto40CFRPart98.2(b)(2),biogeniccarbondioxideemissions(e.g.,frombiomass)areexcludedfromthecombustionofbiomass.
10.Per40CFRPart98,SubpartC,TablesC‐1andC‐2.TheCO2emissionfactoristhedefaultfactorforwoodandwoodresiduals,andtheCH4andN2Oemissionfactorsarethedefaultfactorsforallsolidbiomassfuels.11.TheCO2efactoriscalculatedbasedontheemissionfactorsforCO 2,CH4,andN2Oandtheglobalwarmingpotential(GWP)foreachpollutantper40CFR98,SubpartA,TableA‐1:
EmissionFactor
6.BasedonunpublishedNCASIvaluesfordirect‐firedkilns,providedintheNCDAQAirPermitReview/PreliminaryDetermination,p.9,fortheWeyerhaeuserNRLumberMill(Plymouth,N.C.)May2010permitapplication.TotalPM/PM 10/PM2.5
emissionsarethesumoffilterableandcondensableparticulate.
7.BasedontheairpermitdocumentforBiblerBrother,datedMay2008,whichusedEPA's"PMCalculator"softwarefortheratioofPMtoPM10forvariouswooddryersourceclassificationcodes,aspublishedintheAirPermitReview/PreliminaryDetermination,p.9,fortheWeyerhaeuserNRLumberMill(Plymouth,N.C.)May2010permitapplication.
8.BasedonWeyerhaeuser'sParticulateMatterEstimatingGuide,2003,asreferencedintheMay20120WeyerhaeuserPlymouthLumberMillRevisedAirPermitApplicationforEnergyProject.InformationpublishedintheAirPermitReview/PreliminaryDetermination,p.9,fortheWeyerhaeuserNRLumberMill(Plymouth,N.C.)May2010permitapplication.
9.TotalVOC(lb/MBF)asrequestedbyEPD.
1.BasedontheaverageofNCASItestresultsasprovidedviaemailfromDr.WordofNCASItotheNorthCarolinaDepartmentofAirQuality(NCDAQ),publishedintheAirPermitReview/PreliminaryDetermination,p.8fortheWeyerhaeuserNRLumberMill(Plymouth,N.C.)applicationsubmittedinMay2010entitled"FinalReport‐RevisedAirPermitApplicatinforEnergyProject."
2.EmissionsofthesepollutantsarenotexpectedattheWestFraserAugusta,GAsite.
3.PerNCASISARA313Guidance‐WoodProducts‐April2009,aspublishedintheWeyerhaeuserNRLumberMill(Plymouth,N.C.)revisedairpermitapplicationentitled"FinalReport‐RevisedAirPermitApplicatinforEnergyProject,"datedMay2010.
4.ProvidedbyDr.DavidWordofNCASItotheWeyerhaeuserfacilityinFebruary2008,aspublishedintheAirPermitReview/PreliminaryDetermination,p.5fortheWeyerhaeuserNRLumberMill(Plymouth,N.C.)fortheMay2010permitapplication.
5.PerU.S.EPA'sAP‐42,Section1.6,Table1.6‐2,WoodResidueCombustioninBoilers (September2003).
TrinityConsultants Page3of37AugustaExpansionProjectEmissionsAnalysis(20130306JF)
BatchKilnEFs

AppendixB‐EmissionCalculationsWestFraser‐Augusta,Georgia
TableB‐5.BaselineMonthlyEmissionsforKiln1(tonspermonth)
Month CO Fluorides H2S Lead NOX
ReducedSulfurCompounds
(includingH2S) SO2 H2SO4 TotalPM TotalPM10 TotalPM2.5
TotalReducedSulfur
(includingH2S) TotalVOC CO2ebiomassdeferral Formaldehyde Methanol
Jan‐02 0.62 N/A N/A 5.56E‐05 0.24 N/A 0.08 N/A 0.35 0.21 0.19 N/A 3.27 13.68 0.03 0.14Feb‐02 0.59 N/A N/A 5.30E‐05 0.23 N/A 0.07 N/A 0.33 0.20 0.18 N/A 3.11 13.04 0.03 0.13Mar‐02 0.65 N/A N/A 5.79E‐05 0.25 N/A 0.08 N/A 0.36 0.22 0.20 N/A 3.40 14.23 0.04 0.14Apr‐02 0.56 N/A N/A 5.01E‐05 0.22 N/A 0.07 N/A 0.31 0.19 0.17 N/A 2.94 12.33 0.03 0.12May‐02 0.53 N/A N/A 4.73E‐05 0.20 N/A 0.07 N/A 0.30 0.18 0.16 N/A 2.78 11.63 0.03 0.12Jun‐02 0.68 N/A N/A 6.07E‐05 0.26 N/A 0.09 N/A 0.38 0.23 0.21 N/A 3.57 14.93 0.04 0.15Jul‐02 0.80 N/A N/A 7.12E‐05 0.31 N/A 0.10 N/A 0.44 0.27 0.25 N/A 4.18 17.50 0.04 0.17Aug‐02 0.66 N/A N/A 5.89E‐05 0.25 N/A 0.08 N/A 0.37 0.22 0.20 N/A 3.46 14.49 0.04 0.14Sep‐02 0.68 N/A N/A 6.09E‐05 0.26 N/A 0.09 N/A 0.38 0.23 0.21 N/A 3.57 14.97 0.04 0.15Oct‐02 0.76 N/A N/A 6.83E‐05 0.29 N/A 0.10 N/A 0.43 0.26 0.24 N/A 4.01 16.80 0.04 0.17Nov‐02 0.82 N/A N/A 7.32E‐05 0.31 N/A 0.10 N/A 0.46 0.28 0.25 N/A 4.30 17.99 0.04 0.18Dec‐02 0.61 N/A N/A 5.42E‐05 0.23 N/A 0.08 N/A 0.34 0.21 0.19 N/A 3.18 13.33 0.03 0.13Jan‐03 0.78 N/A N/A 7.25E‐05 0.30 N/A 0.10 N/A 0.44 0.27 0.24 N/A 4.11 17.82 0.04 0.17Feb‐03 0.87 N/A N/A 8.01E‐05 0.33 N/A 0.11 N/A 0.48 0.29 0.27 N/A 4.54 19.69 0.05 0.19Mar‐03 0.81 N/A N/A 7.45E‐05 0.31 N/A 0.11 N/A 0.45 0.27 0.25 N/A 4.23 18.32 0.04 0.18Apr‐03 0.74 N/A N/A 6.86E‐05 0.28 N/A 0.10 N/A 0.41 0.25 0.23 N/A 3.89 16.86 0.04 0.16May‐03 0.89 N/A N/A 8.24E‐05 0.34 N/A 0.12 N/A 0.50 0.30 0.28 N/A 4.68 20.26 0.05 0.20Jun‐03 0.63 N/A N/A 5.81E‐05 0.24 N/A 0.08 N/A 0.35 0.21 0.19 N/A 3.30 14.30 0.03 0.14Jul‐03 0.64 N/A N/A 5.90E‐05 0.24 N/A 0.08 N/A 0.36 0.22 0.20 N/A 3.35 14.50 0.03 0.14Aug‐03 0.73 N/A N/A 6.74E‐05 0.28 N/A 0.10 N/A 0.41 0.25 0.23 N/A 3.82 16.56 0.04 0.16Sep‐03 0.67 N/A N/A 6.22E‐05 0.26 N/A 0.09 N/A 0.38 0.23 0.21 N/A 3.53 15.30 0.04 0.15Oct‐03 0.83 N/A N/A 7.65E‐05 0.32 N/A 0.11 N/A 0.46 0.28 0.26 N/A 4.34 18.82 0.05 0.18Nov‐03 0.61 N/A N/A 5.67E‐05 0.24 N/A 0.08 N/A 0.34 0.21 0.19 N/A 3.22 13.95 0.03 0.13Dec‐03 0.66 N/A N/A 6.15E‐05 0.25 N/A 0.09 N/A 0.37 0.22 0.21 N/A 3.49 15.11 0.04 0.15Jan‐04 0.68 N/A N/A 6.03E‐05 0.26 N/A 0.09 N/A 0.38 0.23 0.21 N/A 3.55 14.83 0.04 0.15Feb‐04 0.58 N/A N/A 5.20E‐05 0.22 N/A 0.07 N/A 0.33 0.20 0.18 N/A 3.06 12.78 0.03 0.13Mar‐04 0.51 N/A N/A 4.56E‐05 0.20 N/A 0.06 N/A 0.29 0.17 0.16 N/A 2.68 11.21 0.03 0.11Apr‐04 0.62 N/A N/A 5.56E‐05 0.24 N/A 0.08 N/A 0.35 0.21 0.19 N/A 3.27 13.68 0.03 0.14May‐04 0.56 N/A N/A 4.98E‐05 0.21 N/A 0.07 N/A 0.31 0.19 0.17 N/A 2.93 12.25 0.03 0.12Jun‐04 0.67 N/A N/A 5.95E‐05 0.26 N/A 0.08 N/A 0.37 0.23 0.21 N/A 3.50 14.64 0.04 0.15Jul‐04 0.28 N/A N/A 2.46E‐05 0.11 N/A 0.03 N/A 0.15 0.09 0.09 N/A 1.45 6.05 0.02 0.06Aug‐04 0.97 N/A N/A 8.64E‐05 0.37 N/A 0.12 N/A 0.54 0.33 0.30 N/A 5.09 21.25 0.05 0.21Sep‐04 0.80 N/A N/A 7.16E‐05 0.31 N/A 0.10 N/A 0.45 0.27 0.25 N/A 4.22 17.61 0.04 0.18Oct‐04 0.86 N/A N/A 7.69E‐05 0.33 N/A 0.11 N/A 0.48 0.29 0.27 N/A 4.53 18.91 0.05 0.19Nov‐04 0.80 N/A N/A 7.14E‐05 0.31 N/A 0.10 N/A 0.45 0.27 0.25 N/A 4.20 17.56 0.04 0.18Dec‐04 0.89 N/A N/A 7.90E‐05 0.34 N/A 0.11 N/A 0.49 0.30 0.27 N/A 4.65 19.42 0.05 0.19Jan‐05 0.88 N/A N/A 7.88E‐05 0.34 N/A 0.11 N/A 0.49 0.30 0.27 N/A 4.61 19.36 0.05 0.19Feb‐05 0.85 N/A N/A 7.64E‐05 0.33 N/A 0.11 N/A 0.48 0.29 0.26 N/A 4.47 18.78 0.05 0.19Mar‐05 0.93 N/A N/A 8.36E‐05 0.36 N/A 0.12 N/A 0.52 0.32 0.29 N/A 4.90 20.57 0.05 0.20Apr‐05 0.89 N/A N/A 7.97E‐05 0.34 N/A 0.11 N/A 0.50 0.30 0.28 N/A 4.67 19.59 0.05 0.19May‐05 0.91 N/A N/A 8.17E‐05 0.35 N/A 0.12 N/A 0.51 0.31 0.28 N/A 4.79 20.09 0.05 0.20Jun‐05 0.74 N/A N/A 6.59E‐05 0.28 N/A 0.09 N/A 0.41 0.25 0.23 N/A 3.86 16.21 0.04 0.16Jul‐05 0.88 N/A N/A 7.85E‐05 0.34 N/A 0.11 N/A 0.49 0.30 0.27 N/A 4.60 19.31 0.05 0.19Aug‐05 0.92 N/A N/A 8.23E‐05 0.35 N/A 0.12 N/A 0.51 0.31 0.28 N/A 4.82 20.24 0.05 0.20Sep‐05 0.92 N/A N/A 8.21E‐05 0.35 N/A 0.12 N/A 0.51 0.31 0.28 N/A 4.81 20.18 0.05 0.20Oct‐05 0.91 N/A N/A 8.15E‐05 0.35 N/A 0.12 N/A 0.51 0.31 0.28 N/A 4.77 20.03 0.05 0.20Nov‐05 0.84 N/A N/A 7.48E‐05 0.32 N/A 0.11 N/A 0.47 0.28 0.26 N/A 4.38 18.39 0.05 0.18Dec‐05 1.04 N/A N/A 9.34E‐05 0.40 N/A 0.13 N/A 0.58 0.35 0.32 N/A 5.47 22.97 0.06 0.23
TrinityConsultants Page4of37AugustaExpansionProjectEmissionsAnalysis(20130306JF)
Kiln1Emissions

AppendixB‐EmissionCalculationsWestFraser‐Augusta,Georgia
TableB‐5.BaselineMonthlyEmissionsforKiln1(tonspermonth)
Month CO Fluorides H2S Lead NOX
ReducedSulfurCompounds
(includingH2S) SO2 H2SO4 TotalPM TotalPM10 TotalPM2.5
TotalReducedSulfur
(includingH2S) TotalVOC CO2ebiomassdeferral Formaldehyde Methanol
Jan‐06 0.93 N/A N/A 7.46E‐05 0.36 N/A 0.11 N/A 0.52 0.32 0.29 N/A 4.89 18.35 0.05 0.20Feb‐06 0.71 N/A N/A 5.68E‐05 0.27 N/A 0.08 N/A 0.40 0.24 0.22 N/A 3.73 13.97 0.04 0.16Mar‐06 1.17 N/A N/A 9.32E‐05 0.45 N/A 0.13 N/A 0.65 0.39 0.36 N/A 6.11 22.93 0.06 0.26Apr‐06 0.88 N/A N/A 7.03E‐05 0.34 N/A 0.10 N/A 0.49 0.30 0.27 N/A 4.61 17.28 0.05 0.19May‐06 1.03 N/A N/A 8.23E‐05 0.39 N/A 0.12 N/A 0.57 0.35 0.32 N/A 5.39 20.23 0.06 0.23Jun‐06 0.96 N/A N/A 7.71E‐05 0.37 N/A 0.11 N/A 0.54 0.33 0.30 N/A 5.06 18.96 0.05 0.21Jul‐06 0.98 N/A N/A 7.87E‐05 0.38 N/A 0.11 N/A 0.55 0.33 0.30 N/A 5.16 19.35 0.05 0.22Aug‐06 0.89 N/A N/A 7.14E‐05 0.34 N/A 0.10 N/A 0.50 0.30 0.28 N/A 4.68 17.56 0.05 0.20Sep‐06 0.92 N/A N/A 7.35E‐05 0.35 N/A 0.10 N/A 0.51 0.31 0.28 N/A 4.82 18.07 0.05 0.20Oct‐06 0.82 N/A N/A 6.52E‐05 0.31 N/A 0.09 N/A 0.45 0.28 0.25 N/A 4.28 16.04 0.04 0.18Nov‐06 0.70 N/A N/A 5.61E‐05 0.27 N/A 0.08 N/A 0.39 0.24 0.22 N/A 3.68 13.80 0.04 0.15Dec‐06 0.62 N/A N/A 4.99E‐05 0.24 N/A 0.07 N/A 0.35 0.21 0.19 N/A 3.27 12.26 0.03 0.14Jan‐07 0.74 N/A N/A 4.05E‐05 0.28 N/A 0.06 N/A 0.41 0.25 0.23 N/A 3.88 9.95 0.04 0.16Feb‐07 0.60 N/A N/A 3.27E‐05 0.23 N/A 0.05 N/A 0.33 0.20 0.19 N/A 3.14 8.03 0.03 0.13Mar‐07 0.61 N/A N/A 3.33E‐05 0.23 N/A 0.05 N/A 0.34 0.21 0.19 N/A 3.19 8.18 0.03 0.13Apr‐07 0.55 N/A N/A 3.02E‐05 0.21 N/A 0.04 N/A 0.31 0.19 0.17 N/A 2.90 7.43 0.03 0.12May‐07 0.84 N/A N/A 4.58E‐05 0.32 N/A 0.06 N/A 0.47 0.28 0.26 N/A 4.40 11.27 0.05 0.18Jun‐07 0.68 N/A N/A 3.73E‐05 0.26 N/A 0.05 N/A 0.38 0.23 0.21 N/A 3.58 9.16 0.04 0.15Jul‐07 0.72 N/A N/A 3.94E‐05 0.28 N/A 0.06 N/A 0.40 0.24 0.22 N/A 3.79 9.70 0.04 0.16Aug‐07 1.10 N/A N/A 6.00E‐05 0.42 N/A 0.08 N/A 0.61 0.37 0.34 N/A 5.76 14.74 0.06 0.24Sep‐07 0.61 N/A N/A 3.32E‐05 0.23 N/A 0.05 N/A 0.34 0.21 0.19 N/A 3.19 8.16 0.03 0.13Oct‐07 0.62 N/A N/A 3.38E‐05 0.24 N/A 0.05 N/A 0.34 0.21 0.19 N/A 3.24 8.31 0.03 0.14Nov‐07 0.38 N/A N/A 2.07E‐05 0.15 N/A 0.03 N/A 0.21 0.13 0.12 N/A 1.99 5.10 0.02 0.08Dec‐07 0.48 N/A N/A 2.61E‐05 0.18 N/A 0.04 N/A 0.27 0.16 0.15 N/A 2.51 6.43 0.03 0.10Jan‐08 0.23 N/A N/A 1.39E‐05 0.09 N/A 0.02 N/A 0.13 0.08 0.07 N/A 1.22 3.42 0.01 0.05Feb‐08 0.48 N/A N/A 2.85E‐05 0.18 N/A 0.04 N/A 0.27 0.16 0.15 N/A 2.52 7.02 0.03 0.11Mar‐08 0.21 N/A N/A 1.26E‐05 0.08 N/A 0.02 N/A 0.12 0.07 0.07 N/A 1.11 3.09 0.01 0.05Apr‐08 0.77 N/A N/A 4.58E‐05 0.30 N/A 0.06 N/A 0.43 0.26 0.24 N/A 4.04 11.26 0.04 0.17May‐08 0.81 N/A N/A 4.83E‐05 0.31 N/A 0.07 N/A 0.45 0.27 0.25 N/A 4.26 11.88 0.04 0.18Jun‐08 0.68 N/A N/A 4.07E‐05 0.26 N/A 0.06 N/A 0.38 0.23 0.21 N/A 3.59 10.00 0.04 0.15Jul‐08 0.79 N/A N/A 4.70E‐05 0.30 N/A 0.07 N/A 0.44 0.27 0.24 N/A 4.14 11.55 0.04 0.17Aug‐08 0.98 N/A N/A 5.85E‐05 0.38 N/A 0.08 N/A 0.55 0.33 0.30 N/A 5.16 14.39 0.05 0.22Sep‐08 0.34 N/A N/A 2.05E‐05 0.13 N/A 0.03 N/A 0.19 0.12 0.11 N/A 1.81 5.04 0.02 0.08Oct‐08 0.32 N/A N/A 1.88E‐05 0.12 N/A 0.03 N/A 0.18 0.11 0.10 N/A 1.66 4.63 0.02 0.07Nov‐08 0.73 N/A N/A 4.32E‐05 0.28 N/A 0.06 N/A 0.41 0.25 0.22 N/A 3.81 10.63 0.04 0.16Dec‐08 0.54 N/A N/A 3.23E‐05 0.21 N/A 0.05 N/A 0.30 0.18 0.17 N/A 2.84 7.93 0.03 0.12Jan‐09 0.47 N/A N/A 2.97E‐05 0.18 N/A 0.04 N/A 0.26 0.16 0.15 N/A 2.46 7.30 0.03 0.10Feb‐09 0.57 N/A N/A 3.58E‐05 0.22 N/A 0.05 N/A 0.32 0.19 0.18 N/A 2.97 8.81 0.03 0.12Mar‐09 0.70 N/A N/A 4.46E‐05 0.27 N/A 0.06 N/A 0.39 0.24 0.22 N/A 3.70 10.96 0.04 0.15Apr‐09 0.84 N/A N/A 5.30E‐05 0.32 N/A 0.07 N/A 0.47 0.28 0.26 N/A 4.40 13.03 0.05 0.18May‐09 0.63 N/A N/A 3.98E‐05 0.24 N/A 0.06 N/A 0.35 0.21 0.19 N/A 3.30 9.79 0.03 0.14Jun‐09 0.66 N/A N/A 4.19E‐05 0.25 N/A 0.06 N/A 0.37 0.22 0.21 N/A 3.48 10.31 0.04 0.15Jul‐09 0.76 N/A N/A 4.82E‐05 0.29 N/A 0.07 N/A 0.43 0.26 0.24 N/A 4.00 11.86 0.04 0.17Aug‐09 0.78 N/A N/A 4.95E‐05 0.30 N/A 0.07 N/A 0.44 0.26 0.24 N/A 4.11 12.17 0.04 0.17Sep‐09 0.63 N/A N/A 3.95E‐05 0.24 N/A 0.06 N/A 0.35 0.21 0.19 N/A 3.28 9.72 0.03 0.14Oct‐09 0.78 N/A N/A 4.94E‐05 0.30 N/A 0.07 N/A 0.44 0.26 0.24 N/A 4.09 12.14 0.04 0.17Nov‐09 0.63 N/A N/A 4.00E‐05 0.24 N/A 0.06 N/A 0.35 0.21 0.20 N/A 3.32 9.83 0.03 0.14
TrinityConsultants Page5of37AugustaExpansionProjectEmissionsAnalysis(20130306JF)
Kiln1Emissions

AppendixB‐EmissionCalculationsWestFraser‐Augusta,Georgia
TableB‐5.BaselineMonthlyEmissionsforKiln1(tonspermonth)
Month CO Fluorides H2S Lead NOX
ReducedSulfurCompounds
(includingH2S) SO2 H2SO4 TotalPM TotalPM10 TotalPM2.5
TotalReducedSulfur
(includingH2S) TotalVOC CO2ebiomassdeferral Formaldehyde Methanol
Dec‐09 0.57 N/A N/A 3.59E‐05 0.22 N/A 0.05 N/A 0.32 0.19 0.18 N/A 2.98 8.84 0.03 0.12Jan‐10 0.68 N/A N/A 4.77E‐05 0.26 N/A 0.07 N/A 0.38 0.23 0.21 N/A 3.54 11.72 0.04 0.15Feb‐10 0.40 N/A N/A 2.85E‐05 0.16 N/A 0.04 N/A 0.23 0.14 0.13 N/A 2.12 7.02 0.02 0.09Mar‐10 0.75 N/A N/A 5.27E‐05 0.29 N/A 0.07 N/A 0.42 0.25 0.23 N/A 3.92 12.95 0.04 0.16Apr‐10 0.81 N/A N/A 5.73E‐05 0.31 N/A 0.08 N/A 0.45 0.27 0.25 N/A 4.26 14.09 0.04 0.18May‐10 0.78 N/A N/A 5.51E‐05 0.30 N/A 0.08 N/A 0.44 0.26 0.24 N/A 4.10 13.55 0.04 0.17Jun‐10 0.83 N/A N/A 5.84E‐05 0.32 N/A 0.08 N/A 0.46 0.28 0.26 N/A 4.34 14.35 0.05 0.18Jul‐10 0.89 N/A N/A 6.27E‐05 0.34 N/A 0.09 N/A 0.49 0.30 0.27 N/A 4.66 15.41 0.05 0.19Aug‐10 0.00 N/A N/A 0.00E+00 0.00 N/A 0.00 N/A 0.00 0.00 0.00 N/A 0.00 0.00 0.00 0.00Sep‐10 0.46 N/A N/A 3.23E‐05 0.18 N/A 0.05 N/A 0.26 0.15 0.14 N/A 2.40 7.95 0.03 0.10Oct‐10 0.87 N/A N/A 6.13E‐05 0.33 N/A 0.09 N/A 0.48 0.29 0.27 N/A 4.56 15.07 0.05 0.19Nov‐10 0.64 N/A N/A 4.55E‐05 0.25 N/A 0.06 N/A 0.36 0.22 0.20 N/A 3.38 11.19 0.04 0.14Dec‐10 0.61 N/A N/A 4.33E‐05 0.24 N/A 0.06 N/A 0.34 0.21 0.19 N/A 3.22 10.64 0.03 0.13Jan‐11 0.73 N/A N/A 6.62E‐05 0.28 N/A 0.09 N/A 0.41 0.25 0.23 N/A 3.83 16.27 0.04 0.16Feb‐11 0.67 N/A N/A 6.11E‐05 0.26 N/A 0.09 N/A 0.38 0.23 0.21 N/A 3.53 15.01 0.04 0.15Mar‐11 0.87 N/A N/A 7.91E‐05 0.33 N/A 0.11 N/A 0.49 0.29 0.27 N/A 4.57 19.44 0.05 0.19Apr‐11 0.97 N/A N/A 8.80E‐05 0.37 N/A 0.12 N/A 0.54 0.33 0.30 N/A 5.09 21.63 0.05 0.21May‐11 1.02 N/A N/A 9.24E‐05 0.39 N/A 0.13 N/A 0.57 0.34 0.32 N/A 5.34 22.73 0.06 0.22Jun‐11 0.84 N/A N/A 7.65E‐05 0.32 N/A 0.11 N/A 0.47 0.29 0.26 N/A 4.42 18.80 0.05 0.18Jul‐11 0.68 N/A N/A 6.16E‐05 0.26 N/A 0.09 N/A 0.38 0.23 0.21 N/A 3.56 15.15 0.04 0.15Aug‐11 0.87 N/A N/A 7.86E‐05 0.33 N/A 0.11 N/A 0.48 0.29 0.27 N/A 4.54 19.31 0.05 0.19Sep‐11 0.57 N/A N/A 5.16E‐05 0.22 N/A 0.07 N/A 0.32 0.19 0.18 N/A 2.99 12.70 0.03 0.12Oct‐11 0.76 N/A N/A 6.88E‐05 0.29 N/A 0.10 N/A 0.42 0.26 0.23 N/A 3.98 16.93 0.04 0.17Nov‐11 0.37 N/A N/A 3.40E‐05 0.14 N/A 0.05 N/A 0.21 0.13 0.12 N/A 1.96 8.35 0.02 0.08Dec‐11 0.76 N/A N/A 6.88E‐05 0.29 N/A 0.10 N/A 0.42 0.26 0.23 N/A 3.98 16.92 0.04 0.17
1.Baselinemonthlyemissionsarecalculatedtwowaysdependingontheunitsoftheemissionfactorofinterest.
Iftheemissionfactorisinunitsoflb/MBF,thefollowingderivationisused:ActualEmissions[ton/month]=EmissionFactor[lb/MBF]*MonthlyKilnProduction[BF/month]/2,000lb/ton/1,000BF/MBFIftheemissionfactorisinunitsoflb/MMBtu,thefollowingderivationisused:ActualEmissions[ton/month]=EmissionFactor[lb/MMBtu]*MonthlyWoodCombusted[tons/month]*HeatingValue[4,500Btu/lbwoodcombusted]/1,000,000Btu/MMBtu
TrinityConsultants Page6of37AugustaExpansionProjectEmissionsAnalysis(20130306JF)
Kiln1Emissions

AppendixB‐EmissionCalculationsWestFraser‐Augusta,Georgia
TableB‐6.Total24‐MonthRollingAverageActualAnnualEmissionsforKilns1(tpy)
CO Fluorides H2S Lead NOX
ReducedSulfurCompounds
(includingH2S) SO2 H2SO4 TotalPM TotalPM10 TotalPM2.5
TotalReducedSulfur
(includingH2S) TotalVOC CO2ebiomassdeferral Formaldehyde Methanol
Jan‐02 ‐ Dec‐03 8.41 N/A N/A 7.65E‐04 3.23 N/A 1.08 N/A 4.69 2.85 2.60 N/A 44.14 188.21 0.46 1.84Feb‐02 ‐ Jan‐04 8.44 N/A N/A 7.68E‐04 3.24 N/A 1.08 N/A 4.71 2.86 2.61 N/A 44.28 188.78 0.46 1.85Mar‐02 ‐ Feb‐04 8.43 N/A N/A 7.67E‐04 3.24 N/A 1.08 N/A 4.70 2.85 2.61 N/A 44.25 188.66 0.46 1.85Apr‐02 ‐ Mar‐04 8.37 N/A N/A 7.61E‐04 3.21 N/A 1.08 N/A 4.66 2.83 2.59 N/A 43.89 187.14 0.46 1.83May‐02 ‐ Apr‐04 8.40 N/A N/A 7.64E‐04 3.22 N/A 1.08 N/A 4.68 2.84 2.60 N/A 44.06 187.82 0.46 1.84Jun‐02 ‐ May‐04 8.41 N/A N/A 7.65E‐04 3.23 N/A 1.08 N/A 4.69 2.85 2.60 N/A 44.13 188.13 0.46 1.84Jul‐02 ‐ Jun‐04 8.41 N/A N/A 7.65E‐04 3.22 N/A 1.08 N/A 4.69 2.84 2.60 N/A 44.10 187.98 0.46 1.84Aug‐02 ‐ Jul‐04 8.15 N/A N/A 7.41E‐04 3.12 N/A 1.05 N/A 4.54 2.76 2.52 N/A 42.74 182.25 0.45 1.79Sep‐02 ‐ Aug‐04 8.30 N/A N/A 7.55E‐04 3.18 N/A 1.07 N/A 4.63 2.81 2.57 N/A 43.55 185.63 0.45 1.82Oct‐02 ‐ Sep‐04 8.36 N/A N/A 7.60E‐04 3.21 N/A 1.07 N/A 4.66 2.83 2.59 N/A 43.87 186.95 0.46 1.83Nov‐02 ‐ Oct‐04 8.41 N/A N/A 7.65E‐04 3.23 N/A 1.08 N/A 4.69 2.85 2.60 N/A 44.13 188.01 0.46 1.84Dec‐02 ‐ Nov‐04 8.40 N/A N/A 7.64E‐04 3.22 N/A 1.08 N/A 4.68 2.84 2.60 N/A 44.08 187.79 0.46 1.84Jan‐03 ‐ Dec‐04 8.54 N/A N/A 7.76E‐04 3.28 N/A 1.10 N/A 4.76 2.89 2.64 N/A 44.81 190.83 0.47 1.87Feb‐03 ‐ Jan‐05 8.59 N/A N/A 7.79E‐04 3.29 N/A 1.10 N/A 4.79 2.91 2.66 N/A 45.06 191.61 0.47 1.88Mar‐03 ‐ Feb‐05 8.58 N/A N/A 7.77E‐04 3.29 N/A 1.10 N/A 4.79 2.90 2.66 N/A 45.03 191.15 0.47 1.88Apr‐03 ‐ Mar‐05 8.65 N/A N/A 7.82E‐04 3.32 N/A 1.10 N/A 4.82 2.93 2.68 N/A 45.37 192.27 0.47 1.90May‐03 ‐ Apr‐05 8.72 N/A N/A 7.88E‐04 3.35 N/A 1.11 N/A 4.86 2.95 2.70 N/A 45.75 193.64 0.48 1.91Jun‐03 ‐ May‐05 8.73 N/A N/A 7.87E‐04 3.35 N/A 1.11 N/A 4.87 2.95 2.70 N/A 45.81 193.55 0.48 1.91Jul‐03 ‐ Jun‐05 8.79 N/A N/A 7.91E‐04 3.37 N/A 1.12 N/A 4.90 2.97 2.72 N/A 46.09 194.51 0.48 1.93Aug‐03 ‐ Jul‐05 8.90 N/A N/A 8.01E‐04 3.42 N/A 1.13 N/A 4.96 3.01 2.76 N/A 46.72 196.91 0.49 1.95Sep‐03 ‐ Aug‐05 9.00 N/A N/A 8.08E‐04 3.45 N/A 1.14 N/A 5.02 3.05 2.79 N/A 47.22 198.75 0.49 1.97Oct‐03 ‐ Sep‐05 9.12 N/A N/A 8.18E‐04 3.50 N/A 1.16 N/A 5.09 3.09 2.82 N/A 47.86 201.19 0.50 2.00Nov‐03 ‐ Oct‐05 9.16 N/A N/A 8.21E‐04 3.51 N/A 1.16 N/A 5.11 3.10 2.84 N/A 48.08 201.79 0.50 2.01Dec‐03 ‐ Nov‐05 9.27 N/A N/A 8.30E‐04 3.56 N/A 1.17 N/A 5.17 3.14 2.87 N/A 48.66 204.01 0.51 2.03Jan‐04 ‐ Dec‐05 9.46 N/A N/A 8.46E‐04 3.63 N/A 1.19 N/A 5.28 3.20 2.93 N/A 49.65 207.94 0.52 2.07Feb‐04 ‐ Jan‐06 9.59 N/A N/A 8.53E‐04 3.68 N/A 1.20 N/A 5.35 3.25 2.97 N/A 50.32 209.71 0.53 2.10Mar‐04 ‐ Feb‐06 9.66 N/A N/A 8.55E‐04 3.70 N/A 1.21 N/A 5.38 3.27 2.99 N/A 50.66 210.30 0.53 2.12Apr‐04 ‐ Mar‐06 9.98 N/A N/A 8.79E‐04 3.83 N/A 1.24 N/A 5.57 3.38 3.09 N/A 52.37 216.16 0.55 2.19May‐04 ‐ Apr‐06 10.11 N/A N/A 8.86E‐04 3.88 N/A 1.25 N/A 5.64 3.42 3.13 N/A 53.04 217.96 0.55 2.22Jun‐04 ‐ May‐06 10.34 N/A N/A 9.03E‐04 3.97 N/A 1.28 N/A 5.77 3.50 3.20 N/A 54.27 221.95 0.57 2.27Jul‐04 ‐ Jun‐06 10.49 N/A N/A 9.12E‐04 4.02 N/A 1.29 N/A 5.85 3.55 3.25 N/A 55.05 224.12 0.57 2.30Aug‐04 ‐ Jul‐06 10.85 N/A N/A 9.39E‐04 4.16 N/A 1.33 N/A 6.05 3.67 3.36 N/A 56.90 230.76 0.59 2.38Sep‐04 ‐ Aug‐06 10.81 N/A N/A 9.31E‐04 4.15 N/A 1.32 N/A 6.03 3.66 3.35 N/A 56.70 228.91 0.59 2.37Oct‐04 ‐ Sep‐06 10.86 N/A N/A 9.32E‐04 4.17 N/A 1.32 N/A 6.06 3.68 3.36 N/A 57.00 229.14 0.60 2.38Nov‐04 ‐ Oct‐06 10.84 N/A N/A 9.26E‐04 4.16 N/A 1.31 N/A 6.04 3.67 3.36 N/A 56.88 227.71 0.59 2.38Dec‐04 ‐ Nov‐06 10.79 N/A N/A 9.18E‐04 4.14 N/A 1.30 N/A 6.02 3.65 3.34 N/A 56.62 225.83 0.59 2.37Jan‐05 ‐ Dec‐06 10.66 N/A N/A 9.04E‐04 4.09 N/A 1.28 N/A 5.94 3.61 3.30 N/A 55.93 222.25 0.58 2.34Feb‐05 ‐ Jan‐07 10.59 N/A N/A 8.85E‐04 4.06 N/A 1.25 N/A 5.90 3.58 3.28 N/A 55.56 217.54 0.58 2.32Mar‐05 ‐ Feb‐07 10.46 N/A N/A 8.63E‐04 4.01 N/A 1.22 N/A 5.83 3.54 3.24 N/A 54.89 212.17 0.57 2.29Apr‐05 ‐ Mar‐07 10.30 N/A N/A 8.38E‐04 3.95 N/A 1.18 N/A 5.74 3.48 3.19 N/A 54.04 205.98 0.56 2.26May‐05 ‐ Apr‐07 10.13 N/A N/A 8.13E‐04 3.89 N/A 1.15 N/A 5.65 3.43 3.14 N/A 53.15 199.90 0.56 2.22Jun‐05 ‐ May‐07 10.09 N/A N/A 7.95E‐04 3.87 N/A 1.12 N/A 5.63 3.42 3.13 N/A 52.96 195.50 0.55 2.21Jul‐05 ‐ Jun‐07 10.07 N/A N/A 7.81E‐04 3.86 N/A 1.10 N/A 5.61 3.41 3.12 N/A 52.82 191.97 0.55 2.21Aug‐05 ‐ Jul‐07 9.99 N/A N/A 7.61E‐04 3.83 N/A 1.08 N/A 5.57 3.38 3.09 N/A 52.41 187.17 0.55 2.19Sep‐05 ‐ Aug‐07 10.08 N/A N/A 7.50E‐04 3.87 N/A 1.06 N/A 5.62 3.41 3.12 N/A 52.88 184.42 0.55 2.21Oct‐05 ‐ Sep‐07 9.92 N/A N/A 7.26E‐04 3.81 N/A 1.02 N/A 5.53 3.36 3.07 N/A 52.07 178.41 0.54 2.18Nov‐05 ‐ Oct‐07 9.78 N/A N/A 7.02E‐04 3.75 N/A 0.99 N/A 5.45 3.31 3.03 N/A 51.30 172.55 0.54 2.14Dec‐05 ‐ Nov‐07 9.55 N/A N/A 6.75E‐04 3.66 N/A 0.95 N/A 5.32 3.23 2.96 N/A 50.11 165.90 0.52 2.09
24MonthPeriod
TrinityConsultants Page7of37AugustaExpansionProjectEmissionsAnalysis(20130306JF)
24‐MonRollingAvg‐Kiln1
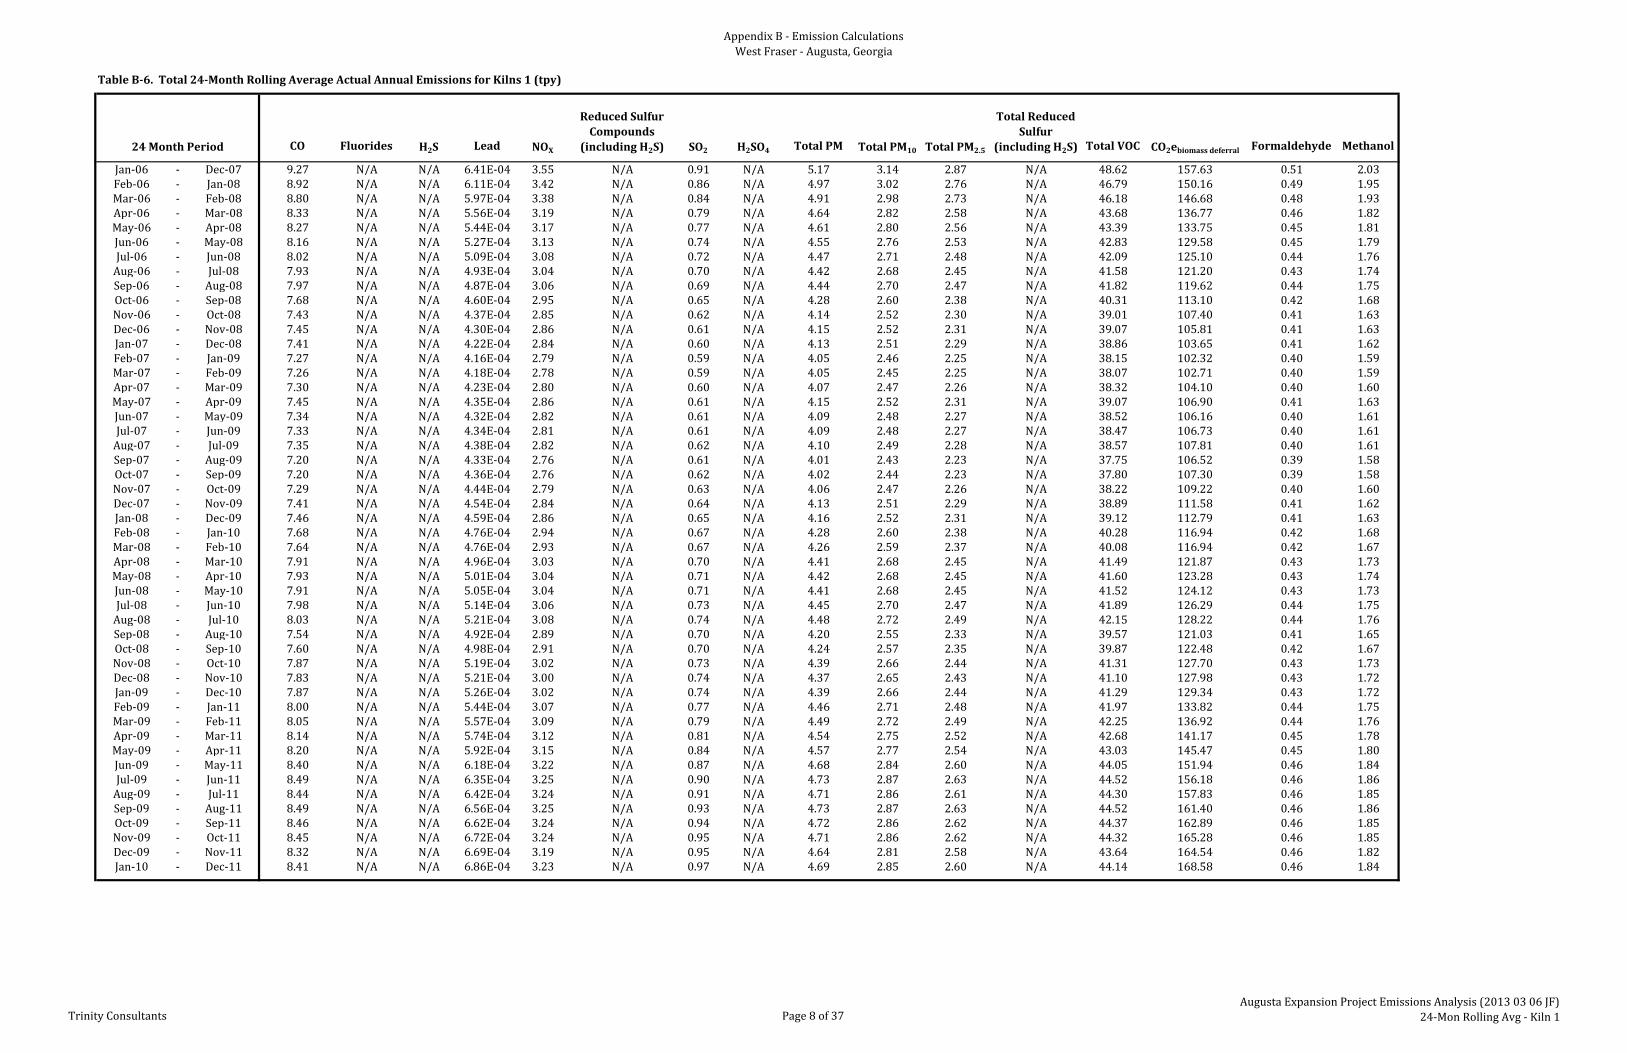
AppendixB‐EmissionCalculationsWestFraser‐Augusta,Georgia
TableB‐6.Total24‐MonthRollingAverageActualAnnualEmissionsforKilns1(tpy)
CO Fluorides H2S Lead NOX
ReducedSulfurCompounds
(includingH2S) SO2 H2SO4 TotalPM TotalPM10 TotalPM2.5
TotalReducedSulfur
(includingH2S) TotalVOC CO2ebiomassdeferral Formaldehyde Methanol24MonthPeriod
Jan‐06 ‐ Dec‐07 9.27 N/A N/A 6.41E‐04 3.55 N/A 0.91 N/A 5.17 3.14 2.87 N/A 48.62 157.63 0.51 2.03Feb‐06 ‐ Jan‐08 8.92 N/A N/A 6.11E‐04 3.42 N/A 0.86 N/A 4.97 3.02 2.76 N/A 46.79 150.16 0.49 1.95Mar‐06 ‐ Feb‐08 8.80 N/A N/A 5.97E‐04 3.38 N/A 0.84 N/A 4.91 2.98 2.73 N/A 46.18 146.68 0.48 1.93Apr‐06 ‐ Mar‐08 8.33 N/A N/A 5.56E‐04 3.19 N/A 0.79 N/A 4.64 2.82 2.58 N/A 43.68 136.77 0.46 1.82May‐06 ‐ Apr‐08 8.27 N/A N/A 5.44E‐04 3.17 N/A 0.77 N/A 4.61 2.80 2.56 N/A 43.39 133.75 0.45 1.81Jun‐06 ‐ May‐08 8.16 N/A N/A 5.27E‐04 3.13 N/A 0.74 N/A 4.55 2.76 2.53 N/A 42.83 129.58 0.45 1.79Jul‐06 ‐ Jun‐08 8.02 N/A N/A 5.09E‐04 3.08 N/A 0.72 N/A 4.47 2.71 2.48 N/A 42.09 125.10 0.44 1.76Aug‐06 ‐ Jul‐08 7.93 N/A N/A 4.93E‐04 3.04 N/A 0.70 N/A 4.42 2.68 2.45 N/A 41.58 121.20 0.43 1.74Sep‐06 ‐ Aug‐08 7.97 N/A N/A 4.87E‐04 3.06 N/A 0.69 N/A 4.44 2.70 2.47 N/A 41.82 119.62 0.44 1.75Oct‐06 ‐ Sep‐08 7.68 N/A N/A 4.60E‐04 2.95 N/A 0.65 N/A 4.28 2.60 2.38 N/A 40.31 113.10 0.42 1.68Nov‐06 ‐ Oct‐08 7.43 N/A N/A 4.37E‐04 2.85 N/A 0.62 N/A 4.14 2.52 2.30 N/A 39.01 107.40 0.41 1.63Dec‐06 ‐ Nov‐08 7.45 N/A N/A 4.30E‐04 2.86 N/A 0.61 N/A 4.15 2.52 2.31 N/A 39.07 105.81 0.41 1.63Jan‐07 ‐ Dec‐08 7.41 N/A N/A 4.22E‐04 2.84 N/A 0.60 N/A 4.13 2.51 2.29 N/A 38.86 103.65 0.41 1.62Feb‐07 ‐ Jan‐09 7.27 N/A N/A 4.16E‐04 2.79 N/A 0.59 N/A 4.05 2.46 2.25 N/A 38.15 102.32 0.40 1.59Mar‐07 ‐ Feb‐09 7.26 N/A N/A 4.18E‐04 2.78 N/A 0.59 N/A 4.05 2.45 2.25 N/A 38.07 102.71 0.40 1.59Apr‐07 ‐ Mar‐09 7.30 N/A N/A 4.23E‐04 2.80 N/A 0.60 N/A 4.07 2.47 2.26 N/A 38.32 104.10 0.40 1.60May‐07 ‐ Apr‐09 7.45 N/A N/A 4.35E‐04 2.86 N/A 0.61 N/A 4.15 2.52 2.31 N/A 39.07 106.90 0.41 1.63Jun‐07 ‐ May‐09 7.34 N/A N/A 4.32E‐04 2.82 N/A 0.61 N/A 4.09 2.48 2.27 N/A 38.52 106.16 0.40 1.61Jul‐07 ‐ Jun‐09 7.33 N/A N/A 4.34E‐04 2.81 N/A 0.61 N/A 4.09 2.48 2.27 N/A 38.47 106.73 0.40 1.61Aug‐07 ‐ Jul‐09 7.35 N/A N/A 4.38E‐04 2.82 N/A 0.62 N/A 4.10 2.49 2.28 N/A 38.57 107.81 0.40 1.61Sep‐07 ‐ Aug‐09 7.20 N/A N/A 4.33E‐04 2.76 N/A 0.61 N/A 4.01 2.43 2.23 N/A 37.75 106.52 0.39 1.58Oct‐07 ‐ Sep‐09 7.20 N/A N/A 4.36E‐04 2.76 N/A 0.62 N/A 4.02 2.44 2.23 N/A 37.80 107.30 0.39 1.58Nov‐07 ‐ Oct‐09 7.29 N/A N/A 4.44E‐04 2.79 N/A 0.63 N/A 4.06 2.47 2.26 N/A 38.22 109.22 0.40 1.60Dec‐07 ‐ Nov‐09 7.41 N/A N/A 4.54E‐04 2.84 N/A 0.64 N/A 4.13 2.51 2.29 N/A 38.89 111.58 0.41 1.62Jan‐08 ‐ Dec‐09 7.46 N/A N/A 4.59E‐04 2.86 N/A 0.65 N/A 4.16 2.52 2.31 N/A 39.12 112.79 0.41 1.63Feb‐08 ‐ Jan‐10 7.68 N/A N/A 4.76E‐04 2.94 N/A 0.67 N/A 4.28 2.60 2.38 N/A 40.28 116.94 0.42 1.68Mar‐08 ‐ Feb‐10 7.64 N/A N/A 4.76E‐04 2.93 N/A 0.67 N/A 4.26 2.59 2.37 N/A 40.08 116.94 0.42 1.67Apr‐08 ‐ Mar‐10 7.91 N/A N/A 4.96E‐04 3.03 N/A 0.70 N/A 4.41 2.68 2.45 N/A 41.49 121.87 0.43 1.73May‐08 ‐ Apr‐10 7.93 N/A N/A 5.01E‐04 3.04 N/A 0.71 N/A 4.42 2.68 2.45 N/A 41.60 123.28 0.43 1.74Jun‐08 ‐ May‐10 7.91 N/A N/A 5.05E‐04 3.04 N/A 0.71 N/A 4.41 2.68 2.45 N/A 41.52 124.12 0.43 1.73Jul‐08 ‐ Jun‐10 7.98 N/A N/A 5.14E‐04 3.06 N/A 0.73 N/A 4.45 2.70 2.47 N/A 41.89 126.29 0.44 1.75Aug‐08 ‐ Jul‐10 8.03 N/A N/A 5.21E‐04 3.08 N/A 0.74 N/A 4.48 2.72 2.49 N/A 42.15 128.22 0.44 1.76Sep‐08 ‐ Aug‐10 7.54 N/A N/A 4.92E‐04 2.89 N/A 0.70 N/A 4.20 2.55 2.33 N/A 39.57 121.03 0.41 1.65Oct‐08 ‐ Sep‐10 7.60 N/A N/A 4.98E‐04 2.91 N/A 0.70 N/A 4.24 2.57 2.35 N/A 39.87 122.48 0.42 1.67Nov‐08 ‐ Oct‐10 7.87 N/A N/A 5.19E‐04 3.02 N/A 0.73 N/A 4.39 2.66 2.44 N/A 41.31 127.70 0.43 1.73Dec‐08 ‐ Nov‐10 7.83 N/A N/A 5.21E‐04 3.00 N/A 0.74 N/A 4.37 2.65 2.43 N/A 41.10 127.98 0.43 1.72Jan‐09 ‐ Dec‐10 7.87 N/A N/A 5.26E‐04 3.02 N/A 0.74 N/A 4.39 2.66 2.44 N/A 41.29 129.34 0.43 1.72Feb‐09 ‐ Jan‐11 8.00 N/A N/A 5.44E‐04 3.07 N/A 0.77 N/A 4.46 2.71 2.48 N/A 41.97 133.82 0.44 1.75Mar‐09 ‐ Feb‐11 8.05 N/A N/A 5.57E‐04 3.09 N/A 0.79 N/A 4.49 2.72 2.49 N/A 42.25 136.92 0.44 1.76Apr‐09 ‐ Mar‐11 8.14 N/A N/A 5.74E‐04 3.12 N/A 0.81 N/A 4.54 2.75 2.52 N/A 42.68 141.17 0.45 1.78May‐09 ‐ Apr‐11 8.20 N/A N/A 5.92E‐04 3.15 N/A 0.84 N/A 4.57 2.77 2.54 N/A 43.03 145.47 0.45 1.80Jun‐09 ‐ May‐11 8.40 N/A N/A 6.18E‐04 3.22 N/A 0.87 N/A 4.68 2.84 2.60 N/A 44.05 151.94 0.46 1.84Jul‐09 ‐ Jun‐11 8.49 N/A N/A 6.35E‐04 3.25 N/A 0.90 N/A 4.73 2.87 2.63 N/A 44.52 156.18 0.46 1.86Aug‐09 ‐ Jul‐11 8.44 N/A N/A 6.42E‐04 3.24 N/A 0.91 N/A 4.71 2.86 2.61 N/A 44.30 157.83 0.46 1.85Sep‐09 ‐ Aug‐11 8.49 N/A N/A 6.56E‐04 3.25 N/A 0.93 N/A 4.73 2.87 2.63 N/A 44.52 161.40 0.46 1.86Oct‐09 ‐ Sep‐11 8.46 N/A N/A 6.62E‐04 3.24 N/A 0.94 N/A 4.72 2.86 2.62 N/A 44.37 162.89 0.46 1.85Nov‐09 ‐ Oct‐11 8.45 N/A N/A 6.72E‐04 3.24 N/A 0.95 N/A 4.71 2.86 2.62 N/A 44.32 165.28 0.46 1.85Dec‐09 ‐ Nov‐11 8.32 N/A N/A 6.69E‐04 3.19 N/A 0.95 N/A 4.64 2.81 2.58 N/A 43.64 164.54 0.46 1.82Jan‐10 ‐ Dec‐11 8.41 N/A N/A 6.86E‐04 3.23 N/A 0.97 N/A 4.69 2.85 2.60 N/A 44.14 168.58 0.46 1.84
TrinityConsultants Page8of37AugustaExpansionProjectEmissionsAnalysis(20130306JF)
24‐MonRollingAvg‐Kiln1

AppendixB‐EmissionCalculationsWestFraser‐Augusta,Georgia
TableB‐7.BaselineMonthlyEmissionsforKiln2(tonspermonth)
Month CO Fluorides H2S Lead NOX
ReducedSulfurCompounds
(includingH2S) SO2 H2SO4 TotalPM TotalPM10 TotalPM2.5
TotalReducedSulfur
(includingH2S) TotalVOC CO2ebiomassdeferral Formaldehyde Methanol
Jan‐02 1.28 N/A N/A 1.14E‐04 0.49 N/A 0.16 N/A 0.71 0.43 0.40 N/A 6.70 28.06 0.07 0.28Feb‐02 1.10 N/A N/A 9.85E‐05 0.42 N/A 0.14 N/A 0.61 0.37 0.34 N/A 5.78 24.21 0.06 0.24Mar‐02 1.12 N/A N/A 1.00E‐04 0.43 N/A 0.14 N/A 0.63 0.38 0.35 N/A 5.89 24.64 0.06 0.25Apr‐02 1.29 N/A N/A 1.15E‐04 0.49 N/A 0.16 N/A 0.72 0.44 0.40 N/A 6.77 28.33 0.07 0.28May‐02 1.37 N/A N/A 1.22E‐04 0.52 N/A 0.17 N/A 0.76 0.46 0.42 N/A 7.18 30.06 0.07 0.30Jun‐02 1.27 N/A N/A 1.14E‐04 0.49 N/A 0.16 N/A 0.71 0.43 0.39 N/A 6.68 27.95 0.07 0.28Jul‐02 0.85 N/A N/A 7.58E‐05 0.33 N/A 0.11 N/A 0.47 0.29 0.26 N/A 4.45 18.63 0.05 0.19Aug‐02 1.55 N/A N/A 1.38E‐04 0.59 N/A 0.20 N/A 0.86 0.52 0.48 N/A 8.13 34.02 0.08 0.34Sep‐02 1.29 N/A N/A 1.15E‐04 0.49 N/A 0.16 N/A 0.72 0.44 0.40 N/A 6.76 28.28 0.07 0.28Oct‐02 1.22 N/A N/A 1.09E‐04 0.47 N/A 0.15 N/A 0.68 0.41 0.38 N/A 6.42 26.88 0.07 0.27Nov‐02 1.19 N/A N/A 1.06E‐04 0.46 N/A 0.15 N/A 0.66 0.40 0.37 N/A 6.23 26.09 0.07 0.26Dec‐02 0.82 N/A N/A 7.35E‐05 0.32 N/A 0.10 N/A 0.46 0.28 0.25 N/A 4.32 18.07 0.05 0.18Jan‐03 0.99 N/A N/A 9.13E‐05 0.38 N/A 0.13 N/A 0.55 0.33 0.31 N/A 5.18 22.45 0.05 0.22Feb‐03 1.10 N/A N/A 1.02E‐04 0.42 N/A 0.14 N/A 0.61 0.37 0.34 N/A 5.78 25.04 0.06 0.24Mar‐03 1.11 N/A N/A 1.03E‐04 0.43 N/A 0.14 N/A 0.62 0.38 0.34 N/A 5.82 25.24 0.06 0.24Apr‐03 0.98 N/A N/A 9.05E‐05 0.38 N/A 0.13 N/A 0.55 0.33 0.30 N/A 5.14 22.26 0.05 0.21May‐03 1.37 N/A N/A 1.26E‐04 0.52 N/A 0.18 N/A 0.76 0.46 0.42 N/A 7.17 31.10 0.07 0.30Jun‐03 1.26 N/A N/A 1.17E‐04 0.48 N/A 0.16 N/A 0.70 0.43 0.39 N/A 6.61 28.66 0.07 0.28Jul‐03 1.29 N/A N/A 1.20E‐04 0.50 N/A 0.17 N/A 0.72 0.44 0.40 N/A 6.78 29.39 0.07 0.28Aug‐03 1.10 N/A N/A 1.02E‐04 0.42 N/A 0.14 N/A 0.61 0.37 0.34 N/A 5.77 25.03 0.06 0.24Sep‐03 1.06 N/A N/A 9.84E‐05 0.41 N/A 0.14 N/A 0.59 0.36 0.33 N/A 5.58 24.20 0.06 0.23Oct‐03 0.71 N/A N/A 6.54E‐05 0.27 N/A 0.09 N/A 0.39 0.24 0.22 N/A 3.71 16.08 0.04 0.15Nov‐03 1.31 N/A N/A 1.21E‐04 0.50 N/A 0.17 N/A 0.73 0.44 0.41 N/A 6.88 29.82 0.07 0.29Dec‐03 0.72 N/A N/A 6.69E‐05 0.28 N/A 0.09 N/A 0.40 0.24 0.22 N/A 3.79 16.44 0.04 0.16Jan‐04 1.07 N/A N/A 9.54E‐05 0.41 N/A 0.13 N/A 0.60 0.36 0.33 N/A 5.61 23.44 0.06 0.23Feb‐04 0.99 N/A N/A 8.82E‐05 0.38 N/A 0.12 N/A 0.55 0.33 0.31 N/A 5.19 21.70 0.05 0.22Mar‐04 1.48 N/A N/A 1.32E‐04 0.57 N/A 0.19 N/A 0.83 0.50 0.46 N/A 7.79 32.52 0.08 0.33Apr‐04 1.12 N/A N/A 9.97E‐05 0.43 N/A 0.14 N/A 0.62 0.38 0.35 N/A 5.87 24.51 0.06 0.25May‐04 1.56 N/A N/A 1.39E‐04 0.60 N/A 0.20 N/A 0.87 0.53 0.48 N/A 8.20 34.25 0.09 0.34Jun‐04 1.16 N/A N/A 1.04E‐04 0.45 N/A 0.15 N/A 0.65 0.39 0.36 N/A 6.09 25.45 0.06 0.25Jul‐04 0.59 N/A N/A 5.26E‐05 0.23 N/A 0.07 N/A 0.33 0.20 0.18 N/A 3.10 12.94 0.03 0.13Aug‐04 1.42 N/A N/A 1.26E‐04 0.54 N/A 0.18 N/A 0.79 0.48 0.44 N/A 7.43 31.04 0.08 0.31Sep‐04 0.85 N/A N/A 7.57E‐05 0.33 N/A 0.11 N/A 0.47 0.29 0.26 N/A 4.46 18.62 0.05 0.19Oct‐04 1.26 N/A N/A 1.12E‐04 0.48 N/A 0.16 N/A 0.70 0.43 0.39 N/A 6.61 27.61 0.07 0.28Nov‐04 1.06 N/A N/A 9.44E‐05 0.41 N/A 0.13 N/A 0.59 0.36 0.33 N/A 5.56 23.22 0.06 0.23Dec‐04 1.25 N/A N/A 1.11E‐04 0.48 N/A 0.16 N/A 0.70 0.42 0.39 N/A 6.55 27.37 0.07 0.27Jan‐05 1.13 N/A N/A 1.01E‐04 0.43 N/A 0.14 N/A 0.63 0.38 0.35 N/A 5.92 24.83 0.06 0.25Feb‐05 0.85 N/A N/A 7.57E‐05 0.32 N/A 0.11 N/A 0.47 0.29 0.26 N/A 4.44 18.62 0.05 0.19Mar‐05 1.44 N/A N/A 1.29E‐04 0.55 N/A 0.18 N/A 0.80 0.49 0.44 N/A 7.54 31.64 0.08 0.31Apr‐05 1.42 N/A N/A 1.28E‐04 0.55 N/A 0.18 N/A 0.79 0.48 0.44 N/A 7.47 31.35 0.08 0.31May‐05 1.29 N/A N/A 1.16E‐04 0.50 N/A 0.16 N/A 0.72 0.44 0.40 N/A 6.78 28.45 0.07 0.28Jun‐05 1.34 N/A N/A 1.20E‐04 0.52 N/A 0.17 N/A 0.75 0.45 0.42 N/A 7.05 29.57 0.07 0.29Jul‐05 1.43 N/A N/A 1.28E‐04 0.55 N/A 0.18 N/A 0.80 0.48 0.44 N/A 7.52 31.54 0.08 0.31Aug‐05 1.28 N/A N/A 1.14E‐04 0.49 N/A 0.16 N/A 0.71 0.43 0.40 N/A 6.69 28.10 0.07 0.28
TrinityConsultants Page9of37AugustaExpansionProjectEmissionsAnalysis(20130306JF)
Kiln2Emissions

AppendixB‐EmissionCalculationsWestFraser‐Augusta,Georgia
TableB‐7.BaselineMonthlyEmissionsforKiln2(tonspermonth)
Month CO Fluorides H2S Lead NOX
ReducedSulfurCompounds
(includingH2S) SO2 H2SO4 TotalPM TotalPM10 TotalPM2.5
TotalReducedSulfur
(includingH2S) TotalVOC CO2ebiomassdeferral Formaldehyde Methanol
Sep‐05 1.23 N/A N/A 1.10E‐04 0.47 N/A 0.16 N/A 0.69 0.42 0.38 N/A 6.46 27.11 0.07 0.27Oct‐05 1.16 N/A N/A 1.04E‐04 0.45 N/A 0.15 N/A 0.65 0.39 0.36 N/A 6.11 25.64 0.06 0.26Nov‐05 0.95 N/A N/A 8.48E‐05 0.36 N/A 0.12 N/A 0.53 0.32 0.29 N/A 4.97 20.85 0.05 0.21Dec‐05 1.29 N/A N/A 1.15E‐04 0.49 N/A 0.16 N/A 0.72 0.44 0.40 N/A 6.76 28.36 0.07 0.28Jan‐06 1.06 N/A N/A 8.44E‐05 0.40 N/A 0.12 N/A 0.59 0.36 0.33 N/A 5.54 20.76 0.06 0.23Feb‐06 1.03 N/A N/A 8.24E‐05 0.40 N/A 0.12 N/A 0.57 0.35 0.32 N/A 5.40 20.26 0.06 0.23Mar‐06 1.46 N/A N/A 1.17E‐04 0.56 N/A 0.17 N/A 0.82 0.50 0.45 N/A 7.68 28.79 0.08 0.32Apr‐06 1.46 N/A N/A 1.17E‐04 0.56 N/A 0.17 N/A 0.82 0.49 0.45 N/A 7.67 28.77 0.08 0.32May‐06 1.30 N/A N/A 1.04E‐04 0.50 N/A 0.15 N/A 0.73 0.44 0.40 N/A 6.83 25.62 0.07 0.29Jun‐06 1.29 N/A N/A 1.03E‐04 0.49 N/A 0.15 N/A 0.72 0.44 0.40 N/A 6.77 25.38 0.07 0.28Jul‐06 1.04 N/A N/A 8.36E‐05 0.40 N/A 0.12 N/A 0.58 0.35 0.32 N/A 5.48 20.55 0.06 0.23Aug‐06 0.85 N/A N/A 6.83E‐05 0.33 N/A 0.10 N/A 0.48 0.29 0.26 N/A 4.48 16.80 0.05 0.19Sep‐06 0.35 N/A N/A 2.82E‐05 0.14 N/A 0.04 N/A 0.20 0.12 0.11 N/A 1.85 6.94 0.02 0.08Oct‐06 0.60 N/A N/A 4.81E‐05 0.23 N/A 0.07 N/A 0.34 0.20 0.19 N/A 3.15 11.83 0.03 0.13Nov‐06 0.90 N/A N/A 7.20E‐05 0.35 N/A 0.10 N/A 0.50 0.30 0.28 N/A 4.72 17.70 0.05 0.20Dec‐06 0.44 N/A N/A 3.52E‐05 0.17 N/A 0.05 N/A 0.25 0.15 0.14 N/A 2.31 8.65 0.02 0.10Jan‐07 1.01 N/A N/A 1.38E‐04 0.39 N/A 0.20 N/A 0.57 0.34 0.31 N/A 5.32 33.97 0.06 0.22Feb‐07 0.94 N/A N/A 1.28E‐04 0.36 N/A 0.18 N/A 0.52 0.32 0.29 N/A 4.93 31.47 0.05 0.21Mar‐07 0.86 N/A N/A 1.18E‐04 0.33 N/A 0.17 N/A 0.48 0.29 0.27 N/A 4.54 28.95 0.05 0.19Apr‐07 1.29 N/A N/A 1.75E‐04 0.49 N/A 0.25 N/A 0.72 0.44 0.40 N/A 6.75 43.09 0.07 0.28May‐07 0.31 N/A N/A 4.28E‐05 0.12 N/A 0.06 N/A 0.18 0.11 0.10 N/A 1.65 10.52 0.02 0.07Jun‐07 1.20 N/A N/A 1.64E‐04 0.46 N/A 0.23 N/A 0.67 0.41 0.37 N/A 6.31 40.26 0.07 0.26Jul‐07 1.25 N/A N/A 1.71E‐04 0.48 N/A 0.24 N/A 0.70 0.42 0.39 N/A 6.58 41.97 0.07 0.27Aug‐07 0.80 N/A N/A 1.09E‐04 0.31 N/A 0.15 N/A 0.44 0.27 0.25 N/A 4.18 26.68 0.04 0.17Sep‐07 1.31 N/A N/A 1.79E‐04 0.50 N/A 0.25 N/A 0.73 0.44 0.41 N/A 6.90 44.01 0.07 0.29Oct‐07 1.21 N/A N/A 1.65E‐04 0.46 N/A 0.23 N/A 0.67 0.41 0.37 N/A 6.35 40.49 0.07 0.27Nov‐07 0.66 N/A N/A 8.94E‐05 0.25 N/A 0.13 N/A 0.37 0.22 0.20 N/A 3.44 21.98 0.04 0.14Dec‐07 1.01 N/A N/A 1.38E‐04 0.39 N/A 0.19 N/A 0.57 0.34 0.31 N/A 5.32 33.93 0.06 0.22Jan‐08 1.15 N/A N/A 2.67E‐04 0.44 N/A 0.38 N/A 0.64 0.39 0.36 N/A 6.05 65.65 0.06 0.25Feb‐08 0.67 N/A N/A 1.55E‐04 0.26 N/A 0.22 N/A 0.37 0.23 0.21 N/A 3.52 38.18 0.04 0.15Mar‐08 0.90 N/A N/A 2.08E‐04 0.34 N/A 0.29 N/A 0.50 0.30 0.28 N/A 4.71 51.06 0.05 0.20Apr‐08 0.00 N/A N/A 0.00E+00 0.00 N/A 0.00 N/A 0.00 0.00 0.00 N/A 0.00 0.00 0.00 0.00May‐08 0.00 N/A N/A 0.00E+00 0.00 N/A 0.00 N/A 0.00 0.00 0.00 N/A 0.00 0.00 0.00 0.00Jun‐08 0.00 N/A N/A 0.00E+00 0.00 N/A 0.00 N/A 0.00 0.00 0.00 N/A 0.00 0.00 0.00 0.00Jul‐08 0.00 N/A N/A 0.00E+00 0.00 N/A 0.00 N/A 0.00 0.00 0.00 N/A 0.00 0.00 0.00 0.00Aug‐08 0.00 N/A N/A 0.00E+00 0.00 N/A 0.00 N/A 0.00 0.00 0.00 N/A 0.00 0.00 0.00 0.00Sep‐08 0.90 N/A N/A 2.09E‐04 0.35 N/A 0.30 N/A 0.50 0.31 0.28 N/A 4.74 51.45 0.05 0.20Oct‐08 1.06 N/A N/A 2.46E‐04 0.41 N/A 0.35 N/A 0.59 0.36 0.33 N/A 5.56 60.37 0.06 0.23Nov‐08 0.34 N/A N/A 7.87E‐05 0.13 N/A 0.11 N/A 0.19 0.12 0.11 N/A 1.78 19.36 0.02 0.07Dec‐08 0.30 N/A N/A 7.05E‐05 0.12 N/A 0.10 N/A 0.17 0.10 0.09 N/A 1.60 17.34 0.02 0.07Jan‐09 0.20 N/A N/A 4.92E‐05 0.08 N/A 0.07 N/A 0.11 0.07 0.06 N/A 1.06 12.10 0.01 0.04Feb‐09 0.00 N/A N/A 0.00E+00 0.00 N/A 0.00 N/A 0.00 0.00 0.00 N/A 0.00 0.00 0.00 0.00Mar‐09 0.81 N/A N/A 1.97E‐04 0.31 N/A 0.28 N/A 0.45 0.27 0.25 N/A 4.25 48.34 0.04 0.18Apr‐09 0.61 N/A N/A 1.48E‐04 0.23 N/A 0.21 N/A 0.34 0.21 0.19 N/A 3.19 36.28 0.03 0.13May‐09 0.71 N/A N/A 1.72E‐04 0.27 N/A 0.24 N/A 0.39 0.24 0.22 N/A 3.72 42.26 0.04 0.16Jun‐09 0.86 N/A N/A 2.09E‐04 0.33 N/A 0.30 N/A 0.48 0.29 0.27 N/A 4.52 51.35 0.05 0.19Jul‐09 0.41 N/A N/A 9.84E‐05 0.16 N/A 0.14 N/A 0.23 0.14 0.13 N/A 2.13 24.20 0.02 0.09Aug‐09 0.76 N/A N/A 1.84E‐04 0.29 N/A 0.26 N/A 0.42 0.26 0.24 N/A 3.99 45.36 0.04 0.17
TrinityConsultants Page10of37AugustaExpansionProjectEmissionsAnalysis(20130306JF)
Kiln2Emissions
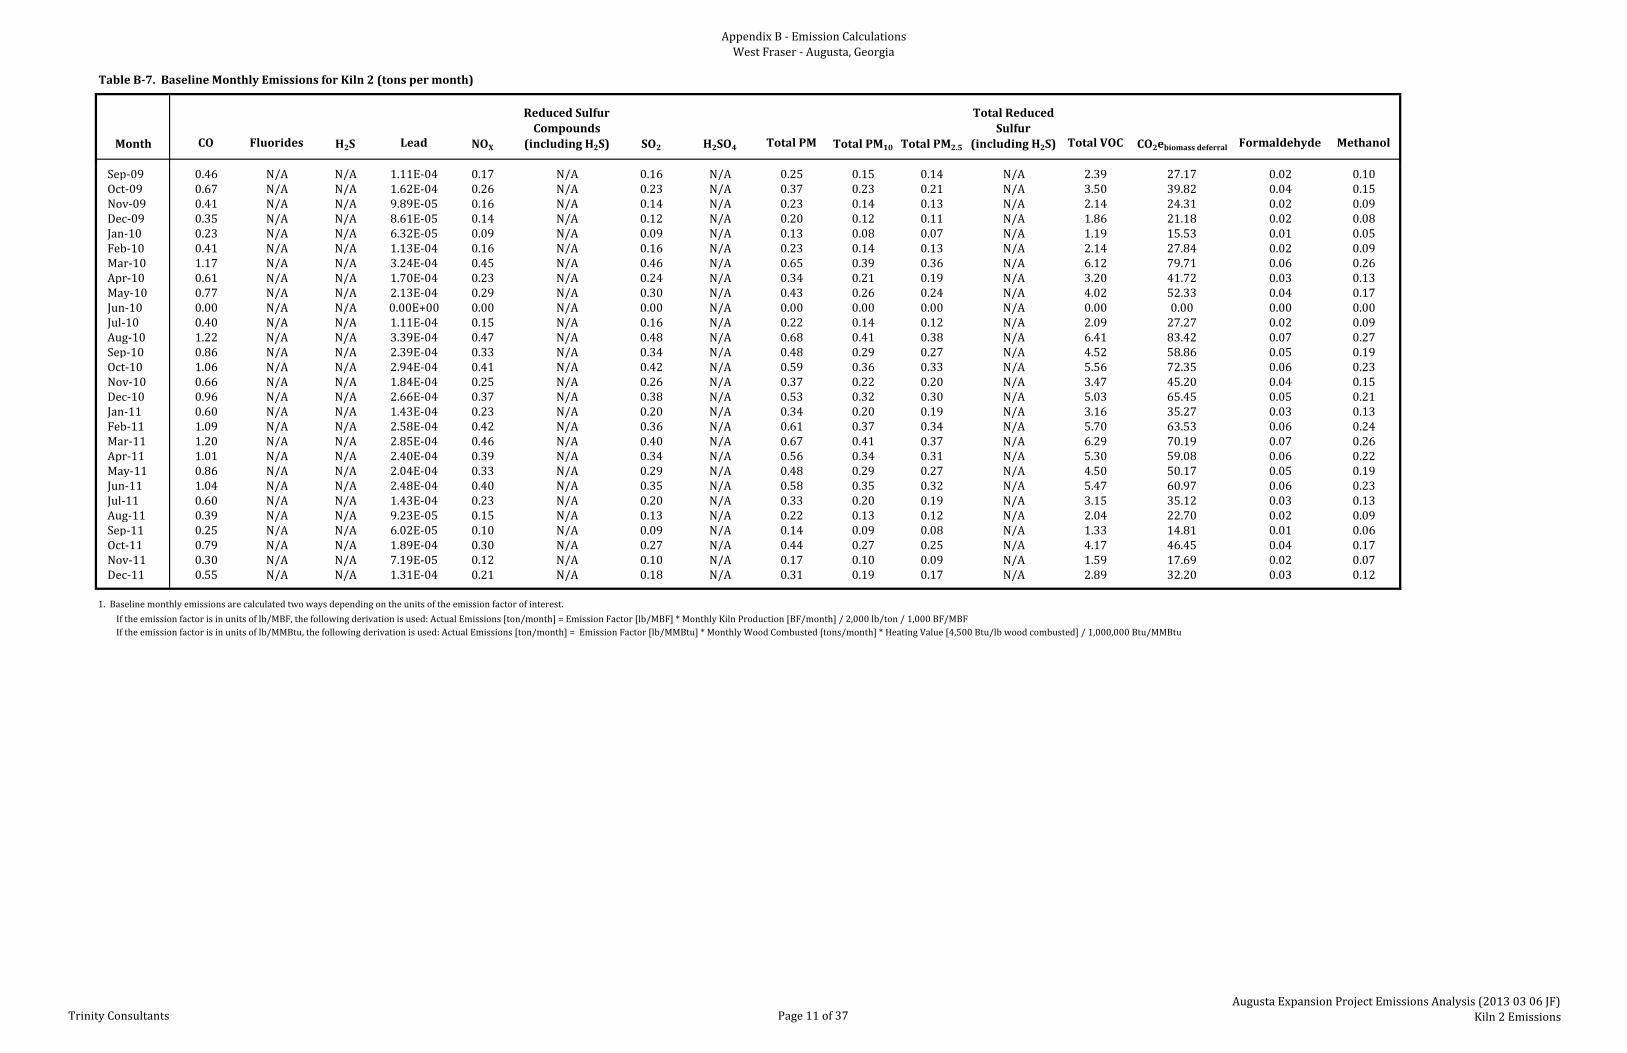
AppendixB‐EmissionCalculationsWestFraser‐Augusta,Georgia
TableB‐7.BaselineMonthlyEmissionsforKiln2(tonspermonth)
Month CO Fluorides H2S Lead NOX
ReducedSulfurCompounds
(includingH2S) SO2 H2SO4 TotalPM TotalPM10 TotalPM2.5
TotalReducedSulfur
(includingH2S) TotalVOC CO2ebiomassdeferral Formaldehyde Methanol
Sep‐09 0.46 N/A N/A 1.11E‐04 0.17 N/A 0.16 N/A 0.25 0.15 0.14 N/A 2.39 27.17 0.02 0.10Oct‐09 0.67 N/A N/A 1.62E‐04 0.26 N/A 0.23 N/A 0.37 0.23 0.21 N/A 3.50 39.82 0.04 0.15Nov‐09 0.41 N/A N/A 9.89E‐05 0.16 N/A 0.14 N/A 0.23 0.14 0.13 N/A 2.14 24.31 0.02 0.09Dec‐09 0.35 N/A N/A 8.61E‐05 0.14 N/A 0.12 N/A 0.20 0.12 0.11 N/A 1.86 21.18 0.02 0.08Jan‐10 0.23 N/A N/A 6.32E‐05 0.09 N/A 0.09 N/A 0.13 0.08 0.07 N/A 1.19 15.53 0.01 0.05Feb‐10 0.41 N/A N/A 1.13E‐04 0.16 N/A 0.16 N/A 0.23 0.14 0.13 N/A 2.14 27.84 0.02 0.09Mar‐10 1.17 N/A N/A 3.24E‐04 0.45 N/A 0.46 N/A 0.65 0.39 0.36 N/A 6.12 79.71 0.06 0.26Apr‐10 0.61 N/A N/A 1.70E‐04 0.23 N/A 0.24 N/A 0.34 0.21 0.19 N/A 3.20 41.72 0.03 0.13May‐10 0.77 N/A N/A 2.13E‐04 0.29 N/A 0.30 N/A 0.43 0.26 0.24 N/A 4.02 52.33 0.04 0.17Jun‐10 0.00 N/A N/A 0.00E+00 0.00 N/A 0.00 N/A 0.00 0.00 0.00 N/A 0.00 0.00 0.00 0.00Jul‐10 0.40 N/A N/A 1.11E‐04 0.15 N/A 0.16 N/A 0.22 0.14 0.12 N/A 2.09 27.27 0.02 0.09Aug‐10 1.22 N/A N/A 3.39E‐04 0.47 N/A 0.48 N/A 0.68 0.41 0.38 N/A 6.41 83.42 0.07 0.27Sep‐10 0.86 N/A N/A 2.39E‐04 0.33 N/A 0.34 N/A 0.48 0.29 0.27 N/A 4.52 58.86 0.05 0.19Oct‐10 1.06 N/A N/A 2.94E‐04 0.41 N/A 0.42 N/A 0.59 0.36 0.33 N/A 5.56 72.35 0.06 0.23Nov‐10 0.66 N/A N/A 1.84E‐04 0.25 N/A 0.26 N/A 0.37 0.22 0.20 N/A 3.47 45.20 0.04 0.15Dec‐10 0.96 N/A N/A 2.66E‐04 0.37 N/A 0.38 N/A 0.53 0.32 0.30 N/A 5.03 65.45 0.05 0.21Jan‐11 0.60 N/A N/A 1.43E‐04 0.23 N/A 0.20 N/A 0.34 0.20 0.19 N/A 3.16 35.27 0.03 0.13Feb‐11 1.09 N/A N/A 2.58E‐04 0.42 N/A 0.36 N/A 0.61 0.37 0.34 N/A 5.70 63.53 0.06 0.24Mar‐11 1.20 N/A N/A 2.85E‐04 0.46 N/A 0.40 N/A 0.67 0.41 0.37 N/A 6.29 70.19 0.07 0.26Apr‐11 1.01 N/A N/A 2.40E‐04 0.39 N/A 0.34 N/A 0.56 0.34 0.31 N/A 5.30 59.08 0.06 0.22May‐11 0.86 N/A N/A 2.04E‐04 0.33 N/A 0.29 N/A 0.48 0.29 0.27 N/A 4.50 50.17 0.05 0.19Jun‐11 1.04 N/A N/A 2.48E‐04 0.40 N/A 0.35 N/A 0.58 0.35 0.32 N/A 5.47 60.97 0.06 0.23Jul‐11 0.60 N/A N/A 1.43E‐04 0.23 N/A 0.20 N/A 0.33 0.20 0.19 N/A 3.15 35.12 0.03 0.13Aug‐11 0.39 N/A N/A 9.23E‐05 0.15 N/A 0.13 N/A 0.22 0.13 0.12 N/A 2.04 22.70 0.02 0.09Sep‐11 0.25 N/A N/A 6.02E‐05 0.10 N/A 0.09 N/A 0.14 0.09 0.08 N/A 1.33 14.81 0.01 0.06Oct‐11 0.79 N/A N/A 1.89E‐04 0.30 N/A 0.27 N/A 0.44 0.27 0.25 N/A 4.17 46.45 0.04 0.17Nov‐11 0.30 N/A N/A 7.19E‐05 0.12 N/A 0.10 N/A 0.17 0.10 0.09 N/A 1.59 17.69 0.02 0.07Dec‐11 0.55 N/A N/A 1.31E‐04 0.21 N/A 0.18 N/A 0.31 0.19 0.17 N/A 2.89 32.20 0.03 0.12
1.Baselinemonthlyemissionsarecalculatedtwowaysdependingontheunitsoftheemissionfactorofinterest.
Iftheemissionfactorisinunitsoflb/MBF,thefollowingderivationisused:ActualEmissions[ton/month]=EmissionFactor[lb/MBF]*MonthlyKilnProduction[BF/month]/2,000lb/ton/1,000BF/MBFIftheemissionfactorisinunitsoflb/MMBtu,thefollowingderivationisused:ActualEmissions[ton/month]=EmissionFactor[lb/MMBtu]*MonthlyWoodCombusted[tons/month]*HeatingValue[4,500Btu/lbwoodcombusted]/1,000,000Btu/MMBtu
TrinityConsultants Page11of37AugustaExpansionProjectEmissionsAnalysis(20130306JF)
Kiln2Emissions

AppendixB‐EmissionCalculationsWestFraser‐Augusta,Georgia
TableB‐8.Total24‐MonthRollingAverageActualAnnualEmissionsforKiln2(tpy)
CO Fluorides H2S Lead NOX
ReducedSulfurCompounds
(includingH2S) SO2 H2SO4 TotalPM TotalPM10 TotalPM2.5
TotalReducedSulfur
(includingH2S) TotalVOC CO2ebiomassdeferral Formaldehyde Methanol
Jan‐02 ‐ Dec‐03 13.68 N/A N/A 1.24E‐03 5.25 N/A 1.75 N/A 7.63 4.63 4.23 N/A 71.76 305.47 0.75 3.00Feb‐02 ‐ Jan‐04 13.57 N/A N/A 1.23E‐03 5.21 N/A 1.74 N/A 7.57 4.59 4.20 N/A 71.22 303.16 0.74 2.98Mar‐02 ‐ Feb‐04 13.52 N/A N/A 1.23E‐03 5.18 N/A 1.73 N/A 7.54 4.57 4.19 N/A 70.92 301.90 0.74 2.96Apr‐02 ‐ Mar‐04 13.70 N/A N/A 1.24E‐03 5.25 N/A 1.76 N/A 7.64 4.64 4.24 N/A 71.87 305.84 0.75 3.00May‐02 ‐ Apr‐04 13.61 N/A N/A 1.24E‐03 5.22 N/A 1.75 N/A 7.59 4.61 4.21 N/A 71.42 303.93 0.75 2.98Jun‐02 ‐ May‐04 13.71 N/A N/A 1.24E‐03 5.26 N/A 1.76 N/A 7.64 4.64 4.24 N/A 71.93 306.03 0.75 3.01Jul‐02 ‐ Jun‐04 13.65 N/A N/A 1.24E‐03 5.24 N/A 1.75 N/A 7.61 4.62 4.23 N/A 71.64 304.78 0.75 2.99Aug‐02 ‐ Jul‐04 13.53 N/A N/A 1.23E‐03 5.19 N/A 1.73 N/A 7.54 4.58 4.19 N/A 70.97 301.94 0.74 2.96Sep‐02 ‐ Aug‐04 13.46 N/A N/A 1.22E‐03 5.16 N/A 1.73 N/A 7.50 4.55 4.17 N/A 70.62 300.45 0.74 2.95Oct‐02 ‐ Sep‐04 13.24 N/A N/A 1.20E‐03 5.08 N/A 1.70 N/A 7.38 4.48 4.10 N/A 69.47 295.61 0.73 2.90Nov‐02 ‐ Oct‐04 13.26 N/A N/A 1.20E‐03 5.09 N/A 1.70 N/A 7.39 4.49 4.10 N/A 69.56 295.98 0.73 2.91Dec‐02 ‐ Nov‐04 13.19 N/A N/A 1.20E‐03 5.06 N/A 1.69 N/A 7.36 4.46 4.08 N/A 69.23 294.54 0.72 2.89Jan‐03 ‐ Dec‐04 13.41 N/A N/A 1.22E‐03 5.14 N/A 1.72 N/A 7.48 4.54 4.15 N/A 70.34 299.18 0.73 2.94Feb‐03 ‐ Jan‐05 13.48 N/A N/A 1.22E‐03 5.17 N/A 1.73 N/A 7.51 4.56 4.17 N/A 70.71 300.37 0.74 2.95Mar‐03 ‐ Feb‐05 13.35 N/A N/A 1.21E‐03 5.12 N/A 1.71 N/A 7.44 4.52 4.13 N/A 70.04 297.16 0.73 2.93Apr‐03 ‐ Mar‐05 13.51 N/A N/A 1.22E‐03 5.18 N/A 1.73 N/A 7.53 4.57 4.18 N/A 70.90 300.36 0.74 2.96May‐03 ‐ Apr‐05 13.74 N/A N/A 1.24E‐03 5.27 N/A 1.75 N/A 7.66 4.65 4.25 N/A 72.07 304.90 0.75 3.01Jun‐03 ‐ May‐05 13.70 N/A N/A 1.23E‐03 5.25 N/A 1.74 N/A 7.64 4.63 4.24 N/A 71.87 303.58 0.75 3.00Jul‐03 ‐ Jun‐05 13.74 N/A N/A 1.24E‐03 5.27 N/A 1.75 N/A 7.66 4.65 4.25 N/A 72.08 304.04 0.75 3.01Aug‐03 ‐ Jul‐05 13.81 N/A N/A 1.24E‐03 5.30 N/A 1.75 N/A 7.70 4.67 4.28 N/A 72.45 305.11 0.76 3.03Sep‐03 ‐ Aug‐05 13.90 N/A N/A 1.25E‐03 5.33 N/A 1.76 N/A 7.75 4.70 4.30 N/A 72.91 306.65 0.76 3.05Oct‐03 ‐ Sep‐05 13.98 N/A N/A 1.25E‐03 5.36 N/A 1.77 N/A 7.79 4.73 4.33 N/A 73.35 308.10 0.77 3.06Nov‐03 ‐ Oct‐05 14.21 N/A N/A 1.27E‐03 5.45 N/A 1.80 N/A 7.92 4.81 4.40 N/A 74.55 312.88 0.78 3.11Dec‐03 ‐ Nov‐05 14.03 N/A N/A 1.25E‐03 5.38 N/A 1.77 N/A 7.82 4.75 4.34 N/A 73.59 308.40 0.77 3.07Jan‐04 ‐ Dec‐05 14.31 N/A N/A 1.28E‐03 5.49 N/A 1.81 N/A 7.98 4.84 4.43 N/A 75.07 314.35 0.78 3.14Feb‐04 ‐ Jan‐06 14.30 N/A N/A 1.27E‐03 5.49 N/A 1.80 N/A 7.97 4.84 4.43 N/A 75.04 313.01 0.78 3.13Mar‐04 ‐ Feb‐06 14.32 N/A N/A 1.27E‐03 5.49 N/A 1.79 N/A 7.99 4.85 4.43 N/A 75.14 312.29 0.78 3.14Apr‐04 ‐ Mar‐06 14.31 N/A N/A 1.26E‐03 5.49 N/A 1.78 N/A 7.98 4.84 4.43 N/A 75.09 310.43 0.78 3.14May‐04 ‐ Apr‐06 14.48 N/A N/A 1.27E‐03 5.56 N/A 1.80 N/A 8.08 4.90 4.48 N/A 75.99 312.56 0.79 3.17Jun‐04 ‐ May‐06 14.35 N/A N/A 1.25E‐03 5.51 N/A 1.77 N/A 8.00 4.86 4.44 N/A 75.31 308.25 0.79 3.15Jul‐04 ‐ Jun‐06 14.42 N/A N/A 1.25E‐03 5.53 N/A 1.77 N/A 8.04 4.88 4.46 N/A 75.65 308.21 0.79 3.16Aug‐04 ‐ Jul‐06 14.65 N/A N/A 1.27E‐03 5.62 N/A 1.79 N/A 8.17 4.96 4.53 N/A 76.84 312.02 0.80 3.21Sep‐04 ‐ Aug‐06 14.36 N/A N/A 1.24E‐03 5.51 N/A 1.75 N/A 8.01 4.86 4.45 N/A 75.36 304.90 0.79 3.15Oct‐04 ‐ Sep‐06 14.12 N/A N/A 1.22E‐03 5.41 N/A 1.72 N/A 7.87 4.78 4.37 N/A 74.06 299.06 0.77 3.09Nov‐04 ‐ Oct‐06 13.79 N/A N/A 1.18E‐03 5.29 N/A 1.67 N/A 7.69 4.66 4.27 N/A 72.33 291.17 0.76 3.02Dec‐04 ‐ Nov‐06 13.71 N/A N/A 1.17E‐03 5.26 N/A 1.66 N/A 7.64 4.64 4.24 N/A 71.91 288.41 0.75 3.00Jan‐05 ‐ Dec‐06 13.30 N/A N/A 1.13E‐03 5.10 N/A 1.60 N/A 7.42 4.50 4.12 N/A 69.79 279.05 0.73 2.92Feb‐05 ‐ Jan‐07 13.25 N/A N/A 1.15E‐03 5.08 N/A 1.63 N/A 7.38 4.48 4.10 N/A 69.49 283.62 0.73 2.90Mar‐05 ‐ Feb‐07 13.29 N/A N/A 1.18E‐03 5.10 N/A 1.67 N/A 7.41 4.50 4.12 N/A 69.74 290.05 0.73 2.91Apr‐05 ‐ Mar‐07 13.01 N/A N/A 1.17E‐03 4.99 N/A 1.66 N/A 7.25 4.40 4.03 N/A 68.24 288.71 0.71 2.85May‐05 ‐ Apr‐07 12.94 N/A N/A 1.20E‐03 4.96 N/A 1.69 N/A 7.21 4.38 4.01 N/A 67.88 294.58 0.71 2.84Jun‐05 ‐ May‐07 12.45 N/A N/A 1.16E‐03 4.78 N/A 1.64 N/A 6.94 4.21 3.85 N/A 65.32 285.61 0.68 2.73Jul‐05 ‐ Jun‐07 12.38 N/A N/A 1.18E‐03 4.75 N/A 1.67 N/A 6.90 4.19 3.83 N/A 64.95 290.96 0.68 2.71Aug‐05 ‐ Jul‐07 12.29 N/A N/A 1.20E‐03 4.71 N/A 1.70 N/A 6.85 4.16 3.80 N/A 64.48 296.17 0.67 2.69Sep‐05 ‐ Aug‐07 12.05 N/A N/A 1.20E‐03 4.62 N/A 1.70 N/A 6.72 4.08 3.73 N/A 63.22 295.46 0.66 2.64Oct‐05 ‐ Sep‐07 12.09 N/A N/A 1.24E‐03 4.64 N/A 1.75 N/A 6.74 4.09 3.74 N/A 63.44 303.91 0.66 2.65Nov‐05 ‐ Oct‐07 12.11 N/A N/A 1.27E‐03 4.65 N/A 1.79 N/A 6.75 4.10 3.75 N/A 63.56 311.34 0.66 2.66Dec‐05 ‐ Nov‐07 11.97 N/A N/A 1.27E‐03 4.59 N/A 1.79 N/A 6.67 4.05 3.71 N/A 62.80 311.90 0.66 2.62
24MonthPeriod
TrinityConsultants Page12of37AugustaExpansionProjectEmissionsAnalysis(20130306JF)
24‐MonRollingAvg‐Kiln2

AppendixB‐EmissionCalculationsWestFraser‐Augusta,Georgia
TableB‐8.Total24‐MonthRollingAverageActualAnnualEmissionsforKiln2(tpy)
CO Fluorides H2S Lead NOX
ReducedSulfurCompounds
(includingH2S) SO2 H2SO4 TotalPM TotalPM10 TotalPM2.5
TotalReducedSulfur
(includingH2S) TotalVOC CO2ebiomassdeferral Formaldehyde Methanol24MonthPeriod
Jan‐06 ‐ Dec‐07 11.83 N/A N/A 1.28E‐03 4.54 N/A 1.81 N/A 6.60 4.00 3.66 N/A 62.08 314.69 0.65 2.59Feb‐06 ‐ Jan‐08 11.88 N/A N/A 1.37E‐03 4.56 N/A 1.94 N/A 6.62 4.02 3.68 N/A 62.33 337.14 0.65 2.60Mar‐06 ‐ Feb‐08 11.70 N/A N/A 1.41E‐03 4.49 N/A 1.99 N/A 6.52 3.96 3.62 N/A 61.39 346.09 0.64 2.56Apr‐06 ‐ Mar‐08 11.42 N/A N/A 1.45E‐03 4.38 N/A 2.05 N/A 6.37 3.86 3.53 N/A 59.90 357.23 0.63 2.50May‐06 ‐ Apr‐08 10.69 N/A N/A 1.39E‐03 4.10 N/A 1.97 N/A 5.96 3.62 3.31 N/A 56.07 342.84 0.59 2.34Jun‐06 ‐ May‐08 10.04 N/A N/A 1.34E‐03 3.85 N/A 1.90 N/A 5.60 3.40 3.11 N/A 52.65 330.03 0.55 2.20Jul‐06 ‐ Jun‐08 9.39 N/A N/A 1.29E‐03 3.60 N/A 1.82 N/A 5.24 3.18 2.91 N/A 49.27 317.34 0.51 2.06Aug‐06 ‐ Jul‐08 8.87 N/A N/A 1.25E‐03 3.40 N/A 1.76 N/A 4.94 3.00 2.75 N/A 46.53 307.06 0.49 1.94Sep‐06 ‐ Aug‐08 8.44 N/A N/A 1.21E‐03 3.24 N/A 1.72 N/A 4.71 2.86 2.61 N/A 44.29 298.67 0.46 1.85Oct‐06 ‐ Sep‐08 8.72 N/A N/A 1.31E‐03 3.34 N/A 1.84 N/A 4.86 2.95 2.70 N/A 45.73 320.92 0.48 1.91Nov‐06 ‐ Oct‐08 8.95 N/A N/A 1.40E‐03 3.43 N/A 1.98 N/A 4.99 3.03 2.77 N/A 46.94 345.19 0.49 1.96Dec‐06 ‐ Nov‐08 8.67 N/A N/A 1.41E‐03 3.32 N/A 1.99 N/A 4.83 2.93 2.68 N/A 45.47 346.02 0.47 1.90Jan‐07 ‐ Dec‐08 8.60 N/A N/A 1.42E‐03 3.30 N/A 2.01 N/A 4.79 2.91 2.66 N/A 45.11 350.36 0.47 1.88Feb‐07 ‐ Jan‐09 8.19 N/A N/A 1.38E‐03 3.14 N/A 1.95 N/A 4.57 2.77 2.54 N/A 42.98 339.42 0.45 1.80Mar‐07 ‐ Feb‐09 7.72 N/A N/A 1.32E‐03 2.96 N/A 1.86 N/A 4.31 2.61 2.39 N/A 40.52 323.69 0.42 1.69Apr‐07 ‐ Mar‐09 7.70 N/A N/A 1.36E‐03 2.95 N/A 1.92 N/A 4.29 2.60 2.38 N/A 40.37 333.39 0.42 1.69May‐07 ‐ Apr‐09 7.36 N/A N/A 1.34E‐03 2.82 N/A 1.90 N/A 4.10 2.49 2.28 N/A 38.59 329.98 0.40 1.61Jun‐07 ‐ May‐09 7.55 N/A N/A 1.41E‐03 2.90 N/A 1.99 N/A 4.21 2.56 2.34 N/A 39.63 345.85 0.41 1.66Jul‐07 ‐ Jun‐09 7.38 N/A N/A 1.43E‐03 2.83 N/A 2.02 N/A 4.12 2.50 2.29 N/A 38.73 351.40 0.40 1.62Aug‐07 ‐ Jul‐09 6.96 N/A N/A 1.39E‐03 2.67 N/A 1.97 N/A 3.88 2.35 2.15 N/A 36.50 342.51 0.38 1.53Sep‐07 ‐ Aug‐09 6.94 N/A N/A 1.43E‐03 2.66 N/A 2.02 N/A 3.87 2.35 2.15 N/A 36.41 351.85 0.38 1.52Oct‐07 ‐ Sep‐09 6.51 N/A N/A 1.40E‐03 2.50 N/A 1.97 N/A 3.63 2.20 2.02 N/A 34.15 343.43 0.36 1.43Nov‐07 ‐ Oct‐09 6.24 N/A N/A 1.40E‐03 2.39 N/A 1.97 N/A 3.48 2.11 1.93 N/A 32.73 343.09 0.34 1.37Dec‐07 ‐ Nov‐09 6.11 N/A N/A 1.40E‐03 2.35 N/A 1.98 N/A 3.41 2.07 1.89 N/A 32.08 344.26 0.34 1.34Jan‐08 ‐ Dec‐09 5.78 N/A N/A 1.37E‐03 2.22 N/A 1.94 N/A 3.23 1.96 1.79 N/A 30.35 337.88 0.32 1.27Feb‐08 ‐ Jan‐10 5.32 N/A N/A 1.27E‐03 2.04 N/A 1.80 N/A 2.97 1.80 1.65 N/A 27.92 312.82 0.29 1.17Mar‐08 ‐ Feb‐10 5.19 N/A N/A 1.25E‐03 1.99 N/A 1.77 N/A 2.89 1.76 1.61 N/A 27.23 307.65 0.28 1.14Apr‐08 ‐ Mar‐10 5.33 N/A N/A 1.31E‐03 2.04 N/A 1.85 N/A 2.97 1.80 1.65 N/A 27.94 321.98 0.29 1.17May‐08 ‐ Apr‐10 5.63 N/A N/A 1.39E‐03 2.16 N/A 1.97 N/A 3.14 1.91 1.74 N/A 29.54 342.84 0.31 1.23Jun‐08 ‐ May‐10 6.01 N/A N/A 1.50E‐03 2.31 N/A 2.12 N/A 3.35 2.03 1.86 N/A 31.55 369.01 0.33 1.32Jul‐08 ‐ Jun‐10 6.01 N/A N/A 1.50E‐03 2.31 N/A 2.12 N/A 3.35 2.03 1.86 N/A 31.55 369.01 0.33 1.32Aug‐08 ‐ Jul‐10 6.21 N/A N/A 1.56E‐03 2.38 N/A 2.20 N/A 3.46 2.10 1.92 N/A 32.60 382.64 0.34 1.36Sep‐08 ‐ Aug‐10 6.82 N/A N/A 1.73E‐03 2.62 N/A 2.44 N/A 3.80 2.31 2.11 N/A 35.81 424.35 0.37 1.50Oct‐08 ‐ Sep‐10 6.80 N/A N/A 1.74E‐03 2.61 N/A 2.46 N/A 3.79 2.30 2.11 N/A 35.70 428.06 0.37 1.49Nov‐08 ‐ Oct‐10 6.80 N/A N/A 1.77E‐03 2.61 N/A 2.49 N/A 3.79 2.30 2.11 N/A 35.69 434.05 0.37 1.49Dec‐08 ‐ Nov‐10 6.96 N/A N/A 1.82E‐03 2.67 N/A 2.57 N/A 3.88 2.36 2.16 N/A 36.54 446.97 0.38 1.53Jan‐09 ‐ Dec‐10 7.29 N/A N/A 1.92E‐03 2.80 N/A 2.71 N/A 4.06 2.47 2.26 N/A 38.25 471.03 0.40 1.60Feb‐09 ‐ Jan‐11 7.49 N/A N/A 1.96E‐03 2.87 N/A 2.77 N/A 4.18 2.53 2.32 N/A 39.30 482.61 0.41 1.64Mar‐09 ‐ Feb‐11 8.03 N/A N/A 2.09E‐03 3.08 N/A 2.95 N/A 4.48 2.72 2.49 N/A 42.15 514.38 0.44 1.76Apr‐09 ‐ Mar‐11 8.23 N/A N/A 2.14E‐03 3.16 N/A 3.02 N/A 4.59 2.78 2.55 N/A 43.17 525.30 0.45 1.80May‐09 ‐ Apr‐11 8.43 N/A N/A 2.18E‐03 3.23 N/A 3.08 N/A 4.70 2.85 2.61 N/A 44.22 536.70 0.46 1.85Jun‐09 ‐ May‐11 8.50 N/A N/A 2.20E‐03 3.26 N/A 3.11 N/A 4.74 2.88 2.63 N/A 44.62 540.65 0.47 1.86Jul‐09 ‐ Jun‐11 8.59 N/A N/A 2.22E‐03 3.30 N/A 3.13 N/A 4.79 2.91 2.66 N/A 45.09 545.46 0.47 1.88Aug‐09 ‐ Jul‐11 8.69 N/A N/A 2.24E‐03 3.33 N/A 3.16 N/A 4.85 2.94 2.69 N/A 45.60 550.93 0.48 1.91Sep‐09 ‐ Aug‐11 8.51 N/A N/A 2.19E‐03 3.26 N/A 3.10 N/A 4.74 2.88 2.63 N/A 44.63 539.60 0.47 1.86Oct‐09 ‐ Sep‐11 8.40 N/A N/A 2.17E‐03 3.22 N/A 3.06 N/A 4.69 2.84 2.60 N/A 44.10 533.41 0.46 1.84Nov‐09 ‐ Oct‐11 8.47 N/A N/A 2.18E‐03 3.25 N/A 3.08 N/A 4.72 2.87 2.62 N/A 44.43 536.73 0.46 1.86Dec‐09 ‐ Nov‐11 8.42 N/A N/A 2.17E‐03 3.23 N/A 3.06 N/A 4.69 2.85 2.61 N/A 44.15 533.42 0.46 1.84Jan‐10 ‐ Dec‐11 8.51 N/A N/A 2.19E‐03 3.27 N/A 3.10 N/A 4.75 2.88 2.64 N/A 44.66 538.93 0.47 1.87
TrinityConsultants Page13of37AugustaExpansionProjectEmissionsAnalysis(20130306JF)
24‐MonRollingAvg‐Kiln2

AppendixB‐EmissionCalculationsWestFraser‐Augusta,Georgia
TableB‐9.BaselineMonthlyEmissionsforKiln3(tonspermonth)
Month CO Fluorides H2S Lead NOX
ReducedSulfurCompounds
(includingH2S) SO2 H2SO4 TotalPM TotalPM10 TotalPM2.5
TotalReducedSulfur
(includingH2S) TotalVOC CO2ebiomassdeferral Formaldehyde Methanol
Jan‐02 2.13 N/A N/A 1.90E‐04 0.82 N/A 0.27 N/A 1.19 0.72 0.66 N/A 11.18 46.79 0.12 0.47Feb‐02 1.98 N/A N/A 1.77E‐04 0.76 N/A 0.25 N/A 1.10 0.67 0.61 N/A 10.37 43.43 0.11 0.43Mar‐02 2.22 N/A N/A 1.98E‐04 0.85 N/A 0.28 N/A 1.24 0.75 0.69 N/A 11.65 48.77 0.12 0.49Apr‐02 2.07 N/A N/A 1.85E‐04 0.80 N/A 0.26 N/A 1.16 0.70 0.64 N/A 10.88 45.54 0.11 0.45May‐02 2.32 N/A N/A 2.07E‐04 0.89 N/A 0.29 N/A 1.29 0.78 0.72 N/A 12.17 50.94 0.13 0.51Jun‐02 2.15 N/A N/A 1.92E‐04 0.82 N/A 0.27 N/A 1.20 0.73 0.67 N/A 11.28 47.21 0.12 0.47Jul‐02 2.05 N/A N/A 1.83E‐04 0.79 N/A 0.26 N/A 1.14 0.69 0.64 N/A 10.77 45.10 0.11 0.45Aug‐02 2.15 N/A N/A 1.92E‐04 0.83 N/A 0.27 N/A 1.20 0.73 0.67 N/A 11.29 47.26 0.12 0.47Sep‐02 1.76 N/A N/A 1.57E‐04 0.68 N/A 0.22 N/A 0.98 0.60 0.55 N/A 9.24 38.70 0.10 0.39Oct‐02 1.98 N/A N/A 1.77E‐04 0.76 N/A 0.25 N/A 1.10 0.67 0.61 N/A 10.39 43.52 0.11 0.43Nov‐02 1.99 N/A N/A 1.78E‐04 0.76 N/A 0.25 N/A 1.11 0.67 0.62 N/A 10.43 43.69 0.11 0.44Dec‐02 1.68 N/A N/A 1.50E‐04 0.64 N/A 0.21 N/A 0.93 0.57 0.52 N/A 8.80 36.82 0.09 0.37Jan‐03 2.49 N/A N/A 2.30E‐04 0.95 N/A 0.32 N/A 1.39 0.84 0.77 N/A 13.05 56.55 0.14 0.55Feb‐03 2.06 N/A N/A 1.90E‐04 0.79 N/A 0.27 N/A 1.15 0.70 0.64 N/A 10.80 46.80 0.11 0.45Mar‐03 1.76 N/A N/A 1.63E‐04 0.67 N/A 0.23 N/A 0.98 0.59 0.54 N/A 9.22 39.98 0.10 0.39Apr‐03 1.83 N/A N/A 1.69E‐04 0.70 N/A 0.24 N/A 1.02 0.62 0.57 N/A 9.58 41.51 0.10 0.40May‐03 2.06 N/A N/A 1.90E‐04 0.79 N/A 0.27 N/A 1.15 0.70 0.64 N/A 10.79 46.76 0.11 0.45Jun‐03 1.91 N/A N/A 1.77E‐04 0.73 N/A 0.25 N/A 1.06 0.65 0.59 N/A 10.01 43.40 0.10 0.42Jul‐03 1.59 N/A N/A 1.47E‐04 0.61 N/A 0.21 N/A 0.89 0.54 0.49 N/A 8.33 36.10 0.09 0.35Aug‐03 2.15 N/A N/A 1.98E‐04 0.82 N/A 0.28 N/A 1.20 0.73 0.66 N/A 11.26 48.79 0.12 0.47Sep‐03 2.07 N/A N/A 1.92E‐04 0.79 N/A 0.27 N/A 1.15 0.70 0.64 N/A 10.87 47.11 0.11 0.45Oct‐03 2.16 N/A N/A 2.00E‐04 0.83 N/A 0.28 N/A 1.20 0.73 0.67 N/A 11.32 49.07 0.12 0.47Nov‐03 1.77 N/A N/A 1.64E‐04 0.68 N/A 0.23 N/A 0.99 0.60 0.55 N/A 9.29 40.28 0.10 0.39Dec‐03 1.89 N/A N/A 1.74E‐04 0.72 N/A 0.25 N/A 1.05 0.64 0.58 N/A 9.90 42.89 0.10 0.41Jan‐04 2.24 N/A N/A 1.99E‐04 0.86 N/A 0.28 N/A 1.25 0.76 0.69 N/A 11.73 48.98 0.12 0.49Feb‐04 1.90 N/A N/A 1.70E‐04 0.73 N/A 0.24 N/A 1.06 0.64 0.59 N/A 9.98 41.68 0.10 0.42Mar‐04 1.86 N/A N/A 1.65E‐04 0.71 N/A 0.23 N/A 1.03 0.63 0.57 N/A 9.73 40.66 0.10 0.41Apr‐04 2.18 N/A N/A 1.94E‐04 0.84 N/A 0.27 N/A 1.21 0.74 0.67 N/A 11.43 47.75 0.12 0.48May‐04 1.86 N/A N/A 1.66E‐04 0.71 N/A 0.23 N/A 1.04 0.63 0.58 N/A 9.77 40.82 0.10 0.41Jun‐04 2.23 N/A N/A 1.99E‐04 0.85 N/A 0.28 N/A 1.24 0.75 0.69 N/A 11.69 48.83 0.12 0.49Jul‐04 0.85 N/A N/A 7.57E‐05 0.33 N/A 0.11 N/A 0.47 0.29 0.26 N/A 4.45 18.60 0.05 0.19Aug‐04 0.24 N/A N/A 2.15E‐05 0.09 N/A 0.03 N/A 0.13 0.08 0.07 N/A 1.26 5.28 0.01 0.05Sep‐04 1.91 N/A N/A 1.70E‐04 0.73 N/A 0.24 N/A 1.06 0.65 0.59 N/A 10.02 41.85 0.10 0.42Oct‐04 2.06 N/A N/A 1.84E‐04 0.79 N/A 0.26 N/A 1.15 0.70 0.64 N/A 10.83 45.25 0.11 0.45Nov‐04 1.75 N/A N/A 1.56E‐04 0.67 N/A 0.22 N/A 0.97 0.59 0.54 N/A 9.16 38.26 0.10 0.38Dec‐04 1.88 N/A N/A 1.68E‐04 0.72 N/A 0.24 N/A 1.05 0.64 0.58 N/A 9.88 41.25 0.10 0.41Jan‐05 1.99 N/A N/A 1.78E‐04 0.76 N/A 0.25 N/A 1.11 0.67 0.62 N/A 10.44 43.83 0.11 0.44Feb‐05 1.91 N/A N/A 1.71E‐04 0.73 N/A 0.24 N/A 1.06 0.65 0.59 N/A 10.02 42.05 0.10 0.42Mar‐05 2.12 N/A N/A 1.90E‐04 0.81 N/A 0.27 N/A 1.18 0.72 0.66 N/A 11.13 46.70 0.12 0.46Apr‐05 2.37 N/A N/A 2.12E‐04 0.91 N/A 0.30 N/A 1.32 0.80 0.73 N/A 12.45 52.23 0.13 0.52May‐05 2.60 N/A N/A 2.33E‐04 1.00 N/A 0.33 N/A 1.45 0.88 0.81 N/A 13.66 57.33 0.14 0.57Jun‐05 1.99 N/A N/A 1.79E‐04 0.76 N/A 0.25 N/A 1.11 0.67 0.62 N/A 10.46 43.91 0.11 0.44Jul‐05 2.49 N/A N/A 2.23E‐04 0.95 N/A 0.31 N/A 1.39 0.84 0.77 N/A 13.06 54.81 0.14 0.55Aug‐05 2.40 N/A N/A 2.15E‐04 0.92 N/A 0.30 N/A 1.34 0.81 0.74 N/A 12.59 52.85 0.13 0.53Sep‐05 2.40 N/A N/A 2.15E‐04 0.92 N/A 0.30 N/A 1.34 0.81 0.74 N/A 12.57 52.75 0.13 0.53
TrinityConsultants Page14of37AugustaExpansionProjectEmissionsAnalysis(20130306JF)
Kiln3Emissions

AppendixB‐EmissionCalculationsWestFraser‐Augusta,Georgia
TableB‐9.BaselineMonthlyEmissionsforKiln3(tonspermonth)
Month CO Fluorides H2S Lead NOX
ReducedSulfurCompounds
(includingH2S) SO2 H2SO4 TotalPM TotalPM10 TotalPM2.5
TotalReducedSulfur
(includingH2S) TotalVOC CO2ebiomassdeferral Formaldehyde Methanol
Oct‐05 2.28 N/A N/A 2.05E‐04 0.88 N/A 0.29 N/A 1.27 0.77 0.71 N/A 11.98 50.28 0.13 0.50Nov‐05 1.91 N/A N/A 1.71E‐04 0.73 N/A 0.24 N/A 1.06 0.64 0.59 N/A 10.00 41.97 0.10 0.42Dec‐05 2.63 N/A N/A 2.36E‐04 1.01 N/A 0.33 N/A 1.47 0.89 0.82 N/A 13.82 57.98 0.14 0.58Jan‐06 2.21 N/A N/A 1.77E‐04 0.85 N/A 0.25 N/A 1.23 0.75 0.68 N/A 11.58 43.43 0.12 0.48Feb‐06 1.91 N/A N/A 1.53E‐04 0.73 N/A 0.22 N/A 1.06 0.65 0.59 N/A 10.01 37.53 0.10 0.42Mar‐06 2.70 N/A N/A 2.16E‐04 1.04 N/A 0.31 N/A 1.51 0.91 0.84 N/A 14.17 53.12 0.15 0.59Apr‐06 2.14 N/A N/A 1.71E‐04 0.82 N/A 0.24 N/A 1.19 0.72 0.66 N/A 11.23 42.12 0.12 0.47May‐06 2.70 N/A N/A 2.16E‐04 1.04 N/A 0.31 N/A 1.51 0.91 0.84 N/A 14.17 53.14 0.15 0.59Jun‐06 2.30 N/A N/A 1.84E‐04 0.88 N/A 0.26 N/A 1.28 0.78 0.71 N/A 12.05 45.18 0.13 0.50Jul‐06 2.46 N/A N/A 1.97E‐04 0.94 N/A 0.28 N/A 1.37 0.83 0.76 N/A 12.92 48.43 0.13 0.54Aug‐06 2.14 N/A N/A 1.71E‐04 0.82 N/A 0.24 N/A 1.19 0.72 0.66 N/A 11.23 42.09 0.12 0.47Sep‐06 2.16 N/A N/A 1.73E‐04 0.83 N/A 0.24 N/A 1.21 0.73 0.67 N/A 11.34 42.53 0.12 0.47Oct‐06 1.68 N/A N/A 1.34E‐04 0.64 N/A 0.19 N/A 0.93 0.57 0.52 N/A 8.80 32.98 0.09 0.37Nov‐06 1.83 N/A N/A 1.46E‐04 0.70 N/A 0.21 N/A 1.02 0.62 0.57 N/A 9.60 36.01 0.10 0.40Dec‐06 1.82 N/A N/A 1.45E‐04 0.70 N/A 0.21 N/A 1.01 0.61 0.56 N/A 9.53 35.74 0.10 0.40Jan‐07 1.91 N/A N/A 1.04E‐04 0.73 N/A 0.15 N/A 1.07 0.65 0.59 N/A 10.03 25.69 0.10 0.42Feb‐07 1.90 N/A N/A 1.04E‐04 0.73 N/A 0.15 N/A 1.06 0.64 0.59 N/A 9.98 25.57 0.10 0.42Mar‐07 2.00 N/A N/A 1.09E‐04 0.77 N/A 0.15 N/A 1.11 0.68 0.62 N/A 10.47 26.83 0.11 0.44Apr‐07 1.99 N/A N/A 1.09E‐04 0.76 N/A 0.15 N/A 1.11 0.67 0.62 N/A 10.44 26.74 0.11 0.44May‐07 2.70 N/A N/A 1.47E‐04 1.03 N/A 0.21 N/A 1.50 0.91 0.83 N/A 14.14 36.23 0.15 0.59Jun‐07 2.39 N/A N/A 1.31E‐04 0.92 N/A 0.18 N/A 1.33 0.81 0.74 N/A 12.53 32.10 0.13 0.52Jul‐07 2.40 N/A N/A 1.31E‐04 0.92 N/A 0.19 N/A 1.34 0.81 0.74 N/A 12.58 32.24 0.13 0.53Aug‐07 2.78 N/A N/A 1.52E‐04 1.07 N/A 0.21 N/A 1.55 0.94 0.86 N/A 14.60 37.39 0.15 0.61Sep‐07 1.91 N/A N/A 1.04E‐04 0.73 N/A 0.15 N/A 1.06 0.65 0.59 N/A 10.00 25.63 0.10 0.42Oct‐07 2.22 N/A N/A 1.22E‐04 0.85 N/A 0.17 N/A 1.24 0.75 0.69 N/A 11.67 29.89 0.12 0.49Nov‐07 2.37 N/A N/A 1.30E‐04 0.91 N/A 0.18 N/A 1.32 0.80 0.73 N/A 12.44 31.88 0.13 0.52Dec‐07 1.51 N/A N/A 8.27E‐05 0.58 N/A 0.12 N/A 0.84 0.51 0.47 N/A 7.94 20.34 0.08 0.33Jan‐08 2.24 N/A N/A 1.33E‐04 0.86 N/A 0.19 N/A 1.25 0.76 0.69 N/A 11.73 32.72 0.12 0.49Feb‐08 1.83 N/A N/A 1.09E‐04 0.70 N/A 0.15 N/A 1.02 0.62 0.57 N/A 9.61 26.81 0.10 0.40Mar‐08 1.82 N/A N/A 1.08E‐04 0.70 N/A 0.15 N/A 1.02 0.62 0.56 N/A 9.55 26.65 0.10 0.40Apr‐08 2.14 N/A N/A 1.27E‐04 0.82 N/A 0.18 N/A 1.19 0.72 0.66 N/A 11.21 31.26 0.12 0.47May‐08 2.36 N/A N/A 1.41E‐04 0.91 N/A 0.20 N/A 1.32 0.80 0.73 N/A 12.41 34.60 0.13 0.52Jun‐08 2.23 N/A N/A 1.33E‐04 0.85 N/A 0.19 N/A 1.24 0.75 0.69 N/A 11.68 32.58 0.12 0.49Jul‐08 2.62 N/A N/A 1.56E‐04 1.00 N/A 0.22 N/A 1.46 0.89 0.81 N/A 13.74 38.31 0.14 0.57Aug‐08 2.94 N/A N/A 1.75E‐04 1.13 N/A 0.25 N/A 1.64 1.00 0.91 N/A 15.43 43.04 0.16 0.64Sep‐08 2.32 N/A N/A 1.38E‐04 0.89 N/A 0.19 N/A 1.29 0.78 0.72 N/A 12.16 33.90 0.13 0.51Oct‐08 1.83 N/A N/A 1.09E‐04 0.70 N/A 0.15 N/A 1.02 0.62 0.57 N/A 9.58 26.71 0.10 0.40Nov‐08 1.99 N/A N/A 1.18E‐04 0.76 N/A 0.17 N/A 1.11 0.67 0.62 N/A 10.44 29.12 0.11 0.44Dec‐08 1.36 N/A N/A 8.09E‐05 0.52 N/A 0.11 N/A 0.76 0.46 0.42 N/A 7.13 19.88 0.07 0.30Jan‐09 1.41 N/A N/A 8.93E‐05 0.54 N/A 0.13 N/A 0.79 0.48 0.44 N/A 7.41 21.96 0.08 0.31Feb‐09 1.58 N/A N/A 1.00E‐04 0.61 N/A 0.14 N/A 0.88 0.54 0.49 N/A 8.31 24.64 0.09 0.35Mar‐09 2.23 N/A N/A 1.41E‐04 0.86 N/A 0.20 N/A 1.24 0.75 0.69 N/A 11.70 34.67 0.12 0.49Apr‐09 2.55 N/A N/A 1.61E‐04 0.98 N/A 0.23 N/A 1.42 0.86 0.79 N/A 13.39 39.67 0.14 0.56May‐09 2.15 N/A N/A 1.36E‐04 0.82 N/A 0.19 N/A 1.20 0.73 0.67 N/A 11.27 33.41 0.12 0.47Jun‐09 2.15 N/A N/A 1.36E‐04 0.82 N/A 0.19 N/A 1.20 0.73 0.67 N/A 11.27 33.42 0.12 0.47Jul‐09 2.24 N/A N/A 1.42E‐04 0.86 N/A 0.20 N/A 1.25 0.76 0.69 N/A 11.77 34.88 0.12 0.49Aug‐09 2.00 N/A N/A 1.26E‐04 0.77 N/A 0.18 N/A 1.12 0.68 0.62 N/A 10.49 31.10 0.11 0.44Sep‐09 1.76 N/A N/A 1.11E‐04 0.68 N/A 0.16 N/A 0.98 0.60 0.55 N/A 9.24 27.39 0.10 0.39Oct‐09 2.32 N/A N/A 1.47E‐04 0.89 N/A 0.21 N/A 1.30 0.79 0.72 N/A 12.19 36.13 0.13 0.51Nov‐09 1.99 N/A N/A 1.26E‐04 0.77 N/A 0.18 N/A 1.11 0.67 0.62 N/A 10.47 31.02 0.11 0.44
TrinityConsultants Page15of37AugustaExpansionProjectEmissionsAnalysis(20130306JF)
Kiln3Emissions

AppendixB‐EmissionCalculationsWestFraser‐Augusta,Georgia
TableB‐9.BaselineMonthlyEmissionsforKiln3(tonspermonth)
Month CO Fluorides H2S Lead NOX
ReducedSulfurCompounds
(includingH2S) SO2 H2SO4 TotalPM TotalPM10 TotalPM2.5
TotalReducedSulfur
(includingH2S) TotalVOC CO2ebiomassdeferral Formaldehyde Methanol
Dec‐09 1.83 N/A N/A 1.16E‐04 0.70 N/A 0.16 N/A 1.02 0.62 0.57 N/A 9.63 28.53 0.10 0.40Jan‐10 2.06 N/A N/A 1.46E‐04 0.79 N/A 0.21 N/A 1.15 0.70 0.64 N/A 10.83 35.84 0.11 0.45Feb‐10 1.19 N/A N/A 8.43E‐05 0.46 N/A 0.12 N/A 0.67 0.40 0.37 N/A 6.26 20.72 0.07 0.26Mar‐10 1.75 N/A N/A 1.23E‐04 0.67 N/A 0.17 N/A 0.97 0.59 0.54 N/A 9.17 30.34 0.10 0.38Apr‐10 2.72 N/A N/A 1.92E‐04 1.04 N/A 0.27 N/A 1.52 0.92 0.84 N/A 14.27 47.21 0.15 0.60May‐10 2.47 N/A N/A 1.74E‐04 0.95 N/A 0.25 N/A 1.38 0.84 0.76 N/A 12.96 42.88 0.14 0.54Jun‐10 2.46 N/A N/A 1.74E‐04 0.94 N/A 0.25 N/A 1.37 0.83 0.76 N/A 12.92 42.74 0.13 0.54Jul‐10 2.40 N/A N/A 1.69E‐04 0.92 N/A 0.24 N/A 1.34 0.81 0.74 N/A 12.59 41.64 0.13 0.53Aug‐10 2.23 N/A N/A 1.58E‐04 0.86 N/A 0.22 N/A 1.24 0.76 0.69 N/A 11.71 38.74 0.12 0.49Sep‐10 2.22 N/A N/A 1.57E‐04 0.85 N/A 0.22 N/A 1.24 0.75 0.69 N/A 11.67 38.62 0.12 0.49Oct‐10 2.09 N/A N/A 1.47E‐04 0.80 N/A 0.21 N/A 1.16 0.71 0.65 N/A 10.96 36.24 0.11 0.46Nov‐10 1.67 N/A N/A 1.18E‐04 0.64 N/A 0.17 N/A 0.93 0.56 0.52 N/A 8.74 28.91 0.09 0.37Dec‐10 2.25 N/A N/A 1.59E‐04 0.86 N/A 0.22 N/A 1.25 0.76 0.70 N/A 11.79 39.02 0.12 0.49Jan‐11 2.07 N/A N/A 1.88E‐04 0.80 N/A 0.27 N/A 1.16 0.70 0.64 N/A 10.88 46.26 0.11 0.45Feb‐11 2.01 N/A N/A 1.82E‐04 0.77 N/A 0.26 N/A 1.12 0.68 0.62 N/A 10.53 44.76 0.11 0.44Mar‐11 2.09 N/A N/A 1.90E‐04 0.80 N/A 0.27 N/A 1.17 0.71 0.65 N/A 10.99 46.73 0.11 0.46Apr‐11 2.25 N/A N/A 2.04E‐04 0.86 N/A 0.29 N/A 1.25 0.76 0.70 N/A 11.78 50.09 0.12 0.49May‐11 2.34 N/A N/A 2.12E‐04 0.90 N/A 0.30 N/A 1.30 0.79 0.72 N/A 12.26 52.12 0.13 0.51Jun‐11 2.08 N/A N/A 1.89E‐04 0.80 N/A 0.27 N/A 1.16 0.70 0.64 N/A 10.91 46.41 0.11 0.46Jul‐11 1.85 N/A N/A 1.68E‐04 0.71 N/A 0.24 N/A 1.03 0.63 0.57 N/A 9.69 41.21 0.10 0.40Aug‐11 2.08 N/A N/A 1.89E‐04 0.80 N/A 0.27 N/A 1.16 0.70 0.64 N/A 10.91 46.40 0.11 0.46Sep‐11 1.60 N/A N/A 1.45E‐04 0.61 N/A 0.20 N/A 0.89 0.54 0.50 N/A 8.39 35.68 0.09 0.35Oct‐11 2.09 N/A N/A 1.89E‐04 0.80 N/A 0.27 N/A 1.16 0.71 0.65 N/A 10.95 46.54 0.11 0.46Nov‐11 0.96 N/A N/A 8.72E‐05 0.37 N/A 0.12 N/A 0.54 0.33 0.30 N/A 5.04 21.44 0.05 0.21Dec‐11 2.07 N/A N/A 1.88E‐04 0.79 N/A 0.26 N/A 1.15 0.70 0.64 N/A 10.84 46.10 0.11 0.45
1.Baselinemonthlyemissionsarecalculatedtwowaysdependingontheunitsoftheemissionfactorofinterest.
Iftheemissionfactorisinunitsoflb/MBF,thefollowingderivationisused:ActualEmissions[ton/month]=EmissionFactor[lb/MBF]*MonthlyKilnProduction[BF/month]/2,000lb/ton/1,000BF/MBFIftheemissionfactorisinunitsoflb/MMBtu,thefollowingderivationisused:ActualEmissions[ton/month]=EmissionFactor[lb/MMBtu]*MonthlyWoodCombusted[tons/month]*HeatingValue[4,500Btu/lbwoodcombusted]/1,000,000Btu/MMBtu
TrinityConsultants Page16of37AugustaExpansionProjectEmissionsAnalysis(20130306JF)
Kiln3Emissions

AppendixB‐EmissionCalculationsWestFraser‐Augusta,Georgia
TableB‐10.Total24‐MonthRollingAverageActualAnnualEmissionsforKiln3(tpy)
CO Fluorides H2S Lead NOX
ReducedSulfurCompounds
(includingH2S) SO2 H2SO4 TotalPM TotalPM10 TotalPM2.5
TotalReducedSulfur
(includingH2S) TotalVOC CO2ebiomassdeferral Formaldehyde Methanol
Jan‐02 ‐ Dec‐03 24.10 N/A N/A 2.19E‐03 9.24 N/A 3.09 N/A 13.44 8.15 7.46 N/A 126.43 538.49 1.32 5.28Feb‐02 ‐ Jan‐04 24.15 N/A N/A 2.19E‐03 9.26 N/A 3.10 N/A 13.46 8.17 7.48 N/A 126.71 539.59 1.32 5.29Mar‐02 ‐ Feb‐04 24.11 N/A N/A 2.19E‐03 9.25 N/A 3.09 N/A 13.44 8.16 7.47 N/A 126.51 538.72 1.32 5.29Apr‐02 ‐ Mar‐04 23.93 N/A N/A 2.17E‐03 9.18 N/A 3.07 N/A 13.34 8.10 7.41 N/A 125.55 534.66 1.31 5.25May‐02 ‐ Apr‐04 23.98 N/A N/A 2.18E‐03 9.20 N/A 3.08 N/A 13.37 8.11 7.43 N/A 125.83 535.77 1.31 5.26Jun‐02 ‐ May‐04 23.76 N/A N/A 2.16E‐03 9.11 N/A 3.05 N/A 13.24 8.04 7.35 N/A 124.63 530.70 1.30 5.21Jul‐02 ‐ Jun‐04 23.79 N/A N/A 2.16E‐03 9.13 N/A 3.05 N/A 13.27 8.05 7.37 N/A 124.84 531.52 1.30 5.22Aug‐02 ‐ Jul‐04 23.19 N/A N/A 2.11E‐03 8.90 N/A 2.98 N/A 12.93 7.85 7.18 N/A 121.68 518.27 1.27 5.08Sep‐02 ‐ Aug‐04 22.24 N/A N/A 2.02E‐03 8.53 N/A 2.86 N/A 12.40 7.52 6.88 N/A 116.67 497.28 1.22 4.87Oct‐02 ‐ Sep‐04 22.31 N/A N/A 2.03E‐03 8.56 N/A 2.87 N/A 12.44 7.55 6.91 N/A 117.06 498.86 1.22 4.89Nov‐02 ‐ Oct‐04 22.35 N/A N/A 2.03E‐03 8.57 N/A 2.87 N/A 12.46 7.56 6.92 N/A 117.28 499.72 1.22 4.90Dec‐02 ‐ Nov‐04 22.23 N/A N/A 2.02E‐03 8.53 N/A 2.86 N/A 12.39 7.52 6.88 N/A 116.64 497.01 1.22 4.87Jan‐03 ‐ Dec‐04 22.33 N/A N/A 2.03E‐03 8.57 N/A 2.87 N/A 12.45 7.56 6.91 N/A 117.18 499.23 1.22 4.90Feb‐03 ‐ Jan‐05 22.09 N/A N/A 2.00E‐03 8.47 N/A 2.83 N/A 12.31 7.47 6.84 N/A 115.88 492.86 1.21 4.84Mar‐03 ‐ Feb‐05 22.01 N/A N/A 1.99E‐03 8.44 N/A 2.82 N/A 12.27 7.45 6.81 N/A 115.49 490.49 1.21 4.82Apr‐03 ‐ Mar‐05 22.19 N/A N/A 2.01E‐03 8.51 N/A 2.84 N/A 12.37 7.51 6.87 N/A 116.44 493.85 1.22 4.86May‐03 ‐ Apr‐05 22.47 N/A N/A 2.03E‐03 8.62 N/A 2.87 N/A 12.53 7.60 6.96 N/A 117.87 499.21 1.23 4.92Jun‐03 ‐ May‐05 22.74 N/A N/A 2.05E‐03 8.72 N/A 2.90 N/A 12.68 7.69 7.04 N/A 119.31 504.50 1.25 4.98Jul‐03 ‐ Jun‐05 22.78 N/A N/A 2.05E‐03 8.74 N/A 2.90 N/A 12.70 7.71 7.05 N/A 119.53 504.75 1.25 4.99Aug‐03 ‐ Jul‐05 23.23 N/A N/A 2.09E‐03 8.91 N/A 2.95 N/A 12.95 7.86 7.19 N/A 121.90 514.10 1.27 5.09Sep‐03 ‐ Aug‐05 23.36 N/A N/A 2.10E‐03 8.96 N/A 2.97 N/A 13.02 7.90 7.23 N/A 122.57 516.14 1.28 5.12Oct‐03 ‐ Sep‐05 23.52 N/A N/A 2.11E‐03 9.02 N/A 2.98 N/A 13.12 7.96 7.28 N/A 123.42 518.96 1.29 5.16Nov‐03 ‐ Oct‐05 23.59 N/A N/A 2.11E‐03 9.05 N/A 2.98 N/A 13.15 7.98 7.30 N/A 123.75 519.57 1.29 5.17Dec‐03 ‐ Nov‐05 23.65 N/A N/A 2.12E‐03 9.07 N/A 2.99 N/A 13.19 8.00 7.32 N/A 124.10 520.41 1.30 5.18Jan‐04 ‐ Dec‐05 24.03 N/A N/A 2.15E‐03 9.22 N/A 3.03 N/A 13.40 8.13 7.44 N/A 126.06 527.96 1.32 5.27Feb‐04 ‐ Jan‐06 24.01 N/A N/A 2.14E‐03 9.21 N/A 3.02 N/A 13.39 8.13 7.43 N/A 125.99 525.19 1.32 5.26Mar‐04 ‐ Feb‐06 24.02 N/A N/A 2.13E‐03 9.21 N/A 3.01 N/A 13.39 8.13 7.44 N/A 126.01 523.11 1.32 5.26Apr‐04 ‐ Mar‐06 24.44 N/A N/A 2.15E‐03 9.37 N/A 3.04 N/A 13.63 8.27 7.57 N/A 128.22 529.34 1.34 5.36May‐04 ‐ Apr‐06 24.42 N/A N/A 2.14E‐03 9.37 N/A 3.02 N/A 13.62 8.26 7.56 N/A 128.12 526.52 1.34 5.35Jun‐04 ‐ May‐06 24.84 N/A N/A 2.17E‐03 9.53 N/A 3.06 N/A 13.85 8.40 7.69 N/A 130.32 532.68 1.36 5.44Jul‐04 ‐ Jun‐06 24.87 N/A N/A 2.16E‐03 9.54 N/A 3.05 N/A 13.87 8.42 7.70 N/A 130.50 530.85 1.36 5.45Aug‐04 ‐ Jul‐06 25.68 N/A N/A 2.22E‐03 9.85 N/A 3.14 N/A 14.32 8.69 7.95 N/A 134.73 545.77 1.41 5.63Sep‐04 ‐ Aug‐06 26.63 N/A N/A 2.29E‐03 10.21 N/A 3.24 N/A 14.85 9.01 8.24 N/A 139.71 564.17 1.46 5.84Oct‐04 ‐ Sep‐06 26.76 N/A N/A 2.30E‐03 10.26 N/A 3.24 N/A 14.92 9.05 8.28 N/A 140.37 564.51 1.47 5.86Nov‐04 ‐ Oct‐06 26.56 N/A N/A 2.27E‐03 10.19 N/A 3.21 N/A 14.81 8.99 8.22 N/A 139.36 558.37 1.46 5.82Dec‐04 ‐ Nov‐06 26.60 N/A N/A 2.27E‐03 10.20 N/A 3.20 N/A 14.83 9.00 8.24 N/A 139.58 557.25 1.46 5.83Jan‐05 ‐ Dec‐06 26.57 N/A N/A 2.26E‐03 10.19 N/A 3.19 N/A 14.81 8.99 8.23 N/A 139.41 554.50 1.46 5.82Feb‐05 ‐ Jan‐07 26.53 N/A N/A 2.22E‐03 10.18 N/A 3.13 N/A 14.79 8.98 8.21 N/A 139.20 545.43 1.45 5.82Mar‐05 ‐ Feb‐07 26.53 N/A N/A 2.18E‐03 10.18 N/A 3.09 N/A 14.79 8.98 8.21 N/A 139.18 537.19 1.45 5.81Apr‐05 ‐ Mar‐07 26.47 N/A N/A 2.14E‐03 10.15 N/A 3.03 N/A 14.76 8.95 8.19 N/A 138.85 527.25 1.45 5.80May‐05 ‐ Apr‐07 26.27 N/A N/A 2.09E‐03 10.08 N/A 2.96 N/A 14.65 8.89 8.13 N/A 137.85 514.50 1.44 5.76Jun‐05 ‐ May‐07 26.32 N/A N/A 2.05E‐03 10.10 N/A 2.90 N/A 14.67 8.91 8.15 N/A 138.09 503.96 1.44 5.77Jul‐05 ‐ Jun‐07 26.52 N/A N/A 2.03E‐03 10.17 N/A 2.86 N/A 14.78 8.97 8.21 N/A 139.12 498.05 1.45 5.81Aug‐05 ‐ Jul‐07 26.47 N/A N/A 1.98E‐03 10.15 N/A 2.80 N/A 14.76 8.96 8.20 N/A 138.89 486.76 1.45 5.80Sep‐05 ‐ Aug‐07 26.66 N/A N/A 1.95E‐03 10.23 N/A 2.75 N/A 14.87 9.02 8.25 N/A 139.89 479.03 1.46 5.84Oct‐05 ‐ Sep‐07 26.42 N/A N/A 1.89E‐03 10.13 N/A 2.67 N/A 14.73 8.94 8.18 N/A 138.60 465.47 1.45 5.79Nov‐05 ‐ Oct‐07 26.39 N/A N/A 1.85E‐03 10.12 N/A 2.62 N/A 14.71 8.93 8.17 N/A 138.45 455.27 1.45 5.78Dec‐05 ‐ Nov‐07 26.62 N/A N/A 1.83E‐03 10.21 N/A 2.59 N/A 14.84 9.01 8.24 N/A 139.67 450.23 1.46 5.83
24MonthPeriod
TrinityConsultants Page17of37AugustaExpansionProjectEmissionsAnalysis(20130306JF)
24‐MonRollingAvg‐Kiln3

AppendixB‐EmissionCalculationsWestFraser‐Augusta,Georgia
TableB‐10.Total24‐MonthRollingAverageActualAnnualEmissionsforKiln3(tpy)
CO Fluorides H2S Lead NOX
ReducedSulfurCompounds
(includingH2S) SO2 H2SO4 TotalPM TotalPM10 TotalPM2.5
TotalReducedSulfur
(includingH2S) TotalVOC CO2ebiomassdeferral Formaldehyde Methanol24MonthPeriod
Jan‐06 ‐ Dec‐07 26.06 N/A N/A 1.75E‐03 10.00 N/A 2.48 N/A 14.53 8.82 8.07 N/A 136.73 431.41 1.43 5.71Feb‐06 ‐ Jan‐08 26.07 N/A N/A 1.73E‐03 10.00 N/A 2.45 N/A 14.54 8.82 8.07 N/A 136.80 426.05 1.43 5.72Mar‐06 ‐ Feb‐08 26.04 N/A N/A 1.71E‐03 9.99 N/A 2.42 N/A 14.52 8.81 8.06 N/A 136.61 420.69 1.43 5.71Apr‐06 ‐ Mar‐08 25.60 N/A N/A 1.66E‐03 9.82 N/A 2.34 N/A 14.27 8.66 7.92 N/A 134.30 407.45 1.40 5.61May‐06 ‐ Apr‐08 25.60 N/A N/A 1.64E‐03 9.82 N/A 2.31 N/A 14.27 8.66 7.92 N/A 134.29 402.02 1.40 5.61Jun‐06 ‐ May‐08 25.43 N/A N/A 1.60E‐03 9.75 N/A 2.26 N/A 14.18 8.60 7.87 N/A 133.41 392.75 1.39 5.57Jul‐06 ‐ Jun‐08 25.39 N/A N/A 1.57E‐03 9.74 N/A 2.22 N/A 14.16 8.59 7.86 N/A 133.22 386.46 1.39 5.57Aug‐06 ‐ Jul‐08 25.47 N/A N/A 1.55E‐03 9.77 N/A 2.19 N/A 14.20 8.62 7.89 N/A 133.63 381.40 1.40 5.58Sep‐06 ‐ Aug‐08 25.87 N/A N/A 1.55E‐03 9.92 N/A 2.19 N/A 14.42 8.75 8.01 N/A 135.74 381.87 1.42 5.67Oct‐06 ‐ Sep‐08 25.95 N/A N/A 1.54E‐03 9.95 N/A 2.17 N/A 14.47 8.78 8.03 N/A 136.15 377.56 1.42 5.69Nov‐06 ‐ Oct‐08 26.02 N/A N/A 1.52E‐03 9.98 N/A 2.15 N/A 14.51 8.81 8.06 N/A 136.54 374.43 1.43 5.70Dec‐06 ‐ Nov‐08 26.10 N/A N/A 1.51E‐03 10.01 N/A 2.13 N/A 14.55 8.83 8.08 N/A 136.95 370.98 1.43 5.72Jan‐07 ‐ Dec‐08 25.87 N/A N/A 1.48E‐03 9.92 N/A 2.09 N/A 14.43 8.75 8.01 N/A 135.75 363.05 1.42 5.67Feb‐07 ‐ Jan‐09 25.62 N/A N/A 1.47E‐03 9.83 N/A 2.07 N/A 14.29 8.67 7.93 N/A 134.44 361.18 1.40 5.62Mar‐07 ‐ Feb‐09 25.47 N/A N/A 1.47E‐03 9.77 N/A 2.07 N/A 14.20 8.62 7.88 N/A 133.61 360.72 1.40 5.58Apr‐07 ‐ Mar‐09 25.58 N/A N/A 1.48E‐03 9.81 N/A 2.09 N/A 14.26 8.66 7.92 N/A 134.22 364.64 1.40 5.61May‐07 ‐ Apr‐09 25.86 N/A N/A 1.51E‐03 9.92 N/A 2.13 N/A 14.42 8.75 8.01 N/A 135.70 371.11 1.42 5.67Jun‐07 ‐ May‐09 25.59 N/A N/A 1.50E‐03 9.82 N/A 2.12 N/A 14.27 8.66 7.92 N/A 134.26 369.70 1.40 5.61Jul‐07 ‐ Jun‐09 25.47 N/A N/A 1.51E‐03 9.77 N/A 2.13 N/A 14.20 8.62 7.89 N/A 133.63 370.36 1.40 5.58Aug‐07 ‐ Jul‐09 25.39 N/A N/A 1.51E‐03 9.74 N/A 2.14 N/A 14.16 8.59 7.86 N/A 133.23 371.68 1.39 5.57Sep‐07 ‐ Aug‐09 25.00 N/A N/A 1.50E‐03 9.59 N/A 2.12 N/A 13.94 8.46 7.74 N/A 131.17 368.53 1.37 5.48Oct‐07 ‐ Sep‐09 24.93 N/A N/A 1.50E‐03 9.56 N/A 2.12 N/A 13.90 8.44 7.72 N/A 130.79 369.42 1.37 5.46Nov‐07 ‐ Oct‐09 24.98 N/A N/A 1.52E‐03 9.58 N/A 2.14 N/A 13.93 8.45 7.73 N/A 131.06 372.54 1.37 5.47Dec‐07 ‐ Nov‐09 24.79 N/A N/A 1.51E‐03 9.51 N/A 2.14 N/A 13.82 8.39 7.67 N/A 130.07 372.11 1.36 5.43Jan‐08 ‐ Dec‐09 24.95 N/A N/A 1.53E‐03 9.57 N/A 2.16 N/A 13.91 8.44 7.72 N/A 130.91 376.20 1.37 5.47Feb‐08 ‐ Jan‐10 24.87 N/A N/A 1.54E‐03 9.54 N/A 2.17 N/A 13.86 8.41 7.70 N/A 130.46 377.76 1.36 5.45Mar‐08 ‐ Feb‐10 24.55 N/A N/A 1.52E‐03 9.42 N/A 2.15 N/A 13.69 8.31 7.60 N/A 128.79 374.72 1.35 5.38Apr‐08 ‐ Mar‐10 24.51 N/A N/A 1.53E‐03 9.40 N/A 2.16 N/A 13.67 8.29 7.59 N/A 128.59 376.57 1.34 5.37May‐08 ‐ Apr‐10 24.80 N/A N/A 1.56E‐03 9.51 N/A 2.21 N/A 13.83 8.39 7.68 N/A 130.13 384.55 1.36 5.44Jun‐08 ‐ May‐10 24.85 N/A N/A 1.58E‐03 9.53 N/A 2.23 N/A 13.86 8.41 7.69 N/A 130.40 388.69 1.36 5.45Jul‐08 ‐ Jun‐10 24.97 N/A N/A 1.60E‐03 9.58 N/A 2.26 N/A 13.92 8.45 7.73 N/A 131.02 393.76 1.37 5.47Aug‐08 ‐ Jul‐10 24.86 N/A N/A 1.61E‐03 9.54 N/A 2.27 N/A 13.86 8.41 7.70 N/A 130.44 395.43 1.36 5.45Sep‐08 ‐ Aug‐10 24.51 N/A N/A 1.60E‐03 9.40 N/A 2.26 N/A 13.66 8.29 7.59 N/A 128.58 393.28 1.34 5.37Oct‐08 ‐ Sep‐10 24.46 N/A N/A 1.61E‐03 9.38 N/A 2.27 N/A 13.64 8.28 7.57 N/A 128.34 395.63 1.34 5.36Nov‐08 ‐ Oct‐10 24.59 N/A N/A 1.63E‐03 9.43 N/A 2.30 N/A 13.71 8.32 7.61 N/A 129.03 400.40 1.35 5.39Dec‐08 ‐ Nov‐10 24.43 N/A N/A 1.63E‐03 9.37 N/A 2.30 N/A 13.62 8.27 7.56 N/A 128.18 400.30 1.34 5.35Jan‐09 ‐ Dec‐10 24.88 N/A N/A 1.67E‐03 9.54 N/A 2.35 N/A 13.87 8.42 7.70 N/A 130.51 409.87 1.36 5.45Feb‐09 ‐ Jan‐11 25.21 N/A N/A 1.72E‐03 9.67 N/A 2.42 N/A 14.05 8.53 7.80 N/A 132.24 422.01 1.38 5.52Mar‐09 ‐ Feb‐11 25.42 N/A N/A 1.76E‐03 9.75 N/A 2.48 N/A 14.17 8.60 7.87 N/A 133.35 432.07 1.39 5.57Apr‐09 ‐ Mar‐11 25.35 N/A N/A 1.78E‐03 9.72 N/A 2.52 N/A 14.13 8.58 7.85 N/A 133.00 438.11 1.39 5.56May‐09 ‐ Apr‐11 25.20 N/A N/A 1.80E‐03 9.66 N/A 2.55 N/A 14.05 8.53 7.80 N/A 132.19 443.32 1.38 5.52Jun‐09 ‐ May‐11 25.29 N/A N/A 1.84E‐03 9.70 N/A 2.60 N/A 14.10 8.56 7.83 N/A 132.69 452.67 1.39 5.54Jul‐09 ‐ Jun‐11 25.26 N/A N/A 1.87E‐03 9.69 N/A 2.64 N/A 14.08 8.55 7.82 N/A 132.51 459.17 1.38 5.54Aug‐09 ‐ Jul‐11 25.06 N/A N/A 1.88E‐03 9.61 N/A 2.66 N/A 13.97 8.48 7.76 N/A 131.47 462.33 1.37 5.49Sep‐09 ‐ Aug‐11 25.10 N/A N/A 1.91E‐03 9.63 N/A 2.70 N/A 13.99 8.49 7.77 N/A 131.68 469.98 1.38 5.50Oct‐09 ‐ Sep‐11 25.02 N/A N/A 1.93E‐03 9.60 N/A 2.72 N/A 13.95 8.46 7.74 N/A 131.25 474.13 1.37 5.48Nov‐09 ‐ Oct‐11 24.90 N/A N/A 1.95E‐03 9.55 N/A 2.75 N/A 13.88 8.42 7.71 N/A 130.63 479.33 1.36 5.46Dec‐09 ‐ Nov‐11 24.38 N/A N/A 1.93E‐03 9.35 N/A 2.73 N/A 13.59 8.25 7.55 N/A 127.92 474.54 1.34 5.34Jan‐10 ‐ Dec‐11 24.50 N/A N/A 1.97E‐03 9.40 N/A 2.78 N/A 13.66 8.29 7.58 N/A 128.52 483.33 1.34 5.37
TrinityConsultants Page18of37AugustaExpansionProjectEmissionsAnalysis(20130306JF)
24‐MonRollingAvg‐Kiln3

AppendixB‐EmissionCalculationsWestFraser‐Augusta,Georgia
TableB‐11.Total24‐MonthRollingAverageActualAnnualEmissionsforAllKilns(tpy)
CO Fluorides H2S Lead NOX
ReducedSulfurCompounds
(includingH2S) SO2 H2SO4 TotalPM TotalPM10 TotalPM2.5
TotalReducedSulfur
(includingH2S) TotalVOC CO2ebiomassdeferral
Form‐aldehyde Methanol
Jan‐02 ‐ Dec‐03 46.19 N/A N/A 4.20E‐03 17.72 N/A 5.93 N/A 25.75 15.63 14.30 N/A 242.33 1,032.17 2.53 10.12Feb‐02 ‐ Jan‐04 46.16 N/A N/A 4.20E‐03 17.71 N/A 5.93 N/A 25.74 15.62 14.29 N/A 242.20 1,031.53 2.53 10.12Mar‐02 ‐ Feb‐04 46.07 N/A N/A 4.19E‐03 17.67 N/A 5.91 N/A 25.68 15.59 14.26 N/A 241.69 1,029.28 2.52 10.10Apr‐02 ‐ Mar‐04 46.00 N/A N/A 4.18E‐03 17.64 N/A 5.90 N/A 25.64 15.56 14.24 N/A 241.32 1,027.65 2.52 10.08May‐02 ‐ Apr‐04 45.99 N/A N/A 4.18E‐03 17.64 N/A 5.90 N/A 25.64 15.56 14.24 N/A 241.31 1,027.52 2.52 10.08Jun‐02 ‐ May‐04 45.88 N/A N/A 4.17E‐03 17.60 N/A 5.89 N/A 25.58 15.52 14.20 N/A 240.70 1,024.86 2.51 10.06Jul‐02 ‐ Jun‐04 45.86 N/A N/A 4.17E‐03 17.59 N/A 5.88 N/A 25.57 15.52 14.20 N/A 240.58 1,024.27 2.51 10.05Aug‐02 ‐ Jul‐04 44.86 N/A N/A 4.08E‐03 17.21 N/A 5.76 N/A 25.01 15.18 13.89 N/A 235.38 1,002.45 2.46 9.83Sep‐02 ‐ Aug‐04 44.00 N/A N/A 4.00E‐03 16.88 N/A 5.65 N/A 24.53 14.89 13.62 N/A 230.84 983.36 2.41 9.64Oct‐02 ‐ Sep‐04 43.91 N/A N/A 3.99E‐03 16.84 N/A 5.64 N/A 24.48 14.86 13.60 N/A 230.40 981.43 2.41 9.62Nov‐02 ‐ Oct‐04 44.02 N/A N/A 4.00E‐03 16.89 N/A 5.65 N/A 24.54 14.90 13.63 N/A 230.97 983.71 2.41 9.65Dec‐02 ‐ Nov‐04 43.83 N/A N/A 3.98E‐03 16.81 N/A 5.63 N/A 24.44 14.83 13.57 N/A 229.94 979.34 2.40 9.61Jan‐03 ‐ Dec‐04 44.28 N/A N/A 4.02E‐03 16.99 N/A 5.68 N/A 24.69 14.98 13.71 N/A 232.33 989.24 2.43 9.71Feb‐03 ‐ Jan‐05 44.15 N/A N/A 4.01E‐03 16.94 N/A 5.66 N/A 24.62 14.94 13.67 N/A 231.65 984.84 2.42 9.68Mar‐03 ‐ Feb‐05 43.94 N/A N/A 3.98E‐03 16.86 N/A 5.62 N/A 24.50 14.87 13.60 N/A 230.56 978.80 2.41 9.63Apr‐03 ‐ Mar‐05 44.35 N/A N/A 4.01E‐03 17.01 N/A 5.67 N/A 24.73 15.01 13.73 N/A 232.70 986.49 2.43 9.72May‐03 ‐ Apr‐05 44.92 N/A N/A 4.06E‐03 17.23 N/A 5.73 N/A 25.05 15.20 13.91 N/A 235.69 997.75 2.46 9.85Jun‐03 ‐ May‐05 45.17 N/A N/A 4.07E‐03 17.33 N/A 5.75 N/A 25.18 15.28 13.98 N/A 236.99 1,001.63 2.48 9.90Jul‐03 ‐ Jun‐05 45.31 N/A N/A 4.08E‐03 17.38 N/A 5.76 N/A 25.26 15.33 14.03 N/A 237.71 1,003.29 2.48 9.93Aug‐03 ‐ Jul‐05 45.95 N/A N/A 4.13E‐03 17.62 N/A 5.84 N/A 25.62 15.55 14.23 N/A 241.07 1,016.13 2.52 10.07Sep‐03 ‐ Aug‐05 46.26 N/A N/A 4.15E‐03 17.74 N/A 5.87 N/A 25.79 15.65 14.32 N/A 242.70 1,021.53 2.53 10.14Oct‐03 ‐ Sep‐05 46.63 N/A N/A 4.18E‐03 17.88 N/A 5.91 N/A 26.00 15.78 14.43 N/A 244.63 1,028.25 2.55 10.22Nov‐03 ‐ Oct‐05 46.96 N/A N/A 4.21E‐03 18.01 N/A 5.94 N/A 26.18 15.89 14.54 N/A 246.37 1,034.25 2.57 10.29Dec‐03 ‐ Nov‐05 46.95 N/A N/A 4.20E‐03 18.01 N/A 5.93 N/A 26.18 15.89 14.54 N/A 246.35 1,032.82 2.57 10.29Jan‐04 ‐ Dec‐05 47.80 N/A N/A 4.27E‐03 18.33 N/A 6.03 N/A 26.65 16.17 14.80 N/A 250.79 1,050.26 2.62 10.48Feb‐04 ‐ Jan‐06 47.91 N/A N/A 4.26E‐03 18.38 N/A 6.02 N/A 26.71 16.21 14.83 N/A 251.35 1,047.90 2.63 10.50Mar‐04 ‐ Feb‐06 47.99 N/A N/A 4.25E‐03 18.41 N/A 6.01 N/A 26.76 16.24 14.86 N/A 251.80 1,045.70 2.63 10.52Apr‐04 ‐ Mar‐06 48.73 N/A N/A 4.29E‐03 18.69 N/A 6.07 N/A 27.17 16.49 15.09 N/A 255.68 1,055.93 2.67 10.68May‐04 ‐ Apr‐06 49.01 N/A N/A 4.30E‐03 18.80 N/A 6.07 N/A 27.33 16.58 15.17 N/A 257.15 1,057.04 2.69 10.74Jun‐04 ‐ May‐06 49.54 N/A N/A 4.32E‐03 19.00 N/A 6.11 N/A 27.62 16.76 15.34 N/A 259.90 1,062.88 2.71 10.86Jul‐04 ‐ Jun‐06 49.78 N/A N/A 4.32E‐03 19.10 N/A 6.11 N/A 27.76 16.84 15.41 N/A 261.19 1,063.18 2.73 10.91Aug‐04 ‐ Jul‐06 51.17 N/A N/A 4.43E‐03 19.63 N/A 6.25 N/A 28.53 17.31 15.84 N/A 268.47 1,088.55 2.80 11.22Sep‐04 ‐ Aug‐06 51.80 N/A N/A 4.47E‐03 19.87 N/A 6.31 N/A 28.88 17.53 16.04 N/A 271.77 1,097.98 2.84 11.35Oct‐04 ‐ Sep‐06 51.74 N/A N/A 4.44E‐03 19.84 N/A 6.28 N/A 28.84 17.51 16.02 N/A 271.43 1,092.71 2.83 11.34Nov‐04 ‐ Oct‐06 51.19 N/A N/A 4.38E‐03 19.63 N/A 6.19 N/A 28.54 17.32 15.85 N/A 268.56 1,077.25 2.80 11.22Dec‐04 ‐ Nov‐06 51.10 N/A N/A 4.36E‐03 19.60 N/A 6.16 N/A 28.49 17.29 15.82 N/A 268.11 1,071.49 2.80 11.20Jan‐05 ‐ Dec‐06 50.53 N/A N/A 4.29E‐03 19.38 N/A 6.07 N/A 28.17 17.10 15.64 N/A 265.12 1,055.80 2.77 11.08Feb‐05 ‐ Jan‐07 50.37 N/A N/A 4.26E‐03 19.32 N/A 6.01 N/A 28.08 17.04 15.59 N/A 264.25 1,046.59 2.76 11.04Mar‐05 ‐ Feb‐07 50.28 N/A N/A 4.23E‐03 19.29 N/A 5.97 N/A 28.03 17.01 15.57 N/A 263.81 1,039.41 2.76 11.02Apr‐05 ‐ Mar‐07 49.77 N/A N/A 4.16E‐03 19.09 N/A 5.87 N/A 27.75 16.84 15.41 N/A 261.13 1,021.93 2.73 10.91May‐05 ‐ Apr‐07 49.34 N/A N/A 4.10E‐03 18.93 N/A 5.80 N/A 27.51 16.70 15.28 N/A 258.89 1,008.98 2.70 10.82Jun‐05 ‐ May‐07 48.86 N/A N/A 4.01E‐03 18.74 N/A 5.66 N/A 27.24 16.53 15.13 N/A 256.37 985.06 2.68 10.71Jul‐05 ‐ Jun‐07 48.96 N/A N/A 3.99E‐03 18.78 N/A 5.64 N/A 27.30 16.57 15.16 N/A 256.89 980.98 2.68 10.73Aug‐05 ‐ Jul‐07 48.75 N/A N/A 3.95E‐03 18.70 N/A 5.57 N/A 27.18 16.50 15.09 N/A 255.78 970.10 2.67 10.69Sep‐05 ‐ Aug‐07 48.79 N/A N/A 3.90E‐03 18.71 N/A 5.51 N/A 27.20 16.51 15.11 N/A 255.99 958.91 2.67 10.69Oct‐05 ‐ Sep‐07 48.43 N/A N/A 3.85E‐03 18.58 N/A 5.44 N/A 27.00 16.39 14.99 N/A 254.11 947.79 2.65 10.62Nov‐05 ‐ Oct‐07 48.28 N/A N/A 3.82E‐03 18.52 N/A 5.40 N/A 26.92 16.34 14.95 N/A 253.31 939.16 2.65 10.58Dec‐05 ‐ Nov‐07 48.14 N/A N/A 3.77E‐03 18.46 N/A 5.33 N/A 26.84 16.29 14.90 N/A 252.57 928.03 2.64 10.55
24MonthPeriod
TrinityConsultants Page19of37AugustaExpansionProjectEmissionsAnalysis(20130306JF)
24‐MonRollingAvg‐Kilns1‐3

AppendixB‐EmissionCalculationsWestFraser‐Augusta,Georgia
TableB‐11.Total24‐MonthRollingAverageActualAnnualEmissionsforAllKilns(tpy)
CO Fluorides H2S Lead NOX
ReducedSulfurCompounds
(includingH2S) SO2 H2SO4 TotalPM TotalPM10 TotalPM2.5
TotalReducedSulfur
(includingH2S) TotalVOC CO2ebiomassdeferral
Form‐aldehyde Methanol24MonthPeriod
Jan‐06 ‐ Dec‐07 47.16 N/A N/A 3.68E‐03 18.09 N/A 5.19 N/A 26.29 15.96 14.60 N/A 247.43 903.73 2.58 10.34Feb‐06 ‐ Jan‐08 46.87 N/A N/A 3.71E‐03 17.98 N/A 5.25 N/A 26.13 15.86 14.51 N/A 245.93 913.35 2.57 10.27Mar‐06 ‐ Feb‐08 46.54 N/A N/A 3.72E‐03 17.85 N/A 5.25 N/A 25.95 15.75 14.41 N/A 244.18 913.47 2.55 10.20Apr‐06 ‐ Mar‐08 45.34 N/A N/A 3.67E‐03 17.39 N/A 5.18 N/A 25.28 15.34 14.04 N/A 237.89 901.45 2.48 9.94May‐06 ‐ Apr‐08 44.55 N/A N/A 3.57E‐03 17.09 N/A 5.05 N/A 24.84 15.07 13.79 N/A 233.75 878.62 2.44 9.77Jun‐06 ‐ May‐08 43.63 N/A N/A 3.47E‐03 16.73 N/A 4.90 N/A 24.32 14.76 13.51 N/A 228.88 852.37 2.39 9.56Jul‐06 ‐ Jun‐08 42.81 N/A N/A 3.37E‐03 16.42 N/A 4.76 N/A 23.87 14.48 13.25 N/A 224.58 828.90 2.35 9.38Aug‐06 ‐ Jul‐08 42.26 N/A N/A 3.29E‐03 16.21 N/A 4.65 N/A 23.56 14.30 13.08 N/A 221.74 809.67 2.32 9.26Sep‐06 ‐ Aug‐08 42.28 N/A N/A 3.25E‐03 16.22 N/A 4.60 N/A 23.57 14.31 13.09 N/A 221.84 800.16 2.32 9.27Oct‐06 ‐ Sep‐08 42.35 N/A N/A 3.30E‐03 16.24 N/A 4.66 N/A 23.61 14.33 13.11 N/A 222.19 811.58 2.32 9.28Nov‐06 ‐ Oct‐08 42.40 N/A N/A 3.36E‐03 16.26 N/A 4.75 N/A 23.64 14.35 13.13 N/A 222.48 827.01 2.32 9.29Dec‐06 ‐ Nov‐08 42.22 N/A N/A 3.35E‐03 16.19 N/A 4.73 N/A 23.54 14.28 13.07 N/A 221.49 822.81 2.31 9.25Jan‐07 ‐ Dec‐08 41.88 N/A N/A 3.32E‐03 16.06 N/A 4.69 N/A 23.35 14.17 12.97 N/A 219.72 817.06 2.29 9.18Feb‐07 ‐ Jan‐09 41.09 N/A N/A 3.27E‐03 15.76 N/A 4.61 N/A 22.91 13.90 12.72 N/A 215.57 802.93 2.25 9.01Mar‐07 ‐ Feb‐09 40.44 N/A N/A 3.20E‐03 15.51 N/A 4.52 N/A 22.55 13.68 12.52 N/A 212.19 787.12 2.22 8.86Apr‐07 ‐ Mar‐09 40.58 N/A N/A 3.26E‐03 15.57 N/A 4.61 N/A 22.63 13.73 12.56 N/A 212.91 802.13 2.22 8.89May‐07 ‐ Apr‐09 40.67 N/A N/A 3.29E‐03 15.60 N/A 4.64 N/A 22.67 13.76 12.59 N/A 213.35 807.99 2.23 8.91Jun‐07 ‐ May‐09 40.48 N/A N/A 3.34E‐03 15.53 N/A 4.72 N/A 22.57 13.70 12.53 N/A 212.40 821.70 2.22 8.87Jul‐07 ‐ Jun‐09 40.18 N/A N/A 3.37E‐03 15.41 N/A 4.76 N/A 22.40 13.60 12.44 N/A 210.83 828.48 2.20 8.81Aug‐07 ‐ Jul‐09 39.70 N/A N/A 3.34E‐03 15.23 N/A 4.72 N/A 22.14 13.43 12.29 N/A 208.31 822.00 2.18 8.70Sep‐07 ‐ Aug‐09 39.14 N/A N/A 3.36E‐03 15.01 N/A 4.75 N/A 21.82 13.24 12.12 N/A 205.33 826.90 2.14 8.58Oct‐07 ‐ Sep‐09 38.64 N/A N/A 3.34E‐03 14.82 N/A 4.71 N/A 21.55 13.08 11.96 N/A 202.75 820.15 2.12 8.47Nov‐07 ‐ Oct‐09 38.50 N/A N/A 3.35E‐03 14.77 N/A 4.74 N/A 21.47 13.03 11.92 N/A 202.01 824.85 2.11 8.44Dec‐07 ‐ Nov‐09 38.32 N/A N/A 3.37E‐03 14.70 N/A 4.76 N/A 21.36 12.96 11.86 N/A 201.03 827.95 2.10 8.40Jan‐08 ‐ Dec‐09 38.19 N/A N/A 3.36E‐03 14.65 N/A 4.75 N/A 21.29 12.92 11.82 N/A 200.38 826.87 2.09 8.37Feb‐08 ‐ Jan‐10 37.87 N/A N/A 3.28E‐03 14.52 N/A 4.64 N/A 21.11 12.81 11.72 N/A 198.66 807.52 2.07 8.30Mar‐08 ‐ Feb‐10 37.38 N/A N/A 3.25E‐03 14.34 N/A 4.59 N/A 20.84 12.65 11.57 N/A 196.10 799.31 2.05 8.19Apr‐08 ‐ Mar‐10 37.74 N/A N/A 3.34E‐03 14.48 N/A 4.71 N/A 21.04 12.77 11.68 N/A 198.02 820.42 2.07 8.27May‐08 ‐ Apr‐10 38.36 N/A N/A 3.46E‐03 14.71 N/A 4.89 N/A 21.39 12.98 11.88 N/A 201.27 850.67 2.10 8.41Jun‐08 ‐ May‐10 38.78 N/A N/A 3.59E‐03 14.88 N/A 5.07 N/A 21.62 13.12 12.01 N/A 203.47 881.81 2.13 8.50Jul‐08 ‐ Jun‐10 38.97 N/A N/A 3.62E‐03 14.95 N/A 5.11 N/A 21.73 13.19 12.07 N/A 204.46 889.06 2.14 8.54Aug‐08 ‐ Jul‐10 39.11 N/A N/A 3.69E‐03 15.00 N/A 5.21 N/A 21.81 13.23 12.11 N/A 205.19 906.29 2.14 8.57Sep‐08 ‐ Aug‐10 38.87 N/A N/A 3.82E‐03 14.91 N/A 5.39 N/A 21.67 13.15 12.04 N/A 203.96 938.66 2.13 8.52Oct‐08 ‐ Sep‐10 38.86 N/A N/A 3.85E‐03 14.91 N/A 5.44 N/A 21.67 13.15 12.03 N/A 203.90 946.18 2.13 8.52Nov‐08 ‐ Oct‐10 39.27 N/A N/A 3.91E‐03 15.06 N/A 5.53 N/A 21.89 13.29 12.16 N/A 206.04 962.16 2.15 8.61Dec‐08 ‐ Nov‐10 39.23 N/A N/A 3.97E‐03 15.05 N/A 5.60 N/A 21.87 13.27 12.14 N/A 205.81 975.25 2.15 8.60Jan‐09 ‐ Dec‐10 40.04 N/A N/A 4.11E‐03 15.36 N/A 5.80 N/A 22.32 13.55 12.39 N/A 210.05 1,010.23 2.19 8.77Feb‐09 ‐ Jan‐11 40.70 N/A N/A 4.22E‐03 15.61 N/A 5.97 N/A 22.69 13.77 12.60 N/A 213.51 1,038.45 2.23 8.92Mar‐09 ‐ Feb‐11 41.50 N/A N/A 4.41E‐03 15.92 N/A 6.22 N/A 23.14 14.04 12.85 N/A 217.75 1,083.38 2.27 9.10Apr‐09 ‐ Mar‐11 41.71 N/A N/A 4.49E‐03 16.00 N/A 6.35 N/A 23.26 14.11 12.91 N/A 218.85 1,104.58 2.29 9.14May‐09 ‐ Apr‐11 41.83 N/A N/A 4.58E‐03 16.04 N/A 6.47 N/A 23.32 14.15 12.95 N/A 219.45 1,125.48 2.29 9.17Jun‐09 ‐ May‐11 42.19 N/A N/A 4.66E‐03 16.18 N/A 6.58 N/A 23.52 14.28 13.06 N/A 221.35 1,145.26 2.31 9.25Jul‐09 ‐ Jun‐11 42.34 N/A N/A 4.72E‐03 16.24 N/A 6.67 N/A 23.60 14.32 13.11 N/A 222.12 1,160.81 2.32 9.28Aug‐09 ‐ Jul‐11 42.19 N/A N/A 4.76E‐03 16.18 N/A 6.73 N/A 23.52 14.28 13.06 N/A 221.37 1,171.08 2.31 9.25Sep‐09 ‐ Aug‐11 42.09 N/A N/A 4.76E‐03 16.14 N/A 6.73 N/A 23.47 14.24 13.03 N/A 220.82 1,170.98 2.31 9.23Oct‐09 ‐ Sep‐11 41.88 N/A N/A 4.76E‐03 16.06 N/A 6.72 N/A 23.35 14.17 12.97 N/A 219.72 1,170.43 2.29 9.18Nov‐09 ‐ Oct‐11 41.81 N/A N/A 4.80E‐03 16.04 N/A 6.79 N/A 23.31 14.15 12.94 N/A 219.37 1,181.35 2.29 9.16Dec‐09 ‐ Nov‐11 41.11 N/A N/A 4.77E‐03 15.77 N/A 6.74 N/A 22.92 13.91 12.73 N/A 215.71 1,172.51 2.25 9.01Jan‐10 ‐ Dec‐11 41.42 N/A N/A 4.84E‐03 15.89 N/A 6.84 N/A 23.09 14.02 12.82 N/A 217.33 1,190.84 2.27 9.08
TrinityConsultants Page20of37AugustaExpansionProjectEmissionsAnalysis(20130306JF)
24‐MonRollingAvg‐Kilns1‐3

AppendixB‐EmissionCalculationsWestFraser‐Augusta,Georgia
TableB‐12.SummaryofSelectedBaselinePeriodsandEmissions
StartMonth EndMonth
NSRPollutantsCO Sep‐05 Aug‐06 51.80Fluorides N/A N/A N/AH2S N/A N/A N/ALead Jan‐10 Dec‐11 4.84E‐03NOX Sep‐05 Aug‐06 19.87ReducedSulfurCompounds(includingH2S) N/A N/A N/ASO2 Jan‐10 Dec‐11 6.84H2SO4 N/A N/A N/ATotalPM Sep‐05 Aug‐06 28.88TotalPM10 Sep‐05 Aug‐06 17.53TotalPM2.5 Sep‐05 Aug‐06 16.04TotalReducedSulfur(includingH2S) N/A N/A N/ATotalVOC Sep‐05 Aug‐06 271.77
GreenhouseGases
CO2ebiomassdeferral Jan‐10 Dec‐11 1190.84
HAPsFormaldehyde Sep‐05 Aug‐06 2.84Methanol Sep‐05 Aug‐06 11.35
Pollutant
TotalEmissionsforKilns1‐3BaselinePeriod Baseline
Emissions(tpy)
TrinityConsultants Page21of37AugustaExpansionProjectEmissionsAnalysis(20130306JF)
SelectionofBaseline

AppendixB‐EmissionCalculationsWestFraser‐Augusta,Georgia
TableB‐13.NCASIEmissionFactorsforDirect‐FiredContinuousKilns
Pollutant Reference
CriteriaNOX 0.28 lb/MBF 3TotalVOC 3.83 lb/MBF 4CO 0.73 lb/MBF 5TotalPM 0.14 lb/MBF 6TotalPM10 0.104 lb/MBF 6TotalPM2.5 0.099 lb/MBF 6SO2 0.025 lb/MMBtu 7
GreenhouseGasesCO2 206.79 lb/MMBtu 8CH4 7.1E‐02 lb/MMBtu 8N2O 9.3E‐03 lb/MMBtu 8
CO2e 211.15 lb/MMBtu 9CO2ebiomassdeferral 4.35 lb/MMBtu 10
3.ProvidedbyDr.DavidWordofNCASItotheWeyerhaeuserfacility.
4.TotalVOC(lb/MBF)asrequestedbyEPD.
8.PerU.S.EPA'sAP‐42,Section1‐6,WoodResidueCombustioninBoiler s(Sept.2003).
CO2 1
CH4 21
N2O 310
12.Pursuantto40CFRPart98.2(b)(2),biogeniccarbondioxideemissions(e.g.,frombiomass)areexcluded.
AsprintedintheMay2010Weyerhaeuser‐Plymouth,NCpermitapplication 1 andtheNCDAQAirPermitReview/PreliminaryDeterminationdocument 2
EmissionFactor
1."FinalReport‐RevisedAirPermitApplicationforEnergyProject,"WeyerhaeuserNRCompany‐LumberTechnologies,Plymouth,NC,May2010(Permit#06389/T19).2.NorthCarolinaDivisionofAirQuality(NCDAQ)AirPermitReview/PreliminaryDeterminationfortheWeyerhaeuserNRCompany,Plymouth,NCfacilitypermitapplication(May2010),writtenbyJennyKelvingtonofNCDAQ.
5.BasedontheaverageofNCASItestresultsasprovidedviaemailfromDr.WordofNCASItoNCDAQ,aspublishedintheAirPermitReview/PreliminaryDetermination,p.8.
9.Per40CFRPart98,SubpartC,TablesC‐1andC‐2.TheCO2emissionfactoristhedefaultfactorforwoodandwoodresiduals,andtheCH4andN2Oemissionfactorsarethedefaultfactorsforallsolidbiomassfuels.10.TheCO2efactoriscalculatedbasedontheemissionfactorsforCO 2,CH4,andN2Oandtheglobalwarmingpotential(GWP)foreachpollutantper40CFR98,SubpartA,TableA‐1:
6.BasedonpreliminarydeterminationforSimpsonLumberCompany,LLC,thebestavailableemissionfactorsforparticulaterelatedemissionsarebasedontestsconductedatBiblerBrothersLumberCompany,Russelville,AR.TheBiblerBrothersdataisforfilterablePMonly.ThefilterablePMemissionfactoris0.068lb/MBF.CondensablePMisbasedonunpublisheddataprovidedbyNCASI.NCASIrecommendsaratioofCondensabletoFilterablePMof1.016.TheCondensablePMemissionfactorusedistherefore0.069lb/MBF.FilterablePM10isassumedtobe50%offilterablePM(basedonPermitNO.2421‐107‐0011‐V‐02‐3issuedtoRayonierWoodProductsLLC‐SwainsboroSawmill).FilterablePM2.5isassumedtobe87%ofPM10basedonAP‐42forwoodcombustion.AllcondensablePMisassumedtobePM10andPM2.5.
TrinityConsultants Page22of37AugustaExpansionProjectEmissionsAnalysis(20130306JF)
ContinuousKilnEFs

AppendixB‐EmissionCalculationsWestFraser‐Augusta,Georgia
TableB‐14.NCASIEmissionFactorsforHAPs/TAPsfromDirect‐FiredContinuousKilns
Pollutant CASNo. HAP? TAP? Reference
Acetaldehyde 75‐07‐0 Yes Yes 0.058 lb/MBF 1Acetophenone 98‐86‐2 Yes Yes 2.60E‐07 lb/MMBtu 2Acrolein 107‐02‐8 Yes Yes 1.90E‐04 lb/MMBtu 3Antimony 7440‐36‐0 Yes Yes 7.90E‐06 lb/MMBtu 4Arsenic 7440‐38‐2 Yes Yes 3.70E‐06 lb/MMBtu 5Barium 7440‐39‐3 No Yes 2.00E‐05 lb/MMBtu 5Benzene 71‐43‐2 Yes Yes 2.70E‐04 lb/MMBtu 5Benzo(a)pyrene 50‐32‐8 Yes Yes 2.60E‐06 lb/MMBtu 4Beryllium 7440‐41‐7 Yes Yes 8.20E‐07 lb/MMBtu 2n‐Butyraldehyde 123‐72‐8 No Yes 6.10E‐05 lb/MMBtu 5Di(2‐ethylhexyl)phthalate 117‐81‐7 Yes Yes 4.70E‐08 lb/MMBtu 2Cadmium 7440‐43‐9 Yes Yes 4.70E‐06 lb/MMBtu 2Carbondisulfide 75‐15‐0 Yes Yes 1.30E‐04 lb/MMBtu 5Carbontetrachloride 56‐23‐5 Yes Yes 8.90E‐07 lb/MMBtu 5Chlorine 7782‐50‐5 Yes Yes 7.90E‐04 lb/MMBtu 4Chlorobenzene 108‐90‐7 Yes Yes 5.50E‐10 lb/MMBtu 2Chloroform 67‐66‐3 Yes Yes 3.70E‐05 lb/MMBtu 5Chromium 7440‐47‐3 Yes Yes 6.60E‐06 lb/MMBtu 5ChromiumVI 18540‐29‐9 Yes Yes 7.30E‐06 lb/MMBtu 2,6Cobalt 7440‐48‐4 Yes Yes 4.20E‐04 lb/MMBtu 2Copper 7440‐50‐8 No Yes 1.30E‐05 lb/MMBtu 5Crotonaldehyde 4170‐30‐3 No Yes 1.10E‐05 lb/MMBtu 5Cumene 98‐82‐8 Yes Yes 1.80E‐05 lb/MMBtu 5Dibutylphthalate 84‐74‐2 Yes Yes 3.30E‐05 lb/MMBtu 22,4‐Dinitrophenol 51‐28‐5 Yes Yes 2.60E‐07 lb/MMBtu 22,4‐Dinitrotoluene 121‐14‐2 Yes Yes 9.40E‐07 lb/MMBtu 2Dioxin(as2,3,7,8‐TCDD) 1746‐01‐6 Yes Yes 8.60E‐12 lb/MMBtu 4Ethylbenzene 100‐41‐4 Yes Yes 6.80E‐06 lb/MMBtu 2Ethylenedichloride 107‐06‐2 Yes Yes 2.90E‐05 lb/MMBtu 2Formaldehyde 50‐00‐0 Yes Yes 0.04 lb/MBF 3Hexachlorobenzene 118‐74‐1 Yes Yes 1.00E‐06 lb/MMBtu 2Hexane 110‐54‐3 Yes Yes 2.90E‐04 lb/MMBtu 5Hydrochloricacid 7647‐01‐0 Yes Yes 2.30E‐03 lb/MMBtu 3Isopropanol 67‐63‐0 No Yes 3.00E‐03 lb/MMBtu 5Lead 7439‐92‐1 Yes Yes 1.77E‐05 lb/MMBtu 3Manganese 7439‐96‐5 Yes Yes 1.81E‐03 lb/MMBtu 3Mercury 7439‐97‐6 Yes Yes 5.00E‐07 lb/MMBtu 3Methanol 67‐56‐1 Yes Yes 0.16 lb/MBF 3Methylbromide 74‐83‐9 Yes Yes 1.50E‐05 lb/MMBtu 2Methylchloride 74‐87‐3 Yes Yes 2.30E‐05 lb/MMBtu 5Methylchloroform 71‐55‐6 Yes Yes 4.20E‐05 lb/MMBtu 5Methylethylketone 78‐93‐3 No Yes 2.40E‐08 lb/MMBtu 2Methylisobutylketone 108‐10‐1 Yes Yes 0.001 lb/MBF 7Methylenechloride 75‐09‐2 Yes Yes 3.50E‐04 lb/MMBtu 5Naphthalene 91‐20‐3 Yes Yes 2.80E‐05 lb/MMBtu 3Nickel 7440‐02‐0 Yes Yes 4.80E‐06 lb/MMBtu 52‐Nitrophenol 88‐75‐5 No Yes 4.20E‐08 lb/MMBtu 54‐Nitrophenol 100‐02‐7 Yes Yes 1.20E‐07 lb/MMBtu 2PAC ‐‐ Yes Yes 7.83E‐05 lb/ton 8Pentachlorophenol 87‐86‐5 Yes Yes 4.80E‐08 lb/MMBtu 2Phenol 108‐95‐2 Yes Yes 0.022 lb/MBF 1Phosphorus 7723‐14‐0 Yes Yes 9.90E‐05 lb/MMBtu 2POM ‐‐ Yes Yes 2.88E‐05 lb/MMBtu 2,4Propionaldehyde 123‐38‐6 Yes Yes 5.90E‐04 lb/MMBtu 3Propylenedichloride 78‐87‐5 Yes Yes 3.30E‐05 lb/MMBtu 2Selenium 7782‐49‐2 Yes Yes 6.20E‐06 lb/MMBtu 2Silver 7440‐22‐4 No Yes 9.90E‐07 lb/MMBtu 5Styrene 100‐42‐5 Yes Yes 3.20E‐05 lb/MMBtu 5Tetrachloroethylene 127‐18‐4 Yes Yes 3.82E‐05 lb/MMBtu 9Thallium 7440‐28‐0 No Yes 1.90E‐06 lb/MMBtu 5Toluene 108‐88‐3 Yes Yes 0.0001 lb/MBF 71,2,4‐Trichlorobenzene 120‐82‐1 Yes Yes 5.50E‐05 lb/MMBtu 21,1,2‐Trichloroethane 79‐00‐5 Yes Yes 1.20E‐04 lb/MMBtu 2Trichloroethylene 79‐01‐6 Yes Yes 3.90E‐05 lb/MMBtu 5Trichlorofluoromethane 75‐69‐4 No Yes 4.10E‐05 lb/MMBtu 52,4,6‐Trichlorophenol 88‐06‐2 Yes Yes 2.40E‐08 lb/MMBtu 2Vinylchloride 75‐01‐4 Yes Yes 1.80E‐05 lb/MMBtu 2Xylenes 1330‐20‐7 Yes Yes 2.60E‐06 lb/MMBtu 2
2.PerNCASITBNo.858,Tables20Aand20B,February2003,aspublishedintheWeyerhaeuserairpermitapplication.
3.PerNCASISARA313Guidance‐WoodProducts‐April2009,aspublishedintheWeyerhaeuserairpermitapplication.4.PerU.S.EPA'sAP‐42,Section1‐6,WoodResidueCombustioninBoiler s(Sept.2003).
9.Valuelistedin"FinalReport‐RevisedAirPermitApplicationforEnergyProject,"WeyerhaeuserNRCompany‐LumberTechnologies,Plymouth,NC,May2010(Permit#06389/T19).
EmissionFactor
1.Lumber‐PlywoodTRIWorkbook2001,Revision2,June2002,byWeyerhaeuserEnvironmentalTechnologyandScience,asreferencedintheMay20120WeyerhaeuserPlymouthLumberMillRevisedAirPermitApplicationforEnergyProject.
5.PerNCASITBNo.858,Tables20Aand20B,asusedintheTitleVrenewalapplicationfortheWestFraserfacilityinAugusta,Georgia(March2011,permit2421‐245‐0047‐V‐04‐0).6.BasedonaJuly7,1999memofromNCDAQ,thechromiumVIcompoundsrepresentedarechromicacidemissionscalculatedintermsofthechromiumVIequivalents,asreferencedintheMay20120WeyerhaeuserPlymouthLumberMillRevisedAirPermitApplicationforEnergyProject.7.PerNCASITB845,asusedintheTitleVrenewalapplicationfortheWestFraserfacilityinAugusta,Georgia(March2011,permit2421‐245‐0047‐V‐04‐0).8.PertheNCASIpublicationforWoodProductsFacilities,,asusedintheTitleVrenewalapplicationfortheWestFraserfacilityinAugusta,Georgia(March2011,permit2421‐245‐0047‐V‐04‐0).
TrinityConsultants Page23of37AugustaExpansionProjectEmissionsAnalysis(20130306JF)
ContinuousKilnEFs

AppendixB‐EmissionCalculationsWestFraser‐Augusta,Georgia
TableB‐15.VOCasCarbonEmissionsfromDirect‐FiredDryingKilns1
Number
Test1Test2Test3Test4Test5Test6Test7Test8Test9Test10Test11Test12Test13Test14Test15Test16Test17
Test1Test2Test3
Test1Test2Test3
Avg.ofNCASINumbersMax.ofNCASINumbers
TableB‐16.CarbonMonoxideEmissionsfromDirect‐FiredDryingKilns1
NumberCO
(lb/MBF)
Test1 0.75Test2 0.44Test3 0.51Test4 0.57Test5 0.92Test6 1.0Test7 0.92
Avg.ofNCASINumbers 0.73Max.ofNCASINumbers 1.0
2.83
VOCasCarbon(lb/MBF)
UnpublishedNCASITestData3.662.462.752.724.994.73.72.872.42
OtherUnpublishedNCASITestData
3.162.072.891.612.852.782.82
PublishedNCASITestData4.24.74.2
1.DatatakenfromtheNCDAQAirPermitReview/PreliminaryDeterminationfortheWeyerhaueserapplication,providedtoNCDAQbyDr.DavidWordofNCASI.Valuesexcludetestdatathatdoesnotspecifythedryingofsouthernyellowpine.
1.DatatakenfromtheNCDAQAirPermitReview/PreliminaryDeterminationfortheWeyerhaueserapplication,providedtoNCDAQbyDr.DavidWordofNCASI.
2.93.43.6
3.234.99
TrinityConsultants Page24of37AugustaExpansionProjectEmissionsAnalysis(20130306JF)
ContinuousKilnEFs

AppendixB‐EmissionCalculationsWestFraser‐Augusta,Georgia
TableB‐17.ContinuousKilnInformation
BurnerCapacity1 FuelHHV2
AnnualHoursofOperation
KilnID (MMBtu/hr) (Btu/lb) (hrs/yr) (MBF/hr) (MMBF/yr)
ContinuousKiln1(KD04) 35 4,500 8,760 12.6 110ContinuousKiln2(KD05) 35 4,500 8,760 12.6 110
1.BurnercapacityprovidedtoDeannaDuramandJakeStewart(Trinity)onApril23,2012.2.Theaveragehighheatingvalueforwood/bark/finesis4,500Btu/lb,perU.S.EPA'sAP‐42,Section1.6,WoodResidueCombustioninBoilers (Sept.2003).
TableB‐18.PotentialEmissionsfromDirect‐FiredContinuousKilns1
Pollutant (lb/hr) (tpy) (lb/hr) (tpy) (lb/hr) (tpy)
Criteria 2,3
NOX 3.52 15.40 3.52 15.40 7.03 30.80TotalVOC 48.09 210.65 48.09 210.65 96.19 421.30CO 9.17 40.15 9.17 40.15 18.33 80.30TotalPM 1.73 7.59 1.73 7.59 3.47 15.18TotalPM10 1.31 5.72 1.31 5.72 2.61 11.44TotalPM2.5 1.24 5.45 1.24 5.45 2.49 10.89SO2 0.88 3.83 0.88 3.83 1.75 7.67
GreenhouseGases 4
CO2e 7,390 32,369 7,390 32,369 14,780.17 64,737.14CO2ebiomassdeferral 152.32 667.15 152.32 667.15 304.63 1,334.30
1.Potentialannualemissionswerecalculatedusingthefollowingequationsbasedontheunitsoftheemissionfactor:
Potentialemissions[tpy]=Emissionfactor[lb/MBF]*Annualproductioncapacity[MMBF/yr]*1,000/2,000lb/ton
Potentialemissions[tpy]=Emissionfactor[lb/MMBtu]*Heatinputcapacity[MMBtu/hr]*Annualhoursofoperation[hrs/yr]/2,000lb/ton
2.VOCiscomputedasterpene+methanol+formaldehyde
3.TotalPM/PM10/PM2.5emissionsarethesumoffilterableandcondensableparticulate.
4.CO2ebasedonthebiomassdeferralexcludesbiogenicCO2emissions(e.g.,frombiomass)pertheBiomassDeferralpublishedinFederalRegisterVol.76,No.139,onJuly20,2011.
3.Theannualproductioncapacityisbasedontheprojectedlengthsofthecenterchambersfortheproposedkilnsandalumberproductionvalueof1.1MMBF/year/footlengthofthecenterchamber.Thehourlyproductioncapacitywascalculatedbasedontheannualhoursofoperationofthekilns.
ProductionCapacity3
KD04Emissions KD05Emissions TotalKilnPTE
TrinityConsultants Page25of37AugustaExpansionProjectEmissionsAnalysis(20130306JF)
KD04&KD05PTE

AppendixB‐EmissionCalculationsWestFraser‐Augusta,Georgia
TableB‐19.PotentialHAP/TAPEmissionsfromDirect‐FiredContinuousKilns1
Control KD04Emissions KD05Emissions TotalKilnPTEPollutant CASNo. HAP? TAP? Efficiency2 (lb/hr) (tpy) (lb/hr) (tpy) (lb/hr) (tpy)
Acetaldehyde 75‐07‐0 Yes Yes ‐ 7.28E‐01 3.19E+00 7.28E‐01 3.19E+00 1.46 6.38Acetophenone 98‐86‐2 Yes Yes ‐ 9.10E‐06 3.99E‐05 9.10E‐06 3.99E‐05 1.82E‐05 7.97E‐05Acrolein 107‐02‐8 Yes Yes ‐ 6.65E‐03 2.91E‐02 6.65E‐03 2.91E‐02 1.33E‐02 5.83E‐02Antimony 7440‐36‐0 Yes Yes 50% 1.38E‐04 6.06E‐04 1.38E‐04 6.06E‐04 2.77E‐04 1.21E‐03Arsenic 7440‐38‐2 Yes Yes 50% 6.48E‐05 2.84E‐04 6.48E‐05 2.84E‐04 1.30E‐04 5.67E‐04Barium 7440‐39‐3 No Yes 50% 3.50E‐04 1.53E‐03 3.50E‐04 1.53E‐03 7.00E‐04 3.07E‐03Benzene 71‐43‐2 Yes Yes ‐ 9.45E‐03 4.14E‐02 9.45E‐03 4.14E‐02 1.89E‐02 8.28E‐02Benzo(a)pyrene 50‐32‐8 Yes Yes ‐ 9.10E‐05 3.99E‐04 9.10E‐05 3.99E‐04 1.82E‐04 7.97E‐04Beryllium 7440‐41‐7 Yes Yes 50% 1.44E‐05 6.29E‐05 1.44E‐05 6.29E‐05 2.87E‐05 1.26E‐04n‐Butyraldehyde 123‐72‐8 No Yes ‐ 2.14E‐03 9.35E‐03 2.14E‐03 9.35E‐03 4.27E‐03 1.87E‐02Di(2‐ethylhexyl)phthalate 117‐81‐7 Yes Yes ‐ 1.65E‐06 7.21E‐06 1.65E‐06 7.21E‐06 3.29E‐06 1.44E‐05Cadmium 7440‐43‐9 Yes Yes 50% 8.23E‐05 3.60E‐04 8.23E‐05 3.60E‐04 1.65E‐04 7.21E‐04Carbondisulfide 75‐15‐0 Yes Yes ‐ 4.55E‐03 1.99E‐02 4.55E‐03 1.99E‐02 9.10E‐03 3.99E‐02Carbontetrachloride 56‐23‐5 Yes Yes ‐ 3.12E‐05 1.36E‐04 3.12E‐05 1.36E‐04 6.23E‐05 2.73E‐04Chlorine 7782‐50‐5 Yes Yes ‐ 2.77E‐02 1.21E‐01 2.77E‐02 1.21E‐01 5.53E‐02 2.42E‐01Chlorobenzene 108‐90‐7 Yes Yes ‐ 1.93E‐08 8.43E‐08 1.93E‐08 8.43E‐08 3.85E‐08 1.69E‐07Chloroform 67‐66‐3 Yes Yes ‐ 1.30E‐03 5.67E‐03 1.30E‐03 5.67E‐03 2.59E‐03 1.13E‐02Chromium 7440‐47‐3 Yes Yes 50% 1.16E‐04 5.06E‐04 1.16E‐04 5.06E‐04 2.31E‐04 1.01E‐03ChromiumVI 18540‐29‐9 Yes Yes 50% 1.28E‐04 5.60E‐04 1.28E‐04 5.60E‐04 2.56E‐04 1.12E‐03Cobalt 7440‐48‐4 Yes Yes 50% 7.35E‐03 3.22E‐02 7.35E‐03 3.22E‐02 1.47E‐02 6.44E‐02Copper 7440‐50‐8 No Yes 50% 2.28E‐04 9.96E‐04 2.28E‐04 9.96E‐04 4.55E‐04 1.99E‐03Crotonaldehyde 4170‐30‐3 No Yes ‐ 3.85E‐04 1.69E‐03 3.85E‐04 1.69E‐03 7.70E‐04 3.37E‐03Cumene 98‐82‐8 Yes Yes ‐ 6.30E‐04 2.76E‐03 6.30E‐04 2.76E‐03 1.26E‐03 5.52E‐03Dibutylphthalate 84‐74‐2 Yes Yes ‐ 1.16E‐03 5.06E‐03 1.16E‐03 5.06E‐03 2.31E‐03 1.01E‐022,4‐Dinitrophenol 51‐28‐5 Yes Yes ‐ 9.10E‐06 3.99E‐05 9.10E‐06 3.99E‐05 1.82E‐05 7.97E‐052,4‐Dinitrotoluene 121‐14‐2 Yes Yes ‐ 3.29E‐05 1.44E‐04 3.29E‐05 1.44E‐04 6.58E‐05 2.88E‐04Dioxin(as2,3,7,8‐TCDD) 1746‐01‐6 Yes Yes ‐ 3.01E‐10 1.32E‐09 3.01E‐10 1.32E‐09 6.02E‐10 2.64E‐09Ethylbenzene 100‐41‐4 Yes Yes ‐ 2.38E‐04 1.04E‐03 2.38E‐04 1.04E‐03 4.76E‐04 2.08E‐03Ethylenedichloride 107‐06‐2 Yes Yes ‐ 1.02E‐03 4.45E‐03 1.02E‐03 4.45E‐03 2.03E‐03 8.89E‐03Formaldehyde 50‐00‐0 Yes Yes ‐ 5.02E‐01 2.20E+00 5.02E‐01 2.20E+00 1.00 4.40Hexachlorobenzene 118‐74‐1 Yes Yes ‐ 3.50E‐05 1.53E‐04 3.50E‐05 1.53E‐04 7.00E‐05 3.07E‐04Hexane 110‐54‐3 Yes Yes ‐ 1.02E‐02 4.45E‐02 1.02E‐02 4.45E‐02 2.03E‐02 8.89E‐02Hydrochloricacid 7647‐01‐0 Yes Yes ‐ 8.05E‐02 3.53E‐01 8.05E‐02 3.53E‐01 1.61E‐01 7.05E‐01Isopropanol 67‐63‐0 No Yes ‐ 1.05E‐01 4.60E‐01 1.05E‐01 4.60E‐01 2.10E‐01 9.20E‐01Lead 7439‐92‐1 Yes Yes 50% 3.10E‐04 1.36E‐03 3.10E‐04 1.36E‐03 6.20E‐04 2.71E‐03Manganese 7439‐96‐5 Yes Yes 50% 3.17E‐02 1.39E‐01 3.17E‐02 1.39E‐01 6.34E‐02 2.77E‐01Mercury 7439‐97‐6 Yes Yes ‐ 1.75E‐05 7.67E‐05 1.75E‐05 7.67E‐05 3.50E‐05 1.53E‐04Methanol 67‐56‐1 Yes Yes ‐ 2.01E+00 8.80E+00 2.01E+00 8.80E+00 4.02 17.60Methylbromide 74‐83‐9 Yes Yes ‐ 5.25E‐04 2.30E‐03 5.25E‐04 2.30E‐03 1.05E‐03 4.60E‐03Methylchloride 74‐87‐3 Yes Yes ‐ 8.05E‐04 3.53E‐03 8.05E‐04 3.53E‐03 1.61E‐03 7.05E‐03Methylchloroform 71‐55‐6 Yes Yes ‐ 1.47E‐03 6.44E‐03 1.47E‐03 6.44E‐03 2.94E‐03 1.29E‐02Methylethylketone 78‐93‐3 No Yes ‐ 8.40E‐07 3.68E‐06 8.40E‐07 3.68E‐06 1.68E‐06 7.36E‐06Methylisobutylketone 108‐10‐1 Yes Yes ‐ 1.26E‐02 5.50E‐02 1.26E‐02 5.50E‐02 2.51E‐02 1.10E‐01Methylenechloride 75‐09‐2 Yes Yes ‐ 1.23E‐02 5.37E‐02 1.23E‐02 5.37E‐02 2.45E‐02 1.07E‐01Naphthalene 91‐20‐3 Yes Yes ‐ 9.80E‐04 4.29E‐03 9.80E‐04 4.29E‐03 1.96E‐03 8.58E‐03Nickel 7440‐02‐0 Yes Yes 50% 8.40E‐05 3.68E‐04 8.40E‐05 3.68E‐04 1.68E‐04 7.36E‐042‐Nitrophenol 88‐75‐5 No Yes ‐ 1.47E‐06 6.44E‐06 1.47E‐06 6.44E‐06 2.94E‐06 1.29E‐054‐Nitrophenol 100‐02‐7 Yes Yes ‐ 4.20E‐06 1.84E‐05 4.20E‐06 1.84E‐05 8.40E‐06 3.68E‐05PAC ‐‐ Yes Yes ‐ 3.05E‐04 1.33E‐03 3.05E‐04 1.33E‐03 6.09E‐04 2.67E‐03Pentachlorophenol 87‐86‐5 Yes Yes ‐ 1.68E‐06 7.36E‐06 1.68E‐06 7.36E‐06 3.36E‐06 1.47E‐05Phenol 108‐95‐2 Yes Yes ‐ 2.76E‐01 1.21E+00 2.76E‐01 1.21E+00 0.55 2.42Phosphorus 7723‐14‐0 Yes Yes ‐ 3.47E‐03 1.52E‐02 3.47E‐03 1.52E‐02 6.93E‐03 3.04E‐02POM ‐‐ Yes Yes ‐ 1.01E‐03 4.42E‐03 1.01E‐03 4.42E‐03 2.02E‐03 8.83E‐03Propionaldehyde 123‐38‐6 Yes Yes ‐ 2.07E‐02 9.04E‐02 2.07E‐02 9.04E‐02 4.13E‐02 1.81E‐01Propylenedichloride 78‐87‐5 Yes Yes ‐ 1.16E‐03 5.06E‐03 1.16E‐03 5.06E‐03 2.31E‐03 1.01E‐02Selenium 7782‐49‐2 Yes Yes ‐ 2.17E‐04 9.50E‐04 2.17E‐04 9.50E‐04 4.34E‐04 1.90E‐03Silver 7440‐22‐4 No Yes 50% 1.73E‐05 7.59E‐05 1.73E‐05 7.59E‐05 3.47E‐05 1.52E‐04Styrene 100‐42‐5 Yes Yes ‐ 1.12E‐03 4.91E‐03 1.12E‐03 4.91E‐03 2.24E‐03 9.81E‐03Tetrachloroethylene 127‐18‐4 Yes Yes ‐ 1.34E‐03 5.86E‐03 1.34E‐03 5.86E‐03 2.67E‐03 1.17E‐02Thallium 7440‐28‐0 No Yes ‐ 6.65E‐05 2.91E‐04 6.65E‐05 2.91E‐04 1.33E‐04 5.83E‐04Toluene 108‐88‐3 Yes Yes ‐ 1.26E‐03 5.50E‐03 1.26E‐03 5.50E‐03 2.51E‐03 1.10E‐021,2,4‐Trichlorobenzene 120‐82‐1 Yes Yes ‐ 1.93E‐03 8.43E‐03 1.93E‐03 8.43E‐03 3.85E‐03 1.69E‐021,1,2‐Trichloroethane 79‐00‐5 Yes Yes ‐ 4.20E‐03 1.84E‐02 4.20E‐03 1.84E‐02 8.40E‐03 3.68E‐02Trichloroethylene 79‐01‐6 Yes Yes ‐ 1.37E‐03 5.98E‐03 1.37E‐03 5.98E‐03 2.73E‐03 1.20E‐02Trichlorofluoromethane 75‐69‐4 No Yes ‐ 1.44E‐03 6.29E‐03 1.44E‐03 6.29E‐03 2.87E‐03 1.26E‐022,4,6‐Trichlorophenol 88‐06‐2 Yes Yes ‐ 8.40E‐07 3.68E‐06 8.40E‐07 3.68E‐06 1.68E‐06 7.36E‐06Vinylchloride 75‐01‐4 Yes Yes ‐ 6.30E‐04 2.76E‐03 6.30E‐04 2.76E‐03 1.26E‐03 5.52E‐03Xylenes 1330‐20‐7 Yes Yes ‐ 9.10E‐05 3.99E‐04 9.10E‐05 3.99E‐04 1.82E‐04 7.97E‐04
TotalHAPEmissions 3.77 16.50 3.77 16.50 7.53 33.00MaximumIndividualHAPEmissions 2.01 8.80 2.01 8.80 4.02 17.60
1.Potentialannualemissionswerecalculatedusingthefollowingequationsbasedontheunitsoftheemissionfactor:
Potentialemissions[tpy]=Emissionfactor[lb/MBF]*Annualproductioncapacity[MMBF/yr]*1,000/2,000lb/ton
Potentialemissions[tpy]=Emissionfactor[lb/MMBtu]*Heatinputcapacity[MMBtu/hr]*Annualhoursofoperation[hrs/yr]/2,000lb/ton
Potentialemissions[tpy]=Emissionfactor[lb/ton]*(Heatinputcapacity[MMBtu/hr]*1.0E6/FuelHHV[Btu/lb]/2,000lb/ton)*Annualhoursofoperation[hrs/yr]/2,000lb/ton
2.Controlefficiencyforparticle‐boundmetalHAPsisappliedbasedonEPD'sSIPApplicationReviewdocument(ApplicationNo.19470)thatstatesthatkilnsactassettlingchambers
andtheminimumexpectedcontrolforparticulateemissionsfromkilnsactingassettlingchambersis50%.
3.SeleniumandMercurywerenotincludedasmetalboundHAPsduetotheirabilitytoexistoutsideofparticleboundformations.
TrinityConsultants Page26of37AugustaExpansionProjectEmissionsAnalysis(20130306JF)
KD04&KD05PTE

AppendixB‐EmissionCalculationsWestFraser‐Augusta,Georgia
TableB‐20.ProposedLumberIncreasesviaProject
MaterialPastPotentialThroughput1
FuturePotential
Throughput
ThroughputIncrease(tpy)
Wood/Lumber(MMBF/yr) 157 220 63.00Wood/Lumber(tpy)2 659,400 924,000 264,600
TableB‐21.EmissionIncreasesforSawingandDebarking
Emission ControlFactor Efficiency1
EmissionSource Pollutant (lb/ton) (%) (lb/hr)2 (tpy)3
LogSawing4 8,760 PM 0.350 90% 1.06 4.63PM10 0.200 90% 0.60 2.65
PM2.56 0.200 90% 0.60 2.65
Debarking5 8,760 PM 0.020 90% 0.06 0.26PM10 0.011 90% 0.03 0.15
PM2.56 0.011 90% 0.03 0.15
6.ItisassumedthatPM10=PM2.5.
4.EmissionfactorsfromEIIPUncontrolledEmissionFactors(July2001),pertheFactorInformationRetrieval(FIRE)databasemanagementsystem,version6.23forSCCCode3‐07‐008‐02,LogSawing.5.EmissionfactorsfromEIIPUncontrolledEmissionFactors(July2001),pertheFactorInformationRetrieval(FIRE)databasemanagementsystem,version6.23forSCCCode3‐07‐008‐01,LogDebarking.
1.Pastpotentialthroughputisthemaximumlumberdryingcapacityofthemill,asstatedintheirmostrecentTitleVPermitNo.2421‐245‐0047‐V‐04‐0,issuedJune2012.
2.Wood/Lumber[tpy]=Wood/Lumber[MMBF/yr]×4.2tons/MBF×1,000MBF/MMBF.Afactorof4.2tons/MBFwasprovidedbythemill.
AnnualHoursofOperation
PotentialEmissionsIncrease
1.BasedonguidancebytheTexasCommissiononEnvironmentalQuality(TCEQ)entitled"RockCrushingPlants"(Feb.2002),acontrolefficiencyof90%shouldbeappliedforworkperformedfullyenclosed.
2.PotentialHourlyEmissionsIncrease[lb/hr]=PotentialAnnualEmissionsIncrease[tpy]×2,000lb/ton/AnnualHoursofOperation[hr/yr]3.PotentialAnnualEmissionsIncrease[tpy]=Emissionfactor[lb/ton]×(1‐ControlEfficiency[%])×AssociatedThroughputIncrease[ton/yr]/2,000lb/ton
TrinityConsultants Page27of37AugustaExpansionProjectEmissionsAnalysis(20130306JF)
SawingandDebarking
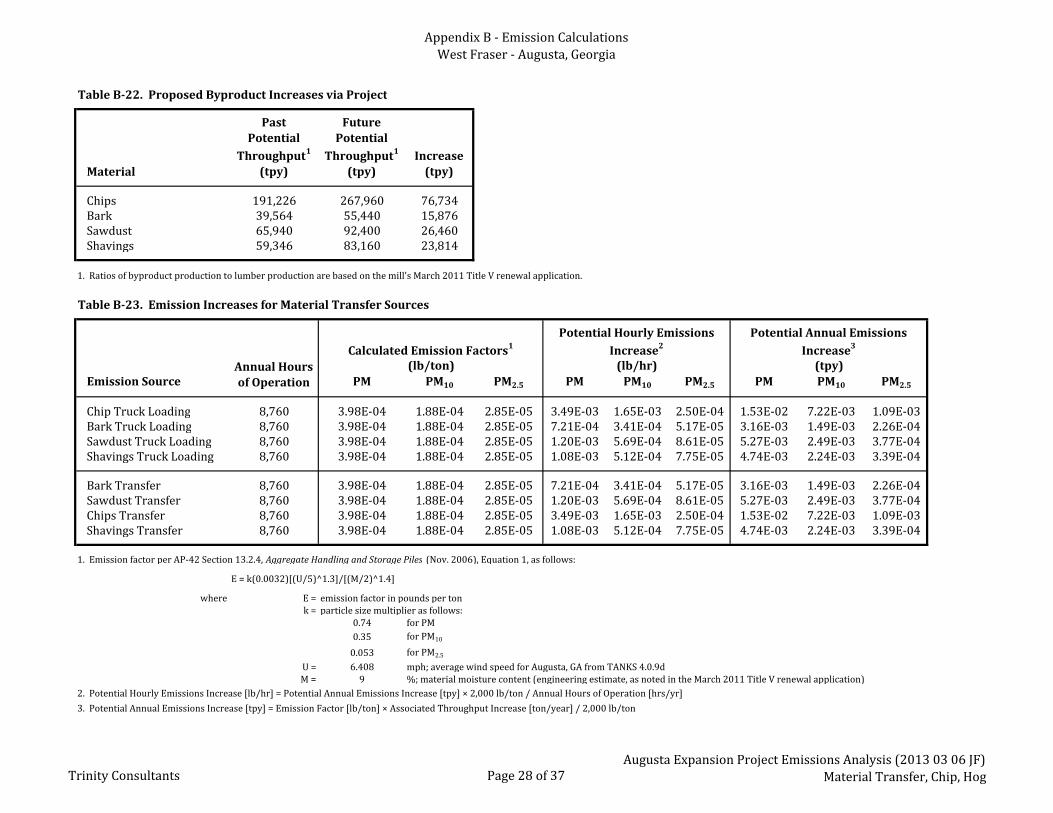
AppendixB‐EmissionCalculationsWestFraser‐Augusta,Georgia
TableB‐22.ProposedByproductIncreasesviaProject
Material
PastPotential
Throughput1
(tpy)
FuturePotential
Throughput1
(tpy)Increase(tpy)
Chips 191,226 267,960 76,734Bark 39,564 55,440 15,876Sawdust 65,940 92,400 26,460Shavings 59,346 83,160 23,814
1.Ratiosofbyproductproductiontolumberproductionarebasedonthemill'sMarch2011TitleVrenewalapplication.
TableB‐23.EmissionIncreasesforMaterialTransferSources
EmissionSource PM PM10 PM2.5 PM PM10 PM2.5 PM PM10 PM2.5
ChipTruckLoading 8,760 3.98E‐04 1.88E‐04 2.85E‐05 3.49E‐03 1.65E‐03 2.50E‐04 1.53E‐02 7.22E‐03 1.09E‐03BarkTruckLoading 8,760 3.98E‐04 1.88E‐04 2.85E‐05 7.21E‐04 3.41E‐04 5.17E‐05 3.16E‐03 1.49E‐03 2.26E‐04SawdustTruckLoading 8,760 3.98E‐04 1.88E‐04 2.85E‐05 1.20E‐03 5.69E‐04 8.61E‐05 5.27E‐03 2.49E‐03 3.77E‐04ShavingsTruckLoading 8,760 3.98E‐04 1.88E‐04 2.85E‐05 1.08E‐03 5.12E‐04 7.75E‐05 4.74E‐03 2.24E‐03 3.39E‐04
BarkTransfer 8,760 3.98E‐04 1.88E‐04 2.85E‐05 7.21E‐04 3.41E‐04 5.17E‐05 3.16E‐03 1.49E‐03 2.26E‐04SawdustTransfer 8,760 3.98E‐04 1.88E‐04 2.85E‐05 1.20E‐03 5.69E‐04 8.61E‐05 5.27E‐03 2.49E‐03 3.77E‐04ChipsTransfer 8,760 3.98E‐04 1.88E‐04 2.85E‐05 3.49E‐03 1.65E‐03 2.50E‐04 1.53E‐02 7.22E‐03 1.09E‐03ShavingsTransfer 8,760 3.98E‐04 1.88E‐04 2.85E‐05 1.08E‐03 5.12E‐04 7.75E‐05 4.74E‐03 2.24E‐03 3.39E‐04
1.EmissionfactorperAP‐42Section13.2.4,AggregateHandlingandStoragePiles (Nov.2006),Equation1,asfollows:
E=k(0.0032)[(U/5)^1.3]/[(M/2)^1.4]
where E= emissionfactorinpoundspertonk= particlesizemultiplierasfollows:
0.74 forPM0.35 forPM10
0.053 forPM2.5
U= 6.408 mph;averagewindspeedforAugusta,GAfromTANKS4.0.9dM= 9 %;materialmoisturecontent(engineeringestimate,asnotedintheMarch2011TitleVrenewalapplication)
2.PotentialHourlyEmissionsIncrease[lb/hr]=PotentialAnnualEmissionsIncrease[tpy]×2,000lb/ton/AnnualHoursofOperation[hrs/yr]
3.PotentialAnnualEmissionsIncrease[tpy]=EmissionFactor[lb/ton]×AssociatedThroughputIncrease[ton/year]/2,000lb/ton
AnnualHoursofOperation
CalculatedEmissionFactors1PotentialHourlyEmissions
Increase2PotentialAnnualEmissions
Increase3
(lb/ton) (lb/hr) (tpy)
TrinityConsultants Page28of37AugustaExpansionProjectEmissionsAnalysis(20130306JF)
MaterialTransfer,Chip,Hog

AppendixB‐EmissionCalculationsWestFraser‐Augusta,Georgia
TableB‐24.ProposedLumberIncreasesviaProject
Material
PastPotential
Throughput1
(tpy)
FuturePotential
Throughput1
(tpy)Increase(tpy)
Chipper 191,226 267,960 76,734Hogger 65,940 92,400 26,460
1.Throughputsforthechipperandhoggerarebasedonthepastpotentialandfuturepotentialproductionofchipsandsawdustatthefacility,respectively.
TableB‐25.EmissionIncreasesforHoggerandChipper
Emission ControlFactor1 Efficiency2
EmissionSource Pollutant (lb/ton) (%) (lb/hr)3 (tpy)4
Chipper 8,760 PM 0.020 90% 1.75E‐02 7.67E‐02PM10 0.011 90% 9.64E‐03 4.22E‐02
PM2.55 0.011 90% 9.64E‐03 4.22E‐02
Hogger 8,760 PM 0.020 90% 6.04E‐03 2.65E‐02PM10 0.011 90% 3.32E‐03 1.46E‐02
PM2.55 0.011 90% 3.32E‐03 1.46E‐02
3.PotentialHourlyEmissionsIncrease[lb/hr]=PotentialAnnualEmissionsIncrease[tpy]×2,000lb/ton/AnnualHoursofOperation[hr/yr]
4.PotentialEmissionsIncrease[tpy]=Emissionfactor[lb/ton]×(1‐ControlEfficiency[%])×AssociatedThroughputIncrease[ton/yr]/2,000lb/ton
5.ItisassumedthatPM10=PM2.5.
AnnualHoursofOperation
EmissionsIncrease
1.EmissionfactorsfromEIIPUncontrolledEmissionFactors(July2001),pertheFactorInformationRetrieval(FIRE)databasemanagementsystem,version6.23forSCCCode3‐07‐008‐01,LogDebarking.2.BasedonguidancefromtheTexasCommissiononEnvironmentalQuality(TCEQ)entitled"RockCrushingPlants"(Feb.2002),acontrolefficiencyof90%shouldbeappliedforworkperformedfullyenclosed.
TrinityConsultants Page29of37AugustaExpansionProjectEmissionsAnalysis(20130306JF)
MaterialTransfer,Chip,Hog

AppendixB‐EmissionCalculationsWestFraser‐Augusta,Georgia
TableB‐26.ProposedRoadTrafficIncreases
Material
PastPotentialNumberofTrucksPerYear1
FuturePotentialNumberofTrucksPerYear2
TruckIncreasePerYear
LogTruck 24,500 34,331 9,831LumberTruck 6,800 9,529 2,729BarkTruck 3,600 5,045 1,445ChipTruck 17,400 24,382 6,982ShavingsTruck 5,400 7,567 2,167SawdustTruck 180 252 72Forklift 7 8 1Bobcat 2 2 0
1.Pastpotentialnumberoftrucksperyeardatafromthemill'sMarch2011TitleVrenewalapplication.2.Futurepotentialtrucksperyear=Pastpotentialtrucksperyear×(Futurepotentialproduction[MMBF/yr]/Pastpotentialproduction[MMBF/yr]).
TableB‐27.InputsforIncreasedEmissionsfromRoadTravel
PavedRoads UnpavedRoadsSource (tons) (tons) (tons) (ft) (ft) (Days) (VMT/day) (VMT/yr) (VMT/day) (VMT/yr)
LogTruck 16 43 29.5 2,640 365 26.93 ‐ ‐ 13.47 4,916LumberTruck 16 39 27.5 2,640 365 7.48 ‐ ‐ 3.74 1,364BarkTruck 16 27 21.5 2,640 365 3.96 ‐ ‐ 1.98 722ChipTruck 16 27 21.5 2,640 365 19.13 ‐ ‐ 9.56 3,491ShavingsTruck 16 27 21.5 2,640 365 5.94 ‐ ‐ 2.97 1,083SawdustTruck 16 27 21.5 2,640 365 0.20 ‐ ‐ 0.10 36.11Forklift ‐ ‐ 16.5 N/A ‐ 365 0.00 109.59 40,000 ‐ ‐Bobcat ‐ ‐ 16.5 N/A ‐ 365 ‐ 0.00 0 ‐ ‐
1.Datatakenfromthemill'sMarch2011TitleVrenewalapplication.
Futurepotentialvehiclemilestraveled[VMT/yr]=Pastpotentialvehiclemilestraveled[VMT/yr]×(Futurepotentialthroughput[MMBF/yr]/Pastpotentialthroughput[MMBF/yr]‐1).
ThevaluesshownhererepresenttheincreasefrompastpotentialVMT/yrtofuturepotentialVMT/yr.
EventsPerYear1
IncreaseinNumberofTrucksPer
Day
2.Thepastpotentialvehiclemilestraveled(VMT)peryearvaluefortheforkliftsandbobcatsattheAugustaMillare198,750VMT/yrforthealltheforkliftsand25,000VMT/yrforallthebobcats.Thevalueswereroundeduptoaccountfortheincreaseinproductionusingthefollowingequation:
IncreaseinVehicleMilesTraveled
PavedRoads2 UnpavedRoads
TruckWeightEmpty1
TruckWeightLoaded1
AverageWeight(W)
DistanceTraveledperRoundTrip1
TrinityConsultants Page30of37AugustaExpansionProjectEmissionsAnalysis(20130306JF)
Roads

AppendixB‐EmissionCalculationsWestFraser‐Augusta,Georgia
TableB‐28.PotentialHourlyFugitiveEmissionIncreasesfromRoadTravel
FilterablePM FilterablePM10 FilterablePM2.5
Source PM PM10 PM2.5 (lb/hr) (lb/hr) (lb/hr)
PavedRoadTravelLogTruck 1.35 0.27 0.07 ‐ ‐ ‐LumberTruck 1.26 0.25 0.06 ‐ ‐ ‐BarkTruck 0.98 0.20 0.05 ‐ ‐ ‐ChipTruck 0.98 0.20 0.05 ‐ ‐ ‐ShavingsTruck 0.98 0.20 0.05 ‐ ‐ ‐SawdustTruck 0.98 0.20 0.05 ‐ ‐ ‐Forklift 0.75 0.15 0.04 3.41 0.68 0.17Bobcat 0.75 0.15 0.04 0.00 0.00 0.00TotalPaved 3.41 0.68 0.17
UnpavedRoadTravelLogTruck 5.34 1.52 0.15 3.00 0.85 0.09LumberTruck 5.17 1.47 0.15 0.81 0.23 0.02BarkTruck 4.63 1.32 0.13 0.38 0.11 0.01ChipTruck 4.63 1.32 0.13 1.85 0.53 0.05ShavingsTruck 4.63 1.32 0.13 0.57 0.16 0.02SawdustTruck 4.63 1.32 0.13 0.02 5.44E‐03 5.44E‐04Forklift 4.11 1.17 0.12 ‐ ‐ ‐Bobcat 4.11 1.17 0.12 ‐ ‐ ‐TotalUnpaved 6.62 1.89 0.19
TotalRoadEmissions 10.03 2.57 0.36
1.PavedRoadsEmissionFactor(lb/VMT)=k(sL)^0.91×(W)^1.02,perAP‐42Section13.2.1, PavedRoads (Jan.2011),Equation1,withvariablesdefinedasfollows:PM‐k(lb/VMT)= 0.011 ParticlesizemultiplierforPMperAP‐42,Table13.2.1‐1
PM10‐k(lb/VMT)= 0.0022 ParticlesizemultiplierforPM10perAP‐42,Table13.2.1‐1
PM2.5‐k(lb/VMT)= 0.00054 ParticlesizemultiplierforPM2.5perAP‐42,Table13.2.1‐1
sL(g/m2)= 4.45 Basedonsite‐specificdataforsiltloadingfromthemill'sMarch2011TitleVrenewalapplication2.UnpavedRoadsEmissionFactor(lb/VMT)=[k(s/12)^a×(W/3)^b]×(100%‐%controlefficiency),perAP‐42Section13.2.2,UnpavedRoads(Nov.2006),Equation1a,withvariablesdefinedasfollows:
PM‐k(lb/VMT)= 4.9 ParticlesizemultiplierforPMperAP‐42,Table13.2.2‐2PM10‐k(lb/VMT)= 1.5 ParticlesizemultiplierforPM10perAP‐42,Table13.2.2‐2
PM2.5‐k(lb/VMT)= 0.15 ParticlesizemultiplierforPM2.5perAP‐42,Table13.2.2‐2
PM‐a= 0.7 EmpiricalconstantforPMperAP‐42,Table13.2.2‐2
PM10andPM2.5‐a= 0.9 EmpiricalconstantforPM10andPM2.5perAP‐42,Table13.2.2‐2
b= 0.45 EmpiricalconstantforindustrialroadsperAP‐42,Table13.2.2‐2s(%)= 8.4 SurfacesiltcontentbasedonmedianvalueforlumbersawmillsperAP‐42,Table13.2.2‐1
%controlefficiency= 50.0 %controlefficiency
EmissionFactor1,2
(lb/VMT)IncreaseinPotentialFugitiveEmissions3
3.Potentialemissionscalculatedasappropriateemissionfactormultipliedbyvehiclemilestraveledpertimeperiod.Note,WestFraserconservativelyestimatedhourlyemissionsusingtheemissionfactoronadailybasisbecauseanemissionfactoronanhourlybasiscalculatedperEquation3resultsinlowerpotentialemissions.
TrinityConsultants Page31of37AugustaExpansionProjectEmissionsAnalysis(20130306JF)
Roads

AppendixB‐EmissionCalculationsWestFraser‐Augusta,Georgia
TableB‐29.PotentialAnnualFugitiveEmissionIncreasesfromRoadTravel
FilterablePM FilterablePM10 FilterablePM2.5
Source PM PM10 PM2.5 (tpy) (tpy) (tpy)
PavedRoadTravelLogTruck 1.24 0.25 0.06 ‐ ‐ ‐LumberTruck 1.15 0.23 0.06 ‐ ‐ ‐BarkTruck 0.90 0.18 0.04 ‐ ‐ ‐ChipTruck 0.90 0.18 0.04 ‐ ‐ ‐ShavingsTruck 0.90 0.18 0.04 ‐ ‐ ‐SawdustTruck 0.90 0.18 0.04 ‐ ‐ ‐Forklift 0.69 0.14 0.03 13.71 2.74 0.67Bobcat 0.69 0.14 0.03 0.00 0.00 0.00TotalPaved 13.71 2.74 0.67
UnpavedRoadTravelLogTruck 3.58 1.02 0.10 8.81 2.51 0.25LumberTruck 3.47 0.99 0.10 2.37 0.68 0.07BarkTruck 3.11 0.89 0.09 1.12 0.32 0.03ChipTruck 3.11 0.89 0.09 5.43 1.55 0.15ShavingsTruck 3.11 0.89 0.09 1.68 0.48 0.05SawdustTruck 3.11 0.89 0.09 0.06 0.02 0.00Forklift 2.76 0.79 0.08 ‐ ‐ ‐Bobcat 2.76 0.79 0.08 ‐ ‐ ‐TotalUnpaved 19.46 5.55 0.55
TotalRoadEmissions 33.17 8.29 1.23
1.PavedRoadsEmissionFactor(lb/VMT)=[k(sL)^0.91×(W)^1.02]×[1‐P/(4N)],perAP‐42Section13.2.1, PavedRoads (Jan.2011),Equation2,withvariablesdefinedasfollows:
PM‐k(lb/VMT)= 0.011 ParticlesizemultiplierforPMperAP‐42,Table13.2.1‐1PM10‐k(lb/VMT)= 0.0022 ParticlesizemultiplierforPM10perAP‐42,Table13.2.1‐1
PM2.5‐k(lb/VMT)= 0.00054 ParticlesizemultiplierforPM2.5perAP‐42,Table13.2.1‐1
sL(g/m2)= 4.45 Basedonsite‐specificdataforsiltloadingfromthemill'sMarch2011TitleVrenewalapplicationP= 120 No.dayswithrainfallgreaterthan0.01inch,PerAP‐42,Figure13.2.1‐2N= 365 Daysinaveragingperiod
PM‐k(lb/VMT)= 4.9 ParticlesizemultiplierforPMperAP‐42,Table13.2.2‐2PM10‐k(lb/VMT)= 1.5 ParticlesizemultiplierforPM10perAP‐42,Table13.2.2‐2
PM2.5‐k(lb/VMT)= 0.15 ParticlesizemultiplierforPM2.5perAP‐42,Table13.2.2‐2
PM‐a= 0.7 EmpiricalconstantforPMperAP‐42,Table13.2.2‐2
PM10andPM2.5‐a= 0.9 EmpiricalconstantforPM10andPM2.5perAP‐42,Table13.2.2‐2
b= 0.45 EmpiricalconstantforindustrialroadsperAP‐42,Table13.2.2‐2s(%)= 8.4 SurfacesiltcontentbasedonmedianvalueforlumbersawmillsperAP‐42,Table13.2.2‐1
P= 120 No.dayswithrainfallgreaterthan0.01inch,PerAP‐42,Figure13.2.2‐1%controlefficiency= 50.0 %controlefficiency
EmissionFactor1,2
(lb/VMT)IncreaseinPotentialFugitiveEmissions3
2.UnpavedRoadsEmissionFactor(lb/VMT)=[k(s/12)^a×(W/3)^b]×[(365‐P)/365]×(100%‐%controlefficiency),perAP‐42Section13.2.2, UnpavedRoads (Nov.2006),Equations1aand2,withvariablesdefinedasfollows:
3.Potentialemissionscalculatedasappropriateemissionfactormultipliedbyvehiclemilestraveledpertimeperiod.Note,WestFraserconservativelyestimatedhourlyandannualemissionsusingtheemissionfactoronadailybasisbecauseanemissionfactoronanhourlybasiscalculatedperEquation3resultsinlowerpotentialemissions.
TrinityConsultants Page32of37AugustaExpansionProjectEmissionsAnalysis(20130306JF)
Roads

AppendixB‐EmissionCalculationsWestFraser‐Augusta,Georgia
TableB‐30.TotalEmissionsIncreasefromNewUnits
KD04 KD05 (tpy)
NSRPollutantsCO 40.15 40.15 80.30Fluorides N/A N/A N/AH2S N/A N/A N/ALead 3.10E‐04 3.10E‐04 6.20E‐04NOX 15.40 15.40 30.80ReducedSulfurCompounds(includingH2S) N/A N/A N/ASO2 3.83 3.83 7.67H2SO4 N/A N/A N/ATotalPM 7.59 7.59 15.18TotalPM10 5.72 5.72 11.44TotalPM2.5 5.45 5.45 10.89TotalReducedSulfur(includingH2S) N/A N/A N/ATotalVOC 210.65 210.65 421.30
GreenhouseGasesCO2ebiomassdeferral 667.15 667.15 1,334
HAPsFormaldehyde 0.50 0.50 1.00Methanol 2.01 2.01 4.02
PotentialEmissions(tpy)
Pollutant
EmissionsIncrease
TrinityConsultants Page33of37AugustaExpansionProjectEmissionsAnalysis(20130306JF)
EmissionsIncSummary(Step1)

AppendixB‐EmissionCalculationsWestFraser‐Augusta,Georgia
TableB‐31.TotalEmissionsIncreasefromAssociatedUn
(tpy)
NSRPollutantsCO N/AFluorides N/AH2S N/ALead N/ANOX N/AReducedSulfurCompounds(includingH2S) N/ASO2 N/AH2SO4 N/ATotalPM 38.23TotalPM10 11.17TotalPM2.5 4.08TotalReducedSulfur(includingH2S) N/ATotalVOC N/A
GreenhouseGasesCO2ebiomassdeferral N/A
HAPsFormaldehyde N/AMethanol N/A
Pollutant
PotentialEmissionsIncrease
TrinityConsultants Page34of37AugustaExpansionProjectEmissionsAnalysis(20130306JF)
EmissionsIncSummary(Step1)
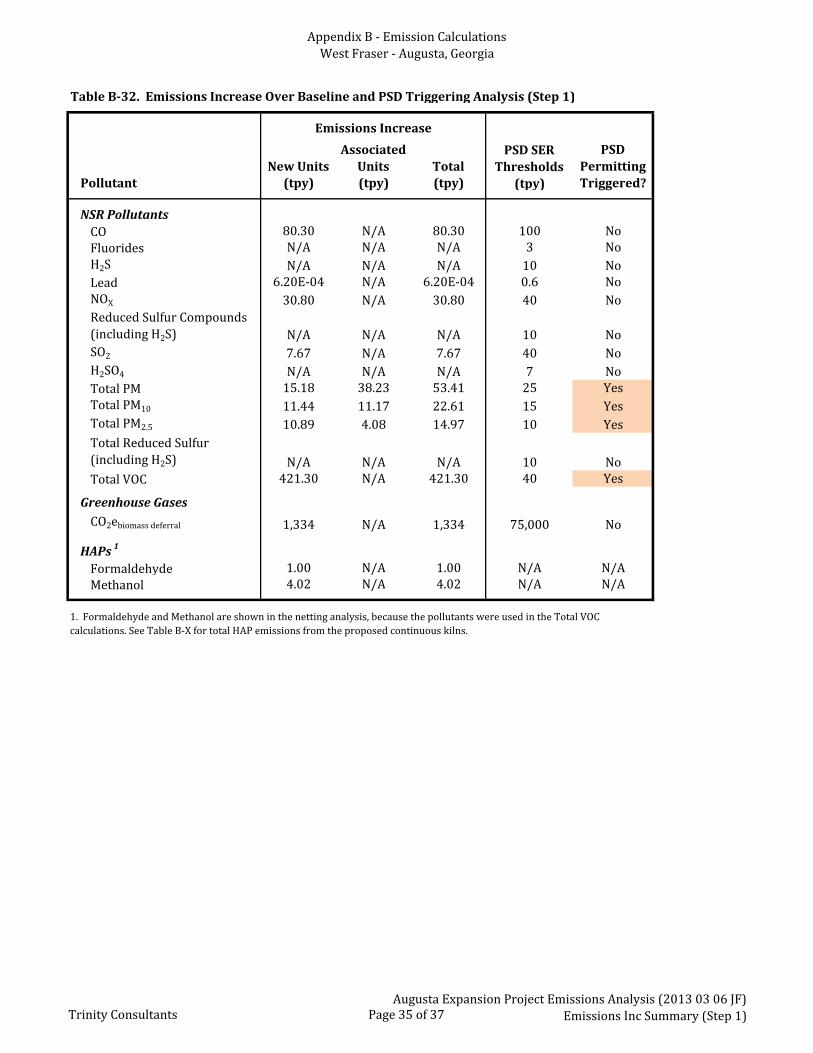
AppendixB‐EmissionCalculationsWestFraser‐Augusta,Georgia
TableB‐32.EmissionsIncreaseOverBaselineandPSDTriggeringAnalysis(Step1)
NewUnitsAssociatedUnits Total
(tpy) (tpy) (tpy) (tpy)
NSRPollutantsCO 80.30 N/A 80.30 100 NoFluorides N/A N/A N/A 3 NoH2S N/A N/A N/A 10 NoLead 6.20E‐04 N/A 6.20E‐04 0.6 NoNOX 30.80 N/A 30.80 40 NoReducedSulfurCompounds(includingH2S) N/A N/A N/A 10 NoSO2 7.67 N/A 7.67 40 NoH2SO4 N/A N/A N/A 7 NoTotalPM 15.18 38.23 53.41 25 YesTotalPM10 11.44 11.17 22.61 15 YesTotalPM2.5 10.89 4.08 14.97 10 YesTotalReducedSulfur(includingH2S) N/A N/A N/A 10 NoTotalVOC 421.30 N/A 421.30 40 Yes
GreenhouseGasesCO2ebiomassdeferral 1,334 N/A 1,334 75,000 No
HAPs 1
Formaldehyde 1.00 N/A 1.00 N/A N/AMethanol 4.02 N/A 4.02 N/A N/A
1.FormaldehydeandMethanolareshowninthenettinganalysis,becausethepollutantswereusedintheTotalVOCcalculations.SeeTableB‐XfortotalHAPemissionsfromtheproposedcontinuouskilns.
PSDPermittingTriggered?
PSDSERThresholds
EmissionsIncrease
Pollutant
TrinityConsultants Page35of37AugustaExpansionProjectEmissionsAnalysis(20130306JF)
EmissionsIncSummary(Step1)

AppendixB‐EmissionCalculationsWestFraser‐Augusta,Georgia
TableB‐33.ContemporaneousDecreases
ShutdownofKilns1‐3(tpy)
NSRPollutantsCO 51.80Fluorides N/AH2S N/ALead 4.84E‐03NOX 19.87ReducedSulfurCompounds(includingH2S) N/ASO2 6.84H2SO4 N/ATotalPM 28.88TotalPM10 17.53TotalPM2.5 16.04
TotalReducedSulfur(includingH2S) N/ATotalVOC 271.77
GreenhouseGasesCO2ebiomassdeferral 1190.84
HAPsFormaldehyde 2.84Methanol 11.35
Pollutant
TrinityConsultants Page36of37AugustaExpansionProjectEmissionsAnalysis(20130306JF)
PSDNetting(Step2)

AppendixB‐EmissionCalculationsWestFraser‐Augusta,Georgia
TableB‐34.NettingAnalysis
NetEmissionsChange
PSDSERThresholds
(tpy) (tpy)
NSRPollutantsCO 28.50 100 NoFluorides N/A 3 NoH2S N/A 10 NoLead 0.00 0.6 NoNOX 10.93 40 NoReducedSulfurCompounds(includingH2S) N/A 10 NoSO2 0.82 40 NoH2SO4 N/A 7 NoTotalPM 24.53 25 NoTotalPM10 5.08 15 NoTotalPM2.5 ‐1.07 10 No
TotalReducedSulfur(includingH2S) N/A 10 NoTotalVOC 149.53 40 Yes
GreenhouseGasesCO2ebiomassdeferral 143.45 75,000 No
HAPs 2
Formaldehyde ‐1.83 N/A N/AMethanol ‐7.34 N/A N/A
Pollutant
PSDPermittingTriggered?
TrinityConsultants Page37of37AugustaExpansionProjectEmissionsAnalysis(20130306JF)
PSDNetting(Step2)

Appendix D Updates

AppendixD‐BACTCalculationsWestFraser‐Augusta,GAMill
TableD‐1.EmissionUnitsSubjecttoBACT
Unit
KD04 110.0 MMBF/yrKD05 110.0 MMBF/yr
TableD‐2.PotentialControlScenarioSummary
EmissionUnit Pollutant CaptureEfficiency2
KD04 VOC 3.83 lb/MBF 80.0% 0.061 lb/MBF
KD05 VOC 3.83 lb/MBF 80.0% 0.061 lb/MBF
AllKilns VOC 3.83 lb/MBF 80.0% 0.061 lb/MBF
AllKilns VOC 3.83 lb/MBF 80.0% 1.072 lb/MBF
1.VOCasterpene+methanol+formaldehyde.
TableD‐3.CostSummary
Control Baseline Pollutant OperatingEfficiency1,2 Emissions Removed Cost
EmissionUnit Pollutant (%) (tpy) (%) (tpy) ($/tonremoved)
KD04 VOC 98% 210.65 80.0% 165.15 14,329$
KD05 VOC 98% 210.65 80.0% 165.15 14,329$
AllKilns VOC 98% 421.30 80.0% 330.30 14,222$
AllKilns VOC 65% 421.30 80.0% 219.08 14,044$
1.RTOcontrolefficiencyperOAQPSManual,Section3.2,Chapter2.
Max.ProductionCapacity
ControlBasis
RTO
2.Basedonengineeringestimate.
TotalControlledEmissionsThroughtheStacks
CurrentPotential
Emissions1
3.Basedonengineeringestimate.
Biofiltration
RTO
2.BiofiltrationcontrolefficiencybasedonNorthCarolinaDepartmentofEnvironmentandNaturalResourcesAirPermitReviewforWeyerhauser’sPlymouthfacility'scontinuouskilnconstructionapplication,whichreferencedanestimated60–70%VOCcontrolefficiencyfrombiofiltration,basedonaconversationwithDavidWordofNCASI.
CaptureEfficiency3
RTO
RTO
Technology
RTO
RTO
Biofiltration
TrinityConsultants Page1of5AugustaKilnBACTCostCalculations(20130307JS)
CostSummary

AppendixD‐BACTCalculationsWestFraser‐Augusta,GAMill
TableD‐4.CostAnalysisSupportingInformationforRTO
ParameterKiln4(KD04)
Kiln5(KD05)
2Kilnsto1RTO Units Note(s)
MaximumProductionCapacity 110 110 220 MMBF/yrUncontrolledStackInletEmissions(VOC) 168.52 168.52 337.04 tpy 1RemovalEfficiency 98 98 98 % 2VOCRemoved 165.15 165.15 330.30 tpy 3
ControlEquip.OutletTemperature 1,450 1,450 1,450 °F 4Airflow 40,471 40,471 80,942 acfm 5AirflowCaptureEfficiency 50 50 50 % 6ExhaustTemperature 130 130 130 °F 5AirMoistureContent 13.6 13.6 13.6 % 5ExhaustGasFlowRate 35,667 35,667 71,333 scfm 7SpecificHeatofDryAir 6.85 6.85 6.85 Btu/lb‐mole·°F 8SpecificHeatofWater 17.99 17.99 17.99 Btu/lb‐mole·°F 8PressureDrop 19 19 19 inchesofH2O 9FanMotorEfficiency 70 70 70 % 10FanElectricityUsage 64.3 64.3 128.5 kW‐hr 11EnergyRequiredFromFuel 61.44 61.44 122.88 MMBtu/hr 12NaturalGasHeatCapacity 1,020 1,020 1,020 MMBtu/MMscf 13
OperatingLaborCost 12.0 12.0 12.0 $/hr 14MaintenanceLaborCost 13.2 13.2 13.2 $/hr 14ElectricityCost 0.06 0.1 0.06 $/kW‐hr 15NaturalGasCost 3.3 3.3 3.3 $/1,000scf 16
RTOEquipmentLife 10 10 10 years 17InterestRate 7.0 7.0 7.0 % 17
2002$ 179.9 179.9 179.9 n/a 182012$(October) 231.3 231.3 231.3 n/a 18
1.Potentialinletemissionsbasedonmaximumcapacityandemissions.VOCasterpene+methanol+formaldehyde.
2.PerOAQPSManual,Section3.2,Chapter2.
3.VOCRemoved(tpy)=RemovalEfficiency(%)×UncontrolledStackInletEmissions(tpy).
4.Basedonaverageoperatingtemperature(1,400°F‐1,500°F)inEPAFactSheet:http://www.epa.gov/ttn/catc/dir1/fregen.pdf
5.ValuesbasedstacktestperformedonBiblerBrothersLumberCompanycontinuouslumberkilninRussellville,ARonMarch12,2009.
8.Standardvalue.
9.BasedonexampleprobleminOAQPSManual,Section3.2,Chapter2,page2‐43.
10.PerOAQPSManual,Section3.2,Chapter2,page2‐41,efficiencyrangesfrom40to70%.70%isconservativelychosen.
11.TotalFanElectricityUsagebasedonEquation2.42ofOAQPSManual,Section3.2,Chapter2,page2‐41.
13.AveragenaturalgasheatingvalueperAP‐42Section1.4NaturalGasCombustion (July1998).
14.LaborcostsperOAQPSManual,Section3.1,Chapter1,pages1‐29and1‐37.
15.BasedonOAQPS,Section2,Chapter3,page3‐32.
16.BasedonOAQPS,Section3.2,Chapter,2,page2‐46
17.BasedonexampleprobleminOAQPSManual,Section3.2,Chapter2,page2‐45.
18.ValuesbasedonU.S.HistoricalConsumerPriceIndex:ftp://ftp.bls.gov/pub/special.requests/cpi/cpiai.txt.
12.EstimatedasExhaustGasFlowRate,scfm*60,min/hr*Density(Air),0.0026lb‐mole/scf*SpecificHeat(Btu/lb‐mole·°F)*(OutletTemp‐ExhaustTemp,°F)/10 6,basedonthesensibleheatintegral,Q=mCp(T1‐T2),whereQistheheatrequired,misthemassflowrateoftheair,Cpisthespecificheatofair,T 1istheoutlettemperatureoftheRTO,andT2istheexhausttemperaturefromtheequipment.Alsoincorporatesenergyrequiredtoheatwatervapor.
7.CalculatedbasedonfuelF‐factorof11,936Btu/CF,andaccountingfor18.86percentoxygenbasedoninformationfromBiblerBrothersLumberCompanyMarch12,2009stacktestresultandmultipliedbythecaptureefficiencyof50%.
6.EngineeringestimatebasedonNorthCarolinaDepartmentofEnvironmentandNaturalResourcesAirPermitReviewforWeyerhauser’sPlymouthfacility'scontinuouskilnconstructionapplication,whichestimateda50%captureefficiencyforemissionsfromacontinuouslumberkiln.
TrinityConsultants Page2of5AugustaKilnBACTCostCalculations(20130307JS)
RTOInfo

AppendixD‐BACTCalculationsWestFraser‐Augusta,GAMill
TableD‐5.CapitalCostAnalysisforRTOforVOCControl
Kiln4(KD04) Kiln5(KD05)2Kilnsto1RTO OAQPSNotation1
PurchasedEquipmentCostsTotalEquipmentCost2 1,605,115 1,605,115 3,210,230 AInstrumentation 160,512 160,512 321,023 0.10×ASalesTax 48,153 48,153 96,307 0.03×AFreight 80,256 80,256 160,512 0.05×A
TotalPurchasedEquipmentCosts 1,894,036 1,894,036 3,788,071 B=1.18×A
DirectInstallationCostsFoundationsandSupports 151,523 151,523 303,046 0.08×BHandlingandErection 265,165 265,165 530,330 0.14×BElectrical 75,761 75,761 151,523 0.04×BPiping 37,881 37,881 75,761 0.02×BInsulation 18,940 18,940 37,881 0.01×BPainting 18,940 18,940 37,881 0.01×BSitePreparation&Buildings ‐ ‐ ‐ ‐Additionalductwork ‐ ‐ ‐ ‐
TotalDirectInstallationCosts 568,211 568,211 1,136,421 C=0.30×B
IndirectInstallationCostsEngineering 189,404 189,404 378,807 0.10×BConstructionandFieldExpense 94,702 94,702 189,404 0.05×BContractorFees 189,404 189,404 378,807 0.10×BStart‐up 37,881 37,881 75,761 0.02×BPerformanceTest 18,940 18,940 37,881 0.01×BProcessContingencies 56,821 56,821 113,642 0.03×B
TotalIndirectInstallationCosts 587,151 587,151 1,174,302 D=0.31×B
TotalCapitalInvestment($) 3,049,398 3,049,398 6,098,795 TCI=B+C+D
1.U.S.EPAOAQPS,EPAAirPollutionControlCostManual(6thEdition) ,January2002,Section3.2(VOCDestructionControls),Chapter2(Incinerators).
Minimumregenerativethermaloxidizercost 35 2002dollars/scfm
Conversionfrom2002toOctober2012dollars 1.29 October2012dollarsper2002dollar
Minimumregenerativeincineratorcost 45.00 August2012dollars/scfm
TableD‐6.OperatingCostAnalysisforRTOforVOCcontrol
Kiln4(KD04) Kiln5(KD05)2Kilnsto1RTO OAQPSNotation1
DirectAnnualCostsOperatingLabor(0.5hr,per8‐hrshift) 6,570 6,570 6,570 ESupervisoryLabor 986 986 986 F=0.15×EMaintenanceLabor(0.5hr,per8‐hrshift) 7,227 7,227 7,227 GMaintenanceMaterials 7,227 7,227 7,227 H=GElectricity 33,776 33,776 67,552 INaturalGas 1,741,248 1,741,248 3,482,495 J
TotalDirectAnnualCosts 1,797,033 1,797,033 3,572,057 DAC=E+F+G+H+I+J
IndirectAnnualCostsOverhead 13,206 13,206 13,206 K=0.60×(E+F+G+H)AdministrativeCharges 60,988 60,988 121,976 L=0.02×TCIPropertyTax 30,494 30,494 60,988 M=0.01×TCIInsurance 30,494 30,494 60,988 N=0.01×TCICapitalRecovery2 434,166 434,166 868,331 O
TotalIndirectAnnualCosts 569,347 569,347 1,125,489 IDAC=K+L+M+N+O
TotalAnnualCost($) 2,366,380 2,366,380 4,697,546 TAC=DAC+IDAC
PollutantRemoved(tpy) 165.15 165.15 330.30
CostpertonofPollutantRemoved($) 14,329 14,329 14,222 $/ton=TAC/PollutantRemoved
1.U.S.EPAOAQPS,EPAAirPollutionControlCostManual(6thEdition) ,January2002,Section3.2(VOCDestructionControls),Chapter2(Incinerators).
OperatingCost
CapitalCost
2.CapitalRecoveryfactorcalculatedbasedonEquation2.8a(Section1,Chapter2,page2‐21)andTable1.13(Section2,Chapter1,page1‐52)ofU.S.EPAOAQPS,EPAAirPollutionControlCostManual(6thEdition),January2002.
2.CapitalCostsarebasedtheEPACATCRegenerativeIncineratorFactSheet(EPA‐452/F‐03‐021)average$/scfmcapitalcost,scaledfrom2002$to2012$.
TrinityConsultants Page3of5AugustaKilnBACTCostCalculations(20130307JS)
RTOCost

AppendixD‐BACTCalculationsWestFraser‐Augusta,GAMill
TableD‐7.CostAnalysisSupportingInformationforBiofilterandKilnExhaustSystem
Parameter AllKilns Units Note(s)
MaximumProductionCapacity 220 MMBF/yrUncontrolledStackInletEmissions(VOC) 337.04 tpy 1RemovalEfficiency 65 % 2VOCRemoved 219.08 tpy 3
AirflowCaptureEfficiency 80 % 4PressureDrop 19 inchesofH2O 5FanMotorEfficiency 70.00 % 6
OperatingLaborCost 12.00 $/hr 7MaintenanceLaborCost 13.20 $/hr 7ElectricityCost 0.06 $/kW‐hr 8WaterCost 0.00 $/gal 9
KilnExhaustSystemEquipmentLife 10 years 10InterestRate 7.0 % 10
2010$(March) 217.6 n/a 112012$(October) 231.3 n/a 11
1.Potentialinletemissionsbasedonmaximumcapacityandemissions,routingbothkilnsintoonebiofilter.
5.BasedonexampleprobleminOAQPSManual,Section3.2,Chapter2,page2‐43.
6.PerOAQPSManual,Section3.2,Chapter2,page2‐41,efficiencyrangesfrom40to70%.70%isconservativelychosen.
7.LaborcostsperOAQPSManual,Section3.1,Chapter1,pages1‐29and1‐37.
8.BasedonOAQPS,Section2,Chapter3,page3‐32.
9.BasedonOAQPS,Section4.2,Chapter1,page1‐39.
10.BasedonexampleprobleminOAQPSManual,Section3.2,Chapter2,page2‐45.
11.ValuesbasedonU.S.HistoricalConsumerPriceIndex:ftp://ftp.bls.gov/pub/special.requests/cpi/cpiai.txt.
2.BiofiltrationcontrolefficiencybasedonNorthCarolinaDepartmentofEnvironmentandNaturalResourcesAirPermitReviewforWeyerhauser’sPlymouthfacilitycontinuouskilnconstructionapplication,whichreferencedanestimated60–70%VOCcontrolefficiencyfrombiofiltration,basedonaconversationwithDavidWordofNCASI.3.VOCRemoved(tpy)=RemovalEfficiency(%)×UncontrolledStackInletEmissions(tpy).VOCasterpene+methanol+formaldehyde.4.EngineeringestimatebasedonNorthCarolinaDepartmentofEnvironmentandNaturalResourcesAirPermitReviewforWeyerhauser’sPlymouthfacility'scontinuouskilnconstructionapplication,whichestimateda50%captureefficiencyforemissionsfromacontinuouslumberkiln.
TrinityConsultants Page4of5AugustaKilnBACTCostCalculations(20130307JS)
BiofiltrationInfo

AppendixD‐BACTCalculationsWestFraser‐Augusta,GAMill
TableD‐8.CapitalCostAnalysisforBiofilterandKilnExhaustSystemforVOCcontrol
AllKilns OAQPSNotation
TotalCapitalInvestment1 13,763,885 TCI
TableD‐9.OperatingCostAnalysisforBiofilterandKilnExhaustSystemforVOCcontrol
AllKilns OAQPSNotation
TotalDirectAnnualCosts 1 210,633 DAC
IndirectAnnualCosts1 342,727CapitalRecovery2 1,959,668
TotalIndirectAnnualCosts 2,866,155 IDAC
TotalAnnualCost($) 3,076,788 TAC=DAC+IDAC
PollutantRemoved(tpy) 219.08
CostpertonofPollutantRemoved($) 14,044 $/ton=TAC/PollutantRemoved
CapitalCost
OperatingCost
1.CalculatedfromtheNorthCarolinaDivisionofAirQuality(NCDAQ)AirPermitReview/PreliminaryDeterminationfortheWeyerhaeuserNRCompany,Plymouth,NCfacilitypermitapplication(May2010),writtenbyJennyKelvingtonofNCDAQ,forthecostestimatesofabiofiltrationsystemforsimilarkilnstothoseWestFraserisproposing.Thecostsincludeachillerthatwouldbeneededtocooltheexhausttemperaturetoatleast110°F,themaximumtemperaturethatcangothroughthebiofiltrationsystemwithoutkillingthebugs.Relianceonthisvalueisreasonableasthequotedunitwassizedforcontrollingtwocontinuouskilnsaswell(atapermittedthroughputof117MMBF/yr).However,thecostwasscaleduptoaccountfortheMaplesvilleMill'spotentialproductionthroughputof200MMBF/yr.AllcostshavebeenadjustedfromMarch2010dollarstoOctober2012dollars.
2.CapitalRecoveryfactorcalculatedbasedonEquation2.8a(Section1,Chapter2,page2‐21)andTable1.13(Section2,Chapter1,page1‐52)ofU.S.EPAOAQPS,EPAAirPollutionControlCostManual (6thEdition),January2002.
1.CalculatedfromtheNorthCarolinaDivisionofAirQuality(NCDAQ)AirPermitReview/PreliminaryDeterminationfortheWeyerhaeuserNRCompany,Plymouth,NCfacilitypermitapplication(May2010),writtenbyJennyKelvingtonofNCDAQ,forthecostestimatesofabiofiltrationsystemforsimilarkilnstothoseWestFraserisproposing.Thecostsincludeachillerthatwouldbeneededtocooltheexhausttemperaturetoatleast110°F,themaximumtemperaturethatcangothroughthebiofiltrationsystemwithoutkillingthebugs.Relianceonthisvalueisreasonableasthequotedunitwassizedforcontrollingtwocontinuouskilnsaswell(atapermittedthroughputof117MMBF/yr).However,thecostwasscaleduptoaccountfortheMaplesvilleMill'spotentialproductionthroughputof200MMBF/yr.AllcostshavebeenadjustedfromMarch2010dollarstoOctober 2012dollars.
TrinityConsultants Page5of5AugustaKilnBACTCostCalculations(20130307JS)
BiofiltrationCost

Appendix F Updates
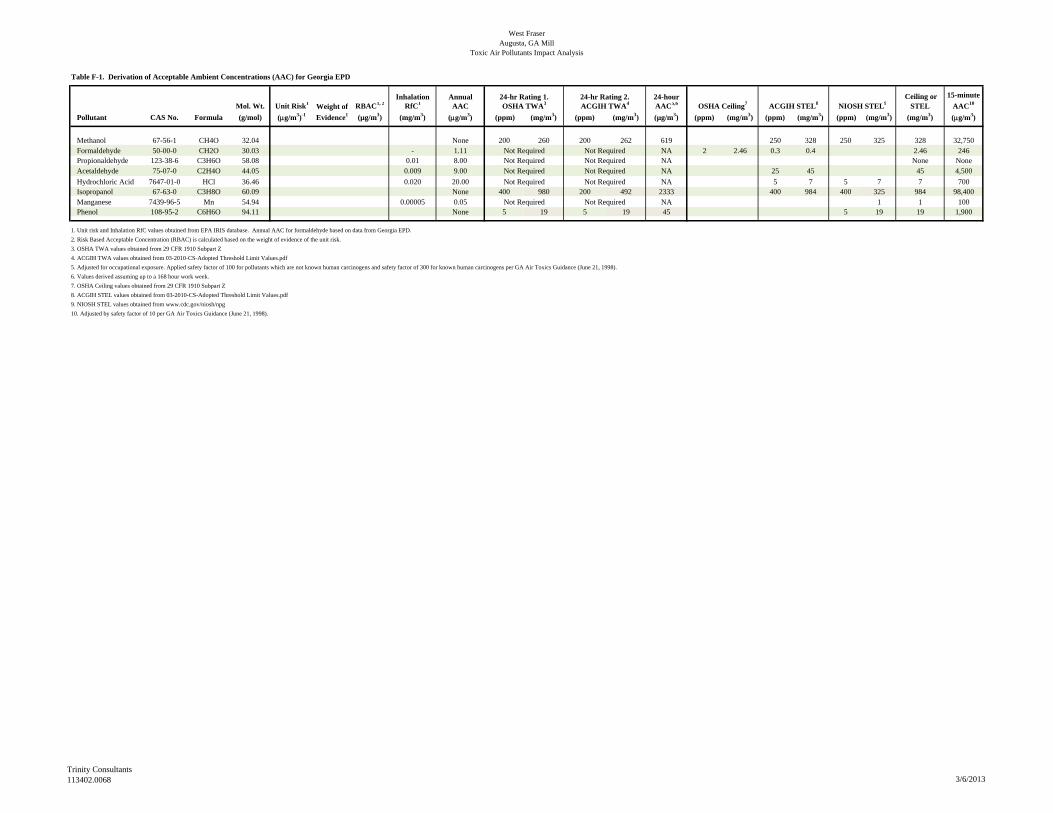
West FraserAugusta, GA Mill
Toxic Air Pollutants Impact Analysis
Table F-1. Derivation of Acceptable Ambient Concentrations (AAC) for Georgia EPD
Inhalation Annual 24-hour Mol. Wt. Unit Risk1 RBAC1, 2 RfC1 AAC AAC5,6
Pollutant CAS No. Formula (g/mol) (g/m3)-1 (µg/m3) (mg/m3) (g/m3) (ppm) (mg/m3) (ppm) (mg/m3) (µg/m3) (ppm) (mg/m3) (ppm) (mg/m3) (ppm) (mg/m3) (mg/m3) (g/m3)
Methanol 67-56-1 CH4O 32.04 None 200 260 200 262 619 250 328 250 325 328 32,750Formaldehyde 50-00-0 CH2O 30.03 - 1.11 NA 2 2.46 0.3 0.4 2.46 246Propionaldehyde 123-38-6 C3H6O 58.08 0.01 8.00 NA None NoneAcetaldehyde 75-07-0 C2H4O 44.05 0.009 9.00 NA 25 45 45 4,500
Hydrochloric Acid 7647-01-0 HCl 36.46 0.020 20.00 NA 5 7 5 7 7 700Isopropanol 67-63-0 C3H8O 60.09 None 400 980 200 492 2333 400 984 400 325 984 98,400Manganese 7439-96-5 Mn 54.94 0.00005 0.05 NA 1 1 100Phenol 108-95-2 C6H6O 94.11 None 5 19 5 19 45 5 19 19 1,900
1. Unit risk and Inhalation RfC values obtained from EPA IRIS database. Annual AAC for formaldehyde based on data from Georgia EPD.
2. Risk Based Acceptable Concentration (RBAC) is calculated based on the weight of evidence of the unit risk.
3. OSHA TWA values obtained from 29 CFR 1910 Subpart Z
4. ACGIH TWA values obtained from 03-2010-CS-Adopted Threshold Limit Values.pdf
5. Adjusted for occupational exposure. Applied safety factor of 100 for pollutants which are not known human carcinogens and safety factor of 300 for known human carcinogens per GA Air Toxics Guidance (June 21, 1998).
6. Values derived assuming up to a 168 hour work week.
7. OSHA Ceiling values obtained from 29 CFR 1910 Subpart Z
8. ACGIH STEL values obtained from 03-2010-CS-Adopted Threshold Limit Values.pdf
9. NIOSH STEL values obtained from www.cdc.gov/niosh/npg
10. Adjusted by safety factor of 10 per GA Air Toxics Guidance (June 21, 1998).
Weight of
Evidence1
OSHA TWA3 ACGIH TWA4 OSHA Ceiling7
15-minute
AAC10NIOSH STEL9ACGIH STEL824-hr Rating 1. 24-hr Rating 2.
Not Required Not Required
Not Required Not Required
Ceiling or STEL
Not Required
Not RequiredNot Required
Not RequiredNot RequiredNot Required
Trinity Consultants113402.0068 3/6/2013

West FraserAugusta, GA Mill
Toxic Air Pollutants Impact Analysis Table F-2. Derivation of Long-term Acceptable Ambient Concentrations (AAC) for Georgia EPD
Mol. Wt. Unit Risk1 RBAC2 Inhalation RfC1 Annual AAC
Pollutant CAS No. Formula (g/mol) (g/m3)-1 (µg/m3) (mg/m3) (g/m3)
Methanol 67-56-1 CH4O 32.04 None Need 24-hr TWAFormaldehyde 50-00-0 CH2O 30.03 - 1.11 Not RequiredPropionaldehyde 123-38-6 C3H6O 58.08 0.008 8.00 Not RequiredAcetaldehyde 75-07-0 C2H4O 44.05 0.009 9.00 Not RequiredHydrochloric Acid 75-09-2 HCl 36.46 0.020 20.00 Not RequiredIsopropanol 75-09-2 C3H8O 60.09 None Need 24-hr TWAManganese 75-09-2 Mn 54.94 0.00005 0.05 Not RequiredPhenol 75-09-2 C6H6O 94.11 None Need 24-hr TWA
1. Unit risk and Inhalation RfC values obtained from EPA IRIS database.
2. Risk Based Acceptable Concentration (RBAC) is calculated based on the weight of evidence of the unit risk.
3. Formaldehyde annual AAC as prescribed by Georgia EPD.
Weight of Evidence
24-hour AAC Required?
Trinity Consultants113402.0068 3/6/2013

West FraserAugusta, GA Mill
Toxic Air Pollutants Impact Analysis
Table F-3. Derivation of 24-hr Acceptable Ambient Concentrations (AAC) for Georgia EPD
24-hr Rating 4. 24-hourMol. Wt. LD50 (rat) AAC4
Pollutant CAS No. Formula (g/mol) (ppm) (mg/m3) (ppm) (mg/m3) (ppm) (mg/m3) (mg/kg) (mg/m3) (µg/m3)
Methanol Need 24-hr TWA 67-56-1 CH4O 32.04 200 260 200 262 260 619Formaldehyde Not Required 50-00-0 CH2O 30.03 Not Required Not RequiredPropionaldehyde Not Required 123-38-6 C3H6O 58.08 Not Required Not RequiredAcetaldehyde Not Required 75-07-0 C2H4O 44.05 Not Required Not RequiredHydrochloric Acid Not Required 7647-01-0 HCl 36.46 Not Required Not RequiredIsopropanol Need 24-hr TWA 67-63-0 C3H8O 60.09 400 980 200 492 980 2333Manganese Not Required 7439-96-5 Mn 54.94 None NonePhenol Need 24-hr TWA 108-95-2 C6H6O 94.11 5 19 5 19 19 45
1. Per the Guidelines , one long-term value is required; TAP with an annual AAC do not require a 24-hr AAC.
2. OSHA TWA values obtained from 29 CFR 1910 Subpart Z
3. ACGIH TWA values obtained from 03-2004-TLVs.doc
4. Adjusted for occupational exposure. Applied safety factor of 100 for pollutants which are not known human carcinogens and safety factor of 300 for known human carcinogens per GA Air Toxics Guidance (June 21, 1998).
24-hr Rating 3. Rating Available 24-hour TWAOSHA TWA ACGIH TWA NIOSH TWA
Not Required Not Required
Not Required
24-hr AAC
Required1?
24-hr Rating 1. 24-hr Rating 2.
Not Required Not RequiredNot Required Not RequiredNot Required Not Required
Not Required
Trinity Consultants113402.0068 3/6/2013

West FraserAugusta, GA Mill
Toxic Air Pollutants Impact Analysis
Table F-4. Derivation of 15-minute Acceptable Ambient Concentrations (AAC) for Georgia EPD
Mol. Wt.Ceiling or
STEL
15-minute
AAC4
Pollutant CAS No. Formula (g/mol) (ppm) (mg/m3) (ppm) (mg/m3) (ppm) (mg/m3) (mg/m3) (g/m3)
Methanol 67-56-1 CH4O 32.04 250 328 250 325 328 32,750Formaldehyde 50-00-0 CH2O 30.03 2 2.46 0.3 0.4 2.46 246Propionaldehyde 123-38-6 C3H6O 58.08 None NoneAcetaldehyde 75-07-0 C2H4O 44.05 25 45.00 45 4500Hydrochloric Acid 7647-01-0 HCl 36.46 5 7.00 5 7 7 700Isopropanol 67-63-0 C3H8O 60.09 400 984.00 400 325 984 98400Manganese 7439-96-5 Mn 54.94 5 1 5 500Phenol 108-95-2 C6H6O 94.11 5 19 19 1900
1. OSHA Ceiling values obtained from 29 CFR 1910 Subpart Z
2. ACGIH STEL values obtained from 03-2004-TLVs.doc
3. NIOSH STEL values obtained from www.cdc.gov/niosh/npg
4. Adjusted by safety factor of 10 per GA Air Toxics Guidance (June 21, 1998).
OSHA Ceiling1 ACGIH STEL2 NIOSH STEL3
Trinity Consultants113402.0068 3/6/2013

SIP Form Updates

Georgia SIP Application Form 1.00, rev. October 2012 Page 3 of 4
11. If confidential information is being submitted in this application, were the guidelines followed in the “Procedures for Requesting that Submitted Information be treated as Confidential”?
No Yes
12. New Facility Emissions Summary
Criteria Pollutant New Facility
Potential (tpy) Actual (tpy)
Carbon monoxide (CO)
Nitrogen oxides (NOx)
Particulate Matter (PM) (filterable only)
PM <10 microns (PM10)
PM <2.5 microns (PM2.5)
Sulfur dioxide (SO2)
Volatile Organic Compounds (VOC)
Greenhouse Gases (GHGs) (in CO2e)
Total Hazardous Air Pollutants (HAPs)
Individual HAPs Listed Below:
13. Existing Facility Emissions Summary
Criteria Pollutant Current Facility After Modification
Potential (tpy) Actual (tpy) Potential (tpy) Actual (tpy)
Carbon monoxide (CO) 78.16 78.16 80.30 80.30
Nitrogen oxides (NOx) 29.98 29.98 30.80 30.80
Particulate Matter (PM) (filterable only)* 207.5 207.5 217.33 217.33
PM <10 microns (PM10) 68.0 68.0 64.16 64.16
PM <2.5 microns (PM2.5) 37.74 37.74 28.51 28.51
Sulfur dioxide (SO2) 10.36 10.36 7.67 7.67
Volatile Organic Compounds (VOC) 410.35 410.35 421.6 421.6
Greenhouse Gases (GHGs) (in CO2e)*
1,803 1,803 1,334 1,334
Total Hazardous Air Pollutants (HAPs)*
21.41 21.41 33.35 33.35
Individual HAPs Listed Below:
Formaldehyde 4.28 4.28 4.40 4.40
Methanol 17.13 17.13 17.60 17.60 *PM is listed as Total PM, as the Filterable and Condensable PM emission factors for the kilns cannot be determined from the source. The sources (quoted in the emission calculations) list a Total PM factor. All fugitive sources however only emit Filterable PM (as Condensable PM from those sources is negligible). *Biomass deferral. * HAP for existing only includes methanol plus formaldehyde.

Georgia SIP Application Form 4.00, rev. June 2011 Page 1 of 2
Facility Name: West Fraser – Augusta Lumber Mill Date of Application: Revised March 2013
FORM 4.00 – EMISSION INFORMATION
Emission Unit ID
Air Pollution Control
Device ID
Stack ID
Pollutant Emitted
Emission Rates
Hourly Actual Emissions
(lb/hr)
Hourly Potential
Emissions (lb/hr)
Actual Annual
Emission (tpy)
Potential Annual
Emission (tpy)
Method of Determination
KD04 N/A N/A Total PM 1.73 1.73 7.59 7.59 NCASI Factor, from publically available document
KD04 N/A N/A
Total PM10 1.31 1.31 5.72 5.72 NCASI Factor, from publically available document
KD04 N/A N/A
Total PM2.5 1.24 1.24 5.45 5.45 NCASI Factor, from publically available document
KD04 N/A N/A
CO 9.17 9.17 40.15 40.15 NCASI Factor, from publically available document
KD04 N/A N/A
NOX 3.52 3.52 15.40 15.40 NCASI Factor, from publically available document
KD04 N/A N/A SO2 0.88 0.88 3.83 3.83 AP-42
KD04 N/A N/A
VOC 48.09 48.09 210.65 210.65 NCASI Factors, from publically available document
KD04 N/A N/A CO2ebiomass deferral 152.32 152.32 667.15 667.15
40 CFR Part 98 Subpart C
KD04 N/A N/A
Formaldehyde 0.50 0.50 2.20 2.20 NCASI Factor, from publically available document
KD04 N/A N/A
Methanol 2.01 2.01 8.80 8.80 NCASI Factor, from publically available document
KD05 N/A N/A Total PM 1.73 1.73 7.59 7.59 NCASI Factor, from publically available document
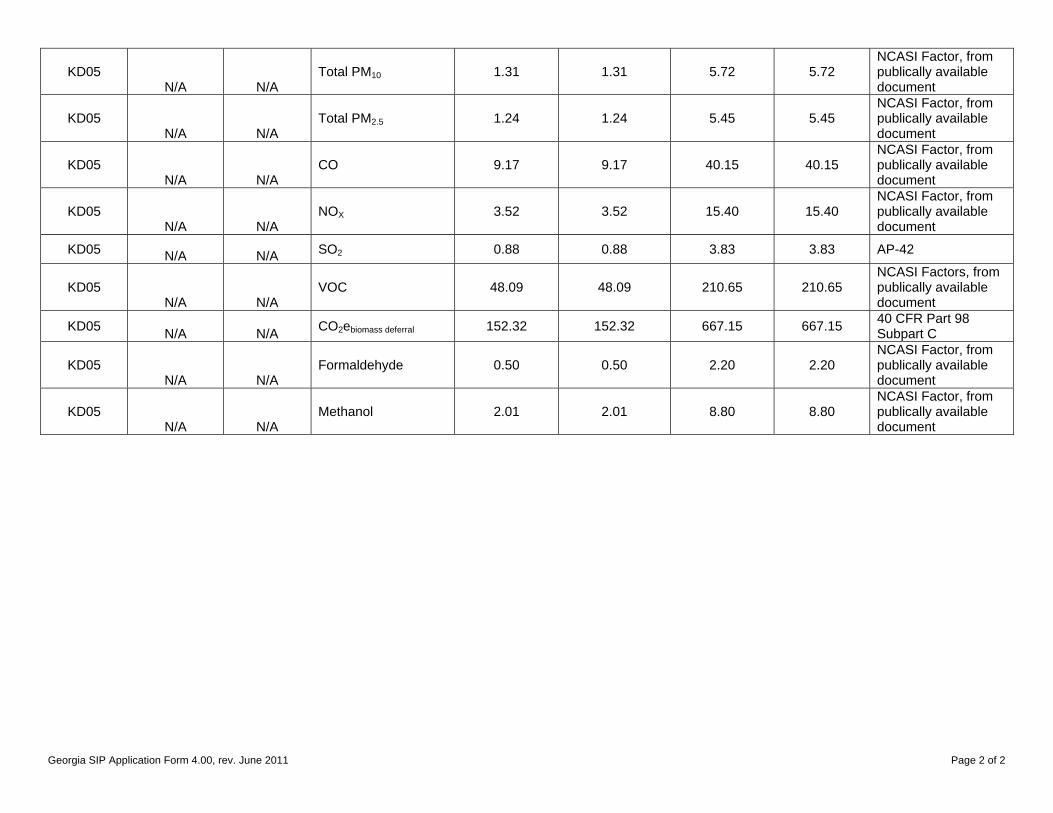
Georgia SIP Application Form 4.00, rev. June 2011 Page 2 of 2
KD05 N/A N/A
Total PM10 1.31 1.31 5.72 5.72 NCASI Factor, from publically available document
KD05 N/A N/A
Total PM2.5 1.24 1.24 5.45 5.45 NCASI Factor, from publically available document
KD05 N/A N/A
CO 9.17 9.17 40.15 40.15 NCASI Factor, from publically available document
KD05 N/A N/A
NOX 3.52 3.52 15.40 15.40 NCASI Factor, from publically available document
KD05 N/A N/A SO2 0.88 0.88 3.83 3.83 AP-42
KD05 N/A N/A
VOC 48.09 48.09 210.65 210.65 NCASI Factors, from publically available document
KD05 N/A N/A CO2ebiomass deferral 152.32 152.32 667.15 667.15
40 CFR Part 98 Subpart C
KD05 N/A N/A
Formaldehyde 0.50 0.50 2.20 2.20 NCASI Factor, from publically available document
KD05 N/A N/A
Methanol 2.01 2.01 8.80 8.80 NCASI Factor, from publically available document

Georgia SIP Application Form 6.00, rev. June 2005 Page 1 of 1
Facility Name: West Fraser – Augusta Lumber Mill Date of Application: Revised March 2013
FORM 6.00 – FUGITIVE EMISSION SOURCES
Fugitive Emission Source ID
Description of Source Emission Reduction Precautions
Pot. Fugitive Emissions*
Amount (tpy)
Pollutant
NA Log Sawing N/A 16.17 PM
NA Log Sawing N/A 9.24 PM10/ PM2.5
NA Debarking N/A 0.92 PM
NA Debarking N/A 0.51 PM10/ PM2.5
NA Truck Unloading N/A 9.93E-02 PM
NA Truck Unloading N/A 4.70E-02 PM10
NA Truck Unloading N/A 7.11E-03 PM2.5
NA Material Transfer N/A 9.93E-02 PM
NA Material Transfer N/A 4.70E-02 PM10
NA Material Transfer N/A 7.11E-03 PM2.5
NA Chipper N/A 0.27 PM
NA Chipper N/A 0.15 PM10/ PM2.5
NA Hogger N/A 0.09 PM
NA Hogger N/A 0.05 PM10/ PM2.5
RF01/ RF02
Road Travel Periodically spraying water on the roads 184.5 PM
RF01/ RF02
Road Travel Periodically spraying water on the roads 42.68 PM10
RF01/ RF02
Road Travel Periodically spraying water on the roads 7.66 PM2.5
*Note that all numbers shown are future potential emissions for the source following the project.

Georgia SIP Application Form 7.00, rev. June 2005 Page 2 of 2
Facility Name: West Fraser – Augusta Lumber Mill Date of Application: Revised March 2013
FORM 7.00 AIR MODELING INFORMATION: Chemicals Data
Chemical Potential
Emission Rate (lb/hr)
Toxicity Reference MSDS
Attached
Methanol 4.02 See Attached See Attached
Formaldehyde 1.004 See Attached See Attached
Propionaldehyde 0.04 See Attached See Attached
Acetaldehyde 1.456 See Attached See Attached
Hydrochloric Acid 0.16 See Attached See Attached
Isopropanol 0.21 See Attached See Attached
Manganese 0.0634 See Attached See Attached
Phenol 0.55 See Attached See Attached

Title V Database Updates


B - Facility Emissions
Facility: West Fraser Inc. Application: 2012 PSD Application for Continuous Kilns
B2 - Facility-Wide Actual Emissions Estimates
Trifluralin > 0 to < 10
Vinyl acetate > 0 to < 10
Vinyl bromide > 0 to < 10
Vinyl chloride > 0 to < 10
Vinylidene chloride (1,1-Dichloroethylene) > 0 to < 10
Volatile Hazardous Air Pollutants > 0 to < 10
Xylenes (isomers and mixture) > 0 to < 10
5 Year Average Actual
(tons per year) Pollutant Maximum Actual
Annual (tons per year)
Nitrogen Oxides 30.8 30.8
Particulate Matter 217.3 217.3
Particulate Matter <10 microns 64.2 64.2
Sulfur Dioxide 7.7 7.7
Total Hazardous Air Pollutants 33.4 33.4
Volatile Organic Compounds 421.6 421.6
Thursday, March 07, 2013 Page 8 of 8

Facility: West Fraser Inc. Application: 2012 PSD Application for Continuous
Pollutant Sulfur Dioxide
Maximum Actual Emissions in Tons per Year: 3.83 tons/yr
Method the Emissions were determined (CEM, Stack Testing, Mass Balance, etc.):
AP-42
Applicable Federal Standard:
Applicable State Standard:
Applicable Permit Condition(s):
Is this a Proposed Voluntary Limit?
Is there a Work Practice or Design Standard?
Is this in Compliance with the Standard(s) ?
No
No
No
Numerical Emission Limit or Standard: 0
Maximum Actual Emissions in Units of the Standard:
0
Emission Unit: KD04 Continuous Kiln #1
Pollutant Volatile Organic Compounds
Maximum Actual Emissions in Tons per Year: 210.65 tons/yr
Method the Emissions were determined (CEM, Stack Testing, Mass Balance, etc.):
As requested by GA EPD.
Applicable Federal Standard:
Applicable State Standard:
Applicable Permit Condition(s):
Is this a Proposed Voluntary Limit?
Is there a Work Practice or Design Standard?
Is this in Compliance with the Standard(s) ?
No
No
No
Numerical Emission Limit or Standard:
Maximum Actual Emissions in Units of the Standard:
0
Emission Unit: KD04 Continuous Kiln #1
Thursday, March 07, 2013 Page 3 of 8

Facility: West Fraser Inc. Application: 2012 PSD Application for Continuous
Pollutant Sulfur Dioxide
Maximum Actual Emissions in Tons per Year: 3.83 tons/yr
Method the Emissions were determined (CEM, Stack Testing, Mass Balance, etc.):
AP-42
Applicable Federal Standard:
Applicable State Standard:
Applicable Permit Condition(s):
Is this a Proposed Voluntary Limit?
Is there a Work Practice or Design Standard?
Is this in Compliance with the Standard(s) ?
No
No
No
Numerical Emission Limit or Standard: 0
Maximum Actual Emissions in Units of the Standard:
0
Emission Unit: KD05 Continuous Kiln #2
Pollutant Volatile Organic Compounds
Maximum Actual Emissions in Tons per Year: 210.65 tons/yr
Method the Emissions were determined (CEM, Stack Testing, Mass Balance, etc.):
As requested by GA EPD.
Applicable Federal Standard:
Applicable State Standard:
Applicable Permit Condition(s):
Is this a Proposed Voluntary Limit?
Is there a Work Practice or Design Standard?
Is this in Compliance with the Standard(s) ?
No
No
No
Numerical Emission Limit or Standard:
Maximum Actual Emissions in Units of the Standard:
0
Emission Unit: KD05 Continuous Kiln #2
Thursday, March 07, 2013 Page 6 of 8