
were plotted to show the relationship between the frequency of baro-
23
J. Physiol. (1971), 214, pp. 201-223 201 With 8 text-ftigureo Printed in Great Britain THE RESPONSES OF AORTIC ARCH AND RIGHT SUBCLAVIAN BARORECEPTORS TO CHANGES OF NON-PULSATILE PRESSURE AND THEIR MODIFICATION BY HYPOTHERMIA BY JENNIFER E. ANGELL JAMES From the Department of Physiology, St Bartholomew's Hospital Medical College, London EC 1M 6BQ (Received 7 August 1970) SUMMARY 1. A method is described for isolation of the aortic arch and right sub- clavian-carotid angle in situ in the rabbit and perfusion with Krebs- Henseleit solution or blood under controlled conditions of pressure and temperature. 2. The characteristics of the baroreceptors of the aortic arch and right subclavian-carotid angle were studied by recording from single or few- fibre preparations of the left and right aortic nerves respectively. Curves were plotted to show the relationship between the frequency of baro- receptor impulse activity and intra-aortic pressure during non-pulsatile perfusion under steady-state conditions. 3. The aortic arch and right subclavian-carotid angle baroreceptors were found to have similar characteristics. Three types of response of the baroreceptors at the threshold pressure to a steady intra-aortic pressure are described. 4. Increasing the intra-aortic pressure increased the frequency of impulses in fibres previously active and caused recruitment of other fibres in multi-fibre preparations. The relationship was linear at low pressures and a point of inflexion occurred at higher pressures in the majority of fibres. 5. Lowering the temperature of the perfusate reduced the impulse frequency at any given pressure. 6. The curves obtained during stepwise increases and decreases in intra- aortic arch pressure were dissimilar, particularly at the lower end of the pressure range. This phenomenon is probably due to properties of the arterial wall. 7. When the aortic arch preparation was excised, changes occurred in
Transcript of were plotted to show the relationship between the frequency of baro-

J. Physiol. (1971), 214, pp. 201-223 201With 8 text-ftigureoPrinted in Great Britain
THE RESPONSES OFAORTIC ARCH AND RIGHT SUBCLAVIAN BARORECEPTORS
TO CHANGES OF NON-PULSATILE PRESSURE ANDTHEIR MODIFICATION BY HYPOTHERMIA
BY JENNIFER E. ANGELL JAMESFrom the Department of Physiology, St Bartholomew's Hospital
Medical College, London EC1M 6BQ
(Received 7 August 1970)
SUMMARY
1. A method is described for isolation of the aortic arch and right sub-clavian-carotid angle in situ in the rabbit and perfusion with Krebs-Henseleit solution or blood under controlled conditions of pressure andtemperature.
2. The characteristics of the baroreceptors of the aortic arch and rightsubclavian-carotid angle were studied by recording from single or few-fibre preparations of the left and right aortic nerves respectively. Curveswere plotted to show the relationship between the frequency of baro-receptor impulse activity and intra-aortic pressure during non-pulsatileperfusion under steady-state conditions.
3. The aortic arch and right subclavian-carotid angle baroreceptorswere found to have similar characteristics. Three types of response of thebaroreceptors at the threshold pressure to a steady intra-aortic pressureare described.
4. Increasing the intra-aortic pressure increased the frequency ofimpulses in fibres previously active and caused recruitment of other fibresin multi-fibre preparations. The relationship was linear at low pressuresand a point of inflexion occurred at higher pressures in the majority offibres.
5. Lowering the temperature of the perfusate reduced the impulsefrequency at any given pressure.
6. The curves obtained during stepwise increases and decreases in intra-aortic arch pressure were dissimilar, particularly at the lower end of thepressure range. This phenomenon is probably due to properties of thearterial wall.
7. When the aortic arch preparation was excised, changes occurred in

JENNIFER E. ANGELL JAMESthe shape of the impulse frequency-pressure curves from baroreceptors inboth areas. The point of inflexion was elevated and a higher percentage offibres failed to reach a point of inflexion in the pressure range studied.
INTRODUCTION
Our knowledge of the physiological characteristics of arterial baro-receptors stems mainly from studies carried out on the carotid sinuses(Bronk & Stella, 1932, 1935; Landgren, 1952a, b; see also Heymans &Neil, 1958) and it has been generally assumed that the baroreceptors inthe aortic arch show similar characteristics. However, in a recent study ithas been shown that whereas the reflex vasomotor responses elicited bychanges in mean carotid sinus pressure are modified by alterations of pulsepressure, those evoked by the aortic-arch baroreceptors through changesof mean pressure are only weakly affected by modifications in pulse pres-sure (Angell James & Daly, 1970). But apart from a few studies of theimpulse discharge in baroreceptor fibres from the aortic arch in the entireanimal (Adrian, 1926; Bloor, 1964; Aars, 1968), there has been no syste-matic investigation of their responses to alteration of mean pressure, pulsepressure and pulse frequency under conditions of controlled perfusion.
This paper describes a technique for isolating and perfusing the aorticarch and right subelavian-carotid angle for experimental investigation ofbaroreceptor nerve fibre activity from these two areas under controlledconditions. The pattern of firing of single and few-fibre recordings of theaortic nerves was studied during perfusion at non-pulsatile pressures. Someof the results of this study have been described briefly elsewhere (AngellJames, 1968) and in detail in a thesis (Angell James, 1969).
METHODS
New Zealand white rabbits weighing 16-3-5 kg were anaesthetized with 25%urethane (1X5-2X0 g/kg; British Drug Houses, Ltd.) given intravenously. During thisperiod it was found that music was helpful in keeping the animals quiet and relaxed.A tracheostomy was performed and the common carotid arteries were prepared
for ligation and cannulation.18olation of the aortic arch and subelavian regions. Positive pressure ventilation
was maintained with a bellows respirator pump (C. F. Palmer, Ltd.) at a frequencyof 30 c/min. A mid line thorocotomy was performed and the right and left sub-clavian arteries and the descending thoracic aorta, below the level of the left pul-monary artery, were prepared for subsequent ligation. The internal mammaryarteries were ligated together with any anomalous vessels arising from the aorticarch and its major branches (Angell James, 1969) (Fig. 1). These surgical procedureswere facilitated by use of specially designed aneurysm needles (Daly & AngellJames, 1968).
Perfusion of the preparation. The right common carotid artery was cannulated
202

AORTIC AND SUBCLAVIAN BARORECEPTORSwith a nylon cannula ('Portex', o.d. 1F65 mm, i.d. 1 19 mm) and heparin wasadministered intra-arterially ('Pularin', Evans Medical Ltd., 1000 i.u./kg). The rightand left subelavian arteries were then ligated whilst recording from the right andleft aortic nerves to determine whether this procedure had any effect on impulseactivity, as the ligatures were very close to the nerves to the baroreceptor areas.
Fig. 1. Diagram showing the isolated perfused aortic arch and rightsubclavian regions of the rabbit, and indicating the site of the ligaturesand cannulae. The architecture of the main branches of the aortic archis variable (Angell James, 1969), but that depicted here is the com-monest variant.
The preparation was perfused through a brass cannula (o.d. 4 mm, i.d. 3-8 mm,length 75 mm), bent in the middle through 40°, which was passed through the wallof the left ventricle so that its tip lay in the ascending aorta. It was secured inposition by tapes tied in the atrio-ventricular groove and around the ventricles. Theleft common carotid artery and the descending thoracic aorta were ligated. The
203
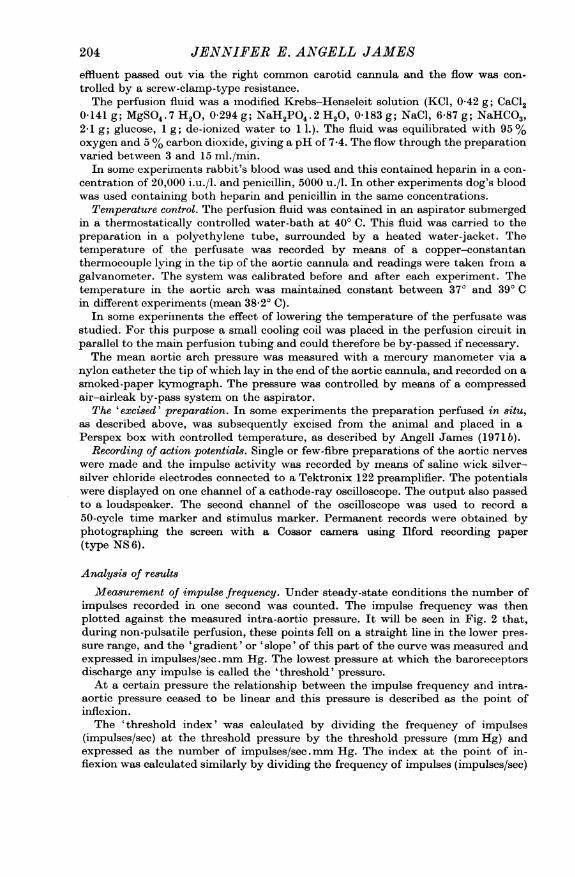
204 JENNIFER E. ANGELL JAMESeffluent passed out via the right common carotid cannula and the flow was con-trolled by a screw-clamp-type resistance.The perfusion fluid was a modified Krebs-Henseleit solution (KC1, 0-42 g; CaCI2
0-141 g; MgSO4.7 H20, 0-294 g; NaH2PO4 .2 H20, 04183 g; NaCI, 6-87 g; NaHCO3,2 1 g; glucose, 1 g; de-ionized water to 11.). The fluid was equilibrated with 95 %oxygen and 5 % carbon dioxide, giving a pH of 7-4. The flow through the preparationvaried between 3 and 15 ml./min.
In some experiments rabbit's blood was used and this contained heparmi in a con-centration of 20,000 i.u./l. and penicillin, 5000 u./l. In other experiments dog's bloodwas used containing both heparin and penicillin in the same concentrations.
Temperature control. The perfusion fluid was contained in an aspirator submergedin a thermostatically controlled water-bath at 400 C. This fluid was carried to thepreparation in a polyethylene tube, surrounded by a heated water-jacket. Thetemperature of the perfusate was recorded by means of a copper-constantanthermocouple living in the tip of the aortic cannula and readings were taken from agalvanometer. The system was calibrated before and after each experiment. Thetemperature in the aortic arch was maintained constant between 37° and 390 Cin different experiments (mean 3820 C).
In some experiments the effect of lowering the temperature of the perfusate wasstudied. For this purpose a small cooling coil was placed in the perfusion circuit inparallel to the main perfusion tubing and could therefore be by-passed if necessary.The mean aortic arch pressure was measured with a mercury manometer via a
nylon catheter the tip of which lay in the end of the aortic cannula, and recorded on asmoked-paper kymograph. The pressure was controlled by means of a compressedair-airleak by-pass system on the aspirator.
The 'excised' preparation. In some experiments the preparation perfused in situ,as described above, was subsequently excised from the animal and placed in aPerspex box with controlled temperature, as described by Angell James (1971 b).
Recording of action potentials. Single or few-fibre preparations of the aortic nerveswere made and the impulse activity was recorded by means of salinewick silver-silver chloride electrodes connected to a Tektronix 122 preamplifier. The potentialswere displayed on one channel of a cathode-ray oscilloscope. The output also passedto a loudspeaker. The second channel of the oscilloscope was used to record a
50-cycle time marker and stimulus marker. Permanent records were obtained byphotographing the screen with a Cossor camera using Ilford recording paper
(type NS6).
Analysis of resultsMeasurement of impulse frequency. Under steady-state conditions the number of
impulses recorded in one second was counted. The impulse frequency was thenplotted against the measured intra-aortic pressure. It will be seen in Fig. 2 that,during non-pulsatile perfusion, these points fell on a straight line in the lower pres-
sure range, and the 'gradient' or 'slope' of this part of the curve was measured andexpressed in impulses/sec mm Hg. The lowest pressure at which the baroreceptorsdischarge any impulse is called the 'threshold' pressure.
At a certain pressure the relationship between the impulse frequency and intra-aortic pressure ceased to be linear and this pressure is described as the point ofinflexion.The 'threshold index' was calculated by dividing the frequency of impulses
(impulses/sec) at the threshold pressure by the threshold pressure (mm Hg) andexpressed as the number of impulses/sec.mm Hg. The index at the point of in-fiexion was calculated similarly by dividing the frequency of impulses (impulses/sec)
204

AORTIC AND SUBOLAVIAN BARORECEPTORS
!IiII.LII- A411 L 4 I _I L1_
I 5 I I5 . - I I
100Pressure (mm Hg)
Fig. 2. The relationship between impulse activity in a single baroreceptorfibre of the left aortic nerve and intra-aortic pressure. Rabbit, wt. 1-8 kg.The isolated aortic arch was perfused with Krebs-Henseleit solution at38.50 C. A, impulse frequency 47/sec at its threshold pressure of 65 mmHg; B, impulse frequency 59/sec at a pressure of 82 mm Hg; C, impulsefrequency 74/sec at a pressure of 100 mm Hg; D, impulse frequency 89/sec at a pressure of 122 mmHg; E, impulse frequency of 100/sec at a
pressure of 155 mm Hg. Time marker 50 c/s.
A
B
C
D
E
120 r
100 1-
U0
00V
E
80 f-
60 1-
4Ck-50 150
I
11
205
I.. - -- - V v- V -W I . 9 I - I - - v v I - 9 v v . - 9 w I -
I d tu 11 file]] 11 11 -111 I 11 I 1. 11IN-WVTW W-rvwlrl-V'W-
I
- g , . -- - , -W I - ., I W
I . 4. -
II I

JENNIFER E. ANGELL JAMESby the pressure (mm Hg) at the point of inflexion and expressed as impulses/sec .mm H1g.
Statistical arnalysi. The results are expressed as mean ± the standard error of themean (s.E. of mean). The Student t test was used to evaluate the significance of thedifference of two means of grouped values, and the significance of the difference fromzero of the mean of the difference between paired observations.
RESULTS
I. The aortic arch preparation in situIn single- or few-fibre preparations of the aortic nerves it was found
that the size of the action potentials was variable. Raising the mean pres-sure of the perfusate in a stepwise fashion resulted in a sudden increase inimpulse activity which was greater than that at which it settled at thenew pressure. Although under steady-state conditions considerablevariability was found in the shape of the curve relating impulse frequencyto intra-aortic arch pressure with different fibres, control tests made onsix fibres in six experiments showed that the curves were repeatable for atleast 30 min.
Impulse frequency-aortic pressure curvesfor left and right aortic nerves
Left aortic nerveThe shape of the curve relating impulse frequency to aortic arch pressure
differed considerably from one fibre to another but there were certainfeatures which were common to most fibres. When the pressure was raisedfrom zero, no impulses were recorded until a critical pressure was reached,the threshold pressure, which in the experiment depicted in Fig. 2 was65 mm Hg.The nature of the discharge in fibres at their threshold pressures was
variable and has been classified arbitrarily into three types. In Type 1there was a critical level of pressure at which the discharge of impulses inthe fibre commenced (Fig. 2A). In Type 2 the fibres discharged inter-mittently, in some cases in bursts lasting for a second and then ceasing fora second or two. A third form of discharge (Type 3) was that in which theimpulse frequency remained constant over a range of pressure of about20-40 mm Hg before increasing as the pressure increased. In some of thesecases the frequency of the fibre even diminished by 2 or 3 impulses/sec ormore before the stage of increasing with the intra-aortic pressure. Of thetwenty-six fibres studied, sixteen were of Type 1, four of Type 2 and six ofType 3.The results of an analysis of twenty-six single- or few-fibre prepara-
tions of the left aortic nerve in fifteen experiments are shown in Table 1.The threshold pressure of the fibres varied from 0 to 118 mm Hg (mean
206
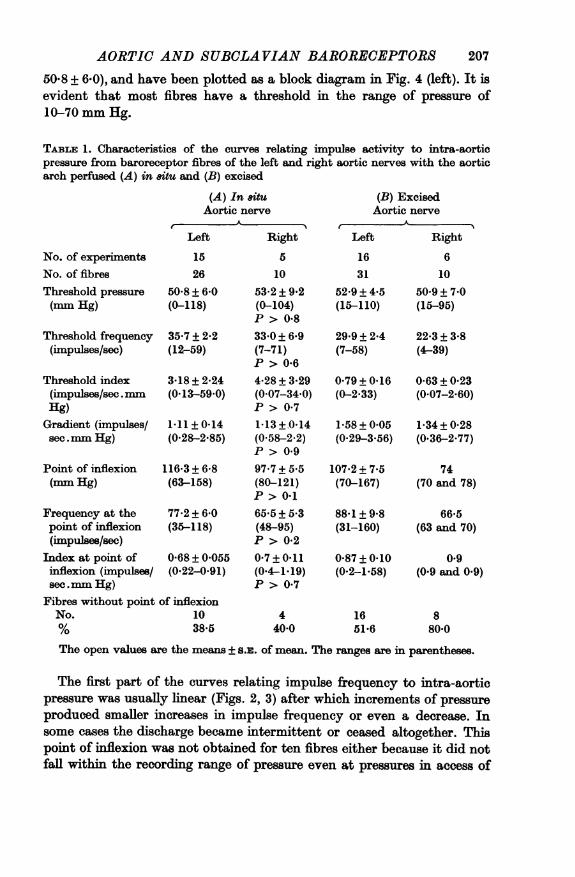
AORTIC AND SUBCLAVIAN BARORECEPTORS50-8 + 6.0), and have been plotted as a block diagram in Fig. 4 (left). It isevident that most fibres have a threshold in the range of pressure of10-70 mm Hg.
TABLE 1. Characteristics of the curves relating impulse activity to ntra-aorticpressure from baroreceptor fibres of the left and right aortic nerves with the aorticarch perfused (A) in situ and (B) excised
No. of experimentsNo. of fibresThreshold pressure(mm Hg)
Threshold frequency(impulses/see)
Threshold index(impulses/sec. rmmHg)Gradient (impulses/sec.mm Hg)
Point of inflexion(mm Hg)
Frequency at thepoint of inflexion(impulses/sec)
Index at point ofinflexion (impulses/sec.mm Hg)
(A) In 8ttuAortic nerve
Left Right
15 526 10
50-8+ 6-0 53-2 + 9-2(0-118) (0-104)
P > 0-835.7 + 2-2 33-0+ 6-9(12-59) (7-71)
P > 0-63-18 ± 2-24 4-28 ± 3-29(0-13-59-0) (0-07-34.0)
P > 0-71-11 + 0-14 1-13 ±+0-14(0-28-2-85) (0-58-2-2)
P > 0-9116-3 + 6-8 97-7 + 5.5(63-158) (80-121)
P > 0-177-2 + 6-0 65-5 + 5.3(36-118) (48-95)
P > 0-20-68±0-055 0-7+0-11(0-22-0-91) (0.4-1.19)
P > 0-7Fibres without point of inflexionNo. 10°/% 38-5
440-0
(B) ExcisedAortic nerve
A- 5~Left Right
16 631 10
52-9 + 4-5 50-9+ 7-0(15-110) (15-95)
29-9 + 2-4 22-3 ± 3-8(7-58) (4-39)
0-79 ± 0-16 0-63 + 0-23(0-2-33) (0-07-2-60)
1-58±0-05 1-34±0-28(0-29-3-56) (0-36-2-77)
107-2 ± 7-5(70-167)
88-1+9-8(31-160)
0-87 + 0-10(0-2-1-58)
1651-6
74(70 and 78)
66-5(63 and 70)
0-9(0-9 and 0-9)
880-0
The open values are the means ± 5-. of mean. The ranges are in parentheses.
The first part of the curves relating impulse frequency to intra-aorticpressure was usually linear (Figs. 2, 3) after which increments of pressureproduced smaller increases in impulse frequency or even a decrease. Insome cases the discharge became intermittent or ceased altogether. Thispoint of inflexion was not obtained for ten fibres either because it did notfall within the recording range of pressure even at pressures in access of
207

JENNIFER E. ANGELL JAMES250 mm Hg or because the fibre ceased firing abruptly and in these casesthe impulse frequency-pressure relationship remained linear.
In multi-fibre preparations of the aortic nerve it was found that as theaortic arch pressure was raised recruitment occurred of other fibres whichhad higher threshold pressures.
Right aortic nerveThe results of a study of ten fibres from the right aortic nerve in five
experiments are summarized in Table 1 and the relationship between theimpulse frequency and intra-aortic pressure is illustrated in Fig. 3 (right).
120 120
5 100 1505 100 750
80 1/ /
U'
Fi.3 Gah hoigte eaiosi f mus /tvt to'-U---.
40 /0 7
20 ~~~~~~~~20
50 100 150 50 100 150Pressure (mm Hg) Pressure (mm Hg)
Fig. 3. Graphs showing the relationship of impulse activity to intra-aortic pressure. Left, four single fibres from the left aortic nerve. Right,four single fibres from the right aortie nerve. The lowest point of each curverepresents the threshold pressure of each receptor.
The nature of the firing at threshold levels of pressure was classifiedaccording to the three types described above and seven fibres were ofType 1, one of Type 2 and two of Type 3.
Comparison of left and right aortic nerves. Table 1 also shows that for thetwo nerves there is little difference between the corresponding values forthe threshold index, the slope of the initial part of the impulse frequency-pressure curve, the point of inflexion, the impulse frequency at the pointof inflexion, and the index at the point of inflexion. In subsequent sectionsof this paper, therefore, the characteristics of the fibres comprising thesetwo nerves will be considered together.
208

AORTIC AND SUBCLAVIAN BARORECEPTORS 209
In situ Excised
5-6
_-
0 40 80 10 0 408-2
06z
3-
2
0 40 80 120 0 40 80 120Aortic pressure (mm Hg)
Fig. 4. Histograms showing the threshold pressure (mm Hg) of twenty.six fibres from the left aortic nerve with the aortic arch preparation in &itu(left) and thirty-one fibres with the excised aortic arch preparation (right).
Effects of altering the composition and temperature of the perfusateComposition. In the majority of experiments Krebs-Henseleit solution
was used as the perfusate and it was therefore considered necessary to findout whether the impulse frequency-pressure curves differed in any waywhen blood was used. The effects of substituting dog's blood for Krebs-Henseleit solution (eight fibres in four experiments) and rabbit's blood forKrebs-Henseleit solution (two fibres in two experiments) were thereforestudied. No appreciable difference between any of the curves was found,and the results from a typical experiment are shown in Fig. 5.
Temperature. The effects of lowering the temperature of the perfusateon the relationship between impulse frequency and aortic arch pressurewas studied in six experiments at three different temperatures (meanvalues 38-2, 29-0 and 22.10 C). In order for the comparison to be made theimpulse frequency was determined at the threshold pressure and at pres-sures of 60, 80 and 100 mm Hg. The results obtained from thirteen fibres,of which five were from the right aortic nerve and eight from the left, areshown graphically in Fig. 6, from which it may be seen that as the

20JENNIFER E. ANGELL JAMEStemperature is lowered the impulse frequency at a given aortic pressureis reduced.A paired analysis of the data was made by comparing the values at the
two lower temperatures with the corresponding control values at 38.20 C.Compared with the control temperature the threshold pressure and theimpulse frequency at the threshold pressure were respectively 11'5 + 4'1
80 I-Dog's blood
Krebs-Henseleit
Rabbit's blood601-
20 _-
0 50 100Pressure (mm Hg)
150
Fig. 5. Graph relating the impulse activity from a single fibre of the rightaortic nerve to aortic arch pressure. The temperature of the perfusates wasthe same. *, Krebs-Henseleit solution; 0O dog's blood; A, rabbit's blood.
mm Hg and 6'5 + 2'9 impulses/sec lower at the temperature of 29-00 C(P < 0'02 and P < 0'05) and 13-9 + 5-0 mm Hg and 10'7 + 2'6 impulses/see lower at the temperature of 22-10 C (P < 0-02 and P < 0.001). Thereduction in impulse frequency at pressures of 60, 80 and 100 mm Hg isalso statistically significant (P < 0.001) and becomes greater as thepressure increases (see Fig. 6).When the temperature of the perfusate was lowered the gradient of the
first part of the curve relating impulse frequency to intra-aortic pressure
U0
V
E 40
I I
210

AORTIC AND SUBCLAVIAN BARORECEPTORSwas depressed from a mean of 1*56 + 029 impulses/sec.mm Hg (range0.36-3.76) at 38.20C to a mean of 0-74+0-16 impulses/sec.mm Hg(range 0.18-1.75) at 29.00C and 0-22+001 impulses/sec.mmHg (range- 028 to + 1 0) at 22.10 C. In some experiments it was found that with thelowest temperature of 22.10 C the slope was negative, indicating a fall ofthe impulse frequency as the intra-aortic pressure increased. Some fibreseven became inactive at a perfusion temperature of 220 C.
801.
60 *-U0
0
- 40
20 k
0 50 100Aortic pressure (mm Hg)
150
Fig. 6. The effect of temperature on the relationship of impulse activity toaortic arch pressure. Thirteen fibres of the aortic nerves. Perfusate: Krebs-Henseleit solution. **-, temperature 38520 C; 0--- 0, temperature29-00 C; E....-, temperature 2211C. Values are the means ± s.E. of mean.
The results obtained on another four fibres (two from the left and twofrom the right aortic nerves) in two experiments are not included in Fig. 6as their curves relating impulse frequency to intra-aortic pressure layoutside the pressure range used for this particular analysis. However, theyexhibited a similar reduction of impulse frequency at any given pressurewhen the temperature of the perfusate was lowered.
211
1 l .

JENNIFER E. ANGELL JAMES
The effect on aortic baroreceptor activity of reducing aorticpressure in steps after previously raising the pressure
A comparison was made of the relationship between the impulsefrequency and aortic arch pressure during a stepwise increase in aorticpressure and during similar decrease in pressure. It was found in all sixexperiments that the two curves differed slightly in position (Table 2). Thetypical effect is shown in Fig. 7. It may be observed that whereas the curves
TABiE 2. A comparison ofthe relationship between the impulse frequency and aorticarch pressure during (A) a stepwise increase and (B) a stepwise decrease in aorticarch pressure. Six fibres in six experiments
A(increasingpressure)
B(decreasingpressure)
Difference(B-A)
Threshold pressure(mm Hg)
Threshold frequency(impulses/sec)
Threshold index(impulses/sec.mm Hg)
Frequency at 20mmHg above thresholdpressure (impulses/see)
Frequency at 40 mmHg above thresholdpressure (impulses/sec)
Frequency at 60 mmHg above thresholdpressure (impulses/sec)Gradient (impulses/sec.mm Hg)
56-6 ± 4-8 69-2 + 11-7 12-5 + 8-9(20-104) (33-104) (-10 to +50)
P> 0.232-3 + 5-9 30*0+ 8-2 - 2-3 + 3.3(8-50) (1-60) (- 11 to +10)
P > 0*50-98 ± 0'38 0*54 + 0*16 - 0*62 + 0*32(0.08-2-5) (0.01-1.03) (-1-64 to + 0.04)
0-1 > P > 0*0548*2 + 5-4 33*2 ± 5-0 - 12-4 + 2-4(27-63) (19-50) (- 18 to - 6)
P < 0-0157 0+ 7-0 46-4±+ 6-1 - 7-0+ 2*6(34-77) (27-62) (- 15 to 0)
P < 0-0260*2 + 7*9 56-0± 4-7 -4-2+ 3-2(45-90) (47-74) (- 16 to + 2)
P > 0-21-07 + 0*4 1-37 ± 0*36 0*30 + 0-42(0.28-2.77) (0.36-2.77) (- 0-04 to + ' U)
P.> (5The open values are the mean + s.E. of mean. The ranges are in parentheses
at the higher levels of pressure did not differ appreciably, the lower partof the descending pressure curve fell to the right of the ascending pressurecurve. The lowest pressure at which impulses were recorded on thedescending pressure curve was 53 mm Hg, compared with the original'threshold' pressure of 41 mm Hg on the ascending pressure curve. Thefrequency of firing was also less than for the equivalent pressure when thepressure was progressively raised, and the threshold index was thereforereduced.
212
AORTIC AND SUBCLAVIAN BARORECEPTORS
60 -
40 -
U
0
0~
E <20_
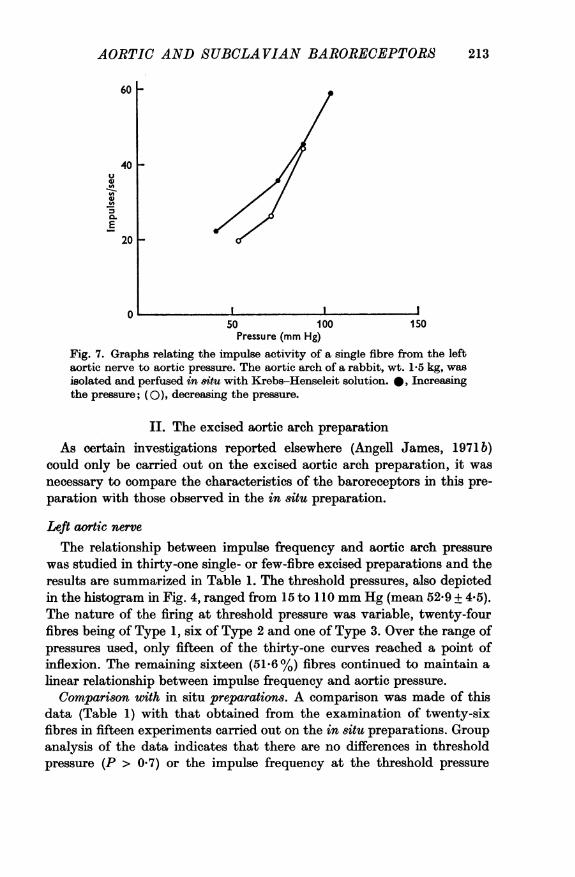
50 100 150Pressure (mm Hg)
Fig. 7. Graphs relating the impulse activity of a single fibre from the leftaortic nerve to aortic pressure. The aortic arch of a rabbit, wt. 1-5 kg, wasisolated and perfused in situ with Krebs-Henseleit solution. A, Increasingthe pressure; (O), decreasing the pressure.
II. The excised aortic arch preparationAs certain investigations reported elsewhere (Angell James, 1971 b)
could only be carried out on the excised aortic arch preparation, it wasnecessary to compare the characteristics of the baroreceptors in this pre-paration with those observed in the in situ preparation.
Left aortic nerve
The relationship between impulse frequency and aortic arch pressurewas studied in thirty-one single- or few-fibre excised preparations and theresults are summarized in Table 1. The threshold pressures, also depictedin the histogram in Fig. 4, ranged from 15 to 110 mm Hg (mean 52-9 + 4.5).The nature of the firing at threshold pressure was variable, twenty-fourfibres being of Type 1, six of Type 2 and one of Type 3. Over the range ofpressures used, only fifteen of the thirty-one curves reached a point ofinflexion. The remaining sixteen (51.6 %) fibres continued to maintain alinear relationship between impulse frequency and aortic pressure.
Comparison with in situ preparations. A comparison was made of thisdata (Table 1) with that obtained from the examination of twenty-sixfibres in fifteen experiments carried out on the in situ preparations. Groupanalysis of the data indicates that there are no differences in thresholdpressure (P > 0.7) or the impulse frequency at the threshold pressure
213

JENNIFER E. ANGELL JAMES(P > 0.2). The threshold index, however, was lower. There was a signi-ficant difference between the values for the gradient of the first part of thecurves, 1II + 014 impulses/sec.mm Hg in the in sitU preparations and1-58 + 0.05 impulses/sec.mm Hg in the excised preparations (P < 0.05).The data for comparison of the points of inflexion in the two series is
more difficult to evaluate. Although the mean pressure corresponding tothe point of inflexion was less in the 'excised' preparations the data repre-sented only 48-4% of the fibres, as the remainder failed to reach this point.This compares with 61-5 % of the fibres in the in situ preparations. Thus asmaller proportion of fibres reached their point of inflexion in the 'excised'preparation and those fibres that did had a higher frequency of impulsesthan those in in situ preparations. The index at the point of inflexion wasfound to be less in the in situ preparations than in the 'excised' prepara-tions. This indicates that the frequency of impulses was higher at the pointof inflexion in the 'excised' preparation.
Right aortic nerveIn the 'excised' preparations of the aortic arch and subclavian areas
the threshold pressure was similar to that in the in situ preparations, butof ten fibres studied only two showed a point of inflexion. The remainingeight fibres (80 %) did not reach this point.
Comparison with in situ preparations. Group comparison of the data forthe right aortic nerve obtained from in situ and 'excised' aortic archpreparations indicates that there is no difference between the values forthreshold pressure (P > 0.8), impulse frequency at the threshold pressure(P > 0.1) or gradient of the first part of the curve (P > 0 5) (Table 1). Thethreshold index, however, was lower in the excised preparation.No detailed comparison could be made of the values for the point of
inflexion in the two series as only two of the ten fibres (20%) in the' excised' aortic arch reached this point; in the in situ preparation 60% ofthe fibres showed this point at a mean pressure of 97-7 + 5*5 mm Hg andmean impulse frequency of 65-5 + 5-3 impulses/sec. However, the fact that80% of the fibres in the 'excised' preparation compared with 40% in thein situ preparation failed to reach their point of inflexion in the range ofpressures used indicated that the characteristics of the baroreceptors in the'excised' preparation are different to those in the in sitU preparation.
It is apparent that the differences in the relationship between impulsefrequency and aortic arch pressure in the in situ and 'excised' preparation,particularly with regard to the position of the point of inflexion, apply tofibres of both the left and right aortic nerves.The different behaviour of the baroreceptors in the two types of pre-
paration may be due to the fact that in the 'excised' preparation cutting
214

AORTIC AND SUBCLAVIAN BARORECEPTORSthe vessels released the longitudinal elastic tension of the aortic arch andcommon carotid-subclavian angle. However the aortic arch is also free tostraighten in this preparation, which would alter the radii of curvature andmodify the general form of the Laplace equation. In order to study theeffect of releasing the longitudinal tension alone on single fibre activity,further experiments were carried out as described below.
III. The effects of relasing the longitudinal tensionin the arterial walls
Experiments were carried out on the aortic arch in situ and impulsefrequency-aortic arch pressure curves were obtained before and afterreleasing the longitudinal tension oftheaortic arch. This was done by cuttingtransversely the descending aorta distal to the ligature on the vessel (seeMethods). In this series visual inspection indicated there was little alter-ation of the curvature of the aortic arch, presumably due to the tetheringto adjacent tissues being undisturbed.A typical experiment is illustrated in Fig. 8, in which the impulse dis-
charge in a single fibre ofthe left aortic nerve was studied. After cutting thedescending aorta the threshold pressure was elevated but the impulse fre-quency at the threshold pressure did not increase correspondingly; on thecontrary, it fell below the control level. Thus the threshold index wasreduced from 1-5 to 0 43 impulses/sec.mm Hg. The point of inflexion wasincreased by 40 mm Hg after severing the aorta and the impulse frequencywas augmented at these pressures.The results of four experiments in which five fibres were studied before
and after severing the descending aorta (Table 3) showed that this pro-cedure resulted in an elevation of the threshold pressure in four of the fivefibres; but the fifth fibre now exhibited a Type 3 threshold so that a con-stant rate of firing was maintained over a range ofpressure from 17 mm Hgbelow the control threshold to 15 mm Hg above it. The average value forthe threshold was raised, but there was no increase in either the impulsefrequency, despite this elevation of the threshold pressure, or the thresholdindex. Reducing the longitudinal tension on the vessels also caused an in-crease in the pressure at which the point of inflexion occurred and an in-crease in the impulse frequency at the point of inflexion. However, therewas no difference between the mean control and experimental values forthe gradient of the linear part of the curve.
It is concluded from these experiments that severing the aortic vesselsalters the relationship between the impulse frequency and aortic pressure.This corroborates the findings that the relationship is also different in'excised' and in situ aortic-arch preparations.
215

JENNIFER E. ANGELL JAMES
Aorta
I I I I I I I I I I I I I I I I I
so 100Pressure (mm Hg)
Fig. 8. Graphs showing the relationship between impulse activity and aorticpressure. Single fibre from the left aortic nerve of a 1*6 kg rabbit. Theaortic arch was isolated and perfused with Krebs-Henseleit solution. 0,
aortic arch in situ; 0O aortic arch in situ and the aorta divided distal to theorigin of the left subclavian artery.
TABLE 3. The effect on the behaviour of the aortic arch baroreceptors of altering thelongitudinal tension of the aortic arch by cutting the vessel. Five fibres in fourexperiments. Aortic arch preparation in situ
Control(A)
Experimental(B)
Difference(B - A)
Threshold pressure
(mm Hg)
Threshold frequency(impulses/sec)
Threshold index(impulses/sec.mm Hg)
Point of inflexion(mm Hg)
Frequency at point ofinflexion (impulses/sec) (three fibres)
Gradient (impulses/see.mm Hg)
40*2+ 12-8 47-8+ 13-8 +7-2+941(13-84) (15-88) (- 17 to + 40)
P > 0*433-6 + 1-7 31-8 + 2-8 2-0 + 1-8(30-39) (24-39) (-6 to +4)
P > 0-31-2+0 33 1 01 +0-36 -0-2+0 37(0*4l-2-31) (0-43-2*3) (-1-07 to + 1.2)
P > 0*698-2 + 10-8 138-6 ± 11 5 30*7- + 3-7(63-129) (113-167) (27-38)
P < 0.0181-4 + 111 133 + 14*5 36-3 + 9-7(51-115) (87-160) (17-47)
P < 0-021-4+0 37 1-3+0-25 -0*09+0-16(0.86-2.85) (0 86-2-2) (-0.65 to +0 34)
P> 0-5
Two fibres failed to reach the point of inflexion after severing the aortic arch.The open values are the means + S.E. of mean. The ranges are in parentheses.
160 k Aorta cut-*
120 1-U
-Wa)4)
0E
80 I-
40 F
0150
216
AORTIC AND SUBCLAVIAN BARORECEPTORS
DISCUSSION
The isolated aortic-arch preparation described here has enabled a studyto be made of the physiological characteristics of the baroreceptors in theaortic-arch and right subclavian areas under conditions of controlledperfusion. When perfused with non-pulsatile pressures no systematicdifferences were found as indicated by the characteristics of the impulse fre-quency-aortic arch pressure curves. This is consistent with the observationsof Irisawa & Ninomiya (1967), who found no difference in the 'form' of thewhole nerve activity in the left and right aortic nerves of the rabbit.The threshold pressure of the aortic arch baroreceptors lay in the range
given by experiments in vivo in which thresholds were calculated by theuse of regression lines from data relating impulse activity to mean arterialblood pressure in the anaesthetized rabbit (Bloor, 1964). Bauer (1939) wasunable to obtain any reflex effect from stimulation of these receptorsuntil a pressure of 60-65 mm Hg was obtained. However, any comparisonbetween his values and those reported here is difficult to assess because thedata from the present experiments is based on receptor threshold whereasBauer (1939) studied the threshold for the reflex response which wouldinclude the characteristics of the central and peripheral parts of theautonomic nervous system.The threshold pressure for the right subclavian baroreceptors was the
same as for the receptors in the aortic arch. Other workers have studiedthe threshold for arterial blood pressure response from the right sub-clavian baroreceptor areas perfused at non-pulsatile pressures, and whereasTang (1964) obtained values of 60-80 mm Hg, those observed by Ueda,Uchida, Yasuda & Takeda (1966) were lower (20 + 8-6 mm Hg).The phenomenon of impulse activity occurring sometimes at very low
pressures was also observed in the carotid sinus by Landgren (1952 a), whoascribed it to deformation of the receptor endings by collapse of thearterial wall. A similar explanation for the reflex effect observed in the low-pressure ranges was given by Heymans & Bouckaert (1929) to account forthe fall in blood pressure which occurred on lowering the carotid sinuspressure from an initial level of about 50 mm Hg. However, in the presentexperiments it appears that some fibres fire constantly over a pressurerange extending to 0 mm Hg and this must be due to a constant tensionacting on the nerve endings. Occasionally a slight increase in dischargeoccurred as the pressure approached 0 mm Hg, which could be due to thecollapse of the arterial wall deforming the receptors.The explanation for the three types of threshold described in this paper
must lie in the nature of the intimate connexions of the receptors withthe smooth muscle, elastic and collagen tissues in the wall; thus the inter-
217
JENNIFER E. ANGELL JAMESmittent (Type 2) threshold could be due to phasic changes in tone of thevessel wall and the constant discharge (Type 3) threshold to a constanttension acting on the receptor endings over that pressure range.The linear relationship between the arterial pressure and impulse fre-
quency in the lower parts of the curves relating these two parameters wasdescribed for the carotid sinus baroreceptors by Bronk & Stella (1932,1935). This is the most sensitive part of the curve and straddles the valuefor the normal mean arterial blood pressure for the unanaesthetized rabbit(92 + 5-8 mm Hg, Chalmers, Korner & White, 1967). The curves obtainedby Homma & Suzuki (1966) in the cat were not only less steep than thosereported here but were also S-shaped, thus differing from the majority offibres in the present series. The possibility that the aortic arch was'splinted' by the clamps applied to the proximal and distal parts of thearch in their experiments might account for this difference, particularly inview of the observed changes in the shape of the curves that occur ondeliberately altering the longitudinal tension in the aorta (this paper).The impulse frequency at the point of inflexion was not necessarily the
maximum frequency attained in any given fibre; in some fibres, at least,the impulse frequency continued to increase with pressure whereas inothers the impulse frequency either remained constant, diminished, be-came intermittent or decreased to zero. The enormous variation in theresponse between one receptor and another may be due to their positionin the wall of the vessel and to their relationship to different tissues withinthe wall.The shape of the impulse frequency-aortic pressure curve was also
dependent on the previous history of the preparation. Thus followingdistension of the aortic arch the lower part of the curve is shifted to theright, resulting in a diminished frequency of impulse activity at a givenpressure. This indicates an alteration ofreceptor activity most probably dueto mechanical changes resulting from the arterial wall having been stretched(static hysteresis).
Studies based on the aortic-arch baroreceptor impulse activity and ontheir efferent response indicate that the most sensitive control of fluctua-tions of arterial blood pressure would occur at levels of pressure found inthe normal animal (Angell James & Daly, 1970). Where the arterialpressure gradually falls due, for instance, to haemorrhage, the impulsefrequency in individual fibres diminishes and there is, in addition, a pro-gressive reduction in the number of active units. As the pressure rises abovenormal, the incremental increase in the total number of impulses becomesprogressively less, due to the point of inflexion being reached in individualunits when the curve begins to flatten and, in the case of some receptors atleast, starts to fall. Few fibres would be recruited. Whole nerve recordings
218

AORTIC AND SUBCLAVIAN BARORECEPTORS
of the aortic nerves in the intact animal confirm that at pressures aboveabout 140 mm Hg in the rabbit there is little increase in total nerveactivity (Aars, 1968).
Effects of hypothermiaThe reversible diminution in the frequency of impulses in single fibres
of both the left and right aortic nerves at any given pressure produced bylowering the temperature of the perfusate is an observation similar tothat made by Diamond (1955) on the carotid sinus of the cat. The onlydifference appears to be in connexion with the effect oftemperature on thethreshold pressure. Whereas the threshold, at least in the case of some ofthe aortic fibres, was reduced by lowering the temperature ofthe perfusate,Diamond (1955) found it to be increased in carotid sinus fibres.The possibility must be considered that the effects ofhypothermia on the
aortic baroreceptor impulse activity is the result of partial block of nervetransmission. However, the evidence presented by Paintal (1965a, b)indicates that even at the minimum temperature used, 26.50 C, and atimpulse frequencies of the order of 100 impulses/sec, this explanation isunlikely. Alternative explanations are that the phenomenon is due todepolarization of the membrane by the nerve endings, such as occurs withmuscle spindles (Lippold, Nicholls & Redfearn, 1960), or to an alterationin the visco-elastic properties of the wall of the blood vessel. With regardto the last possibility, cooling blood vessels results in contraction ofsmoothmuscle and in a reduction in distensibility. At any given pressure, there-fore, the radius of the aortic arch is less on cooling than at a temperatureof 370 C. No experiments have been carried out to determine which of thetwo alternatives is the more likely.
These results have a bearing on the arterial baroreceptor reflex responsesunder conditions of hypothermia. Nashat & Neil (1955) found that re-ducing the temperature of the carotid sinus perfusate, the body tempera-ture remaining normal, reduced the arterial blood pressure response to agiven rise of carotid sinus pressure.
Possible mechanisms of stimulation of arterial baroreceptorsHauss, Kreuziger & Asteroth (1949) demonstrated that the reflex fall
in blood pressure resulting from an increase in carotid sinus pressure wasdependent on stretch, 'distension' or deformation of the sinus wall. Con-sistent with this view is the finding that the increased aortic baroreceptorimpulse activity resulting from a rise in aortic arch pressure can be pre-vented by simultaneously applying an extra-mural counter-pressure ofsimilar size (Angell James, 1971 b). Moreover the shape of the curverelating impulse activity to aortic arch pressure resembles the pressure-volume curves (Hallock & Benson, 1937; Remington, 1955), the point of
219

JENNIFER E. ANGELL JAMES
inflexion occurring at a point when the volume or circumference ceases toincrease linearly with pressure. Excision of the preparation results in anelevation of the point of inflexion and the frequency of impulses which isprobably due to the release of the longitudinal tension allowing an addi-tional increase in volume, which has been shown to occur, at higher pres-sures when the aorta is excised (Bergel, 1961). This suggests there is a closerelationship between aortic volume and baroreceptor activity. This issupported by the work of Aars (1969) in which he demonstrated a closerelationship between baroreceptor activity, from whole nerve recordings,and aortic diameter.
It is well known that the pressure-circumference relationship is depen-dent on the longitudinal tension, a reduction in longitudinal tension result-ing in an increased circumference at a given pressure (Rushmer, 1955;Bergel, 1961). It might be expected, therefore, that if the baroreceptorfibre impulse frequency was solely a function of vessel diameter, thephysiological effects of dividing the aortic arch would be to increase theimpulse frequency at a given pressure. But this was not always so, exceptat a pressure above that for the normal inflexion point. This finding can bereconciled if it is assumed that the attachments of the receptors in relationto the components of the vessel wall are such that the receptors arestretched not only by an increase in circumference of the vessel, but also byan increase in its longitudinal length. In this connexion traction on thecommon carotid artery stimulates the sinus nerve endings (Heymans &Neil, 1958, p. 76). The explanation for the elevation of the threshold pres-sure which occurs after division of the aorta may be similar. Thus afterreducing the longitudinal tension on the aortic arch, the impulse fre-quency at a given pressure would be the resultant of an increased rate offiring through an increase in circumference and a reduced discharge due to adiminished longitudinal length.One of the striking features of the present study was the variability of
the characteristics of the aortic-arch baroreceptors as found by Bronk &Stella (1935) for the carotid sinus baroreceptors. This may be a reflexionof the wide range of contact which the nerve terminals make with indi-vidual components of the arterial wall and various admixtures of thesecomponents in a particular area, as suggested for the carotid sinus by Rees(1967). No relationship was found between action potential height andspecific characteristics of the curves. In any case action potential heightdepends not only on aortic nerve fibre diameter (2-10,t, Paintal, 1953)but also on the distance of the active fibre from the recording electrode.
There is evidence that in addition to changes of vessel circumference andlongitudinal stretch, the baroreceptors are also affected by local mechanicalchanges within the vessel wall. The local application of adrenaline or nor-
220

AORTIC AND SUBCLAVIAN BARORECEPTORS
adrenaline to the carotid sinus causes a reflex fall in arterial blood pressure(Palme, 1951; Heymans & Heuvel-Heymans, 1951). Heymans, & Heuvel-Heymans postulated that this response was due to an increase in tone ortension within the vessel wall which affected baroreceptors. Landgren(1952 b) demonstrated the increase baroreceptor activity by electro-neurographic recordings and found that it was accompanied by a reductionin diameter of the carotid sinus. Further evidence that local mechanicalchanges in the vessel affect baroreceptors is presented in the present paper.In the construction of static impulse-frequency-pressure curves, as for
the dynamic curves (Angell James, 1971 a), the impulse frequency wasfound to be lower at a given pressure on the descending pressure limbdespite the aortic diameter being larger (Remington, 1955). The explana-tion of these effects is not entirely clear but certain aspects of the problemhave been discussed previously (Peterson, 1960; Bader, 1963).On the basis of the views of Benninghoff (1930) on the structural
relationship between smooth 'spannung' muscles and elastic membranesand fibres in the wall of elastic vessels, contraction of the smooth muscle,for instance by adrenaline, would increase the tension, and hence thelength of the elastic fibres and so stimulate the baroreceptors lying parallelwith these fibres (see Bader, 1963). Such an explanation would account forthe changes occurring in the static impulse frequency-pressure loops ifchanges occurred predominantly in the smooth muscle component of thevessel wall. Alternatively it is known that the relative extensibilities of thevarious components of the vessel wall differ considerably (Burton, 1954).Thus a change in extensibility in one component relative to another at thesame pressure may alter the activity in adjacent baroreceptors as some ofthe nerve terminals situated near the external elastic lamina are related tocollagen and elastic tissue, at least in the carotid sinus (Rees, 1967). In theaortic arch receptors are also found in the outer third of the medial coat(Kdster & Tschermak, 1902; Nonidez, 1935) and are therefore affected bythe mechanical properties of this area of the vessel wall in addition to thoseof the external elastic limina.
I am grateful to Professor M. de Burgh Daly for suggesting the field of study andfor his constant help and advice. I should also like to express my thanks to MrJohnE. Chapman, MrReuben Cohen and Mr John Formoy for technical assistance atvarious times and to Mr D. C. Moore for the photography.
This paper comprises part of some work which has been approved by theUniversity of London for the award of a degree of Doctor of Philosophy.
PHY 214
221
8

JENNIFER E. ANGELL JAMES
REFERENCES
AARs, H. (1968). Aortic baroreceptor activity in normal and hypertensive rabbits.Acta physiol. scand. 72, 298-309.
AARs, H. (1969). Relationship between aortic diameter and aortic baroreceptoractivity in normal and hypertensive rabbits. Acta physiol. 8cand. 75, 406-414.
ADRIAN, E. D. (1926). The impulses produced by sensory nerve endings. Part I.J. Physiol. 61, 49-72.
ANGELL JAMES, J. E. (1968). Studies of the impulse activity in baroreceptor fibresfrom an isolated aortic arch preparation of the rabbit. J. Phys'iol. 198, 51-52P.
ANGELL JAMES, J. E. (1969). Studies of baroreceptor discharge and vasomotor re-flexes elicited from an isolated perfused aortic arch preparation. Ph.D. Thesis,University of London.
ANGELL JAMES, J. E. (1971a). The effects of altering mean pressure, pulse pressureand pulse frequency on the impulse activity in baroreceptor fibres from the aorticarch and right subclavian artery in the rabbit. J. Physiol. 214, 65-88.
ANGELL JAMES, J. E. (1971 b). The effects of changes of extramural, 'intrathoracic',pressure on aortic arch baroreceptors. J. Physi&. 214, 89-103.
ANGELL JAmEs, J. E. & DALY, M. DE B. (1970). Comparison of the reflex vasomotorresponses elicited by the separately perfused carotid sinus and aortic arch baro-receptors in the dog. J. Physiol. 209, 257-293.
BADER, H. (1963). The anatomy and physiology of the vascular wall. In Handbook ofPhysiology, section 2: Circulation, vol. 2, pp. 865-889. Washington, D.C.:American Physiological Society.
BAUER, D. J. (1939). Vagal reflexes appearing in asphyxia in rabbits at differentages. J. Phys-iol. 95, 187-202.
BENNINGHOFF, A. (1930). Blutgefasse und Herz. In Handbuch der mikroskopischenAnatomie des Mensohen, chap. 6, pp. 1-232, ed. MOTLTNDORFF, W. V. Berlin:Springer.
BERGEL, D. H. (1961). The static elastic properties of the arterial wall. J. Physl.156, 445-457.
BLOOR, C. M. (1964). Aortic baroreceptor threshold and sensitivity in rabbits atdifferent ages. J. Physiol. 174, 163-171.
BRONK, D. W. & STELLA, G. (1932). Afferent impulses in the carotid sinus nerve. I.The relation of the discharge from single end organs to arterial blood pressure.J. cel. comp. Physiol. 1, 113-130.
BRONK, D. W. & STELLA, G. (1935). The response to steady pressures of single endorgans in the isolated carotid sinus. Am. J. Physiol. 110, 708-714.
BURTON, A. C. (1954). Relation of structure to function of the tissues of the wall ofblood vessels. Physiol. Rev. 34, 619-642.
CHALMERs, J. P., KORNER, P. I. & WHITE, S. W. (1967). The effects of haemorrhagein the unanaesthetized rabbit. J. Physiol. 189, 367-391.
DALY, M. DE B. & ANGELL JAMES, J. E. (1968). Small aneurysm needles. Brit.med. J. ii, 760.
DIAMoND, J. (1955). Observations on the excitation by acetylcholine and by pres-sure of sensory receptors in the cat's carotid sinus. J. Physiol. 130, 513-532.
HALTOCK, P. & BENSON, I. C. (1937). Elastic properties of the isolated human aorta.J. din. Invest. 16, 595-602.
HAuss, W. H., KREUZIGER, H. & ASTEROTH, H. (1949). 'Ober die Reizung derPressorezeptoren im Sinus caroticus beim Hund. Z. Kreislaufforsch. 38, 28-33.
HEYMANs, C. & BOUCKAERT, J. J. (1929). Perfusions des sinus carotidiens isoles avecla pompe de Dale-Schuster. R6flexes vasomoteurs. Cr. Sdanc. Soc. Biol. 103,31-33.
222

AORTIC AND SUBOLAVIAN BARORECEPTORSIHEYxN5, C. & HEuVEL-HEYMANs, G. VAN DEN (1951). New aspects of blood
pressure regulation. Circulation Re8. 4, 581-586.HEYMANs, C. & NEIL, E. (1958). Reflexogenic Areas of the Cardiova8cular Sy8tem.London: Churchill.
HoMMA, S. & SUZUKI, S. (1966). Phasic properties of aortic and atrial receptorsobserved from their afferent discharge. Jap. J. Physiol. 16, 31-41.
IRISAWA, H. & NINOMiYA, I. (1967). Comparison of the averaged nervous activitiesof aortic and carotid sinus nerves. Am. J. Physiol. 213, 504-510.
KOSTER, G. & TscHERA1x, A. (1902). fiberr Ursprung und Endigung des N. de-pressor und N. Laryngeus superior beim Kaninchen. Arch. Anat. Entwick. (suppl.),pp. 255-294.
LANDREN, S. (1952a). On the excitation mechanism of the carotid baroreceptors.Acta physiol. scand. 26, 1-34.
LANDGREN, S. (1952b). The baroreceptor activity in the carotid sinus nerve and thedistensibility of the sinus wall. Acta physiol. scand. 26, 35-56.
LIPPOLD, O. C. J., NICHOLLS, J. C. & REDFEARN, J. W. T. (1960). A study of theafferent discharge produced by cooling a mammalian muscle spindle. J. Physiol.153, 218-231.
NAsHAT, F. S. & NED, E. (1955). The effect of hypothermia on baroreceptor andchemoreceptor reflexes. J. Physiol. 127, 59-60P.
NONIDEZ, J. F. (1935). The aortic (depressor) nerve and its associated epithelioidbody, the glomus aorticum. Am. J. Anat. 57, 259-301.
PAINTAL, A. S. (1953). The conduction velocities of respiratory and cardiac afferentfibres in the vagus nerves. J. Physiol. 121, 182-190.
PAINTAL, A. S. (1965a). Block of conduction in mammalian myelinated nerve fibresby low temperatures. J. Physiol. 180, 1-19.
PAINTAL, A. S. (1965b). Effects of temperature on conduction in single vagal andsaphenous myelinated nerve fibres of the cat. J. Physiol. 180, 20-49.
PAImE, F. (1951). tVber die Eignung der Blutdruckcharakteristik zur Beurteilungder Erregbarkeitsaenderung im pressorezeptorischen Reflexbogen. Expl Med.Surg. 9, 404-423.
PETERSON, L. H. (1960). Regulation of blood vessels. Circulation 21, 749-759.REES, P. M. (1967). Observations on the fine structure and distribution of pre-
sumptive baroreceptor nerves at the carotid sinus. J. comp. Neurol. 131, 517-548.REMINGTON, J. W. (1955). Hysteresis loop phenomena of the aorta and other
extensible tissue. Am. J. Physiol. 180, 83-95.RusRMER, R. F. (1955). Pressure-circumference relations in the aorta. Am. J.
Physiol. 183, 543-549.TANG, S. B. (1964). Baroreceptor reflexes from the right subclavian artery in rabbit.
Acta physiol. sin. 27, 168-171.UEDA, H., UCHIDA, Y., YASUDA, H. & TAXEDA, T. (1966). Reflex control of blood
pressure by the right subclavian baroreceptor in experimental renal hypertensionof rabbit. Jap. Heart J. 7, 543-555.
223


