
Wells Fargo Reports $6.2 Billion in Quarterly Net …...News Release Tuesday, July 16, 2019 Wells...
42
News Release Tuesday, July 16, 2019 Wells Fargo Reports $6.2 Billion in Quarterly Net Income; Diluted EPS of $1.30 • Financial results: Net income of $6.2 billion, compared with $5.2 billion in second quarter 2018 Diluted earnings per share (EPS) of $1.30, compared with $0.98 Revenue of $21.6 billion • Net interest income of $12.1 billion, down $446 million • Noninterest income of $9.5 billion, up $477 million Noninterest expense of $13.4 billion, down $533 million Average deposits of $1.3 trillion, down $2.4 billion Average loans of $947.5 billion, up $3.4 billion Return on assets (ROA) of 1.31%, return on equity (ROE) of 13.26%, and return on average tangible common equity (ROTCE) of 15.78% 1 Credit quality: Provision expense of $503 million, up $51 million from second quarter 2018 • Net charge-offs of $653 million, up $51 million Net charge-offs of 0.28% of average loans (annualized), up from 0.26% • Reserve release 2 of $150 million, equal to the amount released in second quarter 2018 Nonaccrual loans of $5.9 billion, down $1.2 billion, or 17% Strong capital position while returning more capital to shareholders: Returned $6.1 billion to shareholders through common stock dividends and net share repurchases, up 52% from $4.0 billion in second quarter 2018 Common Equity Tier 1 ratio (fully phased-in) of 12.0% 3 , which continued to exceed both the regulatory minimum of 9% and our current internal target of 10% Received a non-objection to the Company's 2019 Capital Plan submission from the Federal Reserve • As part of the plan, the Company expects to increase its third quarter 2019 common stock dividend to $0.51 per share from $0.45 per share, subject to approval by the Company's Board of Directors. The plan also includes up to $23.1 billion of gross common stock repurchases, subject to management discretion, for the four-quarter period from third quarter 2019 through second quarter 2020. Financial results reported in this document are preliminary. Final financial results and other disclosures will be reported in our Quarterly Report on Form 10-Q for the quarter ended June 30, 2019, and may differ materially from the results and disclosures in this document due to, among other things, the completion of final review procedures, the occurrence of subsequent events, or the discovery of additional information. 1 Tangible common equity is a non-GAAP financial measure and represents total equity less preferred equity, noncontrolling interests, and goodwill and certain identifiable intangible assets (including goodwill and intangible assets associated with certain of our nonmarketable equity securities but excluding mortgage servicing rights), net of applicable deferred taxes. The methodology of determining tangible common equity may differ among companies. Management believes that return on average tangible common equity, which utilizes tangible common equity, is a useful financial measure because it enables investors and others to assess the Company's use of equity. For additional information, including a corresponding reconciliation to GAAP financial measures, see the “Tangible Common Equity” tables on page 36. 2 Reserve build represents the amount by which the provision for credit losses exceeds net charge-offs, while reserve release represents the amount by which net charge-offs exceed the provision for credit losses. 3 See table on page 37 for more information on Common Equity Tier 1. Common Equity Tier 1 (fully phased-in) is a preliminary estimate and is calculated assuming the full phase-in of the Basel III capital rules.
Transcript of Wells Fargo Reports $6.2 Billion in Quarterly Net …...News Release Tuesday, July 16, 2019 Wells...
News Release Tuesday, July 16, 2019
Wells Fargo Reports $6.2 Billion in Quarterly Net Income; Diluted EPS of $1.30 • Financial results:
Net income of $6.2 billion, compared with $5.2 billion in second quarter 2018
Diluted earnings per share (EPS) of $1.30, compared with $0.98
Revenue of $21.6 billion
• Net interest income of $12.1 billion, down $446 million
• Noninterest income of $9.5 billion, up $477 million
Noninterest expense of $13.4 billion, down $533 million
Average deposits of $1.3 trillion, down $2.4 billion
Average loans of $947.5 billion, up $3.4 billion
Return on assets (ROA) of 1.31%, return on equity (ROE) of 13.26%, and return on average tangible common equity (ROTCE) of 15.78%1
Credit quality:
Provision expense of $503 million, up $51 million from second quarter 2018
• Net charge-offs of $653 million, up $51 million
Net charge-offs of 0.28% of average loans (annualized), up from 0.26%
• Reserve release2 of $150 million, equal to the amount released in second quarter 2018
Nonaccrual loans of $5.9 billion, down $1.2 billion, or 17%
Strong capital position while returning more capital to shareholders:
Returned $6.1 billion to shareholders through common stock dividends and net share repurchases, up 52% from $4.0 billion in second quarter 2018
Common Equity Tier 1 ratio (fully phased-in) of 12.0%3, which continued to exceed both the regulatory minimum of 9% and our current internal target of 10%
Received a non-objection to the Company's 2019 Capital Plan submission from the Federal Reserve
• As part of the plan, the Company expects to increase its third quarter 2019 common stock dividend to $0.51 per share from $0.45 per share, subject to approval by the Company's Board of Directors. The plan also includes up to $23.1 billion of gross common stock repurchases, subject to management discretion, for the four-quarter period from third quarter 2019 through second quarter 2020.
Financial results reported in this document are preliminary. Final financial results and other disclosures will be reported in our Quarterly Report on Form 10-Q for the quarter ended June 30, 2019, and may differ materially from the results and disclosures in this document due to, among other things, the completion of final review procedures, the occurrence of subsequent events, or the discovery of additional information.
1 Tangible common equity is a non-GAAP financial measure and represents total equity less preferred equity, noncontrolling interests, and goodwill and certain identifiable intangible assets (including goodwill and intangible assets associated with certain of our nonmarketable equity securities but excluding mortgage servicing rights), net of applicable deferred taxes. The methodology of determining tangible common equity may differ among companies. Management believes that return on average tangible common equity, which utilizes tangible common equity, is a useful financial measure because it enables investors and others to assess the Company's use of equity. For additional information, including a corresponding reconciliation to GAAP financial measures, see the “Tangible Common Equity” tables on page 36.
2 Reserve build represents the amount by which the provision for credit losses exceeds net charge-offs, while reserve release represents the amount by which net charge-offs exceed the provision for credit losses.
3 See table on page 37 for more information on Common Equity Tier 1. Common Equity Tier 1 (fully phased-in) is a preliminary estimate and is calculated assuming the full phase-in of the Basel III capital rules.
- 2 -
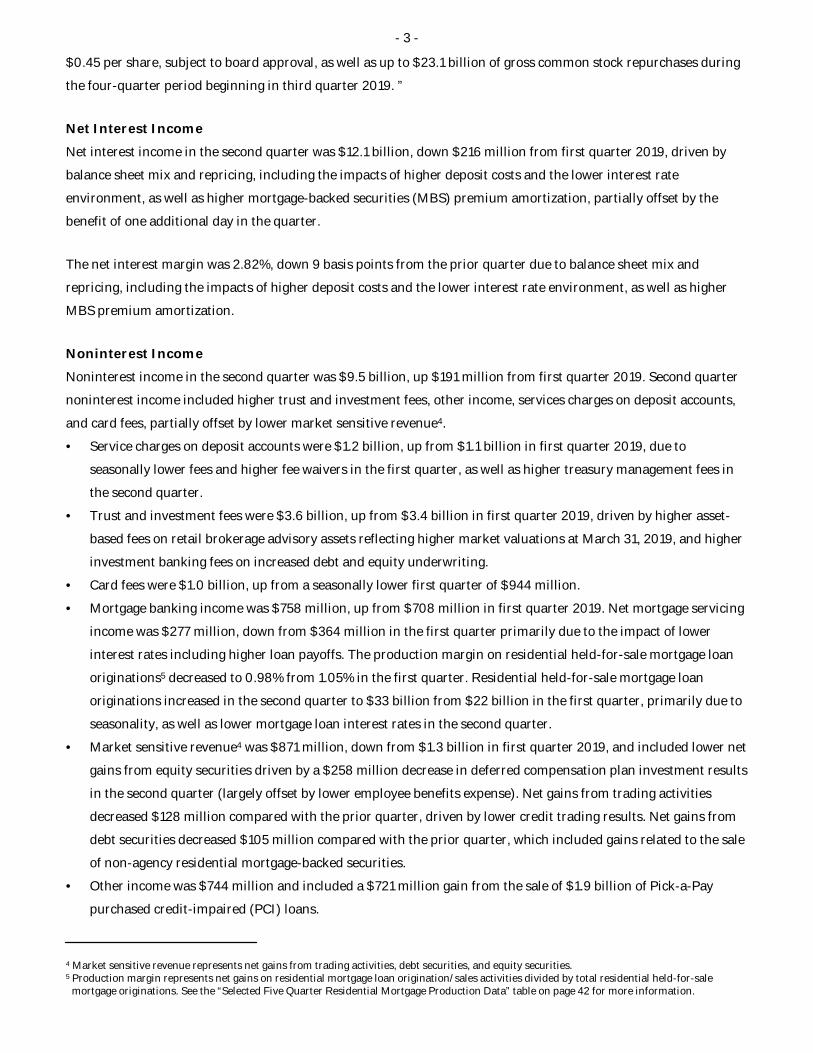
Selected Financial Information
Earnings Diluted earnings per common share Wells Fargo net income (in billions) Return on assets (ROA) Return on equity (ROE) Return on average tangible common equity (ROTCE) (a)
Asset Quality Net charge-offs (annualized) as a % of average total loans Allowance for credit losses as a % of total loans Allowance for credit losses as a % of annualized net charge-offs
Other Revenue (in billions) Efficiency ratio (b) Average loans (in billions) Average deposits (in billions) Net interest margin
$
$
$
Jun 30,2019
1.30 6.21 1.31%
13.26 15.78
0.28% 1.12 405
21.6 62.3%
947.5 1,269.0
2.82%
Quarter ended
Mar 31, 2019
Jun 30, 2018
1.20 0.98 5.86 5.19 1.26 1.10
12.71 10.60 15.16 12.62
0.30 0.26 1.14 1.18 384 460
21.6 21.6 64.4 64.9
950.0 944.1 1,262.1 1,271.3
2.91 2.93
(a) Tangible common equity is a non-GAAP financial measure and represents total equity less preferred equity, noncontrolling interests, and goodwill and certain identifiable intangible assets (including goodwill and intangible assets associated with certain of our nonmarketable equity securities but excluding mortgage servicing rights), net of applicable deferred taxes. The methodology of determining tangible common equity may differ among companies. Management believes that return on average tangible common equity, which utilizes tangible common equity, is a useful financial measure because it enables investors and others to assess the Company's use of equity. For additional information, including a corresponding reconciliation to GAAP financial measures, see the “Tangible Common Equity” tables on page 36.
(b) The efficiency ratio is noninterest expense divided by total revenue (net interest income and noninterest income).
SAN FRANCISCO – Wells Fargo & Company (NYSE:WFC) reported net income of $6.2 billion, or $1.30 per diluted
common share, for second quarter 2019, compared with $5.2 billion, or $0.98 per share, for second quarter 2018,
and $5.9 billion, or $1.20 per share, for first quarter 2019.
Interim Chief Executive Officer Allen Parker said, “In second quarter 2019, we recorded strong earnings and
continued to make progress on our top priorities: focusing on our customers and team members; meeting the
expectations of our regulators; and continuing the important transformation of our Company. The commitment of
our team members to provide outstanding customer service was reflected in higher customer experience survey
scores from our branches, continued growth in primary consumer checking customers, and an increase in referred
investment assets as a result of the partnership between our Wealth and Investment Management team and our
Community Banking team. During the second quarter, we formed a new Strategic Execution and Operations Office
that will focus on achieving operational excellence across our businesses to enable us to execute more effectively on
our regulatory priorities and further drive our transformation. Finally, our recent CCAR results demonstrated the
strength of our diversified business model, our strong capital position, our sound financial risk management, and
our commitment to return excess capital to our shareholders in a prudent manner. I’m confident that all our
stakeholders will benefit from the transformational changes we are implementing as we work to build the most
customer-focused, efficient, and innovative Wells Fargo ever.”
Chief Financial Officer John Shrewsberry said, “Wells Fargo reported $6.2 billion of net income in the second
quarter and diluted earnings per share of $1.30. We grew period-end loans and deposits, as well as pre-tax pre-
provision profit, compared with the first quarter and a year ago. Our credit quality remained solid with net charge-
offs near historic lows. Additionally, our strong capital position was reflected in our 2019 Capital Plan, which
includes an increase in our quarterly common stock dividend rate in third quarter 2019 to $0.51 per share from
- 3 -
$0.45 per share, subject to board approval, as well as up to $23.1 billion of gross common stock repurchases during
the four-quarter period beginning in third quarter 2019. ”
Net Interest Income
Net interest income in the second quarter was $12.1 billion, down $216 million from first quarter 2019, driven by
balance sheet mix and repricing, including the impacts of higher deposit costs and the lower interest rate
environment, as well as higher mortgage-backed securities (MBS) premium amortization, partially offset by the
benefit of one additional day in the quarter.
The net interest margin was 2.82%, down 9 basis points from the prior quarter due to balance sheet mix and
repricing, including the impacts of higher deposit costs and the lower interest rate environment, as well as higher
MBS premium amortization.
Noninterest Income
Noninterest income in the second quarter was $9.5 billion, up $191 million from first quarter 2019. Second quarter
noninterest income included higher trust and investment fees, other income, services charges on deposit accounts,
and card fees, partially offset by lower market sensitive revenue4.
• Service charges on deposit accounts were $1.2 billion, up from $1.1 billion in first quarter 2019, due to
seasonally lower fees and higher fee waivers in the first quarter, as well as higher treasury management fees in
the second quarter.
• Trust and investment fees were $3.6 billion, up from $3.4 billion in first quarter 2019, driven by higher asset-
based fees on retail brokerage advisory assets reflecting higher market valuations at March 31, 2019, and higher
investment banking fees on increased debt and equity underwriting.
• Card fees were $1.0 billion, up from a seasonally lower first quarter of $944 million.
• Mortgage banking income was $758 million, up from $708 million in first quarter 2019. Net mortgage servicing
income was $277 million, down from $364 million in the first quarter primarily due to the impact of lower
interest rates including higher loan payoffs. The production margin on residential held-for-sale mortgage loan
originations5 decreased to 0.98% from 1.05% in the first quarter. Residential held-for-sale mortgage loan
originations increased in the second quarter to $33 billion from $22 billion in the first quarter, primarily due to
seasonality, as well as lower mortgage loan interest rates in the second quarter.
• Market sensitive revenue4 was $871 million, down from $1.3 billion in first quarter 2019, and included lower net
gains from equity securities driven by a $258 million decrease in deferred compensation plan investment results
in the second quarter (largely offset by lower employee benefits expense). Net gains from trading activities
decreased $128 million compared with the prior quarter, driven by lower credit trading results. Net gains from
debt securities decreased $105 million compared with the prior quarter, which included gains related to the sale
of non-agency residential mortgage-backed securities.
• Other income was $744 million and included a $721 million gain from the sale of $1.9 billion of Pick-a-Pay
purchased credit-impaired (PCI) loans.
4 Market sensitive revenue represents net gains from trading activities, debt securities, and equity securities. 5 Production margin represents net gains on residential mortgage loan origination/sales activities divided by total residential held-for-sale
mortgage originations. See the “Selected Five Quarter Residential Mortgage Production Data” table on page 42 for more information.
- 4 -
Noninterest Expense
Noninterest expense in the second quarter declined $467 million from the prior quarter to $13.4 billion,
predominantly due to a decline in employee benefits expense and incentive compensation expense, which were
seasonally elevated in the first quarter, as well as a $243 million decrease in deferred compensation expense (largely
offset by lower net gains from equity securities). These decreases were partially offset by higher outside professional
and contract services, salary, and advertising and promotion expense. The efficiency ratio was 62.3% in second
quarter 2019, compared with 64.4% in the first quarter.
Income Taxes
The Company’s effective income tax rate was 17.3% for second quarter 2019. The effective income tax rate in first
quarter 2019 was 13.1% and included net discrete income tax benefits of $297 million related mostly to the results of
U.S. federal and state income tax examinations and the accounting for stock compensation activity. The Company
currently expects the effective income tax rate for the remainder of 2019 to be approximately 18%, excluding the
impact of any unanticipated discrete items.
Loans
Average loans were $947.5 billion in the second quarter, down $2.6 billion from the first quarter. Period-end loan
balances were $949.9 billion at June 30, 2019, up $1.6 billion from March 31, 2019. Commercial loans were flat
compared with March 31, 2019. Consumer loans increased $1.6 billion from the prior quarter, reflecting the
following:
• Real estate 1-4 family first mortgage loans increased $1.9 billion, as $19.8 billion of held-for-investment
mortgage loan originations were partially offset by paydowns, the sale of $1.9 billion of Pick-a-Pay PCI loans,
and the reclassification of $1.8 billion of mortgage loans to held for sale
• Real estate 1-4 family junior lien mortgage loans decreased $1.0 billion, as paydowns continued to exceed
originations
• Credit card loans increased $541 million, up from a seasonally lower first quarter
• Automobile loans increased $751 million, as originations of $6.3 billion outpaced paydowns, resulting in linked-
quarter growth for the first time since third quarter 2016
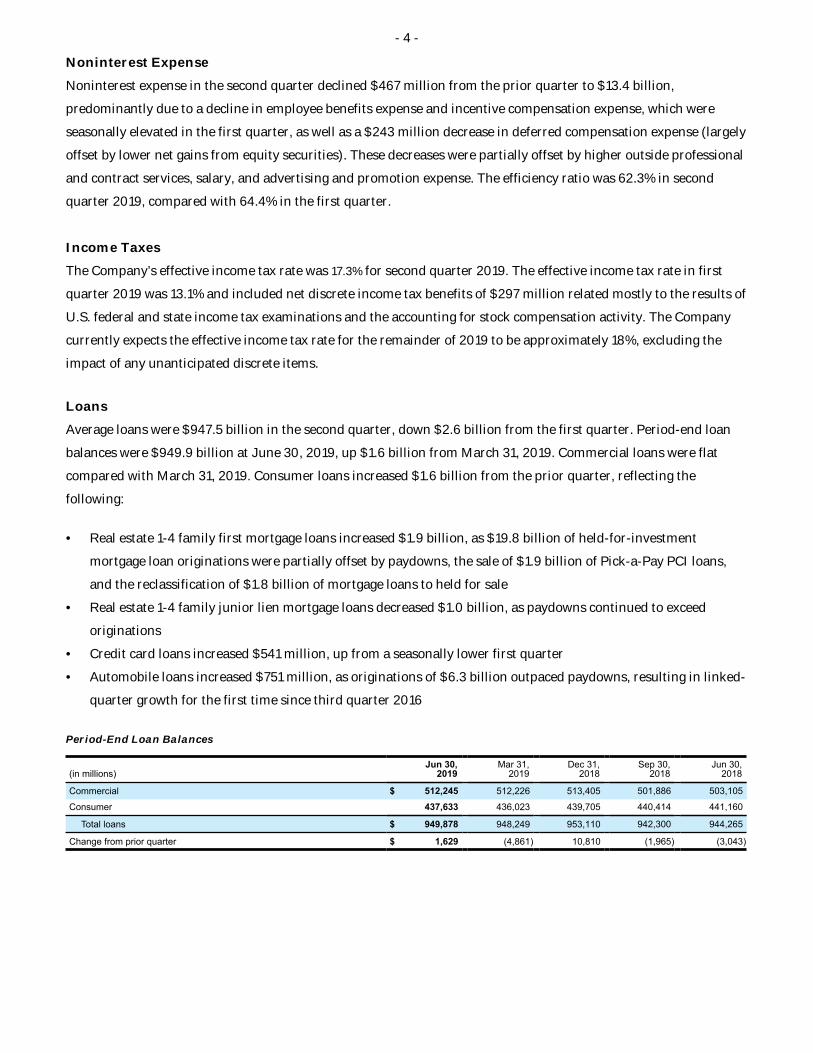
Period-End Loan Balances
(in millions) Jun 30,
2019 Mar 31,
2019 Dec 31,
2018 Sep 30,
2018 Jun 30,
2018
Commercial
Consumer
$ 512,245 437,633
512,226
436,023
513,405
439,705
501,886
440,414
503,105
441,160
Total loans $ 949,878 948,249 953,110 942,300 944,265
Change from prior quarter $ 1,629 (4,861) 10,810 (1,965) (3,043)

- 5 -
Debt and Equity Securities
Debt securities include available-for-sale and held-to-maturity debt securities, as well as debt securities held for
trading. Period-end debt securities were $482.1 billion at June 30, 2019, down $1.4 billion from the first quarter,
predominantly due to a net decrease in available-for-sale debt securities. Debt securities purchases of approximately
$15.9 billion, predominantly federal agency MBS in the available-for-sale portfolio, were more than offset by runoff
and sales.
Net unrealized gains on available-for-sale debt securities were $2.5 billion at June 30, 2019, compared with
$853 million at March 31, 2019, primarily due to lower long-term interest rates in the second quarter.
Period-end equity securities, which include marketable and non-marketable equity securities, as well as equity
securities held for trading, were $61.5 billion at June 30, 2019, up $3.1 billion from the first quarter.
Deposits
Total average deposits for second quarter 2019 were $1.3 trillion, up $6.9 billion from the prior quarter primarily
due to higher retail banking deposits reflecting increased promotional activity, partially offset by lower Wealth and
Investment Management deposits. The average deposit cost for second quarter 2019 was 70 basis points, up 5 basis
points from the prior quarter and 30 basis points from a year ago.
Capital
The Company's Common Equity Tier 1 ratio (fully phased-in) was 12.0%3 and continued to exceed both the
regulatory minimum of 9% and our current internal target of 10%. In second quarter 2019, the Company
repurchased 104.9 million shares of its common stock, which, net of issuances, reduced period-end common shares
outstanding by 92.4 million. The Company paid a quarterly common stock dividend of $0.45 per share.
In June 2019, the Company received a non-objection to its 2019 Capital Plan from the Federal Reserve. As part of
the plan, the Company expects to increase its third quarter 2019 common stock dividend to $0.51 per share, subject
to approval by the Company's Board of Directors. The plan also includes up to $23.1 billion of gross common stock
repurchases, subject to management discretion, for the four-quarter period from third quarter 2019 through second
quarter 2020. In addition, the Company may consider redemptions or repurchases of other capital securities as part
of the plan.
As of June 30, 2019, our eligible external total loss absorbing capacity (TLAC) as a percentage of total risk-weighted
assets was 24.1%6, compared with the required minimum of 22.0%.
6 The TLAC ratio is a preliminary estimate.

- 6 -
Credit Quality
Net Loan Charge-offs
The quarterly loss rate in the second quarter was 0.28% (annualized), down from 0.30% in the prior quarter, and up
from 0.26% a year ago. Commercial and consumer losses were 0.13% and 0.45%, respectively. Total credit losses
were $653 million in second quarter 2019, down $42 million from first quarter 2019. Commercial losses increased
$20 million, while consumer losses decreased $62 million primarily due to lower automobile losses.
Net Loan Charge-Offs
Quarter ended
June 30, 2019 March 31, 2019 June 30, 2018 Net loan As a % of Net loan As a % of Net loan As a % of
($ in millions) charge-
offs average
loans (a) charge-
offs average
loans (a) charge-
offs average
loans (a)
Commercial: Commercial and industrial $ 159 0.18% $ 133 0.15% $ 58 0.07% Real estate mortgage 4 0.01 6 0.02 — — Real estate construction (2) (0.04) (2) (0.04) (6) (0.09) Lease financing 4 0.09 8 0.17 15 0.32
Total commercial 165 0.13 145 0.11 67 0.05
Consumer: Real estate 1-4 family first mortgage (30) (0.04) (12) (0.02) (23) (0.03) Real estate 1-4 family junior lien mortgage (19) (0.24) (9) (0.10) (13) (0.13) Credit card 349 3.68 352 3.73 323 3.61 Automobile 52 0.46 91 0.82 113 0.93 Other revolving credit and installment 136 1.56 128 1.47 135 1.44
Total consumer 488 0.45 550 0.51 535 0.49
Total $ 653 0.28% $ 695 0.30% $ 602 0.26%
(a) Quarterly net charge-offs (recoveries) as a percentage of average loans are annualized.
- 7 -
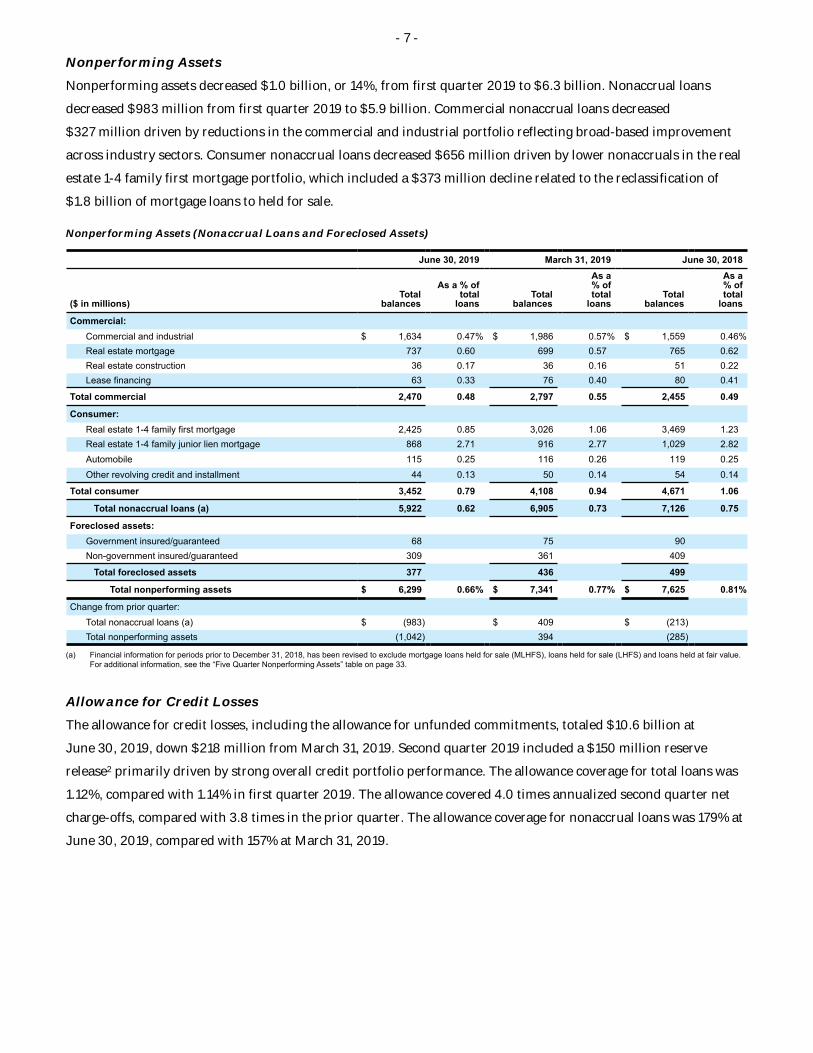
Nonperforming Assets
Nonperforming assets decreased $1.0 billion, or 14%, from first quarter 2019 to $6.3 billion. Nonaccrual loans
decreased $983 million from first quarter 2019 to $5.9 billion. Commercial nonaccrual loans decreased
$327 million driven by reductions in the commercial and industrial portfolio reflecting broad-based improvement
across industry sectors. Consumer nonaccrual loans decreased $656 million driven by lower nonaccruals in the real
estate 1-4 family first mortgage portfolio, which included a $373 million decline related to the reclassification of
$1.8 billion of mortgage loans to held for sale.
Nonperforming Assets (Nonaccrual Loans and Foreclosed Assets)
June 30, 2019 March 31, 2019 June 30, 2018 As a As a
As a % of % of % of Total total Total total Total total
($ in millions) balances loans balances loans balances loans
Commercial: Commercial and industrial $ 1,634 0.47% $ 1,986 0.57% $ 1,559 0.46% Real estate mortgage 737 0.60 699 0.57 765 0.62 Real estate construction 36 0.17 36 0.16 51 0.22 Lease financing 63 0.33 76 0.40 80 0.41
Total commercial 2,470 0.48 2,797 0.55 2,455 0.49
Consumer: Real estate 1-4 family first mortgage 2,425 0.85 3,026 1.06 3,469 1.23 Real estate 1-4 family junior lien mortgage 868 2.71 916 2.77 1,029 2.82 Automobile 115 0.25 116 0.26 119 0.25 Other revolving credit and installment 44 0.13 50 0.14 54 0.14
Total consumer 3,452 0.79 4,108 0.94 4,671 1.06
Total nonaccrual loans (a) 5,922 0.62 6,905 0.73 7,126 0.75
Foreclosed assets: Government insured/guaranteed 68 75 90 Non-government insured/guaranteed 309 361 409
Total foreclosed assets 377 436 499
Total nonperforming assets $ 6,299 0.66% $ 7,341 0.77% $ 7,625 0.81%
Change from prior quarter: Total nonaccrual loans (a) $ (983) $ 409 $ (213) Total nonperforming assets (1,042) 394 (285)
(a) Financial information for periods prior to December 31, 2018, has been revised to exclude mortgage loans held for sale (MLHFS), loans held for sale (LHFS) and loans held at fair value. For additional information, see the “Five Quarter Nonperforming Assets” table on page 33.
Allowance for Credit Losses
The allowance for credit losses, including the allowance for unfunded commitments, totaled $10.6 billion at
June 30, 2019, down $218 million from March 31, 2019. Second quarter 2019 included a $150 million reserve
release2 primarily driven by strong overall credit portfolio performance. The allowance coverage for total loans was
1.12%, compared with 1.14% in first quarter 2019. The allowance covered 4.0 times annualized second quarter net
charge-offs, compared with 3.8 times in the prior quarter. The allowance coverage for nonaccrual loans was 179% at
June 30, 2019, compared with 157% at March 31, 2019.
- 8 -
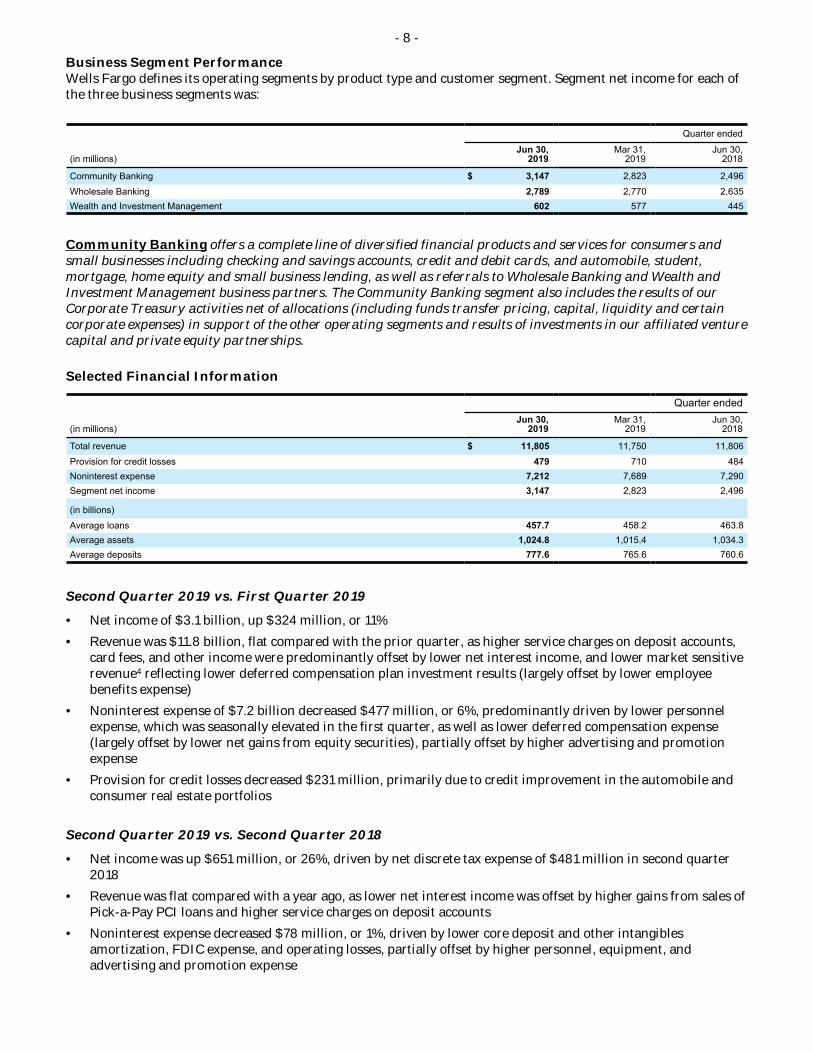
Business Segment Performance Wells Fargo defines its operating segments by product type and customer segment. Segment net income for each of the three business segments was:
Quarter ended
(in millions) Jun 30,
2019 Mar 31,
2019 Jun 30,
2018
Community Banking Wholesale Banking Wealth and Investment Management
$ 3,147 2,789
602
2,823 2,770
577
2,496 2,635
445
Community Banking offers a complete line of diversified financial products and services for consumers and small businesses including checking and savings accounts, credit and debit cards, and automobile, student, mortgage, home equity and small business lending, as well as referrals to Wholesale Banking and Wealth and Investment Management business partners. The Community Banking segment also includes the results of our Corporate Treasury activities net of allocations (including funds transfer pricing, capital, liquidity and certain corporate expenses) in support of the other operating segments and results of investments in our affiliated venture capital and private equity partnerships.
Selected Financial Information
Quarter ended
(in millions) Jun 30,
2019 Mar 31,
2019 Jun 30,
2018
Total revenue Provision for credit losses
$ 11,805 479
11,750 710
11,806 484
Noninterest expense Segment net income
7,212 3,147
7,689 2,823
7,290 2,496
(in billions) Average loans Average assets Average deposits
457.7 1,024.8
777.6
458.2 1,015.4
765.6
463.8 1,034.3
760.6
Second Quarter 2019 vs. First Quarter 2019
• Net income of $3.1 billion, up $324 million, or 11%
• Revenue was $11.8 billion, flat compared with the prior quarter, as higher service charges on deposit accounts, card fees, and other income were predominantly offset by lower net interest income, and lower market sensitive revenue4 reflecting lower deferred compensation plan investment results (largely offset by lower employee benefits expense)
• Noninterest expense of $7.2 billion decreased $477 million, or 6%, predominantly driven by lower personnel expense, which was seasonally elevated in the first quarter, as well as lower deferred compensation expense (largely offset by lower net gains from equity securities), partially offset by higher advertising and promotion expense
• Provision for credit losses decreased $231 million, primarily due to credit improvement in the automobile and consumer real estate portfolios
Second Quarter 2019 vs. Second Quarter 2018
• Net income was up $651 million, or 26%, driven by net discrete tax expense of $481 million in second quarter 2018
• Revenue was flat compared with a year ago, as lower net interest income was offset by higher gains from sales of Pick-a-Pay PCI loans and higher service charges on deposit accounts
• Noninterest expense decreased $78 million, or 1%, driven by lower core deposit and other intangibles amortization, FDIC expense, and operating losses, partially offset by higher personnel, equipment, and advertising and promotion expense
- 9 -
Business Metrics and Highlights
• Primary consumer checking customers7,8 of 24.3 million, up 1.3% from a year ago. The sale of 52 branches and $1.8 billion of deposits which closed in fourth quarter 2018 reduced the growth rate by 0.4%
• Branch customer experience surveys completed during second quarter 2019 reflected higher scores from the previous quarter, with both ‘Customer Loyalty’ and ‘Overall Satisfaction with Most Recent Visit’ scores reaching their highest level in more than three years
• Debit card point-of-sale purchase volume9 of $93.2 billion in the second quarter, up 6% year-over-year
• General purpose credit card point-of-sale purchase volume of $20.4 billion in the second quarter, up 6% year-over-year
• 30.0 million digital (online and mobile) active customers, including 23.7 million mobile active customers8,10
• 5,442 retail bank branches as of the end of second quarter 2019, reflecting 78 branch consolidations in the first half of 2019
• Home Lending
Originations of $53 billion, up from $33 billion in the prior quarter, primarily due to seasonality, as well as lower mortgage loan interest rates
Originations of loans held-for-sale and loans held-for-investment were $33 billion and $20 billion, respectively
Production margin on residential held-for-sale mortgage loan originations5 of 0.98%, down from 1.05% in the prior quarter
Applications of $90 billion, up from $64 billion in the prior quarter, driven primarily by seasonality, as well as lower mortgage loan interest rates
Unclosed application pipeline of $44 billion at quarter end, up from $32 billion at March 31, 2019, driven primarily by seasonality, as well as lower mortgage loan interest rates
• Automobile originations of $6.3 billion in the second quarter, up 43% from the prior year, reflecting our focus on growing auto loans following the restructuring of the business
• For the third year in a row, Wells Fargo was #1 in Nilson's annual ranking of the top 50 U.S. debit card issuers, receiving the top ranking by both purchase volume and number of transactions (April 2019)
7 Customers who actively use their checking account with transactions such as debit card purchases, online bill payments, and direct deposit. 8 Data as of May 2019, comparisons with May 2018. 9 Combined consumer and business debit card purchase volume dollars. 10 Digital and mobile active customers is the number of consumer and small business customers who have logged on via a digital or mobile device
in the prior 90 days.
- 10 -
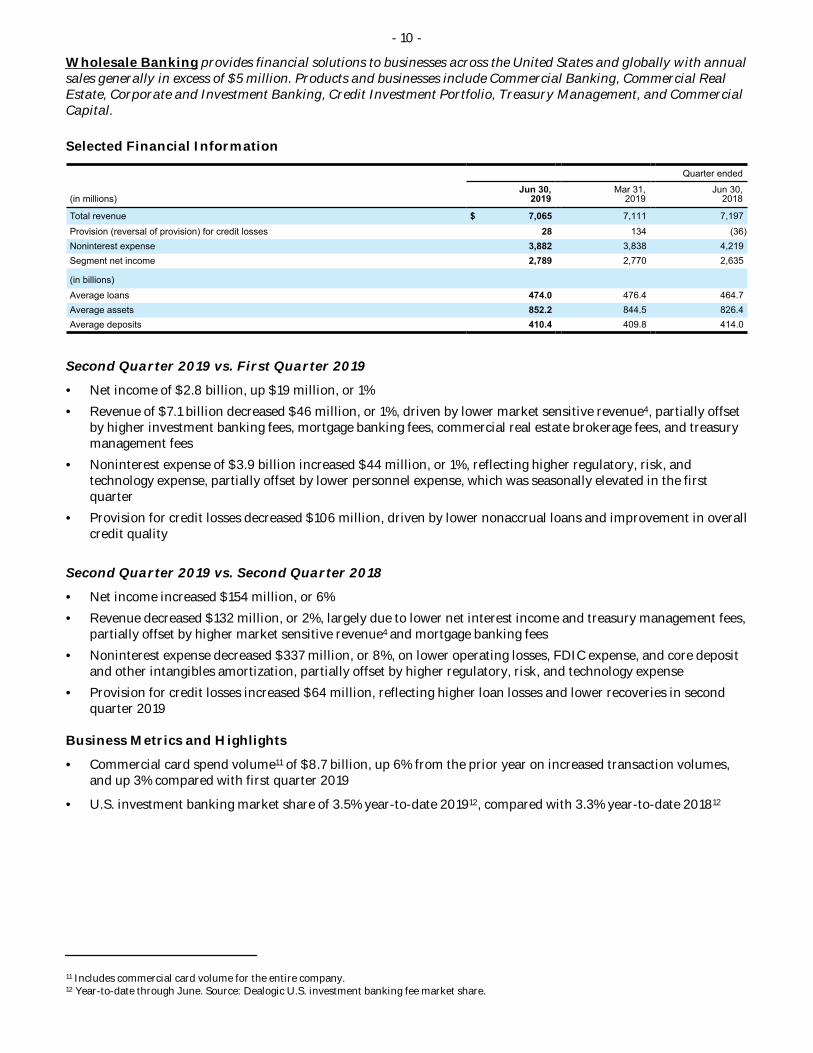
Wholesale Banking provides financial solutions to businesses across the United States and globally with annual sales generally in excess of $5 million. Products and businesses include Commercial Banking, Commercial Real Estate, Corporate and Investment Banking, Credit Investment Portfolio, Treasury Management, and Commercial Capital.
Selected Financial Information
Quarter ended
(in millions) Jun 30,
2019 Mar 31,
2019 Jun 30,
2018
Total revenue Provision (reversal of provision) for credit losses Noninterest expense Segment net income
$ 7,065 28
3,882 2,789
7,111
134 3,838 2,770
7,197
(36) 4,219 2,635
(in billions) Average loans Average assets Average deposits
474.0 852.2 410.4
476.4 844.5 409.8
464.7 826.4 414.0
Second Quarter 2019 vs. First Quarter 2019
• Net income of $2.8 billion, up $19 million, or 1%
• Revenue of $7.1 billion decreased $46 million, or 1%, driven by lower market sensitive revenue4, partially offset by higher investment banking fees, mortgage banking fees, commercial real estate brokerage fees, and treasury management fees
• Noninterest expense of $3.9 billion increased $44 million, or 1%, reflecting higher regulatory, risk, and technology expense, partially offset by lower personnel expense, which was seasonally elevated in the first quarter
• Provision for credit losses decreased $106 million, driven by lower nonaccrual loans and improvement in overall credit quality
Second Quarter 2019 vs. Second Quarter 2018
• Net income increased $154 million, or 6%
• Revenue decreased $132 million, or 2%, largely due to lower net interest income and treasury management fees, partially offset by higher market sensitive revenue4 and mortgage banking fees
• Noninterest expense decreased $337 million, or 8%, on lower operating losses, FDIC expense, and core deposit and other intangibles amortization, partially offset by higher regulatory, risk, and technology expense
• Provision for credit losses increased $64 million, reflecting higher loan losses and lower recoveries in second quarter 2019
Business Metrics and Highlights
• Commercial card spend volume11 of $8.7 billion, up 6% from the prior year on increased transaction volumes, and up 3% compared with first quarter 2019
• U.S. investment banking market share of 3.5% year-to-date 201912, compared with 3.3% year-to-date 201812
11 Includes commercial card volume for the entire company. 12 Year-to-date through June. Source: Dealogic U.S. investment banking fee market share.
- 11 -
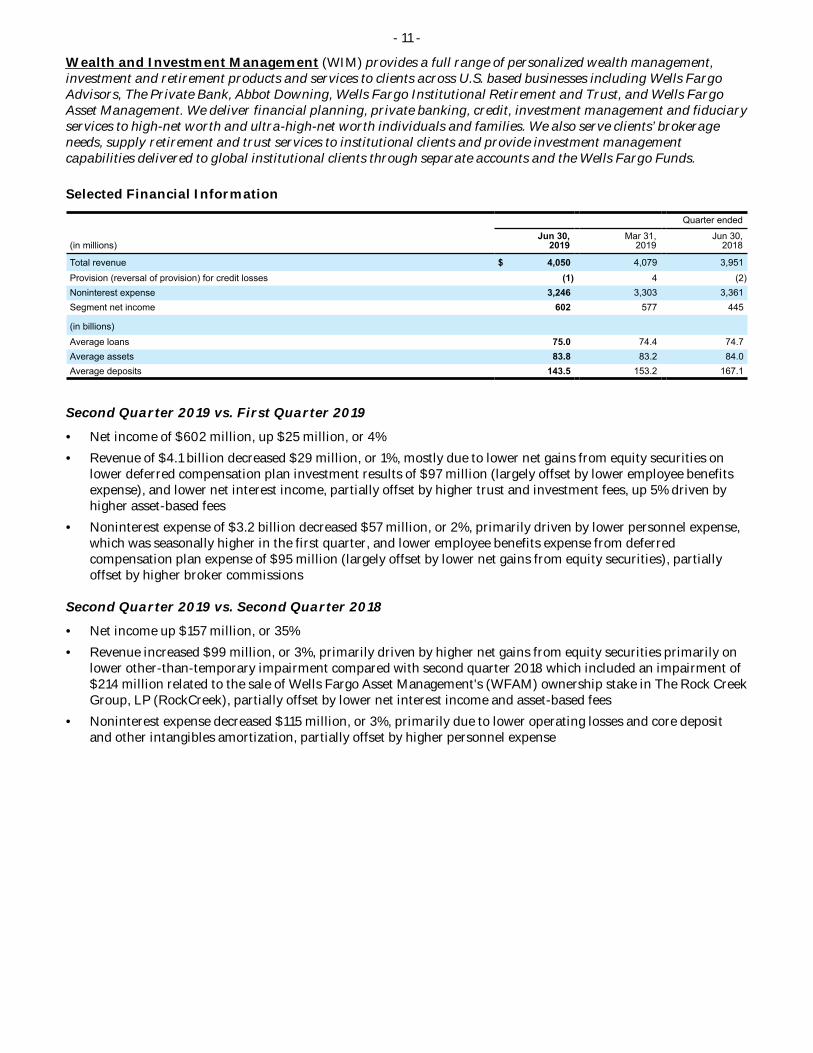
Wealth and Investment Management (WIM) provides a full range of personalized wealth management, investment and retirement products and services to clients across U.S. based businesses including Wells Fargo Advisors, The Private Bank, Abbot Downing, Wells Fargo Institutional Retirement and Trust, and Wells Fargo Asset Management. We deliver financial planning, private banking, credit, investment management and fiduciary services to high-net worth and ultra-high-net worth individuals and families. We also serve clients’ brokerage needs, supply retirement and trust services to institutional clients and provide investment management capabilities delivered to global institutional clients through separate accounts and the Wells Fargo Funds.
Selected Financial Information
Quarter ended
(in millions) Jun 30,
2019 Mar 31,
2019 Jun 30,
2018
Total revenue Provision (reversal of provision) for credit losses Noninterest expense Segment net income
$ 4,050 (1)
3,246 602
4,079
4 3,303
577
3,951
(2) 3,361
445
(in billions) Average loans Average assets Average deposits
75.0 83.8
143.5
74.4 83.2
153.2
74.7 84.0
167.1
Second Quarter 2019 vs. First Quarter 2019
• Net income of $602 million, up $25 million, or 4%
• Revenue of $4.1 billion decreased $29 million, or 1%, mostly due to lower net gains from equity securities on lower deferred compensation plan investment results of $97 million (largely offset by lower employee benefits expense), and lower net interest income, partially offset by higher trust and investment fees, up 5% driven by higher asset-based fees
• Noninterest expense of $3.2 billion decreased $57 million, or 2%, primarily driven by lower personnel expense, which was seasonally higher in the first quarter, and lower employee benefits expense from deferred compensation plan expense of $95 million (largely offset by lower net gains from equity securities), partially offset by higher broker commissions
Second Quarter 2019 vs. Second Quarter 2018
• Net income up $157 million, or 35%
• Revenue increased $99 million, or 3%, primarily driven by higher net gains from equity securities primarily on lower other-than-temporary impairment compared with second quarter 2018 which included an impairment of $214 million related to the sale of Wells Fargo Asset Management's (WFAM) ownership stake in The Rock Creek Group, LP (RockCreek), partially offset by lower net interest income and asset-based fees
• Noninterest expense decreased $115 million, or 3%, primarily due to lower operating losses and core deposit and other intangibles amortization, partially offset by higher personnel expense
- 12 -
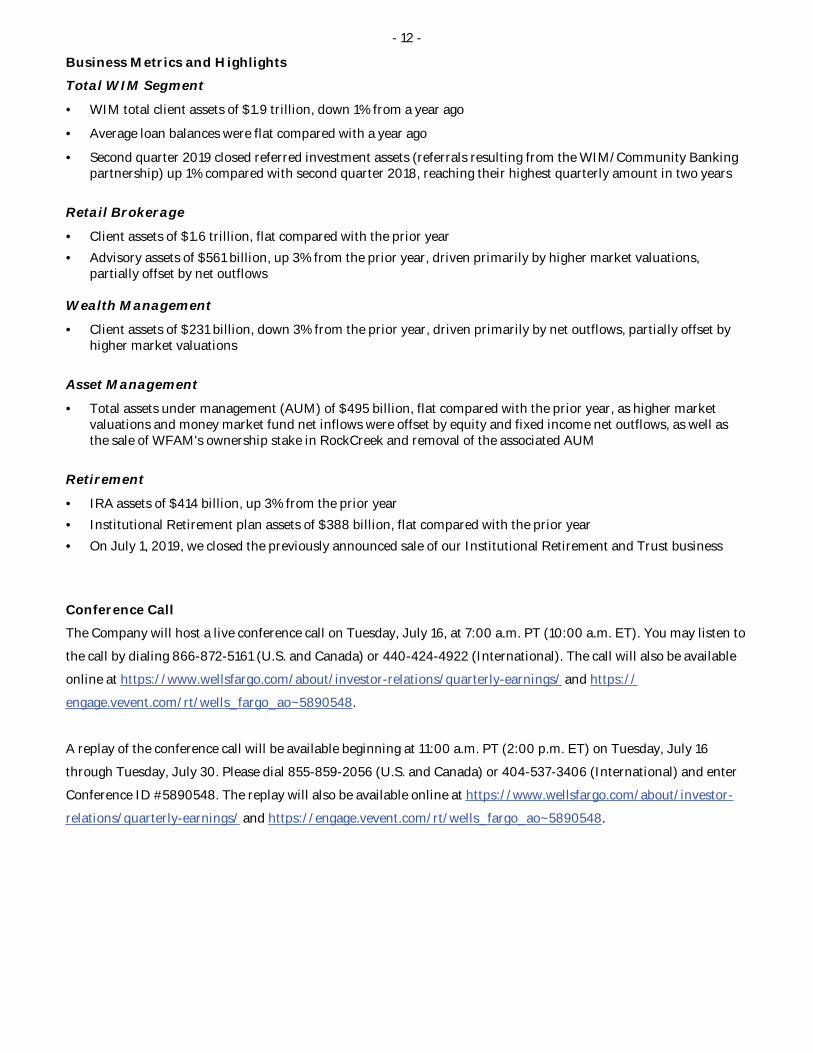
Business Metrics and Highlights
Total WIM Segment
• WIM total client assets of $1.9 trillion, down 1% from a year ago
• Average loan balances were flat compared with a year ago
• Second quarter 2019 closed referred investment assets (referrals resulting from the WIM/Community Banking partnership) up 1% compared with second quarter 2018, reaching their highest quarterly amount in two years
Retail Brokerage
• Client assets of $1.6 trillion, flat compared with the prior year
• Advisory assets of $561 billion, up 3% from the prior year, driven primarily by higher market valuations, partially offset by net outflows
Wealth Management
• Client assets of $231 billion, down 3% from the prior year, driven primarily by net outflows, partially offset by higher market valuations
Asset Management
• Total assets under management (AUM) of $495 billion, flat compared with the prior year, as higher market valuations and money market fund net inflows were offset by equity and fixed income net outflows, as well as the sale of WFAM's ownership stake in RockCreek and removal of the associated AUM
Retirement
• IRA assets of $414 billion, up 3% from the prior year
• Institutional Retirement plan assets of $388 billion, flat compared with the prior year
• On July 1, 2019, we closed the previously announced sale of our Institutional Retirement and Trust business
Conference Call
The Company will host a live conference call on Tuesday, July 16, at 7:00 a.m. PT (10:00 a.m. ET). You may listen to
the call by dialing 866-872-5161 (U.S. and Canada) or 440-424-4922 (International). The call will also be available
online at https://www.wellsfargo.com/about/investor-relations/quarterly-earnings/ and https://
engage.vevent.com/rt/wells_fargo_ao~5890548.
A replay of the conference call will be available beginning at 11:00 a.m. PT (2:00 p.m. ET) on Tuesday, July 16
through Tuesday, July 30. Please dial 855-859-2056 (U.S. and Canada) or 404-537-3406 (International) and enter
Conference ID #5890548. The replay will also be available online at https://www.wellsfargo.com/about/investor-
relations/quarterly-earnings/ and https://engage.vevent.com/rt/wells_fargo_ao~5890548.
- 13 -
Forward-Looking Statements This document contains “forward-looking statements” within the meaning of the Private Securities Litigation Reform Act of 1995. In addition, we may make forward-looking statements in our other documents filed or furnished with the SEC, and our management may make forward-looking statements orally to analysts, investors, representatives of the media and others. Forward-looking statements can be identified by words such as “anticipates,” “intends,” “plans,” “seeks,” “believes,” “estimates,” “expects,” “target,” “projects,” “outlook,” “forecast,” “will,” “may,” “could,” “should,” “can” and similar references to future periods. In particular, forward-looking statements include, but are not limited to, statements we make about: (i) the future operating or financial performance of the Company, including our outlook for future growth; (ii) our noninterest expense and efficiency ratio; (iii) future credit quality and performance, including our expectations regarding future loan losses and allowance levels; (iv) the appropriateness of the allowance for credit losses; (v) our expectations regarding net interest income and net interest margin; (vi) loan growth or the reduction or mitigation of risk in our loan portfolios; (vii) future capital or liquidity levels or targets and our estimated Common Equity Tier 1 ratio under Basel III capital standards; (viii) the performance of our mortgage business and any related exposures; (ix) the expected outcome and impact of legal, regulatory and legislative developments, as well as our expectations regarding compliance therewith; (x) future common stock dividends, common share repurchases and other uses of capital; (xi) our targeted range for return on assets, return on equity, and return on tangible common equity; (xii) the outcome of contingencies, such as legal proceedings; and (xiii) the Company’s plans, objectives and strategies.
Forward-looking statements are not based on historical facts but instead represent our current expectations and assumptions regarding our business, the economy and other future conditions. Because forward-looking statements relate to the future, they are subject to inherent uncertainties, risks and changes in circumstances that are difficult to predict. Our actual results may differ materially from those contemplated by the forward-looking statements. We caution you, therefore, against relying on any of these forward-looking statements. They are neither statements of historical fact nor guarantees or assurances of future performance. While there is no assurance that any list of risks and uncertainties or risk factors is complete, important factors that could cause actual results to differ materially from those in the forward-looking statements include the following, without limitation:
• current and future economic and market conditions, including the effects of declines in housing prices, high unemployment rates, U.S. fiscal debt, budget and tax matters, geopolitical matters, and any slowdown in global economic growth;
• our capital and liquidity requirements (including under regulatory capital standards, such as the Basel III capital standards) and our ability to generate capital internally or raise capital on favorable terms;
• financial services reform and other current, pending or future legislation or regulation that could have a negative effect on our revenue and businesses, including the Dodd-Frank Act and other legislation and regulation relating to bank products and services;
• developments in our mortgage banking business, including the extent of the success of our mortgage loan modification efforts, the amount of mortgage loan repurchase demands that we receive, any negative effects relating to our mortgage servicing, loan modification or foreclosure practices, and the effects of regulatory or judicial requirements or guidance impacting our mortgage banking business and any changes in industry standards;
• our ability to realize any efficiency ratio or expense target as part of our expense management initiatives, including as a result of business and economic cyclicality, seasonality, changes in our business composition and operating environment, growth in our businesses and/or acquisitions, and unexpected expenses relating to, among other things, litigation and regulatory matters;
• the effect of the current interest rate environment or changes in interest rates on our net interest income, net interest margin and our mortgage originations, mortgage servicing rights and mortgage loans held for sale;
• significant turbulence or a disruption in the capital or financial markets, which could result in, among other things, reduced investor demand for mortgage loans, a reduction in the availability of funding or increased funding costs, and declines in asset values and/or recognition of other-than-temporary impairment on securities held in our debt securities and equity securities portfolios;
• the effect of a fall in stock market prices on our investment banking business and our fee income from our brokerage, asset and wealth management businesses;

- 14 -
• negative effects from the retail banking sales practices matter and from other instances where customers may have experienced financial harm, including on our legal, operational and compliance costs, our ability to engage in certain business activities or offer certain products or services, our ability to keep and attract customers, our ability to attract and retain qualified team members, and our reputation;
• resolution of regulatory matters, litigation, or other legal actions, which may result in, among other things, additional costs, fines, penalties, restrictions on our business activities, reputational harm, or other adverse consequences;
• a failure in or breach of our operational or security systems or infrastructure, or those of our third-party vendors or other service providers, including as a result of cyber attacks;
• the effect of changes in the level of checking or savings account deposits on our funding costs and net interest margin;
• fiscal and monetary policies of the Federal Reserve Board; and
• the other risk factors and uncertainties described under “Risk Factors” in our Annual Report on Form 10-K for the year ended December 31, 2018.
In addition to the above factors, we also caution that the amount and timing of any future common stock dividends or repurchases will depend on the earnings, cash requirements and financial condition of the Company, market conditions, capital requirements (including under Basel capital standards), common stock issuance requirements, applicable law and regulations (including federal securities laws and federal banking regulations), and other factors deemed relevant by the Company’s Board of Directors, and may be subject to regulatory approval or conditions.
For more information about factors that could cause actual results to differ materially from our expectations, refer to our reports filed with the Securities and Exchange Commission, including the discussion under “Risk Factors” in our Annual Report on Form 10-K for the year ended December 31, 2018, as filed with the Securities and Exchange Commission and available on its website at www.sec.gov.
Any forward-looking statement made by us speaks only as of the date on which it is made. Factors or events that could cause our actual results to differ may emerge from time to time, and it is not possible for us to predict all of them. We undertake no obligation to publicly update any forward-looking statement, whether as a result of new information, future developments or otherwise, except as may be required by law.
Forward-looking Non-GAAP Financial Measures. From time to time management may discuss forward-looking non-GAAP financial measures, such as forward-looking estimates or targets for return on average tangible common equity. We are unable to provide a reconciliation of forward-looking non-GAAP financial measures to their most directly comparable GAAP financial measures because we are unable to provide, without unreasonable effort, a meaningful or accurate calculation or estimation of amounts that would be necessary for the reconciliation due to the complexity and inherent difficulty in forecasting and quantifying future amounts or when they may occur. Such unavailable information could be significant to future results.

- 15 -
About Wells Fargo Wells Fargo & Company (NYSE: WFC) is a diversified, community-based financial services company with $1.9 trillion in assets. Wells Fargo’s vision is to satisfy our customers’ financial needs and help them succeed financially. Founded in 1852 and headquartered in San Francisco, Wells Fargo provides banking, investment and mortgage products and services, as well as consumer and commercial finance, through 7,600 locations, more than 13,000 ATMs, the internet (wellsfargo.com) and mobile banking, and has offices in 32 countries and territories to support customers who conduct business in the global economy. With approximately 263,000 team members, Wells Fargo serves one in three households in the United States. Wells Fargo & Company was ranked No. 29 on Fortune’s 2019 rankings of America’s largest corporations.
Media Ancel Martinez, 415-222-3858 [email protected]
or
Investor Relations John M. Campbell, 415-396-0523 [email protected]
# # #

- 16 -
Wells Fargo & Company and Subsidiaries QUARTERLY FINANCIAL DATA
TABLE OF CONTENTS
Pages
Summary Information
Summary Financial Data 17
Income
Consolidated Statement of Income 19
Consolidated Statement of Comprehensive Income 21
Condensed Consolidated Statement of Changes in Total Equity 21
Average Balances, Yields and Rates Paid (Taxable-Equivalent Basis) 22
Five Quarter Average Balances, Yields and Rates Paid (Taxable-Equivalent Basis) 24
Noninterest Income and Noninterest Expense 25
Five Quarter Deferred Compensation Plan Investment Results 27
Balance Sheet
Consolidated Balance Sheet 28
Trading Activities 30
Debt Securities 30
Equity Securities 31
Loans
Loans 32
Nonperforming Assets 33
Loans 90 Days or More Past Due and Still Accruing 33
Changes in Allowance for Credit Losses 35
Equity
Tangible Common Equity 36
Common Equity Tier 1 Under Basel III 37
Operating Segments
Operating Segment Results 38
Other
Mortgage Servicing and other related data 40
- 17 -
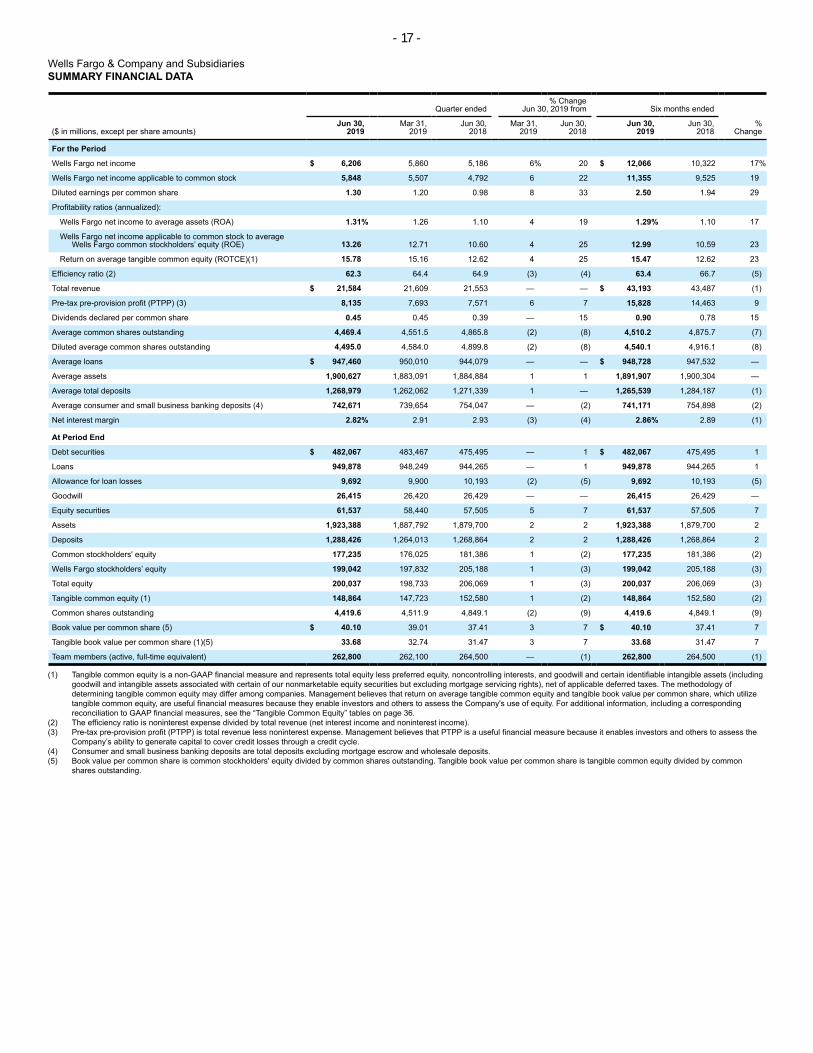
Wells Fargo & Company and Subsidiaries SUMMARY FINANCIAL DATA
% ChangeQuarter ended Jun 30, 2019 from Six months ended
Jun 30, Mar 31, Jun 30, Mar 31, Jun 30, Jun 30, Jun 30, % ($ in millions, except per share amounts) 2019 2019 2018 2019 2018 2019 2018 Change
For the Period
Wells Fargo net income $ 6,206 5,860 5,186 6% 20 $ 12,066 10,322 17%
Wells Fargo net income applicable to common stock 5,848 5,507 4,792 6 22 11,355 9,525 19
Diluted earnings per common share 1.30 1.20 0.98 8 33 2.50 1.94 29
Profitability ratios (annualized):
Wells Fargo net income to average assets (ROA) 1.31% 1.26 1.10 4 19 1.29% 1.10 17
Wells Fargo net income applicable to common stock to averageWells Fargo common stockholders’ equity (ROE) 13.26 12.71 10.60 4 25 12.99 10.59 23
Return on average tangible common equity (ROTCE)(1) 15.78 15.16 12.62 4 25 15.47 12.62 23
Efficiency ratio (2) 62.3 64.4 64.9 (3) (4) 63.4 66.7 (5)
Total revenue $ 21,584 21,609 21,553 — — $ 43,193 43,487 (1)
Pre-tax pre-provision profit (PTPP) (3) 8,135 7,693 7,571 6 7 15,828 14,463 9
Dividends declared per common share 0.45 0.45 0.39 — 15 0.90 0.78 15
Average common shares outstanding 4,469.4 4,551.5 4,865.8 (2) (8) 4,510.2 4,875.7 (7)
Diluted average common shares outstanding 4,495.0 4,584.0 4,899.8 (2) (8) 4,540.1 4,916.1 (8)
Average loans $ 947,460 950,010 944,079 — — $ 948,728 947,532 —
Average assets 1,900,627 1,883,091 1,884,884 1 1 1,891,907 1,900,304 —
Average total deposits 1,268,979 1,262,062 1,271,339 1 — 1,265,539 1,284,187 (1)
Average consumer and small business banking deposits (4) 742,671 739,654 754,047 — (2) 741,171 754,898 (2)
Net interest margin 2.82% 2.91 2.93 (3) (4) 2.86% 2.89 (1)
At Period End
Debt securities $ 482,067 483,467 475,495 — 1 $ 482,067 475,495 1
Loans 949,878 948,249 944,265 — 1 949,878 944,265 1
Allowance for loan losses 9,692 9,900 10,193 (2) (5) 9,692 10,193 (5)
Goodwill 26,415 26,420 26,429 — — 26,415 26,429 —
Equity securities 61,537 58,440 57,505 5 7 61,537 57,505 7
Assets 1,923,388 1,887,792 1,879,700 2 2 1,923,388 1,879,700 2
Deposits 1,288,426 1,264,013 1,268,864 2 2 1,288,426 1,268,864 2
Common stockholders' equity 177,235 176,025 181,386 1 (2) 177,235 181,386 (2)
Wells Fargo stockholders’ equity 199,042 197,832 205,188 1 (3) 199,042 205,188 (3)
Total equity 200,037 198,733 206,069 1 (3) 200,037 206,069 (3)
Tangible common equity (1) 148,864 147,723 152,580 1 (2) 148,864 152,580 (2)
Common shares outstanding 4,419.6 4,511.9 4,849.1 (2) (9) 4,419.6 4,849.1 (9)
Book value per common share (5) $ 40.10 39.01 37.41 3 7 $ 40.10 37.41 7
Tangible book value per common share (1)(5) 33.68 32.74 31.47 3 7 33.68 31.47 7
Team members (active, full-time equivalent) 262,800 262,100 264,500 — (1) 262,800 264,500 (1)
(1) Tangible common equity is a non-GAAP financial measure and represents total equity less preferred equity, noncontrolling interests, and goodwill and certain identifiable intangible assets (including goodwill and intangible assets associated with certain of our nonmarketable equity securities but excluding mortgage servicing rights), net of applicable deferred taxes. The methodology of determining tangible common equity may differ among companies. Management believes that return on average tangible common equity and tangible book value per common share, which utilize tangible common equity, are useful financial measures because they enable investors and others to assess the Company's use of equity. For additional information, including a corresponding reconciliation to GAAP financial measures, see the “Tangible Common Equity” tables on page 36.
(2) The efficiency ratio is noninterest expense divided by total revenue (net interest income and noninterest income). (3) Pre-tax pre-provision profit (PTPP) is total revenue less noninterest expense. Management believes that PTPP is a useful financial measure because it enables investors and others to assess the
Company’s ability to generate capital to cover credit losses through a credit cycle. (4) Consumer and small business banking deposits are total deposits excluding mortgage escrow and wholesale deposits. (5) Book value per common share is common stockholders' equity divided by common shares outstanding. Tangible book value per common share is tangible common equity divided by common
shares outstanding.

- 18 -
Wells Fargo & Company and Subsidiaries FIVE QUARTER SUMMARY FINANCIAL DATA
Quarter ended
Jun 30, Mar 31, Dec 31, Sep 30, Jun 30, ($ in millions, except per share amounts) 2019 2019 2018 2018 2018
For the Quarter Wells Fargo net income $ 6,206 5,860 6,064 6,007 5,186 Wells Fargo net income applicable to common stock 5,848 5,507 5,711 5,453 4,792 Diluted earnings per common share 1.30 1.20 1.21 1.13 0.98 Profitability ratios (annualized):
Wells Fargo net income to average assets (ROA) 1.31% 1.26 1.28 1.27 1.10 Wells Fargo net income applicable to common stock to average Wells
Fargo common stockholders’ equity (ROE) 13.26 12.71 12.89 12.04 10.60 Return on average tangible common equity (ROTCE)(1) 15.78 15.16 15.39 14.33 12.62
Efficiency ratio (2) 62.3 64.4 63.6 62.7 64.9 Total revenue $ 21,584 21,609 20,980 21,941 21,553 Pre-tax pre-provision profit (PTPP) (3) 8,135 7,693 7,641 8,178 7,571 Dividends declared per common share 0.45 0.45 0.43 0.43 0.39 Average common shares outstanding 4,469.4 4,551.5 4,665.8 4,784.0 4,865.8 Diluted average common shares outstanding 4,495.0 4,584.0 4,700.8 4,823.2 4,899.8 Average loans $ 947,460 950,010 946,336 939,462 944,079 Average assets 1,900,627 1,883,091 1,879,047 1,876,283 1,884,884 Average total deposits 1,268,979 1,262,062 1,268,948 1,266,378 1,271,339 Average consumer and small business banking deposits (4) 742,671 739,654 736,295 743,503 754,047 Net interest margin 2.82% 2.91 2.94 2.94 2.93
At Quarter End Debt securities $ 482,067 483,467 484,689 472,283 475,495 Loans 949,878 948,249 953,110 942,300 944,265 Allowance for loan losses 9,692 9,900 9,775 10,021 10,193 Goodwill 26,415 26,420 26,418 26,425 26,429 Equity securities 61,537 58,440 55,148 61,755 57,505 Assets 1,923,388 1,887,792 1,895,883 1,872,981 1,879,700 Deposits 1,288,426 1,264,013 1,286,170 1,266,594 1,268,864 Common stockholders' equity 177,235 176,025 174,359 176,934 181,386 Wells Fargo stockholders’ equity 199,042 197,832 196,166 198,741 205,188 Total equity 200,037 198,733 197,066 199,679 206,069 Tangible common equity (1) 148,864 147,723 145,980 148,391 152,580 Common shares outstanding 4,419.6 4,511.9 4,581.3 4,711.6 4,849.1 Book value per common share (5) $ 40.10 39.01 38.06 37.55 37.41 Tangible book value per common share (1)(5) 33.68 32.74 31.86 31.49 31.47 Team members (active, full-time equivalent) 262,800 262,100 258,700 261,700 264,500
(1) Tangible common equity is a non-GAAP financial measure and represents total equity less preferred equity, noncontrolling interests, and goodwill and certain identifiable intangible assets (including goodwill and intangible assets associated with certain of our nonmarketable equity securities but excluding mortgage servicing rights), net of applicable deferred taxes. The methodology of determining tangible common equity may differ among companies. Management believes that return on average tangible common equity and tangible book value per common share, which utilize tangible common equity, are useful financial measures because they enable investors and others to assess the Company's use of equity. For additional information, including a corresponding reconciliation to GAAP financial measures, see the “Tangible Common Equity” tables on page 36.
(2) The efficiency ratio is noninterest expense divided by total revenue (net interest income and noninterest income). (3) Pre-tax pre-provision profit (PTPP) is total revenue less noninterest expense. Management believes that PTPP is a useful financial measure because it enables investors and others to assess the
Company’s ability to generate capital to cover credit losses through a credit cycle. (4) Consumer and small business banking deposits are total deposits excluding mortgage escrow and wholesale deposits. (5) Book value per common share is common stockholders' equity divided by common shares outstanding. Tangible book value per common share is tangible common equity divided by common
shares outstanding.
- 19 -
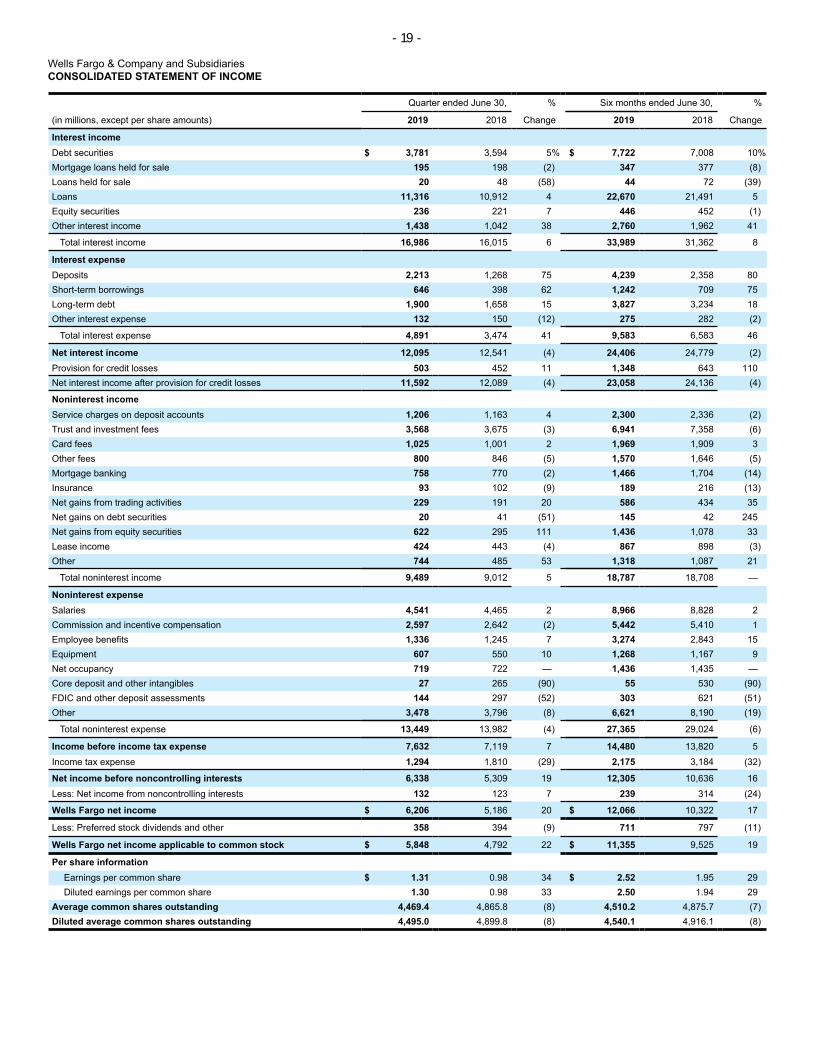
Wells Fargo & Company and Subsidiaries CONSOLIDATED STATEMENT OF INCOME
Quarter ended June 30, % Six months ended June 30, %
(in millions, except per share amounts) 2019 2018 Change 2019 2018 Change
Interest income Debt securities $ 3,781 3,594 5% $ 7,722 7,008 10% Mortgage loans held for sale 195 198 (2) 347 377 (8) Loans held for sale 20 48 (58) 44 72 (39) Loans 11,316 10,912 4 22,670 21,491 5 Equity securities 236 221 7 446 452 (1) Other interest income 1,438 1,042 38 2,760 1,962 41
Total interest income 16,986 16,015 6 33,989 31,362 8
Interest expense Deposits 2,213 1,268 75 4,239 2,358 80 Short-term borrowings 646 398 62 1,242 709 75 Long-term debt 1,900 1,658 15 3,827 3,234 18 Other interest expense 132 150 (12) 275 282 (2)
Total interest expense 4,891 3,474 41 9,583 6,583 46
Net interest income 12,095 12,541 (4) 24,406 24,779 (2) Provision for credit losses 503 452 11 1,348 643 110 Net interest income after provision for credit losses 11,592 12,089 (4) 23,058 24,136 (4)
Noninterest income Service charges on deposit accounts 1,206 1,163 4 2,300 2,336 (2) Trust and investment fees 3,568 3,675 (3) 6,941 7,358 (6) Card fees 1,025 1,001 2 1,969 1,909 3 Other fees 800 846 (5) 1,570 1,646 (5) Mortgage banking 758 770 (2) 1,466 1,704 (14) Insurance 93 102 (9) 189 216 (13) Net gains from trading activities 229 191 20 586 434 35 Net gains on debt securities 20 41 (51) 145 42 245 Net gains from equity securities 622 295 111 1,436 1,078 33 Lease income 424 443 (4) 867 898 (3) Other 744 485 53 1,318 1,087 21
Total noninterest income 9,489 9,012 5 18,787 18,708 —
Noninterest expense Salaries 4,541 4,465 2 8,966 8,828 2 Commission and incentive compensation 2,597 2,642 (2) 5,442 5,410 1 Employee benefits 1,336 1,245 7 3,274 2,843 15 Equipment 607 550 10 1,268 1,167 9 Net occupancy 719 722 — 1,436 1,435 — Core deposit and other intangibles 27 265 (90) 55 530 (90) FDIC and other deposit assessments 144 297 (52) 303 621 (51) Other 3,478 3,796 (8) 6,621 8,190 (19)
Total noninterest expense 13,449 13,982 (4) 27,365 29,024 (6)
Income before income tax expense 7,632 7,119 7 14,480 13,820 5 Income tax expense 1,294 1,810 (29) 2,175 3,184 (32)
Net income before noncontrolling interests 6,338 5,309 19 12,305 10,636 16 Less: Net income from noncontrolling interests 132 123 7 239 314 (24)
Wells Fargo net income $ 6,206 5,186 20 $ 12,066 10,322 17
Less: Preferred stock dividends and other 358 394 (9) 711 797 (11)
Wells Fargo net income applicable to common stock $ 5,848 4,792 22 $ 11,355 9,525 19
Per share information Earnings per common share $ 1.31 0.98 34 $ 2.52 1.95 29 Diluted earnings per common share 1.30 0.98 33 2.50 1.94 29
Average common shares outstanding 4,469.4 4,865.8 (8) 4,510.2 4,875.7 (7) Diluted average common shares outstanding 4,495.0 4,899.8 (8) 4,540.1 4,916.1 (8)
- 20 -
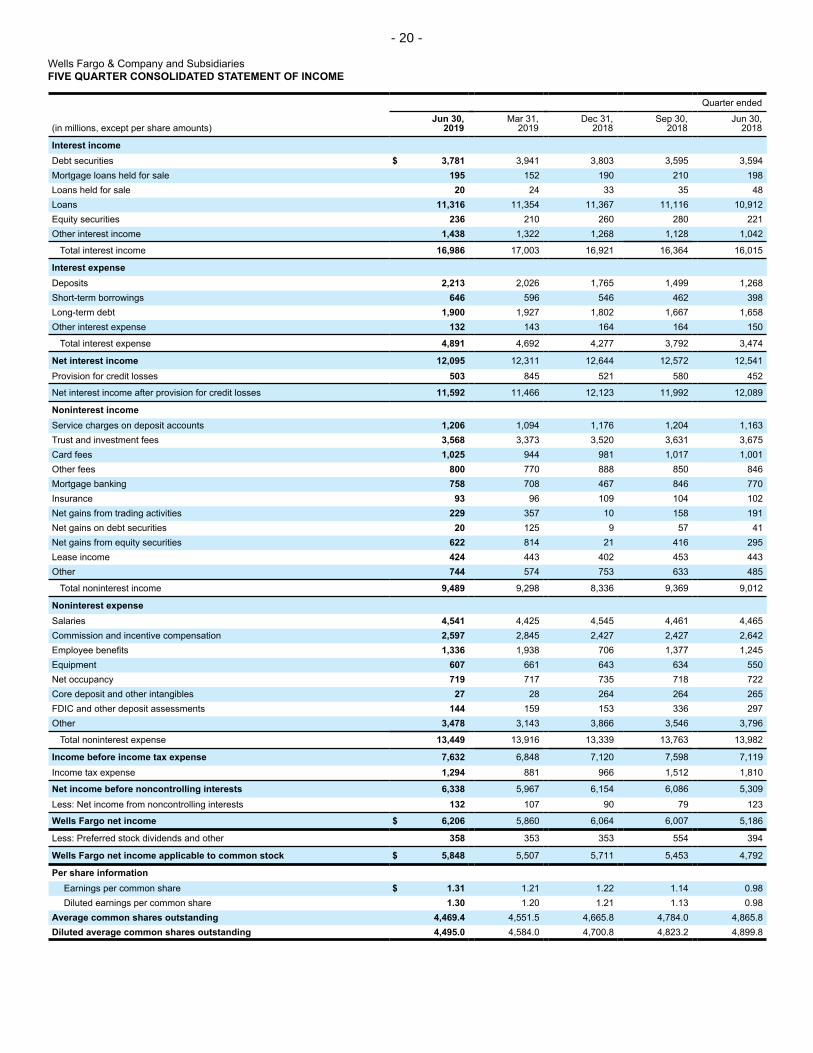
Wells Fargo & Company and Subsidiaries FIVE QUARTER CONSOLIDATED STATEMENT OF INCOME
Quarter ended
(in millions, except per share amounts) Jun 30,
2019 Mar 31,
2019 Dec 31,
2018 Sep 30,
2018 Jun 30,
2018
Interest income Debt securities $ 3,781 3,941 3,803 3,595 3,594 Mortgage loans held for sale 195 152 190 210 198 Loans held for sale 20 24 33 35 48 Loans 11,316 11,354 11,367 11,116 10,912 Equity securities 236 210 260 280 221 Other interest income 1,438 1,322 1,268 1,128 1,042
Total interest income 16,986 17,003 16,921 16,364 16,015
Interest expense Deposits 2,213 2,026 1,765 1,499 1,268 Short-term borrowings 646 596 546 462 398 Long-term debt 1,900 1,927 1,802 1,667 1,658 Other interest expense 132 143 164 164 150
Total interest expense 4,891 4,692 4,277 3,792 3,474
Net interest income 12,095 12,311 12,644 12,572 12,541 Provision for credit losses 503 845 521 580 452
Net interest income after provision for credit losses 11,592 11,466 12,123 11,992 12,089
Noninterest income Service charges on deposit accounts 1,206 1,094 1,176 1,204 1,163 Trust and investment fees 3,568 3,373 3,520 3,631 3,675 Card fees 1,025 944 981 1,017 1,001 Other fees 800 770 888 850 846 Mortgage banking 758 708 467 846 770 Insurance 93 96 109 104 102 Net gains from trading activities 229 357 10 158 191 Net gains on debt securities 20 125 9 57 41 Net gains from equity securities 622 814 21 416 295 Lease income 424 443 402 453 443 Other 744 574 753 633 485
Total noninterest income 9,489 9,298 8,336 9,369 9,012
Noninterest expense Salaries 4,541 4,425 4,545 4,461 4,465 Commission and incentive compensation 2,597 2,845 2,427 2,427 2,642 Employee benefits 1,336 1,938 706 1,377 1,245 Equipment 607 661 643 634 550 Net occupancy 719 717 735 718 722 Core deposit and other intangibles 27 28 264 264 265 FDIC and other deposit assessments 144 159 153 336 297 Other 3,478 3,143 3,866 3,546 3,796
Total noninterest expense 13,449 13,916 13,339 13,763 13,982
Income before income tax expense 7,632 6,848 7,120 7,598 7,119 Income tax expense 1,294 881 966 1,512 1,810
Net income before noncontrolling interests 6,338 5,967 6,154 6,086 5,309 Less: Net income from noncontrolling interests 132 107 90 79 123
Wells Fargo net income $ 6,206 5,860 6,064 6,007 5,186
Less: Preferred stock dividends and other 358 353 353 554 394
Wells Fargo net income applicable to common stock $ 5,848 5,507 5,711 5,453 4,792
Per share information Earnings per common share $ 1.31 1.21 1.22 1.14 0.98 Diluted earnings per common share 1.30 1.20 1.21 1.13 0.98
Average common shares outstanding 4,469.4 4,551.5 4,665.8 4,784.0 4,865.8 Diluted average common shares outstanding 4,495.0 4,584.0 4,700.8 4,823.2 4,899.8

- 21 -
Wells Fargo & Company and Subsidiaries CONSOLIDATED STATEMENT OF COMPREHENSIVE INCOME
Quarter ended June 30, % Six months ended June 30, %
(in millions) 2019 2018 Change 2019 2018 Change
Wells Fargo net income $ 6,206 5,186 20% $ 12,066 10,322 17%
Other comprehensive income (loss), before tax: Debt securities:
Net unrealized gains (losses) arising during the period 1,709 (617) NM 4,540 (4,060) NM Reclassification of net (gains) losses to net income 39 49 (20) (42) 117 NM
Derivative and hedging activities: Net unrealized gains (losses) arising during the period 57 (150) NM 22 (392) NM Reclassification of net losses to net income 79 77 3 158 137 15
Defined benefit plans adjustments: Net actuarial and prior service gains (losses) arising during the period — — — (4) 6 NM
Amortization of net actuarial loss, settlements and other to net income 33 29 14 68 61 11 Foreign currency translation adjustments:
Net unrealized gains (losses) arising during the period 14 (83) NM 56 (85) NM
Other comprehensive income (loss), before tax 1,931 (695) NM 4,798 (4,216) NM
Income tax benefit (expense) related to other comprehensive income (473) 154 NM (1,167) 1,016 NM
Other comprehensive income (loss), net of tax 1,458 (541) NM 3,631 (3,200) NM
Less: Other comprehensive loss from noncontrolling interests — (1) (100) — (1) (100) Wells Fargo other comprehensive income (loss), net of tax 1,458 (540) NM 3,631 (3,199) NM
Wells Fargo comprehensive income 7,664 4,646 65 15,697 7,123 120
Comprehensive income from noncontrolling interests 132 122 8 239 313 (24)
Total comprehensive income $ 7,796 4,768 64 $ 15,936 7,436 114
NM – Not meaningful
FIVE QUARTER CONDENSED CONSOLIDATED STATEMENT OF CHANGES IN TOTAL EQUITY
Quarter ended
Jun 30, Mar 31, Dec 31, Sep 30, Jun 30, (in millions) 2019 2019 2018 2018 2018
Balance, beginning of period $ 198,733 197,066 199,679 206,069 205,910 Cumulative effect from change in accounting policies (1) — (11) — — — Wells Fargo net income 6,206 5,860 6,064 6,007 5,186 Wells Fargo other comprehensive income (loss), net of tax 1,458 2,173 537 (1,012) (540) Noncontrolling interests 94 1 (38) 57 (77) Common stock issued 399 1,139 239 156 73 Common stock repurchased (2) (4,898) (4,820) (7,299) (7,382) (2,923) Preferred stock redeemed (3) — — — (2,150) — Preferred stock released by ESOP 193 — 268 260 490 Common stock warrants repurchased/exercised — — (131) (36) (1) Common stock dividends (2,015) (2,054) (2,016) (2,062) (1,900) Preferred stock dividends (358) (353) (353) (399) (394) Stock incentive compensation expense 247 544 144 202 258 Net change in deferred compensation and related plans (22) (812) (28) (31) (13)
Balance, end of period $ 200,037 198,733 197,066 199,679 206,069
(1) Effective January 1, 2019, we adopted ASU 2016-02 – Leases (Topic 842) and subsequent related Updates and ASU 2017-08 – Receivables – Nonrefundable Fees and Other Costs (Subtopic 310-20): Premium Amortization on Purchased Callable Debt Securities.
(2) For the quarter ended June 30, 2018, includes $1.0 billion related to a private forward repurchase transaction that settled in third quarter 2018 for 18.8 million shares of common stock. (3) Represents the impact of the redemption of preferred stock, Series J, in third quarter 2018.
- 22 -
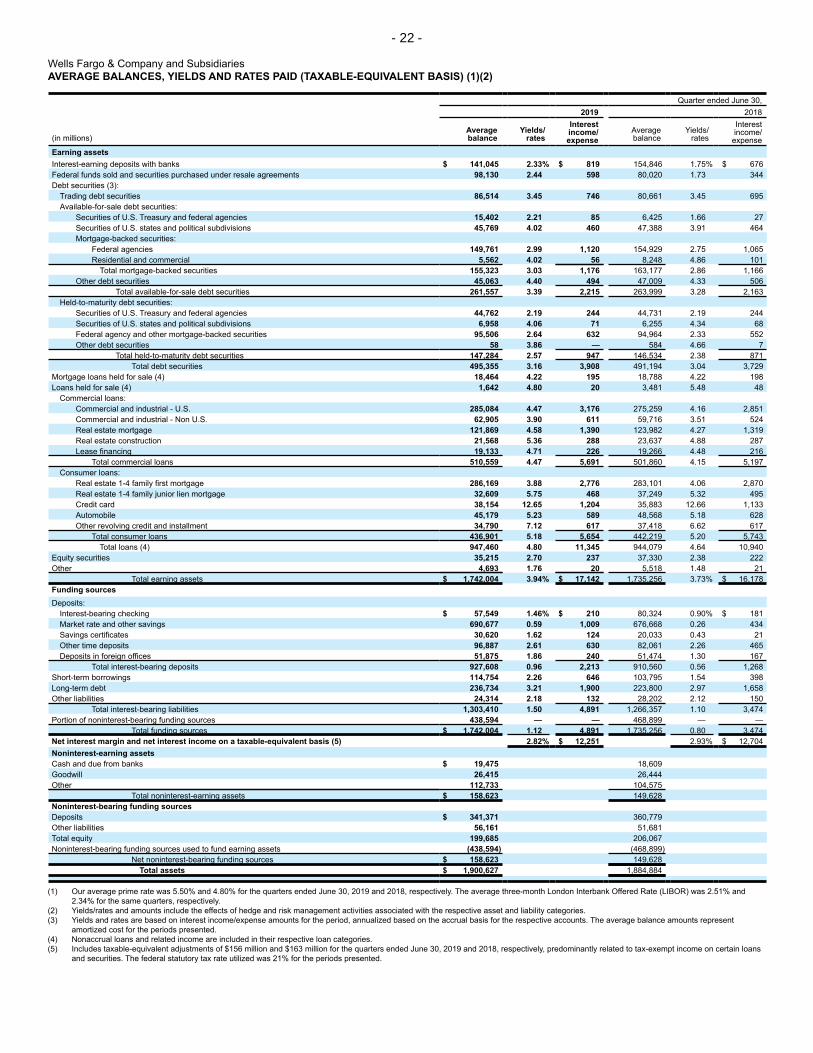
Wells Fargo & Company and Subsidiaries AVERAGE BALANCES, YIELDS AND RATES PAID (TAXABLE-EQUIVALENT BASIS) (1)(2)
Quarter ended June 30, 2019 2018
Interest InterestAverage Yields/ income/ Average Yields/ income/
expense(in millions) balance rates balance rates expense Earning assets Interest-earning deposits with banks $ 141,045 2.33% $ 819 154,846 1.75% $ 676 Federal funds sold and securities purchased under resale agreements 98,130 2.44 598 80,020 1.73 344 Debt securities (3):
Trading debt securities 86,514 3.45 746 80,661 3.45 695 Available-for-sale debt securities:
Securities of U.S. Treasury and federal agencies 15,402 2.21 85 6,425 1.66 27 Securities of U.S. states and political subdivisions 45,769 4.02 460 47,388 3.91 464 Mortgage-backed securities:
Federal agencies 149,761 2.99 1,120 154,929 2.75 1,065 Residential and commercial 5,562 4.02 56 8,248 4.86 101
Total mortgage-backed securities 155,323 3.03 1,176 163,177 2.86 1,166 Other debt securities 45,063 4.40 494 47,009 4.33 506
Total available-for-sale debt securities 261,557 3.39 2,215 263,999 3.28 2,163 Held-to-maturity debt securities:
Securities of U.S. Treasury and federal agencies 44,762 2.19 244 44,731 2.19 244 Securities of U.S. states and political subdivisions 6,958 4.06 71 6,255 4.34 68 Federal agency and other mortgage-backed securities 95,506 2.64 632 94,964 2.33 552 Other debt securities 58 3.86 — 584 4.66 7
Total held-to-maturity debt securities 147,284 2.57 947 146,534 2.38 871 Total debt securities 495,355 3.16 3,908 491,194 3.04 3,729
Mortgage loans held for sale (4) 18,464 4.22 195 18,788 4.22 198 Loans held for sale (4) 1,642 4.80 20 3,481 5.48 48
Commercial loans: Commercial and industrial - U.S. 285,084 4.47 3,176 275,259 4.16 2,851 Commercial and industrial - Non U.S. 62,905 3.90 611 59,716 3.51 524 Real estate mortgage 121,869 4.58 1,390 123,982 4.27 1,319 Real estate construction 21,568 5.36 288 23,637 4.88 287 Lease financing 19,133 4.71 226 19,266 4.48 216
Total commercial loans 510,559 4.47 5,691 501,860 4.15 5,197 Consumer loans:
Real estate 1-4 family first mortgage 286,169 3.88 2,776 283,101 4.06 2,870 Real estate 1-4 family junior lien mortgage 32,609 5.75 468 37,249 5.32 495 Credit card 38,154 12.65 1,204 35,883 12.66 1,133 Automobile 45,179 5.23 589 48,568 5.18 628 Other revolving credit and installment 34,790 7.12 617 37,418 6.62 617
Total consumer loans 436,901 5.18 5,654 442,219 5.20 5,743 Total loans (4) 947,460 4.80 11,345 944,079 4.64 10,940
Equity securities 35,215 2.70 237 37,330 2.38 222 Other 4,693 1.76 20 5,518 1.48 21
Total earning assets $ 1,742,004 3.94% $ 17,142 1,735,256 3.73% $ 16,178 Funding sources Deposits:
Interest-bearing checking $ 57,549 1.46% $ 210 80,324 0.90% $ 181 Market rate and other savings 690,677 0.59 1,009 676,668 0.26 434 Savings certificates 30,620 1.62 124 20,033 0.43 21 Other time deposits 96,887 2.61 630 82,061 2.26 465 Deposits in foreign offices 51,875 1.86 240 51,474 1.30 167
Total interest-bearing deposits 927,608 0.96 2,213 910,560 0.56 1,268 Short-term borrowings 114,754 2.26 646 103,795 1.54 398 Long-term debt 236,734 3.21 1,900 223,800 2.97 1,658 Other liabilities 24,314 2.18 132 28,202 2.12 150
Total interest-bearing liabilities 1,303,410 1.50 4,891 1,266,357 1.10 3,474 Portion of noninterest-bearing funding sources 438,594 — — 468,899 — —
Total funding sources $ 1,742,004 1.12 4,891 1,735,256 0.80 3,474 Net interest margin and net interest income on a taxable-equivalent basis (5) 2.82% $ 12,251 2.93% $ 12,704 Noninterest-earning assets Cash and due from banks $ 19,475 18,609 Goodwill 26,415 26,444 Other 112,733 104,575
Total noninterest-earning assets $ 158,623 149,628 Noninterest-bearing funding sources Deposits $ 341,371 360,779 Other liabilities 56,161 51,681 Total equity 199,685 206,067 Noninterest-bearing funding sources used to fund earning assets (438,594) (468,899)
Net noninterest-bearing funding sources $ 158,623 149,628 Total assets $ 1,900,627 1,884,884
(1) Our average prime rate was 5.50% and 4.80% for the quarters ended June 30, 2019 and 2018, respectively. The average three-month London Interbank Offered Rate (LIBOR) was 2.51% and 2.34% for the same quarters, respectively.
(2) Yields/rates and amounts include the effects of hedge and risk management activities associated with the respective asset and liability categories. (3) Yields and rates are based on interest income/expense amounts for the period, annualized based on the accrual basis for the respective accounts. The average balance amounts represent
amortized cost for the periods presented. (4) Nonaccrual loans and related income are included in their respective loan categories. (5) Includes taxable-equivalent adjustments of $156 million and $163 million for the quarters ended June 30, 2019 and 2018, respectively, predominantly related to tax-exempt income on certain loans
and securities. The federal statutory tax rate utilized was 21% for the periods presented.

- 23 -
Wells Fargo & Company and Subsidiaries AVERAGE BALANCES, YIELDS AND RATES PAID (TAXABLE-EQUIVALENT BASIS) (1)(2)
Six months ended June 30, 2019 2018
Interest Interest Average Yields/ income/ Average Yields/ income/
(in millions) balance rates expense balance rates expense Earning assets Interest-earning deposits with banks $ 140,915 2.33% $ 1,629 163,520 1.61% $ 1,308 Federal funds sold and securities purchased under resale agreements 90,875 2.42 1,093 79,083 1.57 615 Debt securities (3):
Trading debt securities 87,938 3.52 1,544 79,693 3.35 1,332 Available-for-sale debt securities:
Securities of U.S. Treasury and federal agencies 14,740 2.18 159 6,426 1.66 53 Securities of U.S. states and political subdivisions 47,049 4.02 946 48,665 3.64 885 Mortgage-backed securities:
Federal agencies 150,623 3.04 2,293 156,690 2.73 2,141 Residential and commercial 5,772 4.17 120 8,558 4.48 192
Total mortgage-backed securities 156,395 3.09 2,413 165,248 2.82 2,333 Other debt securities 45,920 4.43 1,011 47,549 4.02 950
Total available-for-sale debt securities 264,104 3.44 4,529 267,888 3.16 4,221 Held-to-maturity debt securities:
Securities of U.S. Treasury and federal agencies 44,758 2.20 487 44,727 2.20 487 Securities of U.S. states and political subdivisions 6,560 4.05 133 6,257 4.34 136 Federal agency and other mortgage-backed securities 95,753 2.69 1,288 92,888 2.35 1,093 Other debt securities 60 3.91 1 639 3.89 12
Total held-to-maturity debt securities 147,131 2.60 1,909 144,511 2.40 1,728 Total debt securities 499,173 3.20 7,982 492,092 2.96 7,281
Mortgage loans held for sale (4) 16,193 4.28 347 18,598 4.06 377 Loans held for sale (4) 1,752 5.04 44 2,750 5.28 72
Commercial loans: Commercial and industrial - U.S. 285,827 4.47 6,345 273,658 4.00 5,435 Commercial and industrial - Non U.S. 62,863 3.90 1,215 59,964 3.37 1,003 Real estate mortgage 121,644 4.58 2,763 125,085 4.16 2,581 Real estate construction 21,999 5.40 589 24,041 4.70 561 Lease financing 19,261 4.66 450 19,266 4.89 471
Total commercial loans 511,594 4.48 11,362 502,014 4.03 10,051 Consumer loans:
Real estate 1-4 family first mortgage 285,694 3.92 5,597 283,651 4.04 5,722 Real estate 1-4 family junior lien mortgage 33,197 5.75 949 38,042 5.23 988 Credit card 38,168 12.76 2,416 36,174 12.71 2,280 Automobile 45,007 5.21 1,163 50,010 5.17 1,283 Other revolving credit and installment 35,068 7.13 1,240 37,641 6.54 1,221
Total consumer loans 437,134 5.22 11,365 445,518 5.18 11,494 Total loans (4) 948,728 4.82 22,727 947,532 4.57 21,545
Equity securities 34,154 2.63 448 38,536 2.37 455 Other 4,555 1.69 38 5,765 1.34 40
Total earning assets $ 1,736,345 3.97% $ 34,308 1,747,876 3.64% $ 31,693 Funding sources Deposits:
Interest-bearing checking $ 56,905 1.44% $ 407 74,084 0.84% $ 310 Market rate and other savings 689,628 0.54 1,856 677,861 0.24 802 Savings certificates 27,940 1.46 202 20,025 0.38 38 Other time deposits 97,356 2.64 1,275 79,340 2.06 812 Deposits in foreign offices 53,649 1.88 499 73,023 1.09 396
Total interest-bearing deposits 925,478 0.92 4,239 924,333 0.51 2,358 Short-term borrowings 111,719 2.24 1,243 102,793 1.39 710 Long-term debt 234,963 3.27 3,827 224,924 2.88 3,234 Other liabilities 24,801 2.23 275 28,065 2.02 282
Total interest-bearing liabilities 1,296,961 1.49 9,584 1,280,115 1.03 6,584 Portion of noninterest-bearing funding sources 439,384 — — 467,761 — —
Total funding sources $ 1,736,345 1.11 9,584 1,747,876 0.75 6,584 Net interest margin and net interest income on a taxable-equivalent basis (5) 2.86% $ 24,724 2.89% $ 25,109 Noninterest-earning assets Cash and due from banks $ 19,544 18,730 Goodwill 26,417 26,480 Other 109,601 107,218
Total noninterest-earning assets $ 155,562 152,428 Noninterest-bearing funding sources Deposits $ 340,061 359,854 Other liabilities 55,864 54,212 Total equity 199,021 206,123 Noninterest-bearing funding sources used to fund earning assets (439,384) (467,761)
Net noninterest-bearing funding sources $ 155,562 152,428 Total assets $ 1,891,907 1,900,304
(1) Our average prime rate was 5.50% and 4.66% for first half of 2019 and 2018, respectively. The average three-month London Interbank Offered Rate (LIBOR) was 2.60% and 2.13% for the same periods, respectively.
(2) Yields/rates and amounts include the effects of hedge and risk management activities associated with the respective asset and liability categories. (3) Yields and rates are based on interest income/expense amounts for the period. The average balance amounts represent amortized cost for the periods presented. (4) Nonaccrual loans and related income are included in their respective loan categories. (5) Includes taxable-equivalent adjustments of $318 million and $330 million for the first half of 2019 and 2018, respectively, predominantly related to tax-exempt income on certain loans and securities.
The federal statutory tax rate utilized was 21% for the periods presented.
- 24 -
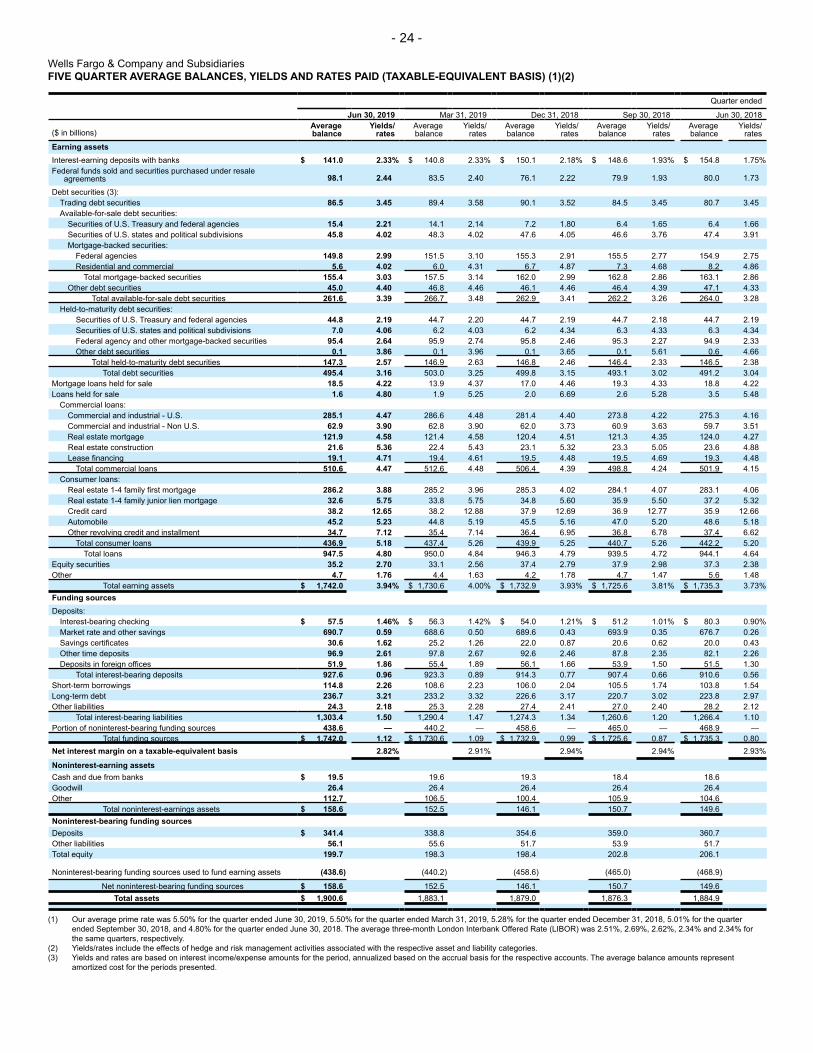
Wells Fargo & Company and Subsidiaries FIVE QUARTER AVERAGE BALANCES, YIELDS AND RATES PAID (TAXABLE-EQUIVALENT BASIS) (1)(2)
Quarter ended
Jun 30, 2019 Mar 31, 2019 Dec 31, 2018 Sep 30, 2018 Jun 30, 2018 Average Yields/ Average Yields/ Average Yields/ Average Yields/ Average Yields/
($ in billions) balance rates balance rates balance rates balance rates balance rates
Earning assets Interest-earning deposits with banks $ 141.0 2.33% $ 140.8 2.33% $ 150.1 2.18% $ 148.6 1.93% $ 154.8 1.75% Federal funds sold and securities purchased under resale
agreements 98.1 2.44 83.5 2.40 76.1 2.22 79.9 1.93 80.0 1.73
Debt securities (3): Trading debt securities 86.5 3.45 89.4 3.58 90.1 3.52 84.5 3.45 80.7 3.45 Available-for-sale debt securities:
Securities of U.S. Treasury and federal agencies 15.4 2.21 14.1 2.14 7.2 1.80 6.4 1.65 6.4 1.66 Securities of U.S. states and political subdivisions 45.8 4.02 48.3 4.02 47.6 4.05 46.6 3.76 47.4 3.91 Mortgage-backed securities:
Federal agencies 149.8 2.99 151.5 3.10 155.3 2.91 155.5 2.77 154.9 2.75 Residential and commercial 5.6 4.02 6.0 4.31 6.7 4.87 7.3 4.68 8.2 4.86
Total mortgage-backed securities 155.4 3.03 157.5 3.14 162.0 2.99 162.8 2.86 163.1 2.86 Other debt securities 45.0 4.40 46.8 4.46 46.1 4.46 46.4 4.39 47.1 4.33
Total available-for-sale debt securities 261.6 3.39 266.7 3.48 262.9 3.41 262.2 3.26 264.0 3.28 Held-to-maturity debt securities:
Securities of U.S. Treasury and federal agencies 44.8 2.19 44.7 2.20 44.7 2.19 44.7 2.18 44.7 2.19 Securities of U.S. states and political subdivisions 7.0 4.06 6.2 4.03 6.2 4.34 6.3 4.33 6.3 4.34 Federal agency and other mortgage-backed securities 95.4 2.64 95.9 2.74 95.8 2.46 95.3 2.27 94.9 2.33 Other debt securities 0.1 3.86 0.1 3.96 0.1 3.65 0.1 5.61 0.6 4.66
Total held-to-maturity debt securities 147.3 2.57 146.9 2.63 146.8 2.46 146.4 2.33 146.5 2.38 Total debt securities 495.4 3.16 503.0 3.25 499.8 3.15 493.1 3.02 491.2 3.04
Mortgage loans held for sale 18.5 4.22 13.9 4.37 17.0 4.46 19.3 4.33 18.8 4.22 Loans held for sale 1.6 4.80 1.9 5.25 2.0 6.69 2.6 5.28 3.5 5.48
Commercial loans: Commercial and industrial - U.S. 285.1 4.47 286.6 4.48 281.4 4.40 273.8 4.22 275.3 4.16 Commercial and industrial - Non U.S. 62.9 3.90 62.8 3.90 62.0 3.73 60.9 3.63 59.7 3.51 Real estate mortgage 121.9 4.58 121.4 4.58 120.4 4.51 121.3 4.35 124.0 4.27 Real estate construction 21.6 5.36 22.4 5.43 23.1 5.32 23.3 5.05 23.6 4.88 Lease financing 19.1 4.71 19.4 4.61 19.5 4.48 19.5 4.69 19.3 4.48
Total commercial loans 510.6 4.47 512.6 4.48 506.4 4.39 498.8 4.24 501.9 4.15 Consumer loans:
Real estate 1-4 family first mortgage 286.2 3.88 285.2 3.96 285.3 4.02 284.1 4.07 283.1 4.06 Real estate 1-4 family junior lien mortgage 32.6 5.75 33.8 5.75 34.8 5.60 35.9 5.50 37.2 5.32 Credit card 38.2 12.65 38.2 12.88 37.9 12.69 36.9 12.77 35.9 12.66 Automobile 45.2 5.23 44.8 5.19 45.5 5.16 47.0 5.20 48.6 5.18 Other revolving credit and installment 34.7 7.12 35.4 7.14 36.4 6.95 36.8 6.78 37.4 6.62
Total consumer loans 436.9 5.18 437.4 5.26 439.9 5.25 440.7 5.26 442.2 5.20 Total loans 947.5 4.80 950.0 4.84 946.3 4.79 939.5 4.72 944.1 4.64
Equity securities 35.2 2.70 33.1 2.56 37.4 2.79 37.9 2.98 37.3 2.38 Other 4.7 1.76 4.4 1.63 4.2 1.78 4.7 1.47 5.6 1.48
Total earning assets $ 1,742.0 3.94% $ 1,730.6 4.00% $ 1,732.9 3.93% $ 1,725.6 3.81% $ 1,735.3 3.73% Funding sources Deposits:
Interest-bearing checking $ 57.5 1.46% $ 56.3 1.42% $ 54.0 1.21% $ 51.2 1.01% $ 80.3 0.90% Market rate and other savings 690.7 0.59 688.6 0.50 689.6 0.43 693.9 0.35 676.7 0.26 Savings certificates 30.6 1.62 25.2 1.26 22.0 0.87 20.6 0.62 20.0 0.43 Other time deposits 96.9 2.61 97.8 2.67 92.6 2.46 87.8 2.35 82.1 2.26 Deposits in foreign offices 51.9 1.86 55.4 1.89 56.1 1.66 53.9 1.50 51.5 1.30
Total interest-bearing deposits 927.6 0.96 923.3 0.89 914.3 0.77 907.4 0.66 910.6 0.56 Short-term borrowings 114.8 2.26 108.6 2.23 106.0 2.04 105.5 1.74 103.8 1.54 Long-term debt 236.7 3.21 233.2 3.32 226.6 3.17 220.7 3.02 223.8 2.97 Other liabilities 24.3 2.18 25.3 2.28 27.4 2.41 27.0 2.40 28.2 2.12
Total interest-bearing liabilities 1,303.4 1.50 1,290.4 1.47 1,274.3 1.34 1,260.6 1.20 1,266.4 1.10 Portion of noninterest-bearing funding sources 438.6 — 440.2 — 458.6 — 465.0 — 468.9 —
Total funding sources $ 1,742.0 1.12 $ 1,730.6 1.09 $ 1,732.9 0.99 $ 1,725.6 0.87 $ 1,735.3 0.80 Net interest margin on a taxable-equivalent basis 2.82% 2.91% 2.94% 2.94% 2.93%
Noninterest-earning assets Cash and due from banks $ 19.5 19.6 19.3 18.4 18.6 Goodwill 26.4 26.4 26.4 26.4 26.4 Other 112.7 106.5 100.4 105.9 104.6
Total noninterest-earnings assets $ 158.6 152.5 146.1 150.7 149.6 Noninterest-bearing funding sources Deposits $ 341.4 338.8 354.6 359.0 360.7 Other liabilities 56.1 55.6 51.7 53.9 51.7 Total equity 199.7 198.3 198.4 202.8 206.1
Noninterest-bearing funding sources used to fund earning assets (438.6) (440.2) (458.6) (465.0) (468.9)
Net noninterest-bearing funding sources $ 158.6 152.5 146.1 150.7 149.6 Total assets $ 1,900.6 1,883.1 1,879.0 1,876.3 1,884.9
(1) Our average prime rate was 5.50% for the quarter ended June 30, 2019, 5.50% for the quarter ended March 31, 2019, 5.28% for the quarter ended December 31, 2018, 5.01% for the quarter ended September 30, 2018, and 4.80% for the quarter ended June 30, 2018. The average three-month London Interbank Offered Rate (LIBOR) was 2.51%, 2.69%, 2.62%, 2.34% and 2.34% for the same quarters, respectively.
(2) Yields/rates include the effects of hedge and risk management activities associated with the respective asset and liability categories. (3) Yields and rates are based on interest income/expense amounts for the period, annualized based on the accrual basis for the respective accounts. The average balance amounts represent
amortized cost for the periods presented.
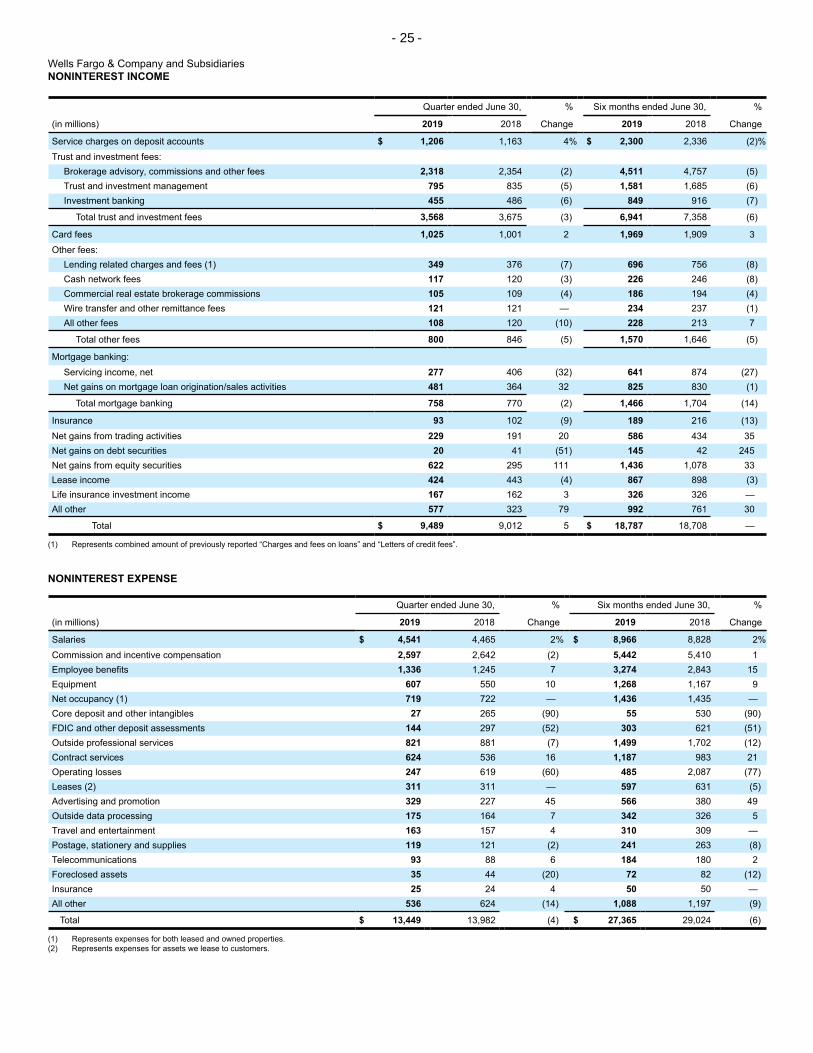
- 25 -
Wells Fargo & Company and Subsidiaries NONINTEREST INCOME
Quarter ended June 30, % Six months ended June 30, %
(in millions) 2019 2018 Change 2019 2018 Change
Service charges on deposit accounts $ 1,206 1,163 4% $ 2,300 2,336 (2)% Trust and investment fees:
Brokerage advisory, commissions and other fees 2,318 2,354 (2) 4,511 4,757 (5) Trust and investment management 795 835 (5) 1,581 1,685 (6) Investment banking 455 486 (6) 849 916 (7)
Total trust and investment fees 3,568 3,675 (3) 6,941 7,358 (6)
Card fees 1,025 1,001 2 1,969 1,909 3 Other fees:
Lending related charges and fees (1) 349 376 (7) 696 756 (8) Cash network fees 117 120 (3) 226 246 (8) Commercial real estate brokerage commissions 105 109 (4) 186 194 (4) Wire transfer and other remittance fees 121 121 — 234 237 (1) All other fees 108 120 (10) 228 213 7
Total other fees 800 846 (5) 1,570 1,646 (5)
Mortgage banking: Servicing income, net 277 406 (32) 641 874 (27) Net gains on mortgage loan origination/sales activities 481 364 32 825 830 (1)
Total mortgage banking 758 770 (2) 1,466 1,704 (14)
Insurance 93 102 (9) 189 216 (13) Net gains from trading activities 229 191 20 586 434 35 Net gains on debt securities 20 41 (51) 145 42 245 Net gains from equity securities 622 295 111 1,436 1,078 33 Lease income 424 443 (4) 867 898 (3) Life insurance investment income 167 162 3 326 326 — All other 577 323 79 992 761 30
Total $ 9,489 9,012 5 $ 18,787 18,708 —
(1) Represents combined amount of previously reported “Charges and fees on loans” and “Letters of credit fees”.
NONINTEREST EXPENSE
Quarter ended June 30, % Six months ended June 30, %
(in millions) 2019 2018 Change 2019 2018 Change
Salaries $ 4,541 4,465 2% $ 8,966 8,828 2% Commission and incentive compensation 2,597 2,642 (2) 5,442 5,410 1 Employee benefits 1,336 1,245 7 3,274 2,843 15 Equipment 607 550 10 1,268 1,167 9 Net occupancy (1) 719 722 — 1,436 1,435 — Core deposit and other intangibles 27 265 (90) 55 530 (90) FDIC and other deposit assessments 144 297 (52) 303 621 (51) Outside professional services 821 881 (7) 1,499 1,702 (12) Contract services 624 536 16 1,187 983 21 Operating losses 247 619 (60) 485 2,087 (77) Leases (2) 311 311 — 597 631 (5) Advertising and promotion 329 227 45 566 380 49 Outside data processing 175 164 7 342 326 5 Travel and entertainment 163 157 4 310 309 — Postage, stationery and supplies 119 121 (2) 241 263 (8) Telecommunications 93 88 6 184 180 2 Foreclosed assets 35 44 (20) 72 82 (12) Insurance 25 24 4 50 50 — All other 536 624 (14) 1,088 1,197 (9)
Total $ 13,449 13,982 (4) $ 27,365 29,024 (6)
(1) Represents expenses for both leased and owned properties. (2) Represents expenses for assets we lease to customers.

- 26 -
Wells Fargo & Company and Subsidiaries FIVE QUARTER NONINTEREST INCOME
Quarter ended
(in millions) Jun 30,
2019 Mar 31,
2019 Dec 31,
2018 Sep 30,
2018 Jun 30,
2018
Service charges on deposit accounts $ 1,206 1,094 1,176 1,204 1,163 Trust and investment fees:
Brokerage advisory, commissions and other fees 2,318 2,193 2,345 2,334 2,354 Trust and investment management 795 786 796 835 835 Investment banking 455 394 379 462 486
Total trust and investment fees 3,568 3,373 3,520 3,631 3,675
Card fees 1,025 944 981 1,017 1,001 Other fees:
Lending related charges and fees (1) 349 347 400 370 376 Cash network fees 117 109 114 121 120 Commercial real estate brokerage commissions 105 81 145 129 109 Wire transfer and other remittance fees 121 113 120 120 121 All other fees 108 120 109 110 120
Total other fees 800 770 888 850 846
Mortgage banking: Servicing income, net 277 364 109 390 406 Net gains on mortgage loan origination/sales activities 481 344 358 456 364
Total mortgage banking 758 708 467 846 770
Insurance 93 96 109 104 102 Net gains from trading activities 229 357 10 158 191 Net gains on debt securities 20 125 9 57 41 Net gains from equity securities 622 814 21 416 295 Lease income 424 443 402 453 443 Life insurance investment income 167 159 158 167 162 All other 577 415 595 466 323
Total $ 9,489 9,298 8,336 9,369 9,012
(1) Represents combined amount of previously reported “Charges and fees on loans” and “Letters of credit fees”.
FIVE QUARTER NONINTEREST EXPENSE
Quarter ended
(in millions) Jun 30,
2019 Mar 31,
2019 Dec 31,
2018 Sep 30,
2018 Jun 30,
2018
Salaries $ 4,541 4,425 4,545 4,461 4,465 Commission and incentive compensation 2,597 2,845 2,427 2,427 2,642 Employee benefits 1,336 1,938 706 1,377 1,245 Equipment 607 661 643 634 550 Net occupancy (1) 719 717 735 718 722 Core deposit and other intangibles 27 28 264 264 265 FDIC and other deposit assessments 144 159 153 336 297 Outside professional services 821 678 843 761 881 Contract services 624 563 616 593 536 Operating losses 247 238 432 605 619 Leases (2) 311 286 392 311 311 Advertising and promotion 329 237 254 223 227 Outside data processing 175 167 168 166 164 Travel and entertainment 163 147 168 141 157 Postage, stationery and supplies 119 122 132 120 121 Telecommunications 93 91 91 90 88 Foreclosed assets 35 37 47 59 44 Insurance 25 25 25 26 24 All other 536 552 698 451 624
Total $ 13,449 13,916 13,339 13,763 13,982
(1) Represents expenses for both leased and owned properties. (2) Represents expenses for assets we lease to customers.
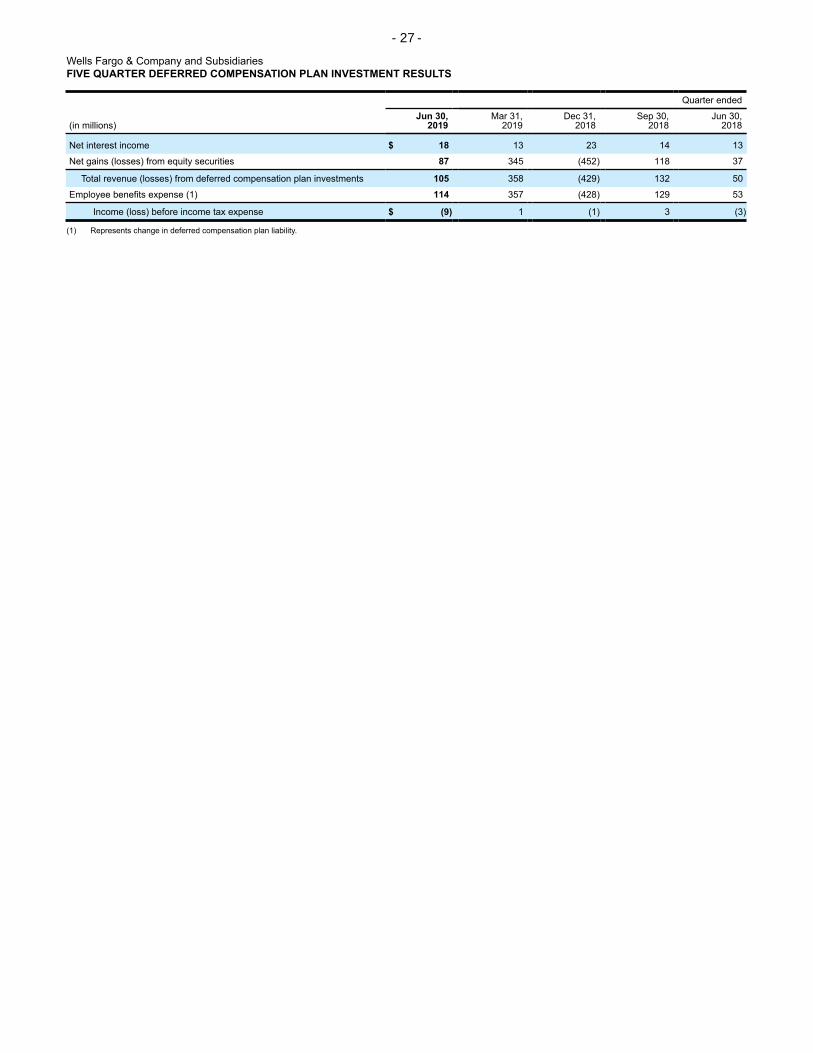
- 27 -
Wells Fargo & Company and Subsidiaries FIVE QUARTER DEFERRED COMPENSATION PLAN INVESTMENT RESULTS
Quarter ended
(in millions) Jun 30,
2019 Mar 31,
2019 Dec 31,
2018 Sep 30,
2018 Jun 30,
2018
Net interest income $ 18 13 23 14 13
Net gains (losses) from equity securities 87 345 (452) 118 37
Total revenue (losses) from deferred compensation plan investments 105 358 (429) 132 50
Employee benefits expense (1) 114 357 (428) 129 53
Income (loss) before income tax expense $ (9) 1 (1) 3 (3)
(1) Represents change in deferred compensation plan liability.
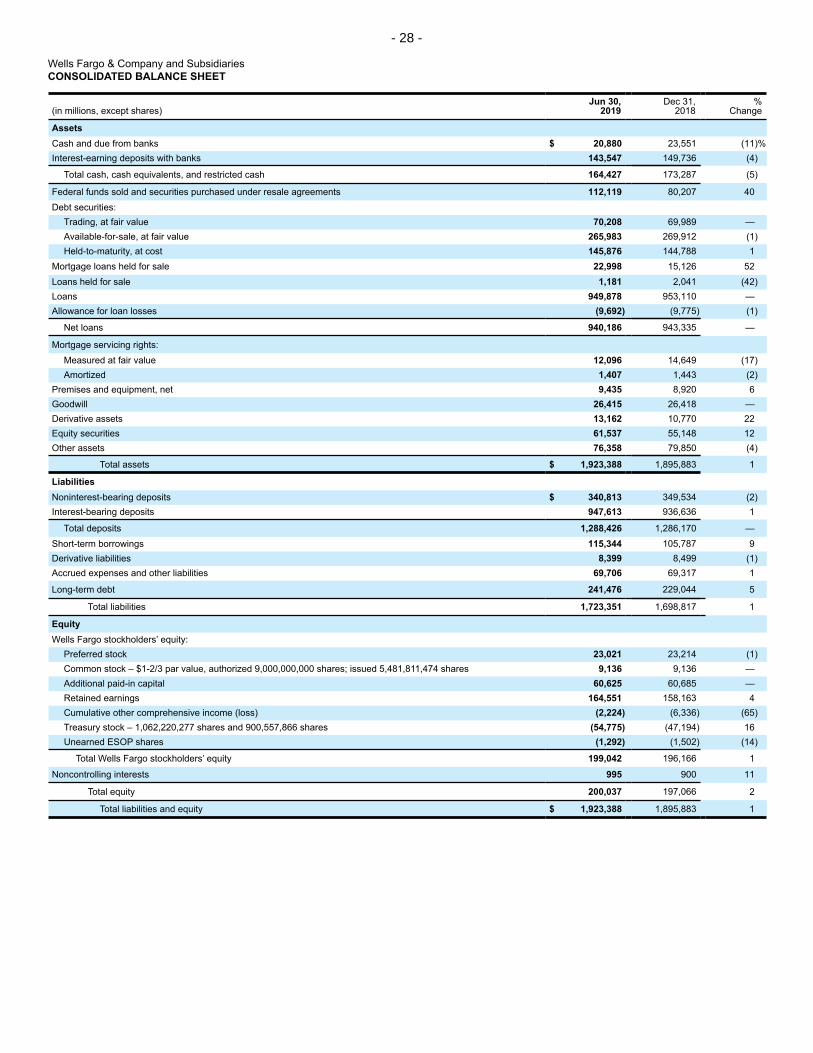
- 28 -
Wells Fargo & Company and Subsidiaries CONSOLIDATED BALANCE SHEET
(in millions, except shares) Jun 30,
2019 Dec 31,
2018 %
Change
Assets Cash and due from banks $ 20,880 23,551 (11)% Interest-earning deposits with banks 143,547 149,736 (4)
Total cash, cash equivalents, and restricted cash 164,427 173,287 (5)
Federal funds sold and securities purchased under resale agreements 112,119 80,207 40 Debt securities:
Trading, at fair value 70,208 69,989 — Available-for-sale, at fair value 265,983 269,912 (1) Held-to-maturity, at cost 145,876 144,788 1
Mortgage loans held for sale 22,998 15,126 52 Loans held for sale 1,181 2,041 (42) Loans 949,878 953,110 — Allowance for loan losses (9,692) (9,775) (1)
Net loans 940,186 943,335 —
Mortgage servicing rights: Measured at fair value 12,096 14,649 (17) Amortized 1,407 1,443 (2)
Premises and equipment, net 9,435 8,920 6 Goodwill 26,415 26,418 — Derivative assets 13,162 10,770 22 Equity securities 61,537 55,148 12 Other assets 76,358 79,850 (4)
Total assets $ 1,923,388 1,895,883 1
Liabilities Noninterest-bearing deposits $ 340,813 349,534 (2) Interest-bearing deposits 947,613 936,636 1
Total deposits 1,288,426 1,286,170 — Short-term borrowings 115,344 105,787 9 Derivative liabilities 8,399 8,499 (1) Accrued expenses and other liabilities 69,706 69,317 1
Long-term debt 241,476 229,044 5
Total liabilities 1,723,351 1,698,817 1
Equity Wells Fargo stockholders’ equity:
Preferred stock 23,021 23,214 (1) Common stock – $1-2/3 par value, authorized 9,000,000,000 shares; issued 5,481,811,474 shares 9,136 9,136 — Additional paid-in capital 60,625 60,685 — Retained earnings 164,551 158,163 4 Cumulative other comprehensive income (loss) (2,224) (6,336) (65) Treasury stock – 1,062,220,277 shares and 900,557,866 shares (54,775) (47,194) 16 Unearned ESOP shares (1,292) (1,502) (14)
Total Wells Fargo stockholders’ equity 199,042 196,166 1
Noncontrolling interests 995 900 11
Total equity 200,037 197,066 2
Total liabilities and equity $ 1,923,388 1,895,883 1
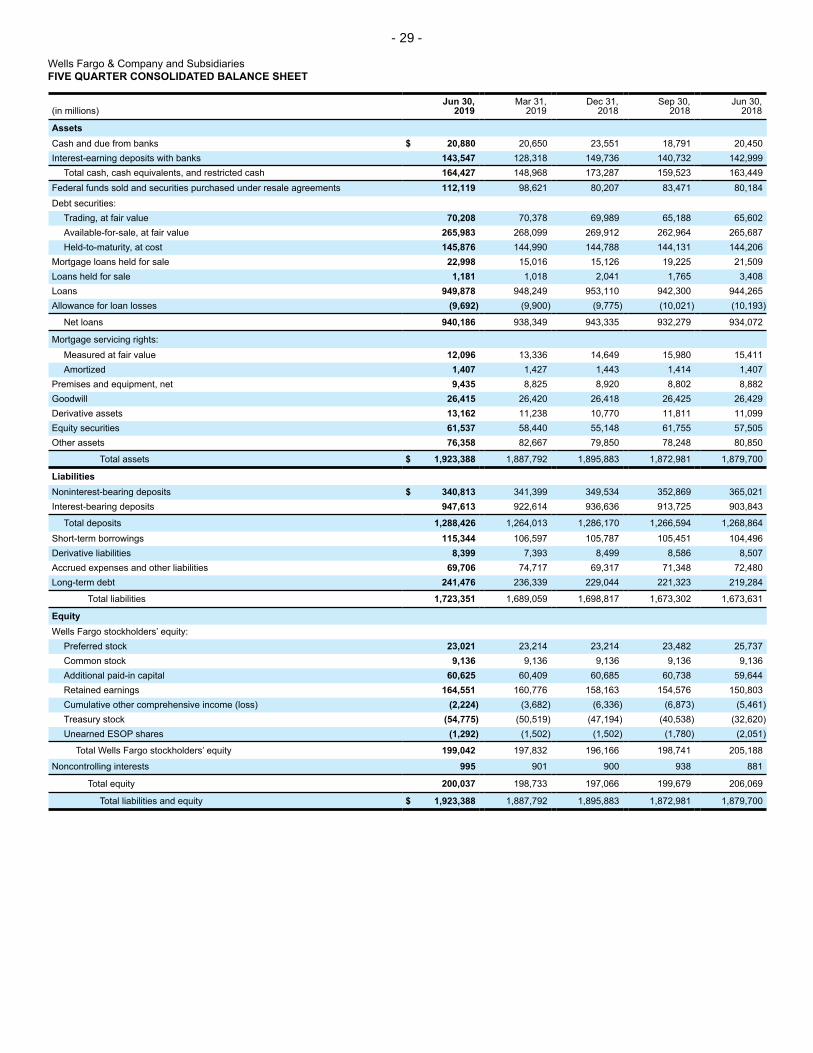
- 29 -
Wells Fargo & Company and Subsidiaries FIVE QUARTER CONSOLIDATED BALANCE SHEET
(in millions) Jun 30,
2019 Mar 31,
2019 Dec 31,
2018 Sep 30,
2018 Jun 30,
2018
Assets Cash and due from banks $ 20,880 20,650 23,551 18,791 20,450 Interest-earning deposits with banks 143,547 128,318 149,736 140,732 142,999
Total cash, cash equivalents, and restricted cash 164,427 148,968 173,287 159,523 163,449 Federal funds sold and securities purchased under resale agreements 112,119 98,621 80,207 83,471 80,184 Debt securities:
Trading, at fair value 70,208 70,378 69,989 65,188 65,602 Available-for-sale, at fair value 265,983 268,099 269,912 262,964 265,687 Held-to-maturity, at cost 145,876 144,990 144,788 144,131 144,206
Mortgage loans held for sale 22,998 15,016 15,126 19,225 21,509 Loans held for sale 1,181 1,018 2,041 1,765 3,408 Loans 949,878 948,249 953,110 942,300 944,265 Allowance for loan losses (9,692) (9,900) (9,775) (10,021) (10,193)
Net loans 940,186 938,349 943,335 932,279 934,072
Mortgage servicing rights: Measured at fair value 12,096 13,336 14,649 15,980 15,411 Amortized 1,407 1,427 1,443 1,414 1,407
Premises and equipment, net 9,435 8,825 8,920 8,802 8,882 Goodwill 26,415 26,420 26,418 26,425 26,429 Derivative assets 13,162 11,238 10,770 11,811 11,099 Equity securities 61,537 58,440 55,148 61,755 57,505 Other assets 76,358 82,667 79,850 78,248 80,850
Total assets $ 1,923,388 1,887,792 1,895,883 1,872,981 1,879,700
Liabilities Noninterest-bearing deposits $ 340,813 341,399 349,534 352,869 365,021 Interest-bearing deposits 947,613 922,614 936,636 913,725 903,843
Total deposits 1,288,426 1,264,013 1,286,170 1,266,594 1,268,864 Short-term borrowings 115,344 106,597 105,787 105,451 104,496 Derivative liabilities 8,399 7,393 8,499 8,586 8,507 Accrued expenses and other liabilities 69,706 74,717 69,317 71,348 72,480 Long-term debt 241,476 236,339 229,044 221,323 219,284
Total liabilities 1,723,351 1,689,059 1,698,817 1,673,302 1,673,631
Equity Wells Fargo stockholders’ equity:
Preferred stock 23,021 23,214 23,214 23,482 25,737 Common stock 9,136 9,136 9,136 9,136 9,136 Additional paid-in capital 60,625 60,409 60,685 60,738 59,644 Retained earnings 164,551 160,776 158,163 154,576 150,803 Cumulative other comprehensive income (loss) (2,224) (3,682) (6,336) (6,873) (5,461) Treasury stock (54,775) (50,519) (47,194) (40,538) (32,620) Unearned ESOP shares (1,292) (1,502) (1,502) (1,780) (2,051)
Total Wells Fargo stockholders’ equity 199,042 197,832 196,166 198,741 205,188
Noncontrolling interests 995 901 900 938 881
Total equity 200,037 198,733 197,066 199,679 206,069
Total liabilities and equity $ 1,923,388 1,887,792 1,895,883 1,872,981 1,879,700

- 30 -
Wells Fargo & Company and Subsidiaries FIVE QUARTER TRADING ASSETS AND LIABILITIES
(in millions) Jun 30,
2019 Mar 31,
2019 Dec 31,
2018 Sep 30,
2018 Jun 30,
2018
Trading assets Debt securities $ 70,208 70,378 69,989 65,188 65,602 Equity securities 23,327 20,933 19,449 26,138 22,978 Loans held for sale 1,118 998 1,469 1,266 1,350 Gross trading derivative assets 34,683 30,002 29,216 30,302 30,758
Netting (1) (22,827) (20,809) (19,807) (19,188) (20,687) Total trading derivative assets 11,856 9,193 9,409 11,114 10,071
Total trading assets 106,509 101,502 100,316 103,706 100,001
Trading liabilities Short sales 15,955 21,586 19,720 23,992 21,765 Gross trading derivative liabilities 33,458 28,994 28,717 29,268 29,847
Netting (1) (26,417) (22,810) (21,178) (21,842) (22,311)
Total trading derivative liabilities 7,041 6,184 7,539 7,426 7,536
Total trading liabilities $ 22,996 27,770 27,259 31,418 29,301
(1) Represents balance sheet netting for trading derivative asset and liability balances, and trading portfolio level counterparty valuation adjustments.
FIVE QUARTER DEBT SECURITIES
(in millions) Jun 30,
2019 Mar 31,
2019 Dec 31,
2018 Sep 30,
2018 Jun 30,
2018
Trading debt securities $ 70,208 70,378 69,989 65,188 65,602
Available-for-sale debt securities: Securities of U.S. Treasury and federal agencies 15,319 15,106 13,348 6,187 6,271 Securities of U.S. states and political subdivisions 45,095 49,700 49,264 48,216 47,559 Mortgage-backed securities:
Federal agencies 155,858 150,663 153,203 153,511 154,556 Residential and commercial 5,443 5,828 7,000 6,939 8,286
Total mortgage-backed securities 161,301 156,491 160,203 160,450 162,842 Other debt securities 44,268 46,802 47,097 48,111 49,015
Total available-for-sale debt securities 265,983 268,099 269,912 262,964 265,687
Held-to-maturity debt securities: Securities of U.S. Treasury and federal agencies 44,766 44,758 44,751 44,743 44,735 Securities of U.S. states and political subdivisions 7,948 6,163 6,286 6,293 6,300 Federal agency and other mortgage-backed securities (1) 93,105 94,009 93,685 93,020 93,016 Other debt securities 57 60 66 75 155
Total held-to-maturity debt securities 145,876 144,990 144,788 144,131 144,206
Total debt securities $ 482,067 483,467 484,689 472,283 475,495
(1) Predominantly consists of federal agency mortgage-backed securities.
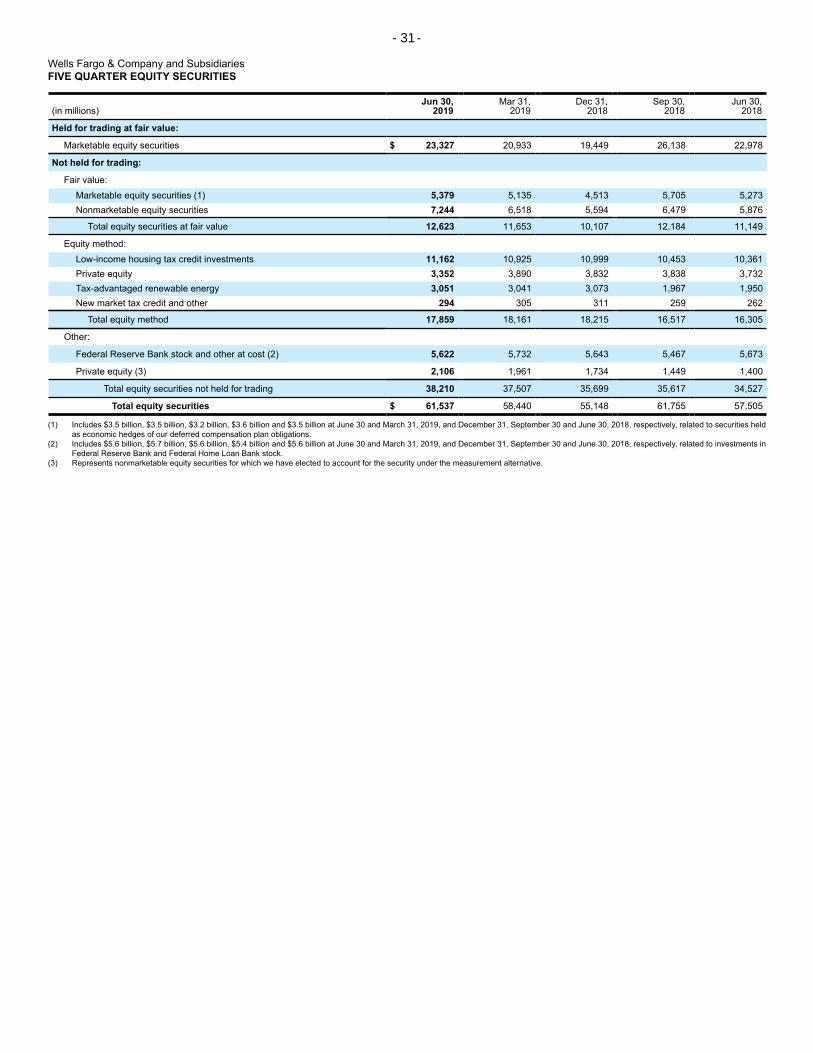
- 31 -
Wells Fargo & Company and Subsidiaries FIVE QUARTER EQUITY SECURITIES
Jun 30, Mar 31, Dec 31, Sep 30, Jun 30, (in millions) 2019 2019 2018 2018 2018
Held for trading at fair value:
Marketable equity securities $ 23,327 20,933 19,449 26,138 22,978
Not held for trading:
Fair value: Marketable equity securities (1) 5,379 5,135 4,513 5,705 5,273 Nonmarketable equity securities 7,244 6,518 5,594 6,479 5,876
Total equity securities at fair value 12,623 11,653 10,107 12,184 11,149
Equity method: Low-income housing tax credit investments 11,162 10,925 10,999 10,453 10,361 Private equity 3,352 3,890 3,832 3,838 3,732 Tax-advantaged renewable energy 3,051 3,041 3,073 1,967 1,950 New market tax credit and other 294 305 311 259 262
Total equity method 17,859 18,161 18,215 16,517 16,305
Other:
Federal Reserve Bank stock and other at cost (2) 5,622 5,732 5,643 5,467 5,673
Private equity (3) 2,106 1,961 1,734 1,449 1,400
Total equity securities not held for trading 38,210 37,507 35,699 35,617 34,527
Total equity securities $ 61,537 58,440 55,148 61,755 57,505
(1) Includes $3.5 billion, $3.5 billion, $3.2 billion, $3.6 billion and $3.5 billion at June 30 and March 31, 2019, and December 31, September 30 and June 30, 2018, respectively, related to securities held as economic hedges of our deferred compensation plan obligations.
(2) Includes $5.6 billion, $5.7 billion, $5.6 billion, $5.4 billion and $5.6 billion at June 30 and March 31, 2019, and December 31, September 30 and June 30, 2018, respectively, related to investments in Federal Reserve Bank and Federal Home Loan Bank stock.
(3) Represents nonmarketable equity securities for which we have elected to account for the security under the measurement alternative.

- 32 -
Wells Fargo & Company and Subsidiaries FIVE QUARTER LOANS
(in millions)
Commercial: Commercial and industrial Real estate mortgage Real estate construction Lease financing
$
Jun 30, 2019
348,846 123,008
21,067 19,324
Mar 31, 2019
349,134 122,113
21,857 19,122
Dec 31, 2018
350,199 121,014
22,496 19,696
Sep 30,2018
338,048 120,403 23,690 19,745
Jun 30, 2018
336,590 123,964 22,937 19,614
Total commercial 512,245 512,226 513,405 501,886 503,105
Consumer: Real estate 1-4 family first mortgage 286,427 284,545 285,065 284,273 283,001 Real estate 1-4 family junior lien mortgage 32,068 33,099 34,398 35,330 36,542 Credit card 38,820 38,279 39,025 37,812 36,684 Automobile 45,664 44,913 45,069 46,075 47,632 Other revolving credit and installment 34,654 35,187 36,148 36,924 37,301
Total consumer 437,633 436,023 439,705 440,414 441,160 Total loans (1) $ 949,878 948,249 953,110 942,300 944,265
(1) Includes $1.2 billion, $3.2 billion, $5.0 billion, $6.9 billion, and $9.0 billion of purchased credit-impaired (PCI) loans at June 30 and March 31, 2019, and December 31, September 30 and June 30, 2018, respectively.
Our foreign loans are reported by respective class of financing receivable in the table above. Substantially all of our foreign loan portfolio is commercial loans. Loans are classified as foreign primarily based on whether the borrower's primary address is outside of the United States. The following table presents total commercial foreign loans outstanding by class of financing receivable.
(in millions) Jun 30,
2019 Mar 31,
2019 Dec 31,
2018 Sep 30,
2018 Jun 30,
2018
Commercial foreign loans: Commercial and industrial Real estate mortgage Real estate construction Lease financing
$ 63,296 6,801 1,287 1,215
63,158 7,049 1,138 1,167
62,564 6,731 1,011 1,159
61,696 6,891
726 1,187
61,732 7,617
542 1,097
Total commercial foreign loans $ 72,599 72,512 71,465 70,500 70,988
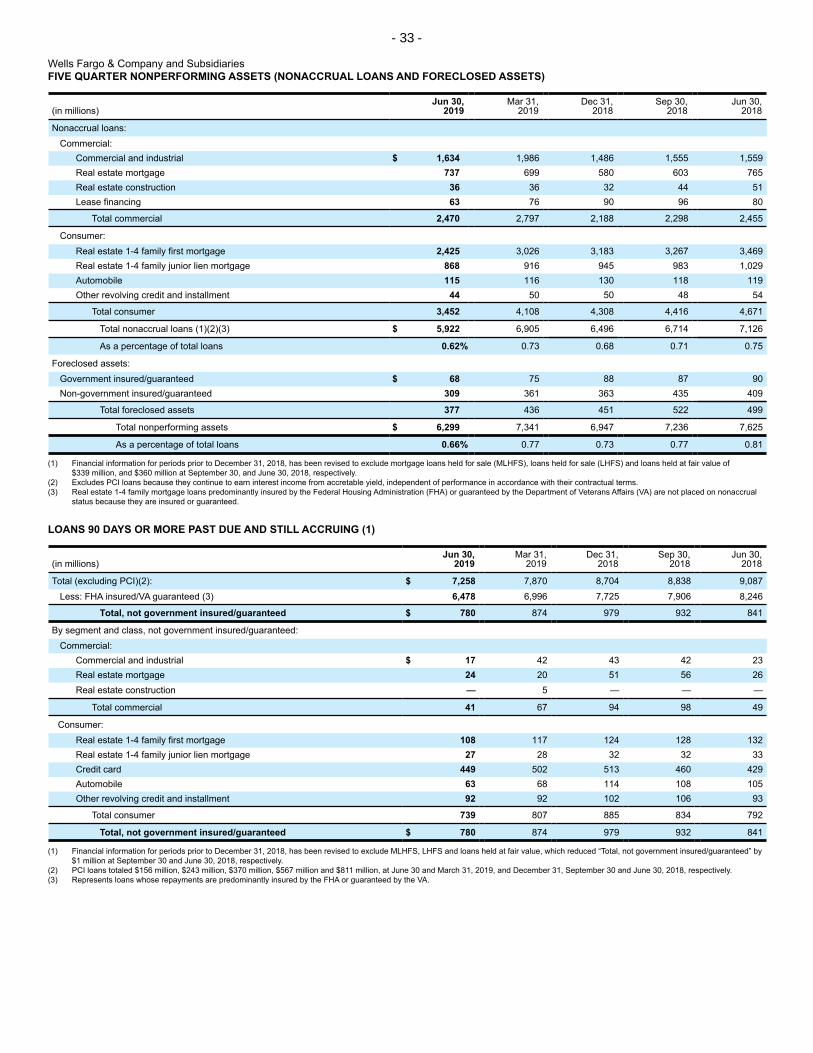
- 33 -
Wells Fargo & Company and Subsidiaries FIVE QUARTER NONPERFORMING ASSETS (NONACCRUAL LOANS AND FORECLOSED ASSETS)
(in millions) Jun 30,
2019 Mar 31,
2019 Dec 31,
2018 Sep 30,
2018 Jun 30,
2018
Nonaccrual loans: Commercial:
Commercial and industrial $ 1,634 1,986 1,486 1,555 1,559 Real estate mortgage 737 699 580 603 765 Real estate construction 36 36 32 44 51 Lease financing 63 76 90 96 80
Total commercial 2,470 2,797 2,188 2,298 2,455
Consumer: Real estate 1-4 family first mortgage 2,425 3,026 3,183 3,267 3,469 Real estate 1-4 family junior lien mortgage 868 916 945 983 1,029 Automobile 115 116 130 118 119 Other revolving credit and installment 44 50 50 48 54
Total consumer 3,452 4,108 4,308 4,416 4,671
Total nonaccrual loans (1)(2)(3) $ 5,922 6,905 6,496 6,714 7,126
As a percentage of total loans 0.62% 0.73 0.68 0.71 0.75
Foreclosed assets: Government insured/guaranteed $ 68 75 88 87 90 Non-government insured/guaranteed 309 361 363 435 409
Total foreclosed assets 377 436 451 522 499
Total nonperforming assets $ 6,299 7,341 6,947 7,236 7,625
As a percentage of total loans 0.66% 0.77 0.73 0.77 0.81
(1) Financial information for periods prior to December 31, 2018, has been revised to exclude mortgage loans held for sale (MLHFS), loans held for sale (LHFS) and loans held at fair value of $339 million, and $360 million at September 30, and June 30, 2018, respectively.
(2) Excludes PCI loans because they continue to earn interest income from accretable yield, independent of performance in accordance with their contractual terms. (3) Real estate 1-4 family mortgage loans predominantly insured by the Federal Housing Administration (FHA) or guaranteed by the Department of Veterans Affairs (VA) are not placed on nonaccrual
status because they are insured or guaranteed.
LOANS 90 DAYS OR MORE PAST DUE AND STILL ACCRUING (1)
Jun 30, Mar 31, Dec 31, Sep 30, Jun 30, (in millions) 2019 2019 2018 2018 2018
Total (excluding PCI)(2): $ 7,258 7,870 8,704 8,838 9,087 Less: FHA insured/VA guaranteed (3) 6,478 6,996 7,725 7,906 8,246
Total, not government insured/guaranteed $ 780 874 979 932
By segment and class, not government insured/guaranteed: Commercial:
Commercial and industrial $ 17 42 43 42 23 Real estate mortgage 24 20 51 56 26 Real estate construction — 5 — — —
Total commercial 41 67 94 98 49
Consumer: Real estate 1-4 family first mortgage 108 117 124 128 132 Real estate 1-4 family junior lien mortgage 27 28 32 32 33 Credit card 449 502 513 460 429 Automobile 63 68 114 108 105 Other revolving credit and installment 92 92 102 106 93
Total consumer 739 807 885 834 792
Total, not government insured/guaranteed $ 780 874 979 932
(1) Financial information for periods prior to December 31, 2018, has been revised to exclude MLHFS, LHFS and loans held at fair value, which reduced “Total, not government insured/guaranteed” by $1 million at September 30 and June 30, 2018, respectively.
(2) PCI loans totaled $156 million, $243 million, $370 million, $567 million and $811 million, at June 30 and March 31, 2019, and December 31, September 30 and June 30, 2018, respectively. (3) Represents loans whose repayments are predominantly insured by the FHA or guaranteed by the VA.
841
841
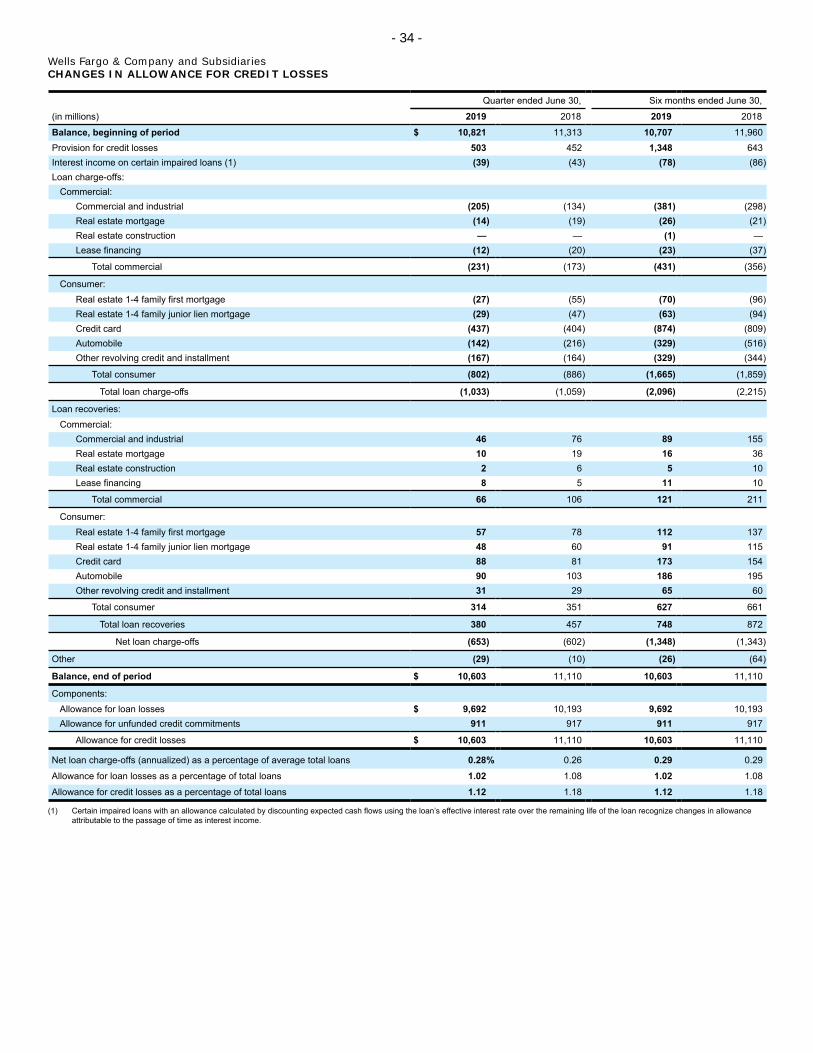
- 34 -
Wells Fargo & Company and Subsidiaries CHANGES IN ALLOWANCE FOR CREDIT LOSSES
Quarter ended June 30, Six months ended June 30,
(in millions) 2019 2018 2019 2018
Balance, beginning of period $ 10,821 11,313 10,707 11,960 Provision for credit losses 503 452 1,348 643 Interest income on certain impaired loans (1) (39) (43) (78) (86) Loan charge-offs:
Commercial: Commercial and industrial (205) (134) (381) (298) Real estate mortgage (14) (19) (26) (21) Real estate construction — — (1) — Lease financing (12) (20) (23) (37)
Total commercial (231) (173) (431) (356)
Consumer: Real estate 1-4 family first mortgage (27) (55) (70) (96) Real estate 1-4 family junior lien mortgage (29) (47) (63) (94) Credit card (437) (404) (874) (809) Automobile (142) (216) (329) (516) Other revolving credit and installment (167) (164) (329) (344)
Total consumer (802) (886) (1,665) (1,859)
Total loan charge-offs (1,033) (1,059) (2,096) (2,215)
Loan recoveries: Commercial:
Commercial and industrial 46 76 89 155 Real estate mortgage 10 19 16 36 Real estate construction 2 6 5 10 Lease financing 8 5 11 10
Total commercial 66 106 121 211
Consumer: Real estate 1-4 family first mortgage 57 78 112 137 Real estate 1-4 family junior lien mortgage 48 60 91 115 Credit card 88 81 173 154 Automobile 90 103 186 195 Other revolving credit and installment 31 29 65 60
Total consumer 314 351 627 661
Total loan recoveries 380 457 748 872
Net loan charge-offs (653) (602) (1,348) (1,343)
Other (29) (10) (26) (64)
Balance, end of period $ 10,603 11,110 10,603 11,110
Components: Allowance for loan losses $ 9,692 10,193 9,692 10,193 Allowance for unfunded credit commitments 911 917 911 917
Allowance for credit losses $ 10,603 11,110 10,603 11,110
Net loan charge-offs (annualized) as a percentage of average total loans 0.28% 0.26 0.29 0.29
Allowance for loan losses as a percentage of total loans 1.02 1.08 1.02 1.08
Allowance for credit losses as a percentage of total loans 1.12 1.18 1.12 1.18
(1) Certain impaired loans with an allowance calculated by discounting expected cash flows using the loan’s effective interest rate over the remaining life of the loan recognize changes in allowance attributable to the passage of time as interest income.

- 35 -
Wells Fargo & Company and Subsidiaries FIVE QUARTER CHANGES IN ALLOWANCE FOR CREDIT LOSSES
Quarter ended
Jun 30, Mar 31, Dec 31, Sep 30, Jun 30, (in millions) 2019 2019 2018 2018 2018
Balance, beginning of quarter $ 10,821 10,707 10,956 11,110 11,313 Provision for credit losses 503 845 521 580 452 Interest income on certain impaired loans (1) (39) (39) (38) (42) (43) Loan charge-offs:
Commercial: Commercial and industrial (205) (176) (220) (209) (134) Real estate mortgage (14) (12) (12) (9) (19) Real estate construction — (1) — — — Lease financing (12) (11) (18) (15) (20)
Total commercial (231) (200) (250) (233) (173)
Consumer: Real estate 1-4 family first mortgage (27) (43) (38) (45) (55) Real estate 1-4 family junior lien mortgage (29) (34) (38) (47) (47) Credit card (437) (437) (414) (376) (404) Automobile (142) (187) (217) (214) (216) Other revolving credit and installment (167) (162) (180) (161) (164)
Total consumer (802) (863) (887) (843) (886)
Total loan charge-offs (1,033) (1,063) (1,137) (1,076) (1,059)
Loan recoveries: Commercial:
Commercial and industrial 46 43 88 61 76 Real estate mortgage 10 6 24 10 19 Real estate construction 2 3 1 2 6 Lease financing 8 3 5 8 5
Total commercial 66 55 118 81 106
Consumer: Real estate 1-4 family first mortgage 57 55 60 70 78 Real estate 1-4 family junior lien mortgage 48 43 48 56 60 Credit card 88 85 76 77 81 Automobile 90 96 84 84 103 Other revolving credit and installment 31 34 30 28 29
Total consumer 314 313 298 315 351
Total loan recoveries 380 368 416 396 457
Net loan charge-offs (653) (695) (721) (680) (602)
Other (29) 3 (11) (12) (10)
Balance, end of quarter $ 10,603 10,821 10,707 10,956 11,110
Components: Allowance for loan losses $ 9,692 9,900 9,775 10,021 10,193 Allowance for unfunded credit commitments 911 921 932 935 917
Allowance for credit losses $ 10,603 10,821 10,707 10,956 11,110
Net loan charge-offs (annualized) as a percentage of average total loans 0.28% 0.30 0.30 0.29 0.26 Allowance for loan losses as a percentage of:
Total loans 1.02 1.04 1.03 1.06 1.08 Nonaccrual loans 164 143 150 149 143 Nonaccrual loans and other nonperforming assets 154 135 141 138 134
Allowance for credit losses as a percentage of: Total loans 1.12 1.14 1.12 1.16 1.18 Nonaccrual loans 179 157 165 163 156 Nonaccrual loans and other nonperforming assets 168 147 154 151 146
(1) Certain impaired loans with an allowance calculated by discounting expected cash flows using the loan’s effective interest rate over the remaining life of the loan recognize changes in allowance attributable to the passage of time as interest income.

- 36 -
Wells Fargo & Company and Subsidiaries TANGIBLE COMMON EQUITY (1)
Jun 30, Mar 31, Dec 31, Sep 30, Jun 30, (in millions, except ratios) 2019 2019 2018 2018 2018
Tangible book value per common share (1): Total equity $ 200,037 198,733 197,066 199,679 206,069 Adjustments:
Preferred stock (23,021) (23,214) (23,214) (23,482) (25,737) Additional paid-in capital on ESOP
preferred stock (78) (95) (95) (105) (116) Unearned ESOP shares 1,292 1,502 1,502 1,780 2,051 Noncontrolling interests (995) (901) (900) (938) (881)
Total common stockholders' equity (A) 177,235 176,025 174,359 176,934 181,386 Adjustments:
Goodwill (26,415) (26,420) (26,418) (26,425) (26,429) Certain identifiable intangible assets
(other than MSRs) (493) (522) (559) (826) (1,091) Other assets (2) (2,251) (2,131) (2,187) (2,121) (2,160) Applicable deferred taxes (3) 788 771 785 829 874
Tangible common equity (B) $ 148,864 147,723 145,980 148,391 152,580
Common shares outstanding (C) 4,419.6 4,511.9 4,581.3 4,711.6 4,849.1 Book value per common share (A)/(C) $ 40.10 39.01 38.06 37.55 37.41
Tangible book value per common share (B)/(C) 33.68 32.74 31.86 31.49 31.47
Quarter ended Six months ended
Jun 30, Mar 31, Dec 31, Sep 30, Jun 30, Jun 30, Jun 30, (in millions, except ratios) 2019 2019 2018 2018 2018 2019 2018
Return on average tangible common equity (1): Net income applicable to common stock (A) $ 5,848 5,507 5,711 5,453 4,792 11,355 9,525 Average total equity 199,685 198,349 198,442 202,826 206,067 199,021 206,123 Adjustments:
Preferred stock (23,023) (23,214) (23,463) (24,219) (26,021) (23,118) (26,089) Additional paid-in capital on ESOP preferred stock (78) (95) (105) (115) (129) (87) (141) Unearned ESOP shares 1,294 1,502 1,761 2,026 2,348 1,397 2,428 Noncontrolling interests (939) (899) (910) (892) (919) (919) (958)
Average common stockholders’ equity (B) 176,939 175,643 175,725 179,626 181,346 176,294 181,363 Adjustments:
Goodwill (26,415) (26,420) (26,423) (26,429) (26,444) (26,417) (26,480) Certain identifiable intangible assets (other than
MSRs) (505) (543) (693) (958) (1,223) (524) (1,355) Other assets (2) (2,155) (2,159) (2,204) (2,083) (2,271) (2,157) (2,252) Applicable deferred taxes (3) 780 784 800 845 889 782 911
Average tangible common equity (C) $ 148,644 147,305 147,205 151,001 152,297 147,978 152,187
Return on average common stockholders' equity (ROE)(annualized) (A)/(B) 13.26 12.71 12.89 12.04 10.60 12.99 10.59
Return on average tangible common equity (ROTCE)(annualized) (A)/(C) 15.78 15.16 15.39 14.33 12.62 15.47 12.62
(1) Tangible common equity is a non-GAAP financial measure and represents total equity less preferred equity, noncontrolling interests, and goodwill and certain identifiable intangible assets (including goodwill and intangible assets associated with certain of our nonmarketable equity securities but excluding mortgage servicing rights), net of applicable deferred taxes. The methodology of determining tangible common equity may differ among companies. Management believes that return on average tangible common equity and tangible book value per common share, which utilize tangible common equity, are useful financial measures because they enable investors and others to assess the Company's use of equity.
(2) Represents goodwill and other intangibles on nonmarketable equity securities, which are included in other assets. (3) Applicable deferred taxes relate to goodwill and other intangible assets. They were determined by applying the combined federal statutory rate and composite state income tax rates to the
difference between book and tax basis of the respective goodwill and intangible assets at period end.
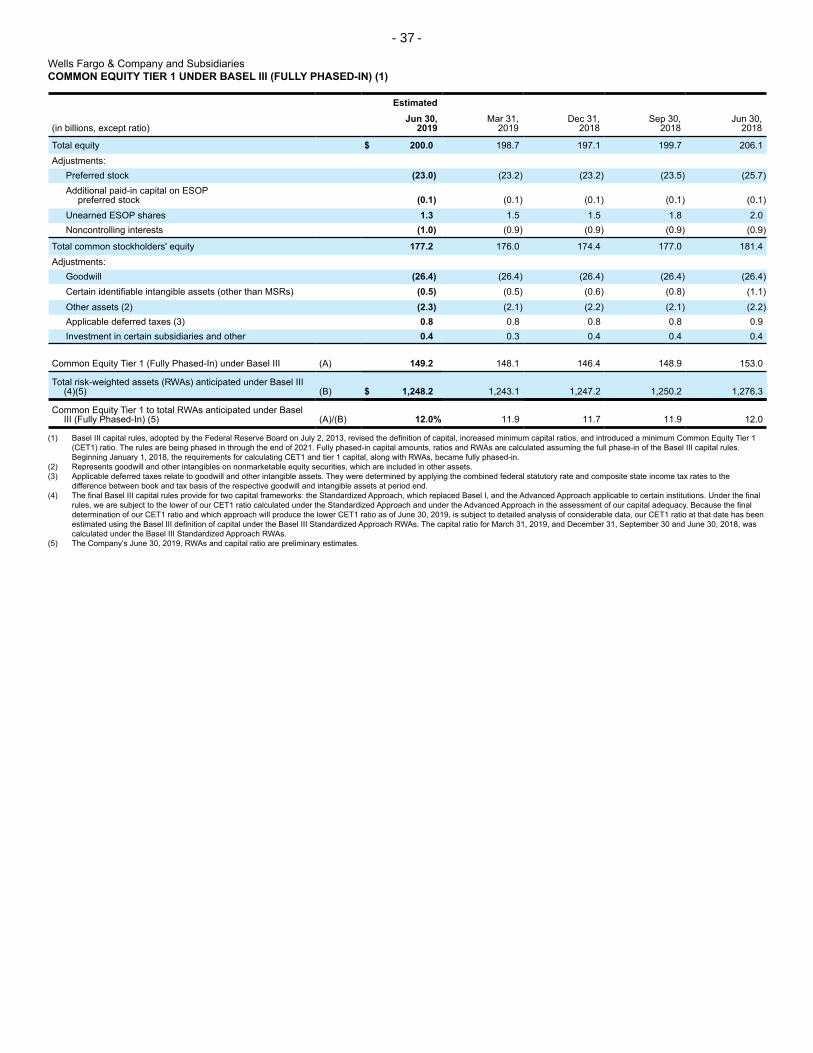
- 37 -
Wells Fargo & Company and Subsidiaries COMMON EQUITY TIER 1 UNDER BASEL III (FULLY PHASED-IN) (1)
Estimated Jun 30, Mar 31, Dec 31, Sep 30, Jun 30,
(in billions, except ratio) 2019 2019 2018 2018 2018
Total equity $ 200.0 198.7 197.1 199.7 206.1 Adjustments:
Preferred stock (23.0) (23.2) (23.2) (23.5) (25.7) Additional paid-in capital on ESOP
preferred stock (0.1) (0.1) (0.1) (0.1) (0.1) Unearned ESOP shares 1.3 1.5 1.5 1.8 2.0 Noncontrolling interests (1.0) (0.9) (0.9) (0.9) (0.9)
Total common stockholders' equity 177.2 176.0 174.4 177.0 181.4 Adjustments:
Goodwill (26.4) (26.4) (26.4) (26.4) (26.4) Certain identifiable intangible assets (other than MSRs) (0.5) (0.5) (0.6) (0.8) (1.1) Other assets (2) (2.3) (2.1) (2.2) (2.1) (2.2) Applicable deferred taxes (3) 0.8 0.8 0.8 0.8 0.9 Investment in certain subsidiaries and other 0.4 0.3 0.4 0.4 0.4
Common Equity Tier 1 (Fully Phased-In) under Basel III (A) 149.2 148.1 146.4 148.9
Total risk-weighted assets (RWAs) anticipated under Basel III(4)(5) (B) $ 1,248.2 1,243.1 1,247.2 1,250.2 1,276.3
Common Equity Tier 1 to total RWAs anticipated under BaselIII (Fully Phased-In) (5) (A)/(B) 12.0% 11.9 11.7 11.9
(1) Basel III capital rules, adopted by the Federal Reserve Board on July 2, 2013, revised the definition of capital, increased minimum capital ratios, and introduced a minimum Common Equity Tier 1 (CET1) ratio. The rules are being phased in through the end of 2021. Fully phased-in capital amounts, ratios and RWAs are calculated assuming the full phase-in of the Basel III capital rules. Beginning January 1, 2018, the requirements for calculating CET1 and tier 1 capital, along with RWAs, became fully phased-in.
(2) Represents goodwill and other intangibles on nonmarketable equity securities, which are included in other assets. (3) Applicable deferred taxes relate to goodwill and other intangible assets. They were determined by applying the combined federal statutory rate and composite state income tax rates to the
difference between book and tax basis of the respective goodwill and intangible assets at period end. (4) The final Basel III capital rules provide for two capital frameworks: the Standardized Approach, which replaced Basel I, and the Advanced Approach applicable to certain institutions. Under the final
rules, we are subject to the lower of our CET1 ratio calculated under the Standardized Approach and under the Advanced Approach in the assessment of our capital adequacy. Because the final determination of our CET1 ratio and which approach will produce the lower CET1 ratio as of June 30, 2019, is subject to detailed analysis of considerable data, our CET1 ratio at that date has been estimated using the Basel III definition of capital under the Basel III Standardized Approach RWAs. The capital ratio for March 31, 2019, and December 31, September 30 and June 30, 2018, was calculated under the Basel III Standardized Approach RWAs.
(5) The Company’s June 30, 2019, RWAs and capital ratio are preliminary estimates.
153.0
12.0

- 38 -
Wells Fargo & Company and Subsidiaries OPERATING SEGMENT RESULTS (1)
Wealth and Community Wholesale Investment Consolidated
Banking Banking Management Other (2) Company(income/expense in millions,average balances in billions) 2019 2018 2019 2018 2019 2018 2019 2018 2019 2018
Quarter ended June 30, Net interest income (3) $ 7,066 7,346 4,535 4,693 1,037 1,111 (543) (609) 12,095 12,541 Provision (reversal of provision) for
credit losses 479 484 28 (36) (1) (2) (3) 6 503 452 Noninterest income 4,739 4,460 2,530 2,504 3,013 2,840 (793) (792) 9,489 9,012 Noninterest expense 7,212 7,290 3,882 4,219 3,246 3,361 (891) (888) 13,449 13,982
Income (loss) before income taxexpense (benefit) 4,114 4,032 3,155 3,014 805 592 (442) (519) 7,632 7,119
Income tax expense (benefit) 838 1,413 365 379 201 147 (110) (129) 1,294 1,810
Net income (loss) before noncontrollinginterests 3,276 2,619 2,790 2,635 604 445 (332) (390) 6,338 5,309
Less: Net income from noncontrollinginterests 129 123 1 — 2 — — — 132
Net income (loss) $ 3,147 2,496 2,789 2,635 602 445 (332) (390) 6,206 5,186
Average loans $ 457.7 463.8 474.0 464.7 75.0 74.7 (59.2) (59.1) 947.5 944.1 Average assets 1,024.8 1,034.3 852.2 826.4 83.8 84.0 (60.2) (59.8) 1,900.6 1,884.9 Average deposits 777.6 760.6 410.4 414.0 143.5 167.1 (62.5) (70.4) 1,269.0 1,271.3
Six months ended June 30, Net interest income (3) $ 14,314 14,541 9,069 9,225 2,138 2,223 (1,115) (1,210) 24,406 24,779 Provision (reversal of provision) for
credit losses 1,189 702 162 (56) 3 (8) (6) 5 1,348 Noninterest income 9,241 9,095 5,107 5,251 5,991 5,970 (1,552) (1,608) 18,787 18,708 Noninterest expense 14,901 15,992 7,720 8,197 6,549 6,651 (1,805) (1,816) 27,365 29,024
Income (loss) before income taxexpense (benefit) 7,465 6,942 6,294 6,335 1,577 1,550 (856) (1,007) 14,480 13,820
Income tax expense (benefit) 1,262 2,222 734 827 393 386 (214) (251) 2,175 3,184
Net income (loss) before noncontrollinginterests 6,203 4,720 5,560 5,508 1,184 1,164 (642) (756) 12,305 10,636
Less: Net income (loss) fromnoncontrolling interests 233 311 1 (2) 5 5 — — 239
Net income (loss) $ 5,970 4,409 5,559 5,510 1,179 1,159 (642) (756) 12,066 10,322
Average loans $ 457.9 467.1 475.2 464.9 74.7 74.3 (59.1) (58.8) 948.7 947.5 Average assets 1,020.1 1,048.0 848.4 827.8 83.5 84.1 (60.1) (59.6) 1,891.9 1,900.3 Average deposits 771.6 754.1 410.1 429.9 148.3 172.5 (64.5) (72.3) 1,265.5 1,284.2
(1) The management accounting process measures the performance of the operating segments based on our management structure and is not necessarily comparable with other similar information for other financial services companies. We define our operating segments by product type and customer segment.
(2) Includes the elimination of certain items that are included in more than one business segment, substantially all of which represents products and services for Wealth and Investment Management customers served through Community Banking distribution channels.
(3) Net interest income is the difference between interest earned on assets and the cost of liabilities to fund those assets. Interest earned includes actual interest earned on segment assets as well as interest credits for any funding of a segment available to be provided to other segments. The cost of liabilities includes actual interest expense on segment liabilities as well as funding charges for any funding provided from other segments.
123
643
314

- 39 -
Wells Fargo & Company and Subsidiaries FIVE QUARTER OPERATING SEGMENT RESULTS (1)
Quarter ended
Jun 30, Mar 31, Dec 31, Sep 30, Jun 30,(income/expense in millions, average balances in billions) 2019 2019 2018 2018 2018
COMMUNITY BANKING Net interest income (2) $ 7,066 7,248 7,340 7,338 7,346 Provision for credit losses 479 710 534 547 484 Noninterest income 4,739 4,502 4,121 4,478 4,460 Noninterest expense 7,212 7,689 7,032 7,467 7,290 Income before income tax expense 4,114 3,351 3,895 3,802 4,032 Income tax expense 838 424 637 925 1,413 Net income before noncontrolling interests 3,276 2,927 3,258 2,877 2,619 Less: Net income from noncontrolling interests 129 104 89 61 123 Segment net income $ 3,147 2,823 3,169 2,816 2,496 Average loans $ 457.7 458.2 459.7 460.9 463.8 Average assets 1,024.8 1,015.4 1,015.9 1,024.9 1,034.3 Average deposits 777.6 765.6 759.4 760.9 760.6
WHOLESALE BANKING Net interest income (2) $ 4,535 4,534 4,739 4,726 4,693 Provision (reversal of provision) for credit losses 28 134 (28) 26 (36) Noninterest income 2,530 2,577 2,187 2,578 2,504 Noninterest expense 3,882 3,838 4,025 3,935 4,219 Income before income tax expense 3,155 3,139 2,929 3,343 3,014 Income tax expense 365 369 253 475 379 Net income before noncontrolling interests 2,790 2,770 2,676 2,868 2,635 Less: Net income from noncontrolling interests 1 — 5 17 — Segment net income $ 2,789 2,770 2,671 2,851 2,635 Average loans $ 474.0 476.4 470.2 462.8 464.7 Average assets 852.2 844.5 839.1 827.2 826.4 Average deposits 410.4 409.8 421.6 413.6 414.0
WEALTH AND INVESTMENT MANAGEMENT Net interest income (2) $ 1,037 1,101 1,116 1,102 1,111 Provision (reversal of provision) for credit losses (1) 4 (3) 6 (2) Noninterest income 3,013 2,978 2,841 3,124 2,840 Noninterest expense 3,246 3,303 3,044 3,243 3,361 Income before income tax expense 805 772 916 977 592 Income tax expense 201 192 231 244 147 Net income before noncontrolling interests 604 580 685 733 445 Less: Net income (loss) from noncontrolling interests 2 3 (4) 1 — Segment net income $ 602 577 689 732 445 Average loans $ 75.0 74.4 75.2 74.6 74.7 Average assets 83.8 83.2 83.6 83.8 84.0 Average deposits 143.5 153.2 155.5 159.8 167.1
OTHER (3) Net interest income (2) $ (543) (572) (551) (594) (609) Provision (reversal of provision) for credit losses (3) (3) 18 1 6 Noninterest income (793) (759) (813) (811) (792) Noninterest expense (891) (914) (762) (882) (888) Loss before income tax benefit (442) (414) (620) (524) (519) Income tax benefit (110) (104) (155) (132) (129) Net loss before noncontrolling interests (332) (310) (465) (392) (390) Less: Net income from noncontrolling interests — — — — — Other net loss $ (332) (310) (465) (392) (390) Average loans $ (59.2) (59.0) (58.8) (58.8) (59.1) Average assets (60.2) (60.0) (59.6) (59.6) (59.8) Average deposits (62.5) (66.5) (67.6) (67.9) (70.4)
CONSOLIDATED COMPANY Net interest income (2) $ 12,095 12,311 12,644 12,572 12,541 Provision for credit losses 503 845 521 580 452 Noninterest income 9,489 9,298 8,336 9,369 9,012 Noninterest expense 13,449 13,916 13,339 13,763 13,982 Income before income tax expense 7,632 6,848 7,120 7,598 7,119 Income tax expense 1,294 881 966 1,512 1,810 Net income before noncontrolling interests 6,338 5,967 6,154 6,086 5,309 Less: Net income from noncontrolling interests 132 107 90 79 123 Wells Fargo net income $ 6,206 5,860 6,064 6,007 5,186 Average loans $ 947.5 950.0 946.3 939.5 944.1 Average assets 1,900.6 1,883.1 1,879.0 1,876.3 1,884.9 Average deposits 1,269.0 1,262.1 1,268.9 1,266.4 1,271.3
(1) The management accounting process measures the performance of the operating segments based on our management structure and is not necessarily comparable with other similar information for other financial services companies. We define our operating segments by product type and customer segment.
(2) Net interest income is the difference between interest earned on assets and the cost of liabilities to fund those assets. Interest earned includes actual interest earned on segment assets as well as interest credits for any funding of a segment available to be provided to other segments. The cost of liabilities includes actual interest expense on segment liabilities as well as funding charges for any funding provided from other segments.
(3) Includes the elimination of certain items that are included in more than one business segment, most of which represents products and services for Wealth and Investment Management customers served through Community Banking distribution channels.

- 40 -
Wells Fargo & Company and Subsidiaries FIVE QUARTER CONSOLIDATED MORTGAGE SERVICING
Quarter ended
Jun 30, Mar 31, Dec 31, Sep 30, Jun 30, (in millions) 2019 2019 2018 2018 2018
MSRs measured using the fair value method: Fair value, beginning of quarter $ 13,336 14,649 15,980 15,411 15,041
Servicing from securitizations or asset transfers (1) 400 341 449 502 486 Sales and other (2) (1) (281) (64) (2) (1)
Net additions 399 60 385 500 485
Changes in fair value:
Due to changes in valuation model inputs or assumptions: Mortgage interest rates (3) (1,153) (940) (874) 582 376 Servicing and foreclosure costs (4) (22) 12 763 (9) 30 Discount rates (5) (109) 100 (821) (9) — Prepayment estimates and other (6) 206 (63) (314) (33) (61)
Net changes in valuation model inputs or assumptions (1,078) (891) (1,246) 531 345
Changes due to collection/realization of expected cash flows over time (561) (482) (470) (462) (460)
Total changes in fair value (1,639) (1,373) (1,716) 69 (115)
Fair value, end of quarter $ 12,096 13,336 14,649 15,980 15,411
(1) Includes impacts associated with exercising our right to repurchase delinquent loans from Government National Mortgage Association (GNMA) loan securitization pools. Total reported MSRs may increase upon repurchase due to servicing liabilities associated with these loans.
(2) Includes sales and transfers of MSRs, which can result in an increase of total reported MSRs if the sales or transfers are related to nonperforming loan portfolios or portfolios with servicing liabilities. (3) Includes prepayment speed changes as well as other valuation changes due to changes in mortgage interest rates (such as changes in estimated interest earned on custodial deposit balances). (4) Includes costs to service and unreimbursed foreclosure costs. (5) Reflects discount rate assumption change, excluding portion attributable to changes in mortgage interest rates. (6) Represents changes driven by other valuation model inputs or assumptions including prepayment speed estimation changes and other assumption updates. Prepayment speed estimation changes
are influenced by observed changes in borrower behavior and other external factors that occur independent of interest rate changes.
Quarter ended
Jun 30, Mar 31, Dec 31, Sep 30, Jun 30, (in millions) 2019 2019 2018 2018 2018
Amortized MSRs: Balance, beginning of quarter $ 1,427 1,443 1,414 1,407 1,411
Purchases 16 24 45 42 22 Servicing from securitizations or asset transfers 33 26 52 33 39 Amortization (69) (66) (68) (68) (65)
Balance, end of quarter $ 1,407 1,427 1,443 1,414 1,407
Fair value of amortized MSRs: Beginning of quarter $ 2,149 2,288 2,389 2,309 2,307 End of quarter 1,897 2,149 2,288 2,389 2,309
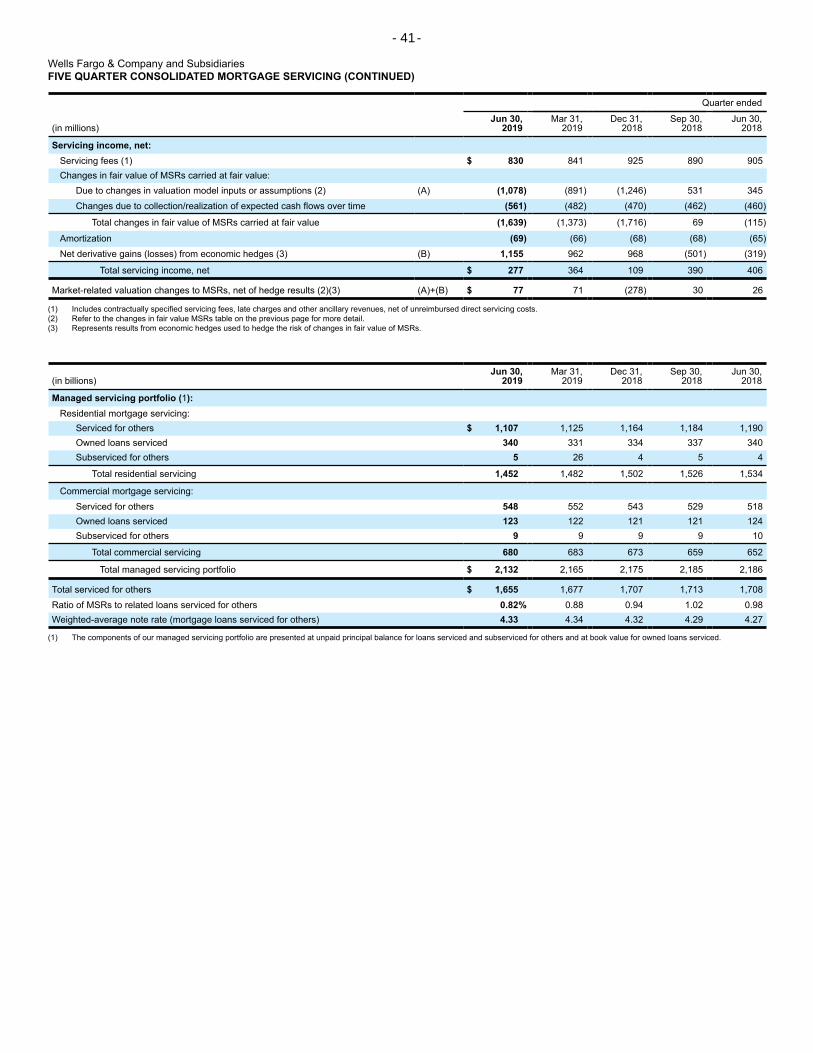
- 41 -
Wells Fargo & Company and Subsidiaries FIVE QUARTER CONSOLIDATED MORTGAGE SERVICING (CONTINUED)
Quarter ended
Jun 30, Mar 31, Dec 31, Sep 30, Jun 30, (in millions) 2019 2019 2018 2018 2018
Servicing income, net: Servicing fees (1) $ 830 841 925 890 905 Changes in fair value of MSRs carried at fair value:
Due to changes in valuation model inputs or assumptions (2) (A) (1,078) (891) (1,246) 531 345 Changes due to collection/realization of expected cash flows over time (561) (482) (470) (462) (460)
Total changes in fair value of MSRs carried at fair value (1,639) (1,373) (1,716) 69 (115)
Amortization (69) (66) (68) (68) (65) Net derivative gains (losses) from economic hedges (3) (B) 1,155 962 968 (501) (319)
Total servicing income, net $ 277 364 109 390 406
Market-related valuation changes to MSRs, net of hedge results (2)(3) (A)+(B) $ 77 71 (278) 30 26
(1) Includes contractually specified servicing fees, late charges and other ancillary revenues, net of unreimbursed direct servicing costs. (2) Refer to the changes in fair value MSRs table on the previous page for more detail. (3) Represents results from economic hedges used to hedge the risk of changes in fair value of MSRs.
Jun 30, Mar 31, Dec 31, Sep 30, Jun 30, (in billions) 2019 2019 2018 2018 2018
Managed servicing portfolio (1): Residential mortgage servicing:
Serviced for others $ 1,107 1,125 1,164 1,184 1,190 Owned loans serviced 340 331 334 337 340 Subserviced for others 5 26 4 5 4
Total residential servicing 1,452 1,482 1,502 1,526 1,534
Commercial mortgage servicing: Serviced for others 548 552 543 529 518 Owned loans serviced 123 122 121 121 124 Subserviced for others 9 9 9 9 10
Total commercial servicing 680 683 673 659 652
Total managed servicing portfolio $ 2,132 2,165 2,175 2,185 2,186
Total serviced for others $ 1,655 1,677 1,707 1,713 1,708 Ratio of MSRs to related loans serviced for others 0.82% 0.88 0.94 1.02 0.98 Weighted-average note rate (mortgage loans serviced for others) 4.33 4.34 4.32 4.29 4.27
(1) The components of our managed servicing portfolio are presented at unpaid principal balance for loans serviced and subserviced for others and at book value for owned loans serviced.

364
- 42 -
Wells Fargo & Company and Subsidiaries SELECTED FIVE QUARTER RESIDENTIAL MORTGAGE PRODUCTION DATA
Quarter ended
Jun 30, Mar 31, Dec 31, Sep 30, Jun 30, 2019 2019 2018 2018 2018
Net gains on mortgage loan origination/sales activities (in millions): Residential (A) $ 322 232 245 324 281 Commercial 83 47 65 75 49 Residential pipeline and unsold/repurchased loan management (1) 76 65 48 57 34
Total $ 344 456481 358
Application data (in billions): Wells Fargo first mortgage quarterly applications $ 90 64 48 57 67 Refinances as a percentage of applications 44% 44 30 26 25 Wells Fargo first mortgage unclosed pipeline, at quarter end $ 44 32 18 22 26
Residential real estate originations: Purchases as a percentage of originations 68% 70 78 81 78 Refinances as a percentage of originations 32 30 22 19 22
Total 100% 100 100 100 100
Wells Fargo first mortgage loans (in billions): Retail $ 26 14 16 18 21 Correspondent 27 18 21 27 28
Other (2) — 1 1 1 1
Total quarter-to-date $ 53 33 38 46 50
Held-for-sale (B) $ 33 22 28 33 37
Held-for-investment 20 11 10 13 13
Total quarter-to-date $ 53 33 38 46
Total year-to-date $ 86 33 177 139
Production margin on residential held-for-sale mortgage originations (A)/(B) 0.98% 1.05 0.89 0.97
(1) Predominantly includes the results of sales of modified GNMA loans, interest rate management activities and changes in estimate to the liability for mortgage loan repurchase losses. (2) Consists of home equity loans and lines.
50
93
0.77