
Wells Fargo
240
New opportunities. Unchanging vision. “The reason we wake up in the morning is to help our customers succeed financially and to satisfy all their financial needs. The result is we make money because of our focus on serving customers, not the other way around. This time-tested vision will forever be what matters to Wells Fargo. We’ll never put the stagecoach ahead of the horses. ” — John G. Stumpf, Chairman, President and Chief Executive Officer WELLS FARGO WELLS FARGO & COMPANY 2011 ANNUAL REPORT NEW OPPORTUNITIES. UNCHANGING VISION. Wells Fargo & Company Annual Report 2011
-
Upload
candyannie -
Category
Documents
-
view
141 -
download
0
Transcript of Wells Fargo

LITTLE&COMPANY LITTLE&COMPANY
New opportunities. Unchanging vision.
“The reason we wake up in the morning is to help ourcustomers succeed financially and to satisfy all theirfinancial needs. The result is we make money becauseof our focus on serving customers, not the other wayaround. This time-tested vision will forever be whatmatters to Wells Fargo. We’ll never put the stagecoachahead of the horses.”— John G. Stumpf, Chairman, President and Chief Executive Officer
Wells Fargo & Company 420 Montgomery Street San Francisco, California 94104
1-866-878-5865 wellsfargo.com
WE
LLS FAR
GO
WE
LL
S F
AR
GO
& C
OM
PA
NY
20
11 AN
NU
AL
RE
PO
RT
NE
WO
pp
OR
tu
Nit
iES.u
NC
hA
NG
iNG
viSiO
N.
Wells Fargo & Company Annual Report 2011
Together we’ll go far
Our vision:Satisfy all our customers’ financial needs and help themsucceed financially.
Nuestra vision:Deseamos satisfacer todas las necesidades financierasde nuestros clientes y ayudarlos a tener éxito en elárea financiera.
Notre vision:Satisfaire tous les besoins financiers de nos clientset les aider à atteindre le succès financier.
80478_L2_Cover.indd 1 2/22/12 2:19 AM
Washington
233
Oregon
172 Idaho
106
Montana
57
Colorado
243
North Dakota
36
South Dakota
57
Nebraska
64
California
1,407
Nevada
148 Utah
154
Wyoming
32
Arizona
335New Mexico
106
Kansas
43
Oklahoma
23
Texas
853
Minnesota
244
Iowa
99
Wisconsin
106Michigan
78
Missouri
62
Illinois
143Indiana
90Ohio
98
Kentucky
24Tennessee
57Arkansas
30
Louisiana
24
Mississippi
27 Alabama
171Georgia
368
Florida
808
South Carolina
180
North Carolina
455
Virginia
384
W. Virginia
29
Pennsylvania
419
New York
230
Maine
6N.H.
19
Vt.
8
New Jersey
393
Massachusetts
59Rhode Island
6Connecticut
99
D.C.
39
Maryland
136
Hawaii
4
Alaska
59
Delaware
31
LITTLE&COMPANY LITTLE&COMPANY
Wells Fargo coast to coast
#1 Retail banking deposits 1
#1 Total stores#1 Retail mortgage lender#1 Home loan originator to minority and low- to moderate-income
consumers & in low- to moderate-income neighborhoods(2010 HMDA data)
#1 Used car lender (AutoCount 2011)#1 Small business lender (U.S. in dollars per 2010 Community
Reinvestment Act government data)#1 U.S. Small Business Administration’s (SBA) 2011 Large 7(a)
Lender of the Year#1 REIT preferred stock (FY 2011, Bloomberg)#1 Internet Bank in the U.S. (2011 Global Finance Magazine)#1 In mobile banking for ease-of-use, privacy, security, quality, and
availability (Keynote Mobile Banking Scorecard 2011)#1 In the world for best social media strategy
(2011 Global Finance Magazine)#1 Mortgage servicer#2 Debit card issuer#2 Annuity distributor#2 Real estate lead arranger of loan syndications
(FY 2011, Thomson Reuters)
#2 REIT common stock (FY 2011, Dealogic)#2 Arranger of asset-based loans (FY 2011, Thomson Reuters)#2 Non-investment grade loan issuer by number of transactions
(FY 2010, Thomson Reuters)#2 Underwriter of preferred stock (FY 2010, Bloomberg)#2 Provider of private student loans#2 Overall auto finance lender (AutoCount 2011)#3 Branded bank ATM owner#3 Full-service retail brokerage provider based on number of
Financial Advisors#4 Loan syndication bookrunner (FY 2011, Thomson Reuters)#4 High-grade corporate loan issuer (FY 2011, Thomson Reuters)#4 Wealth management provider#5 IRA provider (Cerulli Associates)#5 Family wealth provider (Family Wealth Alliance)#6 Institutional retirement plan recordkeeper
(PLANSPONSOR Magazine)#7 Issuer of credit cards#7 Merchant processor for credit and debit cards#8 Senior manager of total municipal bond issues
(FY 2011, Thomson Reuters)
Around the worldArgentinaAustraliaBangladeshBrazilCanadaChileChina
ColombiaDominican RepublicEcuadorEgyptEnglandFranceGermany
IndiaIndonesiaIrelandItalyJapanJerseyMalaysia
MexicoPhilippinesRussiaSingaporeSouth AfricaSouth KoreaSpain
TaiwanThailandTurkeyUnited Arab EmiratesVietnam
Stores9,112
worldwide
ATMs12,211
wellsfargo.com22.4 millionactive online
customers
Mobile banking7.3 million
active mobilecustomers
Wells FargoCustomer
Connection500+ million
customercontacts
© 2012 Wells Fargo & Company. All rights reserved.
1 Deposits up to $500 million in a single banking store, excludes non-retail stores andcredit unions. Source: SNL.
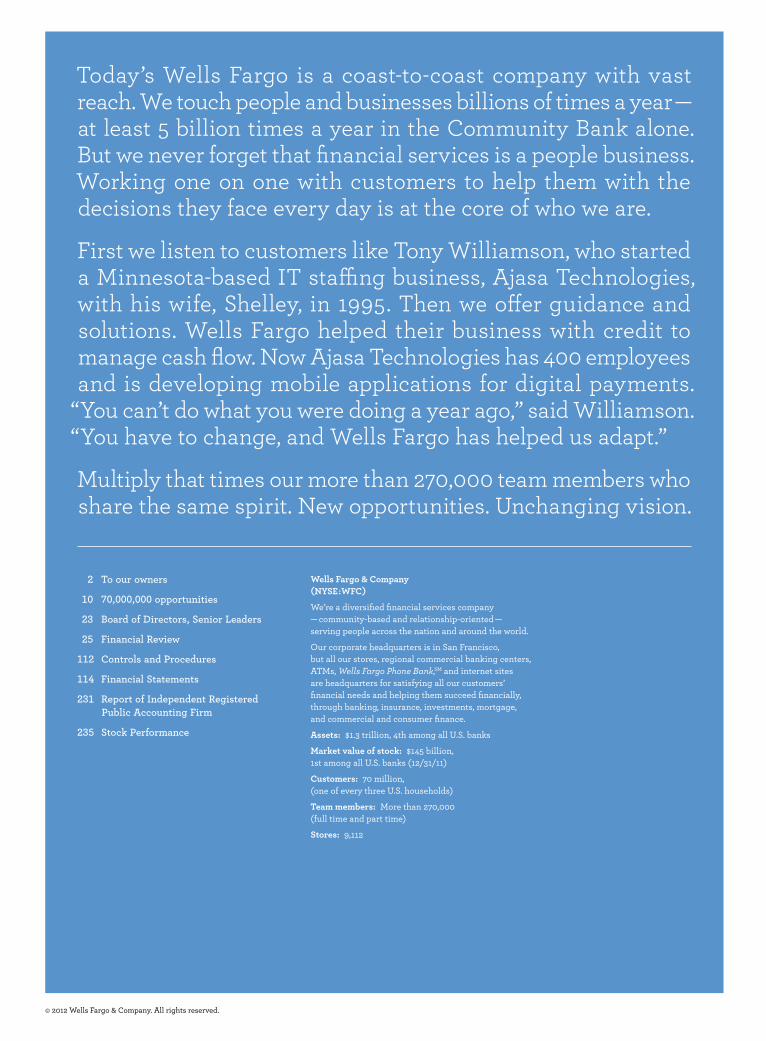
Today’s Wells Fargo is a coast-to-coast company with vastreach. We touch people and businesses billions of times a year — at least 5 billion times a year in the Community Bank alone.But we never forget that financial services is a people business.Working one on one with customers to help them with thedecisions they face every day is at the core of who we are.
First we listen to customers like Tony Williamson, who starteda Minnesota-based IT staffing business, Ajasa Technologies,with his wife, Shelley, in 1995. Then we offer guidance andsolutions. Wells Fargo helped their business with credit tomanage cash flow. Now Ajasa Technologies has 400 employeesand is developing mobile applications for digital payments.
“You can’t do what you were doing a year ago,” said Williamson.“You have to change, and Wells Fargo has helped us adapt.”
Multiply that times our more than 270,000 team members whoshare the same spirit. New opportunities. Unchanging vision.
112 Controls and Procedures
114 Financial Statements
231 Report of Independent Registered Public Accounting Firm
235 Stock Performance
2 To our owners
10 70,000,000 opportunities
23 Board of Directors, Senior Leaders
25 Financial Review
Wells Fargo & Company(NYSE:WFC)
We’re a diversified financial services company — community-based and relationship-oriented — serving people across the nation and around the world.
Our corporate headquarters is in San Francisco,but all our stores, regional commercial banking centers,ATMs, Wells Fargo Phone Bank,SM and internet sitesare headquarters for satisfying all our customers’financial needs and helping them succeed financially,through banking, insurance, investments, mortgage,and commercial and consumer finance.
Assets: $1.3 trillion, 4th among all U.S. banks
Market value of stock: $145 billion,1st among all U.S. banks (12/31/11)
Customers: 70 million,(one of every three U.S. households)
team members: More than 270,000(full time and part time)
Stores: 9,112
80478_L2_Cover.indd 2 2/22/12 2:19 AM
1
1 of 24
Tony Williamson of Ajasa Technologies, New Hope, Minn.
80478_L3_L4_L5_p1_24.indd 1 2/21/12 10:03 PM

1
1 of 24
Tony Williamson of Ajasa Technologies, New Hope, Minn.
80478_L3_L4_L5_p1_24.indd 1 2/21/12 10:03 PM

2
Outstanding resultsThe results were outstanding. Wells Fargoachieved record net income for the thirdconsecutive year, up 28 percent to $15.9 billion.Diluted earnings per common share rose28 percent to $2.82. Our customers entrustedus with even more of their business. Totaldeposits grew 9 percent to $920.1 billion. Totalloans grew 2 percent to $769.6 billion. Manyof our businesses had double-digit revenuegrowth. As a result of our performance, we wererewarded with a higher value in the market.We were ranked No. 1 in the U.S. bankingindustry in total market value of our company,even though we’re the fourth largest by assets.
Our team achieved all this while successfullyexecuting the largest, most complex bankmerger in our nation’s history. We began ourintegration with Wachovia at the beginningof 2009. We completed it on schedule andunder budget early in the first quarter of 2012.
All of our more than 6,200 retail banking storesare now on one system so our customers cando their banking business when, where, andhow they want to do it, coast to coast. Yourhometown Wells Fargo bank is wherever youhappen to be.
Guided by our time-tested Vision & Values,we also have more opportunities than everbefore to serve our customers and communities,and help our country grow. We’re fortunate tohave the most extensive U.S. financial servicesstore network. We’re in more communities andcloser to more customers than anyone else.We serve one of every three U.S. households.We originate one of every four home mortgages.We service more home loans than anyone else.We’re the nation’s No. 1 small business lender indollars and the No. 1 middle-market commerciallender. We’re first or second in home loans, carloans, student loans, and business loans.
John G. StumpfChairman, President andChief Executive OfficerWells Fargo & Company
To our owners,
Our more than 270,000 talented teammembers — whom we believe to bethe best team in the business — pulledtogether for our customers as neverbefore in 2011. They were guided, asalways, by our unchanging vision:to satisfy all our customers’ financialneeds and help them succeed financially.They were guided by our values, andwhat we stand for: honoring andsupporting our people, striving for thehighest ethical standards, doing what’sright for our customers, learning fromdiversity, and calling on everyoneto be leaders.
80478_L3_L4_L5_p1_24.indd 2 2/21/12 10:03 PM
3
3 of 24
Betting on AmericaWells Fargo employs one of every 500 working adults in America, making us the nation’s 12th largest private employer. Chances are you know someone who works for Wells Fargo, or someone who knows someone who does. Thirty-seven percent of our team is racially and ethnically diverse. This is slightly more than the U.S. population, which is 36 percent diverse. This diversity should enable us to better understand and respond to the financial needs of our customers and communities. Our reach is global, but at our heart we’re a hometown American company. Ninety-seven percent of our assets and 98 percent of our team members are based in the U.S. This makes us different from our large peers. Our roots are American roots, and we’ve grown as they’ve spread wide and deep in American soil. Since 1852, we’ve been betting on America. We liked our bet then, and we like it even more now. We’re confident in the ingenuity, resourcefulness, work ethic, and can-do attitude of Americans and our Wells Fargo team. Together, we’re focused on the tremendous opportunities we now have ahead of us and on the responsibilities we have to help our customers, communities, and country succeed. We’re focused on providing you, our shareholders, with sustainable, long-term success. We returned more capital to shareholders in 2011 by increasing our quarterly common stock dividend by 140 percent, to 48 cents for the year. We also resumed the repurchase of our common stock.
Earning trustThe U.S. economy’s recovery remained sluggish and continued to deliver disappointing results. Millions of Americans struggled with unemployment and underemployment despite slight improvements in the job market. The lack of jobs led to a decline in first-time home sales, even with historic low interest rates and bargain-basement prices. A stagnant housing market placed a drag on the economy. Consumers spent less and paid down their debt, including mortgages, credit cards, and auto loans. This made sense for consumers who wanted to regain control of their financial situation, but less spending didn’t help the recovery. By year’s end, credit balances and
spending began trending upward again, but balances were often paid in full each month. Consumers were not alone. Businesses also faced significant obstacles. Our quarterly surveys of small business owners showed their deep concerns about economic and credit market outlooks, along with pending regulatory reforms, and their potential effect on sales and operating costs. Many Americans remained frustrated with the slow, uneven economic recovery and the lack of job opportunities. As a result, they have lost faith in many large companies and institutions. We understand their concerns. We’re listening to our customers every day and helping them address their financial needs in any way we can. We’re contributing to communities across the country, helping them find local solutions for local problems. We’re also at the table in Washington, D.C., discussing the merits of proposed reforms for the financial services industry. We want to be a partner for thoughtful change, and we share our government’s desire to do what’s right for consumers and businesses. We don’t take trust for granted. We know we have to earn it every day in our conversations and actions with our customers. Here’s how we try to do that.
Helping our mortgage customersFirst, no financial product is more important to Americans, more interwoven with their financial security, than their home mortgage. Other financial services companies are backing away from this business because of what they perceive to be its high costs and its risks. Not Wells Fargo. Here’s why: Two-thirds of all Americans are in the mortgage business. They have mortgages on their homes. We want to be there to satisfy not just their mortgage needs, but all their other financial needs that connect to their mortgage. We believe we have the right products to offer mortgage customers and the right underwriting principles to make sure their loans are good loans. As a result, more than 92 percent of our mortgage customers were current on their payments and fewer than 2 percent of our owner-occupied home mortgages proceeded to a foreclosure sale.
1 in 500Wells Fargo employs more than 270,000 team members. That’s 1 in 500 working adults — making us the 12th largest private employer in the U.S.
No. 1Our company had the highest market capitalization in the U.S. banking industry.
1 in 3Wells Fargo serves one in three households in the U.S.
80478_L3_L4_L5_p1_24.indd 3 2/21/12 10:03 PM

4
4 of 24
Our Performance
$ in millions, except per share amounts 2011 2010 % Change
FOR THE YEARWells Fargo net income $ 15,869 12,362 28%Wells Fargo net income applicable to common stock 15,025 11,632 29Diluted earnings per common share 2.82 2.21 28Profitability ratios: Wells Fargo net income to average total assets (ROA) 1.25% 1.01 24 Wells Fargo net income applicable to common stock to average Wells Fargo common stockholders’ equity (ROE) 11.93 10.33 15Efficiency ratio 1 61.0 59.2 3
Total revenue $ 80,948 85,210 (5)Pre-tax pre-provision profit 2 31,555 34,754 (9)
Dividends declared per common share 0.48 0.20 140Average common shares outstanding 5,278.1 5,226.8 1Diluted average common shares outstanding 5,323.4 5,263.1 1
Average loans $ 757,144 770,601 (2)Average assets 1,270,265 1,226,938 4Average core deposits 3 826,735 772,021 7Average retail core deposits 4 595,851 572,881 4
Net interest margin 3.94% 4.26 (8)
AT YEAR-ENDSecurities available for sale $ 222,613 172,654 29Loans 769,631 757,267 2Allowance for loan losses 19,372 23,022 (16)Goodwill 25,115 24,770 1Assets 1,313,867 1,258,128 4Core deposits 3 872,629 798,192 9Wells Fargo stockholders’ equity 140,241 126,408 11Total equity 141,687 127,889 11Tier 1 capital 5 113,952 109,353 4Total capital 5 148,469 147,142 1
Capital ratios: Total equity to assets 10.78% 10.16 6 Risk-based capital: 5
Tier 1 capital 11.33 11.16 2 Total capital 14.76 15.01 (2) Tier 1 leverage 5 9.03 9.19 (2) Tier 1 common equity 6 9.46 8.30 14Book value per common share $ 24.64 22.49 10Team members (active, full-time equivalent) 264,200 272,200 (3)
1 The efficiency ratio is noninterest expense divided by total revenue (net interest income and noninterest income).
2 Pre-tax pre-provision profit (PTPP) is total revenue less noninterest expense. Management believes that PTPP is a useful financial measure because it enables investors and others to assess the Company’s ability to generate capital to cover credit losses through a credit cycle.
3 Core deposits are noninterest-bearing deposits, interest-bearing checking, savings certificates, certain market rate and other savings, and certain foreign deposits (Eurodollar sweep balances).
4 Retail core deposits are total core deposits excluding Wholesale Banking core deposits and retail mortgage escrow deposits.
5 See Note 26 (Regulatory and Agency Capital Requirements) to Financial Statements in this Report for additional information.
6 See the “Financial Review – Capital Management” section in this Report for additional information.
80478_L3_L4_L5_p1_24.indd 4 2/21/12 10:03 PM
5
5 of 24
We’re taking major steps to help our customers avoid foreclosure. Since the beginning of 2009 through the end of 2011, we have: • Completedmorethan728,000activetrial
or completed mortgage modifications to help homeowners who are struggling financially keep their homes. That’s an average of 665 each and every day, or 28 every hour.
• Helpedmorethan5.2 millionhomeownerswith new low-rate loans, either to buy a home or refinance their mortgage.
• Providedmorethan$4.1 billioninprincipalreduction when that was the best solution for the customer and the company.
In 2011 alone, we hosted 33 home preservation workshops, where we met face-to-face with thousands of our mortgage customers in cities across the country and provided on-the-spot relief to many of them. While we can’t help every mortgage customer who falls behind on payments, we’re proud of our progress and look forward to helping even more customers.
Helping small business growSecond, no part of the economy is getting more attention today than our nation’s small businesses, widely viewed as the engine of America’s job growth. As the nation’s leading small business lender, we’ve been increasing our small business lending, doing everything we can to say “yes” to creditworthy borrowers. Our new loan commitments for small businesses grew to $13.9 billion in 2011, up 8 percent from 2010. We were the nation’s No. 1 Small Business Administration (SBA) lender in dollar volume for the third consecutive year, approving a record $1.2 billion in SBA 7(a) loans.
Our five prioritiesServing customers when, where, and how they want to be served, and helping them succeed financially, is the foundation for everything we do. Our success depends on staying true to those principles and focusing on executing our strategic priorities, including: 1. Puttingcustomersfirst 2. Growingrevenue 3. Reducingexpenses 4. LivingourVision&Values 5. Connectingwithcommunities
and stakeholders
1. Putting customers firstFrom Wells Fargo’s Vision & Values: “We value what’s right for our customers in everything we do.”
Our customers come first, and we focus on helping them succeed financially. Their success comes before ours. We never put the stagecoach ahead of the horses. Consider our integration of Wachovia into Wells Fargo. When most companies merge, often the first thing they do is rush to change signs and business cards. We did it differently. It took us three years to integrate Wachovia’s operations because it was important to get the merger right for our customers. During those three years, we provided 490,000 hours of training for 35,000 retail banking team members who focused on making the transition as easy and effortless as possible for our customers. Our team members never lost sight of our guiding principle: The customer is always at the center of everything we do and every decision we make. This principle is more important than ever when you consider our size and scale. In the Community Bank alone, we touch people and businesses at least 5 billion times a year. Every single one of those interactions is vital to each customer. That gives us billions of chances a year to be a customer’s hero, to put the customer’s needs first and ensure we do things right. We will never be perfect. No company can be flawless billions of times a year. Smart companies, however, learn from their mistakes. When we make one, we want to admit it, apologize for it, fix it fast, and try to make sure it never happens again. Today, seven out of every 10 of our checking accounts are online. We’re finding new ways to make this experience even better. This year, we launched a new program called Wells Fargo AssistSM to help customers who are behind on payments or face financial hardship. In the first 12 months, we expect to have more than 100,000 customers visit this site, where they can connect with product specialists who can work with them — privately and conveniently. Rather than having to visit different Wells Fargo sites, the Wells Fargo Assist site is organized to reflect the way customers think of us, as One Wells Fargo offering many financial services and products: mortgages, home equity lines, credit cards,
5.2 millionSince the beginning of 2009 through the end of 2011, we helped more than 5.2 million homeowners with new low-rate loans, either to buy a home or refinance their mortgage.
$13.9 billionIn 2011, small business new loan commitments grew to $13.9 billion (an 8 percent increase from 2010).
92%92 percent of our mortgage customers remained current on their home payments.
80478_L3_L4_L5_p1_24.indd 5 2/21/12 10:03 PM
6
student loans, personal loans, and lines of credit.This can help our customers resolve past-dueaccounts quickly and discreetly, and also reduceour collection work.
We’re also putting the global needs ofour business customers first. This year werelocated our branch in Shanghai, one of theworld’s most dynamic cities. This expandedoffice will play a critical role in supporting theincreasing number of Wells Fargo customersdoing business in China and a growing numberof Chinese companies that want to grow theirbusiness in the U.S. This is just one way we’repositioned to continue to grow our internationalbusiness and serve our customers with anexpanded range of products and services.
2. Growing revenueFrom Wells Fargo’s Vision & Values:“We can’t control the economy, interestrates, the markets, or world events. We focuson what we can control and what we cansustain long term: our core performance,our revenue growth.”
When we put customers first and helpthem succeed financially, we strengthenrelationships, build loyalty, and earn trust.As a result, our customers bring us morebusiness, we create more opportunitiesfor our team members, and we earn morerevenue to support our operations, growingour earnings and shareholder return.
In 2011, Wells Fargo grew its Tier 1common equity 1 (a bank’s core equity capital)by $13.8 billion, up 17 percent. This was thegreatest increase among the four largest U.S.banks, based on assets.
We grew revenue in many of our businesseswithin Community Banking; Wealth, Brokerageand Retirement; Consumer Lending; andWholesale Banking, including CommercialBanking. However, our total revenue declinedduring the year, reflecting lower interest rates,new regulations, and the sluggish economy.We’re confident we can grow revenue ifwe stay true to our vision and attract newcustomers through organic growth anddisciplined acquisitions.
We have a huge opportunity to earnmore business from our current customers.Our average retail bank household cross-sellreached a record 5.92 products in 2011, upfrom 5.70 in the fourth quarter of 2010. In ourWestern markets it was a record 6.29, in theEast 5.43, and our top region had 7.38. Theopportunities, therefore, are immense. Evenif we get to eight products per retail bankhousehold, we still have room to grow. Webelieve the average American household hasbetween 14 and 16 financial services products.
In Wholesale Banking, we’re building onstrong relationships with existing customersand developing relationships with newcustomers. Our loans in this important segmentgrew 8 percent in 2011. Our CommercialBanking business has increased loans for17 straight months.
We also bought commercial portfolioswith favorable risk-reward characteristicsin 2011, including approximately $4 billionof U.S.-based commercial real estate loans,and made a number of other acquisitions,expanding our product lines. We serve thetreasury management, investment banking,and international needs of more than 28,000relationships with middle-market and largecorporate businesses, governments, andinstitutions worldwide.
We see huge growth opportunities in ourWealth, Brokerage and Retirement segment.Only one of about every 10 of our bankinghouseholds has an investment relationshipwith us. More than 5 million affluent bankinghouseholds don’t have investment productswith us, but they have nearly $2 trillion ininvestable assets. Increasing cross-sell only5 percent with these customers could generate$600 million in annual revenue. Our morethan 15,000 financial advisors have their workcut out for them. They’re eager to earn all ourcustomers’ business. If you’re a Wells Fargocustomer with investable assets, we lookforward to talking to you soon.
Growing revenue comes down to how wellour team can help our customers succeed, onecustomer at a time. In Scottsdale, Ariz., forexample, our financial advisors and privatebankers worked together to help a customeropen a $1 million line of credit to help hisbusiness meet its short-term capital needs.
1 Please see the “Financial Review – Capital Management” sectionin this Report for more information.
80478_L3_L4_L5_p1_24.indd 6 2/21/12 10:03 PM
7
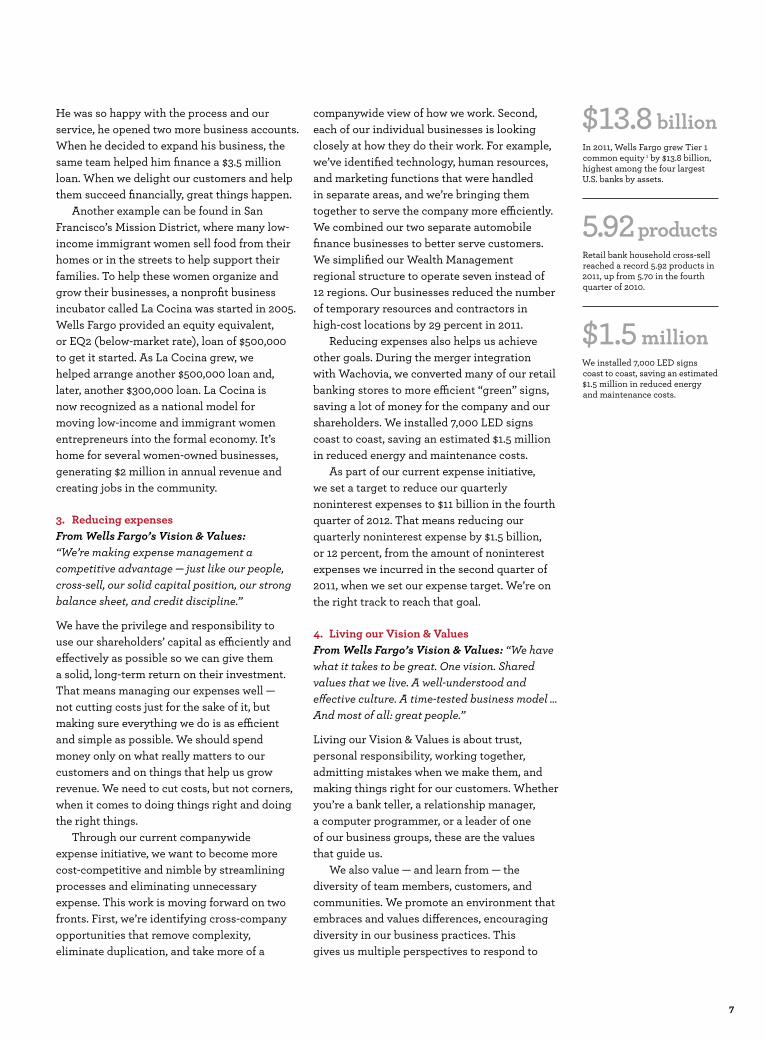
He was so happy with the process and ourservice, he opened two more business accounts.When he decided to expand his business, thesame team helped him finance a $3.5 millionloan. When we delight our customers and helpthem succeed financially, great things happen.
Another example can be found in SanFrancisco’s Mission District, where many low-income immigrant women sell food from theirhomes or in the streets to help support theirfamilies. To help these women organize andgrow their businesses, a nonprofit businessincubator called La Cocina was started in 2005.Wells Fargo provided an equity equivalent,or EQ2 (below-market rate), loan of $500,000to get it started. As La Cocina grew, wehelped arrange another $500,000 loan and,later, another $300,000 loan. La Cocina isnow recognized as a national model formoving low-income and immigrant womenentrepreneurs into the formal economy. It’shome for several women-owned businesses,generating $2 million in annual revenue andcreating jobs in the community.
3. Reducing expensesFrom Wells Fargo’s Vision & Values:“We’re making expense management acompetitive advantage — just like our people,cross-sell, our solid capital position, our strongbalance sheet, and credit discipline.”
We have the privilege and responsibility touse our shareholders’ capital as efficiently andeffectively as possible so we can give thema solid, long-term return on their investment.That means managing our expenses well —not cutting costs just for the sake of it, butmaking sure everything we do is as efficientand simple as possible. We should spendmoney only on what really matters to ourcustomers and on things that help us growrevenue. We need to cut costs, but not corners,when it comes to doing things right and doingthe right things.
Through our current companywideexpense initiative, we want to become morecost-competitive and nimble by streamliningprocesses and eliminating unnecessaryexpense. This work is moving forward on twofronts. First, we’re identifying cross-companyopportunities that remove complexity,eliminate duplication, and take more of a
companywide view of how we work. Second,each of our individual businesses is lookingclosely at how they do their work. For example,we’ve identified technology, human resources,and marketing functions that were handledin separate areas, and we’re bringing themtogether to serve the company more efficiently.We combined our two separate automobilefinance businesses to better serve customers.We simplified our Wealth Managementregional structure to operate seven instead of12 regions. Our businesses reduced the numberof temporary resources and contractors inhigh-cost locations by 29 percent in 2011.
Reducing expenses also helps us achieveother goals. During the merger integrationwith Wachovia, we converted many of our retailbanking stores to more efficient “green” signs,saving a lot of money for the company and ourshareholders. We installed 7,000 LED signscoast to coast, saving an estimated $1.5 millionin reduced energy and maintenance costs.
As part of our current expense initiative,we set a target to reduce our quarterlynoninterest expenses to $11 billion in the fourthquarter of 2012. That means reducing ourquarterly noninterest expense by $1.5 billion,or 12 percent, from the amount of noninterestexpenses we incurred in the second quarter of2011, when we set our expense target. We’re onthe right track to reach that goal.
4. Living our Vision & ValuesFrom Wells Fargo’s Vision & Values: “We havewhat it takes to be great. One vision. Sharedvalues that we live. A well-understood andeffective culture. A time-tested business model …And most of all: great people.”
Living our Vision & Values is about trust,personal responsibility, working together,admitting mistakes when we make them, andmaking things right for our customers. Whetheryou’re a bank teller, a relationship manager,a computer programmer, or a leader of oneof our business groups, these are the valuesthat guide us.
We also value — and learn from — thediversity of team members, customers, andcommunities. We promote an environment thatembraces and values differences, encouragingdiversity in our business practices. Thisgives us multiple perspectives to respond to
5.92 productsRetail bank household cross-sellreached a record 5.92 products in2011, up from 5.70 in the fourthquarter of 2010.
$13.8 billionIn 2011, Wells Fargo grew Tier 1common equity 1 by $13.8 billion,highest among the four largestU.S. banks by assets.
$1.5 millionWe installed 7,000 LED signscoast to coast, saving an estimated$1.5 million in reduced energyand maintenance costs.
80478_L3_L4_L5_p1_24.indd 7 2/21/12 10:03 PM
7
He was so happy with the process and ourservice, he opened two more business accounts.When he decided to expand his business, thesame team helped him finance a $3.5 millionloan. When we delight our customers and helpthem succeed financially, great things happen.
Another example can be found in SanFrancisco’s Mission District, where many low-income immigrant women sell food from theirhomes or in the streets to help support theirfamilies. To help these women organize andgrow their businesses, a nonprofit businessincubator called La Cocina was started in 2005.Wells Fargo provided an equity equivalent,or EQ2 (below-market rate), loan of $500,000to get it started. As La Cocina grew, wehelped arrange another $500,000 loan and,later, another $300,000 loan. La Cocina isnow recognized as a national model formoving low-income and immigrant womenentrepreneurs into the formal economy. It’shome for several women-owned businesses,generating $2 million in annual revenue andcreating jobs in the community.
3. Reducing expensesFrom Wells Fargo’s Vision & Values:“We’re making expense management acompetitive advantage — just like our people,cross-sell, our solid capital position, our strongbalance sheet, and credit discipline.”
We have the privilege and responsibility touse our shareholders’ capital as efficiently andeffectively as possible so we can give thema solid, long-term return on their investment.That means managing our expenses well —not cutting costs just for the sake of it, butmaking sure everything we do is as efficientand simple as possible. We should spendmoney only on what really matters to ourcustomers and on things that help us growrevenue. We need to cut costs, but not corners,when it comes to doing things right and doingthe right things.
Through our current companywideexpense initiative, we want to become morecost-competitive and nimble by streamliningprocesses and eliminating unnecessaryexpense. This work is moving forward on twofronts. First, we’re identifying cross-companyopportunities that remove complexity,eliminate duplication, and take more of a
companywide view of how we work. Second,each of our individual businesses is lookingclosely at how they do their work. For example,we’ve identified technology, human resources,and marketing functions that were handledin separate areas, and we’re bringing themtogether to serve the company more efficiently.We combined our two separate automobilefinance businesses to better serve customers.We simplified our Wealth Managementregional structure to operate seven instead of12 regions. Our businesses reduced the numberof temporary resources and contractors inhigh-cost locations by 29 percent in 2011.
Reducing expenses also helps us achieveother goals. During the merger integrationwith Wachovia, we converted many of our retailbanking stores to more efficient “green” signs,saving a lot of money for the company and ourshareholders. We installed 7,000 LED signscoast to coast, saving an estimated $1.5 millionin reduced energy and maintenance costs.
As part of our current expense initiative,we set a target to reduce our quarterlynoninterest expenses to $11 billion in the fourthquarter of 2012. That means reducing ourquarterly noninterest expense by $1.5 billion,or 12 percent, from the amount of noninterestexpenses we incurred in the second quarter of2011, when we set our expense target. We’re onthe right track to reach that goal.
4. Living our Vision & ValuesFrom Wells Fargo’s Vision & Values: “We havewhat it takes to be great. One vision. Sharedvalues that we live. A well-understood andeffective culture. A time-tested business model …And most of all: great people.”
Living our Vision & Values is about trust,personal responsibility, working together,admitting mistakes when we make them, andmaking things right for our customers. Whetheryou’re a bank teller, a relationship manager,a computer programmer, or a leader of oneof our business groups, these are the valuesthat guide us.
We also value — and learn from — thediversity of team members, customers, andcommunities. We promote an environment thatembraces and values differences, encouragingdiversity in our business practices. Thisgives us multiple perspectives to respond to
5.92 productsRetail bank household cross-sellreached a record 5.92 products in2011, up from 5.70 in the fourthquarter of 2010.
$13.8 billionIn 2011, Wells Fargo grew Tier 1common equity 1 by $13.8 billion,highest among the four largestU.S. banks by assets.
$1.5 millionWe installed 7,000 LED signscoast to coast, saving an estimated$1.5 million in reduced energyand maintenance costs.
80478_L3_L4_L5_p1_24.indd 7 2/21/12 10:03 PM

8
“Living our Vision & Values is abouttrust, personal responsibility, workingtogether, admitting mistakes when wemake them, and making things rightfor our customers. Whether you’rea bank teller, a relationship manager,a computer programmer, or a leaderof one of our business groups, theseare the values that guide us.”
the needs of our team members, customers,and communities. More than 28,000 ofour team members — up 33 percent for theyear — participated in our nine team membernetworks, groups that are aligned with ourcompany’s diverse customer segments andbusiness strategies. We’re committed todiversity and diverse representation all acrossWells Fargo, including on my own leadershipteam. I’m proud to serve as chair of ourcompany’s diversity council, and I take personalresponsibility for our progress.
We make our Vision & Values bookletavailable to all of our team members. It’s aliving document. We encourage all our teammembers and leaders to use it as a guide fortheir daily work. It’s our gold standard forserving our customers, working together asteam members, serving our communities, andhonoring our shareholders for investing in ourcompany. You can read our Vision & Valuesin the “About Us” section on wellsfargo.com.Check it out and let us know how we’re doing.You can also read about the important roleour Vision & Values plays in the Wells Fargoculture in the February 13, 2012, issue ofForbes magazine. Search forbes.com for theJanuary 25, 2012, article titled “Wells Fargo:The Bank That Works.”
5. Connecting with communities andstakeholdersFrom Wells Fargo’s Vision & Values:“Our responsibility goes far beyond protectingour customers’ assets. We’re responsiblefor being leaders to promote the long-termeconomic prosperity and quality of life foreveryone in our communities. If they prosper,so do we.”
For 160 years, Wells Fargo has been committedto the communities where our customers liveand work. Each of these communities hasunique needs. Our teams in these communitiesknow how they can make a difference. They’reclosely connected to their customers. Theyknow them by name. They know how to helpthem succeed financially, and they help supportthem when the going gets rough. One suchcrisis happened in the town of Bastrop, Texas,near Austin, last year. Bastrop (population:7,200) was one of many communities parchedby drought, record heat, and wildfires in thesummer of 2011. Ten of our 12 Wells Fargo teammembers in Bastrop had to leave their homesand live in shelters, churches, or with friendsand family. Despite that, they still chose to cometo work so they could serve our customers.When the offer was made to bring bankersfrom outside the community to help, they said,“We know the customers. They’re our friends,neighbors, and customers, and we don’t wantto leave.” I believe you can find similar courageand selflessness among our team members inevery community where we do business.
Because of our record earnings in 2011,Wells Fargo was also able to excel in giving tononprofit organizations and in team membervolunteerism. Wells Fargo contributed$213.5 million to 25,000 nonprofits across theU.S. Fortune ranked us 23rd among the 500largest companies in America, and the Journalof Philanthropy ranked Wells Fargo No. 3 incorporate giving. Our team members set acompany record by contributing more than$63.9 million of their own money to nonprofitsacross the country, including $41.6 millionthrough our annual community supportcampaign. That was a 16 percent increase over2010, and the ninth straight year of double-digitincreases in pledges. Even though we’re the12th largest private employer, not the largest, in2010 Wells Fargo was recognized by United WayWorldwide for the second year in a row for having
80478_L3_L4_L5_p1_24.indd 8 2/21/12 10:03 PM
9
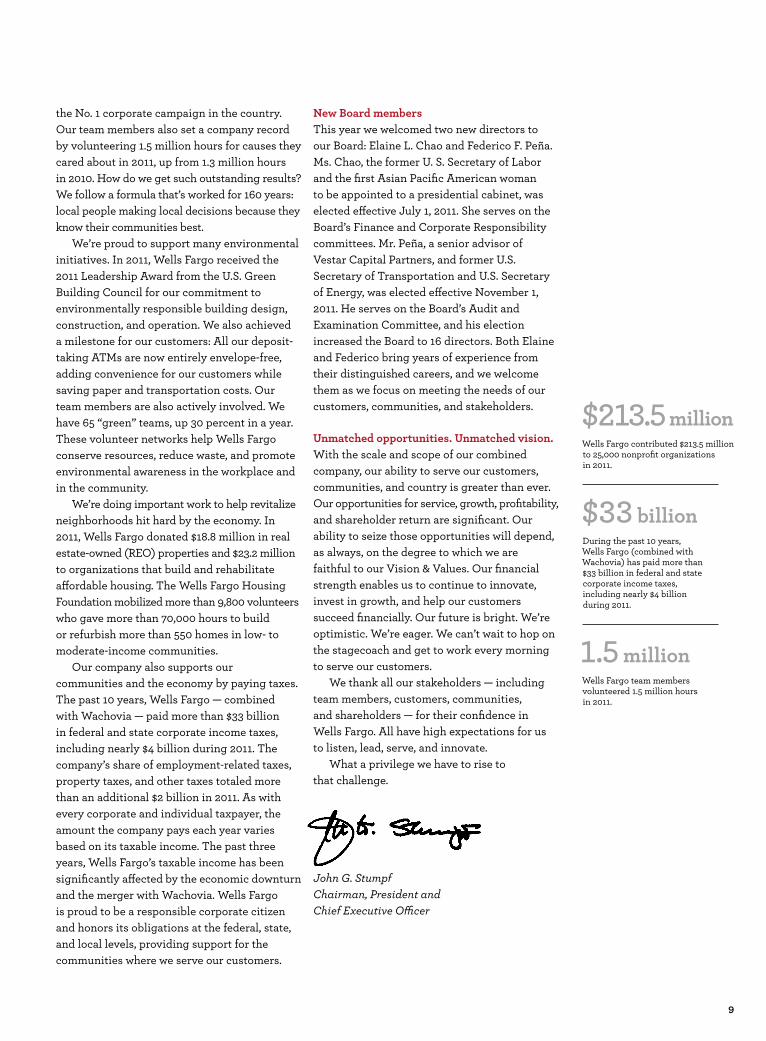
the No. 1 corporate campaign in the country.Our team members also set a company recordby volunteering 1.5 million hours for causes theycared about in 2011, up from 1.3 million hoursin 2010. How do we get such outstanding results?We follow a formula that’s worked for 160 years:local people making local decisions because theyknow their communities best.
We’re proud to support many environmentalinitiatives. In 2011, Wells Fargo received the2011 Leadership Award from the U.S. GreenBuilding Council for our commitment toenvironmentally responsible building design,construction, and operation. We also achieveda milestone for our customers: All our deposit-taking ATMs are now entirely envelope-free,adding convenience for our customers whilesaving paper and transportation costs. Ourteam members are also actively involved. Wehave 65 “green” teams, up 30 percent in a year.These volunteer networks help Wells Fargoconserve resources, reduce waste, and promoteenvironmental awareness in the workplace andin the community.
We’re doing important work to help revitalizeneighborhoods hit hard by the economy. In2011, Wells Fargo donated $18.8 million in realestate-owned (REO) properties and $23.2 millionto organizations that build and rehabilitateaffordable housing. The Wells Fargo HousingFoundation mobilized more than 9,800 volunteerswho gave more than 70,000 hours to buildor refurbish more than 550 homes in low- tomoderate-income communities.
Our company also supports ourcommunities and the economy by paying taxes.The past 10 years, Wells Fargo — combinedwith Wachovia — paid more than $33 billionin federal and state corporate income taxes,including nearly $4 billion during 2011. Thecompany’s share of employment-related taxes,property taxes, and other taxes totaled morethan an additional $2 billion in 2011. As withevery corporate and individual taxpayer, theamount the company pays each year variesbased on its taxable income. The past threeyears, Wells Fargo’s taxable income has beensignificantly affected by the economic downturnand the merger with Wachovia. Wells Fargois proud to be a responsible corporate citizenand honors its obligations at the federal, state,and local levels, providing support for thecommunities where we serve our customers.
New Board membersThis year we welcomed two new directors toour Board: Elaine L. Chao and Federico F. Peña.Ms. Chao, the former U. S. Secretary of Laborand the first Asian Pacific American womanto be appointed to a presidential cabinet, waselected effective July 1, 2011. She serves on theBoard’s Finance and Corporate Responsibilitycommittees. Mr. Peña, a senior advisor ofVestar Capital Partners, and former U.S.Secretary of Transportation and U.S. Secretaryof Energy, was elected effective November 1,2011. He serves on the Board’s Audit andExamination Committee, and his electionincreased the Board to 16 directors. Both Elaineand Federico bring years of experience fromtheir distinguished careers, and we welcomethem as we focus on meeting the needs of ourcustomers, communities, and stakeholders.
Unmatched opportunities. Unmatched vision.With the scale and scope of our combinedcompany, our ability to serve our customers,communities, and country is greater than ever.Our opportunities for service, growth, profitability,and shareholder return are significant. Ourability to seize those opportunities will depend,as always, on the degree to which we arefaithful to our Vision & Values. Our financialstrength enables us to continue to innovate,invest in growth, and help our customerssucceed financially. Our future is bright. We’reoptimistic. We’re eager. We can’t wait to hop onthe stagecoach and get to work every morningto serve our customers.
We thank all our stakeholders — includingteam members, customers, communities,and shareholders — for their confidence inWells Fargo. All have high expectations for usto listen, lead, serve, and innovate.
What a privilege we have to rise tothat challenge.
John G. StumpfChairman, President andChief Executive Officer
$33 billionDuring the past 10 years,Wells Fargo (combined withWachovia) has paid more than$33 billion in federal and statecorporate income taxes,including nearly $4 billionduring 2011.
$213.5 millionWells Fargo contributed $213.5 millionto 25,000 nonprofit organizationsin 2011.
1.5 millionWells Fargo team membersvolunteered 1.5 million hoursin 2011.
80478_L3_L4_L5_p1_24.indd 9 2/21/12 10:03 PM
9
the No. 1 corporate campaign in the country.Our team members also set a company recordby volunteering 1.5 million hours for causes theycared about in 2011, up from 1.3 million hoursin 2010. How do we get such outstanding results?We follow a formula that’s worked for 160 years:local people making local decisions because theyknow their communities best.
We’re proud to support many environmentalinitiatives. In 2011, Wells Fargo received the2011 Leadership Award from the U.S. GreenBuilding Council for our commitment toenvironmentally responsible building design,construction, and operation. We also achieveda milestone for our customers: All our deposit-taking ATMs are now entirely envelope-free,adding convenience for our customers whilesaving paper and transportation costs. Ourteam members are also actively involved. Wehave 65 “green” teams, up 30 percent in a year.These volunteer networks help Wells Fargoconserve resources, reduce waste, and promoteenvironmental awareness in the workplace andin the community.
We’re doing important work to help revitalizeneighborhoods hit hard by the economy. In2011, Wells Fargo donated $18.8 million in realestate-owned (REO) properties and $23.2 millionto organizations that build and rehabilitateaffordable housing. The Wells Fargo HousingFoundation mobilized more than 9,800 volunteerswho gave more than 70,000 hours to buildor refurbish more than 550 homes in low- tomoderate-income communities.
Our company also supports ourcommunities and the economy by paying taxes.The past 10 years, Wells Fargo — combinedwith Wachovia — paid more than $33 billionin federal and state corporate income taxes,including nearly $4 billion during 2011. Thecompany’s share of employment-related taxes,property taxes, and other taxes totaled morethan an additional $2 billion in 2011. As withevery corporate and individual taxpayer, theamount the company pays each year variesbased on its taxable income. The past threeyears, Wells Fargo’s taxable income has beensignificantly affected by the economic downturnand the merger with Wachovia. Wells Fargois proud to be a responsible corporate citizenand honors its obligations at the federal, state,and local levels, providing support for thecommunities where we serve our customers.
New Board membersThis year we welcomed two new directors toour Board: Elaine L. Chao and Federico F. Peña.Ms. Chao, the former U. S. Secretary of Laborand the first Asian Pacific American womanto be appointed to a presidential cabinet, waselected effective July 1, 2011. She serves on theBoard’s Finance and Corporate Responsibilitycommittees. Mr. Peña, a senior advisor ofVestar Capital Partners, and former U.S.Secretary of Transportation and U.S. Secretaryof Energy, was elected effective November 1,2011. He serves on the Board’s Audit andExamination Committee, and his electionincreased the Board to 16 directors. Both Elaineand Federico bring years of experience fromtheir distinguished careers, and we welcomethem as we focus on meeting the needs of ourcustomers, communities, and stakeholders.
Unmatched opportunities. Unmatched vision.With the scale and scope of our combinedcompany, our ability to serve our customers,communities, and country is greater than ever.Our opportunities for service, growth, profitability,and shareholder return are significant. Ourability to seize those opportunities will depend,as always, on the degree to which we arefaithful to our Vision & Values. Our financialstrength enables us to continue to innovate,invest in growth, and help our customerssucceed financially. Our future is bright. We’reoptimistic. We’re eager. We can’t wait to hop onthe stagecoach and get to work every morningto serve our customers.
We thank all our stakeholders — includingteam members, customers, communities,and shareholders — for their confidence inWells Fargo. All have high expectations for usto listen, lead, serve, and innovate.
What a privilege we have to rise tothat challenge.
John G. StumpfChairman, President andChief Executive Officer
$33 billionDuring the past 10 years,Wells Fargo (combined withWachovia) has paid more than$33 billion in federal and statecorporate income taxes,including nearly $4 billionduring 2011.
$213.5 millionWells Fargo contributed $213.5 millionto 25,000 nonprofit organizationsin 2011.
1.5 millionWells Fargo team membersvolunteered 1.5 million hoursin 2011.
80478_L3_L4_L5_p1_24.indd 9 2/21/12 10:03 PM

10
10 of 24
Justin (left) and Stuart Alboum of W. Alboum Hat Co. Inc., Irvington, N.J.
80478_L3_L4_L5_p1_24.indd 10 2/21/12 10:03 PM
11
11 of 24
Wells Fargo can serve customers today as never before, thanks to our new scale and scope. But the opportunities we have with our 70 million customers are guided by an unchanging commitment: To listening. To partnering. To devising solutions that work.
For Stuart and Justin Alboum of Irvington, N.J. — the third- and fourth-generation owners of a business founded in 1921 — that means working with Business Banking’s Jeff Lenches to refinance the mortgage on their factory. The financing helped W. Alboum Hat Co. Inc. add new machines and boost production while enhancing the trust they require in a business relationship. “I feel very confident going to Jeff and his team for financial advice,” said Stuart, who subsequently moved checking and other business accounts to Wells Fargo.
New opportunities. Unchanging vision.
70,000,000 opportunities
80478_L3_L4_L5_p1_24.indd 11 2/21/12 10:03 PM

12
12 of 24
1:1 mortgage relationshipsWhen you’re behind on your mortgage payment, the last thing you need is uncertainty about who to call. That’s one reason Wells Fargo created a special Home Preservation team providing a single point of contact.
80478_L3_L4_L5_p1_24.indd 12 2/21/12 10:11 PM
Shornell Essex of Des Moines, Iowa, isa member of that team, which meansher customers contact her and
13
onlyher in working through an issue —whether the likely outcome is a loanmodification, short sale, deed-in-lieu,or (at last resort) foreclosure. “Now thecustomer has a partner, an advocate,and a ‘friend’ working with them fromstart to finish,” she said. “It’s no longernecessary to contact anyone else,because I can assist with any issue,even taking a payment.”
The team has completed nearly50,000 modifications since the modellaunched in July 2011.
Another advantage of the individualizedapproach: No one has to navigate phone
systems, send paperwork to multipledepartments, or feel as if they’re alonein the process. Essex said part of whatshe and other members of the HomePreservation team do is help customersunderstand their options so they areprepared for what’s next in the process.
“I like being in constant contact sono one is surprised,” she said. “So if Inotify a customer that an underwritingdecision has been made, I also use thattime to discuss options and answerquestions. The best calls are whenI’m able to tell someone who’s beenin financial distress that an issue hasbeen resolved and that brighter daysare ahead. Customers sometimes cryand often tell me what a difference thismakes in their lives.”
Shornell Essex, Des Moines, Iowa
$4.1 billionSince the beginning of 2009through the end of 2011,Wells Fargo has provided morethan $4.1 billion in mortgageprincipal reduction.
728,000+Since the beginning of 2009through the end of 2011, we’vecompleted more than 728,000mortgage modifications that havehelped struggling homeownerskeep their homes.
1 in 4We provide one out of every fourhome mortgages and are the largestservicer of mortgages in the U.S.
80478_L3_L4_L5_p1_24.indd 13 2/21/12 10:12 PM

14
14 of 24
Wells Fargo helps people with decisions about their money every day. Our teams of financial advisors and planners, private bankers, and retirement and trust specialists manage more than $1.3 trillion for customers — creating financial plans that meet life goals.
One of those customers is “Bubba” Danforth of Orangedale, Fla., who was a crabber one day last August and a millionaire the next, thanks to a winning Florida Lotto ticket he purchased at a local country store.
Today he’s confident he can leave a healthy financial legacy to his family, thanks to a team of Wells Fargo professionals.
“The Wells Fargo team is giving us information and options,” said his wife, Cathy. “We want to make good choices and manage the money well. We hope the money can live on for generations.”
The Danforths chose Wells Fargo for a simple reason: trust. The morning after getting the news about their $20 million windfall, the couple visited the Green Coast Springs banking store
they knew so well. Team members there previously had helped them untangle a financial knot created when fraudsters took advantage of Bubba’s aging mother. The couple placed the winning ticket in their safe deposit box, and Teller Chrispian Boyd asked,
“Would you like me to recommend someone who can help you?”
Wells Fargo Advisors’ David Berard and Wells Fargo Private Bank’s Marty Flack quickly assembled a team (including specialists from The Private Bank, Wells Fargo Insurance, and Community Banking) and presented a plan for the Danforths to consider.
Cathy concluded, “We’re modest people and have never had a lot of money, but we tried to manage what we did have. Now we have peace of mind.”
$1.3 trillion under management
9,054Wells Fargo operates the largest store network in the U.S., including 6,239 banking, 1,375 Wells Fargo Advisors, 725 mortgage, and 715 wholesale locations.
15,000The brokerage team, Wells Fargo Advisors, has more than 15,000 financial advisors.
No. 4Wells Fargo is the fourth largest wealth management firm.
80478_L3_L4_L5_p1to24_R1.indd 14 2/27/12 2:14 PM
15
15 of 24
Bubba and Cathy Danforth, Orangedale, Fla.
80478_L3_L4_L5_p1_24.indd 15 2/21/12 10:03 PM

15
15 of 24
Bubba and Cathy Danforth, Orangedale, Fla.
80478_L3_L4_L5_p1_24.indd 15 2/21/12 10:03 PM

16
16 of 24
Community Development’s Brenda Wright (left) with Elvia Buendia of La Luna Cupcakes, San Francisco, Calif.
80478_L3_L4_L5_p1_24.indd 16 2/21/12 10:03 PM
17
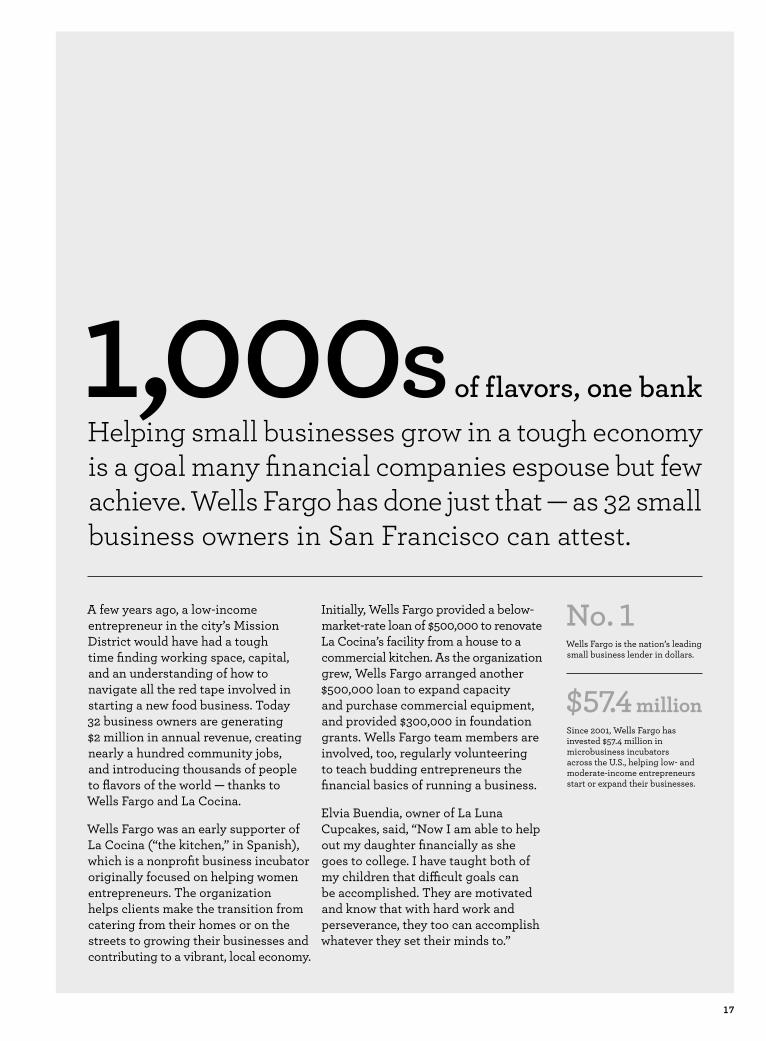
A few years ago, a low-incomeentrepreneur in the city’s MissionDistrict would have had a toughtime finding working space, capital,and an understanding of how tonavigate all the red tape involved instarting a new food business. Today32 business owners are generating$2 million in annual revenue, creatingnearly a hundred community jobs,and introducing thousands of peopleto flavors of the world — thanks toWells Fargo and La Cocina.
Wells Fargo was an early supporter ofLa Cocina (“the kitchen,” in Spanish),which is a nonprofit business incubatororiginally focused on helping womenentrepreneurs. The organizationhelps clients make the transition fromcatering from their homes or on thestreets to growing their businesses andcontributing to a vibrant, local economy.
Initially, Wells Fargo provided a below-market-rate loan of $500,000 to renovateLa Cocina’s facility from a house to acommercial kitchen. As the organizationgrew, Wells Fargo arranged another$500,000 loan to expand capacityand purchase commercial equipment,and provided $300,000 in foundationgrants. Wells Fargo team members areinvolved, too, regularly volunteeringto teach budding entrepreneurs thefinancial basics of running a business.
Elvia Buendia, owner of La LunaCupcakes, said, “Now I am able to helpout my daughter financially as shegoes to college. I have taught both ofmy children that difficult goals canbe accomplished. They are motivatedand know that with hard work andperseverance, they too can accomplishwhatever they set their minds to.”
Helping small businesses grow in a tough economyis a goal many financial companies espouse but fewachieve. Wells Fargo has done just that — as 32 smallbusiness owners in San Francisco can attest.
1,000s flavors, one of bank
No. 1Wells Fargo is the nation’s leadingsmall business lender in dollars.
$57.4 millionSince 2001, Wells Fargo hasinvested $57.4 million inmicrobusiness incubatorsacross the U.S., helping low- andmoderate-income entrepreneursstart or expand their businesses.
80478_L3_L4_L5_p1_24.indd 17 2/21/12 10:03 PM
17
A few years ago, a low-incomeentrepreneur in the city’s MissionDistrict would have had a toughtime finding working space, capital,and an understanding of how tonavigate all the red tape involved instarting a new food business. Today32 business owners are generating$2 million in annual revenue, creatingnearly a hundred community jobs,and introducing thousands of peopleto flavors of the world — thanks toWells Fargo and La Cocina.
Wells Fargo was an early supporter ofLa Cocina (“the kitchen,” in Spanish),which is a nonprofit business incubatororiginally focused on helping womenentrepreneurs. The organizationhelps clients make the transition fromcatering from their homes or on thestreets to growing their businesses andcontributing to a vibrant, local economy.
Initially, Wells Fargo provided a below-market-rate loan of $500,000 to renovateLa Cocina’s facility from a house to acommercial kitchen. As the organizationgrew, Wells Fargo arranged another$500,000 loan to expand capacityand purchase commercial equipment,and provided $300,000 in foundationgrants. Wells Fargo team members areinvolved, too, regularly volunteeringto teach budding entrepreneurs thefinancial basics of running a business.
Elvia Buendia, owner of La LunaCupcakes, said, “Now I am able to helpout my daughter financially as shegoes to college. I have taught both ofmy children that difficult goals canbe accomplished. They are motivatedand know that with hard work andperseverance, they too can accomplishwhatever they set their minds to.”
Helping small businesses grow in a tough economyis a goal many financial companies espouse but fewachieve. Wells Fargo has done just that — as 32 smallbusiness owners in San Francisco can attest.
1,000s flavors, one of bank
No. 1Wells Fargo is the nation’s leadingsmall business lender in dollars.
$57.4 millionSince 2001, Wells Fargo hasinvested $57.4 million inmicrobusiness incubatorsacross the U.S., helping low- andmoderate-income entrepreneursstart or expand their businesses.
80478_L3_L4_L5_p1_24.indd 17 2/21/12 10:03 PM

18
18 of 24
Helping customers succeed financially means more than providing advice to millions of individuals as they earn, save, spend, and invest. It also means working with thousands of innovative companies with new ideas — like the one that now supplies 53.5 megawatts of solar energy in New Mexico.
53.5 megawatts
80478_L3_L4_L5_p1_24.indd 18 2/21/12 10:13 PM
19
19 of 24
A multi-site SunEdison solar farm in the southeastern part of the state can generate enough power to supply more than 8,000 U.S. homes each year. The project’s construction financing was made possible by a partnership among four teams in Wells Fargo’s Wholesale Banking group: the Cleantech Group in Commercial Banking, Wells Fargo Securities, Wells Fargo Equipment Finance, and Wells Fargo Environmental Finance.
Wells Fargo also has committed to provide permanent equity financing for the solar farm, which is the largest in New Mexico and one of the largest in the U.S.
“Everyone wants a more sustainable energy future,” said the Cleantech Group’s Andrew Kho. “The success of this project is one step toward that end — and a testament to Wells Fargo’s commitment to it.”
Wells Fargo has seven business groups across the company equipped to serve different aspects of the cleantech industry and environmental markets, from solar financing for homeowners and businesses to insurance brokerage and trust services for large-scale environmental projects. Wells Fargo began investing equity in solar projects in 2007, and in 2010 began offering construction financing.
Andrew Kho at SunEdison solar farm, Carlsbad, N.M.
$3.6 billionWells Fargo has provided more than $3.6 billion in equity and debt financing to 39 wind projects and more than 260 solar projects in 24 states since 2006.
8%Wells Fargo’s Wholesale Bank saw loan growth of 8 percent in 2011.
80478_L3_L4_L5_p1_24.indd 19 2/21/12 10:13 PM

20
20 of 24
Army Sgt. Buddy Mays and his family, Meansville, Ga.
80478_L3_L4_L5_p1_24.indd 20 2/21/12 10:03 PM
21
Take Army Sgt. Buddy Mays ofMeansville, Ga., who returned home toan uncertain future after his Humveewas hit by a roadside bomb in Iraq.He was left a paraplegic and facednot only supporting his wife and twoyoung daughters but also a draftyhouse that he could barely navigate inhis wheelchair or afford because of itshigh energy costs.
That all changed because ofWells Fargo’s partnership with PurpleHeart Homes of Statesville, N.C., oneof 25,000 nonprofits Wells Fargoworked with in 2011 to make adifference in the lives of others.
Purple Heart Homes founders JohnGallina and Dale Beatty (also injuredIraq combat veterans) turned toWells Fargo to help rehabilitate Mays’shome because of the company’sreputation for bringing communityleadership to bear when confrontedwith a tough challenge.
“Community support, financing, andvolunteers — Wells Fargo brings all ofthat,” Gallina said.
With the help of an army of Wells Fargovolunteers from Georgia CommunityBanking, Environmental Affairs,and Wells Fargo Home Mortgage,Mays’s house today is a differentplace: wheelchair accessible andeasier to maintain, thanks to energy-efficient heating and cooling systems,enhanced insulation, and ENERGYSTAR® appliances.
“It’s simplified everyday life andeverything in my house in a way thatmost people will never understand,”Mays said. “The volunteers overwhelmme the most. That all of these peoplewho don’t know me would do this —well, there’s really not much I can saybut ‘thanks.’ ”
How did Wells Fargo become known as one of themost generous companies in the U.S.? By investingour resources in the thousands of communities weare proud to call home — and by helping solve bigissues one at a time.
25,000 partnerships
›
›
›
›
2011
Build and renovateaffordable housing.
Teach financial literacy andworkforce development skills.
Help struggling homeownersstay in their homes.
Read to children in elementaryschool classrooms.
In 2011, Wells Fargopartnered with nonprofits to:
80478_L3_L4_L5_p1_24.indd 21 2/21/12 10:03 PM

22
Investing in our communities
$213,500,000Wells Fargo contributed $213.5 million to 25,000nonprofits in 2011. That equates to $4.1 million everyweek or $585,000 every day or $24,000 every hour.
Where we giveEducation 32%Community Development 30%Human Services 23%Arts and Culture 7%Civic 6%Environmental 2%
Our community commitmentSocial capitalapplying our best thinking asleaders in making communitiesbetter places to live and work
Team member volunteerismencouraging and celebrating thegood work team members do intheir communities
Financial contributionsgiving with purpose and focus
Complianceconducting business ethicallyand responsibly accordingto legal requirements and ourown standards
Environmental progress> More than $11.5 billion in
environmental financingsince 2005
> All deposit-taking ATMs inour network of more than12,000 machines across thecountry are now entirelyEnvelope-FreeSM
> Earned a 2011 LeadershipAward from the U.S. GreenBuilding Council for ourcommitment to environmentallyresponsible building design,construction, and operation
$63.9 milliondonated by team membersto more than 28,000 nonprofits
$67.8 millionto educational organizations —which includes $18.5 million inmatched educational donationsfrom team members
1.5 millionhours volunteered by team members— average value of a volunteer hour:$21.36, equivalent to $32.1 millionin time contributed
$3.4 billion*
in community developmentloans and investments inprojects that support affordablehousing, community services,and economic development,revitalization, and stabilization
* preliminary estimate; subject to changepending regulatory filing
80478_L3_L4_L5_p1_24.indd 22 2/21/12 10:03 PM
23
23 of 24
Board of Directors
John S. Chen 6Chairman, CEOSybase, Inc.Dublin, California(Computer software)
Federico F. Peña 1Senior AdvisorVestar Capital PartnersDenver, Colorado(Private equity)
Philip J. Quigley 1, 3, 5Retired Chairman, President, CEOPacific Telesis GroupSan Francisco, California(Telecommunications)
Nicholas G. Moore 1, 3, 7Retired Global ChairmanPricewaterhouseCoopersNew York, New York(Accounting)
Lloyd H. Dean 2, 3, 6, 7President, CEODignity HealthSan Francisco, California(Healthcare)
John D. Baker II 1, 2, 3Executive ChairmanPatriot Transportation Holding, Inc.Jacksonville, Florida(Transportation, real estate management)
Judith M. Runstad 2, 3, 4, 7Of CounselFoster Pepper PLLCSeattle, Washington(Law firm)
Susan E. Engel 3, 4, 6Chief Executive OfficerPortero, Inc.New York, New York(Online luxury retailer)
Stephen W. Sanger * 5, 6, 7Retired ChairmanGeneral Mills, Inc.Minneapolis, Minnesota(Packaged foods)
John G. Stumpf Chairman, President, CEOWells Fargo & Company
Enrique Hernandez, Jr. 1, 2, 4, 7Chairman, CEOInter-Con Security Systems, Inc.Pasadena, California(Security services)
Cynthia H. Milligan 2, 3, 5, 7Dean EmeritusCollege of Business AdministrationUniversity of Nebraska – Lincoln, Nebraska(Higher education)
Susan G. Swenson 1, 5Retired President, CEOSage Software – North AmericaIrvine, California(Business software and services supply)
Standing Committees1. Audit and Examination2. Corporate Responsibility3. Credit4. Finance5. Governance and Nominating6. Human Resources7. Risk
* Lead Director
Elaine L. Chao 2, 4Distinguished FellowThe Heritage FoundationWashington, D.C.(Educational and research organization)
Mackey J. McDonald 5, 6Retired Chairman, CEOVF CorporationGreensboro, North Carolina(Apparel manufacturer)
Donald M. James 4, 6Chairman, CEOVulcan Materials CompanyBirmingham, Alabama(Construction materials)
John G. Stumpf, Chairman, President and CEO *
Paul R. Ackerman, TreasurerCaryl J. Athanasiu, Chief Operational Risk OfficerPatricia R. Callahan, Chief Administrative Officer *Jon R. Campbell, Social ResponsibilityDavid M. Carroll, Wealth, Brokerage
and Retirement *Donald E. Dana, Corporate PropertiesHope A. Hardison, Human ResourcesMichael J. Heid, Home Mortgage *Bruce E. Helsel, Corporate DevelopmentLaurel A. Holschuh, Corporate SecretaryDavid A. Hoyt, Wholesale Banking *David M. Julian, Chief Market Risk OfficerRichard D. Levy, Controller *
Diane P. Lilly, Government RelationsMichael J. Loughlin, Chief Risk Officer *Kevin McCabe, Chief AuditorAvid Modjtabai, Consumer Lending *Jamie Moldafsky, Chief Marketing OfficerKevin A. Rhein, Chief Information Officer *Joseph J. Rice, Chief Credit OfficerJames H. Rowe, Investor RelationsEric D. Shand, Chief Loan ExaminerTimothy J. Sloan, Chief Financial Officer *James M. Strother, General Counsel *Oscar Suris, Corporate CommunicationsCarrie L. Tolstedt, Community Banking *
Executive Officers, Corporate Staff
* “ Executive officers” according to Securities and Exchange Commission rules
80478_L3_L4_L5_p1_24.indd 23 2/21/12 10:03 PM

24
24 of 24
COMMUNITY BANKINGGroup HeadCarrie L. Tolstedt
Business Banking GroupDebra B. Rossi, Merchant ServicesRobert D. Worth, Business Banking
Support GroupDavid J. Rader, SBA Lending
Consumer and Business DepositsKenneth A. Zimmerman
Daniel I. Ayala, Global Remittance Services
Edward M. Kadletz, Debit and Prepaid Products
Customer ConnectionDiana L. Starcher
Internet Services GroupJames P. Smith
Regional BankingRegional PresidentsPaul W. “Chip” Carlisle, Southwest
John T. Gavin, Dallas-Fort WorthGlenn V. Godkin, HoustonDon C. Kendrick, Jr., Central TexasSuzanne M. Ramos, Border BankingLisa J. Riley, New MexicoKenneth A. Telg, Greater Texas
Thomas W. Honig, Mountain MidwestMary Bell, Indiana, OhioFred Bertoldo,
Wisconsin, Michigan, ChicagoNathan E. Christian, ColoradoScott Johnson, Iowa, IllinoisKirk L. Kellner,
Kansas, Missouri, NebraskaTimothy S. Kugler, WyomingDavid R. Kvamme, Minnesota Great LakesDaniel P. Murphy, North Dakota,
South DakotaJoy N. Ott, Montana
Gerrit van Huisstede, Western MountainKirk V. Clausen, NevadaPamela M. Conboy, ArizonaDana B. Reddington, IdahoRichard Strutz, AlaskaGreg A. Winegardner, UtahPatrick G. Yalung, Washington
Laura A. Schulte, EasternShelley Freeman, Florida
Scott M. Coble, North FloridaCarl A. Miller, Jr., Greater Gulf CoastFrank Newman III, South FloridaLarisa F. Perry, Central Florida
Darryl G. Harmon, SoutheastMichael S. Donnelly, AtlantaGlen M. Kelley, Greater GeorgiaLeigh Vincent Collier, Mid-South
Pete Jones, Mid-AtlanticAndrew M. Bertamini, MarylandTimothy A. Butturini, Greater VirginiaMichael L. Golden,
Greater Washington, D.C.Deborah E. O’Donnell, Western Virginia
Stanhope A. Kelly, CarolinasKendall K. Alley, CharlotteJack O. Clayton,
Triangle/Eastern North CarolinaLeslie L. Hayes,
Western/Triad North CarolinaForrest R. (Rick) Redden III,
South CarolinaMichelle Y. Lee, Northeast
Lucia DiNapoli Gibbons, Northern New Jersey
Joseph F. Kirk, New York and Connecticut
Brenda K. Ross-Dulan, Southern New Jersey
Hugh C. Long, Penn-DelVincent J. Liuzzi III,
Greater Philadelphia, DelawareGregory S. Redden,
Greater PennsylvaniaLisa J. Stevens, West Coast
Michael F. Billeci, San Francisco Bay AreaJames W. Foley, Greater Bay AreaDavid A. Galasso, Northern and
Central CaliforniaDonald J. Pearson, OregonJohn K. Sotoodeh, Los Angeles Metro,
Orange CountyKim M. Young, Southern CaliforniaMarc Bernstein, Enterprise Small
Business SegmentTodd Reimringer,
Business Payroll Services
CONSUMER LENDINGGroup HeadAvid Modjtabai
Consumer Credit SolutionsThomas A. Wolfe
Dan Abbott, Retail ServicesR. Kirk Bare, Education Financial ServicesJerry Bowen, Commercial AutoDawn Martin Harp, Dealer ServicesPaul S. Tsang, Strategic Auto Investments
Wells Fargo Home MortgageMichael J. Heid
Franklin R. Codel, Mortgage ProductionMary C. Coffin, Performing ServicingMichael J. DeVito, Default ServicingJohn P. Gibbons, Capital Markets
WEALTH , BROKERAGE AND RETIREMENTGroup HeadDavid M. Carroll
Christine A. Deakin, Business ServicesDaniel J. Ludeman, Wells Fargo AdvisorsJohn M. Papadopulos, RetirementJames P. Steiner, Abbot DowningJay S. Welker, Wealth Management
WHOLESALE BANKINGGroup HeadDavid A. Hoyt
Asset Management GroupMichael J. Niedermeyer
Robert W. Bissell, Wells Capital Management
Thomas K. Hoops, Affiliated ManagersKarla M. Rabusch, Wells Fargo
Funds Management, LLC
Commercial BankingPerry G. Pelos
John C. Adams, Northern RegionMary Knell, Washington Division
Tim M. Billerbeck, Business DevelopmentDave R. Golden, Mountain DivisionLisa N. Johnson, Midwest DivisionPaul D. Kalsbeek, Southern RegionRich J. Kerbis, Commercial Banking CreditJohn P. Manning,
Greater Los Angeles DivisionLaura S. Oberst, Central DivisionRob C. Yraceburu,
Southern California DivisionCarlos E. Evans, Eastern Region
Jim E. Fitzgerald, Northeast DivisionStan F. Gibson, Carolinas DivisionHoward M. Halle, Florida DivisionMarybeth Howe, Great Lakes DivisionLarry M. Levy, Mid-Atlantic DivisionSusanne Svizeny,
Pennsylvania, Delaware Division
Commercial Real EstateMark L. Myers
Charles H. “Chip” Fedalen, Institutional and Metro Markets Group
Christopher J. Jordan, Hospitality Finance Group
Robin W. Michel, Regional Private Markets Group
William A. Vernon, Real Estate Merchant Banking
Corporate Banking GroupJ. Michael Johnson
J. Nicholas Cole, Wells Fargo Restaurant Finance
James D. Heinz, U.S. Corporate BankingKyle G. Hranicky, Energy GroupJohn R. Hukari, Equity Funds GroupJay J. Kornmayer, Gaming DivisionBrian J. Van Elslander,
Financial Sponsors GroupDaniel P. Weiler, Financial Institutions
Group; Power and Utilities Group
Insurance GroupLaura Schupbach
Neal R. Aton, Centralized Insurance Business
Michael P. Day, Rural Community Insurance Services, Inc.
Anne J. Doss, National Practice and Specialty Group
Scott R. Isaacson, Insurance Strategy Group
Kevin T. Kenny, Distributed Insurance Brokerage Group
Robert A. Pinkerton, Flatiron CapitalH. David Wood, Insurance
Operations Group
International GroupRichard Yorke
Rajnish Bharadwaj, Cross Border Governance
Peter P. Connolly, Global Transaction Banking
James C. Johnston, EMEA Regional President
John V. Rindlaub, Asia Pacific Regional President
Sanjiv S. Sanghvi, Global Banking GroupCharles H. Silverman,
Global Financial Institutions
Specialized Lending, Servicing and TrustJ. Edward Blakey
Brian Bartlett, Corporate Trust ServicesJoseph R. Becquer, Commercial
Mortgage ServicingJulie Caperton, Asset Backed FinanceLesley A. Eckstein, Community Lending
and InvestmentDouglas J. Mazer, Commercial
Mortgage OriginationJohn M. McQueen, Wells Fargo
Equipment Finance, Inc.Alan Wiener, Multi-family Housing
Wells Fargo Capital FinanceHenry K. Jordan
Scott R. Diehl, Industries GroupJim Dore, Commercial and Retail FinanceGuy K. Fuchs, Corporate Finance
Wells Fargo SecuritiesJohn R. Shrewsberry
Christopher Bartlett, Equity Sales and Trading
Walter Dolhare and Tim Mullins, Fixed Income Sales and Trading
Robert Engel and Jonathan Weiss, Investment Banking and Capital Markets
Benjamin V. Lambert and Roy March, Eastdil Secured, LLC
Diane Schumaker-Krieg, Research and Economics
Phil D. Smith, Government and Institutional Banking
George Wick, Principal Investments
Wholesale CreditDavid Weber
Lezlie J. Beam, Lending ManagerRobert W. Belson, Lending ManagerJames C. Johnston, Lending ManagerKenneth C. McCorkle, AgriBusinessBarry Neal, EnvironmentalMike Sadilek, Loan Workout
Wholesale ServicesStephen M. Ellis
Michael J. Kennedy, Payment StrategiesDaniel C. Peltz, Treasury
Management Group
Senior Business Leaders
80478_L3_L4_L5_p1_24.indd 24 2/21/12 10:03 PM
Financial Review
26 Overview
30 Earnings Performance
41 Balance Sheet Analysis
44 Off-Balance Sheet Arrangements
46 Risk Management
84 Capital Management
87 Regulatory Reform
89 Critical Accounting Policies
95 Current Accounting Developments
96 Forward-Looking Statements
97 Risk Factors
Controls and Procedures
112 Disclosure Controls and Procedures
112 Internal Control over Financial Reporting
112 Management’s Report on Internal Control over Financial Reporting
113 Report of Independent Registered Public Accounting Firm
Financial Statements
114 Consolidated Statement of Income
115 Consolidated Balance Sheet
116 Consolidated Statement of Changes in Equity and Comprehensive Income
120 Consolidated Statement of Cash Flows
Notes to Financial Statements
121 1 Summary of Significant Accounting Policies
131 2 Business Combinations
132 3 Cash, Loan and Dividend Restrictions
132 4 Federal Funds Sold, Securities Purchased under Resale Agreements and Other Short-Term Investments
133 5 Securities Available for Sale
141 6 Loans and Allowance for Credit Losses
159 7 Premises, Equipment, Lease Commitments and Other Assets
160 8 Securitizations and Variable Interest Entities
171 9 Mortgage Banking Activities
174 10 Intangible Assets
175 11 Deposits
176 12 Short-Term Borrowings
177 13 Long-Term Debt
179 14 Guarantees
181 15 Legal Actions
184 16 Derivatives
190 17 Fair Values of Assets and Liabilities
206 18 Preferred Stock
208 19 Common Stock and Stock Plans
212 20 Employee Benefits and Other Expenses
219 21 Income Taxes
221 22 Earnings Per Common Share
222 23 Other Comprehensive Income
223 24 Operating Segments
225 25 Condensed Consolidating Financial Statements
230 26 Regulatory and Agency Capital Requirements
231 Report of Independent Registered Public Accounting Firm
232 Quarterly Financial Data
234 Glossary of Acronyms
25
This Annual Report, including the Financial Review and the Financial Statements and related Notes, contains forward-looking statements, which may include forecasts of our financial results and condition, expectations for our operations and business, and our assumptions for those forecasts and expectations. Do not unduly rely on forward-looking statements. Actual results may differ materially from our forward-looking statements due to several factors. Factors that could cause our actual results to differ materially from our forward-looking statements are described in this Report, including in the “Forward-Looking Statements” and “Risk Factors” sections in this Report, and the “Regulation and Supervision” section of our Annual Report on Form 10-K for the year ended December 31, 2011 (2011 Form 10-K). When we refer to “Wells Fargo,” “the Company,” “we,” “our” or “us” in this Report, we mean Wells Fargo & Company and Subsidiaries (consolidated). When we refer to the “Parent,” we mean Wells Fargo & Company. When we refer to “legacy Wells Fargo,” we mean Wells Fargo excluding Wachovia Corporation (Wachovia). See the Glossary of Acronyms at the end of this Report for terms used throughout this Report.
Financial Review Overview
Wells Fargo & Company is a diversified financial services company with $1.3 trillion in assets. Founded in 1852 and headquartered in San Francisco, we provide banking, insurance, trust and investments, mortgage banking, investment banking, retail banking, brokerage services and consumer and commercial finance through more than 9,000 stores, 12,000 ATMs, the internet and other distribution channels to individuals, businesses and institutions across North America and internationally. With approximately 264,000 active, full-time equivalent team members, we serve one in three households in America and ranked No. 23 on Fortune’s 2011 rankings of America’s largest corporations. We ranked fourth in assets and first in the market value of our common stock among all U.S. banks at December 31, 2011. Our vision is to satisfy all our customers’ financial needs, help them succeed financially, be recognized as the premier financial services company in our markets and be one of America’s great companies. Our primary strategy to achieve this vision is to increase the number of products our customers utilize and to offer them all of the financial products that fulfill their needs. Our cross-sell strategy, diversified business model and the breadth of our geographic reach facilitate growth in both strong and weak economic cycles, as we can grow by expanding the number of products our current customers have with us, gain new customers in our extended markets, and increase market share in many businesses. Our retail bank household cross-sell increased each quarter during 2011 to 5.92 products per household in fourth quarter 2011, up from 5.70 in fourth quarter 2010. We believe there is more opportunity for cross-sell as we continue to earn more business from our customers. Our goal is eight products per customer, which is approximately half of our estimate of potential demand for an average U.S. household. Currently, one of every four of our retail banking households has eight or more products. Our pursuit of growth and earnings performance is influenced by our belief that it is important to maintain a well controlled operating environment. We manage our credit risk by establishing what we believe are sound credit policies for underwriting new business, while monitoring and reviewing the performance of our loan portfolio. We manage the interest rate
and market risks inherent in our asset and liability balances within established ranges, while ensuring adequate liquidity and funding. We maintain strong capital levels to facilitate future growth. Expense management is also important to us, but we approach this in a manner intended to help ensure our revenue is not adversely affected. Our current company-wide expense management initiative is focused on removing unnecessary complexity and eliminating duplication as a way to improve the customer experience and the work process of our team members. With this initiative and the completion of Wachovia merger integration activities, we are targeting fourth quarter 2012 noninterest expense of $11 billion. We expect first quarter 2012 noninterest expense to remain elevated because of seasonally higher personnel expenses and our final quarter of Wachovia integration expenses, partially offset by continued gains from efficiency and cost save initiatives. We expect quarterly total expenses to decline over the rest of 2012, driven by the benefit from ongoing efficiency initiatives and the conclusion of integration activities. However, quarterly expenses may vary due to cyclical or seasonal factors, among others. In addition, we will continue to invest in our businesses and add team members where appropriate. Financial Performance Our 2011 results were strong despite continued economic volatility during the year, with improved credit quality and lower expenses as well as solid growth in deposits and capital, which funded growth in loans and investment securities. Regulatory reform and related initiatives also created a difficult environment in which to achieve strong financial performance. For example, changes mandated by Regulation E and related overdraft policy changes implemented in third quarter 2010 decreased our service charges on deposit accounts. Also, implementation of the Durbin Amendment to the Dodd-Frank Act in fourth quarter 2011 reduced debit interchange fees and the mortgage servicing regulatory consent orders that we entered into with our regulators in April 2011 and other regulatory activities contributed to lowered residential mortgage
26
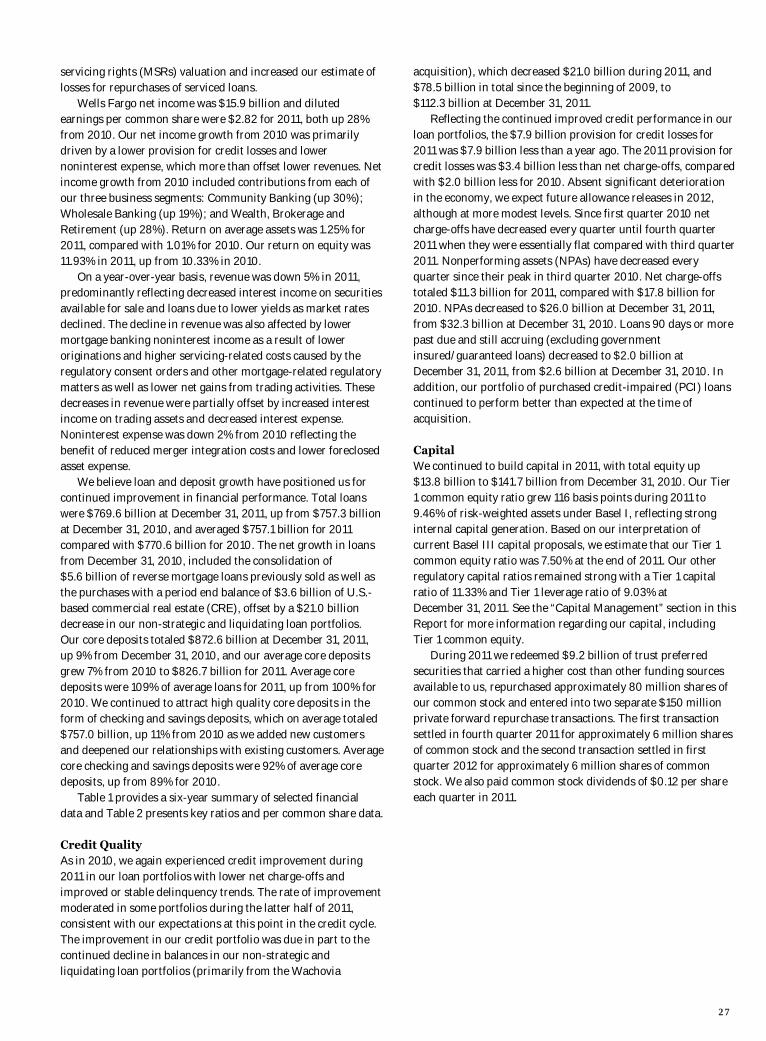
servicing rights (MSRs) valuation and increased our estimate of losses for repurchases of serviced loans. Wells Fargo net income was $15.9 billion and diluted earnings per common share were $2.82 for 2011, both up 28% from 2010. Our net income growth from 2010 was primarily driven by a lower provision for credit losses and lower noninterest expense, which more than offset lower revenues. Net income growth from 2010 included contributions from each of our three business segments: Community Banking (up 30%); Wholesale Banking (up 19%); and Wealth, Brokerage and Retirement (up 28%). Return on average assets was 1.25% for 2011, compared with 1.01% for 2010. Our return on equity was 11.93% in 2011, up from 10.33% in 2010. On a year-over-year basis, revenue was down 5% in 2011, predominantly reflecting decreased interest income on securities available for sale and loans due to lower yields as market rates declined. The decline in revenue was also affected by lower mortgage banking noninterest income as a result of lower originations and higher servicing-related costs caused by the regulatory consent orders and other mortgage-related regulatory matters as well as lower net gains from trading activities. These decreases in revenue were partially offset by increased interest income on trading assets and decreased interest expense. Noninterest expense was down 2% from 2010 reflecting the benefit of reduced merger integration costs and lower foreclosed asset expense. We believe loan and deposit growth have positioned us for continued improvement in financial performance. Total loans were $769.6 billion at December 31, 2011, up from $757.3 billion at December 31, 2010, and averaged $757.1 billion for 2011 compared with $770.6 billion for 2010. The net growth in loans from December 31, 2010, included the consolidation of $5.6 billion of reverse mortgage loans previously sold as well as the purchases with a period end balance of $3.6 billion of U.S.-based commercial real estate (CRE), offset by a $21.0 billion decrease in our non-strategic and liquidating loan portfolios. Our core deposits totaled $872.6 billion at December 31, 2011, up 9% from December 31, 2010, and our average core deposits grew 7% from 2010 to $826.7 billion for 2011. Average core deposits were 109% of average loans for 2011, up from 100% for 2010. We continued to attract high quality core deposits in the form of checking and savings deposits, which on average totaled $757.0 billion, up 11% from 2010 as we added new customers and deepened our relationships with existing customers. Average core checking and savings deposits were 92% of average core deposits, up from 89% for 2010. Table 1 provides a six-year summary of selected financial data and Table 2 presents key ratios and per common share data. Credit Quality As in 2010, we again experienced credit improvement during 2011 in our loan portfolios with lower net charge-offs and improved or stable delinquency trends. The rate of improvement moderated in some portfolios during the latter half of 2011, consistent with our expectations at this point in the credit cycle. The improvement in our credit portfolio was due in part to the continued decline in balances in our non-strategic and liquidating loan portfolios (primarily from the Wachovia
acquisition), which decreased $21.0 billion during 2011, and $78.5 billion in total since the beginning of 2009, to $112.3 billion at December 31, 2011. Reflecting the continued improved credit performance in our loan portfolios, the $7.9 billion provision for credit losses for 2011 was $7.9 billion less than a year ago. The 2011 provision for credit losses was $3.4 billion less than net charge-offs, compared with $2.0 billion less for 2010. Absent significant deterioration in the economy, we expect future allowance releases in 2012, although at more modest levels. Since first quarter 2010 net charge-offs have decreased every quarter until fourth quarter 2011 when they were essentially flat compared with third quarter 2011. Nonperforming assets (NPAs) have decreased every quarter since their peak in third quarter 2010. Net charge-offs totaled $11.3 billion for 2011, compared with $17.8 billion for 2010. NPAs decreased to $26.0 billion at December 31, 2011, from $32.3 billion at December 31, 2010. Loans 90 days or more past due and still accruing (excluding government insured/guaranteed loans) decreased to $2.0 billion at December 31, 2011, from $2.6 billion at December 31, 2010. In addition, our portfolio of purchased credit-impaired (PCI) loans continued to perform better than expected at the time of acquisition. Capital We continued to build capital in 2011, with total equity up $13.8 billion to $141.7 billion from December 31, 2010. Our Tier 1 common equity ratio grew 116 basis points during 2011 to 9.46% of risk-weighted assets under Basel I, reflecting strong internal capital generation. Based on our interpretation of current Basel III capital proposals, we estimate that our Tier 1 common equity ratio was 7.50% at the end of 2011. Our other regulatory capital ratios remained strong with a Tier 1 capital ratio of 11.33% and Tier 1 leverage ratio of 9.03% at December 31, 2011. See the “Capital Management” section in this Report for more information regarding our capital, including Tier 1 common equity. During 2011 we redeemed $9.2 billion of trust preferred securities that carried a higher cost than other funding sources available to us, repurchased approximately 80 million shares of our common stock and entered into two separate $150 million private forward repurchase transactions. The first transaction settled in fourth quarter 2011 for approximately 6 million shares of common stock and the second transaction settled in first quarter 2012 for approximately 6 million shares of common stock. We also paid common stock dividends of $0.12 per share each quarter in 2011.
27
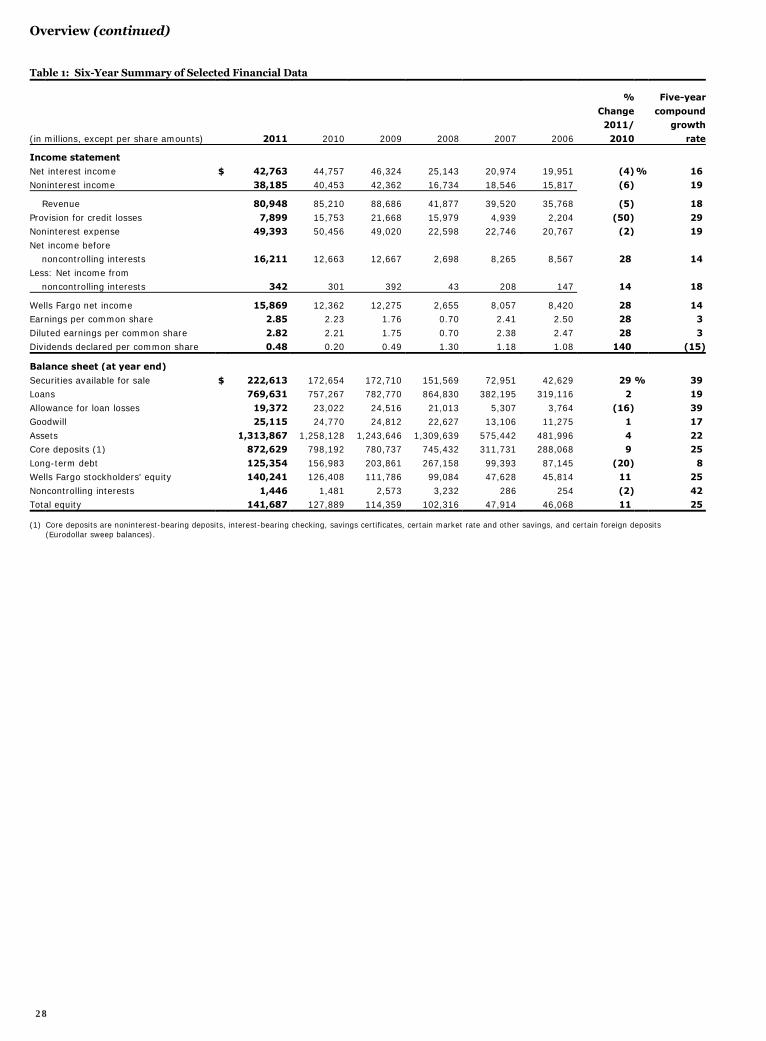
Overview (continued)
Table 1: Six-Year Summary of Selected Financial Data % Five-year
Change compound 2011/ growth
(in millions, except per share amounts) 2011 2010 2009 2008 2007 2006 2010 rate
Income statement
Net interest income $ 42,763 44,757 46,324 25,143 20,974 19,951 (4) % 16 Noninterest income 38,185 40,453 42,362 16,734 18,546 15,817 (6) 19
Revenue 80,948 85,210 88,686 41,877 39,520 35,768 (5) 18
Provision for credit losses 7,899 15,753 21,668 15,979 4,939 2,204 (50) 29 Noninterest expense 49,393 50,456 49,020 22,598 22,746 20,767 (2) 19
Net income before noncontrolling interests 16,211 12,663 12,667 2,698 8,265 8,567 28 14
Less: Net income from noncontrolling interests 342 301 392 43 208 147 14 18
Wells Fargo net income 15,869 12,362 12,275 2,655 8,057 8,420 28 14 Earnings per common share 2.85 2.23 1.76 0.70 2.41 2.50 28 3
Diluted earnings per common share 2.82 2.21 1.75 0.70 2.38 2.47 28 3 Dividends declared per common share 0.48 0.20 0.49 1.30 1.18 1.08 140 (15)
Balance sheet (at year end)
Securities available for sale $ 222,613 172,654 172,710 151,569 72,951 42,629 29 % 39 Loans 769,631 757,267 782,770 864,830 382,195 319,116 2 19
Allowance for loan losses 19,372 23,022 24,516 21,013 5,307 3,764 (16) 39 Goodwill 25,115 24,770 24,812 22,627 13,106 11,275 1 17
Assets 1,313,867 1,258,128 1,243,646 1,309,639 575,442 481,996 4 22 Core deposits (1) 872,629 798,192 780,737 745,432 311,731 288,068 9 25
Long-term debt 125,354 156,983 203,861 267,158 99,393 87,145 (20) 8 Wells Fargo stockholders' equity 140,241 126,408 111,786 99,084 47,628 45,814 11 25
Noncontrolling interests 1,446 1,481 2,573 3,232 286 254 (2) 42 Total equity 141,687 127,889 114,359 102,316 47,914 46,068 11 25
(1) Core deposits are noninterest-bearing deposits, interest-bearing checking, savings certificates, certain market rate and other savings, and certain foreign deposits (Eurodollar sweep balances).
28
Table 2: Ratios and Per Common Share Data Year ended December 31,
2011 2010 2009
Profitability ratios Wells Fargo net income to average assets (ROA) 1.25 % 1.01 0.97
Wells Fargo net income applicable to common stock to average Wells Fargo common stockholders' equity (ROE) 11.93 10.33 9.88
Efficiency ratio (1) 61.0 59.2 55.3 Capital ratios
At year end: Wells Fargo common stockholders' equity to assets 9.87 9.41 8.34
Total equity to assets 10.78 10.16 9.20 Risk-based capital (2)
Tier 1 capital 11.33 11.16 9.25
Total capital 14.76 15.01 13.26
Tier 1 leverage (2) 9.03 9.19 7.87 Tier 1 common equity (3) 9.46 8.30 6.46
Average balances: Average Wells Fargo common stockholders' equity to average assets 9.91 9.17 6.41
Average total equity to average assets 10.80 9.96 9.34 Per common share data
Dividend payout (4) 17.0 9.0 27.9 Book value $ 24.64 22.49 20.03
Market price (5) High 34.25 34.25 31.53
Low 22.58 23.02 7.80 Year end 27.56 30.99 26.99
(1) The efficiency ratio is noninterest expense divided by total revenue (net interest income and noninterest income). (2) See Note 26 (Regulatory and Agency Capital Requirements) to Financial Statements in this Report for additional information. (3) See the "Capital Management" section in this Report for additional information. (4) Dividends declared per common share as a percentage of earnings per common share. (5) Based on daily prices reported on the New York Stock Exchange Composite Transaction Reporting System.
29
Earnings Performance
Wells Fargo net income for 2011 was $15.9 billion ($2.82 diluted earnings per common share) compared with $12.4 billion ($2.21 diluted earnings per common share) for 2010 and $12.3 billion ($1.75 diluted earnings per common share) for 2009. Our 2011 earnings reflected strong execution of our business strategy in a difficult economic environment. The key drivers of our financial performance in 2011 were improved credit quality, lower operating costs, diversified sources of fee income, balanced net interest and fee income, a diversified loan portfolio and increased deposits. Revenue, the sum of net interest income and noninterest income, was $80.9 billion in 2011, compared with $85.2 billion in 2010 and $88.7 billion in 2009. The decline in revenue in 2011 was predominantly due to lower net interest income, mortgage banking and net gains from trading activities. Net interest income of $42.8 billion in 2011, represented 53% of revenue, compared with $44.8 billion (53%) in 2010 and $46.3 billion (52%) in 2009. The 4% decline in 2011 net interest income from 2010 reflected a 32 basis points decline in the net interest margin and a 2% decline in average loans. The decline in average loans from 2010 reflected reductions in the non-strategic and liquidating loan portfolios, partially offset by loan growth and loan acquisitions. Continued success in generating low-cost deposits enabled the Company to grow assets by funding loan and securities growth while reducing higher cost long-term debt.
Noninterest income was $38.2 billion in 2011, representing 47% of revenue, compared with $40.5 billion (47%) in 2010 and $42.4 billion (48%) in 2009. The decrease in noninterest income in 2011 was due largely to lower service charges on deposit accounts, net gains on mortgage loan origination/sales activities and net gains from trading activities. Noninterest expense was $49.4 billion in 2011, compared with $50.5 billion in 2010 and $49.0 billion in 2009. Noninterest expense as a percentage of revenue was 61% in 2011, 59% in 2010 and 55% in 2009. Noninterest expense for 2011 included $1.7 billion of Wachovia merger-related integration expense, compared with $1.9 billion in 2010 and $895 million in 2009. Table 3 presents the components of revenue and noninterest expense as a percentage of revenue for year-over-year results.
30
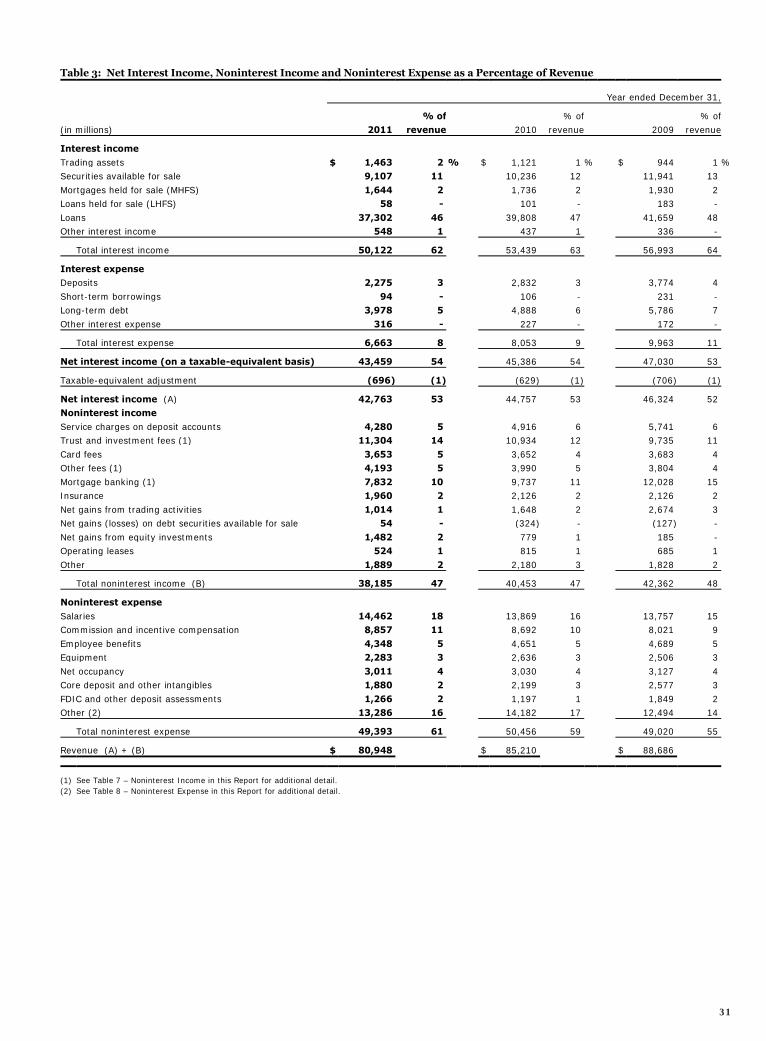
Table 3: Net Interest Income, Noninterest Income and Noninterest Expense as a Percentage of Revenue
Year ended December 31,
% of % of % of (in millions) 2011 revenue 2010 revenue 2009 revenue
Interest income
Trading assets $ 1,463 2 % $ 1,121 1 % $ 944 1 % Securities available for sale 9,107 11 10,236 12 11,941 13
Mortgages held for sale (MHFS) 1,644 2 1,736 2 1,930 2 Loans held for sale (LHFS) 58 - 101 - 183 -
Loans 37,302 46 39,808 47 41,659 48 Other interest income 548 1 437 1 336 -
Total interest income 50,122 62 53,439 63 56,993 64
Interest expense Deposits 2,275 3 2,832 3 3,774 4
Short-term borrowings 94 - 106 - 231 - Long-term debt 3,978 5 4,888 6 5,786 7
Other interest expense 316 - 227 - 172 -
Total interest expense 6,663 8 8,053 9 9,963 11
Net interest income (on a taxable-equivalent basis) 43,459 54 45,386 54 47,030 53
Taxable-equivalent adjustment (696) (1) (629) (1) (706) (1)
Net interest income (A) 42,763 53 44,757 53 46,324 52 Noninterest income
Service charges on deposit accounts 4,280 5 4,916 6 5,741 6 Trust and investment fees (1) 11,304 14 10,934 12 9,735 11
Card fees 3,653 5 3,652 4 3,683 4 Other fees (1) 4,193 5 3,990 5 3,804 4
Mortgage banking (1) 7,832 10 9,737 11 12,028 15 Insurance 1,960 2 2,126 2 2,126 2
Net gains from trading activities 1,014 1 1,648 2 2,674 3 Net gains (losses) on debt securities available for sale 54 - (324) - (127) -
Net gains from equity investments 1,482 2 779 1 185 - Operating leases 524 1 815 1 685 1
Other 1,889 2 2,180 3 1,828 2
Total noninterest income (B) 38,185 47 40,453 47 42,362 48
Noninterest expense
Salaries 14,462 18 13,869 16 13,757 15 Commission and incentive compensation 8,857 11 8,692 10 8,021 9
Employee benefits 4,348 5 4,651 5 4,689 5 Equipment 2,283 3 2,636 3 2,506 3
Net occupancy 3,011 4 3,030 4 3,127 4 Core deposit and other intangibles 1,880 2 2,199 3 2,577 3
FDIC and other deposit assessments 1,266 2 1,197 1 1,849 2 Other (2) 13,286 16 14,182 17 12,494 14
Total noninterest expense 49,393 61 50,456 59 49,020 55
Revenue (A) + (B) $ 80,948 $ 85,210 $ 88,686
(1) See Table 7 – Noninterest Income in this Report for additional detail. (2) See Table 8 – Noninterest Expense in this Report for additional detail.
31

Earnings Performance (continued)
Net Interest Income Net interest income is the interest earned on debt securities, loans (including yield-related loan fees) and other interest-earning assets minus the interest paid for deposits, short-term borrowings and long-term debt. The net interest margin is the average yield on earning assets minus the average interest rate paid for deposits and our other sources of funding. Net interest income and the net interest margin are presented on a taxable-equivalent basis in Table 5 to consistently reflect income from taxable and tax-exempt loans and securities based on a 35% federal statutory tax rate. Net interest income and the net interest margin are significantly influenced by the mix and overall size of our earning asset portfolio and the cost of funding those assets. In addition, some sources of interest income, such as loan prepayment fees and collection of interest on nonaccrual loans, can vary from period to period. Net interest income on a taxable-equivalent basis was $43.5 billion in 2011, compared with $45.4 billion in 2010 and $47.0 billion in 2009. The net interest margin was 3.94% in 2011, down 32 basis points from 4.26% in 2010 and down 34 basis points from 4.28% in 2009. The decline in net interest income and the net interest margin was largely due to repricing of the balance sheet as higher-yielding loan and security runoff was partially offset by new loans, investment portfolio purchases and growth in short-term investments. The decline in earning asset income was mitigated by a reduction in funding costs resulting from disciplined deposit pricing, debt maturities, and redemptions of higher cost trust preferred securities. Table 4 presents the components of earning assets and funding sources as a percentage of earning assets and provides an analysis of year-over-year changes that influenced net interest income. Soft consumer loan demand and the impact of liquidating certain loan portfolios reduced average loans in 2011 to 69% of average earning assets compared with 72% in 2010. Average short-term investments and trading account assets were 12% of earning assets in 2011 up from 9% in 2010.
Core deposits are an important low-cost source of funding and affect both net interest income and the net interest margin. Core deposits include noninterest-bearing deposits, interest-bearing checking, savings certificates, certain market rate and other savings, and certain foreign deposits (Eurodollar sweep balances). Average core deposits rose to $826.7 billion in 2011 from $772.0 billion in 2010 and funded 109% and 100% of average loans, respectively. Average core deposits increased to 75% of average earning assets in 2011, compared with 73% a year ago. The cost of these deposits declined significantly as the mix shifted from higher cost certificates of deposit to checking and savings products, which were also at lower yields relative to 2010. About 91% of our average core deposits are in checking and savings deposits, one of the highest percentages in the industry. Table 5 presents the individual components of net interest income and the net interest margin. The effect on interest income and costs of earning asset and funding mix changes described above, combined with rate changes during 2011, are analyzed in Table 6.
32
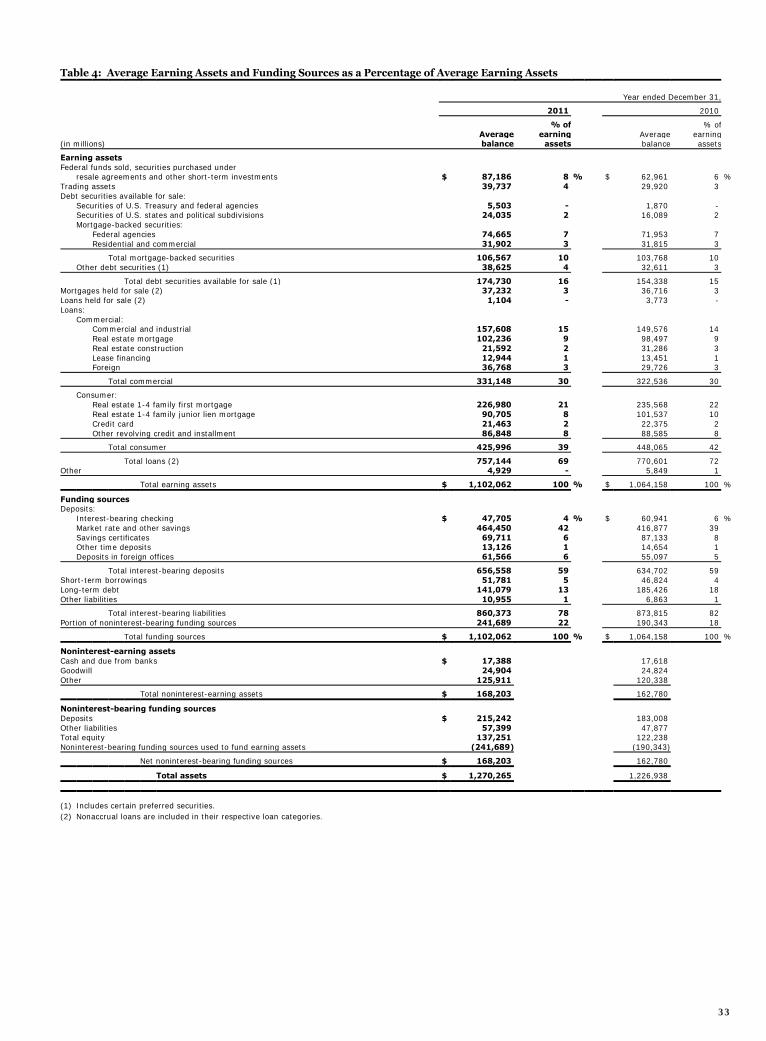
Table 4: Average Earning Assets and Funding Sources as a Percentage of Average Earning Assets
Year ended December 31,
2011 2010
% of % of Average earning Average earning (in millions) balance assets balance assets
Earning assets Federal funds sold, securities purchased under resale agreements and other short-term investments $ 87,186 8 % $ 62,961 6 % Trading assets 39,737 4 29,920 3 Debt securities available for sale: Securities of U.S. Treasury and federal agencies 5,503 - 1,870 - Securities of U.S. states and political subdivisions 24,035 2 16,089 2 Mortgage-backed securities: Federal agencies 74,665 7 71,953 7 Residential and commercial 31,902 3 31,815 3
Total mortgage-backed securities 106,567 10 103,768 10 Other debt securities (1) 38,625 4 32,611 3
Total debt securities available for sale (1) 174,730 16 154,338 15 Mortgages held for sale (2) 37,232 3 36,716 3 Loans held for sale (2) 1,104 - 3,773 - Loans: Commercial: Commercial and industrial 157,608 15 149,576 14 Real estate mortgage 102,236 9 98,497 9 Real estate construction 21,592 2 31,286 3 Lease financing 12,944 1 13,451 1 Foreign 36,768 3 29,726 3
Total commercial 331,148 30 322,536 30
Consumer: Real estate 1-4 family first mortgage 226,980 21 235,568 22 Real estate 1-4 family junior lien mortgage 90,705 8 101,537 10 Credit card 21,463 2 22,375 2 Other revolving credit and installment 86,848 8 88,585 8
Total consumer 425,996 39 448,065 42
Total loans (2) 757,144 69 770,601 72 Other 4,929 - 5,849 1
Total earning assets $ 1,102,062 100 % $ 1,064,158 100 %
Funding sources Deposits: Interest-bearing checking $ 47,705 4 % $ 60,941 6 % Market rate and other savings 464,450 42 416,877 39 Savings certificates 69,711 6 87,133 8 Other time deposits 13,126 1 14,654 1 Deposits in foreign offices 61,566 6 55,097 5
Total interest-bearing deposits 656,558 59 634,702 59 Short-term borrowings 51,781 5 46,824 4 Long-term debt 141,079 13 185,426 18 Other liabilities 10,955 1 6,863 1
Total interest-bearing liabilities 860,373 78 873,815 82 Portion of noninterest-bearing funding sources 241,689 22 190,343 18
Total funding sources $ 1,102,062 100 % $ 1,064,158 100 %
Noninterest-earning assets Cash and due from banks $ 17,388 17,618 Goodwill 24,904 24,824 Other 125,911 120,338
Total noninterest-earning assets $ 168,203 162,780
Noninterest-bearing funding sources Deposits $ 215,242 183,008 Other liabilities 57,399 47,877 Total equity 137,251 122,238 Noninterest-bearing funding sources used to fund earning assets (241,689) (190,343)
Net noninterest-bearing funding sources $ 168,203 162,780
Total assets $ 1,270,265 1,226,938 (1) Includes certain preferred securities. (2) Nonaccrual loans are included in their respective loan categories.
33
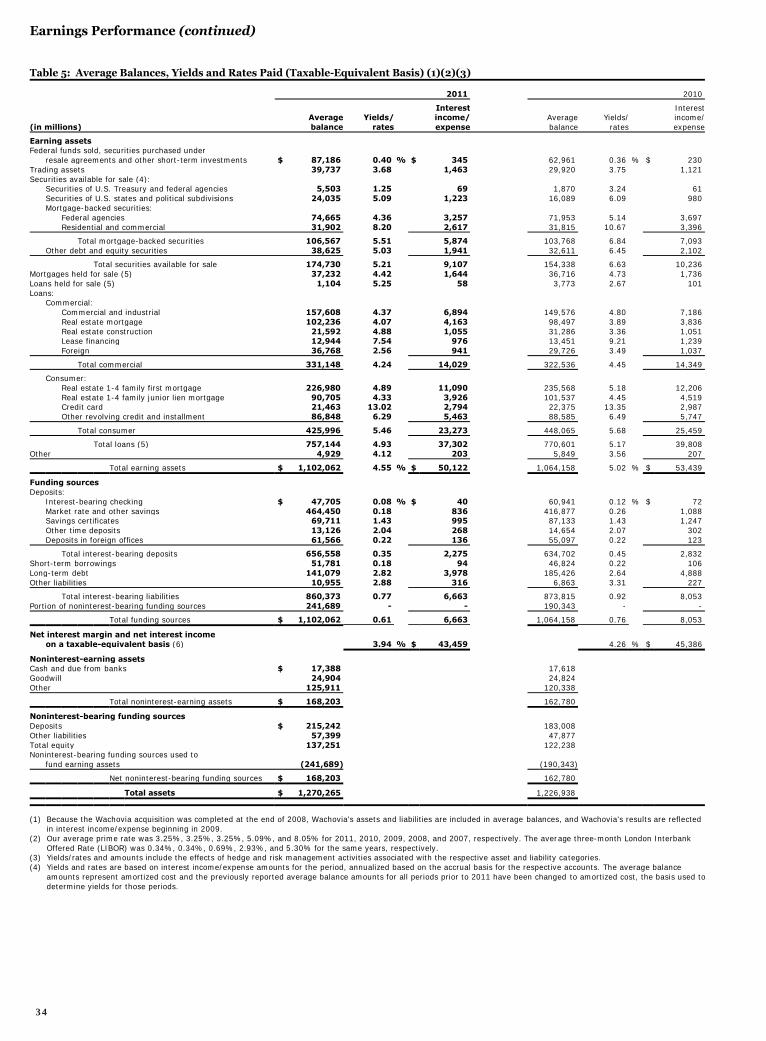
Earnings Performance (continued)
Table 5: Average Balances, Yields and Rates Paid (Taxable-Equivalent Basis) (1)(2)(3) 2011 2010
Interest Interest Average Yields/ income/ Average Yields/ income/ (in millions) balance rates expense balance rates expense
Earning assets Federal funds sold, securities purchased under resale agreements and other short-term investments $ 87,186 0.40 % $ 345 62,961 0.36 % $ 230 Trading assets 39,737 3.68 1,463 29,920 3.75 1,121 Securities available for sale (4): Securities of U.S. Treasury and federal agencies 5,503 1.25 69 1,870 3.24 61 Securities of U.S. states and political subdivisions 24,035 5.09 1,223 16,089 6.09 980 Mortgage-backed securities: Federal agencies 74,665 4.36 3,257 71,953 5.14 3,697 Residential and commercial 31,902 8.20 2,617 31,815 10.67 3,396
Total mortgage-backed securities 106,567 5.51 5,874 103,768 6.84 7,093 Other debt and equity securities 38,625 5.03 1,941 32,611 6.45 2,102
Total securities available for sale 174,730 5.21 9,107 154,338 6.63 10,236 Mortgages held for sale (5) 37,232 4.42 1,644 36,716 4.73 1,736 Loans held for sale (5) 1,104 5.25 58 3,773 2.67 101 Loans: Commercial: Commercial and industrial 157,608 4.37 6,894 149,576 4.80 7,186 Real estate mortgage 102,236 4.07 4,163 98,497 3.89 3,836 Real estate construction 21,592 4.88 1,055 31,286 3.36 1,051 Lease financing 12,944 7.54 976 13,451 9.21 1,239 Foreign 36,768 2.56 941 29,726 3.49 1,037
Total commercial 331,148 4.24 14,029 322,536 4.45 14,349
Consumer: Real estate 1-4 family first mortgage 226,980 4.89 11,090 235,568 5.18 12,206 Real estate 1-4 family junior lien mortgage 90,705 4.33 3,926 101,537 4.45 4,519 Credit card 21,463 13.02 2,794 22,375 13.35 2,987 Other revolving credit and installment 86,848 6.29 5,463 88,585 6.49 5,747
Total consumer 425,996 5.46 23,273 448,065 5.68 25,459
Total loans (5) 757,144 4.93 37,302 770,601 5.17 39,808 Other 4,929 4.12 203 5,849 3.56 207
Total earning assets $ 1,102,062 4.55 % $ 50,122 1,064,158 5.02 % $ 53,439
Funding sources Deposits: Interest-bearing checking $ 47,705 0.08 % $ 40 60,941 0.12 % $ 72 Market rate and other savings 464,450 0.18 836 416,877 0.26 1,088 Savings certificates 69,711 1.43 995 87,133 1.43 1,247 Other time deposits 13,126 2.04 268 14,654 2.07 302 Deposits in foreign offices 61,566 0.22 136 55,097 0.22 123
Total interest-bearing deposits 656,558 0.35 2,275 634,702 0.45 2,832 Short-term borrowings 51,781 0.18 94 46,824 0.22 106 Long-term debt 141,079 2.82 3,978 185,426 2.64 4,888 Other liabilities 10,955 2.88 316 6,863 3.31 227
Total interest-bearing liabilities 860,373 0.77 6,663 873,815 0.92 8,053 Portion of noninterest-bearing funding sources 241,689 - - 190,343 - -
Total funding sources $ 1,102,062 0.61 6,663 1,064,158 0.76 8,053
Net interest margin and net interest income on a taxable-equivalent basis (6) 3.94 % $ 43,459 4.26 % $ 45,386
Noninterest-earning assets Cash and due from banks $ 17,388 17,618 Goodwill 24,904 24,824 Other 125,911 120,338
Total noninterest-earning assets $ 168,203 162,780
Noninterest-bearing funding sources Deposits $ 215,242 183,008 Other liabilities 57,399 47,877 Total equity 137,251 122,238 Noninterest-bearing funding sources used to fund earning assets (241,689) (190,343)
Net noninterest-bearing funding sources $ 168,203 162,780
Total assets $ 1,270,265 1,226,938
(1) Because the Wachovia acquisition was completed at the end of 2008, Wachovia's assets and liabilities are included in average balances, and Wachovia's results are reflected in interest income/expense beginning in 2009.
(2) Our average prime rate was 3.25%, 3.25%, 3.25%, 5.09%, and 8.05% for 2011, 2010, 2009, 2008, and 2007, respectively. The average three-month London Interbank Offered Rate (LIBOR) was 0.34%, 0.34%, 0.69%, 2.93%, and 5.30% for the same years, respectively.
(3) Yields/rates and amounts include the effects of hedge and risk management activities associated with the respective asset and liability categories. (4) Yields and rates are based on interest income/expense amounts for the period, annualized based on the accrual basis for the respective accounts. The average balance
amounts represent amortized cost and the previously reported average balance amounts for all periods prior to 2011 have been changed to amortized cost, the basis used to determine yields for those periods.
34

2009 2008 2007
Interest Interest Interest Average Yields/ income/ Average Yields/ income/ Average Yields/ income/ balance rates expense balance rates expense balance rates expense
$ 26,869 0.56 % $ 150 5,293 1.71 % $ 90 4,468 4.99 % $ 223 21,092 4.48 944 4,971 3.80 189 4,291 4.37 188
2,436 2.83 69 1,065 3.84 41 851 4.26 36 13,098 6.42 840 7,329 6.83 501 4,643 7.37 342
84,295 5.45 4,591 43,968 5.97 2,623 38,181 6.10 2,328 45,672 9.09 4,150 23,357 6.04 1,412 6,524 6.12 399
129,967 6.73 8,741 67,325 5.99 4,035 44,705 6.10 2,727 32,022 7.16 2,291 13,956 7.17 1,000 6,343 7.52 477
177,523 6.73 11,941 89,675 6.22 5,577 56,542 6.34 3,582 37,416 5.16 1,930 25,656 6.13 1,573 33,066 6.50 2,150 6,293 2.90 183 837 5.69 48 896 7.76 70
180,924 4.22 7,643 98,620 6.12 6,034 77,965 8.17 6,367 96,273 3.50 3,365 41,659 5.80 2,416 32,722 7.38 2,414 40,885 2.91 1,190 19,453 5.08 988 16,934 7.80 1,321 14,751 9.32 1,375 7,141 5.62 401 5,921 5.84 346 30,661 3.95 1,212 7,127 10.50 748 7,321 11.68 855
363,494 4.07 14,785 174,000 6.08 10,587 140,863 8.02 11,303
238,359 5.45 12,992 75,116 6.67 5,008 61,527 7.25 4,463 106,957 4.76 5,089 75,375 6.55 4,934 72,075 8.12 5,851 23,357 12.16 2,841 19,601 12.13 2,378 15,874 13.58 2,155 90,666 6.56 5,952 54,368 8.72 4,744 54,436 9.71 5,285
459,339 5.85 26,874 224,460 7.60 17,064 203,912 8.71 17,754
822,833 5.06 41,659 398,460 6.94 27,651 344,775 8.43 29,057 6,113 3.05 186 1,920 4.73 91 1,402 5.07 71
$ 1,098,139 5.19 % $ 56,993 526,812 6.69 % $ 35,219 445,440 7.93 % $ 35,341
$ 70,179 0.14 % $ 100 5,650 1.12 % $ 64 5,057 3.16 % $ 160 351,892 0.39 1,375 166,691 1.32 2,195 147,939 2.78 4,105 140,197 1.24 1,738 39,481 3.08 1,215 40,484 4.38 1,773 20,459 2.03 415 6,656 2.83 187 8,937 4.87 435 53,166 0.27 146 47,578 1.81 860 36,761 4.57 1,679
635,893 0.59 3,774 266,056 1.70 4,521 239,178 3.41 8,152 51,972 0.44 231 65,826 2.25 1,478 25,854 4.81 1,245 231,801 2.50 5,786 102,283 3.70 3,789 93,193 5.18 4,824 4,904 3.50 172 - - - - - -
924,570 1.08 9,963 434,165 2.25 9,788 358,225 3.97 14,221 173,569 - - 92,647 - - 87,215 - -
$ 1,098,139 0.91 9,963 526,812 1.86 9,788 445,440 3.19 14,221
4.28 % $ 47,030 4.83 % $ 25,431 4.74 % $ 21,120
$ 19,218 11,175 11,806 23,997 13,353 11,957 121,000 53,056 51,549
$ 164,215 77,584 75,312
$ 171,712 87,820 88,907 48,193 28,658 26,287 117,879 53,753 47,333
(173,569) (92,647) (87,215)
$ 164,215 77,584 75,312
$ 1,262,354 604,396 520,752
(5) Nonaccrual loans and related income are included in their respective loan categories. (6) Includes taxable-equivalent adjustments of $696 million, $629 million, $706 million, $288 million and $146 million for 2011, 2010, 2009, 2008 and 2007, respectively,
primarily related to tax-exempt income on certain loans and securities. The federal statutory tax rate utilized was 35% for the periods presented.
35
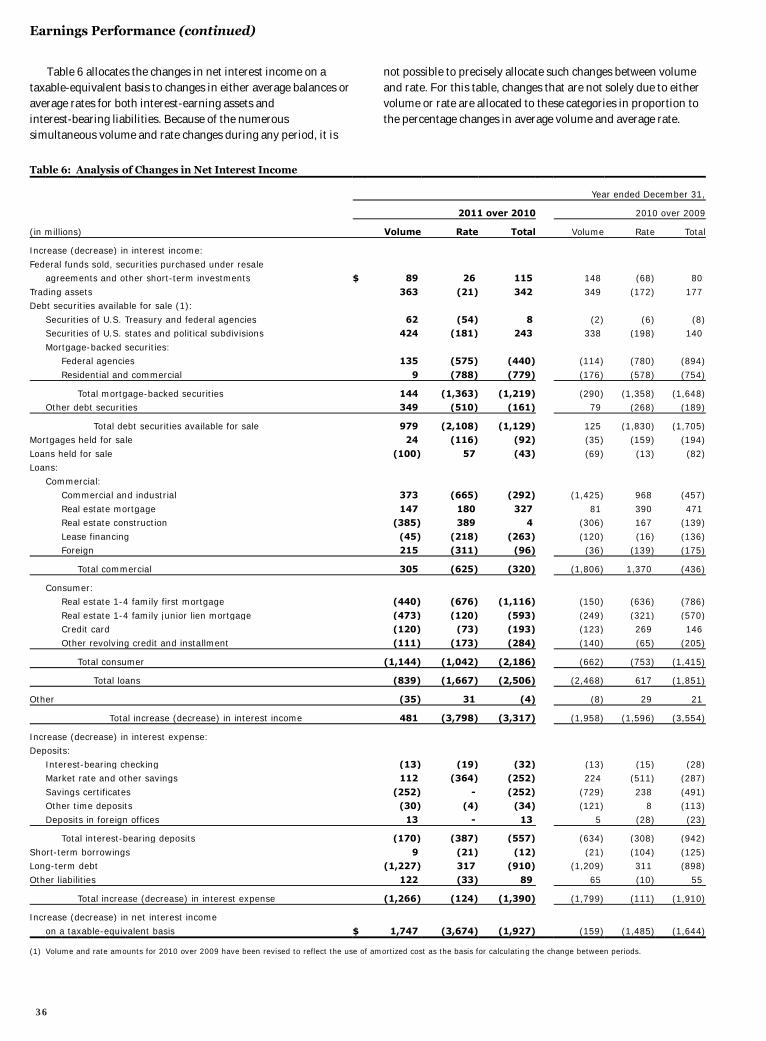
Earnings Performance (continued)
Table 6 allocates the changes in net interest income on a taxable-equivalent basis to changes in either average balances or average rates for both interest-earning assets and interest-bearing liabilities. Because of the numerous simultaneous volume and rate changes during any period, it is
not possible to precisely allocate such changes between volume and rate. For this table, changes that are not solely due to either volume or rate are allocated to these categories in proportion to the percentage changes in average volume and average rate.
Table 6: Analysis of Changes in Net Interest Income Year ended December 31,
2011 over 2010 2010 over 2009
(in millions) Volume Rate Total Volume Rate Total
Increase (decrease) in interest income:
Federal funds sold, securities purchased under resale agreements and other short-term investments $ 89 26 115 148 (68) 80
Trading assets 363 (21) 342 349 (172) 177 Debt securities available for sale (1):
Securities of U.S. Treasury and federal agencies 62 (54) 8 (2) (6) (8) Securities of U.S. states and political subdivisions 424 (181) 243 338 (198) 140
Mortgage-backed securities: Federal agencies 135 (575) (440) (114) (780) (894)
Residential and commercial 9 (788) (779) (176) (578) (754)
Total mortgage-backed securities 144 (1,363) (1,219) (290) (1,358) (1,648) Other debt securities 349 (510) (161) 79 (268) (189)
Total debt securities available for sale 979 (2,108) (1,129) 125 (1,830) (1,705) Mortgages held for sale 24 (116) (92) (35) (159) (194)
Loans held for sale (100) 57 (43) (69) (13) (82) Loans:
Commercial: Commercial and industrial 373 (665) (292) (1,425) 968 (457)
Real estate mortgage 147 180 327 81 390 471 Real estate construction (385) 389 4 (306) 167 (139)
Lease financing (45) (218) (263) (120) (16) (136) Foreign 215 (311) (96) (36) (139) (175)
Total commercial 305 (625) (320) (1,806) 1,370 (436)
Consumer: Real estate 1-4 family first mortgage (440) (676) (1,116) (150) (636) (786)
Real estate 1-4 family junior lien mortgage (473) (120) (593) (249) (321) (570) Credit card (120) (73) (193) (123) 269 146
Other revolving credit and installment (111) (173) (284) (140) (65) (205)
Total consumer (1,144) (1,042) (2,186) (662) (753) (1,415)
Total loans (839) (1,667) (2,506) (2,468) 617 (1,851)
Other (35) 31 (4) (8) 29 21
Total increase (decrease) in interest income 481 (3,798) (3,317) (1,958) (1,596) (3,554)
Increase (decrease) in interest expense: Deposits:
Interest-bearing checking (13) (19) (32) (13) (15) (28) Market rate and other savings 112 (364) (252) 224 (511) (287)
Savings certificates (252) - (252) (729) 238 (491) Other time deposits (30) (4) (34) (121) 8 (113)
Deposits in foreign offices 13 - 13 5 (28) (23)
Total interest-bearing deposits (170) (387) (557) (634) (308) (942)
Short-term borrowings 9 (21) (12) (21) (104) (125) Long-term debt (1,227) 317 (910) (1,209) 311 (898)
Other liabilities 122 (33) 89 65 (10) 55
Total increase (decrease) in interest expense (1,266) (124) (1,390) (1,799) (111) (1,910)
Increase (decrease) in net interest income
on a taxable-equivalent basis $ 1,747 (3,674) (1,927) (159) (1,485) (1,644)
(1) Volume and rate amounts for 2010 over 2009 have been revised to reflect the use of amortized cost as the basis for calculating the change between periods.
36
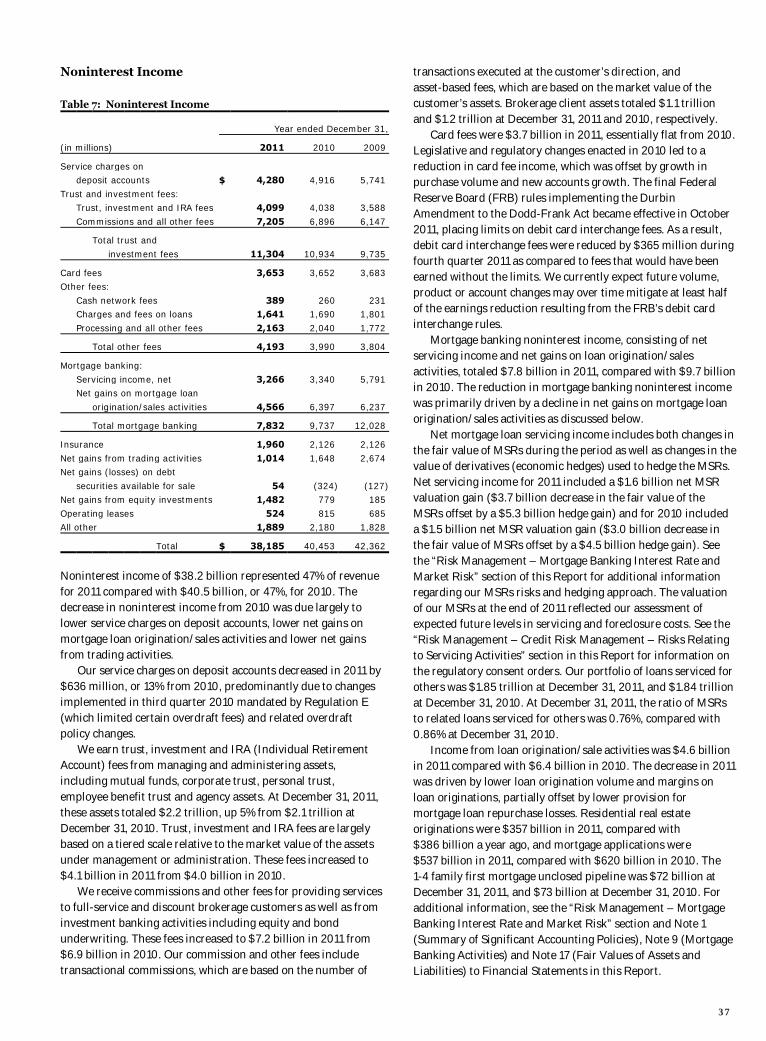
Noninterest Income Table 7: Noninterest Income
Year ended December 31,
(in millions) 2011 2010 2009
Service charges on deposit accounts $ 4,280 4,916 5,741
Trust and investment fees: Trust, investment and IRA fees 4,099 4,038 3,588
Commissions and all other fees 7,205 6,896 6,147
Total trust and
investment fees 11,304 10,934 9,735
Card fees 3,653 3,652 3,683 Other fees:
Cash network fees 389 260 231 Charges and fees on loans 1,641 1,690 1,801
Processing and all other fees 2,163 2,040 1,772
Total other fees 4,193 3,990 3,804
Mortgage banking:
Servicing income, net 3,266 3,340 5,791 Net gains on mortgage loan
origination/sales activities 4,566 6,397 6,237
Total mortgage banking 7,832 9,737 12,028
Insurance 1,960 2,126 2,126
Net gains from trading activities 1,014 1,648 2,674 Net gains (losses) on debt
securities available for sale 54 (324) (127) Net gains from equity investments 1,482 779 185
Operating leases 524 815 685 All other 1,889 2,180 1,828
Total $ 38,185 40,453 42,362
Noninterest income of $38.2 billion represented 47% of revenue for 2011 compared with $40.5 billion, or 47%, for 2010. The decrease in noninterest income from 2010 was due largely to lower service charges on deposit accounts, lower net gains on mortgage loan origination/sales activities and lower net gains from trading activities. Our service charges on deposit accounts decreased in 2011 by $636 million, or 13% from 2010, predominantly due to changes implemented in third quarter 2010 mandated by Regulation E (which limited certain overdraft fees) and related overdraft policy changes. We earn trust, investment and IRA (Individual Retirement Account) fees from managing and administering assets, including mutual funds, corporate trust, personal trust, employee benefit trust and agency assets. At December 31, 2011, these assets totaled $2.2 trillion, up 5% from $2.1 trillion at December 31, 2010. Trust, investment and IRA fees are largely based on a tiered scale relative to the market value of the assets under management or administration. These fees increased to $4.1 billion in 2011 from $4.0 billion in 2010. We receive commissions and other fees for providing services to full-service and discount brokerage customers as well as from investment banking activities including equity and bond underwriting. These fees increased to $7.2 billion in 2011 from $6.9 billion in 2010. Our commission and other fees include transactional commissions, which are based on the number of
transactions executed at the customer’s direction, and asset-based fees, which are based on the market value of the customer’s assets. Brokerage client assets totaled $1.1 trillion and $1.2 trillion at December 31, 2011 and 2010, respectively. Card fees were $3.7 billion in 2011, essentially flat from 2010. Legislative and regulatory changes enacted in 2010 led to a reduction in card fee income, which was offset by growth in purchase volume and new accounts growth. The final Federal Reserve Board (FRB) rules implementing the Durbin Amendment to the Dodd-Frank Act became effective in October 2011, placing limits on debit card interchange fees. As a result, debit card interchange fees were reduced by $365 million during fourth quarter 2011 as compared to fees that would have been earned without the limits. We currently expect future volume, product or account changes may over time mitigate at least half of the earnings reduction resulting from the FRB’s debit card interchange rules. Mortgage banking noninterest income, consisting of net servicing income and net gains on loan origination/sales activities, totaled $7.8 billion in 2011, compared with $9.7 billion in 2010. The reduction in mortgage banking noninterest income was primarily driven by a decline in net gains on mortgage loan origination/sales activities as discussed below. Net mortgage loan servicing income includes both changes in the fair value of MSRs during the period as well as changes in the value of derivatives (economic hedges) used to hedge the MSRs. Net servicing income for 2011 included a $1.6 billion net MSR valuation gain ($3.7 billion decrease in the fair value of the MSRs offset by a $5.3 billion hedge gain) and for 2010 included a $1.5 billion net MSR valuation gain ($3.0 billion decrease in the fair value of MSRs offset by a $4.5 billion hedge gain). See the “Risk Management – Mortgage Banking Interest Rate and Market Risk” section of this Report for additional information regarding our MSRs risks and hedging approach. The valuation of our MSRs at the end of 2011 reflected our assessment of expected future levels in servicing and foreclosure costs. See the “Risk Management – Credit Risk Management – Risks Relating to Servicing Activities” section in this Report for information on the regulatory consent orders. Our portfolio of loans serviced for others was $1.85 trillion at December 31, 2011, and $1.84 trillion at December 31, 2010. At December 31, 2011, the ratio of MSRs to related loans serviced for others was 0.76%, compared with 0.86% at December 31, 2010. Income from loan origination/sale activities was $4.6 billion in 2011 compared with $6.4 billion in 2010. The decrease in 2011 was driven by lower loan origination volume and margins on loan originations, partially offset by lower provision for mortgage loan repurchase losses. Residential real estate originations were $357 billion in 2011, compared with $386 billion a year ago, and mortgage applications were $537 billion in 2011, compared with $620 billion in 2010. The 1-4 family first mortgage unclosed pipeline was $72 billion at December 31, 2011, and $73 billion at December 31, 2010. For additional information, see the “Risk Management – Mortgage Banking Interest Rate and Market Risk” section and Note 1 (Summary of Significant Accounting Policies), Note 9 (Mortgage Banking Activities) and Note 17 (Fair Values of Assets and Liabilities) to Financial Statements in this Report.
37
Earnings Performance (continued)
Net gains on mortgage loan origination/sales activities include the cost of any additions to the mortgage repurchase liability. Mortgage loans are repurchased from third parties based on standard representations and warranties, and early payment default clauses in mortgage sale contracts. Additions to the mortgage repurchase liability that were charged against net gains on mortgage loan origination/sales activities during 2011 totaled $1.3 billion (compared with $1.6 billion for 2010), of which $1.2 billion ($1.5 billion for 2010) was for subsequent increases in estimated losses on prior year’s loan sales. For additional information about mortgage loan repurchases, see the “Risk Management – Credit Risk Management – Liability for Mortgage Loan Repurchase Losses” section and Note 9 (Mortgage Banking Activities) to Financial Statements in this Report. Net gains from trading activities, which reflect unrealized changes in fair value of our trading positions and realized gains and losses, were $1.0 billion in 2011 and $1.6 billion in 2010. The year-over-year decrease was driven by challenging market conditions, including sovereign debt concerns, which pressured credit spreads, reduced prices on financial assets and limited new issue origination and trading opportunities. The decline also reflects a loss of $377 million in 2011 relating to our resolution of a legacy Wachovia position. Net gains from trading activities do not include interest income and other fees earned from related activities. Those amounts are reported within interest income from trading assets and other noninterest income, respectively, in the income statement. Net gains from trading activities are primarily from trading conducted on behalf of or driven by the needs of our customers (customer accommodation trading) and also include the results of certain economic hedging and proprietary trading activity. Net gains (losses) from proprietary trading were a $14 million net loss in 2011 and a $22 million net gain in 2010. Proprietary trading results also included interest and fees reported in their corresponding income statement line items. Proprietary trading activities are not significant to our client-focused business model. Our trading activities, customer accommodation, economic hedging and proprietary trading are further discussed in the “Asset/Liability Management – Market Risk – Trading Activities” section in this Report. Net gains on debt and equity securities totaled $1.5 billion for 2011 and $455 million for 2010, after other-than-temporary impairment (OTTI) write downs of $711 million for 2011 and $940 million for 2010. Included in net gains on debt and equity securities for 2011 was a $271 million gain related to a legacy Wachovia position, due to redemption of our interest in an investment fund. Other income in 2011 also included a $153 million gain on the sale of our H.D. Vest Financial Services business.
38
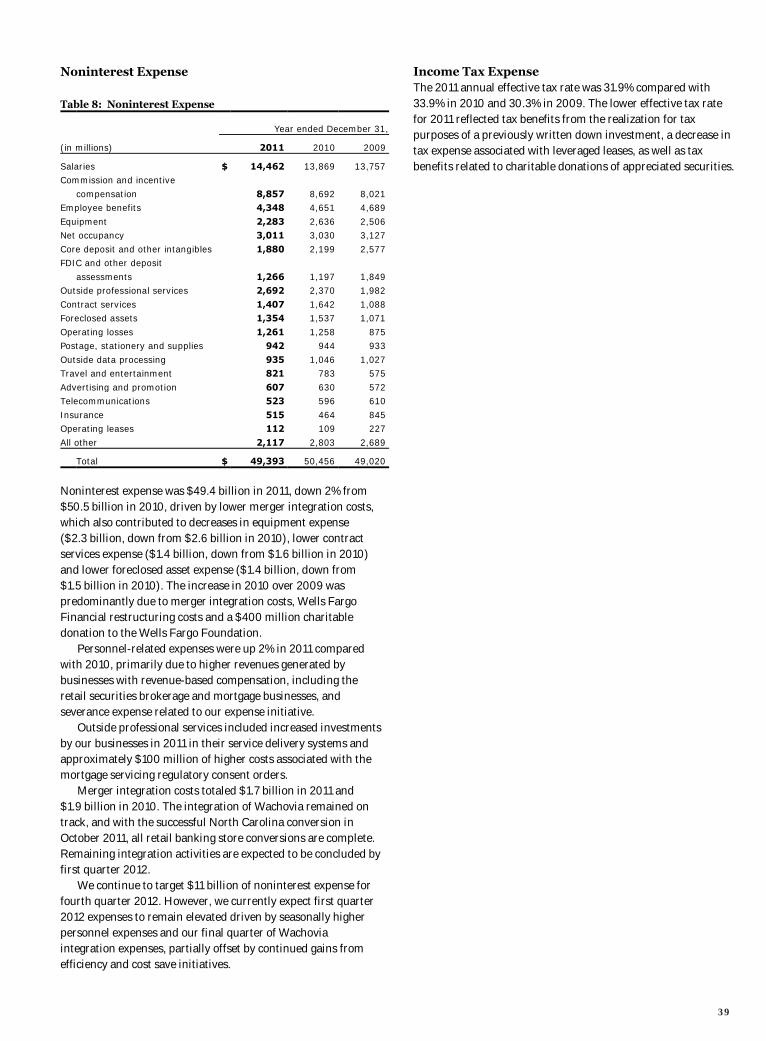
Noninterest Expense Table 8: Noninterest Expense
Year ended December 31,
(in millions) 2011 2010 2009
Salaries $ 14,462 13,869 13,757 Commission and incentive
compensation 8,857 8,692 8,021 Employee benefits 4,348 4,651 4,689
Equipment 2,283 2,636 2,506 Net occupancy 3,011 3,030 3,127
Core deposit and other intangibles 1,880 2,199 2,577 FDIC and other deposit
assessments 1,266 1,197 1,849 Outside professional services 2,692 2,370 1,982
Contract services 1,407 1,642 1,088 Foreclosed assets 1,354 1,537 1,071
Operating losses 1,261 1,258 875 Postage, stationery and supplies 942 944 933
Outside data processing 935 1,046 1,027 Travel and entertainment 821 783 575
Advertising and promotion 607 630 572 Telecommunications 523 596 610
Insurance 515 464 845 Operating leases 112 109 227
All other 2,117 2,803 2,689
Total $ 49,393 50,456 49,020
Noninterest expense was $49.4 billion in 2011, down 2% from $50.5 billion in 2010, driven by lower merger integration costs, which also contributed to decreases in equipment expense ($2.3 billion, down from $2.6 billion in 2010), lower contract services expense ($1.4 billion, down from $1.6 billion in 2010) and lower foreclosed asset expense ($1.4 billion, down from $1.5 billion in 2010). The increase in 2010 over 2009 was predominantly due to merger integration costs, Wells Fargo Financial restructuring costs and a $400 million charitable donation to the Wells Fargo Foundation. Personnel-related expenses were up 2% in 2011 compared with 2010, primarily due to higher revenues generated by businesses with revenue-based compensation, including the retail securities brokerage and mortgage businesses, and severance expense related to our expense initiative. Outside professional services included increased investments by our businesses in 2011 in their service delivery systems and approximately $100 million of higher costs associated with the mortgage servicing regulatory consent orders. Merger integration costs totaled $1.7 billion in 2011 and $1.9 billion in 2010. The integration of Wachovia remained on track, and with the successful North Carolina conversion in October 2011, all retail banking store conversions are complete. Remaining integration activities are expected to be concluded by first quarter 2012. We continue to target $11 billion of noninterest expense for fourth quarter 2012. However, we currently expect first quarter 2012 expenses to remain elevated driven by seasonally higher personnel expenses and our final quarter of Wachovia integration expenses, partially offset by continued gains from efficiency and cost save initiatives.
Income Tax Expense The 2011 annual effective tax rate was 31.9% compared with 33.9% in 2010 and 30.3% in 2009. The lower effective tax rate for 2011 reflected tax benefits from the realization for tax purposes of a previously written down investment, a decrease in tax expense associated with leveraged leases, as well as tax benefits related to charitable donations of appreciated securities.
39
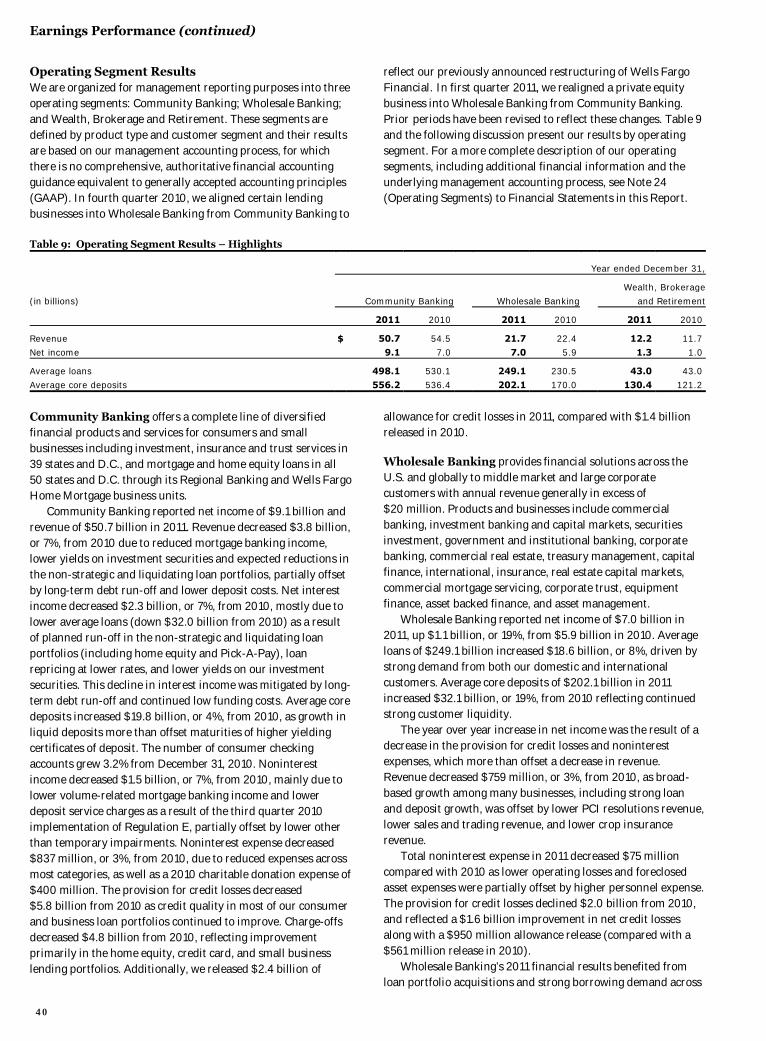
Earnings Performance (continued)
Operating Segment Results We are organized for management reporting purposes into three operating segments: Community Banking; Wholesale Banking; and Wealth, Brokerage and Retirement. These segments are defined by product type and customer segment and their results are based on our management accounting process, for which there is no comprehensive, authoritative financial accounting guidance equivalent to generally accepted accounting principles (GAAP). In fourth quarter 2010, we aligned certain lending businesses into Wholesale Banking from Community Banking to
reflect our previously announced restructuring of Wells Fargo Financial. In first quarter 2011, we realigned a private equity business into Wholesale Banking from Community Banking. Prior periods have been revised to reflect these changes. Table 9 and the following discussion present our results by operating segment. For a more complete description of our operating segments, including additional financial information and the underlying management accounting process, see Note 24 (Operating Segments) to Financial Statements in this Report.
Table 9: Operating Segment Results – Highlights
Year ended December 31,
Wealth, Brokerage
(in billions) Community Banking Wholesale Banking and Retirement
2011 2010 2011 2010 2011 2010
Revenue $ 50.7 54.5 21.7 22.4 12.2 11.7
Net income 9.1 7.0 7.0 5.9 1.3 1.0
Average loans 498.1 530.1 249.1 230.5 43.0 43.0
Average core deposits 556.2 536.4 202.1 170.0 130.4 121.2
Community Banking offers a complete line of diversified financial products and services for consumers and small businesses including investment, insurance and trust services in 39 states and D.C., and mortgage and home equity loans in all 50 states and D.C. through its Regional Banking and Wells Fargo Home Mortgage business units. Community Banking reported net income of $9.1 billion and revenue of $50.7 billion in 2011. Revenue decreased $3.8 billion, or 7%, from 2010 due to reduced mortgage banking income, lower yields on investment securities and expected reductions in the non-strategic and liquidating loan portfolios, partially offset by long-term debt run-off and lower deposit costs. Net interest income decreased $2.3 billion, or 7%, from 2010, mostly due to lower average loans (down $32.0 billion from 2010) as a result of planned run-off in the non-strategic and liquidating loan portfolios (including home equity and Pick-A-Pay), loan repricing at lower rates, and lower yields on our investment securities. This decline in interest income was mitigated by long-term debt run-off and continued low funding costs. Average core deposits increased $19.8 billion, or 4%, from 2010, as growth in liquid deposits more than offset maturities of higher yielding certificates of deposit. The number of consumer checking accounts grew 3.2% from December 31, 2010. Noninterest income decreased $1.5 billion, or 7%, from 2010, mainly due to lower volume-related mortgage banking income and lower deposit service charges as a result of the third quarter 2010 implementation of Regulation E, partially offset by lower other than temporary impairments. Noninterest expense decreased $837 million, or 3%, from 2010, due to reduced expenses across most categories, as well as a 2010 charitable donation expense of $400 million. The provision for credit losses decreased $5.8 billion from 2010 as credit quality in most of our consumer and business loan portfolios continued to improve. Charge-offs decreased $4.8 billion from 2010, reflecting improvement primarily in the home equity, credit card, and small business lending portfolios. Additionally, we released $2.4 billion of
allowance for credit losses in 2011, compared with $1.4 billion released in 2010. Wholesale Banking provides financial solutions across the U.S. and globally to middle market and large corporate customers with annual revenue generally in excess of $20 million. Products and businesses include commercial banking, investment banking and capital markets, securities investment, government and institutional banking, corporate banking, commercial real estate, treasury management, capital finance, international, insurance, real estate capital markets, commercial mortgage servicing, corporate trust, equipment finance, asset backed finance, and asset management. Wholesale Banking reported net income of $7.0 billion in 2011, up $1.1 billion, or 19%, from $5.9 billion in 2010. Average loans of $249.1 billion increased $18.6 billion, or 8%, driven by strong demand from both our domestic and international customers. Average core deposits of $202.1 billion in 2011 increased $32.1 billion, or 19%, from 2010 reflecting continued strong customer liquidity. The year over year increase in net income was the result of a decrease in the provision for credit losses and noninterest expenses, which more than offset a decrease in revenue. Revenue decreased $759 million, or 3%, from 2010, as broad-based growth among many businesses, including strong loan and deposit growth, was offset by lower PCI resolutions revenue, lower sales and trading revenue, and lower crop insurance revenue. Total noninterest expense in 2011 decreased $75 million compared with 2010 as lower operating losses and foreclosed asset expenses were partially offset by higher personnel expense. The provision for credit losses declined $2.0 billion from 2010, and reflected a $1.6 billion improvement in net credit losses along with a $950 million allowance release (compared with a $561 million release in 2010). Wholesale Banking’s 2011 financial results benefited from loan portfolio acquisitions and strong borrowing demand across
40
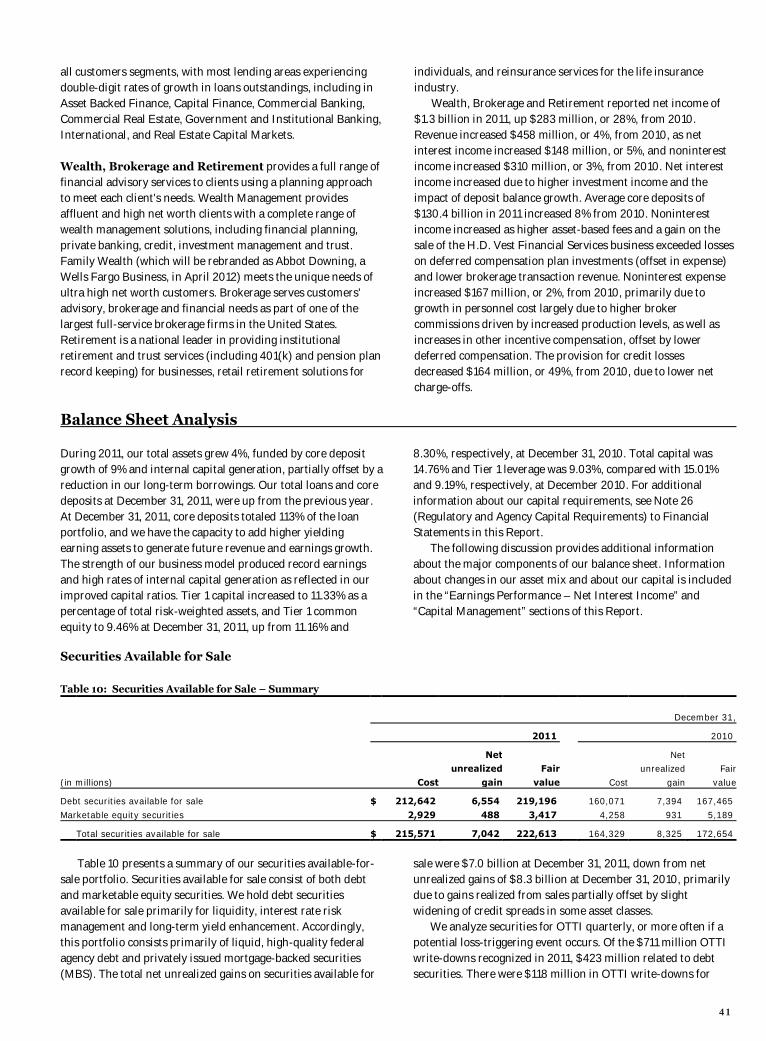
all customers segments, with most lending areas experiencing double-digit rates of growth in loans outstandings, including in Asset Backed Finance, Capital Finance, Commercial Banking, Commercial Real Estate, Government and Institutional Banking, International, and Real Estate Capital Markets. Wealth, Brokerage and Retirement provides a full range of financial advisory services to clients using a planning approach to meet each client's needs. Wealth Management provides affluent and high net worth clients with a complete range of wealth management solutions, including financial planning, private banking, credit, investment management and trust. Family Wealth (which will be rebranded as Abbot Downing, a Wells Fargo Business, in April 2012) meets the unique needs of ultra high net worth customers. Brokerage serves customers' advisory, brokerage and financial needs as part of one of the largest full-service brokerage firms in the United States. Retirement is a national leader in providing institutional retirement and trust services (including 401(k) and pension plan record keeping) for businesses, retail retirement solutions for
individuals, and reinsurance services for the life insurance industry. Wealth, Brokerage and Retirement reported net income of $1.3 billion in 2011, up $283 million, or 28%, from 2010. Revenue increased $458 million, or 4%, from 2010, as net interest income increased $148 million, or 5%, and noninterest income increased $310 million, or 3%, from 2010. Net interest income increased due to higher investment income and the impact of deposit balance growth. Average core deposits of $130.4 billion in 2011 increased 8% from 2010. Noninterest income increased as higher asset-based fees and a gain on the sale of the H.D. Vest Financial Services business exceeded losses on deferred compensation plan investments (offset in expense) and lower brokerage transaction revenue. Noninterest expense increased $167 million, or 2%, from 2010, primarily due to growth in personnel cost largely due to higher broker commissions driven by increased production levels, as well as increases in other incentive compensation, offset by lower deferred compensation. The provision for credit losses decreased $164 million, or 49%, from 2010, due to lower net charge-offs.
Balance Sheet Analysis
During 2011, our total assets grew 4%, funded by core deposit growth of 9% and internal capital generation, partially offset by a reduction in our long-term borrowings. Our total loans and core deposits at December 31, 2011, were up from the previous year. At December 31, 2011, core deposits totaled 113% of the loan portfolio, and we have the capacity to add higher yielding earning assets to generate future revenue and earnings growth. The strength of our business model produced record earnings and high rates of internal capital generation as reflected in our improved capital ratios. Tier 1 capital increased to 11.33% as a percentage of total risk-weighted assets, and Tier 1 common equity to 9.46% at December 31, 2011, up from 11.16% and
8.30%, respectively, at December 31, 2010. Total capital was 14.76% and Tier 1 leverage was 9.03%, compared with 15.01% and 9.19%, respectively, at December 2010. For additional information about our capital requirements, see Note 26 (Regulatory and Agency Capital Requirements) to Financial Statements in this Report. The following discussion provides additional information about the major components of our balance sheet. Information about changes in our asset mix and about our capital is included in the “Earnings Performance – Net Interest Income” and “Capital Management” sections of this Report.
Securities Available for Sale Table 10: Securities Available for Sale – Summary
December 31,
2011 2010
Net Net unrealized Fair unrealized Fair
(in millions) Cost gain value Cost gain value
Debt securities available for sale $ 212,642 6,554 219,196 160,071 7,394 167,465
Marketable equity securities 2,929 488 3,417 4,258 931 5,189
Total securities available for sale $ 215,571 7,042 222,613 164,329 8,325 172,654
Table 10 presents a summary of our securities available-for-sale portfolio. Securities available for sale consist of both debt and marketable equity securities. We hold debt securities available for sale primarily for liquidity, interest rate risk management and long-term yield enhancement. Accordingly, this portfolio consists primarily of liquid, high-quality federal agency debt and privately issued mortgage-backed securities (MBS). The total net unrealized gains on securities available for
sale were $7.0 billion at December 31, 2011, down from net unrealized gains of $8.3 billion at December 31, 2010, primarily due to gains realized from sales partially offset by slight widening of credit spreads in some asset classes. We analyze securities for OTTI quarterly, or more often if a potential loss-triggering event occurs. Of the $711 million OTTI write-downs recognized in 2011, $423 million related to debt securities. There were $118 million in OTTI write-downs for
41

Balance Sheet Analysis (continued)
marketable equity securities and $170 million in OTTI write-downs related to nonmarketable equity securities. For a discussion of our OTTI accounting policies and underlying considerations and analysis see Note 1 (Summary of Significant Accounting Policies – Securities) and Note 5 (Securities Available for Sale) to Financial Statements in this Report. At December 31, 2011, debt securities available for sale included $32.6 billion of municipal bonds, of which 78% were rated “A-” or better, based on external and, in some cases, internal ratings. Additionally, some of these bonds are guaranteed against loss by bond insurers. These guaranteed bonds are predominantly investment grade and were generally underwritten in accordance with our own investment standards prior to the determination to purchase, without relying on the bond insurer’s guarantee in making the investment decision. Our municipal bond holdings continue to be monitored as part of our ongoing impairment analysis of our securities available for sale. The weighted-average expected maturity of debt securities available for sale was 4.9 years at December 31, 2011. Because 61% of this portfolio is MBS, the expected remaining maturity may differ from contractual maturity because borrowers generally have the right to prepay obligations before the underlying mortgages mature. The estimated effect of a 200 basis point increase or decrease in interest rates on the fair value and the expected remaining maturity of the MBS available for sale are shown in Table 11.
Table 11: Mortgage-Backed Securities Expected Net remaining
Fair unrealized maturity (in billions) value gain (loss) (in years)
At December 31, 2011 Actual $ 132.7 5.6 3.8
Assuming a 200 basis point: Increase in interest rates 122.6 (4.5) 5.2
Decrease in interest rates 137.4 10.3 3.1
See Note 5 (Securities Available for Sale) to Financial Statements in this Report for securities available for sale by security type.
42
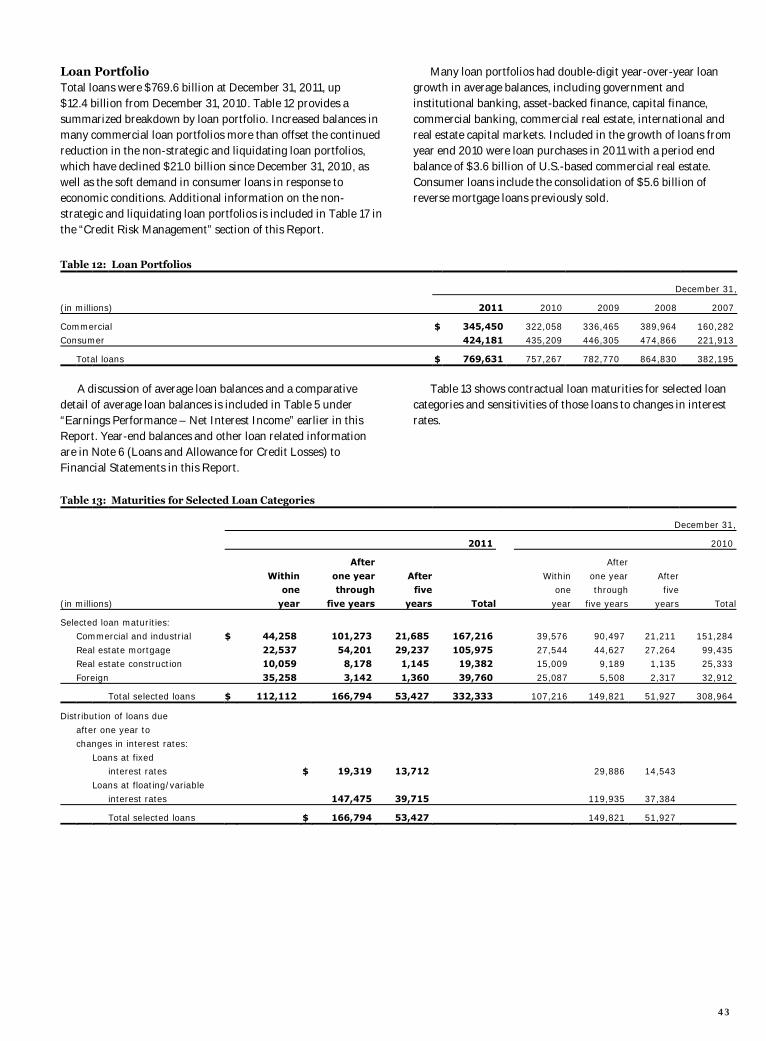
Loan Portfolio Total loans were $769.6 billion at December 31, 2011, up $12.4 billion from December 31, 2010. Table 12 provides a summarized breakdown by loan portfolio. Increased balances in many commercial loan portfolios more than offset the continued reduction in the non-strategic and liquidating loan portfolios, which have declined $21.0 billion since December 31, 2010, as well as the soft demand in consumer loans in response to economic conditions. Additional information on the non-strategic and liquidating loan portfolios is included in Table 17 in the “Credit Risk Management” section of this Report.
Many loan portfolios had double-digit year-over-year loan growth in average balances, including government and institutional banking, asset-backed finance, capital finance, commercial banking, commercial real estate, international and real estate capital markets. Included in the growth of loans from year end 2010 were loan purchases in 2011 with a period end balance of $3.6 billion of U.S.-based commercial real estate. Consumer loans include the consolidation of $5.6 billion of reverse mortgage loans previously sold.
Table 12: Loan Portfolios
December 31,
(in millions) 2011 2010 2009 2008 2007
Commercial $ 345,450 322,058 336,465 389,964 160,282 Consumer 424,181 435,209 446,305 474,866 221,913
Total loans $ 769,631 757,267 782,770 864,830 382,195
A discussion of average loan balances and a comparative detail of average loan balances is included in Table 5 under “Earnings Performance – Net Interest Income” earlier in this Report. Year-end balances and other loan related information are in Note 6 (Loans and Allowance for Credit Losses) to Financial Statements in this Report.
Table 13 shows contractual loan maturities for selected loan categories and sensitivities of those loans to changes in interest rates.
Table 13: Maturities for Selected Loan Categories December 31,
2011 2010
After After
Within one year After Within one year After one through five one through five
(in millions) year five years years Total year five years years Total
Selected loan maturities: Commercial and industrial $ 44,258 101,273 21,685 167,216 39,576 90,497 21,211 151,284
Real estate mortgage 22,537 54,201 29,237 105,975 27,544 44,627 27,264 99,435 Real estate construction 10,059 8,178 1,145 19,382 15,009 9,189 1,135 25,333
Foreign 35,258 3,142 1,360 39,760 25,087 5,508 2,317 32,912
Total selected loans $ 112,112 166,794 53,427 332,333 107,216 149,821 51,927 308,964
Distribution of loans due
after one year to changes in interest rates:
Loans at fixed interest rates $ 19,319 13,712 29,886 14,543
Loans at floating/variable interest rates 147,475 39,715 119,935 37,384
Total selected loans $ 166,794 53,427 149,821 51,927
43
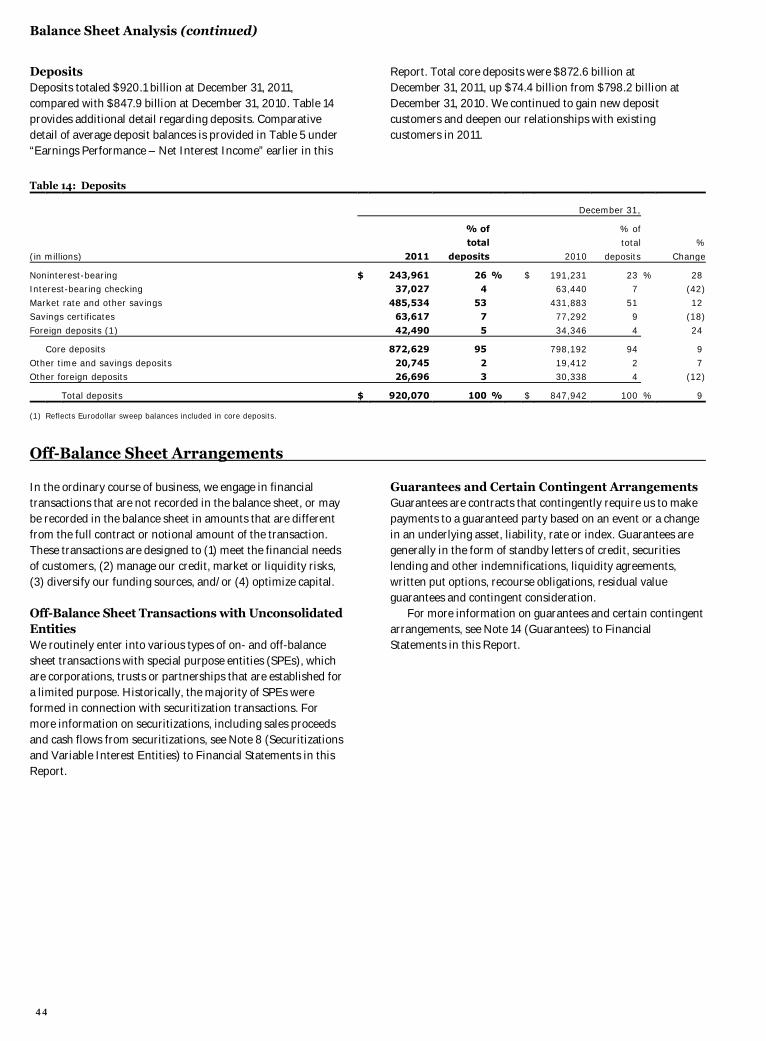
Balance Sheet Analysis (continued)
Deposits Deposits totaled $920.1 billion at December 31, 2011, compared with $847.9 billion at December 31, 2010. Table 14 provides additional detail regarding deposits. Comparative detail of average deposit balances is provided in Table 5 under “Earnings Performance – Net Interest Income” earlier in this
Report. Total core deposits were $872.6 billion at December 31, 2011, up $74.4 billion from $798.2 billion at December 31, 2010. We continued to gain new deposit customers and deepen our relationships with existing customers in 2011.
Table 14: Deposits December 31,
% of % of total total %
(in millions) 2011 deposits 2010 deposits Change
Noninterest-bearing $ 243,961 26 % $ 191,231 23 % 28 Interest-bearing checking 37,027 4 63,440 7 (42)
Market rate and other savings 485,534 53 431,883 51 12 Savings certificates 63,617 7 77,292 9 (18)
Foreign deposits (1) 42,490 5 34,346 4 24
Core deposits 872,629 95 798,192 94 9
Other time and savings deposits 20,745 2 19,412 2 7 Other foreign deposits 26,696 3 30,338 4 (12)
Total deposits $ 920,070 100 % $ 847,942 100 % 9
(1) Reflects Eurodollar sweep balances included in core deposits.
Off-Balance Sheet Arrangements
In the ordinary course of business, we engage in financial transactions that are not recorded in the balance sheet, or may be recorded in the balance sheet in amounts that are different from the full contract or notional amount of the transaction. These transactions are designed to (1) meet the financial needs of customers, (2) manage our credit, market or liquidity risks, (3) diversify our funding sources, and/or (4) optimize capital. Off-Balance Sheet Transactions with Unconsolidated Entities We routinely enter into various types of on- and off-balance sheet transactions with special purpose entities (SPEs), which are corporations, trusts or partnerships that are established for a limited purpose. Historically, the majority of SPEs were formed in connection with securitization transactions. For more information on securitizations, including sales proceeds and cash flows from securitizations, see Note 8 (Securitizations and Variable Interest Entities) to Financial Statements in this Report.
Guarantees and Certain Contingent Arrangements Guarantees are contracts that contingently require us to make payments to a guaranteed party based on an event or a change in an underlying asset, liability, rate or index. Guarantees are generally in the form of standby letters of credit, securities lending and other indemnifications, liquidity agreements, written put options, recourse obligations, residual value guarantees and contingent consideration. For more information on guarantees and certain contingent arrangements, see Note 14 (Guarantees) to Financial Statements in this Report.
44
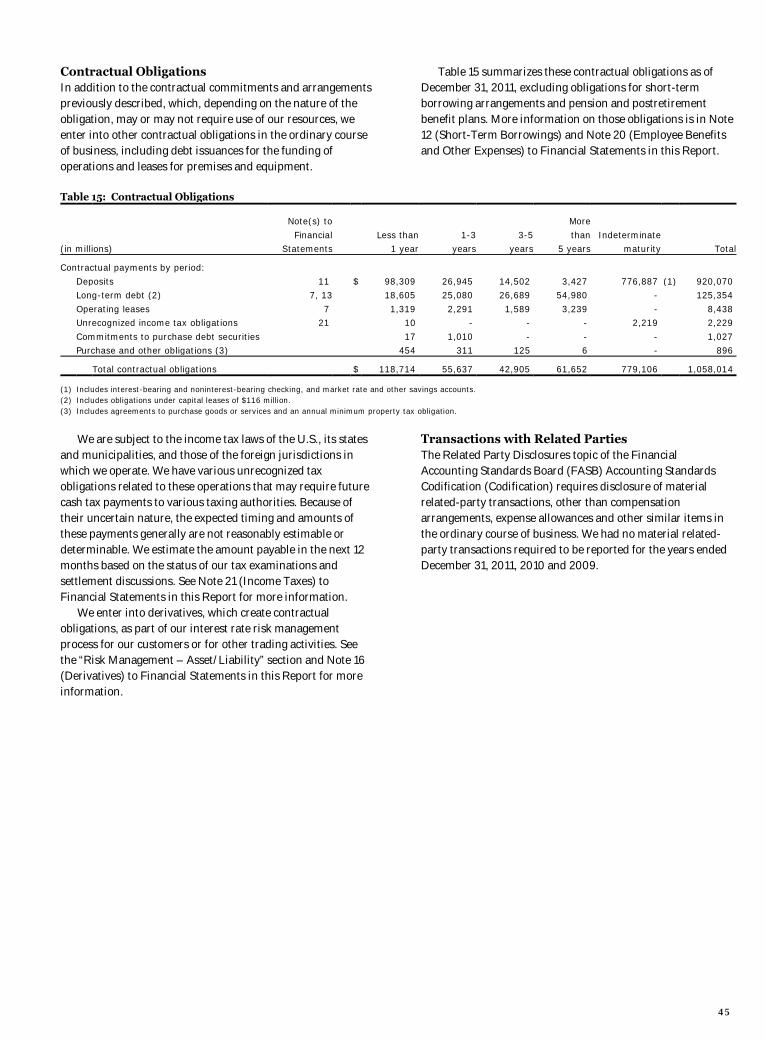
Contractual Obligations In addition to the contractual commitments and arrangements previously described, which, depending on the nature of the obligation, may or may not require use of our resources, we enter into other contractual obligations in the ordinary course of business, including debt issuances for the funding of operations and leases for premises and equipment.
Table 15 summarizes these contractual obligations as of December 31, 2011, excluding obligations for short-term borrowing arrangements and pension and postretirement benefit plans. More information on those obligations is in Note 12 (Short-Term Borrowings) and Note 20 (Employee Benefits and Other Expenses) to Financial Statements in this Report.
Table 15: Contractual Obligations
Note(s) to More
Financial Less than 1-3 3-5 than Indeterminate (in millions) Statements 1 year years years 5 years maturity Total
Contractual payments by period:
Deposits 11 $ 98,309 26,945 14,502 3,427 776,887 (1) 920,070 Long-term debt (2) 7, 13 18,605 25,080 26,689 54,980 - 125,354
Operating leases 7 1,319 2,291 1,589 3,239 - 8,438 Unrecognized income tax obligations 21 10 - - - 2,219 2,229
Commitments to purchase debt securities 17 1,010 - - - 1,027 Purchase and other obligations (3) 454 311 125 6 - 896
Total contractual obligations $ 118,714 55,637 42,905 61,652 779,106 1,058,014
(1) Includes interest-bearing and noninterest-bearing checking, and market rate and other savings accounts. (2) Includes obligations under capital leases of $116 million. (3) Includes agreements to purchase goods or services and an annual minimum property tax obligation.
We are subject to the income tax laws of the U.S., its states and municipalities, and those of the foreign jurisdictions in which we operate. We have various unrecognized tax obligations related to these operations that may require future cash tax payments to various taxing authorities. Because of their uncertain nature, the expected timing and amounts of these payments generally are not reasonably estimable or determinable. We estimate the amount payable in the next 12 months based on the status of our tax examinations and settlement discussions. See Note 21 (Income Taxes) to Financial Statements in this Report for more information. We enter into derivatives, which create contractual obligations, as part of our interest rate risk management process for our customers or for other trading activities. See the “Risk Management – Asset/Liability” section and Note 16 (Derivatives) to Financial Statements in this Report for more information.
Transactions with Related Parties The Related Party Disclosures topic of the Financial Accounting Standards Board (FASB) Accounting Standards Codification (Codification) requires disclosure of material related-party transactions, other than compensation arrangements, expense allowances and other similar items in the ordinary course of business. We had no material related-party transactions required to be reported for the years ended December 31, 2011, 2010 and 2009.
45
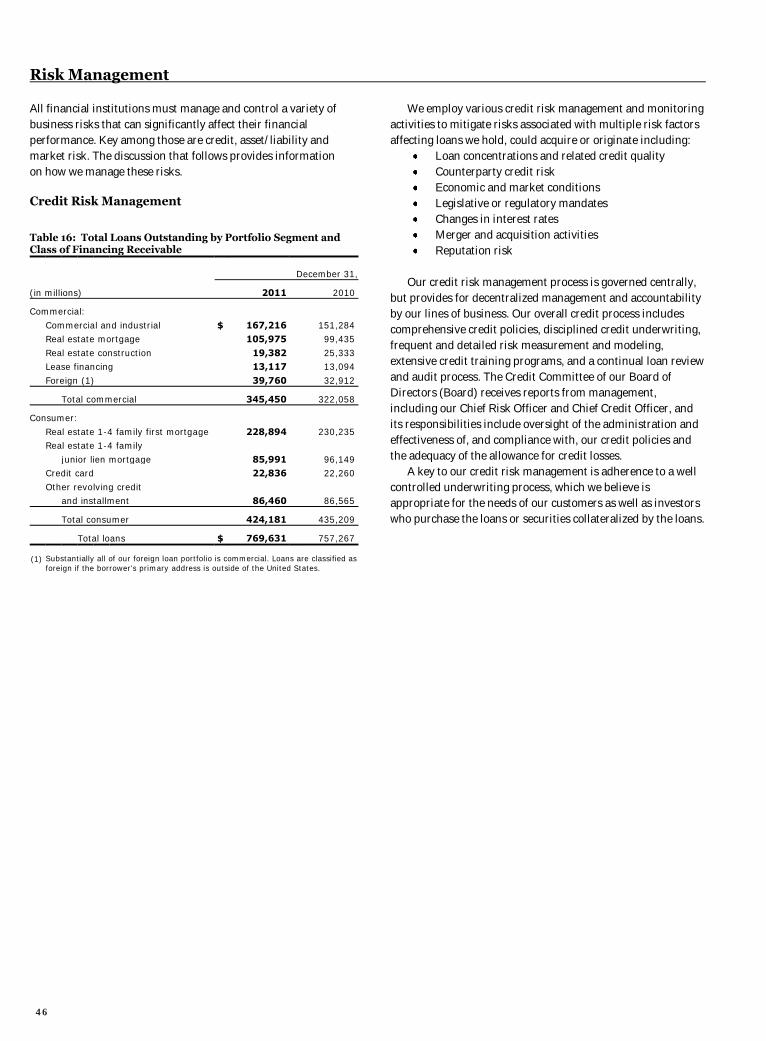
Risk Management
All financial institutions must manage and control a variety of business risks that can significantly affect their financial performance. Key among those are credit, asset/liability and market risk. The discussion that follows provides information on how we manage these risks. Credit Risk Management Table 16: Total Loans Outstanding by Portfolio Segment and Class of Financing Receivable
December 31,
(in millions) 2011 2010
Commercial:
Commercial and industrial $ 167,216 151,284 Real estate mortgage 105,975 99,435
Real estate construction 19,382 25,333 Lease financing 13,117 13,094
Foreign (1) 39,760 32,912
Total commercial 345,450 322,058
Consumer:
Real estate 1-4 family first mortgage 228,894 230,235 Real estate 1-4 family
junior lien mortgage 85,991 96,149 Credit card 22,836 22,260
Other revolving credit and installment 86,460 86,565
Total consumer 424,181 435,209
Total loans $ 769,631 757,267
(1) Substantially all of our foreign loan portfolio is commercial. Loans are classified as foreign if the borrower’s primary address is outside of the United States.
We employ various credit risk management and monitoring activities to mitigate risks associated with multiple risk factors affecting loans we hold, could acquire or originate including:
Loan concentrations and related credit quality Counterparty credit risk Economic and market conditions Legislative or regulatory mandates Changes in interest rates Merger and acquisition activities Reputation risk
Our credit risk management process is governed centrally,
but provides for decentralized management and accountability by our lines of business. Our overall credit process includes comprehensive credit policies, disciplined credit underwriting, frequent and detailed risk measurement and modeling, extensive credit training programs, and a continual loan review and audit process. The Credit Committee of our Board of Directors (Board) receives reports from management, including our Chief Risk Officer and Chief Credit Officer, and its responsibilities include oversight of the administration and effectiveness of, and compliance with, our credit policies and the adequacy of the allowance for credit losses. A key to our credit risk management is adherence to a well controlled underwriting process, which we believe is appropriate for the needs of our customers as well as investors who purchase the loans or securities collateralized by the loans.
46
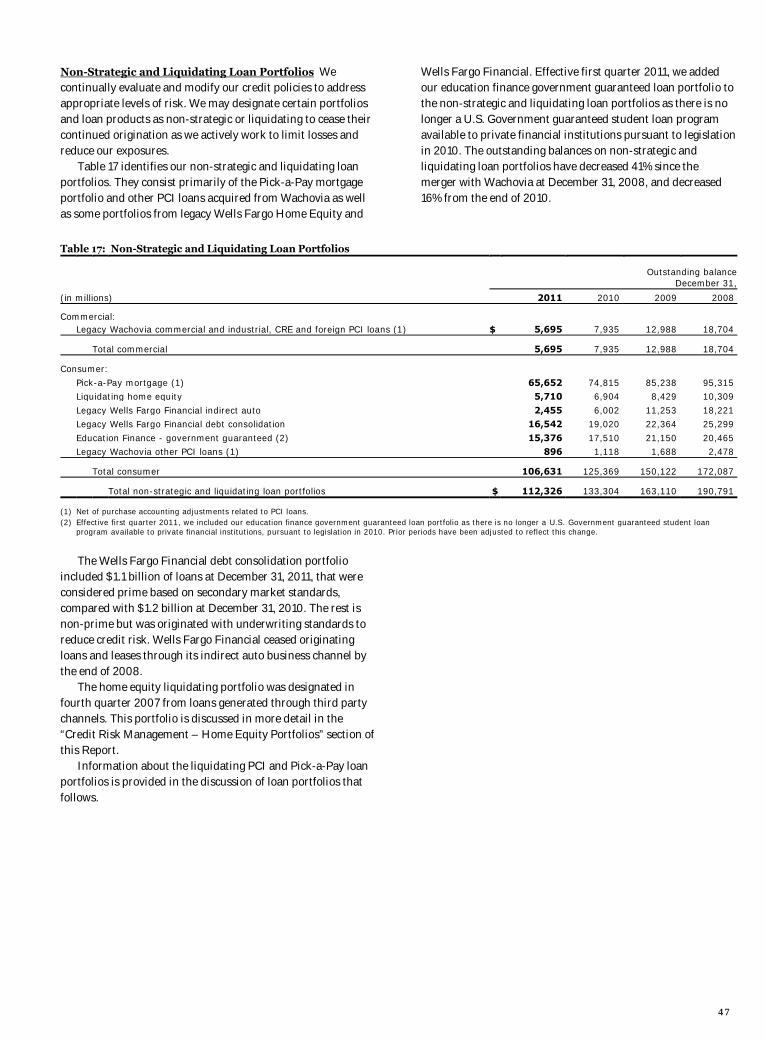
Non-Strategic and Liquidating Loan Portfolios We continually evaluate and modify our credit policies to address appropriate levels of risk. We may designate certain portfolios and loan products as non-strategic or liquidating to cease their continued origination as we actively work to limit losses and reduce our exposures. Table 17 identifies our non-strategic and liquidating loan portfolios. They consist primarily of the Pick-a-Pay mortgage portfolio and other PCI loans acquired from Wachovia as well as some portfolios from legacy Wells Fargo Home Equity and
Wells Fargo Financial. Effective first quarter 2011, we added our education finance government guaranteed loan portfolio to the non-strategic and liquidating loan portfolios as there is no longer a U.S. Government guaranteed student loan program available to private financial institutions pursuant to legislation in 2010. The outstanding balances on non-strategic and liquidating loan portfolios have decreased 41% since the merger with Wachovia at December 31, 2008, and decreased 16% from the end of 2010.
Table 17: Non-Strategic and Liquidating Loan Portfolios
Outstanding balance
December 31,
(in millions) 2011 2010 2009 2008
Commercial: Legacy Wachovia commercial and industrial, CRE and foreign PCI loans (1) $ 5,695 7,935 12,988 18,704
Total commercial 5,695 7,935 12,988 18,704
Consumer:
Pick-a-Pay mortgage (1) 65,652 74,815 85,238 95,315 Liquidating home equity 5,710 6,904 8,429 10,309
Legacy Wells Fargo Financial indirect auto 2,455 6,002 11,253 18,221 Legacy Wells Fargo Financial debt consolidation 16,542 19,020 22,364 25,299
Education Finance - government guaranteed (2) 15,376 17,510 21,150 20,465 Legacy Wachovia other PCI loans (1) 896 1,118 1,688 2,478
Total consumer 106,631 125,369 150,122 172,087
Total non-strategic and liquidating loan portfolios $ 112,326 133,304 163,110 190,791
(1) Net of purchase accounting adjustments related to PCI loans. (2) Effective first quarter 2011, we included our education finance government guaranteed loan portfolio as there is no longer a U.S. Government guaranteed student loan
program available to private financial institutions, pursuant to legislation in 2010. Prior periods have been adjusted to reflect this change.
The Wells Fargo Financial debt consolidation portfolio included $1.1 billion of loans at December 31, 2011, that were considered prime based on secondary market standards, compared with $1.2 billion at December 31, 2010. The rest is non-prime but was originated with underwriting standards to reduce credit risk. Wells Fargo Financial ceased originating loans and leases through its indirect auto business channel by the end of 2008. The home equity liquidating portfolio was designated in fourth quarter 2007 from loans generated through third party channels. This portfolio is discussed in more detail in the “Credit Risk Management – Home Equity Portfolios” section of this Report. Information about the liquidating PCI and Pick-a-Pay loan portfolios is provided in the discussion of loan portfolios that follows.
47

Risk Management — Credit Risk Management (continued)
PURCHASED CREDIT-IMPAIRED (PCI) LOANS Loans acquired with evidence of credit deterioration since their origination and where it is probable that we will not collect all contractually required principal and interest payments are accounted for using the measurement provisions for PCI loans. PCI loans are recorded at fair value at the date of acquisition, and the historical allowance for credit losses related to these loans is not carried over. Such loans are considered to be accruing due to the existence of the accretable yield and not based on consideration given to contractual interest payments. Substantially all of our PCI loans were acquired in the Wachovia acquisition on December 31, 2008. A nonaccretable difference is established for PCI loans to absorb losses expected on those loans at the date of acquisition. Amounts absorbed by the nonaccretable difference do not affect the income statement or the allowance for credit losses. Substantially all commercial and industrial, CRE and foreign PCI loans are accounted for as individual loans. Conversely, Pick-a-Pay and other consumer PCI loans have been aggregated into several pools based on common risk characteristics. Each pool is accounted for as a single asset with a single composite interest rate and an aggregate expectation of cash flows. Resolutions of loans may include sales to third parties, receipt of payments in settlement with the borrower, or foreclosure of the collateral. Our policy is to remove an individual PCI loan from a pool based on comparing the amount
received from its resolution with its contractual amount. Any difference between these amounts is absorbed by the nonaccretable difference. This removal method assumes that the amount received from resolution approximates pool performance expectations. The accretable yield percentage is unaffected by the resolution and any changes in the effective yield for the remaining loans in the pool are addressed by our quarterly cash flow evaluation process for each pool. For loans that are resolved by payment in full, there is no release of the nonaccretable difference for the pool because there is no difference between the amount received at resolution and the contractual amount of the loan. Modified PCI loans are not removed from a pool even if those loans would otherwise be deemed troubled debt restructurings (TDRs). Modified PCI loans that are accounted for individually are TDRs, and removed from PCI accounting, if there has been a concession granted in excess of the original nonaccretable difference. We include these TDRs in our impaired loans. During 2011, we recognized in income $239 million released from the nonaccretable difference related to commercial PCI loans due to payoffs and other resolutions. We also transferred $373 million from the nonaccretable difference to the accretable yield for PCI loans with improving credit-related cash flows and absorbed $2.3 billion of losses in the nonaccretable difference from loan resolutions and write-downs. Table 18 provides an analysis of changes in the nonaccretable difference.
Table 18: Changes in Nonaccretable Difference for PCI Loans Other (in millions) Commercial Pick-a-Pay consumer Total
Balance, December 31, 2008 $ 10,410 26,485 4,069 40,964
Release of nonaccretable difference due to: Loans resolved by settlement with borrower (1) (330) - - (330)
Loans resolved by sales to third parties (2) (86) - (85) (171) Reclassification to accretable yield for loans with improving credit-related cash flows (3) (138) (27) (276) (441)
Use of nonaccretable difference due to: Losses from loan resolutions and write-downs (4) (4,853) (10,218) (2,086) (17,157)
Balance, December 31, 2009 5,003 16,240 1,622 22,865 Release of nonaccretable difference due to:
Loans resolved by settlement with borrower (1) (817) - - (817) Loans resolved by sales to third parties (2) (172) - - (172)
Reclassification to accretable yield for loans with improving credit-related cash flows (3) (726) (2,356) (317) (3,399) Use of nonaccretable difference due to:
Losses from loan resolutions and write-downs (4) (1,698) (2,959) (391) (5,048)
Balance, December 31, 2010 1,590 10,925 914 13,429 Addition of nonaccretable difference due to acquisitions 188 - - 188
Release of nonaccretable difference due to: Loans resolved by settlement with borrower (1) (198) - - (198)
Loans resolved by sales to third parties (2) (41) - - (41) Reclassification to accretable yield for loans with improving credit-related cash flows (3) (352) - (21) (373)
Use of nonaccretable difference due to: Losses from loan resolutions and write-downs (4) (258) (1,799) (241) (2,298)
Balance, December 31, 2011 $ 929 9,126 652 10,707
(1) Release of the nonaccretable difference for settlement with borrower, on individually accounted PCI loans, increases interest income in the period of settlement. Pick-a-Pay and Other consumer PCI loans do not reflect nonaccretable difference releases for settlements with borrowers due to pool accounting for those loans, which assumes that the amount received approximates the pool performance expectations.
(2) Release of the nonaccretable difference as a result of sales to third parties increases noninterest income in the period of the sale. (3) Reclassification of nonaccretable difference to accretable yield for loans with increased cash flow estimates will result in increased interest income as a prospective yield
adjustment over the remaining life of the loan or pool of loans. (4) Write-downs to net realizable value of PCI loans are absorbed by the nonaccretable difference when severe delinquency (normally 180 days) or other indications of severe
borrower financial stress exist that indicate there will be a loss of contractually due amounts upon final resolution of the loan.
48
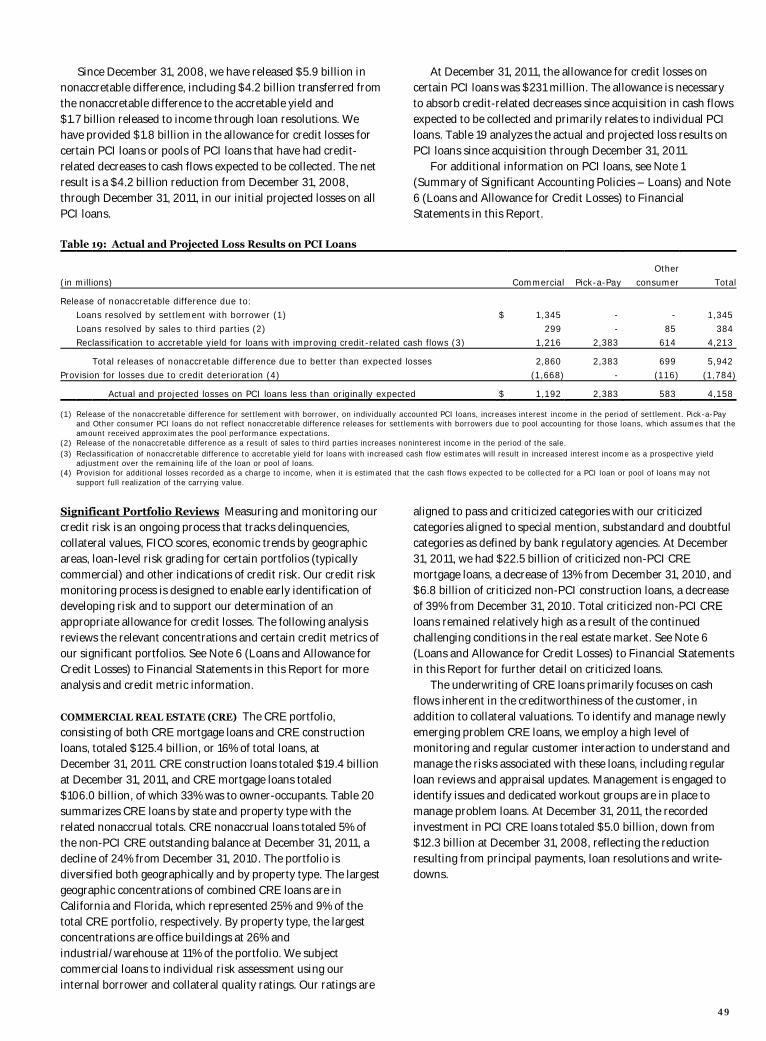
Since December 31, 2008, we have released $5.9 billion in nonaccretable difference, including $4.2 billion transferred from the nonaccretable difference to the accretable yield and $1.7 billion released to income through loan resolutions. We have provided $1.8 billion in the allowance for credit losses for certain PCI loans or pools of PCI loans that have had credit-related decreases to cash flows expected to be collected. The net result is a $4.2 billion reduction from December 31, 2008, through December 31, 2011, in our initial projected losses on all PCI loans.
At December 31, 2011, the allowance for credit losses on certain PCI loans was $231 million. The allowance is necessary to absorb credit-related decreases since acquisition in cash flows expected to be collected and primarily relates to individual PCI loans. Table 19 analyzes the actual and projected loss results on PCI loans since acquisition through December 31, 2011. For additional information on PCI loans, see Note 1 (Summary of Significant Accounting Policies – Loans) and Note 6 (Loans and Allowance for Credit Losses) to Financial Statements in this Report.
Table 19: Actual and Projected Loss Results on PCI Loans
Other
(in millions) Commercial Pick-a-Pay consumer Total
Release of nonaccretable difference due to: Loans resolved by settlement with borrower (1) $ 1,345 - - 1,345
Loans resolved by sales to third parties (2) 299 - 85 384 Reclassification to accretable yield for loans with improving credit-related cash flows (3) 1,216 2,383 614 4,213
Total releases of nonaccretable difference due to better than expected losses 2,860 2,383 699 5,942 Provision for losses due to credit deterioration (4) (1,668) - (116) (1,784)
Actual and projected losses on PCI loans less than originally expected $ 1,192 2,383 583 4,158
(1) Release of the nonaccretable difference for settlement with borrower, on individually accounted PCI loans, increases interest income in the period of settlement. Pick-a-Pay and Other consumer PCI loans do not reflect nonaccretable difference releases for settlements with borrowers due to pool accounting for those loans, which assumes that the amount received approximates the pool performance expectations.
(2) Release of the nonaccretable difference as a result of sales to third parties increases noninterest income in the period of the sale. (3) Reclassification of nonaccretable difference to accretable yield for loans with increased cash flow estimates will result in increased interest income as a prospective yield
adjustment over the remaining life of the loan or pool of loans. (4) Provision for additional losses recorded as a charge to income, when it is estimated that the cash flows expected to be collected for a PCI loan or pool of loans may not
support full realization of the carrying value.
Significant Portfolio Reviews Measuring and monitoring our credit risk is an ongoing process that tracks delinquencies, collateral values, FICO scores, economic trends by geographic areas, loan-level risk grading for certain portfolios (typically commercial) and other indications of credit risk. Our credit risk monitoring process is designed to enable early identification of developing risk and to support our determination of an appropriate allowance for credit losses. The following analysis reviews the relevant concentrations and certain credit metrics of our significant portfolios. See Note 6 (Loans and Allowance for Credit Losses) to Financial Statements in this Report for more analysis and credit metric information. COMMERCIAL REAL ESTATE (CRE) The CRE portfolio, consisting of both CRE mortgage loans and CRE construction loans, totaled $125.4 billion, or 16% of total loans, at December 31, 2011. CRE construction loans totaled $19.4 billion at December 31, 2011, and CRE mortgage loans totaled $106.0 billion, of which 33% was to owner-occupants. Table 20 summarizes CRE loans by state and property type with the related nonaccrual totals. CRE nonaccrual loans totaled 5% of the non-PCI CRE outstanding balance at December 31, 2011, a decline of 24% from December 31, 2010. The portfolio is diversified both geographically and by property type. The largest geographic concentrations of combined CRE loans are in California and Florida, which represented 25% and 9% of the total CRE portfolio, respectively. By property type, the largest concentrations are office buildings at 26% and industrial/warehouse at 11% of the portfolio. We subject commercial loans to individual risk assessment using our internal borrower and collateral quality ratings. Our ratings are
aligned to pass and criticized categories with our criticized categories aligned to special mention, substandard and doubtful categories as defined by bank regulatory agencies. At December 31, 2011, we had $22.5 billion of criticized non-PCI CRE mortgage loans, a decrease of 13% from December 31, 2010, and $6.8 billion of criticized non-PCI construction loans, a decrease of 39% from December 31, 2010. Total criticized non-PCI CRE loans remained relatively high as a result of the continued challenging conditions in the real estate market. See Note 6 (Loans and Allowance for Credit Losses) to Financial Statements in this Report for further detail on criticized loans. The underwriting of CRE loans primarily focuses on cash flows inherent in the creditworthiness of the customer, in addition to collateral valuations. To identify and manage newly emerging problem CRE loans, we employ a high level of monitoring and regular customer interaction to understand and manage the risks associated with these loans, including regular loan reviews and appraisal updates. Management is engaged to identify issues and dedicated workout groups are in place to manage problem loans. At December 31, 2011, the recorded investment in PCI CRE loans totaled $5.0 billion, down from $12.3 billion at December 31, 2008, reflecting the reduction resulting from principal payments, loan resolutions and write-downs.
49
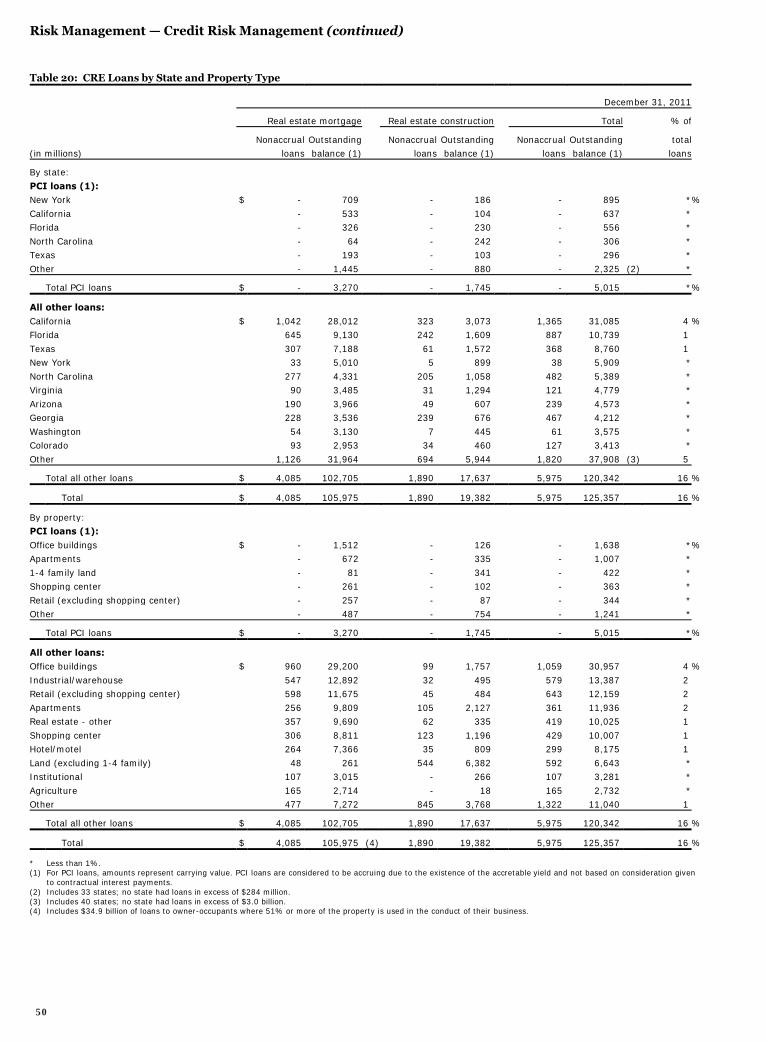
Risk Management — Credit Risk Management (continued)
Table 20: CRE Loans by State and Property Type
December 31, 2011
Real estate mortgage Real estate construction Total % of
Nonaccrual Outstanding Nonaccrual Outstanding Nonaccrual Outstanding total (in millions) loans balance (1) loans balance (1) loans balance (1) loans
By state:
PCI loans (1): New York $ - 709 - 186 - 895 *%
California - 533 - 104 - 637 * Florida - 326 - 230 - 556 *
North Carolina - 64 - 242 - 306 * Texas - 193 - 103 - 296 *
Other - 1,445 - 880 - 2,325 (2) *
Total PCI loans $ - 3,270 - 1,745 - 5,015 *%
All other loans:
California $ 1,042 28,012 323 3,073 1,365 31,085 4 % Florida 645 9,130 242 1,609 887 10,739 1
Texas 307 7,188 61 1,572 368 8,760 1 New York 33 5,010 5 899 38 5,909 *
North Carolina 277 4,331 205 1,058 482 5,389 * Virginia 90 3,485 31 1,294 121 4,779 *
Arizona 190 3,966 49 607 239 4,573 * Georgia 228 3,536 239 676 467 4,212 *
Washington 54 3,130 7 445 61 3,575 * Colorado 93 2,953 34 460 127 3,413 *
Other 1,126 31,964 694 5,944 1,820 37,908 (3) 5
Total all other loans $ 4,085 102,705 1,890 17,637 5,975 120,342 16 %
Total $ 4,085 105,975 1,890 19,382 5,975 125,357 16 %
By property: PCI loans (1):
Office buildings $ - 1,512 - 126 - 1,638 *% Apartments - 672 - 335 - 1,007 *
1-4 family land - 81 - 341 - 422 * Shopping center - 261 - 102 - 363 *
Retail (excluding shopping center) - 257 - 87 - 344 * Other - 487 - 754 - 1,241 *
Total PCI loans $ - 3,270 - 1,745 - 5,015 *%
All other loans: Office buildings $ 960 29,200 99 1,757 1,059 30,957 4 %
Industrial/warehouse 547 12,892 32 495 579 13,387 2 Retail (excluding shopping center) 598 11,675 45 484 643 12,159 2
Apartments 256 9,809 105 2,127 361 11,936 2 Real estate - other 357 9,690 62 335 419 10,025 1
Shopping center 306 8,811 123 1,196 429 10,007 1 Hotel/motel 264 7,366 35 809 299 8,175 1
Land (excluding 1-4 family) 48 261 544 6,382 592 6,643 * Institutional 107 3,015 - 266 107 3,281 *
Agriculture 165 2,714 - 18 165 2,732 * Other 477 7,272 845 3,768 1,322 11,040 1
Total all other loans $ 4,085 102,705 1,890 17,637 5,975 120,342 16 %
Total $ 4,085 105,975 (4) 1,890 19,382 5,975 125,357 16 %
* Less than 1%. (1) For PCI loans, amounts represent carrying value. PCI loans are considered to be accruing due to the existence of the accretable yield and not based on consideration given
to contractual interest payments. (2) Includes 33 states; no state had loans in excess of $284 million. (3) Includes 40 states; no state had loans in excess of $3.0 billion. (4) Includes $34.9 billion of loans to owner-occupants where 51% or more of the property is used in the conduct of their business.
50
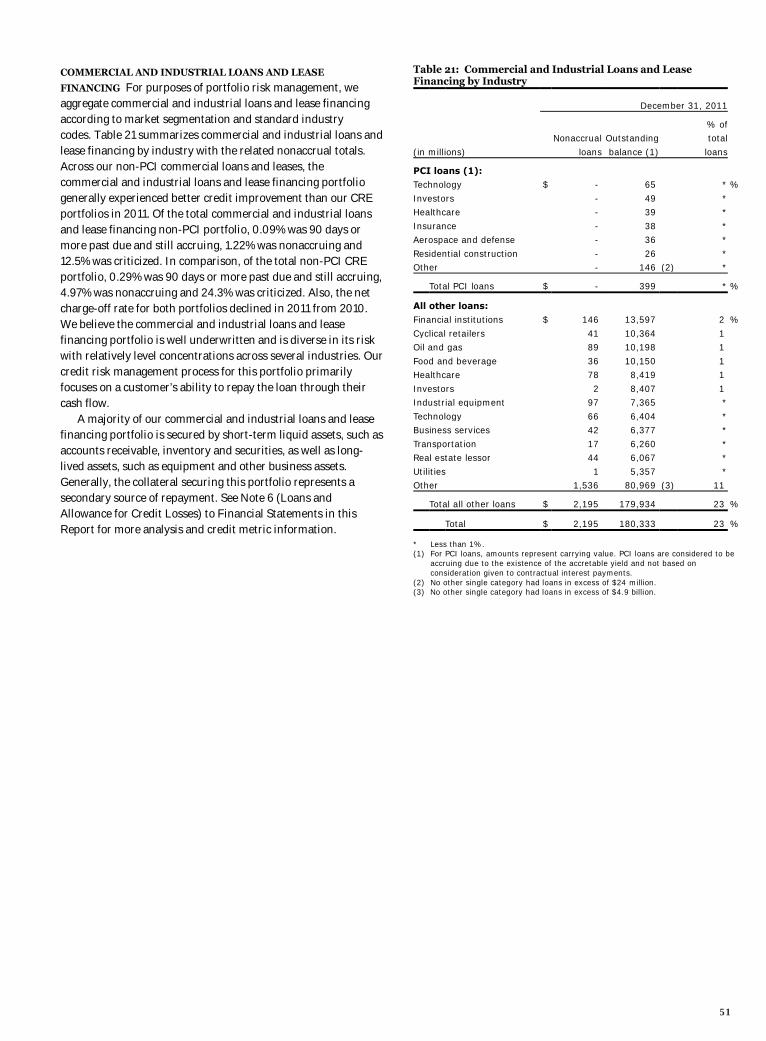
COMMERCIAL AND INDUSTRIAL LOANS AND LEASE
FINANCING For purposes of portfolio risk management, we aggregate commercial and industrial loans and lease financing according to market segmentation and standard industry codes. Table 21 summarizes commercial and industrial loans and lease financing by industry with the related nonaccrual totals. Across our non-PCI commercial loans and leases, the commercial and industrial loans and lease financing portfolio generally experienced better credit improvement than our CRE portfolios in 2011. Of the total commercial and industrial loans and lease financing non-PCI portfolio, 0.09% was 90 days or more past due and still accruing, 1.22% was nonaccruing and 12.5% was criticized. In comparison, of the total non-PCI CRE portfolio, 0.29% was 90 days or more past due and still accruing, 4.97% was nonaccruing and 24.3% was criticized. Also, the net charge-off rate for both portfolios declined in 2011 from 2010. We believe the commercial and industrial loans and lease financing portfolio is well underwritten and is diverse in its risk with relatively level concentrations across several industries. Our credit risk management process for this portfolio primarily focuses on a customer’s ability to repay the loan through their cash flow. A majority of our commercial and industrial loans and lease financing portfolio is secured by short-term liquid assets, such as accounts receivable, inventory and securities, as well as long-lived assets, such as equipment and other business assets. Generally, the collateral securing this portfolio represents a secondary source of repayment. See Note 6 (Loans and Allowance for Credit Losses) to Financial Statements in this Report for more analysis and credit metric information.
Table 21: Commercial and Industrial Loans and Lease Financing by Industry
December 31, 2011
% of Nonaccrual Outstanding total
(in millions) loans balance (1) loans
PCI loans (1): Technology $ - 65 * %
Investors - 49 * Healthcare - 39 *
Insurance - 38 * Aerospace and defense - 36 *
Residential construction - 26 * Other - 146 (2) *
Total PCI loans $ - 399 * %
All other loans: Financial institutions $ 146 13,597 2 %
Cyclical retailers 41 10,364 1 Oil and gas 89 10,198 1
Food and beverage 36 10,150 1 Healthcare 78 8,419 1
Investors 2 8,407 1 Industrial equipment 97 7,365 *
Technology 66 6,404 * Business services 42 6,377 *
Transportation 17 6,260 * Real estate lessor 44 6,067 *
Utilities 1 5,357 * Other 1,536 80,969 (3) 11
Total all other loans $ 2,195 179,934 23 %
Total $ 2,195 180,333 23 %
* Less than 1%. (1) For PCI loans, amounts represent carrying value. PCI loans are considered to be
accruing due to the existence of the accretable yield and not based on consideration given to contractual interest payments.
(2) No other single category had loans in excess of $24 million. (3) No other single category had loans in excess of $4.9 billion.
51

Risk Management — Credit Risk Management (continued)
During the current credit cycle, we have experienced an increase in loans requiring risk mitigation activities including the restructuring of loan terms and requests for extensions of commercial and industrial and CRE loans. All actions are based on a re-underwriting of the loan and our assessment of the borrower’s ability to perform under the agreed-upon terms. Extension terms generally range from six to thirty-six months and may require that the borrower provide additional economic support in the form of partial repayment, or additional collateral or guarantees. In cases where the value of collateral or financial condition of the borrower is insufficient to repay our loan, we may rely upon the support of an outside repayment guarantee in providing the extension. Our ability to seek performance under a guarantee is directly related to the guarantor’s creditworthiness, capacity and willingness to perform, which is evaluated on an annual basis, or more frequently as warranted. Our evaluation is based on the most current financial information available and is focused on various key financial metrics, including net worth, leverage, and current and future liquidity. We consider the guarantor’s reputation, creditworthiness, and willingness to work with us based on our analysis as well as other lenders’ experience with the guarantor. Our assessment of the guarantor’s credit strength is reflected in our loan risk ratings for such loans. The loan risk rating and accruing status are important factors in our allowance methodology for commercial and industrial and CRE loans. In considering the accrual status of the loan, we evaluate the collateral and future cash flows as well as the anticipated support of any repayment guarantor. In many cases the strength of the guarantor provides sufficient assurance that full repayment of the loan is expected. When full and timely collection of the loan becomes uncertain, including the performance of the guarantor, we place the loan on nonaccrual status and we charge-off all or a portion of the loan based on the fair value of the collateral securing the loan, if any. At the time of restructuring, we evaluate whether the loan should be classified as a TDR, and account for it accordingly. For more information on TDRs, see “Troubled Debt Restructurings” later in this section and Note 6 (Loans and Allowance for Credit Losses) to Financial Statements in this Report.
FOREIGN LOANS AND EUROPEAN EXPOSURE Our foreign country risk monitoring process incorporates frequent dialogue with our foreign financial institution customers, counterparties and regulatory agencies, enhanced by centralized monitoring of macroeconomic and capital markets conditions. We establish exposure limits for each country via a centralized oversight process based on the needs of our customers, and in consideration of relevant economic, political, social, legal, and transfer risks. We monitor exposures closely and adjust our limits in response to changing conditions. We conduct periodic stress tests of our significant country risk exposures, analyzing the potential direct and indirect impacts of various macroeconomic and capital market scenarios.
At December 31, 2011, foreign loans represented approximately 5% of our total consolidated loans outstanding and approximately 3% of our total assets. Our largest foreign country exposure on an ultimate risk basis was the United Kingdom, which amounted to approximately $11.0 billion, or 0.84%, of our consolidated assets, and included $1.7 billion of sovereign claims. Our United Kingdom sovereign claims arise primarily from deposits we have placed with the Bank of England pursuant to regulatory requirements in support of our London branch.
Several European countries have been experiencing significant fiscal and economic deterioration in recent months. In January 2012, Standard & Poor’s Ratings Service (S&P) downgraded the long-term sovereign debt ratings of France, Italy, Spain, Cyprus, Portugal, Austria, Malta, Slovakia and Slovenia, as well as the rating of the European Financial Stability Facility. In addition, in February 2012, Moody’s Investors Service lowered the sovereign debt ratings of Italy, Malta, Portugal, Slovakia, Slovenia, and Spain, and Fitch Ratings and S&P downgraded Greece to the lowest rating above a default. At December 31, 2011, our exposure to these downgraded countries, including cross-border claims on an ultimate risk basis, and foreign exchange and derivative products, aggregated approximately $3.4 billion, including $182.3 million of sovereign claims.
Based on our most recent stress testing activities conducted in fourth quarter 2011, in the event of a rapid deterioration in financial and economic conditions in Europe we believe it is unlikely we would experience a material impact to our financial condition, results of operations, liquidity, or capital resources as a result of our European exposures due to the relatively small magnitude of our exposures as well as its diversity by country, type, and counterparty.
Table 22 provides information regarding our exposures to European sovereign entities and institutions located within such countries, including cross-border claims on an ultimate risk basis, and foreign exchange and derivative products.
52
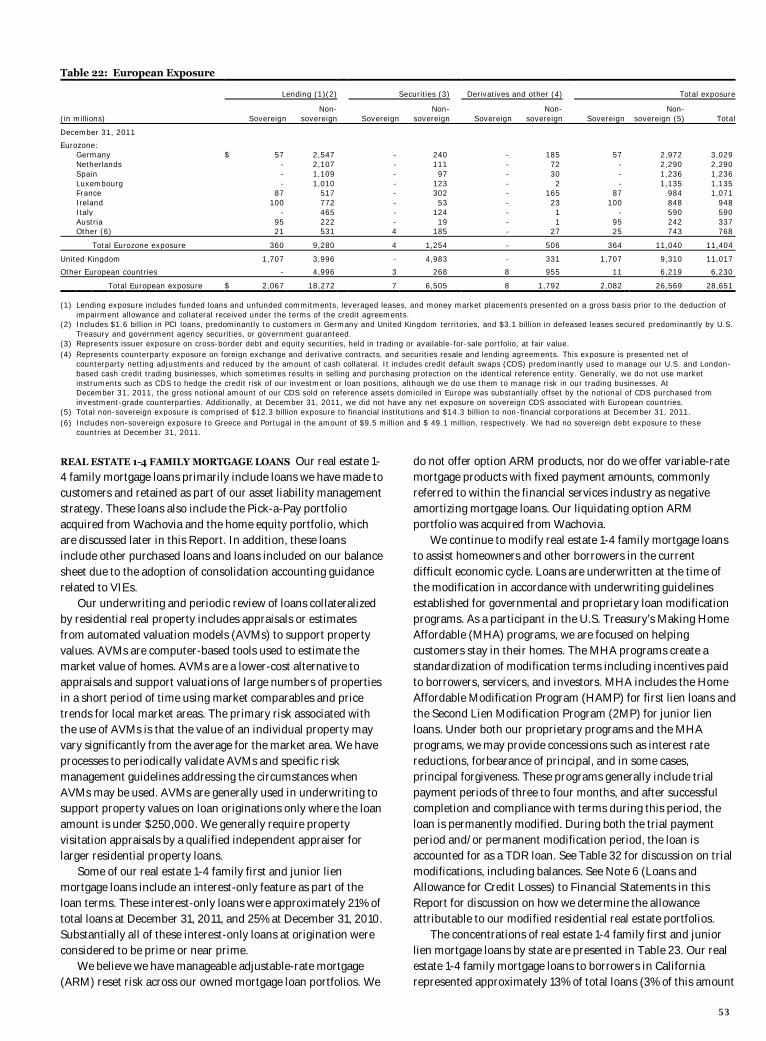
Table 22: European Exposure Lending (1)(2) Securities (3) Derivatives and other (4) Total exposure
Non- Non- Non- Non- (in millions) Sovereign sovereign Sovereign sovereign Sovereign sovereign Sovereign sovereign (5) Total
December 31, 2011
Eurozone: Germany $ 57 2,547 - 240 - 185 57 2,972 3,029 Netherlands - 2,107 - 111 - 72 - 2,290 2,290 Spain - 1,109 - 97 - 30 - 1,236 1,236 Luxembourg - 1,010 - 123 - 2 - 1,135 1,135 France 87 517 - 302 - 165 87 984 1,071 Ireland 100 772 - 53 - 23 100 848 948 Italy - 465 - 124 - 1 - 590 590 Austria 95 222 - 19 - 1 95 242 337 Other (6) 21 531 4 185 - 27 25 743 768
Total Eurozone exposure 360 9,280 4 1,254 - 506 364 11,040 11,404
United Kingdom 1,707 3,996 - 4,983 - 331 1,707 9,310 11,017
Other European countries - 4,996 3 268 8 955 11 6,219 6,230
Total European exposure $ 2,067 18,272 7 6,505 8 1,792 2,082 26,569 28,651 (1) Lending exposure includes funded loans and unfunded commitments, leveraged leases, and money market placements presented on a gross basis prior to the deduction of
impairment allowance and collateral received under the terms of the credit agreements. (2) Includes $1.6 billion in PCI loans, predominantly to customers in Germany and United Kingdom territories, and $3.1 billion in defeased leases secured predominantly by U.S.
Treasury and government agency securities, or government guaranteed. (3) Represents issuer exposure on cross-border debt and equity securities, held in trading or available-for-sale portfolio, at fair value. (4) Represents counterparty exposure on foreign exchange and derivative contracts, and securities resale and lending agreements. This exposure is presented net of
counterparty netting adjustments and reduced by the amount of cash collateral. It includes credit default swaps (CDS) predominantly used to manage our U.S. and London-based cash credit trading businesses, which sometimes results in selling and purchasing protection on the identical reference entity. Generally, we do not use market instruments such as CDS to hedge the credit risk of our investment or loan positions, although we do use them to manage risk in our trading businesses. At December 31, 2011, the gross notional amount of our CDS sold on reference assets domiciled in Europe was substantially offset by the notional of CDS purchased from investment-grade counterparties. Additionally, at December 31, 2011, we did not have any net exposure on sovereign CDS associated with European countries.
(5) Total non-sovereign exposure is comprised of $12.3 billion exposure to financial institutions and $14.3 billion to non-financial corporations at December 31, 2011. (6) Includes non-sovereign exposure to Greece and Portugal in the amount of $9.5 million and $ 49.1 million, respectively. We had no sovereign debt exposure to these
countries at December 31, 2011.
REAL ESTATE 1-4 FAMILY MORTGAGE LOANS Our real estate 1-4 family mortgage loans primarily include loans we have made to customers and retained as part of our asset liability management strategy. These loans also include the Pick-a-Pay portfolio acquired from Wachovia and the home equity portfolio, which are discussed later in this Report. In addition, these loans include other purchased loans and loans included on our balance sheet due to the adoption of consolidation accounting guidance related to VIEs. Our underwriting and periodic review of loans collateralized by residential real property includes appraisals or estimates from automated valuation models (AVMs) to support property values. AVMs are computer-based tools used to estimate the market value of homes. AVMs are a lower-cost alternative to appraisals and support valuations of large numbers of properties in a short period of time using market comparables and price trends for local market areas. The primary risk associated with the use of AVMs is that the value of an individual property may vary significantly from the average for the market area. We have processes to periodically validate AVMs and specific risk management guidelines addressing the circumstances when AVMs may be used. AVMs are generally used in underwriting to support property values on loan originations only where the loan amount is under $250,000. We generally require property visitation appraisals by a qualified independent appraiser for larger residential property loans. Some of our real estate 1-4 family first and junior lien mortgage loans include an interest-only feature as part of the loan terms. These interest-only loans were approximately 21% of total loans at December 31, 2011, and 25% at December 31, 2010. Substantially all of these interest-only loans at origination were considered to be prime or near prime. We believe we have manageable adjustable-rate mortgage (ARM) reset risk across our owned mortgage loan portfolios. We
do not offer option ARM products, nor do we offer variable-rate mortgage products with fixed payment amounts, commonly referred to within the financial services industry as negative amortizing mortgage loans. Our liquidating option ARM portfolio was acquired from Wachovia. We continue to modify real estate 1-4 family mortgage loans to assist homeowners and other borrowers in the current difficult economic cycle. Loans are underwritten at the time of the modification in accordance with underwriting guidelines established for governmental and proprietary loan modification programs. As a participant in the U.S. Treasury’s Making Home Affordable (MHA) programs, we are focused on helping customers stay in their homes. The MHA programs create a standardization of modification terms including incentives paid to borrowers, servicers, and investors. MHA includes the Home Affordable Modification Program (HAMP) for first lien loans and the Second Lien Modification Program (2MP) for junior lien loans. Under both our proprietary programs and the MHA programs, we may provide concessions such as interest rate reductions, forbearance of principal, and in some cases, principal forgiveness. These programs generally include trial payment periods of three to four months, and after successful completion and compliance with terms during this period, the loan is permanently modified. During both the trial payment period and/or permanent modification period, the loan is accounted for as a TDR loan. See Table 32 for discussion on trial modifications, including balances. See Note 6 (Loans and Allowance for Credit Losses) to Financial Statements in this Report for discussion on how we determine the allowance attributable to our modified residential real estate portfolios.
The concentrations of real estate 1-4 family first and junior lien mortgage loans by state are presented in Table 23. Our real estate 1-4 family mortgage loans to borrowers in California represented approximately 13% of total loans (3% of this amount
53
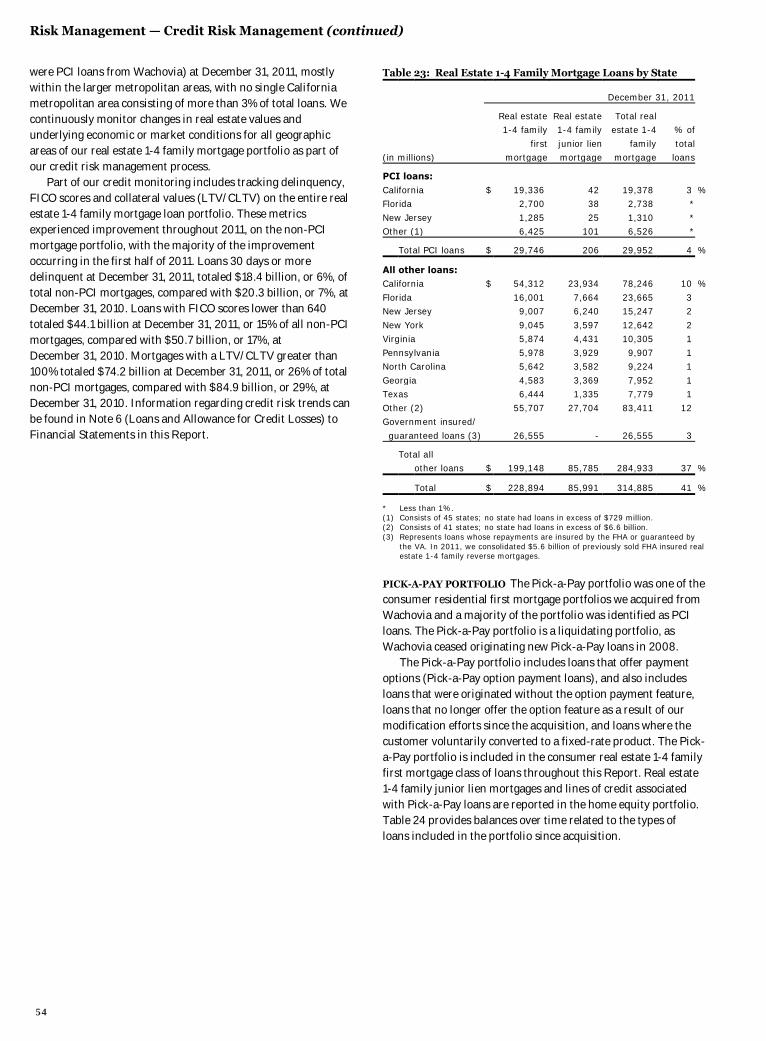
Risk Management — Credit Risk Management (continued)
were PCI loans from Wachovia) at December 31, 2011, mostly within the larger metropolitan areas, with no single California metropolitan area consisting of more than 3% of total loans. We continuously monitor changes in real estate values and underlying economic or market conditions for all geographic areas of our real estate 1-4 family mortgage portfolio as part of our credit risk management process.
Part of our credit monitoring includes tracking delinquency, FICO scores and collateral values (LTV/CLTV) on the entire real estate 1-4 family mortgage loan portfolio. These metrics experienced improvement throughout 2011, on the non-PCI mortgage portfolio, with the majority of the improvement occurring in the first half of 2011. Loans 30 days or more delinquent at December 31, 2011, totaled $18.4 billion, or 6%, of total non-PCI mortgages, compared with $20.3 billion, or 7%, at December 31, 2010. Loans with FICO scores lower than 640 totaled $44.1 billion at December 31, 2011, or 15% of all non-PCI mortgages, compared with $50.7 billion, or 17%, at December 31, 2010. Mortgages with a LTV/CLTV greater than 100% totaled $74.2 billion at December 31, 2011, or 26% of total non-PCI mortgages, compared with $84.9 billion, or 29%, at December 31, 2010. Information regarding credit risk trends can be found in Note 6 (Loans and Allowance for Credit Losses) to Financial Statements in this Report.
Table 23: Real Estate 1-4 Family Mortgage Loans by State
December 31, 2011
Real estate Real estate Total real 1-4 family 1-4 family estate 1-4 % of
first junior lien family total (in millions) mortgage mortgage mortgage loans
PCI loans:
California $ 19,336 42 19,378 3 % Florida 2,700 38 2,738 *
New Jersey 1,285 25 1,310 * Other (1) 6,425 101 6,526 *
Total PCI loans $ 29,746 206 29,952 4 %
All other loans: California $ 54,312 23,934 78,246 10 %
Florida 16,001 7,664 23,665 3 New Jersey 9,007 6,240 15,247 2
New York 9,045 3,597 12,642 2 Virginia 5,874 4,431 10,305 1
Pennsylvania 5,978 3,929 9,907 1 North Carolina 5,642 3,582 9,224 1
Georgia 4,583 3,369 7,952 1 Texas 6,444 1,335 7,779 1
Other (2) 55,707 27,704 83,411 12 Government insured/
guaranteed loans (3) 26,555 - 26,555 3
Total all
other loans $ 199,148 85,785 284,933 37 %
Total $ 228,894 85,991 314,885 41 %
* Less than 1%. (1) Consists of 45 states; no state had loans in excess of $729 million. (2) Consists of 41 states; no state had loans in excess of $6.6 billion. (3) Represents loans whose repayments are insured by the FHA or guaranteed by
the VA. In 2011, we consolidated $5.6 billion of previously sold FHA insured real estate 1-4 family reverse mortgages.
PICK-A-PAY PORTFOLIO The Pick-a-Pay portfolio was one of the consumer residential first mortgage portfolios we acquired from Wachovia and a majority of the portfolio was identified as PCI loans. The Pick-a-Pay portfolio is a liquidating portfolio, as Wachovia ceased originating new Pick-a-Pay loans in 2008. The Pick-a-Pay portfolio includes loans that offer payment options (Pick-a-Pay option payment loans), and also includes loans that were originated without the option payment feature, loans that no longer offer the option feature as a result of our modification efforts since the acquisition, and loans where the customer voluntarily converted to a fixed-rate product. The Pick-a-Pay portfolio is included in the consumer real estate 1-4 family first mortgage class of loans throughout this Report. Real estate 1-4 family junior lien mortgages and lines of credit associated with Pick-a-Pay loans are reported in the home equity portfolio. Table 24 provides balances over time related to the types of loans included in the portfolio since acquisition.
54
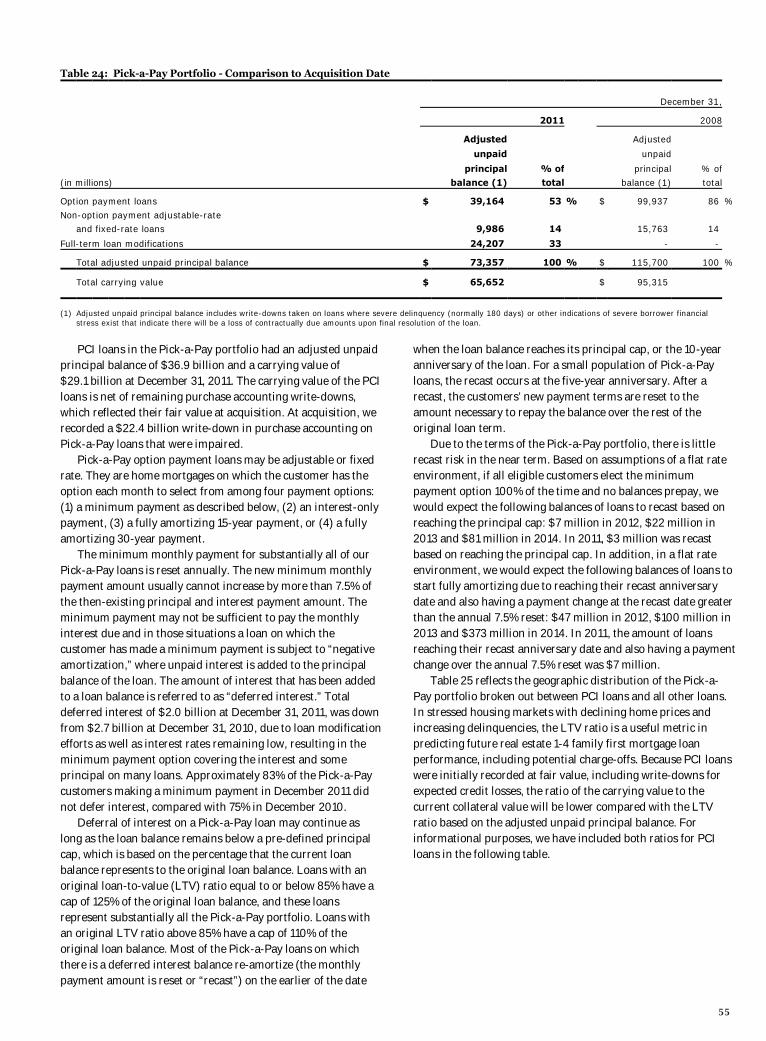
Table 24: Pick-a-Pay Portfolio - Comparison to Acquisition Date
December 31,
2011 2008
Adjusted Adjusted
unpaid unpaid
principal % of principal % of
(in millions) balance (1) total balance (1) total
Option payment loans $ 39,164 53 % $ 99,937 86 %
Non-option payment adjustable-rate and fixed-rate loans 9,986 14 15,763 14
Full-term loan modifications 24,207 33 - -
Total adjusted unpaid principal balance $ 73,357 100 % $ 115,700 100 %
Total carrying value $ 65,652 $ 95,315
(1) Adjusted unpaid principal balance includes write-downs taken on loans where severe delinquency (normally 180 days) or other indications of severe borrower financial stress exist that indicate there will be a loss of contractually due amounts upon final resolution of the loan.
PCI loans in the Pick-a-Pay portfolio had an adjusted unpaid principal balance of $36.9 billion and a carrying value of $29.1 billion at December 31, 2011. The carrying value of the PCI loans is net of remaining purchase accounting write-downs, which reflected their fair value at acquisition. At acquisition, we recorded a $22.4 billion write-down in purchase accounting on Pick-a-Pay loans that were impaired. Pick-a-Pay option payment loans may be adjustable or fixed rate. They are home mortgages on which the customer has the option each month to select from among four payment options: (1) a minimum payment as described below, (2) an interest-only payment, (3) a fully amortizing 15-year payment, or (4) a fully amortizing 30-year payment. The minimum monthly payment for substantially all of our Pick-a-Pay loans is reset annually. The new minimum monthly payment amount usually cannot increase by more than 7.5% of the then-existing principal and interest payment amount. The minimum payment may not be sufficient to pay the monthly interest due and in those situations a loan on which the customer has made a minimum payment is subject to “negative amortization,” where unpaid interest is added to the principal balance of the loan. The amount of interest that has been added to a loan balance is referred to as “deferred interest.” Total deferred interest of $2.0 billion at December 31, 2011, was down from $2.7 billion at December 31, 2010, due to loan modification efforts as well as interest rates remaining low, resulting in the minimum payment option covering the interest and some principal on many loans. Approximately 83% of the Pick-a-Pay customers making a minimum payment in December 2011 did not defer interest, compared with 75% in December 2010. Deferral of interest on a Pick-a-Pay loan may continue as long as the loan balance remains below a pre-defined principal cap, which is based on the percentage that the current loan balance represents to the original loan balance. Loans with an original loan-to-value (LTV) ratio equal to or below 85% have a cap of 125% of the original loan balance, and these loans represent substantially all the Pick-a-Pay portfolio. Loans with an original LTV ratio above 85% have a cap of 110% of the original loan balance. Most of the Pick-a-Pay loans on which there is a deferred interest balance re-amortize (the monthly payment amount is reset or “recast”) on the earlier of the date
when the loan balance reaches its principal cap, or the 10-year anniversary of the loan. For a small population of Pick-a-Pay loans, the recast occurs at the five-year anniversary. After a recast, the customers’ new payment terms are reset to the amount necessary to repay the balance over the rest of the original loan term. Due to the terms of the Pick-a-Pay portfolio, there is little recast risk in the near term. Based on assumptions of a flat rate environment, if all eligible customers elect the minimum payment option 100% of the time and no balances prepay, we would expect the following balances of loans to recast based on reaching the principal cap: $7 million in 2012, $22 million in 2013 and $81 million in 2014. In 2011, $3 million was recast based on reaching the principal cap. In addition, in a flat rate environment, we would expect the following balances of loans to start fully amortizing due to reaching their recast anniversary date and also having a payment change at the recast date greater than the annual 7.5% reset: $47 million in 2012, $100 million in 2013 and $373 million in 2014. In 2011, the amount of loans reaching their recast anniversary date and also having a payment change over the annual 7.5% reset was $7 million. Table 25 reflects the geographic distribution of the Pick-a-Pay portfolio broken out between PCI loans and all other loans. In stressed housing markets with declining home prices and increasing delinquencies, the LTV ratio is a useful metric in predicting future real estate 1-4 family first mortgage loan performance, including potential charge-offs. Because PCI loans were initially recorded at fair value, including write-downs for expected credit losses, the ratio of the carrying value to the current collateral value will be lower compared with the LTV ratio based on the adjusted unpaid principal balance. For informational purposes, we have included both ratios for PCI loans in the following table.
55
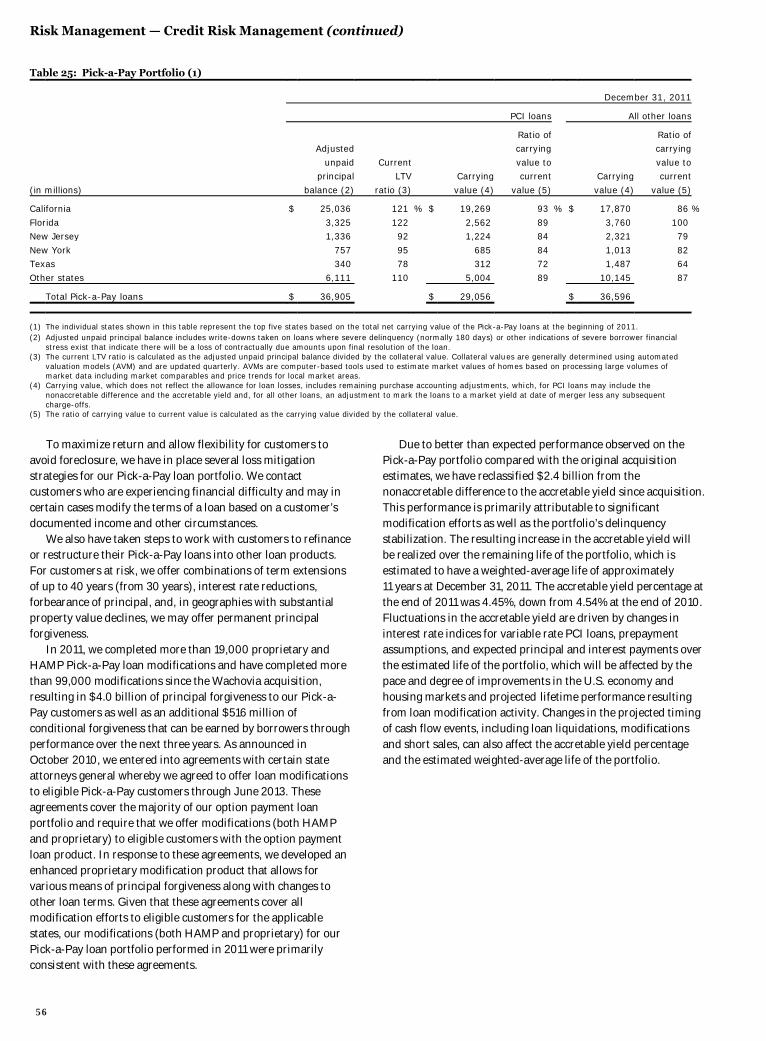
Risk Management — Credit Risk Management (continued)
Table 25: Pick-a-Pay Portfolio (1)
December 31, 2011
PCI loans All other loans
Ratio of Ratio of Adjusted carrying carrying
unpaid Current value to value to principal LTV Carrying current Carrying current
(in millions) balance (2) ratio (3) value (4) value (5) value (4) value (5)
California $ 25,036 121 % $ 19,269 93 % $ 17,870 86 %
Florida 3,325 122 2,562 89 3,760 100 New Jersey 1,336 92 1,224 84 2,321 79
New York 757 95 685 84 1,013 82 Texas 340 78 312 72 1,487 64
Other states 6,111 110 5,004 89 10,145 87
Total Pick-a-Pay loans $ 36,905 $ 29,056 $ 36,596
(1) The individual states shown in this table represent the top five states based on the total net carrying value of the Pick-a-Pay loans at the beginning of 2011. (2) Adjusted unpaid principal balance includes write-downs taken on loans where severe delinquency (normally 180 days) or other indications of severe borrower financial
stress exist that indicate there will be a loss of contractually due amounts upon final resolution of the loan.
(3) The current LTV ratio is calculated as the adjusted unpaid principal balance divided by the collateral value. Collateral values are generally determined using automated valuation models (AVM) and are updated quarterly. AVMs are computer-based tools used to estimate market values of homes based on processing large volumes of market data including market comparables and price trends for local market areas.
(4) Carrying value, which does not reflect the allowance for loan losses, includes remaining purchase accounting adjustments, which, for PCI loans may include the nonaccretable difference and the accretable yield and, for all other loans, an adjustment to mark the loans to a market yield at date of merger less any subsequent charge-offs.
(5) The ratio of carrying value to current value is calculated as the carrying value divided by the collateral value. To maximize return and allow flexibility for customers to avoid foreclosure, we have in place several loss mitigation strategies for our Pick-a-Pay loan portfolio. We contact customers who are experiencing financial difficulty and may in certain cases modify the terms of a loan based on a customer’s documented income and other circumstances. We also have taken steps to work with customers to refinance or restructure their Pick-a-Pay loans into other loan products. For customers at risk, we offer combinations of term extensions of up to 40 years (from 30 years), interest rate reductions, forbearance of principal, and, in geographies with substantial property value declines, we may offer permanent principal forgiveness. In 2011, we completed more than 19,000 proprietary and HAMP Pick-a-Pay loan modifications and have completed more than 99,000 modifications since the Wachovia acquisition, resulting in $4.0 billion of principal forgiveness to our Pick-a-Pay customers as well as an additional $516 million of conditional forgiveness that can be earned by borrowers through performance over the next three years. As announced in October 2010, we entered into agreements with certain state attorneys general whereby we agreed to offer loan modifications to eligible Pick-a-Pay customers through June 2013. These agreements cover the majority of our option payment loan portfolio and require that we offer modifications (both HAMP and proprietary) to eligible customers with the option payment loan product. In response to these agreements, we developed an enhanced proprietary modification product that allows for various means of principal forgiveness along with changes to other loan terms. Given that these agreements cover all modification efforts to eligible customers for the applicable states, our modifications (both HAMP and proprietary) for our Pick-a-Pay loan portfolio performed in 2011 were primarily consistent with these agreements.
Due to better than expected performance observed on the Pick-a-Pay portfolio compared with the original acquisition estimates, we have reclassified $2.4 billion from the nonaccretable difference to the accretable yield since acquisition. This performance is primarily attributable to significant modification efforts as well as the portfolio’s delinquency stabilization. The resulting increase in the accretable yield will be realized over the remaining life of the portfolio, which is estimated to have a weighted-average life of approximately 11 years at December 31, 2011. The accretable yield percentage at the end of 2011 was 4.45%, down from 4.54% at the end of 2010. Fluctuations in the accretable yield are driven by changes in interest rate indices for variable rate PCI loans, prepayment assumptions, and expected principal and interest payments over the estimated life of the portfolio, which will be affected by the pace and degree of improvements in the U.S. economy and housing markets and projected lifetime performance resulting from loan modification activity. Changes in the projected timing of cash flow events, including loan liquidations, modifications and short sales, can also affect the accretable yield percentage and the estimated weighted-average life of the portfolio.
56
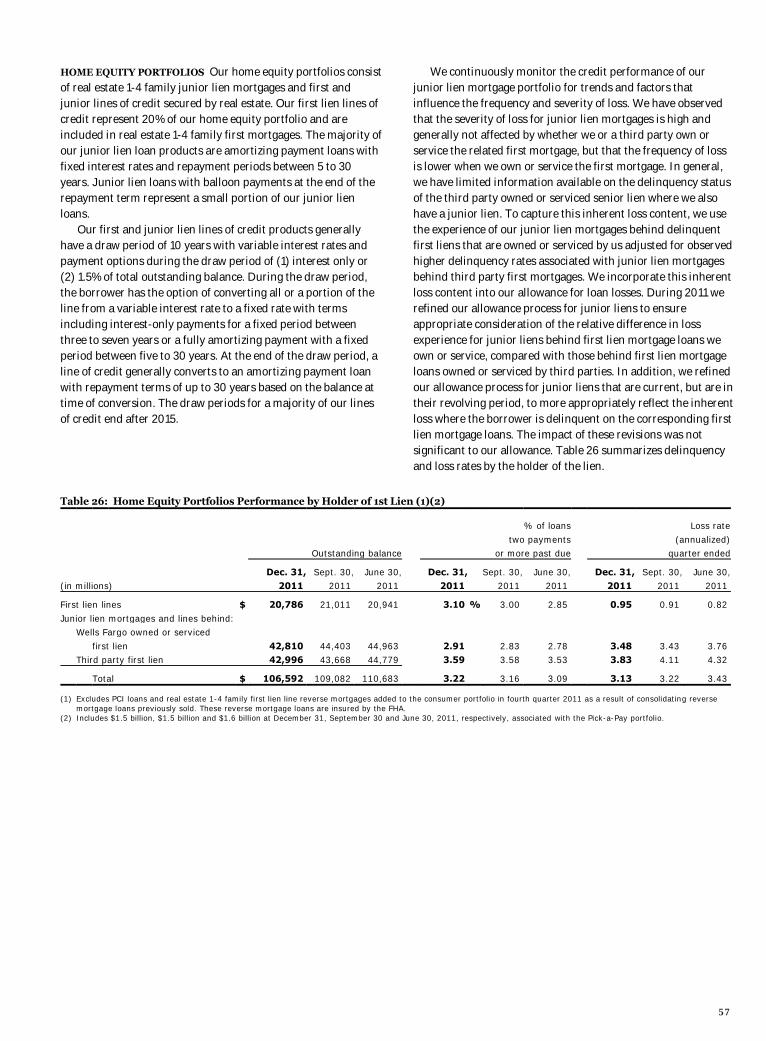
HOME EQUITY PORTFOLIOS Our home equity portfolios consist of real estate 1-4 family junior lien mortgages and first and junior lines of credit secured by real estate. Our first lien lines of credit represent 20% of our home equity portfolio and are included in real estate 1-4 family first mortgages. The majority of our junior lien loan products are amortizing payment loans with fixed interest rates and repayment periods between 5 to 30 years. Junior lien loans with balloon payments at the end of the repayment term represent a small portion of our junior lien loans. Our first and junior lien lines of credit products generally have a draw period of 10 years with variable interest rates and payment options during the draw period of (1) interest only or (2) 1.5% of total outstanding balance. During the draw period, the borrower has the option of converting all or a portion of the line from a variable interest rate to a fixed rate with terms including interest-only payments for a fixed period between three to seven years or a fully amortizing payment with a fixed period between five to 30 years. At the end of the draw period, a line of credit generally converts to an amortizing payment loan with repayment terms of up to 30 years based on the balance at time of conversion. The draw periods for a majority of our lines of credit end after 2015.
We continuously monitor the credit performance of our junior lien mortgage portfolio for trends and factors that influence the frequency and severity of loss. We have observed that the severity of loss for junior lien mortgages is high and generally not affected by whether we or a third party own or service the related first mortgage, but that the frequency of loss is lower when we own or service the first mortgage. In general, we have limited information available on the delinquency status of the third party owned or serviced senior lien where we also have a junior lien. To capture this inherent loss content, we use the experience of our junior lien mortgages behind delinquent first liens that are owned or serviced by us adjusted for observed higher delinquency rates associated with junior lien mortgages behind third party first mortgages. We incorporate this inherent loss content into our allowance for loan losses. During 2011 we refined our allowance process for junior liens to ensure appropriate consideration of the relative difference in loss experience for junior liens behind first lien mortgage loans we own or service, compared with those behind first lien mortgage loans owned or serviced by third parties. In addition, we refined our allowance process for junior liens that are current, but are in their revolving period, to more appropriately reflect the inherent loss where the borrower is delinquent on the corresponding first lien mortgage loans. The impact of these revisions was not significant to our allowance. Table 26 summarizes delinquency and loss rates by the holder of the lien.
Table 26: Home Equity Portfolios Performance by Holder of 1st Lien (1)(2) % of loans Loss rate
two payments (annualized) Outstanding balance or more past due quarter ended
Dec. 31, Sept. 30, June 30, Dec. 31, Sept. 30, June 30, Dec. 31, Sept. 30, June 30, (in millions) 2011 2011 2011 2011 2011 2011 2011 2011 2011
First lien lines $ 20,786 21,011 20,941 3.10 % 3.00 2.85 0.95 0.91 0.82
Junior lien mortgages and lines behind: Wells Fargo owned or serviced
first lien 42,810 44,403 44,963 2.91 2.83 2.78 3.48 3.43 3.76 Third party first lien 42,996 43,668 44,779 3.59 3.58 3.53 3.83 4.11 4.32
Total $ 106,592 109,082 110,683 3.22 3.16 3.09 3.13 3.22 3.43
(1) Excludes PCI loans and real estate 1-4 family first lien line reverse mortgages added to the consumer portfolio in fourth quarter 2011 as a result of consolidating reverse mortgage loans previously sold. These reverse mortgage loans are insured by the FHA.
(2) Includes $1.5 billion, $1.5 billion and $1.6 billion at December 31, September 30 and June 30, 2011, respectively, associated with the Pick-a-Pay portfolio.
57
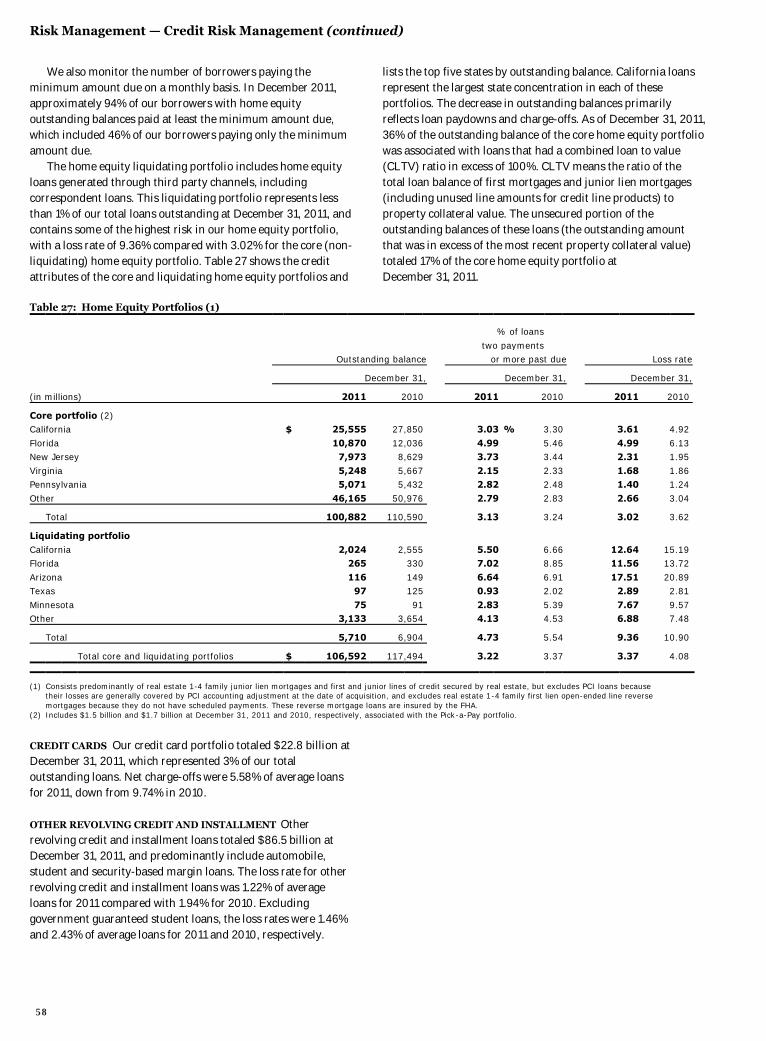
Risk Management — Credit Risk Management (continued)
We also monitor the number of borrowers paying the minimum amount due on a monthly basis. In December 2011, approximately 94% of our borrowers with home equity outstanding balances paid at least the minimum amount due, which included 46% of our borrowers paying only the minimum amount due.
The home equity liquidating portfolio includes home equity loans generated through third party channels, including correspondent loans. This liquidating portfolio represents less than 1% of our total loans outstanding at December 31, 2011, and contains some of the highest risk in our home equity portfolio, with a loss rate of 9.36% compared with 3.02% for the core (non-liquidating) home equity portfolio. Table 27 shows the credit attributes of the core and liquidating home equity portfolios and
lists the top five states by outstanding balance. California loans represent the largest state concentration in each of these portfolios. The decrease in outstanding balances primarily reflects loan paydowns and charge-offs. As of December 31, 2011, 36% of the outstanding balance of the core home equity portfolio was associated with loans that had a combined loan to value (CLTV) ratio in excess of 100%. CLTV means the ratio of the total loan balance of first mortgages and junior lien mortgages (including unused line amounts for credit line products) to property collateral value. The unsecured portion of the outstanding balances of these loans (the outstanding amount that was in excess of the most recent property collateral value) totaled 17% of the core home equity portfolio at December 31, 2011.
Table 27: Home Equity Portfolios (1)
% of loans
two payments Outstanding balance or more past due Loss rate
December 31, December 31, December 31,
(in millions) 2011 2010 2011 2010 2011 2010
Core portfolio (2) California $ 25,555 27,850 3.03 % 3.30 3.61 4.92
Florida 10,870 12,036 4.99 5.46 4.99 6.13 New Jersey 7,973 8,629 3.73 3.44 2.31 1.95
Virginia 5,248 5,667 2.15 2.33 1.68 1.86 Pennsylvania 5,071 5,432 2.82 2.48 1.40 1.24
Other 46,165 50,976 2.79 2.83 2.66 3.04
Total 100,882 110,590 3.13 3.24 3.02 3.62
Liquidating portfolio
California 2,024 2,555 5.50 6.66 12.64 15.19 Florida 265 330 7.02 8.85 11.56 13.72
Arizona 116 149 6.64 6.91 17.51 20.89 Texas 97 125 0.93 2.02 2.89 2.81
Minnesota 75 91 2.83 5.39 7.67 9.57 Other 3,133 3,654 4.13 4.53 6.88 7.48
Total 5,710 6,904 4.73 5.54 9.36 10.90
Total core and liquidating portfolios $ 106,592 117,494 3.22 3.37 3.37 4.08
(1) Consists predominantly of real estate 1-4 family junior lien mortgages and first and junior lines of credit secured by real estate, but excludes PCI loans because their losses are generally covered by PCI accounting adjustment at the date of acquisition, and excludes real estate 1-4 family first lien open-ended line reverse mortgages because they do not have scheduled payments. These reverse mortgage loans are insured by the FHA.
(2) Includes $1.5 billion and $1.7 billion at December 31, 2011 and 2010, respectively, associated with the Pick-a-Pay portfolio.
CREDIT CARDS Our credit card portfolio totaled $22.8 billion at December 31, 2011, which represented 3% of our total outstanding loans. Net charge-offs were 5.58% of average loans for 2011, down from 9.74% in 2010. OTHER REVOLVING CREDIT AND INSTALLMENT Other revolving credit and installment loans totaled $86.5 billion at December 31, 2011, and predominantly include automobile, student and security-based margin loans. The loss rate for other revolving credit and installment loans was 1.22% of average loans for 2011 compared with 1.94% for 2010. Excluding government guaranteed student loans, the loss rates were 1.46% and 2.43% of average loans for 2011 and 2010, respectively.
58
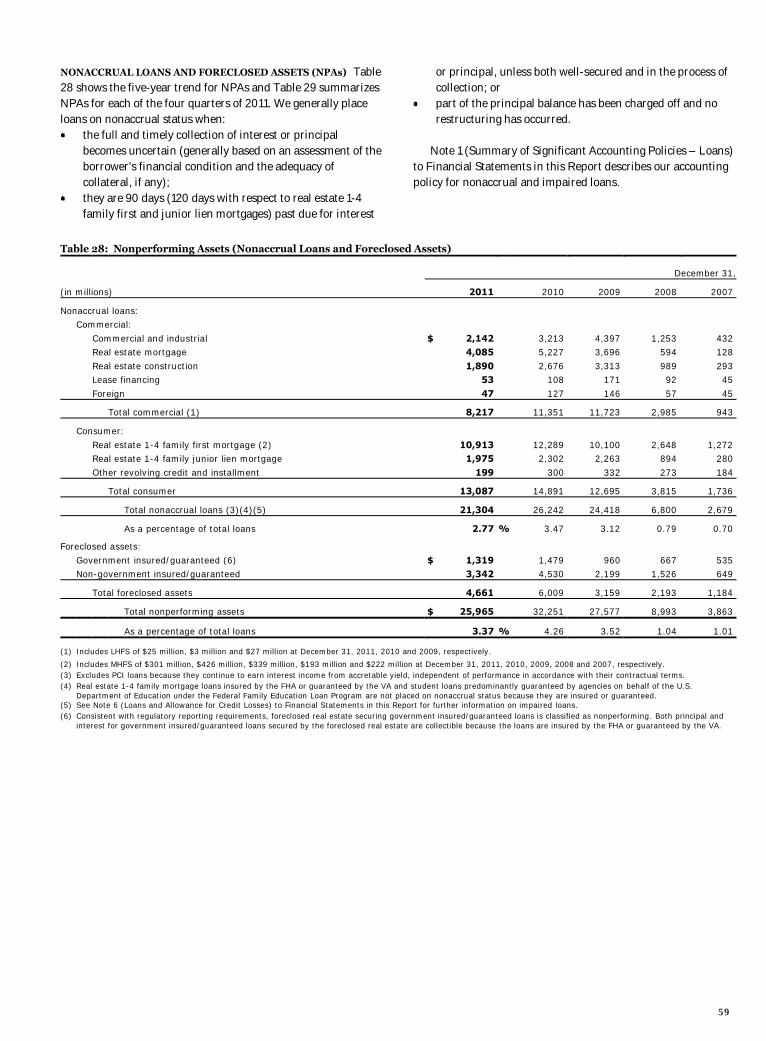
NONACCRUAL LOANS AND FORECLOSED ASSETS (NPAs) Table 28 shows the five-year trend for NPAs and Table 29 summarizes NPAs for each of the four quarters of 2011. We generally place loans on nonaccrual status when: the full and timely collection of interest or principal
becomes uncertain (generally based on an assessment of the borrower’s financial condition and the adequacy of collateral, if any);
they are 90 days (120 days with respect to real estate 1-4 family first and junior lien mortgages) past due for interest
or principal, unless both well-secured and in the process of collection; or
part of the principal balance has been charged off and no restructuring has occurred.
Note 1 (Summary of Significant Accounting Policies – Loans) to Financial Statements in this Report describes our accounting policy for nonaccrual and impaired loans.
Table 28: Nonperforming Assets (Nonaccrual Loans and Foreclosed Assets) December 31,
(in millions) 2011 2010 2009 2008 2007
Nonaccrual loans: Commercial:
Commercial and industrial $ 2,142 3,213 4,397 1,253 432 Real estate mortgage 4,085 5,227 3,696 594 128
Real estate construction 1,890 2,676 3,313 989 293 Lease financing 53 108 171 92 45
Foreign 47 127 146 57 45
Total commercial (1) 8,217 11,351 11,723 2,985 943
Consumer:
Real estate 1-4 family first mortgage (2) 10,913 12,289 10,100 2,648 1,272 Real estate 1-4 family junior lien mortgage 1,975 2,302 2,263 894 280
Other revolving credit and installment 199 300 332 273 184
Total consumer 13,087 14,891 12,695 3,815 1,736
Total nonaccrual loans (3)(4)(5) 21,304 26,242 24,418 6,800 2,679
As a percentage of total loans 2.77 % 3.47 3.12 0.79 0.70
Foreclosed assets:
Government insured/guaranteed (6) $ 1,319 1,479 960 667 535 Non-government insured/guaranteed 3,342 4,530 2,199 1,526 649
Total foreclosed assets 4,661 6,009 3,159 2,193 1,184
Total nonperforming assets $ 25,965 32,251 27,577 8,993 3,863
As a percentage of total loans 3.37 % 4.26 3.52 1.04 1.01
(1) Includes LHFS of $25 million, $3 million and $27 million at December 31, 2011, 2010 and 2009, respectively. (2) Includes MHFS of $301 million, $426 million, $339 million, $193 million and $222 million at December 31, 2011, 2010, 2009, 2008 and 2007, respectively. (3) Excludes PCI loans because they continue to earn interest income from accretable yield, independent of performance in accordance with their contractual terms. (4) Real estate 1-4 family mortgage loans insured by the FHA or guaranteed by the VA and student loans predominantly guaranteed by agencies on behalf of the U.S.
Department of Education under the Federal Family Education Loan Program are not placed on nonaccrual status because they are insured or guaranteed. (5) See Note 6 (Loans and Allowance for Credit Losses) to Financial Statements in this Report for further information on impaired loans. (6) Consistent with regulatory reporting requirements, foreclosed real estate securing government insured/guaranteed loans is classified as nonperforming. Both principal and
interest for government insured/guaranteed loans secured by the foreclosed real estate are collectible because the loans are insured by the FHA or guaranteed by the VA.
59
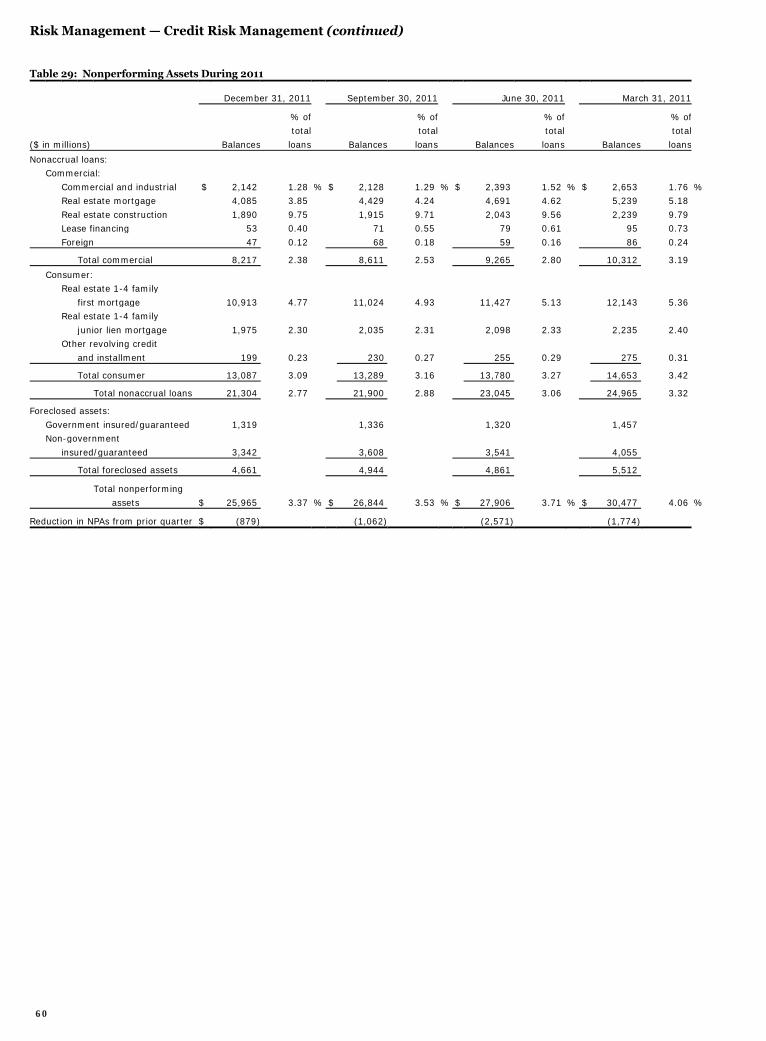
Risk Management — Credit Risk Management (continued)
Table 29: Nonperforming Assets During 2011
December 31, 2011 September 30, 2011 June 30, 2011 March 31, 2011
% of % of % of % of total total total total
($ in millions) Balances loans Balances loans Balances loans Balances loans
Nonaccrual loans: Commercial:
Commercial and industrial $ 2,142 1.28 % $ 2,128 1.29 % $ 2,393 1.52 % $ 2,653 1.76 % Real estate mortgage 4,085 3.85 4,429 4.24 4,691 4.62 5,239 5.18
Real estate construction 1,890 9.75 1,915 9.71 2,043 9.56 2,239 9.79 Lease financing 53 0.40 71 0.55 79 0.61 95 0.73
Foreign 47 0.12 68 0.18 59 0.16 86 0.24
Total commercial 8,217 2.38 8,611 2.53 9,265 2.80 10,312 3.19
Consumer: Real estate 1-4 family
first mortgage 10,913 4.77 11,024 4.93 11,427 5.13 12,143 5.36 Real estate 1-4 family
junior lien mortgage 1,975 2.30 2,035 2.31 2,098 2.33 2,235 2.40 Other revolving credit
and installment 199 0.23 230 0.27 255 0.29 275 0.31
Total consumer 13,087 3.09 13,289 3.16 13,780 3.27 14,653 3.42
Total nonaccrual loans 21,304 2.77 21,900 2.88 23,045 3.06 24,965 3.32
Foreclosed assets:
Government insured/guaranteed 1,319 1,336 1,320 1,457 Non-government
insured/guaranteed 3,342 3,608 3,541 4,055
Total foreclosed assets 4,661 4,944 4,861 5,512
Total nonperforming
assets $ 25,965 3.37 % $ 26,844 3.53 % $ 27,906 3.71 % $ 30,477 4.06 %
Reduction in NPAs from prior quarter $ (879) (1,062) (2,571) (1,774)
60
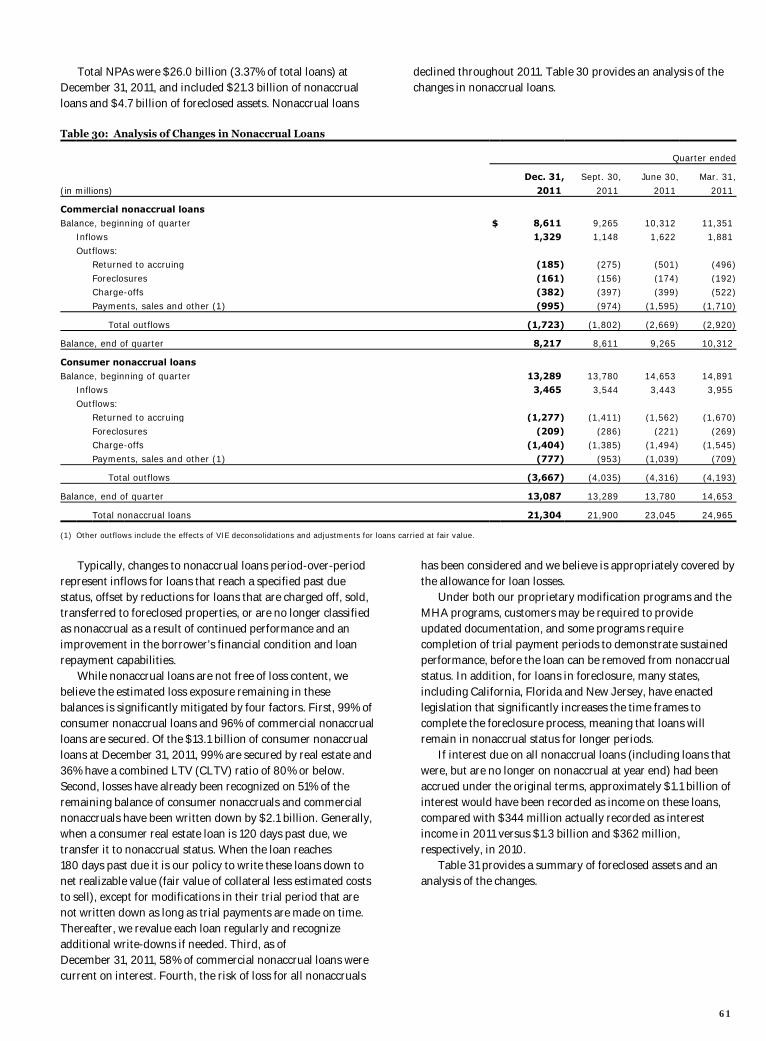
Total NPAs were $26.0 billion (3.37% of total loans) at December 31, 2011, and included $21.3 billion of nonaccrual loans and $4.7 billion of foreclosed assets. Nonaccrual loans
declined throughout 2011. Table 30 provides an analysis of the changes in nonaccrual loans.
Table 30: Analysis of Changes in Nonaccrual Loans
Quarter ended
Dec. 31, Sept. 30, June 30, Mar. 31,
(in millions) 2011 2011 2011 2011
Commercial nonaccrual loans
Balance, beginning of quarter $ 8,611 9,265 10,312 11,351 Inflows 1,329 1,148 1,622 1,881
Outflows: Returned to accruing (185) (275) (501) (496)
Foreclosures (161) (156) (174) (192) Charge-offs (382) (397) (399) (522)
Payments, sales and other (1) (995) (974) (1,595) (1,710)
Total outflows (1,723) (1,802) (2,669) (2,920)
Balance, end of quarter 8,217 8,611 9,265 10,312
Consumer nonaccrual loans
Balance, beginning of quarter 13,289 13,780 14,653 14,891 Inflows 3,465 3,544 3,443 3,955
Outflows: Returned to accruing (1,277) (1,411) (1,562) (1,670)
Foreclosures (209) (286) (221) (269) Charge-offs (1,404) (1,385) (1,494) (1,545)
Payments, sales and other (1) (777) (953) (1,039) (709)
Total outflows (3,667) (4,035) (4,316) (4,193)
Balance, end of quarter 13,087 13,289 13,780 14,653
Total nonaccrual loans 21,304 21,900 23,045 24,965
(1) Other outflows include the effects of VIE deconsolidations and adjustments for loans carried at fair value.
Typically, changes to nonaccrual loans period-over-period represent inflows for loans that reach a specified past due status, offset by reductions for loans that are charged off, sold, transferred to foreclosed properties, or are no longer classified as nonaccrual as a result of continued performance and an improvement in the borrower’s financial condition and loan repayment capabilities. While nonaccrual loans are not free of loss content, we believe the estimated loss exposure remaining in these balances is significantly mitigated by four factors. First, 99% of consumer nonaccrual loans and 96% of commercial nonaccrual loans are secured. Of the $13.1 billion of consumer nonaccrual loans at December 31, 2011, 99% are secured by real estate and 36% have a combined LTV (CLTV) ratio of 80% or below. Second, losses have already been recognized on 51% of the remaining balance of consumer nonaccruals and commercial nonaccruals have been written down by $2.1 billion. Generally, when a consumer real estate loan is 120 days past due, we transfer it to nonaccrual status. When the loan reaches 180 days past due it is our policy to write these loans down to net realizable value (fair value of collateral less estimated costs to sell), except for modifications in their trial period that are not written down as long as trial payments are made on time. Thereafter, we revalue each loan regularly and recognize additional write-downs if needed. Third, as of December 31, 2011, 58% of commercial nonaccrual loans were current on interest. Fourth, the risk of loss for all nonaccruals
has been considered and we believe is appropriately covered by the allowance for loan losses.
Under both our proprietary modification programs and the MHA programs, customers may be required to provide updated documentation, and some programs require completion of trial payment periods to demonstrate sustained performance, before the loan can be removed from nonaccrual status. In addition, for loans in foreclosure, many states, including California, Florida and New Jersey, have enacted legislation that significantly increases the time frames to complete the foreclosure process, meaning that loans will remain in nonaccrual status for longer periods.
If interest due on all nonaccrual loans (including loans that were, but are no longer on nonaccrual at year end) had been accrued under the original terms, approximately $1.1 billion of interest would have been recorded as income on these loans, compared with $344 million actually recorded as interest income in 2011 versus $1.3 billion and $362 million, respectively, in 2010. Table 31 provides a summary of foreclosed assets and an analysis of the changes.
61
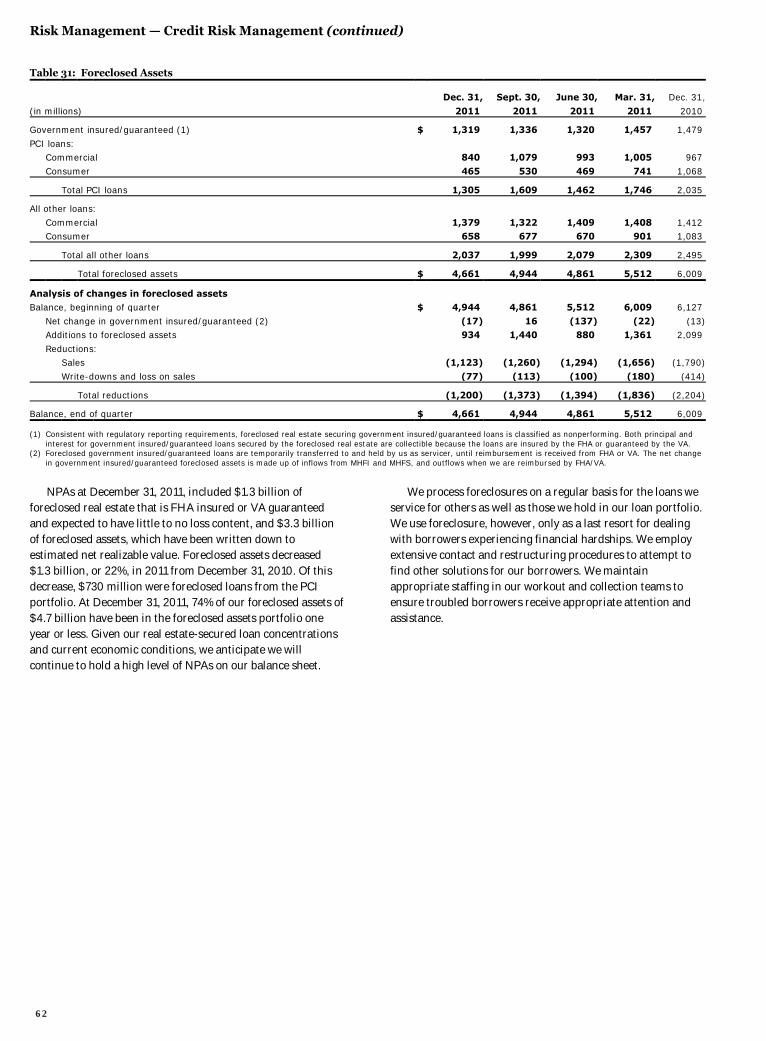
Risk Management — Credit Risk Management (continued)
Table 31: Foreclosed Assets
Dec. 31, Sept. 30, June 30, Mar. 31, Dec. 31,
(in millions) 2011 2011 2011 2011 2010
Government insured/guaranteed (1) $ 1,319 1,336 1,320 1,457 1,479
PCI loans: Commercial 840 1,079 993 1,005 967
Consumer 465 530 469 741 1,068
Total PCI loans 1,305 1,609 1,462 1,746 2,035
All other loans:
Commercial 1,379 1,322 1,409 1,408 1,412 Consumer 658 677 670 901 1,083
Total all other loans 2,037 1,999 2,079 2,309 2,495
Total foreclosed assets $ 4,661 4,944 4,861 5,512 6,009
Analysis of changes in foreclosed assets
Balance, beginning of quarter $ 4,944 4,861 5,512 6,009 6,127 Net change in government insured/guaranteed (2) (17) 16 (137) (22) (13) Additions to foreclosed assets 934 1,440 880 1,361 2,099 Reductions: Sales (1,123) (1,260) (1,294) (1,656) (1,790) Write-downs and loss on sales (77) (113) (100) (180) (414)
Total reductions (1,200) (1,373) (1,394) (1,836) (2,204)
Balance, end of quarter $ 4,661 4,944 4,861 5,512 6,009
(1) Consistent with regulatory reporting requirements, foreclosed real estate securing government insured/guaranteed loans is classified as nonperforming. Both principal and interest for government insured/guaranteed loans secured by the foreclosed real estate are collectible because the loans are insured by the FHA or guaranteed by the VA.
(2) Foreclosed government insured/guaranteed loans are temporarily transferred to and held by us as servicer, until reimbursement is received from FHA or VA. The net change in government insured/guaranteed foreclosed assets is made up of inflows from MHFI and MHFS, and outflows when we are reimbursed by FHA/VA.
NPAs at December 31, 2011, included $1.3 billion of foreclosed real estate that is FHA insured or VA guaranteed and expected to have little to no loss content, and $3.3 billion of foreclosed assets, which have been written down to estimated net realizable value. Foreclosed assets decreased $1.3 billion, or 22%, in 2011 from December 31, 2010. Of this decrease, $730 million were foreclosed loans from the PCI portfolio. At December 31, 2011, 74% of our foreclosed assets of $4.7 billion have been in the foreclosed assets portfolio one year or less. Given our real estate-secured loan concentrations and current economic conditions, we anticipate we will continue to hold a high level of NPAs on our balance sheet.
We process foreclosures on a regular basis for the loans we service for others as well as those we hold in our loan portfolio. We use foreclosure, however, only as a last resort for dealing with borrowers experiencing financial hardships. We employ extensive contact and restructuring procedures to attempt to find other solutions for our borrowers. We maintain appropriate staffing in our workout and collection teams to ensure troubled borrowers receive appropriate attention and assistance.
62
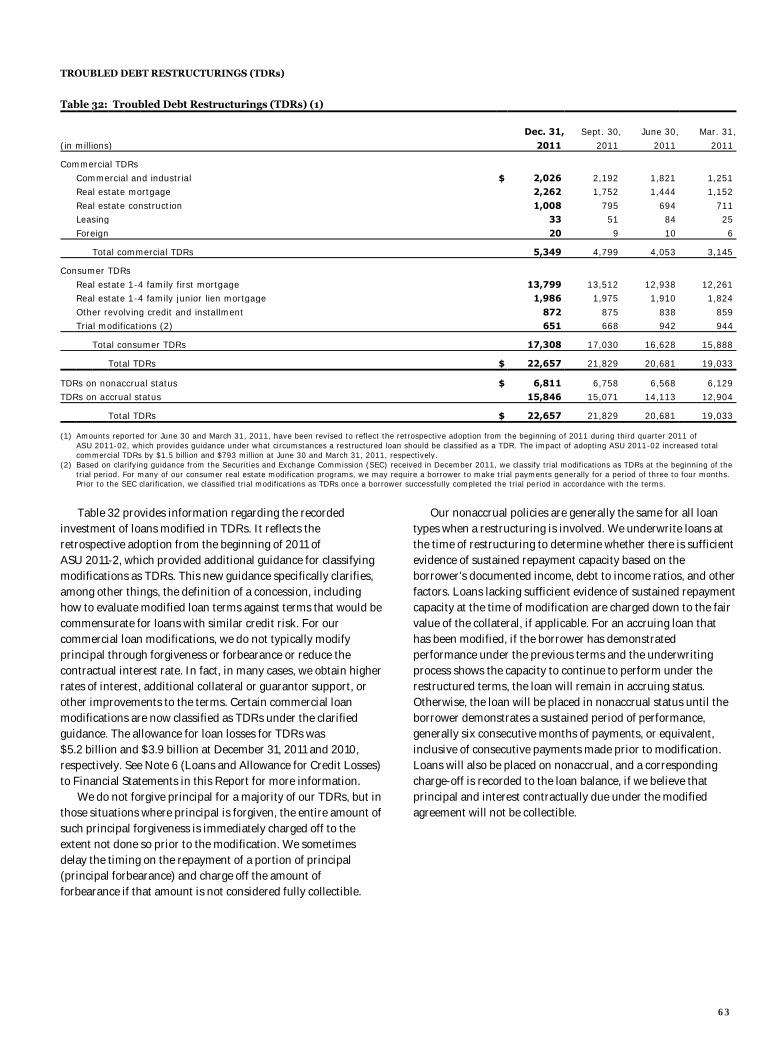
TROUBLED DEBT RESTRUCTURINGS (TDRs) Table 32: Troubled Debt Restructurings (TDRs) (1)
Dec. 31, Sept. 30, June 30, Mar. 31,
(in millions) 2011 2011 2011 2011
Commercial TDRs
Commercial and industrial $ 2,026 2,192 1,821 1,251 Real estate mortgage 2,262 1,752 1,444 1,152
Real estate construction 1,008 795 694 711 Leasing 33 51 84 25
Foreign 20 9 10 6
Total commercial TDRs 5,349 4,799 4,053 3,145
Consumer TDRs
Real estate 1-4 family first mortgage 13,799 13,512 12,938 12,261 Real estate 1-4 family junior lien mortgage 1,986 1,975 1,910 1,824
Other revolving credit and installment 872 875 838 859 Trial modifications (2) 651 668 942 944
Total consumer TDRs 17,308 17,030 16,628 15,888
Total TDRs $ 22,657 21,829 20,681 19,033
TDRs on nonaccrual status $ 6,811 6,758 6,568 6,129 TDRs on accrual status 15,846 15,071 14,113 12,904
Total TDRs $ 22,657 21,829 20,681 19,033
(1) Amounts reported for June 30 and March 31, 2011, have been revised to reflect the retrospective adoption from the beginning of 2011 during third quarter 2011 of ASU 2011-02, which provides guidance under what circumstances a restructured loan should be classified as a TDR. The impact of adopting ASU 2011-02 increased total commercial TDRs by $1.5 billion and $793 million at June 30 and March 31, 2011, respectively.
(2) Based on clarifying guidance from the Securities and Exchange Commission (SEC) received in December 2011, we classify trial modifications as TDRs at the beginning of the trial period. For many of our consumer real estate modification programs, we may require a borrower to make trial payments generally for a period of three to four months. Prior to the SEC clarification, we classified trial modifications as TDRs once a borrower successfully completed the trial period in accordance with the terms.
Table 32 provides information regarding the recorded investment of loans modified in TDRs. It reflects the retrospective adoption from the beginning of 2011 of ASU 2011-2, which provided additional guidance for classifying modifications as TDRs. This new guidance specifically clarifies, among other things, the definition of a concession, including how to evaluate modified loan terms against terms that would be commensurate for loans with similar credit risk. For our commercial loan modifications, we do not typically modify principal through forgiveness or forbearance or reduce the contractual interest rate. In fact, in many cases, we obtain higher rates of interest, additional collateral or guarantor support, or other improvements to the terms. Certain commercial loan modifications are now classified as TDRs under the clarified guidance. The allowance for loan losses for TDRs was $5.2 billion and $3.9 billion at December 31, 2011 and 2010, respectively. See Note 6 (Loans and Allowance for Credit Losses) to Financial Statements in this Report for more information. We do not forgive principal for a majority of our TDRs, but in those situations where principal is forgiven, the entire amount of such principal forgiveness is immediately charged off to the extent not done so prior to the modification. We sometimes delay the timing on the repayment of a portion of principal (principal forbearance) and charge off the amount of forbearance if that amount is not considered fully collectible.
Our nonaccrual policies are generally the same for all loan types when a restructuring is involved. We underwrite loans at the time of restructuring to determine whether there is sufficient evidence of sustained repayment capacity based on the borrower’s documented income, debt to income ratios, and other factors. Loans lacking sufficient evidence of sustained repayment capacity at the time of modification are charged down to the fair value of the collateral, if applicable. For an accruing loan that has been modified, if the borrower has demonstrated performance under the previous terms and the underwriting process shows the capacity to continue to perform under the restructured terms, the loan will remain in accruing status. Otherwise, the loan will be placed in nonaccrual status until the borrower demonstrates a sustained period of performance, generally six consecutive months of payments, or equivalent, inclusive of consecutive payments made prior to modification. Loans will also be placed on nonaccrual, and a corresponding charge-off is recorded to the loan balance, if we believe that principal and interest contractually due under the modified agreement will not be collectible.
63
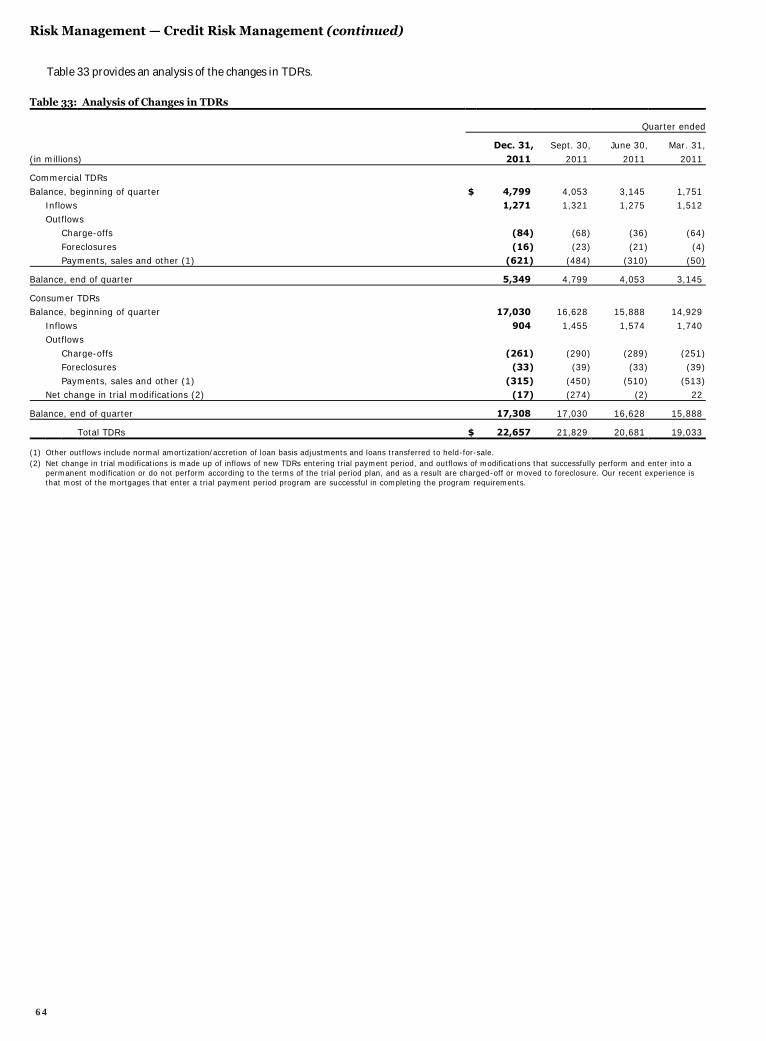
Risk Management — Credit Risk Management (continued)
Table 33 provides an analysis of the changes in TDRs. Table 33: Analysis of Changes in TDRs
Quarter ended
Dec. 31, Sept. 30, June 30, Mar. 31,
(in millions) 2011 2011 2011 2011
Commercial TDRs
Balance, beginning of quarter $ 4,799 4,053 3,145 1,751 Inflows 1,271 1,321 1,275 1,512
Outflows Charge-offs (84) (68) (36) (64)
Foreclosures (16) (23) (21) (4) Payments, sales and other (1) (621) (484) (310) (50)
Balance, end of quarter 5,349 4,799 4,053 3,145
Consumer TDRs Balance, beginning of quarter 17,030 16,628 15,888 14,929
Inflows 904 1,455 1,574 1,740 Outflows
Charge-offs (261) (290) (289) (251) Foreclosures (33) (39) (33) (39)
Payments, sales and other (1) (315) (450) (510) (513) Net change in trial modifications (2) (17) (274) (2) 22
Balance, end of quarter 17,308 17,030 16,628 15,888
Total TDRs $ 22,657 21,829 20,681 19,033
(1) Other outflows include normal amortization/accretion of loan basis adjustments and loans transferred to held-for-sale. (2) Net change in trial modifications is made up of inflows of new TDRs entering trial payment period, and outflows of modifications that successfully perform and enter into a
permanent modification or do not perform according to the terms of the trial period plan, and as a result are charged-off or moved to foreclosure. Our recent experience is that most of the mortgages that enter a trial payment period program are successful in completing the program requirements.
64
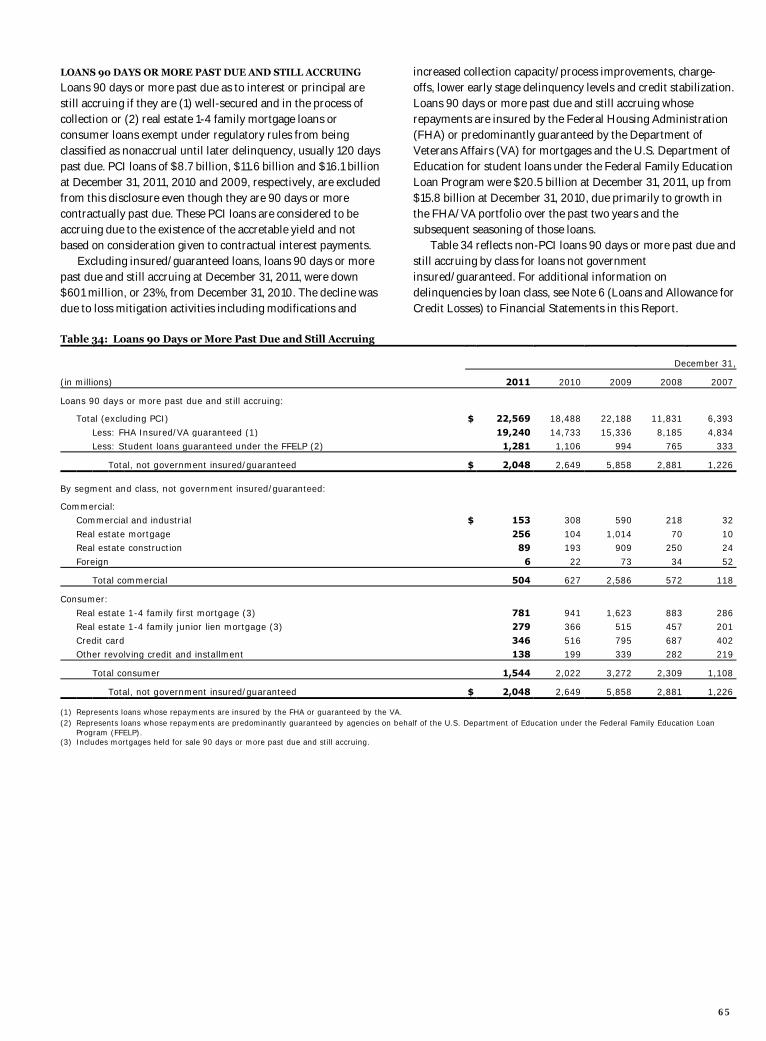
LOANS 90 DAYS OR MORE PAST DUE AND STILL ACCRUING Loans 90 days or more past due as to interest or principal are still accruing if they are (1) well-secured and in the process of collection or (2) real estate 1-4 family mortgage loans or consumer loans exempt under regulatory rules from being classified as nonaccrual until later delinquency, usually 120 days past due. PCI loans of $8.7 billion, $11.6 billion and $16.1 billion at December 31, 2011, 2010 and 2009, respectively, are excluded from this disclosure even though they are 90 days or more contractually past due. These PCI loans are considered to be accruing due to the existence of the accretable yield and not based on consideration given to contractual interest payments. Excluding insured/guaranteed loans, loans 90 days or more past due and still accruing at December 31, 2011, were down $601 million, or 23%, from December 31, 2010. The decline was due to loss mitigation activities including modifications and
increased collection capacity/process improvements, charge-offs, lower early stage delinquency levels and credit stabilization. Loans 90 days or more past due and still accruing whose repayments are insured by the Federal Housing Administration (FHA) or predominantly guaranteed by the Department of Veterans Affairs (VA) for mortgages and the U.S. Department of Education for student loans under the Federal Family Education Loan Program were $20.5 billion at December 31, 2011, up from $15.8 billion at December 31, 2010, due primarily to growth in the FHA/VA portfolio over the past two years and the subsequent seasoning of those loans. Table 34 reflects non-PCI loans 90 days or more past due and still accruing by class for loans not government insured/guaranteed. For additional information on delinquencies by loan class, see Note 6 (Loans and Allowance for Credit Losses) to Financial Statements in this Report.
Table 34: Loans 90 Days or More Past Due and Still Accruing
December 31,
(in millions) 2011 2010 2009 2008 2007
Loans 90 days or more past due and still accruing:
Total (excluding PCI) $ 22,569 18,488 22,188 11,831 6,393
Less: FHA Insured/VA guaranteed (1) 19,240 14,733 15,336 8,185 4,834 Less: Student loans guaranteed under the FFELP (2) 1,281 1,106 994 765 333
Total, not government insured/guaranteed $ 2,048 2,649 5,858 2,881 1,226
By segment and class, not government insured/guaranteed:
Commercial: Commercial and industrial $ 153 308 590 218 32
Real estate mortgage 256 104 1,014 70 10 Real estate construction 89 193 909 250 24
Foreign 6 22 73 34 52
Total commercial 504 627 2,586 572 118
Consumer:
Real estate 1-4 family first mortgage (3) 781 941 1,623 883 286 Real estate 1-4 family junior lien mortgage (3) 279 366 515 457 201
Credit card 346 516 795 687 402 Other revolving credit and installment 138 199 339 282 219
Total consumer 1,544 2,022 3,272 2,309 1,108
Total, not government insured/guaranteed $ 2,048 2,649 5,858 2,881 1,226
(1) Represents loans whose repayments are insured by the FHA or guaranteed by the VA. (2) Represents loans whose repayments are predominantly guaranteed by agencies on behalf of the U.S. Department of Education under the Federal Family Education Loan
Program (FFELP). (3) Includes mortgages held for sale 90 days or more past due and still accruing.
65
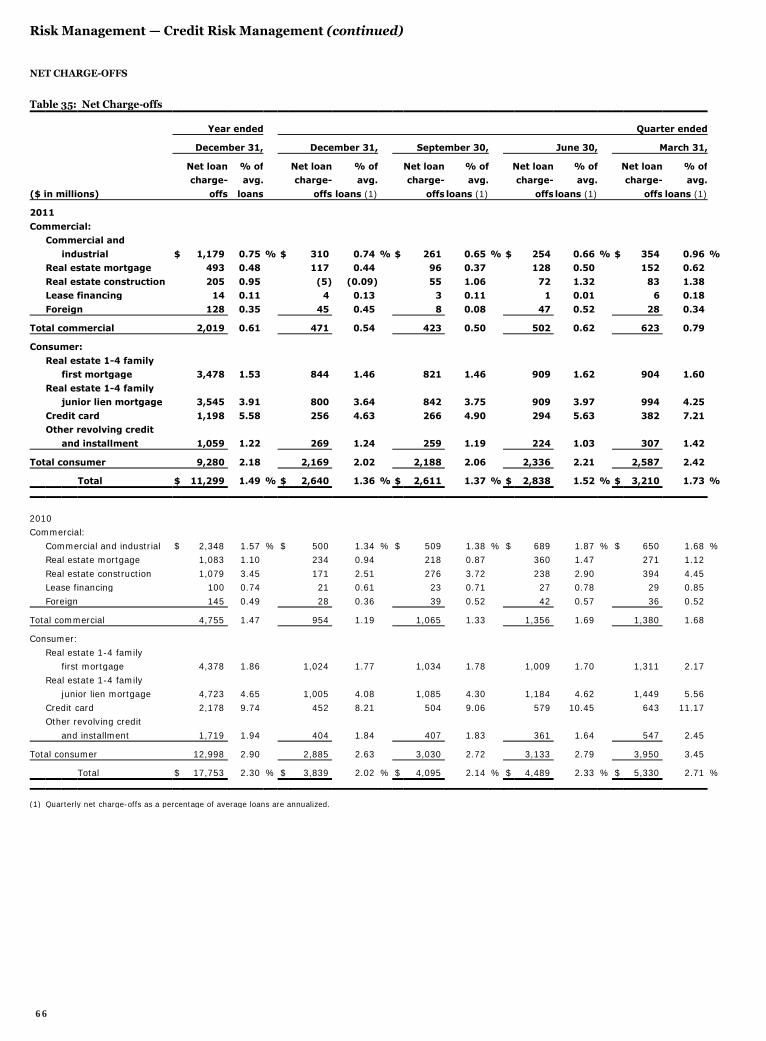
Risk Management — Credit Risk Management (continued)
NET CHARGE-OFFS Table 35: Net Charge-offs
Year ended Quarter ended
December 31, December 31, September 30, June 30, March 31,
Net loan % of Net loan % of Net loan % of Net loan % of Net loan % of charge- avg. charge- avg. charge- avg. charge- avg. charge- avg.
($ in millions) offs loans offs loans (1) offs loans (1) offs loans (1) offs loans (1)
2011
Commercial: Commercial and
industrial $ 1,179 0.75 % $ 310 0.74 % $ 261 0.65 % $ 254 0.66 % $ 354 0.96 % Real estate mortgage 493 0.48 117 0.44 96 0.37 128 0.50 152 0.62
Real estate construction 205 0.95 (5) (0.09) 55 1.06 72 1.32 83 1.38 Lease financing 14 0.11 4 0.13 3 0.11 1 0.01 6 0.18
Foreign 128 0.35 45 0.45 8 0.08 47 0.52 28 0.34
Total commercial 2,019 0.61 471 0.54 423 0.50 502 0.62 623 0.79
Consumer:
Real estate 1-4 family first mortgage 3,478 1.53 844 1.46 821 1.46 909 1.62 904 1.60
Real estate 1-4 family junior lien mortgage 3,545 3.91 800 3.64 842 3.75 909 3.97 994 4.25
Credit card 1,198 5.58 256 4.63 266 4.90 294 5.63 382 7.21 Other revolving credit
and installment 1,059 1.22 269 1.24 259 1.19 224 1.03 307 1.42
Total consumer 9,280 2.18 2,169 2.02 2,188 2.06 2,336 2.21 2,587 2.42
Total $ 11,299 1.49 % $ 2,640 1.36 % $ 2,611 1.37 % $ 2,838 1.52 % $ 3,210 1.73 %
2010 Commercial:
Commercial and industrial $ 2,348 1.57 % $ 500 1.34 % $ 509 1.38 % $ 689 1.87 % $ 650 1.68 % Real estate mortgage 1,083 1.10 234 0.94 218 0.87 360 1.47 271 1.12
Real estate construction 1,079 3.45 171 2.51 276 3.72 238 2.90 394 4.45 Lease financing 100 0.74 21 0.61 23 0.71 27 0.78 29 0.85
Foreign 145 0.49 28 0.36 39 0.52 42 0.57 36 0.52
Total commercial 4,755 1.47 954 1.19 1,065 1.33 1,356 1.69 1,380 1.68
Consumer:
Real estate 1-4 family first mortgage 4,378 1.86 1,024 1.77 1,034 1.78 1,009 1.70 1,311 2.17
Real estate 1-4 family junior lien mortgage 4,723 4.65 1,005 4.08 1,085 4.30 1,184 4.62 1,449 5.56
Credit card 2,178 9.74 452 8.21 504 9.06 579 10.45 643 11.17 Other revolving credit
and installment 1,719 1.94 404 1.84 407 1.83 361 1.64 547 2.45
Total consumer 12,998 2.90 2,885 2.63 3,030 2.72 3,133 2.79 3,950 3.45
Total $ 17,753 2.30 % $ 3,839 2.02 % $ 4,095 2.14 % $ 4,489 2.33 % $ 5,330 2.71 %
(1) Quarterly net charge-offs as a percentage of average loans are annualized.
66
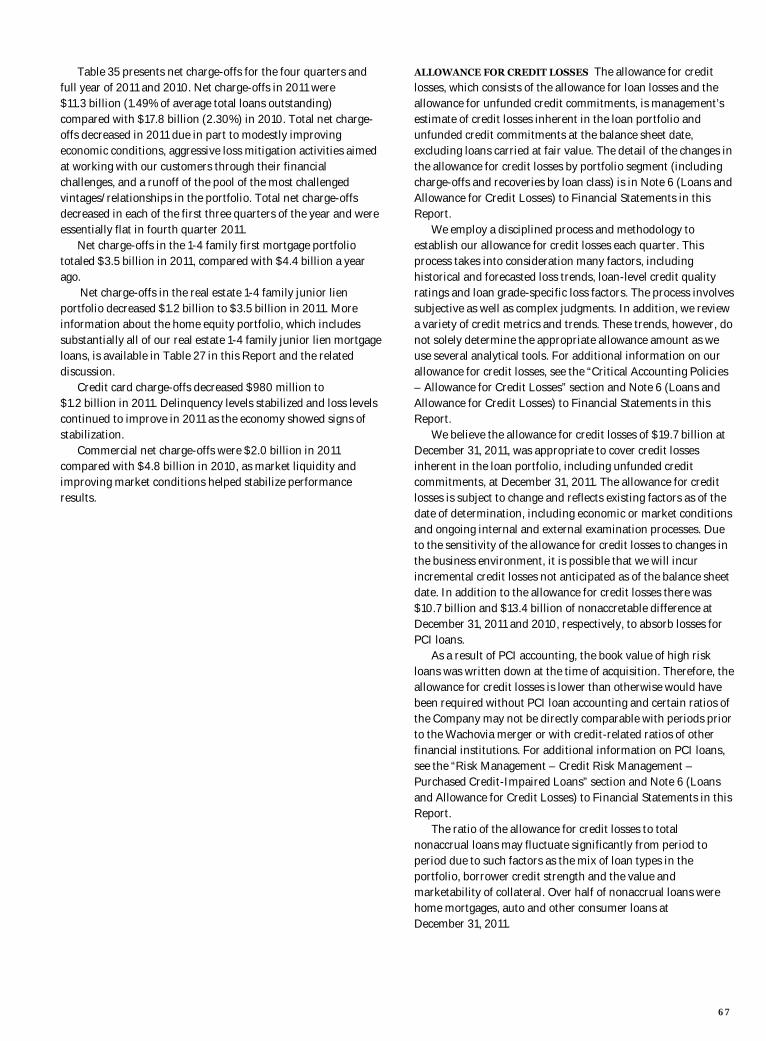
Table 35 presents net charge-offs for the four quarters and full year of 2011 and 2010. Net charge-offs in 2011 were $11.3 billion (1.49% of average total loans outstanding) compared with $17.8 billion (2.30%) in 2010. Total net charge-offs decreased in 2011 due in part to modestly improving economic conditions, aggressive loss mitigation activities aimed at working with our customers through their financial challenges, and a runoff of the pool of the most challenged vintages/relationships in the portfolio. Total net charge-offs decreased in each of the first three quarters of the year and were essentially flat in fourth quarter 2011. Net charge-offs in the 1-4 family first mortgage portfolio totaled $3.5 billion in 2011, compared with $4.4 billion a year ago. Net charge-offs in the real estate 1-4 family junior lien portfolio decreased $1.2 billion to $3.5 billion in 2011. More information about the home equity portfolio, which includes substantially all of our real estate 1-4 family junior lien mortgage loans, is available in Table 27 in this Report and the related discussion. Credit card charge-offs decreased $980 million to $1.2 billion in 2011. Delinquency levels stabilized and loss levels continued to improve in 2011 as the economy showed signs of stabilization. Commercial net charge-offs were $2.0 billion in 2011 compared with $4.8 billion in 2010, as market liquidity and improving market conditions helped stabilize performance results.
ALLOWANCE FOR CREDIT LOSSES The allowance for credit losses, which consists of the allowance for loan losses and the allowance for unfunded credit commitments, is management’s estimate of credit losses inherent in the loan portfolio and unfunded credit commitments at the balance sheet date, excluding loans carried at fair value. The detail of the changes in the allowance for credit losses by portfolio segment (including charge-offs and recoveries by loan class) is in Note 6 (Loans and Allowance for Credit Losses) to Financial Statements in this Report. We employ a disciplined process and methodology to establish our allowance for credit losses each quarter. This process takes into consideration many factors, including historical and forecasted loss trends, loan-level credit quality ratings and loan grade-specific loss factors. The process involves subjective as well as complex judgments. In addition, we review a variety of credit metrics and trends. These trends, however, do not solely determine the appropriate allowance amount as we use several analytical tools. For additional information on our allowance for credit losses, see the “Critical Accounting Policies – Allowance for Credit Losses” section and Note 6 (Loans and Allowance for Credit Losses) to Financial Statements in this Report. We believe the allowance for credit losses of $19.7 billion at December 31, 2011, was appropriate to cover credit losses inherent in the loan portfolio, including unfunded credit commitments, at December 31, 2011. The allowance for credit losses is subject to change and reflects existing factors as of the date of determination, including economic or market conditions and ongoing internal and external examination processes. Due to the sensitivity of the allowance for credit losses to changes in the business environment, it is possible that we will incur incremental credit losses not anticipated as of the balance sheet date. In addition to the allowance for credit losses there was $10.7 billion and $13.4 billion of nonaccretable difference at December 31, 2011 and 2010, respectively, to absorb losses for PCI loans. As a result of PCI accounting, the book value of high risk loans was written down at the time of acquisition. Therefore, the allowance for credit losses is lower than otherwise would have been required without PCI loan accounting and certain ratios of the Company may not be directly comparable with periods prior to the Wachovia merger or with credit-related ratios of other financial institutions. For additional information on PCI loans, see the “Risk Management – Credit Risk Management – Purchased Credit-Impaired Loans” section and Note 6 (Loans and Allowance for Credit Losses) to Financial Statements in this Report. The ratio of the allowance for credit losses to total nonaccrual loans may fluctuate significantly from period to period due to such factors as the mix of loan types in the portfolio, borrower credit strength and the value and marketability of collateral. Over half of nonaccrual loans were home mortgages, auto and other consumer loans at December 31, 2011.
67
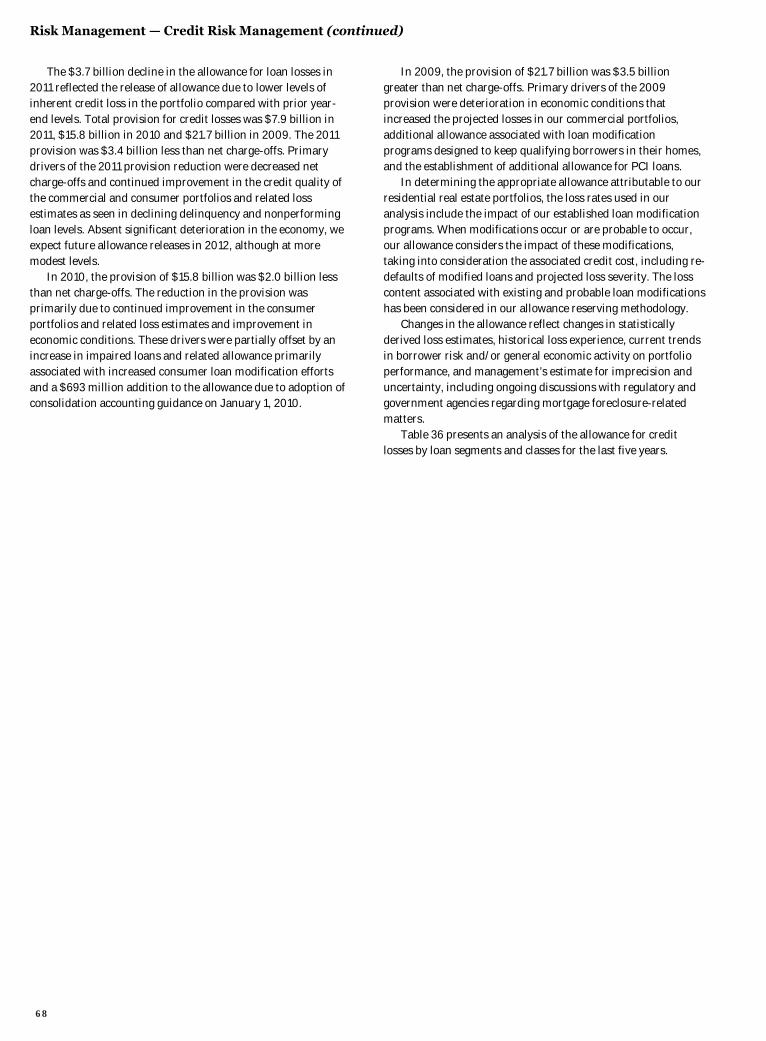
Risk Management — Credit Risk Management (continued)
The $3.7 billion decline in the allowance for loan losses in 2011 reflected the release of allowance due to lower levels of inherent credit loss in the portfolio compared with prior year-end levels. Total provision for credit losses was $7.9 billion in 2011, $15.8 billion in 2010 and $21.7 billion in 2009. The 2011 provision was $3.4 billion less than net charge-offs. Primary drivers of the 2011 provision reduction were decreased net charge-offs and continued improvement in the credit quality of the commercial and consumer portfolios and related loss estimates as seen in declining delinquency and nonperforming loan levels. Absent significant deterioration in the economy, we expect future allowance releases in 2012, although at more modest levels. In 2010, the provision of $15.8 billion was $2.0 billion less than net charge-offs. The reduction in the provision was primarily due to continued improvement in the consumer portfolios and related loss estimates and improvement in economic conditions. These drivers were partially offset by an increase in impaired loans and related allowance primarily associated with increased consumer loan modification efforts and a $693 million addition to the allowance due to adoption of consolidation accounting guidance on January 1, 2010.
In 2009, the provision of $21.7 billion was $3.5 billion greater than net charge-offs. Primary drivers of the 2009 provision were deterioration in economic conditions that increased the projected losses in our commercial portfolios, additional allowance associated with loan modification programs designed to keep qualifying borrowers in their homes, and the establishment of additional allowance for PCI loans. In determining the appropriate allowance attributable to our residential real estate portfolios, the loss rates used in our analysis include the impact of our established loan modification programs. When modifications occur or are probable to occur, our allowance considers the impact of these modifications, taking into consideration the associated credit cost, including re-defaults of modified loans and projected loss severity. The loss content associated with existing and probable loan modifications has been considered in our allowance reserving methodology. Changes in the allowance reflect changes in statistically derived loss estimates, historical loss experience, current trends in borrower risk and/or general economic activity on portfolio performance, and management’s estimate for imprecision and uncertainty, including ongoing discussions with regulatory and government agencies regarding mortgage foreclosure-related matters. Table 36 presents an analysis of the allowance for credit losses by loan segments and classes for the last five years.
68
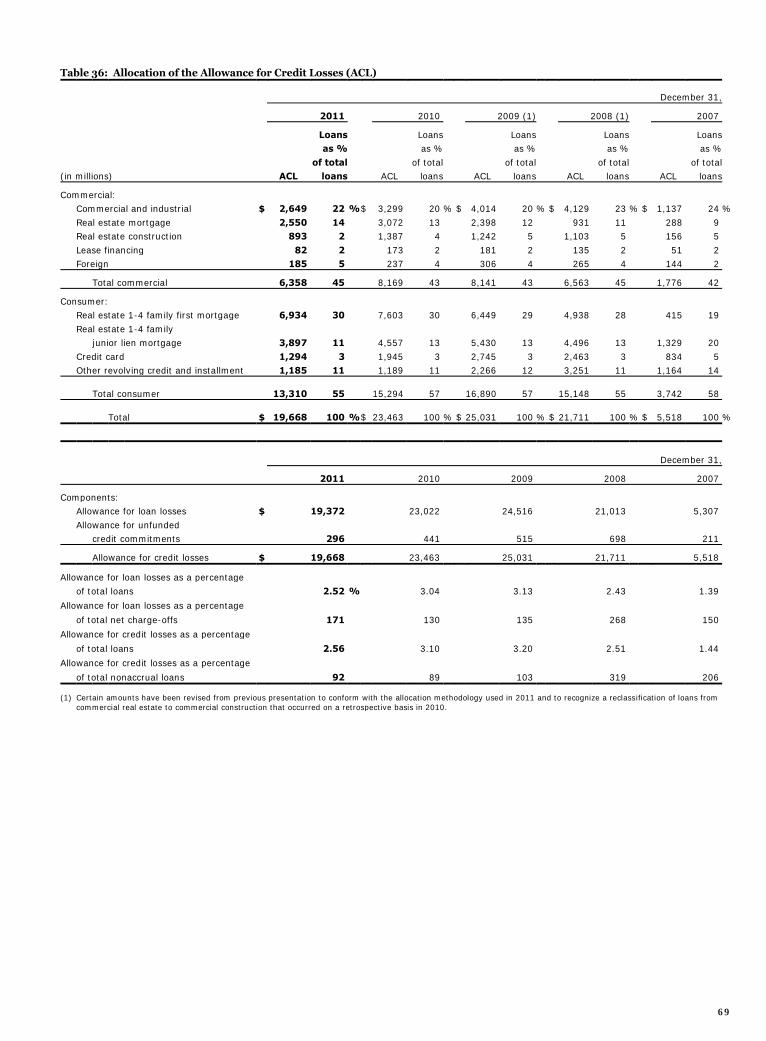
Table 36: Allocation of the Allowance for Credit Losses (ACL)
December 31,
2011 2010 2009 (1) 2008 (1) 2007
Loans Loans Loans Loans Loans as % as % as % as % as %
of total of total of total of total of total (in millions) ACL loans ACL loans ACL loans ACL loans ACL loans
Commercial: Commercial and industrial $ 2,649 22 % $ 3,299 20 % $ 4,014 20 % $ 4,129 23 % $ 1,137 24 %
Real estate mortgage 2,550 14 3,072 13 2,398 12 931 11 288 9 Real estate construction 893 2 1,387 4 1,242 5 1,103 5 156 5
Lease financing 82 2 173 2 181 2 135 2 51 2 Foreign 185 5 237 4 306 4 265 4 144 2
Total commercial 6,358 45 8,169 43 8,141 43 6,563 45 1,776 42
Consumer: Real estate 1-4 family first mortgage 6,934 30 7,603 30 6,449 29 4,938 28 415 19
Real estate 1-4 family junior lien mortgage 3,897 11 4,557 13 5,430 13 4,496 13 1,329 20
Credit card 1,294 3 1,945 3 2,745 3 2,463 3 834 5 Other revolving credit and installment 1,185 11 1,189 11 2,266 12 3,251 11 1,164 14
Total consumer 13,310 55
15,294 57
16,890 57
15,148 55 3,742 58
Total $ 19,668 100 % $
23,463 100 % $
25,031 100 % $
21,711 100 % $ 5,518 100 %
December 31,
2011 2010 2009 2008 2007
Components: Allowance for loan losses $ 19,372 23,022 24,516 21,013 5,307
Allowance for unfunded credit commitments 296 441 515 698 211
Allowance for credit losses $ 19,668 23,463 25,031 21,711 5,518
Allowance for loan losses as a percentage
of total loans 2.52 % 3.04 3.13 2.43 1.39
Allowance for loan losses as a percentage of total net charge-offs 171 130 135 268 150 Allowance for credit losses as a percentage of total loans 2.56 3.10 3.20 2.51 1.44 Allowance for credit losses as a percentage of total nonaccrual loans 92 89 103 319 206
(1) Certain amounts have been revised from previous presentation to conform with the allocation methodology used in 2011 and to recognize a reclassification of loans from commercial real estate to commercial construction that occurred on a retrospective basis in 2010.
69
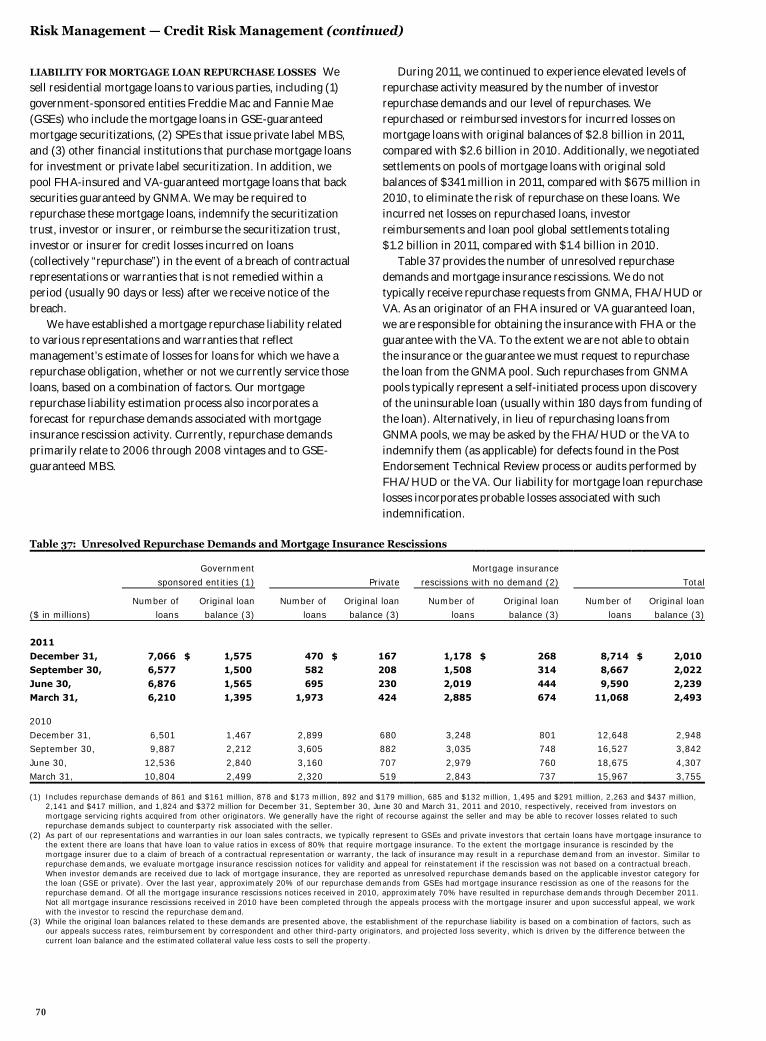
Risk Management — Credit Risk Management (continued)
LIABILITY FOR MORTGAGE LOAN REPURCHASE LOSSES We sell residential mortgage loans to various parties, including (1) government-sponsored entities Freddie Mac and Fannie Mae (GSEs) who include the mortgage loans in GSE-guaranteed mortgage securitizations, (2) SPEs that issue private label MBS, and (3) other financial institutions that purchase mortgage loans for investment or private label securitization. In addition, we pool FHA-insured and VA-guaranteed mortgage loans that back securities guaranteed by GNMA. We may be required to repurchase these mortgage loans, indemnify the securitization trust, investor or insurer, or reimburse the securitization trust, investor or insurer for credit losses incurred on loans (collectively “repurchase”) in the event of a breach of contractual representations or warranties that is not remedied within a period (usually 90 days or less) after we receive notice of the breach. We have established a mortgage repurchase liability related to various representations and warranties that reflect management’s estimate of losses for loans for which we have a repurchase obligation, whether or not we currently service those loans, based on a combination of factors. Our mortgage repurchase liability estimation process also incorporates a forecast for repurchase demands associated with mortgage insurance rescission activity. Currently, repurchase demands primarily relate to 2006 through 2008 vintages and to GSE-guaranteed MBS.
During 2011, we continued to experience elevated levels of repurchase activity measured by the number of investor repurchase demands and our level of repurchases. We repurchased or reimbursed investors for incurred losses on mortgage loans with original balances of $2.8 billion in 2011, compared with $2.6 billion in 2010. Additionally, we negotiated settlements on pools of mortgage loans with original sold balances of $341 million in 2011, compared with $675 million in 2010, to eliminate the risk of repurchase on these loans. We incurred net losses on repurchased loans, investor reimbursements and loan pool global settlements totaling $1.2 billion in 2011, compared with $1.4 billion in 2010.
Table 37 provides the number of unresolved repurchase demands and mortgage insurance rescissions. We do not typically receive repurchase requests from GNMA, FHA/HUD or VA. As an originator of an FHA insured or VA guaranteed loan, we are responsible for obtaining the insurance with FHA or the guarantee with the VA. To the extent we are not able to obtain the insurance or the guarantee we must request to repurchase the loan from the GNMA pool. Such repurchases from GNMA pools typically represent a self-initiated process upon discovery of the uninsurable loan (usually within 180 days from funding of the loan). Alternatively, in lieu of repurchasing loans from GNMA pools, we may be asked by the FHA/HUD or the VA to indemnify them (as applicable) for defects found in the Post Endorsement Technical Review process or audits performed by FHA/HUD or the VA. Our liability for mortgage loan repurchase losses incorporates probable losses associated with such indemnification.
Table 37: Unresolved Repurchase Demands and Mortgage Insurance Rescissions
Government Mortgage insurance
sponsored entities (1) Private rescissions with no demand (2) Total
Number of Original loan Number of Original loan Number of Original loan Number of Original loan ($ in millions) loans balance (3) loans balance (3) loans balance (3) loans balance (3)
2011
December 31, 7,066 $ 1,575 470 $ 167 1,178 $ 268 8,714 $ 2,010 September 30, 6,577 1,500 582 208 1,508 314 8,667 2,022
June 30, 6,876 1,565 695 230 2,019 444 9,590 2,239 March 31, 6,210 1,395 1,973 424 2,885 674 11,068 2,493 2010
December 31, 6,501 1,467 2,899 680 3,248 801 12,648 2,948 September 30, 9,887 2,212 3,605 882 3,035 748 16,527 3,842
June 30, 12,536 2,840 3,160 707 2,979 760 18,675 4,307 March 31, 10,804 2,499 2,320 519 2,843 737 15,967 3,755
(1) Includes repurchase demands of 861 and $161 million, 878 and $173 million, 892 and $179 million, 685 and $132 million, 1,495 and $291 million, 2,263 and $437 million, 2,141 and $417 million, and 1,824 and $372 million for December 31, September 30, June 30 and March 31, 2011 and 2010, respectively, received from investors on mortgage servicing rights acquired from other originators. We generally have the right of recourse against the seller and may be able to recover losses related to such repurchase demands subject to counterparty risk associated with the seller.
(2) As part of our representations and warranties in our loan sales contracts, we typically represent to GSEs and private investors that certain loans have mortgage insurance to the extent there are loans that have loan to value ratios in excess of 80% that require mortgage insurance. To the extent the mortgage insurance is rescinded by the mortgage insurer due to a claim of breach of a contractual representation or warranty, the lack of insurance may result in a repurchase demand from an investor. Similar to repurchase demands, we evaluate mortgage insurance rescission notices for validity and appeal for reinstatement if the rescission was not based on a contractual breach. When investor demands are received due to lack of mortgage insurance, they are reported as unresolved repurchase demands based on the applicable investor category for the loan (GSE or private). Over the last year, approximately 20% of our repurchase demands from GSEs had mortgage insurance rescission as one of the reasons for the repurchase demand. Of all the mortgage insurance rescissions notices received in 2010, approximately 70% have resulted in repurchase demands through December 2011. Not all mortgage insurance rescissions received in 2010 have been completed through the appeals process with the mortgage insurer and upon successful appeal, we work with the investor to rescind the repurchase demand.
(3) While the original loan balances related to these demands are presented above, the establishment of the repurchase liability is based on a combination of factors, such as our appeals success rates, reimbursement by correspondent and other third-party originators, and projected loss severity, which is driven by the difference between the current loan balance and the estimated collateral value less costs to sell the property.
70
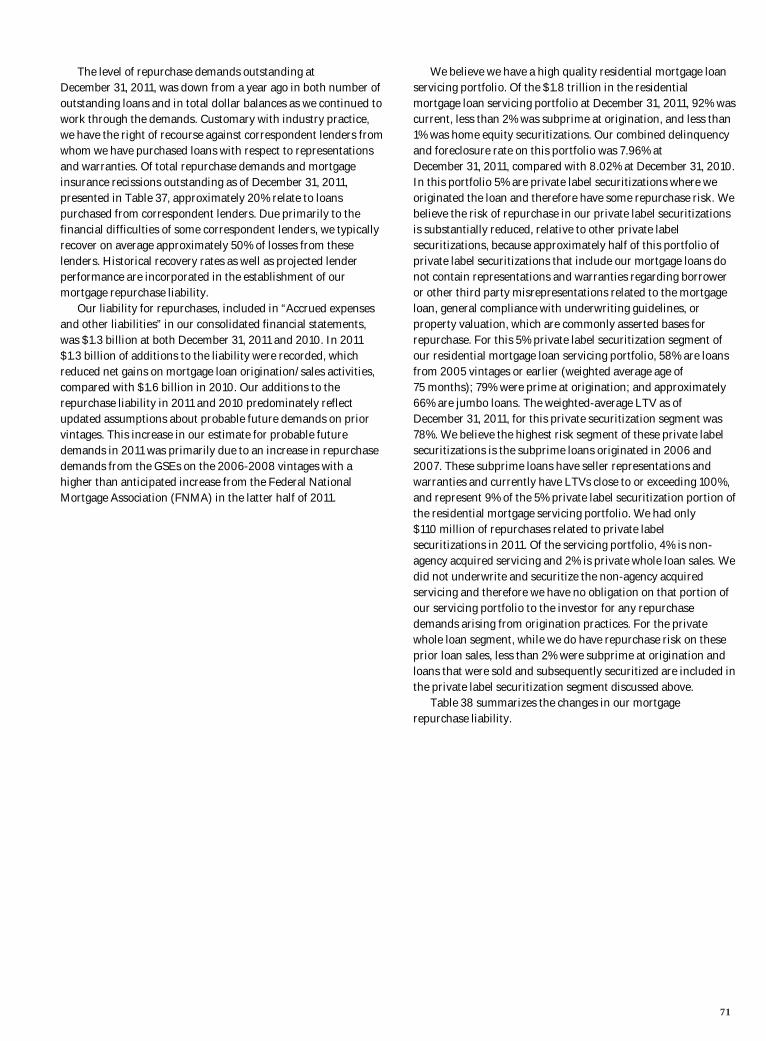
The level of repurchase demands outstanding at December 31, 2011, was down from a year ago in both number of outstanding loans and in total dollar balances as we continued to work through the demands. Customary with industry practice, we have the right of recourse against correspondent lenders from whom we have purchased loans with respect to representations and warranties. Of total repurchase demands and mortgage insurance recissions outstanding as of December 31, 2011, presented in Table 37, approximately 20% relate to loans purchased from correspondent lenders. Due primarily to the financial difficulties of some correspondent lenders, we typically recover on average approximately 50% of losses from these lenders. Historical recovery rates as well as projected lender performance are incorporated in the establishment of our mortgage repurchase liability. Our liability for repurchases, included in “Accrued expenses and other liabilities” in our consolidated financial statements, was $1.3 billion at both December 31, 2011 and 2010. In 2011 $1.3 billion of additions to the liability were recorded, which reduced net gains on mortgage loan origination/sales activities, compared with $1.6 billion in 2010. Our additions to the repurchase liability in 2011 and 2010 predominately reflect updated assumptions about probable future demands on prior vintages. This increase in our estimate for probable future demands in 2011 was primarily due to an increase in repurchase demands from the GSEs on the 2006-2008 vintages with a higher than anticipated increase from the Federal National Mortgage Association (FNMA) in the latter half of 2011.
We believe we have a high quality residential mortgage loan servicing portfolio. Of the $1.8 trillion in the residential mortgage loan servicing portfolio at December 31, 2011, 92% was current, less than 2% was subprime at origination, and less than 1% was home equity securitizations. Our combined delinquency and foreclosure rate on this portfolio was 7.96% at December 31, 2011, compared with 8.02% at December 31, 2010. In this portfolio 5% are private label securitizations where we originated the loan and therefore have some repurchase risk. We believe the risk of repurchase in our private label securitizations is substantially reduced, relative to other private label securitizations, because approximately half of this portfolio of private label securitizations that include our mortgage loans do not contain representations and warranties regarding borrower or other third party misrepresentations related to the mortgage loan, general compliance with underwriting guidelines, or property valuation, which are commonly asserted bases for repurchase. For this 5% private label securitization segment of our residential mortgage loan servicing portfolio, 58% are loans from 2005 vintages or earlier (weighted average age of 75 months); 79% were prime at origination; and approximately 66% are jumbo loans. The weighted-average LTV as of December 31, 2011, for this private securitization segment was 78%. We believe the highest risk segment of these private label securitizations is the subprime loans originated in 2006 and 2007. These subprime loans have seller representations and warranties and currently have LTVs close to or exceeding 100%, and represent 9% of the 5% private label securitization portion of the residential mortgage servicing portfolio. We had only $110 million of repurchases related to private label securitizations in 2011. Of the servicing portfolio, 4% is non-agency acquired servicing and 2% is private whole loan sales. We did not underwrite and securitize the non-agency acquired servicing and therefore we have no obligation on that portion of our servicing portfolio to the investor for any repurchase demands arising from origination practices. For the private whole loan segment, while we do have repurchase risk on these prior loan sales, less than 2% were subprime at origination and loans that were sold and subsequently securitized are included in the private label securitization segment discussed above.
Table 38 summarizes the changes in our mortgage repurchase liability.
71

Risk Management — Credit Risk Management (continued)
Table 38: Changes in Mortgage Repurchase Liability
Quarter ended Dec. 31, Sept. 30, June 30, Mar. 31, Year ended Dec. 31,
(in millions) 2011 2011 2011 2011 2011 2010
Balance, beginning of period $ 1,194 1,188 1,207 1,289 1,289 1,033
Provision for repurchase losses: Loan sales 27 19 20 35 101 144
Change in estimate (1) 377 371 222 214 1,184 1,474
Total additions 404 390 242 249 1,285 1,618
Losses (272) (384) (261) (331) (1,248) (1,362)
Balance, end of period $ 1,326 1,194 1,188 1,207 1,326 1,289
(1) Results from such factors as credit deterioration, changes in investor demand and mortgage insurer practices, and changes in the financial stability of correspondent lenders.
The mortgage repurchase liability of $1.3 billion at December 31, 2011, represents our best estimate of the probable loss that we may incur for various representations and warranties in the contractual provisions of our sales of mortgage loans. Because the level of mortgage loan repurchase losses depends upon economic factors, investor demand strategies and other external conditions that may change over the life of the underlying loans, the level of the liability for mortgage loan repurchase losses is difficult to estimate and requires considerable management judgment. We maintain regular contact with the GSEs and other significant investors to monitor and address their repurchase demand practices and concerns. Because of the uncertainty in the various estimates underlying the mortgage repurchase liability, there is a range of losses in excess of the recorded mortgage repurchase liability that are reasonably possible. The estimate of the range of possible loss for representations and warranties does not represent a probable loss, and is based on currently available information, significant judgment, and a number of assumptions that are subject to change. The high end of this range of reasonably possible losses in excess of our recorded liability was $2.1 billion at December 31, 2011, and was determined based upon modifying the assumptions utilized in our best estimate of probable loss to reflect what we believe to be the high end of reasonably possible adverse assumptions. For additional information on our repurchase liability, see the “Critical Accounting Policies – Liability for Mortgage Loan Repurchase Losses” section and Note 9 (Mortgage Banking Activities) to Financial Statements in this Report. The repurchase liability is predominantly applicable to loans we originated and sold with representations and warranties. Most of these loans are included in our servicing portfolio. Our repurchase liability estimate involves consideration of many factors that influence the key assumptions of what our repurchase volume may be and what loss on average we may incur. Those key assumptions and the sensitivity of the liability to immediate adverse changes in them at December 31, 2011, are presented in Table 39. For additional information about the range of loss that is reasonably possible in excess of the recorded mortgage repurchase liability, see Note 9 (Mortgage Banking Activities) to Financial Statements in this Report.
Table 39: Mortgage Repurchase Liability – Sensitivity/Assumptions
Mortgage repurchase
(in millions) liability
Balance at December 31, 2011 $ 1,326 Loss on repurchases (1) 40.0 %
Increase in liability from: 10% higher losses $ 133
25% higher losses 333 Repurchase rate assumption 0.3 % Increase in liability from:
10% higher repurchase rates $ 122 25% higher repurchase rates 304
(1) Represents total estimated average loss rate on repurchased loans, net of recovery from third party originators, based on historical experience and current economic conditions. The average loss rate includes the impact of repurchased loans for which no loss is expected to be realized.
To the extent that economic conditions and the housing market do not improve or future investor repurchase demands and appeals success rates differ from past experience, we could continue to have increased demands and increased loss severity on repurchases, causing future additions to the repurchase liability. However, some of the underwriting standards that were permitted by the GSEs for conforming loans in the 2006 through 2008 vintages, which significantly contributed to recent levels of repurchase demands, were tightened starting in mid to late 2008. Accordingly, we do not expect a similar rate of repurchase requests from the 2009 and prospective vintages, absent deterioration in economic conditions or changes in investor behavior. In October 2011, the Arizona Department of Insurance assumed full and exclusive power of management and control of PMI Mortgage Insurance Co. (PMI) and announced that PMI will pay 50% of claim amounts in cash, with the rest deferred. In November 2011, PMI’s parent company, PMI Group Inc., filed for Chapter 11 bankruptcy. Wells Fargo has previously utilized PMI to provide mortgage insurance on certain loans originated and held in our portfolio. Additionally, PMI has provided mortgage insurance on loans originated and sold to third-party investors. For loans sold to third-party investors, there is no additional risk of repurchase loss to Wells Fargo associated with the deferred insurance claim amounts from PMI since this credit
72
risk is owned by the investor in the loan. We also hold a small amount of residential mortgage-backed securities, which are backed by mortgages with a limited amount of insurance provided by PMI. Because the loans and securities held in our portfolios with PMI insurance support are limited in amount, we do not anticipate the deferred claim payments will result in a material adverse effect on our consolidated financial statements.
RISKS RELATING TO SERVICING ACTIVITIES In addition to servicing loans in our portfolio, we act as servicer and/or master servicer of residential mortgage loans included in GSE-guaranteed mortgage securitizations, FHA/VA/GNMA-guaranteed mortgage securitizations and private label mortgage securitizations, as well as for unsecuritized loans owned by institutional investors. The following discussion summarizes the primary duties and requirements of servicing and related recent industry developments. General Servicing Duties and Requirements
The loans we service were originated by us or by other mortgage loan originators. As servicer, our primary duties are typically to (1) collect payments due from borrowers, (2) advance certain delinquent payments of principal and interest, (3) maintain and administer any hazard, title or primary mortgage insurance policies relating to the mortgage loans, (4) maintain any required escrow accounts for payment of taxes and insurance and administer escrow payments, (5) foreclose on defaulted mortgage loans or, to the extent consistent with the documents governing a securitization, consider alternatives to foreclosure, such as loan modifications or short sales, and (6) for loans sold into private label securitizations, manage the foreclosed property through liquidation. As master servicer, our primary duties are typically to (1) supervise, monitor and oversee the servicing of the mortgage loans by the servicer, (2) consult with each servicer and use reasonable efforts to cause the servicer to observe its servicing obligations, (3) prepare monthly distribution statements to security holders and, if required by the securitization documents, certain periodic reports required to be filed with the SEC, (4) if required by the securitization documents, calculate distributions and loss allocations on the mortgage-backed securities, (5) prepare tax and information returns of the securitization trust, and (6) advance amounts required by non-affiliated servicers who fail to perform their advancing obligations. Each agreement under which we act as servicer or master servicer generally specifies a standard of responsibility for actions we take in such capacity and provides protection against expenses and liabilities we incur when acting in compliance with the specified standard. For example, most private label securitization agreements under which we act as servicer or master servicer typically provide that the servicer and the master servicer are entitled to indemnification by the securitization trust for taking action or refraining from taking action in good faith or for errors in judgment. However, we are not indemnified, but rather are required to indemnify the securitization trustee, against any failure by us, as servicer or master servicer, to perform our servicing obligations or against any of our acts or omissions that involve wilful misfeasance, bad
faith or gross negligence in the performance of, or reckless disregard of, our duties. In addition, if we commit a material breach of our obligations as servicer or master servicer, we may be subject to termination if the breach is not cured within a specified period following notice, which can generally be given by the securitization trustee or a specified percentage of security holders. Whole loan sale contracts under which we act as servicer generally include similar provisions with respect to our actions as servicer. The standards governing servicing in GSE-guaranteed securitizations, and the possible remedies for violations of such standards, vary, and those standards and remedies are determined by servicing guides maintained by the GSEs, contracts between the GSEs and individual servicers and topical guides published by the GSEs from time to time. Such remedies could include indemnification or repurchase of an affected mortgage loan. Foreclosure and Securitization Matters
During fourth quarter 2010, we identified practices where the final steps relating to the execution of foreclosure affidavits, as well as some aspects of the notarization process were not adhered to. Any re-execution or redelivery of any documents in connection with foreclosures will involve costs that may not be legally or otherwise reimbursable to us to the extent they relate to securitized mortgage loans. Further, if the validity of any foreclosure action is challenged by a borrower, whether successfully or not, we may incur significant litigation costs, which may not be reimbursable to us to the extent they relate to securitized mortgage loans. In addition, if a court were to overturn a foreclosure due to errors or deficiencies in the foreclosure process, we may have liability to the borrower if the required process was not followed and such failure resulted in damages to the borrower. We could also have liability to a title insurer that insured the title to the property sold in foreclosure. Any such liabilities may not be reimbursable to us to the extent they relate to a securitized mortgage loan. When we securitize mortgage loans we have an obligation to deliver mortgage notes, assignments and other critical documents. Although we continue to believe that we delivered all documents in accordance with the requirements of each securitization involving our mortgage loans, if any required document with respect to a securitized mortgage loan sold by us is missing or materially defective, we would be obligated to cure the defect or to repurchase the loan. To facilitate securitizations it is a common industry practice to record mortgages in the name of Mortgage Electronic Registration Systems, Inc. (MERS). Attorneys general of most states have alleged that this common industry practice creates issues regarding whether a securitization trust has good title to the mortgage loan. MERS is a company that acts as mortgagee of record and as nominee for the owner of the related mortgage note. When mortgages are assigned, such as between an originator and a securitization trust, the change is recorded electronically on a register maintained by MERS. The purpose of MERS is to save borrowers and lenders from having to record assignments of mortgages in county land offices each time ownership of the mortgage note is assigned. Although MERS has been in existence and used for many years, it has recently been
73
Risk Management — Credit Risk Management (continued)
alleged by attorneys general that having a mortgagee of record that is different from the owner of the mortgage note “breaks the chain of title” and clouds the ownership of the loan. We do not believe that to be the case, and believe that the operative legal principle is that the ownership of a mortgage follows the ownership of the mortgage note, and that a securitization trust should have good title to a mortgage loan if the note is endorsed and delivered to it, regardless of whether MERS is the mortgagee of record or whether an assignment of mortgage is recorded to the trust. However, in order to foreclose on the mortgage loan, it may be necessary for an assignment of the mortgage to be completed by MERS to the trust, in order to comply with state law requirements governing foreclosure. Our practice is to obtain assignments of mortgages from MERS prior to commencing the foreclosure process. Consent Orders and Settlement in Principle
In April 2011, the Board of Governors of the Federal Reserve System (FRB) and the Office of the Comptroller of the Currency (OCC) issued Consent Orders that require us to correct deficiencies in our residential mortgage loan servicing and foreclosure practices that were identified by federal banking regulators in their fourth quarter 2010 review. The Consent Orders also require that we improve our servicing and foreclosure practices. We have already implemented many of the operational changes that will result from the expanded servicing responsibilities outlined in the Consent Orders. On February 9, 2012, the OCC and FRB announced the imposition of civil money penalties of $83 million and $85 million, respectively, pursuant to the Consent Orders. These penalties will be satisfied through payments made under a separate simultaneous federal/state settlement in principle, announced on the same day, among the Department of Justice, Department of Housing and Urban Development (HUD), the Department of the Treasury, the Department of Veterans Affairs, the Federal Trade Commission (FTC), the Executive Office of the U.S. Trustee, the Consumer Financial Protection Bureau, a task force of Attorneys General representing 49 states, Wells Fargo, and four other servicers related to investigations of mortgage industry servicing and foreclosure practices. While Oklahoma is not participating in the larger settlement, it is settling separately with the five servicers with a simplified agreement. Under the settlement in principle, the terms of which do not become final until approval of the settlement agreement by the U.S. District Court and execution of a consent order, which will be in effect for three and one-half years (subject to a trailing review period), we have agreed to the following programmatic commitments, consisting of three components totalling $5.3 billion: Consumer Relief Program For qualified borrowers with
financial hardship and a loan owned and serviced by Wells Fargo, a commitment to provide $3.4 billion in aggregate consumer relief and assistance programs, including expanded first and second mortgage modifications that broaden the use of principal reduction to help customers achieve affordability, an expanded short sale program that includes waivers of deficiency balances, forgiveness of arrearages for unemployed borrowers, cash-for-keys
payments to borrowers who voluntarily vacate properties, and “anti-blight” provisions designed to reduce the impact on communities of vacant properties. As of December 31, 2011, the expected impact of the Consumer Relief Program was covered in our allowance for credit losses and in the nonaccretable difference relating to our purchased credit-impaired residential mortgage portfolio.
Refinance Program For qualified borrowers with little or negative equity in their home and a loan owned and serviced by Wells Fargo, an expanded first-lien refinance program commitment estimated to provide $900 million of aggregate payment relief over the life of the refinanced loans. The Refinance Program will not result in any current-period charge as its impact will be recognized over a period of years in the form of lower interest income as qualified borrowers benefit from reduced interest rates on loans refinanced under the program.
Foreclosure Assistance Payment $1 billion paid directly to the federal government and the participating states for their use to address the impact of foreclosure challenges as they see fit and which may include direct payments to consumers. As of December 31, 2011, we had fully accrued for the Foreclosure Assistance Payment.
California (under a separate California Agreement) and Florida (under a separate Florida Agreement) will receive state-specific sub-commitments totaling $1.95 billion and $1.0 billion, respectively, regarding the amount of Consumer Relief and Refinance Program benefits for these two states as a part of, and not in addition to, the overall commitment to all states for these two programs. The amount of credit we will receive toward fulfilling our commitments under the Consumer Relief and Refinance Programs will be determined based upon the nature of the modification or other relief to the borrower, the characteristics of the loan and the timing of the modification or relief. The terms of the Consumer Relief and Refinance Programs as well as other servicing matters are discussed in more detail below. Consumer Relief Program The Consumer Relief Program allows for selection from a menu of various alternatives to meet the $3.4 billion overall commitment, subject to servicer agreements, agreements with the U.S. Treasury, investor guidelines, mortgage or bond insurer requirements, or other applicable requirements, and is intended to provide assistance to eligible borrowers who are experiencing financial difficulty. Eligible borrowers include borrowers who have a pre-modification LTV in excess of 100%. The settlement provides for various modification and assistance programs with varying levels of credits, minimums, and maximums that can be used to satisfy the overall commitment amount for different activities, primarily including: first lien principal forgiveness for LTV less than or equal to
175%: 100% credit (must constitute at least 30% of the Consumer Relief Program credits);
first lien principal forgiveness for LTV greater than 175%: 50% credit for portion forgiven over 175% LTV;
74

forgiveness of forbearance amounts on existing loan modifications – 40% credit;
earned forgiveness over no more than a 3 year period: 85% credit for LTV less than or equal to 175%; 45% credit for forgiveness over 175% LTV;
second lien principal forgiveness: 90% credit for loans 90 days or less delinquent; 50% credit for loans greater than 90 but less than 180 days delinquent; 10% credit for loans 180 days more delinquent. Subject to a number of requirements, servicers participating in the settlement will be obligated to implement second lien principal forgiveness on second mortgages it owns when another participating servicer reduces principal on a first mortgage via its proprietary non-HAMP modification programs (must constitute at least 60% of the Consumer Relief Program credits when combined with the first lien principal forgiveness credits);
deficiency balance waivers on first and second lien loans: 10% credit;
short sale deficiency balance waivers on first and second lien loans: 20% to 100% credit depending on whether the servicer, servicer/lien holder or investor incurs the loss;
payment arrearages forgiveness for unemployed borrowers: 100% credit;
transitional funds paid to homeowners in connection with a short sale or deed-in-lieu of foreclosure for payments in excess of $1,500: 45% credit if a non-GSE investor bears the cost or 100% if the servicer bears the cost;
anti-blight – forgiveness of principal associated with properties where foreclosure is not pursued: 50% credit;
anti-blight – cash costs paid by servicer for property demolition – 100% credit; and
anti-blight – donation of real estate owned properties to qualifying recipients such as non-profit organizations: 100% credit.
Additionally, the Consumer Relief Program limits the total amount of credits that may be applied toward the $3.4 billion commitment from certain activities such as: credits from deficiency balance waivers are limited to 10% of
credits under the Consumer Relief Program; credits for forgiveness of forbearance are limited to 12.5% of
credits under the Consumer Relief Program; and anti-blight provisions are limited to 12% of credits under the
Consumer Relief Program. We will begin to receive credit towards satisfaction of the requirements of the Consumer Relief Program for any activities taken on or after March 1, 2012. We can also receive an additional 25% credit for any first or second lien principal reduction taken within one year from March 1, 2012. Because we will not receive dollar-for-dollar credit for the relief provided in some circumstances, the actual relief we provide to borrowers will likely exceed our commitment. The terms also require that we satisfy 75% of the commitments under the Consumer Relief Program within two years from March 1, 2012. If we do not meet this two-year requirement and also do not meet the entire commitment within three years, we are required to pay an
amount equal to 140% of the unmet commitment amount. If we meet the two-year commitment target, but do not meet the entire commitment amount within the three years, we are required to pay an amount equal to 125% of the unmet commitment amount. We expect that we will be able to meet our commitment (and state-level sub-commitments) on the Consumer Relief Program within the required timeframes. We expect to be able to meet our Consumer Relief Program commitment primarily through our first and second lien modification and short sale and other deficiency balance waiver programs. We have evaluated our commitment along with the menu of credits and believe that fulfilling our commitment under the Consumer Relief Program has been appropriately considered in our estimation for the allowance for loan losses as well as our cash flow projections to evaluate the nonaccretable difference for our PCI portfolios at December 31, 2011. Refinance Program The Refinance Program is intended for borrowers in good standing who are not experiencing financial difficulty, but are not able to take advantage of refinancing at lower rates to lower their payments because they have little or negative equity in their home. The terms of the pending settlement for the Refinance Program require that we provide notification to eligible borrowers indicating that they may refinance under the program. The minimum eligibility criteria for the program are as follows: must be Wells Fargo owned first lien mortgage loan on
property that is occupied; loan must be current with no delinquencies in the last
12 months; must be fixed rate, adjustable rate, or interest-only
mortgages with an initial period of five years or more; current LTV is greater than 100%; loans originated prior to January 1, 2009; loans must have a current interest rate of at least 5.25% or
100 basis points above the Freddie Mac current primary mortgage market survey rate, whichever is greater;
the minimum difference between the current interest rate and the offered interest rate under the Refinance Program must be at least 25 basis points or there must be at least a $100 reduction in monthly payment; and
the maximum unpaid principal balance must be below the GSE lending limit applicable to the respective state where the property is located.
Additionally, there are defined exclusions from the eligibility criteria such as FHA/VA loans, properties outside the 50 states, the District of Columbia and Puerto Rico, and loans for borrowers who have been in bankruptcy or foreclosure anytime in the prior 24 months. We are also permitted to extend the Refinance Program to borrowers beyond the minimum eligible population detailed above provided they have an LTV over 80% and would not have qualified for a refinance under our other offered refinance programs in existence as of September 30, 2011. The structure of the refinanced loans can vary to include interest rate reductions for the entire life of the loan or, depending on current interest rates, a minimum of
75

Risk Management — Credit Risk Management (continued)
5 years. Additionally, the original term of the loan can be changed and the rate reduction can be executed via a modification of the existing loan terms or a refinance into a new loan. The new loan or modified loan must be a fully amortizing product and the new interest rate will be capped at 100 basis points over the Freddie Mac current primary mortgage market survey rate or 5.25%, whichever is greater, during the initial rate reduction period. The credit we receive for each refinanced loan towards satisfying the $900 million financial commitment for the Refinance Program is calculated as the difference between the pre-existing interest rate and the new interest rate multiplied by the unpaid principal balance multiplied by a defined multiplier. The defined multiplier is 5 if the rate reduction only applies for 5 years or if the remaining term is less than 10 years, 6 if the remaining term is between 10 and 15 years, and 8 if the remaining term is greater than 15 years. In addition, the terms of the settlement allow for additional dollars spent on the Refinance Program to be credited towards satisfying the requirements of the Consumer Relief Program (25% for the first lien principal reduction obligations and 75% for the second lien principal reduction obligations) subject to certain caps. We will receive credit under the Refinance Program for activities taken on or after March 1, 2012. The Refinance Program allows for an additional 25% credit (additional credit) for all refinance credits earned in the first 12 months of the program. We expect that we will be able to complete the number of refinances necessary to satisfy the entire credit in the first 12 months of offering the Refinance Program. If successful in this regard, the estimated lifetime amount of interest income reduction to the portfolio will be approximately $720 million and the additional credit earned will be $180 million. We expect that we will refinance approximately 20,000 borrowers with an unpaid principal balance of approximately $4.0 billion in order to meet the commitment amount under the Refinance Program. Based on the mix of loans we anticipate will be refinanced, we estimate their weighted average note rate will be reduced by approximately 260 annual basis points and that their weighted average estimated remaining life will be approximately 7 years. These estimates will be impacted by the actual number of eligible borrowers that accept a refinance offer, their existing and new note rates and the remaining term of the actual loans refinanced. The impact of fulfilling our commitment under the Refinance Program will be recognized over a period of years in the form of lower interest income as qualified borrowers benefit from reduced interest rates on loans refinanced under the Refinance Program. Based on our expectation that we will fulfill the credit needs for the Refinance Program within the first 12 months, we expect the future reduction in interest income to be approximately $100 million annually. As a result of refinancings under the Refinance Program we will be foregoing interest that we may not otherwise have agreed to forego. No loss was recognized in our financial statements for this estimated foregone interest income as the impact will be recognized over a period of years in the form of lower interest income as qualified borrowers benefit from reduced interest rates on loans refinanced under the Refinance Program. This impact to foregone interest income will be increased if we do not meet our
expectation for fulfilling the total commitment for the Refinance Program in the first twelve months. The impact of this foregone interest income on our future net interest margin is anticipated to be modestly adverse and will be influenced by the overall mortgage interest rate environment, which products are accepted by the eligible borrowers, and the pace of the execution of the program. The Refinance Program will also impact our fair value for these loans. The estimated reduction to the fair value of our loans for the Refinance Program is approximately $700 million and will be impacted by our actual execution of the program and borrower acceptance rates. Given that this component of the settlement relates to borrowers in good standing as to their payment history who are not experiencing financial difficulty, we will evaluate each borrower to confirm their ability to repay their mortgage obligation. This evaluation will include reviewing key credit and underwriting policy metrics to validate that these borrowers are not experiencing financial difficulty and therefore, actions taken under the Refinance Program would not be considered a troubled debt restructuring. To the extent we determine that an eligible borrower is experiencing financial difficulty, we will consider alternative modification programs which may result in loans being classified and accounted for as troubled debt restructurings. We expect that we will be able to meet the obligations of our commitment for the Refinance Program (and any state-level sub-commitments) and will not be required to pay for not meeting our commitment. Comprehensive National Servicing Standards The settlement also establishes comprehensive national servicing standards that will govern loan default and foreclosure activities. These standards reflect a new set of best practices for mortgage servicing and not the identification of existing flaws or errors in current servicing practices. The national servicing standards include: rules governing the preparation of documentation submitted
in connection with judicial foreclosures, including foreclosure affidavits, declarations, and sworn statements;
rules governing the preparation of evidence submitted to support non-judicial and quasi-judicial foreclosures;
requirements for ensuring the accuracy of borrower’s account information;
documentation of the foreclosing entity’s enforceable interest in the note, holder status, and chain of assignment;
rules governing bankruptcy documentation and process including proofs of claim and motions for relief from stay;
rules governing the oversight of third-party providers including foreclosure law firms, foreclosure trustees, subservicers, and other third parties retained to provide foreclosure, bankruptcy, or mortgage servicing activities;
requirements for loss mitigation programs, including: o notification to borrowers of loss mitigation options and
enhanced communication of status of loss mitigation review;
o restriction of “dual track” progression of foreclosure during consideration for loan modification;
o establishment of a borrower “single point of contact”;
76

o development of electronic loan portals for status of first lien loan modifications; and
o establishment of loan modification decision review process
enhanced protections for service members; restrictions on certain default, foreclosure, and bankruptcy-
related service fees; and restrictions on the imposition of force-placed insurance
Monitoring and Other Settlement Matters The settlement will be overseen by a third party monitor who will receive quarterly reports from servicers capturing progress towards implementing the servicing standards and satisfaction of the commitments of the Consumer Relief Program and the Refinance Program. These reports will be based on an agreed upon set of metrics and other information relevant to our compliance obligations. The enforcement provisions of the settlement include the parties’ right to seek penalties for non-compliance, the monitor’s right to seek additional measurement metrics, and the right to enforce the Consent Order in federal court. As part of the settlement, servicers will be released by the participating states and federal agencies from a number of servicing and origination claims. The releases given by the states and the federal agencies generally apply to “covered servicing conduct” and “covered origination conduct.” The state release and the federal release extend to “covered servicing conduct” prior to the effective date of the settlement. The federal release for “covered origination conduct” depends on which agency and which law is involved. The Department of Justice and the Treasury are releasing claims under federal consumer credit laws governing loan origination. The FTC is releasing claims relating to origination conduct. HUD’s release of claims relating to origination conduct is limited to claims based exclusively on false annual certifications of compliance that are submitted to HUD, and retains the right to pursue individual loan-level violations of the Federal Housing Administration origination rules and regulations. The Department of Justice’s release from claims under the Financial Institutions Reform, Recovery, and Enforcement Act (claims involving harm to financial institutions or federal agencies based on intentional fraud or misrepresentation by a bank or its affiliates) is also limited.
A number of subject areas are carved out from the releases: criminal law violations, claims by natural persons, unpaid taxes, fair lending claims (the state release applies this exception only to loan origination conduct, while the federal release extends the exception to origination and servicing conduct), securitization claims (includes claims that the government could bring as an investor in mortgage-related securities and for the benefit of investors or for conduct directed at investors), claims against MERS or MERSCORP, Inc., although we are released from claims relating to our use of MERS (but still retain an obligation as a MERS shareholder to indemnify MERS against third-party claims), claims of county recorders, and certain existing litigation and other obligations. Under the sub-commitment agreement with California, there is a limited expansion of its ability to pursue certain origination claims involving individual claims for actual fraud against consumers for origination conduct occurring on or after July 1, 2009. There are also side agreements with New York, Delaware and Massachusetts whereby these states retain the right to pursue their existing MERS litigation, subject to certain limitations. Other aspects of the federal release include a carve out under federal consumer credit laws for violations of RESPA related to private mortgage insurance and the retention of all rights by FHFA, Fannie Mae, Freddie Mac, Ginnie Mae, the Federal Home Loan Bank, the SEC, the CFPB (after July 21, 2011) and the federal banking agencies. Additional information on risks and litigation relating to servicing activities is included in Note 15 (Legal Actions) to Financial Statements in this Report.
77
Asset/Liability Management Asset/liability management involves the evaluation, monitoring and management of interest rate risk, market risk, liquidity and funding. The Corporate Asset/Liability Management Committee (Corporate ALCO), which oversees these risks and reports periodically to the Finance Committee of the Board, consists of senior financial and business executives. Each of our principal business groups has its own asset/liability management committee and process linked to the Corporate ALCO process. INTEREST RATE RISK Interest rate risk, which potentially can have a significant earnings impact, is an integral part of being a financial intermediary. We are subject to interest rate risk because: assets and liabilities may mature or reprice at different
times (for example, if assets reprice faster than liabilities and interest rates are generally falling, earnings will initially decline);
assets and liabilities may reprice at the same time but by different amounts (for example, when the general level of interest rates is falling, we may reduce rates paid on checking and savings deposit accounts by an amount that is less than the general decline in market interest rates);
short-term and long-term market interest rates may change by different amounts (for example, the shape of the yield curve may affect new loan yields and funding costs differently); or
the remaining maturity of various assets or liabilities may shorten or lengthen as interest rates change (for example, if long-term mortgage interest rates decline sharply, MBS held in the securities available-for-sale portfolio may prepay significantly earlier than anticipated, which could reduce portfolio income).
Interest rates may also have a direct or indirect effect on
loan demand, credit losses, mortgage origination volume, the fair value of MSRs and other financial instruments, the value of the pension liability and other items affecting earnings. We assess interest rate risk by comparing our most likely earnings plan with various earnings simulations using many interest rate scenarios that differ in the direction of interest rate changes, the degree of change over time, the speed of change and the projected shape of the yield curve. For example, as of December 31, 2011, our most recent simulation indicated estimated earnings at risk of less than 1% of our most likely earnings plan over the next 12 months under a range of both lower and higher interest rates, including a scenario in which the federal funds rate remains unchanged and the 10-year Constant Maturity Treasury bond yield averages below 2.00%, and a scenario in which the federal funds rate rises to 3.75% and the 10-year Constant Maturity Treasury bond yield increases to 5.10%. Simulation estimates depend on, and will change with, the size and mix of our actual and projected balance sheet at the time of each simulation. Due to timing differences between the quarterly valuation of MSRs and the eventual impact of interest rates on mortgage banking volumes, earnings at risk in any particular quarter could be
higher than the average earnings at risk over the 12-month simulation period, depending on the path of interest rates and on our hedging strategies for MSRs. See the “Risk Management – Mortgage Banking Interest Rate and Market Risk” section in this Report for more information. We use exchange-traded and over-the-counter (OTC) interest rate derivatives to hedge our interest rate exposures. The notional or contractual amount, credit risk amount and estimated net fair value of these derivatives as of December 31, 2011 and 2010, are presented in Note 16 (Derivatives) to Financial Statements in this Report. We use derivatives for asset/liability management in three main ways: to convert a major portion of our long-term fixed-rate
debt, which we issue to finance the Company, from fixed-rate payments to floating-rate payments by entering into receive-fixed swaps;
to convert the cash flows from selected asset and/or liability instruments/portfolios from fixed-rate payments to floating-rate payments or vice versa; and
to economically hedge our mortgage origination pipeline, funded mortgage loans and MSRs using interest rate swaps, swaptions, futures, forwards and options.
MORTGAGE BANKING INTEREST RATE AND MARKET RISK We originate, fund and service mortgage loans, which subjects us to various risks, including credit, liquidity and interest rate risks. Based on market conditions and other factors, we reduce credit and liquidity risks by selling or securitizing some or all of the long-term fixed-rate mortgage loans we originate and most of the ARMs we originate. On the other hand, we may hold originated ARMs and fixed-rate mortgage loans in our loan portfolio as an investment for our growing base of core deposits. We determine whether the loans will be held for investment or held for sale at the time of commitment. We may subsequently change our intent to hold loans for investment and sell some or all of our ARMs or fixed-rate mortgages as part of our corporate asset/liability management. We may also acquire and add to our securities available for sale a portion of the securities issued at the time we securitize MHFS. Notwithstanding the continued downturn in the housing sector, and the continued lack of liquidity in the nonconforming secondary markets, our mortgage banking revenue remained strong, reflecting the complementary origination and servicing strengths of the business. The secondary market for agency-conforming mortgages functioned well during 2011. Interest rate and market risk can be substantial in the mortgage business. Changes in interest rates may potentially reduce total origination and servicing fees, the value of our residential MSRs measured at fair value, the value of MHFS and the associated income and loss reflected in mortgage banking noninterest income, the income and expense associated with instruments (economic hedges) used to hedge changes in the fair value of MSRs and MHFS, and the value of derivative loan commitments (interest rate “locks”) extended to mortgage applicants. Interest rates affect the amount and timing of origination and servicing fees because consumer demand for new
78
mortgages and the level of refinancing activity are sensitive to changes in mortgage interest rates. Typically, a decline in mortgage interest rates will lead to an increase in mortgage originations and fees and may also lead to an increase in servicing fee income, depending on the level of new loans added to the servicing portfolio and prepayments. Given the time it takes for consumer behavior to fully react to interest rate changes, as well as the time required for processing a new application, providing the commitment, and securitizing and selling the loan, interest rate changes will affect origination and servicing fees with a lag. The amount and timing of the impact on origination and servicing fees will depend on the magnitude, speed and duration of the change in interest rates. We measure MHFS at fair value for prime MHFS originations for which an active secondary market and readily available market prices exist to reliably support fair value pricing models used for these loans. Loan origination fees on these loans are recorded when earned, and related direct loan origination costs are recognized when incurred. We also measure at fair value certain of our other interests held related to residential loan sales and securitizations. We believe fair value measurement for prime MHFS and other interests held, which we hedge with free-standing derivatives (economic hedges) along with our MSRs measured at fair value, reduces certain timing differences and better matches changes in the value of these assets with changes in the value of derivatives used as economic hedges for these assets. During 2011 and 2010, in response to continued secondary market illiquidity, we continued to originate certain prime non-agency loans to be held for investment for the foreseeable future rather than to be held for sale. In addition, in 2011 and 2010, we originated certain prime agency-eligible loans to be held for investment as part of our asset/liability management strategy. We initially measure all of our MSRs at fair value and carry substantially all of them at fair value depending on our strategy for managing interest rate risk. Under this method, the MSRs are recorded at fair value at the time we sell or securitize the related mortgage loans. The carrying value of MSRs carried at fair value reflects changes in fair value at the end of each quarter and changes are included in net servicing income, a component of mortgage banking noninterest income. If the fair value of the MSRs increases, income is recognized; if the fair value of the MSRs decreases, a loss is recognized. We use a dynamic and sophisticated model to estimate the fair value of our MSRs and periodically benchmark our estimates to independent appraisals. The valuation of MSRs can be highly subjective and involve complex judgments by management about matters that are inherently unpredictable. See “Critical Accounting Policies – Valuation of Residential Mortgage Servicing Rights” section of this Report for additional information. Changes in interest rates influence a variety of significant assumptions included in the periodic valuation of MSRs, including prepayment speeds, expected returns and potential risks on the servicing asset portfolio, the value of escrow balances and other servicing valuation elements. A decline in interest rates generally increases the propensity for refinancing, reduces the expected duration of the servicing portfolio and therefore reduces the estimated fair value of
MSRs. This reduction in fair value causes a charge to income for MSRs carried at fair value, net of any gains on free-standing derivatives (economic hedges) used to hedge MSRs. We may choose not to fully hedge all the potential decline in the value of our MSRs resulting from a decline in interest rates because the potential increase in origination/servicing fees in that scenario provides a partial “natural business hedge.” An increase in interest rates generally reduces the propensity for refinancing, extends the expected duration of the servicing portfolio and therefore increases the estimated fair value of the MSRs. However, an increase in interest rates can also reduce mortgage loan demand and therefore reduce origination income. The price risk associated with our MSRs is economically hedged with a combination of highly liquid interest rate forward instruments including mortgage forward contracts, interest rate swaps and interest rate options. All of the instruments included in the hedge are marked to market daily. Because the hedging instruments are traded in highly liquid markets, their prices are readily observable and are fully reflected in each quarter’s mark to market. Quarterly MSR hedging results include a combination of directional gain or loss due to market changes as well as any carry income generated. If the economic hedge is effective, its overall directional hedge gain or loss will offset the change in the valuation of the underlying MSR asset. Gains or losses associated with these economic hedges are included in mortgage banking noninterest income. Consistent with our longstanding approach to hedging interest rate risk in the mortgage business, the size of the hedge and the particular combination of hedging instruments at any point in time is designed to reduce the volatility of the mortgage business’s earnings over various time frames within a range of mortgage interest rates. Because market factors, the composition of the mortgage servicing portfolio and the relationship between the origination and servicing sides of our mortgage business change continually, the types of instruments used in our hedging are reviewed daily and rebalanced based on our evaluation of current market factors and the interest rate risk inherent in our MSRs portfolio. Throughout 2011, our economic hedging strategy generally used forward mortgage purchase contracts that were effective at offsetting the impact of interest rates on the value of the MSR asset. Mortgage forward contracts are designed to pass the full economics of the underlying reference mortgage securities to the holder of the contract, including both the directional gain or loss from the forward delivery of the reference securities and the corresponding carry income. Carry income represents the contract’s price accretion from the forward delivery price to the current spot price including both the yield earned on the reference securities and the market implied cost of financing during the period. The actual amount of carry income earned on the hedge each quarter will depend on the amount of the underlying asset that is hedged and the particular instruments included in the hedge. The level of carry income is driven by the slope of the yield curve and other market driven supply and demand factors affecting the specific reference securities. A steep yield curve generally produces higher carry income while
79
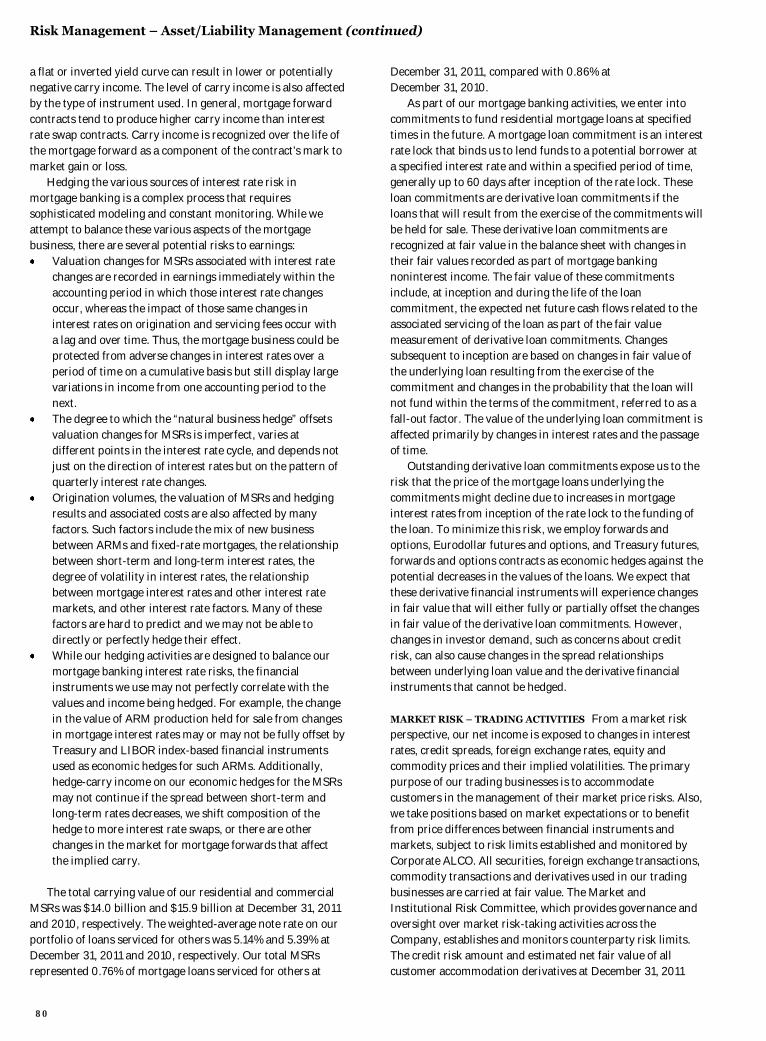
Risk Management – Asset/Liability Management (continued)
a flat or inverted yield curve can result in lower or potentially negative carry income. The level of carry income is also affected by the type of instrument used. In general, mortgage forward contracts tend to produce higher carry income than interest rate swap contracts. Carry income is recognized over the life of the mortgage forward as a component of the contract’s mark to market gain or loss. Hedging the various sources of interest rate risk in mortgage banking is a complex process that requires sophisticated modeling and constant monitoring. While we attempt to balance these various aspects of the mortgage business, there are several potential risks to earnings: Valuation changes for MSRs associated with interest rate
changes are recorded in earnings immediately within the accounting period in which those interest rate changes occur, whereas the impact of those same changes in interest rates on origination and servicing fees occur with a lag and over time. Thus, the mortgage business could be protected from adverse changes in interest rates over a period of time on a cumulative basis but still display large variations in income from one accounting period to the next.
The degree to which the “natural business hedge” offsets valuation changes for MSRs is imperfect, varies at different points in the interest rate cycle, and depends not just on the direction of interest rates but on the pattern of quarterly interest rate changes.
Origination volumes, the valuation of MSRs and hedging results and associated costs are also affected by many factors. Such factors include the mix of new business between ARMs and fixed-rate mortgages, the relationship between short-term and long-term interest rates, the degree of volatility in interest rates, the relationship between mortgage interest rates and other interest rate markets, and other interest rate factors. Many of these factors are hard to predict and we may not be able to directly or perfectly hedge their effect.
While our hedging activities are designed to balance our mortgage banking interest rate risks, the financial instruments we use may not perfectly correlate with the values and income being hedged. For example, the change in the value of ARM production held for sale from changes in mortgage interest rates may or may not be fully offset by Treasury and LIBOR index-based financial instruments used as economic hedges for such ARMs. Additionally, hedge-carry income on our economic hedges for the MSRs may not continue if the spread between short-term and long-term rates decreases, we shift composition of the hedge to more interest rate swaps, or there are other changes in the market for mortgage forwards that affect the implied carry.
The total carrying value of our residential and commercial MSRs was $14.0 billion and $15.9 billion at December 31, 2011 and 2010, respectively. The weighted-average note rate on our portfolio of loans serviced for others was 5.14% and 5.39% at December 31, 2011 and 2010, respectively. Our total MSRs represented 0.76% of mortgage loans serviced for others at
December 31, 2011, compared with 0.86% at December 31, 2010. As part of our mortgage banking activities, we enter into commitments to fund residential mortgage loans at specified times in the future. A mortgage loan commitment is an interest rate lock that binds us to lend funds to a potential borrower at a specified interest rate and within a specified period of time, generally up to 60 days after inception of the rate lock. These loan commitments are derivative loan commitments if the loans that will result from the exercise of the commitments will be held for sale. These derivative loan commitments are recognized at fair value in the balance sheet with changes in their fair values recorded as part of mortgage banking noninterest income. The fair value of these commitments include, at inception and during the life of the loan commitment, the expected net future cash flows related to the associated servicing of the loan as part of the fair value measurement of derivative loan commitments. Changes subsequent to inception are based on changes in fair value of the underlying loan resulting from the exercise of the commitment and changes in the probability that the loan will not fund within the terms of the commitment, referred to as a fall-out factor. The value of the underlying loan commitment is affected primarily by changes in interest rates and the passage of time. Outstanding derivative loan commitments expose us to the risk that the price of the mortgage loans underlying the commitments might decline due to increases in mortgage interest rates from inception of the rate lock to the funding of the loan. To minimize this risk, we employ forwards and options, Eurodollar futures and options, and Treasury futures, forwards and options contracts as economic hedges against the potential decreases in the values of the loans. We expect that these derivative financial instruments will experience changes in fair value that will either fully or partially offset the changes in fair value of the derivative loan commitments. However, changes in investor demand, such as concerns about credit risk, can also cause changes in the spread relationships between underlying loan value and the derivative financial instruments that cannot be hedged.
MARKET RISK – TRADING ACTIVITIES From a market risk perspective, our net income is exposed to changes in interest rates, credit spreads, foreign exchange rates, equity and commodity prices and their implied volatilities. The primary purpose of our trading businesses is to accommodate customers in the management of their market price risks. Also, we take positions based on market expectations or to benefit from price differences between financial instruments and markets, subject to risk limits established and monitored by Corporate ALCO. All securities, foreign exchange transactions, commodity transactions and derivatives used in our trading businesses are carried at fair value. The Market and Institutional Risk Committee, which provides governance and oversight over market risk-taking activities across the Company, establishes and monitors counterparty risk limits. The credit risk amount and estimated net fair value of all customer accommodation derivatives at December 31, 2011
80
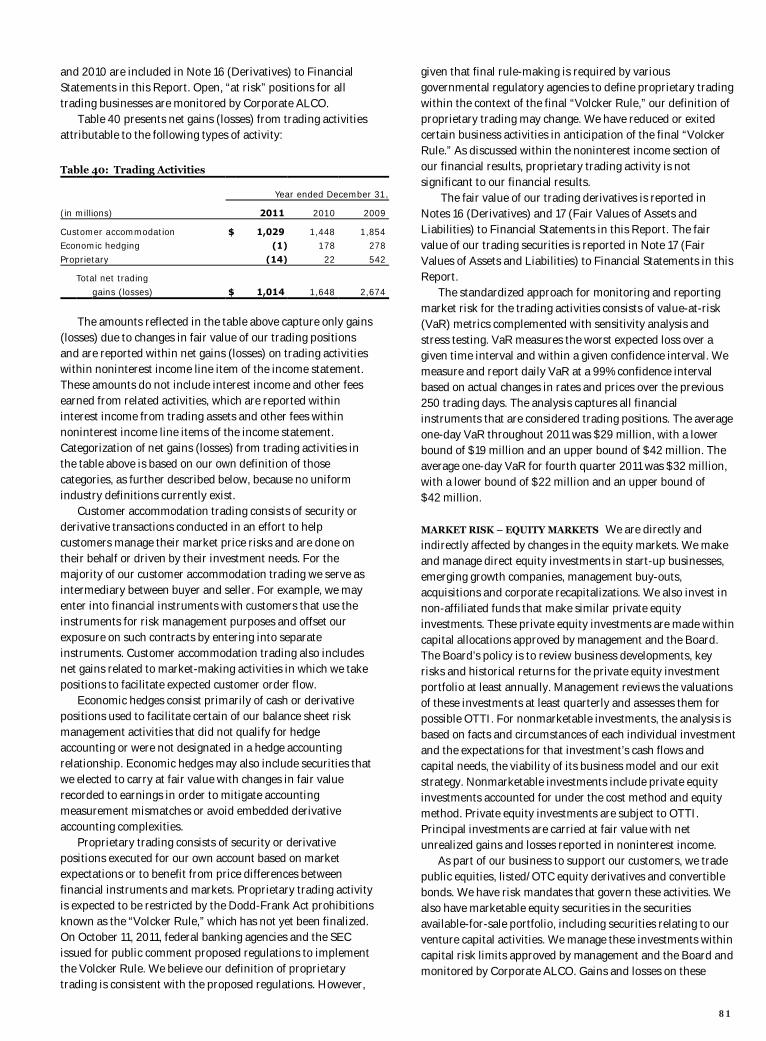
and 2010 are included in Note 16 (Derivatives) to Financial Statements in this Report. Open, “at risk” positions for all trading businesses are monitored by Corporate ALCO. Table 40 presents net gains (losses) from trading activities attributable to the following types of activity:
Table 40: Trading Activities Year ended December 31,
(in millions) 2011 2010 2009
Customer accommodation $ 1,029 1,448 1,854 Economic hedging (1) 178 278
Proprietary (14) 22 542
Total net trading
gains (losses) $ 1,014 1,648 2,674
The amounts reflected in the table above capture only gains (losses) due to changes in fair value of our trading positions and are reported within net gains (losses) on trading activities within noninterest income line item of the income statement. These amounts do not include interest income and other fees earned from related activities, which are reported within interest income from trading assets and other fees within noninterest income line items of the income statement. Categorization of net gains (losses) from trading activities in the table above is based on our own definition of those categories, as further described below, because no uniform industry definitions currently exist. Customer accommodation trading consists of security or derivative transactions conducted in an effort to help customers manage their market price risks and are done on their behalf or driven by their investment needs. For the majority of our customer accommodation trading we serve as intermediary between buyer and seller. For example, we may enter into financial instruments with customers that use the instruments for risk management purposes and offset our exposure on such contracts by entering into separate instruments. Customer accommodation trading also includes net gains related to market-making activities in which we take positions to facilitate expected customer order flow. Economic hedges consist primarily of cash or derivative positions used to facilitate certain of our balance sheet risk management activities that did not qualify for hedge accounting or were not designated in a hedge accounting relationship. Economic hedges may also include securities that we elected to carry at fair value with changes in fair value recorded to earnings in order to mitigate accounting measurement mismatches or avoid embedded derivative accounting complexities. Proprietary trading consists of security or derivative positions executed for our own account based on market expectations or to benefit from price differences between financial instruments and markets. Proprietary trading activity is expected to be restricted by the Dodd-Frank Act prohibitions known as the “Volcker Rule,” which has not yet been finalized. On October 11, 2011, federal banking agencies and the SEC issued for public comment proposed regulations to implement the Volcker Rule. We believe our definition of proprietary trading is consistent with the proposed regulations. However,
given that final rule-making is required by various governmental regulatory agencies to define proprietary trading within the context of the final “Volcker Rule,” our definition of proprietary trading may change. We have reduced or exited certain business activities in anticipation of the final “Volcker Rule.” As discussed within the noninterest income section of our financial results, proprietary trading activity is not significant to our financial results. The fair value of our trading derivatives is reported in Notes 16 (Derivatives) and 17 (Fair Values of Assets and Liabilities) to Financial Statements in this Report. The fair value of our trading securities is reported in Note 17 (Fair Values of Assets and Liabilities) to Financial Statements in this Report. The standardized approach for monitoring and reporting market risk for the trading activities consists of value-at-risk (VaR) metrics complemented with sensitivity analysis and stress testing. VaR measures the worst expected loss over a given time interval and within a given confidence interval. We measure and report daily VaR at a 99% confidence interval based on actual changes in rates and prices over the previous 250 trading days. The analysis captures all financial instruments that are considered trading positions. The average one-day VaR throughout 2011 was $29 million, with a lower bound of $19 million and an upper bound of $42 million. The average one-day VaR for fourth quarter 2011 was $32 million, with a lower bound of $22 million and an upper bound of $42 million.
MARKET RISK – EQUITY MARKETS We are directly and indirectly affected by changes in the equity markets. We make and manage direct equity investments in start-up businesses, emerging growth companies, management buy-outs, acquisitions and corporate recapitalizations. We also invest in non-affiliated funds that make similar private equity investments. These private equity investments are made within capital allocations approved by management and the Board. The Board’s policy is to review business developments, key risks and historical returns for the private equity investment portfolio at least annually. Management reviews the valuations of these investments at least quarterly and assesses them for possible OTTI. For nonmarketable investments, the analysis is based on facts and circumstances of each individual investment and the expectations for that investment’s cash flows and capital needs, the viability of its business model and our exit strategy. Nonmarketable investments include private equity investments accounted for under the cost method and equity method. Private equity investments are subject to OTTI. Principal investments are carried at fair value with net unrealized gains and losses reported in noninterest income. As part of our business to support our customers, we trade public equities, listed/OTC equity derivatives and convertible bonds. We have risk mandates that govern these activities. We also have marketable equity securities in the securities available-for-sale portfolio, including securities relating to our venture capital activities. We manage these investments within capital risk limits approved by management and the Board and monitored by Corporate ALCO. Gains and losses on these
81
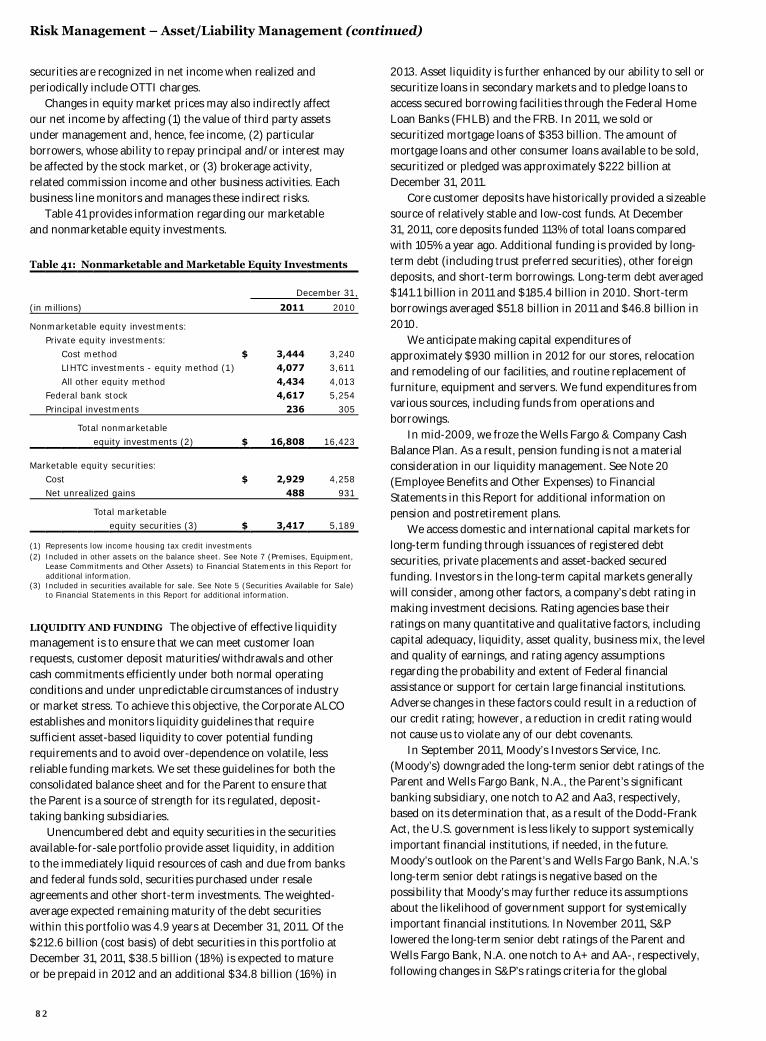
Risk Management – Asset/Liability Management (continued)
securities are recognized in net income when realized and periodically include OTTI charges.
Changes in equity market prices may also indirectly affect our net income by affecting (1) the value of third party assets under management and, hence, fee income, (2) particular borrowers, whose ability to repay principal and/or interest may be affected by the stock market, or (3) brokerage activity, related commission income and other business activities. Each business line monitors and manages these indirect risks.
Table 41 provides information regarding our marketable and nonmarketable equity investments.
Table 41: Nonmarketable and Marketable Equity Investments
December 31,
(in millions) 2011 2010
Nonmarketable equity investments: Private equity investments:
Cost method $ 3,444 3,240 LIHTC investments - equity method (1) 4,077 3,611
All other equity method 4,434 4,013 Federal bank stock 4,617 5,254
Principal investments 236 305
Total nonmarketable
equity investments (2) $ 16,808 16,423
Marketable equity securities: Cost $ 2,929 4,258
Net unrealized gains 488 931
Total marketable equity securities (3) $ 3,417 5,189
(1) Represents low income housing tax credit investments (2) Included in other assets on the balance sheet. See Note 7 (Premises, Equipment,
Lease Commitments and Other Assets) to Financial Statements in this Report for additional information.
(3) Included in securities available for sale. See Note 5 (Securities Available for Sale) to Financial Statements in this Report for additional information.
LIQUIDITY AND FUNDING The objective of effective liquidity management is to ensure that we can meet customer loan requests, customer deposit maturities/withdrawals and other cash commitments efficiently under both normal operating conditions and under unpredictable circumstances of industry or market stress. To achieve this objective, the Corporate ALCO establishes and monitors liquidity guidelines that require sufficient asset-based liquidity to cover potential funding requirements and to avoid over-dependence on volatile, less reliable funding markets. We set these guidelines for both the consolidated balance sheet and for the Parent to ensure that the Parent is a source of strength for its regulated, deposit-taking banking subsidiaries. Unencumbered debt and equity securities in the securities available-for-sale portfolio provide asset liquidity, in addition to the immediately liquid resources of cash and due from banks and federal funds sold, securities purchased under resale agreements and other short-term investments. The weighted-average expected remaining maturity of the debt securities within this portfolio was 4.9 years at December 31, 2011. Of the $212.6 billion (cost basis) of debt securities in this portfolio at December 31, 2011, $38.5 billion (18%) is expected to mature or be prepaid in 2012 and an additional $34.8 billion (16%) in
2013. Asset liquidity is further enhanced by our ability to sell or securitize loans in secondary markets and to pledge loans to access secured borrowing facilities through the Federal Home Loan Banks (FHLB) and the FRB. In 2011, we sold or securitized mortgage loans of $353 billion. The amount of mortgage loans and other consumer loans available to be sold, securitized or pledged was approximately $222 billion at December 31, 2011. Core customer deposits have historically provided a sizeable source of relatively stable and low-cost funds. At December 31, 2011, core deposits funded 113% of total loans compared with 105% a year ago. Additional funding is provided by long-term debt (including trust preferred securities), other foreign deposits, and short-term borrowings. Long-term debt averaged $141.1 billion in 2011 and $185.4 billion in 2010. Short-term borrowings averaged $51.8 billion in 2011 and $46.8 billion in 2010. We anticipate making capital expenditures of approximately $930 million in 2012 for our stores, relocation and remodeling of our facilities, and routine replacement of furniture, equipment and servers. We fund expenditures from various sources, including funds from operations and borrowings. In mid-2009, we froze the Wells Fargo & Company Cash Balance Plan. As a result, pension funding is not a material consideration in our liquidity management. See Note 20 (Employee Benefits and Other Expenses) to Financial Statements in this Report for additional information on pension and postretirement plans. We access domestic and international capital markets for long-term funding through issuances of registered debt securities, private placements and asset-backed secured funding. Investors in the long-term capital markets generally will consider, among other factors, a company’s debt rating in making investment decisions. Rating agencies base their ratings on many quantitative and qualitative factors, including capital adequacy, liquidity, asset quality, business mix, the level and quality of earnings, and rating agency assumptions regarding the probability and extent of Federal financial assistance or support for certain large financial institutions. Adverse changes in these factors could result in a reduction of our credit rating; however, a reduction in credit rating would not cause us to violate any of our debt covenants. In September 2011, Moody’s Investors Service, Inc. (Moody’s) downgraded the long-term senior debt ratings of the Parent and Wells Fargo Bank, N.A., the Parent’s significant banking subsidiary, one notch to A2 and Aa3, respectively, based on its determination that, as a result of the Dodd-Frank Act, the U.S. government is less likely to support systemically important financial institutions, if needed, in the future. Moody’s outlook on the Parent’s and Wells Fargo Bank, N.A.’s long-term senior debt ratings is negative based on the possibility that Moody’s may further reduce its assumptions about the likelihood of government support for systemically important financial institutions. In November 2011, S&P lowered the long-term senior debt ratings of the Parent and Wells Fargo Bank, N.A. one notch to A+ and AA-, respectively, following changes in S&P’s ratings criteria for the global
82
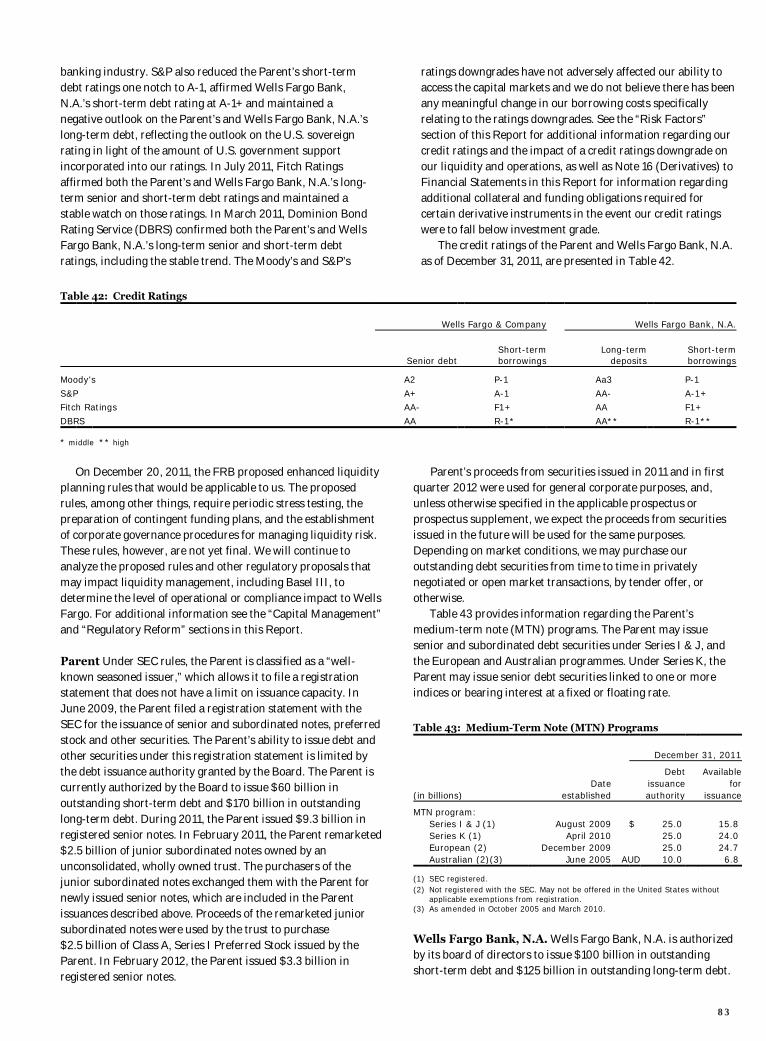
banking industry. S&P also reduced the Parent’s short-term debt ratings one notch to A-1, affirmed Wells Fargo Bank, N.A.’s short-term debt rating at A-1+ and maintained a negative outlook on the Parent’s and Wells Fargo Bank, N.A.’s long-term debt, reflecting the outlook on the U.S. sovereign rating in light of the amount of U.S. government support incorporated into our ratings. In July 2011, Fitch Ratings affirmed both the Parent’s and Wells Fargo Bank, N.A.’s long-term senior and short-term debt ratings and maintained a stable watch on those ratings. In March 2011, Dominion Bond Rating Service (DBRS) confirmed both the Parent’s and Wells Fargo Bank, N.A.’s long-term senior and short-term debt ratings, including the stable trend. The Moody’s and S&P’s
ratings downgrades have not adversely affected our ability to access the capital markets and we do not believe there has been any meaningful change in our borrowing costs specifically relating to the ratings downgrades. See the “Risk Factors” section of this Report for additional information regarding our credit ratings and the impact of a credit ratings downgrade on our liquidity and operations, as well as Note 16 (Derivatives) to Financial Statements in this Report for information regarding additional collateral and funding obligations required for certain derivative instruments in the event our credit ratings were to fall below investment grade. The credit ratings of the Parent and Wells Fargo Bank, N.A. as of December 31, 2011, are presented in Table 42.
Table 42: Credit Ratings
Wells Fargo & Company Wells Fargo Bank, N.A.
Senior debt Short-term borrowings
Long-term deposits
Short-term borrowings
Moody's A2 P-1 Aa3 P-1
S&P A+ A-1 AA- A-1+ Fitch Ratings AA- F1+ AA F1+
DBRS AA R-1* AA** R-1**
* middle ** high
On December 20, 2011, the FRB proposed enhanced liquidity planning rules that would be applicable to us. The proposed rules, among other things, require periodic stress testing, the preparation of contingent funding plans, and the establishment of corporate governance procedures for managing liquidity risk. These rules, however, are not yet final. We will continue to analyze the proposed rules and other regulatory proposals that may impact liquidity management, including Basel III, to determine the level of operational or compliance impact to Wells Fargo. For additional information see the “Capital Management” and “Regulatory Reform” sections in this Report.
Parent Under SEC rules, the Parent is classified as a “well-known seasoned issuer,” which allows it to file a registration statement that does not have a limit on issuance capacity. In June 2009, the Parent filed a registration statement with the SEC for the issuance of senior and subordinated notes, preferred stock and other securities. The Parent’s ability to issue debt and other securities under this registration statement is limited by the debt issuance authority granted by the Board. The Parent is currently authorized by the Board to issue $60 billion in outstanding short-term debt and $170 billion in outstanding long-term debt. During 2011, the Parent issued $9.3 billion in registered senior notes. In February 2011, the Parent remarketed $2.5 billion of junior subordinated notes owned by an unconsolidated, wholly owned trust. The purchasers of the junior subordinated notes exchanged them with the Parent for newly issued senior notes, which are included in the Parent issuances described above. Proceeds of the remarketed junior subordinated notes were used by the trust to purchase $2.5 billion of Class A, Series I Preferred Stock issued by the Parent. In February 2012, the Parent issued $3.3 billion in registered senior notes.
Parent’s proceeds from securities issued in 2011 and in first quarter 2012 were used for general corporate purposes, and, unless otherwise specified in the applicable prospectus or prospectus supplement, we expect the proceeds from securities issued in the future will be used for the same purposes. Depending on market conditions, we may purchase our outstanding debt securities from time to time in privately negotiated or open market transactions, by tender offer, or otherwise. Table 43 provides information regarding the Parent’s medium-term note (MTN) programs. The Parent may issue senior and subordinated debt securities under Series I & J, and the European and Australian programmes. Under Series K, the Parent may issue senior debt securities linked to one or more indices or bearing interest at a fixed or floating rate.
Table 43: Medium-Term Note (MTN) Programs December 31, 2011
Debt Available Date issuance for (in billions) established authority issuance
MTN program: Series I & J (1) August 2009 $ 25.0 15.8 Series K (1) April 2010 25.0 24.0 European (2) December 2009 25.0 24.7 Australian (2)(3) June 2005 AUD 10.0 6.8
(1) SEC registered. (2) Not registered with the SEC. May not be offered in the United States without
applicable exemptions from registration. (3) As amended in October 2005 and March 2010.
Wells Fargo Bank, N.A. Wells Fargo Bank, N.A. is authorized by its board of directors to issue $100 billion in outstanding short-term debt and $125 billion in outstanding long-term debt.
83
Risk Management – Asset/Liability Management (continued)
At December 31, 2011, Wells Fargo Bank, N.A. had available $100 billion in short-term debt issuance authority and $103.7 billion in long-term debt issuance authority.
Wells Fargo Canada Corporation In January 2012, Wells Fargo Canada Corporation (WFCC, formerly known as Wells Fargo Financial Canada Corporation), an indirect wholly owned Canadian subsidiary of the Parent, qualified with the Canadian provincial securities commissions a base shelf prospectus for the distribution from time to time in Canada of up to CAD$7.0 billion in medium-term notes. During 2011, WFCC issued CAD$500 million in medium-term notes using its prior base shelf prospectus. In February 2012, WFCC issued CAD$1.5 billion in medium-term notes. All medium-term notes issued by WFCC are unconditionally guaranteed by the Parent.
FEDERAL HOME LOAN BANK MEMBERSHIP We are a member of the Federal Home Loan Banks based in Dallas, Des Moines and San Francisco (collectively, the FHLBs). Each member of each of the FHLBs is required to maintain a minimum investment in capital stock of the applicable FHLB. The board of directors of each FHLB can increase the minimum investment requirements in the event it has concluded that additional capital is required to allow it to meet its own regulatory capital requirements. Any increase in the minimum investment requirements outside of specified ranges requires the approval of the Federal Housing Finance Board. Because the extent of any obligation to increase our investment in any of the FHLBs depends entirely upon the occurrence of a future event, potential future payments to the FHLBs are not determinable.
Capital Management
We have an active program for managing stockholders’ equity and regulatory capital and maintain a comprehensive process for assessing the Company’s overall capital adequacy. We generate capital primarily through the retention of earnings net of dividends. Our objective is to maintain capital at an amount commensurate with our risk profile and risk tolerance objectives, and to meet both regulatory and market expectations. Our potential sources of stockholders’ equity include retained earnings and issuances of common and preferred stock. Retained earnings increased $12.5 billion from December 31, 2010, predominantly from Wells Fargo net income of $15.9 billion, less common and preferred stock dividends of $3.4 billion. During 2011, we issued approximately 86 million shares of common stock, substantially all of which related to employee benefit plans. We also repurchased approximately 86 million shares of common stock at a net cost of $2.4 billion during 2011. Regulatory Capital Guidelines The Company and each of our subsidiary banks are subject to various regulatory capital adequacy requirements administered by the FRB and the OCC. Risk-based capital (RBC) guidelines establish a risk-adjusted ratio relating capital to different categories of assets and off-balance sheet exposures. At December 31, 2011, the Company and each of our subsidiary banks were “well-capitalized” under applicable regulatory capital adequacy guidelines. See Note 26 (Regulatory and Agency Capital Requirements) to Financial Statements in this Report for additional information. Current regulatory RBC rules are based primarily on broad credit-risk considerations and limited market-related risks, but do not take into account other types of risk facing a financial services company. Our capital adequacy assessment process contemplates a wide range of risks that the Company is exposed to and also takes into consideration our performance under a variety of stressed economic conditions, as well as regulatory expectations and guidance, rating agency viewpoints and the view of capital markets participants. In 2007, U.S. bank regulators approved a final rule adopting international guidelines for determining regulatory capital
known as “Basel II.” Basel II incorporates three pillars that address (a) capital adequacy, (b) supervisory review, which relates to the computation of capital and internal assessment processes, and (c) market discipline, through increased disclosure requirements. We are well underway toward Basel II implementation and currently anticipate entering the “parallel run phase” of Basel II in 2012. During the “parallel run phase,” banks must successfully complete at least a four quarter evaluation period under supervision from regulatory agencies in order to be compliant with the Basel II final rule. Our delayed entry into the “parallel run phase” was approved by the FRB in 2010 as a result of our acquisition of Wachovia. In December 2010, the Basel Committee on Bank Supervision (BCBS) finalized a set of international guidelines for determining regulatory capital known as “Basel III.” These guidelines were developed in response to the financial crisis of 2008 and 2009 and address many of the weaknesses identified in the banking sector as contributing to the crisis including excessive leverage, inadequate and low quality capital and insufficient liquidity buffers. The guidelines, among other things, increase minimum capital requirements and when fully phased in require bank holding companies to maintain a minimum ratio of Tier 1 common equity to risk-weighted assets of at least 7.0%. The U.S. regulatory bodies are reviewing the final international standards and final U.S. rulemaking is expected to be completed in 2012. The BCBS also proposed additional Tier 1 common equity surcharge requirements for global systemically important banks (G-SIBs). The surcharge ranges from 1.0% to 3.5% depending on the bank’s systemic importance to be determined under an indicator-based approach that would consider five broad categories: cross-jurisdictional activity, size, inter-connectedness, substitutability/financial institution infrastructure and complexity. These additional capital requirements, which would be phased in beginning in January 2016 and become fully effective on January 1, 2019, would be in addition to the Basel III 7.0% Tier 1 common equity requirement finalized in December 2010. The Financial Stability Board has determined that the Company is one of the initial
84
29 G-SIBs that would be subject to the surcharge, but has not yet determined the surcharge amount for us and the other banks. The FRB also recently proposed rules required under the Dodd-Frank Act that will impose enhanced prudential standards on large bank holding companies (BHCs) such as Wells Fargo, including enhanced capital, stress testing and liquidity requirements. We are reviewing the proposed rules to determine their potential effect on our business. Although uncertainty exists regarding final capital rules, including the FRB’s approach to capital requirements, we evaluate the impact of Basel III on our capital ratios based on our interpretation of the proposed capital requirements and we estimate that our Tier 1 common equity ratio under the Basel III proposal exceeded the fully phased-in minimum of 7.0% by 50 basis points at the end of 2011. This estimate is subject to change depending on final promulgation of Basel III capital rulemaking and interpretations thereof by regulatory authorities. Table 44 and Table 45, which appear at the end of this Capital Management section, provide information regarding our Tier 1 common equity calculation under Basel I and as estimated under Basel III, respectively. Capital Planning In connection with its increased focus on the adequacy of regulatory capital and risk management for large financial firms, the FRB required large banks to submit a capital plan in early 2011 as part of its Comprehensive Capital Analysis and Review (CCAR). Following submission of our capital plan on January 7, 2011, the FRB notified us on March 18, 2011, that it did not object to our 2011 capital plan. Since that notification, the Company took several capital actions, including increasing the quarterly common stock dividend to $0.12 a share, repurchasing $2.4 billion of our common stock, and redeeming $9.2 billion of trust preferred securities that will no longer count as Tier 1 capital under the Dodd-Frank Act and the proposed Basel III capital standards. In late 2011, the FRB finalized rules to require large BHCs to submit capital plans annually and to obtain regulatory approval before making capital distributions. The rule requires updates to capital plans in the event of material changes in a BHC’s risk profile, including as a result of any significant acquisitions. Under the FRB’s new capital plan rule, the 2012 CCAR will include a comprehensive capital plan supported by an assessment of expected uses and sources of capital over a given planning horizon under a range of expected and stress scenarios, similar to the process the FRB relied upon to conduct the 2011 CCAR. As part of the 2012 CCAR, the FRB will also generate a supervisory stress test driven by a sharp decline in the economy and significant decline in asset pricing using the information provided by the Company to estimate performance. The FRB has indicated it will publish its estimates of performance under this scenario on a BHC-specific basis. We submitted our board-approved 2012 capital plan to the FRB on January 6, 2012. We expect the FRB’s response to our submission in March 2012.
Securities Repurchases From time to time the Board authorizes the Company to repurchase shares of our common stock. Although we announce when the Board authorizes share repurchases, we typically do not give any public notice before we repurchase our shares. Future stock repurchases may be private or open-market repurchases, including block transactions, accelerated or delayed block transactions, forward transactions, and similar transactions. Additionally, we may enter into plans to purchase stock that satisfy the conditions of Rule 10b5-1 of the Securities Exchange Act of 1934. Various factors determine the amount and timing of our share repurchases, including our capital requirements, the number of shares we expect to issue for employee benefit plans and acquisitions, market conditions (including the trading price of our stock), and regulatory and legal considerations, including the FRB’s response to our capital plan. In 2008, the Board authorized the repurchase of up to 25 million additional shares of our outstanding common stock. In first quarter 2011, the Board authorized the repurchase of an additional 200 million shares. During 2011, we repurchased 80 million shares of our common stock in the open market and from our employee benefit plans and an additional 6 million shares through a private forward repurchase transaction that settled in fourth quarter 2011. During fourth quarter 2011, we entered into a second forward repurchase transaction that settled in first quarter 2012 for approximately 6 million shares of common stock. At December 31, 2011, we had utilized all previously remaining common stock repurchase authority from the 2008 authorization and had remaining authority from the 2011 authorization to purchase approximately 117 million shares. For more information about share repurchases during 2011, see Part II, Item 5 of our 2011 Form 10-K and for additional information about our forward repurchase programs see Note 1 (Summary of Significant Accounting Policies) to Financial Statements in this Report. Historically, our policy has been to repurchase shares under the “safe harbor” conditions of Rule 10b-18 of the Securities Exchange Act of 1934 including a limitation on the daily volume of repurchases. Rule 10b-18 imposes an additional daily volume limitation on share repurchases during a pending merger or acquisition in which shares of our stock will constitute some or all of the consideration. Our management may determine that during a pending stock merger or acquisition when the safe harbor would otherwise be available, it is in our best interest to repurchase shares in excess of this additional daily volume limitation. In such cases, we intend to repurchase shares in compliance with the other conditions of the safe harbor, including the standing daily volume limitation that applies whether or not there is a pending stock merger or acquisition. In connection with our participation in the Troubled Asset Relief Program (TARP) Capital Purchase Program (CPP), we issued to the U.S. Treasury Department warrants to purchase 110,261,688 shares of our common stock with an exercise price of $34.01 per share expiring on October 28, 2018. The Board authorized the repurchase by the Company of up to $1 billion of the warrants. On May 26, 2010, in an auction by the U.S. Treasury, we purchased 70,165,963 of the warrants at a price of
85
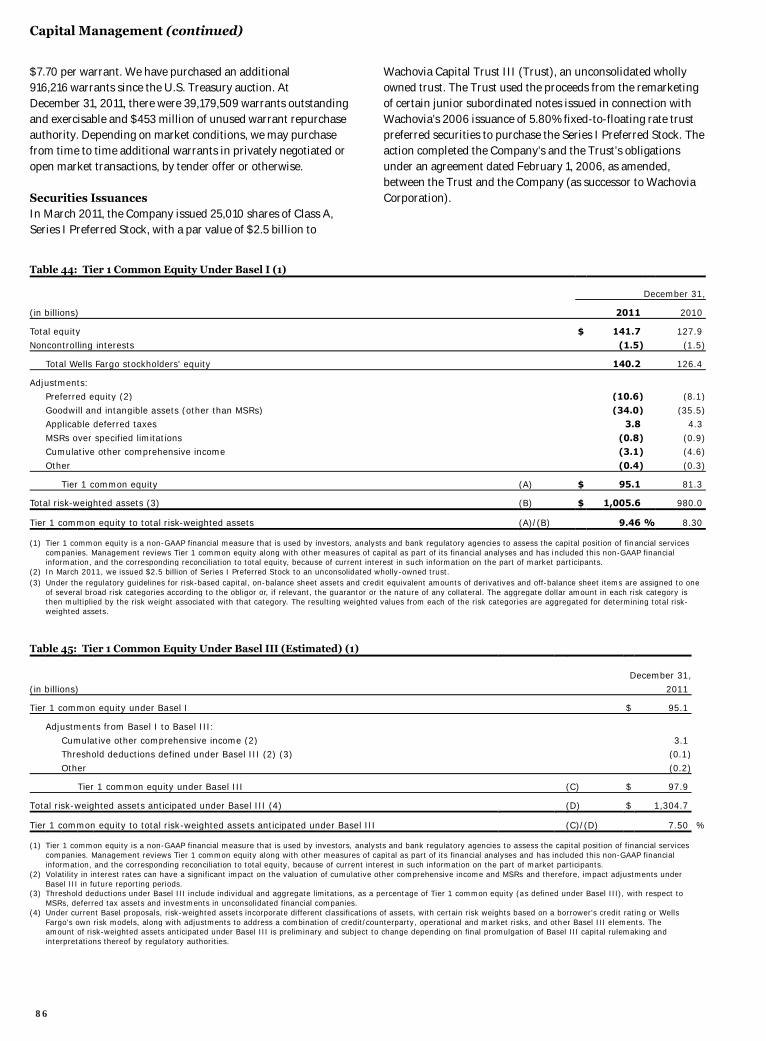
Capital Management (continued)
$7.70 per warrant. We have purchased an additional 916,216 warrants since the U.S. Treasury auction. At December 31, 2011, there were 39,179,509 warrants outstanding and exercisable and $453 million of unused warrant repurchase authority. Depending on market conditions, we may purchase from time to time additional warrants in privately negotiated or open market transactions, by tender offer or otherwise. Securities Issuances In March 2011, the Company issued 25,010 shares of Class A, Series I Preferred Stock, with a par value of $2.5 billion to
Wachovia Capital Trust III (Trust), an unconsolidated wholly owned trust. The Trust used the proceeds from the remarketing of certain junior subordinated notes issued in connection with Wachovia’s 2006 issuance of 5.80% fixed-to-floating rate trust preferred securities to purchase the Series I Preferred Stock. The action completed the Company’s and the Trust’s obligations under an agreement dated February 1, 2006, as amended, between the Trust and the Company (as successor to Wachovia Corporation).
Table 44: Tier 1 Common Equity Under Basel I (1)
December 31,
(in billions) 2011 2010
Total equity $ 141.7 127.9 Noncontrolling interests (1.5) (1.5)
Total Wells Fargo stockholders' equity 140.2 126.4
Adjustments: Preferred equity (2) (10.6) (8.1)
Goodwill and intangible assets (other than MSRs) (34.0) (35.5) Applicable deferred taxes 3.8 4.3
MSRs over specified limitations (0.8) (0.9) Cumulative other comprehensive income (3.1) (4.6)
Other (0.4) (0.3)
Tier 1 common equity (A) $ 95.1 81.3
Total risk-weighted assets (3) (B) $ 1,005.6 980.0
Tier 1 common equity to total risk-weighted assets (A)/(B) 9.46 % 8.30
(1) Tier 1 common equity is a non-GAAP financial measure that is used by investors, analysts and bank regulatory agencies to assess the capital position of financial services companies. Management reviews Tier 1 common equity along with other measures of capital as part of its financial analyses and has included this non-GAAP financial information, and the corresponding reconciliation to total equity, because of current interest in such information on the part of market participants.
(2) In March 2011, we issued $2.5 billion of Series I Preferred Stock to an unconsolidated wholly-owned trust. (3) Under the regulatory guidelines for risk-based capital, on-balance sheet assets and credit equivalent amounts of derivatives and off-balance sheet items are assigned to one
of several broad risk categories according to the obligor or, if relevant, the guarantor or the nature of any collateral. The aggregate dollar amount in each risk category is then multiplied by the risk weight associated with that category. The resulting weighted values from each of the risk categories are aggregated for determining total risk-weighted assets.
Table 45: Tier 1 Common Equity Under Basel III (Estimated) (1)
December 31,
(in billions) 2011
Tier 1 common equity under Basel I $ 95.1
Adjustments from Basel I to Basel III:
Cumulative other comprehensive income (2) 3.1 Threshold deductions defined under Basel III (2) (3) (0.1)
Other (0.2)
Tier 1 common equity under Basel III (C) $ 97.9
Total risk-weighted assets anticipated under Basel III (4) (D) $ 1,304.7
Tier 1 common equity to total risk-weighted assets anticipated under Basel III (C)/(D) 7.50 %
(1) Tier 1 common equity is a non-GAAP financial measure that is used by investors, analysts and bank regulatory agencies to assess the capital position of financial services companies. Management reviews Tier 1 common equity along with other measures of capital as part of its financial analyses and has included this non-GAAP financial information, and the corresponding reconciliation to total equity, because of current interest in such information on the part of market participants.
(2) Volatility in interest rates can have a significant impact on the valuation of cumulative other comprehensive income and MSRs and therefore, impact adjustments under Basel III in future reporting periods.
(3) Threshold deductions under Basel III include individual and aggregate limitations, as a percentage of Tier 1 common equity (as defined under Basel III), with respect to MSRs, deferred tax assets and investments in unconsolidated financial companies.
(4) Under current Basel proposals, risk-weighted assets incorporate different classifications of assets, with certain risk weights based on a borrower's credit rating or Wells Fargo's own risk models, along with adjustments to address a combination of credit/counterparty, operational and market risks, and other Basel III elements. The amount of risk-weighted assets anticipated under Basel III is preliminary and subject to change depending on final promulgation of Basel III capital rulemaking and interpretations thereof by regulatory authorities.
86
Regulatory Reform
The past two years have witnessed a significant increase in regulation and regulatory oversight initiatives that may substantially change how most U.S. financial services companies conduct business. The following highlights the more significant regulations and regulatory oversight initiatives that have affected or may affect our business. For additional information about the regulatory reform matters discussed below and other regulations and regulatory oversight matters, see Part I, Item 1 “Regulation and Supervision” of our 2011 Form 10-K, and the “Capital Management,” “Forward-Looking Statements” and “Risk Factors” sections and Note 26 (Regulatory and Agency Capital Requirements) to Financial Statements in this Report. Dodd-Frank Act The Dodd-Frank Act is the most significant financial reform legislation since the 1930s and is driving much of the current U.S. regulatory reform. The Dodd-Frank Act and many of its provisions became effective in July 2010 and July 2011. However, a number of its provisions still require extensive rulemaking, guidance, and interpretation by regulatory authorities and many of the rules that have been proposed to implement its requirements remain open for public comment and have not been finalized. Where possible, the Company may, from time to time, estimate the impact to the Company’s financial results or business operations as a result of particular Dodd-Frank Act regulations. However, due to the uncertainty of pending regulations, the Company may be unable to make any such estimates. Accordingly, in many respects the ultimate impact of the Dodd-Frank Act and its effects on the U.S. financial system and the Company still remain uncertain. The following provides additional information on the Dodd-Frank Act, including the current status of certain of its rulemaking initiatives. Regulation of interchange fees (the Durbin Amendment). On
October 1, 2011, FRB rules limiting debit card interchange fees to those "reasonable" and "proportional" to the transactions became effective. The rule generally established that the maximum permissible interchange fee that an issuer may receive for an electronic debit transaction will be the sum of 21 cents per transaction and 5 basis points multiplied by the value of the transaction. An additional charge of up to 1 cent may be added if the issuer develops and implements fraud prevention policies and procedures that meet regulation standards. As a result of the FRB’s new rules, our fourth quarter 2011 debit card interchange fees were reduced by $365 million (pre-tax).
Interest on business checking (Regulation Q repeal). Effective July 21, 2011, banks are permitted to pay interest on business checking accounts. We made changes to our affected products in anticipation of the repeal of Regulation Q. To date, our product changes and the repeal of Regulation Q have had a minimal impact on our business because of the low interest rate environment.
Asset-based deposit assessment base; other FDIC assessment changes. In 2011, the FDIC finalized regulations
to implement the provision of the Dodd-Frank Act requiring a shift from deposits to assets as the basis for determining FDIC assessments. In addition, the FDIC approved changes to its assessment rates to implement a new minimum designated reserve ratio and impose separate risk-based assessments on large banks. The FDIC has broad discretionary authority to increase assessments on large financial institutions such as Wells Fargo on a case by case basis.
Regulation of swaps and other derivatives activities. The Dodd-Frank Act establishes a comprehensive framework for regulating over-the-counter derivatives. Included in this framework are certain “push-out” provisions affecting U.S. banks acting as dealers in commodity swaps, equity swaps and certain credit default swaps, which will require that these activities be conducted through an affiliate. It also authorizes the Commodity Futures Trading Commission (CFTC) and the SEC to regulate swaps and security-based swaps respectively. During 2011, the CFTC and SEC proposed rules to implement derivatives regulation, including clearing and trading requirements, data retention and reporting requirements, registration requirements, capital and margin requirements, business conduct standards, and customer eligibility requirements. At this time, the Company cannot predict the financial impact of the rules to our swaps and securities-based swaps activities or estimate the costs of complying with the rules.
Volcker Rule. The Volcker Rule will prohibit banking entities from engaging in proprietary trading or owning any interest in or sponsoring a hedge fund or a private equity fund. In October 2011, federal banking agencies and the SEC issued for public comment proposed regulations to implement the Volcker Rule. The comment period ended on February 13, 2012, and the Volcker Rule will become effective on July 21, 2012, regardless of the status of the rulemaking process. The proposed rules requested comments on over 1,300 questions and it is difficult to predict the content of the final rules. Although proprietary trading is not significant to our financial results, and we have reduced or exited certain businesses in anticipation of the final rules, at this time the Company cannot predict the ultimate impact of the Volcker Rule on our trading and investment activities or financial results.
Changes to asset-backed securities markets. The Dodd-Frank Act will generally require sponsors of asset-backed securities (ABS) to hold at least a 5% ownership stake in the ABS. Exemptions from the requirement include qualified residential mortgages and FHA/VA loans. Federal regulatory authorities have proposed joint rules to implement this credit risk retention requirement, which rules include an exemption for the GSE’s mortgage-backed securities. The proposed rules have been subject to extensive public comment. At this time, the Company cannot predict the financial impact of the credit risk retention requirement on our business.
87
Regulatory Reform (continued)
The Collins Amendment. This provision of the Dodd-Frank Act will phase out the benefit of issuing trust preferred securities by eliminating them from Tier 1 capital over three years beginning January 2013. We redeemed $9.2 billion of our trust preferred securities in 2011 as discussed in the “Capital Management” section of this Report.
Enhanced supervision and regulation of systemically significant firms. The Dodd-Frank Act grants broad authority to banking regulators to establish enhanced supervisory and regulatory requirements for systemically important firms. In December 2011, the FRB published proposed rules that would establish enhanced risk-based capital requirements and leverage limits, liquidity requirements, counterparty credit exposure limits, risk management requirements, stress testing requirements, debt-to-equity limits, and early remediation requirements for large BHCs like Wells Fargo. The Dodd-Frank Act also establishes the Financial Services Oversight Council and the Office of Financial Research, which may recommend new systemic risk management requirements and require new reporting of systemic risks.
Establishment of the Consumer Financial Protection Bureau (CFPB).The Dodd-Frank Act established the CFPB, which became operational on July 21, 2011. The role of the CFPB is to ensure consumers get clear, accurate information to effectively evaluate mortgages, credit cards and other financial products and protect them from hidden fees, abusive terms and deceptive practices. The CFPB has broad rulemaking powers and supervisory and enforcement authority over consumer financial products and services. The CFPB has begun exercising its supervisory authority over the banks under its jurisdiction, including Wells Fargo, and is preparing for supervision of certain non-bank entities. The CFPB has indicated it will concentrate much of its rulemaking effort in 2012 on the variety of mortgage-related topics required under the Dodd-Frank Act, including the steering of consumers to certain products, discrimination, abusive or unfair lending practices, predatory lending, origination disclosures, minimum mortgage underwriting standards, and servicing practices. The CFPB has published proposed regulations on several of these topics, including minimum mortgage underwriting standards (ability to repay). At this time, the Company cannot predict the content of final CFPB regulations and impacts on our business practices or financial results.
Regulatory Capital Guidelines and Capital Plans In December 2010, the BCBS finalized Basel III for determining regulatory capital. When fully phased in by 2019, the Basel III standards will require BHCs to maintain a minimum ratio of Tier 1 common equity to risk-weighted assets of at least 7.0%. In November 2011, the BCBS released its final rule for a common equity surcharge on certain designated G-SIBs. We have been named as one of the G-SIBs that will be subject to a surcharge, although the amount of the surcharge, ranging from 1.0% to 3.5%, has not been determined. The FRB has indicated it expects to adopt regulations implementing the G-SIB surcharge in 2014 and that the surcharge would be imposed on a phased-in basis from 2016-2019. In late 2011, the FRB finalized rules to require BHCs with $50 billion or more of consolidated assets to submit capital plans annually and to obtain regulatory approval before making capital distributions. The rule also requires a capital adequacy assessment under a range of expected and stress scenarios. For additional information, see the “Capital Management” section of this Report. “Living Will” Requirements In late 2011 the FRB and the FDIC approved final resolution-plan regulations as mandated by the Dodd-Frank Act. These regulations will require large financial institutions, including Wells Fargo, to prepare and periodically revise plans that would facilitate their resolution in the event of material distress or failure. As contemplated by the Dodd-Frank Act, resolution plans are to provide for a rapid and orderly resolution – liquidation or orderly restructuring – under Bankruptcy Code and other insolvency statutes applicable to particular types of regulated entities (such as securities broker-dealers or insurance companies).
88
Critical Accounting Policies
Our significant accounting policies (see Note 1 (Summary of Significant Accounting Policies) to Financial Statements in this Report) are fundamental to understanding our results of operations and financial condition because they require that we use estimates and assumptions that may affect the value of our assets or liabilities and financial results. Six of these policies are critical because they require management to make difficult, subjective and complex judgments about matters that are inherently uncertain and because it is likely that materially different amounts would be reported under different conditions or using different assumptions. These policies govern: the allowance for credit losses; PCI loans; the valuation of residential MSRs; liability for mortgage loan repurchase losses; the fair valuation of financial instruments; and income taxes.
Management has reviewed and approved these critical accounting policies and has discussed these policies with the Board’s Audit and Examination Committee.
Allowance for Credit Losses The allowance for credit losses, which consists of the allowance for loan losses and the allowance for unfunded credit commitments, is management’s estimate of credit losses inherent in the loan portfolio at the balance sheet date, excluding loans carried at fair value. We develop and document our allowance methodology at the portfolio segment level. Our loan portfolio consists of a commercial loan portfolio segment and a consumer loan portfolio segment.
We employ a disciplined process and methodology to establish our allowance for credit losses. The total allowance for credit losses considers both impaired and unimpaired loans. While our methodology attributes portions of the allowance to specific portfolio segments, the entire allowance for credit losses is available to absorb credit losses inherent in the total loan portfolio and unfunded credit commitments. No single statistic or measurement determines the adequacy of the allowance for credit losses.
COMMERCIAL PORTFOLIO SEGMENT The allowance for credit losses for unimpaired commercial loans is estimated through the application of loss factors to loans based on credit risk ratings for each loan. In addition, the allowance for credit losses for unfunded commitments, including letters of credit, is estimated by applying these loss factors to loan equivalent exposures. The loss factors reflect the estimated default probability and quality of the underlying collateral. The loss factors used are statistically derived through the observation of historical losses incurred for loans within each credit risk rating over a relevant specified period of time. As appropriate, we adjust or supplement these loss factors and estimates to reflect other risks that may be identified from current conditions and developments in selected portfolios. The allowance also includes an amount for estimated credit losses on impaired loans such as nonaccrual loans and loans that
have been modified in a TDR, whether on accrual or nonaccrual status. CONSUMER PORTFOLIO SEGMENT Loans are pooled generally by product type with similar risk characteristics. Losses are estimated using forecasted losses to represent our best estimate of inherent loss based on historical experience, quantitative and other mathematical techniques over the loss emergence period. Each business group exercises significant judgment in the determination of the credit loss estimation model that fits the credit risk characteristics of its portfolio. We use both internally developed and vendor supplied models in this process. We often use roll rate or net flow models for near-term loss projections, and vintage-based models, behavior score models, and time series or statistical trend models for longer-term projections. Management must use judgment in establishing additional input metrics for the modeling processes, considering further stratification into sub-product, origination channel, vintage, loss type, geographic location and other predictive characteristics. In addition, we establish an allowance for consumer loans modified in a TDR, whether on accrual or nonaccrual status.
The models used to determine the allowance are validated by an independent internal model validation group operating in accordance with Company policies. OTHER ACL MATTERS The allowance for credit losses for both portfolio segments includes an amount for imprecision or uncertainty that may change from period to period. This amount represents management’s judgment of risks inherent in the processes and assumptions used in establishing the allowance. This imprecision considers economic environmental factors, modeling assumptions and performance, process risk, and other subjective factors, including industry trends and ongoing discussions with regulatory and government agencies regarding mortgage foreclosure-related matters. Impaired loans, which predominantly include nonaccrual commercial loans and any loans that have been modified in a TDR, have an estimated allowance calculated as the difference, if any, between the impaired value of the loan and the recorded investment in the loan. The impaired value of the loan is generally calculated as the present value of expected future cash flows from principal and interest, which incorporates expected lifetime losses, discounted at the loan’s effective interest rate. The allowance for an unimpaired loan is based solely on principal losses without consideration for timing of those losses. The allowance for an impaired loan that was modified in a TDR may be lower than the previously established allowance for that loan due to benefits received through modification, such as lower probability of default and/or severity of loss, and the impact of prior charge-offs or charge-offs at the time of the modification that may reduce or eliminate the need for an allowance. Commercial and consumer PCI loans may require an allowance subsequent to their acquisition. This allowance requirement is due to probable decreases in expected principal and interest cash flows (other than due to decreases in interest rate indices and changes in prepayment assumptions).
89

Critical Accounting Policies (continued)
SENSITIVITY TO CHANGES Changes in the allowance for credit losses and, therefore, in the related provision expense can materially affect net income. The establishment of the allowance for credit losses relies on a consistent quarterly process that requires significant management review and judgment. Management considers changes in economic conditions, customer behavior, and collateral value, among other influences. From time to time, economic factors or business decisions, such as the addition or liquidation of a loan product or business unit, may affect the loan portfolio, causing management to provide or release amounts from the allowance for credit losses.
The allowance for credit losses for commercial loans, including unfunded credit commitments (individually risk weighted) is sensitive to credit risk ratings assigned to each credit exposure. Commercial loan risk ratings are evaluated based on each situation by experienced senior credit officers and are subject to periodic review by an independent internal team of credit specialists.
The allowance for credit losses for consumer loans (statistically modeled) is sensitive to economic assumptions and delinquency trends. Forecasted losses are modeled using a range of economic scenarios.
Assuming a one risk rating downgrade throughout our commercial portfolio segment, a more pessimistic economic outlook for modeled losses on our consumer portfolio segment and incremental deterioration in our PCI portfolio could imply an additional allowance requirement of approximately $11.0 billion.
Assuming a one risk rating upgrade throughout our commercial portfolio segment and a more optimistic economic outlook for modeled losses on our consumer portfolio segment could imply a reduced allowance requirement of approximately $3.1 billion.
The sensitivity analyses provided are hypothetical scenarios and are not considered probable. They do not represent management’s view of inherent losses in the portfolio as of the balance sheet date. Because significant judgment is used, it is possible that others performing similar analyses could reach different conclusions.
See the “Risk Management – Credit Risk Management” section and Note 6 (Loans and Allowance for Credit Losses) to Financial Statements in this Report for further discussion of our allowance.
Purchased Credit-Impaired (PCI) Loans Loans acquired with evidence of credit deterioration since their origination and where it is probable that we will not collect all contractually required principal and interest payments are accounted for using the measurement provision for PCI loans. PCI loans are recorded at fair value at the date of acquisition, and the historical allowance for credit losses related to these loans is not carried over. Such loans are considered to be accruing due to the existence of the accretable yield and not based on consideration given to contractual interest payments. Substantially all of our PCI loans were acquired in the Wachovia acquisition on December 31, 2008.
Management evaluated whether there was evidence of credit quality deterioration as of the purchase date using indicators
such as past due and nonaccrual status, commercial risk ratings, recent borrower credit scores and recent loan-to-value percentages.
The fair value at acquisition was based on an estimate of cash flows, both principal and interest, expected to be collected, discounted at the prevailing market rate of interest. We estimated the cash flows expected to be collected at acquisition using our internal credit risk, interest rate risk and prepayment risk models, which incorporate our best estimate of current key assumptions, such as property values, default rates, loss severity and prepayment speeds.
Substantially all commercial and industrial, CRE and foreign PCI loans are accounted for as individual loans. Conversely, Pick-a-Pay and other consumer PCI loans have been aggregated into several pools based on common risk characteristics. Each pool is accounted for as a single asset with a single composite interest rate and an aggregate expectation of cash flows.
The excess of cash flows expected to be collected over the carrying value (estimated fair value at acquisition date) is referred to as the accretable yield and is recognized in interest income using an effective yield method over the remaining life of the loan, or pool of loans, in situations where there is a reasonable expectation about the timing and amount of cash flows expected to be collected. The difference between the contractually required payments and the cash flows expected to be collected at acquisition, considering the impact of prepayments, is referred to as the nonaccretable difference.
Subsequent to acquisition, we regularly evaluate our estimates of cash flows expected to be collected. These evaluations, performed quarterly, require the continued usage of key assumptions and estimates, similar to our initial estimate of fair value. We must apply judgment to develop our estimates of cash flows for PCI loans given the impact of home price and property value changes, changing loss severities, modification activity, and prepayment speeds.
If we have probable decreases in cash flows expected to be collected (other than due to decreases in interest rate indices and changes in prepayment assumptions), we charge the provision for credit losses, resulting in an increase to the allowance for loan losses. If we have probable and significant increases in cash flows expected to be collected, we first reverse any previously established allowance for loan losses and then increase interest income as a prospective yield adjustment over the remaining life of the loan, or pool of loans. Estimates of cash flows are impacted by changes in interest rate indices for variable rate loans and prepayment assumptions, both of which are treated as prospective yield adjustments included in interest income.
Resolutions of loans may include sales of loans to third parties, receipt of payments in settlement with the borrower, or foreclosure of the collateral. Our policy is to remove an individual loan from a pool based on comparing the amount received from its resolution with its contractual amount. Any difference between these amounts is absorbed by the nonaccretable difference for the entire pool. This removal method assumes that the amount received from resolution approximates pool performance expectations. The remaining accretable yield balance is unaffected and any material change in remaining effective yield caused by this removal method is
90
addressed by our quarterly cash flow evaluation process for each pool. For loans that are resolved by payment in full, there is no release of the nonaccretable difference for the pool because there is no difference between the amount received at resolution and the contractual amount of the loan. Modified PCI loans are not removed from a pool even if those loans would otherwise be deemed TDRs. Modified PCI loans that are accounted for individually are considered TDRs, and removed from PCI accounting if there has been a concession granted in excess of the original nonaccretable difference. We include these TDRs in our impaired loans.
The amount of cash flows expected to be collected and, accordingly, the adequacy of the allowance for loan loss due to certain decreases in cash flows expected to be collected, is particularly sensitive to changes in loan credit quality. The sensitivity of the overall allowance for credit losses, including PCI loans, is presented in the preceding section, “Critical Accounting Policies – Allowance for Credit Losses.”
See the “Risk Management – Credit Risk Management” section and Note 6 (Loans and Allowance for Credit Losses) to Financial Statements in this Report for further discussion of PCI loans. Valuation of Residential Mortgage Servicing Rights MSRs are assets that represent the rights to service mortgage loans for others. We recognize MSRs when we purchase servicing rights from third parties, or retain servicing rights in connection with the sale or securitization of loans we originate (asset transfers). We also have MSRs acquired in the past under co-issuer agreements that provide for us to service loans that were originated and securitized by third-party correspondents. We initially measure and carry substantially all of our MSRs related to residential mortgage loans at fair value.
At the end of each quarter, we determine the fair value of MSRs using a valuation model that calculates the present value of estimated future net servicing income. The model incorporates assumptions that market participants use in estimating future net servicing income, including estimates of prepayment speeds (including housing price volatility), discount rates, default rates, cost to service (including delinquency and foreclosure costs), escrow account earnings, contractual servicing fee income, ancillary income and late fees.
Net servicing income, a component of mortgage banking noninterest income, includes the changes from period to period in fair value of both our residential MSRs and the free-standing derivatives (economic hedges) used to hedge our residential MSRs. Changes in the fair value of residential MSRs from period to period result from (1) changes in the valuation model inputs or assumptions (principally reflecting changes in discount rates and prepayment speed assumptions, mostly due to changes in interest rates and costs to service, including delinquency and foreclosure costs), and (2) other changes, representing changes due to collection/realization of expected cash flows over time.
We use a dynamic and sophisticated model to estimate the value of our MSRs. The model is validated by an independent internal model validation group operating in accordance with Company policies. Senior management reviews all significant assumptions quarterly. Mortgage loan prepayment speed – a key
assumption in the model – is the annual rate at which borrowers are forecasted to repay their mortgage loan principal. The discount rate used to determine the present value of estimated future net servicing income – another key assumption in the model – is the required rate of return investors in the market would expect for an asset with similar risk. To determine the discount rate, we consider the risk premium for uncertainties from servicing operations (e.g., possible changes in future servicing costs, ancillary income and earnings on escrow accounts). Both assumptions can, and generally will, change quarterly as market conditions and interest rates change. For example, an increase in either the prepayment speed or discount rate assumption results in a decrease in the fair value of the MSRs, while a decrease in either assumption would result in an increase in the fair value of the MSRs. In recent years, there have been significant market-driven fluctuations in loan prepayment speeds and the discount rate. These fluctuations can be rapid and may be significant in the future. Therefore, estimating prepayment speeds within a range that market participants would use in determining the fair value of MSRs requires significant management judgment. Additionally, in recent years, we have made significant adjustments to the assumptions for servicing and foreclosure costs as a result of an increase in the number of defaulted loans as well as changes in servicing processes associated with default and foreclosure management. While our current valuation reflects our best estimate of these costs, future regulatory changes in servicing standards may have an impact on these assumptions and our MSR valuation in future periods.
The valuation and sensitivity of MSRs is discussed further in Note 1 (Summary of Significant Accounting Policies), Note 8 (Securitizations and Variable Interest Entities), Note 9 (Mortgage Banking Activities) and Note 17 (Fair Values of Assets and Liabilities) to Financial Statements in this Report.
Liability for Mortgage Loan Repurchase Losses We sell residential mortgage loans to various parties, including (1) GSEs, which include the mortgage loans in GSE-guaranteed mortgage securitizations, (2) special purpose entities that issue private label MBS, and (3) other financial institutions that purchase mortgage loans for investment or private label securitization. In addition, we pool FHA-insured and VA-guaranteed mortgage loans, which back securities guaranteed by GNMA. The agreements under which we sell mortgage loans and the insurance or guaranty agreements with FHA and VA contain provisions that include various representations and warranties regarding the origination and characteristics of the mortgage loans. Although the specific representations and warranties vary among different sales, insurance or guarantee agreements, they typically cover ownership of the loan, compliance with loan criteria set forth in the applicable agreement, validity of the lien securing the loan, absence of delinquent taxes or liens against the property securing the loan, compliance with applicable origination laws, and other matters. For more information about these loan sales and the related risks that may result in liability see the “Risk Management – Credit Risk Management – Liability for Mortgage Loan Repurchase Losses” section in this Report.
91
Critical Accounting Policies (continued)
We may be required to repurchase mortgage loans, indemnify the securitization trust, investor or insurer, or reimburse the securitization trust, investor or insurer for credit losses incurred on loans (collectively “repurchase”) in the event of a breach of contractual representations or warranties that is not remedied within a period (usually 90 days or less) after we receive notice of the breach. Our loan sale contracts to private investors (non-GSE) typically contain an additional provision where we would only be required to repurchase loans if any such breach is deemed to have a material and adverse effect on the value of the mortgage loan or to the interests of the investors or interests of security holders in the mortgage loan. The time periods specified in our mortgage loan sales contracts to respond to repurchase requests vary, but are generally 90 days or less. While many contracts do not include specific remedies if the applicable time period for a response is not met, contracts for mortgage loan sales to the GSEs include various types of specific remedies and penalties that could be applied to inadequate responses to repurchase requests. Similarly, the agreements under which we sell mortgage loans require us to deliver various documents to the securitization trust or investor, and we may be obligated to repurchase any mortgage loan for which the required documents are not delivered or are defective. In addition, as part of our representations and warranties in our loan sales contracts, we typically represent to GSEs and private investors that certain loans have mortgage insurance to the extent there are loans that have loan to value ratios in excess of 80% that require mortgage insurance. To the extent the mortgage insurance is rescinded by the mortgage insurer due to a claim of breach of a contractual representation or warranty, the lack of insurance may result in a repurchase demand from an investor. Upon receipt of a repurchase request or a mortgage insurance rescission, we work with securitization trusts, investors or insurers to arrive at a mutually agreeable resolution. Repurchase demands are typically reviewed on an individual loan by loan basis to validate the claims made by the securitization trust, investor or insurer, and to determine whether a contractually required repurchase event occurred. Occasionally, in lieu of conducting a loan level evaluation, we may negotiate global settlements in order to resolve a pipeline of demands in lieu of repurchasing the loans. We manage the risk associated with potential repurchases or other forms of settlement through our underwriting and quality assurance practices and by servicing mortgage loans to meet investor and secondary market standards.
We establish mortgage repurchase liabilities related to various representations and warranties that reflect management’s estimate of losses for loans for which we could have a repurchase obligation, whether or not we currently service those loans, based on a combination of factors. Such factors include default expectations, expected investor repurchase demands (influenced by current and expected mortgage loan file requests and mortgage insurance rescission notices, as well as estimated demand to default and file request relationships) and appeals success rates (where the investor rescinds the demand based on a cure of the defect or acknowledges that the loan satisfies the investor’s applicable representations and warranties), reimbursement by correspondent and other third party originators, and projected loss severity. We establish a
liability at the time loans are sold and continually update our liability estimate during the remaining life of such loans. Although investors may demand repurchase at any time and there is often a lag from the date of default to the time we receive a repurchase demand, the majority of repurchase demands occur on loans that default in the first 24 to 36 months following origination of the mortgage loan and can vary by investor. Most repurchases under our representation and warranty provisions are attributable to borrower misrepresentations and appraisals obtained at origination that investors believe do not fully comply with applicable industry standards.
To date, repurchase demands from private label MBS have been more limited than GSE-guaranteed securities; however, it is possible that requests to repurchase mortgage loans in private label securitizations may increase in frequency as investors explore every possible avenue to recover losses on their securities. We evaluate the validity and materiality of any claim of breach of representations and warranties in private label MBS that is brought to our attention and work with securitization trustees to resolve any repurchase requests. Nevertheless, we may be subject to legal and other expenses if private label securitization trustees or investors choose to commence legal proceedings in the event of disagreements. The mortgage loan repurchase liability at December 31, 2011, represents our best estimate of the probable loss that we may incur for various representations and warranties in the contractual provisions of our sales of mortgage loans. Because the level of mortgage loan repurchase losses are dependent on economic factors, investor demand strategies and other external conditions that may change over the life of the underlying loans, the level of the liability for mortgage loan repurchase losses is difficult to estimate and requires considerable management judgment. We maintain regular contact with the GSEs and other significant investors to monitor and address their repurchase demand practices and concerns. For additional information on our repurchase liability, including an adverse impact analysis, see the “Risk Management – Credit Risk Management – Liability for Mortgage Loan Repurchase Losses” section and Note 9 (Mortgage Banking Activities) to Financial Statements in this Report.
Fair Valuation of Financial Instruments We use fair value measurements to record fair value adjustments to certain financial instruments and to determine fair value disclosures. Trading assets, securities available for sale, derivatives, prime residential MHFS, certain commercial LHFS, certain loans held for investment, principal investments and securities sold but not yet purchased (short sale liabilities) are recorded at fair value on a recurring basis. Additionally, from time to time, we may be required to record at fair value other assets on a nonrecurring basis, such as certain MHFS and LHFS, loans held for investment and certain other assets. These nonrecurring fair value adjustments typically involve application of lower-of-cost-or-market accounting or write-downs of individual assets. Additionally, for financial instruments not recorded at fair value we disclose the estimate of their fair value.
Fair value represents the price that would be received to sell the financial asset or paid to transfer the financial liability in an
92
orderly transaction between market participants at the measurement date.
The accounting provisions for fair value measurements include a three-level hierarchy for disclosure of assets and liabilities recorded at fair value. The classification of assets and liabilities within the hierarchy is based on whether the inputs to the valuation methodology used for measurement are observable or unobservable. Observable inputs reflect market-derived or market-based information obtained from independent sources, while unobservable inputs reflect our estimates about market data. Level 1 – Valuation is based upon quoted prices for identical
instruments traded in active markets. Level 1 instruments include securities traded on active exchange markets, such as the New York Stock Exchange, as well as U.S. Treasury and other U.S. government securities that are traded by dealers or brokers in active OTC markets.
Level 2 – Valuation is based upon quoted prices for similar instruments in active markets, quoted prices for identical or similar instruments in markets that are not active, and model-based valuation techniques, such as matrix pricing, for which all significant assumptions are observable in the market. Level 2 instruments include securities traded in functioning dealer or broker markets, plain-vanilla interest rate derivatives and MHFS that are valued based on prices for other mortgage whole loans with similar characteristics.
Level 3 – Valuation is generated primarily from model-based techniques that use significant assumptions not observable in the market. These unobservable assumptions reflect our own estimates of assumptions market participants would use in pricing the asset or liability. Valuation techniques include use of option pricing models, discounted cash flow models and similar techniques.
When developing fair value measurements, we maximize the use of observable inputs and minimize the use of unobservable inputs. When available, we use quoted prices in active markets to measure fair value. If quoted prices in active markets are not available, fair value measurement is based upon models that use primarily market-based or independently sourced market parameters, including interest rate yield curves, prepayment speeds, option volatilities and currency rates. However, in certain cases, when market observable inputs for model-based valuation techniques are not readily available, we are required to make judgments about assumptions market participants would use to estimate the fair value.
The degree of management judgment involved in determining the fair value of a financial instrument is dependent upon the availability of quoted prices in active markets or observable market parameters. For financial instruments with quoted market prices or observable market parameters in active markets, there is minimal subjectivity involved in measuring fair value. When quoted prices and observable data in active markets are not fully available, management judgment is necessary to estimate fair value. Changes in the market conditions, such as reduced liquidity in the capital markets or changes in secondary market activities, may reduce the availability and reliability of quoted prices or observable data used to determine fair value. When significant adjustments are required to price quotes or
inputs, it may be appropriate to utilize an estimate based primarily on unobservable inputs. When an active market for a financial instrument does not exist, the use of management estimates that incorporate current market participant expectations of future cash flows, adjusted for an appropriate risk premium, is acceptable.
When markets for our financial assets and liabilities become inactive because the level and volume of activity has declined significantly relative to normal conditions, it may be appropriate to adjust quoted prices. The methodology we use to adjust the quoted prices generally involves weighting the quoted prices and results of internal pricing techniques, such as the net present value of future expected cash flows (with observable inputs, where available) discounted at a rate of return market participants require to arrive at the fair value. The more active and orderly markets for particular security classes are determined to be, the more weighting we assign to quoted prices. The less active and orderly markets are determined to be, the less weighting we assign to quoted prices.
We may use independent pricing services and brokers (collectively, “pricing vendors”) to obtain fair values (“vendor prices”) which are used to either record the price of an instrument or to corroborate internally developed prices. For certain securities, we may use internal traders to price instruments. Where vendor prices are utilized for recording the price of an instrument, we determine the most appropriate and relevant pricing vendor for each security class and obtain a price from that particular pricing vendor for each security.
Determination of the fair value of financial instruments using either vendor prices or internally developed prices are both subject to our internal price validation procedures, which include, but are not limited to, one or a combination of the following procedures: comparison to pricing vendors (for internally developed
prices) or to other pricing vendors (for vendor developed prices);
variance analysis of prices; corroboration of pricing by reference to other independent
market data such as secondary broker quotes and relevant benchmark indices;
review of pricing by Company personnel familiar with market liquidity and other market-related conditions; and
investigation of prices on a specific instrument-by-instrument basis.
For instruments where we utilize vendor prices to record the price of an instrument, we perform additional procedures. We evaluate pricing vendors by comparing prices from one vendor to prices of other vendors for identical or similar instruments and evaluate the consistency of prices to known market transactions when determining the level of reliance to be placed on a particular pricing vendor. Methodologies employed and inputs used by independent pricing vendors are subject to additional review when such services are provided. This review may consist of, in part, obtaining and evaluating control reports issued and pricing methodology materials distributed.
Significant judgment is required to determine whether certain assets measured at fair value are included in Level 2 or Level 3. When making this judgment, we consider all available
93
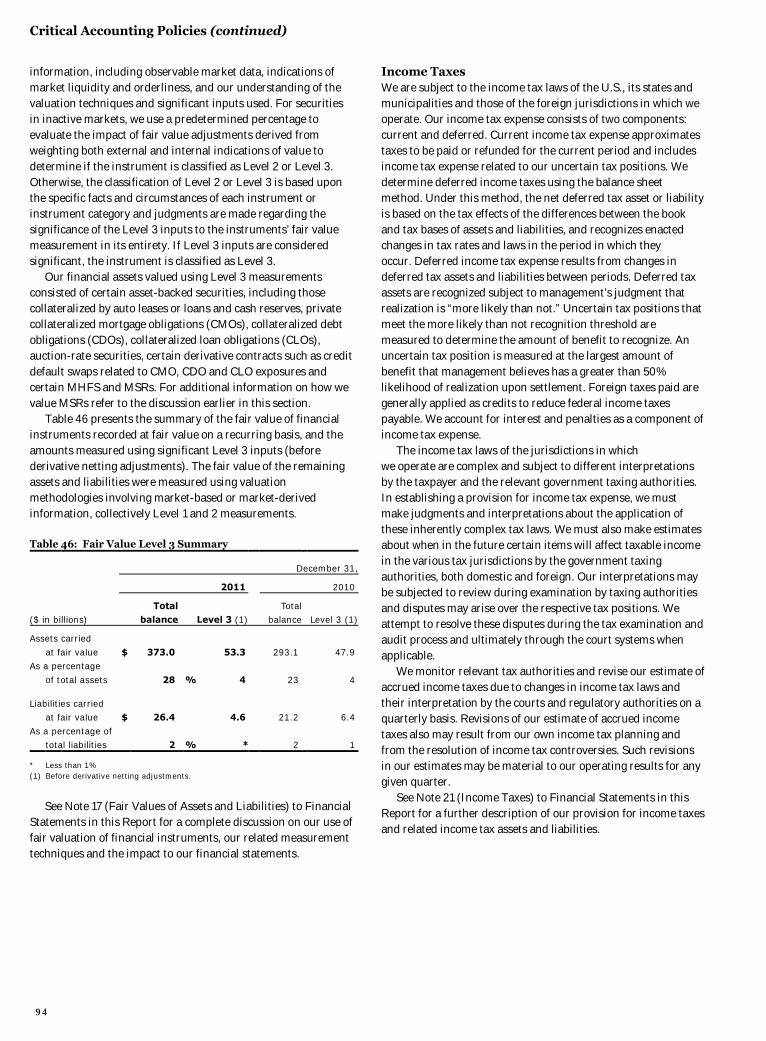
Critical Accounting Policies (continued)
information, including observable market data, indications of market liquidity and orderliness, and our understanding of the valuation techniques and significant inputs used. For securities in inactive markets, we use a predetermined percentage to evaluate the impact of fair value adjustments derived from weighting both external and internal indications of value to determine if the instrument is classified as Level 2 or Level 3. Otherwise, the classification of Level 2 or Level 3 is based upon the specific facts and circumstances of each instrument or instrument category and judgments are made regarding the significance of the Level 3 inputs to the instruments’ fair value measurement in its entirety. If Level 3 inputs are considered significant, the instrument is classified as Level 3.
Our financial assets valued using Level 3 measurements consisted of certain asset-backed securities, including those collateralized by auto leases or loans and cash reserves, private collateralized mortgage obligations (CMOs), collateralized debt obligations (CDOs), collateralized loan obligations (CLOs), auction-rate securities, certain derivative contracts such as credit default swaps related to CMO, CDO and CLO exposures and certain MHFS and MSRs. For additional information on how we value MSRs refer to the discussion earlier in this section.
Table 46 presents the summary of the fair value of financial instruments recorded at fair value on a recurring basis, and the amounts measured using significant Level 3 inputs (before derivative netting adjustments). The fair value of the remaining assets and liabilities were measured using valuation methodologies involving market-based or market-derived information, collectively Level 1 and 2 measurements. Table 46: Fair Value Level 3 Summary
December 31,
2011 2010
Total Total ($ in billions) balance Level 3 (1) balance Level 3 (1)
Assets carried
at fair value $ 373.0 53.3 293.1 47.9 As a percentage
of total assets 28 % 4 23 4 Liabilities carried at fair value $ 26.4 4.6 21.2 6.4
As a percentage of total liabilities 2 % * 2 1
* Less than 1% (1) Before derivative netting adjustments.
See Note 17 (Fair Values of Assets and Liabilities) to Financial Statements in this Report for a complete discussion on our use of fair valuation of financial instruments, our related measurement techniques and the impact to our financial statements.
Income Taxes We are subject to the income tax laws of the U.S., its states and municipalities and those of the foreign jurisdictions in which we operate. Our income tax expense consists of two components: current and deferred. Current income tax expense approximates taxes to be paid or refunded for the current period and includes income tax expense related to our uncertain tax positions. We determine deferred income taxes using the balance sheet method. Under this method, the net deferred tax asset or liability is based on the tax effects of the differences between the book and tax bases of assets and liabilities, and recognizes enacted changes in tax rates and laws in the period in which they occur. Deferred income tax expense results from changes in deferred tax assets and liabilities between periods. Deferred tax assets are recognized subject to management’s judgment that realization is “more likely than not.” Uncertain tax positions that meet the more likely than not recognition threshold are measured to determine the amount of benefit to recognize. An uncertain tax position is measured at the largest amount of benefit that management believes has a greater than 50% likelihood of realization upon settlement. Foreign taxes paid are generally applied as credits to reduce federal income taxes payable. We account for interest and penalties as a component of income tax expense.
The income tax laws of the jurisdictions in which we operate are complex and subject to different interpretations by the taxpayer and the relevant government taxing authorities. In establishing a provision for income tax expense, we must make judgments and interpretations about the application of these inherently complex tax laws. We must also make estimates about when in the future certain items will affect taxable income in the various tax jurisdictions by the government taxing authorities, both domestic and foreign. Our interpretations may be subjected to review during examination by taxing authorities and disputes may arise over the respective tax positions. We attempt to resolve these disputes during the tax examination and audit process and ultimately through the court systems when applicable.
We monitor relevant tax authorities and revise our estimate of accrued income taxes due to changes in income tax laws and their interpretation by the courts and regulatory authorities on a quarterly basis. Revisions of our estimate of accrued income taxes also may result from our own income tax planning and from the resolution of income tax controversies. Such revisions in our estimates may be material to our operating results for any given quarter.
See Note 21 (Income Taxes) to Financial Statements in this Report for a further description of our provision for income taxes and related income tax assets and liabilities.
94
Current Accounting Developments
The following accounting pronouncements have been issued by the FASB but are not yet effective: Accounting Standards Update (ASU or Update) 2011-11,
Disclosures about Offsetting Assets and Liabilities; ASU 2011-05, Presentation of Comprehensive Income; ASU 2011-12, Deferral of the Effective Date for
Amendments to the Presentation of Reclassifications of Items Out of Accumulated Other Comprehensive Income in Accounting Standards Update No. 2011-05;
ASU 2011-04, Amendments to Achieve Common Fair Value Measurement and Disclosure Requirements in U.S. GAAP and IFRSs; and
ASU 2011-03, Reconsideration of Effective Control for Repurchase Agreements.
ASU 2011-11 expands the disclosure requirements for financial instruments and derivatives that may be offset in accordance with enforceable master netting agreements or similar arrangements. The disclosures are required regardless of whether the instruments have been offset (or netted) in the statement of financial position. Under ASU 2011-11, companies must describe the nature of offsetting arrangements and provide quantitative information about those agreements, including the gross and net amounts of financial instruments that are recognized in the statement of financial position. These changes are effective for us in first quarter 2013 with retrospective application. This Update will not affect our consolidated financial results since it amends only the disclosure requirements for offsetting financial instruments. ASU 2011-05 eliminates the option for companies to include the components of other comprehensive income in the statement of changes in stockholders’ equity. This Update requires entities to present the components of comprehensive income in either a single statement or in two separate statements, with the statement of other comprehensive income (OCI) immediately following the statement of income. This Update also requires companies to present amounts reclassified out of OCI and into net income on the face of the statement of income. In December 2011, the FASB issued ASU 2011-12, which defers indefinitely the requirement to present reclassification adjustments on the statement of income. The remaining provisions are effective for us in first quarter 2012 with retrospective application. Early adoption is permitted. This Update will not affect our consolidated financial results as it amends only the presentation of comprehensive income.
ASU 2011-04 modifies accounting guidance and expands existing disclosure requirements for fair value measurements. This Update clarifies how fair values should be measured for instruments classified in stockholders’ equity and under what circumstances premiums and discounts should be applied in fair value measurements. This Update also permits entities to measure fair value on a net basis for financial instruments that are managed based on net exposure to market risks and/or counterparty credit risk. ASU 2011-04 requires new disclosures for financial instruments classified as Level 3, including: 1) quantitative information about unobservable inputs used in measuring fair value, 2) qualitative discussion of the sensitivity of fair value measurements to changes in unobservable inputs, and 3) a description of valuation processes used. This Update also requires disclosure of fair value levels for financial instruments that are not recorded at fair value but for which fair value is required to be disclosed. This guidance is effective for us in first quarter 2012 with prospective application. Early adoption is not permitted. We will expand our fair value disclosures upon adoption of this Update, but we do not expect the measurement clarifications will have a material effect on our consolidated financial statements. ASU 2011-03 amends the criteria companies use to determine if repurchase and similar agreements should be accounted for as sales or financings. Specifically, this Update removes the criterion for transferors to have the ability to meet contractual obligations through collateral maintenance provisions, even if transferees fail to return transferred assets pursuant to the agreements. This Update is effective for us in first quarter 2012 with prospective application to new transactions and existing transactions modified on or after January 1, 2012. Early adoption is not permitted. We do not expect this Update will have a material effect on our consolidated financial statements.
95
Forward-Looking Statements
This Report contains “forward-looking statements” within the meaning of the Private Securities Litigation Reform Act of 1995. Forward-looking statements can be identified by words such as “anticipates,” “intends,” “plans,” “seeks,” “believes,” “estimates,” “expects,” “target,” “projects,” “outlook,” “forecast,” “will,” “may,” “could,” “should,” “can” and similar references to future periods. Examples of forward-looking statements in this Report include, but are not limited to, statements we make about: (i) future results of the Company, including the potential effect of recent strong loan and deposit growth on future financial performance; (ii) our 2012 noninterest expense, including our targeted noninterest expense for fourth quarter 2012 as part of our expense management initiatives; (iii) future credit quality and expectations regarding future loan losses in our loan portfolios and life-of-loan estimates; our foreign loan exposure; the level and loss content of NPAs and nonaccrual loans; the adequacy of the allowance for credit losses, including our current expectation of future allowance releases in 2012; and the reduction or mitigation of risk in our loan portfolios and the effects of loan modification programs; (iv) our expectations regarding the completion of the remaining Wachovia integration activities; (v) future capital levels and our estimate regarding our Tier 1 common equity ratio under proposed Basel III capital standards as of December 31, 2011; (vi) the quality of our residential mortgage loan servicing portfolio, our mortgage repurchase exposure and exposure relating to our mortgage foreclosure practices; (vii) our expectations regarding the satisfaction of our obligations under our settlement in principle with the Department of Justice and other federal and state government entities related to our mortgage servicing and foreclosure practices, including our estimates of the impact of the settlement on our future financial results; (viii) the expected outcome and impact of legal, regulatory and legislative developments, including the Dodd-Frank Act and FRB restrictions on debit card interchange fees, including earnings expectations regarding mitigation efforts; and (ix) the Company’s plans, objectives and strategies, including our belief that we have more opportunity to increase cross-sell of our products.
Forward-looking statements are based on our current expectations and assumptions regarding our business, the economy and other future conditions. Because forward-looking statements relate to the future, they are subject to inherent uncertainties, risks and changes in circumstances that are difficult to predict. Our actual results may differ materially from those contemplated by the forward-looking statements. We caution you, therefore, against relying on any of these forward-looking statements. They are neither statements of historical fact nor guarantees or assurances of future performance. While there is no assurance that any list of risks and uncertainties or risk factors is complete, important factors that could cause actual results to differ materially from those in the forward-looking statements include the following, without limitation: current and future economic and market conditions,
including the effects of further declines in housing prices and high unemployment rates, U. S. fiscal debt and budget matters, and the sovereign debt crisis in Europe;
our capital and liquidity requirements (including under regulatory capital standards, such as the proposed Basel III capital standards, as determined and interpreted by applicable regulatory authorities) and our ability to generate capital internally or raise capital on favorable terms;
financial services reform and other current, pending or future legislation or regulation that could have a negative effect on our revenue and businesses, including the Dodd-Frank Act and legislation and regulation relating to overdraft fees (and changes to our overdraft practices as a result thereof), debit card interchange fees, credit cards, and other bank services, as well as the extent of our ability to offset the loss of revenue and income from financial services reform and other legislation and regulation;
the extent of our success in our loan modification efforts, as well as the effects of regulatory requirements or guidance regarding loan modifications or changes in such requirements or guidance;
the amount of mortgage loan repurchase demands that we receive and our ability to satisfy any such demands without having to repurchase loans related thereto or otherwise indemnify or reimburse third parties, and the credit quality of or losses on such repurchased mortgage loans;
negative effects relating to our mortgage servicing and foreclosure practices, including our ability to meet our obligations under the settlement in principle with the Department of Justice and other federal and state government entities, as well as changes in our procedures or practices and/or industry standards or practices, regulatory or judicial requirements, penalties or fines, increased servicing and other costs or obligations, including loan modification requirements, or delays or moratoriums on foreclosures;
our ability to realize our noninterest expense target as part of our expense management initiatives when and in the amount targeted, including as a result of business and economic cyclicality, seasonality, changes in our business composition and operating environment, growth in our businesses and/or acquisitions, and unexpected expenses relating to, among other things, litigation and regulatory matters;
our ability to successfully complete the remaining Wachovia integration activities, as well as realize all of the expected benefits of the Wachovia merger;
recognition of OTTI on securities held in our available-for-sale portfolio;
the effect of changes in interest rates on our net interest margin and our mortgage originations, MSRs and MHFS;
hedging gains or losses; disruptions in the capital markets and reduced investor
demand for mortgage loans; our ability to sell more products to our customers; the effect of a fall in stock market prices on our investment
banking business and our fee income from our brokerage, asset and wealth management businesses;
our election to provide support to our money market funds;
96
changes in the value of our venture capital investments; changes in our accounting policies or in accounting
standards or in how accounting standards are to be applied or interpreted;
mergers, acquisitions and divestitures; changes in the Company’s credit ratings and changes in the
credit quality of the Company’s customers or counterparties; reputational damage from negative publicity, protests, fines,
penalties and other negative consequences from regulatory violations and legal actions;
a failure in or breach of our operational or security systems or infrastructure, or those of our third party vendors and other service providers, including as a result of cyber attacks;
the loss of checking and savings account deposits to other investments such as the stock market, and the resulting increase in our funding costs and impact on our net interest margin;
fiscal and monetary policies of the FRB; and the other risk factors and uncertainties described under
“Risk Factors” in this Report.
In addition to the above factors, we also caution that there is no assurance that our allowance for credit losses will be adequate to cover future credit losses, especially if housing prices decline and unemployment worsens. Increases in loan charge-offs or in the allowance for credit losses and related provision expense could materially adversely affect our financial results and condition. Any forward-looking statement made by us in this Report speaks only as of the date on which it is made. Factors or events that could cause our actual results to differ may emerge from time to time, and it is not possible for us to predict all of them. We undertake no obligation to publicly update any forward-looking statement, whether as a result of new information, future developments or otherwise, except as may be required by law.
Risk Factors
An investment in the Company involves risk, including the possibility that the value of the investment could fall substantially and that dividends or other distributions on the investment could be reduced or eliminated. We discuss below and elsewhere in this Report, including under “Forward-Looking Statements” and in our 2011 Form 10-K, as well as in other documents we file with the SEC, risk factors that could adversely affect our financial results and condition and the value of, and return on, an investment in the Company. There may be other factors not discussed below or elsewhere in this Report or in our 2011 Form 10-K that could adversely affect our financial results and condition.
RISKS RELATED TO THE ECONOMY, FINANCIAL MARKETS, INTEREST
RATES AND LIQUIDITY
As one of the largest lenders in the U.S. and a provider of financial products and services to consumers and businesses across the U.S. and internationally, our financial results have been, and will continue to be, materially affected by general economic conditions, particularly unemployment levels and home prices in the U.S., and a deterioration in economic conditions or in the financial markets may materially adversely affect our lending and other businesses and our financial results and condition. We generate revenue from the interest and fees we charge on the loans and other products and services we sell, and a substantial amount of our revenue and earnings comes from the net interest income and fee income that we earn from our consumer and commercial lending and banking businesses, including our mortgage banking business where we currently are the largest mortgage originator in the U.S. These businesses have been, and will continue to be, materially affected by the state of the U.S. economy, particularly unemployment
levels and home prices. Although the U.S. economy has continued to gradually improve from the levels of 2008 and early 2009, economic growth has been slow and uneven and the housing market remains weak. In addition, the negative effects and continued uncertainty stemming from the sovereign debt crisis and economic difficulties in Europe and U. S. fiscal and political matters, including concerns about deficit reduction and U.S. debt ratings, have impacted and may continue to impact the continuing global economic recovery. A prolonged period of slow growth in the global economy, particularly in the U.S., or any deterioration in general economic conditions and/or the financial markets resulting from the above matters or any other events or factors that may disrupt or dampen the global economic recovery, could materially adversely affect our financial results and condition. The high unemployment rate in the U.S., together with high levels of unsold housing inventory and distressed property sales and the significant decline in home prices across the U.S., including in many of our large banking markets such as California and Florida, has resulted in elevated credit costs and nonperforming asset levels, which have adversely affected our credit performance and our financial results and condition. If unemployment levels worsen or if home prices continue to fall we would expect to incur higher than normal charge-offs and provision expense from increases in our allowance for credit losses. These conditions may adversely affect not only consumer loan performance but also commercial and CRE loans, especially for those business borrowers that rely on the health of industries that may experience deteriorating economic conditions. The ability of these and other borrowers to repay their loans may be hurt, causing us, as one of the largest commercial lenders and the largest CRE lender in the U.S., to incur significantly higher credit losses. In addition, weak or deteriorating economic conditions make it more challenging for us to increase our consumer and
97
Risk Factors (continued)
commercial loan portfolios by making loans to creditworthy borrowers at attractive yields. Although we have significant capacity to add loans to our balance sheet and there have been some early signs of increased borrower activity, loan demand, especially consumer loan demand, has been soft resulting in our retaining a much higher amount of lower yielding liquid assets on our balance sheet. If economic conditions do not continue to improve or if the economy worsens and unemployment rises, which also would likely result in a decrease in consumer and business confidence and spending, the demand for our credit products, including our mortgages, may fall, reducing our interest and fee income and our earnings.
A deterioration in business and economic conditions, which may erode consumer and investor confidence levels, and/or increased volatility of financial markets, also could adversely affect financial results for our fee-based businesses, including our investment advisory, mutual fund, securities brokerage, wealth management, and investment banking businesses. As a result of the Wachovia merger, a greater percentage of our revenue depends on our fee income from these businesses. We earn fee income from managing assets for others and providing brokerage and other investment advisory and wealth management services. Because investment management fees are often based on the value of assets under management, a fall in the market prices of those assets could reduce our fee income. Changes in stock market prices could affect the trading activity of investors, reducing commissions and other fees we earn from our brokerage business. Poor economic conditions and volatile or unstable financial markets also can negatively affect our debt and equity underwriting and advisory businesses, as well as our trading and venture capital businesses. Extreme market volatility also could cause us to elect to provide capital support to our money market funds, which would reduce our earnings. Our acquisition of Wachovia expanded our international businesses, particularly our global financial institution and correspondent banking services, and any deterioration in global financial markets and economies, including as a result of Europe’s sovereign debt crisis or any international political unrest or disturbances, may adversely affect the revenues and earnings of these and other businesses.
For more information, refer to the “Risk Management – Asset/Liability Management” and “– Credit Risk Management” sections in this Report. Changes in interest rates and financial market values could reduce our net interest income and earnings, including as a result of recognizing losses or OTTI on the securities that we hold in our portfolio or trade for our customers. Our net interest income is the interest we earn on loans, debt securities and other assets we hold less the interest we pay on our deposits, long-term and short-term debt, and other liabilities. Net interest income is a measure of both our net interest margin – the difference between the yield we earn on our assets and the interest rate we pay for deposits and our other sources of funding – and the amount of earning assets we hold. Changes in either our net interest margin or the amount or mix of earning assets we hold could affect our net interest income and our earnings. Changes in interest rates can affect our net
interest margin. Although the yield we earn on our assets and our funding costs tend to move in the same direction in response to changes in interest rates, one can rise or fall faster than the other, causing our net interest margin to expand or contract. Our liabilities tend to be shorter in duration than our assets, so they may adjust faster in response to changes in interest rates. When interest rates rise, our funding costs may rise faster than the yield we earn on our assets, causing our net interest margin to contract until the asset yield increases.
The amount and type of earning assets we hold can affect our yield and net interest margin. We hold earning assets in the form of loans and investment securities, among other assets. As noted above, if the economy remains weak or worsens we may see lower demand for loans by creditworthy customers, reducing our net interest income and yield. In addition, our net interest income and net interest margin can be negatively affected by a prolonged low interest rate environment, which as noted below is currently being experienced as a result of economic conditions and FRB monetary policies, as it may result in us holding lower yielding loans and securities on our balance sheet, particularly if we are unable to replace the maturing higher yielding assets on our balance sheet, including the loans in our non-strategic and liquidating loan portfolio, with similar higher yielding assets. Increases in interest rates, however, may negatively affect loan demand and could result in higher credit losses as borrowers may have more difficulty making higher interest payments. As described below, changes in interest rates also affect our mortgage business, including the value of our MSRs.
Changes in the slope of the “yield curve” – or the spread between short-term and long-term interest rates – could also reduce our net interest margin. Normally, the yield curve is upward sloping, meaning short-term rates are lower than long-term rates. Because our liabilities tend to be shorter in duration than our assets, when the yield curve flattens, as is the case in the current interest rate environment, or even inverts, our net interest margin could decrease as our cost of funds increases relative to the yield we can earn on our assets.
The interest we earn on our loans may be tied to U.S.-denominated interest rates such as the federal funds rate while the interest we pay on our debt may be based on international rates such as LIBOR. If the federal funds rate were to fall without a corresponding decrease in LIBOR, we might earn less on our loans without any offsetting decrease in our funding costs. This could lower our net interest margin and our net interest income.
We assess our interest rate risk by estimating the effect on our earnings under various scenarios that differ based on assumptions about the direction, magnitude and speed of interest rate changes and the slope of the yield curve. We hedge some of that interest rate risk with interest rate derivatives. We also rely on the “natural hedge” that our mortgage loan originations and servicing rights can provide.
We may not hedge all of our interest rate risk. There is always the risk that changes in interest rates could reduce our net interest income and our earnings in material amounts, especially if actual conditions turn out to be materially different than what we assumed. For example, if interest rates rise or fall faster than we assumed or the slope of the yield curve changes, we may incur significant losses on debt securities we hold as investments. To
98

reduce our interest rate risk, we may rebalance our investment and loan portfolios, refinance our debt and take other strategic actions. We may incur losses when we take such actions.
We hold securities in our available-for-sale portfolio, including U.S. Treasury and federal agency securities and federal agency MBS, securities of U.S. states and political subdivisions, residential and commercial MBS, corporate debt securities, and marketable equity securities, including securities relating to our venture capital activities. We analyze securities held in our available-for-sale portfolio for OTTI on at least a quarterly basis. The process for determining whether impairment is other than temporary usually requires difficult, subjective judgments about the future financial performance of the issuer and any collateral underlying the security in order to assess the probability of receiving contractual principal and interest payments on the security. Because of changing economic and market conditions, as well as credit ratings, affecting issuers and the performance of the underlying collateral, we may be required to recognize OTTI in future periods, thus reducing earnings. Our net income also is exposed to changes in interest rates, credit spreads, foreign exchange rates, equity and commodity prices in connection with our trading activities, which are conducted primarily to accommodate our customers in the management of their market price risk, as well as when we take positions based on market expectations or to benefit from differences between financial instruments and markets. The securities held in these activities are carried at fair value with realized and unrealized gains and losses recorded in noninterest income. As part of our business to support our customers, we trade public securities and these securities also are subject to market fluctuations with gains and losses recognized in net income when realized and periodically include OTTI charges. Although we have processes in place to measure and monitor the risks associated with our trading activities, including stress testing and hedging strategies, there can be no assurance that our processes and strategies will be effective in avoiding losses that could have a material adverse effect on our results of operations.
Our venture capital business also is subject to market risk and can be volatile from quarter to quarter. Certain of our venture capital businesses are carried under the cost or equity method, and others (e.g., principal investments) are carried at fair value with unrealized gains and losses reflected in earnings. Our venture capital investments tend to be in technology and other volatile industries so the value of our public and private equity portfolios may fluctuate widely. Earnings from our venture capital investments may be volatile and hard to predict and may have a significant effect on our earnings from period to period. When, and if, we recognize gains may depend on a number of factors, including general economic and market conditions, the prospects of the companies in which we invest, when these companies go public, the size of our position relative to the public float, and whether we are subject to any resale restrictions.
Our venture capital investments could result in significant losses, either OTTI losses for those investments carried under the cost or equity method or mark-to-market losses for principal investments. Our assessment for OTTI is based on a number of factors, including the then current market value of each
investment compared with its carrying value. If we determine there is OTTI for an investment, we write-down the carrying value of the investment, resulting in a charge to earnings. The amount of this charge could be significant. Further, our principal investing portfolio could incur significant mark-to-market losses especially if the carrying value of these investments has increased because of higher market prices. For more information, refer to the “Risk Management – Asset/Liability Management – Interest Rate Risk”, “– Market Risk – Equity Markets”, and “– Market Risk – Trading Activities” and the “Balance Sheet Analysis – Securities Available for Sale” sections in this Report and Note 5 (Securities Available for Sale) to Financial Statements in this Report. Effective liquidity management, which ensures that we can meet customer loan requests, customer deposit maturities/withdrawals and other cash commitments efficiently under both normal operating conditions and other unpredictable circumstances of industry or financial market stress, is essential for the operation of our business, and our financial results and condition could be materially adversely affected if we do not effectively manage our liquidity. Our liquidity is essential for the operation of our business. We primarily rely on bank deposits to be a low cost and stable source of funding for the loans we make and the operation of our business. Core customer deposits, which include noninterest-bearing deposits, interest-bearing checking, savings certificates, certain market rate and other savings, and certain foreign deposits, have historically provided us with a sizeable source of relatively stable and low-cost funds. In addition to customer deposits, our sources of liquidity include investments in our securities portfolio, our ability to sell or securitize loans in secondary markets and to pledge loans to access secured borrowing facilities through the FHLB and the FRB, and our ability to raise funds in domestic and international money and capital markets. Our liquidity and our ability to fund and run our business could be materially adversely affected by a variety of conditions and factors, including financial and credit market disruption and volatility or a lack of market or customer confidence in financial markets in general similar to what occurred during the financial crisis in 2008 and early 2009, which may result in a loss of customer deposits or outflows of cash or collateral and/or our inability to access capital markets on favorable terms. Market disruption and volatility could impact our credit spreads, which are the amount in excess of the interest rate of U.S. Treasury securities, or other benchmark securities, of the same maturity that we need to pay to our funding providers. Increases in interest rates and our credit spreads could significantly increase our funding costs. Other conditions and factors that could materially adversely affect our liquidity and funding include a lack of market or customer confidence in the Company or negative news about the Company or the financial services industry generally which also may result in a loss of deposits and/or negatively affect our ability to access the capital markets; our inability to sell or securitize loans or other assets, and, as described below, reductions in one or more of our credit ratings. Many of the above conditions and factors may be caused by
99
Risk Factors (continued)
events over which we have little or no control. While market conditions have improved since the financial crisis, there can be no assurance that significant disruption and volatility in the financial markets will not occur in the future. For example, in the summer of 2011 concerns regarding the potential failure to raise the U.S. government debt limit and the eventual downgrade of U.S. government debt ratings caused uncertainty and volatility in financial markets. Although the U.S. debt limit was increased, a failure to raise the U.S. debt limit in the future and/or additional downgrades of the sovereign debt ratings of the U.S. government or the debt ratings of related institutions, agencies or instrumentalities, as well as other fiscal or political events could, in addition to causing economic and financial market disruptions, materially adversely affect the market value of the U.S. government securities that we hold, the availability of those securities as collateral for borrowing, and our ability to access capital markets on favorable terms, as well as have other material adverse effects on the operation of our business and our financial results and condition. As noted above, we rely heavily on bank deposits for our funding and liquidity. We compete with banks and other financial services companies for deposits. If our competitors raise the rates they pay on deposits our funding costs may increase, either because we raise our rates to avoid losing deposits or because we lose deposits and must rely on more expensive sources of funding. Higher funding costs reduce our net interest margin and net interest income. Checking and savings account balances and other forms of customer deposits may decrease when customers perceive alternative investments, such as the stock market, as providing a better risk/return tradeoff. When customers move money out of bank deposits and into other investments, we may lose a relatively low cost source of funds, increasing our funding costs and negatively affecting our liquidity. If we are unable to continue to fund our assets through customer bank deposits or access capital markets on favorable terms or if we suffer an increase in our borrowing costs or otherwise fail to manage our liquidity effectively, our liquidity, net interest margin, financial results and condition may be materially adversely affected. As we did during the financial crisis, we may also need to raise additional capital through the issuance of common stock, which could dilute the ownership of existing stockholders, or reduce or even eliminate our common stock dividend to preserve capital or in order to raise additional capital. For more information, refer to the “Risk Management – Asset/Liability Management” section in this Report.
Adverse changes in our credit ratings could have a material adverse effect on our liquidity, cash flows, financial results and condition. Our borrowing costs and ability to obtain funding are influenced by our credit ratings. Reductions in one or more of our credit ratings could adversely affect our ability to borrow funds and raise the costs of our borrowings substantially and could cause creditors and business counterparties to raise collateral requirements or take other actions that could adversely affect our ability to raise capital. Credit ratings and credit ratings agencies’ outlooks are based on
the ratings agencies’ analysis of many quantitative and qualitative factors, such as our capital adequacy, the level and quality of our earnings, rating agency assumptions regarding the probability and extent of federal financial assistance or support, and other rating agency specific criteria. In addition to credit ratings, our borrowing costs are affected by various other external factors, including market volatility and concerns or perceptions about the financial services industry generally. On September 21, 2011, Moody’s downgraded the long-term senior debt ratings of the Parent and Wells Fargo Bank, N.A. one notch to A2 and Aa3, respectively, based on its determination that, as a result of the Dodd-Frank Act, the U.S. government is less likely to support systemically important financial institutions, if needed, than during the financial crisis. The short-term debt ratings of the Parent and Wells Fargo Bank were affirmed at Prime-1. Moody’s also indicated that its outlook on the Parent’s and Wells Fargo Bank’s long-term senior debt ratings is negative based on the possibility that Moody’s may further reduce its assumptions about the likelihood of systemic support for systemically important financial institutions. On November 29, 2011, S&P lowered the long-term senior debt ratings of the Parent and Wells Fargo Bank one notch to A+ and AA-, respectively, following changes in S&P’s ratings criteria for the global banking industry. S&P also reduced the Parent’s short-term debt rating one notch to A-1, affirmed Wells Fargo Bank’s short-term debt rating at A-1+, and maintained a negative outlook on the Parent’s long-term debt reflecting the outlook on the U.S. sovereign rating in light of the amount of U.S. government support incorporated into our ratings. On July 15, 2011, Fitch Ratings affirmed both the Parent’s and Wells Fargo Bank’s long-term senior debt ratings and short-term debt ratings at AA- and F1+, respectively, and maintained a stable watch on those ratings. On March 29, 2011, DBRS confirmed both the Parent’s and Wells Fargo Bank’s long-term senior and short-term debt ratings, including the stable trend. There can be no assurance that we will maintain our current credit ratings. Although the availability and cost of funding are influenced by credit ratings, to date the Moody’s and S&P ratings downgrades described above have not adversely affected our ability to access the capital markets or fund our operations. While to date we do not believe there has been any meaningful change in our borrowing costs specifically relating to the ratings downgrades described above, there can be no assurance that more severe credit ratings downgrades in the future would not materially affect our ability to borrow funds and borrowing costs. Downgrades in our credit ratings also may trigger additional collateral or funding obligations which could negatively affect our liquidity, including as a result of credit-related contingent features in certain of our derivative contracts. The Moody’s and S&P ratings downgrades described above have not triggered, and additional one and two notch downgrades in those credit ratings would not be expected to trigger, a material increase in our collateral or funding obligations. However, in the event of a more severe credit rating downgrade of our long-term and short-term credit ratings, the increase in our collateral or funding obligations and the effect on our liquidity could be material. For information regarding additional collateral and funding obligations required of certain derivative instruments in the
100
event our credit ratings were to fall below investment grade, see Note 16 (Derivatives) to Financial Statements in this Report.
We rely on dividends from our subsidiaries for liquidity, and federal and state law can limit those dividends. Wells Fargo & Company, the parent holding company, is a separate and distinct legal entity from its subsidiaries. It receives a significant portion of its funding and liquidity from dividends and other distributions from its subsidiaries. We generally use these dividends and distributions, among other things, to pay dividends on our common and preferred stock and interest and principal on our debt. Federal and state laws limit the amount of dividends and distributions that our bank and some of our nonbank subsidiaries, including our broker-dealer subsidiaries, may pay to our parent holding company. Also, our right to participate in a distribution of assets upon a subsidiary’s liquidation or reorganization is subject to the prior claims of the subsidiary’s creditors.
For more information, refer to the “Regulation and Supervision – Dividend Restrictions” and “– Holding Company Structure” sections in our 2011 Form 10-K and to Note 3 (Cash, Loan and Dividend Restrictions) and Note 26 (Regulatory and Agency Capital Requirements) to Financial Statements in this Report.
RISKS RELATED TO FINANCIAL REGULATORY REFORM AND OTHER LEGISLATION AND REGULATIONS Enacted legislation and regulation, including the Dodd-Frank Act, as well as future legislation and/or regulation, could require us to change certain of our business practices, reduce our revenue and earnings, impose additional costs on us or otherwise adversely affect our business operations and/or competitive position. Our parent company, our subsidiary banks and many of our nonbank subsidiaries such as those related to our retail brokerage and mutual fund businesses, are subject to significant regulation under state and federal laws in the U.S., as well as the applicable laws of the various jurisdictions outside of the U.S. where we conduct business. These regulations protect depositors, federal deposit insurance funds, consumers, investors and the banking and financial system as a whole, not necessarily our stockholders. Economic, market and political conditions during the past few years have led to a significant amount of new legislation and regulation in the U.S. and abroad. These laws and regulations may affect the manner in which we do business and the products and services that we provide, affect or restrict our ability to compete in our current businesses or our ability to enter into or acquire new businesses, reduce or limit our revenue in businesses or impose additional fees, assessments or taxes on us, intensify the regulatory supervision of us and the financial services industry, and adversely affect our business operations or have other negative consequences. For example, in 2009 several legislative and regulatory initiatives were adopted that affected revenue in 2011 and will continue to affect our businesses and financial results, including FRB amendments to Regulation E, which affect the way we may
charge overdraft fees, and the enactment of the Credit Card Accountability Responsibility and Disclosure Act of 2009 (the Card Act), which affects our ability to change interest rates and assess certain fees on card accounts. We also implemented policy changes to help customers limit overdraft and returned item fees. The continuing impact of these laws and regulations on our future revenue could vary materially due to a variety of factors, including changes in customer behavior, economic conditions and other potential offsetting factors. On July 21, 2010, the Dodd-Frank Act, the most significant financial reform legislation since the 1930s, became law. The Dodd-Frank Act, among other things, (i) established the Financial Stability Oversight Council to monitor systemic risk posed by financial firms and imposes additional and enhanced FRB regulations, including capital and liquidity requirements, on certain large, interconnected bank holding companies such as Wells Fargo and systemically significant nonbanking firms intended to promote financial stability; (ii) creates a liquidation framework for the resolution of covered financial companies, the costs of which would be paid through assessments on surviving covered financial companies; (iii) makes significant changes to the structure of bank and bank holding company regulation and activities in a variety of areas, including prohibiting proprietary trading and private fund investment activities, subject to certain exceptions; (iv) creates a new framework for the regulation of over-the-counter derivatives and new regulations for the securitization market and strengthens the regulatory oversight of securities and capital markets by the SEC; (v) established the Consumer Financial Protection Bureau (CFPB) within the FRB, which has sweeping powers to administer and enforce a new federal regulatory framework of consumer financial regulation; (vi) may limit the existing pre-emption of state laws with respect to the application of such laws to national banks, makes federal pre-emption no longer applicable to operating subsidiaries of national banks, and gives state authorities, under certain circumstances, the ability to enforce state laws and federal consumer regulations against national banks; (vii) provides for increased regulation of residential mortgage activities; (viii) revised the FDIC's assessment base for deposit insurance by changing from an assessment base defined by deposit liabilities to a risk-based system based on total assets; (ix) phases out over three years beginning January 2013 the Tier 1 capital treatment of trust preferred securities; (x) permitted banks to pay interest on business checking accounts beginning on July 1, 2011; (xi) authorized the FRB under the Durbin Amendment to adopt regulations that limit debit card interchange fees received by debit card issuers; and (xii) includes several corporate governance and executive compensation provisions and requirements, including mandating an advisory stockholder vote on executive compensation.
The Dodd-Frank Act and many of its provisions became effective in July 2010 and July 2011. However, a number of its provisions still require extensive rulemaking, guidance, and interpretation by regulatory authorities. Accordingly, in many respects the ultimate impact of the Dodd-Frank Act and its effects on the U.S. financial system and the Company still remain uncertain. Nevertheless, the Dodd-Frank Act, including current and future rules implementing its provisions and the
101
Risk Factors (continued)
interpretation of those rules, could result in a loss of revenue, require us to change certain of our business practices, limit our ability to pursue certain business opportunities, increase our capital requirements and impose additional assessments and costs on us and otherwise adversely affect our business operations and have other negative consequences. For example, as a result of the FRB’s new rules limiting debit card interchange fees, our fourth quarter 2011 debit card interchange fees were reduced by $365 million (pre-tax). Although we expect to recapture a portion of our lost income over time through volume and product changes, there can be no assurance that we will be successful in our efforts to mitigate the negative impact to our financial results from the Durbin Amendment.
In addition, our consumer businesses, including our mortgage, credit card and other consumer lending and non-lending businesses, may be negatively affected by the activities of the CFPB, which has broad rulemaking powers and supervisory authority over consumer financial products and services. Although the full impact of the CFPB on our businesses is uncertain, the CFPB’s activities may increase our compliance costs and require changes in our business practices as a result of new regulations and requirements which could limit or negatively affect the products and services that we currently offer our customers. As a result of greater regulatory scrutiny of our consumer businesses, we also may become subject to more or expanded regulatory examinations and/or investigations, which also could result in increased costs and harm to our reputation in the event of a failure to comply with the increased regulatory requirements.
The Dodd-Frank Act’s proposed prohibitions or limitations on proprietary trading and private fund investment activities, known as the “Volcker Rule,” also may reduce our revenue and earnings, although proprietary trading has not been significant to our financial results. The Volcker Rule is subject to final rulemaking and interpretation, and the ultimate impact of the Volcker Rule on our investment activities, including our venture capital business, is uncertain. Other future regulatory initiatives that could significantly affect our business include proposals to reform the housing finance market in the United States. These proposals, among other things, consider winding down the GSEs and reducing or eliminating over time the role of the GSEs in guaranteeing mortgages and providing funding for mortgage loans, as well as the implementation of reforms relating to borrowers, lenders, and investors in the mortgage market, including reducing the maximum size of a loan that the GSEs can guarantee, phasing in a minimum down payment requirement for borrowers, improving underwriting standards, and increasing accountability and transparency in the securitization process. As recently proposed by the Obama administration, Congress also may consider the adoption of legislation to reform the mortgage financing market in an effort to assist borrowers experiencing difficulty in making mortgage payments or refinancing their mortgages. The extent and timing of any regulatory reform or the adoption of any legislation regarding the GSEs and/or the home mortgage market, as well as any effect on the Company’s business and financial results, are uncertain.
Any other future legislation and/or regulation, if adopted, also could significantly change our regulatory environment and increase our cost of doing business, limit the activities we may pursue or affect the competitive balance among banks, savings associations, credit unions, and other financial services companies, and have a material adverse effect on our financial results and condition. For more information, refer to the “Regulatory Reform” section in this Report and the “Regulation and Supervision” section in our 2011 Form 10-K.
Bank regulations, including Basel capital standards and FRB guidelines and rules, may require higher capital and liquidity levels, limiting our ability to pay common stock dividends, repurchase our common stock, invest in our business or provide loans to our customers. Federal banking regulators continually monitor the capital position of banks and bank holding companies. In December 2010, the Basel Committee on Bank Supervision finalized a set of international guidelines for determining regulatory capital known as Basel III. These guidelines are designed to address many of the weaknesses identified in the banking sector as contributing to the financial crisis of 2008 and 2009 by, among other things, increasing minimum capital requirements, increasing the quality of capital, increasing the risk coverage of the capital framework, and increasing standards for the supervisory review process and public disclosure. When fully phased in, the Basel III guidelines require bank holding companies to maintain a minimum ratio of Tier 1 common equity to risk-weighted assets of at least 7.0%. The Basel Committee also proposed certain liquidity coverage and funding ratios. In June 2011, the Basel Committee proposed additional Tier 1 common equity surcharge requirements for global systemically important banks ranging from 1.0% to 3.5% depending on the bank’s systemic importance to be determined based on certain factors. This new capital surcharge, which would be phased in beginning in January 2016 and become fully effective on January 1, 2019, would be in addition to the Basel III 7.0% Tier 1 common equity requirement proposed in December 2010. The Company has been identified as one of the initial 29 global systemically important banks that would be subject to the surcharge, but the surcharge amount has not yet been determined. The U.S. regulatory bodies are reviewing the final international standards, and the ultimate impact of the Basel III standards on our capital and liquidity will depend on such final rulemaking and regulatory interpretations of the rules as we, along with our regulatory authorities, apply the final rules during the implementation process. As part of its obligation to impose enhanced capital and risk-management standards on large financial firms pursuant to the Dodd-Frank Act, the FRB issued a final capital plan rule that became effective December 30, 2011. The final capital plan rule requires top-tier U.S. bank holding companies, including the Company, to submit annual capital plans for review and to obtain regulatory approval before making capital distributions. There can be no assurance that the FRB would respond favorably to the Company’s future capital plans. The FRB also recently proposed rules under the Dodd-Frank Act that will impose
102

enhanced prudential standards on large bank holding companies such as the Company, including enhanced capital, stress testing, and liquidity requirements. The Basel standards and FRB regulatory capital and liquidity requirements may limit or otherwise restrict how we utilize our capital, including common stock dividends and stock repurchases, and may require us to increase our capital and/or liquidity. Any requirement that we increase our regulatory capital, regulatory capital ratios or liquidity could require us to liquidate assets or otherwise change our business and/or investment plans, which may negatively affect our financial results. Although not currently anticipated, the proposed Basel capital requirements and/or our regulators may require us to raise additional capital in the future. Issuing additional common stock may dilute the ownership of existing stockholders.
For more information, refer to the “Capital Management” and “Regulatory Reform” sections in this Report and the “Regulation and Supervision” section of our 2011 Form 10-K.
FRB policies, including policies on interest rates, can significantly affect business and economic conditions and our financial results and condition. The FRB regulates the supply of money in the United States. Its policies determine in large part our cost of funds for lending and investing and the return we earn on those loans and investments, both of which affect our net interest income and net interest margin. The FRB’s interest rate policies also can materially affect the value of financial instruments we hold, such as debt securities and MSRs. In addition, its policies can affect our borrowers, potentially increasing the risk that they may fail to repay their loans. Changes in FRB policies are beyond our control and can be hard to predict. As a result of the FRB’s concerns regarding, among other things, continued slow economic growth and a weak housing market, the FRB recently indicated that it intends to keep the target range for the federal funds rate near zero at least through late 2014. The FRB also may increase its purchases of U.S. government and mortgage-backed securities or take other actions in an effort to reduce or maintain low long-term interest rates. As noted above, a declining or low interest rate environment and a flattening yield curve which may result from the FRB’s actions could negatively affect our net interest income and net interest margin as it may result in us holding lower yielding loans and investment securities on our balance sheet.
RISKS RELATED TO CREDIT AND OUR MORTGAGE BUSINESS
As one of the largest lenders in the U.S., increased credit risk, including as a result of a deterioration in economic conditions, could require us to increase our provision for credit losses and allowance for credit losses and could have a material adverse effect on our results of operations and financial condition. When we loan money or commit to loan money we incur credit risk, or the risk of losses if our borrowers do not repay their loans. As one of the largest lenders in the U.S., the credit performance of our loan portfolios significantly affects our financial results and condition. As noted above, if the current economic environment were to
deteriorate, more of our customers may have difficulty in repaying their loans or other obligations which could result in a higher level of credit losses and provision for credit losses. We reserve for credit losses by establishing an allowance through a charge to earnings. The amount of this allowance is based on our assessment of credit losses inherent in our loan portfolio (including unfunded credit commitments). The process for determining the amount of the allowance is critical to our financial results and condition. It requires difficult, subjective and complex judgments about the future, including forecasts of economic or market conditions that might impair the ability of our borrowers to repay their loans. We might increase the allowance because of changing economic conditions, including falling home prices and higher unemployment, or other factors. For example, changes in borrower behavior or the regulatory environment also could influence recognition of credit losses in the portfolio and our allowance for credit losses.
Reflecting the continued improved credit performance in our loan portfolios, our provision expense was $3.4 billion and $2.0 billion less than net charge-offs in 2011 and 2010, respectively, which had a positive effect on our earnings. Absent significant deterioration in the economy, we expect future allowance releases in 2012, although at more modest levels. While we believe that our allowance for credit losses was appropriate at December 31, 2011, there is no assurance that it will be sufficient to cover future credit losses, especially if housing and employment conditions worsen. In the event of significant deterioration in economic conditions, we may be required to build reserves in future periods, which would reduce our earnings.
For more information, refer to the “Risk Management – Credit Risk Management” and “Critical Accounting Policies – Allowance for Credit Losses” sections in this Report.
We may have more credit risk and higher credit losses to the extent our loans are concentrated by loan type, industry segment, borrower type, or location of the borrower or collateral. Our credit risk and credit losses can increase if our loans are concentrated to borrowers engaged in the same or similar activities or to borrowers who as a group may be uniquely or disproportionately affected by economic or market conditions. We experienced the effect of concentration risk in 2009 and 2010 when we incurred greater than expected losses in our home equity loan portfolio due to a housing slowdown and greater than expected deterioration in residential real estate values in many markets, including the Central Valley California market and several Southern California metropolitan statistical areas. As California is our largest banking state in terms of loans and deposits, continued deterioration in real estate values and underlying economic conditions in those markets or elsewhere in California could result in materially higher credit losses. As a result of the Wachovia merger, we have increased our exposure to California, as well as to Arizona and Florida, two states that have also suffered significant declines in home values, as well as significant declines in economic activity. Deterioration in economic conditions, housing conditions and real estate values in these states and generally across the country
103
Risk Factors (continued)
could result in materially higher credit losses, including for our home equity portfolio.
The Wachovia merger also increased our CRE exposure, particularly in California and Florida, and we are currently the largest CRE lender in the U.S. A deterioration in economic conditions that negatively affects the business performance of our CRE borrowers, including increases in interest rates and/or declines in commercial property values, could result in materially higher credit losses and have a material adverse effect on our financial results and condition.
The European debt crisis, which has resulted in deteriorating economic conditions in Europe and ratings agency downgrades of the sovereign debt ratings of several European countries, has increased foreign credit risk. Although our foreign loan exposure represented only approximately 5% of our total consolidated outstanding loans and 3% of our total assets at December 31, 2011, continued European economic difficulties could indirectly have a material adverse effect on our credit performance and results of operations and financial condition to the extent it negatively affects the U.S. economy and/or our borrowers who have foreign operations.
For more information, refer to the “Risk Management – Credit Risk Management” section and Note 6 (Loans and Allowance for Credit Losses) to Financial Statements in this Report.
We may incur losses on loans, securities and other acquired assets of Wachovia that are materially greater than reflected in our fair value adjustments. We accounted for the Wachovia merger under the purchase method of accounting, recording the acquired assets and liabilities of Wachovia at fair value. All PCI loans acquired in the merger were recorded at fair value based on the present value of their expected cash flows. We estimated cash flows using internal credit, interest rate and prepayment risk models using assumptions about matters that are inherently uncertain. We may not realize the estimated cash flows or fair value of these loans. In addition, although the difference between the pre-merger carrying value of the credit-impaired loans and their expected cash flows – the “nonaccretable difference” – is available to absorb future charge-offs, we may be required to increase our allowance for credit losses and related provision expense because of subsequent additional credit deterioration in these loans.
For more information, refer to the “Critical Accounting Policies – Purchased Credit-Impaired (PCI) Loans” and “Risk Management – Credit Risk Management” sections in this Report.
Our mortgage banking revenue can be volatile from quarter to quarter, including as a result of changes in interest rates and the value of our MSRs and MHFS, and we rely on the GSEs to purchase our conforming loans to reduce our credit risk and provide liquidity to fund new mortgage loans. We were the largest mortgage originator and residential mortgage servicer in the U.S. as of December 31, 2011, and we earn revenue from fees we receive for originating mortgage loans and for servicing mortgage loans. As a result of our mortgage servicing business, we have a sizeable
portfolio of MSRs. An MSR is the right to service a mortgage loan – collect principal, interest and escrow amounts – for a fee. We acquire MSRs when we keep the servicing rights after we sell or securitize the loans we have originated or when we purchase the servicing rights to mortgage loans originated by other lenders. We initially measure and carry substantially all our residential MSRs using the fair value measurement method. Fair value is the present value of estimated future net servicing income, calculated based on a number of variables, including assumptions about the likelihood of prepayment by borrowers. Changes in interest rates can affect prepayment assumptions and thus fair value. When interest rates fall, borrowers are usually more likely to prepay their mortgage loans by refinancing them at a lower rate. As the likelihood of prepayment increases, the fair value of our MSRs can decrease. Each quarter we evaluate the fair value of our MSRs, and any decrease in fair value reduces earnings in the period in which the decrease occurs. We also measure at fair value prime MHFS for which an active secondary market and readily available market prices exist. In addition, we measure at fair value certain other interests we hold related to residential loan sales and securitizations. Similar to other interest-bearing securities, the value of these MHFS and other interests may be negatively affected by changes in interest rates. For example, if market interest rates increase relative to the yield on these MHFS and other interests, their fair value may fall.
When rates rise, the demand for mortgage loans usually tends to fall, reducing the revenue we receive from loan originations. Under the same conditions, revenue from our MSRs can increase through increases in fair value. When rates fall, mortgage originations usually tend to increase and the value of our MSRs usually tends to decline, also with some offsetting revenue effect. Even though they can act as a “natural hedge,” the hedge is not perfect, either in amount or timing. For example, the negative effect on revenue from a decrease in the fair value of residential MSRs is generally immediate, but any offsetting revenue benefit from more originations and the MSRs relating to the new loans would generally accrue over time. It is also possible that, because of economic conditions and/or a weak or deteriorating housing market similar to current market conditions, even if interest rates were to fall or remain low, mortgage originations may also fall or any increase in mortgage originations may not be enough to offset the decrease in the MSRs value caused by the lower rates.
We typically use derivatives and other instruments to hedge our mortgage banking interest rate risk. We generally do not hedge all of our risk, and we may not be successful in hedging any of the risk. Hedging is a complex process, requiring sophisticated models and constant monitoring, and is not a perfect science. We may use hedging instruments tied to U.S. Treasury rates, LIBOR or Eurodollars that may not perfectly correlate with the value or income being hedged. We could incur significant losses from our hedging activities. There may be periods where we elect not to use derivatives and other instruments to hedge mortgage banking interest rate risk.
We sell most of the mortgage loans we originate in order to reduce our credit risk and provide funding for additional loans. We rely on GSEs to purchase loans that meet their conforming loan requirements and on other capital markets investors to
104
purchase loans that do not meet those requirements – referred to as “nonconforming” loans. During the past few years investor demand for nonconforming loans has fallen sharply, increasing credit spreads and reducing the liquidity for those loans. In response to the reduced liquidity in the capital markets, we may retain more nonconforming loans. When we retain a loan not only do we keep the credit risk of the loan but we also do not receive any sale proceeds that could be used to generate new loans. Continued lack of liquidity could limit our ability to fund – and thus originate – new mortgage loans, reducing the fees we earn from originating and servicing loans. In addition, we cannot assure that GSEs will not materially limit their purchases of conforming loans, including because of capital constraints, or change their criteria for conforming loans (e.g., maximum loan amount or borrower eligibility). Each of the GSEs is currently in conservatorship, with its primary regulator, the Federal Housing Agency acting as conservator. We cannot predict if, when or how the conservatorship will end, or any associated changes to the GSEs business structure and operations that could result. As noted above, there are various proposals to reform the housing finance market in the U.S., including the role of the GSEs in the housing finance market. The extent and timing of any such regulatory reform regarding the housing finance market and the GSEs, including whether the GSEs will continue to exist in their current form, as well as any effect on the Company’s business and financial results, are uncertain.
For more information, refer to the “Risk Management – Asset/Liability Management – Mortgage Banking Interest Rate and Market Risk” and “Critical Accounting Policies” sections in this Report.
We may be required to repurchase mortgage loans or reimburse investors and others as a result of breaches in contractual representations and warranties. We sell residential mortgage loans to various parties, including GSEs, SPEs that issue private label MBS, and other financial institutions that purchase mortgage loans for investment or private label securitization. We may also pool FHA-insured and VA-guaranteed mortgage loans which back securities guaranteed by GNMA. The agreements under which we sell mortgage loans and the insurance or guaranty agreements with the FHA and VA contain various representations and warranties regarding the origination and characteristics of the mortgage loans, including ownership of the loan, compliance with loan criteria set forth in the applicable agreement, validity of the lien securing the loan, absence of delinquent taxes or liens against the property securing the loan, and compliance with applicable origination laws. We may be required to repurchase mortgage loans, indemnify the securitization trust, investor or insurer, or reimburse the securitization trust, investor or insurer for credit losses incurred on loans in the event of a breach of contractual representations or warranties that is not remedied within a period (usually 90 days or less) after we receive notice of the breach. Contracts for mortgage loan sales to the GSEs include various types of specific remedies and penalties that could be applied to inadequate responses to repurchase requests. Similarly, the agreements under which we sell mortgage loans require us to deliver various documents to the securitization trust or investor,
and we may be obligated to repurchase any mortgage loan as to which the required documents are not delivered or are defective. We may negotiate global settlements in order to resolve a pipeline of demands in lieu of repurchasing the loans. We establish a mortgage repurchase liability related to the various representations and warranties that reflect management’s estimate of losses for loans which we have a repurchase obligation. Our mortgage purchase liability represents management’s best estimate of the probable loss that we may expect to incur for the representations and warranties in the contractual provisions of our sales of mortgage loans. Because the level of mortgage loan repurchase losses depends upon economic factors, investor demand strategies and other external conditions that may change over the life of the underlying loans, the level of the liability for mortgage loan repurchase losses is difficult to estimate and requires considerable management judgment. As a result of the uncertainty in the various estimates underlying the mortgage repurchase liability, there is a range of losses in excess of the recorded mortgage repurchase liability that are reasonably possible. The estimate of the range of possible loss for representations and warranties does not represent a probable loss, and is based on currently available information, significant judgment, and a number of assumptions that are subject to change. If economic conditions and the housing market do not improve or future investor repurchase demand and our success at appealing repurchase requests differ from past experience, we could continue to have increased repurchase obligations and increased loss severity on repurchases, requiring material additions to the repurchase liability. For more information, refer to the “Risk Management – Credit Risk Management – Liability for Mortgage Loan Repurchase Losses” section in this Report.
We may be terminated as a servicer or master servicer, be required to repurchase a mortgage loan or reimburse investors for credit losses on a mortgage loan, or incur costs, liabilities, fines and other sanctions if we fail to satisfy our servicing obligations, including our obligations with respect to mortgage loan foreclosure actions. We act as servicer and/or master servicer for mortgage loans included in securitizations and for unsecuritized mortgage loans owned by investors. As a servicer or master servicer for those loans we have certain contractual obligations to the securitization trusts, investors or other third parties, including, in our capacity as a servicer, foreclosing on defaulted mortgage loans or, to the extent consistent with the applicable securitization or other investor agreement, considering alternatives to foreclosure such as loan modifications or short sales and, in our capacity as a master servicer, overseeing the servicing of mortgage loans by the servicer. If we commit a material breach of our obligations as servicer or master servicer, we may be subject to termination if the breach is not cured within a specified period of time following notice, which can generally be given by the securitization trustee or a specified percentage of security holders, causing us to lose servicing income. In addition, we may be required to indemnify the securitization trustee against losses
105
Risk Factors (continued)
from any failure by us, as a servicer or master servicer, to perform our servicing obligations or any act or omission on our part that involves wilful misfeasance, bad faith or gross negligence. For certain investors and/or certain transactions, we may be contractually obligated to repurchase a mortgage loan or reimburse the investor for credit losses incurred on the loan as a remedy for servicing errors with respect to the loan. If we have increased repurchase obligations because of claims that we did not satisfy our obligations as a servicer or master servicer, or increased loss severity on such repurchases, we may have a significant reduction to net servicing income within mortgage banking noninterest income. We may incur costs if we are required to, or if we elect to, re-execute or re-file documents or take other action in our capacity as a servicer in connection with pending or completed foreclosures. We may incur litigation costs if the validity of a foreclosure action is challenged by a borrower. If a court were to overturn a foreclosure because of errors or deficiencies in the foreclosure process, we may have liability to the borrower and/or to any title insurer of the property sold in foreclosure if the required process was not followed. These costs and liabilities may not be legally or otherwise reimbursable to us, particularly to the extent they relate to securitized mortgage loans. In addition, if certain documents required for a foreclosure action are missing or defective, we could be obligated to cure the defect or repurchase the loan. We may incur liability to securitization investors relating to delays or deficiencies in our processing of mortgage assignments or other documents necessary to comply with state law governing foreclosures. The fair value of our MSRs may be negatively affected to the extent our servicing costs increase because of higher foreclosure costs. We may be subject to fines and other sanctions imposed by Federal or state regulators as a result of actual or perceived deficiencies in our foreclosure practices or in the foreclosure practices of other mortgage loan servicers. Any of these actions may harm our reputation or negatively affect our residential mortgage origination or servicing business. In April 2011, we entered into consent orders with the OCC and the FRB following a joint interagency horizontal examination of foreclosure processing at large mortgage servicers, including the Company. These orders incorporate remedial requirements for identified deficiencies and require the Company to, among other things, take certain actions with respect to our mortgage servicing and foreclosure operations, including submitting various action plans to ensure that our mortgage servicing and foreclosure operations comply with legal requirements, regulatory guidance and the consent orders. As noted above, any increase in our servicing costs from changes in our foreclosure and other servicing practices, including resulting from the consent orders, negatively affects the fair value of our MSRs. The consent orders did not provide for civil money penalties but both government entities reserved the ability to seek such penalties. On February 9, 2012, the OCC and the FRB announced that they had also imposed civil money penalties of $83 million and $85 million, respectively, related to the consent orders. These penalties will be satisfied through payments made under a separate simultaneous settlement in principle, announced on the same day, among the Department of Justice, a
task force of Attorneys General from 49 states, other government entities, the Company and four other mortgage servicers related to mortgage servicing and foreclosure practices. Under the settlement in principle, which is subject to the execution of a definitive agreement and court approval, the Company agreed to certain commitments totaling $5.3 billion involving, among other things, a commitment to provide $3.4 billion in aggregate consumer relief and assistance programs for qualified borrowers, including expanded first and second lien mortgage modifications that broaden the use of principal reduction to help customers achieve affordability, an expanded short sale program that includes waivers of deficiency balances, forgiveness of arrearages for unemployed borrowers, cash-for-keys payments to borrowers who voluntarily vacate properties, and “anti-blight” provisions designed to reduce the impact on communities of vacant properties, and an expanded first-lien refinance program commitment estimated to provide $900 million of aggregate payment relief to qualified borrowers over the life of the refinanced loans. In addition, the Company will be required to implement comprehensive servicing standards. As part of the settlement in principle, the Company was released from claims and allegations relating to servicing, modification and foreclosure practices; however, the settlement does not release the Company from any claims arising out of securitization activities, including representations made to investors respecting mortgage-backed securities; criminal claims; repurchase demands from the GSEs; and inquiries into MERS, among other items. Government agencies continue investigations of whether the Company may have violated fair lending or other laws and regulations relating to mortgage origination practices and whether the Company’s offering statements included adequate disclosure of the risks associated with mortgage-backed securities. These investigations, as well as any investigations or litigation relating to any of the Company’s mortgage servicing and foreclosure practices that are not covered or released by the settlement in principle or definitive agreement, could result in material fines, penalties, equitable remedies, or other enforcement actions. The Company’s payment and other customer relief obligations under the settlement in principle were accrued for or otherwise considered in our allowance for credit losses and in the nonaccretable difference relating to our purchased-credit-impaired residential mortgage portfolio as of December 31, 2011, and, therefore, are not expected to have a material adverse effect on our financial results. However, there can be no assurance that the settlement will not result in unexpected costs or developments that could materially adversely affect our mortgage business and/or our financial results. For example, we may be required to pay additional amounts under the settlement if we fail to satisfy our commitment requirements in a timely manner. Furthermore, there can be no assurance as to when or whether a definitive agreement regarding the settlement will be reached and finalized or that it will be on terms consistent with the settlement in principle.
For more information, refer to the “Risk Management – Liability for Mortgage Loan Repurchase Losses” and “– Risks Relating to Servicing Activities,” and “Critical Accounting Policies – Valuation of Residential Mortgage Servicing Rights”
106

sections and Note 14 (Guarantees) and Note 15 (Legal Actions) to Financial Statements in this Report. Financial difficulties or credit downgrades of mortgage and bond insurers may negatively affect our servicing and investment portfolios. Our servicing portfolio includes certain mortgage loans that carry some level of insurance from one or more mortgage insurance companies. To the extent that any of these companies experience financial difficulties or credit downgrades, we may be required, as servicer of the insured loan on behalf of the investor, to obtain replacement coverage with another provider, possibly at a higher cost than the coverage we would replace. We may be responsible for some or all of the incremental cost of the new coverage for certain loans depending on the terms of our servicing agreement with the investor and other circumstances, although we do not have an additional risk of repurchase loss associated with claim amounts for loans sold to third-party investors. Similarly, some of the mortgage loans we hold for investment or for sale carry mortgage insurance. If a mortgage insurer is unable to meet its credit obligations with respect to an insured loan, we might incur higher credit losses if replacement coverage is not obtained. For example, in October 2011, PMI Mortgage Insurance Co. (PMI), one of our providers of mortgage insurance, was seized by its regulator. We previously utilized PMI to provide mortgage insurance on certain loans originated and held in our portfolio and on loans originated and sold to third-party investors. We also hold a small amount of residential MBS, which are backed by mortgages with a limited amount of insurance provided by PMI. PMI has announced that it will pay 50% of insurance claim amounts in cash with the rest deferred. Although we do not expect PMI’s situation to have a material adverse effect on our financial results because of the limited amount of loans and securities held in our portfolios with PMI insurance support, we cannot be certain that any such future events involving one of our other mortgage insurance company providers will not materially adversely affect our mortgage business and/or financial results. We also have investments in municipal bonds that are guaranteed against loss by bond insurers. The value of these bonds and the payment of principal and interest on them may be negatively affected by financial difficulties or credit downgrades experienced by the bond insurers.
For more information, refer to the “Earnings Performance – Balance Sheet Analysis – Securities Available for Sale” and “Risk Management – Credit Risk Management– Liability for Mortgage Loan Repurchase Losses” sections in this Report. OPERATIONAL AND LEGAL RISK
A failure in or breach of our operational or security systems or infrastructure, or those of our third party vendors and other service providers, including as a result of cyber attacks, could disrupt our businesses, result in the disclosure or misuse of confidential or proprietary information, damage our reputation, increase our costs and cause losses. As a large financial institution that serves over 70 million customers through over 9,000 stores, 12,000 ATMs, the Internet and other distribution
channels across the U.S. and internationally, we depend on our ability to process, record and monitor a large number of customer transactions on a continuous basis. As our customer base and locations have expanded throughout the U.S. and internationally, and as customer, public and regulatory expectations regarding operational and information security have increased, our operational systems and infrastructure must continue to be safeguarded and monitored for potential failures, disruptions and breakdowns. Our business, financial, accounting, data processing systems or other operating systems and facilities may stop operating properly or become disabled or damaged as a result of a number of factors including events that are wholly or partially beyond our control. For example, there could be sudden increases in customer transaction volume; electrical or telecommunications outages; natural disasters such as earthquakes, tornados, and hurricanes; disease pandemics; events arising from local or larger scale political or social matters, including terrorist acts; and, as described below, cyber attacks. Although we have business continuity plans and other safeguards in place, our business operations may be adversely affected by significant and widespread disruption to our physical infrastructure or operating systems that support our businesses and customers. Information security risks for large financial institutions such as Wells Fargo have generally increased in recent years in part because of the proliferation of new technologies, the use of the Internet and telecommunications technologies to conduct financial transactions, and the increased sophistication and activities of organized crime, hackers, terrorists, activists, and other external parties. Those parties also may attempt to fraudulently induce employees, customers, or other users of our systems to disclose confidential information in order to gain access to our data or that of our customers. As noted above, our operations rely on the secure processing, transmission and storage of confidential information in our computer systems and networks. Our banking, brokerage, investment advisory, and capital markets businesses rely on our digital technologies, computer and email systems, software, and networks to conduct their operations. In addition, to access our products and services, our customers may use personal smartphones, tablet PC’s, and other mobile devices that are beyond our control systems. Although we believe we have robust information security procedures and controls, our technologies, systems, networks, and our customers’ devices may become the target of cyber attacks or information security breaches that could result in the unauthorized release, gathering, monitoring, misuse, loss or destruction of Wells Fargo’s or our customers’ confidential, proprietary and other information, or otherwise disrupt Wells Fargo’s or its customers’ or other third parties’ business operations. Third parties with which we do business or that facilitate our business activities, including exchanges, clearing houses, financial intermediaries or vendors that provide services or security solutions for our operations, could also be sources of operational and information security risk to us, including from breakdowns or failures of their own systems or capacity constraints.
107

Risk Factors (continued)
Although to date we have not experienced any material losses relating to cyber attacks or other information security breaches, there can be no assurance that we will not suffer such losses in the future. Our risk and exposure to these matters remains heightened because of, among other things, the evolving nature of these threats, the prominent size and scale of Wells Fargo and its role in the financial services industry, our plans to continue to implement our Internet banking and mobile banking channel strategies and develop additional remote connectivity solutions to serve our customers when and how they want to be served, our expanded geographic footprint and international presence, the outsourcing of some of our business operations, the continued uncertain global economic environment, and the remaining system and customer account conversions associated with our integration of Wachovia expected to be completed in first quarter 2012. As a result, cybersecurity and the continued development and enhancement of our controls, processes and practices designed to protect our systems, computers, software, data and networks from attack, damage or unauthorized access remain a priority for Wells Fargo. As cyber threats continue to evolve, we may be required to expend significant additional resources to continue to modify or enhance our protective measures or to investigate and remediate any information security vulnerabilities. Disruptions or failures in the physical infrastructure or operating systems that support our businesses and customers, or cyber attacks or security breaches of the networks, systems or devices that our customers use to access our products and services could result in customer attrition, financial losses, the inability of our customers to transact business with us, violations of applicable privacy and other laws, regulatory fines, penalties or intervention, reputational damage, reimbursement or other compensation costs, and/or additional compliance costs, any of which could materially adversely affect our results of operations or financial condition.
Our framework for managing risks may not be effective in mitigating risk and loss to us. Our risk management framework seeks to mitigate risk and loss to us. We have established processes and procedures intended to identify, measure, monitor, report and analyze the types of risk to which we are subject, including liquidity risk, credit risk, market risk, interest rate risk, operational risk, legal and compliance risk, and reputational risk, among others. However, as with any risk management framework, there are inherent limitations to our risk management strategies as there may exist, or develop in the future, risks that we have not appropriately anticipated or identified. For example, the recent financial and credit crisis and resulting regulatory reform highlighted both the importance and some of the limitations of managing unanticipated risks. If our risk management framework proves ineffective, we could suffer unexpected losses which could materially adversely affect our results of operations or financial condition.
We may incur fines, penalties and other negative consequences from regulatory violations, possibly even inadvertent or unintentional violations. We maintain systems and procedures designed to ensure that we comply with
applicable laws and regulations. However, some legal/regulatory frameworks provide for the imposition of fines or penalties for noncompliance even though the noncompliance was inadvertent or unintentional and even though there was in place at the time systems and procedures designed to ensure compliance. For example, we are subject to regulations issued by the Office of Foreign Assets Control (OFAC) that prohibit financial institutions from participating in the transfer of property belonging to the governments of certain foreign countries and designated nationals of those countries. OFAC may impose penalties for inadvertent or unintentional violations even if reasonable processes are in place to prevent the violations. There may be other negative consequences resulting from a finding of noncompliance, including restrictions on certain activities. Such a finding may also damage our reputation as described below and could restrict the ability of institutional investment managers to invest in our securities.
Negative publicity, including as a result of protests, could damage our reputation and business. Reputation risk, or the risk to our business, earnings and capital from negative public opinion, is inherent in our business and increased substantially because of the financial crisis and the increase in our size and profile in the financial services industry following our acquisition of Wachovia. The reputation of the financial services industry in general has been damaged as a result of the financial crisis and other matters affecting the financial services industry, and negative public opinion about the financial services industry generally or Wells Fargo specifically could adversely affect our ability to keep and attract customers. Negative public opinion could result from our actual or alleged conduct in any number of activities, including mortgage lending practices, servicing and foreclosure activities, corporate governance, regulatory compliance, mergers and acquisitions, and disclosure, sharing or inadequate protection of customer information, and from actions taken by government regulators and community or other organizations in response to that conduct. Because we conduct most of our businesses under the “Wells Fargo” brand, negative public opinion about one business could affect our other businesses and also could negatively affect our “cross-sell” strategy. The proliferation of social media websites utilized by Wells Fargo and other third parties, as well as the personal use of social media by our team members and others, including personal blogs and social network profiles, also may increase the risk that negative, inappropriate or unauthorized information may be posted or released publicly that could harm our reputation or have other negative consequences, including as a result of our team members interacting with our customers in an unauthorized manner in various social media outlets. During the past several months, Wells Fargo and other financial institutions have been the targets of numerous protests throughout the U.S., such as the “Occupy Wall Street” protests and other movements designed to cause customers to close their accounts with large financial institutions. These protests have included disrupting the operation of our retail banking stores and have resulted in negative public commentary about financial institutions, including the fees charged for various products and
108
services. There can be no assurance that continued protests and negative publicity for the Company or large financial institutions generally will not harm our reputation and adversely affect our business and financial results. Risks Relating to Legal Proceedings. Wells Fargo and some of its subsidiaries are involved in judicial, regulatory and arbitration proceedings or investigations concerning matters arising from our business activities. Although we believe we have a meritorious defense in all material significant litigation pending against us, there can be no assurance as to the ultimate outcome. We establish reserves for legal claims when payments associated with the claims become probable and the costs can be reasonably estimated. We may still incur legal costs for a matter even if we have not established a reserve. In addition, the actual cost of resolving a legal claim may be substantially higher than any amounts reserved for that matter. The ultimate resolution of a pending legal proceeding, depending on the remedy sought and granted, could materially adversely affect our results of operations and financial condition.
For more information, refer to Note 15 (Legal Actions) to Financial Statements in this Report. RISKS RELATED TO OUR INDUSTRY’S COMPETITIVE OPERATING ENVIRONMENT We face significant and increasing competition in the rapidly evolving financial services industry. We compete with other financial institutions in a highly competitive industry that is undergoing significant changes as a result of financial regulatory reform and increased public scrutiny stemming from the recent financial crisis and continued challenging economic conditions. Wells Fargo generally competes on the basis of the quality of our customer service, the wide variety of products and services that we can offer our customers and the ability of those products and services to satisfy our customers’ needs, the pricing of our products and services, the extensive distribution channels available for our customers, our innovation, and our reputation. Continued and increased competition in any one or all of these areas may negatively affect our market share and results of operations and/or cause us to increase our capital investment in our businesses in order to remain competitive. Given the current economic, regulatory, and political environment for large financial institutions such as Wells Fargo, as well as increased public protest movements and negative publicity, there is increased competitive pressure to provide products and services at current or lower prices. Consequently, our ability to reposition or reprice our products and services from time to time may be limited and could be influenced significantly by the actions of our competitors who may or may not charge similar fees for their products and services. Any changes in the types of products and services that we offer our customers and/or the pricing for those products and services could result in a loss of customers and market share and could materially adversely affect our results of operations. Continued technological advances and the growth of e-commerce have made it possible for non-depository institutions to offer products and services that traditionally were banking
products, and for financial institutions and other companies to provide electronic and internet-based financial solutions, including electronic payment solutions. We may not respond effectively to these competitive threats from existing and new competitors and may be forced to increase our investment in our business to modify or adapt our existing products and services or develop new products and services to respond to our customers’ needs. Our “cross-selling” efforts to increase the number of products our customers buy from us and offer them all of the financial products that fulfill their needs is a key part of our growth strategy, and our failure to execute this strategy effectively could have a material adverse effect on our revenue growth and financial results. Selling more products to our customers – “cross-selling” – is very important to our business model and key to our ability to grow revenue and earnings especially during the current environment of slow economic growth and regulatory reform initiatives. Many of our competitors also focus on cross-selling, especially in retail banking and mortgage lending. This can limit our ability to sell more products to our customers or influence us to sell our products at lower prices, reducing our net interest income and revenue from our fee-based products. It could also affect our ability to keep existing customers. New technologies could require us to spend more to modify or adapt our products to attract and retain customers. Our cross-sell strategy also is dependent on earning more business from our Wachovia customers, and increasing our cross-sell ratio – or the average number of products sold to existing customers – may become more challenging and we might not attain our goal of selling an average of eight products to each customer.
Our ability to attract and retain qualified team members is critical to the success of our business and failure to do so could adversely affect our business performance, competitive position and future prospects. The success of Wells Fargo is heavily dependent on the talents and efforts of our team members, and in many areas of our business, including the commercial banking, brokerage, investment advisory, and capital markets businesses, the competition for highly qualified personnel is intense. In order to attract and retain highly qualified team members, we must provide competitive compensation. As a large financial institution we may be subject to limitations on compensation by our regulators that may adversely affect our ability to attract and retain these qualified team members. Some of our competitors may not be subject to these same compensation limitations, which may further negatively affect our ability to attract and retain highly qualified team members.
RISKS RELATED TO OUR FINANCIAL STATEMENTS Changes in accounting policies or accounting standards, and changes in how accounting standards are interpreted or applied, could materially affect how we report our financial results and condition. Our accounting policies are fundamental to determining and
109
Risk Factors (continued)
understanding our financial results and condition. As described below, some of these policies require use of estimates and assumptions that may affect the value of our assets or liabilities and financial results. Any changes in our accounting policies could materially affect our financial statements.
From time to time the FASB and the SEC change the financial accounting and reporting standards that govern the preparation of our external financial statements. In addition, accounting standard setters and those who interpret the accounting standards (such as the FASB, SEC, banking regulators and our outside auditors) may change or even reverse their previous interpretations or positions on how these standards should be applied. Changes in financial accounting and reporting standards and changes in current interpretations may be beyond our control, can be hard to predict and could materially affect how we report our financial results and condition. We may be required to apply a new or revised standard retroactively or apply an existing standard differently, also retroactively, in each case resulting in our potentially restating prior period financial statements in material amounts.
Our financial statements are based in part on assumptions and estimates which, if wrong, could cause unexpected losses in the future, and our financial statements depend on our internal controls over financial reporting. Pursuant to U.S. GAAP, we are required to use certain assumptions and estimates in preparing our financial statements, including in determining credit loss reserves, reserves for mortgage repurchases, reserves related to litigation and the fair value of certain assets and liabilities, among other items. Several of our accounting policies are critical because they require management to make difficult, subjective and complex judgments about matters that are inherently uncertain and because it is likely that materially different amounts would be reported under different conditions or using different assumptions. For a description of these policies, refer to the “Critical Accounting Policies” section in this Report. If assumptions or estimates underlying our financial statements are incorrect, we may experience material losses.
Certain of our financial instruments, including trading assets and liabilities, available-for-sale securities, certain loans, MSRs, private equity investments, structured notes and certain repurchase and resale agreements, among other items, require a determination of their fair value in order to prepare our financial statements. Where quoted market prices are not available, we may make fair value determinations based on internally developed models or other means which ultimately rely to some degree on management judgment. Some of these and other assets and liabilities may have no direct observable price levels, making their valuation particularly subjective, being based on significant estimation and judgment. In addition, sudden illiquidity in markets or declines in prices of certain loans and securities may make it more difficult to value certain balance sheet items, which may lead to the possibility that such valuations will be subject to further change or adjustment and could lead to declines in our earnings.
The Sarbanes-Oxley Act of 2002 (Sarbanes-Oxley) requires our management to evaluate the Company’s disclosure controls
and procedures and its internal control over financial reporting and requires our auditors to issue a report on our internal control over financial reporting. We are required to disclose, in our annual report on Form 10-K, the existence of any “material weaknesses” in our internal controls. We cannot assure that we will not identify one or more material weaknesses as of the end of any given quarter or year, nor can we predict the effect on our stock price of disclosure of a material weakness. Sarbanes-Oxley also limits the types of non-audit services our outside auditors may provide to us in order to preserve their independence from us. If our auditors were found not to be “independent” of us under SEC rules, we could be required to engage new auditors and file financial statements and audit reports with the SEC. We could be out of compliance with SEC rules until new financial statements and audit reports were filed, limiting our ability to raise capital and resulting in other adverse consequences. RISKS RELATED TO ACQUISITIONS Acquisitions could reduce our stock price upon announcement and reduce our earnings if we overpay or have difficulty integrating them. We regularly explore opportunities to acquire companies in the financial services industry. We cannot predict the frequency, size or timing of our acquisitions, and we typically do not comment publicly on a possible acquisition until we have signed a definitive agreement. When we do announce an acquisition, our stock price may fall depending on the size of the acquisition, the type of business to be acquired, the purchase price, and the potential dilution to existing stockholders or our earnings per share if we issue common stock in connection with the acquisition.
We generally must receive federal regulatory approvals before we can acquire a bank, bank holding company or certain other financial services businesses depending on the size of the financial services business to be acquired. In deciding whether to approve a proposed acquisition, federal bank regulators will consider, among other factors, the effect of the acquisition on competition and the risk to the stability of the U.S. banking or financial system, our financial condition and future prospects including current and projected capital ratios and levels, the competence, experience, and integrity of management and record of compliance with laws and regulations, the convenience and needs of the communities to be served, including our record of compliance under the Community Reinvestment Act, and our effectiveness in combating money laundering. As a result of the Dodd-Frank Act and concerns regarding the large size of financial institutions such as Wells Fargo, the regulatory process for approving acquisitions has become more complex and regulatory approvals may be more difficult to obtain. We cannot be certain when or if, or on what terms and conditions, any required regulatory approvals will be granted. We might be required to sell banks, branches and/or business units or assets or issue additional equity as a condition to receiving regulatory approval for an acquisition. In addition, federal bank regulations prohibit FRB regulatory approval of any transaction that would create an institution holding more than 10% of total U.S. insured deposits, or of any transaction (whether or not subject to FRB approval) that would create a financial company with more than
110

10% of the liabilities of all financial companies in the U.S. We are approaching the deposit cap, which may limit our bank acquisition opportunities in the future.
Difficulty in integrating an acquired company may cause us not to realize expected revenue increases, cost savings, increases in geographic or product presence, and other projected benefits from the acquisition. The integration could result in higher than expected deposit attrition, loss of key team members, disruption of our business or the business of the acquired company, or otherwise harm our ability to retain customers and team members or achieve the anticipated benefits of the acquisition. Time and resources spent on integration may also impair our ability to grow our existing businesses. Also, the negative effect of any divestitures required by regulatory authorities in acquisitions or business combinations may be greater than expected. Many of the foregoing risks may be increased if the acquired company operates internationally or in a geographic location where we do not already have significant business operations and/or team members.
* * *
Any factor described in this Report or in any of our other
SEC filings could by itself, or together with other factors, adversely affect our financial results and condition. Refer to our quarterly reports on Form 10-Q filed with the SEC in 2012 for material changes to the above discussion of risk factors. There are factors not discussed above or elsewhere in this Report that could adversely affect our financial results and condition.
111
Controls and Procedures Disclosure Controls and Procedures
As required by SEC rules, the Company’s management evaluated the effectiveness, as of December 31, 2011, of the Company’s disclosure controls and procedures. The Company’s chief executive officer and chief financial officer participated in the evaluation. Based on this evaluation, the Company’s chief executive officer and chief financial officer concluded that the Company’s disclosure controls and procedures were effective as of December 31, 2011.
Internal Control Over Financial Reporting
Internal control over financial reporting is defined in Rule 13a-15(f) promulgated under the Securities Exchange Act of 1934 as a process designed by, or under the supervision of, the Company’s principal executive and principal financial officers and effected by the Company’s Board, management and other personnel, to provide reasonable assurance regarding the reliability of financial reporting and the preparation of financial statements for external purposes in accordance with U.S. generally accepted accounting principles (GAAP) and includes those policies and procedures that: pertain to the maintenance of records that in reasonable detail accurately and fairly reflect the transactions and dispositions of
assets of the Company; provide reasonable assurance that transactions are recorded as necessary to permit preparation of financial statements in
accordance with GAAP, and that receipts and expenditures of the Company are being made only in accordance with authorizations of management and directors of the Company; and
provide reasonable assurance regarding prevention or timely detection of unauthorized acquisition, use or disposition of the Company’s assets that could have a material effect on the financial statements.
Because of its inherent limitations, internal control over financial reporting may not prevent or detect misstatements. Projections of any evaluation of effectiveness to future periods are subject to the risk that controls may become inadequate because of changes in conditions, or that the degree of compliance with the policies or procedures may deteriorate. No change occurred during any quarter in 2011 that has materially affected, or is reasonably likely to materially affect, the Company’s internal control over financial reporting. Management’s report on internal control over financial reporting is set forth below, and should be read with these limitations in mind.
Management’s Report on Internal Control over Financial Reporting The Company’s management is responsible for establishing and maintaining adequate internal control over financial reporting for the Company. Management assessed the effectiveness of the Company’s internal control over financial reporting as of December 31, 2011, using the criteria set forth by the Committee of Sponsoring Organizations of the Treadway Commission (COSO) in Internal Control – Integrated Framework. Based on this assessment, management concluded that as of December 31, 2011, the Company’s internal control over financial reporting was effective.
KPMG LLP, the independent registered public accounting firm that audited the Company’s financial statements included in this Annual Report, issued an audit report on the Company’s internal control over financial reporting. KPMG’s audit report appears on the following page.
112
Report of Independent Registered Public Accounting Firm The Board of Directors and Stockholders Wells Fargo & Company: We have audited Wells Fargo & Company and Subsidiaries’ (the Company) internal control over financial reporting as of December 31, 2011, based on criteria established in Internal Control – Integrated Framework issued by the Committee of Sponsoring Organizations of the Treadway Commission (COSO). The Company’s management is responsible for maintaining effective internal control over financial reporting and for its assessment of the effectiveness of internal control over financial reporting, included in the accompanying Management’s Report on Internal Control over Financial Reporting. Our responsibility is to express an opinion on the Company’s internal control over financial reporting based on our audit. We conducted our audit in accordance with the standards of the Public Company Accounting Oversight Board (United States). Those standards require that we plan and perform the audit to obtain reasonable assurance about whether effective internal control over financial reporting was maintained in all material respects. Our audit included obtaining an understanding of internal control over financial reporting, assessing the risk that a material weakness exists, and testing and evaluating the design and operating effectiveness of internal control based on the assessed risk. Our audit also included performing such other procedures as we considered necessary in the circumstances. We believe that our audit provides a reasonable basis for our opinion. A company’s internal control over financial reporting is a process designed to provide reasonable assurance regarding the reliability of financial reporting and the preparation of financial statements for external purposes in accordance with generally accepted accounting principles. A company’s internal control over financial reporting includes those policies and procedures that (1) pertain to the maintenance of records that, in reasonable detail, accurately and fairly reflect the transactions and dispositions of the assets of the company; (2) provide reasonable assurance that transactions are recorded as necessary to permit preparation of financial statements in accordance with generally accepted accounting principles, and that receipts and expenditures of the company are being made only in accordance with authorizations of management and directors of the company; and (3) provide reasonable assurance regarding prevention or timely detection of unauthorized acquisition, use, or disposition of the company’s assets that could have a material effect on the financial statements. Because of its inherent limitations, internal control over financial reporting may not prevent or detect misstatements. Also, projections of any evaluation of effectiveness to future periods are subject to the risk that controls may become inadequate because of changes in conditions, or that the degree of compliance with the policies or procedures may deteriorate. In our opinion, the Company maintained, in all material respects, effective internal control over financial reporting as of December 31, 2011, based on criteria established in Internal Control – Integrated Framework issued by COSO. We also have audited, in accordance with the standards of the Public Company Accounting Oversight Board (United States), the consolidated balance sheet of the Company as of December 31, 2011 and 2010, and the related consolidated statements of income, changes in equity and comprehensive income, and cash flows for each of the years in the three-year period ended December 31, 2011, and our report dated February 28, 2012, expressed an unqualified opinion on those consolidated financial statements. San Francisco, California February 28, 2012
113
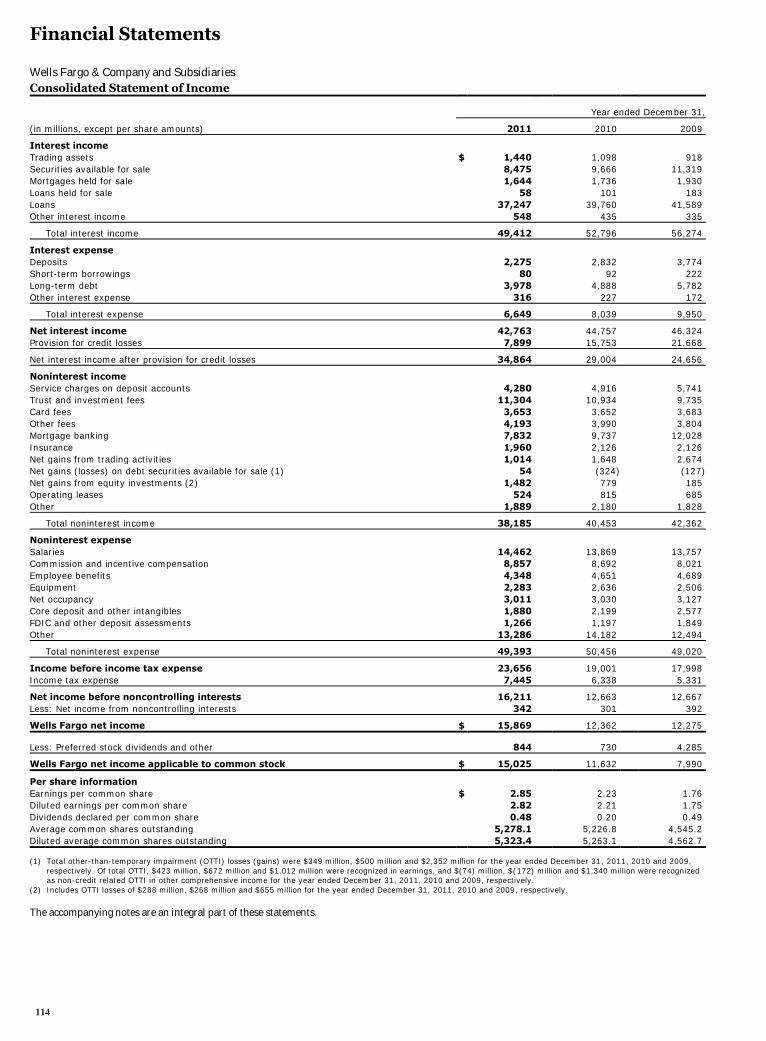
Financial Statements
Wells Fargo & Company and Subsidiaries Consolidated Statement of Income
Year ended December 31,
(in millions, except per share amounts) 2011 2010 2009
Interest income Trading assets $ 1,440 1,098 918 Securities available for sale 8,475 9,666 11,319 Mortgages held for sale 1,644 1,736 1,930 Loans held for sale 58 101 183 Loans 37,247 39,760 41,589 Other interest income 548 435 335
Total interest income 49,412 52,796 56,274
Interest expense Deposits 2,275 2,832 3,774 Short-term borrowings 80 92 222 Long-term debt 3,978 4,888 5,782 Other interest expense 316 227 172
Total interest expense 6,649 8,039 9,950
Net interest income 42,763 44,757 46,324 Provision for credit losses 7,899 15,753 21,668
Net interest income after provision for credit losses 34,864 29,004 24,656
Noninterest income Service charges on deposit accounts 4,280 4,916 5,741 Trust and investment fees 11,304 10,934 9,735 Card fees 3,653 3,652 3,683 Other fees 4,193 3,990 3,804 Mortgage banking 7,832 9,737 12,028 Insurance 1,960 2,126 2,126 Net gains from trading activities 1,014 1,648 2,674 Net gains (losses) on debt securities available for sale (1) 54 (324) (127) Net gains from equity investments (2) 1,482 779 185 Operating leases 524 815 685 Other 1,889 2,180 1,828
Total noninterest income 38,185 40,453 42,362
Noninterest expense Salaries 14,462 13,869 13,757 Commission and incentive compensation 8,857 8,692 8,021 Employee benefits 4,348 4,651 4,689 Equipment 2,283 2,636 2,506 Net occupancy 3,011 3,030 3,127 Core deposit and other intangibles 1,880 2,199 2,577 FDIC and other deposit assessments 1,266 1,197 1,849 Other 13,286 14,182 12,494
Total noninterest expense 49,393 50,456 49,020
Income before income tax expense 23,656 19,001 17,998 Income tax expense 7,445 6,338 5,331
Net income before noncontrolling interests 16,211 12,663 12,667 Less: Net income from noncontrolling interests 342 301 392
Wells Fargo net income $ 15,869 12,362 12,275
Less: Preferred stock dividends and other 844 730 4,285
Wells Fargo net income applicable to common stock $ 15,025 11,632 7,990
Per share information Earnings per common share $ 2.85 2.23 1.76 Diluted earnings per common share 2.82 2.21 1.75 Dividends declared per common share 0.48 0.20 0.49 Average common shares outstanding 5,278.1 5,226.8 4,545.2 Diluted average common shares outstanding 5,323.4 5,263.1 4,562.7
(1) Total other-than-temporary impairment (OTTI) losses (gains) were $349 million, $500 million and $2,352 million for the year ended December 31, 2011, 2010 and 2009, respectively. Of total OTTI, $423 million, $672 million and $1,012 million were recognized in earnings, and $(74) million, $(172) million and $1,340 million were recognized as non-credit related OTTI in other comprehensive income for the year ended December 31, 2011, 2010 and 2009, respectively.
(2) Includes OTTI losses of $288 million, $268 million and $655 million for the year ended December 31, 2011, 2010 and 2009, respectively. The accompanying notes are an integral part of these statements.
114

Wells Fargo & Company and Subsidiaries
Consolidated Balance Sheet
December 31,
(in millions, except shares) 2011 2010
Assets Cash and due from banks $ 19,440 16,044
Federal funds sold, securities purchased under resale agreements and other short-term investments 44,367 80,637 Trading assets 77,814 51,414
Securities available for sale 222,613 172,654 Mortgages held for sale (includes $44,791 and $47,531 carried at fair value) 48,357 51,763
Loans held for sale (includes $1,176 and $873 carried at fair value) 1,338 1,290 Loans (includes $5,916 and $309 carried at fair value) 769,631 757,267 Allowance for loan losses (19,372) (23,022)
Net loans 750,259 734,245
Mortgage servicing rights: Measured at fair value 12,603 14,467
Amortized 1,408 1,419 Premises and equipment, net 9,531 9,644
Goodwill 25,115 24,770 Other assets 101,022 99,781
Total assets (1) $ 1,313,867 1,258,128
Liabilities Noninterest-bearing deposits $ 244,003 191,256
Interest-bearing deposits 676,067 656,686
Total deposits 920,070 847,942 Short-term borrowings 49,091 55,401
Accrued expenses and other liabilities 77,665 69,913 Long-term debt (includes $0 and $306 carried at fair value) 125,354 156,983
Total liabilities (2) 1,172,180 1,130,239
Equity Wells Fargo stockholders' equity:
Preferred stock 11,431 8,689 Common stock – $1-2/3 par value, authorized 9,000,000,000 shares;
issued 5,358,522,061 shares and 5,272,414,622 shares 8,931 8,787 Additional paid-in capital 55,957 53,426
Retained earnings 64,385 51,918 Cumulative other comprehensive income 3,207 4,738
Treasury stock – 95,910,425 shares and 10,131,394 shares (2,744) (487) Unearned ESOP shares (926) (663)
Total Wells Fargo stockholders' equity 140,241 126,408 Noncontrolling interests 1,446 1,481
Total equity 141,687 127,889
Total liabilities and equity $ 1,313,867 1,258,128
(1) Our consolidated assets at December 31, 2011 and at December 31, 2010, include the following assets of certain variable interest entities (VIEs) that can only be used to settle the liabilities of those VIEs: Cash and due from banks, $321 million and $200 million; Trading assets, $293 million and $143 million; Securities available for sale, $3.3 billion and $2.2 billion; Mortgages held for sale, $444 million and $634 million; Net loans, $12.0 billion and $16.7 billion; Other assets, $1.9 billion and $2.1 billion; and Total assets, $18.2 billion and $21.9 billion.
(2) Our consolidated liabilities at December 31, 2011 and at December 31, 2010, include the following VIE liabilities for which the VIE creditors do not have recourse to Wells Fargo: Short-term borrowings, $24 million and $7 million; Accrued expenses and other liabilities, $175 million and $98 million; Long-term debt, $4.9 billion and $8.3 billion; and Total liabilities, $5.1 billion and $8.4 billion.
The accompanying notes are an integral part of these statements.
115
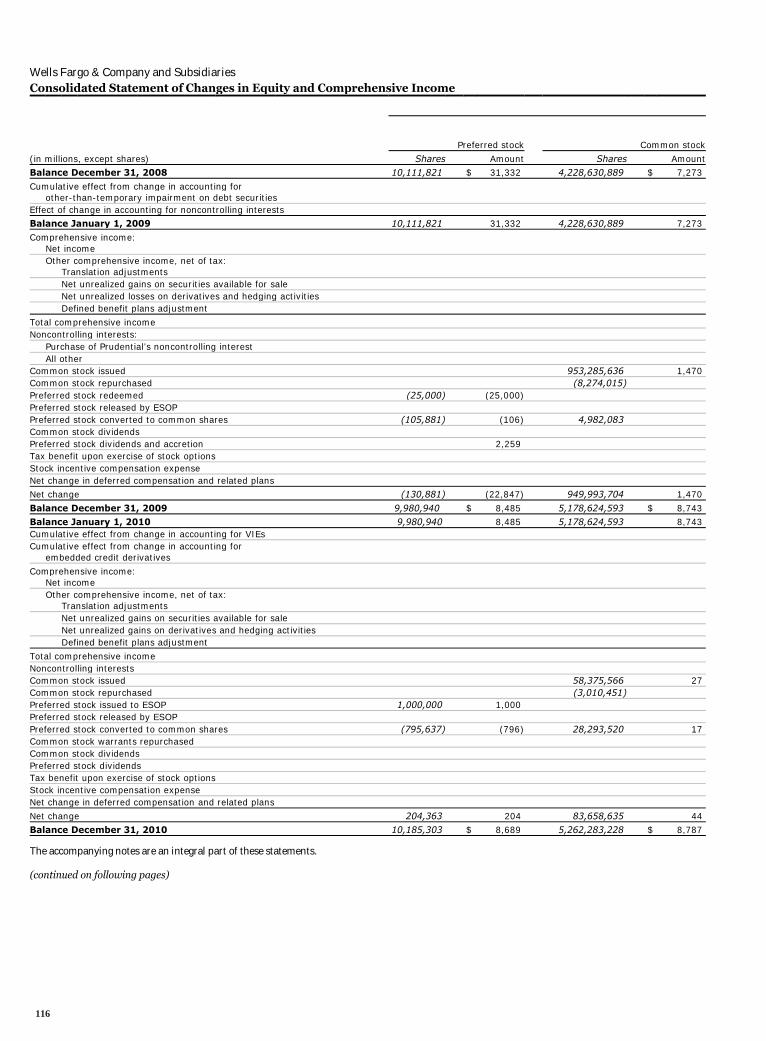
Wells Fargo & Company and Subsidiaries Consolidated Statement of Changes in Equity and Comprehensive Income
Preferred stock Common stock
(in millions, except shares) Shares Amount Shares Amount Balance December 31, 2008 10,111,821 $ 31,332 4,228,630,889 $ 7,273
Cumulative effect from change in accounting for other-than-temporary impairment on debt securities Effect of change in accounting for noncontrolling interests Balance January 1, 2009 10,111,821 31,332 4,228,630,889 7,273
Comprehensive income: Net income Other comprehensive income, net of tax: Translation adjustments Net unrealized gains on securities available for sale Net unrealized losses on derivatives and hedging activities Defined benefit plans adjustment
Total comprehensive income Noncontrolling interests: Purchase of Prudential’s noncontrolling interest All other Common stock issued 953,285,636 1,470 Common stock repurchased (8,274,015) Preferred stock redeemed (25,000) (25,000) Preferred stock released by ESOP Preferred stock converted to common shares (105,881) (106) 4,982,083 Common stock dividends Preferred stock dividends and accretion 2,259 Tax benefit upon exercise of stock options Stock incentive compensation expense Net change in deferred compensation and related plans Net change (130,881) (22,847) 949,993,704 1,470
Balance December 31, 2009 9,980,940 $ 8,485 5,178,624,593 $ 8,743 Balance January 1, 2010 9,980,940 8,485 5,178,624,593 8,743 Cumulative effect from change in accounting for VIEs Cumulative effect from change in accounting for embedded credit derivatives
Comprehensive income: Net income Other comprehensive income, net of tax: Translation adjustments Net unrealized gains on securities available for sale Net unrealized gains on derivatives and hedging activities Defined benefit plans adjustment
Total comprehensive income Noncontrolling interests Common stock issued 58,375,566 27 Common stock repurchased (3,010,451) Preferred stock issued to ESOP 1,000,000 1,000 Preferred stock released by ESOP Preferred stock converted to common shares (795,637) (796) 28,293,520 17 Common stock warrants repurchased Common stock dividends Preferred stock dividends Tax benefit upon exercise of stock options Stock incentive compensation expense Net change in deferred compensation and related plans
Net change 204,363 204 83,658,635 44 Balance December 31, 2010 10,185,303 $ 8,689 5,262,283,228 $ 8,787
The accompanying notes are an integral part of these statements. (continued on following pages)
116
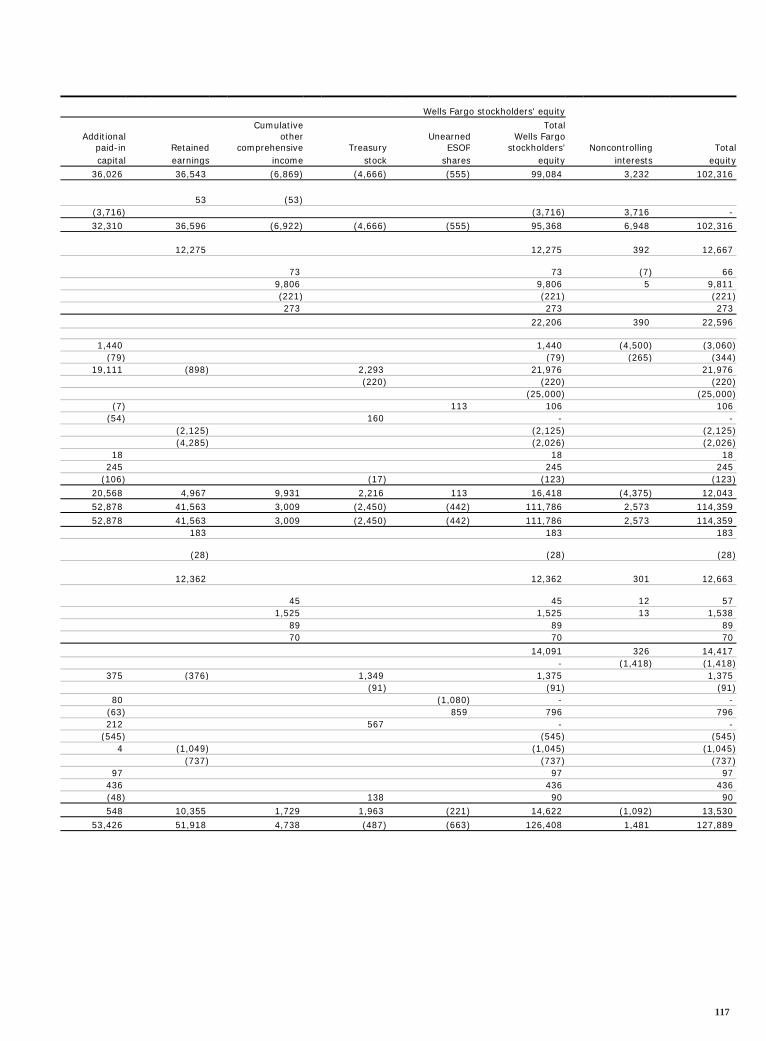
Wells Fargo stockholders' equity
Cumulative Total Additional other Unearned Wells Fargo
paid-in Retained comprehensive Treasury ESOP stockholders' Noncontrolling Totalcapital earnings income stock shares equity interests equity
36,026 36,543 (6,869) (4,666) (555) 99,084 3,232 102,316 53 (53)
(3,716) (3,716) 3,716 - 32,310 36,596 (6,922) (4,666) (555) 95,368 6,948 102,316
12,275 12,275 392 12,667 73 73 (7) 66 9,806 9,806 5 9,811 (221) (221) (221) 273 273 273
22,206 390 22,596
1,440 1,440 (4,500) (3,060) (79) (79) (265) (344)
19,111 (898) 2,293 21,976 21,976 (220) (220) (220) (25,000) (25,000)
(7) 113 106 106 (54) 160 - -
(2,125) (2,125) (2,125) (4,285) (2,026) (2,026)
18 18 18 245 245 245
(106) (17) (123) (123)
20,568 4,967 9,931 2,216 113 16,418 (4,375) 12,043 52,878 41,563 3,009 (2,450) (442) 111,786 2,573 114,359
52,878 41,563 3,009 (2,450) (442) 111,786 2,573 114,359 183 183 183 (28) (28) (28) 12,362 12,362 301 12,663 45 45 12 57 1,525 1,525 13 1,538 89 89 89 70 70 70 14,091 326 14,417 - (1,418) (1,418)
375 (376) 1,349 1,375 1,375 (91) (91) (91)
80 (1,080) - - (63) 859 796 796 212 567 - -
(545) (545) (545) 4 (1,049) (1,045) (1,045)
(737) (737) (737) 97 97 97
436 436 436 (48) 138 90 90 548 10,355 1,729 1,963 (221) 14,622 (1,092) 13,530
53,426 51,918 4,738 (487) (663) 126,408 1,481 127,889
117
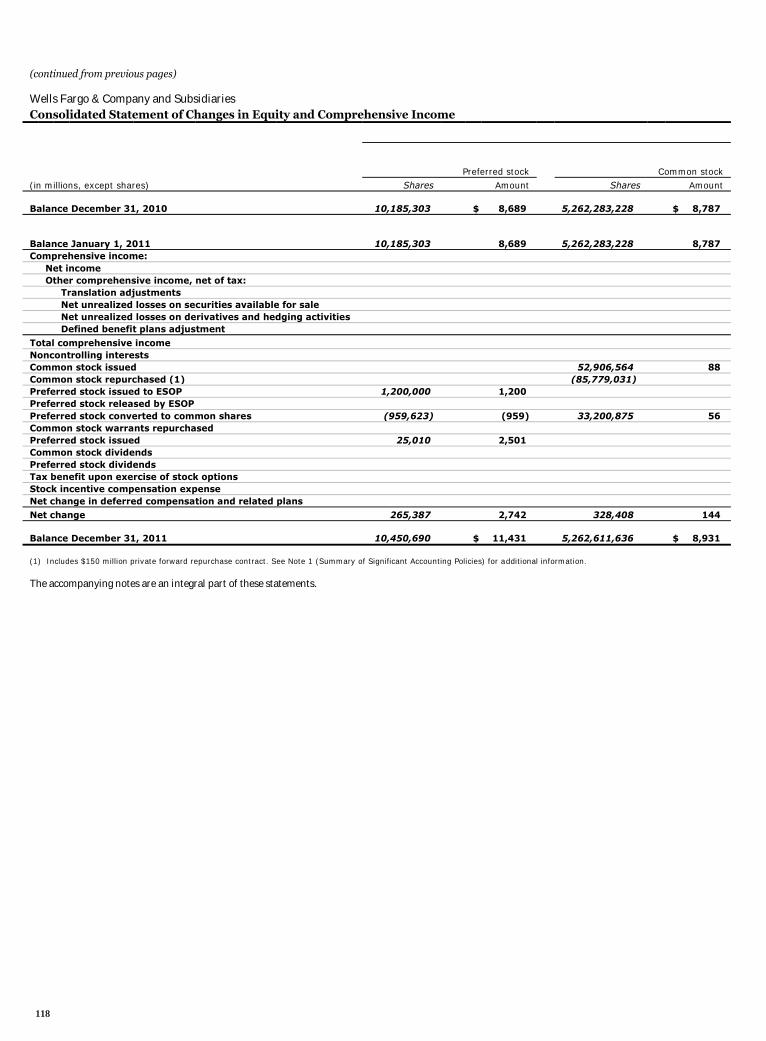
(continued from previous pages)
Wells Fargo & Company and Subsidiaries Consolidated Statement of Changes in Equity and Comprehensive Income
Preferred stock Common stock (in millions, except shares) Shares Amount Shares Amount
Balance December 31, 2010 10,185,303 $ 8,689
5,262,283,228 $ 8,787
Balance January 1, 2011 10,185,303 8,689
5,262,283,228 8,787 Comprehensive income: Net income Other comprehensive income, net of tax: Translation adjustments Net unrealized losses on securities available for sale Net unrealized losses on derivatives and hedging activities Defined benefit plans adjustment
Total comprehensive income Noncontrolling interests Common stock issued 52,906,564 88 Common stock repurchased (1) (85,779,031) Preferred stock issued to ESOP 1,200,000 1,200 Preferred stock released by ESOP Preferred stock converted to common shares (959,623) (959) 33,200,875 56 Common stock warrants repurchased Preferred stock issued 25,010 2,501 Common stock dividends Preferred stock dividends Tax benefit upon exercise of stock options Stock incentive compensation expense Net change in deferred compensation and related plans Net change 265,387 2,742 328,408 144
Balance December 31, 2011 10,450,690 $ 11,431
5,262,611,636 $ 8,931 (1) Includes $150 million private forward repurchase contract. See Note 1 (Summary of Significant Accounting Policies) for additional information. The accompanying notes are an integral part of these statements.
118
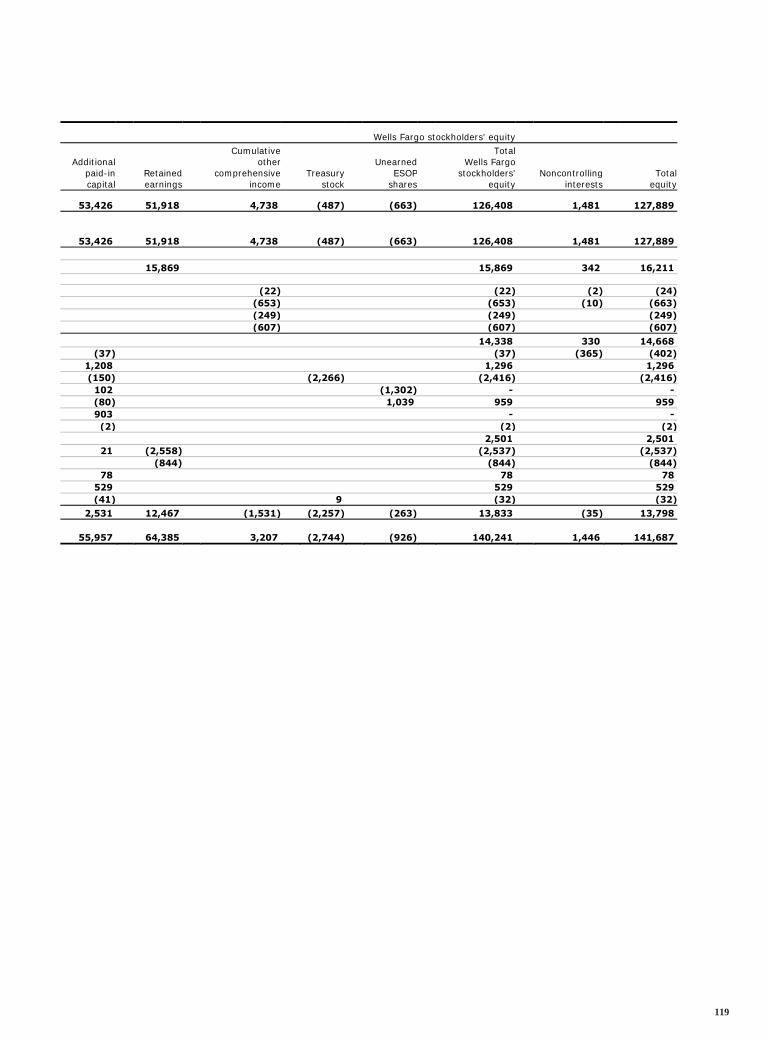
Wells Fargo stockholders' equity Cumulative Total
Additional other Unearned Wells Fargo paid-in Retained comprehensive Treasury ESOP stockholders' Noncontrolling Total capital earnings income stock shares equity interests equity
53,426 51,918 4,738 (487) (663) 126,408 1,481 127,889
53,426 51,918 4,738 (487) (663) 126,408 1,481 127,889
15,869 15,869 342 16,211 (22) (22) (2) (24) (653) (653) (10) (663) (249) (249) (249) (607) (607) (607)
14,338 330 14,668 (37) (37) (365) (402)
1,208 1,296 1,296 (150) (2,266) (2,416) (2,416)
102 (1,302) - - (80) 1,039 959 959 903 - - (2) (2) (2)
2,501 2,501 21 (2,558) (2,537) (2,537)
(844) (844) (844) 78 78 78
529 529 529 (41) 9 (32) (32)
2,531 12,467 (1,531) (2,257) (263) 13,833 (35) 13,798
55,957 64,385 3,207 (2,744) (926) 140,241 1,446 141,687
119
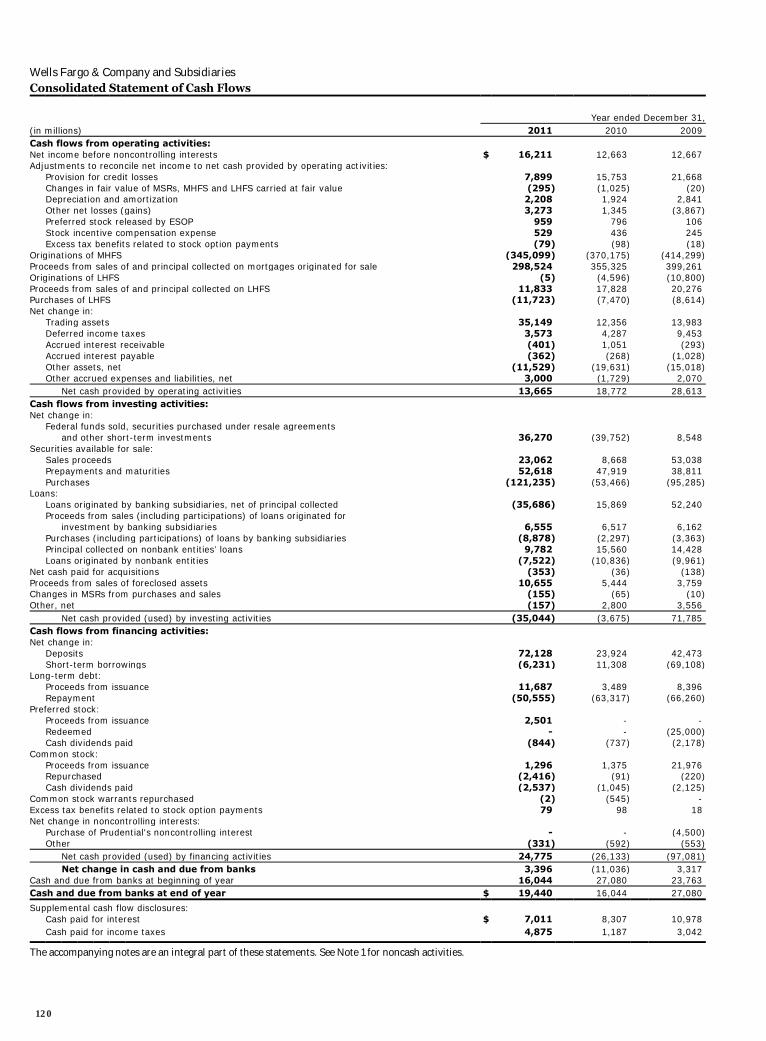
Wells Fargo & Company and Subsidiaries
Consolidated Statement of Cash Flows
Year ended December 31, (in millions) 2011 2010 2009 Cash flows from operating activities: Net income before noncontrolling interests $ 16,211 12,663 12,667 Adjustments to reconcile net income to net cash provided by operating activities: Provision for credit losses 7,899 15,753 21,668 Changes in fair value of MSRs, MHFS and LHFS carried at fair value (295) (1,025) (20) Depreciation and amortization 2,208 1,924 2,841 Other net losses (gains) 3,273 1,345 (3,867) Preferred stock released by ESOP 959 796 106 Stock incentive compensation expense 529 436 245 Excess tax benefits related to stock option payments (79) (98) (18) Originations of MHFS (345,099) (370,175) (414,299) Proceeds from sales of and principal collected on mortgages originated for sale 298,524 355,325 399,261 Originations of LHFS (5) (4,596) (10,800) Proceeds from sales of and principal collected on LHFS 11,833 17,828 20,276 Purchases of LHFS (11,723) (7,470) (8,614) Net change in: Trading assets 35,149 12,356 13,983 Deferred income taxes 3,573 4,287 9,453 Accrued interest receivable (401) 1,051 (293) Accrued interest payable (362) (268) (1,028) Other assets, net (11,529) (19,631) (15,018) Other accrued expenses and liabilities, net 3,000 (1,729) 2,070 Net cash provided by operating activities 13,665 18,772 28,613 Cash flows from investing activities: Net change in: Federal funds sold, securities purchased under resale agreements and other short-term investments 36,270 (39,752) 8,548 Securities available for sale: Sales proceeds 23,062 8,668 53,038 Prepayments and maturities 52,618 47,919 38,811 Purchases (121,235) (53,466) (95,285) Loans: Loans originated by banking subsidiaries, net of principal collected (35,686) 15,869 52,240 Proceeds from sales (including participations) of loans originated for investment by banking subsidiaries 6,555 6,517 6,162 Purchases (including participations) of loans by banking subsidiaries (8,878) (2,297) (3,363) Principal collected on nonbank entities’ loans 9,782 15,560 14,428 Loans originated by nonbank entities (7,522) (10,836) (9,961) Net cash paid for acquisitions (353) (36) (138) Proceeds from sales of foreclosed assets 10,655 5,444 3,759 Changes in MSRs from purchases and sales (155) (65) (10) Other, net (157) 2,800 3,556 Net cash provided (used) by investing activities (35,044) (3,675) 71,785 Cash flows from financing activities: Net change in: Deposits 72,128 23,924 42,473 Short-term borrowings (6,231) 11,308 (69,108) Long-term debt: Proceeds from issuance 11,687 3,489 8,396 Repayment (50,555) (63,317) (66,260) Preferred stock: Proceeds from issuance 2,501 - - Redeemed - - (25,000) Cash dividends paid (844) (737) (2,178) Common stock: Proceeds from issuance 1,296 1,375 21,976 Repurchased (2,416) (91) (220) Cash dividends paid (2,537) (1,045) (2,125) Common stock warrants repurchased (2) (545) - Excess tax benefits related to stock option payments 79 98 18 Net change in noncontrolling interests: Purchase of Prudential's noncontrolling interest - - (4,500) Other (331) (592) (553) Net cash provided (used) by financing activities 24,775 (26,133) (97,081) Net change in cash and due from banks 3,396 (11,036) 3,317 Cash and due from banks at beginning of year 16,044 27,080 23,763 Cash and due from banks at end of year $ 19,440 16,044 27,080
Supplemental cash flow disclosures: Cash paid for interest $ 7,011 8,307 10,978 Cash paid for income taxes 4,875 1,187 3,042
The accompanying notes are an integral part of these statements. See Note 1 for noncash activities.
120
See the Glossary of Acronyms at the end of this Report for terms used throughout the Financial Statements and related Notes of this Form 10-K.
Note 1: Summary of Significant Accounting Policies
Wells Fargo & Company is a diversified financial services company. We provide banking, insurance, trust and investments, mortgage banking, investment banking, retail banking, brokerage, and consumer and commercial finance through banking stores, the internet and other distribution channels to consumers, businesses and institutions in all 50 states, the District of Columbia, and in other countries. When we refer to “Wells Fargo,” “the Company,” “we,” “our” or “us,” we mean Wells Fargo & Company and Subsidiaries (consolidated). Wells Fargo & Company (the Parent) is a financial holding company and a bank holding company. We also hold a majority interest in a real estate investment trust, which has publicly traded preferred stock outstanding. Our accounting and reporting policies conform with U.S. generally accepted accounting principles (GAAP) and practices in the financial services industry. To prepare the financial statements in conformity with GAAP, management must make estimates based on assumptions about future economic and market conditions (for example, unemployment, market liquidity, real estate prices, etc.) that affect the reported amounts of assets and liabilities at the date of the financial statements and income and expenses during the reporting period and the related disclosures. Although our estimates contemplate current conditions and how we expect them to change in the future, it is reasonably possible that actual conditions could be worse than anticipated in those estimates, which could materially affect our results of operations and financial condition. Management has made significant estimates in several areas, including allowance for credit losses and purchased credit-impaired (PCI) loans (Note 6), valuations of residential mortgage servicing rights (MSRs) (Notes 8 and 9) and financial instruments (Note 17), liability for mortgage loan repurchase losses (Note 9) and income taxes (Note 21). Actual results could differ from those estimates. Accounting Standards Adopted in 2011 In first quarter 2011, we adopted certain provisions of Accounting Standards Update (ASU or Update) 2010-6, Improving Disclosures about Fair Value Measurements. ASU 2010-06 amends the disclosure requirements for fair value measurements. Companies are required to disclose significant transfers in and out of Levels 1 and 2 of the fair value hierarchy. This Update also clarifies that fair value measurement disclosures should be presented for each asset and liability class, which is generally a subset of a line item in the statement of financial position. In the rollforward of Level 3 activity, companies must present information on purchases, sales, issuances, and settlements on a gross basis rather than on a net basis. Companies should also provide information about the valuation techniques and inputs used to measure fair value for both recurring and nonrecurring instruments classified as either Level 2 or Level 3. In first quarter 2011, we adopted the
requirement for gross presentation in the Level 3 rollforward with prospective application. The remaining provisions were effective for us in first quarter 2010. Our adoption of this Update did not affect our consolidated financial statement results since it amends only the disclosure requirements for fair value measurements.
In third quarter 2011, we adopted the following new
accounting guidance: Certain provisions of ASU 2010-20, Disclosures about the
Credit Quality of Financing Receivables and the Allowance for Credit Losses; and
ASU 2011-02, A Creditor’s Determination of Whether a Restructuring is a Troubled Debt Restructuring.
ASU 2010-20 requires enhanced disclosures for the allowance for credit losses and financing receivables, which include certain loans and long-term accounts receivables. Companies are required to disaggregate credit quality information and roll forward the allowance for credit losses by portfolio segment. Companies must also provide supplemental information on the nature and extent of troubled debt restructurings (TDRs) and their effect on the allowance for credit losses. We adopted the new disclosure requirements for TDRs in third quarter 2011 with retrospective application to January 1, 2011. The remaining provisions were effective for us in fourth quarter 2010. Our adoption of this Update did not affect our consolidated financial statement results since it amends only the disclosure requirements for financing receivables and the allowance for credit losses. ASU 2011-02 provides guidance clarifying under what circumstances a creditor should classify a restructured receivable as a TDR. A receivable is a TDR if both of the following exist: 1) a creditor has granted a concession to the debtor, and 2) the debtor is experiencing financial difficulties. This Update clarifies that a creditor should consider all aspects of a restructuring when evaluating whether it has granted a concession, which include determining whether a debtor can obtain funds from another source at market rates and assessing the value of additional collateral and guarantees obtained at the time of restructuring. This Update also provides factors a creditor should consider when determining if a debtor is experiencing financial difficulties, such as probability of payment default and bankruptcy declarations. This guidance was effective for us in third quarter 2011 with retrospective application to January 1, 2011. Our adoption of this Update did not have a material effect on our consolidated financial statements.
In fourth quarter 2011, we early adopted ASU 2011-08, Testing Goodwill for Impairment.
121
Note 1: Summary of Significant Accounting Policies (continued)
ASU 2011-08 provides entities with the option to perform a qualitative assessment of goodwill to test for impairment. If, based on qualitative reviews, a company concludes that more likely than not a reporting unit’s fair value is less than its carrying amount, then the company must complete quantitative steps to determine if there is goodwill impairment. If a company concludes otherwise, quantitative tests are not required. Our adoption of this Update did not affect our consolidated financial statements. Accounting Standards with Retrospective Application The following accounting pronouncements have been issued by the FASB but are not yet effective: Accounting Standards Update (ASU or Update) 2011-11,
Disclosures about Offsetting Assets and Liabilities; ASU 2011-05, Presentation of Comprehensive Income; and ASU 2011-12, Deferral of the Effective Date for
Amendments to the Presentation of Reclassifications of Items Out of Accumulated Other Comprehensive Income in Accounting Standards Update No. 2011-05.
ASU 2011-11 expands the disclosure requirements for financial instruments and derivatives that may be offset in accordance with enforceable master netting agreements or similar arrangements. The disclosures are required regardless of whether the instruments have been offset (or netted) in the statement of financial position. Under ASU 2011-11, companies must describe the nature of offsetting arrangements and provide quantitative information about those agreements, including the gross and net amounts of financial instruments that are recognized in the statement of financial position. These changes are effective for us in first quarter 2013 with retrospective application. This Update will not affect our consolidated financial results since it amends only the disclosure requirements for offsetting financial instruments. ASU 2011-05 eliminates the option for companies to include the components of other comprehensive income in the statement of changes in stockholders’ equity. This Update requires entities to present the components of comprehensive income in either a single statement or in two separate statements, with the statement of other comprehensive income (OCI) immediately following the statement of income. This Update also requires companies to present amounts reclassified out of OCI and into net income on the face of the statement of income. In December 2011, the FASB issued ASU 2011-12, which defers indefinitely the requirement to present reclassification adjustments on the statement of income. The remaining provisions are effective for us in first quarter 2012 with retrospective application. Early adoption is permitted. This Update will not affect our consolidated financial results as it amends only the presentation of comprehensive income. Consolidation Our consolidated financial statements include the accounts of the Parent and our majority-owned subsidiaries and VIEs (defined below) in which we are the primary beneficiary.
Significant intercompany accounts and transactions are eliminated in consolidation. If we own at least 20% of an entity, we generally account for the investment using the equity method. If we own less than 20% of an entity, we generally carry the investment at cost, except marketable equity securities, which we carry at fair value with changes in fair value included in OCI. Investments accounted for under the equity or cost method are included in other assets.
We are a variable interest holder in certain special-purpose entities (SPEs) in which equity investors do not have the characteristics of a controlling financial interest or where the entity does not have enough equity at risk to finance its activities without additional subordinated financial support from other parties (referred to as VIEs). Our variable interest arises from contractual, ownership or other monetary interests in the entity, which change with fluctuations in the fair value of the entity's assets. We consolidate a VIE if we are the primary beneficiary, defined as the party that that has both the power to direct the activities that most significantly impact the VIE and a variable interest that could potentially be significant to the VIE. A variable interest is a contractual, ownership or other interest that changes with changes in the fair value of the VIE’s net assets. To determine whether or not a variable interest we hold could potentially be significant to the VIE, we consider both qualitative and quantitative factors regarding the nature, size and form of our involvement with the VIE. We assess whether or not we are the primary beneficiary of a VIE on an on-going basis.
Cash and Due From Banks Cash and cash equivalents include cash on hand, cash items in transit, and amounts due from the Federal Reserve Bank and other depository institutions.
Trading Assets Trading assets are primarily securities, including corporate debt, U.S. government agency obligations and other securities that we acquire for short-term appreciation or other trading purposes, and the fair value of derivatives held for customer accommodation purposes or risk mitigation and hedging. Interest-only strips and other retained interests in securitizations that can be contractually prepaid or otherwise settled in a way that the holder would not recover substantially all of its recorded investment are classified as trading assets. Trading assets are carried at fair value, with realized and unrealized gains and losses recorded in noninterest income.
Securities SECURITIES AVAILABLE FOR SALE Debt securities that we might not hold until maturity and marketable equity securities are classified as securities available for sale and reported at fair value. Unrealized gains and losses, after applicable taxes, are reported in cumulative OCI. Fair value measurement is based upon quoted prices in active markets, if available. If quoted prices in active markets are not available, fair values are measured using independent pricing models or other model-based valuation techniques such as the present value of future cash flows, adjusted for the security's credit rating, prepayment assumptions and other factors such as credit loss assumptions
122
and market liquidity. See Note 17 for more information on fair value measurement of our securities. We conduct OTTI analysis on a quarterly basis or more often if a potential loss-triggering event occurs. The initial indicator of OTTI for both debt and equity securities is a decline in market value below the amount recorded for an investment and the severity and duration of the decline. For a debt security for which there has been a decline in the fair value below amortized cost basis, we recognize OTTI if we (1) have the intent to sell the security, (2) it is more likely than not that we will be required to sell the security before recovery of its amortized cost basis, or (3) we do not expect to recover the entire amortized cost basis of the security. Estimating recovery of the amortized cost basis of a debt security is based upon an assessment of the cash flows expected to be collected. If the cash flows expected to be collected are less than amortized cost, OTTI is considered to have occurred. In performing an assessment of the cash flows expected to be collected, we consider all relevant information including: the length of time and the extent to which the fair value has
been less than the amortized cost basis; the historical and implied volatility of the fair value of the
security; the cause of the price decline, such as the general level of
interest rates or adverse conditions specifically related to the security, an industry or a geographic area;
the issuer's financial condition, near-term prospects and ability to service the debt;
the payment structure of the debt security and the likelihood of the issuer being able to make payments that increase in the future;
for asset-backed securities, the credit performance of the underlying collateral, including delinquency rates, level of non-performing assets, cumulative losses to date, collateral value and the remaining credit enhancement compared with expected credit losses;
any change in rating agencies' credit ratings at evaluation date from acquisition date and any likely imminent action;
independent analyst reports and forecasts, sector credit ratings and other independent market data; and
recoveries or additional declines in fair value subsequent to the balance sheet date.
If we intend to sell the security, or if it is more likely than not we will be required to sell the security before recovery, an OTTI write-down is recognized in earnings equal to the entire difference between the amortized cost basis and fair value of the security. For debt securities that are considered other-than-temporarily impaired that we do not intend to sell or it is more likely than not that we will not be required to sell before recovery, the OTTI write-down is separated into an amount representing the credit loss, which is recognized in earnings, and the amount related to all other factors, which is recognized in OCI. The measurement of the credit loss component is equal to the difference between the debt security's cost basis and the present value of its expected future cash flows discounted at the security's effective yield. The remaining difference between the security’s fair value and the present value of future expected cash
flows is due to factors that are not credit-related and, therefore, are recognized in OCI. We believe that we will fully collect the carrying value of securities on which we have recorded a non-credit-related impairment in OCI. We hold investments in perpetual preferred securities (PPS) that are structured in equity form, but have many of the characteristics of debt instruments, including periodic cash flows in the form of dividends, call features, ratings that are similar to debt securities and pricing like long-term callable bonds. Because of the hybrid nature of these securities, we evaluate PPS for OTTI using a model similar to the model we use for debt securities as described above. Among the factors we consider in our evaluation of PPS are whether there is any evidence of deterioration in the credit of the issuer as indicated by a decline in cash flows or a rating agency downgrade to below investment grade and the estimated recovery period. Additionally, in determining if there was evidence of credit deterioration, we evaluate: (1) the severity of decline in market value below cost, (2) the period of time for which the decline in fair value has existed, and (3) the financial condition and near-term prospects of the issuer, including any specific events which may influence the operations of the issuer. We consider PPS to be other-than-temporarily impaired if cash flows expected to be collected are insufficient to recover our investment or if we no longer believe the security will recover within the estimated recovery period. OTTI write-downs of PPS are recognized in earnings equal to the difference between the cost basis and fair value of the security. Based upon the factors considered in our OTTI evaluation, we believe our investments in PPS currently rated investment grade will be fully realized and, accordingly, have not recognized OTTI on such securities. For marketable equity securities other than PPS, OTTI evaluations focus on whether evidence exists that supports recovery of the unrealized loss within a timeframe consistent with temporary impairment. This evaluation considers the severity of and length of time fair value is below cost, our intent and ability to hold the security until forecasted recovery of the fair value of the security, and the investee's financial condition, capital strength, and near-term prospects. The securities portfolio is an integral part of our asset/liability management process. We manage these investments to provide liquidity, manage interest rate risk and maximize portfolio yield within capital risk limits approved by management and the Board of Directors and monitored by the Corporate Asset/Liability Management Committee (Corporate ALCO). We recognize realized gains and losses on the sale of these securities in noninterest income using the specific identification method. Unamortized premiums and discounts are recognized in interest income over the contractual life of the security using the interest method. As principal repayments are received on securities (i.e., primarily mortgage-backed securities (MBS)) a proportionate amount of the related premium or discount is recognized in income so that the effective interest rate on the remaining portion of the security continues unchanged.
123

Note 1: Summary of Significant Accounting Policies (continued)
NONMARKETABLE EQUITY SECURITIES Nonmarketable equity securities include venture capital equity securities that are not publicly traded and securities acquired for various purposes, such as to meet regulatory requirements (for example, Federal Reserve Bank and Federal Home Loan Bank (FHLB) stock). These securities are accounted for under the cost or equity method and are included in other assets. We review those assets accounted for under the cost or equity method at least quarterly for possible OTTI. Our review typically includes an analysis of the facts and circumstances of each investment, the expectations for the investment's cash flows and capital needs, the viability of its business model and our exit strategy. We reduce the asset value when we consider declines in value to be other than temporary. We recognize the estimated loss as a loss from equity investments in noninterest income. In addition, we invest in certain equity securities held by our subsidiaries that meet the definition of an investment company (principal investments) and, therefore, are recorded at fair value with realized and unrealized gains and losses included in gains and losses from equity investments in noninterest income. Securities Purchased and Sold Agreements Securities purchased under resale agreements and securities sold under repurchase agreements are accounted for as collateralized financing transactions and are recorded at the acquisition or sale price plus accrued interest. It is our policy to take possession of securities purchased under resale agreements, which are primarily U.S. Government and Government agency securities. We monitor the market value of securities purchased and sold, and obtain collateral from or return it to counterparties when appropriate. These financing transactions do not create material credit risk given the collateral provided and the related monitoring process.
Mortgages Held for Sale Mortgages held for sale (MHFS) include commercial and residential mortgages originated for sale and securitization in the secondary market, which is our principal market, or for sale as whole loans. We elect the fair value option for substantially all residential MHFS (see Note 17). The remaining residential MHFS are held at the lower of cost or market value (LOCOM), and are valued on an aggregate portfolio basis. Commercial MHFS are held at LOCOM and are valued on an individual loan basis. Gains and losses on MHFS are recorded in mortgage banking noninterest income. Direct loan origination costs and fees for MHFS under fair value option are recognized in mortgage banking noninterest income at origination. For MHFS recorded at LOCOM, loan costs and fees are deferred at origination and are recognized in mortgage banking noninterest income at time of sale. Interest income on MHFS for which the fair value option is elected is calculated based upon the note rate of the loan and is recorded to interest income. Our lines of business are authorized to originate held-for-investment loans that meet or exceed established loan product profitability criteria, including minimum positive net interest margin spreads in excess of funding costs. When a determination is made at the time of commitment to originate
loans as held for investment, it is our intent to hold these loans to maturity or for the “foreseeable future,” subject to periodic review under our corporate asset/liability management process. In determining the “foreseeable future” for these loans, management considers (1) the current economic environment and market conditions, (2) our business strategy and current business plans, (3) the nature and type of the loan receivable, including its expected life, and (4) our current financial condition and liquidity demands. Consistent with our core banking business of managing the spread between the yield on our assets and the cost of our funds, loans are periodically reevaluated to determine if our minimum net interest margin spreads continue to meet our profitability objectives. If subsequent changes in interest rates significantly impact the ongoing profitability of certain loan products, we may subsequently change our intent to hold these loans, and we would take actions to sell such loans in response to the Corporate ALCO directives to reposition our balance sheet because of the changes in interest rates. These directives identify both the type of loans to be sold and the weighted average coupon rate of such loans no longer meeting our ongoing investment criteria. Upon the issuance of such directives, we immediately transfer these loans to the MHFS portfolio at LOCOM.
Loans Held for Sale Loans held for sale (LHFS) are carried at LOCOM or at fair value. Generally, consumer loans are valued on an aggregate portfolio basis, and commercial loans are valued on an individual loan basis. Gains and losses on LHFS are recorded in other noninterest income. For LHFS recorded at LOCOM, direct loan origination costs and fees are deferred at origination and are recognized in other noninterest income at time of sale. For loans recorded at fair value, direct loan origination costs and fees are recorded in other noninterest income at origination. The fair value of LHFS is based on what secondary markets are currently offering for portfolios with similar characteristics, and related gains and losses are recorded in noninterest income.
Loans Loans are reported at their outstanding principal balances net of any unearned income, cumulative charge-offs, unamortized deferred fees and costs on originated loans and unamortized premiums or discounts on purchased loans. PCI loans are reported net of any remaining purchase accounting adjustments. See the “Purchased Credit-Impaired Loans” section in this Note for our accounting policy for PCI loans. Unearned income, deferred fees and costs, and discounts and premiums are amortized to interest income over the contractual life of the loan using the interest method. Loan commitment fees are generally deferred and amortized into noninterest income on a straight-line basis over the commitment period.
Loans also include direct financing leases that are recorded at the aggregate of minimum lease payments receivable plus the estimated residual value of the leased property, less unearned income. Leveraged leases, which are a form of direct financing leases, are recorded net of related nonrecourse debt. Leasing
124
income is recognized as a constant percentage of outstanding lease financing balances over the lease terms in interest income.
NONACCRUAL AND PAST DUE LOANS We generally place loans on nonaccrual status when: the full and timely collection of interest or principal
becomes uncertain; they are 90 days (120 days with respect to real estate 1-4
family first and junior lien mortgages) past due for interest or principal, unless both well-secured and in the process of collection; or
part of the principal balance has been charged off and no restructuring has occurred.
PCI loans are written down at acquisition to fair value using an estimate of cash flows deemed to be collectible. Accordingly, such loans are no longer classified as nonaccrual even though they may be contractually past due because we expect to fully collect the new carrying values of such loans (that is, the new cost basis arising out of purchase accounting). When we place a loan on nonaccrual status, we reverse the accrued unpaid interest receivable against interest income and amortization of any net deferred fees is suspended. A loan will remain in accruing status provided it is both well-secured and in the process of collection. If the ultimate collectability of a loan is in doubt and the loan is on nonaccrual, the cost recovery method is used and cash collected is applied to first reduce the principal outstanding. Generally, we return a loan to accrual status when all delinquent interest and principal become current under the terms of the loan agreement and collectability of remaining principal and interest is no longer doubtful. For modified loans, we underwrite at the time of a restructuring to determine if there is sufficient evidence of sustained repayment capacity based on the borrower’s financial strength, including documented income, debt to income ratios and other factors. If the borrower has demonstrated performance under the previous terms and the underwriting process shows the capacity to continue to perform under the restructured terms, the loan will remain in accruing status. When a loan classified as a TDR performs in accordance with its modified terms, the loan either continues to accrue interest (for performing loans) or will return to accrual status after the borrower demonstrates a sustained period of performance (generally six consecutive months of payments, or equivalent, inclusive of consecutive payments made prior to the modification). Loans will be placed on nonaccrual status and a corresponding charge-off is recorded if we believe it is probable that principal and interest contractually due under the modified terms of the agreement will not be collectible. Generally, consumer loans not secured by real estate or autos are placed on nonaccrual status only when part of the principal has been charged off. Loans are fully charged off or charged down to net realizable value (fair value of collateral less estimated costs to sell) when deemed uncollectible due to bankruptcy or other factors, or when they reach a defined number of days past due based on loan product, industry practice, country, terms and other factors.
Our loans are considered past due when contractually required principal or interest payments have not been made on the due dates.
LOAN CHARGE-OFF POLICIES For commercial loans, we generally fully charge off or charge down to net realizable value for loans secured by collateral when: management judges the loan to be uncollectible; repayment is deemed to be protracted beyond reasonable
time frames; the loan has been classified as a loss by either our internal
loan review process or our banking regulatory agencies; the customer has filed bankruptcy and the loss becomes
evident owing to a lack of assets; or the loan is 180 days past due unless both well-secured and
in the process of collection.
For consumer loans, our charge-off policies are as follows: 1-4 family first and junior lien mortgages – We generally
charge down to net realizable value when the loan is 180 days past due.
Auto loans – We generally fully charge off when the loan is 120 days past due.
Credit card loans – We generally fully charge off when the loan is 180 days past due.
Unsecured loans (closed end) – We generally charge off when the loan is 120 days past due.
Unsecured loans (open end) – We generally charge off when the loan is 180 days past due.
Other secured loans – We generally fully or partially charge down to net realizable value when the loan is 120 days past due.
IMPAIRED LOANS We consider a loan to be impaired when, based on current information and events, we determine that we will not be able to collect all amounts due according to the loan contract, including scheduled interest payments. This evaluation is generally based on delinquency information, an assessment of the borrower’s financial condition and the adequacy of collateral, if any. Our impaired loans predominantly include loans on nonaccrual status for commercial and industrial, commercial real estate (CRE), foreign loans and any loans modified in a TDR, on both accrual and nonaccrual status.
When we identify a loan as impaired, we measure the impairment based on the present value of expected future cash flows, discounted at the loan’s effective interest rate. When collateral is the sole source of repayment for the loan, we may measure impairment based on the fair value of the collateral. If foreclosure is probable, we use the current fair value of the collateral less estimated selling costs, instead of discounted cash flows.
If we determine that the value of an impaired loan is less than the recorded investment in the loan (net of previous charge-offs, deferred loan fees or costs and unamortized premium or discount), we recognize impairment. When the value of an impaired loan is calculated by discounting expected cash flows, interest income is recognized using the loan’s effective interest rate over the remaining life of the loan.
125
Note 1: Summary of Significant Accounting Policies (continued)
TROUBLED DEBT RESTRUCTURINGS (TDRs) In situations where, for economic or legal reasons related to a borrower’s financial difficulties, we grant a concession for other than an insignificant period of time to the borrower that we would not otherwise consider, the related loan is classified as a TDR. We strive to identify borrowers in financial difficulty early and work with them to modify their loan to more affordable terms before it reaches nonaccrual status. These modified terms may include rate reductions, principal forgiveness, term extensions, payment forbearance and other actions intended to minimize our economic loss and to avoid foreclosure or repossession of the collateral. For modifications where we forgive principal, the entire amount of such principal forgiveness is immediately charged off. Loans classified as TDRs, including loans in trial payment periods (trial modifications), are considered impaired loans. PURCHASED CREDIT-IMPAIRED (PCI) LOANS Loans acquired with evidence of credit deterioration since their origination and where it is probable that we will not collect all contractually required principal and interest payments are accounted for using the measurement provision for PCI loans. PCI loans are recorded at fair value at the date of acquisition, and the historical allowance for credit losses related to these loans is not carried over. Some loans that otherwise meet the definition as credit-impaired are specifically excluded from the PCI loan portfolios, such as revolving loans where the borrower still has revolving privileges. Evidence of credit quality deterioration as of the purchase date may include statistics such as past due and nonaccrual status, commercial risk ratings, recent borrower credit scores and recent loan-to-value percentages. Generally, acquired loans that meet our definition for nonaccrual status are considered to be credit-impaired. Substantially all commercial and industrial, CRE and foreign PCI loans are accounted for as individual loans. Conversely, Pick-a-Pay and other consumer PCI loans have been aggregated into several pools based on common risk characteristics. Each pool is accounted for as a single asset with a single composite interest rate and an aggregate expectation of cash flows. Accounting for PCI loans involves estimating fair value, at acquisition, using the principal and interest cash flows expected to be collected discounted at the prevailing market rate of interest. The excess of cash flows expected to be collected over the carrying value (estimated fair value at acquisition date) is referred to as the accretable yield and is recognized in interest income using an effective yield method over the remaining life of the loan, or pool of loans, in situations where there is a reasonable expectation about the timing and amount of cash flows to be collected. The difference between contractually required payments and the cash flows expected to be collected at acquisition, considering the impact of prepayments, is referred to as the nonaccretable difference. Subsequent to acquisition, we regularly evaluate our estimates of cash flows expected to be collected. If we have probable decreases in cash flows expected to be collected (other than due to decreases in interest rate indices and changes in prepayment assumptions), we charge the provision for credit
losses, resulting in an increase to the allowance for loan losses. If we have probable and significant increases in cash flows expected to be collected, we first reverse any previously established allowance for loan losses and then increase interest income as a prospective yield adjustment over the remaining life of the loan, or pool of loans. Estimates of cash flows are impacted by changes in interest rate indices for variable rate loans and prepayment assumptions, both of which are treated as prospective yield adjustments included in interest income. Resolutions of loans may include sales of loans to third parties, receipt of payments in settlement with the borrower, or foreclosure of the collateral. For individual PCI loans, gains or losses on sales to third parties are included in noninterest income, and gains or losses as a result of a settlement with the borrower are included in interest income. Our policy is to remove an individual loan from a pool based on comparing the amount received from its resolution with its contractual amount. Any difference between these amounts is absorbed by the nonaccretable difference for the entire pool. This removal method assumes that the amount received from resolution approximates pool performance expectations. The remaining accretable yield balance is unaffected and any material change in remaining effective yield caused by this removal method is addressed by our quarterly cash flow evaluation process for each pool. For loans that are resolved by payment in full, there is no release of the nonaccretable difference for the pool because there is no difference between the amount received at resolution and the contractual amount of the loan. Modified PCI loans are not removed from a pool even if those loans would otherwise be deemed TDRs. Modified PCI loans that are accounted for individually are considered TDRs, and removed from PCI accounting if there has been a concession granted in excess of the original nonaccretable difference. We include these TDRs in our impaired loans. FORECLOSED ASSETS Foreclosed assets obtained through our lending activities primarily include real estate. Generally, loans have been written down to their net realizable value prior to foreclosure. Any further reduction to their net realizable value is recorded with a charge to the allowance for credit losses at foreclosure. We allow up to 90 days after foreclosure to finalize determination of net realizable value. Thereafter, changes in net realizable value are recorded to noninterest expense. The net realizable value of these assets is reviewed and updated periodically depending on the type of property.
ALLOWANCE FOR CREDIT LOSSES The allowance for credit losses (allowance), which consists of the allowance for loan losses and the allowance for unfunded credit commitments, is management’s estimate of credit losses inherent in the loan portfolio and unfunded credit commitments at the balance sheet date, excluding loans carried at fair value. It considers both unimpaired and impaired loans and is developed and documented at the loan portfolio segment level – commercial and consumer.
Unimpaired loans are generally evaluated on a collective basis by utilizing risk grades for the commercial loan portfolio segment and loss estimates for pools of loans with similar risk
126
characteristics for the consumer loan portfolio segment. Impaired loans are evaluated on an individual loan basis and predominantly include loans on nonaccrual status for commercial and industrial, commercial real estate, foreign loans and any loans modified in a TDR, on both accrual and nonaccrual status. Commercial and consumer PCI loans may require an allowance subsequent to their acquisition due to probable decreases in expected principal and interest cash flows (other than due to decreases in interest rate indices and changes in prepayment assumptions).
The allowance for each portfolio segment includes an amount for imprecision or uncertainty that may change from period to period. This imprecision amount represents management’s judgment of risks inherent in the evaluation processes and assumptions used in establishing the allowance. While our methodology attributes portions of the allowance to the specific portfolio segments, the entire allowance is available to absorb credit losses inherent in the total loan portfolio and unfunded credit commitments. No single statistic or measurement determines the adequacy of the allowance for credit losses.
Securitizations and Beneficial Interests In certain asset securitization transactions that meet the applicable criteria to be accounted for as a sale, assets are sold to an entity referred to as an SPE, which then issues beneficial interests in the form of senior and subordinated interests collateralized by the assets. In some cases, we may retain beneficial interests issued by the entity. Additionally, from time to time, we may also re-securitize certain assets in a new securitization transaction. The assets and liabilities transferred to an SPE are excluded from our consolidated balance sheet if the transfer qualifies as a sale and we are not required to consolidate the SPE. For transfers of financial assets recorded as sales, we recognize and initially measure at fair value all assets obtained (including beneficial interests) and liabilities incurred. We record a gain or loss in noninterest income for the difference between the carrying amount and the fair value of the assets sold. Fair values are based on quoted market prices, quoted market prices for similar assets, or if market prices are not available, then the fair value is estimated using discounted cash flow analyses with assumptions for credit losses, prepayments and discount rates that are corroborated by and independently verified against market observable data, where possible. Retained interests from securitizations with off-balance sheet entities, including SPEs and VIEs where we are not the primary beneficiary, are classified as available for sale securities, trading account assets or loans, and are accounted for as described herein.
Mortgage Servicing Rights (MSRs) We recognize the rights to service mortgage loans for others, or MSRs, as assets whether we purchase the MSRs or the MSRs result from a sale or securitization of loans we originate (asset transfers). We initially record all of our MSRs at fair value. Subsequently, residential loan MSRs are carried at either fair value or LOCOM based on our strategy for managing interest
rate risk. Currently, substantially all of our residential loan MSRs are carried at fair value. All of our MSRs related to our commercial mortgage loans are subsequently measured at LOCOM.
We base the fair value of MSRs on the present value of estimated future net servicing income cash flows. We estimate future net servicing income cash flows with assumptions that market participants would use to estimate fair value, including estimates of prepayment speeds (including housing price volatility), discount rates, default rates, cost to service (including delinquency and foreclosure costs), escrow account earnings, contractual servicing fee income, ancillary income and late fees. Our valuation approach is independently validated by our internal valuation model validation group and our valuation estimates are periodically benchmarked to independent appraisals. Changes in the fair value of MSRs occur primarily due to the collection/realization of expected cash flows, as well as changes in valuation inputs and assumptions. For MSRs carried at fair value, changes in fair value are reported in noninterest income in the period in which the change occurs. MSRs subsequently measured at LOCOM are amortized in proportion to, and over the period of, estimated net servicing income. The amortization of MSRs is reported in noninterest income, analyzed monthly and adjusted to reflect changes in prepayment speeds, as well as other factors. MSRs accounted for at LOCOM are periodically evaluated for impairment based on the fair value of those assets. For purposes of impairment evaluation and measurement, we stratify MSRs based on the predominant risk characteristics of the underlying loans, including investor and product type. If, by individual stratum, the carrying amount of these MSRs exceeds fair value, a valuation reserve is established. The valuation reserve is adjusted as the fair value changes.
Premises and Equipment Premises and equipment are carried at cost less accumulated depreciation and amortization. Capital leases, where we are the lessee, are included in premises and equipment at the capitalized amount less accumulated amortization. We primarily use the straight-line method of depreciation and amortization. Estimated useful lives range up to 40 years for buildings, up to 10 years for furniture and equipment, and the shorter of the estimated useful life or lease term for leasehold improvements. We amortize capitalized leased assets on a straight-line basis over the lives of the respective leases.
Goodwill and Identifiable Intangible Assets Goodwill is recorded in business combinations under the purchase method of accounting when the purchase price is higher than the fair value of net assets, including identifiable intangible assets. We assess goodwill for impairment annually, and more frequently in certain circumstances. We initially perform a qualitative assessment of goodwill to test for impairment. If, based on our qualitative review, we conclude that more likely than not a reporting unit’s fair value is less than its carrying amount, then we complete quantitative steps as described below to determine if there is goodwill impairment. If we conclude that
127
Note 1: Summary of Significant Accounting Policies (continued)
a reporting unit fair value is not less than its carrying amount, quantitative tests are not required. We have determined that our reporting units are one level below the operating segments. We assess goodwill for impairment on a reporting unit level and apply various quantitative valuation methodologies when required to compare the estimated fair value to the carrying value of each reporting unit. Valuation methodologies include discounted cash flow and earnings multiple approaches. If the fair value is less than the carrying amount, an additional test is required to measure the amount of impairment. We recognize impairment losses as a charge to noninterest expense (unless related to discontinued operations) and an adjustment to the carrying value of the goodwill asset. Subsequent reversals of goodwill impairment are prohibited. We amortize core deposit and other customer relationship intangibles on an accelerated basis over useful lives not exceeding 10 years. We review such intangibles for impairment whenever events or changes in circumstances indicate that their carrying amounts may not be recoverable. Impairment is indicated if the sum of undiscounted estimated future net cash flows is less than the carrying value of the asset. Impairment is permanently recognized by writing down the asset to the extent that the carrying value exceeds the estimated fair value.
Operating Lease Assets Operating lease rental income for leased assets is recognized in other income on a straight-line basis over the lease term. Related depreciation expense is recorded on a straight-line basis over the estimated useful life, considering the estimated residual value of the leased asset. The useful life may be adjusted to the term of the lease depending on our plans for the asset after the lease term. On a periodic basis, leased assets are reviewed for impairment. Impairment loss is recognized if the carrying amount of leased assets exceeds fair value and is not recoverable. The carrying amount of leased assets is not recoverable if it exceeds the sum of the undiscounted cash flows expected to result from the lease payments and the estimated residual value upon the eventual disposition of the equipment.
Liability for Mortgage Loan Repurchase Losses We sell residential mortgage loans to various parties, including (1) Freddie Mac and Fannie Mae (government-sponsored entities (GSEs)), which include the mortgage loans in GSE-guaranteed mortgage securitizations, (2) special purpose entities that issue private label MBS, and (3) other financial institutions that purchase mortgage loans for investment or private label securitization. In addition, we pool Federal Housing Administration (FHA)-insured and Department of Veterans Affairs (VA)-guaranteed mortgage loans, which back securities guaranteed by the Government National Mortgage Association (GNMA). We may be required to repurchase mortgage loans, indemnify the securitization trust, investor or insurer, or reimburse the securitization trust, investor or insurer for credit losses incurred on loans (collectively “repurchase”) in the event of a breach of specified contractual representations or warranties that are not remedied within a period (usually 90 days or less) after we receive notice of the breach. Our loan sale contracts to
private investors (non-GSE) typically contain an additional provision where we would only be required to repurchase securitized loans if a breach is deemed to have a material and adverse effect on the value of the mortgage loan or to the investors or interests of security holders in the mortgage loan. We establish mortgage repurchase liabilities related to various representations and warranties that reflect management’s estimate of losses for loans for which we could have a repurchase obligation, whether or not we currently service those loans, based on a combination of factors. Such factors include default expectations, expected investor repurchase demands (influenced by current and expected mortgage loan file requests and mortgage insurance rescissions notices, as well as estimated demand to default and file request relationships) and appeals success rates (where the investor rescinds the demand based on a cure of the defect or acknowledges that the loan satisfies the investor’s applicable representations and warranties), reimbursement by correspondent and other third party originators, and projected loss severity. We establish a liability at the time loans are sold and continually update our liability estimate during their life. Although investors may demand repurchase at any time and there is often a lag from the date of default to the time we receive a repurchase demand, the majority of repurchase demands occur on loans that default in the first 24 to 36 months following origination of the mortgage loan and can vary by investor. The liability for mortgage loan repurchase losses is included in other liabilities. For additional information on our repurchase liability, see Note 9. Pension Accounting We account for our defined benefit pension plans using an actuarial model as more fully discussed in Note 20.
Income Taxes We file consolidated and separate company federal income tax returns, foreign tax returns and various combined and separate company state tax returns.
We evaluate two components of income tax expense: current and deferred. Current income tax expense approximates taxes to be paid or refunded for the current period and includes income tax expense related to our uncertain tax positions. We determine deferred income taxes using the balance sheet method. Under this method, the net deferred tax asset or liability is based on the tax effects of the differences between the book and tax bases of assets and liabilities, and recognizes enacted changes in tax rates and laws in the period in which they occur. Deferred income tax expense results from changes in deferred tax assets and liabilities between periods. Deferred tax assets are recognized subject to management's judgment that realization is “more likely than not.” Uncertain tax positions that meet the more likely than not recognition threshold are measured to determine the amount of benefit to recognize. An uncertain tax position is measured at the largest amount of benefit that management believes has a greater than 50% likelihood of realization upon settlement. Foreign taxes paid are generally applied as credits to reduce federal income taxes payable. We account for interest and penalties as a component of income tax expense.
128
Stock-Based Compensation We have stock-based employee compensation plans as more fully discussed in Note 19. Our compensation expense includes the associated costs for all share-based awards.
Earnings Per Common Share We compute earnings per common share by dividing net income (after deducting dividends and related accretion on preferred stock) by the average number of common shares outstanding during the year. We compute diluted earnings per common share by dividing net income (after deducting dividends and related accretion on preferred stock) by the average number of common shares outstanding during the year, plus the effect of common stock equivalents (for example, stock options, restricted share rights, convertible debentures and warrants) that are dilutive.
Derivatives and Hedging Activities We recognize all derivatives in the balance sheet at fair value. On the date we enter into a derivative contract, we designate the derivative as (1) a hedge of the fair value of a recognized asset or liability, including hedges of foreign currency exposure (“fair value” hedge), (2) a hedge of a forecasted transaction or of the variability of cash flows to be received or paid related to a recognized asset or liability (“cash flow” hedge), or (3) held for trading, customer accommodation or asset/liability risk management purposes, including economic hedges not qualifying for hedge accounting. For a fair value hedge, we record changes in the fair value of the derivative and, to the extent that it is effective, changes in the fair value of the hedged asset or liability attributable to the hedged risk, in current period earnings in the same financial statement category as the hedged item. For a cash flow hedge, we record changes in the fair value of the derivative to the extent that it is effective in OCI, with any ineffectiveness recorded in current period earnings. We subsequently reclassify these changes in fair value to net income in the same period(s) that the hedged transaction affects net income in the same financial statement category as the hedged item. For free-standing derivatives, we report changes in the fair values in current period noninterest income. For fair value and cash flow hedges qualifying for hedge accounting, we formally document at inception the relationship between hedging instruments and hedged items, our risk management objective, strategy and our evaluation of effectiveness for our hedge transactions. This includes linking all derivatives designated as fair value or cash flow hedges to specific assets and liabilities in the balance sheet or to specific forecasted transactions. Periodically, as required, we also formally assess whether the derivative we designated in each hedging relationship is expected to be and has been highly effective in offsetting changes in fair values or cash flows of the hedged item using the regression analysis method or, in limited cases, the dollar offset method. We discontinue hedge accounting prospectively when (1) a derivative is no longer highly effective in offsetting changes in the fair value or cash flows of a hedged item, (2) a derivative expires or is sold, terminated or exercised, (3) a derivative is de-designated as a hedge, because it is unlikely that a forecasted
transaction will occur, or (4) we elect to discontinue the designation of a derivative as a hedge. When we discontinue hedge accounting because a derivative no longer qualifies as an effective fair value hedge, we continue to carry the derivative in the balance sheet at its fair value with changes in fair value included in earnings, and no longer adjust the previously hedged asset or liability for changes in fair value. Previous adjustments to the hedged item are accounted for in the same manner as other components of the carrying amount of the asset or liability. When we discontinue cash flow hedge accounting because the hedging instrument is sold, terminated or no longer designated (de-designated), the amount reported in OCI up to the date of sale, termination or de-designation continues to be reported in OCI until the forecasted transaction affects earnings. When we discontinue cash flow hedge accounting because it is probable that a forecasted transaction will not occur, we continue to carry the derivative in the balance sheet at its fair value with changes in fair value included in earnings, and immediately recognize gains and losses that were accumulated in OCI in earnings. In all other situations in which we discontinue hedge accounting, the derivative will be carried at its fair value in the balance sheet, with changes in its fair value recognized in current period earnings. We occasionally purchase or originate financial instruments that contain an embedded derivative. At inception of the financial instrument, we assess (1) if the economic characteristics of the embedded derivative are not clearly and closely related to the economic characteristics of the financial instrument (host contract), (2) if the financial instrument that embodies both the embedded derivative and the host contract is not measured at fair value with changes in fair value reported in earnings, and (3) if a separate instrument with the same terms as the embedded instrument would meet the definition of a derivative. If the embedded derivative meets all of these conditions, we separate it from the host contract by recording the bifurcated derivative at fair value and the remaining host contract at the difference between the basis of the hybrid instrument and the fair value of the bifurcated derivative. The bifurcated derivative is carried as a free-standing derivative at fair value with changes recorded in current period earnings. Private Share Repurchases In December 2011, we entered into a private forward repurchase contract with an unrelated third party. This contract settled for approximately 6 million shares of our common stock in first quarter 2012. We also entered into a similar contract in August 2011, which settled in November 2011 for approximately 6 million shares of our common stock. These contracts met accounting requirements to be treated as permanent equity transactions. We entered into these contracts to complement our open-market common stock repurchase strategies, to allow us to manage our share repurchases in a manner consistent with our 2011 Federal Reserve Board (FRB) Comprehensive Capital Analysis and Review plan (capital plan), and to provide an economic benefit to the Company. In connection with each contract, we paid $150 million to the counterparty, which was recorded in permanent equity and was not subject to re-
129
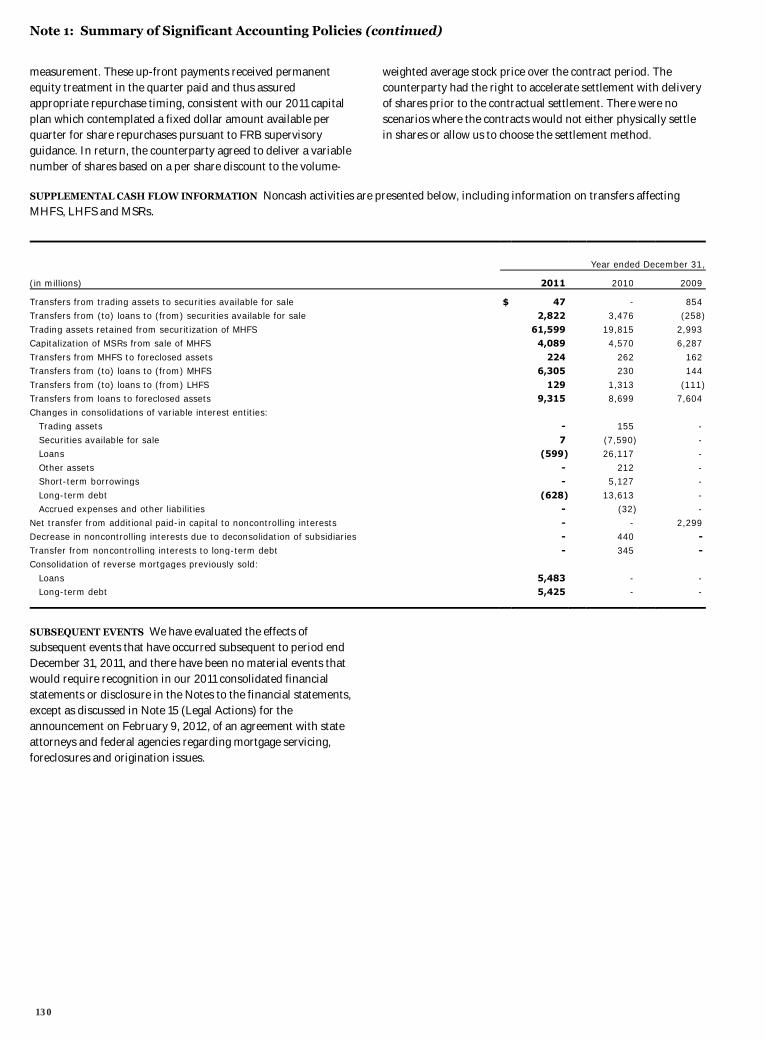
Note 1: Summary of Significant Accounting Policies (continued)
measurement. These up-front payments received permanent equity treatment in the quarter paid and thus assured appropriate repurchase timing, consistent with our 2011 capital plan which contemplated a fixed dollar amount available per quarter for share repurchases pursuant to FRB supervisory guidance. In return, the counterparty agreed to deliver a variable number of shares based on a per share discount to the volume-
weighted average stock price over the contract period. The counterparty had the right to accelerate settlement with delivery of shares prior to the contractual settlement. There were no scenarios where the contracts would not either physically settle in shares or allow us to choose the settlement method.
SUPPLEMENTAL CASH FLOW INFORMATION Noncash activities are presented below, including information on transfers affecting MHFS, LHFS and MSRs.
Year ended December 31,
(in millions) 2011 2010 2009
Transfers from trading assets to securities available for sale $ 47 - 854 Transfers from (to) loans to (from) securities available for sale 2,822 3,476 (258)
Trading assets retained from securitization of MHFS 61,599 19,815 2,993 Capitalization of MSRs from sale of MHFS 4,089 4,570 6,287
Transfers from MHFS to foreclosed assets 224 262 162 Transfers from (to) loans to (from) MHFS 6,305 230 144
Transfers from (to) loans to (from) LHFS 129 1,313 (111) Transfers from loans to foreclosed assets 9,315 8,699 7,604
Changes in consolidations of variable interest entities: Trading assets - 155 -
Securities available for sale 7 (7,590) - Loans (599) 26,117 -
Other assets - 212 - Short-term borrowings - 5,127 -
Long-term debt (628) 13,613 - Accrued expenses and other liabilities - (32) -
Net transfer from additional paid-in capital to noncontrolling interests - - 2,299 Decrease in noncontrolling interests due to deconsolidation of subsidiaries - 440 -
Transfer from noncontrolling interests to long-term debt - 345 - Consolidation of reverse mortgages previously sold:
Loans 5,483 - - Long-term debt 5,425 - - SUBSEQUENT EVENTS We have evaluated the effects of subsequent events that have occurred subsequent to period end December 31, 2011, and there have been no material events that would require recognition in our 2011 consolidated financial statements or disclosure in the Notes to the financial statements, except as discussed in Note 15 (Legal Actions) for the announcement on February 9, 2012, of an agreement with state attorneys and federal agencies regarding mortgage servicing, foreclosures and origination issues.
130
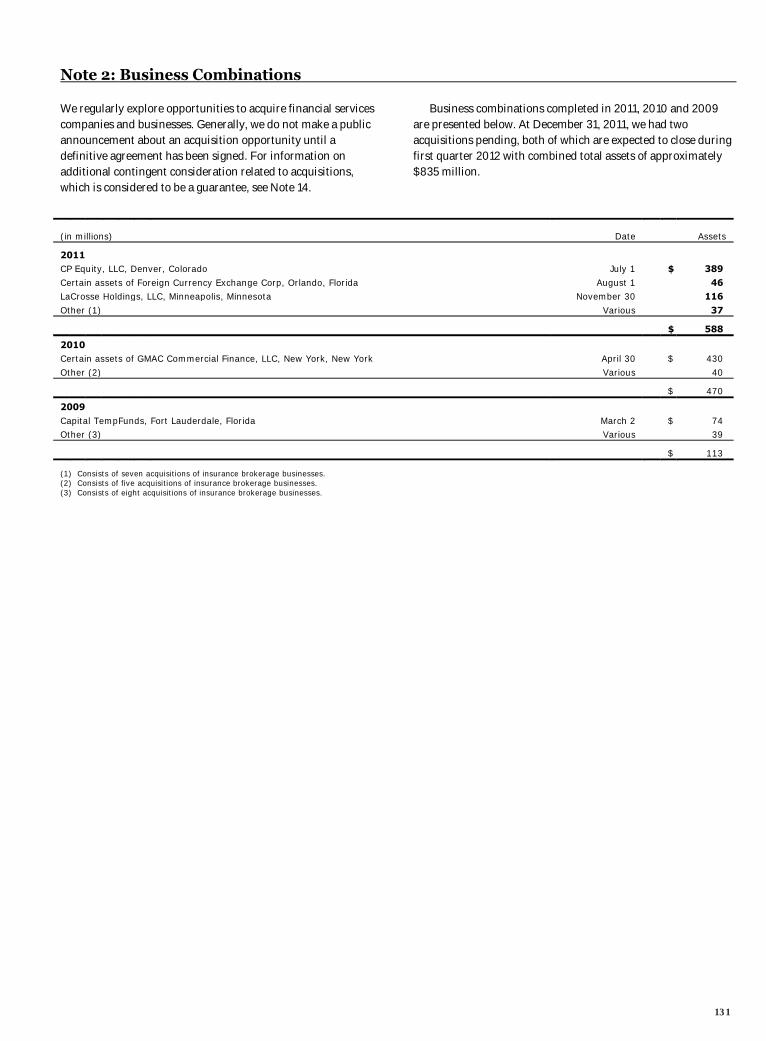
Note 2: Business Combinations
We regularly explore opportunities to acquire financial services companies and businesses. Generally, we do not make a public announcement about an acquisition opportunity until a definitive agreement has been signed. For information on additional contingent consideration related to acquisitions, which is considered to be a guarantee, see Note 14.
Business combinations completed in 2011, 2010 and 2009 are presented below. At December 31, 2011, we had two acquisitions pending, both of which are expected to close during first quarter 2012 with combined total assets of approximately $835 million.
(in millions) Date Assets
2011 CP Equity, LLC, Denver, Colorado July 1 $ 389
Certain assets of Foreign Currency Exchange Corp, Orlando, Florida August 1 46 LaCrosse Holdings, LLC, Minneapolis, Minnesota November 30 116
Other (1) Various 37
$ 588
2010 Certain assets of GMAC Commercial Finance, LLC, New York, New York April 30 $ 430
Other (2) Various 40
$ 470
2009
Capital TempFunds, Fort Lauderdale, Florida March 2 $ 74 Other (3) Various 39
$ 113
(1) Consists of seven acquisitions of insurance brokerage businesses. (2) Consists of five acquisitions of insurance brokerage businesses. (3) Consists of eight acquisitions of insurance brokerage businesses.
131
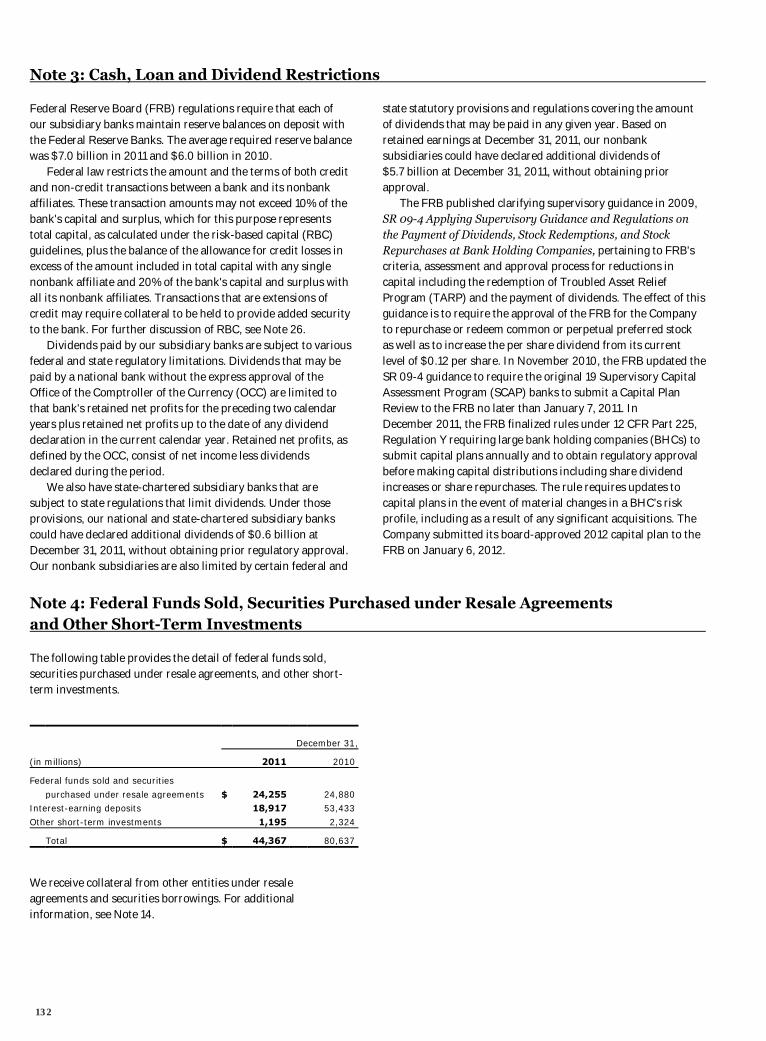
Note 3: Cash, Loan and Dividend Restrictions
Federal Reserve Board (FRB) regulations require that each of our subsidiary banks maintain reserve balances on deposit with the Federal Reserve Banks. The average required reserve balance was $7.0 billion in 2011 and $6.0 billion in 2010. Federal law restricts the amount and the terms of both credit and non-credit transactions between a bank and its nonbank affiliates. These transaction amounts may not exceed 10% of the bank's capital and surplus, which for this purpose represents total capital, as calculated under the risk-based capital (RBC) guidelines, plus the balance of the allowance for credit losses in excess of the amount included in total capital with any single nonbank affiliate and 20% of the bank's capital and surplus with all its nonbank affiliates. Transactions that are extensions of credit may require collateral to be held to provide added security to the bank. For further discussion of RBC, see Note 26. Dividends paid by our subsidiary banks are subject to various federal and state regulatory limitations. Dividends that may be paid by a national bank without the express approval of the Office of the Comptroller of the Currency (OCC) are limited to that bank's retained net profits for the preceding two calendar years plus retained net profits up to the date of any dividend declaration in the current calendar year. Retained net profits, as defined by the OCC, consist of net income less dividends declared during the period. We also have state-chartered subsidiary banks that are subject to state regulations that limit dividends. Under those provisions, our national and state-chartered subsidiary banks could have declared additional dividends of $0.6 billion at December 31, 2011, without obtaining prior regulatory approval. Our nonbank subsidiaries are also limited by certain federal and
state statutory provisions and regulations covering the amount of dividends that may be paid in any given year. Based on retained earnings at December 31, 2011, our nonbank subsidiaries could have declared additional dividends of $5.7 billion at December 31, 2011, without obtaining prior approval. The FRB published clarifying supervisory guidance in 2009, SR 09-4 Applying Supervisory Guidance and Regulations on the Payment of Dividends, Stock Redemptions, and Stock Repurchases at Bank Holding Companies, pertaining to FRB's criteria, assessment and approval process for reductions in capital including the redemption of Troubled Asset Relief Program (TARP) and the payment of dividends. The effect of this guidance is to require the approval of the FRB for the Company to repurchase or redeem common or perpetual preferred stock as well as to increase the per share dividend from its current level of $0.12 per share. In November 2010, the FRB updated the SR 09-4 guidance to require the original 19 Supervisory Capital Assessment Program (SCAP) banks to submit a Capital Plan Review to the FRB no later than January 7, 2011. In December 2011, the FRB finalized rules under 12 CFR Part 225, Regulation Y requiring large bank holding companies (BHCs) to submit capital plans annually and to obtain regulatory approval before making capital distributions including share dividend increases or share repurchases. The rule requires updates to capital plans in the event of material changes in a BHC’s risk profile, including as a result of any significant acquisitions. The Company submitted its board-approved 2012 capital plan to the FRB on January 6, 2012.
Note 4: Federal Funds Sold, Securities Purchased under Resale Agreements and Other Short-Term Investments
The following table provides the detail of federal funds sold, securities purchased under resale agreements, and other short-term investments.
December 31,
(in millions) 2011 2010
Federal funds sold and securities
purchased under resale agreements $ 24,255 24,880 Interest-earning deposits 18,917 53,433
Other short-term investments 1,195 2,324
Total $ 44,367 80,637
We receive collateral from other entities under resale agreements and securities borrowings. For additional information, see Note 14.
132
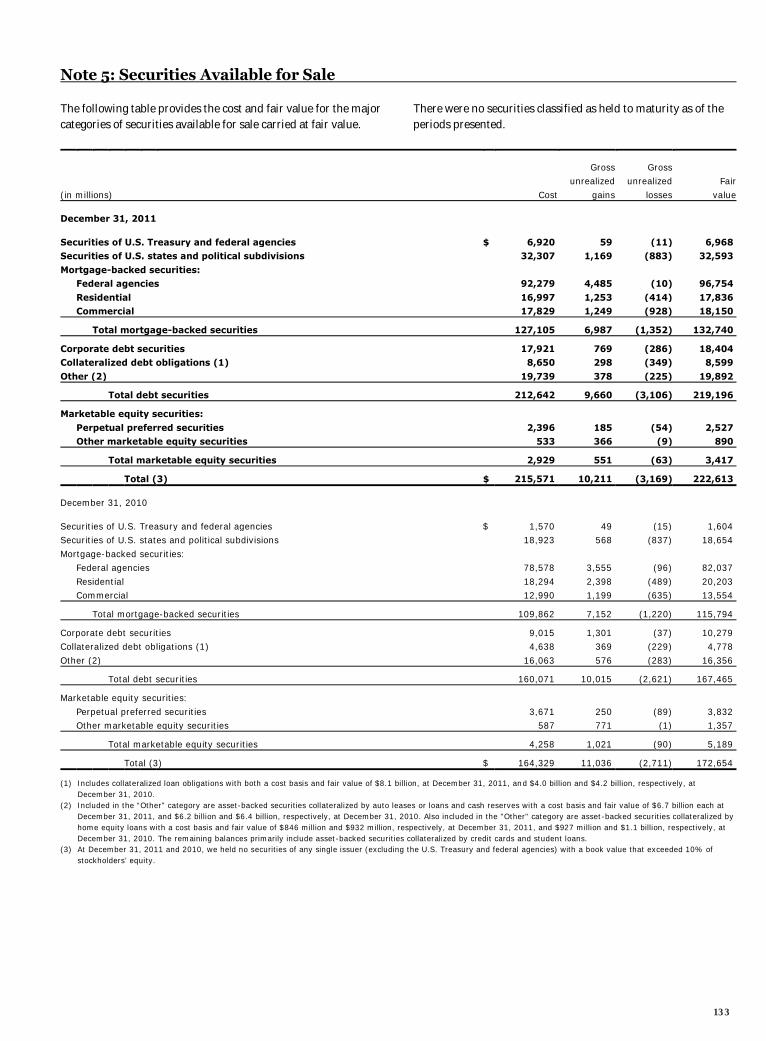
Note 5: Securities Available for Sale
The following table provides the cost and fair value for the major categories of securities available for sale carried at fair value.
There were no securities classified as held to maturity as of the periods presented.
Gross Gross unrealized unrealized Fair
(in millions) Cost gains losses value
December 31, 2011 Securities of U.S. Treasury and federal agencies $ 6,920 59 (11) 6,968 Securities of U.S. states and political subdivisions 32,307 1,169 (883) 32,593
Mortgage-backed securities: Federal agencies 92,279 4,485 (10) 96,754
Residential 16,997 1,253 (414) 17,836 Commercial 17,829 1,249 (928) 18,150
Total mortgage-backed securities 127,105 6,987 (1,352) 132,740
Corporate debt securities 17,921 769 (286) 18,404 Collateralized debt obligations (1) 8,650 298 (349) 8,599
Other (2) 19,739 378 (225) 19,892
Total debt securities 212,642 9,660 (3,106) 219,196
Marketable equity securities:
Perpetual preferred securities 2,396 185 (54) 2,527 Other marketable equity securities 533 366 (9) 890
Total marketable equity securities 2,929 551 (63) 3,417
Total (3) $ 215,571 10,211 (3,169) 222,613
December 31, 2010 Securities of U.S. Treasury and federal agencies $ 1,570 49 (15) 1,604 Securities of U.S. states and political subdivisions 18,923 568 (837) 18,654
Mortgage-backed securities: Federal agencies 78,578 3,555 (96) 82,037
Residential 18,294 2,398 (489) 20,203 Commercial 12,990 1,199 (635) 13,554
Total mortgage-backed securities 109,862 7,152 (1,220) 115,794
Corporate debt securities 9,015 1,301 (37) 10,279 Collateralized debt obligations (1) 4,638 369 (229) 4,778
Other (2) 16,063 576 (283) 16,356
Total debt securities 160,071 10,015 (2,621) 167,465
Marketable equity securities:
Perpetual preferred securities 3,671 250 (89) 3,832 Other marketable equity securities 587 771 (1) 1,357
Total marketable equity securities 4,258 1,021 (90) 5,189
Total (3) $ 164,329 11,036 (2,711) 172,654
(1) Includes collateralized loan obligations with both a cost basis and fair value of $8.1 billion, at December 31, 2011, and $4.0 billion and $4.2 billion, respectively, at December 31, 2010.
(2) Included in the “Other” category are asset-backed securities collateralized by auto leases or loans and cash reserves with a cost basis and fair value of $6.7 billion each at December 31, 2011, and $6.2 billion and $6.4 billion, respectively, at December 31, 2010. Also included in the "Other" category are asset-backed securities collateralized by home equity loans with a cost basis and fair value of $846 million and $932 million, respectively, at December 31, 2011, and $927 million and $1.1 billion, respectively, at December 31, 2010. The remaining balances primarily include asset-backed securities collateralized by credit cards and student loans.
(3) At December 31, 2011 and 2010, we held no securities of any single issuer (excluding the U.S. Treasury and federal agencies) with a book value that exceeded 10% of stockholders’ equity.
133
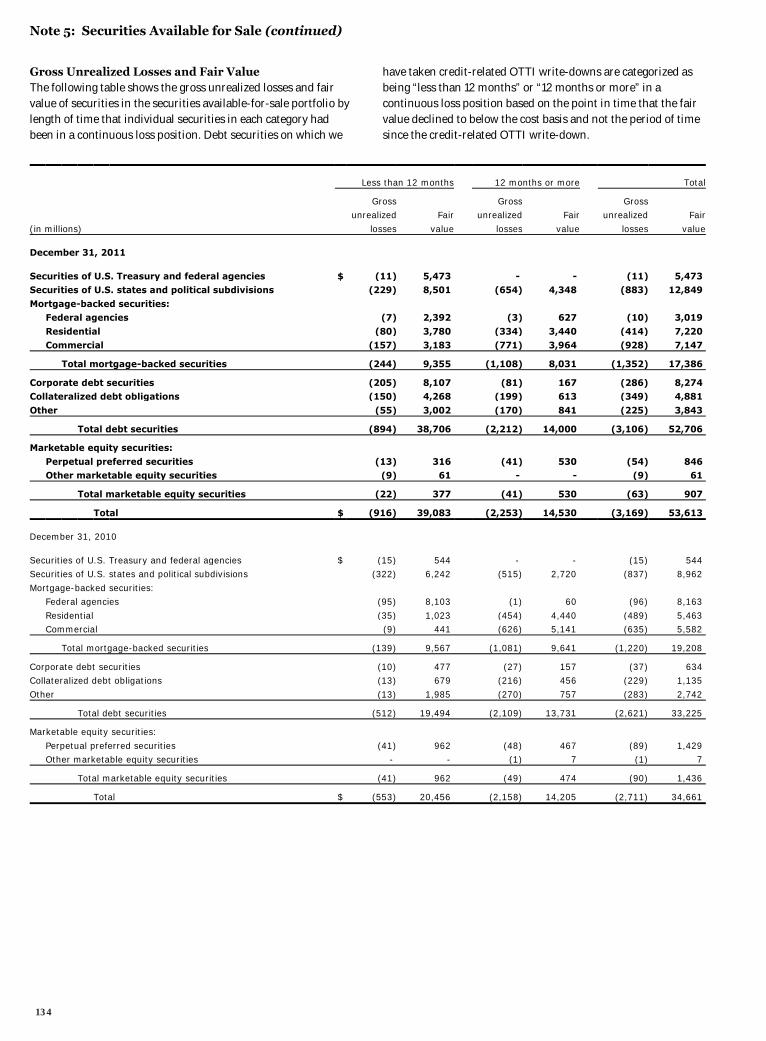
Note 5: Securities Available for Sale (continued)
Gross Unrealized Losses and Fair Value The following table shows the gross unrealized losses and fair value of securities in the securities available-for-sale portfolio by length of time that individual securities in each category had been in a continuous loss position. Debt securities on which we
have taken credit-related OTTI write-downs are categorized as being “less than 12 months” or “12 months or more” in a continuous loss position based on the point in time that the fair value declined to below the cost basis and not the period of time since the credit-related OTTI write-down.
Less than 12 months 12 months or more Total
Gross Gross Gross unrealized Fair unrealized Fair unrealized Fair
(in millions) losses value losses value losses value
December 31, 2011 Securities of U.S. Treasury and federal agencies $ (11) 5,473 - - (11) 5,473 Securities of U.S. states and political subdivisions (229) 8,501 (654) 4,348 (883) 12,849
Mortgage-backed securities: Federal agencies (7) 2,392 (3) 627 (10) 3,019
Residential (80) 3,780 (334) 3,440 (414) 7,220 Commercial (157) 3,183 (771) 3,964 (928) 7,147
Total mortgage-backed securities (244) 9,355 (1,108) 8,031 (1,352) 17,386
Corporate debt securities (205) 8,107 (81) 167 (286) 8,274 Collateralized debt obligations (150) 4,268 (199) 613 (349) 4,881
Other (55) 3,002 (170) 841 (225) 3,843
Total debt securities (894) 38,706 (2,212) 14,000 (3,106) 52,706
Marketable equity securities:
Perpetual preferred securities (13) 316 (41) 530 (54) 846 Other marketable equity securities (9) 61 - - (9) 61
Total marketable equity securities (22) 377 (41) 530 (63) 907
Total $ (916) 39,083 (2,253) 14,530 (3,169) 53,613
December 31, 2010 Securities of U.S. Treasury and federal agencies $ (15) 544 - - (15) 544 Securities of U.S. states and political subdivisions (322) 6,242 (515) 2,720 (837) 8,962
Mortgage-backed securities: Federal agencies (95) 8,103 (1) 60 (96) 8,163
Residential (35) 1,023 (454) 4,440 (489) 5,463 Commercial (9) 441 (626) 5,141 (635) 5,582
Total mortgage-backed securities (139) 9,567 (1,081) 9,641 (1,220) 19,208
Corporate debt securities (10) 477 (27) 157 (37) 634 Collateralized debt obligations (13) 679 (216) 456 (229) 1,135
Other (13) 1,985 (270) 757 (283) 2,742
Total debt securities (512) 19,494 (2,109) 13,731 (2,621) 33,225
Marketable equity securities:
Perpetual preferred securities (41) 962 (48) 467 (89) 1,429 Other marketable equity securities - - (1) 7 (1) 7
Total marketable equity securities (41) 962 (49) 474 (90) 1,436
Total $ (553) 20,456 (2,158) 14,205 (2,711) 34,661
134

We do not have the intent to sell any securities included in the previous table. For debt securities included in the table, we have concluded it is more likely than not that we will not be required to sell prior to recovery of the amortized cost basis. We have assessed each security with gross unrealized losses for credit impairment. For debt securities, we evaluate, where necessary, whether credit impairment exists by comparing the present value of the expected cash flows to the securities’ amortized cost basis. For equity securities, we consider numerous factors in determining whether impairment exists, including our intent and ability to hold the securities for a period of time sufficient to recover the cost basis of the securities. See Note 1 – “Securities” for the factors that we consider in our analysis of OTTI for debt and equity securities available for sale. SECURITIES OF U.S. TREASURY AND FEDERAL AGENCIES AND
FEDERAL AGENCY MORTGAGE-BACKED SECURITIES (MBS) The unrealized losses associated with U.S. Treasury and federal agency securities and federal agency MBS are primarily driven by changes in interest rates and not due to credit losses given the explicit or implicit guarantees provided by the U.S. government. SECURITIES OF U.S. STATES AND POLITICAL SUBDIVISIONS The unrealized losses associated with securities of U.S. states and political subdivisions are primarily driven by changes in interest rates and not due to the credit quality of the securities. Substantially all of these investments are investment grade. The securities were generally underwritten in accordance with our own investment standards prior to the decision to purchase. Some of these securities are guaranteed by a bond insurer, but we did not rely on this guarantee in making our investment decision. These investments will continue to be monitored as part of our ongoing impairment analysis, but are expected to perform, even if the rating agencies reduce the credit rating of the bond insurers. As a result, we expect to recover the entire amortized cost basis of these securities. RESIDENTIAL AND COMMERCIAL MBS The unrealized losses associated with private residential MBS and commercial MBS are primarily driven by changes in projected collateral losses, credit spreads and interest rates. We assess for credit impairment by estimating the present value of expected cash flows. The key assumptions for determining expected cash flows include default rates, loss severities and prepayment rates. We estimate losses to a security by forecasting the underlying mortgage loans in each transaction. We use forecasted loan performance to project cash flows to the various tranches in the structure. We also consider cash flow forecasts and, as applicable, independent industry analyst reports and forecasts, sector credit ratings, and other independent market data. Based upon our assessment of the expected credit losses and the credit enhancement level of the securities, we expect to recover the entire amortized cost basis of these securities. CORPORATE DEBT SECURITIES The unrealized losses associated with corporate debt securities are primarily related to unsecured debt obligations issued by various corporations. We
evaluate the financial performance of each issuer on a quarterly basis to determine that the issuer can make all contractual principal and interest payments. Based upon this assessment, we expect to recover the entire amortized cost basis of these securities. COLLATERALIZED DEBT OBLIGATIONS (CDOs) The unrealized losses associated with CDOs relate to securities primarily backed by commercial, residential or other consumer collateral. The unrealized losses are primarily driven by changes in projected collateral losses, credit spreads and interest rates. We assess for credit impairment by estimating the present value of expected cash flows. The key assumptions for determining expected cash flows include default rates, loss severities and prepayment rates. We also consider cash flow forecasts and, as applicable, independent industry analyst reports and forecasts, sector credit ratings, and other independent market data. Based upon our assessment of the expected credit losses and the credit enhancement level of the securities, we expect to recover the entire amortized cost basis of these securities. OTHER DEBT SECURITIES The unrealized losses associated with other debt securities primarily relate to other asset-backed securities. The losses are primarily driven by changes in projected collateral losses, credit spreads and interest rates. We assess for credit impairment by estimating the present value of expected cash flows. The key assumptions for determining expected cash flows include default rates, loss severities and prepayment rates. Based upon our assessment of the expected credit losses and the credit enhancement level of the securities, we expect to recover the entire amortized cost basis of these securities. MARKETABLE EQUITY SECURITIES Our marketable equity securities include investments in perpetual preferred securities, which provide very attractive tax-equivalent yields. We evaluated these hybrid financial instruments with investment-grade ratings for impairment using an evaluation methodology similar to that used for debt securities. Perpetual preferred securities are not considered to be other-than-temporarily impaired if there is no evidence of credit deterioration or investment rating downgrades of any issuers to below investment grade, and we expect to continue to receive full contractual payments. We will continue to evaluate the prospects for these securities for recovery in their market value in accordance with our policy for estimating OTTI. We have recorded impairment write-downs on perpetual preferred securities where there was evidence of credit deterioration. OTHER SECURITIES AVAILABLE FOR SALE MATTERS The fair values of our investment securities could decline in the future if the underlying performance of the collateral for the residential and commercial MBS or other securities deteriorate and our credit enhancement levels do not provide sufficient protection to our contractual principal and interest. As a result, there is a risk that significant OTTI may occur in the future. The following table shows the gross unrealized losses and fair value of debt and perpetual preferred securities available for sale
135
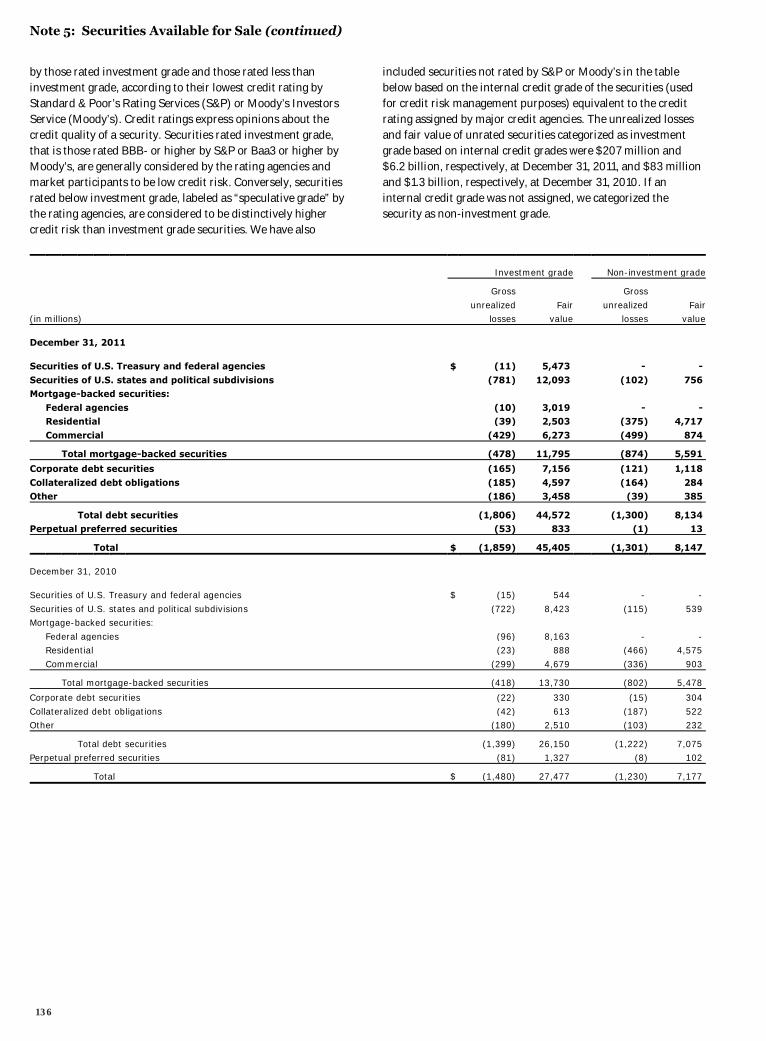
Note 5: Securities Available for Sale (continued)
by those rated investment grade and those rated less than investment grade, according to their lowest credit rating by Standard & Poor’s Rating Services (S&P) or Moody’s Investors Service (Moody’s). Credit ratings express opinions about the credit quality of a security. Securities rated investment grade, that is those rated BBB- or higher by S&P or Baa3 or higher by Moody’s, are generally considered by the rating agencies and market participants to be low credit risk. Conversely, securities rated below investment grade, labeled as “speculative grade” by the rating agencies, are considered to be distinctively higher credit risk than investment grade securities. We have also
included securities not rated by S&P or Moody’s in the table below based on the internal credit grade of the securities (used for credit risk management purposes) equivalent to the credit rating assigned by major credit agencies. The unrealized losses and fair value of unrated securities categorized as investment grade based on internal credit grades were $207 million and $6.2 billion, respectively, at December 31, 2011, and $83 million and $1.3 billion, respectively, at December 31, 2010. If an internal credit grade was not assigned, we categorized the security as non-investment grade.
Investment grade Non-investment grade
Gross Gross
unrealized Fair unrealized Fair (in millions) losses value losses value
December 31, 2011 Securities of U.S. Treasury and federal agencies $ (11) 5,473 - -
Securities of U.S. states and political subdivisions (781) 12,093 (102) 756 Mortgage-backed securities:
Federal agencies (10) 3,019 - - Residential (39) 2,503 (375) 4,717
Commercial (429) 6,273 (499) 874
Total mortgage-backed securities (478) 11,795 (874) 5,591
Corporate debt securities (165) 7,156 (121) 1,118
Collateralized debt obligations (185) 4,597 (164) 284 Other (186) 3,458 (39) 385
Total debt securities (1,806) 44,572 (1,300) 8,134 Perpetual preferred securities (53) 833 (1) 13
Total $ (1,859) 45,405 (1,301) 8,147
December 31, 2010 Securities of U.S. Treasury and federal agencies $ (15) 544 - -
Securities of U.S. states and political subdivisions (722) 8,423 (115) 539 Mortgage-backed securities:
Federal agencies (96) 8,163 - - Residential (23) 888 (466) 4,575
Commercial (299) 4,679 (336) 903
Total mortgage-backed securities (418) 13,730 (802) 5,478
Corporate debt securities (22) 330 (15) 304
Collateralized debt obligations (42) 613 (187) 522 Other (180) 2,510 (103) 232
Total debt securities (1,399) 26,150 (1,222) 7,075 Perpetual preferred securities (81) 1,327 (8) 102
Total $ (1,480) 27,477 (1,230) 7,177
136

Contractual Maturities The following table shows the remaining contractual maturities and contractual yields of debt securities available for sale. The remaining contractual principal maturities for MBS do not consider prepayments. Remaining expected maturities will differ
from contractual maturities because borrowers may have the right to prepay obligations before the underlying mortgages mature.
Remaining contractual principal maturity
Weighted- After one year After five years
Total average Within one year through five years through ten years After ten years
(in millions) amount yield Amount Yield Amount Yield Amount Yield Amount Yield
December 31, 2011 Securities of U.S. Treasury
and federal agencies $ 6,968 0.91 % $ 57 0.48 % $ 6,659 0.84 % $ 194 2.73 % $ 58 3.81 % Securities of U.S. states and
political subdivisions 32,593 4.94 520 3.02 11,679 2.90 2,692 5.31 17,702 6.28 Mortgage-backed securities:
Federal agencies 96,754 4.39 1 6.47 442 4.02 1,399 3.07 94,912 4.42 Residential 17,836 4.51 - - - - 640 1.88 17,196 4.61
Commercial 18,150 5.40 - - - - 87 3.33 18,063 5.41
Total mortgage-backed securities 132,740 4.55 1 6.47 442 4.02 2,126 2.72 130,171 4.58
Corporate debt securities 18,404 4.64 815 5.57 11,022 3.40 4,691 6.67 1,876 6.38 Collateralized debt
obligations 8,599 1.10 - - 540 1.61 6,813 1.00 1,246 1.42 Other 19,892 1.89 506 2.29 12,963 1.75 3,149 2.04 3,274 2.29
Total debt securities
at fair value $ 219,196 4.12 % $ 1,899 3.85 % $ 43,305 2.36 % $ 19,665 3.31 % $ 154,327 4.72 %
December 31, 2010 Securities of U.S. Treasury and federal agencies $ 1,604 2.54 % $ 9 5.07 % $ 641 1.72 % $ 852 2.94 % $ 102 4.15 %
Securities of U.S. states and political subdivisions 18,654 5.99 322 3.83 3,210 3.57 1,884 6.13 13,238 6.60
Mortgage-backed securities: Federal agencies 82,037 5.01 5 6.63 28 6.58 420 5.23 81,584 5.00
Residential 20,203 4.98 - - - - 341 3.20 19,862 5.01 Commercial 13,554 5.39 - - 1 1.38 215 5.28 13,338 5.39
Total mortgage-backed securities 115,794 5.05 5 6.63 29 6.38 976 4.53 114,784 5.05
Corporate debt securities 10,279 5.94 545 7.82 3,853 6.01 4,817 5.62 1,064 6.21
Collateralized debt obligations 4,778 0.80 - - 545 0.88 2,581 0.72 1,652 0.90 Other 16,356 2.53 1,588 2.89 7,887 3.00 4,367 2.01 2,514 1.72
Total debt securities at fair value $ 167,465 4.81 % $ 2,469 4.12 % $ 16,165 3.72 % $ 15,477 3.63 % $ 133,354 5.10 %
137
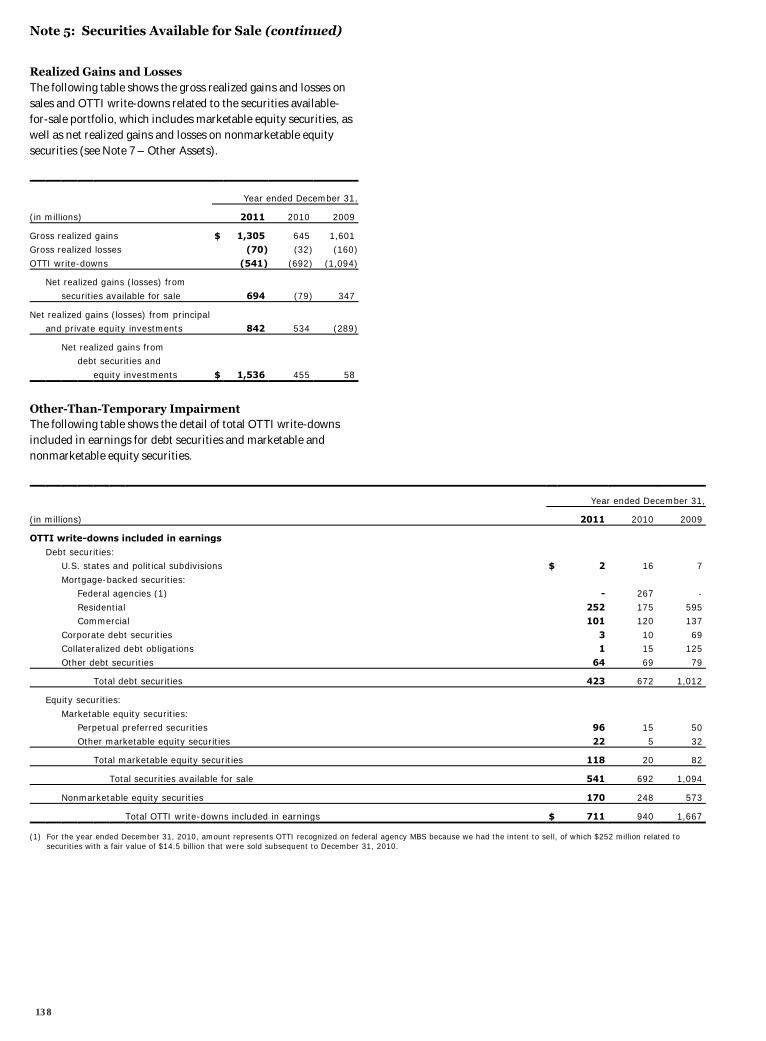
Note 5: Securities Available for Sale (continued)
Realized Gains and Losses The following table shows the gross realized gains and losses on sales and OTTI write-downs related to the securities available-for-sale portfolio, which includes marketable equity securities, as well as net realized gains and losses on nonmarketable equity securities (see Note 7 – Other Assets).
Year ended December 31,
(in millions) 2011 2010 2009
Gross realized gains $ 1,305 645 1,601 Gross realized losses (70) (32) (160)
OTTI write-downs (541) (692) (1,094)
Net realized gains (losses) from
securities available for sale 694 (79) 347
Net realized gains (losses) from principal and private equity investments 842 534 (289)
Net realized gains from debt securities and
equity investments $ 1,536 455 58
Other-Than-Temporary Impairment The following table shows the detail of total OTTI write-downs included in earnings for debt securities and marketable and nonmarketable equity securities.
Year ended December 31,
(in millions) 2011 2010 2009
OTTI write-downs included in earnings
Debt securities: U.S. states and political subdivisions $ 2 16 7
Mortgage-backed securities: Federal agencies (1) - 267 -
Residential 252 175 595 Commercial 101 120 137
Corporate debt securities 3 10 69 Collateralized debt obligations 1 15 125
Other debt securities 64 69 79
Total debt securities 423 672 1,012
Equity securities:
Marketable equity securities: Perpetual preferred securities 96 15 50
Other marketable equity securities 22 5 32
Total marketable equity securities 118 20 82
Total securities available for sale 541 692 1,094
Nonmarketable equity securities 170 248 573
Total OTTI write-downs included in earnings $ 711 940 1,667
(1) For the year ended December 31, 2010, amount represents OTTI recognized on federal agency MBS because we had the intent to sell, of which $252 million related to securities with a fair value of $14.5 billion that were sold subsequent to December 31, 2010.
138
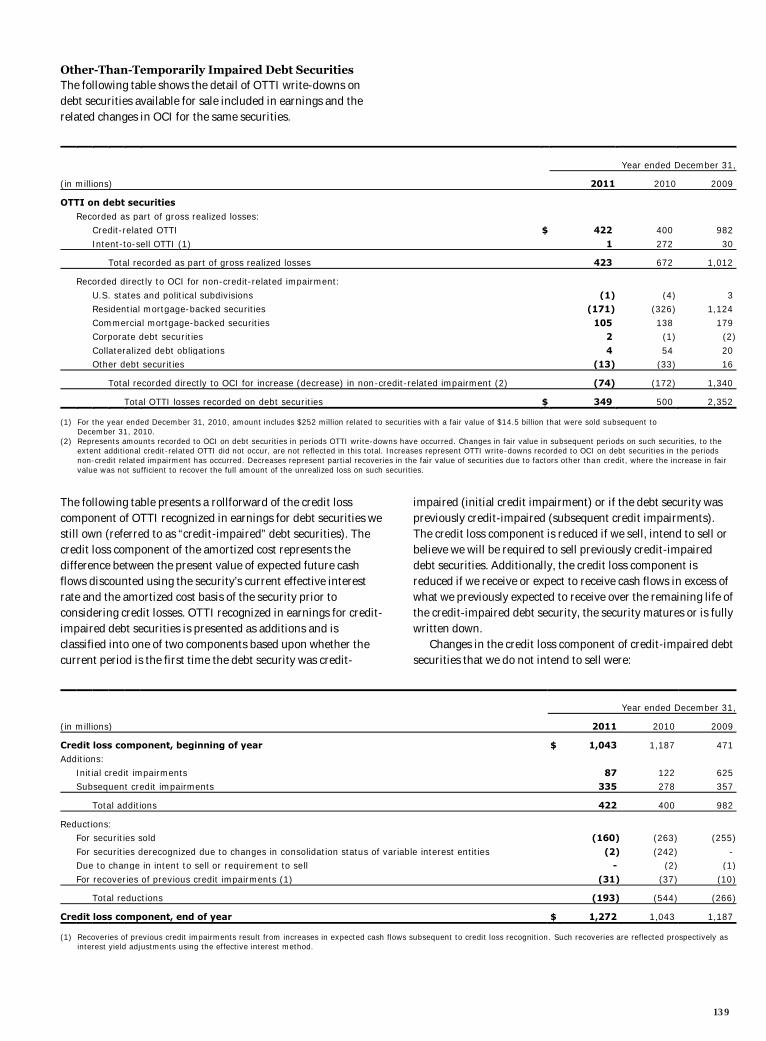
Other-Than-Temporarily Impaired Debt Securities The following table shows the detail of OTTI write-downs on debt securities available for sale included in earnings and the related changes in OCI for the same securities.
Year ended December 31,
(in millions) 2011 2010 2009
OTTI on debt securities
Recorded as part of gross realized losses: Credit-related OTTI $ 422 400 982
Intent-to-sell OTTI (1) 1 272 30
Total recorded as part of gross realized losses 423 672 1,012
Recorded directly to OCI for non-credit-related impairment:
U.S. states and political subdivisions (1) (4) 3 Residential mortgage-backed securities (171) (326) 1,124
Commercial mortgage-backed securities 105 138 179 Corporate debt securities 2 (1) (2)
Collateralized debt obligations 4 54 20 Other debt securities (13) (33) 16
Total recorded directly to OCI for increase (decrease) in non-credit-related impairment (2) (74) (172) 1,340
Total OTTI losses recorded on debt securities $ 349 500 2,352
(1) For the year ended December 31, 2010, amount includes $252 million related to securities with a fair value of $14.5 billion that were sold subsequent to December 31, 2010.
(2) Represents amounts recorded to OCI on debt securities in periods OTTI write-downs have occurred. Changes in fair value in subsequent periods on such securities, to the extent additional credit-related OTTI did not occur, are not reflected in this total. Increases represent OTTI write-downs recorded to OCI on debt securities in the periods non-credit related impairment has occurred. Decreases represent partial recoveries in the fair value of securities due to factors other than credit, where the increase in fair value was not sufficient to recover the full amount of the unrealized loss on such securities.
The following table presents a rollforward of the credit loss component of OTTI recognized in earnings for debt securities we still own (referred to as “credit-impaired” debt securities). The credit loss component of the amortized cost represents the difference between the present value of expected future cash flows discounted using the security’s current effective interest rate and the amortized cost basis of the security prior to considering credit losses. OTTI recognized in earnings for credit-impaired debt securities is presented as additions and is classified into one of two components based upon whether the current period is the first time the debt security was credit-
impaired (initial credit impairment) or if the debt security was previously credit-impaired (subsequent credit impairments). The credit loss component is reduced if we sell, intend to sell or believe we will be required to sell previously credit-impaired debt securities. Additionally, the credit loss component is reduced if we receive or expect to receive cash flows in excess of what we previously expected to receive over the remaining life of the credit-impaired debt security, the security matures or is fully written down. Changes in the credit loss component of credit-impaired debt securities that we do not intend to sell were:
Year ended December 31,
(in millions) 2011 2010 2009
Credit loss component, beginning of year $ 1,043 1,187 471 Additions:
Initial credit impairments 87 122 625 Subsequent credit impairments 335 278 357
Total additions 422 400 982
Reductions: For securities sold (160) (263) (255)
For securities derecognized due to changes in consolidation status of variable interest entities (2) (242) - Due to change in intent to sell or requirement to sell - (2) (1)
For recoveries of previous credit impairments (1) (31) (37) (10)
Total reductions (193) (544) (266)
Credit loss component, end of year $ 1,272 1,043 1,187
(1) Recoveries of previous credit impairments result from increases in expected cash flows subsequent to credit loss recognition. Such recoveries are reflected prospectively as interest yield adjustments using the effective interest method.
139
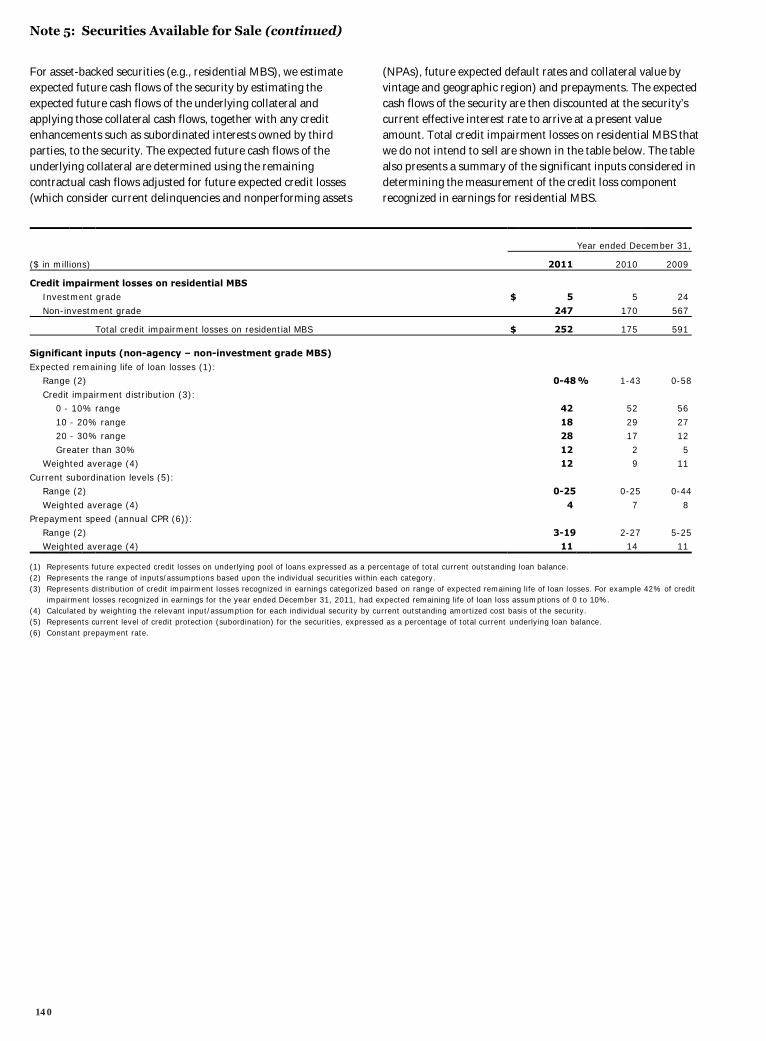
Note 5: Securities Available for Sale (continued)
For asset-backed securities (e.g., residential MBS), we estimate expected future cash flows of the security by estimating the expected future cash flows of the underlying collateral and applying those collateral cash flows, together with any credit enhancements such as subordinated interests owned by third parties, to the security. The expected future cash flows of the underlying collateral are determined using the remaining contractual cash flows adjusted for future expected credit losses (which consider current delinquencies and nonperforming assets
(NPAs), future expected default rates and collateral value by vintage and geographic region) and prepayments. The expected cash flows of the security are then discounted at the security’s current effective interest rate to arrive at a present value amount. Total credit impairment losses on residential MBS that we do not intend to sell are shown in the table below. The table also presents a summary of the significant inputs considered in determining the measurement of the credit loss component recognized in earnings for residential MBS.
Year ended December 31,
($ in millions) 2011 2010 2009
Credit impairment losses on residential MBS Investment grade $ 5 5 24
Non-investment grade 247 170 567
Total credit impairment losses on residential MBS $ 252 175 591
Significant inputs (non-agency – non-investment grade MBS)
Expected remaining life of loan losses (1): Range (2) 0-48 % 1-43 0-58
Credit impairment distribution (3): 0 - 10% range 42 52 56
10 - 20% range 18 29 27 20 - 30% range 28 17 12
Greater than 30% 12 2 5 Weighted average (4) 12 9 11
Current subordination levels (5): Range (2) 0-25 0-25 0-44
Weighted average (4) 4 7 8 Prepayment speed (annual CPR (6)):
Range (2) 3-19 2-27 5-25 Weighted average (4) 11 14 11
(1) Represents future expected credit losses on underlying pool of loans expressed as a percentage of total current outstanding loan balance. (2) Represents the range of inputs/assumptions based upon the individual securities within each category. (3) Represents distribution of credit impairment losses recognized in earnings categorized based on range of expected remaining life of loan losses. For example 42% of credit
impairment losses recognized in earnings for the year ended December 31, 2011, had expected remaining life of loan loss assumptions of 0 to 10%. (4) Calculated by weighting the relevant input/assumption for each individual security by current outstanding amortized cost basis of the security. (5) Represents current level of credit protection (subordination) for the securities, expressed as a percentage of total current underlying loan balance. (6) Constant prepayment rate.
140
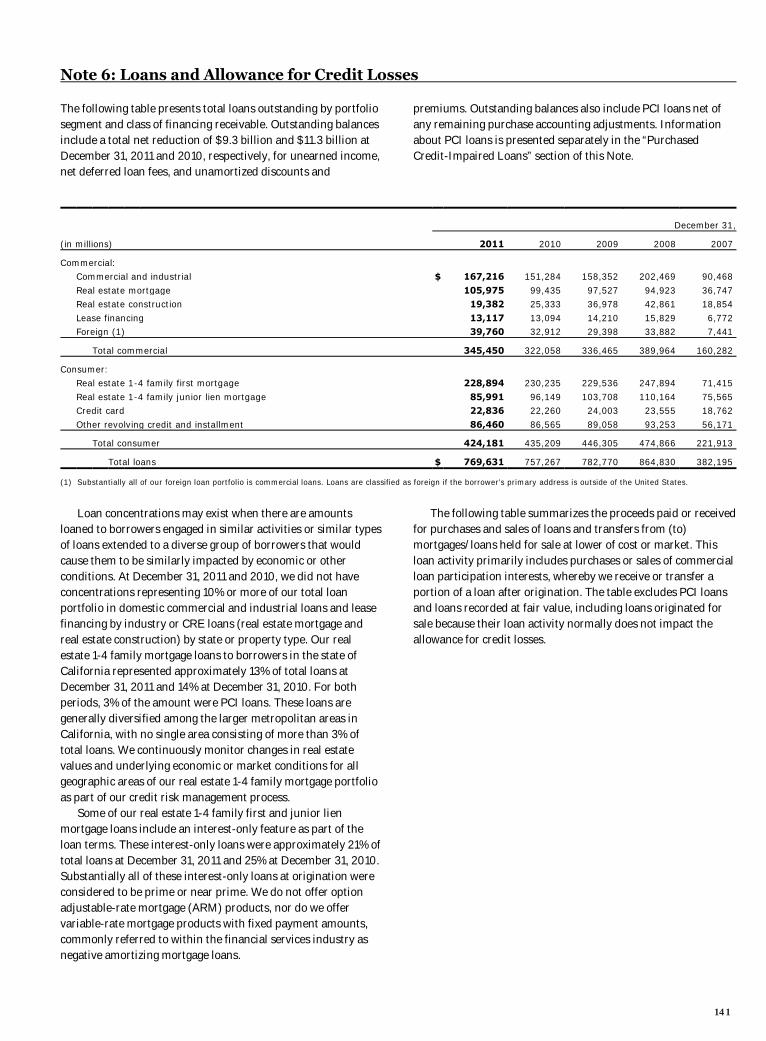
Note 6: Loans and Allowance for Credit Losses
The following table presents total loans outstanding by portfolio segment and class of financing receivable. Outstanding balances include a total net reduction of $9.3 billion and $11.3 billion at December 31, 2011 and 2010, respectively, for unearned income, net deferred loan fees, and unamortized discounts and
premiums. Outstanding balances also include PCI loans net of any remaining purchase accounting adjustments. Information about PCI loans is presented separately in the “Purchased Credit-Impaired Loans” section of this Note.
December 31,
(in millions) 2011 2010 2009 2008 2007
Commercial: Commercial and industrial $ 167,216 151,284 158,352 202,469 90,468
Real estate mortgage 105,975 99,435 97,527 94,923 36,747 Real estate construction 19,382 25,333 36,978 42,861 18,854
Lease financing 13,117 13,094 14,210 15,829 6,772 Foreign (1) 39,760 32,912 29,398 33,882 7,441
Total commercial 345,450 322,058 336,465 389,964 160,282
Consumer: Real estate 1-4 family first mortgage 228,894 230,235 229,536 247,894 71,415
Real estate 1-4 family junior lien mortgage 85,991 96,149 103,708 110,164 75,565 Credit card 22,836 22,260 24,003 23,555 18,762
Other revolving credit and installment 86,460 86,565 89,058 93,253 56,171
Total consumer 424,181 435,209 446,305 474,866 221,913
Total loans $ 769,631 757,267 782,770 864,830 382,195
(1) Substantially all of our foreign loan portfolio is commercial loans. Loans are classified as foreign if the borrower’s primary address is outside of the United States.
Loan concentrations may exist when there are amounts
loaned to borrowers engaged in similar activities or similar types of loans extended to a diverse group of borrowers that would cause them to be similarly impacted by economic or other conditions. At December 31, 2011 and 2010, we did not have concentrations representing 10% or more of our total loan portfolio in domestic commercial and industrial loans and lease financing by industry or CRE loans (real estate mortgage and real estate construction) by state or property type. Our real estate 1-4 family mortgage loans to borrowers in the state of California represented approximately 13% of total loans at December 31, 2011 and 14% at December 31, 2010. For both periods, 3% of the amount were PCI loans. These loans are generally diversified among the larger metropolitan areas in California, with no single area consisting of more than 3% of total loans. We continuously monitor changes in real estate values and underlying economic or market conditions for all geographic areas of our real estate 1-4 family mortgage portfolio as part of our credit risk management process. Some of our real estate 1-4 family first and junior lien mortgage loans include an interest-only feature as part of the loan terms. These interest-only loans were approximately 21% of total loans at December 31, 2011 and 25% at December 31, 2010. Substantially all of these interest-only loans at origination were considered to be prime or near prime. We do not offer option adjustable-rate mortgage (ARM) products, nor do we offer variable-rate mortgage products with fixed payment amounts, commonly referred to within the financial services industry as negative amortizing mortgage loans.
The following table summarizes the proceeds paid or received for purchases and sales of loans and transfers from (to) mortgages/loans held for sale at lower of cost or market. This loan activity primarily includes purchases or sales of commercial loan participation interests, whereby we receive or transfer a portion of a loan after origination. The table excludes PCI loans and loans recorded at fair value, including loans originated for sale because their loan activity normally does not impact the allowance for credit losses.
141
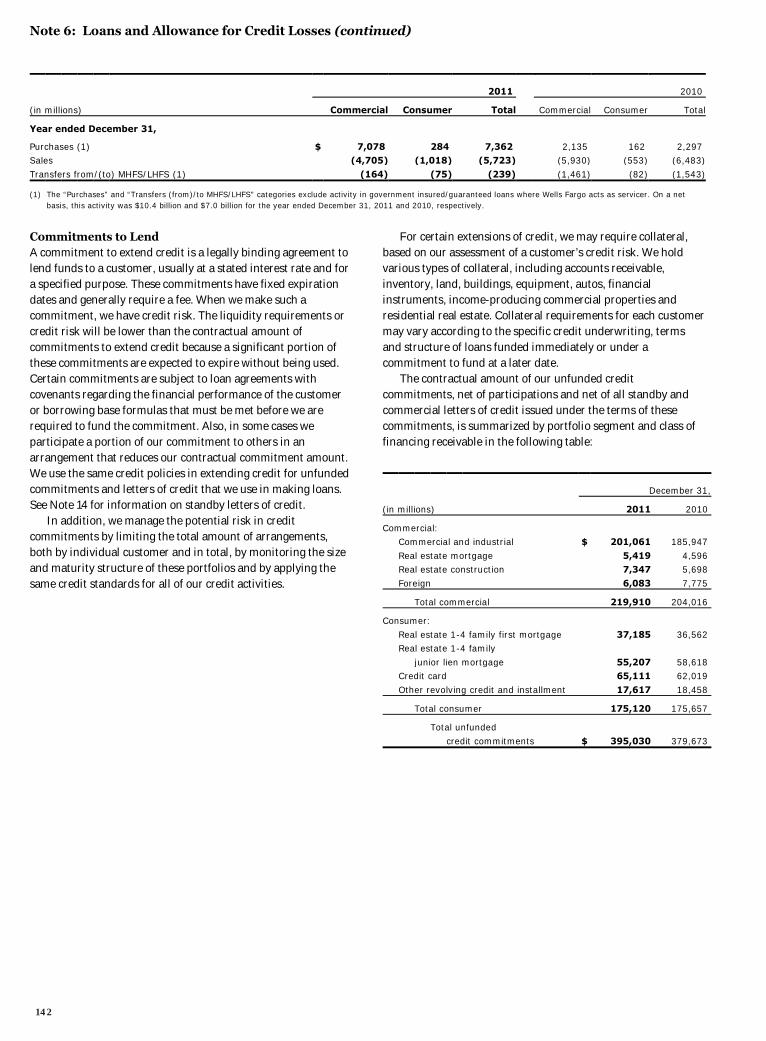
Note 6: Loans and Allowance for Credit Losses (continued)
2011 2010
(in millions) Commercial Consumer Total Commercial Consumer Total
Year ended December 31,
Purchases (1) $ 7,078 284 7,362 2,135 162 2,297 Sales (4,705) (1,018) (5,723) (5,930) (553) (6,483)
Transfers from/(to) MHFS/LHFS (1) (164) (75) (239) (1,461) (82) (1,543)
(1) The “Purchases” and “Transfers (from)/to MHFS/LHFS" categories exclude activity in government insured/guaranteed loans where Wells Fargo acts as servicer. On a net basis, this activity was $10.4 billion and $7.0 billion for the year ended December 31, 2011 and 2010, respectively.
Commitments to Lend A commitment to extend credit is a legally binding agreement to lend funds to a customer, usually at a stated interest rate and for a specified purpose. These commitments have fixed expiration dates and generally require a fee. When we make such a commitment, we have credit risk. The liquidity requirements or credit risk will be lower than the contractual amount of commitments to extend credit because a significant portion of these commitments are expected to expire without being used. Certain commitments are subject to loan agreements with covenants regarding the financial performance of the customer or borrowing base formulas that must be met before we are required to fund the commitment. Also, in some cases we participate a portion of our commitment to others in an arrangement that reduces our contractual commitment amount. We use the same credit policies in extending credit for unfunded commitments and letters of credit that we use in making loans. See Note 14 for information on standby letters of credit. In addition, we manage the potential risk in credit commitments by limiting the total amount of arrangements, both by individual customer and in total, by monitoring the size and maturity structure of these portfolios and by applying the same credit standards for all of our credit activities.
For certain extensions of credit, we may require collateral, based on our assessment of a customer’s credit risk. We hold various types of collateral, including accounts receivable, inventory, land, buildings, equipment, autos, financial instruments, income-producing commercial properties and residential real estate. Collateral requirements for each customer may vary according to the specific credit underwriting, terms and structure of loans funded immediately or under a commitment to fund at a later date. The contractual amount of our unfunded credit commitments, net of participations and net of all standby and commercial letters of credit issued under the terms of these commitments, is summarized by portfolio segment and class of financing receivable in the following table:
December 31,
(in millions) 2011 2010
Commercial: Commercial and industrial $ 201,061 185,947
Real estate mortgage 5,419 4,596 Real estate construction 7,347 5,698
Foreign 6,083 7,775
Total commercial 219,910 204,016
Consumer:
Real estate 1-4 family first mortgage 37,185 36,562 Real estate 1-4 family
junior lien mortgage 55,207 58,618 Credit card 65,111 62,019
Other revolving credit and installment 17,617 18,458
Total consumer 175,120 175,657
Total unfunded
credit commitments $ 395,030 379,673
142
Allowance for Credit Losses (ACL) The ACL is management’s estimate of credit losses inherent in the loan portfolio, including unfunded credit commitments, at the balance sheet date. We have an established process to determine the adequacy of the allowance for credit losses that assesses the losses inherent in our portfolio and related unfunded credit commitments. While we attribute portions of the allowance to specific portfolio segments, the entire allowance is available to absorb credit losses inherent in the total loan portfolio and unfunded credit commitments. Our process involves procedures to appropriately consider the unique risk characteristics of our commercial and consumer loan portfolio segments. For each portfolio segment, losses are estimated collectively for groups of loans with similar characteristics, individually or pooled for impaired loans or, for PCI loans, based on the changes in cash flows expected to be collected. Our allowance levels are influenced by loan volumes, loan grade migration or delinquency status, historic loss experience influencing loss factors, and other conditions influencing loss expectations, such as economic conditions. COMMERCIAL PORTFOLIO SEGMENT ACL METHODOLOGY
Generally, commercial loans are assessed for estimated losses by grading each loan using various risk factors as identified through periodic reviews. We apply historic grade-specific loss factors to the aggregation of each funded grade pool. These historic loss factors are also used to estimate losses for unfunded credit commitments. In the development of our statistically derived loan grade loss factors, we observe historical losses over a relevant period for each loan grade. These loss estimates are adjusted as appropriate based on additional analysis of long-term average loss experience compared to previously forecasted losses, external loss data or other risks identified from current economic conditions and credit quality trends. The allowance also includes an amount for the estimated impairment on nonaccrual commercial loans and commercial loans modified in a TDR, whether on accrual or nonaccrual status. CONSUMER PORTFOLIO SEGMENT ACL METHODOLOGY For consumer loans, not identified as a TDR, we determine the allowance predominantly on a collective basis utilizing forecasted losses to represent our best estimate of inherent loss. We pool loans, generally by product types with similar risk characteristics, such as residential real estate mortgages and credit cards. As appropriate and to achieve greater accuracy, we may further stratify selected portfolios by sub-product, origination channel, vintage, loss type, geographic location and other predictive characteristics. Models designed for each pool are utilized to develop the loss estimates. We use assumptions for these pools in our forecast models, such as historic delinquency and default, loss severity, home price trends, unemployment trends, and other key economic variables that may influence the frequency and severity of losses in the pool. In determining the appropriate allowance attributable to our residential mortgage portfolio, we incorporate the default rates and high severity of loss for junior lien mortgages behind
delinquent first lien mortgages into our loss forecasting calculations. In addition, the loss rates we use in determining our allowance include the impact of our established loan modification programs. When modifications occur or are probable to occur, our allowance considers the impact of these modifications, taking into consideration the associated credit cost, including re-defaults of modified loans and projected loss severity. Accordingly, the loss content associated with the effects of existing and probable loan modifications and junior lien mortgages behind delinquent first lien mortgages has been captured in our allowance methodology. We separately estimate impairment for consumer loans that have been modified in a TDR (including trial modifications), whether on accrual or nonaccrual status. OTHER ACL MATTERS The allowance for credit losses for both portfolio segments includes an amount for imprecision or uncertainty that may change from period to period. This amount represents management’s judgment of risks inherent in the processes and assumptions used in establishing the allowance. This imprecision considers economic environmental factors, modeling assumptions and performance, process risk, and other subjective factors, including industry trends and ongoing discussions with regulatory and government agencies regarding mortgage foreclosure-related matters. Impaired loans, which predominantly include nonaccrual commercial loans and any loans that have been modified in a TDR, have an estimated allowance calculated as the difference, if any, between the impaired value of the loan and the recorded investment in the loan. The impaired value of the loan is generally calculated as the present value of expected future cash flows from principal and interest which incorporates expected lifetime losses, discounted at the loan’s effective interest rate. The allowance for a non-impaired loan is based solely on principal losses without consideration for timing of those losses. The allowance for an impaired loan that was modified in a TDR may be lower than the previously established allowance for that loan due to benefits received through modification, such as lower probability of default and/or severity of loss, and the impact of prior charge-offs or charge-offs at the time of the modification that may reduce or eliminate the need for an allowance. Commercial and consumer PCI loans may require an allowance subsequent to their acquisition. This allowance requirement is due to probable decreases in expected principal and interest cash flows (other than due to decreases in interest rate indices and changes in prepayment assumptions).
143
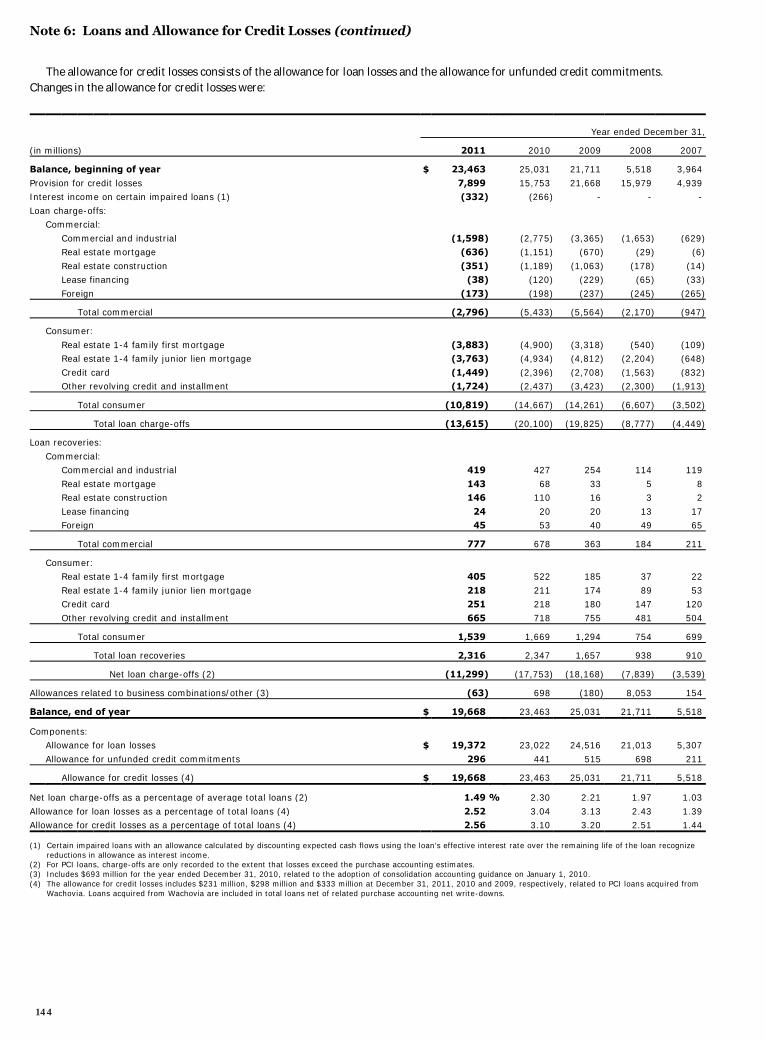
Note 6: Loans and Allowance for Credit Losses (continued)
The allowance for credit losses consists of the allowance for loan losses and the allowance for unfunded credit commitments. Changes in the allowance for credit losses were:
Year ended December 31,
(in millions) 2011 2010 2009 2008 2007
Balance, beginning of year $ 23,463 25,031 21,711 5,518 3,964
Provision for credit losses 7,899 15,753 21,668 15,979 4,939 Interest income on certain impaired loans (1) (332) (266) - - -
Loan charge-offs: Commercial:
Commercial and industrial (1,598) (2,775) (3,365) (1,653) (629) Real estate mortgage (636) (1,151) (670) (29) (6)
Real estate construction (351) (1,189) (1,063) (178) (14) Lease financing (38) (120) (229) (65) (33)
Foreign (173) (198) (237) (245) (265)
Total commercial (2,796) (5,433) (5,564) (2,170) (947)
Consumer:
Real estate 1-4 family first mortgage (3,883) (4,900) (3,318) (540) (109) Real estate 1-4 family junior lien mortgage (3,763) (4,934) (4,812) (2,204) (648)
Credit card (1,449) (2,396) (2,708) (1,563) (832) Other revolving credit and installment (1,724) (2,437) (3,423) (2,300) (1,913)
Total consumer (10,819) (14,667) (14,261) (6,607) (3,502)
Total loan charge-offs (13,615) (20,100) (19,825) (8,777) (4,449)
Loan recoveries:
Commercial: Commercial and industrial 419 427 254 114 119
Real estate mortgage 143 68 33 5 8 Real estate construction 146 110 16 3 2
Lease financing 24 20 20 13 17 Foreign 45 53 40 49 65
Total commercial 777 678 363 184 211
Consumer: Real estate 1-4 family first mortgage 405 522 185 37 22
Real estate 1-4 family junior lien mortgage 218 211 174 89 53 Credit card 251 218 180 147 120
Other revolving credit and installment 665 718 755 481 504
Total consumer 1,539 1,669 1,294 754 699
Total loan recoveries 2,316 2,347 1,657 938 910
Net loan charge-offs (2) (11,299) (17,753) (18,168) (7,839) (3,539)
Allowances related to business combinations/other (3) (63) 698 (180) 8,053 154
Balance, end of year $ 19,668 23,463 25,031 21,711 5,518
Components: Allowance for loan losses $ 19,372 23,022 24,516 21,013 5,307
Allowance for unfunded credit commitments 296 441 515 698 211
Allowance for credit losses (4) $ 19,668 23,463 25,031 21,711 5,518
Net loan charge-offs as a percentage of average total loans (2) 1.49 % 2.30 2.21 1.97 1.03
Allowance for loan losses as a percentage of total loans (4) 2.52 3.04 3.13 2.43 1.39 Allowance for credit losses as a percentage of total loans (4) 2.56 3.10 3.20 2.51 1.44
(1) Certain impaired loans with an allowance calculated by discounting expected cash flows using the loan’s effective interest rate over the remaining life of the loan recognize reductions in allowance as interest income.
(2) For PCI loans, charge-offs are only recorded to the extent that losses exceed the purchase accounting estimates. (3) Includes $693 million for the year ended December 31, 2010, related to the adoption of consolidation accounting guidance on January 1, 2010. (4) The allowance for credit losses includes $231 million, $298 million and $333 million at December 31, 2011, 2010 and 2009, respectively, related to PCI loans acquired from
Wachovia. Loans acquired from Wachovia are included in total loans net of related purchase accounting net write-downs.
144

The following table summarizes the activity in the allowance for credit losses by our commercial and consumer portfolio segments.
2011 2010
(in millions) Commercial Consumer Total Commercial Consumer Total
Year ended December 31,
Balance, beginning of year $ 8,169 15,294 23,463 8,141 16,890 25,031 Provision for credit losses 365 7,534 7,899 4,913 10,840 15,753
Interest income on certain impaired loans (161) (171) (332) (139) (127) (266) Loan charge-offs (2,796) (10,819) (13,615) (5,433) (14,667) (20,100) Loan recoveries 777 1,539 2,316 678 1,669 2,347
Net loan charge-offs (2,019) (9,280) (11,299) (4,755) (12,998) (17,753)
Allowance related to business combinations/other 4 (67) (63) 9 689 698
Balance, end of year $ 6,358 13,310 19,668 8,169 15,294 23,463
The following table disaggregates our allowance for credit losses and recorded investment in loans by impairment methodology.
Allowance for credit losses Recorded investment in loans
(in millions) Commercial Consumer Total Commercial Consumer Total
December 31, 2011 Collectively evaluated (1) $ 4,060 8,699 12,759 328,117 376,785 704,902 Individually evaluated (2) 2,133 4,545 6,678 10,566 17,444 28,010
PCI (3) 165 66 231 6,767 29,952 36,719
Total $ 6,358 13,310 19,668 345,450 424,181 769,631
December 31, 2010 Collectively evaluated (1) $ 5,424 11,539 16,963 302,392 387,707 690,099 Individually evaluated (2) 2,479 3,723 6,202 11,731 14,007 25,738
PCI (3) 266 32 298 7,935 33,495 41,430
Total $ 8,169 15,294 23,463 322,058 435,209 757,267
(1) Represents loans collectively evaluated for impairment in accordance with ASC 450-20, Loss Contingencies (formerly FAS 5), and pursuant to amendments by ASU 2010-20 regarding allowance for unimpaired loans.
(2) Represents loans individually evaluated for impairment in accordance with ASC 310-10, Receivables (formerly FAS 114), and pursuant to amendments by ASU 2010-20 regarding allowance for impaired loans.
(3) Represents the allowance and related loan carrying value determined in accordance with ASC 310-30, Receivables – Loans and Debt Securities Acquired with Deteriorated Credit Quality (formerly SOP 03-3) and pursuant to amendments by ASU 2010-20 regarding allowance for PCI loans.
Credit Quality We monitor credit quality as indicated by evaluating various attributes and utilize such information in our evaluation of the adequacy of the allowance for credit losses. The following sections provide the credit quality indicators we most closely monitor. See the “Purchased Credit-Impaired Loans” section of this Note for credit quality information on our PCI portfolio. The majority of credit quality indicators are based on December 31, 2011 information, with the exception of updated FICO and updated loan-to-value (LTV)/combined LTV (CLTV), which are obtained at least quarterly. Generally, these indicators are updated in the second month of each quarter, with updates no older than September 30, 2011.
COMMERCIAL CREDIT QUALITY INDICATORS In addition to monitoring commercial loan concentration risk, we manage a consistent process for assessing commercial loan credit quality. Commercial loans are subject to individual risk assessment using our internal borrower and collateral quality ratings. Our ratings are aligned to Pass and Criticized categories. The Criticized category includes Special Mention, Substandard, and Doubtful categories which are defined by bank regulatory agencies. The following table provides a breakdown of outstanding commercial loans by risk category. Both the CRE mortgage and construction criticized totals are relatively high as a result of the current conditions in the real estate market. Of the $29.3 billion in criticized CRE loans, $6.0 billion has been placed on nonaccrual status and written down to net realizable value. CRE loans have a high level of monitoring in place to manage these assets and mitigate any loss exposure.
145
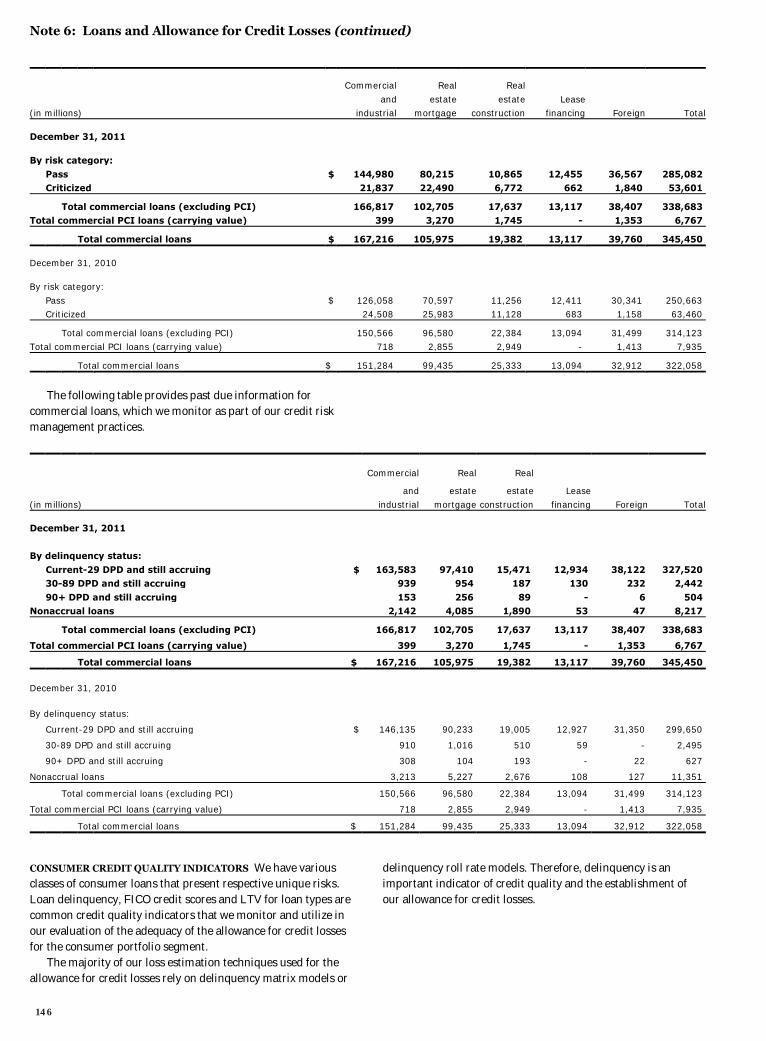
Note 6: Loans and Allowance for Credit Losses (continued)
Commercial Real Real
and estate estate Lease (in millions) industrial mortgage construction financing Foreign Total
December 31, 2011 By risk category:
Pass $ 144,980 80,215 10,865 12,455 36,567 285,082 Criticized 21,837 22,490 6,772 662 1,840 53,601
Total commercial loans (excluding PCI) 166,817 102,705 17,637 13,117 38,407 338,683 Total commercial PCI loans (carrying value) 399 3,270 1,745 - 1,353 6,767
Total commercial loans $ 167,216 105,975 19,382 13,117 39,760 345,450
December 31, 2010 By risk category:
Pass $ 126,058 70,597 11,256 12,411 30,341 250,663 Criticized 24,508 25,983 11,128 683 1,158 63,460
Total commercial loans (excluding PCI) 150,566 96,580 22,384 13,094 31,499 314,123 Total commercial PCI loans (carrying value) 718 2,855 2,949 - 1,413 7,935
Total commercial loans $ 151,284 99,435 25,333 13,094 32,912 322,058
The following table provides past due information for commercial loans, which we monitor as part of our credit risk management practices.
Commercial Real Real
and estate estate Lease (in millions) industrial mortgage construction financing Foreign Total
December 31, 2011
By delinquency status:
Current-29 DPD and still accruing $ 163,583 97,410 15,471 12,934 38,122 327,520 30-89 DPD and still accruing 939 954 187 130 232 2,442
90+ DPD and still accruing 153 256 89 - 6 504 Nonaccrual loans 2,142 4,085 1,890 53 47 8,217
Total commercial loans (excluding PCI) 166,817 102,705 17,637 13,117 38,407 338,683
Total commercial PCI loans (carrying value) 399 3,270 1,745 - 1,353 6,767
Total commercial loans $ 167,216 105,975 19,382 13,117 39,760 345,450
December 31, 2010
By delinquency status:
Current-29 DPD and still accruing $ 146,135 90,233 19,005 12,927 31,350 299,650
30-89 DPD and still accruing 910 1,016 510 59 - 2,495
90+ DPD and still accruing 308 104 193 - 22 627
Nonaccrual loans 3,213 5,227 2,676 108 127 11,351
Total commercial loans (excluding PCI) 150,566 96,580 22,384 13,094 31,499 314,123
Total commercial PCI loans (carrying value) 718 2,855 2,949 - 1,413 7,935
Total commercial loans $ 151,284 99,435 25,333 13,094 32,912 322,058
CONSUMER CREDIT QUALITY INDICATORS We have various classes of consumer loans that present respective unique risks. Loan delinquency, FICO credit scores and LTV for loan types are common credit quality indicators that we monitor and utilize in our evaluation of the adequacy of the allowance for credit losses for the consumer portfolio segment. The majority of our loss estimation techniques used for the allowance for credit losses rely on delinquency matrix models or
delinquency roll rate models. Therefore, delinquency is an important indicator of credit quality and the establishment of our allowance for credit losses.
146
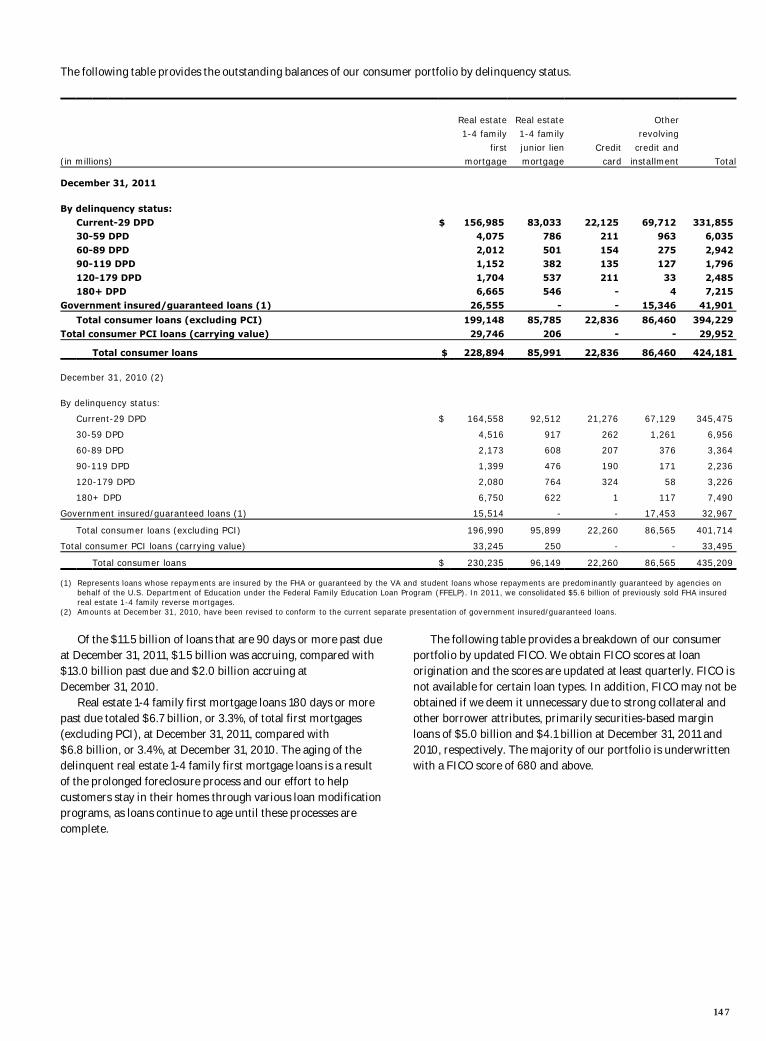
The following table provides the outstanding balances of our consumer portfolio by delinquency status.
Real estate Real estate Other 1-4 family 1-4 family revolving
first junior lien Credit credit and (in millions) mortgage mortgage card installment Total
December 31, 2011
By delinquency status:
Current-29 DPD $ 156,985 83,033 22,125 69,712 331,855 30-59 DPD 4,075 786 211 963 6,035
60-89 DPD 2,012 501 154 275 2,942 90-119 DPD 1,152 382 135 127 1,796
120-179 DPD 1,704 537 211 33 2,485 180+ DPD 6,665 546 - 4 7,215
Government insured/guaranteed loans (1) 26,555 - - 15,346 41,901
Total consumer loans (excluding PCI) 199,148 85,785 22,836 86,460 394,229
Total consumer PCI loans (carrying value) 29,746 206 - - 29,952
Total consumer loans $ 228,894 85,991 22,836 86,460 424,181
December 31, 2010 (2)
By delinquency status:
Current-29 DPD $ 164,558 92,512 21,276 67,129 345,475
30-59 DPD 4,516 917 262 1,261 6,956
60-89 DPD 2,173 608 207 376 3,364
90-119 DPD 1,399 476 190 171 2,236
120-179 DPD 2,080 764 324 58 3,226
180+ DPD 6,750 622 1 117 7,490
Government insured/guaranteed loans (1) 15,514 - - 17,453 32,967
Total consumer loans (excluding PCI) 196,990 95,899 22,260 86,565 401,714
Total consumer PCI loans (carrying value) 33,245 250 - - 33,495
Total consumer loans $ 230,235 96,149 22,260 86,565 435,209
(1) Represents loans whose repayments are insured by the FHA or guaranteed by the VA and student loans whose repayments are predominantly guaranteed by agencies on behalf of the U.S. Department of Education under the Federal Family Education Loan Program (FFELP). In 2011, we consolidated $5.6 billion of previously sold FHA insured real estate 1-4 family reverse mortgages.
(2) Amounts at December 31, 2010, have been revised to conform to the current separate presentation of government insured/guaranteed loans.
Of the $11.5 billion of loans that are 90 days or more past due at December 31, 2011, $1.5 billion was accruing, compared with $13.0 billion past due and $2.0 billion accruing at December 31, 2010. Real estate 1-4 family first mortgage loans 180 days or more past due totaled $6.7 billion, or 3.3%, of total first mortgages (excluding PCI), at December 31, 2011, compared with $6.8 billion, or 3.4%, at December 31, 2010. The aging of the delinquent real estate 1-4 family first mortgage loans is a result of the prolonged foreclosure process and our effort to help customers stay in their homes through various loan modification programs, as loans continue to age until these processes are complete.
The following table provides a breakdown of our consumer portfolio by updated FICO. We obtain FICO scores at loan origination and the scores are updated at least quarterly. FICO is not available for certain loan types. In addition, FICO may not be obtained if we deem it unnecessary due to strong collateral and other borrower attributes, primarily securities-based margin loans of $5.0 billion and $4.1 billion at December 31, 2011 and 2010, respectively. The majority of our portfolio is underwritten with a FICO score of 680 and above.
147
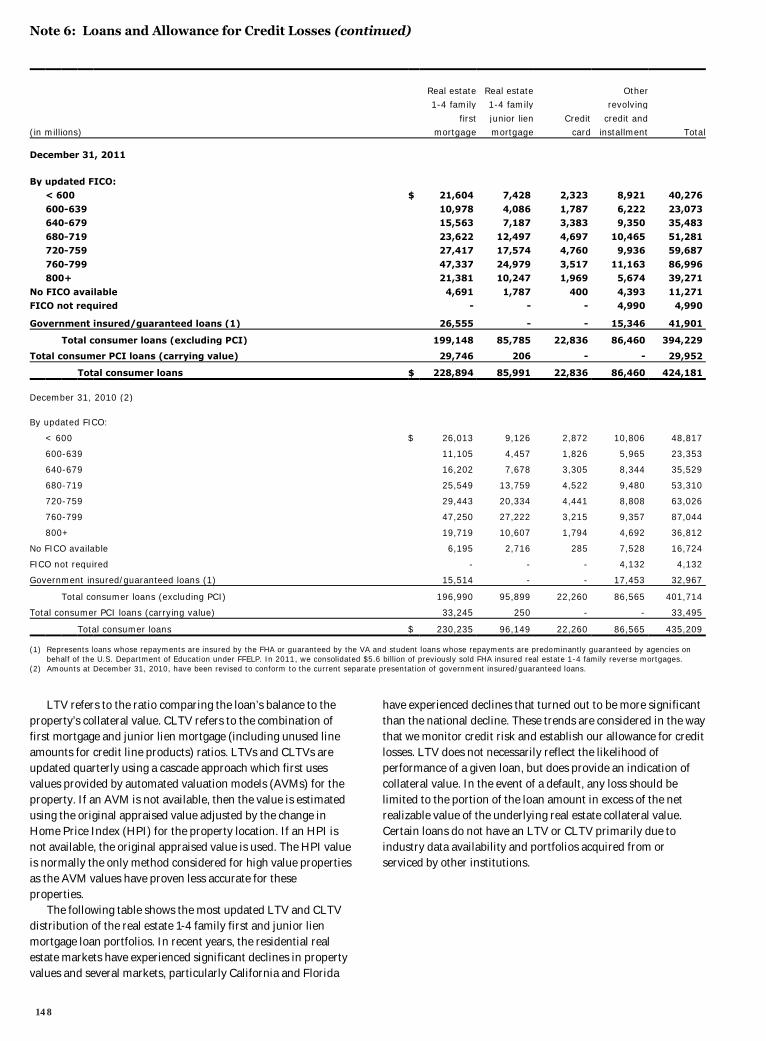
Note 6: Loans and Allowance for Credit Losses (continued)
Real estate Real estate Other 1-4 family 1-4 family revolving
first junior lien Credit credit and (in millions) mortgage mortgage card installment Total
December 31, 2011
By updated FICO: < 600 $ 21,604 7,428 2,323 8,921 40,276
600-639 10,978 4,086 1,787 6,222 23,073 640-679 15,563 7,187 3,383 9,350 35,483
680-719 23,622 12,497 4,697 10,465 51,281 720-759 27,417 17,574 4,760 9,936 59,687
760-799 47,337 24,979 3,517 11,163 86,996 800+ 21,381 10,247 1,969 5,674 39,271
No FICO available 4,691 1,787 400 4,393 11,271 FICO not required - - - 4,990 4,990
Government insured/guaranteed loans (1) 26,555 - - 15,346 41,901
Total consumer loans (excluding PCI) 199,148 85,785 22,836 86,460 394,229
Total consumer PCI loans (carrying value) 29,746 206 - - 29,952
Total consumer loans $ 228,894 85,991 22,836 86,460 424,181
December 31, 2010 (2)
By updated FICO:
< 600 $ 26,013 9,126 2,872 10,806 48,817
600-639 11,105 4,457 1,826 5,965 23,353
640-679 16,202 7,678 3,305 8,344 35,529
680-719 25,549 13,759 4,522 9,480 53,310
720-759 29,443 20,334 4,441 8,808 63,026
760-799 47,250 27,222 3,215 9,357 87,044
800+ 19,719 10,607 1,794 4,692 36,812
No FICO available 6,195 2,716 285 7,528 16,724
FICO not required - - - 4,132 4,132
Government insured/guaranteed loans (1) 15,514 - - 17,453 32,967
Total consumer loans (excluding PCI) 196,990 95,899 22,260 86,565 401,714
Total consumer PCI loans (carrying value) 33,245 250 - - 33,495
Total consumer loans $ 230,235 96,149 22,260 86,565 435,209
(1) Represents loans whose repayments are insured by the FHA or guaranteed by the VA and student loans whose repayments are predominantly guaranteed by agencies on behalf of the U.S. Department of Education under FFELP. In 2011, we consolidated $5.6 billion of previously sold FHA insured real estate 1-4 family reverse mortgages.
(2) Amounts at December 31, 2010, have been revised to conform to the current separate presentation of government insured/guaranteed loans.
LTV refers to the ratio comparing the loan’s balance to the property’s collateral value. CLTV refers to the combination of first mortgage and junior lien mortgage (including unused line amounts for credit line products) ratios. LTVs and CLTVs are updated quarterly using a cascade approach which first uses values provided by automated valuation models (AVMs) for the property. If an AVM is not available, then the value is estimated using the original appraised value adjusted by the change in Home Price Index (HPI) for the property location. If an HPI is not available, the original appraised value is used. The HPI value is normally the only method considered for high value properties as the AVM values have proven less accurate for these properties. The following table shows the most updated LTV and CLTV distribution of the real estate 1-4 family first and junior lien mortgage loan portfolios. In recent years, the residential real estate markets have experienced significant declines in property values and several markets, particularly California and Florida
have experienced declines that turned out to be more significant than the national decline. These trends are considered in the way that we monitor credit risk and establish our allowance for credit losses. LTV does not necessarily reflect the likelihood of performance of a given loan, but does provide an indication of collateral value. In the event of a default, any loss should be limited to the portion of the loan amount in excess of the net realizable value of the underlying real estate collateral value. Certain loans do not have an LTV or CLTV primarily due to industry data availability and portfolios acquired from or serviced by other institutions.
148
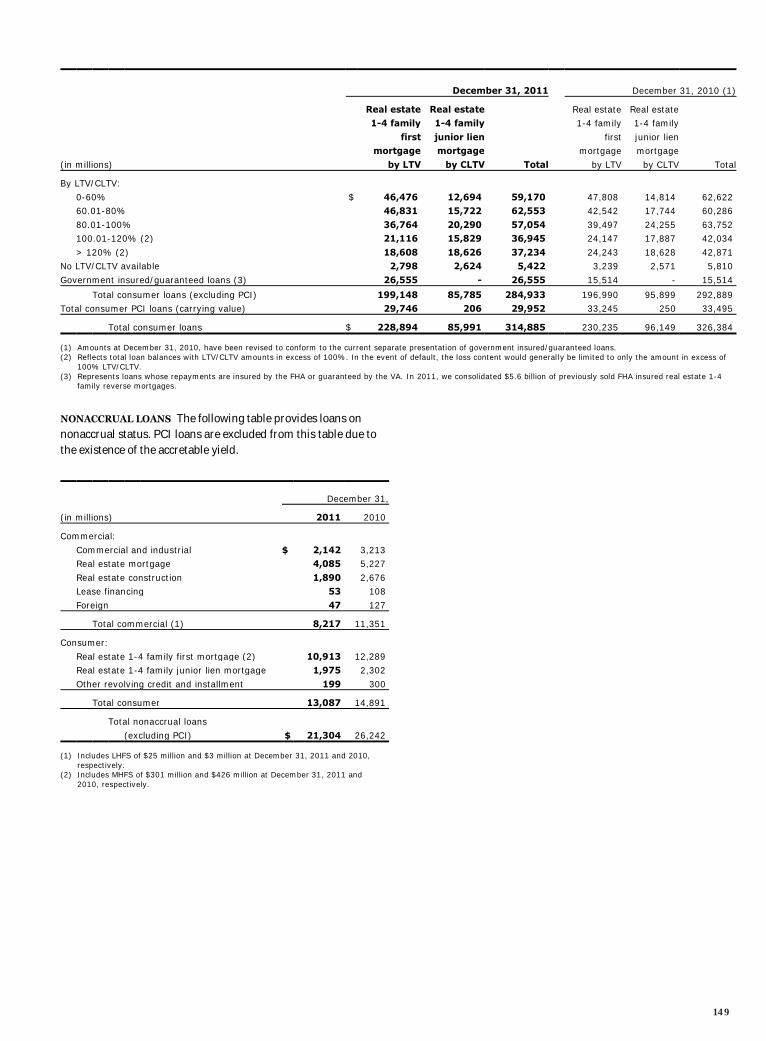
December 31, 2011 December 31, 2010 (1)
Real estate Real estate Real estate Real estate 1-4 family 1-4 family 1-4 family 1-4 family
first junior lien first junior lien mortgage mortgage mortgage mortgage
(in millions) by LTV by CLTV Total by LTV by CLTV Total
By LTV/CLTV:
0-60% $ 46,476 12,694 59,170 47,808 14,814 62,622 60.01-80% 46,831 15,722 62,553 42,542 17,744 60,286
80.01-100% 36,764 20,290 57,054 39,497 24,255 63,752 100.01-120% (2) 21,116 15,829 36,945 24,147 17,887 42,034
> 120% (2) 18,608 18,626 37,234 24,243 18,628 42,871 No LTV/CLTV available 2,798 2,624 5,422 3,239 2,571 5,810
Government insured/guaranteed loans (3) 26,555 - 26,555 15,514 - 15,514
Total consumer loans (excluding PCI) 199,148 85,785 284,933 196,990 95,899 292,889 Total consumer PCI loans (carrying value) 29,746 206 29,952 33,245 250 33,495
Total consumer loans $ 228,894 85,991 314,885 230,235 96,149 326,384
(1) Amounts at December 31, 2010, have been revised to conform to the current separate presentation of government insured/guaranteed loans. (2) Reflects total loan balances with LTV/CLTV amounts in excess of 100%. In the event of default, the loss content would generally be limited to only the amount in excess of
100% LTV/CLTV. (3) Represents loans whose repayments are insured by the FHA or guaranteed by the VA. In 2011, we consolidated $5.6 billion of previously sold FHA insured real estate 1-4
family reverse mortgages.
NONACCRUAL LOANS The following table provides loans on nonaccrual status. PCI loans are excluded from this table due to the existence of the accretable yield.
December 31,
(in millions) 2011 2010
Commercial:
Commercial and industrial $ 2,142 3,213 Real estate mortgage 4,085 5,227
Real estate construction 1,890 2,676 Lease financing 53 108
Foreign 47 127
Total commercial (1) 8,217 11,351
Consumer:
Real estate 1-4 family first mortgage (2) 10,913 12,289 Real estate 1-4 family junior lien mortgage 1,975 2,302
Other revolving credit and installment 199 300
Total consumer 13,087 14,891
Total nonaccrual loans
(excluding PCI) $ 21,304 26,242
(1) Includes LHFS of $25 million and $3 million at December 31, 2011 and 2010, respectively.
(2) Includes MHFS of $301 million and $426 million at December 31, 2011 and 2010, respectively.
149
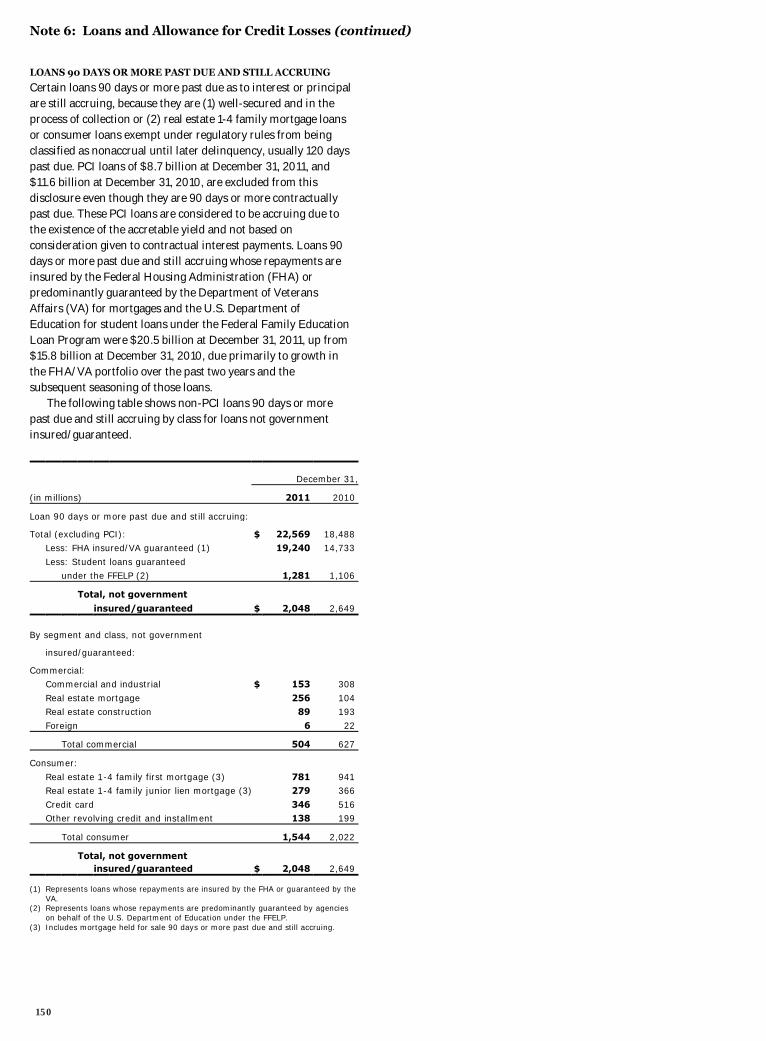
Note 6: Loans and Allowance for Credit Losses (continued)
LOANS 90 DAYS OR MORE PAST DUE AND STILL ACCRUING Certain loans 90 days or more past due as to interest or principal are still accruing, because they are (1) well-secured and in the process of collection or (2) real estate 1-4 family mortgage loans or consumer loans exempt under regulatory rules from being classified as nonaccrual until later delinquency, usually 120 days past due. PCI loans of $8.7 billion at December 31, 2011, and $11.6 billion at December 31, 2010, are excluded from this disclosure even though they are 90 days or more contractually past due. These PCI loans are considered to be accruing due to the existence of the accretable yield and not based on consideration given to contractual interest payments. Loans 90 days or more past due and still accruing whose repayments are insured by the Federal Housing Administration (FHA) or predominantly guaranteed by the Department of Veterans Affairs (VA) for mortgages and the U.S. Department of Education for student loans under the Federal Family Education Loan Program were $20.5 billion at December 31, 2011, up from $15.8 billion at December 31, 2010, due primarily to growth in the FHA/VA portfolio over the past two years and the subsequent seasoning of those loans. The following table shows non-PCI loans 90 days or more past due and still accruing by class for loans not government insured/guaranteed.
December 31,
(in millions) 2011 2010
Loan 90 days or more past due and still accruing:
Total (excluding PCI): $ 22,569 18,488 Less: FHA insured/VA guaranteed (1) 19,240 14,733
Less: Student loans guaranteed under the FFELP (2) 1,281 1,106
Total, not government
insured/guaranteed $ 2,048 2,649
By segment and class, not government
insured/guaranteed:
Commercial: Commercial and industrial $ 153 308
Real estate mortgage 256 104 Real estate construction 89 193
Foreign 6 22
Total commercial 504 627
Consumer:
Real estate 1-4 family first mortgage (3) 781 941 Real estate 1-4 family junior lien mortgage (3) 279 366
Credit card 346 516 Other revolving credit and installment 138 199
Total consumer 1,544 2,022
Total, not government insured/guaranteed $ 2,048 2,649
(1) Represents loans whose repayments are insured by the FHA or guaranteed by the VA.
(2) Represents loans whose repayments are predominantly guaranteed by agencies on behalf of the U.S. Department of Education under the FFELP.
(3) Includes mortgage held for sale 90 days or more past due and still accruing.
150
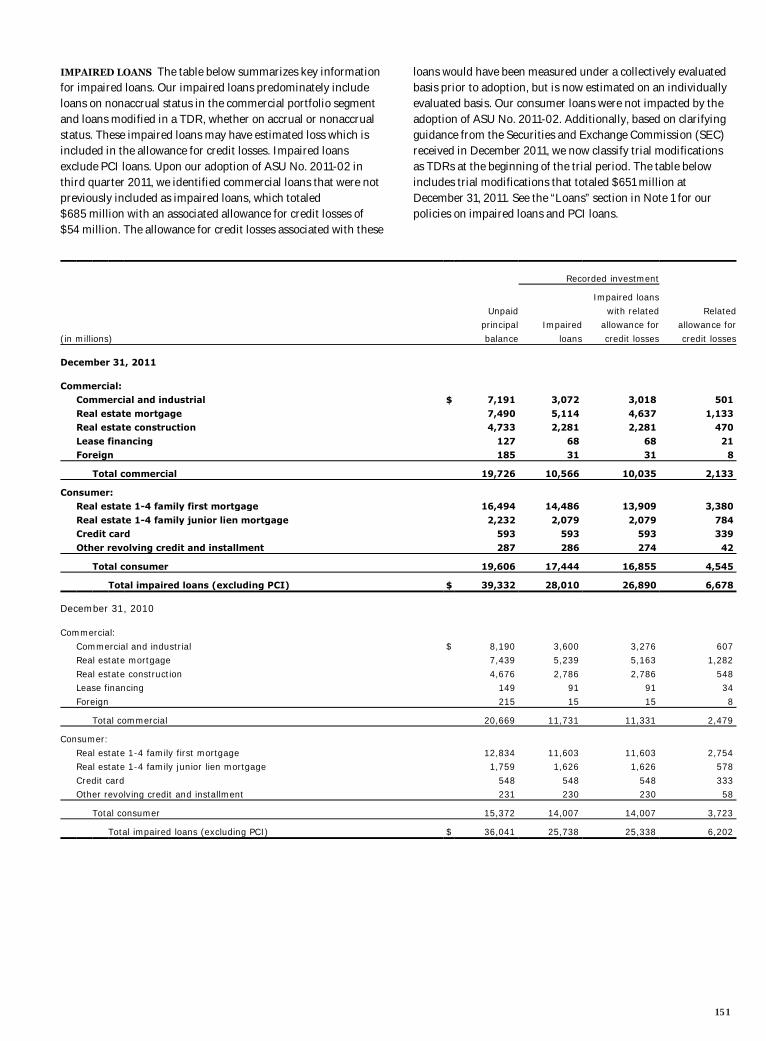
IMPAIRED LOANS The table below summarizes key information for impaired loans. Our impaired loans predominately include loans on nonaccrual status in the commercial portfolio segment and loans modified in a TDR, whether on accrual or nonaccrual status. These impaired loans may have estimated loss which is included in the allowance for credit losses. Impaired loans exclude PCI loans. Upon our adoption of ASU No. 2011-02 in third quarter 2011, we identified commercial loans that were not previously included as impaired loans, which totaled $685 million with an associated allowance for credit losses of $54 million. The allowance for credit losses associated with these
loans would have been measured under a collectively evaluated basis prior to adoption, but is now estimated on an individually evaluated basis. Our consumer loans were not impacted by the adoption of ASU No. 2011-02. Additionally, based on clarifying guidance from the Securities and Exchange Commission (SEC) received in December 2011, we now classify trial modifications as TDRs at the beginning of the trial period. The table below includes trial modifications that totaled $651 million at December 31, 2011. See the “Loans” section in Note 1 for our policies on impaired loans and PCI loans.
Recorded investment
Impaired loans
Unpaid with related Related principal Impaired allowance for allowance for
(in millions) balance loans credit losses credit losses
December 31, 2011 Commercial: Commercial and industrial $ 7,191 3,072 3,018 501
Real estate mortgage 7,490 5,114 4,637 1,133 Real estate construction 4,733 2,281 2,281 470
Lease financing 127 68 68 21 Foreign 185 31 31 8
Total commercial 19,726 10,566 10,035 2,133
Consumer: Real estate 1-4 family first mortgage 16,494 14,486 13,909 3,380
Real estate 1-4 family junior lien mortgage 2,232 2,079 2,079 784 Credit card 593 593 593 339
Other revolving credit and installment 287 286 274 42
Total consumer 19,606 17,444 16,855 4,545
Total impaired loans (excluding PCI) $ 39,332 28,010 26,890 6,678
December 31, 2010 Commercial:
Commercial and industrial $ 8,190 3,600 3,276 607 Real estate mortgage 7,439 5,239 5,163 1,282
Real estate construction 4,676 2,786 2,786 548 Lease financing 149 91 91 34
Foreign 215 15 15 8
Total commercial 20,669 11,731 11,331 2,479
Consumer:
Real estate 1-4 family first mortgage 12,834 11,603 11,603 2,754 Real estate 1-4 family junior lien mortgage 1,759 1,626 1,626 578
Credit card 548 548 548 333 Other revolving credit and installment 231 230 230 58
Total consumer 15,372 14,007 14,007 3,723
Total impaired loans (excluding PCI) $ 36,041 25,738 25,338 6,202
151
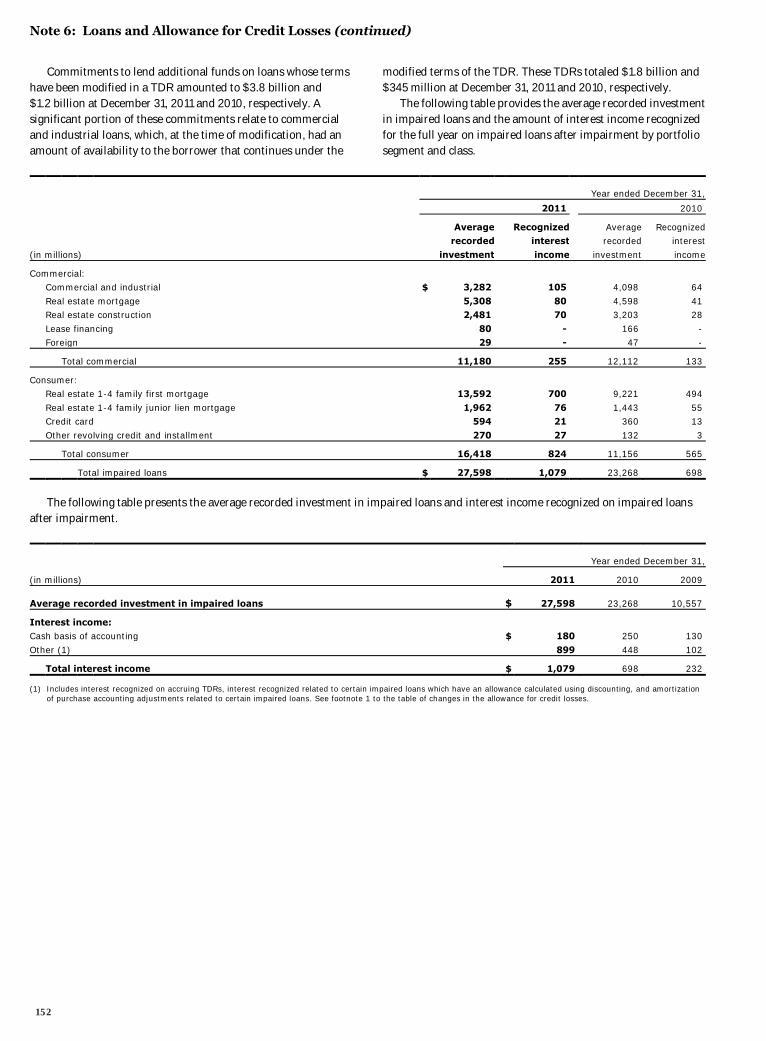
Note 6: Loans and Allowance for Credit Losses (continued)
Commitments to lend additional funds on loans whose terms have been modified in a TDR amounted to $3.8 billion and $1.2 billion at December 31, 2011 and 2010, respectively. A significant portion of these commitments relate to commercial and industrial loans, which, at the time of modification, had an amount of availability to the borrower that continues under the
modified terms of the TDR. These TDRs totaled $1.8 billion and $345 million at December 31, 2011 and 2010, respectively. The following table provides the average recorded investment in impaired loans and the amount of interest income recognized for the full year on impaired loans after impairment by portfolio segment and class.
Year ended December 31,
2011 2010
Average Recognized Average Recognized recorded interest recorded interest
(in millions) investment income investment income
Commercial: Commercial and industrial $ 3,282 105 4,098 64
Real estate mortgage 5,308 80 4,598 41 Real estate construction 2,481 70 3,203 28
Lease financing 80 - 166 - Foreign 29 - 47 -
Total commercial 11,180 255 12,112 133
Consumer: Real estate 1-4 family first mortgage 13,592 700 9,221 494
Real estate 1-4 family junior lien mortgage 1,962 76 1,443 55 Credit card 594 21 360 13
Other revolving credit and installment 270 27 132 3
Total consumer 16,418 824 11,156 565
Total impaired loans $ 27,598 1,079 23,268 698
The following table presents the average recorded investment in impaired loans and interest income recognized on impaired loans after impairment.
Year ended December 31,
(in millions) 2011 2010 2009
Average recorded investment in impaired loans $ 27,598 23,268 10,557
Interest income: Cash basis of accounting $ 180 250 130
Other (1) 899 448 102
Total interest income $ 1,079 698 232
(1) Includes interest recognized on accruing TDRs, interest recognized related to certain impaired loans which have an allowance calculated using discounting, and amortization of purchase accounting adjustments related to certain impaired loans. See footnote 1 to the table of changes in the allowance for credit losses.
152
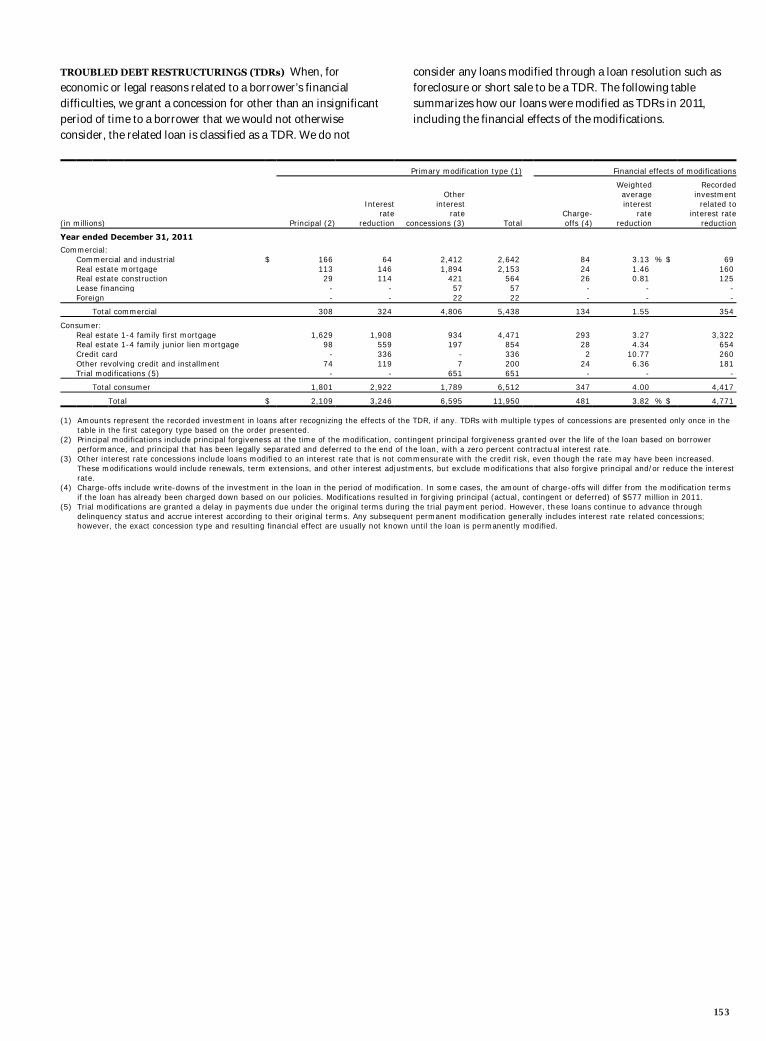
TROUBLED DEBT RESTRUCTURINGS (TDRs) When, for economic or legal reasons related to a borrower’s financial difficulties, we grant a concession for other than an insignificant period of time to a borrower that we would not otherwise consider, the related loan is classified as a TDR. We do not
consider any loans modified through a loan resolution such as foreclosure or short sale to be a TDR. The following table summarizes how our loans were modified as TDRs in 2011, including the financial effects of the modifications.
Primary modification type (1) Financial effects of modifications
Weighted Recorded Other average investment Interest interest interest related to rate rate Charge- rate interest rate
(in millions) Principal (2) reduction concessions (3) Total offs (4) reduction reduction
Year ended December 31, 2011
Commercial: Commercial and industrial $ 166 64 2,412 2,642 84 3.13 % $ 69 Real estate mortgage 113 146 1,894 2,153 24 1.46 160 Real estate construction 29 114 421 564 26 0.81 125 Lease financing - - 57 57 - - - Foreign - - 22 22 - - -
Total commercial 308 324 4,806 5,438 134 1.55 354
Consumer: Real estate 1-4 family first mortgage 1,629 1,908 934 4,471 293 3.27 3,322 Real estate 1-4 family junior lien mortgage 98 559 197 854 28 4.34 654 Credit card - 336 - 336 2 10.77 260 Other revolving credit and installment 74 119 7 200 24 6.36 181 Trial modifications (5) - - 651 651 - - -
Total consumer 1,801 2,922 1,789 6,512 347 4.00 4,417
Total $ 2,109 3,246 6,595 11,950 481 3.82 % $ 4,771 (1) Amounts represent the recorded investment in loans after recognizing the effects of the TDR, if any. TDRs with multiple types of concessions are presented only once in the
table in the first category type based on the order presented. (2) Principal modifications include principal forgiveness at the time of the modification, contingent principal forgiveness granted over the life of the loan based on borrower
performance, and principal that has been legally separated and deferred to the end of the loan, with a zero percent contractual interest rate. (3) Other interest rate concessions include loans modified to an interest rate that is not commensurate with the credit risk, even though the rate may have been increased.
These modifications would include renewals, term extensions, and other interest adjustments, but exclude modifications that also forgive principal and/or reduce the interest rate.
(4) Charge-offs include write-downs of the investment in the loan in the period of modification. In some cases, the amount of charge-offs will differ from the modification terms if the loan has already been charged down based on our policies. Modifications resulted in forgiving principal (actual, contingent or deferred) of $577 million in 2011.
(5) Trial modifications are granted a delay in payments due under the original terms during the trial payment period. However, these loans continue to advance through delinquency status and accrue interest according to their original terms. Any subsequent permanent modification generally includes interest rate related concessions; however, the exact concession type and resulting financial effect are usually not known until the loan is permanently modified.
153
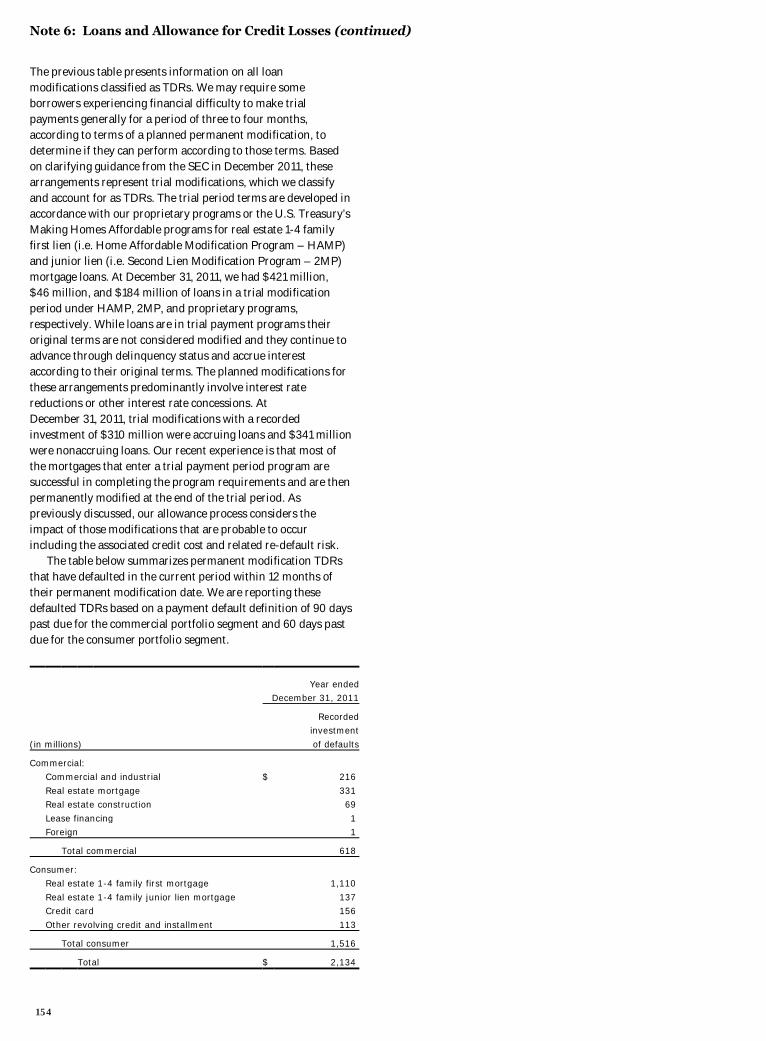
Note 6: Loans and Allowance for Credit Losses (continued)
The previous table presents information on all loan modifications classified as TDRs. We may require some borrowers experiencing financial difficulty to make trial payments generally for a period of three to four months, according to terms of a planned permanent modification, to determine if they can perform according to those terms. Based on clarifying guidance from the SEC in December 2011, these arrangements represent trial modifications, which we classify and account for as TDRs. The trial period terms are developed in accordance with our proprietary programs or the U.S. Treasury’s Making Homes Affordable programs for real estate 1-4 family first lien (i.e. Home Affordable Modification Program – HAMP) and junior lien (i.e. Second Lien Modification Program – 2MP) mortgage loans. At December 31, 2011, we had $421 million, $46 million, and $184 million of loans in a trial modification period under HAMP, 2MP, and proprietary programs, respectively. While loans are in trial payment programs their original terms are not considered modified and they continue to advance through delinquency status and accrue interest according to their original terms. The planned modifications for these arrangements predominantly involve interest rate reductions or other interest rate concessions. At December 31, 2011, trial modifications with a recorded investment of $310 million were accruing loans and $341 million were nonaccruing loans. Our recent experience is that most of the mortgages that enter a trial payment period program are successful in completing the program requirements and are then permanently modified at the end of the trial period. As previously discussed, our allowance process considers the impact of those modifications that are probable to occur including the associated credit cost and related re-default risk.
The table below summarizes permanent modification TDRs that have defaulted in the current period within 12 months of their permanent modification date. We are reporting these defaulted TDRs based on a payment default definition of 90 days past due for the commercial portfolio segment and 60 days past due for the consumer portfolio segment.
Year ended December 31, 2011
Recorded investment
(in millions) of defaults
Commercial: Commercial and industrial $ 216
Real estate mortgage 331 Real estate construction 69
Lease financing 1 Foreign 1
Total commercial 618
Consumer: Real estate 1-4 family first mortgage 1,110
Real estate 1-4 family junior lien mortgage 137 Credit card 156
Other revolving credit and installment 113
Total consumer 1,516
Total $ 2,134
154
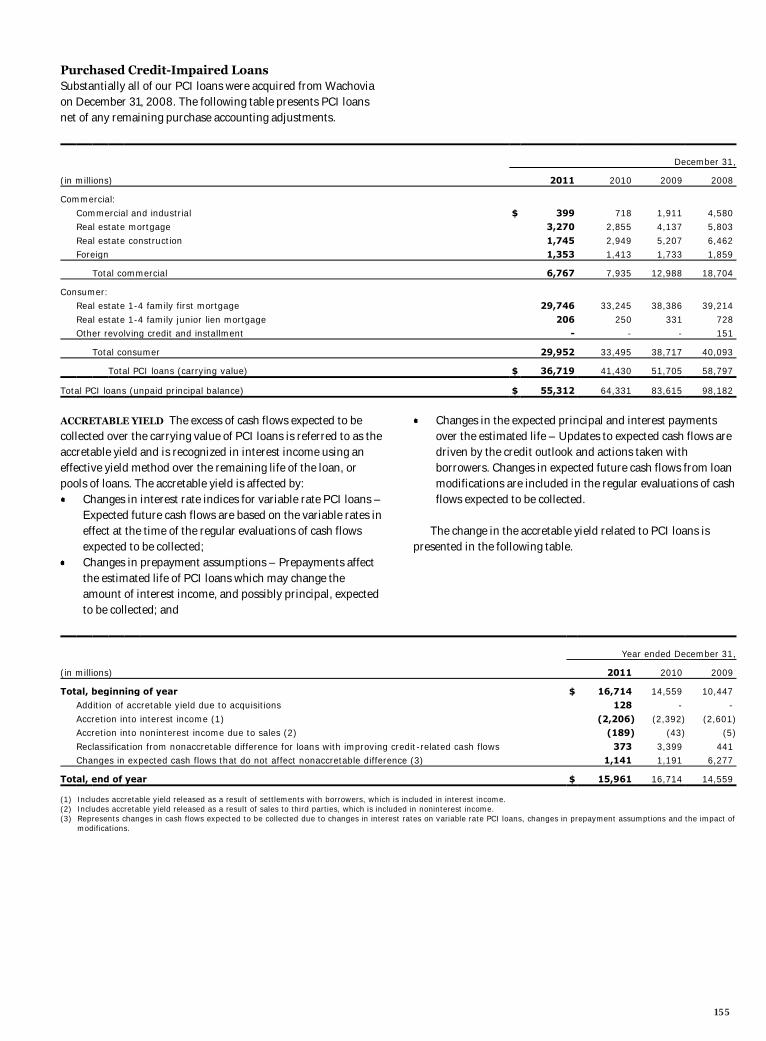
Purchased Credit-Impaired Loans Substantially all of our PCI loans were acquired from Wachovia on December 31, 2008. The following table presents PCI loans net of any remaining purchase accounting adjustments.
December 31,
(in millions) 2011 2010 2009 2008
Commercial:
Commercial and industrial $ 399 718 1,911 4,580 Real estate mortgage 3,270 2,855 4,137 5,803
Real estate construction 1,745 2,949 5,207 6,462 Foreign 1,353 1,413 1,733 1,859
Total commercial 6,767 7,935 12,988 18,704
Consumer: Real estate 1-4 family first mortgage 29,746 33,245 38,386 39,214
Real estate 1-4 family junior lien mortgage 206 250 331 728 Other revolving credit and installment - - - 151
Total consumer 29,952 33,495 38,717 40,093
Total PCI loans (carrying value) $ 36,719 41,430 51,705 58,797
Total PCI loans (unpaid principal balance) $ 55,312 64,331 83,615 98,182
ACCRETABLE YIELD The excess of cash flows expected to be collected over the carrying value of PCI loans is referred to as the accretable yield and is recognized in interest income using an effective yield method over the remaining life of the loan, or pools of loans. The accretable yield is affected by: Changes in interest rate indices for variable rate PCI loans –
Expected future cash flows are based on the variable rates in effect at the time of the regular evaluations of cash flows expected to be collected;
Changes in prepayment assumptions – Prepayments affect the estimated life of PCI loans which may change the amount of interest income, and possibly principal, expected to be collected; and
Changes in the expected principal and interest payments over the estimated life – Updates to expected cash flows are driven by the credit outlook and actions taken with borrowers. Changes in expected future cash flows from loan modifications are included in the regular evaluations of cash flows expected to be collected.
The change in the accretable yield related to PCI loans is presented in the following table.
Year ended December 31,
(in millions) 2011 2010 2009
Total, beginning of year $ 16,714 14,559 10,447 Addition of accretable yield due to acquisitions 128 - -
Accretion into interest income (1) (2,206) (2,392) (2,601) Accretion into noninterest income due to sales (2) (189) (43) (5)
Reclassification from nonaccretable difference for loans with improving credit-related cash flows 373 3,399 441 Changes in expected cash flows that do not affect nonaccretable difference (3) 1,141 1,191 6,277
Total, end of year $ 15,961 16,714 14,559
(1) Includes accretable yield released as a result of settlements with borrowers, which is included in interest income. (2) Includes accretable yield released as a result of sales to third parties, which is included in noninterest income. (3) Represents changes in cash flows expected to be collected due to changes in interest rates on variable rate PCI loans, changes in prepayment assumptions and the impact of
modifications.
155
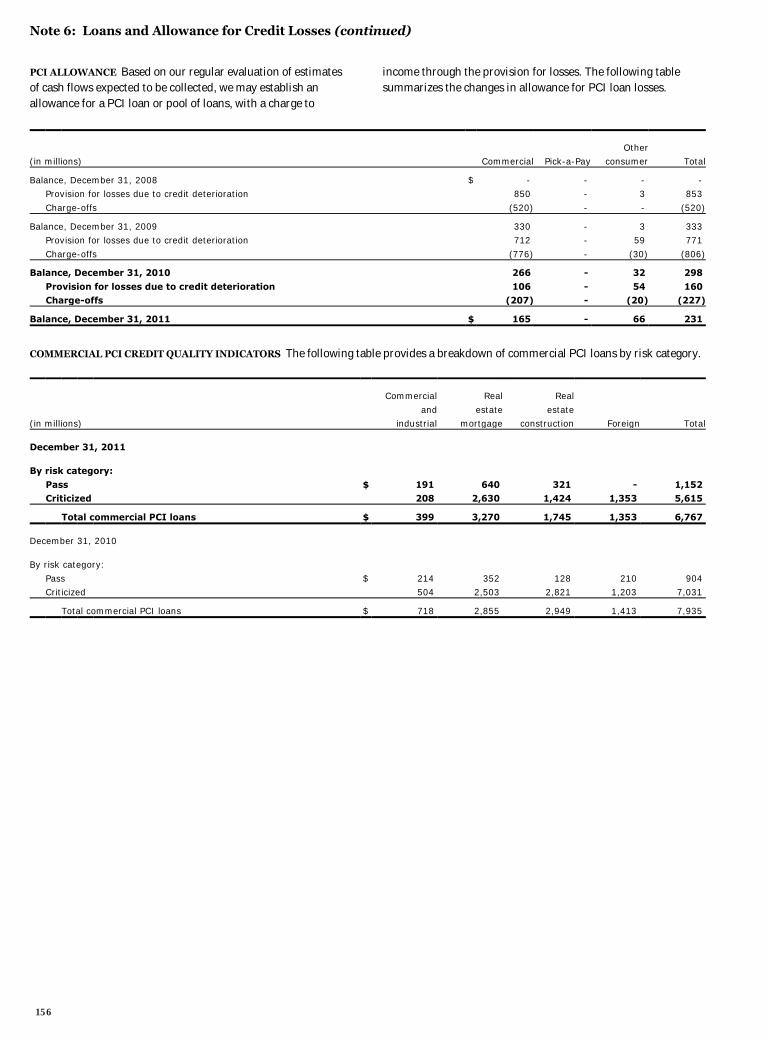
Note 6: Loans and Allowance for Credit Losses (continued)
PCI ALLOWANCE Based on our regular evaluation of estimates of cash flows expected to be collected, we may establish an allowance for a PCI loan or pool of loans, with a charge to
income through the provision for losses. The following table summarizes the changes in allowance for PCI loan losses.
Other (in millions) Commercial Pick-a-Pay consumer Total
Balance, December 31, 2008 $ - - - - Provision for losses due to credit deterioration 850 - 3 853
Charge-offs (520) - - (520)
Balance, December 31, 2009 330 - 3 333 Provision for losses due to credit deterioration 712 - 59 771
Charge-offs (776) - (30) (806)
Balance, December 31, 2010 266 - 32 298
Provision for losses due to credit deterioration 106 - 54 160 Charge-offs (207) - (20) (227)
Balance, December 31, 2011 $ 165 - 66 231
COMMERCIAL PCI CREDIT QUALITY INDICATORS The following table provides a breakdown of commercial PCI loans by risk category.
Commercial Real Real
and estate estate (in millions) industrial mortgage construction Foreign Total
December 31, 2011 By risk category:
Pass $ 191 640 321 - 1,152 Criticized 208 2,630 1,424 1,353 5,615
Total commercial PCI loans $ 399 3,270 1,745 1,353 6,767
December 31, 2010 By risk category:
Pass $ 214 352 128 210 904 Criticized 504 2,503 2,821 1,203 7,031
Total commercial PCI loans $ 718 2,855 2,949 1,413 7,935
156
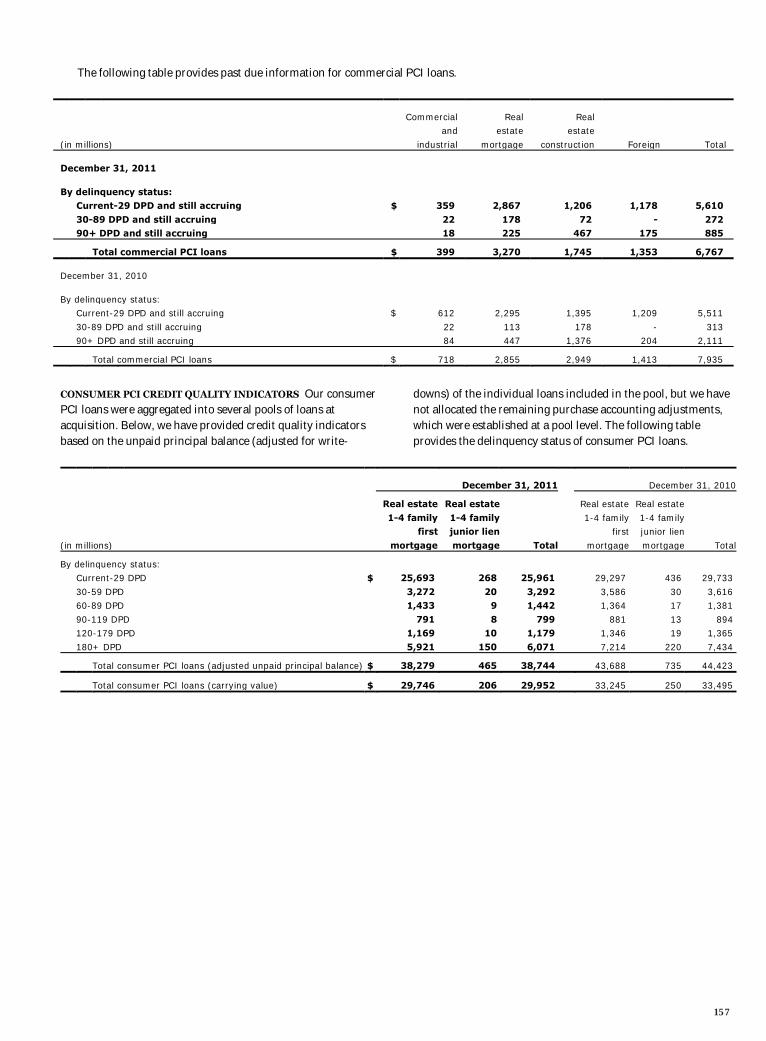
The following table provides past due information for commercial PCI loans.
Commercial Real Real and estate estate
(in millions) industrial mortgage construction Foreign Total
December 31, 2011 By delinquency status: Current-29 DPD and still accruing $ 359 2,867 1,206 1,178 5,610
30-89 DPD and still accruing 22 178 72 - 272 90+ DPD and still accruing 18 225 467 175 885
Total commercial PCI loans $ 399 3,270 1,745 1,353 6,767
December 31, 2010 By delinquency status: Current-29 DPD and still accruing $ 612 2,295 1,395 1,209 5,511
30-89 DPD and still accruing 22 113 178 - 313 90+ DPD and still accruing 84 447 1,376 204 2,111
Total commercial PCI loans $ 718 2,855 2,949 1,413 7,935
CONSUMER PCI CREDIT QUALITY INDICATORS Our consumer PCI loans were aggregated into several pools of loans at acquisition. Below, we have provided credit quality indicators based on the unpaid principal balance (adjusted for write-
downs) of the individual loans included in the pool, but we have not allocated the remaining purchase accounting adjustments, which were established at a pool level. The following table provides the delinquency status of consumer PCI loans.
December 31, 2011 December 31, 2010
Real estate Real estate Real estate Real estate
1-4 family 1-4 family 1-4 family 1-4 family first junior lien first junior lien
(in millions) mortgage mortgage Total mortgage mortgage Total
By delinquency status: Current-29 DPD $ 25,693 268 25,961 29,297 436 29,733
30-59 DPD 3,272 20 3,292 3,586 30 3,616 60-89 DPD 1,433 9 1,442 1,364 17 1,381
90-119 DPD 791 8 799 881 13 894 120-179 DPD 1,169 10 1,179 1,346 19 1,365
180+ DPD 5,921 150 6,071 7,214 220 7,434
Total consumer PCI loans (adjusted unpaid principal balance) $ 38,279 465 38,744 43,688 735 44,423
Total consumer PCI loans (carrying value) $ 29,746 206 29,952 33,245 250 33,495
157
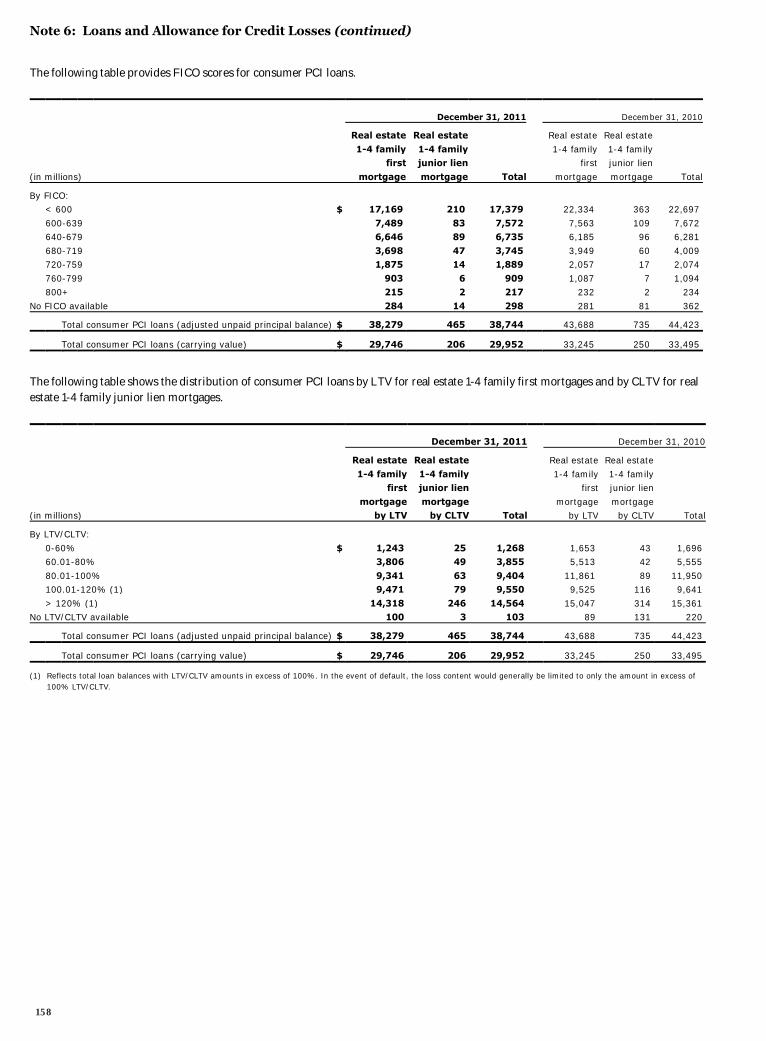
Note 6: Loans and Allowance for Credit Losses (continued)
The following table provides FICO scores for consumer PCI loans.
December 31, 2011 December 31, 2010
Real estate Real estate Real estate Real estate
1-4 family 1-4 family 1-4 family 1-4 family first junior lien first junior lien
(in millions) mortgage mortgage Total mortgage mortgage Total
By FICO: < 600 $ 17,169 210 17,379 22,334 363 22,697
600-639 7,489 83 7,572 7,563 109 7,672 640-679 6,646 89 6,735 6,185 96 6,281
680-719 3,698 47 3,745 3,949 60 4,009 720-759 1,875 14 1,889 2,057 17 2,074
760-799 903 6 909 1,087 7 1,094 800+ 215 2 217 232 2 234
No FICO available 284 14 298 281 81 362
Total consumer PCI loans (adjusted unpaid principal balance) $ 38,279 465 38,744 43,688 735 44,423
Total consumer PCI loans (carrying value) $ 29,746 206 29,952 33,245 250 33,495
The following table shows the distribution of consumer PCI loans by LTV for real estate 1-4 family first mortgages and by CLTV for real estate 1-4 family junior lien mortgages.
December 31, 2011 December 31, 2010
Real estate Real estate Real estate Real estate
1-4 family 1-4 family 1-4 family 1-4 family first junior lien first junior lien
mortgage mortgage mortgage mortgage (in millions) by LTV by CLTV Total by LTV by CLTV Total
By LTV/CLTV:
0-60% $ 1,243 25 1,268 1,653 43 1,696 60.01-80% 3,806 49 3,855 5,513 42 5,555
80.01-100% 9,341 63 9,404 11,861 89 11,950 100.01-120% (1) 9,471 79 9,550 9,525 116 9,641
> 120% (1) 14,318 246 14,564 15,047 314 15,361 No LTV/CLTV available 100 3 103 89 131 220
Total consumer PCI loans (adjusted unpaid principal balance) $ 38,279 465 38,744 43,688 735 44,423
Total consumer PCI loans (carrying value) $ 29,746 206 29,952 33,245 250 33,495
(1) Reflects total loan balances with LTV/CLTV amounts in excess of 100%. In the event of default, the loss content would generally be limited to only the amount in excess of 100% LTV/CLTV.
158

Note 7: Premises, Equipment, Lease Commitments and Other Assets
December 31,
(in millions) 2011 2010
Land $ 1,825 1,825
Buildings 7,441 7,440 Furniture and equipment 7,195 6,689
Leasehold improvements 1,725 1,683 Premises and equipment leased
under capital leases 147 148
Total premises and equipment 18,333 17,785
Less: Accumulated depreciation and amortization 8,802 8,141
Net book value,
premises and equipment $ 9,531 9,644
Depreciation and amortization expense for premises and equipment was $1.4 billion, $1.5 billion and $1.3 billion in 2011, 2010 and 2009, respectively. Dispositions of premises and equipment, included in noninterest expense, resulted in net losses of $17 million, $115 million and $22 million in 2011, 2010 and 2009, respectively. We have obligations under a number of noncancelable operating leases for premises and equipment. The terms of these leases are predominantly up to 15 years, with the longest up to 94 years, and many provide for periodic adjustment of rentals based on changes in various economic indicators. Some leases also include a renewal option. The following table provides the future minimum payments under capital leases and noncancelable operating leases, net of sublease rentals, with terms greater than one year as of December 31, 2011.
Operating Capital
(in millions) leases leases
Year ended December 31,
2012 $ 1,319 54 2013 1,216 55
2014 1,075 3 2015 872 3
2016 717 3 Thereafter 3,239 17
Total minimum lease payments $ 8,438 135
Executory costs $ (9)
Amounts representing interest (10)
Present value of net minimum
lease payments $ 116
Operating lease rental expense (predominantly for premises), net of rental income, was $1.2 billion, $1.3 billion and $1.4 billion in 2011, 2010 and 2009, respectively. The components of other assets were:
December 31,
(in millions) 2011 2010
Nonmarketable equity investments:
Cost method: Private equity investments $ 3,444 3,240
Federal bank stock 4,617 5,254
Total cost method 8,061 8,494
LIHTC investments - equity method (1) 4,077 3,611 All other equity method 4,434 4,013
Principal investments (2) 236 305
Total nonmarketable equity investments 16,808 16,423
Corporate/bank-owned life insurance 20,146 19,845 Accounts receivable 25,939 23,763
Interest receivable 5,296 4,895 Core deposit intangibles 7,311 8,904
Customer relationship and other amortized intangibles 1,639 1,847
Foreclosed assets: GNMA (3) 1,319 1,479
Other 3,342 4,530 Operating lease assets 1,825 1,873
Due from customers on acceptances 225 229 Other 17,172 15,993
Total other assets $ 101,022 99,781
(1) Represents low income housing tax credit investments. (2) Principal investments are recorded at fair value with realized and unrealized
gains (losses) included in net gains (losses) from equity investments in the income statement.
(3) These are foreclosed real estate securing FHA insured and VA guaranteed loans. Both principal and interest for these loans secured by the foreclosed real estate are collectible because they are insured/guaranteed.
Income related to nonmarketable equity investments was:
Year ended December 31,
(in millions) 2011 2010 2009
Net gains (losses) from:
Private equity investments $ 813 492 (368) Principal investments 29 42 79
All other nonmarketable equity investments (298) (188) (234)
Total $ 544 346 (523)
159
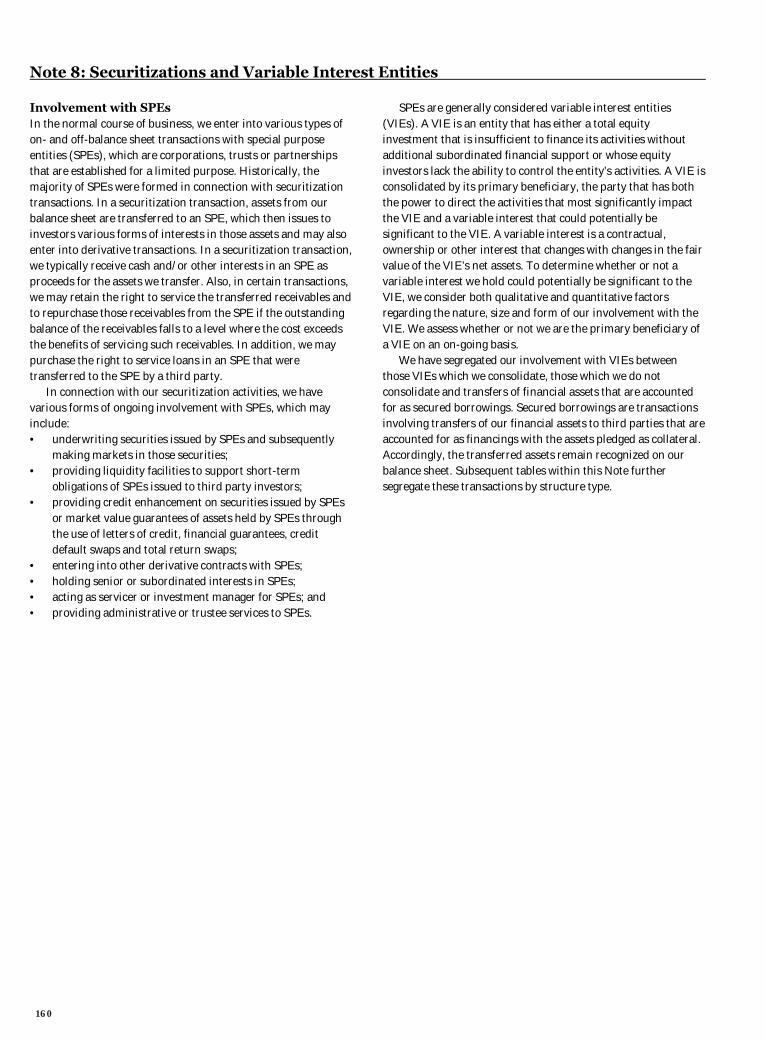
Note 8: Securitizations and Variable Interest Entities Involvement with SPEs In the normal course of business, we enter into various types of on- and off-balance sheet transactions with special purpose entities (SPEs), which are corporations, trusts or partnerships that are established for a limited purpose. Historically, the majority of SPEs were formed in connection with securitization transactions. In a securitization transaction, assets from our balance sheet are transferred to an SPE, which then issues to investors various forms of interests in those assets and may also enter into derivative transactions. In a securitization transaction, we typically receive cash and/or other interests in an SPE as proceeds for the assets we transfer. Also, in certain transactions, we may retain the right to service the transferred receivables and to repurchase those receivables from the SPE if the outstanding balance of the receivables falls to a level where the cost exceeds the benefits of servicing such receivables. In addition, we may purchase the right to service loans in an SPE that were transferred to the SPE by a third party. In connection with our securitization activities, we have various forms of ongoing involvement with SPEs, which may include: • underwriting securities issued by SPEs and subsequently
making markets in those securities; • providing liquidity facilities to support short-term
obligations of SPEs issued to third party investors; • providing credit enhancement on securities issued by SPEs
or market value guarantees of assets held by SPEs through the use of letters of credit, financial guarantees, credit default swaps and total return swaps;
• entering into other derivative contracts with SPEs; • holding senior or subordinated interests in SPEs; • acting as servicer or investment manager for SPEs; and • providing administrative or trustee services to SPEs.
SPEs are generally considered variable interest entities (VIEs). A VIE is an entity that has either a total equity investment that is insufficient to finance its activities without additional subordinated financial support or whose equity investors lack the ability to control the entity’s activities. A VIE is consolidated by its primary beneficiary, the party that has both the power to direct the activities that most significantly impact the VIE and a variable interest that could potentially be significant to the VIE. A variable interest is a contractual, ownership or other interest that changes with changes in the fair value of the VIE’s net assets. To determine whether or not a variable interest we hold could potentially be significant to the VIE, we consider both qualitative and quantitative factors regarding the nature, size and form of our involvement with the VIE. We assess whether or not we are the primary beneficiary of a VIE on an on-going basis. We have segregated our involvement with VIEs between those VIEs which we consolidate, those which we do not consolidate and transfers of financial assets that are accounted for as secured borrowings. Secured borrowings are transactions involving transfers of our financial assets to third parties that are accounted for as financings with the assets pledged as collateral. Accordingly, the transferred assets remain recognized on our balance sheet. Subsequent tables within this Note further segregate these transactions by structure type.
160
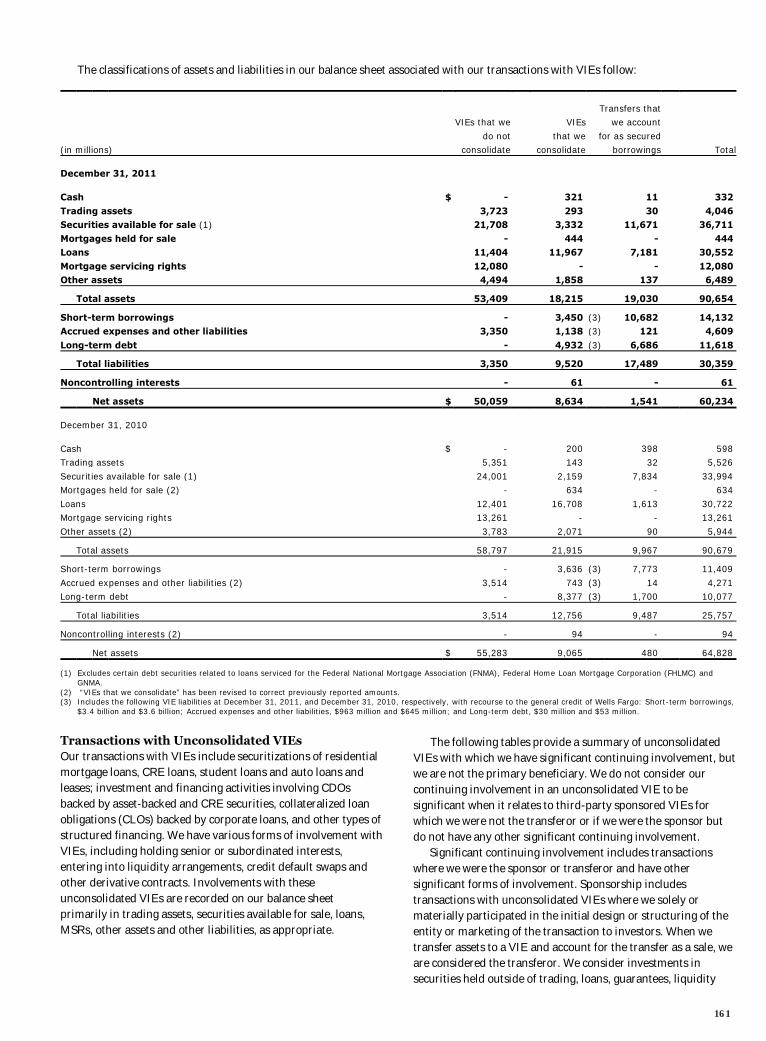
The classifications of assets and liabilities in our balance sheet associated with our transactions with VIEs follow:
Transfers that VIEs that we VIEs we account
do not that we for as secured (in millions) consolidate consolidate borrowings Total
December 31, 2011 Cash $ - 321 11 332
Trading assets 3,723 293 30 4,046 Securities available for sale (1) 21,708 3,332 11,671 36,711
Mortgages held for sale - 444 - 444 Loans 11,404 11,967 7,181 30,552
Mortgage servicing rights 12,080 - - 12,080 Other assets 4,494 1,858 137 6,489
Total assets 53,409 18,215 19,030 90,654
Short-term borrowings - 3,450 (3) 10,682 14,132 Accrued expenses and other liabilities 3,350 1,138 (3) 121 4,609
Long-term debt - 4,932 (3) 6,686 11,618
Total liabilities 3,350 9,520 17,489 30,359
Noncontrolling interests - 61 - 61
Net assets $ 50,059 8,634 1,541 60,234
December 31, 2010 Cash $ - 200 398 598 Trading assets 5,351 143 32 5,526
Securities available for sale (1) 24,001 2,159 7,834 33,994 Mortgages held for sale (2) - 634 - 634
Loans 12,401 16,708 1,613 30,722 Mortgage servicing rights 13,261 - - 13,261
Other assets (2) 3,783 2,071 90 5,944
Total assets 58,797 21,915 9,967 90,679
Short-term borrowings - 3,636 (3) 7,773 11,409
Accrued expenses and other liabilities (2) 3,514 743 (3) 14 4,271 Long-term debt - 8,377 (3) 1,700 10,077
Total liabilities 3,514 12,756 9,487 25,757
Noncontrolling interests (2) - 94 - 94
Net assets $ 55,283 9,065 480 64,828
(1) Excludes certain debt securities related to loans serviced for the Federal National Mortgage Association (FNMA), Federal Home Loan Mortgage Corporation (FHLMC) and GNMA.
(2) “VIEs that we consolidate” has been revised to correct previously reported amounts. (3) Includes the following VIE liabilities at December 31, 2011, and December 31, 2010, respectively, with recourse to the general credit of Wells Fargo: Short-term borrowings,
$3.4 billion and $3.6 billion; Accrued expenses and other liabilities, $963 million and $645 million; and Long-term debt, $30 million and $53 million.
Transactions with Unconsolidated VIEs Our transactions with VIEs include securitizations of residential mortgage loans, CRE loans, student loans and auto loans and leases; investment and financing activities involving CDOs backed by asset-backed and CRE securities, collateralized loan obligations (CLOs) backed by corporate loans, and other types of structured financing. We have various forms of involvement with VIEs, including holding senior or subordinated interests, entering into liquidity arrangements, credit default swaps and other derivative contracts. Involvements with these unconsolidated VIEs are recorded on our balance sheet primarily in trading assets, securities available for sale, loans, MSRs, other assets and other liabilities, as appropriate.
The following tables provide a summary of unconsolidated VIEs with which we have significant continuing involvement, but we are not the primary beneficiary. We do not consider our continuing involvement in an unconsolidated VIE to be significant when it relates to third-party sponsored VIEs for which we were not the transferor or if we were the sponsor but do not have any other significant continuing involvement. Significant continuing involvement includes transactions where we were the sponsor or transferor and have other significant forms of involvement. Sponsorship includes transactions with unconsolidated VIEs where we solely or materially participated in the initial design or structuring of the entity or marketing of the transaction to investors. When we transfer assets to a VIE and account for the transfer as a sale, we are considered the transferor. We consider investments in securities held outside of trading, loans, guarantees, liquidity
161
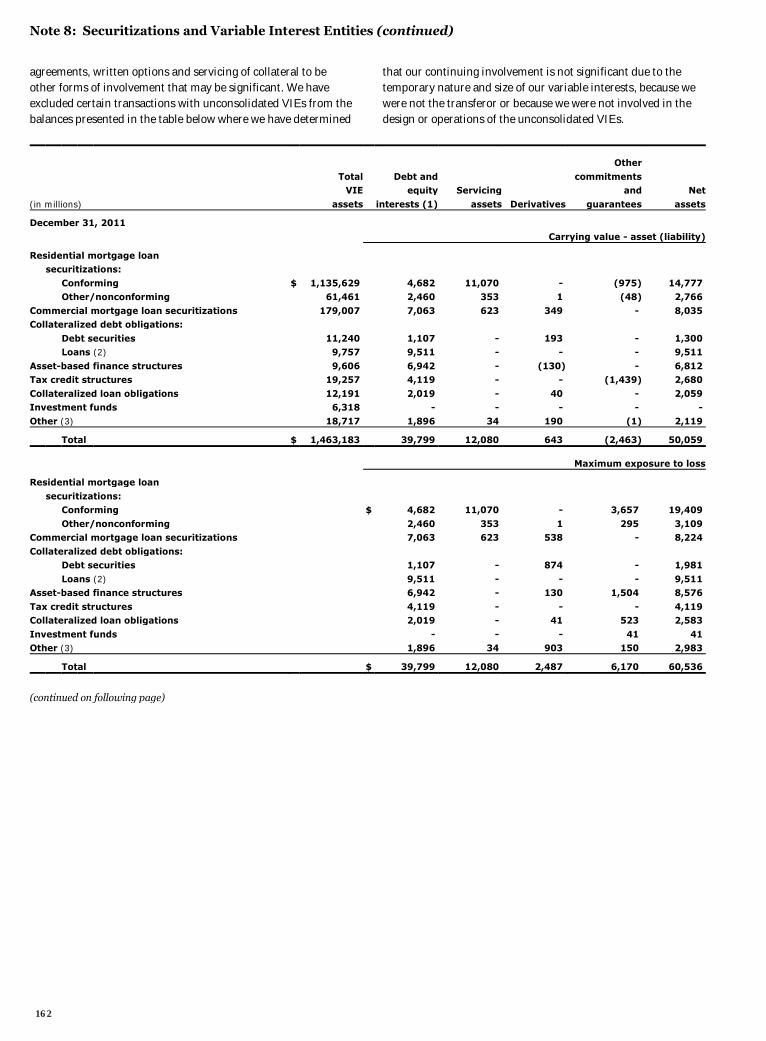
Note 8: Securitizations and Variable Interest Entities (continued)
agreements, written options and servicing of collateral to be other forms of involvement that may be significant. We have excluded certain transactions with unconsolidated VIEs from the balances presented in the table below where we have determined
that our continuing involvement is not significant due to the temporary nature and size of our variable interests, because we were not the transferor or because we were not involved in the design or operations of the unconsolidated VIEs.
Other
Total Debt and commitments VIE equity Servicing and Net
(in millions) assets interests (1) assets Derivatives guarantees assets
December 31, 2011
Carrying value - asset (liability)
Residential mortgage loan securitizations:
Conforming $ 1,135,629 4,682 11,070 - (975) 14,777 Other/nonconforming 61,461 2,460 353 1 (48) 2,766
Commercial mortgage loan securitizations 179,007 7,063 623 349 - 8,035 Collateralized debt obligations:
Debt securities 11,240 1,107 - 193 - 1,300 Loans (2) 9,757 9,511 - - - 9,511
Asset-based finance structures 9,606 6,942 - (130) - 6,812 Tax credit structures 19,257 4,119 - - (1,439) 2,680
Collateralized loan obligations 12,191 2,019 - 40 - 2,059 Investment funds 6,318 - - - - -
Other (3) 18,717 1,896 34 190 (1) 2,119
Total $ 1,463,183 39,799 12,080 643 (2,463) 50,059
Maximum exposure to loss
Residential mortgage loan
securitizations: Conforming $ 4,682 11,070 - 3,657 19,409
Other/nonconforming 2,460 353 1 295 3,109 Commercial mortgage loan securitizations 7,063 623 538 - 8,224
Collateralized debt obligations: Debt securities 1,107 - 874 - 1,981
Loans (2) 9,511 - - - 9,511 Asset-based finance structures 6,942 - 130 1,504 8,576
Tax credit structures 4,119 - - - 4,119 Collateralized loan obligations 2,019 - 41 523 2,583
Investment funds - - - 41 41 Other (3) 1,896 34 903 150 2,983
Total $ 39,799 12,080 2,487 6,170 60,536
(continued on following page)
162
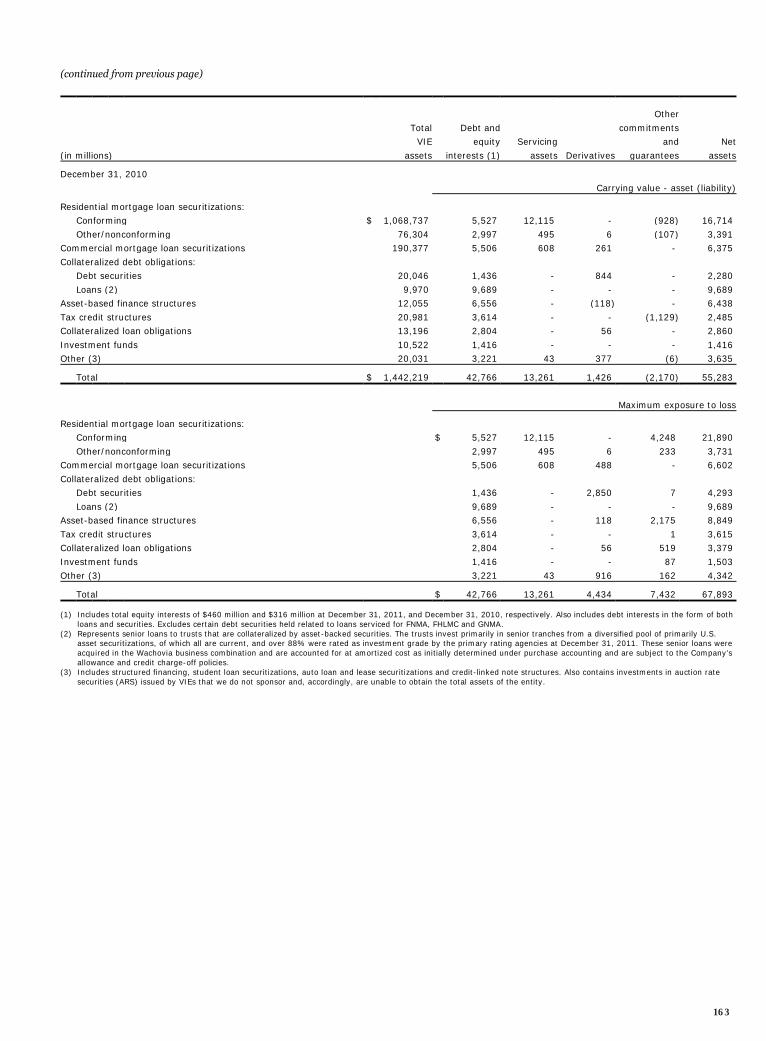
(continued from previous page)
Other
Total Debt and commitments VIE equity Servicing and Net
(in millions) assets interests (1) assets Derivatives guarantees assets
December 31, 2010
Carrying value - asset (liability)
Residential mortgage loan securitizations: Conforming $ 1,068,737 5,527 12,115 - (928) 16,714
Other/nonconforming 76,304 2,997 495 6 (107) 3,391 Commercial mortgage loan securitizations 190,377 5,506 608 261 - 6,375
Collateralized debt obligations: Debt securities 20,046 1,436 - 844 - 2,280
Loans (2) 9,970 9,689 - - - 9,689 Asset-based finance structures 12,055 6,556 - (118) - 6,438
Tax credit structures 20,981 3,614 - - (1,129) 2,485 Collateralized loan obligations 13,196 2,804 - 56 - 2,860
Investment funds 10,522 1,416 - - - 1,416 Other (3) 20,031 3,221 43 377 (6) 3,635
Total $ 1,442,219 42,766 13,261 1,426 (2,170) 55,283
Maximum exposure to loss
Residential mortgage loan securitizations: Conforming $ 5,527 12,115 - 4,248 21,890
Other/nonconforming 2,997 495 6 233 3,731 Commercial mortgage loan securitizations 5,506 608 488 - 6,602
Collateralized debt obligations: Debt securities 1,436 - 2,850 7 4,293
Loans (2) 9,689 - - - 9,689 Asset-based finance structures 6,556 - 118 2,175 8,849
Tax credit structures 3,614 - - 1 3,615 Collateralized loan obligations 2,804 - 56 519 3,379
Investment funds 1,416 - - 87 1,503 Other (3) 3,221 43 916 162 4,342
Total $ 42,766 13,261 4,434 7,432 67,893
(1) Includes total equity interests of $460 million and $316 million at December 31, 2011, and December 31, 2010, respectively. Also includes debt interests in the form of both loans and securities. Excludes certain debt securities held related to loans serviced for FNMA, FHLMC and GNMA.
(2) Represents senior loans to trusts that are collateralized by asset-backed securities. The trusts invest primarily in senior tranches from a diversified pool of primarily U.S. asset securitizations, of which all are current, and over 88% were rated as investment grade by the primary rating agencies at December 31, 2011. These senior loans were acquired in the Wachovia business combination and are accounted for at amortized cost as initially determined under purchase accounting and are subject to the Company’s allowance and credit charge-off policies.
(3) Includes structured financing, student loan securitizations, auto loan and lease securitizations and credit-linked note structures. Also contains investments in auction rate securities (ARS) issued by VIEs that we do not sponsor and, accordingly, are unable to obtain the total assets of the entity.
163
Note 8: Securitizations and Variable Interest Entities (continued)
In the two preceding tables, “Total VIE assets” represents the remaining principal balance of assets held by unconsolidated VIEs using the most current information available. For VIEs that obtain exposure to assets synthetically through derivative instruments, the remaining notional amount of the derivative is included in the asset balance. “Carrying value” is the amount in our consolidated balance sheet related to our involvement with the unconsolidated VIEs. “Maximum exposure to loss” from our involvement with off-balance sheet entities, which is a required disclosure under GAAP, is determined as the carrying value of our involvement with off-balance sheet (unconsolidated) VIEs plus the remaining undrawn liquidity and lending commitments, the notional amount of net written derivative contracts, and generally the notional amount of, or stressed loss estimate for, other commitments and guarantees. It represents estimated loss that would be incurred under severe, hypothetical circumstances, for which we believe the possibility is extremely remote, such as where the value of our interests and any associated collateral declines to zero, without any consideration of recovery or offset from any economic hedges. Accordingly, this required disclosure is not an indication of expected loss. RESIDENTIAL MORTGAGE LOANS Residential mortgage loan securitizations are financed through the issuance of fixed- or floating-rate-asset-backed-securities, which are collateralized by the loans transferred to a VIE. We typically transfer loans we originated to these VIEs, account for the transfers as sales, retain the right to service the loans and may hold other beneficial interests issued by the VIEs. We also may be exposed to limited liability related to recourse agreements and repurchase agreements we make to our issuers and purchasers, which are included in other commitments and guarantees. In certain instances, we may service residential mortgage loan securitizations structured by third parties whose loans we did not originate or transfer. Our residential mortgage loan securitizations consist of conforming and nonconforming securitizations. Conforming residential mortgage loan securitizations are those that are guaranteed by GSEs, including GNMA. We do not consolidate our conforming residential mortgage loan securitizations because we do not have power over the VIEs. The loans sold to the VIEs in nonconforming residential mortgage loan securitizations are those that do not qualify for a GSE guarantee. We may hold variable interests issued by the VIEs, primarily in the form of senior securities. We do not consolidate the nonconforming residential mortgage loan securitizations included in the table because we either do not hold any variable interests, hold variable interests that we do not consider potentially significant or are not the primary servicer for a majority of the VIE assets. Other commitments and guarantees include amounts related to loans sold that we may be required to repurchase, or otherwise indemnify or reimburse the investor or insurer for losses incurred, due to material breach of contractual representations and warranties. The maximum exposure to loss for material breach of contractual representations and warranties represents a stressed case estimate we utilize for
determining stressed case regulatory capital needs and is considered to be a remote scenario. COMMERCIAL MORTGAGE LOAN SECURITIZATIONS
Commercial mortgage loan securitizations are financed through the issuance of fixed- or floating-rate-asset-backed-securities, which are collateralized by the loans transferred to the VIE. In a typical securitization, we may transfer loans we originate to these VIEs, account for the transfers as sales, retain the right to service the loans and may hold other beneficial interests issued by the VIEs. In certain instances, we may service commercial mortgage loan securitizations structured by third parties whose loans we did not originate or transfer. We typically serve as primary or master servicer of these VIEs. The primary or master servicer in a commercial mortgage loan securitization typically cannot make the most significant decisions impacting the performance of the VIE and therefore does not have power over the VIE. We do not consolidate the commercial mortgage loan securitizations included in the disclosure because we either do not have power or do not have a variable interest that could potentially be significant to the VIE. COLLATERALIZED DEBT OBLIGATIONS (CDOs) A CDO is a securitization where an SPE purchases a pool of assets consisting of asset-backed securities and issues multiple tranches of equity or notes to investors. In some transactions, a portion of the assets are obtained synthetically through the use of derivatives such as credit default swaps or total return swaps. Prior to 2008, we engaged in the structuring of CDOs on behalf of third party asset managers who would select and manage the assets for the CDO. Typically, the asset manager has some discretion to manage the sale of assets of, or derivatives used by the CDO, which generally gives the asset manager the power over the CDO. We have not structured these types of transactions since the credit market disruption began in late 2007. In addition to our role as arranger we may have other forms of involvement with these transactions, including transactions established prior to 2008. Such involvement may include acting as liquidity provider, derivative counterparty, secondary market maker or investor. For certain transactions, we may also act as the collateral manager or servicer. We receive fees in connection with our role as collateral manager or servicer. We assess whether we are the primary beneficiary of CDOs based on our role in the transaction in combination with the variable interests we hold. Subsequently, we monitor our ongoing involvement in these transactions to determine if the nature of our involvement has changed. We are not the primary beneficiary of these transactions in most cases because we do not act as the collateral manager or servicer, which generally denotes power. In cases where we are the collateral manager or servicer, we are not the primary beneficiary because we do not hold interests that could potentially be significant to the VIE. In 2011, we incurred a $377 million loss on trading derivatives related to certain CDOs. The loss was associated with the resolution of a legacy Wachovia position that settled during the year.
164
COLLATERALIZED LOAN OBLIGATIONS (CLOs) A CLO is a securitization where an SPE purchases a pool of assets consisting of loans and issues multiple tranches of equity or notes to investors. Generally, CLOs are structured on behalf of a third party asset manager that typically selects and manages the assets for the term of the CLO. Typically, the asset manager has the power over the significant decisions of the VIE through its discretion to manage the assets of the CLO. We assess whether we are the primary beneficiary of CLOs based on our role in the transaction and the variable interests we hold. In most cases, we are not the primary beneficiary of these transactions because we do not have the power to manage the collateral in the VIE. In addition to our role as arranger, we may have other forms of involvement with these transactions. Such involvement may include acting as underwriter, derivative counterparty, secondary market maker or investor. For certain transactions, we may also act as the servicer, for which we receive fees in connection with that role. We also earn fees for arranging these transactions and distributing the securities. ASSET-BASED FINANCE STRUCTURES We engage in various forms of structured finance arrangements with VIEs that are collateralized by various asset classes including energy contracts, auto and other transportation leases, intellectual property, equipment and general corporate credit. We typically provide senior financing, and may act as an interest rate swap or commodity derivative counterparty when necessary. In most cases, we are not the primary beneficiary of these structures because we do not have power over the significant activities of the VIEs involved in these transactions. For example, we have investments in asset-backed securities that are collateralized by auto leases or loans and cash reserves. These fixed-rate and variable-rate securities have been structured as single-tranche, fully amortizing, unrated bonds that are equivalent to investment-grade securities due to their significant overcollateralization. The securities are issued by VIEs that have been formed by third party auto financing institutions primarily because they require a source of liquidity to fund ongoing vehicle sales operations. The third party auto financing institutions manage the collateral in the VIEs, which is indicative of power in these transactions and we therefore do not consolidate these VIEs. TAX CREDIT STRUCTURES We co-sponsor and make investments in affordable housing and sustainable energy projects that are designed to generate a return primarily through the realization of federal tax credits. In some instances, our investments in these structures may require that we fund future capital commitments at the discretion of the project sponsors. While the size of our investment in a single entity may at times exceed 50% of the outstanding equity interests, we do not consolidate these structures due to the project sponsor’s ability to manage the projects, which is indicative of power in these transactions. INVESTMENT FUNDS We do not consolidate the investment funds because we do not absorb the majority of the expected
future variability associated with the funds’ assets, including variability associated with credit, interest rate and liquidity risks. During 2011, we redeemed a $1.4 billion interest in an unconsolidated investment fund managed by one of our majority owned subsidiaries. Upon redemption we placed the assets received into new investment fund VIEs. We consolidated these new VIEs because we have discretion over the management of the assets and are the sole investor in these funds. At December 31, 2010, we had investments of $1.4 billion and lending arrangements of $14 million with this fund. OTHER TRANSACTIONS WITH VIEs In 2008, legacy Wachovia reached an agreement to purchase at par auction rate securities (ARS) that were sold to third-party investors by certain of its subsidiaries. ARS are debt instruments with long-term maturities, but which re-price more frequently, and preferred equities with no maturity. We purchased all outstanding ARS that were issued by VIEs and subject to the agreement. At December 31, 2011, we held in our securities available-for-sale portfolio $643 million of ARS issued by VIEs redeemed pursuant to this agreement, compared with $1.6 billion at December 31, 2010. In 2009, we reached agreements to purchase additional ARS from eligible investors who bought ARS through one of our broker-dealer subsidiaries. We purchased all outstanding ARS that were issued by VIEs and subject to the agreement. As of December 31, 2011, we held in our securities available-for-sale portfolio $624 million of ARS issued by VIEs redeemed pursuant to this agreement, compared with $901 million at December 31, 2010. We do not consolidate the VIEs that issued the ARS because we do not have power over the activities of the VIEs. TRUST PREFERRED SECURITIES In addition to the involvements disclosed in the preceding table, through the issuance of trust preferred securities we had junior subordinated debt financing with a carrying value of $7.6 billion at December 31, 2011, and $19.3 billion at December 31, 2010, and $2.5 billion of preferred stock at December 31, 2011. In these transactions, VIEs that we wholly own issue debt securities or preferred equity to third party investors. All of the proceeds of the issuance are invested in debt securities or preferred equity that we issue to the VIEs. The VIEs’ operations and cash flows relate only to the issuance, administration and repayment of the securities held by third parties. We do not consolidate these VIEs because the sole assets of the VIEs are receivables from us. This is the case even though we own all of the voting equity shares of the VIEs, have fully guaranteed the obligations of the VIEs and may have the right to redeem the third party securities under certain circumstances. We report the debt securities issued to the VIEs as long-term junior subordinated debt and the preferred equity securities issued to the VIEs as preferred stock in our consolidated balance sheet. In 2011, we redeemed $9.2 billion of trust preferred securities that will no longer count as Tier 1 capital under the Dodd-Frank Act and the Basel Committee guidelines known as the Basel III standards.
165
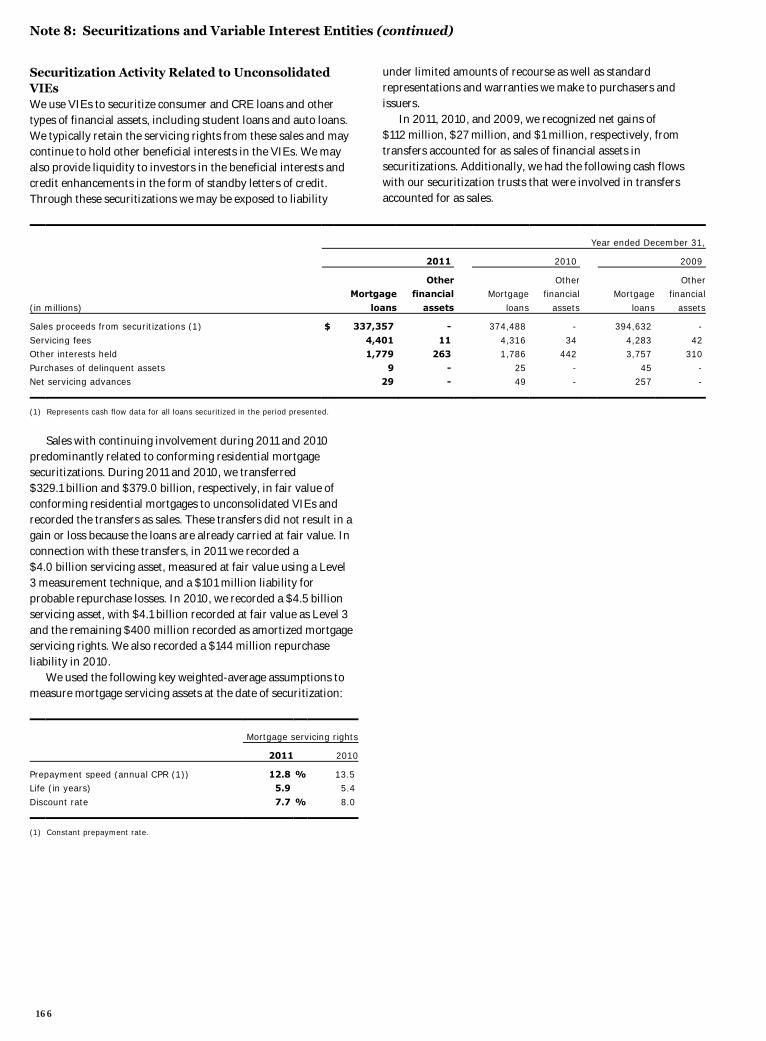
Note 8: Securitizations and Variable Interest Entities (continued)
Securitization Activity Related to Unconsolidated VIEs We use VIEs to securitize consumer and CRE loans and other types of financial assets, including student loans and auto loans. We typically retain the servicing rights from these sales and may continue to hold other beneficial interests in the VIEs. We may also provide liquidity to investors in the beneficial interests and credit enhancements in the form of standby letters of credit. Through these securitizations we may be exposed to liability
under limited amounts of recourse as well as standard representations and warranties we make to purchasers and issuers. In 2011, 2010, and 2009, we recognized net gains of $112 million, $27 million, and $1 million, respectively, from transfers accounted for as sales of financial assets in securitizations. Additionally, we had the following cash flows with our securitization trusts that were involved in transfers accounted for as sales.
Year ended December 31,
2011 2010 2009
Other Other Other Mortgage financial Mortgage financial Mortgage financial
(in millions) loans assets loans assets loans assets
Sales proceeds from securitizations (1) $ 337,357 - 374,488 - 394,632 -
Servicing fees 4,401 11 4,316 34 4,283 42 Other interests held 1,779 263 1,786 442 3,757 310
Purchases of delinquent assets 9 - 25 - 45 - Net servicing advances 29 - 49 - 257 -
(1) Represents cash flow data for all loans securitized in the period presented.
Sales with continuing involvement during 2011 and 2010 predominantly related to conforming residential mortgage securitizations. During 2011 and 2010, we transferred $329.1 billion and $379.0 billion, respectively, in fair value of conforming residential mortgages to unconsolidated VIEs and recorded the transfers as sales. These transfers did not result in a gain or loss because the loans are already carried at fair value. In connection with these transfers, in 2011 we recorded a $4.0 billion servicing asset, measured at fair value using a Level 3 measurement technique, and a $101 million liability for probable repurchase losses. In 2010, we recorded a $4.5 billion servicing asset, with $4.1 billion recorded at fair value as Level 3 and the remaining $400 million recorded as amortized mortgage servicing rights. We also recorded a $144 million repurchase liability in 2010. We used the following key weighted-average assumptions to measure mortgage servicing assets at the date of securitization:
Mortgage servicing rights
2011 2010
Prepayment speed (annual CPR (1)) 12.8 % 13.5 Life (in years) 5.9 5.4
Discount rate 7.7 % 8.0
(1) Constant prepayment rate.
166
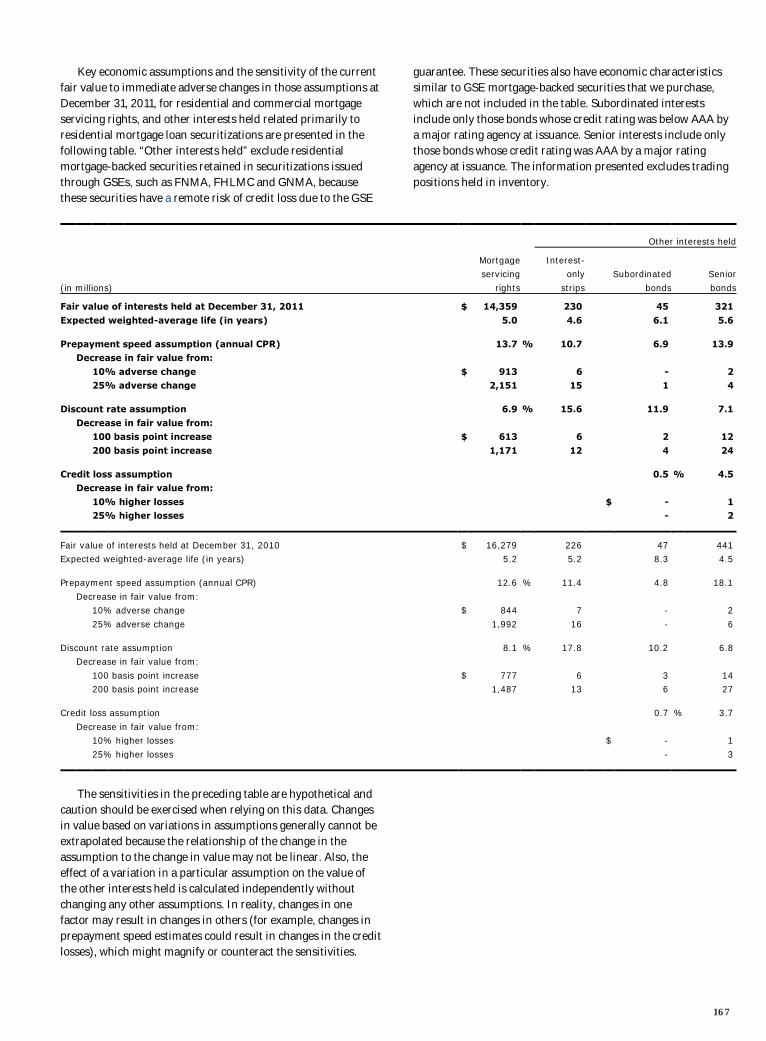
Key economic assumptions and the sensitivity of the current fair value to immediate adverse changes in those assumptions at December 31, 2011, for residential and commercial mortgage servicing rights, and other interests held related primarily to residential mortgage loan securitizations are presented in the following table. “Other interests held” exclude residential mortgage-backed securities retained in securitizations issued through GSEs, such as FNMA, FHLMC and GNMA, because these securities have a remote risk of credit loss due to the GSE
guarantee. These securities also have economic characteristics similar to GSE mortgage-backed securities that we purchase, which are not included in the table. Subordinated interests include only those bonds whose credit rating was below AAA by a major rating agency at issuance. Senior interests include only those bonds whose credit rating was AAA by a major rating agency at issuance. The information presented excludes trading positions held in inventory.
Other interests held
Mortgage Interest- servicing only Subordinated Senior
(in millions) rights strips bonds bonds
Fair value of interests held at December 31, 2011 $ 14,359 230 45 321
Expected weighted-average life (in years) 5.0 4.6 6.1 5.6 Prepayment speed assumption (annual CPR) 13.7 % 10.7 6.9 13.9 Decrease in fair value from:
10% adverse change $ 913 6 - 2 25% adverse change 2,151 15 1 4 Discount rate assumption 6.9 % 15.6 11.9 7.1
Decrease in fair value from: 100 basis point increase $ 613 6 2 12
200 basis point increase 1,171 12 4 24 Credit loss assumption 0.5 % 4.5 Decrease in fair value from:
10% higher losses $ - 1 25% higher losses - 2
Fair value of interests held at December 31, 2010 $ 16,279 226 47 441 Expected weighted-average life (in years) 5.2 5.2 8.3 4.5 Prepayment speed assumption (annual CPR) 12.6 % 11.4 4.8 18.1
Decrease in fair value from: 10% adverse change $ 844 7 - 2
25% adverse change 1,992 16 - 6 Discount rate assumption 8.1 % 17.8 10.2 6.8 Decrease in fair value from:
100 basis point increase $ 777 6 3 14 200 basis point increase 1,487 13 6 27 Credit loss assumption 0.7 % 3.7
Decrease in fair value from: 10% higher losses $ - 1
25% higher losses - 3
The sensitivities in the preceding table are hypothetical and caution should be exercised when relying on this data. Changes in value based on variations in assumptions generally cannot be extrapolated because the relationship of the change in the assumption to the change in value may not be linear. Also, the effect of a variation in a particular assumption on the value of the other interests held is calculated independently without changing any other assumptions. In reality, changes in one factor may result in changes in others (for example, changes in prepayment speed estimates could result in changes in the credit losses), which might magnify or counteract the sensitivities.
167
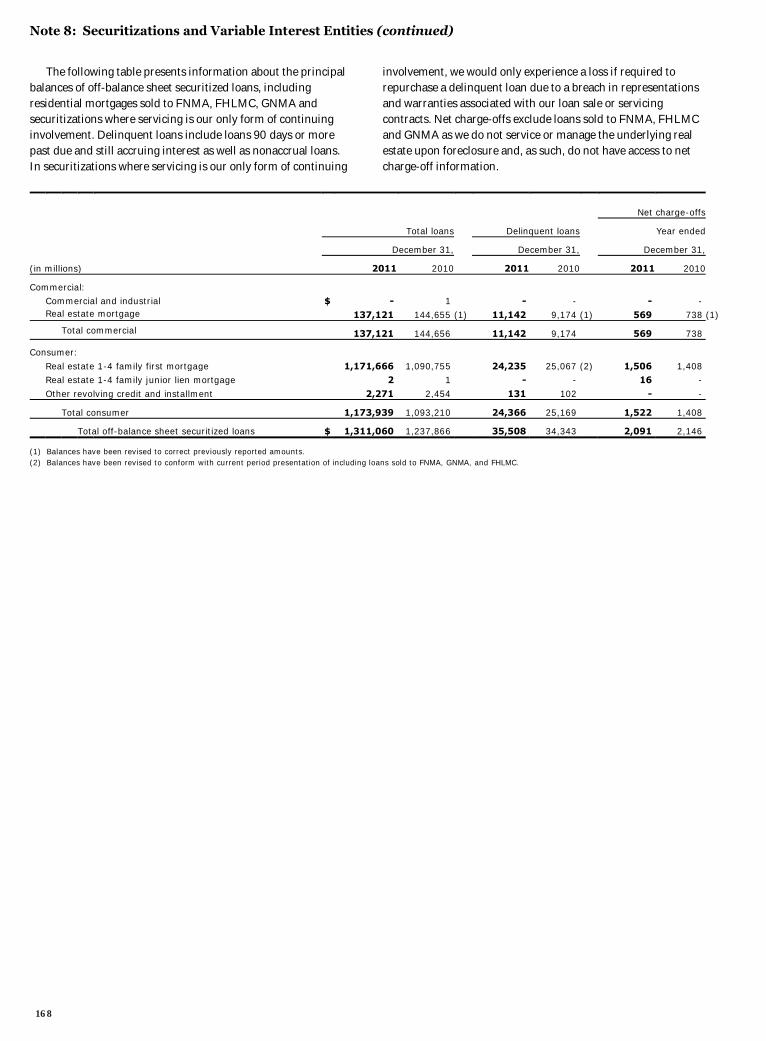
Note 8: Securitizations and Variable Interest Entities (continued)
The following table presents information about the principal balances of off-balance sheet securitized loans, including residential mortgages sold to FNMA, FHLMC, GNMA and securitizations where servicing is our only form of continuing involvement. Delinquent loans include loans 90 days or more past due and still accruing interest as well as nonaccrual loans. In securitizations where servicing is our only form of continuing
involvement, we would only experience a loss if required to repurchase a delinquent loan due to a breach in representations and warranties associated with our loan sale or servicing contracts. Net charge-offs exclude loans sold to FNMA, FHLMC and GNMA as we do not service or manage the underlying real estate upon foreclosure and, as such, do not have access to net charge-off information.
Net charge-offs
Total loans Delinquent loans Year ended
December 31, December 31, December 31,
(in millions) 2011 2010 2011 2010 2011 2010
Commercial: Commercial and industrial $ - 1 - - - - Real estate mortgage 137,121 144,655 (1) 11,142 9,174 (1) 569 738 (1)
Total commercial 137,121 144,656 11,142 9,174 569 738
Consumer:
Real estate 1-4 family first mortgage 1,171,666 1,090,755 24,235 25,067 (2) 1,506 1,408 Real estate 1-4 family junior lien mortgage 2 1 - - 16 -
Other revolving credit and installment 2,271 2,454 131 102 - -
Total consumer 1,173,939 1,093,210 24,366 25,169 1,522 1,408
Total off-balance sheet securitized loans $ 1,311,060 1,237,866 35,508 34,343 2,091 2,146
(1) Balances have been revised to correct previously reported amounts. (2) Balances have been revised to conform with current period presentation of including loans sold to FNMA, GNMA, and FHLMC.
168
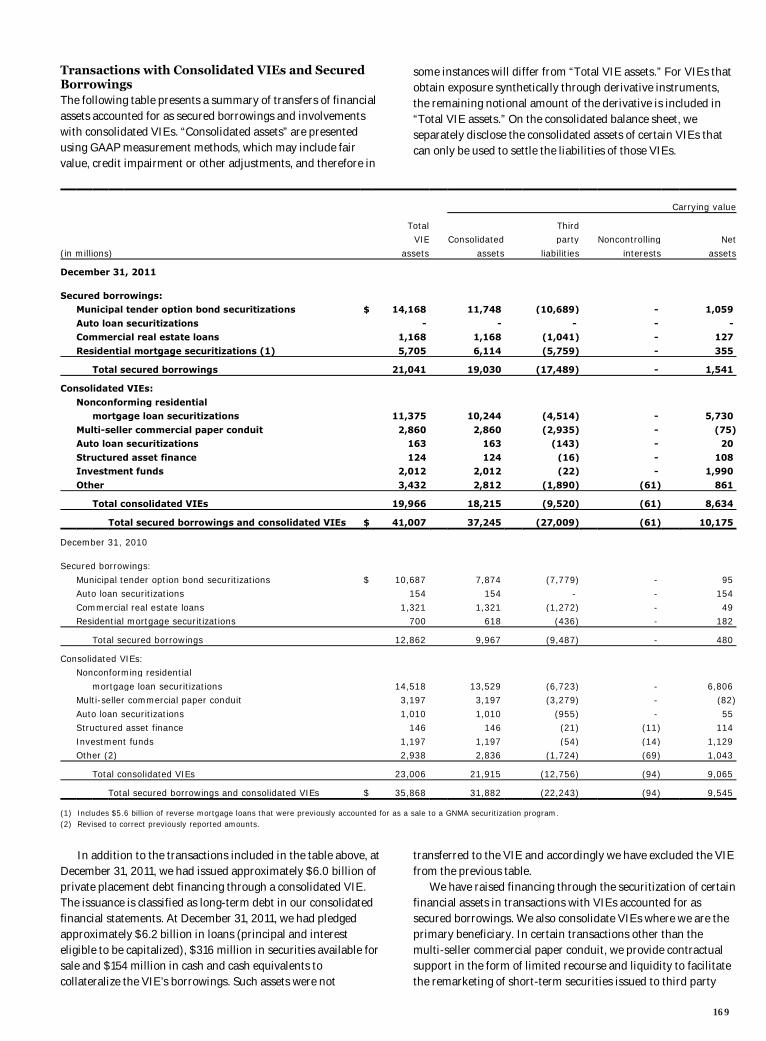
Transactions with Consolidated VIEs and Secured Borrowings The following table presents a summary of transfers of financial assets accounted for as secured borrowings and involvements with consolidated VIEs. “Consolidated assets” are presented using GAAP measurement methods, which may include fair value, credit impairment or other adjustments, and therefore in
some instances will differ from “Total VIE assets.” For VIEs that obtain exposure synthetically through derivative instruments, the remaining notional amount of the derivative is included in “Total VIE assets.” On the consolidated balance sheet, we separately disclose the consolidated assets of certain VIEs that can only be used to settle the liabilities of those VIEs.
Carrying value
Total Third VIE Consolidated party Noncontrolling Net
(in millions) assets assets liabilities interests assets
December 31, 2011 Secured borrowings: Municipal tender option bond securitizations $ 14,168 11,748 (10,689) - 1,059
Auto loan securitizations - - - - - Commercial real estate loans 1,168 1,168 (1,041) - 127
Residential mortgage securitizations (1) 5,705 6,114 (5,759) - 355
Total secured borrowings 21,041 19,030 (17,489) - 1,541
Consolidated VIEs:
Nonconforming residential mortgage loan securitizations 11,375 10,244 (4,514) - 5,730
Multi-seller commercial paper conduit 2,860 2,860 (2,935) - (75) Auto loan securitizations 163 163 (143) - 20
Structured asset finance 124 124 (16) - 108 Investment funds 2,012 2,012 (22) - 1,990
Other 3,432 2,812 (1,890) (61) 861
Total consolidated VIEs 19,966 18,215 (9,520) (61) 8,634
Total secured borrowings and consolidated VIEs $ 41,007 37,245 (27,009) (61) 10,175
December 31, 2010 Secured borrowings:
Municipal tender option bond securitizations $ 10,687 7,874 (7,779) - 95 Auto loan securitizations 154 154 - - 154
Commercial real estate loans 1,321 1,321 (1,272) - 49 Residential mortgage securitizations 700 618 (436) - 182
Total secured borrowings 12,862 9,967 (9,487) - 480
Consolidated VIEs: Nonconforming residential
mortgage loan securitizations 14,518 13,529 (6,723) - 6,806 Multi-seller commercial paper conduit 3,197 3,197 (3,279) - (82)
Auto loan securitizations 1,010 1,010 (955) - 55 Structured asset finance 146 146 (21) (11) 114
Investment funds 1,197 1,197 (54) (14) 1,129 Other (2) 2,938 2,836 (1,724) (69) 1,043
Total consolidated VIEs 23,006 21,915 (12,756) (94) 9,065
Total secured borrowings and consolidated VIEs $ 35,868 31,882 (22,243) (94) 9,545
(1) Includes $5.6 billion of reverse mortgage loans that were previously accounted for as a sale to a GNMA securitization program. (2) Revised to correct previously reported amounts.
In addition to the transactions included in the table above, at
December 31, 2011, we had issued approximately $6.0 billion of private placement debt financing through a consolidated VIE. The issuance is classified as long-term debt in our consolidated financial statements. At December 31, 2011, we had pledged approximately $6.2 billion in loans (principal and interest eligible to be capitalized), $316 million in securities available for sale and $154 million in cash and cash equivalents to collateralize the VIE’s borrowings. Such assets were not
transferred to the VIE and accordingly we have excluded the VIE from the previous table. We have raised financing through the securitization of certain financial assets in transactions with VIEs accounted for as secured borrowings. We also consolidate VIEs where we are the primary beneficiary. In certain transactions other than the multi-seller commercial paper conduit, we provide contractual support in the form of limited recourse and liquidity to facilitate the remarketing of short-term securities issued to third party
169

Note 8: Securitizations and Variable Interest Entities (continued)
investors. Other than this limited contractual support, the assets of the VIEs are the sole source of repayment of the securities held by third parties. The liquidity support we provide to the multi-seller commercial paper conduit ensures timely repayment of commercial paper issued by the conduit and is described further below. NONCONFORMING RESIDENTIAL MORTGAGE LOAN
SECURITIZATIONS We have consolidated certain of our nonconforming residential mortgage loan securitizations in accordance with consolidation accounting guidance. We have determined we are the primary beneficiary of these securitizations because we have the power to direct the most significant activities of the entity through our role as primary servicer and also hold variable interests that we have determined to be significant. The nature of our variable interests in these entities may include beneficial interests issued by the VIE, mortgage servicing rights and recourse or repurchase reserve liabilities. The beneficial interests issued by the VIE that we hold include either subordinate or senior securities held in an amount that we consider potentially significant. MULTI-SELLER COMMERCIAL PAPER CONDUIT We administer a multi-seller asset-based commercial paper conduit that finances certain client transactions. This conduit is a bankruptcy remote entity that makes loans to, or purchases certificated interests, generally from SPEs, established by our clients (sellers) and which are secured by pools of financial assets. The conduit funds itself through the issuance of highly rated commercial paper to third party investors. The primary source of repayment of the commercial paper is the cash flows from the conduit’s assets or the re-issuance of commercial paper upon maturity. The conduit’s assets are structured with deal-specific credit enhancements generally in the form of overcollateralization provided by the seller, but may also include subordinated interests, cash reserve accounts, third party credit support facilities and excess spread capture. The timely repayment of the commercial paper is further supported by asset-specific liquidity facilities in the form of liquidity asset purchase agreements that we provide. Each facility is equal to 102% of the conduit’s funding commitment to a client. The aggregate amount of liquidity must be equal to or greater than all the commercial paper issued by the conduit. At the discretion of the administrator, we may be required to purchase assets from the conduit at par value plus accrued interest or discount on the related commercial paper, including situations where the conduit is unable to issue commercial paper. Par value may be different from fair value.
We receive fees in connection with our role as administrator and liquidity provider. We may also receive fees related to the structuring of the conduit’s transactions. In 2010, the conduit terminated its subordinated note to a third party investor and repaid all amounts due under the terms of the note agreement. We are the primary beneficiary of the conduit because we have power over the significant activities of the conduit and have a significant variable interest due to our liquidity arrangement. INVESTMENT FUNDS We have consolidated certain of our investment funds where we manage the assets of the fund and our interests absorb a majority of the funds’ variability. In 2011, we redeemed our interest in an unconsolidated investment fund and placed the assets received upon redemption into new VIEs. We consolidate these VIEs because we have discretion over the management of the assets and are the sole investor in these funds.
170

Note 9: Mortgage Banking Activities
Mortgage banking activities, included in the Community Banking and Wholesale Banking operating segments, consist of residential and commercial mortgage loan origination, sale activity and servicing.
We apply fair value method to substantially all of our residential MSRs and apply the amortization method to all commercial and some residential MSRs. The changes in MSRs measured using the fair value method were:
Year ended December 31,
(in millions) 2011 2010 2009
Fair value, beginning of year $ 14,467 16,004 14,714
Adjustments from adoption of consolidation accounting guidance - (118) - Acquired from Wachovia (1) - - 34
Servicing from securitizations or asset transfers 3,957 4,092 6,226
Net additions 3,957 3,974 6,260
Changes in fair value:
Due to changes in valuation model inputs or assumptions (2) (3,680) (2,957) (1,534) Other changes in fair value (3) (2,141) (2,554) (3,436)
Total changes in fair value (5,821) (5,511) (4,970)
Fair value, end of year $ 12,603 14,467 16,004
(1) The 2009 amount reflects refinements to initial December 31, 2008, Wachovia purchase accounting adjustments. (2) Principally reflects changes in discount rates and prepayment speed assumptions, mostly due to changes in interest rates, and costs to service, including delinquency and
foreclosure costs. (3) Represents changes due to collection/realization of expected cash flows over time.
The changes in amortized MSRs were:
Year ended December 31,
(in millions) 2011 2010 2009
Balance, beginning of year $ 1,422 1,119 1,446
Adjustments from adoption of consolidation accounting guidance - (5) - Purchases 155 58 11
Acquired from Wachovia (1) - - (135) Servicing from securitizations or asset transfers 132 478 61
Amortization (264) (228) (264)
Balance, end of year (2) 1,445 1,422 1,119
Valuation allowance:
Balance, beginning of year (3) - - Provision for MSRs in excess of fair value (34) (3) -
Balance, end of year (3) (37) (3) -
Amortized MSRs, net $ 1,408 1,419 1,119
Fair value of amortized MSRs: Beginning of year $ 1,812 1,261 1,555
End of year (4) 1,756 1,812 1,261
(1) The 2009 amount reflects refinements to initial December 31, 2008, Wachovia purchase accounting adjustments. (2) Includes $350 million and $400 million in residential amortized MSRs at December 31, 2011 and 2010, respectively. The 2009 balance is all commercial amortized MSRs. For
the years ended December 31, 2011 and 2010, the residential MSR amortization was $(50) million and $(5) million, respectively. Effective January 1, 2012, the amortized residential MSR portfolio will be transferred to MSRs carried at fair value.
(3) Commercial amortized MSRs are evaluated for impairment purposes by the following risk strata: agency (GSEs) and non-agency. There was no valuation allowance recorded for the periods presented on the commercial amortized MSRs. Residential amortized MSRs are evaluated for impairment purposes by the following risk strata: Mortgages sold to GSEs (FHLMC and FNMA) and mortgages sold to GNMA, each by interest rate stratifications. A valuation allowance of $37 million and $3 million was recorded on the residential amortized MSRs for the years ended December 31, 2011 and 2010, respectively.
(4) Includes fair value of $316 million and $441 million in residential amortized MSRs and $1,440 million and $1,371 million in commercial amortized MSRs at December 31, 2011 and 2010, respectively.
171
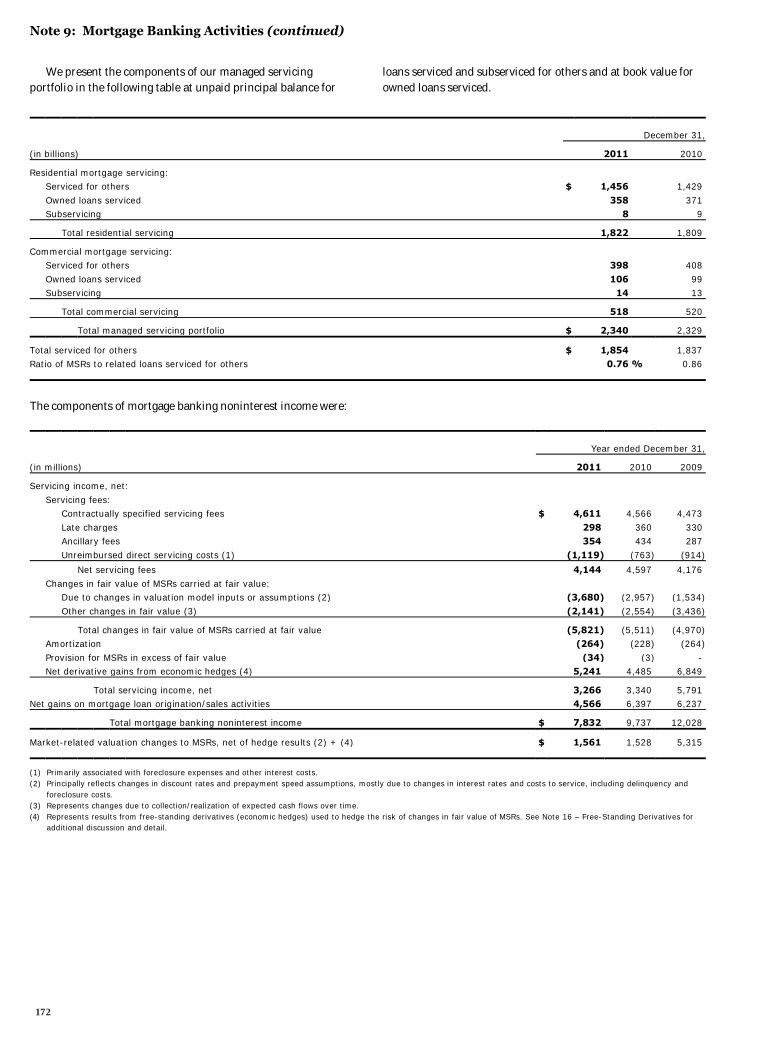
Note 9: Mortgage Banking Activities (continued)
We present the components of our managed servicing portfolio in the following table at unpaid principal balance for
loans serviced and subserviced for others and at book value for owned loans serviced.
December 31,
(in billions) 2011 2010
Residential mortgage servicing: Serviced for others $ 1,456 1,429
Owned loans serviced 358 371 Subservicing 8 9
Total residential servicing 1,822 1,809
Commercial mortgage servicing: Serviced for others 398 408
Owned loans serviced 106 99 Subservicing 14 13
Total commercial servicing 518 520
Total managed servicing portfolio $ 2,340 2,329
Total serviced for others $ 1,854 1,837 Ratio of MSRs to related loans serviced for others 0.76 % 0.86
The components of mortgage banking noninterest income were:
Year ended December 31,
(in millions) 2011 2010 2009
Servicing income, net:
Servicing fees: Contractually specified servicing fees $ 4,611 4,566 4,473
Late charges 298 360 330 Ancillary fees 354 434 287
Unreimbursed direct servicing costs (1) (1,119) (763) (914)
Net servicing fees 4,144 4,597 4,176
Changes in fair value of MSRs carried at fair value: Due to changes in valuation model inputs or assumptions (2) (3,680) (2,957) (1,534)
Other changes in fair value (3) (2,141) (2,554) (3,436)
Total changes in fair value of MSRs carried at fair value (5,821) (5,511) (4,970) Amortization (264) (228) (264)
Provision for MSRs in excess of fair value (34) (3) - Net derivative gains from economic hedges (4) 5,241 4,485 6,849
Total servicing income, net 3,266 3,340 5,791 Net gains on mortgage loan origination/sales activities 4,566 6,397 6,237
Total mortgage banking noninterest income $ 7,832 9,737 12,028
Market-related valuation changes to MSRs, net of hedge results (2) + (4) $ 1,561 1,528 5,315
(1) Primarily associated with foreclosure expenses and other interest costs. (2) Principally reflects changes in discount rates and prepayment speed assumptions, mostly due to changes in interest rates and costs to service, including delinquency and
foreclosure costs. (3) Represents changes due to collection/realization of expected cash flows over time. (4) Represents results from free-standing derivatives (economic hedges) used to hedge the risk of changes in fair value of MSRs. See Note 16 – Free-Standing Derivatives for
additional discussion and detail.
172
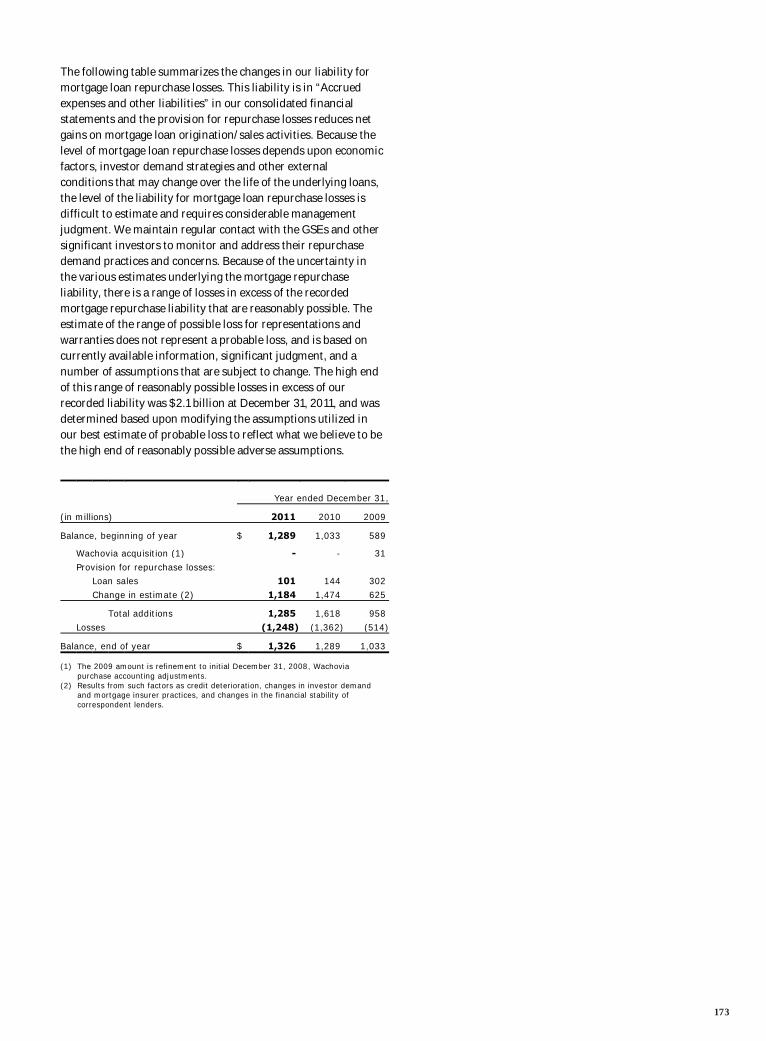
The following table summarizes the changes in our liability for mortgage loan repurchase losses. This liability is in “Accrued expenses and other liabilities” in our consolidated financial statements and the provision for repurchase losses reduces net gains on mortgage loan origination/sales activities. Because the level of mortgage loan repurchase losses depends upon economic factors, investor demand strategies and other external conditions that may change over the life of the underlying loans, the level of the liability for mortgage loan repurchase losses is difficult to estimate and requires considerable management judgment. We maintain regular contact with the GSEs and other significant investors to monitor and address their repurchase demand practices and concerns. Because of the uncertainty in the various estimates underlying the mortgage repurchase liability, there is a range of losses in excess of the recorded mortgage repurchase liability that are reasonably possible. The estimate of the range of possible loss for representations and warranties does not represent a probable loss, and is based on currently available information, significant judgment, and a number of assumptions that are subject to change. The high end of this range of reasonably possible losses in excess of our recorded liability was $2.1 billion at December 31, 2011, and was determined based upon modifying the assumptions utilized in our best estimate of probable loss to reflect what we believe to be the high end of reasonably possible adverse assumptions.
Year ended December 31,
(in millions) 2011 2010 2009
Balance, beginning of year $ 1,289 1,033 589
Wachovia acquisition (1) - - 31
Provision for repurchase losses: Loan sales 101 144 302
Change in estimate (2) 1,184 1,474 625
Total additions 1,285 1,618 958
Losses (1,248) (1,362) (514)
Balance, end of year $ 1,326 1,289 1,033
(1) The 2009 amount is refinement to initial December 31, 2008, Wachovia purchase accounting adjustments.
(2) Results from such factors as credit deterioration, changes in investor demand and mortgage insurer practices, and changes in the financial stability of correspondent lenders.
173
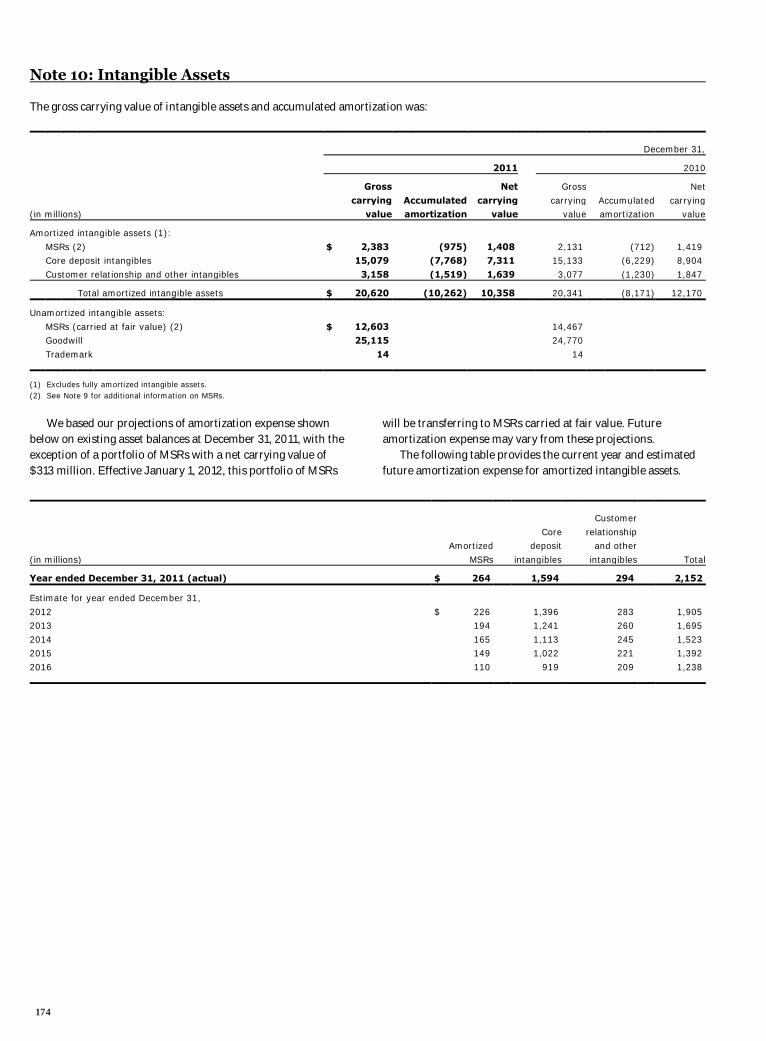
Note 10: Intangible Assets
The gross carrying value of intangible assets and accumulated amortization was:
December 31,
2011 2010
Gross Net Gross Net
carrying Accumulated carrying carrying Accumulated carrying (in millions) value amortization value value amortization value
Amortized intangible assets (1):
MSRs (2) $ 2,383 (975) 1,408 2,131 (712) 1,419 Core deposit intangibles 15,079 (7,768) 7,311 15,133 (6,229) 8,904
Customer relationship and other intangibles 3,158 (1,519) 1,639 3,077 (1,230) 1,847
Total amortized intangible assets $ 20,620 (10,262) 10,358 20,341 (8,171) 12,170
Unamortized intangible assets:
MSRs (carried at fair value) (2) $ 12,603 14,467 Goodwill 25,115 24,770
Trademark 14 14
(1) Excludes fully amortized intangible assets. (2) See Note 9 for additional information on MSRs.
We based our projections of amortization expense shown below on existing asset balances at December 31, 2011, with the exception of a portfolio of MSRs with a net carrying value of $313 million. Effective January 1, 2012, this portfolio of MSRs
will be transferring to MSRs carried at fair value. Future amortization expense may vary from these projections. The following table provides the current year and estimated future amortization expense for amortized intangible assets.
Customer
Core relationship Amortized deposit and other
(in millions) MSRs intangibles intangibles Total
Year ended December 31, 2011 (actual) $ 264 1,594 294 2,152
Estimate for year ended December 31,
2012 $ 226 1,396 283 1,905 2013 194 1,241 260 1,695
2014 165 1,113 245 1,523 2015 149 1,022 221 1,392
2016 110 919 209 1,238
174
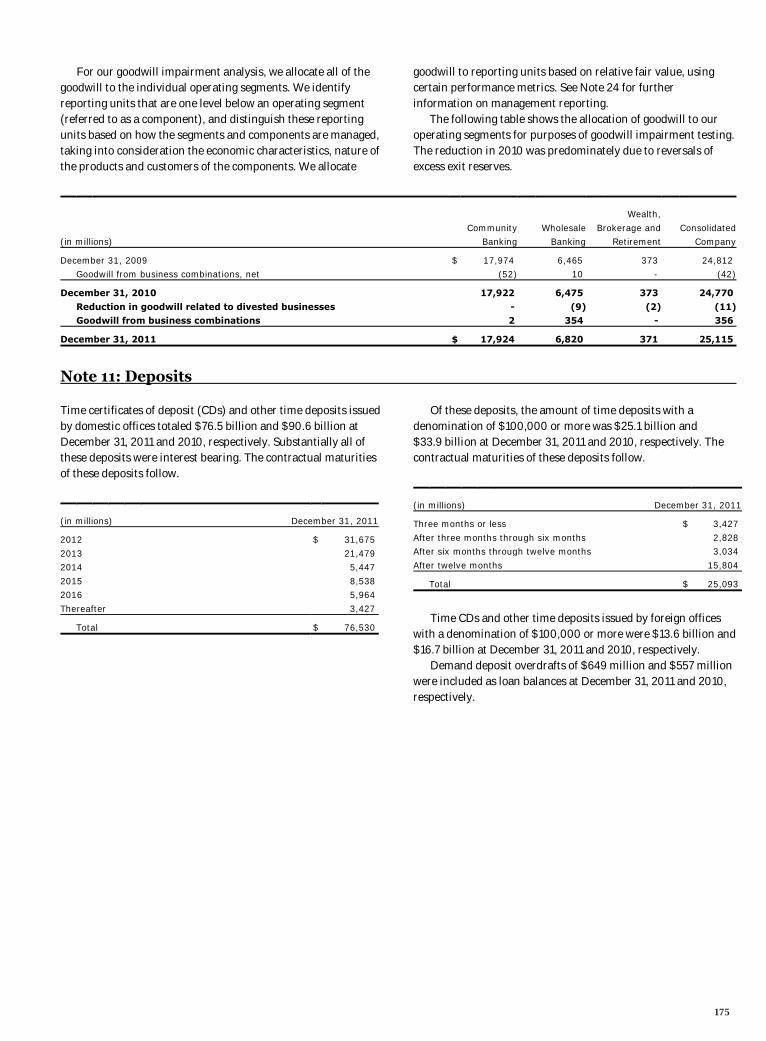
For our goodwill impairment analysis, we allocate all of the goodwill to the individual operating segments. We identify reporting units that are one level below an operating segment (referred to as a component), and distinguish these reporting units based on how the segments and components are managed, taking into consideration the economic characteristics, nature of the products and customers of the components. We allocate
goodwill to reporting units based on relative fair value, using certain performance metrics. See Note 24 for further information on management reporting. The following table shows the allocation of goodwill to our operating segments for purposes of goodwill impairment testing. The reduction in 2010 was predominately due to reversals of excess exit reserves.
Wealth,
Community Wholesale Brokerage and Consolidated (in millions) Banking Banking Retirement Company
December 31, 2009 $ 17,974 6,465 373 24,812 Goodwill from business combinations, net (52) 10 - (42)
December 31, 2010 17,922 6,475 373 24,770
Reduction in goodwill related to divested businesses - (9) (2) (11) Goodwill from business combinations 2 354 - 356
December 31, 2011 $ 17,924 6,820 371 25,115
Note 11: Deposits
Time certificates of deposit (CDs) and other time deposits issued by domestic offices totaled $76.5 billion and $90.6 billion at December 31, 2011 and 2010, respectively. Substantially all of these deposits were interest bearing. The contractual maturities of these deposits follow.
(in millions) December 31, 2011
2012 $ 31,675
2013 21,479 2014 5,447
2015 8,538 2016 5,964
Thereafter 3,427
Total $ 76,530
Of these deposits, the amount of time deposits with a denomination of $100,000 or more was $25.1 billion and $33.9 billion at December 31, 2011 and 2010, respectively. The contractual maturities of these deposits follow.
(in millions) December 31, 2011
Three months or less $ 3,427
After three months through six months 2,828 After six months through twelve months 3,034
After twelve months 15,804
Total $ 25,093
Time CDs and other time deposits issued by foreign offices with a denomination of $100,000 or more were $13.6 billion and $16.7 billion at December 31, 2011 and 2010, respectively. Demand deposit overdrafts of $649 million and $557 million were included as loan balances at December 31, 2011 and 2010, respectively.
175
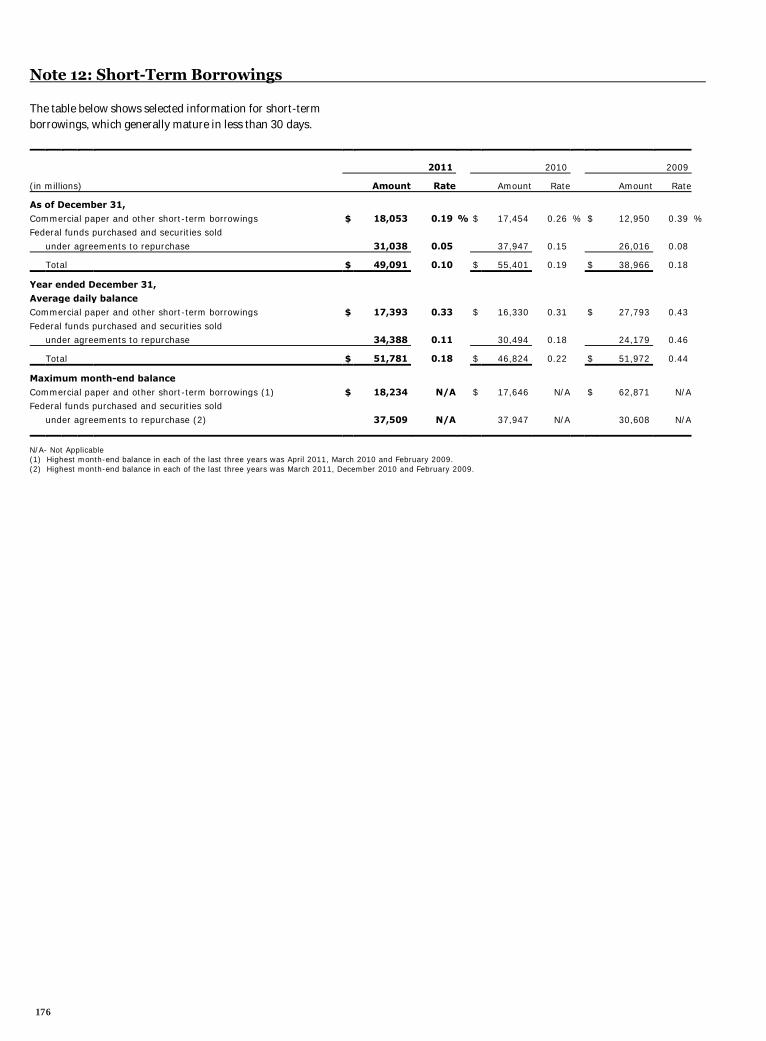
Note 12: Short-Term Borrowings
The table below shows selected information for short-term borrowings, which generally mature in less than 30 days.
2011 2010 2009
(in millions) Amount Rate Amount Rate Amount Rate
As of December 31,
Commercial paper and other short-term borrowings $ 18,053 0.19 % $ 17,454 0.26 % $ 12,950 0.39 % Federal funds purchased and securities sold
under agreements to repurchase 31,038 0.05 37,947 0.15 26,016 0.08
Total $ 49,091 0.10 $ 55,401 0.19 $ 38,966 0.18
Year ended December 31,
Average daily balance Commercial paper and other short-term borrowings $ 17,393 0.33 $ 16,330 0.31 $ 27,793 0.43
Federal funds purchased and securities sold under agreements to repurchase 34,388 0.11 30,494 0.18 24,179 0.46
Total $ 51,781 0.18 $ 46,824 0.22 $ 51,972 0.44
Maximum month-end balance
Commercial paper and other short-term borrowings (1) $ 18,234 N/A $ 17,646 N/A $ 62,871 N/A Federal funds purchased and securities sold
under agreements to repurchase (2) 37,509 N/A 37,947 N/A 30,608 N/A
N/A- Not Applicable (1) Highest month-end balance in each of the last three years was April 2011, March 2010 and February 2009. (2) Highest month-end balance in each of the last three years was March 2011, December 2010 and February 2009.
176

Note 13: Long-Term Debt
As a part of our overall interest rate risk management strategy, we often use derivatives to manage interest rate risk. As a result, much of the long-term debt presented below is hedged in a fair value or cash flow hedge relationship. See Note 16 for further information on qualifying hedge contracts.
Following is a summary of our long-term debt, reflecting unamortized debt discounts and premiums, and purchase accounting adjustments for debt assumed in the Wachovia acquisition, where applicable:
December 31,
2011 2010
Maturity Stated
(in millions) date(s) interest rate(s)
Wells Fargo & Company (Parent only)
Senior Fixed-rate notes (1) 2012-2035 2.125-6.75% $ 38,002 40,630
Floating-rate notes (1) 2012-2048 Varies 17,872 26,750 Market-linked notes and other (2) 2012-2041 Varies 1,359 545
Total senior debt - Parent 57,233 67,925
Subordinated Fixed-rate notes 2012-2035 4.375-7.574% 12,041 12,370
Floating-rate notes 2015-2016 Varies 1,141 1,118
Total subordinated debt - Parent 13,182 13,488
Junior subordinated
Fixed-rate notes - hybrid trust securities 2029-2068 5.625-7.95% 6,951 11,257 Floating-rate notes 2027 Varies 247 289
FixFloat notes - income trust securities - 6,786
Total junior subordinated debt - Parent (3) 7,198 18,332
Total long-term debt - Parent 77,613 99,745
Wells Fargo Bank, N.A. and other bank entities (Bank)
Senior Fixed-rate notes 2013 6.00% 1,326 2,185
Floating-rate notes 2038-2040 Varies 72 4,186 Fixed-rate advances - Federal Home Loan Bank (FHLB) 2012-2031 2.30 - 8.45% 500 812
Floating-rate advances - FHLB 2012-2013 Varies 2,101 7,103 Market-linked notes and other (2) 2012-2016 Varies 238 229
Capital leases (Note 7) 2012-2025 Varies 116 26
Total senior debt - Bank 4,353 14,541
Subordinated
Fixed-rate notes 2013-2038 4.75-7.74% 15,882 16,520 Floating-rate notes 2014-2017 Varies 1,976 1,945
Total subordinated debt - Bank 17,858 18,465
Junior subordinated Fixed-rate notes - 317
Floating-rate notes 2027 Varies 286 278
Total junior subordinated debt - Bank (3) 286 595
Long-term debt issued by VIE - Fixed rate 2014-2038 0.00-7.00% 2,103 3,751
Long-term debt issued by VIE - Floating rate 2014-2050 Varies 2,748 4,053 Mortgage notes and other debt 2012-2056 Varies 14,854 8,639
Total long-term debt - Bank 42,202 50,044
(continued on following page)
177
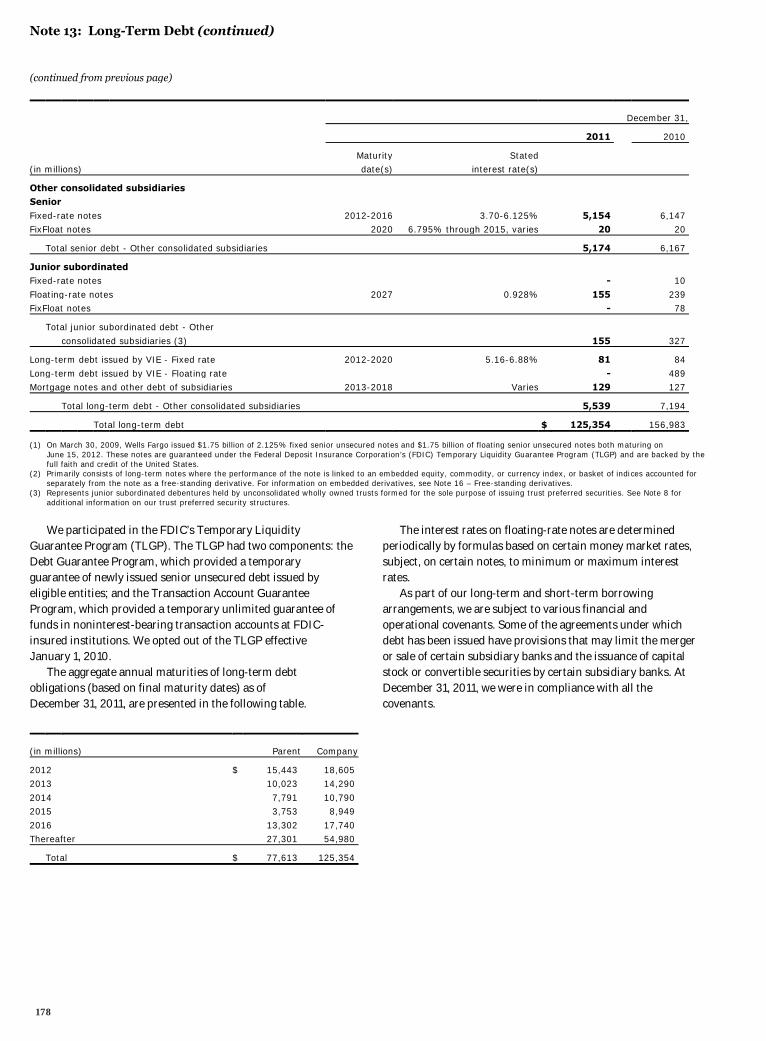
Note 13: Long-Term Debt (continued)
(continued from previous page)
December 31,
2011 2010
Maturity Stated (in millions) date(s) interest rate(s)
Other consolidated subsidiaries Senior
Fixed-rate notes 2012-2016 3.70-6.125% 5,154 6,147 FixFloat notes 2020 6.795% through 2015, varies 20 20
Total senior debt - Other consolidated subsidiaries 5,174 6,167
Junior subordinated Fixed-rate notes - 10
Floating-rate notes 2027 0.928% 155 239 FixFloat notes - 78
Total junior subordinated debt - Other
consolidated subsidiaries (3) 155 327
Long-term debt issued by VIE - Fixed rate 2012-2020 5.16-6.88% 81 84
Long-term debt issued by VIE - Floating rate - 489 Mortgage notes and other debt of subsidiaries 2013-2018 Varies 129 127
Total long-term debt - Other consolidated subsidiaries 5,539 7,194
Total long-term debt $ 125,354 156,983
(1) On March 30, 2009, Wells Fargo issued $1.75 billion of 2.125% fixed senior unsecured notes and $1.75 billion of floating senior unsecured notes both maturing on June 15, 2012. These notes are guaranteed under the Federal Deposit Insurance Corporation’s (FDIC) Temporary Liquidity Guarantee Program (TLGP) and are backed by the full faith and credit of the United States.
(2) Primarily consists of long-term notes where the performance of the note is linked to an embedded equity, commodity, or currency index, or basket of indices accounted for separately from the note as a free-standing derivative. For information on embedded derivatives, see Note 16 – Free-standing derivatives.
(3) Represents junior subordinated debentures held by unconsolidated wholly owned trusts formed for the sole purpose of issuing trust preferred securities. See Note 8 for additional information on our trust preferred security structures.
We participated in the FDIC’s Temporary Liquidity Guarantee Program (TLGP). The TLGP had two components: the Debt Guarantee Program, which provided a temporary guarantee of newly issued senior unsecured debt issued by eligible entities; and the Transaction Account Guarantee Program, which provided a temporary unlimited guarantee of funds in noninterest-bearing transaction accounts at FDIC-insured institutions. We opted out of the TLGP effective January 1, 2010. The aggregate annual maturities of long-term debt obligations (based on final maturity dates) as of December 31, 2011, are presented in the following table.
(in millions) Parent Company
2012 $ 15,443 18,605 2013 10,023 14,290
2014 7,791 10,790 2015 3,753 8,949
2016 13,302 17,740 Thereafter 27,301 54,980
Total $ 77,613 125,354
The interest rates on floating-rate notes are determined periodically by formulas based on certain money market rates, subject, on certain notes, to minimum or maximum interest rates. As part of our long-term and short-term borrowing arrangements, we are subject to various financial and operational covenants. Some of the agreements under which debt has been issued have provisions that may limit the merger or sale of certain subsidiary banks and the issuance of capital stock or convertible securities by certain subsidiary banks. At December 31, 2011, we were in compliance with all the covenants.
178
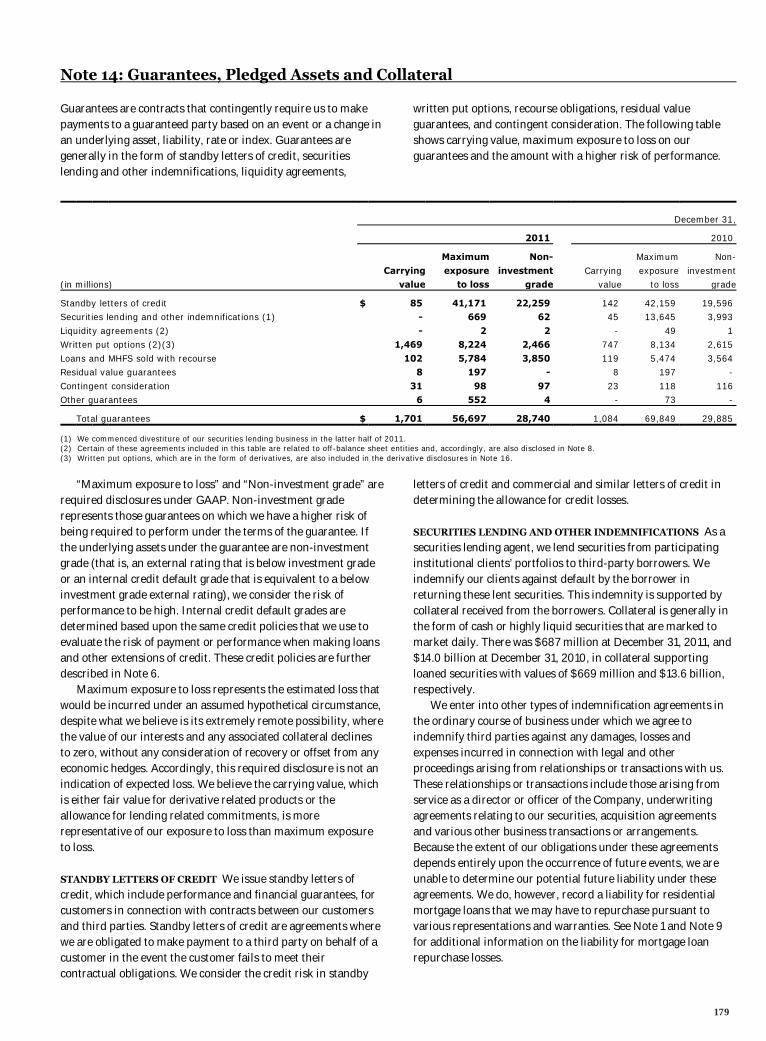
Note 14: Guarantees, Pledged Assets and Collateral
Guarantees are contracts that contingently require us to make payments to a guaranteed party based on an event or a change in an underlying asset, liability, rate or index. Guarantees are generally in the form of standby letters of credit, securities lending and other indemnifications, liquidity agreements,
written put options, recourse obligations, residual value guarantees, and contingent consideration. The following table shows carrying value, maximum exposure to loss on our guarantees and the amount with a higher risk of performance.
December 31,
2011 2010
Maximum Non- Maximum Non-
Carrying exposure investment Carrying exposure investment (in millions) value to loss grade value to loss grade
Standby letters of credit $ 85 41,171 22,259 142 42,159 19,596 Securities lending and other indemnifications (1) - 669 62 45 13,645 3,993
Liquidity agreements (2) - 2 2 - 49 1 Written put options (2)(3) 1,469 8,224 2,466 747 8,134 2,615
Loans and MHFS sold with recourse 102 5,784 3,850 119 5,474 3,564 Residual value guarantees 8 197 - 8 197 -
Contingent consideration 31 98 97 23 118 116 Other guarantees 6 552 4 - 73 -
Total guarantees $ 1,701 56,697 28,740 1,084 69,849 29,885
(1) We commenced divestiture of our securities lending business in the latter half of 2011. (2) Certain of these agreements included in this table are related to off-balance sheet entities and, accordingly, are also disclosed in Note 8. (3) Written put options, which are in the form of derivatives, are also included in the derivative disclosures in Note 16.
“Maximum exposure to loss” and “Non-investment grade” are required disclosures under GAAP. Non-investment grade represents those guarantees on which we have a higher risk of being required to perform under the terms of the guarantee. If the underlying assets under the guarantee are non-investment grade (that is, an external rating that is below investment grade or an internal credit default grade that is equivalent to a below investment grade external rating), we consider the risk of performance to be high. Internal credit default grades are determined based upon the same credit policies that we use to evaluate the risk of payment or performance when making loans and other extensions of credit. These credit policies are further described in Note 6. Maximum exposure to loss represents the estimated loss that would be incurred under an assumed hypothetical circumstance, despite what we believe is its extremely remote possibility, where the value of our interests and any associated collateral declines to zero, without any consideration of recovery or offset from any economic hedges. Accordingly, this required disclosure is not an indication of expected loss. We believe the carrying value, which is either fair value for derivative related products or the allowance for lending related commitments, is more representative of our exposure to loss than maximum exposure to loss. STANDBY LETTERS OF CREDIT We issue standby letters of credit, which include performance and financial guarantees, for customers in connection with contracts between our customers and third parties. Standby letters of credit are agreements where we are obligated to make payment to a third party on behalf of a customer in the event the customer fails to meet their contractual obligations. We consider the credit risk in standby
letters of credit and commercial and similar letters of credit in determining the allowance for credit losses. SECURITIES LENDING AND OTHER INDEMNIFICATIONS As a securities lending agent, we lend securities from participating institutional clients’ portfolios to third-party borrowers. We indemnify our clients against default by the borrower in returning these lent securities. This indemnity is supported by collateral received from the borrowers. Collateral is generally in the form of cash or highly liquid securities that are marked to market daily. There was $687 million at December 31, 2011, and $14.0 billion at December 31, 2010, in collateral supporting loaned securities with values of $669 million and $13.6 billion, respectively. We enter into other types of indemnification agreements in the ordinary course of business under which we agree to indemnify third parties against any damages, losses and expenses incurred in connection with legal and other proceedings arising from relationships or transactions with us. These relationships or transactions include those arising from service as a director or officer of the Company, underwriting agreements relating to our securities, acquisition agreements and various other business transactions or arrangements. Because the extent of our obligations under these agreements depends entirely upon the occurrence of future events, we are unable to determine our potential future liability under these agreements. We do, however, record a liability for residential mortgage loans that we may have to repurchase pursuant to various representations and warranties. See Note 1 and Note 9 for additional information on the liability for mortgage loan repurchase losses.
179
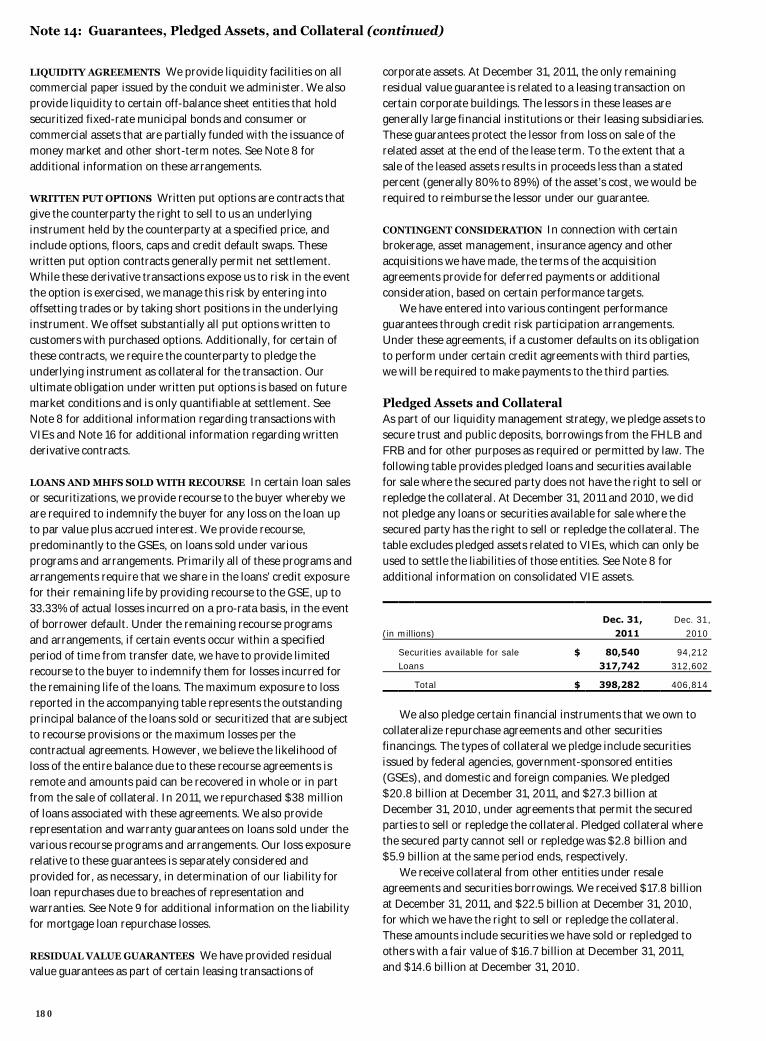
Note 14: Guarantees, Pledged Assets, and Collateral (continued)
LIQUIDITY AGREEMENTS We provide liquidity facilities on all commercial paper issued by the conduit we administer. We also provide liquidity to certain off-balance sheet entities that hold securitized fixed-rate municipal bonds and consumer or commercial assets that are partially funded with the issuance of money market and other short-term notes. See Note 8 for additional information on these arrangements. WRITTEN PUT OPTIONS Written put options are contracts that give the counterparty the right to sell to us an underlying instrument held by the counterparty at a specified price, and include options, floors, caps and credit default swaps. These written put option contracts generally permit net settlement. While these derivative transactions expose us to risk in the event the option is exercised, we manage this risk by entering into offsetting trades or by taking short positions in the underlying instrument. We offset substantially all put options written to customers with purchased options. Additionally, for certain of these contracts, we require the counterparty to pledge the underlying instrument as collateral for the transaction. Our ultimate obligation under written put options is based on future market conditions and is only quantifiable at settlement. See Note 8 for additional information regarding transactions with VIEs and Note 16 for additional information regarding written derivative contracts. LOANS AND MHFS SOLD WITH RECOURSE In certain loan sales or securitizations, we provide recourse to the buyer whereby we are required to indemnify the buyer for any loss on the loan up to par value plus accrued interest. We provide recourse, predominantly to the GSEs, on loans sold under various programs and arrangements. Primarily all of these programs and arrangements require that we share in the loans’ credit exposure for their remaining life by providing recourse to the GSE, up to 33.33% of actual losses incurred on a pro-rata basis, in the event of borrower default. Under the remaining recourse programs and arrangements, if certain events occur within a specified period of time from transfer date, we have to provide limited recourse to the buyer to indemnify them for losses incurred for the remaining life of the loans. The maximum exposure to loss reported in the accompanying table represents the outstanding principal balance of the loans sold or securitized that are subject to recourse provisions or the maximum losses per the contractual agreements. However, we believe the likelihood of loss of the entire balance due to these recourse agreements is remote and amounts paid can be recovered in whole or in part from the sale of collateral. In 2011, we repurchased $38 million of loans associated with these agreements. We also provide representation and warranty guarantees on loans sold under the various recourse programs and arrangements. Our loss exposure relative to these guarantees is separately considered and provided for, as necessary, in determination of our liability for loan repurchases due to breaches of representation and warranties. See Note 9 for additional information on the liability for mortgage loan repurchase losses. RESIDUAL VALUE GUARANTEES We have provided residual value guarantees as part of certain leasing transactions of
corporate assets. At December 31, 2011, the only remaining residual value guarantee is related to a leasing transaction on certain corporate buildings. The lessors in these leases are generally large financial institutions or their leasing subsidiaries. These guarantees protect the lessor from loss on sale of the related asset at the end of the lease term. To the extent that a sale of the leased assets results in proceeds less than a stated percent (generally 80% to 89%) of the asset’s cost, we would be required to reimburse the lessor under our guarantee. CONTINGENT CONSIDERATION In connection with certain brokerage, asset management, insurance agency and other acquisitions we have made, the terms of the acquisition agreements provide for deferred payments or additional consideration, based on certain performance targets. We have entered into various contingent performance guarantees through credit risk participation arrangements. Under these agreements, if a customer defaults on its obligation to perform under certain credit agreements with third parties, we will be required to make payments to the third parties. Pledged Assets and Collateral As part of our liquidity management strategy, we pledge assets to secure trust and public deposits, borrowings from the FHLB and FRB and for other purposes as required or permitted by law. The following table provides pledged loans and securities available for sale where the secured party does not have the right to sell or repledge the collateral. At December 31, 2011 and 2010, we did not pledge any loans or securities available for sale where the secured party has the right to sell or repledge the collateral. The table excludes pledged assets related to VIEs, which can only be used to settle the liabilities of those entities. See Note 8 for additional information on consolidated VIE assets.
Dec. 31, Dec. 31,
(in millions) 2011 2010
Securities available for sale $ 80,540 94,212 Loans 317,742 312,602
Total $ 398,282 406,814
We also pledge certain financial instruments that we own to collateralize repurchase agreements and other securities financings. The types of collateral we pledge include securities issued by federal agencies, government-sponsored entities (GSEs), and domestic and foreign companies. We pledged $20.8 billion at December 31, 2011, and $27.3 billion at December 31, 2010, under agreements that permit the secured parties to sell or repledge the collateral. Pledged collateral where the secured party cannot sell or repledge was $2.8 billion and $5.9 billion at the same period ends, respectively. We receive collateral from other entities under resale agreements and securities borrowings. We received $17.8 billion at December 31, 2011, and $22.5 billion at December 31, 2010, for which we have the right to sell or repledge the collateral. These amounts include securities we have sold or repledged to others with a fair value of $16.7 billion at December 31, 2011, and $14.6 billion at December 31, 2010.
180
Note 15: Legal Actions
Wells Fargo and certain of our subsidiaries are involved in a number of judicial, regulatory and arbitration proceedings concerning matters arising from the conduct of our business activities. These proceedings include actions brought against Wells Fargo and/or our subsidiaries with respect to corporate related matters and transactions in which Wells Fargo and/or our subsidiaries were involved. In addition, Wells Fargo and our subsidiaries may be requested to provide information or otherwise cooperate with government authorities in the conduct of investigations of other persons or industry groups. Although there can be no assurance as to the ultimate outcome, Wells Fargo and/or our subsidiaries have generally denied, or believe we have a meritorious defense and will deny, liability in all significant litigation pending against us, including the matters described below, and we intend to defend vigorously each case, other than matters we describe as having settled. Reserves are established for legal claims when payments associated with the claims become probable and the costs can be reasonably estimated. The actual costs of resolving legal claims may be substantially higher or lower than the amounts reserved for those claims. ILLINOIS ATTORNEY GENERAL LITIGATION On July 31, 2009, the Attorney General for the State of Illinois filed a civil lawsuit against Wells Fargo & Company, Wells Fargo Bank, N.A. and Wells Fargo Financial Illinois, Inc. in the Circuit Court for Cook County, Illinois. The Illinois Attorney General alleges that the Wells Fargo defendants engaged in illegal discrimination by “reverse redlining” and by steering African-American and Latino customers into high cost, subprime mortgage loans while other borrowers with similar incomes received lower cost mortgages. Illinois also alleges that Wells Fargo Financial Illinois, Inc. misled Illinois customers about the terms of mortgage loans. Illinois’ complaint against all Wells Fargo defendants is based on alleged violation of the Illinois Human Rights Act and the Illinois Fairness in Lending Act. The complaint also alleges that Wells Fargo Financial Illinois, Inc. violated the Illinois Consumer Fraud and Deceptive Business Practices Act and the Illinois Uniform Deceptive Trade Practices Act. Illinois’ complaint seeks an injunction against the defendants’ alleged violation of these Illinois statutes, restitution to consumers and civil money penalties. On October 26, 2011, the Illinois Court issued an order granting, in part, and denying, in part, Wells Fargo’s motion to dismiss. The Court dismissed Wells Fargo & Company as a party and dismissed Count III of the complaint, which alleged violations of the Illinois Fair Lending Act. The Court denied the remainder of the motion to dismiss. INTERCHANGE LITIGATION Wells Fargo Bank, N.A., Wells Fargo & Company, Wachovia Bank, N.A. and Wachovia Corporation are named as defendants, separately or in combination, in putative class actions filed on behalf of a plaintiff class of merchants and in individual actions brought by individual merchants with regard to the interchange fees associated with Visa and MasterCard payment card transactions. These actions have been consolidated in the United States
District Court for the Eastern District of New York. Visa, MasterCard and several banks and bank holding companies are named as defendants in various of these actions. The amended and consolidated complaint asserts claims against defendants based on alleged violations of federal and state antitrust laws and seeks damages, as well as injunctive relief. Plaintiff merchants allege that Visa, MasterCard and payment card issuing banks unlawfully colluded to set interchange rates. Plaintiffs also allege that enforcement of certain Visa and MasterCard rules and alleged tying and bundling of services offered to merchants are anticompetitive. Wells Fargo and Wachovia, along with other defendants and entities, are parties to Loss and Judgment Sharing Agreements, which provide that they, along with other entities, will share, based on a formula, in any losses from the Interchange Litigation.
MEDICAL CAPITAL CORPORATION LITIGATION Wells Fargo Bank, N.A. served as indenture trustee for debt issued by affiliates of Medical Capital Corporation, which was placed in receivership at the request of the Securities and Exchange Commission (SEC) in August 2009. Since September 2009, Wells Fargo has been named as a defendant in various class and mass actions brought by holders of Medical Capital Corporation’s debt, alleging that Wells Fargo breached contractual and other legal obligations owed to them and seeking unspecified damages. The actions have been consolidated in the United States District Court for the Central District of California. On July 26, 2011, the District Court certified a class consisting of holders of notes issued by affiliates of Medical Capital Corporation and, on October 18, 2011, the Ninth Circuit Court of Appeals denied a petition seeking to appeal the class certification order. MORTGAGE-BACKED CERTIFICATES LITIGATION Several securities law based putative class actions were consolidated in the U.S. District Court for the Northern District of California on July 16, 2009, under the caption In re Wells Fargo Mortgage-Backed Certificates Litigation. The case asserted claims against several Wells Fargo mortgage backed securities trusts, Wells Fargo Bank, N.A. and other affiliated entities, individual employee defendants, along with various underwriters and rating agencies. The plaintiffs alleged that the offering documents contain untrue statements of material fact, or omit to state material facts necessary to make the registration statements and accompanying prospectuses not misleading. The parties agreed to settle the case on May 27, 2011, for $125 million. Final approval of the settlement was entered on November 14, 2011. Some class members opted out of the settlement, with the most significant being the Federal National Mortgage Association (Fannie Mae), the Federal Home Loan Mortgage Corporation (Freddie Mac) and American International Group, Inc. On June 29, 2010, and on July 15, 2010, two complaints, the first captioned The Charles Schwab Corporation vs. Merrill Lynch, Pierce, Fenner & Smith, Inc., et al., and the second captioned The Charles Schwab Corporation v. BNP Paribas
181
Note 15: Legal Actions (continued)
Securities Corp., et al., were filed in the Superior Court for the State of California, San Francisco County against a number of defendants, including Wells Fargo Bank, N.A. and Wells Fargo Asset Securities Corporation. As against the Wells Fargo entities, the new cases assert opt out claims relating to the claims alleged in the Mortgage-Backed Certificates Litigation. On October 15, 2010, three actions, captioned Federal Home Loan Bank of Chicago v. Banc of America Funding Corporation, et al. (filed in the Cook County Circuit Court, State of Illinois); Federal Home Loan Bank of Chicago v. Banc of America Securities LLC, et al. (filed in the Superior Court of the State of California for the County of Los Angeles); and Federal Home Loan Bank of Indianapolis v. Banc of America Mortgage America Securities, Inc., et al. (filed in the Superior Court of the State of Indiana for the County of Marion), named multiple defendants, described as issuers/depositors, and underwriters/dealers of private label mortgage-backed securities, in an action asserting claims that defendants used false and misleading statements in offering documents for the sale of such securities. The Bank of Chicago asserts that it purchased approximately $4.2 billion and the Bank of Indianapolis asserts that it purchased nearly $3 billion of such securities from the defendants. Plaintiffs seek rescission of the sales and damages under state securities and other laws and Section 11 of the Securities Act of 1933. Wells Fargo Asset Securities Corporation, Wells Fargo Bank, N.A. and Wells Fargo & Company were named among the defendants. On April 20, 2011, a case captioned Federal Home Loan of Boston v. Ally Financial, Inc., et al., was filed in the Superior Court of the Commonwealth of Massachusetts for the County of Suffolk. The case names, among a large number of parties, Wells Fargo & Company, Wells Fargo Asset Securitization Corporation and Wells Fargo Bank, N.A. as parties and contains allegations substantially similar to the cases filed by the other Federal Home Loan Banks. On April 28, 2011, a case captioned The Union Central Life Insurance Company, et al. v. Credit Suisse First Boston Securities Corp., et al., was filed in the U.S. District Court for the Southern District of New York. Among other defendants, it names Wells Fargo Asset Securitization Corporation and Wells Fargo Bank, N.A. The case asserts various state law fraud claims and claims for violations of Sections 10(b) and 20(a) of the Securities Exchange Act of 1934 on behalf of three insurance companies, relating to offerings of mortgage-backed securities from 2005 through 2007. In addition, there are other mortgage-related threatened or asserted claims by entities or investors where Wells Fargo may have indemnity or repurchase obligations, or as to which it has entered into agreements to toll the relevant statutes of limitations. MORTGAGE FORECLOSURE DOCUMENT LITIGATION Eight purported class actions and several individual borrower actions related to foreclosure document practices were filed in late 2010 and in early 2011 against Wells Fargo Bank, N.A. in its status as mortgage servicer or corporate trustee of mortgage trusts. The cases have been brought in state and federal courts. Five of the class actions have been dismissed or otherwise resolved. Of the
individual borrower cases, the majority are filed in state courts in California and Ohio. The actions generally claim that Wells Fargo submitted "fraudulent" or "untruthful" affidavits or other foreclosure documents to courts to support foreclosures filed in the state. Specifically, plaintiffs allege that Wells Fargo signers did not have personal knowledge of the facts alleged in the documents and did not verify the information in the documents ultimately filed with courts to foreclose. Plaintiffs attempt to state legal claims ranging from wrongful foreclosure to deceptive practices or fraud and seek relief ranging from cancellation of notes and mortgages to money damages. MORTGAGE RELATED REGULATORY INVESTIGATIONS On April 13, 2011, Wells Fargo Bank, N.A. entered into a Consent Order with the OCC and Wells Fargo & Company entered into a Consent Order with the Board of Governors of the Federal Reserve System in connection with Wells Fargo’s mortgage foreclosure practices. The Consent Orders require Wells Fargo to develop and implement certain compliance programs and to take other remedial steps, which Wells Fargo is doing. On February 9, 2012, the OCC and Federal Reserve announced that they had also imposed civil money penalties of $83 million and $85 million, respectively, related to the Consent Orders. These penalties will be satisfied through payments made under a separate simultaneous settlement in principle, announced on the same day, among the Department of Justice (DOJ), a task force of Attorneys General from 49 states, other government entities, Wells Fargo and four other mortgage servicers related to mortgage servicing and foreclosure practices. Under the settlement in principle, Wells Fargo agreed to the following commitments, comprised of three components totaling $5.3 billion: Consumer Relief Program For qualified borrowers with
financial hardship and a loan owned and serviced by Wells Fargo, a commitment to provide $3.4 billion in aggregate consumer relief and assistance programs, including expanded first and second mortgage modifications that broaden the use of principal reduction to help customers achieve affordability, an expanded short sale program that includes waivers of deficiency balances, forgiveness of arrearages for unemployed borrowers, cash-for-keys payments to borrowers who voluntarily vacate properties, and “anti-blight” provisions designed to reduce the impact on communities of vacant properties. As of December 31, 2011, the expected impact of the Consumer Relief Program was covered in our allowance for credit losses and in the nonaccretable difference relating to our purchased credit-impaired residential mortgage portfolio.
Refinance Program For qualified borrowers with little or negative equity in their home and a loan owned and serviced by Wells Fargo, an expanded first-lien refinance program commitment estimated to provide $900 million of aggregate payment relief over the life of the refinanced loans. The Refinance Program will not result in any current-period charge as its impact will be recognized over a period of years in the form of lower interest income as qualified borrowers benefit from reduced interest rates on loans refinanced under the program.
182
Foreclosure Assistance Payment $1 billion paid directly to the federal government and the participating states for their use to address the impact of foreclosure challenges as they see fit and which may include direct payments to consumers. As of December 31, 2011, we had fully accrued for the Foreclosure Assistance Payment.
Government agencies continue investigations or examinations of other mortgage related practices of Wells Fargo. The investigations relate to two main topics, (1) whether Wells Fargo may have violated fair lending or other laws and regulations relating to mortgage origination practices; and (2) whether Wells Fargo properly disclosed in offering documents for its residential mortgage-backed securities the facts and risks associated with those securities. Wells Fargo has received a Wells notice from SEC staff relating to Wells Fargo’s disclosures in mortgage-backed securities offering documents. Wells Fargo continues to provide information requested by the various agencies in connection with certain investigations. MUNICIPAL DERIVATIVES BID PRACTICES INVESTIGATION The DOJ and the SEC, beginning in November 2006, requested information from a number of financial institutions, including Wachovia Bank, N.A.’s municipal derivatives group, with regard to competitive bid practices in the municipal derivative markets. Other state and federal agencies subsequently also began investigations of the same practices. On December 8, 2011, a global resolution of the Wachovia Bank investigations was announced by DOJ, the Internal Revenue Service, the SEC, the OCC and a group of State Attorneys General. The investigations were settled with Wachovia Bank agreeing to pay a total of approximately $148 million in penalties and remediation to the various agencies. Wachovia Bank, along with a number of other banks and financial services companies, was named as a defendant in a number of substantially identical purported class actions and individual actions filed in various state and federal courts by various municipalities alleging they have been damaged by the activity which is the subject of the government investigations. These cases were either consolidated under the caption In re Municipal Derivatives Antitrust Litigation or administered jointly with that action in the U.S. District Court for the Southern District of New York. The plaintiffs and Wells Fargo agreed to settle the In re Municipal Derivatives Antitrust Litigation on October 21, 2011. The settlement is subject to court approval and, if finally approved, will result in Wells Fargo paying the amount of $37 million. The settlement was preliminarily approved on December 27, 2011. ORDER OF POSTING LITIGATION A series of putative class actions have been filed against Wachovia Bank, N.A. and Wells Fargo Bank, N.A., as well as many other banks, challenging the high to low order in which the Banks post debit card transactions to consumer deposit accounts. There are currently several such cases pending against Wells Fargo Bank (including the Wachovia Bank cases to which Wells Fargo succeeded), most of which have been consolidated in multi-district litigation proceedings in the U.S. District Court for the Southern District of Florida. The bank
defendants moved to compel these cases to arbitration under recent Supreme Court authority. On November 22, 2011, the Judge denied the motion. The Banks have appealed the decision to the U.S. Court of Appeals for the Eleventh Circuit. On August 10, 2010, the U.S. District Court for the Northern District of California issued an order in Gutierrez v. Wells Fargo Bank, N.A., a case that was not consolidated in the multi-district proceedings, enjoining the Bank’s use of the high to low posting method for debit card transactions with respect to the plaintiff class of California depositors, directing that the Bank establish a different posting methodology and ordering remediation of approximately $203 million. On October 26, 2010, a final judgment was entered in Gutierrez. On October 28, 2010, Wells Fargo appealed to the U.S. Court of Appeals for the Ninth Circuit. WACHOVIA EQUITY SECURITIES AND BONDS/NOTES LITIGATION A securities class action, now captioned In re Wachovia Equity Securities Litigation, has been pending under various names since July 7, 2008, in the U.S. District Court for the Southern District of New York alleging violations of Sections 10(b) and 20(a) of the Securities Exchange Act of 1934. Among other allegations, plaintiffs allege Wachovia’s common stock price was artificially inflated as a result of allegedly misleading disclosures relating to the Golden West Financial Corp. mortgage portfolio, Wachovia’s exposure to other mortgage related products such as CDOs, control issues and auction rate securities. There are four additional cases (not class actions) containing allegations similar to the allegations in the In re Wachovia Equity Securities Litigation captioned Stichting Pensioenfonds ABP v. Wachovia Corp. et al., FC Holdings AB, et al. v. Wachovia Corp., et al., Deka Investment GmbH v. Wachovia Corp. et al. and Forsta AP-Fonden v. Wachovia Corp., et al., respectively, which were filed in the U.S. District Court for the Southern District of New York. On March 31, 2011, the U.S. District Court for the Southern District of New York entered a Decision and Order granting Wachovia’s motions to dismiss the In re Wachovia Equity Securities Litigation and the Stichting Pensioenfonds ABP, FC Holdings AB, Deka Investment GmbH and Forsta AP-Fonden cases. Plaintiffs and Wells Fargo have agreed to settle the Equity Securities Litigation for $75 million and on January 27, 2012, the Court entered an order preliminarily approving the settlement. A fairness hearing on final approval of the settlement is scheduled for June 1, 2012. After a number of procedural motions, three purported class action cases alleging violations of Sections 11, 12, and 15 of the Securities Act of 1933 as a result of allegedly misleading disclosures relating to the Golden West mortgage portfolio in connection with Wachovia’s issuance of various preferred securities and bonds were transferred to the U.S. District Court for the Southern District of New York. A consolidated class action complaint was filed on September 4, 2009, and the matter was captioned In Re Wachovia Preferred Securities and Bond/Notes Litigation. On March 31, 2011, by the same Decision and Order referenced above, the court also granted in part and denied in part Wachovia’s motion to dismiss the In re Wachovia Preferred Securities and Bond/Notes Litigation, allowing that case to go forward after limiting the number of offerings at issue.
183
Note 15: Legal Actions (continued)
Wells Fargo and the plaintiffs agreed to settle the In re Wachovia Preferred Securities and Bond/Notes Litigation for $590 million. The proposed settlement was preliminarily approved by the Court on August 9, 2011. The hearing on final approval was held on November 14, 2011, and a judgment approving class action settlements was filed on January 3, 2012. There are a number of other similar actions filed in state courts in North Carolina and South Carolina by individual shareholders. Two of the individual shareholder actions in South Carolina have been dismissed and the shareholders have appealed. On December 22, 2011, the dismissal of the Rivers v. Wachovia Corporation, et al. case, one of the two South Carolina actions, was affirmed by the U.S. Court of Appeals for the Fourth Circuit. OUTLOOK When establishing a liability for contingent litigation losses, the Company determines a range of potential losses for
each matter that is both probable and estimable, and records the amount it considers to be the best estimate within the range. The high end of the range of reasonably possible potential litigation losses in excess of the Company’s liability for probable and estimable losses was $1.2 billion as of December 31, 2011. For these matters and others where an unfavorable outcome is reasonably possible but not probable, there may be a range of possible losses in excess of the established liability that cannot be estimated. Based on information currently available, advice of counsel, available insurance coverage and established reserves, Wells Fargo believes that the eventual outcome of the actions against Wells Fargo and/or its subsidiaries, including the matters described above, will not, individually or in the aggregate, have a material adverse effect on Wells Fargo’s consolidated financial position. However, in the event of unexpected future developments, it is possible that the ultimate resolution of those matters, if unfavorable, may be material to Wells Fargo’s results of operations for any particular period.
Note 16: Derivatives
We use derivatives to manage exposure to market risk, interest rate risk, credit risk and foreign currency risk, to generate profits from proprietary trading and to assist customers with their risk management objectives. Derivative transactions are measured in terms of the notional amount, but this amount is not recorded on the balance sheet and is not, when viewed in isolation, a meaningful measure of the risk profile of the instruments. The notional amount is generally not exchanged, but is used only as the basis on which interest and other payments are determined. Our asset/liability management approach to interest rate, foreign currency and certain other risks includes the use of derivatives. Such derivatives are typically designated as fair value or cash flow hedges, or economic hedge derivatives for those that do not qualify for hedge accounting. This helps minimize significant, unplanned fluctuations in earnings, fair values of assets and liabilities, and cash flows caused by interest rate, foreign currency and other market value volatility. This approach involves modifying the repricing characteristics of certain assets and liabilities so that changes in interest rates, foreign currency and other exposures do not have a significantly adverse effect on the net interest margin, cash flows and earnings. As a result of fluctuations in these exposures, hedged assets and liabilities will gain or lose market value. In a fair value or economic hedge, the effect of this unrealized gain or loss will generally be offset by the gain or loss on the derivatives linked to the hedged assets and liabilities. In a cash flow hedge, where we manage the variability of cash payments due to interest rate fluctuations by the effective use of derivatives linked to hedged assets and liabilities, the unrealized gain or loss on the derivatives or the hedged asset or liability is generally not reflected in earnings.
We also offer various derivatives, including interest rate, commodity, equity, credit and foreign exchange contracts, to our customers but usually offset our exposure from such contracts by purchasing other financial contracts. The customer accommodations and any offsetting financial contracts are treated as free-standing derivatives. Free-standing derivatives also include derivatives we enter into for risk management that do not otherwise qualify for hedge accounting, including economic hedge derivatives. To a lesser extent, we take positions based on market expectations or to benefit from price differentials between financial instruments and markets. Additionally, free-standing derivatives include embedded derivatives that are required to be accounted for separately from their host contracts. The following table presents the total notional or contractual amounts and fair values for derivatives designated as qualifying hedge contracts, which are used as asset/liability management hedges, and free-standing derivatives (economic hedges) not designated as hedging instruments that are recorded on the balance sheet in other assets or other liabilities. Customer accommodation, trading and other free-standing derivatives are recorded on the balance sheet at fair value in trading assets or other liabilities.
184
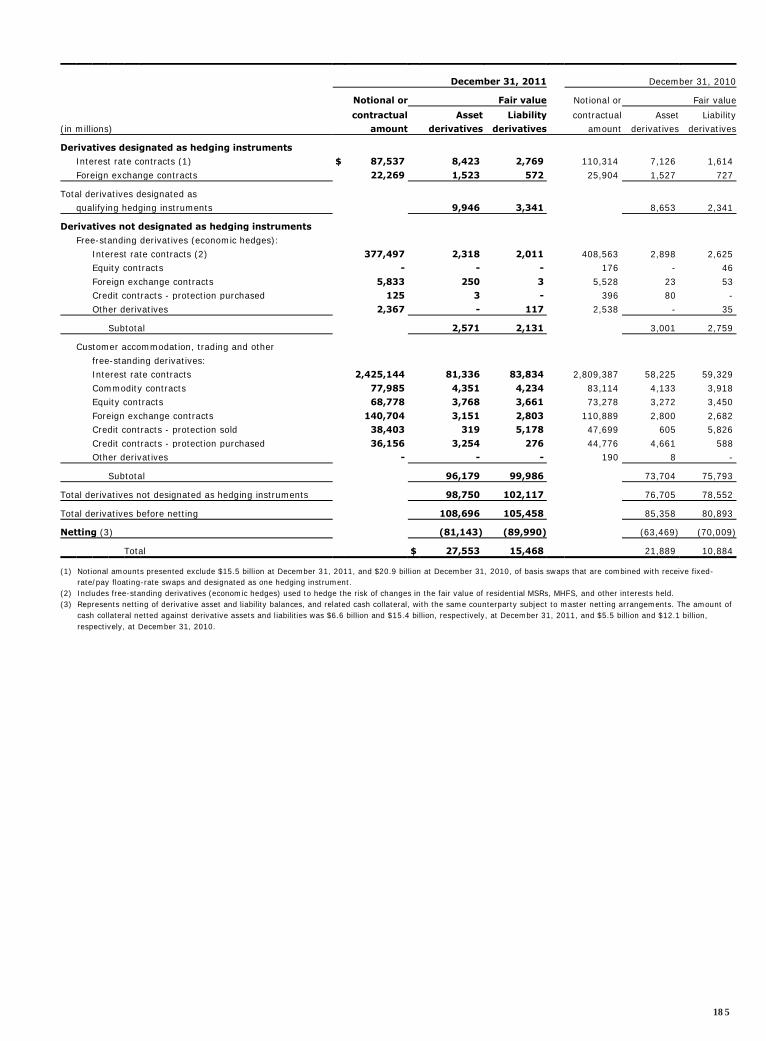
December 31, 2011 December 31, 2010
Notional or Fair value Notional or Fair value
contractual Asset Liability contractual Asset Liability (in millions) amount derivatives derivatives amount derivatives derivatives
Derivatives designated as hedging instruments Interest rate contracts (1) $ 87,537 8,423 2,769 110,314 7,126 1,614
Foreign exchange contracts 22,269 1,523 572 25,904 1,527 727
Total derivatives designated as qualifying hedging instruments 9,946 3,341 8,653 2,341
Derivatives not designated as hedging instruments Free-standing derivatives (economic hedges):
Interest rate contracts (2) 377,497 2,318 2,011 408,563 2,898 2,625 Equity contracts - - - 176 - 46
Foreign exchange contracts 5,833 250 3 5,528 23 53 Credit contracts - protection purchased 125 3 - 396 80 -
Other derivatives 2,367 - 117 2,538 - 35
Subtotal 2,571 2,131 3,001 2,759
Customer accommodation, trading and other
free-standing derivatives: Interest rate contracts 2,425,144 81,336 83,834 2,809,387 58,225 59,329
Commodity contracts 77,985 4,351 4,234 83,114 4,133 3,918 Equity contracts 68,778 3,768 3,661 73,278 3,272 3,450
Foreign exchange contracts 140,704 3,151 2,803 110,889 2,800 2,682 Credit contracts - protection sold 38,403 319 5,178 47,699 605 5,826
Credit contracts - protection purchased 36,156 3,254 276 44,776 4,661 588 Other derivatives - - - 190 8 -
Subtotal 96,179 99,986 73,704 75,793
Total derivatives not designated as hedging instruments 98,750 102,117 76,705 78,552
Total derivatives before netting 108,696 105,458 85,358 80,893
Netting (3) (81,143) (89,990) (63,469) (70,009)
Total $ 27,553 15,468 21,889 10,884
(1) Notional amounts presented exclude $15.5 billion at December 31, 2011, and $20.9 billion at December 31, 2010, of basis swaps that are combined with receive fixed-rate/pay floating-rate swaps and designated as one hedging instrument.
(2) Includes free-standing derivatives (economic hedges) used to hedge the risk of changes in the fair value of residential MSRs, MHFS, and other interests held. (3) Represents netting of derivative asset and liability balances, and related cash collateral, with the same counterparty subject to master netting arrangements. The amount of
cash collateral netted against derivative assets and liabilities was $6.6 billion and $15.4 billion, respectively, at December 31, 2011, and $5.5 billion and $12.1 billion, respectively, at December 31, 2010.
185
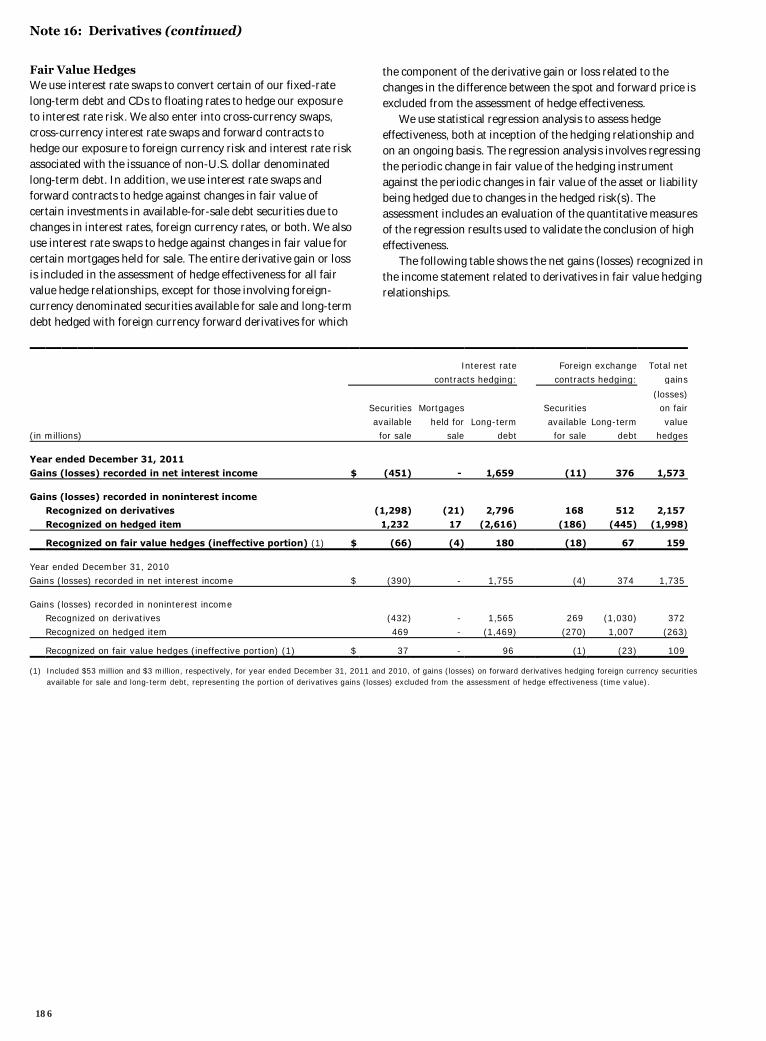
Note 16: Derivatives (continued)
Fair Value Hedges We use interest rate swaps to convert certain of our fixed-rate long-term debt and CDs to floating rates to hedge our exposure to interest rate risk. We also enter into cross-currency swaps, cross-currency interest rate swaps and forward contracts to hedge our exposure to foreign currency risk and interest rate risk associated with the issuance of non-U.S. dollar denominated long-term debt. In addition, we use interest rate swaps and forward contracts to hedge against changes in fair value of certain investments in available-for-sale debt securities due to changes in interest rates, foreign currency rates, or both. We also use interest rate swaps to hedge against changes in fair value for certain mortgages held for sale. The entire derivative gain or loss is included in the assessment of hedge effectiveness for all fair value hedge relationships, except for those involving foreign-currency denominated securities available for sale and long-term debt hedged with foreign currency forward derivatives for which
the component of the derivative gain or loss related to the changes in the difference between the spot and forward price is excluded from the assessment of hedge effectiveness. We use statistical regression analysis to assess hedge effectiveness, both at inception of the hedging relationship and on an ongoing basis. The regression analysis involves regressing the periodic change in fair value of the hedging instrument against the periodic changes in fair value of the asset or liability being hedged due to changes in the hedged risk(s). The assessment includes an evaluation of the quantitative measures of the regression results used to validate the conclusion of high effectiveness. The following table shows the net gains (losses) recognized in the income statement related to derivatives in fair value hedging relationships.
Interest rate Foreign exchange Total net
contracts hedging: contracts hedging: gains
(losses) Securities Mortgages Securities on fair
available held for Long-term available Long-term value (in millions) for sale sale debt for sale debt hedges
Year ended December 31, 2011
Gains (losses) recorded in net interest income $ (451) - 1,659 (11) 376 1,573
Gains (losses) recorded in noninterest income Recognized on derivatives (1,298) (21) 2,796 168 512 2,157
Recognized on hedged item 1,232 17 (2,616) (186) (445) (1,998)
Recognized on fair value hedges (ineffective portion) (1) $ (66) (4) 180 (18) 67 159
Year ended December 31, 2010
Gains (losses) recorded in net interest income $ (390) - 1,755 (4) 374 1,735
Gains (losses) recorded in noninterest income Recognized on derivatives (432) - 1,565 269 (1,030) 372
Recognized on hedged item 469 - (1,469) (270) 1,007 (263)
Recognized on fair value hedges (ineffective portion) (1) $ 37 - 96 (1) (23) 109
(1) Included $53 million and $3 million, respectively, for year ended December 31, 2011 and 2010, of gains (losses) on forward derivatives hedging foreign currency securities available for sale and long-term debt, representing the portion of derivatives gains (losses) excluded from the assessment of hedge effectiveness (time value).
186
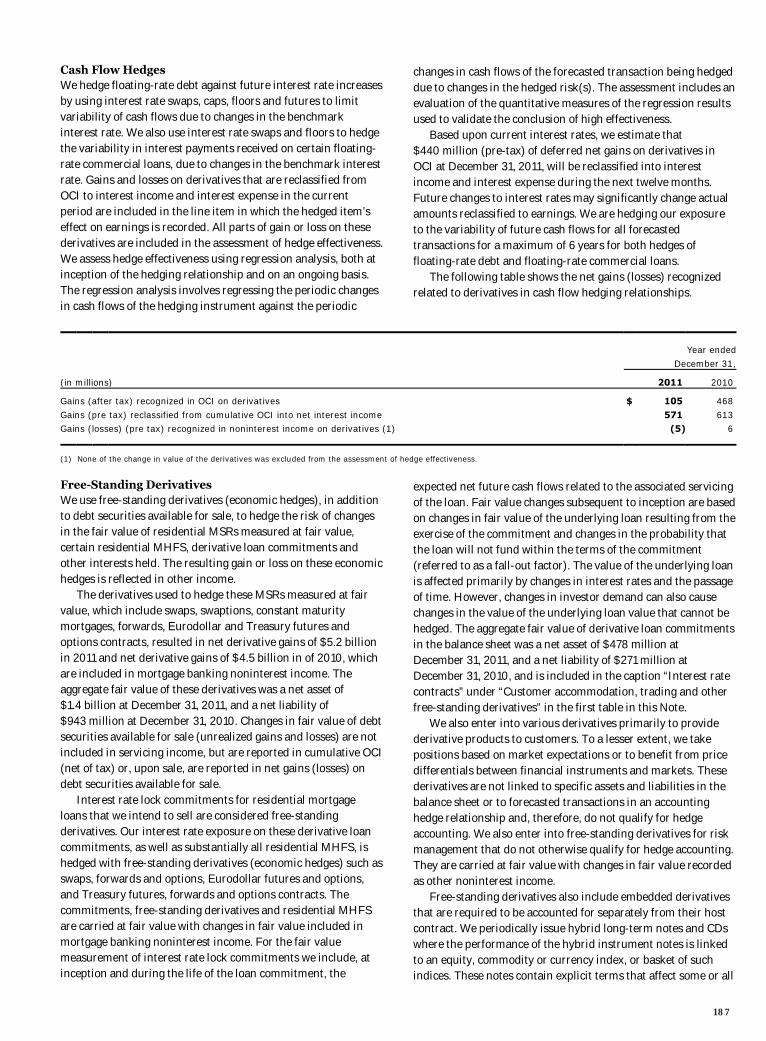
Cash Flow Hedges We hedge floating-rate debt against future interest rate increases by using interest rate swaps, caps, floors and futures to limit variability of cash flows due to changes in the benchmark interest rate. We also use interest rate swaps and floors to hedge the variability in interest payments received on certain floating-rate commercial loans, due to changes in the benchmark interest rate. Gains and losses on derivatives that are reclassified from OCI to interest income and interest expense in the current period are included in the line item in which the hedged item’s effect on earnings is recorded. All parts of gain or loss on these derivatives are included in the assessment of hedge effectiveness. We assess hedge effectiveness using regression analysis, both at inception of the hedging relationship and on an ongoing basis. The regression analysis involves regressing the periodic changes in cash flows of the hedging instrument against the periodic
changes in cash flows of the forecasted transaction being hedged due to changes in the hedged risk(s). The assessment includes an evaluation of the quantitative measures of the regression results used to validate the conclusion of high effectiveness. Based upon current interest rates, we estimate that $440 million (pre-tax) of deferred net gains on derivatives in OCI at December 31, 2011, will be reclassified into interest income and interest expense during the next twelve months. Future changes to interest rates may significantly change actual amounts reclassified to earnings. We are hedging our exposure to the variability of future cash flows for all forecasted transactions for a maximum of 6 years for both hedges of floating-rate debt and floating-rate commercial loans. The following table shows the net gains (losses) recognized related to derivatives in cash flow hedging relationships.
Year ended
December 31,
(in millions) 2011 2010
Gains (after tax) recognized in OCI on derivatives $ 105 468
Gains (pre tax) reclassified from cumulative OCI into net interest income 571 613 Gains (losses) (pre tax) recognized in noninterest income on derivatives (1) (5) 6
(1) None of the change in value of the derivatives was excluded from the assessment of hedge effectiveness.
Free-Standing Derivatives We use free-standing derivatives (economic hedges), in addition to debt securities available for sale, to hedge the risk of changes in the fair value of residential MSRs measured at fair value, certain residential MHFS, derivative loan commitments and other interests held. The resulting gain or loss on these economic hedges is reflected in other income. The derivatives used to hedge these MSRs measured at fair value, which include swaps, swaptions, constant maturity mortgages, forwards, Eurodollar and Treasury futures and options contracts, resulted in net derivative gains of $5.2 billion in 2011 and net derivative gains of $4.5 billion in of 2010, which are included in mortgage banking noninterest income. The aggregate fair value of these derivatives was a net asset of $1.4 billion at December 31, 2011, and a net liability of $943 million at December 31, 2010. Changes in fair value of debt securities available for sale (unrealized gains and losses) are not included in servicing income, but are reported in cumulative OCI (net of tax) or, upon sale, are reported in net gains (losses) on debt securities available for sale. Interest rate lock commitments for residential mortgage loans that we intend to sell are considered free-standing derivatives. Our interest rate exposure on these derivative loan commitments, as well as substantially all residential MHFS, is hedged with free-standing derivatives (economic hedges) such as swaps, forwards and options, Eurodollar futures and options, and Treasury futures, forwards and options contracts. The commitments, free-standing derivatives and residential MHFS are carried at fair value with changes in fair value included in mortgage banking noninterest income. For the fair value measurement of interest rate lock commitments we include, at inception and during the life of the loan commitment, the
expected net future cash flows related to the associated servicing of the loan. Fair value changes subsequent to inception are based on changes in fair value of the underlying loan resulting from the exercise of the commitment and changes in the probability that the loan will not fund within the terms of the commitment (referred to as a fall-out factor). The value of the underlying loan is affected primarily by changes in interest rates and the passage of time. However, changes in investor demand can also cause changes in the value of the underlying loan value that cannot be hedged. The aggregate fair value of derivative loan commitments in the balance sheet was a net asset of $478 million at December 31, 2011, and a net liability of $271 million at December 31, 2010, and is included in the caption “Interest rate contracts” under “Customer accommodation, trading and other free-standing derivatives” in the first table in this Note. We also enter into various derivatives primarily to provide derivative products to customers. To a lesser extent, we take positions based on market expectations or to benefit from price differentials between financial instruments and markets. These derivatives are not linked to specific assets and liabilities in the balance sheet or to forecasted transactions in an accounting hedge relationship and, therefore, do not qualify for hedge accounting. We also enter into free-standing derivatives for risk management that do not otherwise qualify for hedge accounting. They are carried at fair value with changes in fair value recorded as other noninterest income. Free-standing derivatives also include embedded derivatives that are required to be accounted for separately from their host contract. We periodically issue hybrid long-term notes and CDs where the performance of the hybrid instrument notes is linked to an equity, commodity or currency index, or basket of such indices. These notes contain explicit terms that affect some or all
187
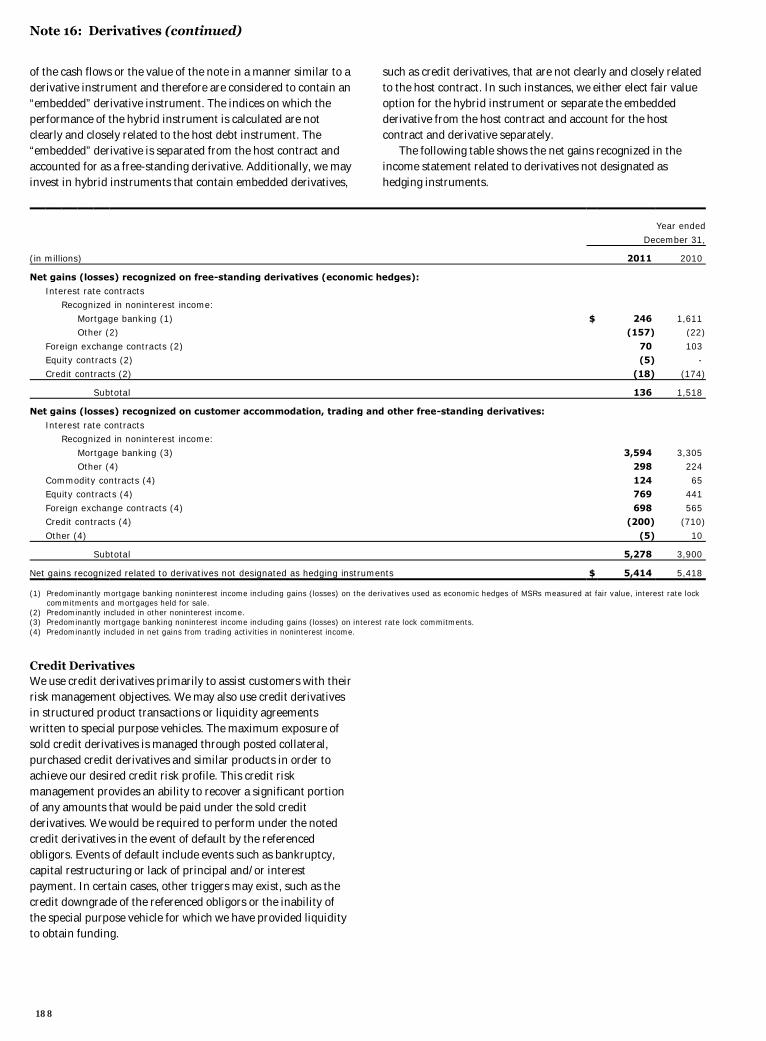
Note 16: Derivatives (continued)
of the cash flows or the value of the note in a manner similar to a derivative instrument and therefore are considered to contain an “embedded” derivative instrument. The indices on which the performance of the hybrid instrument is calculated are not clearly and closely related to the host debt instrument. The “embedded” derivative is separated from the host contract and accounted for as a free-standing derivative. Additionally, we may invest in hybrid instruments that contain embedded derivatives,
such as credit derivatives, that are not clearly and closely related to the host contract. In such instances, we either elect fair value option for the hybrid instrument or separate the embedded derivative from the host contract and account for the host contract and derivative separately. The following table shows the net gains recognized in the income statement related to derivatives not designated as hedging instruments.
Year ended
December 31,
(in millions) 2011 2010
Net gains (losses) recognized on free-standing derivatives (economic hedges):
Interest rate contracts Recognized in noninterest income:
Mortgage banking (1) $ 246 1,611 Other (2) (157) (22)
Foreign exchange contracts (2) 70 103 Equity contracts (2) (5) -
Credit contracts (2) (18) (174)
Subtotal 136 1,518
Net gains (losses) recognized on customer accommodation, trading and other free-standing derivatives:
Interest rate contracts Recognized in noninterest income:
Mortgage banking (3) 3,594 3,305 Other (4) 298 224
Commodity contracts (4) 124 65 Equity contracts (4) 769 441
Foreign exchange contracts (4) 698 565 Credit contracts (4) (200) (710)
Other (4) (5) 10
Subtotal 5,278 3,900
Net gains recognized related to derivatives not designated as hedging instruments $ 5,414 5,418
(1) Predominantly mortgage banking noninterest income including gains (losses) on the derivatives used as economic hedges of MSRs measured at fair value, interest rate lock commitments and mortgages held for sale.
(2) Predominantly included in other noninterest income. (3) Predominantly mortgage banking noninterest income including gains (losses) on interest rate lock commitments. (4) Predominantly included in net gains from trading activities in noninterest income.
Credit Derivatives We use credit derivatives primarily to assist customers with their risk management objectives. We may also use credit derivatives in structured product transactions or liquidity agreements written to special purpose vehicles. The maximum exposure of sold credit derivatives is managed through posted collateral, purchased credit derivatives and similar products in order to achieve our desired credit risk profile. This credit risk management provides an ability to recover a significant portion of any amounts that would be paid under the sold credit derivatives. We would be required to perform under the noted credit derivatives in the event of default by the referenced obligors. Events of default include events such as bankruptcy, capital restructuring or lack of principal and/or interest payment. In certain cases, other triggers may exist, such as the credit downgrade of the referenced obligors or the inability of the special purpose vehicle for which we have provided liquidity to obtain funding.
188
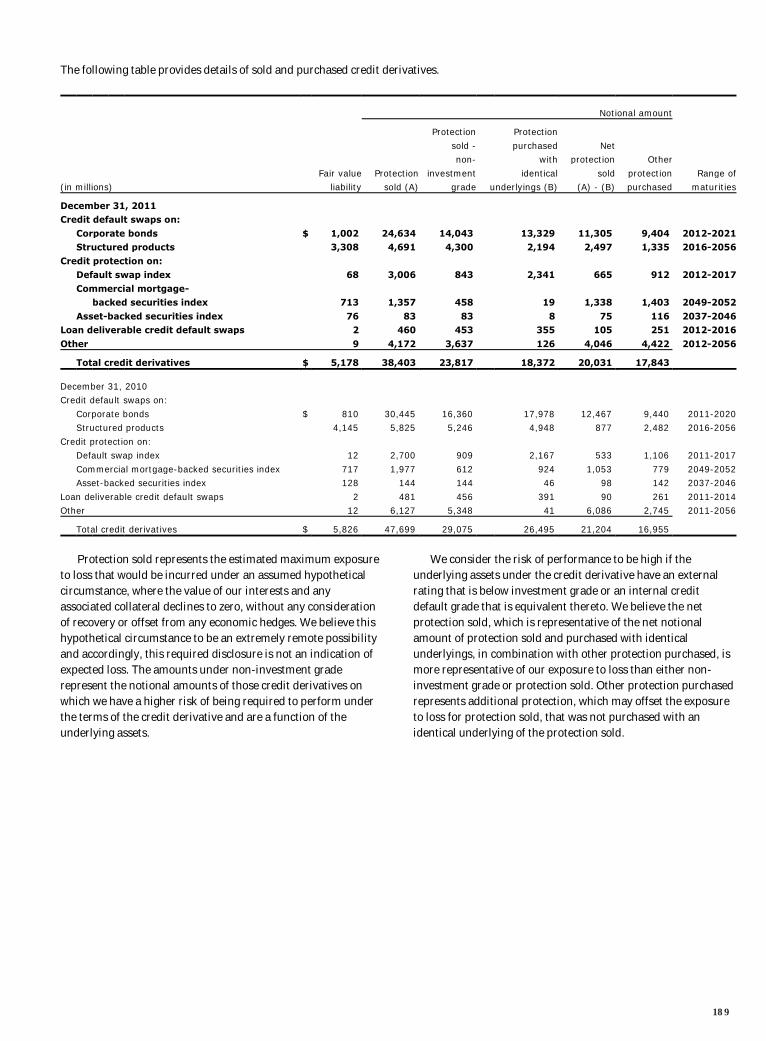
The following table provides details of sold and purchased credit derivatives. Notional amount
Protection Protection
sold - purchased Net non- with protection Other
Fair value Protection investment identical sold protection Range of (in millions) liability sold (A) grade underlyings (B) (A) - (B) purchased maturities
December 31, 2011 Credit default swaps on:
Corporate bonds $ 1,002 24,634 14,043 13,329 11,305 9,404 2012-2021 Structured products 3,308 4,691 4,300 2,194 2,497 1,335 2016-2056
Credit protection on: Default swap index 68 3,006 843 2,341 665 912 2012-2017
Commercial mortgage- backed securities index 713 1,357 458 19 1,338 1,403 2049-2052
Asset-backed securities index 76 83 83 8 75 116 2037-2046 Loan deliverable credit default swaps 2 460 453 355 105 251 2012-2016
Other 9 4,172 3,637 126 4,046 4,422 2012-2056
Total credit derivatives $ 5,178 38,403 23,817 18,372 20,031 17,843
December 31, 2010 Credit default swaps on:
Corporate bonds $ 810 30,445 16,360 17,978 12,467 9,440 2011-2020 Structured products 4,145 5,825 5,246 4,948 877 2,482 2016-2056
Credit protection on: Default swap index 12 2,700 909 2,167 533 1,106 2011-2017
Commercial mortgage-backed securities index 717 1,977 612 924 1,053 779 2049-2052 Asset-backed securities index 128 144 144 46 98 142 2037-2046
Loan deliverable credit default swaps 2 481 456 391 90 261 2011-2014 Other 12 6,127 5,348 41 6,086 2,745 2011-2056
Total credit derivatives $ 5,826 47,699 29,075 26,495 21,204 16,955
Protection sold represents the estimated maximum exposure to loss that would be incurred under an assumed hypothetical circumstance, where the value of our interests and any associated collateral declines to zero, without any consideration of recovery or offset from any economic hedges. We believe this hypothetical circumstance to be an extremely remote possibility and accordingly, this required disclosure is not an indication of expected loss. The amounts under non-investment grade represent the notional amounts of those credit derivatives on which we have a higher risk of being required to perform under the terms of the credit derivative and are a function of the underlying assets.
We consider the risk of performance to be high if the underlying assets under the credit derivative have an external rating that is below investment grade or an internal credit default grade that is equivalent thereto. We believe the net protection sold, which is representative of the net notional amount of protection sold and purchased with identical underlyings, in combination with other protection purchased, is more representative of our exposure to loss than either non-investment grade or protection sold. Other protection purchased represents additional protection, which may offset the exposure to loss for protection sold, that was not purchased with an identical underlying of the protection sold.
189
Note 16: Derivatives (continued)
Credit-Risk Contingent Features Certain of our derivative contracts contain provisions whereby if the credit rating of our debt, based on certain major credit rating agencies indicated in the relevant contracts, were to fall below investment grade, the counterparty could demand additional collateral or require termination or replacement of derivative instruments in a net liability position. The aggregate fair value of all derivative instruments with such credit-risk-related contingent features that are in a net liability position was $17.1 billion and $12.6 billion at December 31, 2011 and 2010, respectively, for which we had posted $15.0 billion and $12.0 billion, respectively, in collateral in the normal course of business. If the credit-risk-related contingent features underlying these agreements had been triggered on December 31, 2011 or 2010, we would have been required to post additional collateral of $2.1 billion, or $1.0 billion, respectively, or potentially settle the contract in an amount equal to its fair value.
Counterparty Credit Risk By using derivatives, we are exposed to counterparty credit risk if counterparties to the derivative contracts do not perform as expected. If a counterparty fails to perform, our counterparty credit risk is equal to the amount reported as a derivative asset on our balance sheet. The amounts reported as a derivative asset are derivative contracts in a gain position, and to the extent subject to master netting arrangements, net of derivatives in a loss position with the same counterparty and cash collateral received. We minimize counterparty credit risk through credit approvals, limits, monitoring procedures, executing master netting arrangements and obtaining collateral, where appropriate. To the extent the master netting arrangements and other criteria meet the applicable requirements, derivatives balances and related cash collateral amounts are shown net in the balance sheet. Counterparty credit risk related to derivatives is considered in determining fair value and our assessment of hedge effectiveness.
Note 17: Fair Values of Assets and Liabilities
We use fair value measurements to record fair value adjustments to certain assets and liabilities and to determine fair value disclosures. Trading assets, securities available for sale, derivatives, substantially all prime residential MHFS, certain commercial LHFS, certain loans held for investment, fair value MSRs, principal investments and securities sold but not yet purchased (short sale liabilities) are recorded at fair value on a recurring basis. We generally do not record our issued debt at fair value. Additionally, from time to time, we may be required to record at fair value other assets on a nonrecurring basis, such as certain residential and commercial MHFS, certain LHFS, loans held for investment and certain other assets. These nonrecurring fair value adjustments typically involve application of lower-of-cost-or-market accounting or write-downs of individual assets. We adopted new guidance on fair value measurements effective January 1, 2009, which addresses measuring fair value in situations where markets are inactive and transactions are not orderly. This guidance states transaction or quoted prices for assets or liabilities in inactive markets may require adjustment due to the uncertainty of whether the underlying transactions are orderly. Prior to our adoption of the new provisions for measuring fair value, we primarily used unadjusted independent vendor or broker quoted prices to measure fair value for substantially all securities available for sale. In connection with the change in guidance for fair value measurement, we developed policies and procedures to determine when the level and volume of activity for our assets and liabilities requiring fair value measurements has significantly declined relative to normal conditions. For such items that use price quotes, such as certain security classes within securities available for sale, the degree of market inactivity and distressed transactions was analyzed to determine the appropriate adjustment to the price quotes. The security classes where we consider the market to be less orderly include primarily non-agency residential MBS. The methodology used to adjust the quotes involved weighting the
price quotes and results of internal pricing techniques such as the net present value of future expected cash flows (with observable inputs, where available) discounted at a rate of return market participants require. The significant inputs utilized in the internal pricing techniques, which were estimated by type of underlying collateral, included credit loss assumptions, estimated prepayment speeds and appropriate discount rates. The more active and orderly markets for particular security classes were determined to be, the more weighting we assigned to price quotes. The less active and orderly markets were determined to be, the less weighting we assigned to price quotes. We continually assess the level and volume of market activity in our investment security classes in determining adjustments, if any, to price quotes. Given market conditions can change over time, determination of which securities markets are considered active or inactive, and if inactive, the degree to which price quotes require adjustment, can also change. Fair Value Hierarchy We group our assets and liabilities measured at fair value in three levels, based on the markets in which the assets and liabilities are traded and the reliability of the assumptions used to determine fair value. These levels are: Level 1 – Valuation is based upon quoted prices for identical
instruments traded in active markets. Level 2 – Valuation is based upon quoted prices for similar
instruments in active markets, quoted prices for identical or similar instruments in markets that are not active, and model-based valuation techniques for which all significant assumptions are observable in the market.
Level 3 – Valuation is generated from model-based techniques that use significant assumptions not observable in the market. These unobservable assumptions reflect estimates of assumptions that market participants would use in pricing the asset or liability. Valuation techniques
190
include use of option pricing models, discounted cash flow models and similar techniques.
In the determination of the classification of financial instruments in Level 2 or Level 3 of the fair value hierarchy, we consider all available information, including observable market data, indications of market liquidity and orderliness, and our understanding of the valuation techniques and significant inputs used. For securities in inactive markets, we use a predetermined percentage to evaluate the impact of fair value adjustments derived from weighting both external and internal indications of value to determine if the instrument is classified as Level 2 or Level 3. Based upon the specific facts and circumstances of each instrument or instrument category, judgments are made regarding the significance of the Level 3 inputs to the instruments' fair value measurement in its entirety. If Level 3 inputs are considered significant, the instrument is classified as Level 3. Determination of Fair Value We base our fair values on the price that would be received to sell an asset or paid to transfer a liability in an orderly transaction between market participants at the measurement date. We maximize the use of observable inputs and minimize the use of unobservable inputs when developing fair value measurements. In instances where there is limited or no observable market data, fair value measurements for assets and liabilities are based primarily upon our own estimates or combination of our own estimates and independent vendor or broker pricing, and the measurements are often calculated based on current pricing for products we offer or issue, the economic and competitive environment, the characteristics of the asset or liability and other such factors. As with any valuation technique used to estimate fair value, changes in underlying assumptions used, including discount rates and estimates of future cash flows, could significantly affect the results of current or future values. Accordingly, these fair value estimates may not be realized in an actual sale or immediate settlement of the asset or liability. We incorporate lack of liquidity into our fair value measurement based on the type of asset or liability measured and the valuation methodology used. For example, for certain residential MHFS and certain securities where the significant inputs have become unobservable due to illiquid markets and vendor or broker pricing is not used, we use a discounted cash flow technique to measure fair value. This technique incorporates forecasting of expected cash flows (adjusted for credit loss assumptions and estimated prepayment speeds) discounted at an appropriate market discount rate to reflect the lack of liquidity in the market that a market participant would consider. For other securities where vendor or broker pricing is used, we use either unadjusted broker quotes or vendor prices or vendor or broker prices adjusted by weighting them with internal discounted cash flow techniques to measure fair value. These unadjusted vendor or broker prices inherently reflect any lack of liquidity in the market, as the fair value measurement represents an exit price from a market participant viewpoint. Following are descriptions of the valuation methodologies used for assets and liabilities recorded at fair value on a
recurring or nonrecurring basis and for estimating fair value for financial instruments not recorded at fair value.
Assets SHORT-TERM FINANCIAL ASSETS Short-term financial assets include cash and due from banks, federal funds sold and securities purchased under resale agreements and due from customers on acceptances. These assets are carried at historical cost. The carrying amount is a reasonable estimate of fair value because of the relatively short time between the origination of the instrument and its expected realization.
TRADING ASSETS (EXCLUDING DERIVATIVES) AND
SECURITIES AVAILABLE FOR SALE Trading assets and securities available for sale are recorded at fair value on a recurring basis. Fair value measurement is based upon quoted prices in active markets, if available. Such instruments are classified within Level 1 of the fair value hierarchy. Examples include exchange-traded equity securities and some highly liquid government securities such as U.S. Treasuries. When instruments are traded in secondary markets and quoted market prices do not exist for such securities, we generally rely on internal valuation techniques or on prices obtained from independent pricing services or brokers (collectively, vendors) or combination thereof. Trading securities are mostly valued using trader prices that are subject to internal price verification procedures. The majority of fair values derived using internal valuation techniques are verified against multiple pricing sources, including prices obtained from independent vendors. Vendors compile prices from various sources and often apply matrix pricing for similar securities when no price is observable. We review pricing methodologies provided by the vendors in order to determine if observable market information is being used, versus unobservable inputs. When we evaluate the appropriateness of an internal trader price compared with vendor prices, our considerations include the range and quality of vendor prices. Vendor prices are used to ensure the reasonableness of a trader price; however valuing financial instruments involves judgments acquired from knowledge of a particular market and is not perfunctory. If a trader asserts that a vendor price is not reflective of market value, justification for using the trader price, including recent sales activity where possible, must be provided to and approved by the appropriate levels of management. Similarly, while securities available for sale traded in secondary markets are typically valued using unadjusted vendor prices or vendor prices adjusted by weighting them with internal discounted cash flow techniques, these prices are reviewed and, if deemed inappropriate by a trader who has the most knowledge of a particular market, can be adjusted. Securities measured with these internal valuation techniques are generally classified as Level 2 of the hierarchy and often involve using quoted market prices for similar securities, pricing models, discounted cash flow analyses using significant inputs observable in the market where available or combination of multiple valuation techniques. Examples include certain residential and commercial MBS,
191
Note 17: Fair Values of Assets and Liabilities (continued)
municipal bonds, U.S. government and agency MBS, and corporate debt securities. Security fair value measurements using significant inputs that are unobservable in the market due to limited activity or a less liquid market are classified as Level 3 in the fair value hierarchy. Such measurements include securities valued using internal models or a combination of multiple valuation techniques such as weighting of internal models and vendor or broker pricing, where the unobservable inputs are significant to the overall fair value measurement. Securities classified as Level 3 include certain residential and commercial MBS, asset-backed securities collateralized by auto leases or loans and cash reserves, CDOs and CLOs, and certain residual and retained interests in residential mortgage loan securitizations. CDOs are valued using the prices of similar instruments, the pricing of completed or pending third party transactions or the pricing of the underlying collateral within the CDO. Where vendor or broker prices are not readily available, management's best estimate is used.
MORTGAGES HELD FOR SALE (MHFS) We carry substantially all of our residential MHFS portfolio at fair value. Fair value is based on independent quoted market prices, where available, or the prices for other mortgage whole loans with similar characteristics. As necessary, these prices are adjusted for typical securitization activities, including servicing value, portfolio composition, market conditions and liquidity. Most of our MHFS are classified as Level 2. For the portion where market pricing data is not available, we use a discounted cash flow model to estimate fair value and, accordingly, classify as Level 3.
LOANS HELD FOR SALE (LHFS) LHFS are carried at the lower of cost or market value, or at fair value. The fair value of LHFS is based on what secondary markets are currently offering for portfolios with similar characteristics. As such, we classify those loans subjected to nonrecurring fair value adjustments as Level 2.
LOANS For the carrying value of loans, including PCI loans, see Note 1. Although most loans are not recorded at fair value on a recurring basis, reverse mortgages, which were previously sold under a GNMA securitization program and were consolidated during fourth quarter 2011, are held at fair value on a recurring basis. In addition, we record nonrecurring fair value adjustments to loans to reflect partial write-downs that are based on the observable market price of the loan or current appraised value of the collateral. We provide fair value estimates in this disclosure for loans that are not recorded at fair value on a recurring or nonrecurring basis. Those estimates differentiate loans based on their financial characteristics, such as product classification, loan category, pricing features and remaining maturity. Prepayment and credit loss estimates are evaluated by product and loan rate. The fair value of commercial loans is calculated by discounting contractual cash flows, adjusted for credit loss estimates, using discount rates that reflect our current pricing for loans with similar characteristics and remaining maturity.
For real estate 1-4 family first and junior lien mortgages, fair value is calculated by discounting contractual cash flows, adjusted for prepayment and credit loss estimates, using discount rates based on current industry pricing (where readily available) or our own estimate of an appropriate risk-adjusted discount rate for loans of similar size, type, remaining maturity and repricing characteristics. The carrying value of credit card loans, which is adjusted for estimates of credit losses inherent in the portfolio at the balance sheet date, is reported as a reasonable estimate of fair value. For all other consumer loans, the fair value is generally calculated by discounting the contractual cash flows, adjusted for prepayment and credit loss estimates, based on the current rates we offer for loans with similar characteristics. Loan commitments, standby letters of credit and commercial and similar letters of credit generate ongoing fees at our current pricing levels, which are recognized over the term of the commitment period. In situations where the credit quality of the counterparty to a commitment has declined, we record an allowance. A reasonable estimate of the fair value of these instruments is the carrying value of deferred fees plus the related allowance. Certain letters of credit that are hedged with derivative instruments are carried at fair value in trading assets or liabilities. For those letters of credit fair value is calculated based on readily quotable credit default spreads, using a market risk credit default swap model.
DERIVATIVES Quoted market prices are available and used for our exchange-traded derivatives, such as certain interest rate futures and option contracts, which we classify as Level 1. However, substantially all of our derivatives are traded in over-the-counter (OTC) markets where quoted market prices are not always readily available. Therefore we value most OTC derivatives using internal valuation techniques. Valuation techniques and inputs to internally-developed models depend on the type of derivative and nature of the underlying rate, price or index upon which the derivative's value is based. Key inputs can include yield curves, credit curves, foreign-exchange rates, prepayment rates, volatility measurements and correlation of such inputs. Where model inputs can be observed in a liquid market and the model does not require significant judgment, such derivatives are typically classified as Level 2 of the fair value hierarchy. Examples of derivatives classified as Level 2 include generic interest rate swaps, foreign currency swaps, commodity swaps, and certain option and forward contracts. When instruments are traded in less liquid markets and significant inputs are unobservable, such derivatives are classified as Level 3. Examples of derivatives classified as Level 3 include complex and highly structured derivatives, certain credit default swaps, interest rate lock commitments written for our residential mortgage loans that we intend to sell and long dated equity options where volatility is not observable. Additionally, significant judgments are required when classifying financial instruments within the fair value hierarchy, particularly between Level 2 and 3, as is the case for certain derivatives.
192

MORTGAGE SERVICING RIGHTS (MSRs) AND CERTAIN OTHER
INTERESTS HELD IN SECURITIZATIONS MSRs and certain other interests held in securitizations (e.g., interest-only strips) do not trade in an active market with readily observable prices. Accordingly, we determine the fair value of MSRs using a valuation model that calculates the present value of estimated future net servicing income cash flows. The model incorporates assumptions that market participants use in estimating future net servicing income cash flows, including estimates of prepayment speeds (including housing price volatility), discount rate, default rates, cost to service (including delinquency and foreclosure costs), escrow account earnings, contractual servicing fee income, ancillary income and late fees. Commercial MSRs and certain residential MSRs are carried at lower of cost or market value, and therefore can be subject to fair value measurements on a nonrecurring basis. Changes in the fair value of MSRs occur primarily due to the collection/realization of expected cash flows, as well as changes in valuation inputs and assumptions. For other interests held in securitizations (such as interest-only strips) we use a valuation model that calculates the present value of estimated future cash flows. The model incorporates our own estimates of assumptions market participants use in determining the fair value, including estimates of prepayment speeds, discount rates, defaults and contractual fee income. Interest-only strips are recorded as trading assets. Our valuation approach is validated by our internal valuation model validation group and our valuation estimates are periodically benchmarked to independent appraisals. Fair value measurements of our MSRs and interest-only strips use significant unobservable inputs and, accordingly, we classify as Level 3.
FORECLOSED ASSETS Foreclosed assets are carried at net realizable value, which represents fair value less estimated costs to sell. Fair value is generally based upon independent market prices or appraised values of the collateral and, accordingly, we classify foreclosed assets as Level 2.
NONMARKETABLE EQUITY INVESTMENTS Nonmarketable equity investments are generally recorded under the cost or equity method of accounting. There are generally restrictions on the sale and/or liquidation of these investments, including federal bank stock. Federal bank stock carrying value approximates fair value. We use facts and circumstances available to estimate the fair value of our nonmarketable equity investments. We typically consider our access to and need for capital (including recent or projected financing activity), qualitative assessments of the viability of the investee, evaluation of the financial statements of the investee and prospects for its future. Public equity investments are valued using quoted market prices and discounts are only applied when there are trading restrictions that are an attribute of the investment. We estimate the fair value of investments in non-public securities using metrics such as security prices of comparable public companies, acquisition prices for similar companies and original investment purchase price multiples, while also incorporating a portfolio company's financial performance and specific factors. For investments in private equity funds, we use the NAV
provided by the fund sponsor as an appropriate measure of fair value. In some cases, such NAVs require adjustments based on certain unobservable inputs.
Liabilities DEPOSIT LIABILITIES Deposit liabilities are carried at historical cost. The fair value of deposits with no stated maturity, such as noninterest-bearing demand deposits, interest-bearing checking, and market rate and other savings, is equal to the amount payable on demand at the measurement date. The fair value of other time deposits is calculated based on the discounted value of contractual cash flows. The discount rate is estimated using the rates currently offered for like wholesale deposits with similar remaining maturities.
SHORT-TERM FINANCIAL LIABILITIES Short-term financial liabilities are carried at historical cost and include federal funds purchased and securities sold under repurchase agreements, commercial paper and other short-term borrowings. The carrying amount is a reasonable estimate of fair value because of the relatively short time between the origination of the instrument and its expected realization.
OTHER LIABILITIES Other liabilities recorded at fair value on a recurring basis, excluding derivative liabilities (see the “Derivatives” section for derivative liabilities), includes primarily short sale liabilities. Short sale liabilities are classified as either Level 1 or Level 2, generally dependent upon whether the underlying securities have readily obtainable quoted prices in active exchange markets.
LONG-TERM DEBT Long-term debt is generally carried at amortized cost. For disclosure, we are required to estimate the fair value of long-term debt. Generally, the discounted cash flow method is used to estimate the fair value of our long-term debt. Contractual cash flows are discounted using rates currently offered for new notes with similar remaining maturities and, as such, these discount rates include our current spread levels.
193
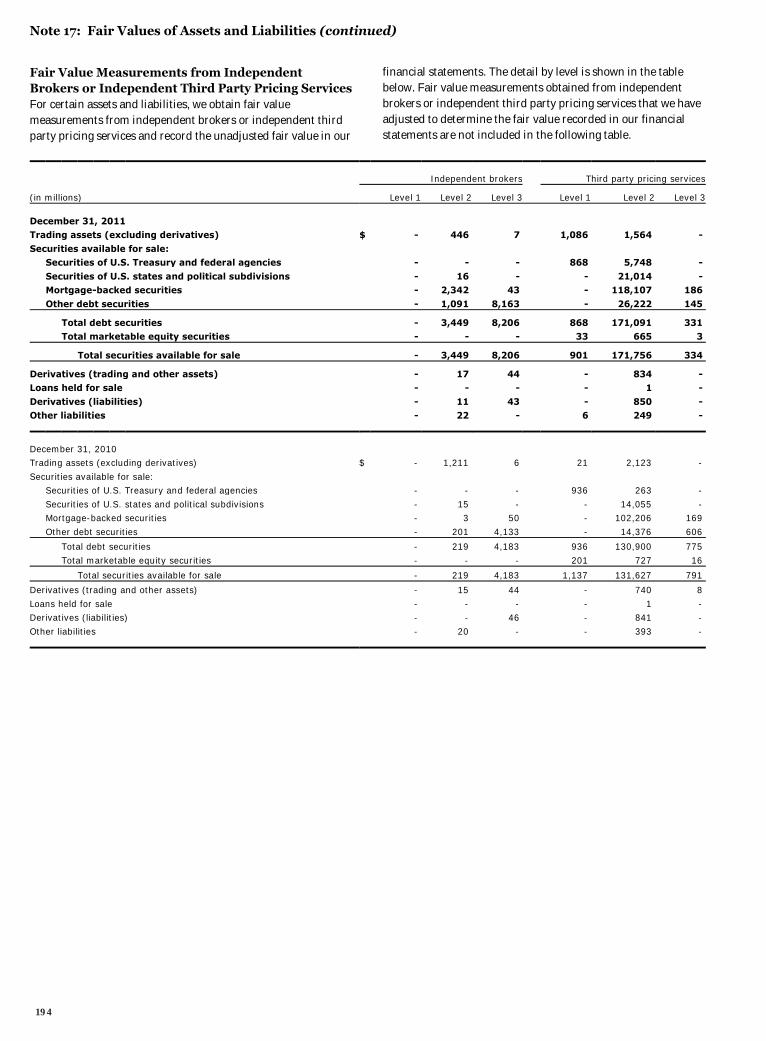
Note 17: Fair Values of Assets and Liabilities (continued)
Fair Value Measurements from Independent Brokers or Independent Third Party Pricing Services For certain assets and liabilities, we obtain fair value measurements from independent brokers or independent third party pricing services and record the unadjusted fair value in our
financial statements. The detail by level is shown in the table below. Fair value measurements obtained from independent brokers or independent third party pricing services that we have adjusted to determine the fair value recorded in our financial statements are not included in the following table.
Independent brokers Third party pricing services
(in millions) Level 1 Level 2 Level 3 Level 1 Level 2 Level 3
December 31, 2011 Trading assets (excluding derivatives) $ - 446 7 1,086 1,564 -
Securities available for sale: Securities of U.S. Treasury and federal agencies - - - 868 5,748 -
Securities of U.S. states and political subdivisions - 16 - - 21,014 - Mortgage-backed securities - 2,342 43 - 118,107 186
Other debt securities - 1,091 8,163 - 26,222 145
Total debt securities - 3,449 8,206 868 171,091 331 Total marketable equity securities - - - 33 665 3
Total securities available for sale - 3,449 8,206 901 171,756 334
Derivatives (trading and other assets) - 17 44 - 834 - Loans held for sale - - - - 1 -
Derivatives (liabilities) - 11 43 - 850 - Other liabilities - 22 - 6 249 -
December 31, 2010 Trading assets (excluding derivatives) $ - 1,211 6 21 2,123 -
Securities available for sale: Securities of U.S. Treasury and federal agencies - - - 936 263 -
Securities of U.S. states and political subdivisions - 15 - - 14,055 - Mortgage-backed securities - 3 50 - 102,206 169
Other debt securities - 201 4,133 - 14,376 606
Total debt securities - 219 4,183 936 130,900 775
Total marketable equity securities - - - 201 727 16
Total securities available for sale - 219 4,183 1,137 131,627 791
Derivatives (trading and other assets) - 15 44 - 740 8
Loans held for sale - - - - 1 - Derivatives (liabilities) - - 46 - 841 -
Other liabilities - 20 - - 393 -
194
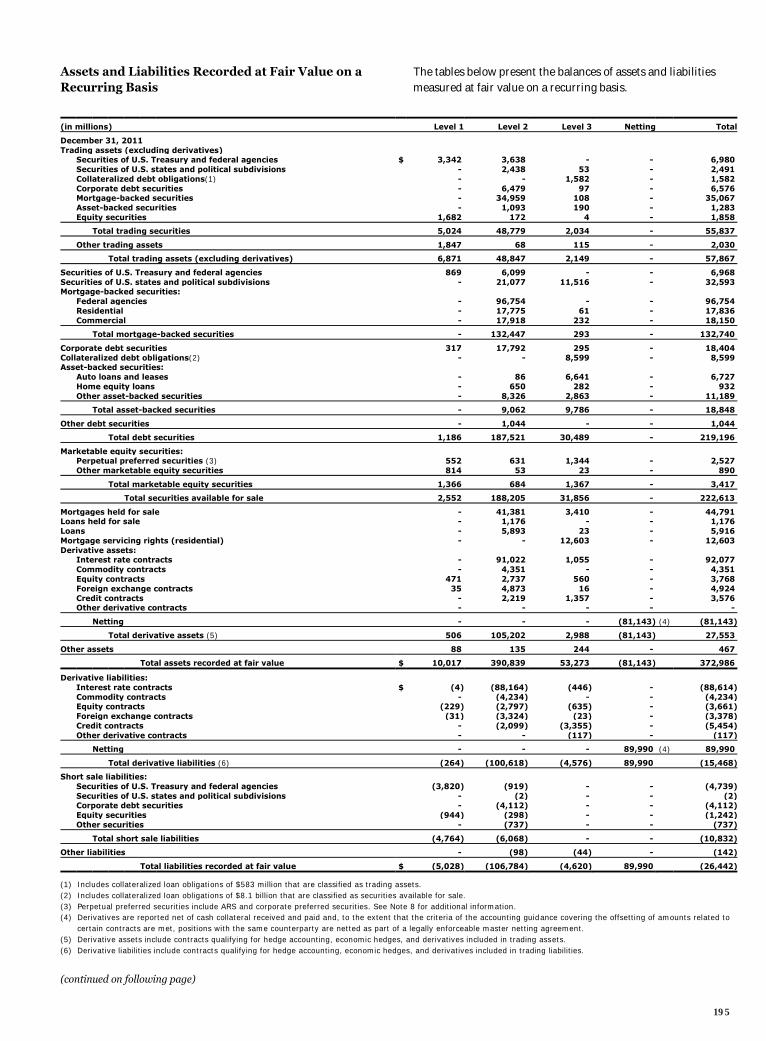
Assets and Liabilities Recorded at Fair Value on a Recurring Basis
The tables below present the balances of assets and liabilities measured at fair value on a recurring basis.
(in millions) Level 1 Level 2 Level 3 Netting Total
December 31, 2011 Trading assets (excluding derivatives) Securities of U.S. Treasury and federal agencies $ 3,342 3,638 - - 6,980 Securities of U.S. states and political subdivisions - 2,438 53 - 2,491 Collateralized debt obligations(1) - - 1,582 - 1,582 Corporate debt securities - 6,479 97 - 6,576 Mortgage-backed securities - 34,959 108 - 35,067 Asset-backed securities - 1,093 190 - 1,283 Equity securities 1,682 172 4 - 1,858
Total trading securities 5,024 48,779 2,034 - 55,837
Other trading assets 1,847 68 115 - 2,030
Total trading assets (excluding derivatives) 6,871 48,847 2,149 - 57,867
Securities of U.S. Treasury and federal agencies 869 6,099 - - 6,968 Securities of U.S. states and political subdivisions - 21,077 11,516 - 32,593 Mortgage-backed securities: Federal agencies - 96,754 - - 96,754 Residential - 17,775 61 - 17,836 Commercial - 17,918 232 - 18,150
Total mortgage-backed securities - 132,447 293 - 132,740
Corporate debt securities 317 17,792 295 - 18,404 Collateralized debt obligations(2) - - 8,599 - 8,599 Asset-backed securities: Auto loans and leases - 86 6,641 - 6,727 Home equity loans - 650 282 - 932 Other asset-backed securities - 8,326 2,863 - 11,189
Total asset-backed securities - 9,062 9,786 - 18,848
Other debt securities - 1,044 - - 1,044
Total debt securities 1,186 187,521 30,489 - 219,196
Marketable equity securities: Perpetual preferred securities (3) 552 631 1,344 - 2,527 Other marketable equity securities 814 53 23 - 890
Total marketable equity securities 1,366 684 1,367 - 3,417
Total securities available for sale 2,552 188,205 31,856 - 222,613
Mortgages held for sale - 41,381 3,410 - 44,791 Loans held for sale - 1,176 - - 1,176 Loans - 5,893 23 - 5,916 Mortgage servicing rights (residential) - - 12,603 - 12,603 Derivative assets: Interest rate contracts - 91,022 1,055 - 92,077 Commodity contracts - 4,351 - - 4,351 Equity contracts 471 2,737 560 - 3,768 Foreign exchange contracts 35 4,873 16 - 4,924 Credit contracts - 2,219 1,357 - 3,576 Other derivative contracts - - - - -
Netting - - - (81,143) (4) (81,143)
Total derivative assets (5) 506 105,202 2,988 (81,143) 27,553
Other assets 88 135 244 - 467
Total assets recorded at fair value $ 10,017 390,839 53,273 (81,143) 372,986
Derivative liabilities: Interest rate contracts $ (4) (88,164) (446) - (88,614) Commodity contracts - (4,234) - - (4,234) Equity contracts (229) (2,797) (635) - (3,661) Foreign exchange contracts (31) (3,324) (23) - (3,378) Credit contracts - (2,099) (3,355) - (5,454) Other derivative contracts - - (117) - (117)
Netting - - - 89,990 (4) 89,990
Total derivative liabilities (6) (264) (100,618) (4,576) 89,990 (15,468)
Short sale liabilities: Securities of U.S. Treasury and federal agencies (3,820) (919) - - (4,739) Securities of U.S. states and political subdivisions - (2) - - (2) Corporate debt securities - (4,112) - - (4,112) Equity securities (944) (298) - - (1,242) Other securities - (737) - - (737)
Total short sale liabilities (4,764) (6,068) - - (10,832)
Other liabilities - (98) (44) - (142)
Total liabilities recorded at fair value $ (5,028) (106,784) (4,620) 89,990 (26,442)
(1) Includes collateralized loan obligations of $583 million that are classified as trading assets. (2) Includes collateralized loan obligations of $8.1 billion that are classified as securities available for sale. (3) Perpetual preferred securities include ARS and corporate preferred securities. See Note 8 for additional information. (4) Derivatives are reported net of cash collateral received and paid and, to the extent that the criteria of the accounting guidance covering the offsetting of amounts related to
certain contracts are met, positions with the same counterparty are netted as part of a legally enforceable master netting agreement. (5) Derivative assets include contracts qualifying for hedge accounting, economic hedges, and derivatives included in trading assets. (6) Derivative liabilities include contracts qualifying for hedge accounting, economic hedges, and derivatives included in trading liabilities.
(continued on following page)
195
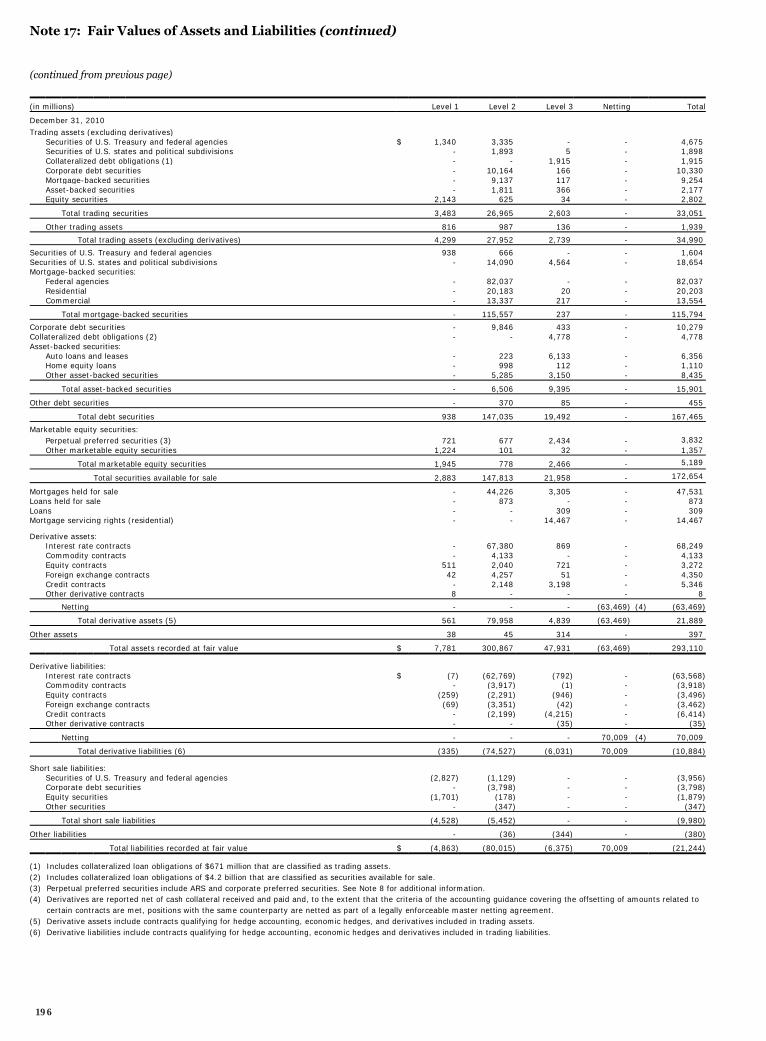
Note 17: Fair Values of Assets and Liabilities (continued)
(continued from previous page)
(in millions) Level 1 Level 2 Level 3 Netting Total
December 31, 2010 Trading assets (excluding derivatives) Securities of U.S. Treasury and federal agencies $ 1,340 3,335 - - 4,675 Securities of U.S. states and political subdivisions - 1,893 5 - 1,898 Collateralized debt obligations (1) - - 1,915 - 1,915 Corporate debt securities - 10,164 166 - 10,330 Mortgage-backed securities - 9,137 117 - 9,254 Asset-backed securities - 1,811 366 - 2,177 Equity securities 2,143 625 34 - 2,802
Total trading securities 3,483 26,965 2,603 - 33,051
Other trading assets 816 987 136 - 1,939
Total trading assets (excluding derivatives) 4,299 27,952 2,739 - 34,990
Securities of U.S. Treasury and federal agencies 938 666 - - 1,604 Securities of U.S. states and political subdivisions - 14,090 4,564 - 18,654 Mortgage-backed securities: Federal agencies - 82,037 - - 82,037 Residential - 20,183 20 - 20,203 Commercial - 13,337 217 - 13,554
Total mortgage-backed securities - 115,557 237 - 115,794
Corporate debt securities - 9,846 433 - 10,279 Collateralized debt obligations (2) - - 4,778 - 4,778 Asset-backed securities: Auto loans and leases - 223 6,133 - 6,356 Home equity loans - 998 112 - 1,110 Other asset-backed securities - 5,285 3,150 - 8,435
Total asset-backed securities - 6,506 9,395 - 15,901 Other debt securities - 370 85 - 455 Total debt securities 938 147,035 19,492 - 167,465 Marketable equity securities: Perpetual preferred securities (3) 721 677 2,434 - 3,832 Other marketable equity securities 1,224 101 32 - 1,357
Total marketable equity securities 1,945 778 2,466 - 5,189
Total securities available for sale 2,883 147,813 21,958 - 172,654
Mortgages held for sale - 44,226 3,305 - 47,531 Loans held for sale - 873 - - 873 Loans - - 309 - 309 Mortgage servicing rights (residential) - - 14,467 - 14,467
Derivative assets: Interest rate contracts - 67,380 869 - 68,249 Commodity contracts - 4,133 - - 4,133 Equity contracts 511 2,040 721 - 3,272 Foreign exchange contracts 42 4,257 51 - 4,350 Credit contracts - 2,148 3,198 - 5,346 Other derivative contracts 8 - - - 8
Netting - - - (63,469) (4) (63,469)
Total derivative assets (5) 561 79,958 4,839 (63,469) 21,889
Other assets 38 45 314 - 397
Total assets recorded at fair value $ 7,781 300,867 47,931 (63,469) 293,110
Derivative liabilities: Interest rate contracts $ (7) (62,769) (792) - (63,568) Commodity contracts - (3,917) (1) - (3,918) Equity contracts (259) (2,291) (946) - (3,496) Foreign exchange contracts (69) (3,351) (42) - (3,462) Credit contracts - (2,199) (4,215) - (6,414) Other derivative contracts - - (35) - (35)
Netting - - - 70,009 (4) 70,009
Total derivative liabilities (6) (335) (74,527) (6,031) 70,009 (10,884)
Short sale liabilities: Securities of U.S. Treasury and federal agencies (2,827) (1,129) - - (3,956) Corporate debt securities - (3,798) - - (3,798) Equity securities (1,701) (178) - - (1,879) Other securities - (347) - - (347)
Total short sale liabilities (4,528) (5,452) - - (9,980)
Other liabilities - (36) (344) - (380)
Total liabilities recorded at fair value $ (4,863) (80,015) (6,375) 70,009 (21,244)
(1) Includes collateralized loan obligations of $671 million that are classified as trading assets. (2) Includes collateralized loan obligations of $4.2 billion that are classified as securities available for sale. (3) Perpetual preferred securities include ARS and corporate preferred securities. See Note 8 for additional information. (4) Derivatives are reported net of cash collateral received and paid and, to the extent that the criteria of the accounting guidance covering the offsetting of amounts related to
certain contracts are met, positions with the same counterparty are netted as part of a legally enforceable master netting agreement. (5) Derivative assets include contracts qualifying for hedge accounting, economic hedges, and derivatives included in trading assets. (6) Derivative liabilities include contracts qualifying for hedge accounting, economic hedges and derivatives included in trading liabilities.
196
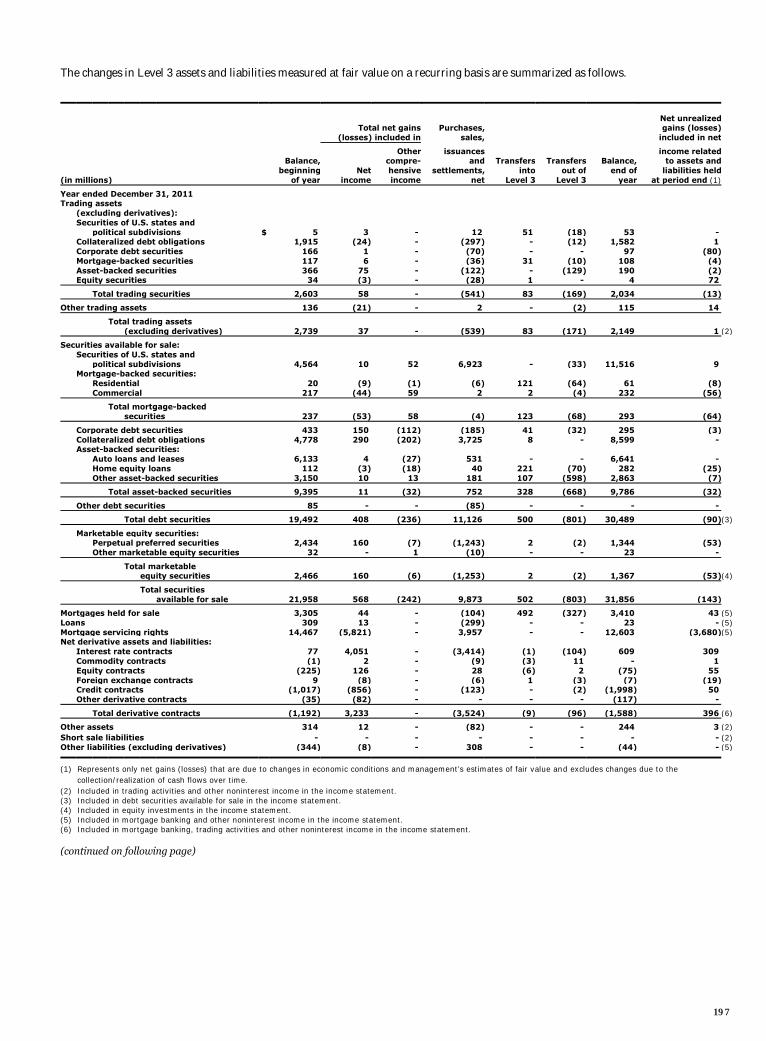
The changes in Level 3 assets and liabilities measured at fair value on a recurring basis are summarized as follows.
Net unrealized Total net gains Purchases, gains (losses) (losses) included in sales, included in net
Other issuances income related Balance, compre- and Transfers Transfers Balance, to assets and beginning Net hensive settlements, into out of end of liabilities held
(in millions) of year income income net Level 3 Level 3 year at period end (1)
Year ended December 31, 2011 Trading assets (excluding derivatives): Securities of U.S. states and political subdivisions $ 5 3 - 12 51 (18) 53 - Collateralized debt obligations 1,915 (24) - (297) - (12) 1,582 1 Corporate debt securities 166 1 - (70) - - 97 (80) Mortgage-backed securities 117 6 - (36) 31 (10) 108 (4) Asset-backed securities 366 75 - (122) - (129) 190 (2) Equity securities 34 (3) - (28) 1 - 4 72
Total trading securities 2,603 58 - (541) 83 (169) 2,034 (13)
Other trading assets 136 (21) - 2 - (2) 115 14
Total trading assets (excluding derivatives) 2,739 37 - (539) 83 (171) 2,149 1 (2)
Securities available for sale: Securities of U.S. states and political subdivisions 4,564 10 52 6,923 - (33) 11,516 9 Mortgage-backed securities: Residential 20 (9) (1) (6) 121 (64) 61 (8) Commercial 217 (44) 59 2 2 (4) 232 (56)
Total mortgage-backed securities 237 (53) 58 (4) 123 (68) 293 (64)
Corporate debt securities 433 150 (112) (185) 41 (32) 295 (3) Collateralized debt obligations 4,778 290 (202) 3,725 8 - 8,599 - Asset-backed securities: Auto loans and leases 6,133 4 (27) 531 - - 6,641 - Home equity loans 112 (3) (18) 40 221 (70) 282 (25) Other asset-backed securities 3,150 10 13 181 107 (598) 2,863 (7)
Total asset-backed securities 9,395 11 (32) 752 328 (668) 9,786 (32)
Other debt securities 85 - - (85) - - - -
Total debt securities 19,492 408 (236) 11,126 500 (801) 30,489 (90)(3)
Marketable equity securities: Perpetual preferred securities 2,434 160 (7) (1,243) 2 (2) 1,344 (53) Other marketable equity securities 32 - 1 (10) - - 23 -
Total marketable equity securities 2,466 160 (6) (1,253) 2 (2) 1,367 (53)(4)
Total securities available for sale 21,958 568 (242) 9,873 502 (803) 31,856 (143)
Mortgages held for sale 3,305 44 - (104) 492 (327) 3,410 43 (5) Loans 309 13 - (299) - - 23 - (5) Mortgage servicing rights 14,467 (5,821) - 3,957 - - 12,603 (3,680)(5) Net derivative assets and liabilities: Interest rate contracts 77 4,051 - (3,414) (1) (104) 609 309 Commodity contracts (1) 2 - (9) (3) 11 - 1 Equity contracts (225) 126 - 28 (6) 2 (75) 55 Foreign exchange contracts 9 (8) - (6) 1 (3) (7) (19) Credit contracts (1,017) (856) - (123) - (2) (1,998) 50 Other derivative contracts (35) (82) - - - - (117) -
Total derivative contracts (1,192) 3,233 - (3,524) (9) (96) (1,588) 396 (6)
Other assets 314 12 - (82) - - 244 3 (2) Short sale liabilities - - - - - - - - (2) Other liabilities (excluding derivatives) (344) (8) - 308 - - (44) - (5)
(1) Represents only net gains (losses) that are due to changes in economic conditions and management’s estimates of fair value and excludes changes due to the collection/realization of cash flows over time.
(2) Included in trading activities and other noninterest income in the income statement. (3) Included in debt securities available for sale in the income statement. (4) Included in equity investments in the income statement. (5) Included in mortgage banking and other noninterest income in the income statement. (6) Included in mortgage banking, trading activities and other noninterest income in the income statement. (continued on following page)
197
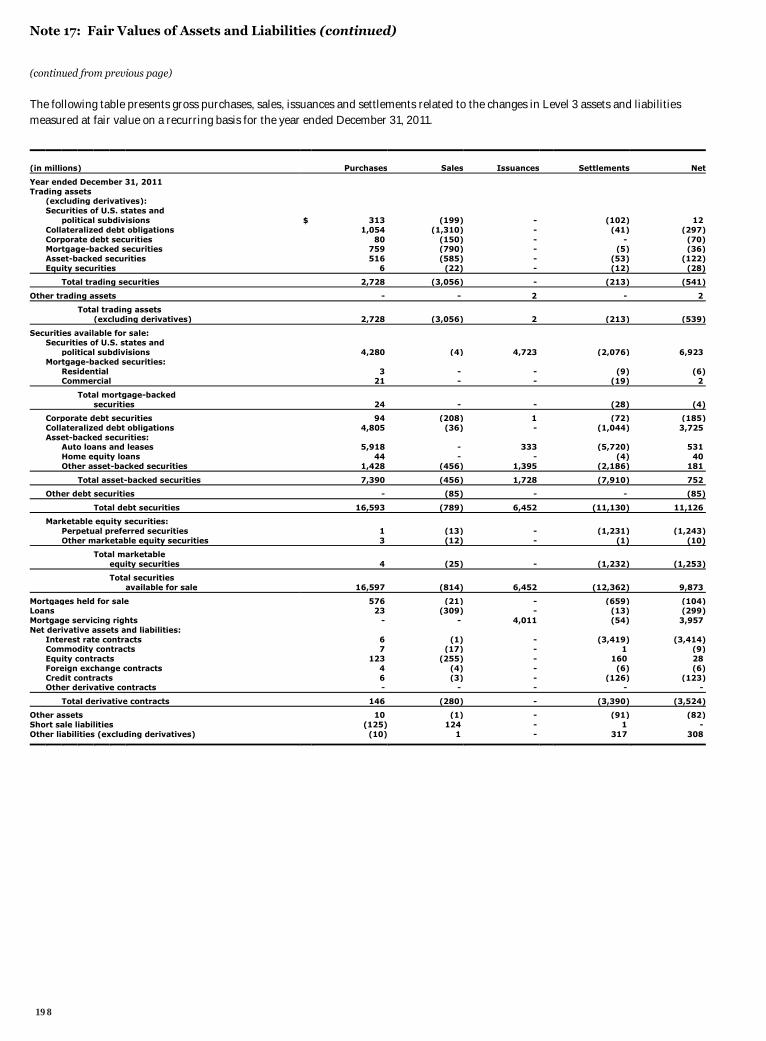
Note 17: Fair Values of Assets and Liabilities (continued)
(continued from previous page)
The following table presents gross purchases, sales, issuances and settlements related to the changes in Level 3 assets and liabilities measured at fair value on a recurring basis for the year ended December 31, 2011.
(in millions) Purchases Sales Issuances Settlements Net
Year ended December 31, 2011 Trading assets (excluding derivatives): Securities of U.S. states and political subdivisions $ 313 (199) - (102) 12 Collateralized debt obligations 1,054 (1,310) - (41) (297) Corporate debt securities 80 (150) - - (70) Mortgage-backed securities 759 (790) - (5) (36) Asset-backed securities 516 (585) - (53) (122) Equity securities 6 (22) - (12) (28)
Total trading securities 2,728 (3,056) - (213) (541)
Other trading assets - - 2 - 2
Total trading assets (excluding derivatives) 2,728 (3,056) 2 (213) (539)
Securities available for sale: Securities of U.S. states and political subdivisions 4,280 (4) 4,723 (2,076) 6,923 Mortgage-backed securities: Residential 3 - - (9) (6) Commercial 21 - - (19) 2
Total mortgage-backed securities 24 - - (28) (4)
Corporate debt securities 94 (208) 1 (72) (185) Collateralized debt obligations 4,805 (36) - (1,044) 3,725 Asset-backed securities: Auto loans and leases 5,918 - 333 (5,720) 531 Home equity loans 44 - - (4) 40 Other asset-backed securities 1,428 (456) 1,395 (2,186) 181
Total asset-backed securities 7,390 (456) 1,728 (7,910) 752
Other debt securities - (85) - - (85)
Total debt securities 16,593 (789) 6,452 (11,130) 11,126
Marketable equity securities: Perpetual preferred securities 1 (13) - (1,231) (1,243) Other marketable equity securities 3 (12) - (1) (10)
Total marketable equity securities 4 (25) - (1,232) (1,253)
Total securities available for sale 16,597 (814) 6,452 (12,362) 9,873
Mortgages held for sale 576 (21) - (659) (104) Loans 23 (309) - (13) (299) Mortgage servicing rights - - 4,011 (54) 3,957 Net derivative assets and liabilities: Interest rate contracts 6 (1) - (3,419) (3,414) Commodity contracts 7 (17) - 1 (9) Equity contracts 123 (255) - 160 28 Foreign exchange contracts 4 (4) - (6) (6) Credit contracts 6 (3) - (126) (123) Other derivative contracts - - - - -
Total derivative contracts 146 (280) - (3,390) (3,524)
Other assets 10 (1) - (91) (82) Short sale liabilities (125) 124 - 1 - Other liabilities (excluding derivatives) (10) 1 - 317 308
198
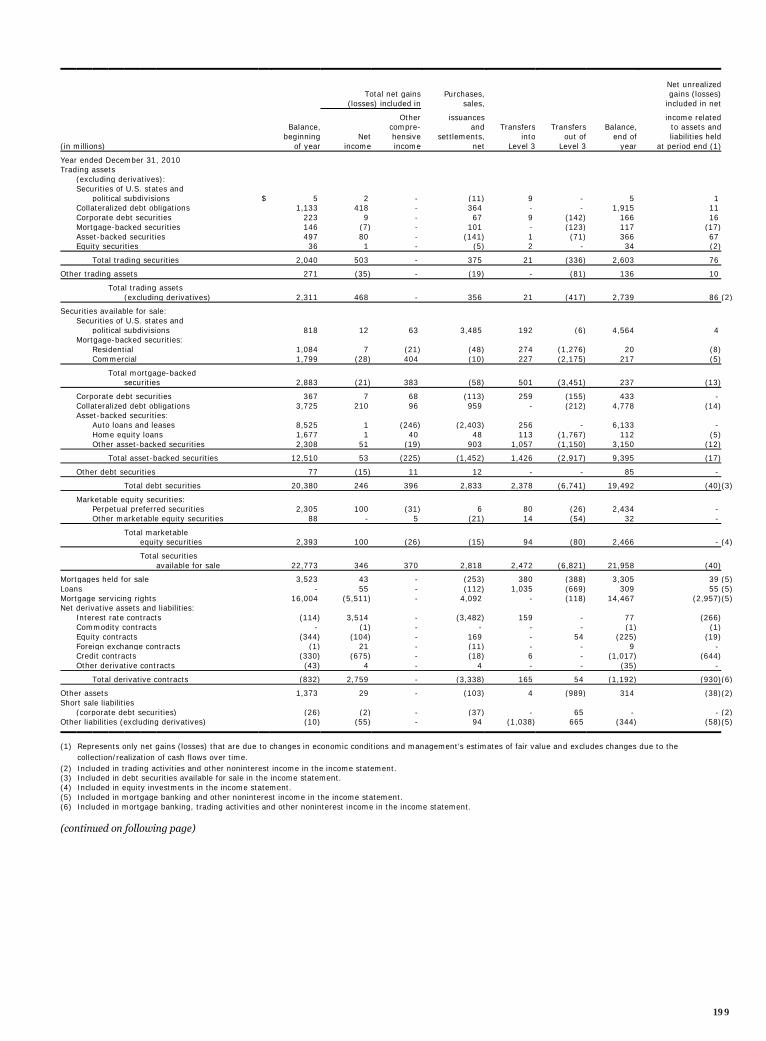
Net unrealized Total net gains Purchases, gains (losses) (losses) included in sales, included in net
Other issuances income related Balance, compre- and Transfers Transfers Balance, to assets and beginning Net hensive settlements, into out of end of liabilities held
(in millions) of year income income net Level 3 Level 3 year at period end (1)
Year ended December 31, 2010 Trading assets (excluding derivatives): Securities of U.S. states and political subdivisions $ 5 2 - (11) 9 - 5 1 Collateralized debt obligations 1,133 418 - 364 - - 1,915 11 Corporate debt securities 223 9 - 67 9 (142) 166 16 Mortgage-backed securities 146 (7) - 101 - (123) 117 (17) Asset-backed securities 497 80 - (141) 1 (71) 366 67 Equity securities 36 1 - (5) 2 - 34 (2)
Total trading securities 2,040 503 - 375 21 (336) 2,603 76
Other trading assets 271 (35) - (19) - (81) 136 10
Total trading assets (excluding derivatives) 2,311 468 - 356 21 (417) 2,739 86 (2)
Securities available for sale: Securities of U.S. states and political subdivisions 818 12 63 3,485 192 (6) 4,564 4 Mortgage-backed securities: Residential 1,084 7 (21) (48) 274 (1,276) 20 (8) Commercial 1,799 (28) 404 (10) 227 (2,175) 217 (5)
Total mortgage-backed securities 2,883 (21) 383 (58) 501 (3,451) 237 (13)
Corporate debt securities 367 7 68 (113) 259 (155) 433 - Collateralized debt obligations 3,725 210 96 959 - (212) 4,778 (14) Asset-backed securities: Auto loans and leases 8,525 1 (246) (2,403) 256 - 6,133 - Home equity loans 1,677 1 40 48 113 (1,767) 112 (5) Other asset-backed securities 2,308 51 (19) 903 1,057 (1,150) 3,150 (12)
Total asset-backed securities 12,510 53 (225) (1,452) 1,426 (2,917) 9,395 (17)
Other debt securities 77 (15) 11 12 - - 85 -
Total debt securities 20,380 246 396 2,833 2,378 (6,741) 19,492 (40)(3)
Marketable equity securities: Perpetual preferred securities 2,305 100 (31) 6 80 (26) 2,434 - Other marketable equity securities 88 - 5 (21) 14 (54) 32 -
Total marketable equity securities 2,393 100 (26) (15) 94 (80) 2,466 - (4)
Total securities available for sale 22,773 346 370 2,818 2,472 (6,821) 21,958 (40)
Mortgages held for sale 3,523 43 - (253) 380 (388) 3,305 39 (5) Loans - 55 - (112) 1,035 (669) 309 55 (5) Mortgage servicing rights 16,004 (5,511) - 4,092 - (118) 14,467 (2,957)(5) Net derivative assets and liabilities: Interest rate contracts (114) 3,514 - (3,482) 159 - 77 (266) Commodity contracts - (1) - - - - (1) (1) Equity contracts (344) (104) - 169 - 54 (225) (19) Foreign exchange contracts (1) 21 - (11) - - 9 - Credit contracts (330) (675) - (18) 6 - (1,017) (644) Other derivative contracts (43) 4 - 4 - - (35) -
Total derivative contracts (832) 2,759 - (3,338) 165 54 (1,192) (930)(6)
Other assets 1,373 29 - (103) 4 (989) 314 (38)(2) Short sale liabilities (corporate debt securities) (26) (2) - (37) - 65 - - (2) Other liabilities (excluding derivatives) (10) (55) - 94 (1,038) 665 (344) (58)(5)
(1) Represents only net gains (losses) that are due to changes in economic conditions and management’s estimates of fair value and excludes changes due to the collection/realization of cash flows over time.
(2) Included in trading activities and other noninterest income in the income statement. (3) Included in debt securities available for sale in the income statement. (4) Included in equity investments in the income statement. (5) Included in mortgage banking and other noninterest income in the income statement. (6) Included in mortgage banking, trading activities and other noninterest income in the income statement. (continued on following page)
199
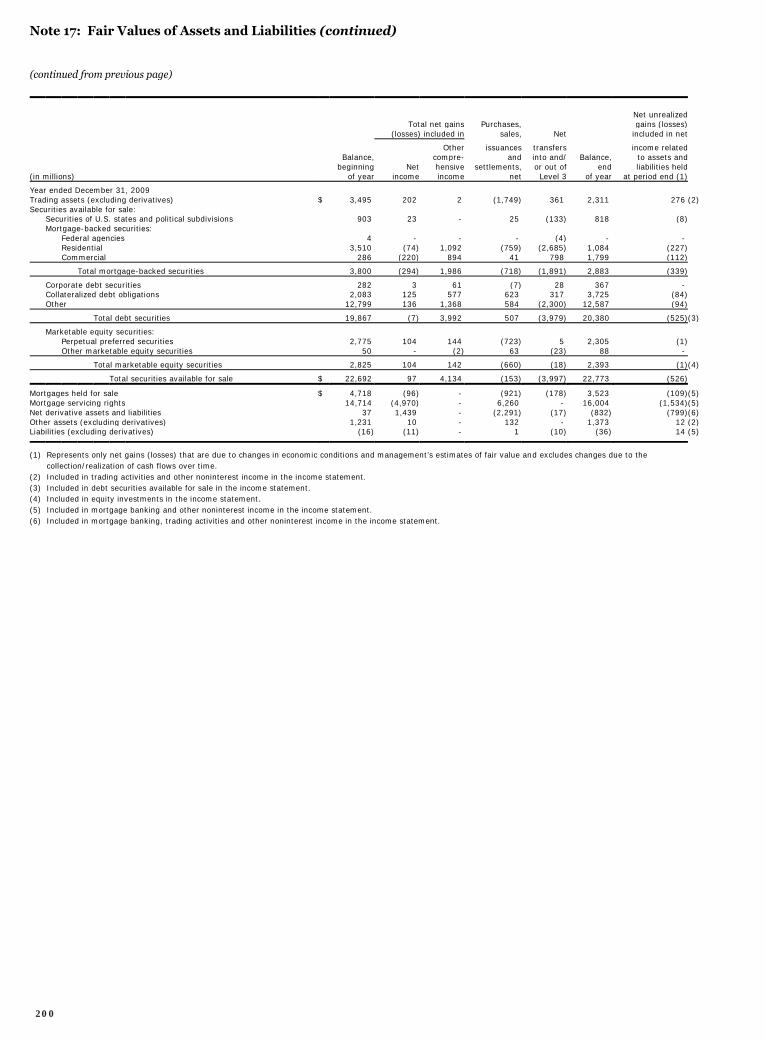
Note 17: Fair Values of Assets and Liabilities (continued)
(continued from previous page)
Net unrealized Total net gains Purchases, gains (losses) (losses) included in sales, Net included in net
Other issuances transfers income related Balance, compre- and into and/ Balance, to assets and beginning Net hensive settlements, or out of end liabilities held
(in millions) of year income income net Level 3 of year at period end (1)
Year ended December 31, 2009 Trading assets (excluding derivatives) $ 3,495 202 2 (1,749) 361 2,311 276 (2) Securities available for sale: Securities of U.S. states and political subdivisions 903 23 - 25 (133) 818 (8) Mortgage-backed securities: Federal agencies 4 - - - (4) - - Residential 3,510 (74) 1,092 (759) (2,685) 1,084 (227) Commercial 286 (220) 894 41 798 1,799 (112)
Total mortgage-backed securities 3,800 (294) 1,986 (718) (1,891) 2,883 (339)
Corporate debt securities 282 3 61 (7) 28 367 - Collateralized debt obligations 2,083 125 577 623 317 3,725 (84) Other 12,799 136 1,368 584 (2,300) 12,587 (94)
Total debt securities 19,867 (7) 3,992 507 (3,979) 20,380 (525) (3)
Marketable equity securities: Perpetual preferred securities 2,775 104 144 (723) 5 2,305 (1) Other marketable equity securities 50 - (2) 63 (23) 88 -
Total marketable equity securities 2,825 104 142 (660) (18) 2,393 (1) (4)
Total securities available for sale $ 22,692 97 4,134 (153) (3,997) 22,773 (526)
Mortgages held for sale $ 4,718 (96) - (921) (178) 3,523 (109) (5) Mortgage servicing rights 14,714 (4,970) - 6,260 - 16,004 (1,534) (5) Net derivative assets and liabilities 37 1,439 - (2,291) (17) (832) (799) (6) Other assets (excluding derivatives) 1,231 10 - 132 - 1,373 12 (2) Liabilities (excluding derivatives) (16) (11) - 1 (10) (36) 14 (5)
(1) Represents only net gains (losses) that are due to changes in economic conditions and management’s estimates of fair value and excludes changes due to the collection/realization of cash flows over time.
(2) Included in trading activities and other noninterest income in the income statement. (3) Included in debt securities available for sale in the income statement. (4) Included in equity investments in the income statement. (5) Included in mortgage banking and other noninterest income in the income statement. (6) Included in mortgage banking, trading activities and other noninterest income in the income statement.
200
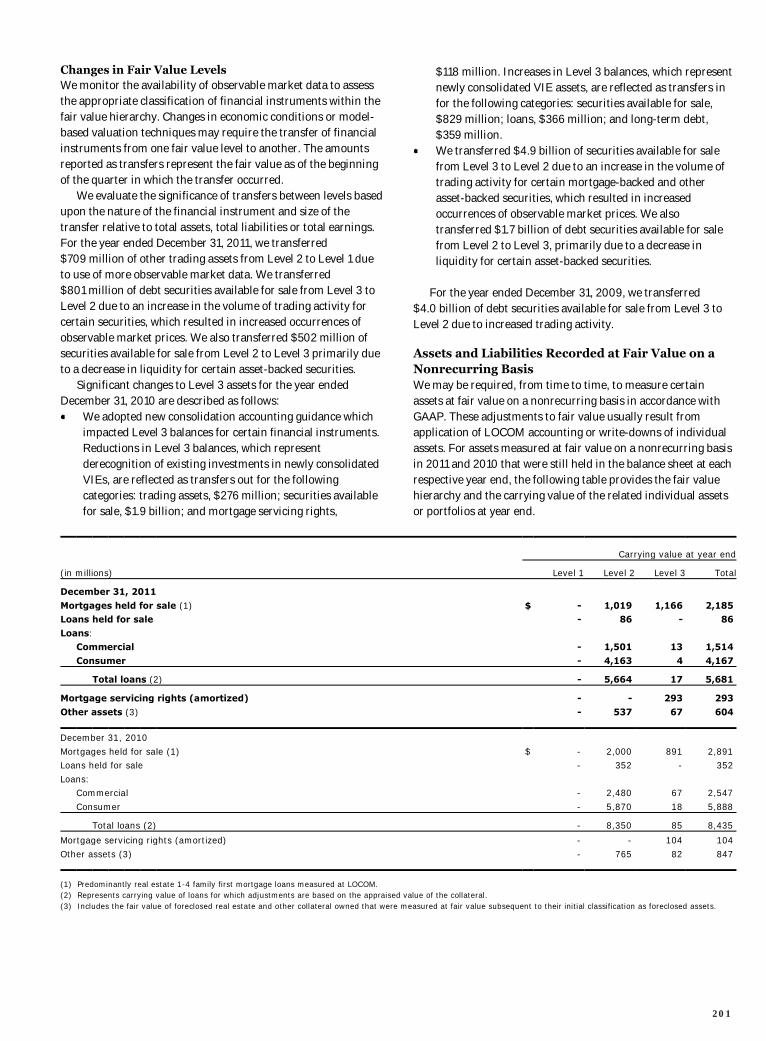
Changes in Fair Value Levels We monitor the availability of observable market data to assess the appropriate classification of financial instruments within the fair value hierarchy. Changes in economic conditions or model-based valuation techniques may require the transfer of financial instruments from one fair value level to another. The amounts reported as transfers represent the fair value as of the beginning of the quarter in which the transfer occurred. We evaluate the significance of transfers between levels based upon the nature of the financial instrument and size of the transfer relative to total assets, total liabilities or total earnings. For the year ended December 31, 2011, we transferred $709 million of other trading assets from Level 2 to Level 1 due to use of more observable market data. We transferred $801 million of debt securities available for sale from Level 3 to Level 2 due to an increase in the volume of trading activity for certain securities, which resulted in increased occurrences of observable market prices. We also transferred $502 million of securities available for sale from Level 2 to Level 3 primarily due to a decrease in liquidity for certain asset-backed securities. Significant changes to Level 3 assets for the year ended December 31, 2010 are described as follows: We adopted new consolidation accounting guidance which
impacted Level 3 balances for certain financial instruments. Reductions in Level 3 balances, which represent derecognition of existing investments in newly consolidated VIEs, are reflected as transfers out for the following categories: trading assets, $276 million; securities available for sale, $1.9 billion; and mortgage servicing rights,
$118 million. Increases in Level 3 balances, which represent newly consolidated VIE assets, are reflected as transfers in for the following categories: securities available for sale, $829 million; loans, $366 million; and long-term debt, $359 million.
We transferred $4.9 billion of securities available for sale from Level 3 to Level 2 due to an increase in the volume of trading activity for certain mortgage-backed and other asset-backed securities, which resulted in increased occurrences of observable market prices. We also transferred $1.7 billion of debt securities available for sale from Level 2 to Level 3, primarily due to a decrease in liquidity for certain asset-backed securities.
For the year ended December 31, 2009, we transferred $4.0 billion of debt securities available for sale from Level 3 to Level 2 due to increased trading activity. Assets and Liabilities Recorded at Fair Value on a Nonrecurring Basis We may be required, from time to time, to measure certain assets at fair value on a nonrecurring basis in accordance with GAAP. These adjustments to fair value usually result from application of LOCOM accounting or write-downs of individual assets. For assets measured at fair value on a nonrecurring basis in 2011 and 2010 that were still held in the balance sheet at each respective year end, the following table provides the fair value hierarchy and the carrying value of the related individual assets or portfolios at year end.
Carrying value at year end
(in millions) Level 1 Level 2 Level 3 Total
December 31, 2011
Mortgages held for sale (1) $ - 1,019 1,166 2,185 Loans held for sale - 86 - 86
Loans: Commercial - 1,501 13 1,514
Consumer - 4,163 4 4,167
Total loans (2) - 5,664 17 5,681
Mortgage servicing rights (amortized) - - 293 293
Other assets (3) - 537 67 604
December 31, 2010
Mortgages held for sale (1) $ - 2,000 891 2,891 Loans held for sale - 352 - 352
Loans: Commercial - 2,480 67 2,547
Consumer - 5,870 18 5,888
Total loans (2) - 8,350 85 8,435
Mortgage servicing rights (amortized) - - 104 104
Other assets (3) - 765 82 847
(1) Predominantly real estate 1-4 family first mortgage loans measured at LOCOM. (2) Represents carrying value of loans for which adjustments are based on the appraised value of the collateral. (3) Includes the fair value of foreclosed real estate and other collateral owned that were measured at fair value subsequent to their initial classification as foreclosed assets.
201
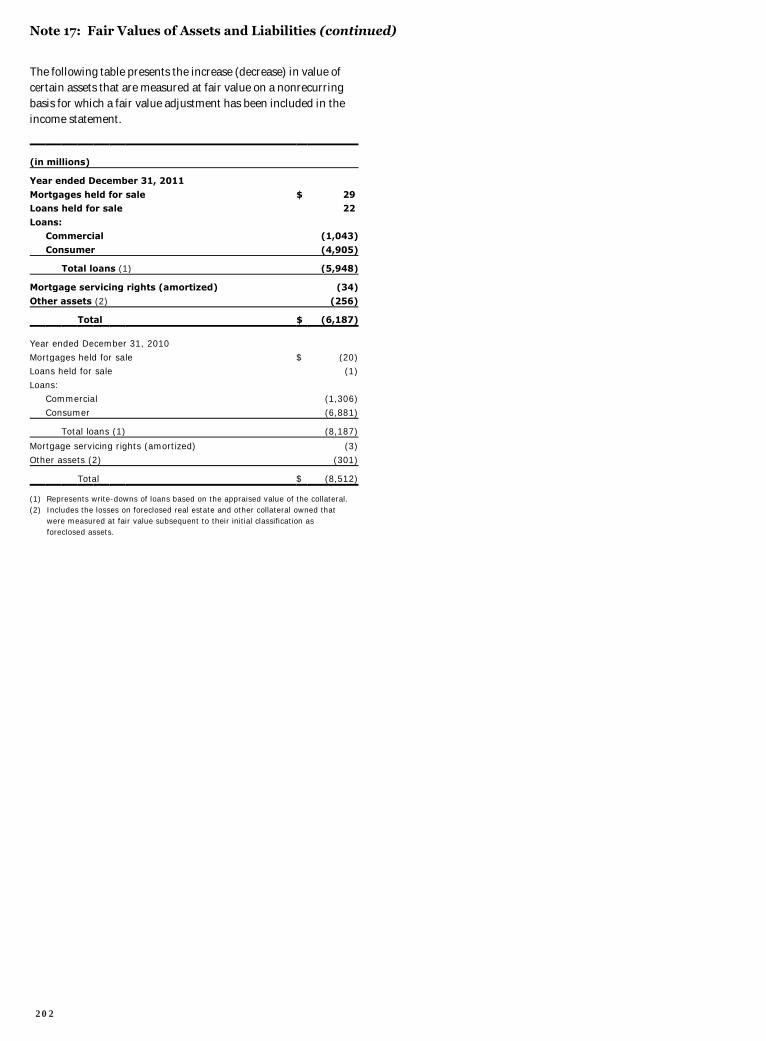
Note 17: Fair Values of Assets and Liabilities (continued)
The following table presents the increase (decrease) in value of certain assets that are measured at fair value on a nonrecurring basis for which a fair value adjustment has been included in the income statement.
(in millions)
Year ended December 31, 2011
Mortgages held for sale $ 29 Loans held for sale 22
Loans: Commercial (1,043)
Consumer (4,905)
Total loans (1) (5,948)
Mortgage servicing rights (amortized) (34)
Other assets (2) (256)
Total $ (6,187)
Year ended December 31, 2010
Mortgages held for sale $ (20)Loans held for sale (1)
Loans: Commercial (1,306)
Consumer (6,881)
Total loans (1) (8,187)
Mortgage servicing rights (amortized) (3)
Other assets (2) (301)
Total $ (8,512)
(1) Represents write-downs of loans based on the appraised value of the collateral. (2) Includes the losses on foreclosed real estate and other collateral owned that
were measured at fair value subsequent to their initial classification as foreclosed assets.
202
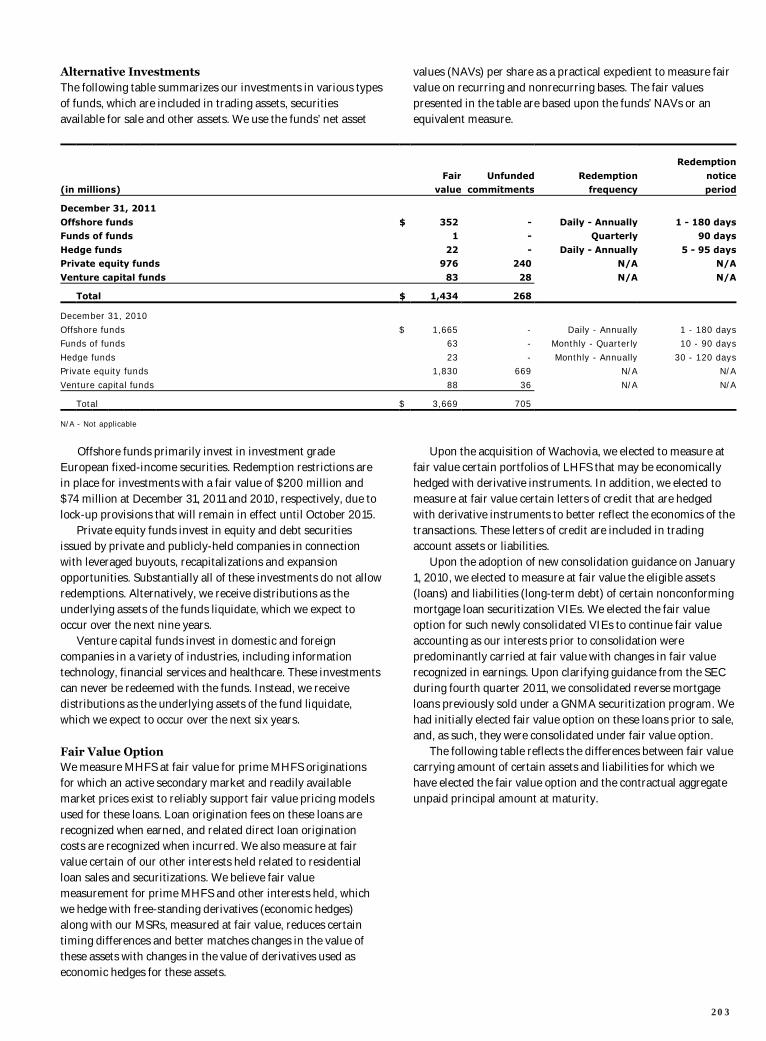
Alternative Investments The following table summarizes our investments in various types of funds, which are included in trading assets, securities available for sale and other assets. We use the funds’ net asset
values (NAVs) per share as a practical expedient to measure fair value on recurring and nonrecurring bases. The fair values presented in the table are based upon the funds’ NAVs or an equivalent measure.
Redemption
Fair Unfunded Redemption notice (in millions) value commitments frequency period
December 31, 2011
Offshore funds $ 352 - Daily - Annually 1 - 180 days Funds of funds 1 - Quarterly 90 days
Hedge funds 22 - Daily - Annually 5 - 95 days Private equity funds 976 240 N/A N/A
Venture capital funds 83 28 N/A N/A
Total $ 1,434 268
December 31, 2010
Offshore funds $ 1,665 - Daily - Annually 1 - 180 days Funds of funds 63 - Monthly - Quarterly 10 - 90 days
Hedge funds 23 - Monthly - Annually 30 - 120 days Private equity funds 1,830 669 N/A N/A
Venture capital funds 88 36 N/A N/A
Total $ 3,669 705
N/A - Not applicable
Offshore funds primarily invest in investment grade
European fixed-income securities. Redemption restrictions are in place for investments with a fair value of $200 million and $74 million at December 31, 2011 and 2010, respectively, due to lock-up provisions that will remain in effect until October 2015. Private equity funds invest in equity and debt securities issued by private and publicly-held companies in connection with leveraged buyouts, recapitalizations and expansion opportunities. Substantially all of these investments do not allow redemptions. Alternatively, we receive distributions as the underlying assets of the funds liquidate, which we expect to occur over the next nine years. Venture capital funds invest in domestic and foreign companies in a variety of industries, including information technology, financial services and healthcare. These investments can never be redeemed with the funds. Instead, we receive distributions as the underlying assets of the fund liquidate, which we expect to occur over the next six years. Fair Value Option We measure MHFS at fair value for prime MHFS originations for which an active secondary market and readily available market prices exist to reliably support fair value pricing models used for these loans. Loan origination fees on these loans are recognized when earned, and related direct loan origination costs are recognized when incurred. We also measure at fair value certain of our other interests held related to residential loan sales and securitizations. We believe fair value measurement for prime MHFS and other interests held, which we hedge with free-standing derivatives (economic hedges) along with our MSRs, measured at fair value, reduces certain timing differences and better matches changes in the value of these assets with changes in the value of derivatives used as economic hedges for these assets.
Upon the acquisition of Wachovia, we elected to measure at fair value certain portfolios of LHFS that may be economically hedged with derivative instruments. In addition, we elected to measure at fair value certain letters of credit that are hedged with derivative instruments to better reflect the economics of the transactions. These letters of credit are included in trading account assets or liabilities. Upon the adoption of new consolidation guidance on January 1, 2010, we elected to measure at fair value the eligible assets (loans) and liabilities (long-term debt) of certain nonconforming mortgage loan securitization VIEs. We elected the fair value option for such newly consolidated VIEs to continue fair value accounting as our interests prior to consolidation were predominantly carried at fair value with changes in fair value recognized in earnings. Upon clarifying guidance from the SEC during fourth quarter 2011, we consolidated reverse mortgage loans previously sold under a GNMA securitization program. We had initially elected fair value option on these loans prior to sale, and, as such, they were consolidated under fair value option. The following table reflects the differences between fair value carrying amount of certain assets and liabilities for which we have elected the fair value option and the contractual aggregate unpaid principal amount at maturity.
203
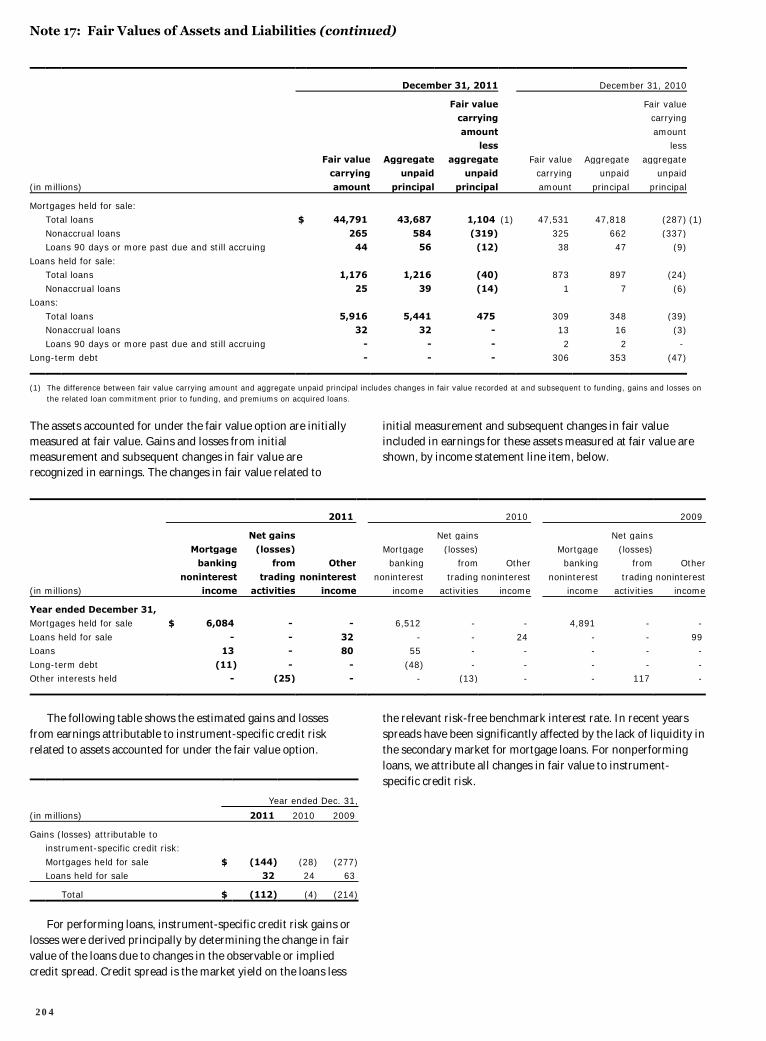
Note 17: Fair Values of Assets and Liabilities (continued)
December 31, 2011 December 31, 2010
Fair value Fair value carrying carrying
amount amount less less
Fair value Aggregate aggregate Fair value Aggregate aggregate carrying unpaid unpaid carrying unpaid unpaid
(in millions) amount principal principal amount principal principal
Mortgages held for sale: Total loans $ 44,791 43,687 1,104 (1) 47,531 47,818 (287) (1)
Nonaccrual loans 265 584 (319) 325 662 (337) Loans 90 days or more past due and still accruing 44 56 (12) 38 47 (9)
Loans held for sale: Total loans 1,176 1,216 (40) 873 897 (24)
Nonaccrual loans 25 39 (14) 1 7 (6) Loans:
Total loans 5,916 5,441 475 309 348 (39) Nonaccrual loans 32 32 - 13 16 (3)
Loans 90 days or more past due and still accruing - - - 2 2 - Long-term debt - - - 306 353 (47)
(1) The difference between fair value carrying amount and aggregate unpaid principal includes changes in fair value recorded at and subsequent to funding, gains and losses on the related loan commitment prior to funding, and premiums on acquired loans.
The assets accounted for under the fair value option are initially measured at fair value. Gains and losses from initial measurement and subsequent changes in fair value are recognized in earnings. The changes in fair value related to
initial measurement and subsequent changes in fair value included in earnings for these assets measured at fair value are shown, by income statement line item, below.
2011 2010 2009
Net gains Net gains Net gains
Mortgage (losses) Mortgage (losses) Mortgage (losses) banking from Other banking from Other banking from Other
noninterest trading noninterest noninterest trading noninterest noninterest trading noninterest (in millions) income activities income income activities income income activities income
Year ended December 31, Mortgages held for sale $ 6,084 - - 6,512 - - 4,891 - -
Loans held for sale - - 32 - - 24 - - 99 Loans 13 - 80 55 - - - - -
Long-term debt (11) - - (48) - - - - - Other interests held - (25) - - (13) - - 117 - The following table shows the estimated gains and losses from earnings attributable to instrument-specific credit risk related to assets accounted for under the fair value option.
Year ended Dec. 31,
(in millions) 2011 2010 2009
Gains (losses) attributable to instrument-specific credit risk:
Mortgages held for sale $ (144) (28) (277) Loans held for sale 32 24 63
Total $ (112) (4) (214)
For performing loans, instrument-specific credit risk gains or losses were derived principally by determining the change in fair value of the loans due to changes in the observable or implied credit spread. Credit spread is the market yield on the loans less
the relevant risk-free benchmark interest rate. In recent years spreads have been significantly affected by the lack of liquidity in the secondary market for mortgage loans. For nonperforming loans, we attribute all changes in fair value to instrument-specific credit risk.
204
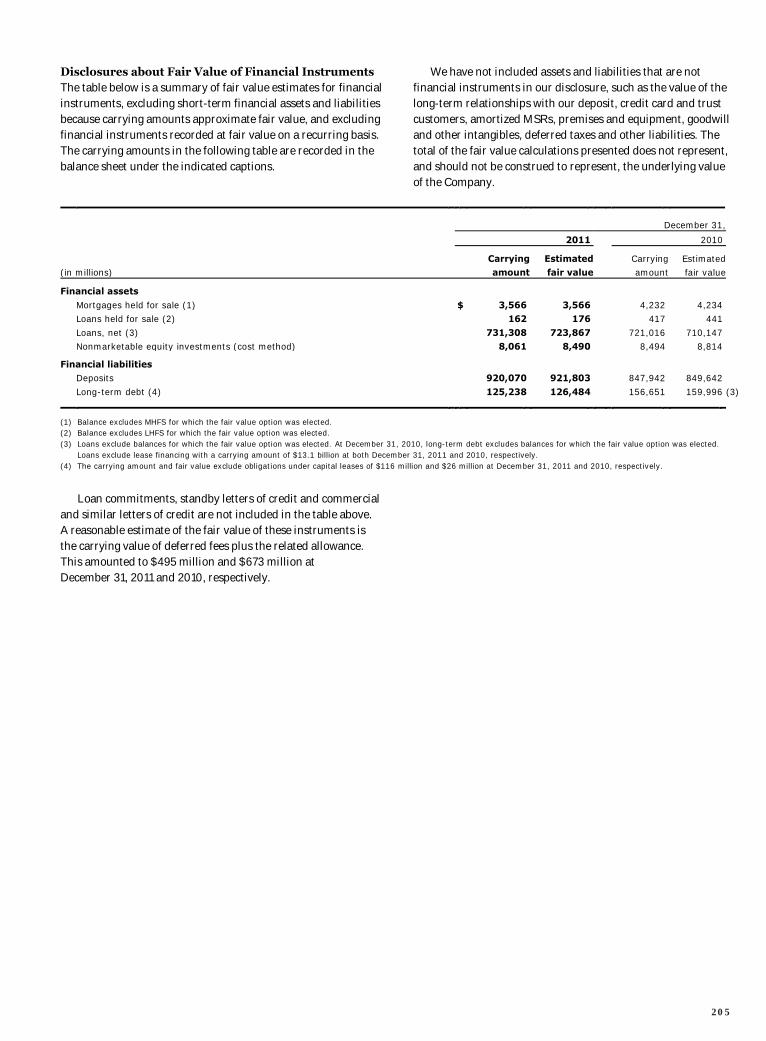
Disclosures about Fair Value of Financial Instruments The table below is a summary of fair value estimates for financial instruments, excluding short-term financial assets and liabilities because carrying amounts approximate fair value, and excluding financial instruments recorded at fair value on a recurring basis. The carrying amounts in the following table are recorded in the balance sheet under the indicated captions.
We have not included assets and liabilities that are not financial instruments in our disclosure, such as the value of the long-term relationships with our deposit, credit card and trust customers, amortized MSRs, premises and equipment, goodwill and other intangibles, deferred taxes and other liabilities. The total of the fair value calculations presented does not represent, and should not be construed to represent, the underlying value of the Company.
December 31,
2011 2010
Carrying Estimated Carrying Estimated (in millions) amount fair value amount fair value
Financial assets
Mortgages held for sale (1) $ 3,566 3,566 4,232 4,234 Loans held for sale (2) 162 176 417 441
Loans, net (3) 731,308 723,867 721,016 710,147 Nonmarketable equity investments (cost method) 8,061 8,490 8,494 8,814
Financial liabilities Deposits 920,070 921,803 847,942 849,642
Long-term debt (4) 125,238 126,484 156,651 159,996 (3)
(1) Balance excludes MHFS for which the fair value option was elected. (2) Balance excludes LHFS for which the fair value option was elected. (3) Loans exclude balances for which the fair value option was elected. At December 31, 2010, long-term debt excludes balances for which the fair value option was elected.
Loans exclude lease financing with a carrying amount of $13.1 billion at both December 31, 2011 and 2010, respectively. (4) The carrying amount and fair value exclude obligations under capital leases of $116 million and $26 million at December 31, 2011 and 2010, respectively.
Loan commitments, standby letters of credit and commercial and similar letters of credit are not included in the table above. A reasonable estimate of the fair value of these instruments is the carrying value of deferred fees plus the related allowance. This amounted to $495 million and $673 million at December 31, 2011 and 2010, respectively.
205
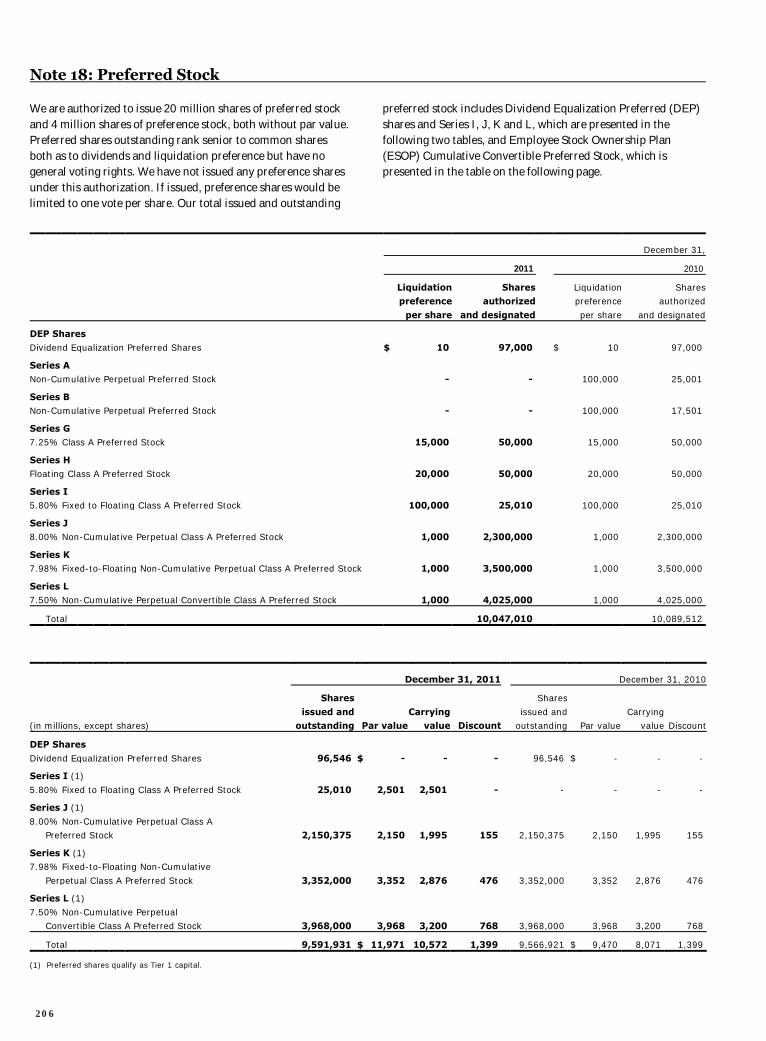
Note 18: Preferred Stock
We are authorized to issue 20 million shares of preferred stock and 4 million shares of preference stock, both without par value. Preferred shares outstanding rank senior to common shares both as to dividends and liquidation preference but have no general voting rights. We have not issued any preference shares under this authorization. If issued, preference shares would be limited to one vote per share. Our total issued and outstanding
preferred stock includes Dividend Equalization Preferred (DEP) shares and Series I, J, K and L, which are presented in the following two tables, and Employee Stock Ownership Plan (ESOP) Cumulative Convertible Preferred Stock, which is presented in the table on the following page.
December 31,
2011 2010
Liquidation Shares Liquidation Shares preference authorized preference authorized
per share and designated per share and designated
DEP Shares Dividend Equalization Preferred Shares $ 10 97,000 $ 10 97,000
Series A Non-Cumulative Perpetual Preferred Stock - - 100,000 25,001
Series B Non-Cumulative Perpetual Preferred Stock - - 100,000 17,501
Series G 7.25% Class A Preferred Stock 15,000 50,000 15,000 50,000
Series H Floating Class A Preferred Stock 20,000 50,000 20,000 50,000
Series I 5.80% Fixed to Floating Class A Preferred Stock 100,000 25,010 100,000 25,010
Series J 8.00% Non-Cumulative Perpetual Class A Preferred Stock 1,000 2,300,000 1,000 2,300,000
Series K 7.98% Fixed-to-Floating Non-Cumulative Perpetual Class A Preferred Stock 1,000 3,500,000 1,000 3,500,000
Series L 7.50% Non-Cumulative Perpetual Convertible Class A Preferred Stock 1,000 4,025,000 1,000 4,025,000
Total 10,047,010 10,089,512
December 31, 2011 December 31, 2010
Shares Shares
issued and Carrying issued and Carrying (in millions, except shares) outstanding Par value value Discount outstanding Par value value Discount
DEP Shares
Dividend Equalization Preferred Shares 96,546 $ - - - 96,546 $ - - -
Series I (1)
5.80% Fixed to Floating Class A Preferred Stock 25,010 2,501 2,501 - - - - -
Series J (1)
8.00% Non-Cumulative Perpetual Class A Preferred Stock 2,150,375 2,150 1,995 155 2,150,375 2,150 1,995 155
Series K (1) 7.98% Fixed-to-Floating Non-Cumulative
Perpetual Class A Preferred Stock 3,352,000 3,352 2,876 476 3,352,000 3,352 2,876 476
Series L (1)
7.50% Non-Cumulative Perpetual Convertible Class A Preferred Stock 3,968,000 3,968 3,200 768 3,968,000 3,968 3,200 768
Total 9,591,931 $ 11,971 10,572 1,399 9,566,921 $ 9,470 8,071 1,399
(1) Preferred shares qualify as Tier 1 capital.
206
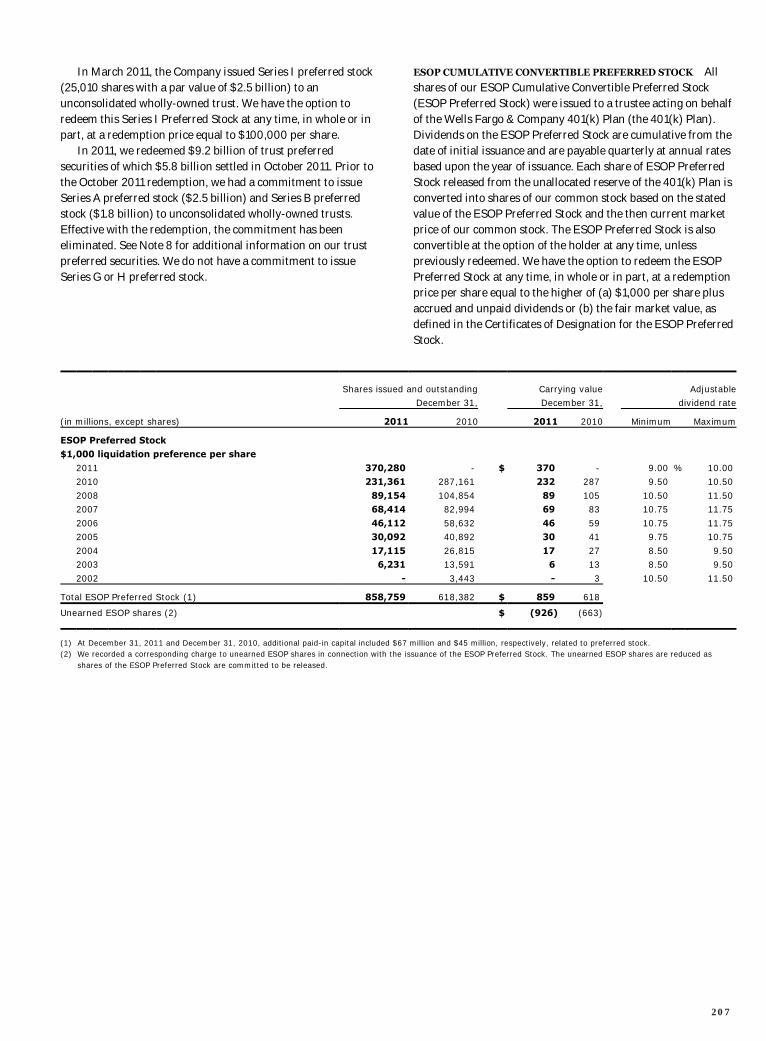
In March 2011, the Company issued Series I preferred stock (25,010 shares with a par value of $2.5 billion) to an unconsolidated wholly-owned trust. We have the option to redeem this Series I Preferred Stock at any time, in whole or in part, at a redemption price equal to $100,000 per share.
In 2011, we redeemed $9.2 billion of trust preferred securities of which $5.8 billion settled in October 2011. Prior to the October 2011 redemption, we had a commitment to issue Series A preferred stock ($2.5 billion) and Series B preferred stock ($1.8 billion) to unconsolidated wholly-owned trusts. Effective with the redemption, the commitment has been eliminated. See Note 8 for additional information on our trust preferred securities. We do not have a commitment to issue Series G or H preferred stock.
ESOP CUMULATIVE CONVERTIBLE PREFERRED STOCK All shares of our ESOP Cumulative Convertible Preferred Stock (ESOP Preferred Stock) were issued to a trustee acting on behalf of the Wells Fargo & Company 401(k) Plan (the 401(k) Plan). Dividends on the ESOP Preferred Stock are cumulative from the date of initial issuance and are payable quarterly at annual rates based upon the year of issuance. Each share of ESOP Preferred Stock released from the unallocated reserve of the 401(k) Plan is converted into shares of our common stock based on the stated value of the ESOP Preferred Stock and the then current market price of our common stock. The ESOP Preferred Stock is also convertible at the option of the holder at any time, unless previously redeemed. We have the option to redeem the ESOP Preferred Stock at any time, in whole or in part, at a redemption price per share equal to the higher of (a) $1,000 per share plus accrued and unpaid dividends or (b) the fair market value, as defined in the Certificates of Designation for the ESOP Preferred Stock.
Shares issued and outstanding Carrying value Adjustable December 31, December 31, dividend rate
(in millions, except shares) 2011 2010 2011 2010 Minimum Maximum
ESOP Preferred Stock $1,000 liquidation preference per share
2011 370,280 - $ 370 - 9.00 % 10.00 2010 231,361 287,161 232 287 9.50 10.50
2008 89,154 104,854 89 105 10.50 11.50 2007 68,414 82,994 69 83 10.75 11.75
2006 46,112 58,632 46 59 10.75 11.75 2005 30,092 40,892 30 41 9.75 10.75
2004 17,115 26,815 17 27 8.50 9.50 2003 6,231 13,591 6 13 8.50 9.50
2002 - 3,443 - 3 10.50 11.50
Total ESOP Preferred Stock (1) 858,759 618,382 $ 859 618
Unearned ESOP shares (2) $ (926) (663)
(1) At December 31, 2011 and December 31, 2010, additional paid-in capital included $67 million and $45 million, respectively, related to preferred stock. (2) We recorded a corresponding charge to unearned ESOP shares in connection with the issuance of the ESOP Preferred Stock. The unearned ESOP shares are reduced as
shares of the ESOP Preferred Stock are committed to be released.
207
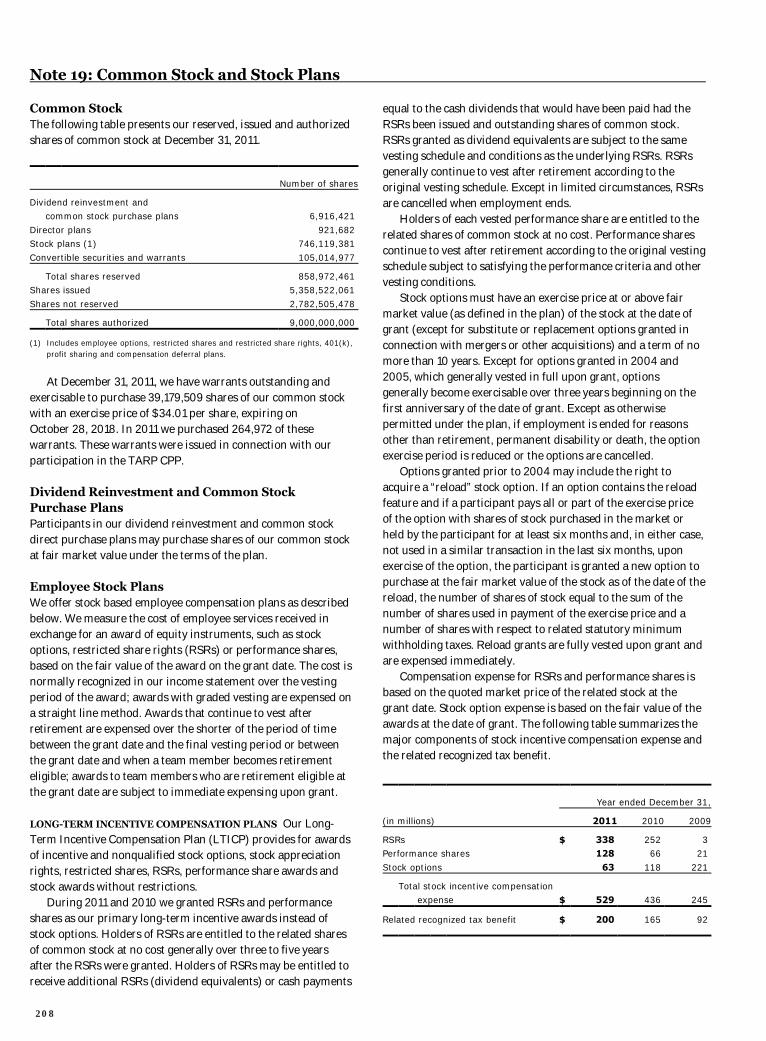
Note 19: Common Stock and Stock Plans
Common Stock The following table presents our reserved, issued and authorized shares of common stock at December 31, 2011.
Number of shares
Dividend reinvestment and common stock purchase plans 6,916,421
Director plans 921,682 Stock plans (1) 746,119,381
Convertible securities and warrants 105,014,977
Total shares reserved 858,972,461 Shares issued 5,358,522,061
Shares not reserved 2,782,505,478
Total shares authorized 9,000,000,000
(1) Includes employee options, restricted shares and restricted share rights, 401(k), profit sharing and compensation deferral plans.
At December 31, 2011, we have warrants outstanding and exercisable to purchase 39,179,509 shares of our common stock with an exercise price of $34.01 per share, expiring on October 28, 2018. In 2011 we purchased 264,972 of these warrants. These warrants were issued in connection with our participation in the TARP CPP. Dividend Reinvestment and Common Stock Purchase Plans Participants in our dividend reinvestment and common stock direct purchase plans may purchase shares of our common stock at fair market value under the terms of the plan.
Employee Stock Plans We offer stock based employee compensation plans as described below. We measure the cost of employee services received in exchange for an award of equity instruments, such as stock options, restricted share rights (RSRs) or performance shares, based on the fair value of the award on the grant date. The cost is normally recognized in our income statement over the vesting period of the award; awards with graded vesting are expensed on a straight line method. Awards that continue to vest after retirement are expensed over the shorter of the period of time between the grant date and the final vesting period or between the grant date and when a team member becomes retirement eligible; awards to team members who are retirement eligible at the grant date are subject to immediate expensing upon grant. LONG-TERM INCENTIVE COMPENSATION PLANS Our Long- Term Incentive Compensation Plan (LTICP) provides for awards of incentive and nonqualified stock options, stock appreciation rights, restricted shares, RSRs, performance share awards and stock awards without restrictions. During 2011 and 2010 we granted RSRs and performance shares as our primary long-term incentive awards instead of stock options. Holders of RSRs are entitled to the related shares of common stock at no cost generally over three to five years after the RSRs were granted. Holders of RSRs may be entitled to receive additional RSRs (dividend equivalents) or cash payments
equal to the cash dividends that would have been paid had the RSRs been issued and outstanding shares of common stock. RSRs granted as dividend equivalents are subject to the same vesting schedule and conditions as the underlying RSRs. RSRs generally continue to vest after retirement according to the original vesting schedule. Except in limited circumstances, RSRs are cancelled when employment ends. Holders of each vested performance share are entitled to the related shares of common stock at no cost. Performance shares continue to vest after retirement according to the original vesting schedule subject to satisfying the performance criteria and other vesting conditions. Stock options must have an exercise price at or above fair market value (as defined in the plan) of the stock at the date of grant (except for substitute or replacement options granted in connection with mergers or other acquisitions) and a term of no more than 10 years. Except for options granted in 2004 and 2005, which generally vested in full upon grant, options generally become exercisable over three years beginning on the first anniversary of the date of grant. Except as otherwise permitted under the plan, if employment is ended for reasons other than retirement, permanent disability or death, the option exercise period is reduced or the options are cancelled. Options granted prior to 2004 may include the right to acquire a “reload” stock option. If an option contains the reload feature and if a participant pays all or part of the exercise price of the option with shares of stock purchased in the market or held by the participant for at least six months and, in either case, not used in a similar transaction in the last six months, upon exercise of the option, the participant is granted a new option to purchase at the fair market value of the stock as of the date of the reload, the number of shares of stock equal to the sum of the number of shares used in payment of the exercise price and a number of shares with respect to related statutory minimum withholding taxes. Reload grants are fully vested upon grant and are expensed immediately. Compensation expense for RSRs and performance shares is based on the quoted market price of the related stock at the grant date. Stock option expense is based on the fair value of the awards at the date of grant. The following table summarizes the major components of stock incentive compensation expense and the related recognized tax benefit.
Year ended December 31,
(in millions) 2011 2010 2009
RSRs $ 338 252 3 Performance shares 128 66 21
Stock options 63 118 221
Total stock incentive compensation expense $ 529 436 245
Related recognized tax benefit $ 200 165 92
208
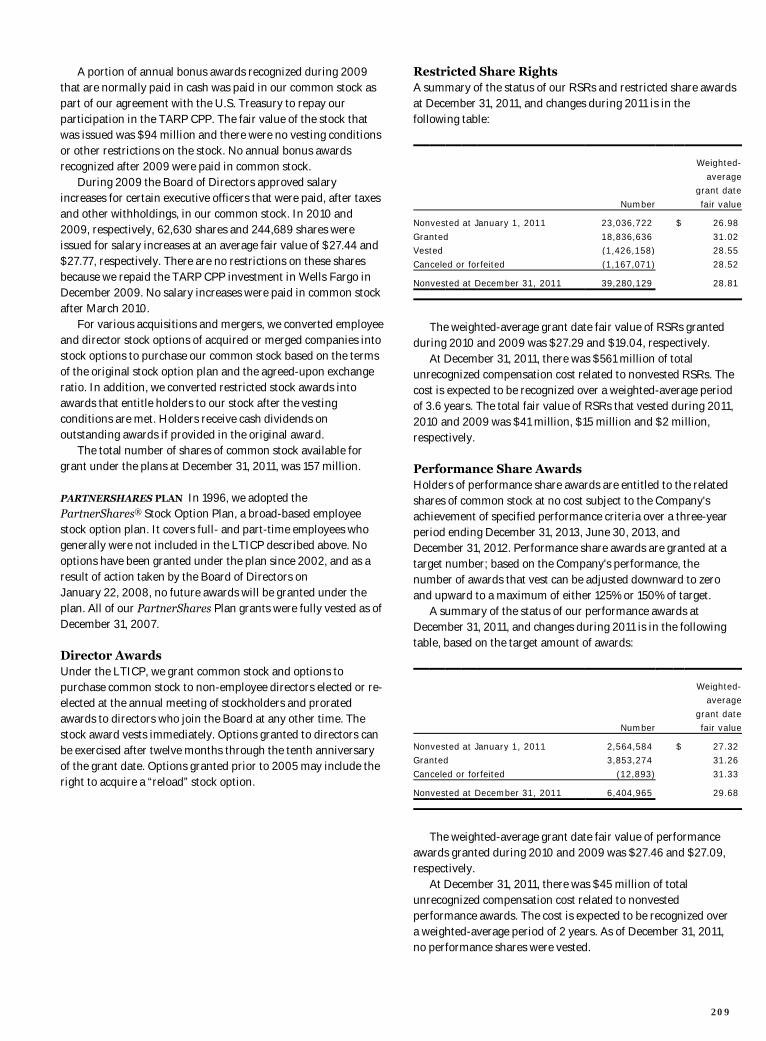
A portion of annual bonus awards recognized during 2009 that are normally paid in cash was paid in our common stock as part of our agreement with the U.S. Treasury to repay our participation in the TARP CPP. The fair value of the stock that was issued was $94 million and there were no vesting conditions or other restrictions on the stock. No annual bonus awards recognized after 2009 were paid in common stock. During 2009 the Board of Directors approved salary increases for certain executive officers that were paid, after taxes and other withholdings, in our common stock. In 2010 and 2009, respectively, 62,630 shares and 244,689 shares were issued for salary increases at an average fair value of $27.44 and $27.77, respectively. There are no restrictions on these shares because we repaid the TARP CPP investment in Wells Fargo in December 2009. No salary increases were paid in common stock after March 2010. For various acquisitions and mergers, we converted employee and director stock options of acquired or merged companies into stock options to purchase our common stock based on the terms of the original stock option plan and the agreed-upon exchange ratio. In addition, we converted restricted stock awards into awards that entitle holders to our stock after the vesting conditions are met. Holders receive cash dividends on outstanding awards if provided in the original award. The total number of shares of common stock available for grant under the plans at December 31, 2011, was 157 million.
PARTNERSHARES PLAN In 1996, we adopted the PartnerShares® Stock Option Plan, a broad-based employee stock option plan. It covers full- and part-time employees who generally were not included in the LTICP described above. No options have been granted under the plan since 2002, and as a result of action taken by the Board of Directors on January 22, 2008, no future awards will be granted under the plan. All of our PartnerShares Plan grants were fully vested as of December 31, 2007. Director Awards Under the LTICP, we grant common stock and options to purchase common stock to non-employee directors elected or re-elected at the annual meeting of stockholders and prorated awards to directors who join the Board at any other time. The stock award vests immediately. Options granted to directors can be exercised after twelve months through the tenth anniversary of the grant date. Options granted prior to 2005 may include the right to acquire a “reload” stock option.
Restricted Share Rights A summary of the status of our RSRs and restricted share awards at December 31, 2011, and changes during 2011 is in the following table:
Weighted-
average grant date
Number fair value
Nonvested at January 1, 2011 23,036,722 $ 26.98
Granted 18,836,636 31.02 Vested (1,426,158) 28.55
Canceled or forfeited (1,167,071) 28.52
Nonvested at December 31, 2011 39,280,129 28.81
The weighted-average grant date fair value of RSRs granted during 2010 and 2009 was $27.29 and $19.04, respectively. At December 31, 2011, there was $561 million of total unrecognized compensation cost related to nonvested RSRs. The cost is expected to be recognized over a weighted-average period of 3.6 years. The total fair value of RSRs that vested during 2011, 2010 and 2009 was $41 million, $15 million and $2 million, respectively. Performance Share Awards Holders of performance share awards are entitled to the related shares of common stock at no cost subject to the Company's achievement of specified performance criteria over a three-year period ending December 31, 2013, June 30, 2013, and December 31, 2012. Performance share awards are granted at a target number; based on the Company's performance, the number of awards that vest can be adjusted downward to zero and upward to a maximum of either 125% or 150% of target. A summary of the status of our performance awards at December 31, 2011, and changes during 2011 is in the following table, based on the target amount of awards:
Weighted- average
grant date Number fair value
Nonvested at January 1, 2011 2,564,584 $ 27.32 Granted 3,853,274 31.26
Canceled or forfeited (12,893) 31.33
Nonvested at December 31, 2011 6,404,965 29.68
The weighted-average grant date fair value of performance awards granted during 2010 and 2009 was $27.46 and $27.09, respectively. At December 31, 2011, there was $45 million of total unrecognized compensation cost related to nonvested performance awards. The cost is expected to be recognized over a weighted-average period of 2 years. As of December 31, 2011, no performance shares were vested.
209
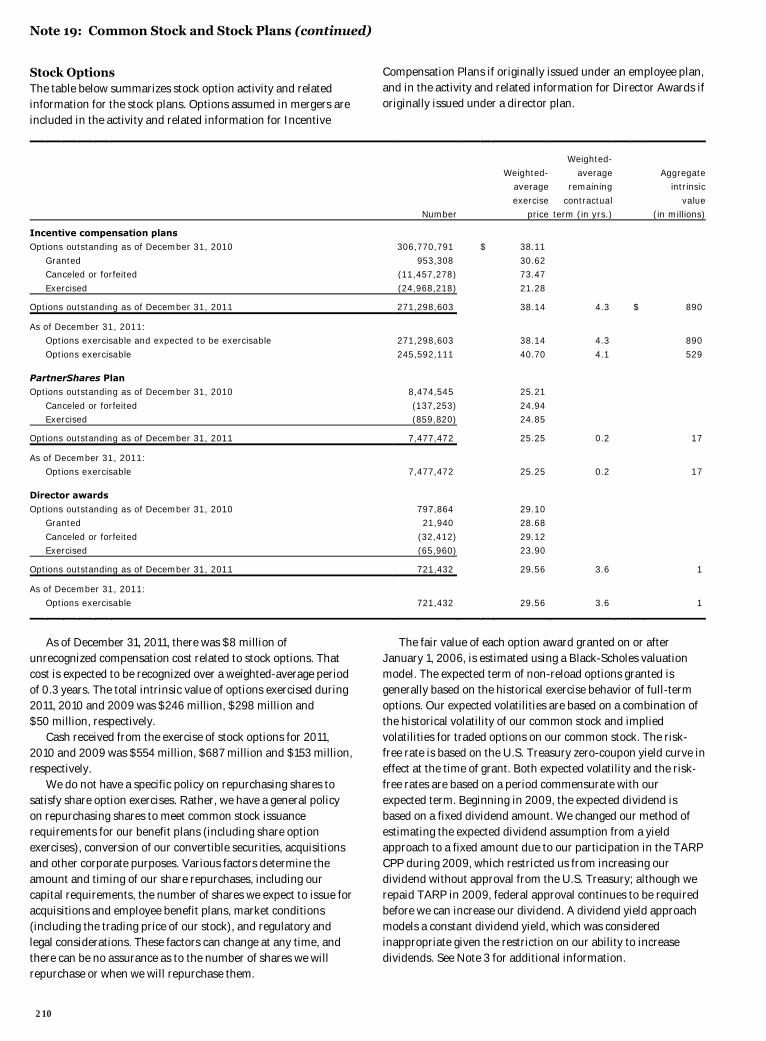
Note 19: Common Stock and Stock Plans (continued)
Stock Options The table below summarizes stock option activity and related information for the stock plans. Options assumed in mergers are included in the activity and related information for Incentive
Compensation Plans if originally issued under an employee plan, and in the activity and related information for Director Awards if originally issued under a director plan.
Weighted-
Weighted- average Aggregate average remaining intrinsic
exercise contractual value Number price term (in yrs.) (in millions)
Incentive compensation plans Options outstanding as of December 31, 2010 306,770,791 $ 38.11
Granted 953,308 30.62 Canceled or forfeited (11,457,278) 73.47
Exercised (24,968,218) 21.28
Options outstanding as of December 31, 2011 271,298,603 38.14 4.3 $ 890
As of December 31, 2011: Options exercisable and expected to be exercisable 271,298,603 38.14 4.3 890
Options exercisable 245,592,111 40.70 4.1 529 PartnerShares Plan Options outstanding as of December 31, 2010 8,474,545 25.21
Canceled or forfeited (137,253) 24.94 Exercised (859,820) 24.85
Options outstanding as of December 31, 2011 7,477,472 25.25 0.2 17
As of December 31, 2011: Options exercisable 7,477,472 25.25 0.2 17 Director awards
Options outstanding as of December 31, 2010 797,864 29.10 Granted 21,940 28.68
Canceled or forfeited (32,412) 29.12 Exercised (65,960) 23.90
Options outstanding as of December 31, 2011 721,432 29.56 3.6 1
As of December 31, 2011:
Options exercisable 721,432 29.56 3.6 1 As of December 31, 2011, there was $8 million of unrecognized compensation cost related to stock options. That cost is expected to be recognized over a weighted-average period of 0.3 years. The total intrinsic value of options exercised during 2011, 2010 and 2009 was $246 million, $298 million and $50 million, respectively. Cash received from the exercise of stock options for 2011, 2010 and 2009 was $554 million, $687 million and $153 million, respectively. We do not have a specific policy on repurchasing shares to satisfy share option exercises. Rather, we have a general policy on repurchasing shares to meet common stock issuance requirements for our benefit plans (including share option exercises), conversion of our convertible securities, acquisitions and other corporate purposes. Various factors determine the amount and timing of our share repurchases, including our capital requirements, the number of shares we expect to issue for acquisitions and employee benefit plans, market conditions (including the trading price of our stock), and regulatory and legal considerations. These factors can change at any time, and there can be no assurance as to the number of shares we will repurchase or when we will repurchase them.
The fair value of each option award granted on or after January 1, 2006, is estimated using a Black-Scholes valuation model. The expected term of non-reload options granted is generally based on the historical exercise behavior of full-term options. Our expected volatilities are based on a combination of the historical volatility of our common stock and implied volatilities for traded options on our common stock. The risk-free rate is based on the U.S. Treasury zero-coupon yield curve in effect at the time of grant. Both expected volatility and the risk-free rates are based on a period commensurate with our expected term. Beginning in 2009, the expected dividend is based on a fixed dividend amount. We changed our method of estimating the expected dividend assumption from a yield approach to a fixed amount due to our participation in the TARP CPP during 2009, which restricted us from increasing our dividend without approval from the U.S. Treasury; although we repaid TARP in 2009, federal approval continues to be required before we can increase our dividend. A dividend yield approach models a constant dividend yield, which was considered inappropriate given the restriction on our ability to increase dividends. See Note 3 for additional information.
210
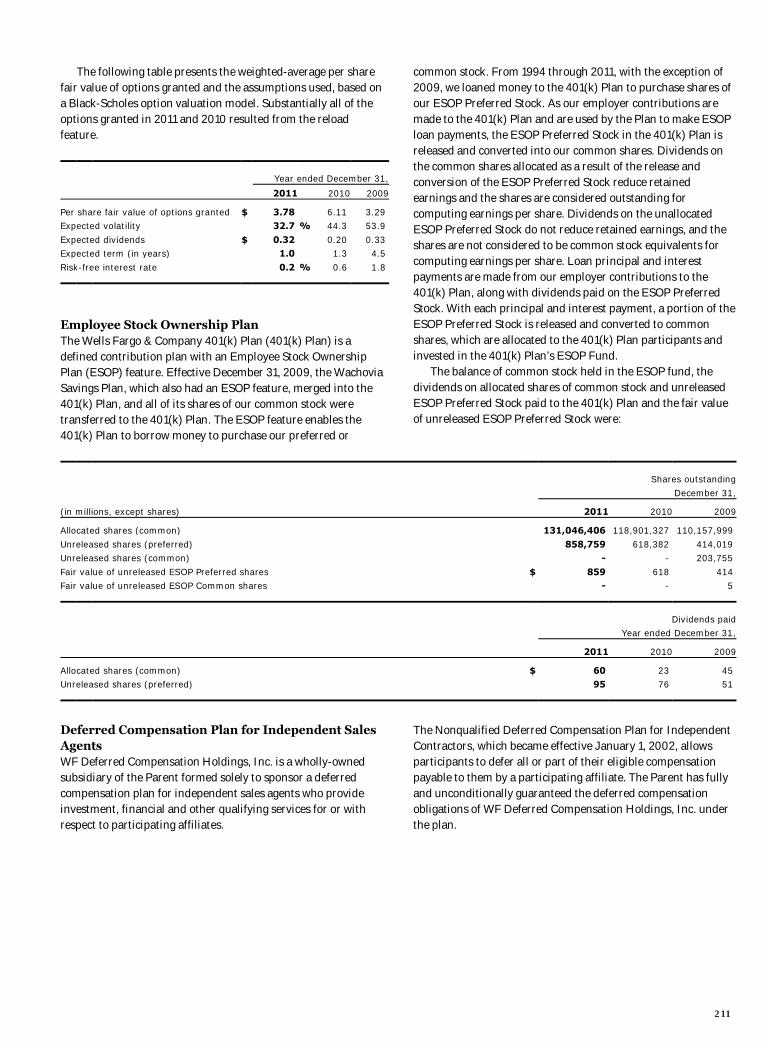
The following table presents the weighted-average per share fair value of options granted and the assumptions used, based on a Black-Scholes option valuation model. Substantially all of the options granted in 2011 and 2010 resulted from the reload feature.
Year ended December 31,
2011 2010 2009
Per share fair value of options granted $ 3.78 6.11 3.29 Expected volatility 32.7 % 44.3 53.9
Expected dividends $ 0.32 0.20 0.33 Expected term (in years) 1.0 1.3 4.5
Risk-free interest rate 0.2 % 0.6 1.8
Employee Stock Ownership Plan The Wells Fargo & Company 401(k) Plan (401(k) Plan) is a defined contribution plan with an Employee Stock Ownership Plan (ESOP) feature. Effective December 31, 2009, the Wachovia Savings Plan, which also had an ESOP feature, merged into the 401(k) Plan, and all of its shares of our common stock were transferred to the 401(k) Plan. The ESOP feature enables the 401(k) Plan to borrow money to purchase our preferred or
common stock. From 1994 through 2011, with the exception of 2009, we loaned money to the 401(k) Plan to purchase shares of our ESOP Preferred Stock. As our employer contributions are made to the 401(k) Plan and are used by the Plan to make ESOP loan payments, the ESOP Preferred Stock in the 401(k) Plan is released and converted into our common shares. Dividends on the common shares allocated as a result of the release and conversion of the ESOP Preferred Stock reduce retained earnings and the shares are considered outstanding for computing earnings per share. Dividends on the unallocated ESOP Preferred Stock do not reduce retained earnings, and the shares are not considered to be common stock equivalents for computing earnings per share. Loan principal and interest payments are made from our employer contributions to the 401(k) Plan, along with dividends paid on the ESOP Preferred Stock. With each principal and interest payment, a portion of the ESOP Preferred Stock is released and converted to common shares, which are allocated to the 401(k) Plan participants and invested in the 401(k) Plan’s ESOP Fund. The balance of common stock held in the ESOP fund, the dividends on allocated shares of common stock and unreleased ESOP Preferred Stock paid to the 401(k) Plan and the fair value of unreleased ESOP Preferred Stock were:
Shares outstanding
December 31,
(in millions, except shares) 2011 2010 2009
Allocated shares (common) 131,046,406 118,901,327 110,157,999
Unreleased shares (preferred) 858,759 618,382 414,019 Unreleased shares (common) - - 203,755
Fair value of unreleased ESOP Preferred shares $ 859 618 414 Fair value of unreleased ESOP Common shares - - 5
Dividends paid Year ended December 31,
2011 2010 2009
Allocated shares (common) $ 60 23 45 Unreleased shares (preferred) 95 76 51
Deferred Compensation Plan for Independent Sales Agents WF Deferred Compensation Holdings, Inc. is a wholly-owned subsidiary of the Parent formed solely to sponsor a deferred compensation plan for independent sales agents who provide investment, financial and other qualifying services for or with respect to participating affiliates.
The Nonqualified Deferred Compensation Plan for Independent Contractors, which became effective January 1, 2002, allows participants to defer all or part of their eligible compensation payable to them by a participating affiliate. The Parent has fully and unconditionally guaranteed the deferred compensation obligations of WF Deferred Compensation Holdings, Inc. under the plan.
211
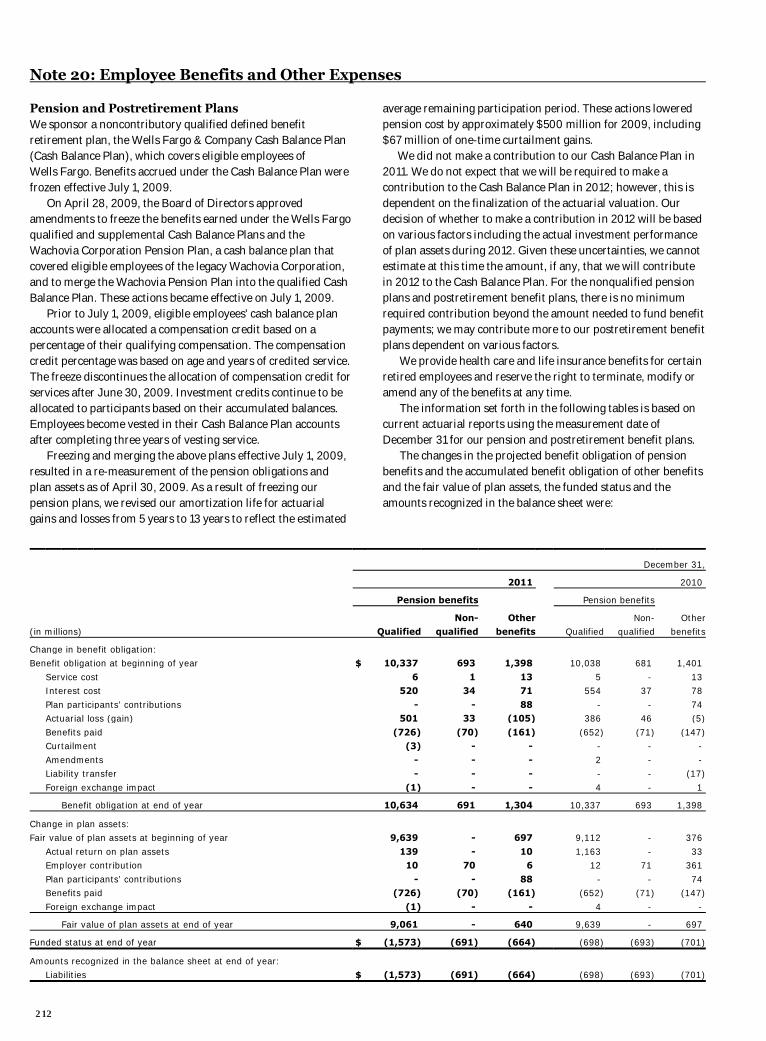
Note 20: Employee Benefits and Other Expenses
Pension and Postretirement Plans We sponsor a noncontributory qualified defined benefit retirement plan, the Wells Fargo & Company Cash Balance Plan (Cash Balance Plan), which covers eligible employees of Wells Fargo. Benefits accrued under the Cash Balance Plan were frozen effective July 1, 2009. On April 28, 2009, the Board of Directors approved amendments to freeze the benefits earned under the Wells Fargo qualified and supplemental Cash Balance Plans and the Wachovia Corporation Pension Plan, a cash balance plan that covered eligible employees of the legacy Wachovia Corporation, and to merge the Wachovia Pension Plan into the qualified Cash Balance Plan. These actions became effective on July 1, 2009. Prior to July 1, 2009, eligible employees' cash balance plan accounts were allocated a compensation credit based on a percentage of their qualifying compensation. The compensation credit percentage was based on age and years of credited service. The freeze discontinues the allocation of compensation credit for services after June 30, 2009. Investment credits continue to be allocated to participants based on their accumulated balances. Employees become vested in their Cash Balance Plan accounts after completing three years of vesting service. Freezing and merging the above plans effective July 1, 2009, resulted in a re-measurement of the pension obligations and plan assets as of April 30, 2009. As a result of freezing our pension plans, we revised our amortization life for actuarial gains and losses from 5 years to 13 years to reflect the estimated
average remaining participation period. These actions lowered pension cost by approximately $500 million for 2009, including $67 million of one-time curtailment gains.
We did not make a contribution to our Cash Balance Plan in 2011. We do not expect that we will be required to make a contribution to the Cash Balance Plan in 2012; however, this is dependent on the finalization of the actuarial valuation. Our decision of whether to make a contribution in 2012 will be based on various factors including the actual investment performance of plan assets during 2012. Given these uncertainties, we cannot estimate at this time the amount, if any, that we will contribute in 2012 to the Cash Balance Plan. For the nonqualified pension plans and postretirement benefit plans, there is no minimum required contribution beyond the amount needed to fund benefit payments; we may contribute more to our postretirement benefit plans dependent on various factors. We provide health care and life insurance benefits for certain retired employees and reserve the right to terminate, modify or amend any of the benefits at any time. The information set forth in the following tables is based on current actuarial reports using the measurement date of December 31 for our pension and postretirement benefit plans.
The changes in the projected benefit obligation of pension benefits and the accumulated benefit obligation of other benefits and the fair value of plan assets, the funded status and the amounts recognized in the balance sheet were:
December 31,
2011 2010
Pension benefits Pension benefits
Non- Other Non- Other (in millions) Qualified qualified benefits Qualified qualified benefits
Change in benefit obligation: Benefit obligation at beginning of year $ 10,337 693 1,398 10,038 681 1,401
Service cost 6 1 13 5 - 13 Interest cost 520 34 71 554 37 78
Plan participants’ contributions - - 88 - - 74 Actuarial loss (gain) 501 33 (105) 386 46 (5)
Benefits paid (726) (70) (161) (652) (71) (147) Curtailment (3) - - - - -
Amendments - - - 2 - - Liability transfer - - - - - (17)
Foreign exchange impact (1) - - 4 - 1
Benefit obligation at end of year 10,634 691 1,304 10,337 693 1,398
Change in plan assets: Fair value of plan assets at beginning of year 9,639 - 697 9,112 - 376
Actual return on plan assets 139 - 10 1,163 - 33 Employer contribution 10 70 6 12 71 361
Plan participants’ contributions - - 88 - - 74 Benefits paid (726) (70) (161) (652) (71) (147)
Foreign exchange impact (1) - - 4 - -
Fair value of plan assets at end of year 9,061 - 640 9,639 - 697
Funded status at end of year $ (1,573) (691) (664) (698) (693) (701)
Amounts recognized in the balance sheet at end of year: Liabilities $ (1,573) (691) (664) (698) (693) (701)
212
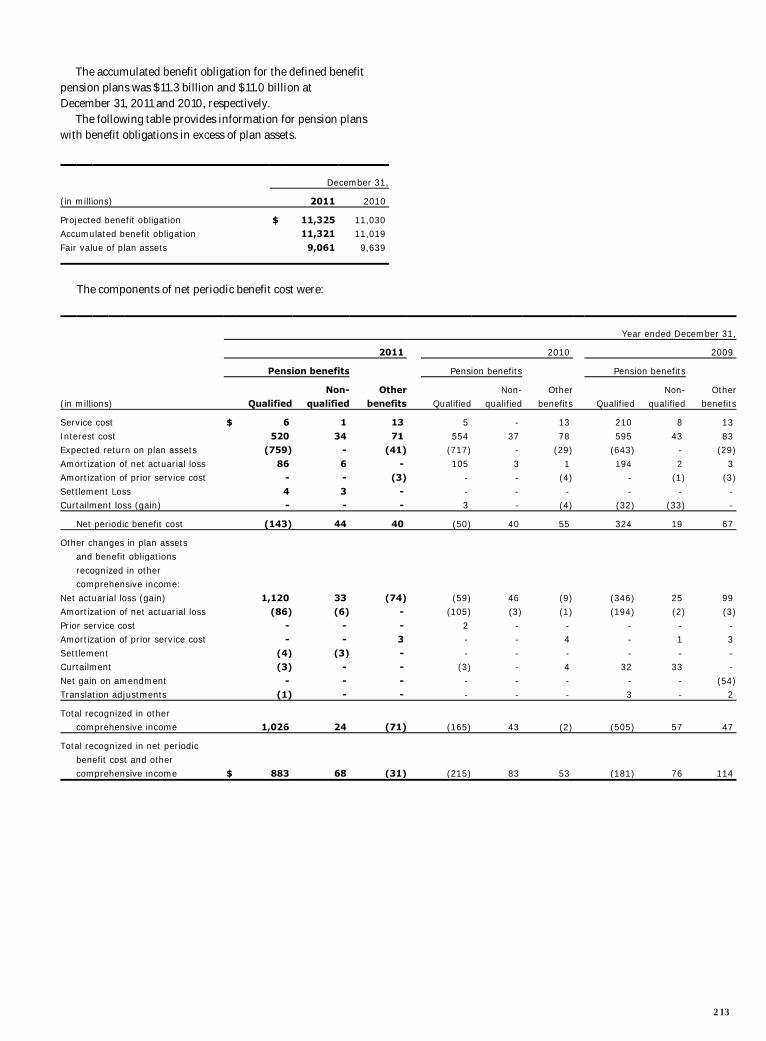
The accumulated benefit obligation for the defined benefit pension plans was $11.3 billion and $11.0 billion at December 31, 2011 and 2010, respectively.
The following table provides information for pension plans with benefit obligations in excess of plan assets.
December 31,
(in millions) 2011 2010
Projected benefit obligation $ 11,325 11,030 Accumulated benefit obligation 11,321 11,019
Fair value of plan assets 9,061 9,639
The components of net periodic benefit cost were:
Year ended December 31,
2011 2010 2009
Pension benefits Pension benefits Pension benefits
Non- Other Non- Other Non- Other(in millions) Qualified qualified benefits Qualified qualified benefits Qualified qualified benefits
Service cost $ 6 1 13 5 - 13 210 8 13
Interest cost 520 34 71 554 37 78 595 43 83 Expected return on plan assets (759) - (41) (717) - (29) (643) - (29)
Amortization of net actuarial loss 86 6 - 105 3 1 194 2 3 Amortization of prior service cost - - (3) - - (4) - (1) (3)
Settlement Loss 4 3 - - - - - - - Curtailment loss (gain) - - - 3 - (4) (32) (33) -
Net periodic benefit cost (143) 44 40 (50) 40 55 324 19 67
Other changes in plan assets and benefit obligations
recognized in other comprehensive income:
Net actuarial loss (gain) 1,120 33 (74) (59) 46 (9) (346) 25 99 Amortization of net actuarial loss (86) (6) - (105) (3) (1) (194) (2) (3)
Prior service cost - - - 2 - - - - - Amortization of prior service cost - - 3 - - 4 - 1 3
Settlement (4) (3) - - - - - - - Curtailment (3) - - (3) - 4 32 33 -
Net gain on amendment - - - - - - - - (54)Translation adjustments (1) - - - - - 3 - 2
Total recognized in other comprehensive income 1,026 24 (71) (165) 43 (2) (505) 57 47
Total recognized in net periodic
benefit cost and other comprehensive income $ 883 68 (31) (215) 83 53 (181) 76 114
213
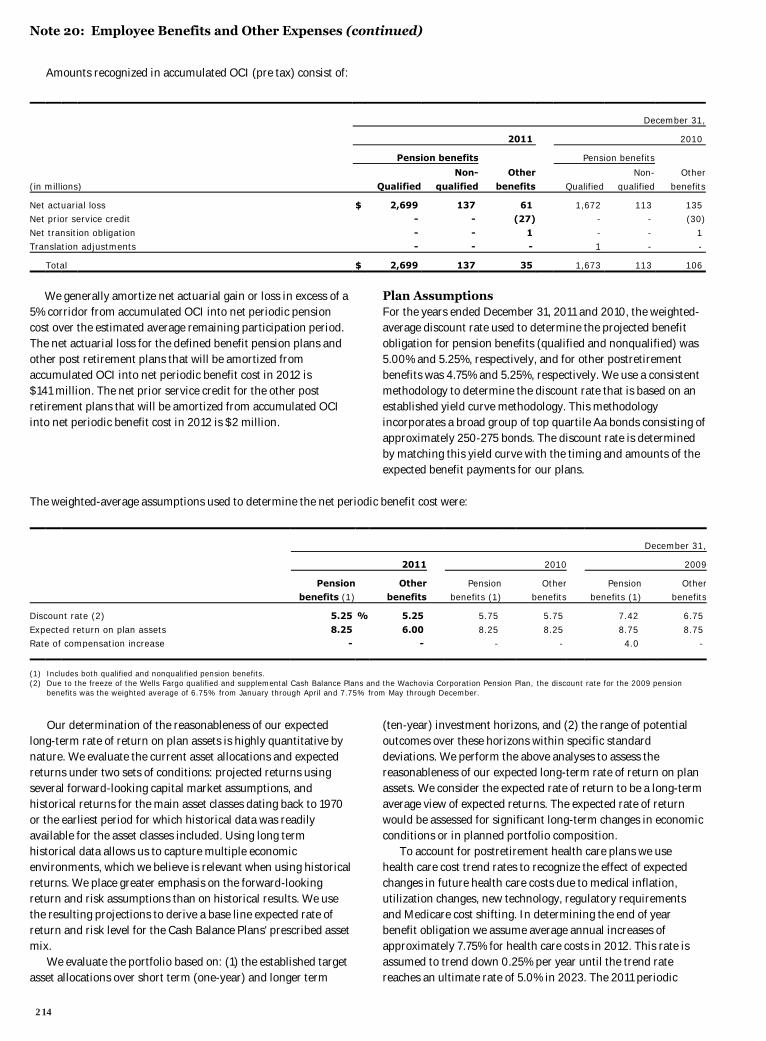
Note 20: Employee Benefits and Other Expenses (continued)
Amounts recognized in accumulated OCI (pre tax) consist of:
December 31,
2011 2010
Pension benefits Pension benefits
Non- Other Non- Other
(in millions) Qualified qualified benefits Qualified qualified benefits
Net actuarial loss $ 2,699 137 61 1,672 113 135 Net prior service credit - - (27) - - (30)
Net transition obligation - - 1 - - 1 Translation adjustments - - - 1 - -
Total $ 2,699 137 35 1,673 113 106
We generally amortize net actuarial gain or loss in excess of a
5% corridor from accumulated OCI into net periodic pension cost over the estimated average remaining participation period. The net actuarial loss for the defined benefit pension plans and other post retirement plans that will be amortized from accumulated OCI into net periodic benefit cost in 2012 is $141 million. The net prior service credit for the other post retirement plans that will be amortized from accumulated OCI into net periodic benefit cost in 2012 is $2 million.
Plan Assumptions For the years ended December 31, 2011 and 2010, the weighted-average discount rate used to determine the projected benefit obligation for pension benefits (qualified and nonqualified) was 5.00% and 5.25%, respectively, and for other postretirement benefits was 4.75% and 5.25%, respectively. We use a consistent methodology to determine the discount rate that is based on an established yield curve methodology. This methodology incorporates a broad group of top quartile Aa bonds consisting of approximately 250-275 bonds. The discount rate is determined by matching this yield curve with the timing and amounts of the expected benefit payments for our plans.
The weighted-average assumptions used to determine the net periodic benefit cost were:
December 31,
2011 2010 2009
Pension Other Pension Other Pension Other benefits (1) benefits benefits (1) benefits benefits (1) benefits
Discount rate (2) 5.25 % 5.25 5.75 5.75 7.42 6.75
Expected return on plan assets 8.25 6.00 8.25 8.25 8.75 8.75 Rate of compensation increase - - - - 4.0 -
(1) Includes both qualified and nonqualified pension benefits. (2) Due to the freeze of the Wells Fargo qualified and supplemental Cash Balance Plans and the Wachovia Corporation Pension Plan, the discount rate for the 2009 pension
benefits was the weighted average of 6.75% from January through April and 7.75% from May through December.
Our determination of the reasonableness of our expected long-term rate of return on plan assets is highly quantitative by nature. We evaluate the current asset allocations and expected returns under two sets of conditions: projected returns using several forward-looking capital market assumptions, and historical returns for the main asset classes dating back to 1970 or the earliest period for which historical data was readily available for the asset classes included. Using long term historical data allows us to capture multiple economic environments, which we believe is relevant when using historical returns. We place greater emphasis on the forward-looking return and risk assumptions than on historical results. We use the resulting projections to derive a base line expected rate of return and risk level for the Cash Balance Plans' prescribed asset mix. We evaluate the portfolio based on: (1) the established target asset allocations over short term (one-year) and longer term
(ten-year) investment horizons, and (2) the range of potential outcomes over these horizons within specific standard deviations. We perform the above analyses to assess the reasonableness of our expected long-term rate of return on plan assets. We consider the expected rate of return to be a long-term average view of expected returns. The expected rate of return would be assessed for significant long-term changes in economic conditions or in planned portfolio composition. To account for postretirement health care plans we use health care cost trend rates to recognize the effect of expected changes in future health care costs due to medical inflation, utilization changes, new technology, regulatory requirements and Medicare cost shifting. In determining the end of year benefit obligation we assume average annual increases of approximately 7.75% for health care costs in 2012. This rate is assumed to trend down 0.25% per year until the trend rate reaches an ultimate rate of 5.0% in 2023. The 2011 periodic
214
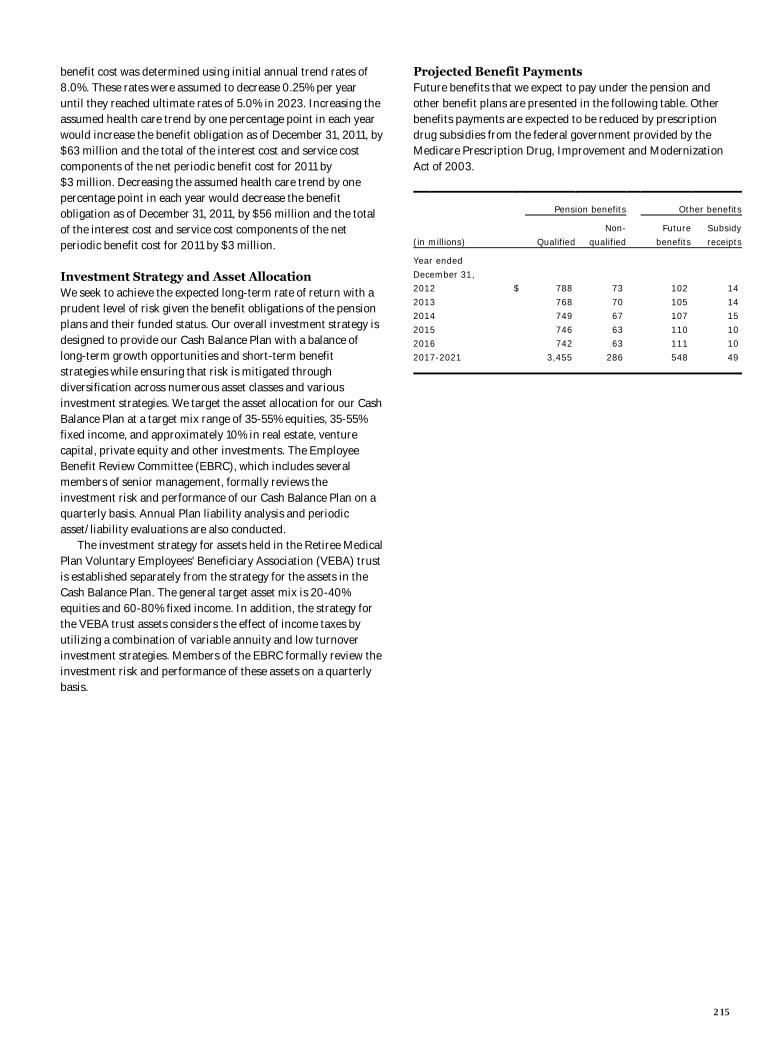
benefit cost was determined using initial annual trend rates of 8.0%. These rates were assumed to decrease 0.25% per year until they reached ultimate rates of 5.0% in 2023. Increasing the assumed health care trend by one percentage point in each year would increase the benefit obligation as of December 31, 2011, by $63 million and the total of the interest cost and service cost components of the net periodic benefit cost for 2011 by $3 million. Decreasing the assumed health care trend by one percentage point in each year would decrease the benefit obligation as of December 31, 2011, by $56 million and the total of the interest cost and service cost components of the net periodic benefit cost for 2011 by $3 million.
Investment Strategy and Asset Allocation We seek to achieve the expected long-term rate of return with a prudent level of risk given the benefit obligations of the pension plans and their funded status. Our overall investment strategy is designed to provide our Cash Balance Plan with a balance of long-term growth opportunities and short-term benefit strategies while ensuring that risk is mitigated through diversification across numerous asset classes and various investment strategies. We target the asset allocation for our Cash Balance Plan at a target mix range of 35-55% equities, 35-55% fixed income, and approximately 10% in real estate, venture capital, private equity and other investments. The Employee Benefit Review Committee (EBRC), which includes several members of senior management, formally reviews the investment risk and performance of our Cash Balance Plan on a quarterly basis. Annual Plan liability analysis and periodic asset/liability evaluations are also conducted. The investment strategy for assets held in the Retiree Medical Plan Voluntary Employees' Beneficiary Association (VEBA) trust is established separately from the strategy for the assets in the Cash Balance Plan. The general target asset mix is 20-40% equities and 60-80% fixed income. In addition, the strategy for the VEBA trust assets considers the effect of income taxes by utilizing a combination of variable annuity and low turnover investment strategies. Members of the EBRC formally review the investment risk and performance of these assets on a quarterly basis.
Projected Benefit Payments Future benefits that we expect to pay under the pension and other benefit plans are presented in the following table. Other benefits payments are expected to be reduced by prescription drug subsidies from the federal government provided by the Medicare Prescription Drug, Improvement and Modernization Act of 2003.
Pension benefits Other benefits
Non- Future Subsidy
(in millions) Qualified qualified benefits receipts
Year ended
December 31, 2012 $ 788 73 102 14
2013 768 70 105 14 2014 749 67 107 15
2015 746 63 110 10 2016 742 63 111 10
2017-2021 3,455 286 548 49
215
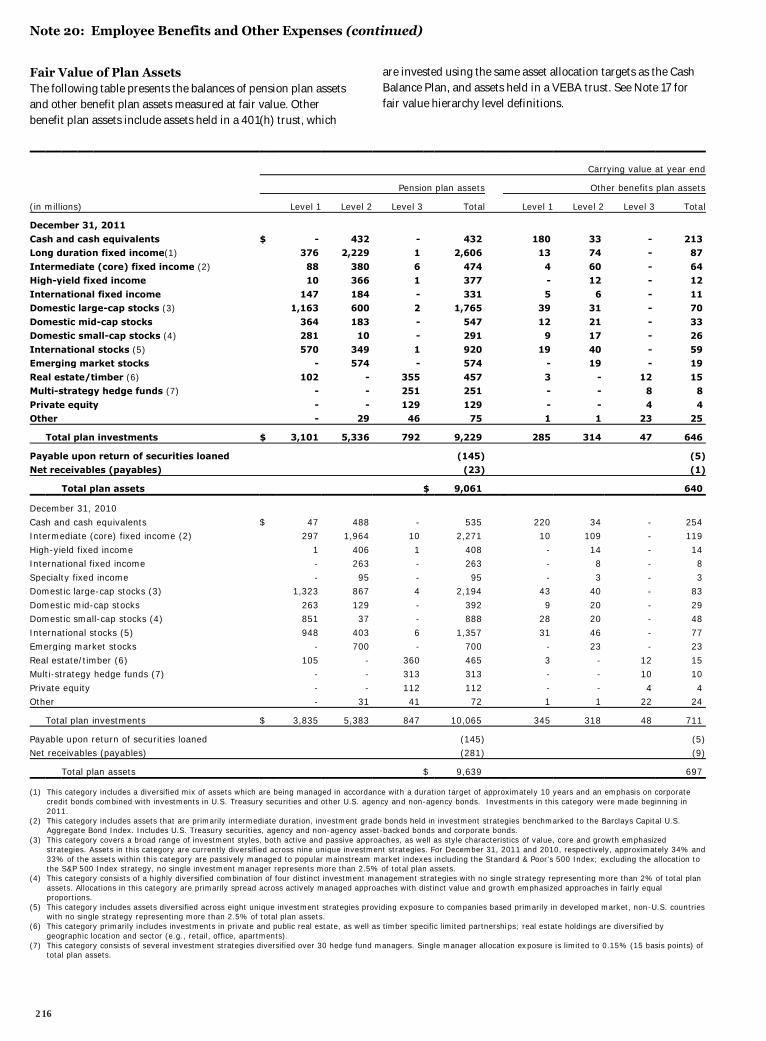
Note 20: Employee Benefits and Other Expenses (continued)
Fair Value of Plan Assets The following table presents the balances of pension plan assets and other benefit plan assets measured at fair value. Other benefit plan assets include assets held in a 401(h) trust, which
are invested using the same asset allocation targets as the Cash Balance Plan, and assets held in a VEBA trust. See Note 17 for fair value hierarchy level definitions.
Carrying value at year end
Pension plan assets Other benefits plan assets
(in millions) Level 1 Level 2 Level 3 Total Level 1 Level 2 Level 3 Total
December 31, 2011
Cash and cash equivalents $ - 432 - 432 180 33 - 213 Long duration fixed income(1) 376 2,229 1 2,606 13 74 - 87
Intermediate (core) fixed income (2) 88 380 6 474 4 60 - 64 High-yield fixed income 10 366 1 377 - 12 - 12
International fixed income 147 184 - 331 5 6 - 11 Domestic large-cap stocks (3) 1,163 600 2 1,765 39 31 - 70
Domestic mid-cap stocks 364 183 - 547 12 21 - 33 Domestic small-cap stocks (4) 281 10 - 291 9 17 - 26
International stocks (5) 570 349 1 920 19 40 - 59 Emerging market stocks - 574 - 574 - 19 - 19
Real estate/timber (6) 102 - 355 457 3 - 12 15 Multi-strategy hedge funds (7) - - 251 251 - - 8 8
Private equity - - 129 129 - - 4 4 Other - 29 46 75 1 1 23 25
Total plan investments $ 3,101 5,336 792 9,229 285 314 47 646
Payable upon return of securities loaned (145) (5) Net receivables (payables) (23) (1)
Total plan assets $ 9,061 640
December 31, 2010
Cash and cash equivalents $ 47 488 - 535 220 34 - 254 Intermediate (core) fixed income (2) 297 1,964 10 2,271 10 109 - 119
High-yield fixed income 1 406 1 408 - 14 - 14 International fixed income - 263 - 263 - 8 - 8
Specialty fixed income - 95 - 95 - 3 - 3 Domestic large-cap stocks (3) 1,323 867 4 2,194 43 40 - 83
Domestic mid-cap stocks 263 129 - 392 9 20 - 29 Domestic small-cap stocks (4) 851 37 - 888 28 20 - 48
International stocks (5) 948 403 6 1,357 31 46 - 77 Emerging market stocks - 700 - 700 - 23 - 23
Real estate/timber (6) 105 - 360 465 3 - 12 15 Multi-strategy hedge funds (7) - - 313 313 - - 10 10
Private equity - - 112 112 - - 4 4 Other - 31 41 72 1 1 22 24
Total plan investments $ 3,835 5,383 847 10,065 345 318 48 711
Payable upon return of securities loaned (145) (5) Net receivables (payables) (281) (9)
Total plan assets $ 9,639 697
(1) This category includes a diversified mix of assets which are being managed in accordance with a duration target of approximately 10 years and an emphasis on corporate credit bonds combined with investments in U.S. Treasury securities and other U.S. agency and non-agency bonds. Investments in this category were made beginning in 2011.
(2) This category includes assets that are primarily intermediate duration, investment grade bonds held in investment strategies benchmarked to the Barclays Capital U.S. Aggregate Bond Index. Includes U.S. Treasury securities, agency and non-agency asset-backed bonds and corporate bonds.
(3) This category covers a broad range of investment styles, both active and passive approaches, as well as style characteristics of value, core and growth emphasized strategies. Assets in this category are currently diversified across nine unique investment strategies. For December 31, 2011 and 2010, respectively, approximately 34% and 33% of the assets within this category are passively managed to popular mainstream market indexes including the Standard & Poor's 500 Index; excluding the allocation to the S&P 500 Index strategy, no single investment manager represents more than 2.5% of total plan assets.
(4) This category consists of a highly diversified combination of four distinct investment management strategies with no single strategy representing more than 2% of total plan assets. Allocations in this category are primarily spread across actively managed approaches with distinct value and growth emphasized approaches in fairly equal proportions.
(5) This category includes assets diversified across eight unique investment strategies providing exposure to companies based primarily in developed market, non-U.S. countries with no single strategy representing more than 2.5% of total plan assets.
(6) This category primarily includes investments in private and public real estate, as well as timber specific limited partnerships; real estate holdings are diversified by geographic location and sector (e.g., retail, office, apartments).
(7) This category consists of several investment strategies diversified over 30 hedge fund managers. Single manager allocation exposure is limited to 0.15% (15 basis points) of total plan assets.
216
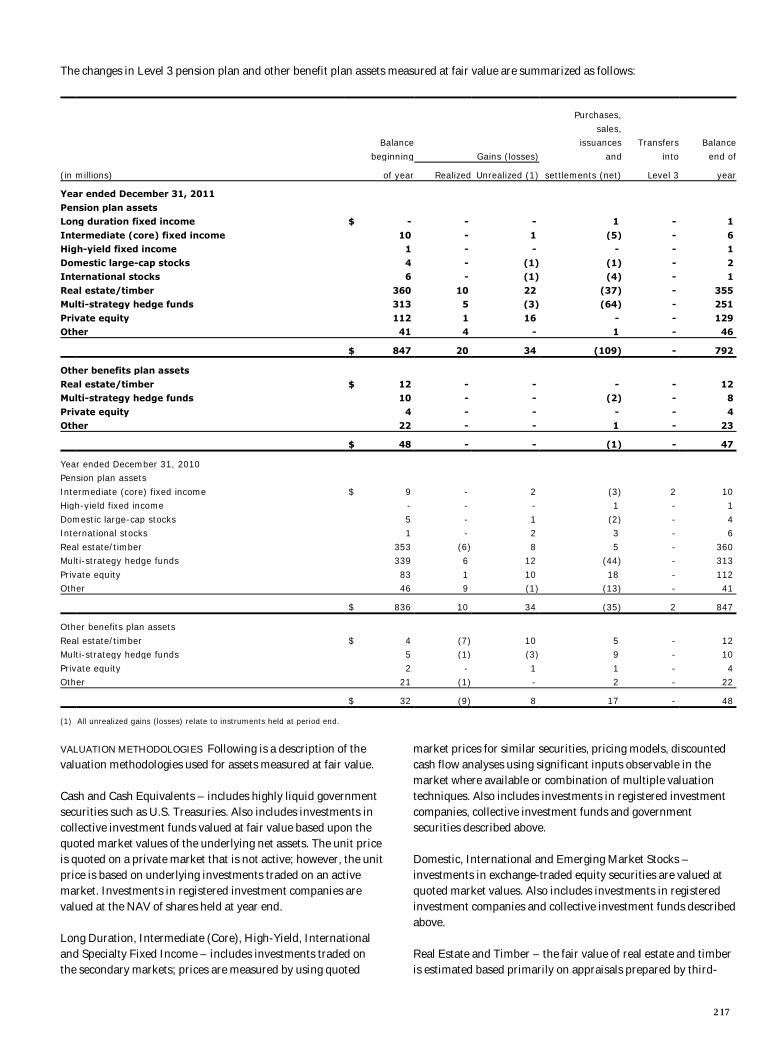
The changes in Level 3 pension plan and other benefit plan assets measured at fair value are summarized as follows:
Purchases,
sales, Balance issuances Transfers Balance
beginning Gains (losses) and into end of
(in millions) of year Realized Unrealized (1) settlements (net) Level 3 year
Year ended December 31, 2011
Pension plan assets Long duration fixed income $ - - - 1 - 1
Intermediate (core) fixed income 10 - 1 (5) - 6 High-yield fixed income 1 - - - - 1
Domestic large-cap stocks 4 - (1) (1) - 2 International stocks 6 - (1) (4) - 1
Real estate/timber 360 10 22 (37) - 355 Multi-strategy hedge funds 313 5 (3) (64) - 251
Private equity 112 1 16 - - 129 Other 41 4 - 1 - 46
$ 847 20 34 (109) - 792
Other benefits plan assets
Real estate/timber $ 12 - - - - 12 Multi-strategy hedge funds 10 - - (2) - 8
Private equity 4 - - - - 4 Other 22 - - 1 - 23
$ 48 - - (1) - 47
Year ended December 31, 2010 Pension plan assets
Intermediate (core) fixed income $ 9 - 2 (3) 2 10 High-yield fixed income - - - 1 - 1
Domestic large-cap stocks 5 - 1 (2) - 4 International stocks 1 - 2 3 - 6
Real estate/timber 353 (6) 8 5 - 360 Multi-strategy hedge funds 339 6 12 (44) - 313
Private equity 83 1 10 18 - 112 Other 46 9 (1) (13) - 41
$ 836 10 34 (35) 2 847
Other benefits plan assets
Real estate/timber $ 4 (7) 10 5 - 12 Multi-strategy hedge funds 5 (1) (3) 9 - 10
Private equity 2 - 1 1 - 4 Other 21 (1) - 2 - 22
$ 32 (9) 8 17 - 48
(1) All unrealized gains (losses) relate to instruments held at period end.
VALUATION METHODOLOGIES Following is a description of the valuation methodologies used for assets measured at fair value.
Cash and Cash Equivalents – includes highly liquid government securities such as U.S. Treasuries. Also includes investments in collective investment funds valued at fair value based upon the quoted market values of the underlying net assets. The unit price is quoted on a private market that is not active; however, the unit price is based on underlying investments traded on an active market. Investments in registered investment companies are valued at the NAV of shares held at year end. Long Duration, Intermediate (Core), High-Yield, International and Specialty Fixed Income – includes investments traded on the secondary markets; prices are measured by using quoted
market prices for similar securities, pricing models, discounted cash flow analyses using significant inputs observable in the market where available or combination of multiple valuation techniques. Also includes investments in registered investment companies, collective investment funds and government securities described above. Domestic, International and Emerging Market Stocks – investments in exchange-traded equity securities are valued at quoted market values. Also includes investments in registered investment companies and collective investment funds described above. Real Estate and Timber – the fair value of real estate and timber is estimated based primarily on appraisals prepared by third-
217
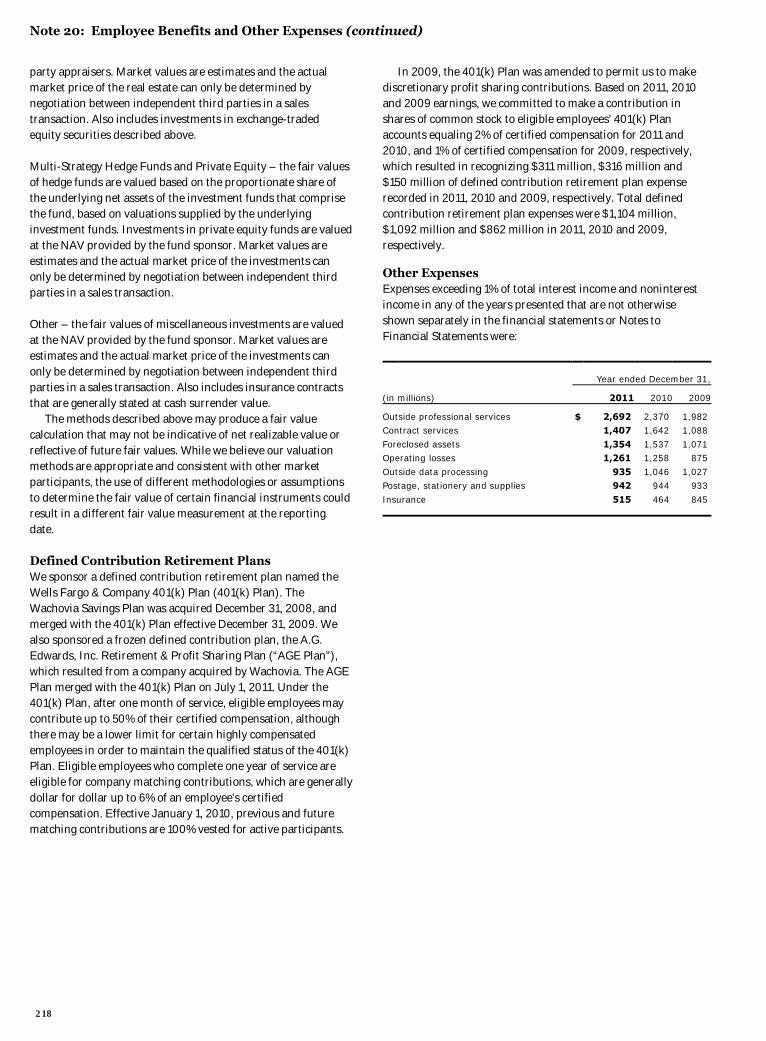
Note 20: Employee Benefits and Other Expenses (continued)
party appraisers. Market values are estimates and the actual market price of the real estate can only be determined by negotiation between independent third parties in a sales transaction. Also includes investments in exchange-traded equity securities described above. Multi-Strategy Hedge Funds and Private Equity – the fair values of hedge funds are valued based on the proportionate share of the underlying net assets of the investment funds that comprise the fund, based on valuations supplied by the underlying investment funds. Investments in private equity funds are valued at the NAV provided by the fund sponsor. Market values are estimates and the actual market price of the investments can only be determined by negotiation between independent third parties in a sales transaction.
Other – the fair values of miscellaneous investments are valued at the NAV provided by the fund sponsor. Market values are estimates and the actual market price of the investments can only be determined by negotiation between independent third parties in a sales transaction. Also includes insurance contracts that are generally stated at cash surrender value.
The methods described above may produce a fair value calculation that may not be indicative of net realizable value or reflective of future fair values. While we believe our valuation methods are appropriate and consistent with other market participants, the use of different methodologies or assumptions to determine the fair value of certain financial instruments could result in a different fair value measurement at the reporting date.
Defined Contribution Retirement Plans We sponsor a defined contribution retirement plan named the Wells Fargo & Company 401(k) Plan (401(k) Plan). The Wachovia Savings Plan was acquired December 31, 2008, and merged with the 401(k) Plan effective December 31, 2009. We also sponsored a frozen defined contribution plan, the A.G. Edwards, Inc. Retirement & Profit Sharing Plan (“AGE Plan”), which resulted from a company acquired by Wachovia. The AGE Plan merged with the 401(k) Plan on July 1, 2011. Under the 401(k) Plan, after one month of service, eligible employees may contribute up to 50% of their certified compensation, although there may be a lower limit for certain highly compensated employees in order to maintain the qualified status of the 401(k) Plan. Eligible employees who complete one year of service are eligible for company matching contributions, which are generally dollar for dollar up to 6% of an employee's certified compensation. Effective January 1, 2010, previous and future matching contributions are 100% vested for active participants.
In 2009, the 401(k) Plan was amended to permit us to make discretionary profit sharing contributions. Based on 2011, 2010 and 2009 earnings, we committed to make a contribution in shares of common stock to eligible employees’ 401(k) Plan accounts equaling 2% of certified compensation for 2011 and 2010, and 1% of certified compensation for 2009, respectively, which resulted in recognizing $311 million, $316 million and $150 million of defined contribution retirement plan expense recorded in 2011, 2010 and 2009, respectively. Total defined contribution retirement plan expenses were $1,104 million, $1,092 million and $862 million in 2011, 2010 and 2009, respectively.
Other Expenses Expenses exceeding 1% of total interest income and noninterest income in any of the years presented that are not otherwise shown separately in the financial statements or Notes to Financial Statements were:
Year ended December 31,
(in millions) 2011 2010 2009
Outside professional services $ 2,692 2,370 1,982 Contract services 1,407 1,642 1,088
Foreclosed assets 1,354 1,537 1,071 Operating losses 1,261 1,258 875
Outside data processing 935 1,046 1,027 Postage, stationery and supplies 942 944 933
Insurance 515 464 845
218
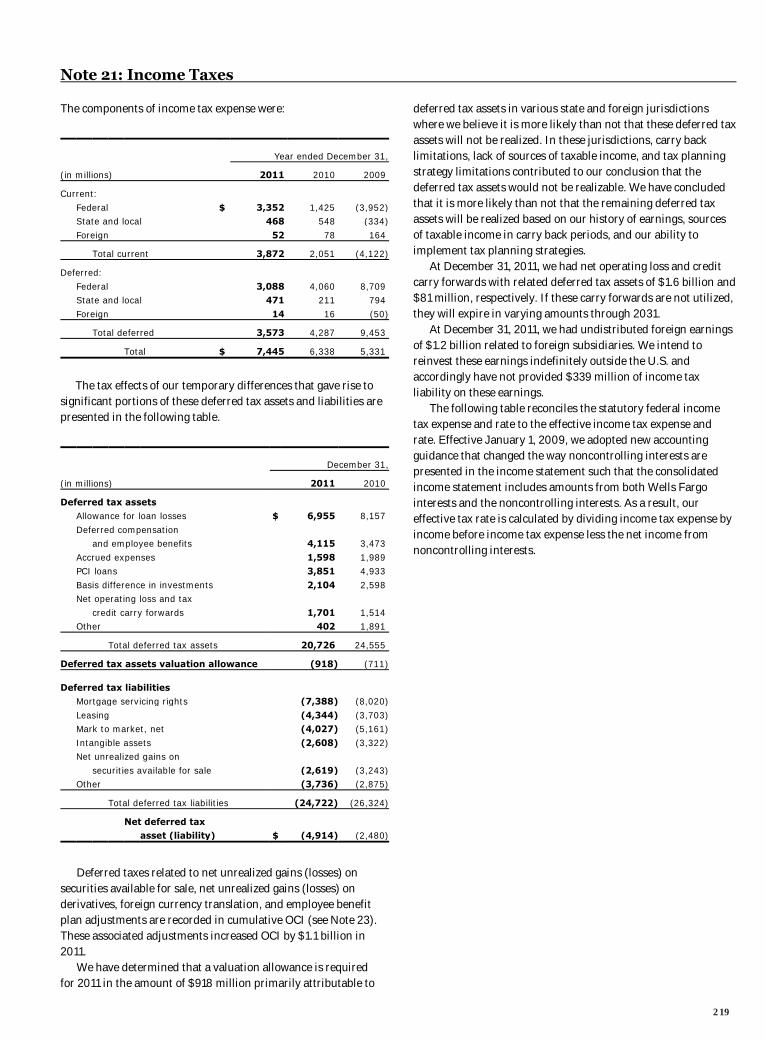
Note 21: Income Taxes
The components of income tax expense were:
Year ended December 31,
(in millions) 2011 2010 2009
Current:
Federal $ 3,352 1,425 (3,952) State and local 468 548 (334)
Foreign 52 78 164
Total current 3,872 2,051 (4,122)
Deferred:
Federal 3,088 4,060 8,709 State and local 471 211 794
Foreign 14 16 (50)
Total deferred 3,573 4,287 9,453
Total $ 7,445 6,338 5,331
The tax effects of our temporary differences that gave rise to
significant portions of these deferred tax assets and liabilities are presented in the following table.
December 31,
(in millions) 2011 2010
Deferred tax assets Allowance for loan losses $ 6,955 8,157
Deferred compensation and employee benefits 4,115 3,473
Accrued expenses 1,598 1,989 PCI loans 3,851 4,933
Basis difference in investments 2,104 2,598 Net operating loss and tax
credit carry forwards 1,701 1,514 Other 402 1,891
Total deferred tax assets 20,726 24,555
Deferred tax assets valuation allowance (918) (711)
Deferred tax liabilities Mortgage servicing rights (7,388) (8,020)
Leasing (4,344) (3,703) Mark to market, net (4,027) (5,161)
Intangible assets (2,608) (3,322) Net unrealized gains on
securities available for sale (2,619) (3,243) Other (3,736) (2,875)
Total deferred tax liabilities (24,722) (26,324)
Net deferred tax asset (liability) $ (4,914) (2,480)
Deferred taxes related to net unrealized gains (losses) on securities available for sale, net unrealized gains (losses) on derivatives, foreign currency translation, and employee benefit plan adjustments are recorded in cumulative OCI (see Note 23). These associated adjustments increased OCI by $1.1 billion in 2011. We have determined that a valuation allowance is required for 2011 in the amount of $918 million primarily attributable to
deferred tax assets in various state and foreign jurisdictions where we believe it is more likely than not that these deferred tax assets will not be realized. In these jurisdictions, carry back limitations, lack of sources of taxable income, and tax planning strategy limitations contributed to our conclusion that the deferred tax assets would not be realizable. We have concluded that it is more likely than not that the remaining deferred tax assets will be realized based on our history of earnings, sources of taxable income in carry back periods, and our ability to implement tax planning strategies. At December 31, 2011, we had net operating loss and credit carry forwards with related deferred tax assets of $1.6 billion and $81 million, respectively. If these carry forwards are not utilized, they will expire in varying amounts through 2031. At December 31, 2011, we had undistributed foreign earnings of $1.2 billion related to foreign subsidiaries. We intend to reinvest these earnings indefinitely outside the U.S. and accordingly have not provided $339 million of income tax liability on these earnings. The following table reconciles the statutory federal income tax expense and rate to the effective income tax expense and rate. Effective January 1, 2009, we adopted new accounting guidance that changed the way noncontrolling interests are presented in the income statement such that the consolidated income statement includes amounts from both Wells Fargo interests and the noncontrolling interests. As a result, our effective tax rate is calculated by dividing income tax expense by income before income tax expense less the net income from noncontrolling interests.
219
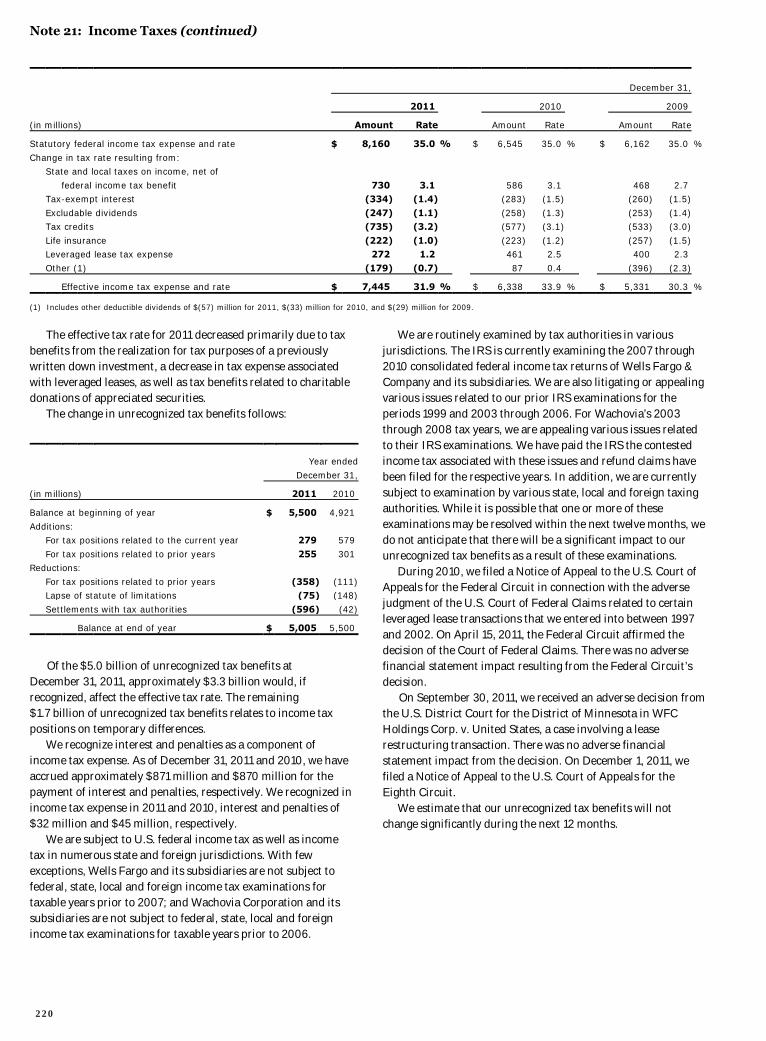
Note 21: Income Taxes (continued)
December 31,
2011 2010 2009
(in millions) Amount Rate Amount Rate Amount Rate
Statutory federal income tax expense and rate $ 8,160 35.0 % $ 6,545 35.0 % $ 6,162 35.0 %
Change in tax rate resulting from: State and local taxes on income, net of
federal income tax benefit 730 3.1 586 3.1 468 2.7 Tax-exempt interest (334) (1.4) (283) (1.5) (260) (1.5)
Excludable dividends (247) (1.1) (258) (1.3) (253) (1.4) Tax credits (735) (3.2) (577) (3.1) (533) (3.0)
Life insurance (222) (1.0) (223) (1.2) (257) (1.5) Leveraged lease tax expense 272 1.2 461 2.5 400 2.3
Other (1) (179) (0.7) 87 0.4 (396) (2.3)
Effective income tax expense and rate $ 7,445 31.9 % $ 6,338 33.9 % $ 5,331 30.3 %
(1) Includes other deductible dividends of $(57) million for 2011, $(33) million for 2010, and $(29) million for 2009.
The effective tax rate for 2011 decreased primarily due to tax benefits from the realization for tax purposes of a previously written down investment, a decrease in tax expense associated with leveraged leases, as well as tax benefits related to charitable donations of appreciated securities. The change in unrecognized tax benefits follows:
Year ended
December 31,
(in millions) 2011 2010
Balance at beginning of year $ 5,500 4,921
Additions: For tax positions related to the current year 279 579
For tax positions related to prior years 255 301 Reductions:
For tax positions related to prior years (358) (111) Lapse of statute of limitations (75) (148)
Settlements with tax authorities (596) (42)
Balance at end of year $ 5,005 5,500
Of the $5.0 billion of unrecognized tax benefits at December 31, 2011, approximately $3.3 billion would, if recognized, affect the effective tax rate. The remaining $1.7 billion of unrecognized tax benefits relates to income tax positions on temporary differences. We recognize interest and penalties as a component of income tax expense. As of December 31, 2011 and 2010, we have accrued approximately $871 million and $870 million for the payment of interest and penalties, respectively. We recognized in income tax expense in 2011 and 2010, interest and penalties of $32 million and $45 million, respectively. We are subject to U.S. federal income tax as well as income tax in numerous state and foreign jurisdictions. With few exceptions, Wells Fargo and its subsidiaries are not subject to federal, state, local and foreign income tax examinations for taxable years prior to 2007; and Wachovia Corporation and its subsidiaries are not subject to federal, state, local and foreign income tax examinations for taxable years prior to 2006.
We are routinely examined by tax authorities in various jurisdictions. The IRS is currently examining the 2007 through 2010 consolidated federal income tax returns of Wells Fargo & Company and its subsidiaries. We are also litigating or appealing various issues related to our prior IRS examinations for the periods 1999 and 2003 through 2006. For Wachovia’s 2003 through 2008 tax years, we are appealing various issues related to their IRS examinations. We have paid the IRS the contested income tax associated with these issues and refund claims have been filed for the respective years. In addition, we are currently subject to examination by various state, local and foreign taxing authorities. While it is possible that one or more of these examinations may be resolved within the next twelve months, we do not anticipate that there will be a significant impact to our unrecognized tax benefits as a result of these examinations.
During 2010, we filed a Notice of Appeal to the U.S. Court of Appeals for the Federal Circuit in connection with the adverse judgment of the U.S. Court of Federal Claims related to certain leveraged lease transactions that we entered into between 1997 and 2002. On April 15, 2011, the Federal Circuit affirmed the decision of the Court of Federal Claims. There was no adverse financial statement impact resulting from the Federal Circuit’s decision. On September 30, 2011, we received an adverse decision from the U.S. District Court for the District of Minnesota in WFC Holdings Corp. v. United States, a case involving a lease restructuring transaction. There was no adverse financial statement impact from the decision. On December 1, 2011, we filed a Notice of Appeal to the U.S. Court of Appeals for the Eighth Circuit.
We estimate that our unrecognized tax benefits will not change significantly during the next 12 months.
220
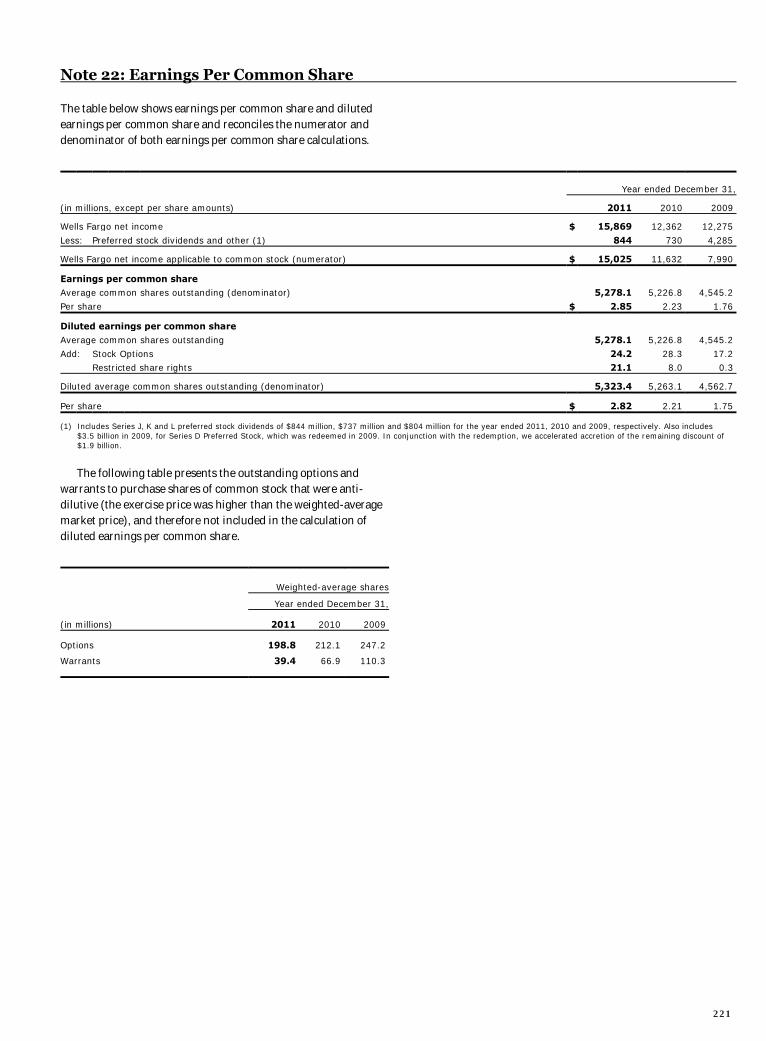
Note 22: Earnings Per Common Share
The table below shows earnings per common share and diluted earnings per common share and reconciles the numerator and denominator of both earnings per common share calculations.
Year ended December 31,
(in millions, except per share amounts) 2011 2010 2009
Wells Fargo net income $ 15,869 12,362 12,275
Less: Preferred stock dividends and other (1) 844 730 4,285
Wells Fargo net income applicable to common stock (numerator) $ 15,025 11,632 7,990
Earnings per common share Average common shares outstanding (denominator) 5,278.1 5,226.8 4,545.2
Per share $ 2.85 2.23 1.76
Diluted earnings per common share Average common shares outstanding 5,278.1 5,226.8 4,545.2
Add: Stock Options 24.2 28.3 17.2 Restricted share rights 21.1 8.0 0.3
Diluted average common shares outstanding (denominator) 5,323.4 5,263.1 4,562.7
Per share $ 2.82 2.21 1.75
(1) Includes Series J, K and L preferred stock dividends of $844 million, $737 million and $804 million for the year ended 2011, 2010 and 2009, respectively. Also includes $3.5 billion in 2009, for Series D Preferred Stock, which was redeemed in 2009. In conjunction with the redemption, we accelerated accretion of the remaining discount of $1.9 billion.
The following table presents the outstanding options and warrants to purchase shares of common stock that were anti-dilutive (the exercise price was higher than the weighted-average market price), and therefore not included in the calculation of diluted earnings per common share.
Weighted-average shares
Year ended December 31,
(in millions) 2011 2010 2009
Options 198.8 212.1 247.2
Warrants 39.4 66.9 110.3
221
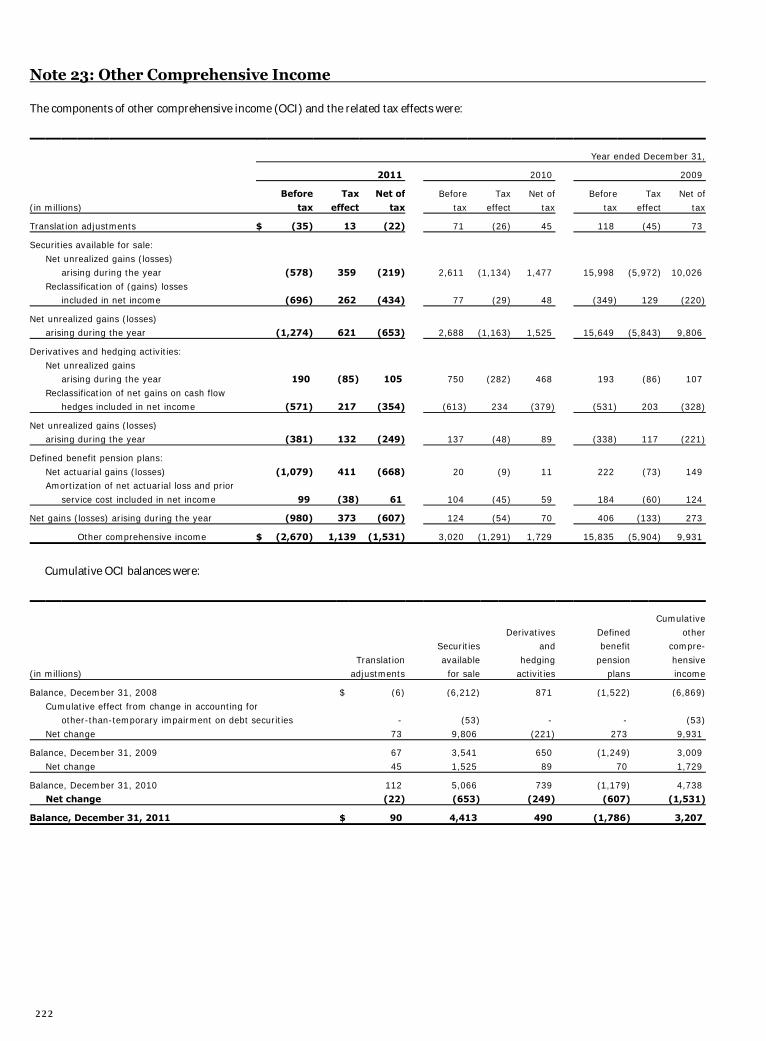
Note 23: Other Comprehensive Income
The components of other comprehensive income (OCI) and the related tax effects were:
Year ended December 31,
2011 2010 2009
Before Tax Net of Before Tax Net of Before Tax Net of
(in millions) tax effect tax tax effect tax tax effect tax
Translation adjustments $ (35) 13 (22) 71 (26) 45 118 (45) 73
Securities available for sale:
Net unrealized gains (losses) arising during the year (578) 359 (219) 2,611 (1,134) 1,477 15,998 (5,972) 10,026
Reclassification of (gains) losses included in net income (696) 262 (434) 77 (29) 48 (349) 129 (220)
Net unrealized gains (losses) arising during the year (1,274) 621 (653) 2,688 (1,163) 1,525 15,649 (5,843) 9,806
Derivatives and hedging activities:
Net unrealized gains arising during the year 190 (85) 105 750 (282) 468 193 (86) 107
Reclassification of net gains on cash flow hedges included in net income (571) 217 (354) (613) 234 (379) (531) 203 (328)
Net unrealized gains (losses) arising during the year (381) 132 (249) 137 (48) 89 (338) 117 (221)
Defined benefit pension plans:
Net actuarial gains (losses) (1,079) 411 (668) 20 (9) 11 222 (73) 149 Amortization of net actuarial loss and prior
service cost included in net income 99 (38) 61 104 (45) 59 184 (60) 124
Net gains (losses) arising during the year (980) 373 (607) 124 (54) 70 406 (133) 273
Other comprehensive income $ (2,670) 1,139 (1,531) 3,020 (1,291) 1,729 15,835 (5,904) 9,931
Cumulative OCI balances were:
Cumulative
Derivatives Defined other Securities and benefit compre-
Translation available hedging pension hensive (in millions) adjustments for sale activities plans income
Balance, December 31, 2008 $ (6) (6,212) 871 (1,522) (6,869)
Cumulative effect from change in accounting for other-than-temporary impairment on debt securities - (53) - - (53)
Net change 73 9,806 (221) 273 9,931
Balance, December 31, 2009 67 3,541 650 (1,249) 3,009
Net change 45 1,525 89 70 1,729
Balance, December 31, 2010 112 5,066 739 (1,179) 4,738 Net change (22) (653) (249) (607) (1,531)
Balance, December 31, 2011 $ 90 4,413 490 (1,786) 3,207
222
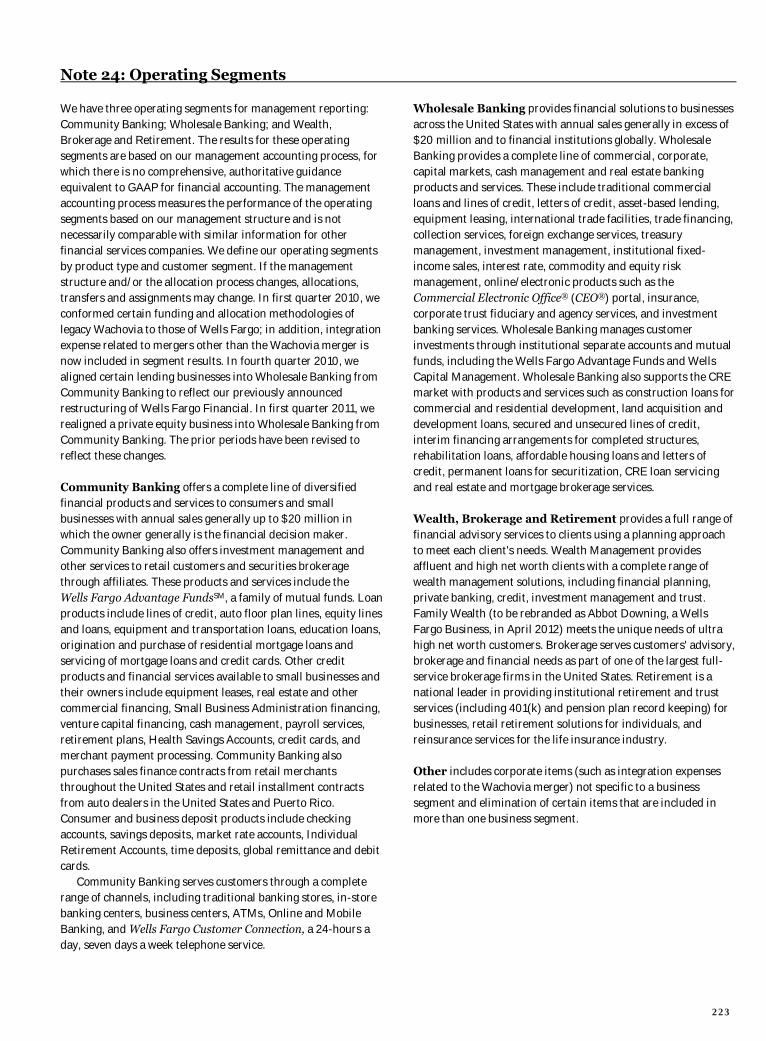
Note 24: Operating Segments
We have three operating segments for management reporting: Community Banking; Wholesale Banking; and Wealth, Brokerage and Retirement. The results for these operating segments are based on our management accounting process, for which there is no comprehensive, authoritative guidance equivalent to GAAP for financial accounting. The management accounting process measures the performance of the operating segments based on our management structure and is not necessarily comparable with similar information for other financial services companies. We define our operating segments by product type and customer segment. If the management structure and/or the allocation process changes, allocations, transfers and assignments may change. In first quarter 2010, we conformed certain funding and allocation methodologies of legacy Wachovia to those of Wells Fargo; in addition, integration expense related to mergers other than the Wachovia merger is now included in segment results. In fourth quarter 2010, we aligned certain lending businesses into Wholesale Banking from Community Banking to reflect our previously announced restructuring of Wells Fargo Financial. In first quarter 2011, we realigned a private equity business into Wholesale Banking from Community Banking. The prior periods have been revised to reflect these changes. Community Banking offers a complete line of diversified financial products and services to consumers and small businesses with annual sales generally up to $20 million in which the owner generally is the financial decision maker. Community Banking also offers investment management and other services to retail customers and securities brokerage through affiliates. These products and services include the Wells Fargo Advantage FundsSM, a family of mutual funds. Loan products include lines of credit, auto floor plan lines, equity lines and loans, equipment and transportation loans, education loans, origination and purchase of residential mortgage loans and servicing of mortgage loans and credit cards. Other credit products and financial services available to small businesses and their owners include equipment leases, real estate and other commercial financing, Small Business Administration financing, venture capital financing, cash management, payroll services, retirement plans, Health Savings Accounts, credit cards, and merchant payment processing. Community Banking also purchases sales finance contracts from retail merchants throughout the United States and retail installment contracts from auto dealers in the United States and Puerto Rico. Consumer and business deposit products include checking accounts, savings deposits, market rate accounts, Individual Retirement Accounts, time deposits, global remittance and debit cards. Community Banking serves customers through a complete range of channels, including traditional banking stores, in-store banking centers, business centers, ATMs, Online and Mobile Banking, and Wells Fargo Customer Connection, a 24-hours a day, seven days a week telephone service.
Wholesale Banking provides financial solutions to businesses across the United States with annual sales generally in excess of $20 million and to financial institutions globally. Wholesale Banking provides a complete line of commercial, corporate, capital markets, cash management and real estate banking products and services. These include traditional commercial loans and lines of credit, letters of credit, asset-based lending, equipment leasing, international trade facilities, trade financing, collection services, foreign exchange services, treasury management, investment management, institutional fixed-income sales, interest rate, commodity and equity risk management, online/electronic products such as the Commercial Electronic Office® (CEO®) portal, insurance, corporate trust fiduciary and agency services, and investment banking services. Wholesale Banking manages customer investments through institutional separate accounts and mutual funds, including the Wells Fargo Advantage Funds and Wells Capital Management. Wholesale Banking also supports the CRE market with products and services such as construction loans for commercial and residential development, land acquisition and development loans, secured and unsecured lines of credit, interim financing arrangements for completed structures, rehabilitation loans, affordable housing loans and letters of credit, permanent loans for securitization, CRE loan servicing and real estate and mortgage brokerage services.
Wealth, Brokerage and Retirement provides a full range of financial advisory services to clients using a planning approach to meet each client's needs. Wealth Management provides affluent and high net worth clients with a complete range of wealth management solutions, including financial planning, private banking, credit, investment management and trust. Family Wealth (to be rebranded as Abbot Downing, a Wells Fargo Business, in April 2012) meets the unique needs of ultra high net worth customers. Brokerage serves customers' advisory, brokerage and financial needs as part of one of the largest full-service brokerage firms in the United States. Retirement is a national leader in providing institutional retirement and trust services (including 401(k) and pension plan record keeping) for businesses, retail retirement solutions for individuals, and reinsurance services for the life insurance industry.
Other includes corporate items (such as integration expenses related to the Wachovia merger) not specific to a business segment and elimination of certain items that are included in more than one business segment.
223
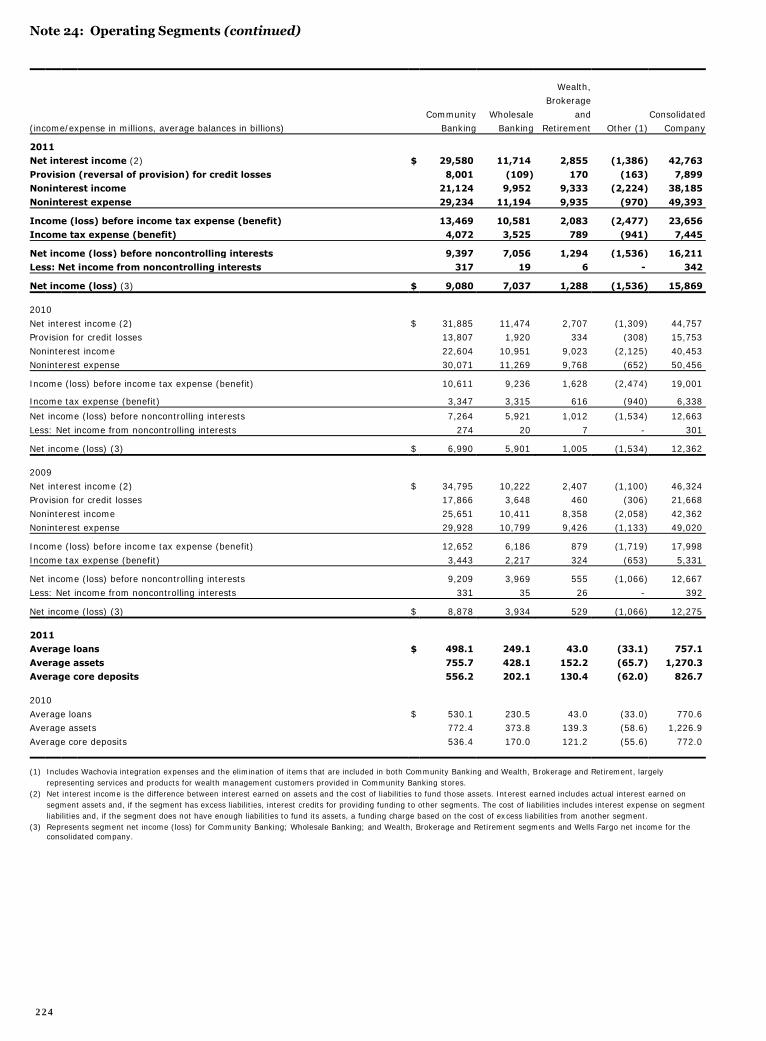
Note 24: Operating Segments (continued)
Wealth, Brokerage
Community Wholesale and Consolidated (income/expense in millions, average balances in billions) Banking Banking Retirement Other (1) Company
2011 Net interest income (2) $ 29,580 11,714 2,855 (1,386) 42,763
Provision (reversal of provision) for credit losses 8,001 (109) 170 (163) 7,899 Noninterest income 21,124 9,952 9,333 (2,224) 38,185
Noninterest expense 29,234 11,194 9,935 (970) 49,393
Income (loss) before income tax expense (benefit) 13,469 10,581 2,083 (2,477) 23,656 Income tax expense (benefit) 4,072 3,525 789 (941) 7,445
Net income (loss) before noncontrolling interests 9,397 7,056 1,294 (1,536) 16,211 Less: Net income from noncontrolling interests 317 19 6 - 342
Net income (loss) (3) $ 9,080 7,037 1,288 (1,536) 15,869
2010
Net interest income (2) $ 31,885 11,474 2,707 (1,309) 44,757 Provision for credit losses 13,807 1,920 334 (308) 15,753
Noninterest income 22,604 10,951 9,023 (2,125) 40,453 Noninterest expense 30,071 11,269 9,768 (652) 50,456
Income (loss) before income tax expense (benefit) 10,611 9,236 1,628 (2,474) 19,001
Income tax expense (benefit) 3,347 3,315 616 (940) 6,338
Net income (loss) before noncontrolling interests 7,264 5,921 1,012 (1,534) 12,663
Less: Net income from noncontrolling interests 274 20 7 - 301
Net income (loss) (3) $ 6,990 5,901 1,005 (1,534) 12,362
2009
Net interest income (2) $ 34,795 10,222 2,407 (1,100) 46,324 Provision for credit losses 17,866 3,648 460 (306) 21,668
Noninterest income 25,651 10,411 8,358 (2,058) 42,362 Noninterest expense 29,928 10,799 9,426 (1,133) 49,020
Income (loss) before income tax expense (benefit) 12,652 6,186 879 (1,719) 17,998
Income tax expense (benefit) 3,443 2,217 324 (653) 5,331
Net income (loss) before noncontrolling interests 9,209 3,969 555 (1,066) 12,667
Less: Net income from noncontrolling interests 331 35 26 - 392
Net income (loss) (3) $ 8,878 3,934 529 (1,066) 12,275
2011 Average loans $ 498.1 249.1 43.0 (33.1) 757.1
Average assets 755.7 428.1 152.2 (65.7) 1,270.3 Average core deposits 556.2 202.1 130.4 (62.0) 826.7 2010
Average loans $ 530.1 230.5 43.0 (33.0) 770.6 Average assets 772.4 373.8 139.3 (58.6) 1,226.9
Average core deposits 536.4 170.0 121.2 (55.6) 772.0
(1) Includes Wachovia integration expenses and the elimination of items that are included in both Community Banking and Wealth, Brokerage and Retirement, largely representing services and products for wealth management customers provided in Community Banking stores.
(2) Net interest income is the difference between interest earned on assets and the cost of liabilities to fund those assets. Interest earned includes actual interest earned on segment assets and, if the segment has excess liabilities, interest credits for providing funding to other segments. The cost of liabilities includes interest expense on segment liabilities and, if the segment does not have enough liabilities to fund its assets, a funding charge based on the cost of excess liabilities from another segment.
(3) Represents segment net income (loss) for Community Banking; Wholesale Banking; and Wealth, Brokerage and Retirement segments and Wells Fargo net income for the consolidated company.
224
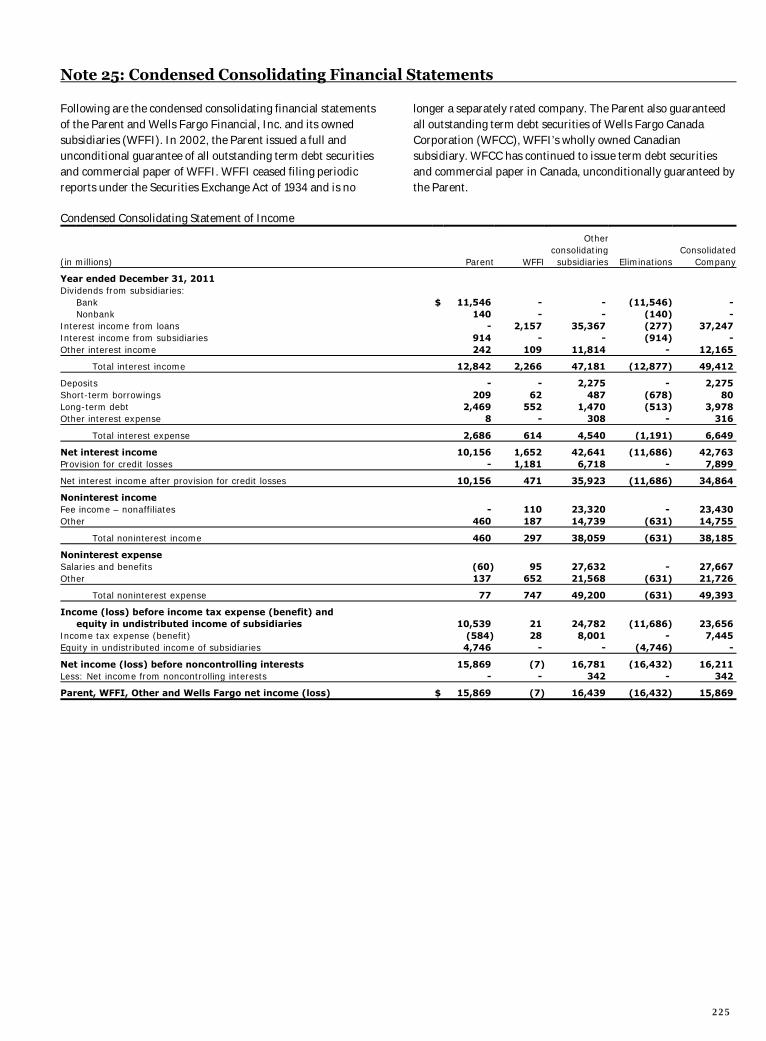
Note 25: Condensed Consolidating Financial Statements
Following are the condensed consolidating financial statements of the Parent and Wells Fargo Financial, Inc. and its owned subsidiaries (WFFI). In 2002, the Parent issued a full and unconditional guarantee of all outstanding term debt securities and commercial paper of WFFI. WFFI ceased filing periodic reports under the Securities Exchange Act of 1934 and is no
longer a separately rated company. The Parent also guaranteed all outstanding term debt securities of Wells Fargo Canada Corporation (WFCC), WFFI’s wholly owned Canadian subsidiary. WFCC has continued to issue term debt securities and commercial paper in Canada, unconditionally guaranteed by the Parent.
Condensed Consolidating Statement of Income
Other consolidating Consolidated (in millions) Parent WFFI subsidiaries Eliminations Company
Year ended December 31, 2011 Dividends from subsidiaries: Bank $ 11,546 - - (11,546) - Nonbank 140 - - (140) - Interest income from loans - 2,157 35,367 (277) 37,247 Interest income from subsidiaries 914 - - (914) - Other interest income 242 109 11,814 - 12,165
Total interest income 12,842 2,266 47,181 (12,877) 49,412
Deposits - - 2,275 - 2,275 Short-term borrowings 209 62 487 (678) 80 Long-term debt 2,469 552 1,470 (513) 3,978 Other interest expense 8 - 308 - 316
Total interest expense 2,686 614 4,540 (1,191) 6,649
Net interest income 10,156 1,652 42,641 (11,686) 42,763 Provision for credit losses - 1,181 6,718 - 7,899
Net interest income after provision for credit losses 10,156 471 35,923 (11,686) 34,864
Noninterest income Fee income – nonaffiliates - 110 23,320 - 23,430 Other 460 187 14,739 (631) 14,755
Total noninterest income 460 297 38,059 (631) 38,185
Noninterest expense Salaries and benefits (60) 95 27,632 - 27,667 Other 137 652 21,568 (631) 21,726
Total noninterest expense 77 747 49,200 (631) 49,393
Income (loss) before income tax expense (benefit) and equity in undistributed income of subsidiaries 10,539 21 24,782 (11,686) 23,656 Income tax expense (benefit) (584) 28 8,001 - 7,445 Equity in undistributed income of subsidiaries 4,746 - - (4,746) -
Net income (loss) before noncontrolling interests 15,869 (7) 16,781 (16,432) 16,211 Less: Net income from noncontrolling interests - - 342 - 342
Parent, WFFI, Other and Wells Fargo net income (loss) $ 15,869 (7) 16,439 (16,432) 15,869
225
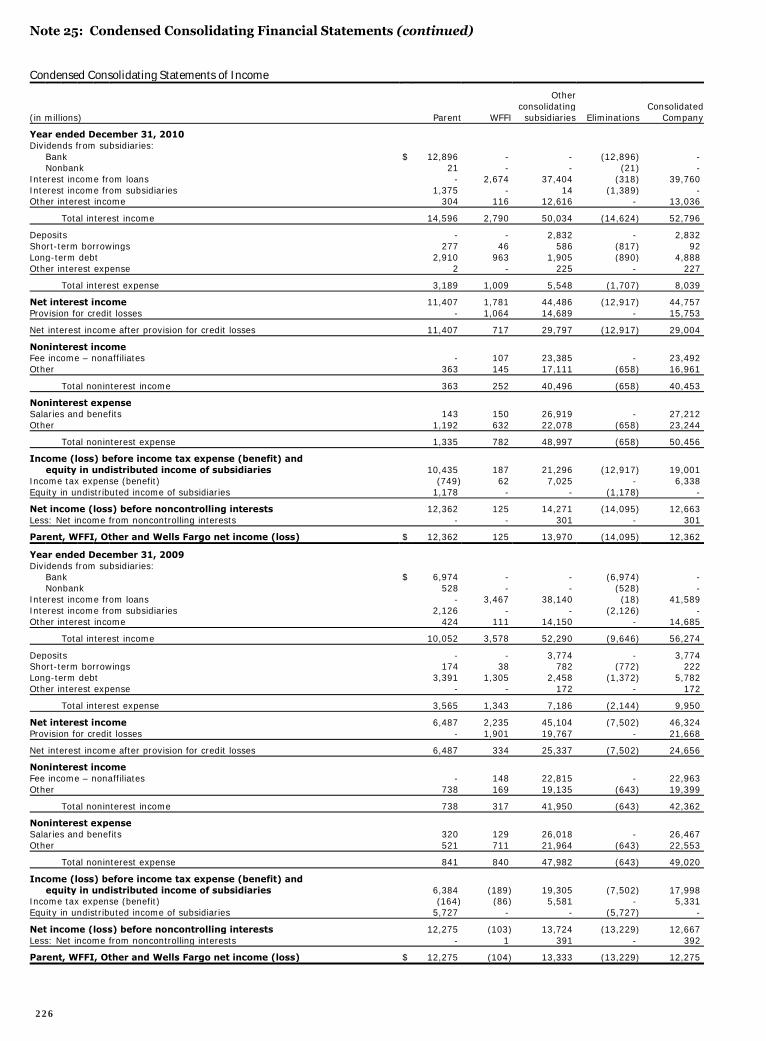
Note 25: Condensed Consolidating Financial Statements (continued)
Condensed Consolidating Statements of Income
Other consolidating Consolidated (in millions) Parent WFFI subsidiaries Eliminations Company
Year ended December 31, 2010 Dividends from subsidiaries: Bank $ 12,896 - - (12,896) - Nonbank 21 - - (21) - Interest income from loans - 2,674 37,404 (318) 39,760 Interest income from subsidiaries 1,375 - 14 (1,389) - Other interest income 304 116 12,616 - 13,036
Total interest income 14,596 2,790 50,034 (14,624) 52,796
Deposits - - 2,832 - 2,832 Short-term borrowings 277 46 586 (817) 92 Long-term debt 2,910 963 1,905 (890) 4,888 Other interest expense 2 - 225 - 227
Total interest expense 3,189 1,009 5,548 (1,707) 8,039
Net interest income 11,407 1,781 44,486 (12,917) 44,757 Provision for credit losses - 1,064 14,689 - 15,753
Net interest income after provision for credit losses 11,407 717 29,797 (12,917) 29,004
Noninterest income Fee income – nonaffiliates - 107 23,385 - 23,492 Other 363 145 17,111 (658) 16,961
Total noninterest income 363 252 40,496 (658) 40,453
Noninterest expense Salaries and benefits 143 150 26,919 - 27,212 Other 1,192 632 22,078 (658) 23,244
Total noninterest expense 1,335 782 48,997 (658) 50,456
Income (loss) before income tax expense (benefit) and equity in undistributed income of subsidiaries 10,435 187 21,296 (12,917) 19,001 Income tax expense (benefit) (749) 62 7,025 - 6,338 Equity in undistributed income of subsidiaries 1,178 - - (1,178) -
Net income (loss) before noncontrolling interests 12,362 125 14,271 (14,095) 12,663 Less: Net income from noncontrolling interests - - 301 - 301
Parent, WFFI, Other and Wells Fargo net income (loss) $ 12,362 125 13,970 (14,095) 12,362
Year ended December 31, 2009 Dividends from subsidiaries: Bank $ 6,974 - - (6,974) - Nonbank 528 - - (528) - Interest income from loans - 3,467 38,140 (18) 41,589 Interest income from subsidiaries 2,126 - - (2,126) - Other interest income 424 111 14,150 - 14,685
Total interest income 10,052 3,578 52,290 (9,646) 56,274
Deposits - - 3,774 - 3,774 Short-term borrowings 174 38 782 (772) 222 Long-term debt 3,391 1,305 2,458 (1,372) 5,782 Other interest expense - - 172 - 172
Total interest expense 3,565 1,343 7,186 (2,144) 9,950
Net interest income 6,487 2,235 45,104 (7,502) 46,324 Provision for credit losses - 1,901 19,767 - 21,668
Net interest income after provision for credit losses 6,487 334 25,337 (7,502) 24,656
Noninterest income Fee income – nonaffiliates - 148 22,815 - 22,963 Other 738 169 19,135 (643) 19,399
Total noninterest income 738 317 41,950 (643) 42,362
Noninterest expense Salaries and benefits 320 129 26,018 - 26,467 Other 521 711 21,964 (643) 22,553
Total noninterest expense 841 840 47,982 (643) 49,020
Income (loss) before income tax expense (benefit) and equity in undistributed income of subsidiaries 6,384 (189) 19,305 (7,502) 17,998 Income tax expense (benefit) (164) (86) 5,581 - 5,331 Equity in undistributed income of subsidiaries 5,727 - - (5,727) -
Net income (loss) before noncontrolling interests 12,275 (103) 13,724 (13,229) 12,667 Less: Net income from noncontrolling interests - 1 391 - 392
Parent, WFFI, Other and Wells Fargo net income (loss) $ 12,275 (104) 13,333 (13,229) 12,275
226
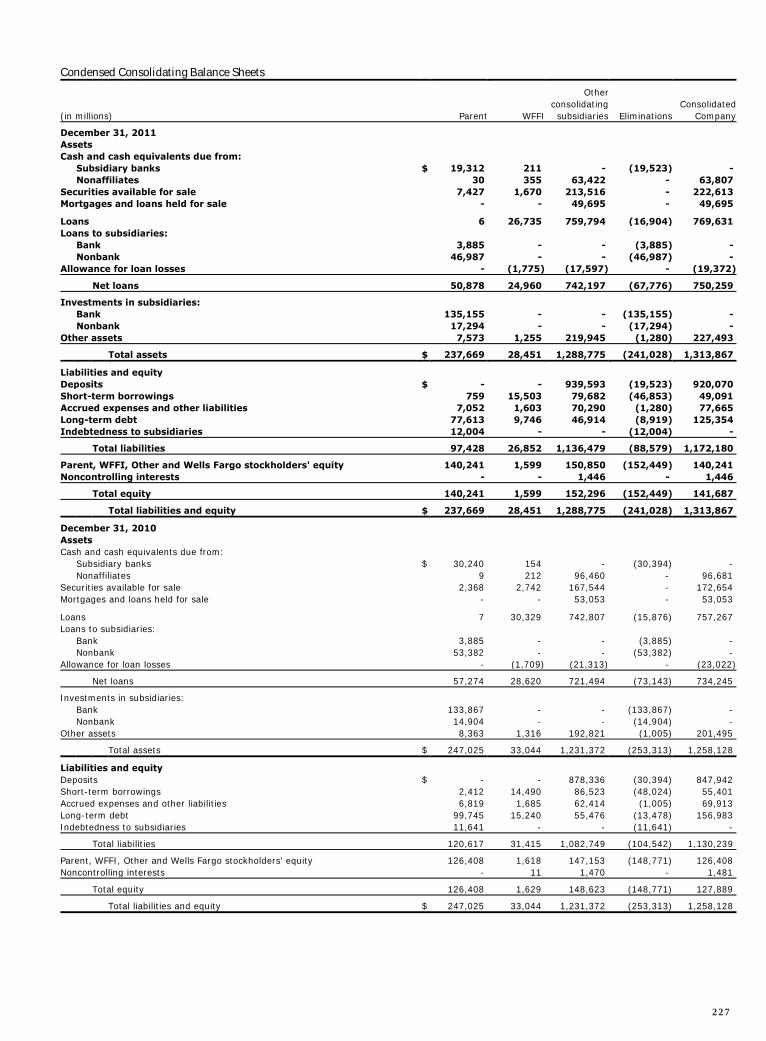
Condensed Consolidating Balance Sheets Other consolidating Consolidated (in millions) Parent WFFI subsidiaries Eliminations Company
December 31, 2011 Assets Cash and cash equivalents due from: Subsidiary banks $ 19,312 211 - (19,523) - Nonaffiliates 30 355 63,422 - 63,807 Securities available for sale 7,427 1,670 213,516 - 222,613 Mortgages and loans held for sale - - 49,695 - 49,695
Loans 6 26,735 759,794 (16,904) 769,631 Loans to subsidiaries: Bank 3,885 - - (3,885) - Nonbank 46,987 - - (46,987) - Allowance for loan losses - (1,775) (17,597) - (19,372)
Net loans 50,878 24,960 742,197 (67,776) 750,259
Investments in subsidiaries: Bank 135,155 - - (135,155) - Nonbank 17,294 - - (17,294) - Other assets 7,573 1,255 219,945 (1,280) 227,493
Total assets $ 237,669 28,451 1,288,775 (241,028) 1,313,867
Liabilities and equity Deposits $ - - 939,593 (19,523) 920,070 Short-term borrowings 759 15,503 79,682 (46,853) 49,091 Accrued expenses and other liabilities 7,052 1,603 70,290 (1,280) 77,665 Long-term debt 77,613 9,746 46,914 (8,919) 125,354 Indebtedness to subsidiaries 12,004 - - (12,004) -
Total liabilities 97,428 26,852 1,136,479 (88,579) 1,172,180
Parent, WFFI, Other and Wells Fargo stockholders' equity 140,241 1,599 150,850 (152,449) 140,241 Noncontrolling interests - - 1,446 - 1,446
Total equity 140,241 1,599 152,296 (152,449) 141,687
Total liabilities and equity $ 237,669 28,451 1,288,775 (241,028) 1,313,867
December 31, 2010 Assets Cash and cash equivalents due from: Subsidiary banks $ 30,240 154 - (30,394) - Nonaffiliates 9 212 96,460 - 96,681 Securities available for sale 2,368 2,742 167,544 - 172,654 Mortgages and loans held for sale - - 53,053 - 53,053
Loans 7 30,329 742,807 (15,876) 757,267 Loans to subsidiaries: Bank 3,885 - - (3,885) - Nonbank 53,382 - - (53,382) - Allowance for loan losses - (1,709) (21,313) - (23,022)
Net loans 57,274 28,620 721,494 (73,143) 734,245
Investments in subsidiaries: Bank 133,867 - - (133,867) - Nonbank 14,904 - - (14,904) - Other assets 8,363 1,316 192,821 (1,005) 201,495
Total assets $ 247,025 33,044 1,231,372 (253,313) 1,258,128
Liabilities and equity Deposits $ - - 878,336 (30,394) 847,942 Short-term borrowings 2,412 14,490 86,523 (48,024) 55,401 Accrued expenses and other liabilities 6,819 1,685 62,414 (1,005) 69,913 Long-term debt 99,745 15,240 55,476 (13,478) 156,983 Indebtedness to subsidiaries 11,641 - - (11,641) -
Total liabilities 120,617 31,415 1,082,749 (104,542) 1,130,239
Parent, WFFI, Other and Wells Fargo stockholders' equity 126,408 1,618 147,153 (148,771) 126,408 Noncontrolling interests - 11 1,470 - 1,481
Total equity 126,408 1,629 148,623 (148,771) 127,889
Total liabilities and equity $ 247,025 33,044 1,231,372 (253,313) 1,258,128
227

Note 25: Condensed Consolidating Financial Statements (continued)
Condensed Consolidating Statements of Cash Flows
Year ended December 31,
2011 2010
Other Other consolidating consolidating subsidiaries/ Consolidated subsidiaries/ Consolidated (in millions) Parent WFFI eliminations Company Parent WFFI eliminations Company
Cash flows from operating activities: Net cash provided (used) by operating activities $ 15,049 1,563 (2,947) 13,665 14,180 1,774 2,818 18,772
Cash flows from investing activities: Securities available for sale: Sales proceeds 11,459 1,946 9,657 23,062 2,441 796 5,431 8,668 Prepayments and maturities - 294 52,324 52,618 - 229 47,690 47,919 Purchases (16,487) (1,086) (103,662) (121,235) (119) (1,037) (52,310) (53,466) Loans: Loans originated by banking subsidiaries, net of principal collected - (596) (35,090) (35,686) - (206) 16,075 15,869 Proceeds from sales (including participations) of loans originated for investment by banking subsidiaries - - 6,555 6,555 - - 6,517 6,517 Purchases (including participations) of loans by banking subsidiaries - - (8,878) (8,878) - - (2,297) (2,297) Principal collected on nonbank entities' loans - 9,984 (202) 9,782 - 10,829 4,731 15,560 Loans originated by nonbank entities - (7,520) (2) (7,522) - (6,336) (4,500) (10,836) Net repayments from (advances to) subsidiaries 1,318 (81) (1,237) - (5,485) (842) 6,327 - Capital notes and term loans made to subsidiaries (1,340) - 1,340 - - - - - Principal collected on notes/loans made to subsidiaries 5,779 - (5,779) - 11,282 - (11,282) - Net decrease (increase) in investment in subsidiaries (610) - 610 - 1,198 - (1,198) - Net cash paid for acquisitions - - (353) (353) - - (36) (36) Other, net 230 210 46,173 46,613 15 64 (31,652) (31,573)
Net cash provided (used) by investing activities 349 3,151 (38,544) (35,044) 9,332 3,497 (16,504) (3,675)
Cash flows from financing activities: Net change in: Deposits - - 72,128 72,128 - - 23,924 23,924 Short-term borrowings (242) 1,013 (7,002) (6,231) 1,860 4,118 5,330 11,308 Long-term debt: Proceeds from issuance 7,058 513 4,116 11,687 1,789 - 1,700 3,489 Repayment (31,198) (6,029) (13,328) (50,555) (23,281) (9,478) (30,558) (63,317) Preferred stock: Proceeds from issuance 2,501 - - 2,501 - - - - Cash dividends paid (844) - - (844) (737) - - (737) Common stock warrants repurchased (2) - - (2) (545) - - (545) Common stock:
Proceeds from issuance 1,296 - - 1,296 1,375 - - 1,375 Repurchased (2,416) - - (2,416) (91) - - (91) Cash dividends paid (2,537) - - (2,537) (1,045) - - (1,045) Excess tax benefits related to stock option payments 79 - - 79 98 - - 98 Net change in noncontrolling interests: Other - (11) (320) (331) - 1 (593) (592)
Net cash provided (used) by financing activities (26,305) (4,514) 55,594 24,775 (20,577) (5,359) (197) (26,133)
Net change in cash and due from banks (10,907) 200 14,103 3,396 2,935 (88) (13,883) (11,036) Cash and due from banks at beginning of year 30,249 366 (14,571) 16,044 27,314 454 (688) 27,080
Cash and due from banks at end of year $ 19,342 566 (468) 19,440 30,249 366 (14,571) 16,044
228
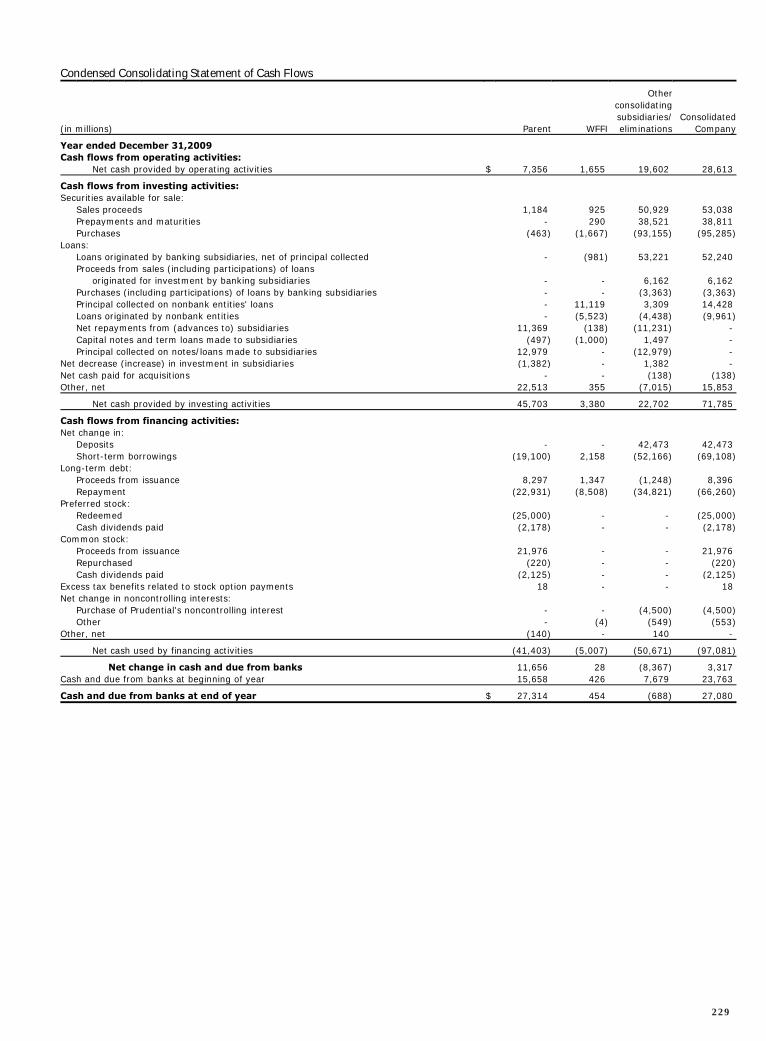
Condensed Consolidating Statement of Cash Flows Other consolidating subsidiaries/ Consolidated (in millions) Parent WFFI eliminations Company
Year ended December 31,2009 Cash flows from operating activities: Net cash provided by operating activities $ 7,356 1,655 19,602 28,613
Cash flows from investing activities: Securities available for sale: Sales proceeds 1,184 925 50,929 53,038 Prepayments and maturities - 290 38,521 38,811 Purchases (463) (1,667) (93,155) (95,285) Loans: Loans originated by banking subsidiaries, net of principal collected - (981) 53,221 52,240 Proceeds from sales (including participations) of loans originated for investment by banking subsidiaries - - 6,162 6,162 Purchases (including participations) of loans by banking subsidiaries - - (3,363) (3,363) Principal collected on nonbank entities' loans - 11,119 3,309 14,428 Loans originated by nonbank entities - (5,523) (4,438) (9,961) Net repayments from (advances to) subsidiaries 11,369 (138) (11,231) - Capital notes and term loans made to subsidiaries (497) (1,000) 1,497 - Principal collected on notes/loans made to subsidiaries 12,979 - (12,979) - Net decrease (increase) in investment in subsidiaries (1,382) - 1,382 - Net cash paid for acquisitions - - (138) (138) Other, net 22,513 355 (7,015) 15,853
Net cash provided by investing activities 45,703 3,380 22,702 71,785
Cash flows from financing activities: Net change in: Deposits - - 42,473 42,473 Short-term borrowings (19,100) 2,158 (52,166) (69,108) Long-term debt: Proceeds from issuance 8,297 1,347 (1,248) 8,396 Repayment (22,931) (8,508) (34,821) (66,260) Preferred stock: Redeemed (25,000) - - (25,000) Cash dividends paid (2,178) - - (2,178) Common stock:
Proceeds from issuance 21,976 - - 21,976 Repurchased (220) - - (220) Cash dividends paid (2,125) - - (2,125) Excess tax benefits related to stock option payments 18 - - 18 Net change in noncontrolling interests: Purchase of Prudential's noncontrolling interest - - (4,500) (4,500) Other - (4) (549) (553) Other, net (140) - 140 -
Net cash used by financing activities (41,403) (5,007) (50,671) (97,081)
Net change in cash and due from banks 11,656 28 (8,367) 3,317 Cash and due from banks at beginning of year 15,658 426 7,679 23,763
Cash and due from banks at end of year $ 27,314 454 (688) 27,080
229
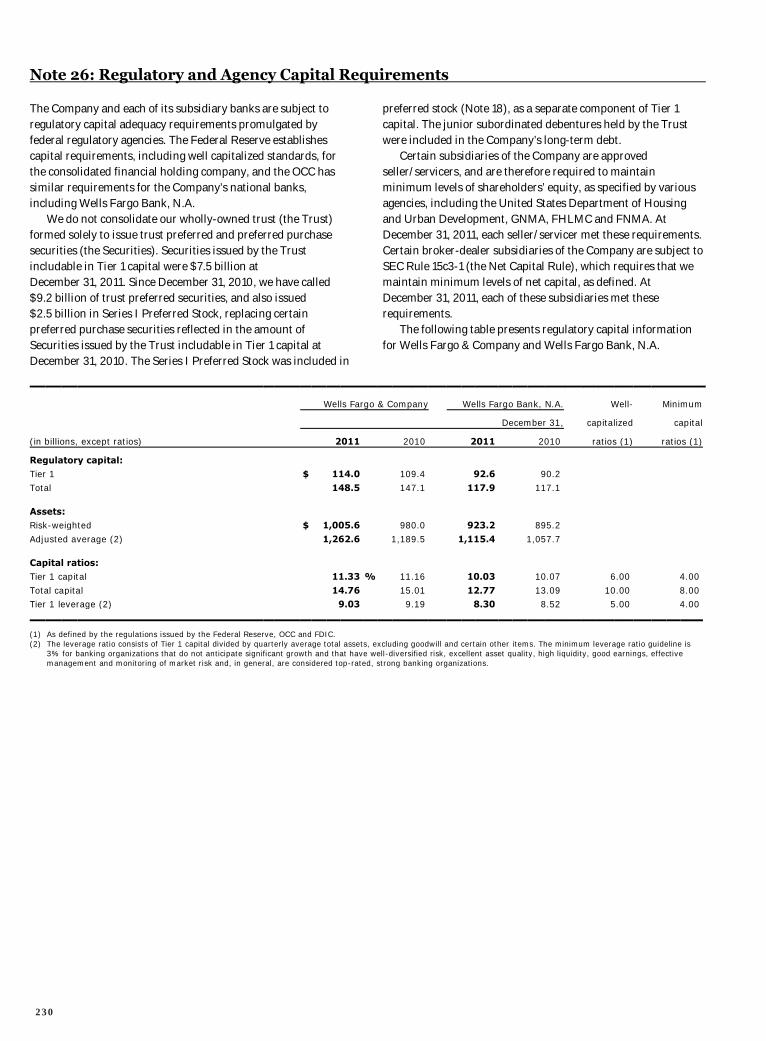
Note 26: Regulatory and Agency Capital Requirements
The Company and each of its subsidiary banks are subject to regulatory capital adequacy requirements promulgated by federal regulatory agencies. The Federal Reserve establishes capital requirements, including well capitalized standards, for the consolidated financial holding company, and the OCC has similar requirements for the Company’s national banks, including Wells Fargo Bank, N.A. We do not consolidate our wholly-owned trust (the Trust) formed solely to issue trust preferred and preferred purchase securities (the Securities). Securities issued by the Trust includable in Tier 1 capital were $7.5 billion at December 31, 2011. Since December 31, 2010, we have called $9.2 billion of trust preferred securities, and also issued $2.5 billion in Series I Preferred Stock, replacing certain preferred purchase securities reflected in the amount of Securities issued by the Trust includable in Tier 1 capital at December 31, 2010. The Series I Preferred Stock was included in
preferred stock (Note 18), as a separate component of Tier 1 capital. The junior subordinated debentures held by the Trust were included in the Company’s long-term debt. Certain subsidiaries of the Company are approved seller/servicers, and are therefore required to maintain minimum levels of shareholders’ equity, as specified by various agencies, including the United States Department of Housing and Urban Development, GNMA, FHLMC and FNMA. At December 31, 2011, each seller/servicer met these requirements. Certain broker-dealer subsidiaries of the Company are subject to SEC Rule 15c3-1 (the Net Capital Rule), which requires that we maintain minimum levels of net capital, as defined. At December 31, 2011, each of these subsidiaries met these requirements. The following table presents regulatory capital information for Wells Fargo & Company and Wells Fargo Bank, N.A.
Wells Fargo & Company Wells Fargo Bank, N.A. Well- Minimum
December 31, capitalized capital
(in billions, except ratios) 2011 2010 2011 2010 ratios (1) ratios (1)
Regulatory capital: Tier 1 $ 114.0 109.4 92.6 90.2
Total 148.5 147.1 117.9 117.1 Assets: Risk-weighted $ 1,005.6 980.0 923.2 895.2
Adjusted average (2) 1,262.6 1,189.5 1,115.4 1,057.7 Capital ratios: Tier 1 capital 11.33 % 11.16 10.03 10.07 6.00 4.00
Total capital 14.76 15.01 12.77 13.09 10.00 8.00 Tier 1 leverage (2) 9.03 9.19 8.30 8.52 5.00 4.00
(1) As defined by the regulations issued by the Federal Reserve, OCC and FDIC. (2) The leverage ratio consists of Tier 1 capital divided by quarterly average total assets, excluding goodwill and certain other items. The minimum leverage ratio guideline is
3% for banking organizations that do not anticipate significant growth and that have well-diversified risk, excellent asset quality, high liquidity, good earnings, effective management and monitoring of market risk and, in general, are considered top-rated, strong banking organizations.
230
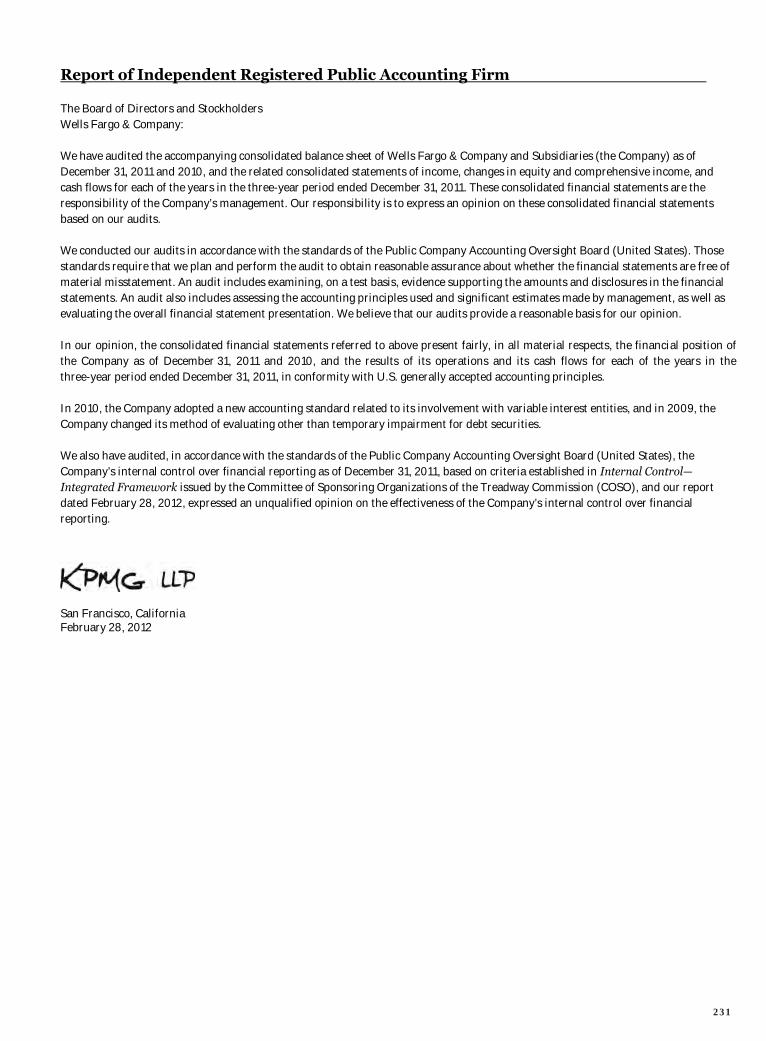
Report of Independent Registered Public Accounting Firm
The Board of Directors and Stockholders Wells Fargo & Company: We have audited the accompanying consolidated balance sheet of Wells Fargo & Company and Subsidiaries (the Company) as of December 31, 2011 and 2010, and the related consolidated statements of income, changes in equity and comprehensive income, and cash flows for each of the years in the three-year period ended December 31, 2011. These consolidated financial statements are the responsibility of the Company’s management. Our responsibility is to express an opinion on these consolidated financial statements based on our audits. We conducted our audits in accordance with the standards of the Public Company Accounting Oversight Board (United States). Those standards require that we plan and perform the audit to obtain reasonable assurance about whether the financial statements are free of material misstatement. An audit includes examining, on a test basis, evidence supporting the amounts and disclosures in the financial statements. An audit also includes assessing the accounting principles used and significant estimates made by management, as well as evaluating the overall financial statement presentation. We believe that our audits provide a reasonable basis for our opinion. In our opinion, the consolidated financial statements referred to above present fairly, in all material respects, the financial position of the Company as of December 31, 2011 and 2010, and the results of its operations and its cash flows for each of the years in the three-year period ended December 31, 2011, in conformity with U.S. generally accepted accounting principles. In 2010, the Company adopted a new accounting standard related to its involvement with variable interest entities, and in 2009, the Company changed its method of evaluating other than temporary impairment for debt securities. We also have audited, in accordance with the standards of the Public Company Accounting Oversight Board (United States), the Company’s internal control over financial reporting as of December 31, 2011, based on criteria established in Internal Control—Integrated Framework issued by the Committee of Sponsoring Organizations of the Treadway Commission (COSO), and our report dated February 28, 2012, expressed an unqualified opinion on the effectiveness of the Company’s internal control over financial reporting. San Francisco, California February 28, 2012
231
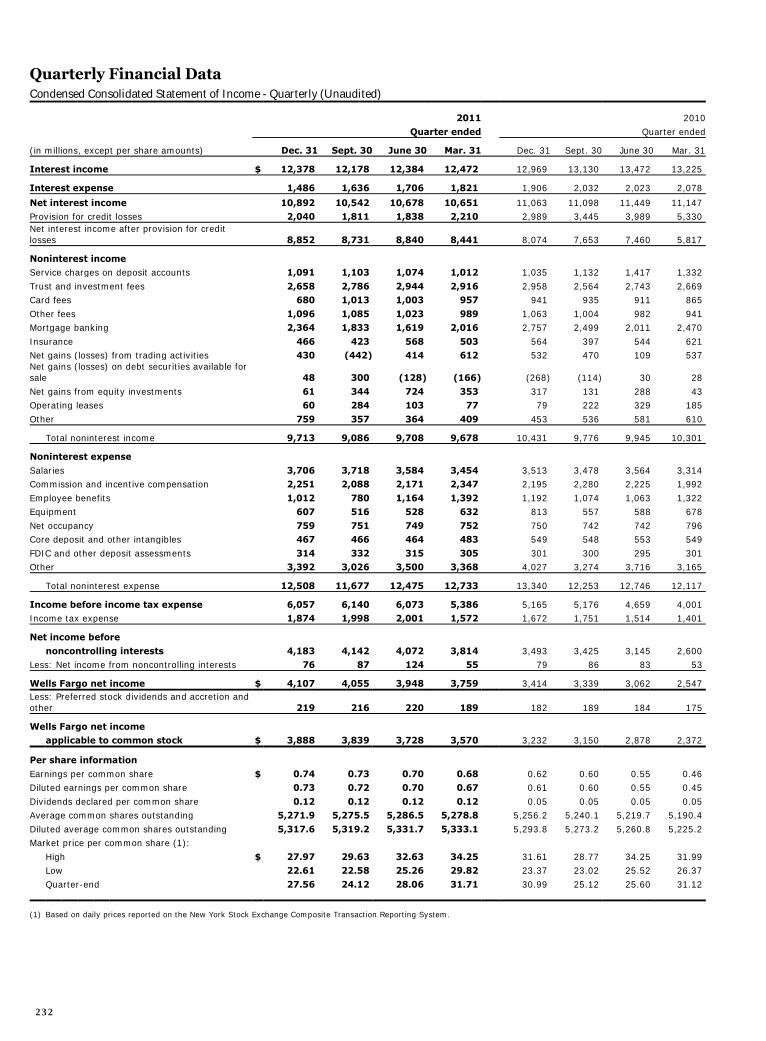
Quarterly Financial Data
Condensed Consolidated Statement of Income - Quarterly (Unaudited)
2011 2010
Quarter ended Quarter ended
(in millions, except per share amounts) Dec. 31 Sept. 30 June 30 Mar. 31 Dec. 31 Sept. 30 June 30 Mar. 31
Interest income $ 12,378 12,178 12,384 12,472 12,969 13,130 13,472 13,225
Interest expense 1,486 1,636 1,706 1,821 1,906 2,032 2,023 2,078
Net interest income 10,892 10,542 10,678 10,651 11,063 11,098 11,449 11,147 Provision for credit losses 2,040 1,811 1,838 2,210 2,989 3,445 3,989 5,330 Net interest income after provision for credit losses 8,852 8,731 8,840 8,441 8,074 7,653 7,460 5,817
Noninterest income Service charges on deposit accounts 1,091 1,103 1,074 1,012 1,035 1,132 1,417 1,332
Trust and investment fees 2,658 2,786 2,944 2,916 2,958 2,564 2,743 2,669 Card fees 680 1,013 1,003 957 941 935 911 865
Other fees 1,096 1,085 1,023 989 1,063 1,004 982 941 Mortgage banking 2,364 1,833 1,619 2,016 2,757 2,499 2,011 2,470
Insurance 466 423 568 503 564 397 544 621 Net gains (losses) from trading activities 430 (442) 414 612 532 470 109 537 Net gains (losses) on debt securities available for sale 48 300 (128) (166) (268) (114) 30 28
Net gains from equity investments 61 344 724 353 317 131 288 43 Operating leases 60 284 103 77 79 222 329 185
Other 759 357 364 409 453 536 581 610
Total noninterest income 9,713 9,086 9,708 9,678 10,431 9,776 9,945 10,301
Noninterest expense
Salaries 3,706 3,718 3,584 3,454 3,513 3,478 3,564 3,314 Commission and incentive compensation 2,251 2,088 2,171 2,347 2,195 2,280 2,225 1,992
Employee benefits 1,012 780 1,164 1,392 1,192 1,074 1,063 1,322 Equipment 607 516 528 632 813 557 588 678
Net occupancy 759 751 749 752 750 742 742 796 Core deposit and other intangibles 467 466 464 483 549 548 553 549
FDIC and other deposit assessments 314 332 315 305 301 300 295 301 Other 3,392 3,026 3,500 3,368 4,027 3,274 3,716 3,165
Total noninterest expense 12,508 11,677 12,475 12,733 13,340 12,253 12,746 12,117
Income before income tax expense 6,057 6,140 6,073 5,386 5,165 5,176 4,659 4,001 Income tax expense 1,874 1,998 2,001 1,572 1,672 1,751 1,514 1,401
Net income before
noncontrolling interests 4,183 4,142 4,072 3,814 3,493 3,425 3,145 2,600 Less: Net income from noncontrolling interests 76 87 124 55 79 86 83 53
Wells Fargo net income $ 4,107 4,055 3,948 3,759 3,414 3,339 3,062 2,547 Less: Preferred stock dividends and accretion and other 219 216 220 189 182 189 184 175
Wells Fargo net income applicable to common stock $ 3,888 3,839 3,728 3,570 3,232 3,150 2,878 2,372
Per share information
Earnings per common share $ 0.74 0.73 0.70 0.68 0.62 0.60 0.55 0.46 Diluted earnings per common share 0.73 0.72 0.70 0.67 0.61 0.60 0.55 0.45
Dividends declared per common share 0.12 0.12 0.12 0.12 0.05 0.05 0.05 0.05 Average common shares outstanding 5,271.9 5,275.5 5,286.5 5,278.8 5,256.2 5,240.1 5,219.7 5,190.4
Diluted average common shares outstanding 5,317.6 5,319.2 5,331.7 5,333.1 5,293.8 5,273.2 5,260.8 5,225.2 Market price per common share (1):
High $ 27.97 29.63 32.63 34.25 31.61 28.77 34.25 31.99 Low 22.61 22.58 25.26 29.82 23.37 23.02 25.52 26.37
Quarter-end 27.56 24.12 28.06 31.71 30.99 25.12 25.60 31.12
(1) Based on daily prices reported on the New York Stock Exchange Composite Transaction Reporting System.
232
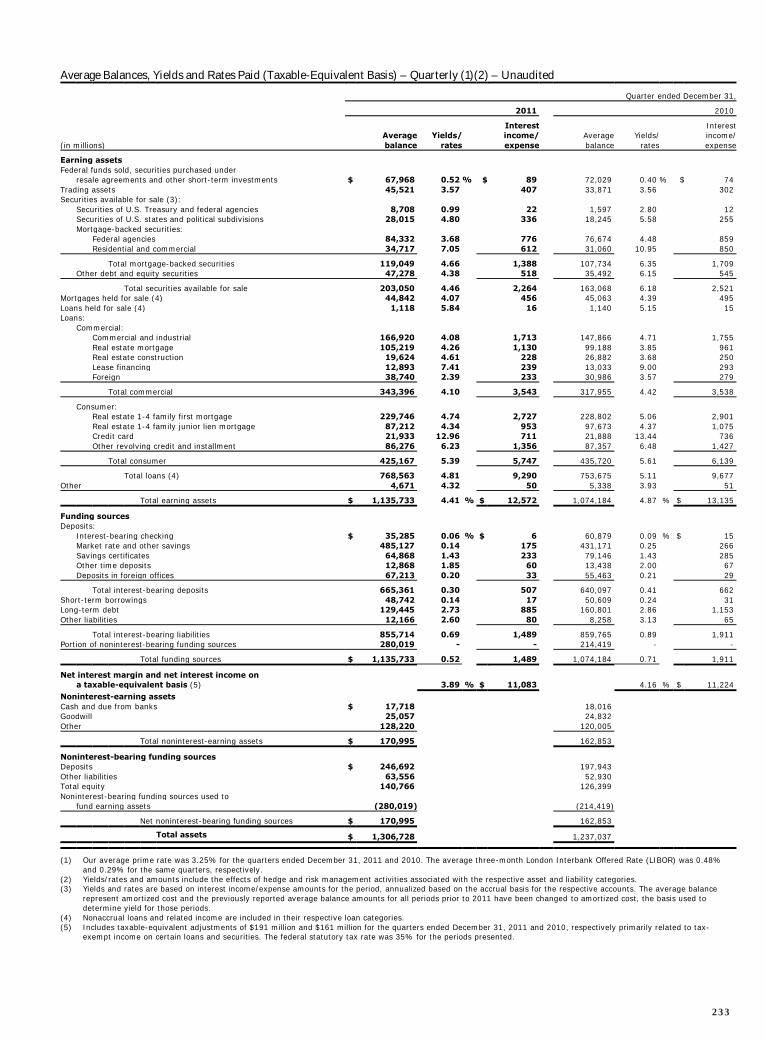
Average Balances, Yields and Rates Paid (Taxable-Equivalent Basis) – Quarterly (1)(2) – Unaudited
Quarter ended December 31,
2011 2010
Interest Interest Average Yields/ income/ Average Yields/ income/ (in millions) balance rates expense balance rates expense
Earning assets Federal funds sold, securities purchased under resale agreements and other short-term investments $ 67,968 0.52 % $ 89 72,029 0.40 % $ 74 Trading assets 45,521 3.57 407 33,871 3.56 302 Securities available for sale (3): Securities of U.S. Treasury and federal agencies 8,708 0.99 22 1,597 2.80 12 Securities of U.S. states and political subdivisions 28,015 4.80 336 18,245 5.58 255 Mortgage-backed securities: Federal agencies 84,332 3.68 776 76,674 4.48 859 Residential and commercial 34,717 7.05 612 31,060 10.95 850
Total mortgage-backed securities 119,049 4.66 1,388 107,734 6.35 1,709 Other debt and equity securities 47,278 4.38 518 35,492 6.15 545
Total securities available for sale 203,050 4.46 2,264 163,068 6.18 2,521 Mortgages held for sale (4) 44,842 4.07 456 45,063 4.39 495 Loans held for sale (4) 1,118 5.84 16 1,140 5.15 15 Loans: Commercial: Commercial and industrial 166,920 4.08 1,713 147,866 4.71 1,755 Real estate mortgage 105,219 4.26 1,130 99,188 3.85 961 Real estate construction 19,624 4.61 228 26,882 3.68 250 Lease financing 12,893 7.41 239 13,033 9.00 293 Foreign 38,740 2.39 233 30,986 3.57 279
Total commercial 343,396 4.10 3,543 317,955 4.42 3,538
Consumer: Real estate 1-4 family first mortgage 229,746 4.74 2,727 228,802 5.06 2,901 Real estate 1-4 family junior lien mortgage 87,212 4.34 953 97,673 4.37 1,075 Credit card 21,933 12.96 711 21,888 13.44 736 Other revolving credit and installment 86,276 6.23 1,356 87,357 6.48 1,427
Total consumer 425,167 5.39 5,747 435,720 5.61 6,139
Total loans (4) 768,563 4.81 9,290 753,675 5.11 9,677 Other 4,671 4.32 50 5,338 3.93 51
Total earning assets $ 1,135,733 4.41 % $ 12,572 1,074,184 4.87 % $ 13,135
Funding sources Deposits: Interest-bearing checking $ 35,285 0.06 % $ 6 60,879 0.09 % $ 15 Market rate and other savings 485,127 0.14 175 431,171 0.25 266 Savings certificates 64,868 1.43 233 79,146 1.43 285 Other time deposits 12,868 1.85 60 13,438 2.00 67 Deposits in foreign offices 67,213 0.20 33 55,463 0.21 29
Total interest-bearing deposits 665,361 0.30 507 640,097 0.41 662 Short-term borrowings 48,742 0.14 17 50,609 0.24 31 Long-term debt 129,445 2.73 885 160,801 2.86 1,153 Other liabilities 12,166 2.60 80 8,258 3.13 65
Total interest-bearing liabilities 855,714 0.69 1,489 859,765 0.89 1,911 Portion of noninterest-bearing funding sources 280,019 - - 214,419 - -
Total funding sources $ 1,135,733 0.52 1,489 1,074,184 0.71 1,911
Net interest margin and net interest income on a taxable-equivalent basis (5) 3.89 % $ 11,083 4.16 % $ 11,224 Noninterest-earning assets Cash and due from banks $ 17,718 18,016 Goodwill 25,057 24,832 Other 128,220 120,005
Total noninterest-earning assets $ 170,995 162,853
Noninterest-bearing funding sources Deposits $ 246,692 197,943 Other liabilities 63,556 52,930 Total equity 140,766 126,399 Noninterest-bearing funding sources used to fund earning assets (280,019) (214,419)
Net noninterest-bearing funding sources $ 170,995 162,853
Total assets $ 1,306,728 1,237,037
(1) Our average prime rate was 3.25% for the quarters ended December 31, 2011 and 2010. The average three-month London Interbank Offered Rate (LIBOR) was 0.48% and 0.29% for the same quarters, respectively.
(2) Yields/rates and amounts include the effects of hedge and risk management activities associated with the respective asset and liability categories. (3) Yields and rates are based on interest income/expense amounts for the period, annualized based on the accrual basis for the respective accounts. The average balance
represent amortized cost and the previously reported average balance amounts for all periods prior to 2011 have been changed to amortized cost, the basis used to determine yield for those periods.
(4) Nonaccrual loans and related income are included in their respective loan categories. (5) Includes taxable-equivalent adjustments of $191 million and $161 million for the quarters ended December 31, 2011 and 2010, respectively primarily related to tax-
exempt income on certain loans and securities. The federal statutory tax rate was 35% for the periods presented.
233

Glossary of Acronyms
ACL Allowance for credit losses
ALCO Asset/Liability Management Committee
ARS Auction rate security
ASU Accounting Standards Update
ARM Adjustable-rate mortgage
AVM Automated valuation model
BCBS Basel Committee on Bank Supervision
BHC Bank holding company
CD Certificate of deposit
CDO Collateralized debt obligation
CFPB Consumer Finance Protection Bureau
CLO Collateralized loan obligation
CLTV Combined loan-to-value
CPP Capital Purchase Program
CPR Constant prepayment rate
CRE Commercial real estate
DPD Days past due
ESOP Employee Stock Ownership Plan
FAS Statement of Financial Accounting Standards
FASB Financial Accounting Standards Board
FDIC Federal Deposit Insurance Corporation
FFELP Federal Family Education Loan Program
FHA Federal Housing Administration
FHLB Federal Home Loan Bank
FHLMC Federal Home Loan Mortgage Company
FICO Fair Isaac Corporation (credit rating)
FNMA Federal National Mortgage Association
FRB Board of Governors of the Federal Reserve System
GAAP Generally accepted accounting principles
GNMA Government National Mortgage Association
GSE Government-sponsored entity
G-SIB Globally systemic important bank
HAMP Home Affordability Modification Program
HPI Home Price Index
HUD Department of Housing and Urban Development
LHFS Loans held for sale
LIBOR London Interbank Offered Rate
LOCOM Lower of cost or market value
LTV Loan-to-value
MBS Mortgage-backed security
MERS Mortgage Electronic Registration Systems, Inc.
MHA Making Home Affordable programs
MHFS Mortgages held for sale
MSR Mortgage servicing right
MTN Medium-term note
NAV Net asset value
NPA Nonperforming asset
OCC Office of the Comptroller of the Currency
OCI Other comprehensive income
OTC Over-the-counter
OTTI Other-than-temporary impairment
PCI Loans Purchased credit-impaired loans
PTPP Pre-tax pre-provision profit
RBC Risk-based capital
ROA Wells Fargo net income to average total assets
ROE Wells Fargo net income applicable to common stock to average Wells Fargo common stockholders' equity
SEC Securities and Exchange Commission
S&P Standard & Poor’s
SPE Special purpose entity
TARP Troubled Asset Relief Program
TDR Troubled debt restructuring
VA Department of Veterans Affairs
VaR Value-at-risk
VIE Variable interest entity
WFCC Wells Fargo Canada Corporation
WFFI Wells Fargo Financial, Inc. and its wholly-owned subsidiaries
234
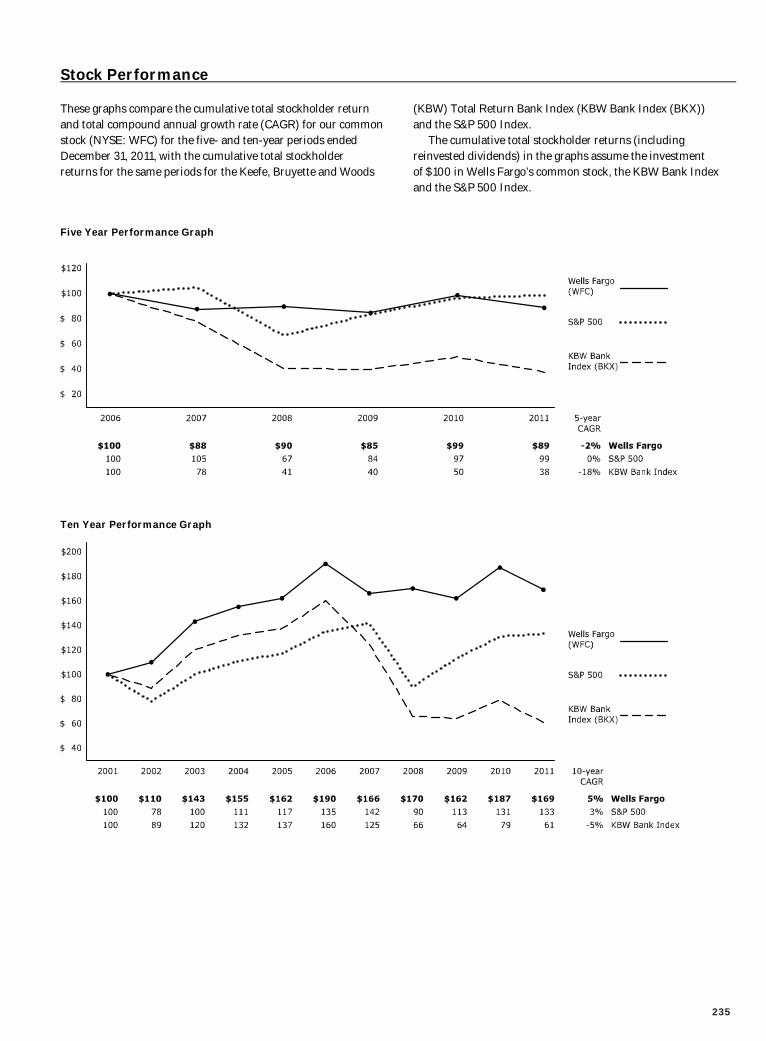
235
Stock Performance
These graphs compare the cumulative total stockholder return and total compound annual growth rate (CAGR) for our common stock (NYSE: WFC) for the five- and ten-year periods ended December 31, 2011, with the cumulative total stockholder returns for the same periods for the Keefe, Bruyette and Woods
(KBW) Total Return Bank Index (KBW Bank Index (BKX))and the S&P 500 Index.
The cumulative total stockholder returns (including reinvested dividends) in the graphs assume the investment of $100 in Wells Fargo’s common stock, the KBW Bank Index and the S&P 500 Index.
Five Year Performance Graph
Ten Year Performance Graph

Common stock
Wells Fargo & Company is listed and trades on the
New York Stock Exchange: WFC
5,262,611,636 common shares outstanding (12/31/11)
Stock purchase and dividend reinvestment
You can buy Wells Fargo stock directly from Wells Fargo,
even if you’re not a Wells Fargo stockholder, through
optional cash payments or automatic monthly deductions
from a bank account. You can also have your dividends
reinvested automatically. It’s a convenient, economical
way to increase your Wells Fargo investment.
Call 1−877−840−0492 for an enrollment kit including
a plan prospectus.
Form 10-K
We will send Wells Fargo’s 2011 Annual Report on
Form 10−K (including the financial statements filed with
the Securities and Exchange Commission) free to any
stockholder who asks for a copy in writing. Stockholders
also can ask for copies of any exhibit to the Form 10−K.
We will charge a fee to cover expenses to prepare and send
any exhibits. Please send requests to: Corporate Secretary,
Wells Fargo & Company, Wells Fargo Center, MAC
N9305−173, Sixth and Marquette, Minneapolis, MN 55479.
SEC filings
Our annual reports on Form 10−K, quarterly reports
on Form 10−Q, current reports on Form 8−K, and
amendments to those reports are available free of charge
on our website (www.wellsfargo.com) as soon as practical
after they are electronically filed with or furnished to the
SEC. Those reports and amendments are also available
free of charge on the SEC’s website at www.sec.gov.
Independent registered public
accounting firm
KPMG LLP
San Francisco, California
1−415−963−5100
Contacts
Investor Relations
1−415−371−2921
Shareholder Services and
Transfer Agent
Wells Fargo Shareowner Services
P.O. Box 64854
Saint Paul, Minnesota 55164−0854
1−877−840−0492
www.wellsfargo.com/com/
shareowner_services
Annual Stockholders’ Meeting
1:00 p.m., Tuesday, April 24, 2012
Julia Morgan Ballroom
Merchants Exchange Building
465 California Street
San Francisco, California
Our reputation
American Banker Most Powerful Women in Banking;
One of America’s Top Banking Teams
American Customer Satisfaction
Index (ACSI)
America’s #1 Large Bank for
Customer Satisfaction
Bank Technology News�/ American Banker Top Innovator for Wells Fargo Mobile
and ATM Services
BLACK ENTERPRISE One of the Top 40 Best Companies
for Diversity
Brand Finance The Most Valuable Bank Brand
in the U.S. (2012)
Brand Z Among the Top 20 Most Valuable
Brands in the World
Wells Fargo & Company
Forward−Looking Statements This Annual Report, including the Financial Review and the Financial Statements and related Notes, contains forward−
looking statements, which may include forecasts of our financial results and condition, expectations for our operations and business, and our
assumptions for those forecasts and expectations. Do not unduly rely on forward−looking statements. Actual results may differ materially from our
forward−looking statements due to several factors. Some of these factors are described in the Financial Review and in the Financial Statements and
related Notes. For a discussion of other factors, refer to “Forward−Looking Statements” and “Risk Factors” in the Financial Review.
CAREERS & the disABLED Among Top 50 Employers
by Readers Choice
CIO Among the Top 100 Companies for
Technology Innovations that Advance
Business Results
DiversityInc Among Top 50 Companies for
Diversity, Top 10 Companies for
Asian Americans, Top 10 Companies
for Lesbian, Gay, Bisexual, and
Transgender Employees
Forbes Top 20 Biggest Public Companies
in the World
Fortune World’s 41st Most Admired Company,
23rd in Revenue Among All Companies
in All Industries
Global Finance Best Consumer and Corporate/
Institutional Internet Banks in the U.S.
Human Rights Campaign
Perfect Score on Corporate
Equality Index
LATINAStyle 12th Best Company for Latinas
The Chronicle of Philanthropy America’s Third Most Generous
Cash Donor
236
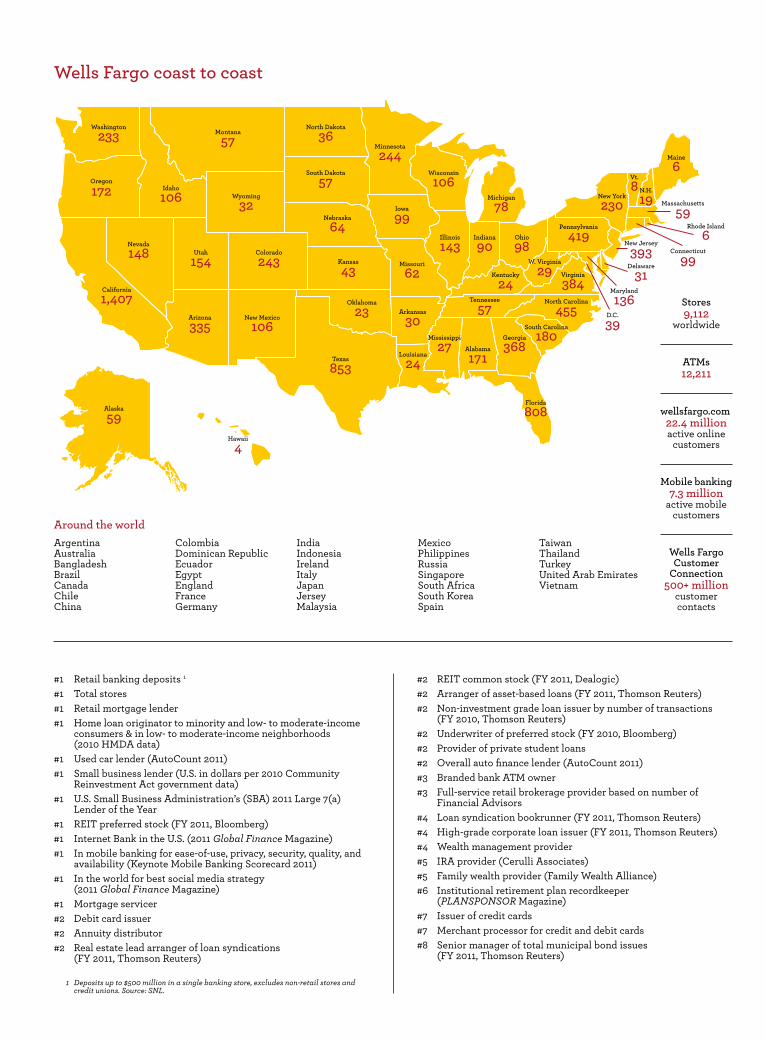
Washington
233
Oregon
172 Idaho
106
Montana
57
Colorado
243
North Dakota
36
South Dakota
57
Nebraska
64
California
1,407
Nevada
148 Utah
154
Wyoming
32
Arizona
335New Mexico
106
Kansas
43
Oklahoma
23
Texas
853
Minnesota
244
Iowa
99
Wisconsin
106Michigan
78
Missouri
62
Illinois
143Indiana
90Ohio
98
Kentucky
24Tennessee
57Arkansas
30
Louisiana
24
Mississippi
27 Alabama
171Georgia
368
Florida
808
South Carolina
180
North Carolina
455
Virginia
384
W. Virginia
29
Pennsylvania
419
New York
230
Maine
6N.H.
19
Vt.
8
New Jersey
393
Massachusetts
59Rhode Island
6Connecticut
99
D.C.
39
Maryland
136
Hawaii
4
Alaska
59
Delaware
31
LITTLE&COMPANY LITTLE&COMPANY
Wells Fargo coast to coast
#1 Retail banking deposits 1
#1 Total stores#1 Retail mortgage lender#1 Home loan originator to minority and low- to moderate-income
consumers & in low- to moderate-income neighborhoods(2010 HMDA data)
#1 Used car lender (AutoCount 2011)#1 Small business lender (U.S. in dollars per 2010 Community
Reinvestment Act government data)#1 U.S. Small Business Administration’s (SBA) 2011 Large 7(a)
Lender of the Year#1 REIT preferred stock (FY 2011, Bloomberg)#1 Internet Bank in the U.S. (2011 Global Finance Magazine)#1 In mobile banking for ease-of-use, privacy, security, quality, and
availability (Keynote Mobile Banking Scorecard 2011)#1 In the world for best social media strategy
(2011 Global Finance Magazine)#1 Mortgage servicer#2 Debit card issuer#2 Annuity distributor#2 Real estate lead arranger of loan syndications
(FY 2011, Thomson Reuters)
#2 REIT common stock (FY 2011, Dealogic)#2 Arranger of asset-based loans (FY 2011, Thomson Reuters)#2 Non-investment grade loan issuer by number of transactions
(FY 2010, Thomson Reuters)#2 Underwriter of preferred stock (FY 2010, Bloomberg)#2 Provider of private student loans#2 Overall auto finance lender (AutoCount 2011)#3 Branded bank ATM owner#3 Full-service retail brokerage provider based on number of
Financial Advisors#4 Loan syndication bookrunner (FY 2011, Thomson Reuters)#4 High-grade corporate loan issuer (FY 2011, Thomson Reuters)#4 Wealth management provider#5 IRA provider (Cerulli Associates)#5 Family wealth provider (Family Wealth Alliance)#6 Institutional retirement plan recordkeeper
(PLANSPONSOR Magazine)#7 Issuer of credit cards#7 Merchant processor for credit and debit cards#8 Senior manager of total municipal bond issues
(FY 2011, Thomson Reuters)
Around the worldArgentinaAustraliaBangladeshBrazilCanadaChileChina
ColombiaDominican RepublicEcuadorEgyptEnglandFranceGermany
IndiaIndonesiaIrelandItalyJapanJerseyMalaysia
MexicoPhilippinesRussiaSingaporeSouth AfricaSouth KoreaSpain
TaiwanThailandTurkeyUnited Arab EmiratesVietnam
Stores9,112
worldwide
ATMs12,211
wellsfargo.com22.4 millionactive online
customers
Mobile banking7.3 million
active mobilecustomers
Wells FargoCustomer
Connection500+ million
customercontacts
© 2012 Wells Fargo & Company. All rights reserved.
1 Deposits up to $500 million in a single banking store, excludes non-retail stores andcredit unions. Source: SNL.
Today’s Wells Fargo is a coast-to-coast company with vastreach. We touch people and businesses billions of times a year — at least 5 billion times a year in the Community Bank alone.But we never forget that financial services is a people business.Working one on one with customers to help them with thedecisions they face every day is at the core of who we are.
First we listen to customers like Tony Williamson, who starteda Minnesota-based IT staffing business, Ajasa Technologies,with his wife, Shelley, in 1995. Then we offer guidance andsolutions. Wells Fargo helped their business with credit tomanage cash flow. Now Ajasa Technologies has 400 employeesand is developing mobile applications for digital payments.
“You can’t do what you were doing a year ago,” said Williamson.“You have to change, and Wells Fargo has helped us adapt.”
Multiply that times our more than 270,000 team members whoshare the same spirit. New opportunities. Unchanging vision.
112 Controls and Procedures
114 Financial Statements
231 Report of Independent Registered Public Accounting Firm
235 Stock Performance
2 To our owners
10 70,000,000 opportunities
23 Board of Directors, Senior Leaders
25 Financial Review
Wells Fargo & Company(NYSE:WFC)
We’re a diversified financial services company — community-based and relationship-oriented — serving people across the nation and around the world.
Our corporate headquarters is in San Francisco,but all our stores, regional commercial banking centers,ATMs, Wells Fargo Phone Bank,SM and internet sitesare headquarters for satisfying all our customers’financial needs and helping them succeed financially,through banking, insurance, investments, mortgage,and commercial and consumer finance.
Assets: $1.3 trillion, 4th among all U.S. banks
Market value of stock: $145 billion,1st among all U.S. banks (12/31/11)
Customers: 70 million,(one of every three U.S. households)
team members: More than 270,000(full time and part time)
Stores: 9,112
80478_L2_Cover.indd 2 2/22/12 2:19 AM

LITTLE&COMPANY LITTLE&COMPANY
New opportunities. Unchanging vision.
“The reason we wake up in the morning is to help ourcustomers succeed financially and to satisfy all theirfinancial needs. The result is we make money becauseof our focus on serving customers, not the other wayaround. This time-tested vision will forever be whatmatters to Wells Fargo. We’ll never put the stagecoachahead of the horses.”— John G. Stumpf, Chairman, President and Chief Executive Officer
Wells Fargo & Company 420 Montgomery Street San Francisco, California 94104
1-866-878-5865 wellsfargo.com
WE
LLS FAR
GO
WE
LL
S F
AR
GO
& C
OM
PA
NY
20
11 AN
NU
AL
RE
PO
RT
NE
WO
pp
OR
tu
Nit
iES.u
NC
hA
NG
iNG
viSiO
N.
Wells Fargo & Company Annual Report 2011
Together we’ll go far
Our vision:Satisfy all our customers’ financial needs and help themsucceed financially.
Nuestra vision:Deseamos satisfacer todas las necesidades financierasde nuestros clientes y ayudarlos a tener éxito en elárea financiera.
Notre vision:Satisfaire tous les besoins financiers de nos clientset les aider à atteindre le succès financier.
80478_L2_Cover.indd 1 2/22/12 2:19 AM