Well-Being in Italian Regions. Measures, Civil Society ...
32
Well-Being in Italian Regions. Measures, Civil Society consultation and Evidence * Tommaso Rondinella † Elisabetta Segre ‡ Massimiliano Mascherini § November 2009 Abstract Efforts recently attempted to integrate various aspects of economic progress, environ- mental sustainability and social welfare into an aggregate measure of wellbeing share one major weakness concerning the identification of key aspects of wellbeing and of weights to aggregate these dimensions, they all suffer from lack of legitimacy. In this paper we present an innovative and well tested approach that attempts to overcome such limitation granting legitimacy through a broad consultation of civil society organisations. After a brief review of the state of the art, we present the methodology followed to build the QUARS (Index of Regional Quality of Development) and we point out strengths and weaknesses of our ap- proach. We summarize the results according to the selected variables for Italian regions, we present the outcomes of our dissemination work and assess the robustness of the composite indicator. * We acknowledge Mario Pianta, Giulio Marcon, Alessandro Messina, Maurizio Franzini, Paolo Palazzi. We have also benefited from useful discussion with Anna Villa, Angelo Marano, Alessandro Santoro, Andrea Calori, Alberto Tarozzi, Grazia Naletto, Gianfranco Bologna, Stefano Inglese. Financial support has been provided by Lunaria. † Lunaria Association, Via Buonarroti 39, 00186 Rome. Tel: +39068841880; fax: +39068841880; email address: [email protected] ‡ Department of Economics, Sapienza University of Rome, P.le Aldo Moro 5, 00185 Rome. Fax: +39064453246; email address: [email protected] § European Foundation for the Improvement of Living and Working Conditions, Wyattville Road Loughlinstown 18 Dublin; email address: [email protected]
Transcript of Well-Being in Italian Regions. Measures, Civil Society ...

Well-Being in Italian Regions.
Measures, Civil Society consultation and Evidence ∗
Tommaso Rondinella† Elisabetta Segre‡ Massimiliano Mascherini§
November 2009
Abstract
Efforts recently attempted to integrate various aspects of economic progress, environ-mental sustainability and social welfare into an aggregate measure of wellbeing share onemajor weakness concerning the identification of key aspects of wellbeing and of weights toaggregate these dimensions, they all suffer from lack of legitimacy. In this paper we presentan innovative and well tested approach that attempts to overcome such limitation grantinglegitimacy through a broad consultation of civil society organisations. After a brief reviewof the state of the art, we present the methodology followed to build the QUARS (Indexof Regional Quality of Development) and we point out strengths and weaknesses of our ap-proach. We summarize the results according to the selected variables for Italian regions, wepresent the outcomes of our dissemination work and assess the robustness of the compositeindicator.
∗We acknowledge Mario Pianta, Giulio Marcon, Alessandro Messina, Maurizio Franzini, Paolo Palazzi. We
have also benefited from useful discussion with Anna Villa, Angelo Marano, Alessandro Santoro, Andrea Calori,
Alberto Tarozzi, Grazia Naletto, Gianfranco Bologna, Stefano Inglese. Financial support has been provided by
Lunaria.†Lunaria Association, Via Buonarroti 39, 00186 Rome. Tel: +39068841880; fax: +39068841880; email address:
[email protected]‡Department of Economics, Sapienza University of Rome, P.le Aldo Moro 5, 00185 Rome. Fax: +39064453246;
email address: [email protected]§European Foundation for the Improvement of Living and Working Conditions, Wyattville Road Loughlinstown
18 Dublin; email address: [email protected]

1 Introduction
During the last few decades a large number of indicators has been developed to overcome the
limits of GDP as a measure of well-being and to assess the impact of policies. From a method-
ological point of view such efforts had to cope with three central issues which make the GDP
an unsatisfactory measure of progress - meant here as a sustainable pattern of well-being (see
Stiglitz, Sen, and Fitoussi 2008). First, GDP is an aggregate measure: the aggregation allows
for compensation (e.g. distributional issues: an increase in the well-being of the best off can
offset a decrease in the well-being of the worst off), needs the identification of a weighting sys-
tem and hides distributional issues. Second, the metric is exclusively monetary: weights are set
by markets through prices, implying that some goods or services with no market, e.g. natural
services and household work, weight zero and therefore are not included in accounting. Finally,
GDP measures only productive flows, ignoring the impact on stocks, in particular natural and
social capital.
Beyond these methodological issues, a further problem needs to be stressed: the overcome
of GDP is mainly a cultural and political process rather than a merely methodological issue.
Even if the academy would converge on a widely accepted measure of well-being which solves all
methodological challenges, this would not be a guarantee for a rapid switch from GDP to this
new measure. In other words, new measures of well-being have in common with GDP a lack of
legitimacy 1. Legitimacy establishes a right to rule for the policy makers and an obligation to
obey for citizens. Such rules should be able to keep (or bring) the society on a path towards
well-being, sustainability and progress. The problem rises when there is no collective agreement
on what well-being and progress are and therefore on how to measure them. In the last decades
it has been taken for granted that economic growth is able to lead automatically to higher living
standards. After the Second World War the developed economies experienced an unprecedented
phase of economic growth that had extraordinary consequences from the point of view of living
standards. The pro capita GDP gained legitimacy and became the basic indicator of welfare and1“Legitimacy is a shared expectation among actors in an arrangement of asymmetric power, such that the
actions of those who rule are accepted voluntarily by those who are ruled because the latter are convinced that
the actions of the former conform to pre-established norms” Schmitter (2001).
1

the fundamental criterion for measuring the level of well-being, although even Kuznet, the creator
of GDP, stated that “the welfare of a nation can scarcely be inferred from a measurement of
national income” (Kuznet 1934) . Starting from the late seventies a growing number of academic
works have shown how an increase in GDP might be generated by activities that are socially
considered harmful to individuals, society and the environment, suggesting that policies oriented
merely at an increase in GDP might lead to a failure in meeting policy objectives connected to
well-being and sustainability. Nevertheless things have slightly change at political level, mainly
because those are academic experiment with a rather scarce legitimacy. A democratic process
is needed in order to foster a change in collective goals. Along with the change in goals goes the
change in indicators.
To try to address this challenge, the Italian civil society campaign Sbilanciamoci supported
by a team of experts set up a wide consultation of its network of organizations, more than
40 based at national level, in order to learn the civil society’s priorities, i.e. identification of
variables and weights, and at same time to grant legitimacy to the selected variables and to
the way they are combined. This process allowed us to identify key dimensions and variables,
that have finally been combined in a composite indicator (QUARS) using standard and sound
statistical methodology. Once the index was ready, the campaign started a parallel work of
dissemination and political pressure on local Governments and Institutions.
The structure of the paper is as follows. After a review of the literature on well-being indexes,
section 1, in section 2 we present our methodology both for the consultation process and for
the building of the composite index. In section 3 we summarize empirical findings and political
results. Section 4 presents the result of uncertainty and sensitivity analysis conducted in order
to check the robustness of our index, while section 5 draws conclusions.
2 Related Literature
A possible classification of the literature on alternative indicators might be run looking at the
GDP’s shortcoming that those indicators attempt to overcome. The bulk of the literature is
made by aggregate indicators. Some try to integrate the information contained in GDP finding
2

solutions to monetize those goods and services with no markets; others aggregate social, economic
and environmental variables into a composite indicator.
The construction of aggregate indicators involves stages where judgement has to be made in
particular with regard to two central issues: the selection of sub-indicators and how to weigh
them. The choice of variables is usually done according to the discretion of the index constructor,
whose choice may be supported by a consultation process (either with experts or more in general
with stakeholders) and/or by statistical tools to minimize correlation between variables. Two
steps in this procedure are too often neglected. In the vast majority of examples the concepts
to be measured are not made explicit, whether this being environmental sustainability, social
well-being or their combination. The definition of the concept is therefore made explicit by the
variables used to build the composite index. Seemingly it may exists a discrepancy between
the chosen variables and what available indicators are able to measure. Therefore the ability of
variables and indicators to well describe the concept is usually taken for granted.
The second central issue in the debate on composite indicators is the way the variables are
aggregated, i.e. choice of weights and aggregation methodology.
In the vast majority of cases the definition of progress, the consequent selection of relevant
dimensions and eventually the decision on the weighting system is made by academic experts.
Therefore the relevant literature can be classified accordingly to different aggregation procedures.
Two major ways to aggregate variables are identified by Gadrey and Jany-Catrice (2003).
One is the monetisation and consequent adding up in the tradition of GDP. In this case weights
are set by markets which can be either real or artificial (shadow prices). The main target
becomes the correction of GDP in order to turn it into a more complete measure of sustainable
well-being (e.g., the MEW, Measure of Sustainable Welfare, developed by Nordhaus and Tobin
(1971)). The Index of Sustainable Economic Welfare (ISEW) (Daly and Cobb 1991) is one of
the most advanced attempts to create an indicator of economic welfare. Its main objective is to
measure the portion of economic activity that delivers welfare to people. The ISEW composite
indicator, which in 1994 turned into the widely known Genuine Progress Indicator, is calculated
as the simple arithmetic average of the indicators considering the positive and negative signs of
3

the various sub-indicators relatively to their impact on well-being.
Many examples of combination of variables through the use of weights other than prices are
present in literature. Prepared by UNDP (1990), the Human Development Index (HDI) is proba-
bly the most famous example. The HDI is calculated as the arithmetic average of three variables
equally weighted: life expectancy, education and income per capita. An hybrid procedure that
combines composite and monetary frameworks is the Index of Economic Well-Being developed
by Osberg and Sharpe (Osberg and Sharpe 2002). It identifies four dimensions of well-being:
average consumption flows, aggregate accumulation of stocks of productive resources, inequal-
ities in income distribution, insecurity in the anticipation of future income. Among the most
influential composite indexes are the Index of Human Well-Being by Prescott-Allen (2001), a
re-scaling of twenty socio-economic variables, and the combination of normalization and princi-
pal component analysis performed by Rahman et al. (2005). While these examples attempt to
measure social welfare and environmental sustainability, the Ecological Footprint (Wackernagel
and Rees 1996) exclusively monitors the relationships between economy and environment, with-
out going deeply into considerations about social well-being. Within the framework of social
metabolism (Fisher-Kowalski 1998) the Material Input Service (MIPS) developed by the Wup-
pertal Institute has to be quoted. The MIPS sums the material used directly or indirectly for
each production service unit measured in tons. Although integration is a difficult process, it is
supported by the idea that aggregated indicators are statistically valid and that the creation
of a bottom line is much more useful in gathering media and policy makers interest than the
use of sets of indicators (Osberg and Sharpe 2002). Only few attempts try to integrate social
and environmental dimensions, aspects that are often seen in literature as substitutes. Even if
in the definition of sustainability a great importance is given to social conditions (according to
the definition made by the Brundtland commission in 1989 sustainability means to meet the
needs of the present generations without compromising the ability of future generations to meet
their own needs), most works move from the consideration that it exists a trade-off between
the two dimensions and therefore composite indicators concentrate on only one aspect 2. Some2Basically, one can consider the two separate notions: a high level of current well-being can be achieved at
the price of lower sustainability; while conversely higher sustainability today may imply lower current well-being.
4

exceptions exist, though. We already quoted the GPI that monetizing environmental goods and
services integrates different dimensions. We can further quote here the attempt made by the
New Economic Foundation that developed the Happy Planet Index, i.e. a composite index that
aims to measure the ecological efficiency with which well-being -in particular “happy life years”-
is delivered (NEF 2006).
Examples of non-aggregative sets of indicators include OECD Society at a Glance (OECD
2006), a set of 33 specific indicators grouped into eight areas in order to assess social needs and
social policy challenges for developed countries. The OECD motivation for developing this set is
to identify what have been the major social developments in OECD countries. A wider approach,
extended to most countries in the world and to economic and environmental variables, is the
one of the World Development Indicators produced every year by the World Bank (WorldBank
2007) and the one produced by the Commission on Sustainable Development of the UNDP (CSD
1995). The Sustainable Development Strategy of the European Union is supported as well by
a set of indicators for the 27 members of the Union: the Sustainable Development Indicators
(SDI) defined by Eurostat (http://europa.eu.int/comm/eurostat). A similar set of indicators,
but from a civil society point of view, is the one collected by Social Watch in order to monitor in
most countries the objectives set by the United Nations in the Copenhagen and Beijin Summits
in 1995 (see Social-Watch 2005). Finally it is worth to mention the Dashboard of Sustainability,
which has been developed by the Joint Research Centre of the European Community, to provide
assistance in the decision making process (http://esl.jrc.it/envind/dashbrds.htm).
As said before, in this literature definition of progress, development or well-being, the conse-
quent selection of variables and the weighting system is done following an expert approach. As
Valentin and Spangerberg (2000) well said “Indicator development is always a two-way process.
Indicators are not only desired from policy aims, but they also help to concretize and mould
them. So developing indicators cannot be a purely technical or scientific process; rather, it
should be an open communication and policy process”. The concept is made clear in Bossel
(1999) “Experts, because they are experts, are likely to focus on issues and items of their profes-
This consideration underscores the importance of separate measures for these two concepts. (Stiglitz, Sen, and
Fitoussi 2008)
5

sional expertise while neglecting others that may have a significant effect in the real system...the
best knowledge of systems and problems, including their long-term perspective, can usually be
found with those who have to cope with them daily”. These shortcomings may be overcome ei-
ther through a political process, such as the one which led to the Millennium Development Goals
set of indicators, or through a consultation process such those usually performed at community
level Valentin and Spangerberg (2000).
3 Measuring well-being from a civil society perspective
To build a widely shared measurement of social and environmental sustainable development,
we carried out a consultation at national level able to grant legitimacy to the selected variables
and to the way they are combined (Segre and Villa 2007, and (Sbilanciamoci! 2006)). The
result is a synthetic index called QUARS3, the italian acronym for Regional Quality of Devel-
opment. It is an indicator tailored for Italian regions and based on the priorities set by the
organizations joining Sbilanciamoci! campaign. Sbilanciamoci! is a network of 46 Italian civil
society organizations active at national level on many different issues. The index had to give
a picture as complete as possible of the key dimensions of sustainable well-being according to
the view of the organizations joining the network. The consultation process is, therefore, the
central activity to better define the concept of quality of development. The QUARS is in fact
representative of a large and diverse group, yet limited to the Italian civil society, that may have
different approaches to regional development and that may fix different priorities for a desirable
development path.
At the basis of the construction of the QUARS is the identification of the variables that form
its structure. The consultation process led to a set of 41 variables that are representative, as
much as possible, of the idea of sustainable well-being that animates the work of the campaign.
The set is composed of variables of environmental, social and economic type, divided into seven
groups of the same importance. The seven groups are defined as follows:3The indicator QUARS was firstly developed by Alessandro Messina and Martino Mazzonis (Sbilanciamoci!
2005), with the scientific support of Mario Pianta, Paolo Palazzi and Giulio Marcon. The current formulation of
the index has been developed in 2006 by the authors
6

1. Environment: evaluation of the environmental impact deriving from the forms of pro-
duction, distribution and consumption and policies adopted to mitigate its effects.
2. Economy and labour: working conditions and income distribution guaranteed by the
economic system.
3. Rights and citizenship: accessibility of services and social inclusion of young people,
the elderly, underprivileged people and immigrants.
4. Education and culture: participation in the school system and quality of the structures,
education of the population, cultural activities.
5. Health: quality and efficiency of the service, proximity, general health of the population.
6. Gender Equity: absence of barriers, based on sex, against taking part in economic,
political and social life.
7. Democratic Participation: political and social participation of citizens and elements of
good governance.
It must be noticed that it has been decided not to include GDP per capita among the variables.
GDP is in fact definitely relevant for reaching a higher well-being, but it is a mean to improve
the different aspects that characterize development, it is not considered a virtue itself. The
relationship between QUARS and GDP will be better addressed in paragraph 3.1.
3.1 The origin
Sbilanciamoci! is a campaign involving 46 associations, NGOs and networks 4 active on social
issues, solidarity, environment, civil rights promotion, education and health monitoring, con-
sumer protection and alternative economic activities, from fair trade to ethical banking. Since4Aiab, Altreconomia, Antigone, Arci, Arci Cultura e Sviluppo, Arci Servizio Civile, Associazione Obiettori
Nonviolenti, Associazione per la Pace, Beati i Costruttori di Pace, Campagna per la Riforma della Banca Mondi-
ale, Carta, CIPSI, Cittadinanzattiva, CNCA, COCIS, Comunita delle Piagge Firenze, Comitato italiano contratto
mondiale sull’acqua, Coop. ROBA dell’Altro Mondo, CRS, CTM Altromercato, Crocevia, Donne in nero, Emer-
gency, Emmaus Italia, Fair, Finansol, Fondazione Culturale Responsabilita Etica, GESCO, Gruppo O.Romero
SICSAL Italia, ICS, Icea, Legambiente, LILA, Lunaria, Mani Tese, Microfinanza srl, Movimento Consumatori,
Nigrizia, Pax Christi, Rete Lilliput, Rete degli Studenti, Terre des Hommes, UISP, Unione degli Studenti, Unione
degli Universitari, Un Ponte per. . . , WWF
7

2000 Sbilanciamoci! has proposed alternatives to the Italian budgetary policies, arguing for
social and environmental priorities. It pushes for a change in the perspectives behind public
policies, proposing new economic and social priorities for a solid world in which more atten-
tion is given to people’s rights and the environment instead of the needs of a market economy.
Sbilanciamoci! elaborates an annual report (Sbilanciamoci! 2009) where, after reviewing the
orientations of economic policies emerging from the Budget Law and from the State Budget,
“develops alternative proposals about how to use public expenditure”. Analysis and proposals of
the campaign are based on the different knowledge and experience of the various organizations.
The wideness of the coalition can in this way guarantee that many relevant issues for the study of
the national budget are actually covered by qualified organizations. From the analysis of public
policies rose the need of a tool able to measure and compare well-being among Italian regions
that led in 2003 to the definition of a new index. A shared vision of sustainable well-being
came directly from the previous work on public policies. In Sbilanciamoci!’s approach a region
(or a territory in general) typified by a good quality of development is a region in which the
economic dimension (production, distribution, consumption) is compatible with environmental
and social factors, where the social and health services adequately meet the needs of all the
citizens, where participation in cultural life is alive, where economic, social and political rights
and equal opportunities are guaranteed and where environment is protected.
3.2 The latent construct
The concept underneath the object of the observation (the so-called latent construct, in our case
the quality of development) was therefore already roughly defined when the idea of building a
composite indicator emerged. Nevertheless the exact definition of the sub-groups of variables had
been determined only after a first consultation of the organizations. Only the choice of the sub-
groups and of the indicators to be used provides the real definition of the concept. In this sense
the QUARS can be certainly considered a composite indicator built following a formative model.
In a formative model the latent construct is dependent upon a “constructivist, operationalist
or instrumentalist interpretation by the scholar” (Borsboom et al. 2003), in our case upon the
interpretation of the representatives of the civil society organizations. Following the theoretical
8
considerations highlighted by Coltman et al. (2008) the nature of the construct itself suggests a
formative approach. In fact the quality of development does not exist as an independent entity,
it covers a very broad domain, it is multidimensional and it can be very diverse according to
different people: the selected indicators are thus defining the concept. Moreover, the causal effect
flows from the indicators to the concept, a change in selected indicators would change at the
same time the quality of development of a region, and finally a different choice of indicators or of
sub-groups (here called dimensions) would change the conceptual domain of the construct. The
concept itself is then limited by data availability. The selection of the indicators has been done
starting from the list of all freely available indicators for Italian regions, a strong limitation in
the definition of a complex concept. During the discussions that led to the indicators’ selection,
the need for including specific indicators that were not available has in fact emerged many times.
Data like average wage by sex at regional level, access to social housing and quota of military
expenditure on total R&D , for example, could not be included into the formulation of the index
and therefore into the definition of the latent construct.
3.3 The consultation process
In order to select the sub-groups and the single indicators a three phases consultation was
carried out. The first phase was dedicated to the definition of the sub-groups. It started
from a version of the index developed by think tank Lunaria that appeared still weak and
inconsistent. A few meetings have been held with representatives of the organizations, with the
coordinators and with a few professors of the scientific entourage of the campaign so to reach
a first framework of analysis represented by seven dimensions: environment, economy, social
inclusion, education, health, gender equity, democratic participation. This first framework of
analysis was not constrained by data availability. Through these dimensions Sbilanciamoci!
campaign tried to provide the priorities to take care of when a territory is characterized by
sustainable level of well-being. During the first phase clearly emerged that the final objective
of building a composite indicator by a civil society campaign was the provision of a tool for
policy makers. It has soon appeared clear that the QUARS should consider relevant issues able
to represent policy objectives at local or national level. On one side the QUARS represents an
9
alternative vision of development with respect to the “economy centred” ones, on the other side
it is an indicator on which policy makers can intervene quite directly. This approach allows the
identification of direct interlocutors to the campaign as well as to the local civil society in Italian
regions that can use the QUARS as an advocacy tool. Yet it has been decided to exclude public
expenditure (that was included in the first version of the index) since it provides no information
on how the money have been actually spent for, including in the index only output measures.
The choice between producing a composite index or maintaining the whole set of variables was
discussed as well during the first phase. Although the cons of merging all the variables into a
single number have been presented, the effectiveness of a tool able to compare Italian regions
and to produce rankings was the most important aspect when taking into considerations the
aims of a civil society campaign that needs to spread as much as possible the idea underlying
the index. A single number, as well as the seven sub-groups which are composite indicators
themselves, attracts easily the attention of the media, of the public and of policy makers. A
single number to refer to is more effective in advocacy activity and can become an identification
mark for the campaign. The analysis of all the variables separately is anyway produced in order
to show the reasons behind the general results.
The second phase has been dedicated to more restricted meetings between the authors and
experts on the different issues in order to choose the indicators to be actually used for a good
definition of the latent construct. A list of hundreds of available regional statistics has been
produced by the authors in order to carry out this phase and select the indicators out of the
available ones. All data considered come from institutional sources and are freely available. Not
all of them refer to the same year and a few are not updated every year. For the index calculated
in 2009, years are ranging between 2005 and 2009 with a couple of exceptions. (See Appendix A
for a complete list of indicators, years and sources). Since at this point it was already clear that
the methodology for aggregating the composite indicator would have been of equal weighting
(see paragraph 2.4), the experts have been asked to provide a set of variables able to cover the
relevant aspects of each issue trying to find as well an equilibrium among the selected indicators.
The consultations have led also to the definition of some sub-composite-indicators still based
10

on official data. Some of them are indexes produced by civil society organizations, such as the
indexes of eco-mafia, eco-management and school ecosystem produced by Legambiente or social
assistance by Associazione Nuovo Welfare and healthcare waiting lists by Cittadinanzattiva,
while some others has been elaborated only for the QUARS, like the ones on mobility, on labour
precariousness and on migrants’ integration. They will be better presented in paragraph 2.5.
The third and last phase of the consultation process was aimed at the finalisation of the set
of variables. In this phase all the organizations and the experts surrounding the campaign have
been asked an opinion on the overall structure and on the internal equilibrium of the index. The
final output of the consultation is a set of 41 variables grouped into seven categories. During
the last three years a few small changes were brought to the set because either better sources
for the same variable have become available (for example income distribution) or because some
data were not published anymore, thus obliging to remove the variable (it is the case of cinemas
in small towns).
The consultation process that led to the selection of the variables listed in Appendix A.
3.4 Aggregation Methodology
Once the set of variables has been identified, the variables must be aggregated into a single
synthesis value. To do this, all the variables must first be expressed in values that are comparable
with each other: they can be percentages or scores defined a priori or numbers that have been
normalized in some way. In any case what is important is that they are pure numbers without
different units of measurement. Various methods of normalizations has been taken into account
(Nardo et al. 2005). Unfortunately, it was not possible to identify a target value from which
measuring a distance for every one of the 41 variabili. It was therefore not possible to identify a
maximum to build a distance to reference measure. The creation of an ideal target in many cases
would be arbitrary while in others would simply makes no sense (i.e. the number of libraries
or the number of voluntary organizations). We had to choose a normalization whose scores are
relative to the results of the rest of the regions. One of the possible ones is the re-scaling of
values, establishing that the highest value present in the distribution represents a maximum
and the lowest value a minimum: this means assigning a value of 1 (or maximum score) to
11

the former and a value of 0 (or minimum score) to the latter. This way of working, greatly
used, leads to the distortion of the distribution and on the relative distances among units. In
presence of outliers the rest of values can appear much closer to each other, while the distances
could increase when observations are all very close to each other because of the widening of the
range. We decided, instead, to apply a standardization of the variables. It is a largely used
methodology, more robust than the re-scaling, that even if not solving completely the problem
with outliers 5 (slightly exaggerating the effects of extreme values on the index) have a more
moderate biased effect (Nardo et al. 2005). This technique does not allow to compare values of
the index and of the dimensions overtime, this can be done only for the original value of each
single variable or for the ranking values of the synthetic measures. Nevertheless the fact that
the standardization imposes an average of zero to the distribution has positive communicative
implications. Positive values represent a score above the average of the regions and negative
ones a score below. The further away the values are from zero, the further away they are from
the mean value. To each indicator it has been applied a transformation of this kind:
zi,j =xi,t − µi
σxj
(1)
where: xi,t is the value of indicator j for the region i; µj is the average value of indicator j;
σxj is the standard deviation for the indicator j; zi,j is the standardized value of indicator j for
the region i.
The aggregation is done in two steps. Standardized indicators are firstly merged into the
seven dimensions by using a simple arithmetic mean. Secondly, the arithmetic mean of the
seven dimensions forms the QUARS. We took the decision not to assign weights to the variables
assuming that their definition would have been a much more complex and subjective matter. The
a priori decision to adopt the technique of equal weighting implies that the subjective component
of construction of indices would lie exclusively in the choice of variables (Salzman 2003). It would
have taken time to the discussion surrounding the choice of the indicators and would have allowed
the inclusion of not very much significant indicators with a small weight. Moreover it appeared5In a sample of n observations it is possible for a limited number to be so far separated in value from the
remainder that they give rise to the question whether they are not from a different population, or that the
sampling technique is a fault. Such values are called outliers (Marriott 1990)
12

too complicated to assign numerical values to social and environmental phenomena. The use
of multivariate techniques would have led to a selection dependent on the correlation among
variables but not taking into consideration the political or social relevance that some variables
have. Since the choice of producing a composite indicators stands mainly in the need of having
an easily communicable tool, of attracting the attention of public, media and policy makers, it
was considered fundamental to be able to analyse all the indicators separately, and excluding
some of those for “statistical reasons” would have reduced very much the “political information”.
The chosen aggregation method had to take into consideration the existing trade-off between the
need of a statistically reliable method and the communication needs of reaching a wide audience.
We took into consideration two more aggregation techniques: Analysis in Principal Components
and concave means (Palazzi 2004). An example of concave mean applied to the QUARS database
is provided in Corsi and Guarini (2009). The former did not produce very useful results (low
variance explained) and the first two components could not be easily interpreted. The latter
did not produce significant variations in the results and the transformation function has been
considered subjective as well as the definition of weights. In both cases the added value of
sophisticated techniques did not seem to offset the loss in communication easiness.
The main weakness of the methodology stands among the typical ones affecting most compos-
ite indexes. QUARS does not identify distance-to-target. Therefore, QUARS does not permit
to determine a region’s performance in absolute terms, but only in relation to the other regions
taken into consideration. As a consequence, it is not possible to build QUARS time series of
a region. Only the rank position of a certain region can be followed over time. And of course
QUARS does not directly indicate why a region is doing well or not so well. Only the disag-
gregated analysis can reveal whether good or bad performance is due to the social, economic
or environmental situation of a region. A great limitation concerning the transfer of the same
indicator to other countries or territorial levels is represented by the scarce availability of non-
conventional data namely some surveys from Istat, the indicators built by Legambiente that in
some cases required an ad hoc research or data on democratic participation.
13

4 Empirical findings of well-being in Italy
Table 1: The QUARS and its dimensions.
Region QUARS Envir Econ Rights Health Educ Gender Partic
TrentinoAA 0.77 1.28 1.11 0.92 0.62 -0.22 0.19 1.51EmiliaRomagna 0.55 -0.02 0.82 0.44 0.59 0.63 0.78 0.58ValleAosta 0.53 0.56 0.81 0.37 0.52 -0.82 1.77 0.50FriuliVG 0.47 -0.06 0.91 0.64 0.87 0.44 -0.07 0.56Toscana 0.43 0.17 0.91 -0.48 0.09 0.52 1.37 0.44Marche 0.38 -0.04 0.71 0.44 0.28 0.45 0.61 0.23Piemonte 0.33 0.27 0.67 0.26 0.50 0.16 0.41 0.02Lombardia 0.31 -0.46 0.39 -0.07 0.96 0.19 0.18 0.98Veneto 0.30 0.03 1.02 0.31 0.50 -0.17 -0.14 0.57Umbria 0.27 -0.06 0.27 0.19 0.32 0.64 0.55 -0.05Liguria 0.11 -0.37 0.43 0.07 -0.20 0.27 0.51 0.06Lazio -0.09 -0.40 -0.61 -0.40 0.02 0.82 -0.02 -0.02Abruzzo -0.10 0.14 0.04 0.12 -0.33 -0.04 -0.25 -0.38Molise -0.28 -0.09 -0.46 0.30 -0.70 0.41 -0.96 -0.45Basilicata -0.31 0.42 -0.96 -0.03 -0.27 -0.54 -0.38 -0.40Sardegna -0.34 0.05 -0.94 -0.05 -0.65 -0.17 -0.35 -0.25Puglia -0.73 -0.41 -0.75 -0.31 -0.97 -0.69 -1.09 -0.91Calabria -0.75 -0.13 -1.56 -0.42 -0.58 -0.56 -0.90 -1.12Sicilia -0.92 -0.34 -1.55 -1.18 -0.83 -0.65 -0.99 -0.92Campania -0.92 -0.55 -1.27 -1.09 -0.74 -0.66 -1.19 -0.97
The composition of the seven dimensions into the QUARS is able to provide an overall
picture of well-being in Italian regions, ranking them and synthetizing in a single number the
differences provided by the analysis of a high number of variables (Table 1). An overall picture
of the composition of the QUARS according to the seven variables for each region is presented
through the Figures in Appendix B. The mean value practically corresponds to the position of
Lazio, that scores very closely to zero. Lazio, together with Abruzzo, represents the frontier
between the North and the South of the country. Italy according to the QUARS is therefore
divided exactly as in the traditional geographical division. Trentino Alto Adige is strongly at the
14
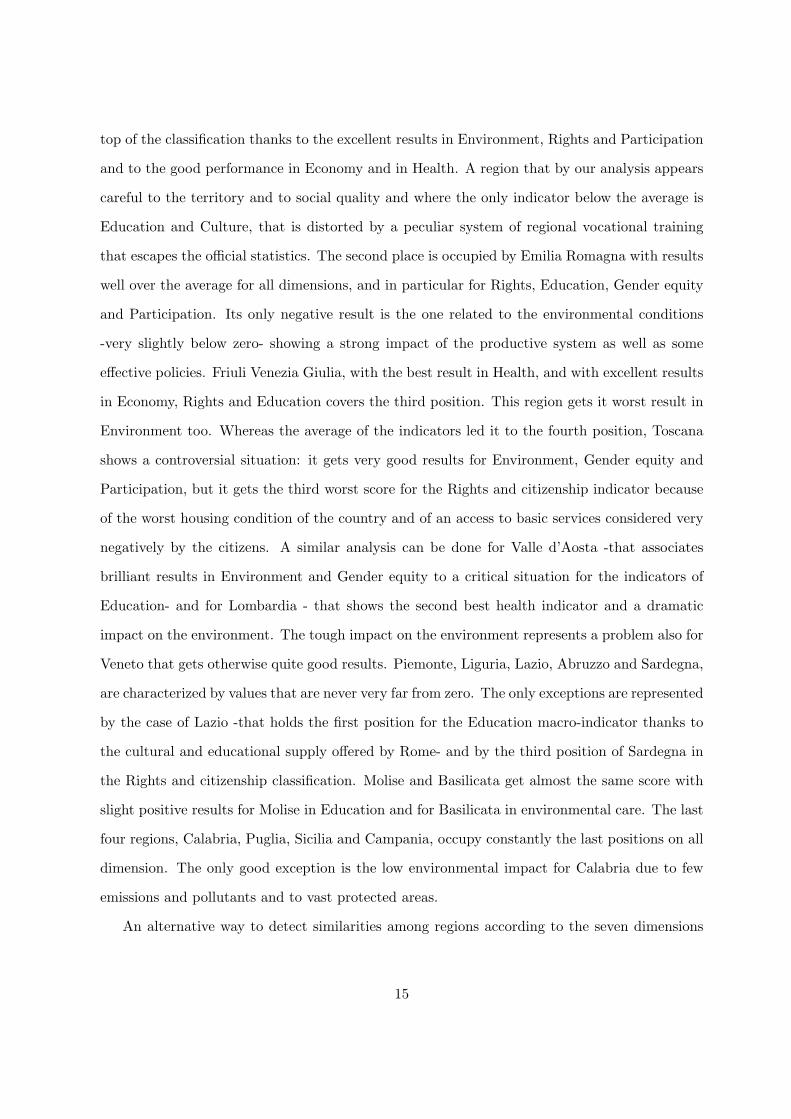
top of the classification thanks to the excellent results in Environment, Rights and Participation
and to the good performance in Economy and in Health. A region that by our analysis appears
careful to the territory and to social quality and where the only indicator below the average is
Education and Culture, that is distorted by a peculiar system of regional vocational training
that escapes the official statistics. The second place is occupied by Emilia Romagna with results
well over the average for all dimensions, and in particular for Rights, Education, Gender equity
and Participation. Its only negative result is the one related to the environmental conditions
-very slightly below zero- showing a strong impact of the productive system as well as some
effective policies. Friuli Venezia Giulia, with the best result in Health, and with excellent results
in Economy, Rights and Education covers the third position. This region gets it worst result in
Environment too. Whereas the average of the indicators led it to the fourth position, Toscana
shows a controversial situation: it gets very good results for Environment, Gender equity and
Participation, but it gets the third worst score for the Rights and citizenship indicator because
of the worst housing condition of the country and of an access to basic services considered very
negatively by the citizens. A similar analysis can be done for Valle d’Aosta -that associates
brilliant results in Environment and Gender equity to a critical situation for the indicators of
Education- and for Lombardia - that shows the second best health indicator and a dramatic
impact on the environment. The tough impact on the environment represents a problem also for
Veneto that gets otherwise quite good results. Piemonte, Liguria, Lazio, Abruzzo and Sardegna,
are characterized by values that are never very far from zero. The only exceptions are represented
by the case of Lazio -that holds the first position for the Education macro-indicator thanks to
the cultural and educational supply offered by Rome- and by the third position of Sardegna in
the Rights and citizenship classification. Molise and Basilicata get almost the same score with
slight positive results for Molise in Education and for Basilicata in environmental care. The last
four regions, Calabria, Puglia, Sicilia and Campania, occupy constantly the last positions on all
dimension. The only good exception is the low environmental impact for Calabria due to few
emissions and pollutants and to vast protected areas.
An alternative way to detect similarities among regions according to the seven dimensions
15
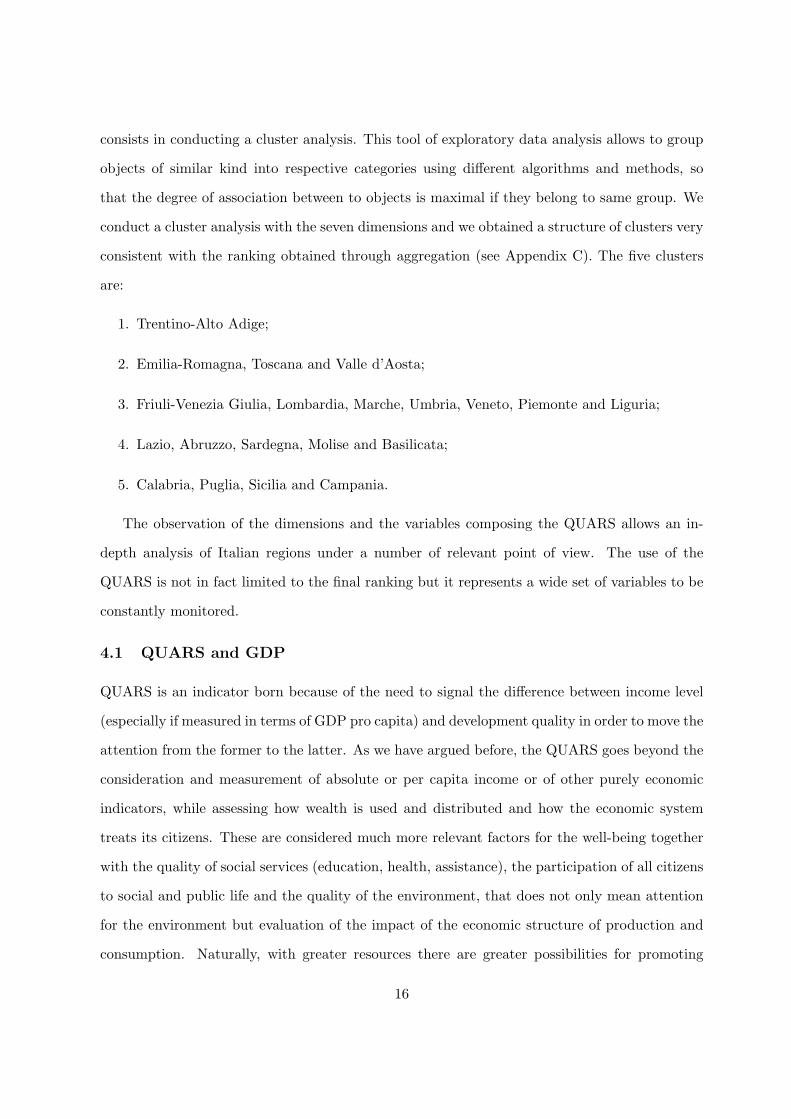
consists in conducting a cluster analysis. This tool of exploratory data analysis allows to group
objects of similar kind into respective categories using different algorithms and methods, so
that the degree of association between to objects is maximal if they belong to same group. We
conduct a cluster analysis with the seven dimensions and we obtained a structure of clusters very
consistent with the ranking obtained through aggregation (see Appendix C). The five clusters
are:
1. Trentino-Alto Adige;
2. Emilia-Romagna, Toscana and Valle d’Aosta;
3. Friuli-Venezia Giulia, Lombardia, Marche, Umbria, Veneto, Piemonte and Liguria;
4. Lazio, Abruzzo, Sardegna, Molise and Basilicata;
5. Calabria, Puglia, Sicilia and Campania.
The observation of the dimensions and the variables composing the QUARS allows an in-
depth analysis of Italian regions under a number of relevant point of view. The use of the
QUARS is not in fact limited to the final ranking but it represents a wide set of variables to be
constantly monitored.
4.1 QUARS and GDP
QUARS is an indicator born because of the need to signal the difference between income level
(especially if measured in terms of GDP pro capita) and development quality in order to move the
attention from the former to the latter. As we have argued before, the QUARS goes beyond the
consideration and measurement of absolute or per capita income or of other purely economic
indicators, while assessing how wealth is used and distributed and how the economic system
treats its citizens. These are considered much more relevant factors for the well-being together
with the quality of social services (education, health, assistance), the participation of all citizens
to social and public life and the quality of the environment, that does not only mean attention
for the environment but evaluation of the impact of the economic structure of production and
consumption. Naturally, with greater resources there are greater possibilities for promoting
16

Figure 1: QUARS and GDP
adequate policies for attaining these objectives. But GDP – as well as public expenditure –
does not translate automatically into quality of life and development. Regions with a higher
GDP may show a lower quality of development and vice-versa. The scatterplot in Figure 1
shows a positive correlation between QUARS and GDP. But at the same time, the non-linear
interpolation of data indicates a convex relation between them. This means that the relation
between quality of development and income becomes weaker for higher level of income, which
confirms the idea that income has decreasing return to progress. The curve presents a maximum
after which the correlation become even negative.
4.2 Political Results and diffusion
During the last years the campaign has carried out a dissemination work in order to animate
the debate on well-being measures and to pressure national and local Governments and Institu-
tions towards the adoption of a wider set of indicators. Among the outcomes of this activity is
the inclusion of the QUARS within best practices at EU’s Beyond GDP conference (Goossens
17
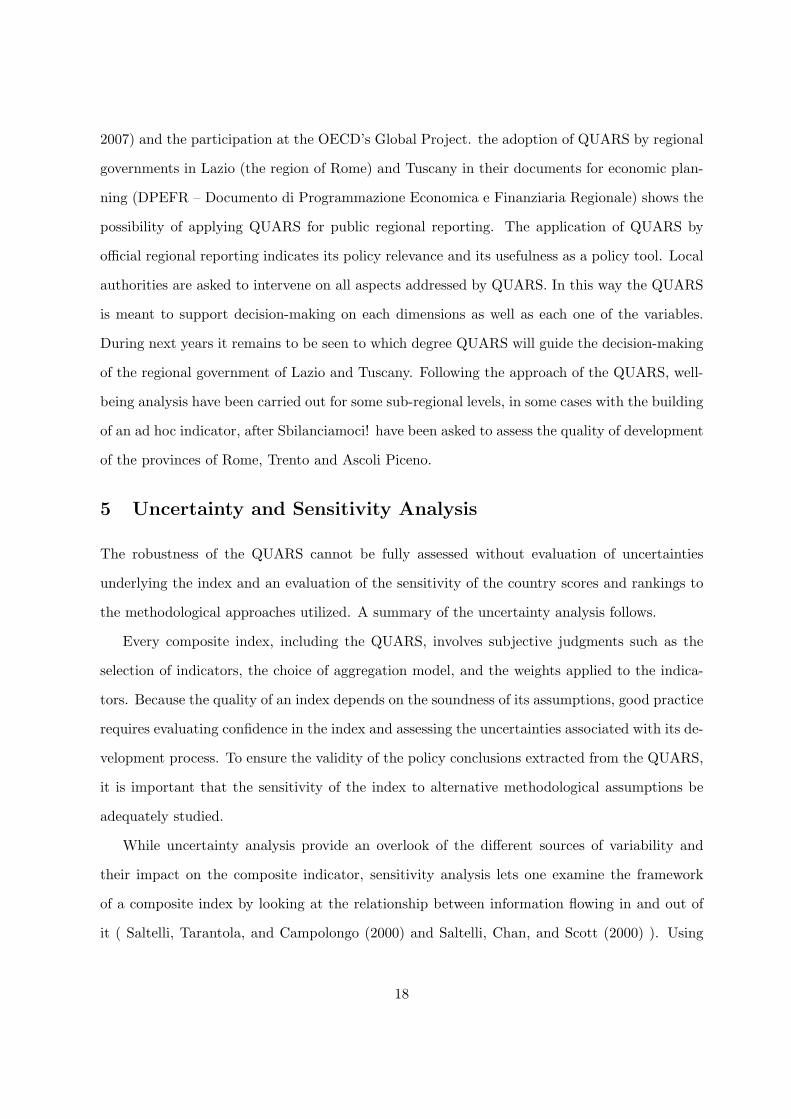
2007) and the participation at the OECD’s Global Project. the adoption of QUARS by regional
governments in Lazio (the region of Rome) and Tuscany in their documents for economic plan-
ning (DPEFR – Documento di Programmazione Economica e Finanziaria Regionale) shows the
possibility of applying QUARS for public regional reporting. The application of QUARS by
official regional reporting indicates its policy relevance and its usefulness as a policy tool. Local
authorities are asked to intervene on all aspects addressed by QUARS. In this way the QUARS
is meant to support decision-making on each dimensions as well as each one of the variables.
During next years it remains to be seen to which degree QUARS will guide the decision-making
of the regional government of Lazio and Tuscany. Following the approach of the QUARS, well-
being analysis have been carried out for some sub-regional levels, in some cases with the building
of an ad hoc indicator, after Sbilanciamoci! have been asked to assess the quality of development
of the provinces of Rome, Trento and Ascoli Piceno.
5 Uncertainty and Sensitivity Analysis
The robustness of the QUARS cannot be fully assessed without evaluation of uncertainties
underlying the index and an evaluation of the sensitivity of the country scores and rankings to
the methodological approaches utilized. A summary of the uncertainty analysis follows.
Every composite index, including the QUARS, involves subjective judgments such as the
selection of indicators, the choice of aggregation model, and the weights applied to the indica-
tors. Because the quality of an index depends on the soundness of its assumptions, good practice
requires evaluating confidence in the index and assessing the uncertainties associated with its de-
velopment process. To ensure the validity of the policy conclusions extracted from the QUARS,
it is important that the sensitivity of the index to alternative methodological assumptions be
adequately studied.
While uncertainty analysis provide an overlook of the different sources of variability and
their impact on the composite indicator, sensitivity analysis lets one examine the framework
of a composite index by looking at the relationship between information flowing in and out of
it ( Saltelli, Tarantola, and Campolongo (2000) and Saltelli, Chan, and Scott (2000) ). Using
18

sensitivity and uncertainty analysis, we can study how variations in QUARS scores and ranks
derive from different sources of variation in the assumptions.
Sensitivity analysis also demonstrates how each indicator depends upon the information
that composes it. It is thus closely related to uncertainty analysis, which aims to quantify
the overall uncertainty in a country’s score (or rank) as a result of the uncertainties in the
index construction. A combination of uncertainty and sensitivity analyses can help to gauge the
robustness of the QUARS results, to increase the transparency and to help frame the debate
around the use of the index.
The validity of the scoring and respective ranking is assessed by evaluating how sensitive
it is to the assumptions that have been made for the construction of the composite indicator.
These four sources of uncertainty exist and their combined effect on country rankings needs to
be tested for this reason we tried to tackle all possible sources of uncertainty, which arise from:
1. Data Normalization
2. Weighting Scheme
3. Composite Indicator Formula (Aggregation Rule)
4. Inclusion/Exclusion of Basic Indicators
The essential point of the methodology used for the uncertainty analysis is based on computer
simulations. The four sources of uncertainty are turned into 4 input factors with uniform
probabilities across the different alternatives, i.e. different approaches and methods see Table 2,
then all possible combinations of input factors are run, delivering in total 588 simulations with
corresponding set of indicators values and country rankings.
For every region the results of the relative distribution of their rankings achieved in the 588
simulations are presented (Figure 2). The variability of these distributions can be considered as
the impact of the uncertainty in the composite indicator. We discuss ranks and not scores be-
cause non-parametric statistics are more appropriate in our case given the non-normal character
of the data and the scores. The results of the simulations are organized in a relative frequency
matrix and the overall QUARS is calculated across the 588 scenarios. Besides the frequency
19
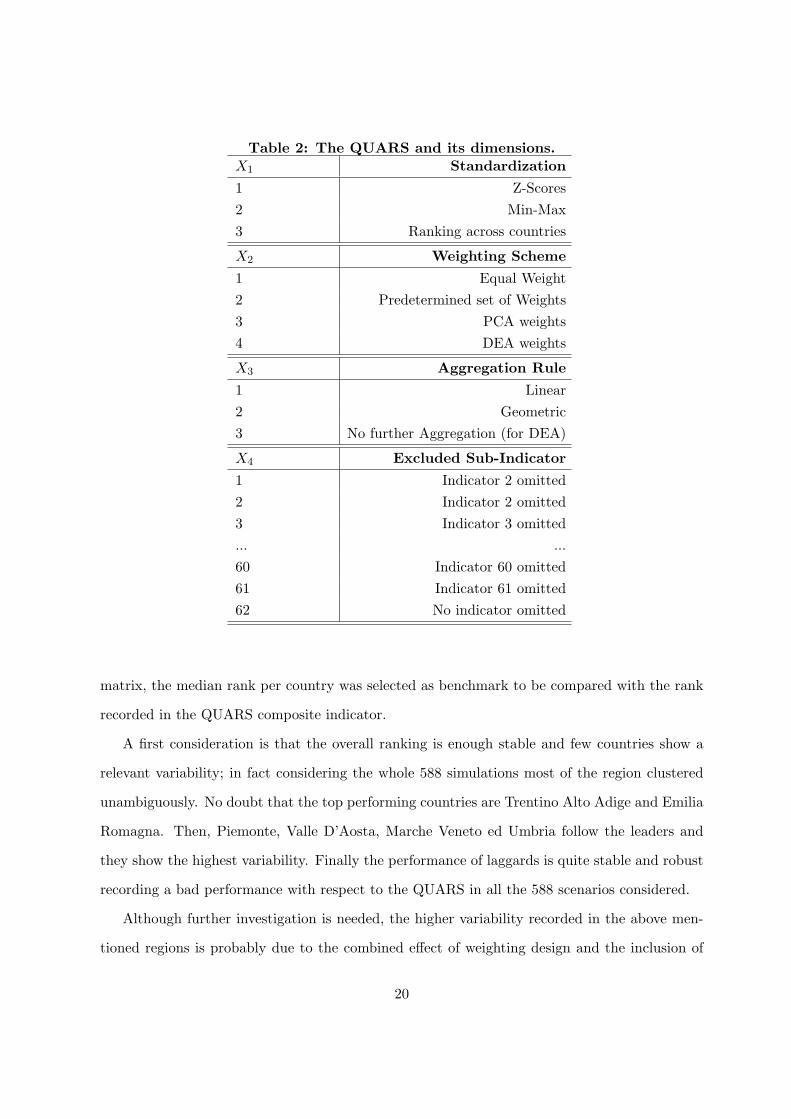
Table 2: The QUARS and its dimensions.X1 Standardization
1 Z-Scores2 Min-Max3 Ranking across countries
X2 Weighting Scheme
1 Equal Weight2 Predetermined set of Weights3 PCA weights4 DEA weights
X3 Aggregation Rule
1 Linear2 Geometric3 No further Aggregation (for DEA)
X4 Excluded Sub-Indicator
1 Indicator 2 omitted2 Indicator 2 omitted3 Indicator 3 omitted... ...60 Indicator 60 omitted61 Indicator 61 omitted62 No indicator omitted
matrix, the median rank per country was selected as benchmark to be compared with the rank
recorded in the QUARS composite indicator.
A first consideration is that the overall ranking is enough stable and few countries show a
relevant variability; in fact considering the whole 588 simulations most of the region clustered
unambiguously. No doubt that the top performing countries are Trentino Alto Adige and Emilia
Romagna. Then, Piemonte, Valle D’Aosta, Marche Veneto ed Umbria follow the leaders and
they show the highest variability. Finally the performance of laggards is quite stable and robust
recording a bad performance with respect to the QUARS in all the 588 scenarios considered.
Although further investigation is needed, the higher variability recorded in the above men-
tioned regions is probably due to the combined effect of weighting design and the inclusion of
20

analysis.png
Figure 2: Uncertainty analysis
21

some relevant indicator. This combined effect probably bias the ranking especially when the
excluded indicator belong to a dimension with a small number of indicators.
Finally, it is worth to notice that, for every region, in most of the case the mode of the
distribution of the uncertainty analysis coincides with the ranking recorded in the QUARS
composite indicator. Thus, for the remaining regions the difference between the QUARS rank
and the observed mode rank is less than 2 positions. So that, for all the regions studied, the very
modest sensitivity of the QUARS ranking to the four input factors (standardization, weighting
scheme, aggregation rule and inclusion/exclusion of a single indicator) implies a considerably
robustness of the index. In sum the overall performance of the QUARS composite indicator
appears to be robust as other indices presented in the literature.
6 Conclusions
The work presented here shows the building of a composite indicator according to an original
and effective approach. The consultative process that led to the definition of the QUARS grants
a strong legitimacy to the index that in this way overcomes a number of drawbacks due to
the contribution of scholars alone. The inclusion of a large civil society coalition implies the
lack of any particular interest, and focuses its attention to the reaching of wellbeing for all
citizens. In particular, it is probably best practice in representing and encouraging one of the
finest expressions of democratic decision-making: public participation. In the context of official
indicators-based reporting this is an aspect which is often neglected, and whereas the measure
we proposed is very much limited by data availability, it still represents an innovative approach
to the measure of progress which deserves further investigation.
The empirical analysis we carried out demonstrates the validity of the set of indicators
in providing an overarching picture of the country. The chosen aggregation method leads to
a ranking of Italian regions that represents clearly the differences and that is confirmed by
the use of other techniques. Thanks to the variety of indicators used, the QUARS is able to
capture a number of different aspects contributing to the definition of wellbeing, representing
the condition of each region in its complexity and multidimensionality. The sensitivity and
22

uncertainty analysis demonstrate that despite the large number of indicators used, the QUARS
is a robust index towards variations in the indicators and aggregation methodologies.
23
References
Borsboom, D., G. Mellenbergh, and J. V. Heerden (2003). The theoretical status of latent
variables. Psychological Review 110 (2), 203–219.
Bossel, H. (1999). Indicators for sustainable development: Theory, method, applications.
Report to the Balaton Group 1999, International Institute for Sustainable Development.
Coltman, T., T. M. Devinney, D. Midgley, and S. Venaik (2008). Formative or reflective
models: Two applications of formative measurement. Journal of Business Research 61 (12),
1250–1262.
Corsi, M. and G. Guarini (2009). What ‘progress’ means? a temptative answer following a
classical approach.
CSD (1995). Indicators of sustainable development. Commission on Sustainable Develop-
ment ,, UNDP.
Daly, H. and J. Cobb (1991). For the Common Good. Green Print.
Fisher-Kowalski, M. (1998). Society’s metabolism: the intellectual history of materials flow
analysis. part i, 1860-1970. Journal of Industrial Ecology 2 (1), 61–78.
Gadrey, J. and F. Jany-Catrice (2003). Les indicateurs de richesse et de developpement. un
bilan international en vue d’une initiative francaise. Rapport de Recherche 03.1, Direction
de l’Animation de la Recherche des Etudes et des Statistiques, Ministere du Travail, des
Relations Sociales, de la Famille et de la Solidarite.
Goossens, Y. (2007). Alternative progress indicators to gross domestic product (gdp) as a
means towards sustainable development. Study IP/A/ENVI/ST/2007-10, European Par-
liament.
Kuznet, S. (1934). National income, 1929-1932. 2d session Senate document no. 124, 73rd US
Congress.
Marriott, F. (1990). A dictionary of statistical terms (fifth ed.). Longman Scientific and Tech-
nical.
24

Nardo, M., M. Saisana, A. Saltelli, S. Tarantola, A. Hoffman, and E. Giovannini (2005).
Handbook on constructing composite indicators: methodology and user guide. Statistics
Working Papert STD/DOC(2005)3, OECD.
NEF (2006). Happy Planet Index. An Index of Human Well-Being and Environmental Impact.
New Economic Foundation.
Nordhaus, W. D. and J. Tobin (1971). Is growth obsolete? Cowles Foundation Discussion
Papers 319, Cowles Foundation, Yale University.
OECD (2006). Society at a Glance. OECD.
Osberg, L. and A. Sharpe (2002). An index of economic well-being for selected oecd countries.
Review of Income and Wealth 48 (3), 291–316.
Palazzi, P. (2004). Lo sviluppo come fenomeno multidimensionale. confronto tra isu e un
indice di sviluppo sostenibile. Moneta e Credito 227 (2), 279–309.
Prescott-Allen, R. (2001). The Well-Being of Nation: a Country by Country Index of Quality
of Life and the Environment. Island Press.
Rahman, T., R. Mittelhammer, and P. Wandschneider (2005). Measuring the quality of life
across countries. a sensitivity analysis of well-being indeces. Research Paper 2005/06,
United Nation University.
Saltelli, A., K. Chan, and M. Scott (2000). Sensitivity Analysis. Probability and Statistics
Series. John Wiley and Sons.
Saltelli, A., S. Tarantola, and F. Campolongo (2000). Sensitivity analysis as an ingredient of
modelling. Statistical Science 15, 377–395.
Salzman, J. (2003). Methodological choices encountered in the construction of composite
indices of economic and social well-being. Woking Paper 1997, Center for the Study of
Living Standards.
Sbilanciamoci! (2005). Come si vive in Italia? Indice di Qualita Regionale dello Sviluppo
(QUARS)-2005. Lunaria.
25
Sbilanciamoci! (2006). Come si vive in Italia? Indice di Qualita Regionale dello Sviluppo
(QUARS)-2006. Lunaria.
Sbilanciamoci! (2009). La finanziaria per noi. Come usare la spesa pubblica per i diritti, la
pace e l’ambiente. Lunaria.
Schmitter, P. (2001). What is there to legitimize in eu and how might this accomplished?
Jean Monnet Working Papers 6/01, Jean Monnet Center for International and Regional
Economic Law and Justice, NYU School of Law.
Segre, E. and A. Villa (2007). Misurare la qualita del vivere: un’applicazione del quars nel
lazio. Quaderni di Economia Regionale 2007-04, Collana del Servizio Studi di Sviluppo
Lazio.
Social-Watch (2005). Social Watch Report. Roars and Whispers. Gender and poverty:
promises vs. action. ITeM, Montevideo.
Stiglitz, J., A. Sen, and J. Fitoussi (2008). Survey on existing approaches to measuring socio-
economic progress. Issue Paper 25/07/08 - 1, Commission on the Measurement of Economic
Performance and social Progress.
UNDP (1990). Human Development Report. Oxford University Press.
Valentin, A. and J. Spangerberg (2000). A guide to community sustainability indicators.
Environmental Impact Assessment Review 20, 381–392.
Wackernagel, M. and W. Rees (1996). Our Ecological Footprint. The New Cathalist.
WorldBank (2007). World Development Indicators. World Bank.
26

Appendix A
27

28

Appendix B
29

30

Appendix C
Trentino
Umbria
Friuli
Lombardia
Marche
Veneto
Piemonte
Liguria
Aosta
Emilia
Toscana
Sicilia
Campania Calabria
Puglia
Basilicata
Sardegna
Molise Lazio
Abruzzo
01
23
45
Cluster Analysis
hclust (*, "complete")D
Height
31