Welding metallurgy 2nd edition
467
-
Upload
malai-kavya -
Category
Business
-
view
13.023 -
download
20
Transcript of Welding metallurgy 2nd edition


WELDING METALLURGY SECOND EDITION

WELDINGMETALLURGYSECOND EDITION
Sindo KouProfessor and ChairDepartment of Materials Science and EngineeringUniversity of Wisconsin
A JOHN WILEY & SONS, INC., PUBLICATION

Copyright © 2003 by John Wiley & Sons, Inc. All rights reserved.
Published by John Wiley & Sons, Inc., Hoboken, New Jersey.Published simultaneously in Canada.
No part of this publication may be reproduced, stored in a retrieval system, or transmitted inany form or by any means, electronic, mechanical, photocopying, recording, scanning, orotherwise, except as permitted under Section 107 or 108 of the 1976 United States CopyrightAct, without either the prior written permission of the Publisher, or authorization throughpayment of the appropriate per-copy fee to the Copyright Clearance Center, Inc., 222Rosewood Drive, Danvers, MA 01923, 978-750-8400, fax 978-750-4470, or on the web atwww.copyright.com. Requests to the Publisher for permission should be addressed to thePermissions Department, John Wiley & Sons, Inc., 111 River Street, Hoboken, NJ 07030, (201)748-6011, fax (201) 748-6008, e-mail: [email protected].
Limit of Liability/Disclaimer of Warranty: While the publisher and author have used their bestefforts in preparing this book, they make no representations or warranties with respect to theaccuracy or completeness of the contents of this book and specifically disclaim any impliedwarranties of merchantability or fitness for a particular purpose. No warranty may be createdor extended by sales representatives or written sales materials. The advice and strategiescontained herein may not be suitable for your situation. You should consult with a professionalwhere appropriate. Neither the publisher nor author shall be liable for any loss of profit or anyother commercial damages, including but not limited to special, incidental, consequential, orother damages.
For general information on our other products and services please contact our Customer CareDepartment within the U.S. at 877-762-2974, outside the U.S. at 317-572-3993 or fax 317-572-4002.
Wiley also publishes its books in a variety of electronic formats. Some content that appears inprint, however, may not be available in electronic format.
Library of Congress Cataloging-in-Publication Data
Kou, Sindo.Welding metallurgy / Sindo Kou.–2nd ed.
p. cm.“A Wiley-Interscience publication.”Includes bibliographical references and index.
ISBN 0-471-43491-41. Welding. 2. Metallurgy. 3. Alloys. I. Title.TS227 .K649 2002671.5¢2–dc21
2002014327
Printed in the United States of America.
10 9 8 7 6 5 4 3 2 1

To Warren F. Savagefor his outstanding contributions to welding metallurgy

CONTENTS
Preface xiii
I INTRODUCTION 1
1 Fusion Welding Processes 3
1.1 Overview 31.2 Oxyacetylene Welding 71.3 Shielded Metal Arc Welding 111.4 Gas–Tungsten Arc Welding 131.5 Plasma Arc Welding 161.6 Gas–Metal Arc Welding 191.7 Flux-Core Arc Welding 221.8 Submerged Arc Welding 221.9 Electroslag Welding 241.10 Electron Beam Welding 271.11 Laser Beam Welding 29
References 33Further Reading 34Problems 34
2 Heat Flow in Welding 37
2.1 Heat Source 372.2 Analysis of Heat Flow in Welding 472.3 Effect of Welding Parameters 532.4 Weld Thermal Simulator 58
References 60Further Reading 62Problems 62
3 Chemical Reactions in Welding 65
3.1 Overview 653.2 Gas–Metal Reactions 683.3 Slag–Metal Reactions 82
References 92
vii

Further Reading 95Problems 95
4 Fluid Flow and Metal Evaporation in Welding 97
4.1 Fluid Flow in Arcs 974.2 Fluid Flow in Weld Pools 1034.3 Metal Evaporation 1144.4 Active Flux GTAW 116
References 117Further Reading 119Problems 120
5 Residual Stresses, Distortion, and Fatigue 122
5.1 Residual Stresses 1225.2 Distortion 1265.3 Fatigue 1315.4 Case Studies 137
References 140Further Reading 141Problems 141
II THE FUSION ZONE 143
6 Basic Solidification Concepts 145
6.1 Solute Redistribution during Solidification 1456.2 Solidification Modes and Constitutional Supercooling 1556.3 Microsegregation and Banding 1606.4 Effect of Cooling Rate 1636.5 Solidification Path 166
References 167Further Reading 168Problems 169
7 Weld Metal Solidification I: Grain Structure 170
7.1 Epitaxial Growth at Fusion Boundary 1707.2 Nonepitaxial Growth at Fusion Boundary 1727.3 Competitive Growth in Bulk Fusion Zone 1747.4 Effect of Welding Parameters on Grain Structure 1747.5 Weld Metal Nucleation Mechanisms 1787.6 Grain Structure Control 187
viii CONTENTS

References 195Further Reading 197Problems 197
8 Weld Metal Solidification II: Microstructure within Grains 199
8.1 Solidification Modes 1998.2 Dendrite and Cell Spacing 2048.3 Effect of Welding Parameters 2068.4 Refining Microstructure within Grains 209
References 213Further Reading 213Problems 214
9 Post-Solidification Phase Transformations 216
9.1 Ferrite-to-Austenite Transformation in Austenitic Stainless Steel Welds 216
9.2 Austenite-to-Ferrite Transformation in Low-Carbon,Low-Alloy Steel Welds 232
References 239Further Reading 241Problems 241
10 Weld Metal Chemical Inhomogeneities 243
10.1 Microsegregation 24310.2 Banding 24910.3 Inclusions and Gas Porosity 25010.4 Inhomogeneities Near Fusion Boundary 25210.5 Macrosegregation in Bulk Weld Metal 255References 260Further Reading 261Problems 261
11 Weld Metal Solidification Cracking 263
11.1 Characteristics, Cause, and Testing 26311.2 Metallurgical Factors 26811.3 Mechanical Factors 28411.4 Reducing Solidification Cracking 28511.5 Case Study: Failure of a Large Exhaust Fan 295References 296Further Reading 299Problems 299
CONTENTS ix

III THE PARTIALLY MELTED ZONE 301
12 Formation of the Partially Melted Zone 303
12.1 Evidence of Liquation 30312.2 Liquation Mechanisms 30412.3 Directional Solidification of Liquated Material 31412.4 Grain Boundary Segregation 31412.5 Grain Boundary Solidification Modes 31612.6 Partially Melted Zone in Cast Irons 318References 318Problems 319
13 Difficulties Associated with the Partially Melted Zone 321
13.1 Liquation Cracking 32113.2 Loss of Strength and Ductility 32813.3 Hydrogen Cracking 32813.4 Remedies 330References 336Problems 338
IV THE HEAT-AFFECTED ZONE 341
14 Work-Hardened Materials 343
14.1 Background 34314.2 Recrystallization and Grain Growth in Welding 34714.3 Effect of Welding Parameters and Process 349References 351Further Reading 352Problems 352
15 Precipitation-Hardening Materials I: Aluminum Alloys 353
15.1 Background 35315.2 Al–Cu–Mg and Al–Mg–Si Alloys 35915.3 Al–Zn–Mg Alloys 36715.4 Friction Stir Welding of Aluminum Alloys 370References 371Further Reading 372Problems 372
16 Precipitation-Hardening Materials II: Nickel-Base Alloys 375
16.1 Background 375
x CONTENTS

16.2 Reversion of Precipitate and Loss of Strength 37916.3 Postweld Heat Treatment Cracking 384References 390Further Reading 392Problems 392
17 Transformation-Hardening Materials: Carbon and Alloy Steels 393
17.1 Phase Diagram and CCT Diagrams 39317.2 Carbon Steels 39617.3 Low-Alloy Steels 40417.4 Hydrogen Cracking 41017.5 Reheat Cracking 41817.6 Lamellar Tearing 42217.7 Case Studies 425References 427Further Reading 429Problems 430
18 Corrosion-Resistant Materials: Stainless Steels 431
18.1 Classification of Stainless Steels 43118.2 Austenitic Stainless Steels 43318.3 Ferritic Stainless Steels 44618.4 Martensitic Stainless Steels 44918.5 Case Study: Failure of a Pipe 451References 452Further Reading 453Problems 454
Index 455
CONTENTS xi

PREFACE
Since the publication of the first edition of this book in 1987, there has beenmuch new progress made in welding metallurgy. The purpose for the secondedition is to update and improve the first edition. Examples of improvementsinclude (1) much sharper photomicrographs and line drawings; (2) integrationof the phase diagram, thermal cycles, and kinetics with the microstructure toexplain microstructural development and defect formation in welds; and (3)additional exercise problems. Specific revisions are as follows.
In Chapter 1 the illustrations for all welding processes have been re-drawn to show both the overall process and the welding area. In Chapter 2 the heat source efficiency has been updated and the melting efficiency added. Chapter 3 has been revised extensively, with the dissolution of atomic nitrogen, oxygen, and hydrogen in the molten metal considered andelectrochemical reactions added. Chapter 4 has also been revised extensively,with the arc added, and with flow visualization, arc plasma dragging, and turbulence included in weld pool convection. Shot peening is added to Chapter 5.
Chapter 6 has been revised extensively, with solute redistribution andmicrosegregation expanded and the solidification path added. Chapter 7 nowincludes nonepitaxial growth at the fusion boundary and formation of non-dendritic equiaxed grains. In Chapter 8 solidification modes are explained withmore illustrations. Chapter 9 has been expanded significantly to add ferriteformation mechanisms, new ferrite prediction methods, the effect of coolingrate, and factors affecting the austenite–ferrite transformation. Chapter 10now includes the effect of both solid-state diffusion and dendrite tip under-cooling on microsegregation. Chapter 11 has been revised extensively toinclude the effect of eutectic reactions, liquid distribution, and ductility of the solidifying metal on solidification cracking and the calculation of fractionof liquid in multicomponent alloys.
Chapter 12 has been rewritten completely to include six different liquationmechanisms in the partially melted zone (PMZ), the direction and modes ofgrain boundary (GB) solidification, and the resultant GB segregation. Chapter13 has been revised extensively to include the mechanism of PMZ crackingand the effect of the weld-metal composition on cracking.
Chapter 15 now includes the heat-affected zone (HAZ) in aluminum–lithium–copper welds and friction stir welds and Chapter 16 the HAZ ofInconel 718. Chapter 17 now includes the effect of multiple-pass welding on
xiii

reheat cracking and Chapter 18 the grain boundary chromium depletion in asensitized austenitic stainless steel.
The author thanks the National Science Foundation and NASA for supporting his welding research, from which this book draws frequently.He also thanks the American Welding Society and ASM International for per-missions to use numerous copyrighted materials. Finally, he thanks C. Huang,G. Cao, C. Limmaneevichitr, H. D. Lu, K.W. Keehn, and T.Tantanawat for pro-viding technical material, requesting permissions, and proofreading.
Sindo Kou
Madison, Wisconsin
xiv PREFACE

PART IIntroduction
Welding Metallurgy, Second Edition. Sindo KouCopyright 2003 John Wiley & Sons, Inc.
ISBN: 0-471-43491-4

1 Fusion Welding Processes
Fusion welding processes will be described in this chapter, including gaswelding, arc welding, and high-energy beam welding. The advantages and dis-advantages of each process will be discussed.
1.1 OVERVIEW
1.1.1 Fusion Welding Processes
Fusion welding is a joining process that uses fusion of the base metal to makethe weld. The three major types of fusion welding processes are as follows:
1. Gas welding:Oxyacetylene welding (OAW)
2. Arc welding:Shielded metal arc welding (SMAW)Gas–tungsten arc welding (GTAW)Plasma arc welding (PAW)Gas–metal arc welding (GMAW)Flux-cored arc welding (FCAW)Submerged arc welding (SAW)Electroslag welding (ESW)
3. High-energy beam welding:Electron beam welding (EBW)Laser beam welding (LBW)
Since there is no arc involved in the electroslag welding process, it is notexactly an arc welding process. For convenience of discussion, it is groupedwith arc welding processes.
1.1.2 Power Density of Heat Source
Consider directing a 1.5-kW hair drier very closely to a 304 stainless steel sheet1.6mm (1/16 in.) thick. Obviously, the power spreads out over an area of roughly
3
Welding Metallurgy, Second Edition. Sindo KouCopyright 2003 John Wiley & Sons, Inc.
ISBN: 0-471-43491-4

50mm (2 in.) diameter, and the sheet just heats up gradually but will not melt.With GTAW at 1.5kW, however, the arc concentrates on a small area of about6mm (1/4 in.) diameter and can easily produce a weld pool.This example clearlydemonstrates the importance of the power density of the heat source inwelding.
The heat sources for the gas, arc, and high-energy beam welding processesare a gas flame, an electric arc, and a high-energy beam, respectively. Thepower density increases from a gas flame to an electric arc and a high-energybeam. As shown in Figure 1.1, as the power density of the heat sourceincreases, the heat input to the workpiece that is required for weldingdecreases. The portion of the workpiece material exposed to a gas flame heatsup so slowly that, before any melting occurs, a large amount of heat is alreadyconducted away into the bulk of the workpiece. Excessive heating can causedamage to the workpiece, including weakening and distortion. On the con-trary, the same material exposed to a sharply focused electron or laser beamcan melt or even vaporize to form a deep keyhole instantaneously, and beforemuch heat is conducted away into the bulk of the workpiece, welding is com-pleted (1).
Therefore, the advantages of increasing the power density of the heatsource are deeper weld penetration, higher welding speeds, and better weldquality with less damage to the workpiece, as indicated in Figure 1.1. Figure1.2 shows that the weld strength (of aluminum alloys) increases as the heatinput per unit length of the weld per unit thickness of the workpiece decreases(2). Figure 1.3a shows that angular distortion is much smaller in EBW than in
4 FUSION WELDING PROCESSES
Increasingdamage toworkpiece
Increasingpenetration,welding speed,weld quality,equipment cost
Power density of heat source
high energybeam welding
arcwelding
gaswelding
Hea
t inp
ut to
wor
kpie
ce
Figure 1.1 Variation of heat input to the workpiece with power density of the heatsource.

GTAW (2). Unfortunately, as shown in Figure 1.3b, the costs of laser and elec-tron beam welding machines are very high (2).
1.1.3 Welding Processes and Materials
Table 1.1 summarizes the fusion welding processes recommended for carbonsteels, low-alloy steels, stainless steels, cast irons, nickel-base alloys, and
OVERVIEW 5
50
40
30
5 10 50 100 500Heat input, kJ/in./in.
Str
engt
h, k
si70395083
60
2219
6061
Figure 1.2 Variation of weld strength with heat input per unit length of weld per unitthickness of workpiece. Reprinted from Mendez and Eagar (2).
Productivity, cm/s
Flame
Arc
Laserelectron
beam
Productivity, inch of weld/s
Cap
ital e
quip
men
t, do
llars
Pow
er d
ensi
ty, W
/m2
0.1 1 10 100
0.04 0.4 4 40 400
103
105
107
103
105
107
(b)
t
EBW
GTA
W
Weld thickness t, mm0 20 40
Dis
tort
ion
angl
e
degr
ee
2
4
6
8
0
(a)
α
α
Figure 1.3 Comparisons between welding processes: (a) angular distortion; (b) capitalequipment cost. Reprinted from Mendez and Eagar (2).

TAB
LE
1.1
Ove
rvie
w o
f Wel
ding
Pro
cess
esa
Mat
eria
lT
hick
ness
bSM
AW
SAW
GM
AW
FC
AW
GT
AW
PAW
ESW
OF
WE
BW
LB
W
Car
bon
S✕
✕✕
✕✕
✕✕
stee
lsI
✕✕
✕✕
✕✕
✕✕
M✕
✕✕
✕✕
✕✕
T✕
✕✕
✕✕
✕✕
Low
-allo
yS
✕✕
✕✕
✕✕
✕st
eels
I✕
✕✕
✕✕
✕✕
M✕
✕✕
✕✕
✕T
✕✕
✕✕
✕✕
Stai
nles
sS
✕✕
✕✕
✕✕
✕✕
stee
lsI
✕✕
✕✕
✕✕
✕✕
M✕
✕✕
✕✕
✕✕
T✕
✕✕
✕✕
✕
Cas
t ir
onI
✕✕
M✕
✕✕
✕✕
T✕
✕✕
✕✕
Nic
kel
S✕
✕✕
✕✕
✕✕
and
allo
ysI
✕✕
✕✕
✕✕
✕M
✕✕
✕✕
✕✕
T✕
✕✕
✕
Alu
min
umS
✕✕
✕✕
✕✕
and
allo
ysI
✕✕
✕✕
M✕
✕✕
T✕
✕
aP
roce
ss c
ode:
SMA
W,s
hiel
ded
met
al a
rc w
eldi
ng;S
AW
,sub
mer
ged
arc
wel
ding
;GM
AW
,gas
–met
al a
rc w
eldi
ng;F
CA
W,fl
ux-c
ored
arc
wel
ding
;GT
AW
,ga
s–tu
ngst
en a
rc w
eldi
ng;P
AW
,pla
sma
arc
wel
ding
;ESW
,ele
ctro
slag
wel
ding
;OF
W,o
xyfu
el g
as w
eldi
ng;E
BW
,ele
ctro
n be
am w
eldi
ng; L
BW
,las
er b
eam
wel
ding
.b
Abb
revi
atio
ns:
S,sh
eet,
up t
o 3
mm
(1 / 8
in.)
;I,
inte
rmed
iate
,3–
6m
m (
1 / 8–1 / 4
in.)
;M
,m
ediu
m,
6–19
mm
(1 / 4–
3 / 4in
.);
T,th
ick,
19m
m (
3 / 4in
.) a
nd u
p;X
,re
com
men
ded.
Sour
ce:
Wel
ding
Han
dboo
k(3
).
6
aluminum alloys (3). For one example, GMAW can be used for all the materi-als of almost all thickness ranges while GTAW is mostly for thinner workpieces.For another example, any arc welding process that requires the use of a flux,such as SMAW, SAW, FCAW, and ESW, is not applicable to aluminum alloys.
1.1.4 Types of Joints and Welding Positions
Figure 1.4 shows the basic weld joint designs in fusion welding: the butt, lap,T-, edge, and corner joints. Figure 1.5 shows the transverse cross section ofsome typical weld joint variations. The surface of the weld is called the face,the two junctions between the face and the workpiece surface are called thetoes, and the portion of the weld beyond the workpiece surface is called thereinforcement. Figure 1.6 shows four welding positions.
1.2 OXYACETYLENE WELDING
1.2.1 The Process
Gas welding is a welding process that melts and joins metals by heating themwith a flame caused by the reaction between a fuel gas and oxygen. Oxy-acetylene welding (OAW), shown in Figure 1.7, is the most commonly usedgas welding process because of its high flame temperature. A flux may be usedto deoxidize and cleanse the weld metal. The flux melts, solidifies, and formsa slag skin on the resultant weld metal. Figure 1.8 shows three different typesof flames in oxyacetylene welding: neutral, reducing, and oxidizing (4), whichare described next.
1.2.2 Three Types of Flames
A. Neutral Flame This refers to the case where oxygen (O2) and acetylene(C2H2) are mixed in equal amounts and burned at the tip of the welding torch.A short inner cone and a longer outer envelope characterize a neutral flame
OXYACETYLENE WELDING 7
(a) butt joint
(c) T-joint
(b) lap joint
(d) edge joint
(e) corner joint
Figure 1.4 Five basic types of weld joint designs.

(Figure 1.8a). The inner cone is the area where the primary combustion takesplace through the chemical reaction between O2 and C2H2, as shown in Figure1.9. The heat of this reaction accounts for about two-thirds of the total heatgenerated. The products of the primary combustion, CO and H2, react with O2
from the surrounding air and form CO2 and H2O. This is the secondary com-bustion, which accounts for about one-third of the total heat generated. Thearea where this secondary combustion takes place is called the outer enve-lope. It is also called the protection envelope since CO and H2 here consumethe O2 entering from the surrounding air, thereby protecting the weld metalfrom oxidation. For most metals, a neutral flame is used.
B. Reducing Flame When excess acetylene is used, the resulting flame iscalled a reducing flame.The combustion of acetylene is incomplete.As a result,a greenish acetylene feather between the inert cone and the outer envelopecharacterizes a reducing flame (Figure 1.8b). This flame is reducing in natureand is desirable for welding aluminum alloys because aluminum oxidizeseasily. It is also good for welding high-carbon steels (also called carburizingflame in this case) because excess oxygen can oxidize carbon and form CO gasporosity in the weld metal.
8 FUSION WELDING PROCESSES
ToeToe
Reinforcement
T-joint;fillet weld
Butt joint;square weld
ToeReinforcement
Butt joint;single-V-groove weld
Root
Toe
Lap joint;fillet weld
Toe
Toe
(d)
(c)
(a)
(b)
Toe
T-joint;single bevel weld
Toe(e)
Figure 1.5 Typical weld joint variations.

OXYACETYLENE WELDING 9
(a) flat (b) horizontal
(c) vertical (d) overhead
Figure 1.6 Four welding positions.
Oxygen/acetylenemixture
Filler rod
Protectionenvelope
Metaldroplet
Base metal Weld pool
Weldmetal
Slag
Primarycombustion
RegulatorFlow meter
Acetylene
Weldingdirection
Gas torch
Workpiece
C2H2
O2
Valve
Oxygen
(a)
(b)
Figure 1.7 Oxyacetylene welding: (a) overall process; (b) welding area enlarged.

C. Oxidizing Flame When excess oxygen is used, the flame becomes oxi-dizing because of the presence of unconsumed oxygen. A short white innercone characterizes an oxidizing flame (Figure 1.8c). This flame is preferredwhen welding brass because copper oxide covers the weld pool and thus pre-vents zinc from evaporating from the weld pool.
1.2.3 Advantages and Disadvantages
The main advantage of the oxyacetylene welding process is that the equip-ment is simple, portable, and inexpensive. Therefore, it is convenient for main-tenance and repair applications. However, due to its limited power density, the
10 FUSION WELDING PROCESSES
inner cone
inner cone
acetylene feather
Reducing Flame
inner cone Oxidizing Flame
Neutral Flame
(a)
(b)
(c)
Figure 1.8 Three types of flames in oxyacetylene welding. Modified from WeldingJournal (4). Courtesy of American Welding Society.
C2H2 + O2Gas
Torch
2500 oC
1000 oC
2800 - 3500 oCinnercone
outerenvelope
2C2H2 + 2O2 (from cylinder)
Secondary combustion in outerenvelope (1/3 total heat) :
4CO + 2H2
4CO + 2O2 (from air) 4CO2
2H2 + O2 (from air) 2H2O
Primary combustion in innercone (2/3 total heat) :
Flame
Figure 1.9 Chemical reactions and temperature distribution in a neutral oxyacetyleneflame.

welding speed is very low and the total heat input per unit length of the weldis rather high, resulting in large heat-affected zones and severe distortion. Theoxyacetylene welding process is not recommended for welding reactive metalssuch as titanium and zirconium because of its limited protection power.
1.3 SHIELDED METAL ARC WELDING
1.3.1 The Process
Shielded metal arc welding (SMAW) is a process that melts and joins metalsby heating them with an arc established between a sticklike covered electrodeand the metals, as shown in Figure 1.10. It is often called stick welding.The electrode holder is connected through a welding cable to one terminal of the power source and the workpiece is connected through a second cableto the other terminal of the power source (Figure 1.10a).
The core of the covered electrode, the core wire, conducts the electriccurrent to the arc and provides filler metal for the joint. For electrical contact,the top 1.5cm of the core wire is bare and held by the electrode holder. Theelectrode holder is essentially a metal clamp with an electrically insulatedoutside shell for the welder to hold safely.
The heat of the arc causes both the core wire and the flux covering at theelectrode tip to melt off as droplets (Figure 1.10b). The molten metal collectsin the weld pool and solidifies into the weld metal. The lighter molten flux, onthe other hand, floats on the pool surface and solidifies into a slag layer at thetop of the weld metal.
1.3.2 Functions of Electrode Covering
The covering of the electrode contains various chemicals and even metalpowder in order to perform one or more of the functions described below.
A. Protection It provides a gaseous shield to protect the molten metal fromair. For a cellulose-type electrode, the covering contains cellulose, (C6H10O5)x.A large volume of gas mixture of H2, CO, H2O, and CO2 is produced when cellulose in the electrode covering is heated and decomposes. For a limestone-(CaCO3�) type electrode, on the other hand, CO2 gas and CaO slag form whenthe limestone decomposes. The limestone-type electrode is a low-hydrogen-type electrode because it produces a gaseous shield low in hydrogen. It is oftenused for welding metals that are susceptible to hydrogen cracking, such ashigh-strength steels.
B. Deoxidation It provides deoxidizers and fluxing agents to deoxidize andcleanse the weld metal. The solid slag formed also protects the already solid-ified but still hot weld metal from oxidation.
SHIELDED METAL ARC WELDING 11

C. Arc Stabilization It provides arc stabilizers to help maintain a stable arc. The arc is an ionic gas (a plasma) that conducts the electric current.Arc stabilizers are compounds that decompose readily into ions in the arc,such as potassium oxalate and lithium carbonate. They increase the electricalconductivity of the arc and help the arc conduct the electric current moresmoothly.
D. Metal Addition It provides alloying elements and/or metal powder tothe weld pool. The former helps control the composition of the weld metalwhile the latter helps increase the deposition rate.
1.3.3 Advantages and Disadvantages
The welding equipment is relatively simple, portable, and inexpensive as com-pared to other arc welding processes. For this reason, SMAW is often used formaintenance, repair, and field construction. However, the gas shield in SMAWis not clean enough for reactive metals such as aluminum and titanium. Thedeposition rate is limited by the fact that the electrode covering tends to over-heat and fall off when excessively high welding currents are used. The limitedlength of the electrode (about 35cm) requires electrode changing, and thisfurther reduces the overall production rate.
12 FUSION WELDING PROCESSES
Gaseous shield
Core wire
Flux covering
Slag
Metaldroplet
Fluxdroplet
Base metal Weld pool
Weldmetal
Arc
(a)
(b)
PowerSource
Cable 1
Electrodeholder
Stickelectrode
Weldingdirection
WorkpieceCable 2
Figure 1.10 Shielded metal arc welding: (a) overall process; (b) welding area enlarged.

1.4 GAS–TUNGSTEN ARC WELDING
1.4.1 The Process
Gas–tungsten arc welding (GTAW) is a process that melts and joins metals byheating them with an arc established between a nonconsumable tungsten elec-trode and the metals, as shown in Figure 1.11. The torch holding the tungstenelectrode is connected to a shielding gas cylinder as well as one terminal ofthe power source, as shown in Figure 1.11a. The tungsten electrode is usuallyin contact with a water-cooled copper tube, called the contact tube, as shownin Figure 1.11b, which is connected to the welding cable (cable 1) from the terminal. This allows both the welding current from the power source to enter the electrode and the electrode to be cooled to prevent overheating.Theworkpiece is connected to the other terminal of the power source through adifferent cable (cable 2). The shielding gas goes through the torch body andis directed by a nozzle toward the weld pool to protect it from the air. Pro-tection from the air is much better in GTAW than in SMAW because an inertgas such as argon or helium is usually used as the shielding gas and becausethe shielding gas is directed toward the weld pool. For this reason, GTAW is
GAS–TUNGSTEN ARC WELDING 13
Shielding gasnozzle
Weldmetal
Metaldroplet
Shieldinggas
Base metal Weld pool
Arc
Fillerrod
Weldingdirection
Filler rod
Torch
Cable 1
Workpiece
Shi
eldi
ng g
ascy
linde
r
Flowmeter
Regulator
Tungsten electrode
(a)
(b)
Powersource
Contact tubeShielding
gasCable 1
Cable 2
Figure 1.11 Gas–tungsten arc welding: (a) overall process; (b) welding area enlarged.

also called tungsten–inert gas (TIG) welding. However, in special occasions anoninert gas (Chapter 3) can be added in a small quantity to the shielding gas.Therefore, GTAW seems a more appropriate name for this welding process.When a filler rod is needed, for instance, for joining thicker materials, it canbe fed either manually or automatically into the arc.
1.4.2 Polarity
Figure 1.12 shows three different polarities in GTAW (5), which are describednext.
A. Direct-Current Electrode Negative (DCEN) This, also called the straightpolarity, is the most common polarity in GTAW. The electrode is connected tothe negative terminal of the power supply. As shown in Figure 1.12a, electronsare emitted from the tungsten electrode and accelerated while travelingthrough the arc. A significant amount of energy, called the work function, isrequired for an electron to be emitted from the electrode. When the electronenters the workpiece, an amount of energy equivalent to the work function isreleased. This is why in GTAW with DCEN more power (about two-thirds) islocated at the work end of the arc and less (about one-third) at the electrodeend. Consequently, a relatively narrow and deep weld is produced.
B. Direct-Current Electrode Positive (DCEP) This is also called the reversepolarity. The electrode is connected to the positive terminal of the powersource. As shown in Figure 1.12b, the heating effect of electrons is now at thetungsten electrode rather than at the workpiece. Consequently, a shallow weldis produced. Furthermore, a large-diameter, water-cooled electrodes must beused in order to prevent the electrode tip from melting. The positive ions ofthe shielding gas bombard the workpiece, as shown in Figure 1.13, knockingoff oxide films and producing a clean weld surface. Therefore, DCEP can be
14 FUSION WELDING PROCESSES
DC electrodenegative
DC electrodepositive
AC
deep weld,no surface cleaning
shallow weld,surface cleaning
intermediate
pool
(a) (b) (c)
Figure 1.12 Three different polarities in GTAW.

used for welding thin sheets of strong oxide-forming materials such as alu-minum and magnesium, where deep penetration is not required.
C. Alternating Current (AC) Reasonably good penetration and oxidecleaning action can both be obtained, as illustrated in Figure 1.12c.This is oftenused for welding aluminum alloys.
1.4.3 Electrodes
Tungsten electrodes with 2% cerium or thorium have better electron emissivity, current-carrying capacity, and resistance to contamination thanpure tungsten electrodes (3). As a result, arc starting is easier and the arc ismore stable. The electron emissivity refers to the ability of the electrode tipto emit electrons. A lower electron emissivity implies a higher electrode tiptemperature required to emit electrons and hence a greater risk of melting thetip.
1.4.4 Shielding Gases
Both argon and helium can be used. Table 1.2 lists the properties of someshielding gases (6). As shown, the ionization potentials for argon and heliumare 15.7 and 24.5eV (electron volts), respectively. Since it is easier to ionizeargon than helium, arc initiation is easier and the voltage drop across the arcis lower with argon. Also, since argon is heavier than helium, it offers moreeffective shielding and greater resistance to cross draft than helium. WithDCEP or AC, argon also has a greater oxide cleaning action than helium.These advantages plus the lower cost of argon make it more attractive forGTAW than helium.
GAS–TUNGSTEN ARC WELDING 15
Cleaning action (electrode positive)
knocked-off atoms
oxide film on surface
M M MOO
OM
Workpiece (negative)
Ar+
bombarding heavy ion
Figure 1.13 Surface cleaning action in GTAW with DC electrode positive.
Because of the greater voltage drop across a helium arc than an argon arc,however, higher power inputs and greater sensitivity to variations in the arclength can be obtained with helium. The former allows the welding of thickersections and the use of higher welding speeds. The latter, on the other hand,allows a better control of the arc length during automatic GTAW.
1.4.5 Advantages and Disadvantages
Gas–tungsten arc welding is suitable for joining thin sections because of itslimited heat inputs. The feeding rate of the filler metal is somewhat indepen-dent of the welding current, thus allowing a variation in the relative amountof the fusion of the base metal and the fusion of the filler metal. Therefore,the control of dilution and energy input to the weld can be achieved withoutchanging the size of the weld. It can also be used to weld butt joints of thinsheets by fusion alone, that is, without the addition of filler metals or autoge-nous welding. Since the GTAW process is a very clean welding process, it canbe used to weld reactive metals, such as titanium and zirconium, aluminum,and magnesium.
However, the deposition rate in GTAW is low. Excessive welding currentscan cause melting of the tungsten electrode and results in brittle tungsteninclusions in the weld metal. However, by using preheated filler metals, thedeposition rate can be improved. In the hot-wire GTAW process, the wire isfed into and in contact with the weld pool so that resistance heating can beobtained by passing an electric current through the wire.
1.5 PLASMA ARC WELDING
1.5.1 The Process
Plasma arc welding (PAW) is an arc welding process that melts and joins metalsby heating them with a constricted arc established between a tungsten elec-
16 FUSION WELDING PROCESSES
TABLE 1.2 Properties of Shielding Gases Used for Welding
Molecular Specific Gravity IonizationChemical Weight with Respect to Air Density Potential
Gas Symbol (g/mol) at 1atm and 0°C (g/L) (eV)
Argon Ar 39.95 1.38 1.784 15.7Carbon dioxide CO2 44.01 1.53 1.978 14.4Helium He 4.00 0.1368 0.178 24.5Hydrogen H2 2.016 0.0695 0.090 13.5Nitrogen N2 28.01 0.967 1.25 14.5Oxygen O2 32.00 1.105 1.43 13.2
Source: Reprinted from Lyttle (6).

trode and the metals, as shown in Figure 1.14. It is similar to GTAW, but anorifice gas as well as a shielding gas is used. As shown in Figure 1.15, the arc inPAW is constricted or collimated because of the converging action of the orificegas nozzle, and the arc expands only slightly with increasing arc length (5).Direct-current electrode negative is normally used, but a special variable-polarity PAW machine has been developed for welding aluminum, where thepresence of aluminum oxide films prevents a keyhole from being established.
1.5.2 Arc Initiation
The tungsten electrode sticks out of the shielding gas nozzle in GTAW (Figure1.11b) while it is recessed in the orifice gas nozzle in PAW (Figure 1.14b). Con-sequently, arc initiation cannot be achieved by striking the electrode tip againstthe workpiece as in GTAW. The control console (Figure 1.14a) allows a pilotarc to be initiated, with the help of a high-frequency generator, between theelectrode tip and the water-cooled orifice gas nozzle. The arc is then gradually
PLASMA ARC WELDING 17
Shielding gas
PowerSource
CablesFillerrod
Controlconsole
Weldingdirection
Torch
Orifice gas
Workpiece
(a)
(b) Tungstenelectrode
Weldmetal
Orifice gas
Shielding gasnozzle
Shieldinggas
Orifice
Molten metal
Base metalKeyhole
Arc plasma
Orifice gas nozzle(water cooled)
Figure 1.14 Plasma arc welding: (a) overall process; (b) welding area enlarged andshown with keyholing.

transferred from between the electrode tip and the orifice gas nozzle tobetween the electrode tip and the workpiece.
1.5.3 Keyholing
In addition to the melt-in mode adopted in conventional arc welding processes(such as GTAW), the keyholing mode can also be used in PAW in certainranges of metal thickness (e.g., 2.5–6.4mm). With proper combinations of theorifice gas flow, the travel speed, and the welding current, keyholing is possi-ble. Keyholing is a positive indication of full penetration and it allows the use of significantly higher welding speeds than GTAW. For example, it hasbeen reported (7) that PAW took one-fifth to one-tenth as long to completea 2.5-m-long weld in 6.4-mm-thick 410 stainless steel as GTAW. Gas–tungstenarc welding requires multiple passes and is limited in welding speed.As shownin Figure 1.16, 304 stainless steel up to 13mm (1/2 in.) thick can be welded in asingle pass (8). The wine-cup-shaped weld is common in keyholing PAW.
1.5.4 Advantages and Disadvantages
Plasma arc welding has several advantages over GTAW.With a collimated arc,PAW is less sensitive to unintentional arc length variations during manualwelding and thus requires less operator skill than GTAW. The short arc lengthin GTAW can cause a welder to unintentionally touch the weld pool with theelectrode tip and contaminate the weld metal with tungsten. However, PAWdoes not have this problem since the electrode is recessed in the nozzle. Asalready mentioned, the keyhole is a positive indication of full penetration, andit allows higher welding speeds to be used in PAW.
However, the PAW torch is more complicated. It requires proper electrodetip configuration and positioning, selection of correct orifice size for the appli-cation, and setting of both orifice and shielding gas flow rates. Because of the
18 FUSION WELDING PROCESSES
Plasma arc Gas tungsten arc
Figure 1.15 Comparison between a gas–tungsten arc and a plasma arc. From WeldingHandbook (5). Courtesy of American Welding Society.

need for a control console, the equipment cost is higher in PAW than in GTAW.The equipment for variable-polarity PAW is much more expensive than thatfor GTAW.
1.6 GAS–METAL ARC WELDING
1.6.1 The Process
Gas–metal arc welding (GMAW) is a process that melts and joins metals byheating them with an arc established between a continuously fed filler wireelectrode and the metals, as shown in Figure 1.17. Shielding of the arc and themolten weld pool is often obtained by using inert gases such as argon andhelium, and this is why GMAW is also called the metal–inert gas (MIG)welding process. Since noninert gases, particularly CO2, are also used, GMAWseems a more appropriate name. This is the most widely used arc weldingprocess for aluminum alloys. Figure 1.18 shows gas–metal arc welds of 5083aluminum, one made with Ar shielding and the other with 75% He–25% Arshielding (9). Unlike in GTAW, DCEP is used in GMAW. A stable arc, smoothmetal transfer with low spatter loss and good weld penetration can beobtained. With DCEN or AC, however, metal transfer is erratic.
1.6.2 Shielding Gases
Argon, helium, and their mixtures are used for nonferrous metals as well asstainless and alloy steels. The arc energy is less uniformly dispersed in an Ararc than in a He arc because of the lower thermal conductivity of Ar. Conse-quently, the Ar arc plasma has a very high energy core and an outer mantleof lesser thermal energy. This helps produce a stable, axial transfer of metal
GAS–METAL ARC WELDING 19
Figure 1.16 A plasma arc weld made in 13-mm-thick 304 stainless steel with keyhol-ing. From Lesnewich (8).

droplets through an Ar arc plasma. The resultant weld transverse cross sectionis often characterized by a papillary- (nipple-) type penetration pattern (10)such as that shown in Figure 1.18 (left). With pure He shielding, on the otherhand, a broad, parabolic-type penetration is often observed.
With ferrous metals, however, He shielding may produce spatter and Arshielding may cause undercutting at the fusion lines. Adding O2 (about 3%)or CO2 (about 9%) to Ar reduces the problems. Carbon and low-alloy steelsare often welded with CO2 as the shielding gas, the advantages being higher
20 FUSION WELDING PROCESSES
(b)
(a)
Shielding gasnozzle
Weldmetal
Metaldroplet
Shieldinggas
Base metal Weld pool
Arc
Shieldinggas
RegulatorFlow meter
Wire drive& control
Wirereel
Wireelectrode
Workpiece
Gun
PowerSource
Shieldinggascylinder
Weldingdirection
Wire electrodeContact tube
Cable 1
Cable 2
Cable 1
Figure 1.17 Gas–metal arc welding: (a) overall process; (b) welding area enlarged.
Figure 1.18 Gas–metal arc welds in 6.4-mm-thick 5083 aluminum made with argon(left) and 75% He–25% Ar (right). Reprinted from Gibbs (9). Courtesy of AmericanWelding Society.

welding speed, greater penetration, and lower cost. Since CO2 shielding pro-duces a high level of spatter, a relatively low voltage is used to maintain a shortburied arc to minimize spatter; that is, the electrode tip is actually below theworkpiece surface (10).
1.6.3 Modes of Metal Transfer
The molten metal at the electrode tip can be transferred to the weld pool bythree basic transfer modes: globular, spray, and short-circuiting.
A. Globular Transfer Discrete metal drops close to or larger than the electrode diameter travel across the arc gap under the influence of gravity.Figure 1.19a shows globular transfer during GMAW of steel at 180A and with Ar–2% O2 shielding (11). Globular transfer often is not smooth and produces spatter. At relatively low welding current globular transfer occurs regardless of the type of the shielding gas. With CO2 and He, however,it occurs at all usable welding currents. As already mentioned, a short buried arc is used in CO2-shielded GMAW of carbon and low-alloy steels tominimize spatter.
GAS–METAL ARC WELDING 21
Figure 1.19 Metal transfer during GMAW of steel with Ar–2% O2 shielding: (a) globular transfer at 180A and 29V shown at every 3 ¥ 10-3 s; (b) spray transfer at 320A and 29V shown at every 2.5 ¥ 10-4 s. Reprinted from Jones et al. (11). Courtesyof American Welding Society.

B. Spray Transfer Above a critical current level, small discrete metal dropstravel across the arc gap under the influence of the electromagnetic force atmuch higher frequency and speed than in the globular mode. Figure 1.19bshows spray transfer during GMAW of steel at 320A and with Ar–2% O2
shielding (11). Metal transfer is much more stable and spatter free. The criti-cal current level depends on the material and size of the electrode and thecomposition of the shielding gas. In the case of Figure 1.19, the critical currentwas found to be between 280 and 320A (11).
C. Short-Circuiting Transfer The molten metal at the electrode tip is trans-ferred from the electrode to the weld pool when it touches the pool surface,that is, when short circuiting occurs. Short-circuiting transfer encompasses thelowest range of welding currents and electrode diameters. It produces a smalland fast-freezing weld pool that is desirable for welding thin sections, out-of-position welding (such as overhead-position welding), and bridging large rootopenings.
1.6.4 Advantages and Disadvantages
Like GTAW, GMAW can be very clean when using an inert shielding gas. Themain advantage of GMAW over GTAW is the much higher deposition rate,which allows thicker workpieces to be welded at higher welding speeds. Thedual-torch and twin-wire processes further increase the deposition rate ofGMAW (12). The skill to maintain a very short and yet stable arc in GTAWis not required. However, GMAW guns can be bulky and difficult-to-reachsmall areas or corners.
1.7 FLUX-CORE ARC WELDING
1.7.1 The Process
Flux-core arc welding (FCAW) is similar to GMAW, as shown in Figure 1.20a.However, as shown in Figure 1.20b, the wire electrode is flux cored rather thansolid; that is, the electrode is a metal tube with flux wrapped inside. The func-tions of the flux are similar to those of the electrode covering in SMAW, includ-ing protecting the molten metal from air. The use of additional shielding gasis optional.
1.8 SUBMERGED ARC WELDING
1.8.1 The Process
Submerged arc welding (SAW) is a process that melts and joins metals byheating them with an arc established between a consumable wire electrode
22 FUSION WELDING PROCESSES

and the metals, with the arc being shielded by a molten slag and granular flux,as shown in Figure 1.21. This process differs from the arc welding processesdiscussed so far in that the arc is submerged and thus invisible. The flux is sup-plied from a hopper (Figure 1.21a), which travels with the torch. No shieldinggas is needed because the molten metal is separated from the air by the moltenslag and granular flux (Figure 1.21b). Direct-current electrode positive is mostoften used. However, at very high welding currents (e.g., above 900A) AC ispreferred in order to minimize arc blow. Arc blow is caused by the electro-magnetic (Lorentz) force as a result of the interaction between the electriccurrent itself and the magnetic field it induces.
1.8.2 Advantages and Disadvantages
The protecting and refining action of the slag helps produce clean welds inSAW. Since the arc is submerged, spatter and heat losses to the surroundingair are eliminated even at high welding currents. Both alloying elements andmetal powders can be added to the granular flux to control the weld metalcomposition and increase the deposition rate, respectively. Using two or moreelectrodes in tandem further increases the deposition rate. Because of its high
SUBMERGED ARC WELDING 23
(b)
(a)
Shielding gasnozzle
Weldmetal
Base metal Weld pool
Arc
Shieldinggas
RegulatorFlow meter
Wire drive& control
Wirereel
Wireelectrode
Workpiece
Gun
PowerSource
Shieldinggascylinder
Weldingdirection
Wire electrodeContact tube
Cable 1
Cable 2
Cable 1
Slag
Metal dropletFlux droplet
Shielding gas(optional)
Figure 1.20 Flux-core arc welding: (a) overall process; (b) welding area enlarged.

deposition rate, workpieces much thicker than that in GTAW and GMAW canbe welded by SAW. However, the relatively large volumes of molten slag andmetal pool often limit SAW to flat-position welding and circumferentialwelding (of pipes). The relatively high heat input can reduce the weld qualityand increase distortions.
1.9 ELECTROSLAG WELDING
1.9.1 The Process
Electroslag welding (ESW) is a process that melts and joins metals by heatingthem with a pool of molten slag held between the metals and continuouslyfeeding a filler wire electrode into it, as shown in Figure 1.22. The weld poolis covered with molten slag and moves upward as welding progresses. A pairof water-cooled copper shoes, one in the front of the workpiece and onebehind it, keeps the weld pool and the molten slag from breaking out. Similarto SAW, the molten slag in ESW protects the weld metal from air and refinesit. Strictly speaking, however, ESW is not an arc welding process, because thearc exists only during the initiation period of the process, that is, when the arc
24 FUSION WELDING PROCESSES
Wire reel
Wire electrode
Wire drive & control
Cables
Flux hopper
Workpiece
Granularflux Wire electrode
Arc Molten slagSolidified slag
Metal pool
(a)
(b)
Weldingdirection
Weld metalBase metal
PowerSource
Droplet
Figure 1.21 Submerged arc welding: (a) overall process; (b) welding area enlarged.

heats up the flux and melts it. The arc is then extinguished, and the resistanceheating generated by the electric current passing through the slag keeps itmolten. In order to make heating more uniform, the electrode is often oscil-lated, especially when welding thicker sections. Figure 1.23 is the transversecross section of an electroslag weld in a steel 7cm thick (13). Typical examplesof the application of ESW include the welding of ship hulls, storage tanks, andbridges.
1.9.2 Advantages and Disadvantages
Electroslag welding can have extremely high deposition rates, but only onesingle pass is required no matter how thick the workpiece is. Unlike SAW orother arc welding processes, there is no angular distortion in ESW because the
ELECTROSLAG WELDING 25
Wire electrode
Consumableguide tube
Base metal
Molten slag
Weld pool
Weld metal
Cable
Water-cooledcoppershoes
Cable
Workpiece
Wirereel
PowerSource
Wire feedmotor & control
Bottomsupport
(a)
(b)
Figure 1.22 Electroslag welding: (a) overall process; (b) welding area enlarged.

weld is symmetrical with respect to its axis. However, the heat input is veryhigh and the weld quality can be rather poor, including low toughness causedby the coarse grains in the fusion zone and the heat-affected zone. Electroslagwelding is restricted to vertical position welding because of the very largepools of the molten metal and slag.
Figure 1.24 summarizes the deposition rates of the arc welding processesdiscussed so far (14). As shown, the deposition rate increases in the order of
26 FUSION WELDING PROCESSES
Figure 1.23 Transverse cross section of electroslag weld in 70-mm-thick steel.Reprinted from Eichhorn et al. (13). Courtesy of American Welding Society.
Deposition Rate, Lb/hr
Wel
ding
Pro
cess
(10
0% D
uty
Cyc
le)
601060127018
7024coldwire
fine wirespray
CO2 shielded
with iron powder added1 electrode 2 electrodes
4 electrodes5 electrodes
3 electrodes
SMAW
GTAW/PAW
GMAW
FCAW
SAW
ESW
0 40 80 120 160 200
Deposition Rate, Kg/hr8020 40 600
iron powder
Figure 1.24 Deposition rate in arc welding processes. Modified from Cary (14).

GTAW, SMAW, GMAW and FCAW, SAW, and ESW. The deposition rate canbe much increased by adding iron powder in SAW or using more than onewire in SAW, ESW, and GMAW (not shown).
1.10 ELECTRON BEAM WELDING
1.10.1 The Process
Electron beam welding (EBW) is a process that melts and joins metals byheating them with an electron beam. As shown in Figure 1.25a, the cathode ofthe electron beam gun is a negatively charged filament (15). When heated upto its thermionic emission temperature, this filament emits electrons. Theseelectrons are accelerated by the electric field between a negatively chargedbias electrode (located slightly below the cathode) and the anode. They passthrough the hole in the anode and are focused by an electromagnetic coil toa point at the workpiece surface. The beam currents and the accelerating voltages employed for typical EBW vary over the ranges of 50–1000mA and30–175kV, respectively. An electron beam of very high intensity can vaporizethe metal and form a vapor hole during welding, that is, a keyhole, as depictedin Figure 1.25b.
Figure 1.26 shows that the beam diameter decreases with decreasingambient pressure (1). Electrons are scattered when they hit air molecules, andthe lower the ambient pressure, the less they are scattered. This is the mainreason for EBW in a vacuum chamber.
The electron beam can be focused to diameters in the range of 0.3–0.8mmand the resulting power density can be as high as 1010 W/m2 (1). The very high
ELECTRON BEAM WELDING 27
weldingdirection
weldbead
electronbeam
keyhole
weld pool
cross-sectionof weld
(b)
motenmetal
electronbeam
specimen
biaselectrode
anode
focusingcoil
topump
highvoltagecathode
(a)
vacuumchamber
Figure 1.25 Electron beam welding: (a) process; (b) keyhole. Modified from Arata(15).

power density makes it possible to vaporize the material and produce a deep-penetrating keyhole and hence weld. Figure 1.27 shows a single-pass electronbeam weld and a dual-pass gas–tungsten arc weld in a 13-mm-thick (0.5-in.)2219 aluminum, the former being much narrower (16). The energy requiredper unit length of the weld is much lower in the electron beam weld (1.5kJ/cm,or 3.8kJ/in.) than in the gas–tungsten arc weld (22.7kJ/cm, or 57.6kJ/in.).
Electron beam welding is not intended for incompletely degassed materi-als such as rimmed steels. Under high welding speeds gas bubbles that do nothave enough time to leave deep weld pools result in weld porosity. Materialscontaining high-vapor-pressure constituents, such as Mg alloys and Pb-containing alloys, are not recommended for EBW because evaporation ofthese elements tends to foul the pumps or contaminate the vacuum system.
1.10.2 Advantages and Disadvantages
With a very high power density in EBW, full-penetration keyholing is possi-ble even in thick workpieces. Joints that require multiple-pass arc welding can
28 FUSION WELDING PROCESSES
750 torr 500 torr 250 torr 50 torr 5 torr
Figure 1.26 Dispersion of electron beam at various ambient pressures (1). Reprintedfrom Welding Handbook (1). Courtesy of American Welding Society.
13 mm(0.5 in)
electronbeamweld
gastungstenarc weld
(a) (b)
Figure 1.27 Welds in 13-mm-thick 2219 aluminum: (a) electron beam weld; (b)gas–tungsten arc weld. From Farrell (16).

be welded in a single pass at a high welding speed. Consequently, the total heat input per unit length of the weld is much lower than that in arc welding,resulting in a very narrow heat-affected zone and little distortion. Reactiveand refractory metals can be welded in vacuum where there is no air to causecontamination. Some dissimilar metals can also be welded because the veryrapid cooling in EBW can prevent the formation of coarse, brittle intermetal-lic compounds.When welding parts varying greatly in mass and size, the abilityof the electron beam to precisely locate the weld and form a favorably shapedfusion zone helps prevent excessive melting of the smaller part.
However, the equipment cost for EBW is very high. The requirement ofhigh vacuum (10-3–10-6 torr) and x-ray shielding is inconvenient and time con-suming. For this reason, medium-vacuum (10-3–25 torr) EBW and nonvacuum(1atm) EBW have also been developed. The fine beam size requires precisefit-up of the joint and alignment of the joint with the gun. As shown in Figure1.28, residual and dissimilar metal magnetism can cause beam deflection andresult in missed joints (17).
1.11 LASER BEAM WELDING
1.11.1 The Process
Laser beam welding (LBW) is a process that melts and joins metals by heatingthem with a laser beam. The laser beam can be produced either by a solid-
LASER BEAM WELDING 29
Missedjoint
48356 47421
A387SB49
Figure 1.28 Missed joints in electron beam welds in 150-mm-thick steels: (a)2.25Cr–1Mo steel with a transverse flux density of 3.5G parallel to joint plane; (b) SB(C–Mn) steel and A387 (2.25Cr–1Mo) steel. Reprinted from Blakeley and Sanderson(17). Courtesy of American Welding Society.
(a) (b)

state laser or a gas laser. In either case, the laser beam can be focused anddirected by optical means to achieve high power densities. In a solid-statelaser, a single crystal is doped with small concentrations of transition elementsor rare earth elements. For instance, in a YAG laser the crystal of yttrium–aluminum–garnet (YAG) is doped with neodymium. The electrons of thedopant element can be selectively excited to higher energy levels upon expo-sure to high-intensity flash lamps, as shown in Figure 1.29a. Lasing occurs whenthese excited electrons return to their normal energy state, as shown in Figure1.29b.The power level of solid-state lasers has improved significantly, and con-tinuous YAG lasers of 3 or even 5kW have been developed.
In a CO2 laser, a gas mixture of CO2, N2, and He is continuously excited by electrodes connected to the power supply and lases continuously. Higher
30 FUSION WELDING PROCESSES
(a)
Powersource
Coolingsystem
Reflecting mirror
Patially reflecting mirrorFocusing lens
Traveldirection
Pool Weld
Workpiece
Cry
stal High
intensityflashlamp
(b)
energy absorbedfrom flash lamp
energy emittedas heat
energyemitted aslight (photon)
nucleus
ground
intermediateexcited
innerelectrons
outerelectronenergylevels
normalelectronorbits
Figure 1.29 Laser beam welding with solid-state laser: (a) process; (b) energy absorp-tion and emission during laser action. Modified from Welding Handbook (1).

power can be achieved by a CO2 laser than a solid-state laser, for instance,15kW. Figure 1.30a shows LBW in the keyholing mode. Figure 1.30b shows aweld in a 13-mm-thick A633 steel made with a 15-kW CO2 laser at 20mm/s(18).
Besides solid-state and gas lasers, semiconductor-based diode lasers havealso been developed. Diode lasers of 2.5kW power and 1mm focus diameterhave been demonstrated (19). While keyholing is not yet possible, conduction-mode (surface melting) welding has produced full-penetration welds with adepth–width ratio of 3 : 1 or better in 3-mm-thick sheets.
1.11.2 Reflectivity
The very high reflectivity of a laser beam by the metal surface is a well-knownproblem in LBW. As much as about 95% of the CO2 beam power can bereflected by a polished metal surface. Reflectivity is slightly lower with a YAGlaser beam. Surface modifications such as roughening, oxidizing, and coatingcan reduce reflectivity significantly (20). Once keyholing is established, absorp-tion is high because the beam is trapped inside the hole by internal reflection.
1.11.3 Shielding Gas
A plasma (an ionic gas) is produced during LBW, especially at high powerlevels, due to ionization by the laser beam. The plasma can absorb and scatterthe laser beam and reduce the depth of penetration significantly. It is there-fore necessary to remove or suppress the plasma (21). The shielding gas forprotecting the molten metal can be directed sideways to blow and deflect theplasma away from the beam path. Helium is often preferred to argon as theshielding gas for high-power LBW because of greater penetration depth (22).
LASER BEAM WELDING 31
weldingdirection
weldbead
laserbeam
keyhole
weld pool
cross-sectionof weld
(a) (b)
moltenmetal
2 mm
Figure 1.30 Laser beam welding with CO2 laser: (a) process; (b) weld in 13-mm-thickA633 steel. (b) Courtesy of E.A. Metzbower.

Since the ionization energy of helium (24.5eV) is higher than that of argon(15.7eV), helium is less likely to be ionized and become part of the plasmathan argon. However, helium is lighter than air and is thus less effective in dis-placing air from the beam path. Helium–10% Ar shielding has been found to improve penetration over pure He at high-speed welding where a lightshielding gas may not have enough time to displace air from the beam path(23).
1.11.4 Lasers in Arc Welding
As shown in Figure 1.31, laser-assisted gas metal arc welding (LAGMAW) hasdemonstrated significantly greater penetration than conventional GMAW(24). In addition to direct heating, the laser beam acts to focus the arc byheating its path through the arc. This increases ionization and hence the con-ductivity of the arc along the beam path and helps focus the arc energy alongthe path. It has been suggested that combining the arc power with a 5-kW CO2
laser, LAGMAW has the potential to achieve weld penetration in mild steelequivalent to that of a 20–25-kW laser (24). Albright et al. (25) have shownthat a lower power CO (not CO2) laser of 7W and 1mm diameter can initi-ate, guide, and focus an Ar–1% CO gas–tungsten arc.
1.11.5 Advantages and Disadvantages
Like EBW, LBW can produce deep and narrow welds at high welding speeds,with a narrow heat-affected zone and little distortion of the workpiece. It can
32 FUSION WELDING PROCESSES
LAGMAWGMAW
300 400 500 600 7000
2
4
6
8
10
12
Welding current (A)
Pen
etra
tion
(mm
)
Figure 1.31 Weld penetration in GMAW and laser-assisted GMAW using CO2 laserat 5.7kW. Reprinted from Hyatt et al. (24). Courtesy of American Welding Society.

be used for welding dissimilar metals or parts varying greatly in mass and size.Unlike EBW, however, vacuum and x-ray shielding are not required in LBW.However, the very high reflectivity of a laser beam by the metal surface is amajor drawback, as already mentioned. Like EBW, the equipment cost is veryhigh, and precise joint fit-up and alignment are required.
REFERENCES
1. Welding Handbook, Vol. 3, 7th ed., American Welding Society, Miami, FL, 1980,pp. 170–238.
2. Mendez, P. F., and Eagar, T. W., Advanced Materials and Processes, 159: 39,2001.
3. Welding Handbook, Vol. 1, 7th ed., American Welding Society, Miami, FL, 1976,pp. 2–32.
4. Welding Workbook, Data Sheet 212a, Weld. J., 77: 65, 1998.5. Welding Handbook, Vol. 2, 7th ed., American Welding Society, Miami, FL, 1978,
pp. 78–112, 296–330.6. Lyttle, K. A., in ASM Handbook, Vol. 6, ASM International, Materials Park, OH,
1993, p. 64.7. Schwartz, M. M., Metals Joining Manual, McGraw-Hill, New York, 1979, pp. 2–1 to
3–40.8. Lesnewich, A., in Weldability of Steels, 3rd ed., Eds. R. D. Stout and W. D. Doty,
Welding Research Council, New York, 1978, p. 5.9. Gibbs, F. E., Weld. J., 59: 23, 1980.
10. Fact Sheet—Choosing Shielding for GMA Welding, Weld. J., 79: 18, 2000.11. Jones, L. A., Eagar, T. W., and Lang, J. H., Weld. J., 77: 135s, 1998.12. Blackman, S. A., and Dorling, D. V., Weld. J., 79: 39, 2000.13. Eichhorn, F., Remmel, J., and Wubbels, B., Weld. J., 63: 37, 1984.14. Cary, H. B., Modern Welding Technology, Prentice-Hall, Englewood Cliffs, NJ,
1979.15. Arata, Y., Development of Ultra High Energy Density Heat Source and Its Appli-
cation to Heat Processing, Okada Memorial Japan Society, 1985.16. Farrell, W. J., The Use of Electron Beam to Fabricate Structural Members, Creative
Manufacturing Seminars, ASTME Paper SP 63-208, 1962–1963.17. Blakeley, P. J., and Sanderson, A., Weld. J., 63: 42, 1984.18. Metzbower, E. A., private communication, Naval Research Laboratory,
Washington, DC.19. Bliedtner, J., Heyse, Th., Jahn, D., Michel, G., Muller, H., and Wolff, D., Weld. J., 80:
47, 2001.20. Xie, J., and Kar, A., Weld. J., 78: 343s, 1999.21. Mazumder, J., in ASM Handbook, Vol. 6, ASM International, Materials Park, OH,
1993, p. 874.22. Rockstroh, T., and Mazumder, J., J. Appl. Phys., 61: 917, 1987.
REFERENCES 33

23. Seaman, F., Role of Shielding Gas in Laser Welding, Technical Paper MR77-982,Society of Manufacturing Engineers, Dearborn, MI, 1977.
24. Hyatt, C. V., Magee, K. H., Porter, J. F., Merchant, V. E., and Matthews, J. R., Weld.J., 80: 163s, 2001.
25. Albright, C. E., Eastman, J., and Lempert, W., Weld. J., 80: 55, 2001.26. Ushio, M., Matsuda, F., and Sadek, A. A., in “ International Trends in Welding
Science and Technology, Eds. S. A. David and J. M. Vitek, ASM International,Materials Park, OH, March 1993, p. 408.
FURTHER READING
1. Arata, Y., Development of Ultra High Energy Density Heat Source and Its Applica-tion to Heat Processing, Okada Memorial Society for the Promotion of Welding,Japan, 1985.
2. Schwartz, M. M., Metals Joining Manual, McGraw-Hill, New York, 1979.3. Welding Handbook, Vols. 1–3, 7th ed., American Welding Society, Miami, FL,
1980.4. Duley, W. W., Laser Welding, Wiley, New York, 1999.5. ASM Handbook, Vol. 6, ASM International, Materials Park, OH, 1993.
PROBLEMS
1.1 It has been suggested that compared to SMAW, the cooling rate ishigher in GMAW and it is, therefore, more likely for heat-affected zonecracking to occur in hardenable steels. What is the main reason for thecooling rate to be higher in GMAW than SMAW?
1.2 The diameter of the electrodes to be used in SMAW depends on factorssuch as the workpiece thickness, the welding position, and the jointdesign. Large electrodes, with their corresponding high currents, tend toproduce large weld pools. When welding in the overhead or verticalposition, do you prefer using larger or smaller electrodes?
1.3 In arc welding, the magnetic field induced by the welding currentpassing through the electrode and the workpiece can interact with thearc and cause “arc blow.” Severe arc blow can cause excessive weldspatter and incomplete fusion. When arc blow is a problem in SMAW,do you expect to minimize it by using DC or AC for welding?
1.4 In the hot-wire GTAW process, shown in Figure P1.4, the tip of the fillermetal wire is dipped in the weld pool and the wire itself is resistanceheated by means of a second power source between the contact tube ofthe wire and the workpiece. In the case of steels, the deposition rate can
34 FUSION WELDING PROCESSES

be more than doubled this way. Do you prefer using an AC or a DCpower source for heating the wire? Do you expect to apply this processto aluminum and copper alloys?
1.5 In GTAW the welding cable is connected to the tungsten electrodethrough a water-cooled copper contact tube, as shown in Figure 1.11.Why is the tube positioned near the lower end of the electrode insteadof the top?
1.6 Measurements of the axial temperature distribution along the GTAWelectrode have shown that the temperature drops sharply from the electrode tip toward the contact tube. Why? For instance, with a 2.4-mm-diameter W–ThO2 electrode at 150A, the temperature dropsfrom about 3600K at the tip to about 2000K at 5mm above the tip.Under the same condition but with a W–CeO2 electrode, the tempera-ture drops from about 2700K at the tip to about 1800K at 5mm abovethe tip (26). Which electrode can carry more current before melting andwhy?
1.7 Experimental results show that in EBW the penetration depth of theweld decreases as the welding speed increases. Explain why. Under thesame power and welding speed, do you expect a much greater penetra-tion depth in aluminum or steel and why?
1.8 How does the working distance in EBW affect the depth–width ratio ofthe resultant weld?
1.9 Consider EBW in the presence of a gas environment. Under the samepower and welding speed, rank and explain the weld penetration for Ar,He, and air. The specific gravities of Ar, He, and air with respect to airare 1.38, 0.137, and 1, respectively, at 1atm, 0°C.
PROBLEMS 35
Shieldinggas nozzle
Weldmetal
Shieldinggas
Base metal Weld pool
Arc
Tungsten electrode
Contact tubeCable 1
Wire feeder
Filler wire
2ndpowersource
Cable 3
Cable 4
Contact tube
Figure P1.4

1.10 Which arc welding process could have been used for joining the edgeweld of thin-gauge steel shown in Figure P1.10 and why?
1.11 Two 15-cm-thick steel plates were joined together in a single pass, asshown in Figure P1.11.Which welding process could have been used andwhy?
36 FUSION WELDING PROCESSES
weld
1 mm
1 mm
transversecross-section
Figure P1.10
15 cm
15 cm
weld transversecross-section
steel
stee
l
Figure P1.11
2 Heat Flow in Welding
Heat flow during welding, as will be shown throughout Parts II–IV of thisbook, can strongly affect phase transformations during welding and thus theresultant microstructure and properties of the weld. It is also responsible forweld residual stresses and distortion, as will be discussed in Chapter 5.
2.1 HEAT SOURCE
2.1.1 Heat Source Efficiency
A. Definition The heat source efficiency h is defined as
(2.1)
where Q is the rate of heat transfer from the heat source to the workpiece,Qnominal the nominal power of the heat source, and tweld the welding time. Aportion of the power provided by the heat source is transferred to the work-piece and the remaining portion is lost to the surroundings. Consequently,h < 1. If the heat source efficiency h is known, the heat transfer rate to theworkpiece, Q, can be easily determined from Equation (2.1).
In arc welding with a constant voltage E and a constant current I, the arcefficiency can be expressed as
(2.2)
Equation (2.2) can also be applied to electron beam welding, where h is theheat source efficiency. In laser beam welding, Qnominal in Equation (2.1) is thepower of the laser beam, for instance, 2500W.
It should be noted that in the welding community the term heat input oftenrefers to Qnominal, or EI in the case of arc welding, and the term heat input perunit length of weld often refers to the ratio Qnominal/V, or EI/V, where V is thewelding speed.
B. Measurements The heat source efficiency can be measured with acalorimeter. The heat transferred from the heat source to the workpiece is in
h = =QtEIt
QEI
weld
weld
h = =Qt
Q tQ
Qweld
nominal weld nominal
37
Welding Metallurgy, Second Edition. Sindo KouCopyright 2003 John Wiley & Sons, Inc.
ISBN: 0-471-43491-4

turn transferred from the workpiece to the calorimeter, which can be deter-mined as described below.
Kou et al. (1, 2) used simple tubular calorimeters to determine the arc efficiency in GTAW of aluminum, as shown in Figure 2.1a. The calorimeter can be a round cross section if the workpiece is a pipe or a rectangular cross section if the workpiece is a sheet. The temperature rise in the cool-ing water (Tout - Tin) can be measured using thermocouples or thermistors.Heat transfer from the workpiece to the calorimeter is as follows (1–3):
(2.3)
where W is the mass flow rate of water, C the specific heat of water, Tout theoutlet water temperature, Tin the inlet water temperature, and t time. The inte-gral corresponds to the shaded area in Figure 2.1b. The arc efficiency h can bedetermined from Equations (2.2) and (2.3).
Giedt et al. (4) used the Seebeck envelop calorimeter shown in Figure 2.2ato measure the arc efficiency in GTAW. The name Seebeck came from the Seebeck thermoelectric effect of a thermocouple, namely, a voltage is produced between two thermocouple junctions of different temperatures.The torch can be quickly withdrawn after welding, and the calorimeter lid can be closed to minimize heat losses to the surrounding air. As shown inFigure 2.2b, heat transfer from the workpiece to the calorimeter can be determined by measuring the temperature difference DT and hence gradient
Qt WC T T dt WC T T dtweld out in out in= -( ) ª -( )• •Ú Ú0 0
38 HEAT FLOW IN WELDING
GTAW torchPipe
Water outThermocoupleThermocouple
Water inInsulation
Arc
Time, seconds
Tem
pera
ture
, o C
Tem
pera
ture
, o F
(a)
(b)
100 120
120
100
80
20
30
40
50
Tout
Tin
Shaded area∞
= ∫ [ ]dtout- in 0 T T
Figure 2.1 Measurement of arc efficiency in GTAW: (a) calorimeter; (b) rise in coolingwater temperature as a function of time. Modified from Kou et al. (1, 2).

across a “gradient layer” of material of known thermal conductivity k andthickness L:
(2.4)Qt A kT
Ldtweld =
•Ú
D0
HEAT SOURCE 39
T
L
Cooling water flow
Gradient layer
Thermocouplejunctions for sensing
temperaturedifference
Direction ofheat flow
Tem
pera
ture
Distance
Temperatureprofile∆
Figure 2.2 Measurement of arc efficiency in GTAW: (a) calorimeter; (b) layer of tem-perature gradient. Reprinted from Giedt et al. (4). Courtesy of American WeldingSociety.
(a)
(b)

where A is the area for heat flow and DT/L the temperature gradient. The arcefficiency h can be determined from Equations (2.4) and (2.2). This type ofcalorimeter was later used to determine the arc efficiencies in PAW, GMAW,and SAW (5–8).
Figure 2.3 shows the results of arc efficiency measurements in GTAW andPAW (2, 5, 7, 9), and Figure 2.4 shows similar results in GMAW and SAW (7,10). These results were obtained using the two types of calorimeters describedabove except for the results of Lu and Kou for GMAW (10, 11), which aredescribed in what follows.
In GMAW the arc, metal droplets, and cathode heating all contribute to theefficiency of the heat source. It has been observed in GMAW of aluminumand steel with Ar shielding that current flow or electron emission occurs not
40 HEAT FLOW IN WELDING
1.0
0.8
0.6
0.4
0.2
0.0
Arc
Effi
cien
cy
10 20 300Travel Speed, mm/s
PAW:
GTAW:Fuerschbach et al. (1991)Dupont et al. (1995)Kou and Lu (1985)Fuerschbach et al. (1991)Dupont et al. (1995)
GTAW
Evans et al. (1998)
PAW
Figure 2.3 Arc efficiencies in GTAW and PAW.
175 275 375 425225 325
Arc
Effi
cien
cy
1.0
0.8
0.6
0.4
0.2
12575
GMAW:
SAW:
Lu and Kou (1989)
DuPont et al. (1995)
SAW
GMAW
Current, A
Lu and Kou (1989)
DuPont et al. (1995)
Figure 2.4 Arc efficiencies in GMAW and SAW.

uniformly over the workpiece surface but over localized areas on the work-piece surface called cathode spots (12, 13). The localized heating, calledcathode heating, causes the surface oxide to dissociate and leaves a clean metalsurface (12). Cathode heating is attributed to field-type emission of electrons.Unlike thermionic emission at the tungsten electrode in DC electrode-negative GTAW, field emission electrons do not cool the cathode (6).
Lu and Kou (10, 11) used a combination of three calorimeters to estimatethe amounts of heat transfer from the arc, filler metal droplets, and cathodeheating to the workpiece in GMAW of aluminum. Figure 2.5a shows the mea-surement of heat transfer from droplets (11). The arc is established betweena GMAW torch and a GTA torch and the droplets collect in the calorimeterbelow. From the water temperature rise and the masses and specific heats ofthe water and the copper basin, the heat transfer from droplets can be deter-
HEAT SOURCE 41
Filler wire
GTAW torchGMAWtorch
Droplets
Water
Radiation baffle
Thermistor
Insulation
Cubasin
Filler wireGMAW torch
WeldO-ring
Water inWater outDTDT
Workpiece
InsulationDT: differentialthermistor
(b)
Filler wireGMAW torch
WeldO-ring
Water inWater outDTDT
Workpiece
Insulation
(c)GTAW torch
(a)
Figure 2.5 Calorimeter for measuring heat inputs in GMAW: (a) metal droplets; (b)total heat input; (c) combined heat inputs from arc and metal droplets. Reprinted fromLu and Kou (10, 11). Courtesy of American Welding Society.
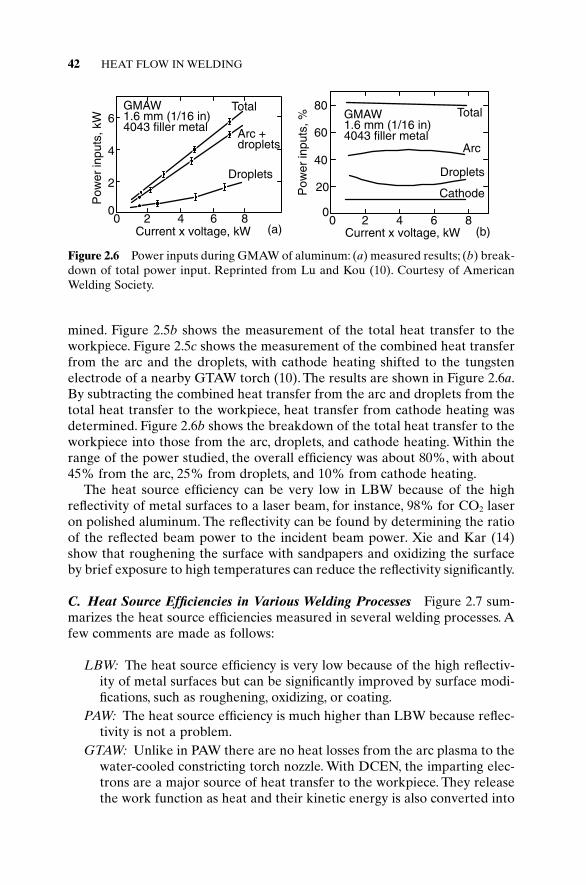
mined. Figure 2.5b shows the measurement of the total heat transfer to theworkpiece. Figure 2.5c shows the measurement of the combined heat transferfrom the arc and the droplets, with cathode heating shifted to the tungstenelectrode of a nearby GTAW torch (10). The results are shown in Figure 2.6a.By subtracting the combined heat transfer from the arc and droplets from thetotal heat transfer to the workpiece, heat transfer from cathode heating wasdetermined. Figure 2.6b shows the breakdown of the total heat transfer to theworkpiece into those from the arc, droplets, and cathode heating. Within therange of the power studied, the overall efficiency was about 80%, with about45% from the arc, 25% from droplets, and 10% from cathode heating.
The heat source efficiency can be very low in LBW because of the highreflectivity of metal surfaces to a laser beam, for instance, 98% for CO2 laseron polished aluminum. The reflectivity can be found by determining the ratioof the reflected beam power to the incident beam power. Xie and Kar (14)show that roughening the surface with sandpapers and oxidizing the surfaceby brief exposure to high temperatures can reduce the reflectivity significantly.
C. Heat Source Efficiencies in Various Welding Processes Figure 2.7 sum-marizes the heat source efficiencies measured in several welding processes. Afew comments are made as follows:
LBW: The heat source efficiency is very low because of the high reflectiv-ity of metal surfaces but can be significantly improved by surface modi-fications, such as roughening, oxidizing, or coating.
PAW: The heat source efficiency is much higher than LBW because reflec-tivity is not a problem.
GTAW: Unlike in PAW there are no heat losses from the arc plasma to thewater-cooled constricting torch nozzle. With DCEN, the imparting elec-trons are a major source of heat transfer to the workpiece. They releasethe work function as heat and their kinetic energy is also converted into
42 HEAT FLOW IN WELDING
GMAW1.6 mm (1/16 in)4043 filler metal
Total
Arc +droplets
Droplets
Current x voltage, kW0 2 4 6 8
0
Pow
er in
puts
, kW
2
4
6 GMAW1.6 mm (1/16 in)4043 filler metal
Total
Arc
Droplets
Cathode
Current x voltage, kW
Pow
er in
puts
, %
0 2 4 6 80
20
40
60
80
(a) (b)
Figure 2.6 Power inputs during GMAW of aluminum: (a) measured results; (b) break-down of total power input. Reprinted from Lu and Kou (10). Courtesy of AmericanWelding Society.

heat at the workpiece. In AC GTAW, however, electrons bombard theworkpiece only during the electrode-negative half cycle, and the arc effi-ciency is thus lower. In GTAW with DCEP, the arc efficiency is evenlower because the electrons bombard the electrode rather than the workpiece.
GMAW, SMAW: Unlike in GTAW, heat transfer to the electrode can betransferred back to the workpiece through metal droplets, thus improv-ing the arc efficiency.
SAW: Unlike in GMAW or SMAW, the arc is covered with a thermally insu-lating blanket of molten slag and granular flux, thus reducing heat lossesto the surroundings and improving the arc efficiency.
EBW: The keyhole in EBW acts like a “black body” trapping the energyfrom the electron beam. As a result, the efficiency of the electron beamis very high.
2.1.2 Melting Efficiency
The ability of the heat source to melt the base metal (as well as the filler metal)is of practical interest to the welder. Figure 2.8 shows the cross-sectional area
HEAT SOURCE 43
EBWSAWGMAWGTAWdc
enPAWLBW
Hea
t Sou
rce
Effi
cien
cy
1.0
0.8
0.6
0.4
0.2
0SMAW
surf
ace
mod
ifica
tions
Figure 2.7 Heat source efficiencies in several welding processes.
Afiller
Abase
Figure 2.8 Transverse cross section of weld showing areas representing contributionsfrom base metal and filler metal.

representing the portion of the weld metal contributed by the base metal, Abase,and that contributed by the filler metal, Afiller. One way to define the meltingefficiency of the welding arc, hm, is as follows:
(2.5)
where V is the welding speed, Hbase the energy required to raise a unit volumeof base metal to the melting point and melt it, and Hfiller the energy required toraise a unit volume of filler metal to the melting point and melt it. The quantityinside the parentheses represents the volume of material melted while thedenominator represents the heat transfer from the heat source to the workpiece.
Figures 2.9a and b show the transverse cross section of two steel welds dif-fering in the melting efficiency (7). Here, EI = 3825W and V = 10mm/s for theshallower weld of lower melting efficiency (Figure 2.9a) and EI = 10170W andV = 26mm/s for the deeper weld of higher melting efficiency (Figure 2.9b).Note that the ratio EI/V is equivalent in each case.
hhm
base weld base filler weld filler
weld=
( ) + ( )A Vt H A Vt HEIt
44 HEAT FLOW IN WELDING
PAWGTAWGMAWSAW
Mel
ting
effic
ienc
y
0 1000 2000 3000 4000 50000.0
0.1
0.2
0.3
0.4
0.5
0.6
0.7
(c)
−η = η αν
1750.50exp m EIV /(H )
ηEIV/(Hαν)
Figure 2.9 Melting efficiency: (a) lower at lower heat input and welding speed; (b)higher at higher heat input and welding speed; (c) variation with dimensionless para-meter hEIV/Ha�. Reprinted from DuPont and Marder (7). Courtesy of AmericanWelding Society.
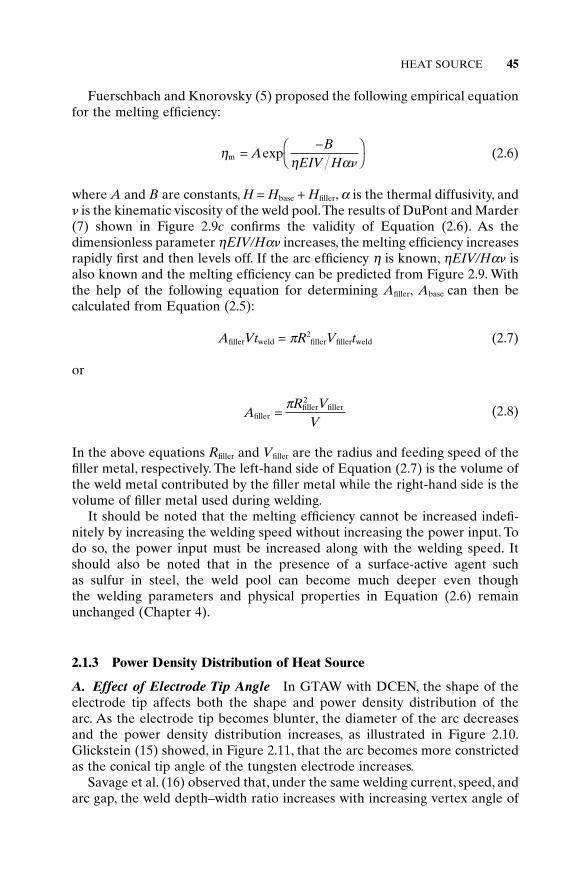
Fuerschbach and Knorovsky (5) proposed the following empirical equationfor the melting efficiency:
(2.6)
where A and B are constants, H = Hbase + Hfiller, a is the thermal diffusivity, and� is the kinematic viscosity of the weld pool.The results of DuPont and Marder(7) shown in Figure 2.9c confirms the validity of Equation (2.6). As the dimensionless parameter hEIV/Ha� increases, the melting efficiency increasesrapidly first and then levels off. If the arc efficiency h is known, hEIV/Ha� isalso known and the melting efficiency can be predicted from Figure 2.9. Withthe help of the following equation for determining Afiller, Abase can then be calculated from Equation (2.5):
AfillerVtweld = pR2fillerVfillertweld (2.7)
or
(2.8)
In the above equations Rfiller and Vfiller are the radius and feeding speed of thefiller metal, respectively. The left-hand side of Equation (2.7) is the volume ofthe weld metal contributed by the filler metal while the right-hand side is thevolume of filler metal used during welding.
It should be noted that the melting efficiency cannot be increased indefi-nitely by increasing the welding speed without increasing the power input. Todo so, the power input must be increased along with the welding speed. Itshould also be noted that in the presence of a surface-active agent such as sulfur in steel, the weld pool can become much deeper even though the welding parameters and physical properties in Equation (2.6) remainunchanged (Chapter 4).
2.1.3 Power Density Distribution of Heat Source
A. Effect of Electrode Tip Angle In GTAW with DCEN, the shape of theelectrode tip affects both the shape and power density distribution of the arc. As the electrode tip becomes blunter, the diameter of the arc decreasesand the power density distribution increases, as illustrated in Figure 2.10.Glickstein (15) showed, in Figure 2.11, that the arc becomes more constrictedas the conical tip angle of the tungsten electrode increases.
Savage et al. (16) observed that, under the same welding current, speed, andarc gap, the weld depth–width ratio increases with increasing vertex angle of
AR V
Vfillerfiller2
filler=p
hh am =
-ÊË
ˆ¯A
BEIV H
expn
HEAT SOURCE 45

46 HEAT FLOW IN WELDING
Tungstenelectrode
Arc
Powerdensity
Radialdistance
Powerdensity
Radialdistance
(a)
(b)
(c)
(d)
Figure 2.10 Effect of electrode tip angle on shape and power density distribution ofgas–tungsten arc.
Figure 2.11 Effect of electrode tip angle on shape of gas–tungsten arc. Reprinted fromGlickstein (15).

the conical tip of the tungsten electrode. Key (17) reported a similar effect ofthe tip angle, at least with Ar shielding, as shown in Figure 2.12.
B. Measurements Several investigators have measured the power densitydistribution (and current density distribution) in the gas tungsten arc by usingthe split-anode method (2, 18–20). Figure 2.13 shows the results of Tsai (20)and Lu and Kou (3). For simplicity, the Gaussian-type distribution is often usedas an approximation (21–23).
2.2 ANALYSIS OF HEAT FLOW IN WELDING
Figure 2.14 is a schematic showing the welding of a stationary workpiece (24).The origin of the coordinate system moves with the heat source at a constantspeed V in the negative-x direction. Except for the initial and final transients
ANALYSIS OF HEAT FLOW IN WELDING 47
30o
(0.125)60o
(0.125)90o
(0.500)180o
(0)
Electrode tip angle(truncation, mm)
Figure 2.12 Effect of electrode tip geometry on shape of gas–tungsten arc welds instainless steel (pure Ar, 150A, 2.0 s, spot-on-plate). Reprinted from Key (17). Courtesyof American Welding Society.
-0.1r2
0 2 4 6 80
20
40
60
q(r) = 30e
Pow
er D
ensi
ty, W
/mm
2
Radius, mm
Lu and Kou (1988)Tsai (1983)
electrode (+)100 A,14.2 V4.7 mm arc
100% Ar3.2 mm electrode
75 tip angle
q(r) = 32e-0.1r2
o
Figure 2.13 Measured power density distributions. Reprinted from Lu and Kou (3).Courtesy of American Welding Society.

of welding, heat flow in a workpiece of sufficient length is steady, or quasi-stationary, with respect to the moving heat source. In other words, for anobserver moving with the heat source, the temperature distribution and thepool geometry do not change with time. This steady-state assumption was firstused by Rosenthal (25) to simplify the mathematical treatment of heat flowduring welding.
2.2.1 Rosenthal’s Equations
Rosenthal (25) used the following simplifying assumptions to derive analyti-cal equations for heat flow during welding:
1. steady-state heat flow,2. point heat source,3. negligible heat of fusion,4. constant thermal properties,5. no heat losses from the workpiece surface, and6. no convection in the weld pool.
A. Rosenthal’s Two-Dimensional Equation Figure 2.15 is a schematicshowing the welding of thin sheets. Because of the small thickness of the work-piece, temperature variations in the thickness direction are assumed negligi-ble and heat flow is assumed two dimensional. Rosenthal (25) derived thefollowing equation for two-dimensional heat flow during the welding of thinsheets of infinite width:
48 HEAT FLOW IN WELDING
Figure 2.14 Coordinate system (x, y, z) moving with heat source. From Kou and Le(24).
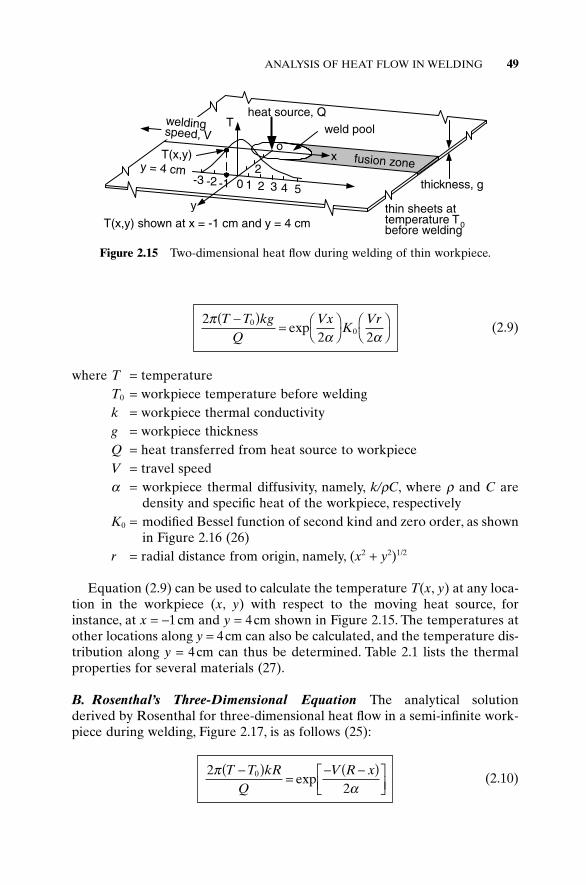
(2.9)
where T = temperatureT0 = workpiece temperature before weldingk = workpiece thermal conductivityg = workpiece thicknessQ = heat transferred from heat source to workpieceV = travel speeda = workpiece thermal diffusivity, namely, k/rC, where r and C are
density and specific heat of the workpiece, respectivelyK0 = modified Bessel function of second kind and zero order, as shown
in Figure 2.16 (26)r = radial distance from origin, namely, (x2 + y2)1/2
Equation (2.9) can be used to calculate the temperature T(x, y) at any loca-tion in the workpiece (x, y) with respect to the moving heat source, forinstance, at x = -1cm and y = 4cm shown in Figure 2.15. The temperatures atother locations along y = 4cm can also be calculated, and the temperature dis-tribution along y = 4cm can thus be determined. Table 2.1 lists the thermalproperties for several materials (27).
B. Rosenthal’s Three-Dimensional Equation The analytical solutionderived by Rosenthal for three-dimensional heat flow in a semi-infinite work-piece during welding, Figure 2.17, is as follows (25):
(2.10)2
20p
aT T kR
QV R x-( )
=- -( )È
Î͢˚̇
exp
22 2
00
pa a
T T kgQ
VxK
Vr-( )= Ê
ˈ¯
ÊË
ˆ¯exp
ANALYSIS OF HEAT FLOW IN WELDING 49
thickness, g
thin sheets attemperature T0before welding
heat source, Qweld pool
fusion zone
T(x,y) shown at x = -1 cm and y = 4 cm
y = 4 cmT(x,y)
T
2
o
1 2 3 4 50-3 -1-2
y
x
weldingspeed, V
Figure 2.15 Two-dimensional heat flow during welding of thin workpiece.

where R is the radial distance from the origin, namely, (x2 + y2 + z2)1/2. For agiven material and a given welding condition, an isotherm T on a plane at agiven x has a radius of R. In other words, Equation (2.10) implies that on thetransverse cross section of the weld all isotherms, including the fusion bound-ary and the outer boundary of the heat-affected zone, are semicircular inshape. Equation (2.10) can be used to calculate the steady-state temperatureT(x, y, z), with respect to the moving heat source, at any location in the work-piece (x, y, z), for instance, at x = 1cm, y = 4cm, and z = 0cm, as shown inFigure 2.17. The temperatures at other locations along y = 4cm can also be
50 HEAT FLOW IN WELDING
2.8
2.4
2.0
1.6
1.2
0.8
0.4
00 1 2 3 4
Modified Bessel functionof second kind
zero order
K0 [
Vr/
(2 )]
Vr/(2 )α
α
Figure 2.16 Modified Bessel function of second kind and zero order (26).
TABLE 2.1 Thermal Properties for Several Materials
Volume Thermal Thermal Thermal Melting
Diffusivity, Capacity, Conductivity, PointMaterial a (m2/s) rCs (J/m3 K) k (J/msK) (K)
Aluminum 8.5 ¥ 10-5 2.7 ¥ 106 229.0 933Carbon steel 9.1 ¥ 10-6 4.5 ¥ 106 41.0 18009% Ni steel 1.1 ¥ 10-5 3.2 ¥ 106 35.2 1673Austenitic 5.3 ¥ 10-6 4.7 ¥ 106 24.9 1773
stainless steelInconel 600 4.7 ¥ 10-6 3.9 ¥ 106 18.3 1673Ti alloy 9.0 ¥ 10-6 3.0 ¥ 106 27.0 1923Copper 9.6 ¥ 10-5 4.0 ¥ 106 384.0 1336Monel 400 8.0 ¥ 10-6 4.4 ¥ 106 35.2 1573
Source: Gray et al. (27).
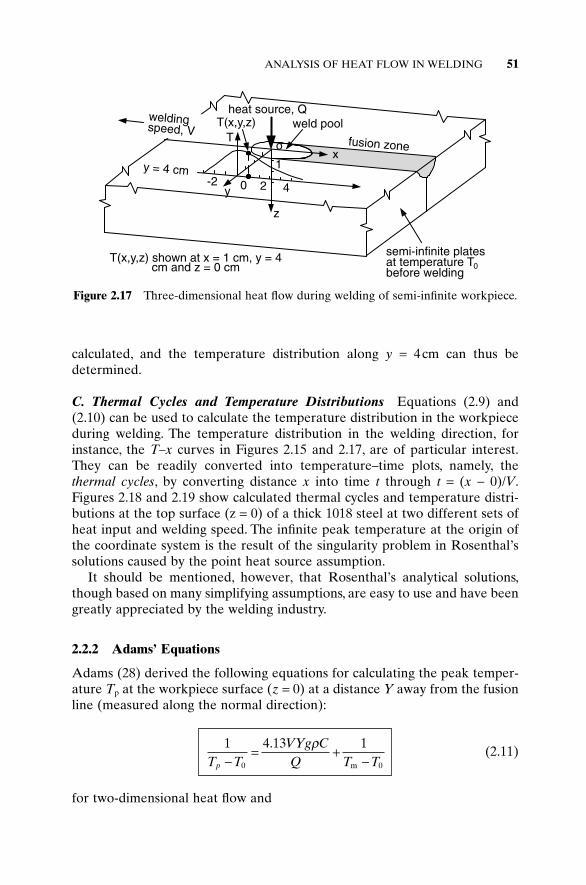
calculated, and the temperature distribution along y = 4cm can thus be determined.
C. Thermal Cycles and Temperature Distributions Equations (2.9) and(2.10) can be used to calculate the temperature distribution in the workpieceduring welding. The temperature distribution in the welding direction, forinstance, the T–x curves in Figures 2.15 and 2.17, are of particular interest.They can be readily converted into temperature–time plots, namely, thethermal cycles, by converting distance x into time t through t = (x - 0)/V.Figures 2.18 and 2.19 show calculated thermal cycles and temperature distri-butions at the top surface (z = 0) of a thick 1018 steel at two different sets ofheat input and welding speed. The infinite peak temperature at the origin ofthe coordinate system is the result of the singularity problem in Rosenthal’ssolutions caused by the point heat source assumption.
It should be mentioned, however, that Rosenthal’s analytical solutions,though based on many simplifying assumptions, are easy to use and have beengreatly appreciated by the welding industry.
2.2.2 Adams’ Equations
Adams (28) derived the following equations for calculating the peak temper-ature Tp at the workpiece surface (z = 0) at a distance Y away from the fusionline (measured along the normal direction):
(2.11)
for two-dimensional heat flow and
1 4 13 1
0 0T TVYg CQ T Tp -
= +-
. rm
ANALYSIS OF HEAT FLOW IN WELDING 51
semi-infinite platesat temperature T0before welding
heat source, Qweld pool
fusion zone
weldingspeed, V
T(x,y,z)
y = 4 cm
To
1
420
z
-2
T(x,y,z) shown at x = 1 cm, y = 4cm and z = 0 cm
y
x
Figure 2.17 Three-dimensional heat flow during welding of semi-infinite workpiece.

(2.12)
for three-dimensional heat flow.Several other analytical solutions have also been derived for two-
dimensional (29–34) and three-dimensional (31, 35–37) welding heat flow.Because of the many simplifying assumptions used, analytical solutions havehad limited success.
2.2.3 Computer Simulation
Many computer models have been developed to study two-dimensional heatflow (e.g., refs. 38–43) and three-dimensional heat flow (e.g., refs. 44–55) duringwelding. Most assumptions of Rosenthal’s analytical solutions are no longerrequired. Figure 2.20 shows the calculated results of Kou and Le (24) for theGTAW of 3.2-mm-thick sheets of 6061 aluminum alloy. The agreement withobserved fusion boundaries and thermal cycles appears good.
1 5 442
21
0
2
0T Tk
QVVY
T Tp -= + Ê
ˈ¯
È
ÎÍ
˘
˚˙ +
-. p a
a m
52 HEAT FLOW IN WELDING
Figure 2.18 Calculated results from Rosenthal’s three-dimensional heat flow equa-tion: (a) thermal cycles; (b) isotherms. Welding speed: 2.4mm/s; heat input: 3200W;material: 1018 steel.

2.3 EFFECT OF WELDING PARAMETERS
2.3.1 Pool Shape
As the heat input Q and welding speed V both increase, the weld pool becomesmore elongated, shifting from elliptical to teardrop shaped. Figure 2.21 showsthe weld pools traced from photos taken during autogenous GTAW of 304stainless steel sheets 1.6mm thick (56). Since the pools were photographedfrom the side at an inclined angle (rather than vertically), the scale bar appliesonly to lengths in the welding direction. In each pool the cross indicates theposition of the electrode tip relative to the pool.The higher the welding speed,the greater the length–width ratio becomes and the more the geometric centerof the pool lags behind the electrode tip.
Kou and Le (57) quenched the weld pool during autogenous GTAW of 1.6-mm 309 stainless steel sheets and observed the sharp pool end shown in Figure2.22. The welding current was 85A, voltage 10V, and speed 4.2mm/s [10in./min(ipm)]. The sharp end characteristic of a teardrop-shaped weld pool is evident.
The effect of the welding parameters on the pool shape is more significantin stainless steel sheets than in aluminum sheets.The much lower thermal con-
EFFECT OF WELDING PARAMETERS 53
Figure 2.19 Calculated results similar to those in Figure 2.18 but with welding speedof 6.2mm/s and heat input of 5000W.

54 HEAT FLOW IN WELDING
Figure 2.20 Computer simulation of GTAW of 3.2-mm-thick 6061 aluminum, 110A,10V, and 4.23mm/s: (a) fusion boundaries and isotherms; (b) thermal cycles. From Kouand Le (24).
2mm 35A, 7.4V0.42 mm/s
70A, 8.4V2.5 mm/s
100A, 9.0V4.2 mm/s
304 stainless steel sheets
Figure 2.21 Weld pool shapes in GTAW of 304 stainless steel sheets. Courtesy ofSmolik (56).

ductivity of stainless steels makes it more difficult for the weld pool to dissi-pate heat and solidify.
2.3.2 Cooling Rate and Temperature Gradient
The ratio EI/V represents the amount of heat input per unit length of weld.Lee et al. (58) measured the cooling rate in GTAW of 2024 aluminum by stick-ing a thermocouple into the weld pool. Figure 2.23 shows that increasing EI/V
EFFECT OF WELDING PARAMETERS 55
Figure 2.22 Sharp pool end in GTAW of 309 stainless steel preserved by ice quench-ing during welding. From Kou and Le (57).
800
(a)
(b)
(e)(d)
(c)
(f)
(a) V:10 cm/min; EI/V:15.4 kJ/cm(b) V:15 cm/min; EI/V:9.79 kJ/cm(c) V:20 cm/min; EI/V:7.34 kJ/cm(d) V:30 cm/min; EI/V:4.76 kJ/cm(e) V:40 cm/min; EI/V:3.57 kJ/cm(f) V:60 cm/min; EI/V:2.38 kJ/cm
0 0.4 0.8 1.2 1.6 2 2.4 2.8 3.2 3.6 4100200300400500600700
900100011001200
Time (sec)
Tem
pera
ture
(o C
)
Figure 2.23 Variation in cooling rates with heat input per unit length of weld (EI/V).Reprinted from Lee et al. (58).

decreases the cooling rate (the slope). Kihara et al. (59) showed that thecooling rate decreases with increasing EI/V and preheating. Figure 2.24 showsthat the cooling rate in ESW, which is known to have a very high Q/V, is muchsmaller than that in arc welding (60). The effects of the heat input, weldingspeed, and preheat on the cooling rate and temperature gradient can be illus-trated by considering the following example.
Example: Bead-on-plate welding of a thick steel plate is carried out usingGTAW at 200A, 10V, and 2mm/s. Based on Rosenthal’s three-dimensionalequation, calculate the 500°C cooling rates along the x axis of the workpiecefor zero and 250°C preheating. The arc efficiency is 70% and the thermal con-ductivity is 35W/m°C.
Along the x axis of the workpiece,
y = z = 0 and R = x (2.13)
Therefore, Equation (2.10) becomes
(2.14)
Therefore, the temperature gradient is
(2.15)
From the above equation and
(2.16)∂∂xt
VT
ÊË
ˆ¯ =
∂∂ p
pTx
Qx x
kT T
Qt
ÊË
ˆ¯ =
-= -
-( )2
12
2
02
T TQkx
- =0 2p
56 HEAT FLOW IN WELDING
Electroslagweld
Arc weld
0 2 4 6 8 10 12 14-18260540815
1095137016501925
05001000
15002000250030003500
Time, min
Tem
pera
ture
, o C
Tem
pera
ture
, o F
Figure 2.24 Thermal cycles of electroslag and arc welds. Reprinted from Liu et al.(60).
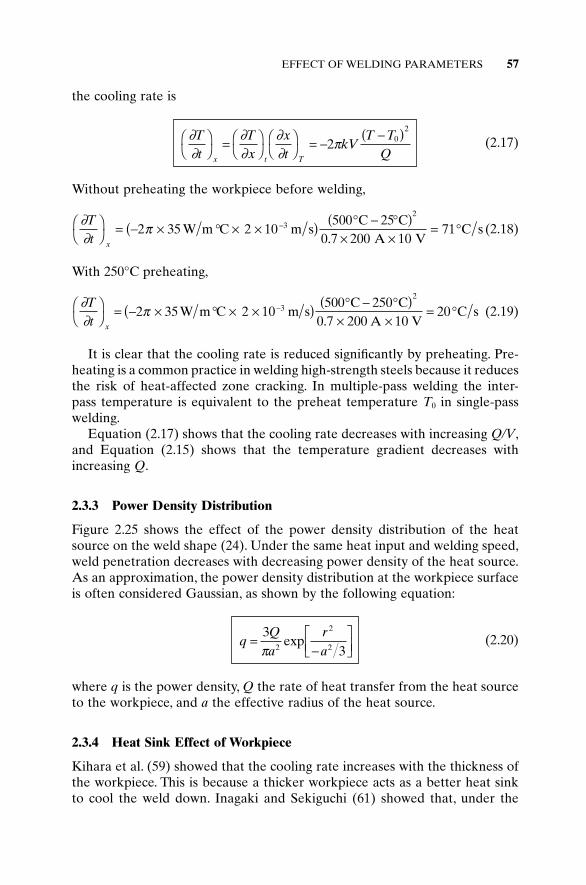
the cooling rate is
(2.17)
Without preheating the workpiece before welding,
(2.18)
With 250°C preheating,
(2.19)
It is clear that the cooling rate is reduced significantly by preheating. Pre-heating is a common practice in welding high-strength steels because it reducesthe risk of heat-affected zone cracking. In multiple-pass welding the inter-pass temperature is equivalent to the preheat temperature T0 in single-passwelding.
Equation (2.17) shows that the cooling rate decreases with increasing Q/V,and Equation (2.15) shows that the temperature gradient decreases withincreasing Q.
2.3.3 Power Density Distribution
Figure 2.25 shows the effect of the power density distribution of the heatsource on the weld shape (24). Under the same heat input and welding speed,weld penetration decreases with decreasing power density of the heat source.As an approximation, the power density distribution at the workpiece surfaceis often considered Gaussian, as shown by the following equation:
(2.20)
where q is the power density, Q the rate of heat transfer from the heat sourceto the workpiece, and a the effective radius of the heat source.
2.3.4 Heat Sink Effect of Workpiece
Kihara et al. (59) showed that the cooling rate increases with the thickness ofthe workpiece. This is because a thicker workpiece acts as a better heat sinkto cool the weld down. Inagaki and Sekiguchi (61) showed that, under the
qQa
ra
=-
ÈÎÍ
˘˚̇
332
2
2pexp
∂∂
pTt x
ÊË
ˆ¯ = - ¥ ∞ ¥ ¥( ) ∞ - ∞( )
¥ ¥= ∞-2 35 2 10
500 2500 7 200 10
203
2
W m C m sC C
A VC s
.
∂∂
pTt x
ÊË
ˆ¯ = - ¥ ∞ ¥ ¥( ) ∞ - ∞( )
¥ ¥= ∞-2 35 2 10
500 250 7 200 10
713
2
W m C m sC C
A VC s
.
∂∂
∂∂
∂∂
pTt
Tx
xt
kVT T
Qx t T
ÊË
ˆ¯ = Ê
ˈ¯
ÊË
ˆ¯ = -
-( )2 0
2
EFFECT OF WELDING PARAMETERS 57

same heat input and plate thickness, the cooling time is shorter for filletwelding (a T-joint between two plates) than for bead-on-plate welding becauseof the greater heat sink effect in the former.
2.4 WELD THERMAL SIMULATOR
2.4.1 The Equipment
The thermal cycles experienced by the workpiece during welding can be dupli-cated in small specimens convenient for mechanical testing by using a weldthermal simulator called Gleeble, a registered trademark of Dynamic Systems.
58 HEAT FLOW IN WELDING
Figure 2.25 Effect of power density distribution on weld shape in GTAW of 3.2-mm6061 aluminum with 880W and 4.23mm/s. From Kou and Le (24).

These simulators evolved from an original device developed by Nippes andSavage in 1949 (62). Figure 2.26 shows a specimen being resistance heated bythe electric current passing through the specimen and the water-cooled jawsholding it (63). A thermocouple spot welded to the middle of the specimen isconnected to a feedback control system that controls the amount of electriccurrent passing through the specimen such that a specific thermal cycle can beduplicated.
2.4.2 Applications
There are many applications for weld thermal simulators. For instance, a weld thermal simulator can be used in conjunction with a high-speed dilatometer to help construct continuous-cooling transformation diagramsuseful for studying phase transformations in welding and heat treating ofsteels.
By performing high-speed tensile testing during weld thermal simulation,the elevated-temperature ductility and strength of metals can be evaluated.This is often called the hot-ductility test. Nippes and Savage (64, 65), forinstance, used this test to investigate the heat-affected zone fissuring inaustenitic stainless steels.
Charpy impact test specimens can also be prepared from specimens (1 ¥1cm in cross section) subjected to various thermal cycles. This synthetic-specimen or simulated-microstructure technique has been employed bynumerous investigators to study the heat-affected-zone toughness.
WELD THERMAL SIMULATOR 59
Figure 2.26 A weld simulator specimen held between two water-cooled jaws andresistance heated by electric current passing through it. Courtesy of Dynamic SystemsInc. (63).

2.4.3 Limitations
Weld thermal simulators, though very useful, have some limitations and draw-backs. First, extremely high cooling rates during electron and laser beamwelding cannot be reproduced, due to the limited cooling capacity of the sim-ulators. Second, because of the surface heat losses, the temperature at thesurface can be lower than that at the centerline of the specimen, especially ifthe peak temperature is high and the thermal conductivity of the specimen islow (66). Third, the temperature gradient is much lower in the specimen than in the weld heat-affected zone, for instance, 10°C/mm, as opposed to300°C/mm near the fusion line of a stainless steel weld. This large differencein the temperature gradient tends to make the specimen microstructure differfrom the heat-affected-zone microstructure. For example, the grain size tendsto be significantly larger in the specimen than in the heat-affected zone, espe-cially at high peak temperatures such as 1100°C and above.
REFERENCES
1. Kou, S., and Le, Y., Metall. Trans. A, 15A: 1165, 1984.2. Kou, S., and Lu, M. J., in Welding Metallurgy, 1st ed., S. Kou, 1987, Wiley, New York,
p. 32; Lu, M. J., Ph.D. Thesis, Department of Materials Science and Engineering,University of Wisconsin, Madison, WI, 1988.
3. Lu, M., and Kou, S., Weld. J., 67: 29s, 1988.4. Giedt, W. H., Tallerico, L. N., and Fuerschbach, P. W., Weld. J., 68: 28s, 1989.5. Fuerschbach, P. W., and Knorovsky, G. A., Weld. J., 70: 287s, 1991.6. Fuerschbach, P. W., Weld. J., 77: 76s, 1998.7. Dupont, J. N., and Marder, A. R., Weld. J., 74: 406s, 1995.8. Dupont, J. N., and Marder, A. R., Metall. Mater. Trans., 27B: 481s, 1996.9. Evans, D. M., Huang, D., McClure, J. C., and Nunes, A. C., Weld. J., 77: 53s, 1998.
10. Lu, M., and Kou, S., Weld. J., 68: 452s, 1989.11. Lu, M., and Kou, S., Weld. J., 68: 382s, 1989.12. Essers, W. G., and Van Gompel, M. R. M., Weld. J., 63: 26s, 1984.13. Hasegawa, M., and Goto, H., IIW Document 212-212-71, International Welding
Institute, London, 1971.14. Xie, J., and Kar, A., Weld. J., 78: 343s, 1999.15. Glickstein, S. S., Weld. J., 55: 222s, 1976.16. Savage, W. F., Strunk, S. S., and Ishikawa, Y., Weld. J., 44: 489s, 1965.17. Key, J. F., Weld. J., 59: 365s, 1980.18. Nestor, O. H., J. Appl. Phys., 33: 1638, 1962.19. Schoeck, P. A., in Modern Developments in Heat Transfer, Warren Ibele, Academic,
New York, 1963, p. 353.20. Tsai, N., Ph.D. Thesis, Department of Materials Science and Engineering, MIT,
Cambridge, MA, 1983.
60 HEAT FLOW IN WELDING

21. Kou, S., and Sun, D. K., Metall. Trans. A, 16A: 203, 1985.22. Oreper, G., Eagar, T. W., and Szekely, J., Weld. J., 62: 307s, 1983.23. Pavelic, V., Tan Bakuchi, L. R., Uyechara, O. A., and Myers, P. S., Weld. J., 48: 295s,
1969.24. Kou, S., and Le, Y., Metall. Trans. A, 14A: 2245, 1983.25. Rosenthal, D., Weld. J., 20: 220s, 1941.26. Abramowitz, M., and Stegun, I.A., Eds., Handbook of Mathematical Functions,
National Bureau of Standards, Washington, DC, 1964.27. Gray, T. F. G., Spence, J., and North, T. H., Rational Welding Design, Newnes-
Butterworth, London, 1975.28. Adams, C. M., Jr., Weld. J., 37: 210s, 1958.29. Grosh, R. J., Trabant, E. A., and Hawskins, G. A., Q. Appl. Math., 13: 161, 1955.30. Swift-Hook, D. T., and Gick, A. E. F., Weld. J., 52: 492s, 1973.31. Jhaveri, P., Moffatt, W. G., and Adams C. M., Jr., Weld. J., 41: 12s, 1962.32. Myers, P. S., Uyehara, O. A., and Borman, G. L., Weld. Res. Council Bull., 123: 1967.33. Ghent, H. W., Hermance, C. E., Kerr, H. W., and Strong, A. B., in Proceedings of the
Conference on Arc Physics and Weld Pool Behavior, Welding Institute, ArbingtonHall, Cambridge, 1979, p. 389.
34. Trivedi, R., and Shrinivason, S. R., J. Heat Transfer, 96: 427, 1974.35. Grosh, R. J., and Trabant, E. A., Weld. J., 35: 396s, 1956.36. Malmuth, N. D., Hall, W. F., Davis, B. I., and Rosen, C. D., Weld. J., 53: 388s, 1974.37. Malmuth, N. D., Int. J. Heat Mass Trans., 19: 349, 1976.38. Kou, S., Kanevsky, T., and Fyfitch, S., Weld. J., 62: 175s, 1982.39. Pavelic, V., and Tsao, K. C., in Proceedings of the Conference on Arc Physics and
Weld Pool Behavior, Vol. 1, Welding Institute, Arbington Hall, Cambridge, 1980,p. 251.
40. Kou, S., and Kanevsky, T., in Proceedings of the Conference on New Trends ofWelding Research in the United States, Ed. S. David, ASM International, MaterialsPark, OH, 1982, p. 77.
41. Friedman, E., Trans. ASME; J. Pressure Vessel Techn., Series J, No. 3, 97: 206, 1965.42. Grill, A., Metall. Trans. B, 12B: 187, 1981.43. Grill, A., Metall. Trans. B, 12B: 667, 1981.44. Ushio, M., Ishmimura, T., Matsuda, F., and Arata, Y., Trans. Japan Weld. Res. Inst.,
6: 1, 1977.45. Kou, S., in Proceedings of the Conference on Modeling of Casting and Welding
Processes, Metall. Society of AIME, Warrendale, PA, 1980.46. Friedman, E., and Glickstein, S. S., Weld. J., 55: 408s, 1976.47. Friedman, E., in Numerical Modeling of Manufacturing Processes, Ed. R. F. Jones,
Jr., American Society of Mechanical Engineers, New York, 1977, p. 35.48. Lewis, R. W., Morgan, K., and Gallagher, R. H., in Numerical Modeling of Manu-
facturing Processes, Ed. R. F. Jones, Jr., American Society of Mechanical Engineers,New York, 1977, p. 67.
49. Hsu, M. B., in Numerical Modeling of Manufacturing Processes, Ed. R. F. Jones, Jr.,American Society of Mechanical Engineers, New York, 1977, p. 97.
REFERENCES 61

50. Glickstein, S. S., and Friedman, E., Weld. J., 60: 110s, 1981.51. Krutz, G. W., and Segerlind, L. J., Weld. J., 57: 211s, 1978.52. Paley, Z., and Hibbert, P. D., Weld. J., 54: 385s, 1975.53. Hibbitt, H. D., and Marcal, P. V., Comput. Struct., 3: 1145, 1973.54. Mazumder, J., and Steen, W. M., J. Appl. Phys., 51: 941, 1980.55. Tsai, N. S., and Eagar, T. W., Weld. J., 62: 82s, 1983.56. Smolik, G., private communication, Idaho National Engineering Laboratories,
Idaho Falls, Idaho, 1984.57. Kou, S., and Le, Y., Metall. Trans. A, 13A: 1141, 1982.58. Lee, J. Y., Park, J. M., Lee, C. H., and Yoon, E. P., in Synthesis/Processing of Light-
weight Metallic Materials II, Eds. C. M. Ward-Close, F. H. Froes, S. S. Cho, and D. J.Chellman, The Minerals, Metals and Materials Society, Warrendale, PA, 1996, p. 49.
59. Kihara, H., Suzuki, H., and Tamura, H., Researches on Weldable High-StrengthSteels, 60th Anniversary Series, Vol. 1, Society of Naval Architects of Japan, Tokyo,1957.
60. Liu, S., Brandi, S. D., and Thomas, R. D., in ASM Handbook, Vol. 6, ASM Interna-tional, Materials Park, OH, 1993, p. 270.
61. Inagaki, M., and Sekiguchi, H., Trans. Nat. Res. Inst. Metals, Tokyo, Japan, 2(2): 102(1960).
62. Nippes, E. F., and Savage, W. F., Weld. J., 28: 534s, 1949.63. HAZ 1000, Duffers Scientific, Troy, NY, now Dynamic System, Inc.64. Nippes, E. F., Savage, W. F., Bastian, B. J., Mason, H. F., and Curran, R. M., Weld. J.,
34: 183s, 1955.65. Nippes, E. F., Savage, W. F., and Grotke, G. E., Weld. Res. Council Bull., 33: Febru-
ary 1957.66. Widgery, D. J., in Weld Thermal Simulators for Research and Problem Solving,
Welding Institute, Cambridge, 1972, p. 14.
FURTHER READING
1. Rykalin, N. N., Calculation of Heat Flow in Welding, Trans. Z. Paley and C. M.Adams,Jr., Document 212-350-74, 1974, International Institute of Welding, London.
2. Rosenthal, D., Weld. J., 20: 220s (1941).3. Meyers, P. S., Uyehara, O. A., and Borman, G. L., Weld. Res. Council Bull. 123:
1967.4. Kou, S., Transport Phenomena and Materials Processing, Wiley, New York, 1996.
PROBLEMS
2.1 In one welding experiment, 50-mm-thick steel plates were joined usingelectroslag welding. The current and voltage were 480A and 34V, res-pectively. The heat losses to the water-cooled copper shoes and by
62 HEAT FLOW IN WELDING

radiation from the surface of the slag pool were 1275 and 375cal/s,respectively. Calculate the heat source efficiency.
2.2 It has been reported that the heat source efficiency in electroslagwelding increases with increasing thickness of the workpiece. Explainwhy.
2.3 (a) Consider the welding of 25.4-mm-thick steel plates. Do you preferto apply Rosenthal’s two- or three-dimensional heat flow equationfor full-penetration electron beam welds? What about bead-on-plate gas–tungsten arc welds?
(b) Suppose you are interested in studying the solidification structureof the weld metal and you wish to calculate the temperature distri-bution in the weld pool. Do you expect Rosenthal’s equations toprovide reliable thermal information in the pool? Why or why not?
(c) In multipass welding do you expect a higher or lower cooling ratein the first pass than in the subsequent passes? Why?
2.4 Large aluminum sheets 1.6mm thick are butt welded using GTAW withalternating current. The current, voltage, and welding speed are 100A,10V, and 2mm/s, respectively. Calculate the peak temperatures at distance of 1.0 and 2.0mm from the fusion boundary. Assume 50% arcefficiency.
2.5 Bead-on-plate welding of a thick-section carbon steel is carried outusing 200A, 20V, and 2mm/s. The preheat temperature and arc effi-ciency are 100°C and 60%, respectively. Calculate the cross-sectionalarea of the weld bead.
2.6 (a) Do you expect to have difficulty in achieving steady-state heat flowduring girth (or circumferential) welding of tubes by keeping constantheat input and welding speed? Explain why. What is the consequenceof the difficulty? (b) Suggest two methods that help achieve steady-stateheat flow during girth welding.
2.7 A cold-rolled AISI 1010 low-carbon steel sheet 0.6mm thick was testedfor surface reflectivity in CO2 laser beam welding under the followingdifferent surface conditions: (a) as received; (b) oxidized in air furnaceat 1000°C for 20s; (c) oxidized in air furnace at 1000°C for 40s; (d)covered with steel powder. In which order does the reflectivity rank inthese surface conditions and why?
2.8 It was observed in YAG laser beam welding of AISI 409 stainless steelthat under the same power the beam size affected the depth–width ratioof the resultant welds significantly. Describe and explain the effect.
2.9 Calculate the thermal cycle at the top surface of a very thick carbonsteel plate at 5mm away from the centerline of the weld surface. The
PROBLEMS 63

power of the arc is 2kW, the arc efficiency 0.7, the travel speed 2mm/s,and the preheat temperature 100°C.
2.10 Is the transverse cross section of the weld pool at a fixed value of xperfectly round according to Rosenthal’s three-dimensional heat flowequation? Explain why or why not based on the equation. What doesyour answer tell you about the shape of the transverse cross section ofa weld based on Rosenthal’s three-dimensional equation?
64 HEAT FLOW IN WELDING

3 Chemical Reactions in Welding
Basic chemical reaction during fusion welding will be described in this chapter,including gas–metal reactions and slag–metal reactions. The effect of thesechemical reactions on the weld metal composition and mechanical propertieswill be discussed.
3.1 OVERVIEW
3.1.1 Effect of Nitrogen, Oxygen, and Hydrogen
Nitrogen, oxygen, and hydrogen gases can dissolve in the weld metal duringwelding. These elements usually come from air, the consumables such as theshielding gas and flux, or the workpiece such as the moist or dirt on its surface.Nitrogen, oxygen, and hydrogen can affect the soundness of the resultant weldsignificantly. Some examples of the effect of these gases are summarized inTable 3.1.
3.1.2 Techniques for Protection from Air
As described in Chapter 1, various techniques can be used to protect the weldpool during fusion welding. These techniques are summarized in Table 3.2.Figure 3.1 shows the weld oxygen and nitrogen levels expected from severaldifferent arc welding processes (1, 2). As will be explained below, techniquesprovide different degrees of weld metal protection.
A. GTAW and GMAW Gas–tungsten arc welding is the cleanest arc weldingprocess because of the use of inert shielding gases (Ar or He) and a short,stable arc. Gas shielding through the torch is sufficient for welding most mate-rials. However, as shown in Figure 3.2, additional gas shielding to protect thesolidified but still hot weld is often provided both behind the torch and underthe weld of highly reactive metals such as titanium (3, 4). Welding can also beconducted inside a special gas-filled box. Although also very clean, GMAW isnot as clean as GTAW due to the less stable arc associated with the use of con-sumable electrodes. Furthermore, the greater arc length in GMAW reducesthe protective effects of the shielding gas. Carbon dioxide is sometimesemployed as shielding gas in GMAW. Under the high temperature of the arc,
65
Welding Metallurgy, Second Edition. Sindo KouCopyright 2003 John Wiley & Sons, Inc.
ISBN: 0-471-43491-4

decomposition into CO and O is favored, potentially increasing the weldoxygen level.
B. SMAW The flow of gas in SMAW is not as well directed toward the weldpool as the flow of inert gas in GTAW or GMAW. Consequently, the protec-tion afforded the weld metal is less effective, resulting in higher weld oxygenand nitrogen levels. Carbon dioxide, produced by the decomposition of car-bonate or cellulose in the electrode covering, can potentially increase the weldoxygen level.
C. Self-Shielded Arc Welding Self-shielded arc welding uses strong nitrideformers such as Al, Ti, and Zr in the electrode wire alone to protect againstnitrogen. Since these nitride formers are also strong deoxidizers, the weld
66 CHEMICAL REACTIONS IN WELDING
TABLE 3.1 Effect of Nitrogen, Oxygen, and Hydrogen on Weld Soundness
Nitrogen Oxygen Hydrogen
Steels Increases strength but Reduces toughness Induces hydrogenreduces toughness but improves it if cracking
acicular ferrite ispromoted
Austenitic or Reduces ferrite andduplex promotes solidificationstainless steels cracking
Aluminum Forms oxide films Forms gas porositythat can be trapped and reduces bothas inclusions strength and
ductility
Titanium Increases strength but Increases strength reduces ductility but reduces ductility
TABLE 3.2 Protection Techniques in CommonWelding Processes
Protection Technique Fusion Welding Process
Gas Gas tungsten arc, gas metal arc, plasma arc
Slag Submerged arc, electroslagGas and slag Shielded metal arc, flux-
cored arcVacuum Electron beamSelf-protection Self-shielded arc

oxygen levels are slightly lower than in SMAW. Unfortunately, as can be seenin Figure 3.1, the weld nitrogen content is still rather high.
D. SAW The weld oxygen level in submerged arc welds can vary signifi-cantly, depending on the composition of the flux; the very high oxygen levelsassociated with acidic fluxes containing large percentages of SiO2, accordingto Eagar (2), are the result of SiO2 decomposition. This is consistent with thelarge increase in the weld metal silicon content when acidic fluxes are used(2). If atmospheric contamination were the reason for the weld metal oxygencontent, the nitrogen content would also have been high.
OVERVIEW 67
Figure 3.1 Oxygen and nitrogen levels expected from several arc welding processes.From Rein (1); reproduced from Eagar (2).
Backingshield(Argon)
Trailingshield(Argon)
Work
Torch(HP Argon)(Air-Argon)
(CO2-Argon)
Figure 3.2 Gas–tungsten arc welding of titanium with additional gas shielding.Reprinted from Harwig et al. (3). Courtesy of American Welding Society.

3.2 GAS–METAL REACTIONS
The gas–metal reactions here refer to chemical reactions that take place at theinterface between the gas phase and the liquid metal. They include the disso-lution of nitrogen, oxygen, and hydrogen in liquid metal and the evolution ofcarbon monoxide.
3.2.1 Thermodynamics of Reactions
In steelmaking, exposure of molten steel to molecular nitrogen, N2, can resultin dissolution of nitrogen atoms in the molten steel, that is,
(3.1)
where the underlining bar denotes dissolution in molten metal. From ther-modynamics (5), the equilibrium concentration of dissolved nitrogen, [N], atany given temperature T can be determined from the following relationship:
(3.2)
where KdN is the equilibrium constant for reaction (3.1) based on dissolution
from a diatomic gas N2, pN2the partial pressure (in atmospheres) of N2 above
the molten metal, DG° the standard free energy of formation (in calories per mole), and R the gas constant 1.987cal/(Kmol). Table 3.3 shows the valuesof DG° for several chemical reactions involving nitrogen, oxygen, and hydro-gen (6–9). From Equation (3.2), the well-known Sievert law (10) for the dis-solution of a diatomic gas in molten metal can be written as
ln lnKN
p
GRT
dN
N
=[ ]Ê
ˈ¯ =
- ∞
2
D
12 2N g N( ) =
68 CHEMICAL REACTIONS IN WELDING
TABLE 3.3 Free Energy of Reactions Involving Nitrogen, Oxygen, and Hydrogen
Free Energy of Reaction,Gas Reaction DG° (cal/mol) Reference
Nitrogen 1/2N2(g) = N(g) 86596.0 - 15.659T (K) 6N(g) = N(wt% in steel) -85736.0 + 21.405T1/2N2(g) = N(wt% in steel) 860.0 + 5.71T 7
Oxygen 1/2O2(g) = O(g) 60064 - 15.735T 6O(g) = O(wt% in steel) -88064 + 15.045 T1/2O2(g) = O(wt% in steel) -28000 - 0.69T 8
Hydrogen 1/2H2(g) = H(g) 53500.0 - 14.40T 9H(g) = H(ppm in steel) -44780.0 + 3.38T 91/2H2(g) = H(ppm in steel) 8720.0 - 11.02T 8

(3.3)
In arc welding, however, a portion of the N2 molecules can dissociate (oreven ionize) under the high temperature of the arc plasma. The atomic N soproduced can dissolve in the molten metal as follows:
N = N (3.4)
(3.5)
where KmN is the equilibrium constant for reaction (3.4) based on dissolution
from a monatomic gas N and pN the partial pressure (in atmospheres) of Nabove the molten metal.
It is interesting to compare dissolution of nitrogen in molten steel from molecular nitrogen to that from atomic nitrogen. Consider an arbitrary tem-perature of 1600°C for molten steel for the purpose of discussion. Based onthe free energy of reaction DG° shown in Table 3.3, for molecular nitrogen apressure of pN2
= 1atm is required in order to have [N] = 0.045wt %. For atomicnitrogen, however, only a pressure of pN = 2 ¥ 10-7 atm is required to dissolvethe same amount of nitrogen in molten steel.
Similarly, for the dissolution of oxygen and hydrogen from O2(g) and H2(g),
(3.6)
(3.7)
However, as in the case of nitrogen, a portion of the O2 and H2 molecules candissociate (or even ionize) under the high temperature of the arc plasma. Theatomic O and H so produced can dissolve in the molten metal as follows:
O = O (3.8)
H = H (3.9)
DebRoy and David (11) showed, in Figure 3.3, the dissolution of mono-atomic, rather than diatomic, nitrogen and hydrogen dominates in molten iron.As they pointed out, several investigators have concluded that the species con-centration in the weld metal can be significantly higher than those calculatedfrom dissolution of diatomic molecules. Dissociation of such molecules toneutral atoms and ions in the arc leads to enhanced dissolution in the moltenmetal.
In the case of hydrogen the calculated results are consistent with the earlierones of Gedeon and Eagar (9) shown in Figure 3.4. The calculation is based
12 2H g H( ) =
12 2O g O( ) =
ln lnKNp
GRTN
m
N
=[ ]Ê
ˈ¯ =
- ∞D
N K pd[ ] = N N2
GAS–METAL REACTIONS 69
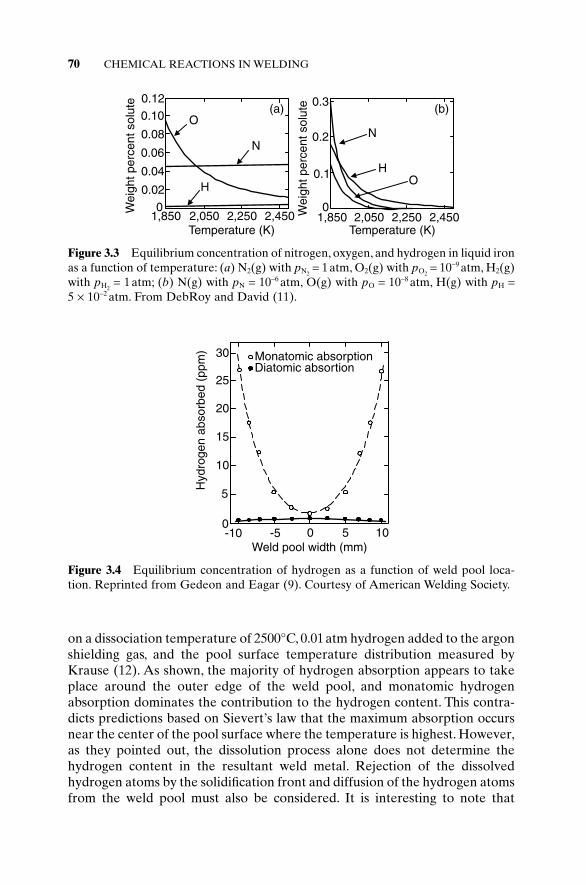
on a dissociation temperature of 2500°C, 0.01atm hydrogen added to the argonshielding gas, and the pool surface temperature distribution measured byKrause (12). As shown, the majority of hydrogen absorption appears to takeplace around the outer edge of the weld pool, and monatomic hydrogenabsorption dominates the contribution to the hydrogen content. This contra-dicts predictions based on Sievert’s law that the maximum absorption occursnear the center of the pool surface where the temperature is highest. However,as they pointed out, the dissolution process alone does not determine thehydrogen content in the resultant weld metal. Rejection of the dissolvedhydrogen atoms by the solidification front and diffusion of the hydrogen atomsfrom the weld pool must also be considered. It is interesting to note that
70 CHEMICAL REACTIONS IN WELDING
O
N
H
1,850 2,050 2,250 2,4500
0.02
0.04
0.06
0.08
0.100.12
Temperature (K)
Wei
ght p
erce
nt s
olut
e
O
N
H
1,850 2,050 2,250 2,4500
0.1
Temperature (K)
Wei
ght p
erce
nt s
olut
e
0.2
0.3(a) (b)
Figure 3.3 Equilibrium concentration of nitrogen, oxygen, and hydrogen in liquid ironas a function of temperature: (a) N2(g) with pN2
= 1atm, O2(g) with pO2= 10-9 atm, H2(g)
with pH2= 1atm; (b) N(g) with pN = 10-6 atm, O(g) with pO = 10-8 atm, H(g) with pH =
5 ¥ 10-2 atm. From DebRoy and David (11).
-10 -5 0 5 100
5
10
15
20
25
30
Weld pool width (mm)
Hyd
roge
n ab
sorb
ed (
ppm
) Monatomic absorptionDiatomic absortion
Figure 3.4 Equilibrium concentration of hydrogen as a function of weld pool loca-tion. Reprinted from Gedeon and Eagar (9). Courtesy of American Welding Society.

Hooijmans and Den Ouden (13) suggested that a considerable amount ofhydrogen absorbed by the liquid metal during welding leaves the weld metalimmediately after the extinction of the arc.
3.2.2 Nitrogen
For metals that neither dissolve nor react with nitrogen, such as copper andnickel, nitrogen can be used as the shielding gas during welding. On the otherhand, for metals that either dissolve nitrogen or form nitrides (or both), suchas Fe, Ti, Mn, and Cr, the protection of the weld metal from nitrogen shouldbe considered.
A. Sources of Nitrogen The presence of nitrogen in the welding zone isusually a result of improper protection against air. However, nitrogen is some-times added purposely to the inert shielding gas. Figure 3.5 shows the weldnitrogen content of a duplex stainless steel as a function of the nitrogen partialpressure in the Ar–N2 shielding gas (14). Nitrogen is an austenite stabilizer foraustenitic and duplex stainless steels. Increasing the weld metal nitrogencontent can decrease the ferrite content (Chapter 9) and increase the risk ofsolidification cracking (Chapter 11).
B. Effect of Nitrogen The presence of nitrogen in the weld metal can sig-nificantly affect its mechanical properties. Figure 3.6 shows the needlelikestructure of iron nitride (Fe4N) in a ferrite matrix (15). The sharp ends of such
GAS–METAL REACTIONS 71
0 0.02 0.04 0.06 0.08 0.1
0.1
0.2
0.3
0.4
Nitrogen partial pressure (MPa)
Nitr
ogen
con
tent
(m
ass%
)
Figure 3.5 Effect of nitrogen partial pressure in Ar–N2 shielding gas on nitrogencontent in welds of duplex stainless steel. Reprinted from Sato et al. (14).
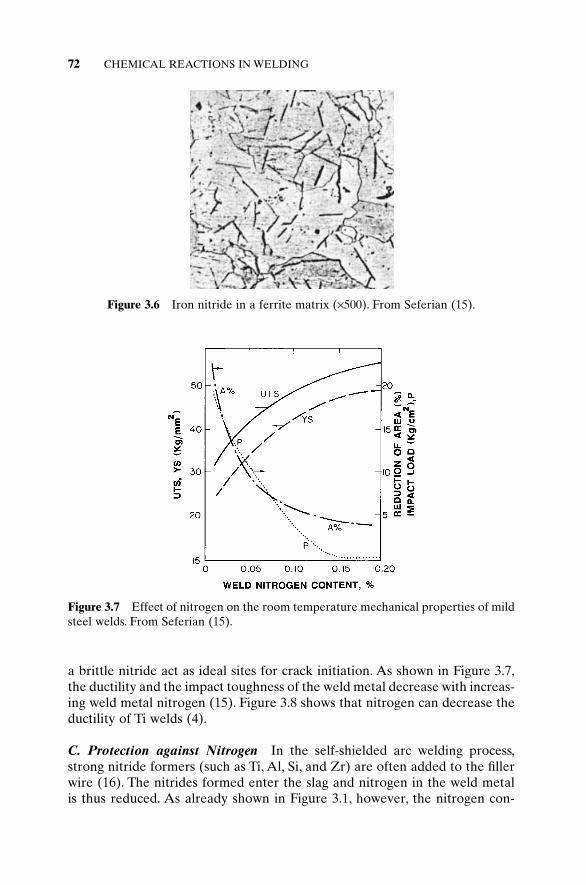
a brittle nitride act as ideal sites for crack initiation. As shown in Figure 3.7,the ductility and the impact toughness of the weld metal decrease with increas-ing weld metal nitrogen (15). Figure 3.8 shows that nitrogen can decrease theductility of Ti welds (4).
C. Protection against Nitrogen In the self-shielded arc welding process,strong nitride formers (such as Ti, Al, Si, and Zr) are often added to the fillerwire (16). The nitrides formed enter the slag and nitrogen in the weld metalis thus reduced. As already shown in Figure 3.1, however, the nitrogen con-
72 CHEMICAL REACTIONS IN WELDING
Figure 3.6 Iron nitride in a ferrite matrix (¥500). From Seferian (15).
Figure 3.7 Effect of nitrogen on the room temperature mechanical properties of mildsteel welds. From Seferian (15).

tents of self-shielded arc welds can still be rather high, and other arc weldingprocesses such as GTAW, GMAW, or SAW should be used if weld nitrogencontamination is to be minimized.
3.2.3 Oxygen
A. Sources of Oxygen Oxygen in the weld metal can come from the air, theuse of excess oxygen in oxyfuel welding, and the use of oxygen- or CO2-containing shielding gases. It can also come from the decomposition of oxides(especially SiO2 and MnO and FeO) in the flux and from the slag–metal reac-tions in the weld pool, which will be discussed subsequently.
In GMAW of steels the addition of oxygen or carbon dioxide to argon (e.g.,Ar–2% O2) helps stabilize the arc, reduce spatter, and prevent the filler metalfrom drawing away from (or not flowing out to) the fusion line (17). Carbondioxide is widely used as a shielding gas in FCAW, the advantages being lowcost, high welding speed, and good weld penetration. Baune et al. (18) pointedout that CO2 can decompose under the high temperature of the welding arcas follows:
(3.10)
(3.11)
B. Effect of Oxygen Oxygen can oxidize the carbon and other alloying elements in the liquid metal, modifying their prevailing role, depressing hardenability, and producing inclusions. The oxidation of carbon is as follows:
(3.12)C O CO g+ = ( )
CO g C s O g( ) = ( ) + ( )12 2
CO g CO g O g2 212
( ) = ( ) + ( )
GAS–METAL REACTIONS 73
.03Fe, 10 C/sec
.03Fe, 28 C/sec
.07Fe, 15 C/sec
.07Fe, 10 C/sec
.11Fe, 11 C/sec
OE = 2C+3.5N+O-0.14Fe0.15 0.2 0.25 0.3 0.35 0.4 0.45
05
101520253035
% E
long
atio
noo
ooo
Figure 3.8 Effect of oxygen equivalence (OE) on ductility of titanium welds.Reprinted from Harwig et al. (4). Courtesy of American Welding Society.

The oxidation of other alloying elements, which will be discussed subse-quently in slag–metal reactions, forms oxides that either go into the slag orremain in the liquid metal and become inclusion particles in the resultant weld metal.
Table 3.4 shows the effect of gas composition in oxyacetylene welding ofmild steel on the weld metal composition and properties (15). When too muchoxygen is used, the weld metal has a high oxygen level but low carbon level.On the other hand, when too much acetylene is used, the weld metal has a lowoxygen level but high carbon level (the flame becomes carburizing). In eithercase, the weld mechanical properties are poor. When the oxygen–acetyleneratio is close to 1, both the impact toughness and strength (proportional tohardness) are reasonably good.
If oxidation results in excessive inclusion formation in the weld metal orsignificant loss of alloying elements to the slag, the mechanical properties ofthe weld metal can deteriorate. Figure 3.9 shows that the strength, toughness,and ductility of mild steel welds can all decrease with increasing oxygen con-tamination (15). In some cases, however, fine inclusion particles can act asnucleation sites for acicular ferrite to form and improve weld metal toughness(Chapter 9). For aluminum and magnesium alloys, the formation of insolubleoxide films on the weld pool surface during welding can cause incompletefusion. Heavy oxide films prevent a keyhole from being established properlyin conventional PAW of aluminum, and more advanced DC variable-polarityPAW has to be used. In the latter, oxide films are cleaned during the electrode-positive part of the current cycle.
Bracarense and Liu (19) discovered in SMAW that the metal transferdroplet size can increase gradually during welding, resulting in increasing Mn
74 CHEMICAL REACTIONS IN WELDING
TABLE 3.4 Effect of Oxygen–Acetylene Ratio on Weld Metal Composition andProperties of Mild Steel
a = O2/C2H2 > 1 a £ 1
Before a = 1.14 a = 1.33 a = 2 a = 2.37 a = 1 a = 0.82
C 0.155 0.054 0.054 0.058 0.048 0.15 1.56Mn 0.56 0.38 0.265 0.29 0.18 0.29 0.375Si 0.03S 0.030P 0.018O — 0.04 0.07 0.09 — 0.02 0.01N — 0.015 0.023 0.030 — 0.012 0.023Impact value, — 5.5 1.40 1.50 1.30 6.9 2.3
kg/cm2
Hardness, HB — 130 132 115 100 140 320Grain size — 6 5 4 4 4 5
Source: Seferian (15).

and Si transfer to the weld pool and hence increasing weld metal hardnessalong the weld length, as shown in Figure 3.10. As the electrode is heated upmore and more during welding, the droplet size increases gradually (becomesmore globular). This reduces the surface area (per unit volume) for oxygen toreact with Mn and Si and hence improves the efficiency of Mn and Si trans-fer to the weld pool.
3.2.4 Hydrogen
A. Steels The presence of hydrogen during the welding of high-strengthsteels can cause hydrogen cracking (Chapter 17).
A.1. Sources of Hydrogen Hydrogen in the welding zone can come fromseveral different sources: the combustion products in oxyfuel welding; decom-position products of cellulose-type electrode coverings in SMAW; moisture orgrease on the surface of the workpiece or electrode; and moisture in the flux,electrode coverings, or shielding gas.
As mentioned previously in Chapter 1, in SMAW high-cellulose electrodescontain much cellulose, (C6H10O5)x, in the electrode covering. The coveringdecomposes upon heating during welding and produces a gaseous shield richin H2, for instance, 41% H2, 40% CO, 16% H2O, and 3% CO2 in the case ofE6010 electrodes (20). On the other hand, low-hydrogen electrodes containmuch CaCO3 in the electrode covering. The covering decomposes duringwelding and produces a gaseous shield low in H2, for example, 77% CO, 19%CO2, 2% H2, and 2% H2O in the case of E6015 electrodes. As such, to reduceweld metal hydrogen, low-hydrogen electrodes should be used.
GAS–METAL REACTIONS 75
Figure 3.9 Effect of the oxygen content on the mechanical properties of mild steelwelds. From Seferian (15).

A.2. Measuring Hydrogen Content Various methods have been developedfor measuring the hydrogen content in the weld metal of steels. The mercurymethod and the gas chromatography method are often used. Figure 3.11 showsthe mercury method (21). A small test specimen (13 ¥ 25 ¥ 127mm, or 1/2 ¥ 1¥ 5 in.) is welded in a copper fixture. The welded test specimen is thenimmersed in mercury contained in a eudiometer tube. As hydrogen diffusesout of the welded test specimen, the mercury level in the eudiometer tube con-tinues to drop. From the final mercury level, H (in millimeters), the amountof hydrogen that diffuses out of the specimen, that is, the so-called diffusiblehydrogen, can be measured. This method, however, can take days because ofthe slow diffusion of hydrogen at room temperature. In the gas chromatogra-phy method (22), the specimen is transferred to a leak-tight chamber after
76 CHEMICAL REACTIONS IN WELDING
430
420
410
400
390
380
100
80
60
40
20200 40 60 80 100
weld length position, mm
120 140 160
[Mn]
and
[Si]
x 10
-2, w
t %
manganese
silicon
[O],
ppmoxygen
(a)
40
200 40 60 80 100
weld length position, mm
120
Har
dnes
s, H
RC
30
50
(b)
Figure 3.10 Variations of weld metal along the length of a weld made with an E7018electrode: (a) composition; (b) hardness. Reprinted from Bracarense and Liu (19).Courtesy of American Welding Society.

welding, which can be heated to accelerate the hydrogen evolution from thespecimen. After that, the chamber can be connected to a gas chromatographanalyzer to measure the total amount of hydrogen present. The advantagesare that it can separate other gases present and measure only hydrogen andit takes hours instead of days. One disadvantage is the relatively high cost ofthe equipment.
Newer methods have also been developed. Albert et al. (23) developed anew sensor for detecting hydrogen. The sensor is a conducting polymer filmcoated with Pd on one side to be exposed to a hydrogen-containing gas andthe other side to air. The current going through the sensor is directionally pro-portional to the hydrogen content in the gas. Figure 3.12 shows the hydrogencontents measured by the new sensor as well as gas chromatography (GC).These are gas–tungsten arc welds of a 0.5Cr–0.5Mo steel made with Ar–H2 asthe shielding gas. Smith et al. (24) developed a new hydrogen sensor that gen-erates results in less than 1h and allows analysis to be done on the actualwelded structure. The sensor is a thin porous film of tungsten oxide, whichchanges color upon reacting with hydrogen.
GAS–METAL REACTIONS 77
Figure 3.11 Mercury method for measuring diffusible hydrogen in welds. Reprintedfrom Shutt and Fink (21). Courtesy of American Welding Society.

A.3. Hydrogen Reduction Methods The weld hydrogen content can bereduced in several ways. First, avoid hydrogen-containing shielding gases,including the use of hydrocarbon fuel gases, cellulose-type electrode cover-ings, and hydrogen-containing inert gases. Second, dry the electrode coveringand flux to remove moisture and clean the filler wire and workpiece to removegrease. Figure 3.13 shows the effect of the electrode baking temperature onthe weld metal hydrogen content (25). Third, adjust the composition of theconsumables if feasible. Figure 3.14 shows that CO2 in the shielding gas helpsreduce hydrogen in the weld metal (22), possibly because of reaction betweenthe two gases. Increasing the CaF2 content in the electrode covering or the flux
78 CHEMICAL REACTIONS IN WELDING
gas chromatographysensor
Concentration of hydrogen in shieldinggas (%)
Hyd
roge
n in
wel
d m
etal
(m
l/100
cc)
0.0 1.0 2.0 3.0 4.0 5.0 6.015.0
25.0
35.0
45.0
55.0
Figure 3.12 Hydrogen content in gas–tungsten arc welds of 0.5Cr–0.5Mo steel as afunction of volume percent of hydrogen in Ar–H2 shielding gas. Reprinted from Albertet al. (23). Courtesy of American Welding Society.
As bakedExposed at 80%relative humidity at28oC for 24 h
Baking temperature oC
Diff
usib
le h
ydro
gen
ml/1
00g
depo
site
d m
etal
00
100 200 300 400 500
5
10
15
20
25
30
Figure 3.13 Effect of electrode baking temperature on weld metal diffusible hydro-gen levels. Reprinted from Fazackerley and Gee (25).

has been reported to reduce the weld hydrogen content. This reduction inhydrogen has been ascribed to the reaction between hydrogen and CaF2 (26).Fourth, as shown in Figure 3.15, use postweld heating to help hydrogen diffuseout of the weld (27).
GAS–METAL REACTIONS 79
(a)
(b)
Ar Ar+5%CO2Ar+20%CO2CO2
ArAr+5%CO2
Ar+20%CO2CO2
Shielding gas
Diff
usib
le H
ydro
gen
(mL/
100g
)
0
1
2
3
0
2
4
6
8
10
deposited metal
fused metal
deposited metalfused metal
Figure 3.14 Effect of shielding gases on weld metal hydrogen content: (a) GMAW;(b) FCAW. Reprinted from Mirza and Gee (22).
Figure 3.15 Effect of postweld heating on the weld metal hydrogen content of mildsteel. Reprinted from Flanigan (27).

B. Aluminum Hydrogen can cause porosity in aluminum welds (Chapter10). The oxide films on the surface of the workpiece or electrode can absorbmoisture from the air and introduce hydrogen into molten aluminum duringwelding. Grease on the surface of the workpiece or electrode and moisture inshielding gas can also be the sources of hydrogen. Figure 3.16 shows the sol-ubility of hydrogen in aluminum (28). Since the solubility of hydrogen is muchhigher in liquid aluminum than in solid aluminum, hydrogen is rejected intothe weld pool by the advancing solid–liquid interface. Consequently, hydrogenporosity is often observed in aluminum welds. Devletian and wood (29) havereviewed the factors affecting porosity in aluminum welds.
B.1. Effect of Hydrogen Porosity As shown in Figure 3.17, excessive hydro-gen porosity can severely reduce both the strength and ductility of aluminumwelds (30). It has also been reported to reduce the fatigue resistance of aluminum welds (31).
B.2. Reducing Hydrogen Porosity To reduce hydrogen porosity, the surfaceof Al–Li alloys has been scrapped, milled, or even thermovacuum degassed toremove hydrogen present in the form of hydrides or hydrated oxides (32, 33).Similarly, Freon (CCl2F2) has been added to the shielding gas to reduce hydro-gen in aluminum welds. The weld pool has been magnetically stirred to helphydrogen bubbles escape and thus reduce hydrogen porosity (34). Keyholeplasma arc welding, with variable-polarity direct current, has been used toreduce hydrogen porosity in aluminum welds (35). The cleaning action of theDCEP cycle helps remove hydrated oxides and hydrides. The keyhole, on theother hand, helps eliminate entrapment of oxides and foreign materials in the weld, by allowing contaminants to enter the arc stream instead of being trapped in the weld. Consequently, the welds produced are practicallyporosity free.
80 CHEMICAL REACTIONS IN WELDING
Figure 3.16 Solubility of hydrogen in aluminum. From Eastwood (28).

Consider the reduction of severe gas porosity in the welding of a high-strength, lightweight Al–5Mg–2Li alloy (33, 36).The presence of Li in the alloypromotes the formation of lithium hydride during heat treatment as well asthe hydration of the surface oxide at room temperature. Surface cleaning andthermovacuum treatment before welding, which help reduce the hydrogencontent of the workpiece surface, have been reported to reduce the porositylevel of the weld metal. Reduction in porosity has also been achieved by usingan alternating magnetic field to stir the weld pool and by using variable-polarity keyhole PAW (33).
Consider also the reduction of severe gas porosity in the welding of PM(powder metallurgy) parts of Al–8.0Fe–1.7Ni alloy (33, 36). Oxidation and sub-sequent hydration of the aluminum powder during and after powder produc-tion by air atomization result in a high surface moisture content. When thepowder is consolidated into PM parts, the moisture is trapped inside the parts.Because of the difficulty in removing the moisture from deep inside the work-piece, thermovacuum treatments at temperatures as high as 595°C have beenfound necessary. Unfortunately, the use of such a high temperature causesunacceptable degradation in the base-metal strength. Therefore, atomizationand consolidation techniques that minimize powder oxidation and hydrationare required for producing porosity-free welds.
GAS–METAL REACTIONS 81
Figure 3.17 Effect of porosity on tensile properties of aluminum welds. From Shore(30).

C. Copper Hydrogen can also cause problems in copper welding. It can reactwith oxygen to form steam, thus causing porosity in the weld metal. It can alsodiffuse to the HAZ and react with oxygen to form steam along the grainboundaries. This can cause microfissuring in the HAZ. These problems can beminimized if deoxidized copper is used for welding.
3.3 SLAG–METAL REACTIONS
3.3.1 Thermochemical Reactions
The thermochemical slag–metal reactions here refer to thermochemical reac-tions that take place at the interface between the molten slag and the liquidmetal. Examples of such reactions are decomposition of metal oxides in theflux, oxidation of alloying elements in the liquid metal by the oxygen dissolvedin the liquid metal, and desulfurization of the weld metal.
A. Decomposition of Flux In studying SAW, Chai and Eagar (37) suggestedthat in the high-temperature environment near the welding plasma, all oxidesare susceptible to decomposition and produce oxygen. It was found that thestability of metal oxides during welding decreases in the following order: (i)CaO, (ii) K2O, (iii) Na2O and TiO2, (iv) Al2O3, (v) MgO, and (vi) SiO2 and MnO(FeO was not included but can be expected to be rather unstable, too). Forinstance, SiO2 and MnO can decompose as follows (2):
(3.13)
(3.14)
It was concluded that in fluxes of low FeO content (<10% FeO), SiO2 andMnO are the primary sources of oxygen contamination and the stability ofmetal oxides in welding is not directly related to their thermodynamic stabil-ity. It was also concluded that CaF2 reduces the oxidizing potential of weldingfluxes due to dilution of the reactive oxides by CaF2 rather than to reactivityof the CaF2 itself and significant losses of Mn may occur by evaporation fromthe weld pool due to the high vapor pressure of Mn.
B. Oxidation by Oxygen in Metal
(3.15)
(3.16)
(3.17)
(3.18)2 3 2 3Al O Al O+ = ( )Ti O TiO+ = ( )2 2
Si O SiO+ = ( )2 2
Mn O MnO+ = ( )
MnO Mn g O g( ) = ( ) + ( )12 2
SiO SiO g O g2 212
( ) = ( ) + ( )
82 CHEMICAL REACTIONS IN WELDING
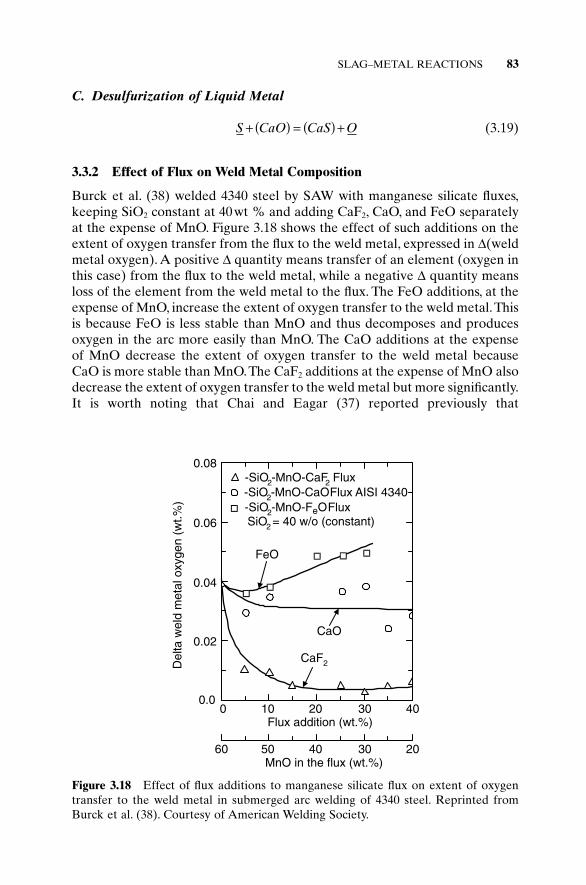
C. Desulfurization of Liquid Metal
(3.19)
3.3.2 Effect of Flux on Weld Metal Composition
Burck et al. (38) welded 4340 steel by SAW with manganese silicate fluxes,keeping SiO2 constant at 40wt % and adding CaF2, CaO, and FeO separatelyat the expense of MnO. Figure 3.18 shows the effect of such additions on theextent of oxygen transfer from the flux to the weld metal, expressed in D(weldmetal oxygen). A positive D quantity means transfer of an element (oxygen inthis case) from the flux to the weld metal, while a negative D quantity meansloss of the element from the weld metal to the flux. The FeO additions, at theexpense of MnO, increase the extent of oxygen transfer to the weld metal.Thisis because FeO is less stable than MnO and thus decomposes and producesoxygen in the arc more easily than MnO. The CaO additions at the expenseof MnO decrease the extent of oxygen transfer to the weld metal because CaO is more stable than MnO.The CaF2 additions at the expense of MnO alsodecrease the extent of oxygen transfer to the weld metal but more significantly.It is worth noting that Chai and Eagar (37) reported previously that
S CaO CaS O+ ( ) = ( ) +
SLAG–METAL REACTIONS 83
FeO
CaO
CaF2
-SiO2-MnO-CaF2 Flux-SiO2-MnO-CaO Flux AISI 4340-SiO2-MnO-FeO FluxSiO2 = 40 w/o (constant)
0 10 20 30 40Flux addition (wt.%)
2030405060MnO in the flux (wt.%)
0.0
0.02
0.04
0.06
0.08
Del
ta w
eld
met
al o
xyge
n (w
t .%)
Figure 3.18 Effect of flux additions to manganese silicate flux on extent of oxygentransfer to the weld metal in submerged arc welding of 4340 steel. Reprinted fromBurck et al. (38). Courtesy of American Welding Society.

CaF2 reduces oxygen transfer by acting as a diluent rather than an activespecies.
Figure 3.19 shows the effect of flux additions on the manganese change of the weld metal (38). It is surprising that the CaO additions at the expenseof MnO do not decrease the extent of manganese transfer from the flux to theweld metal. From the steelmaking data shown in Figure 3.20, it appears thatthe CaO additions do not reduce the activity of MnO (39), as indicated by thedots along the constant MnO activity of about 0.30. The additions of FeO andCaF2 at the expense of MnO decrease the extent of manganese transfer from the flux to the weld metal, as expected. Beyond 20% FeO, D(weld metal manganese) becomes negative, namely, Mn is lost from the weld metalto the slag. This is likely to be caused by the oxidation of Mn by the oxygenintroduced into the liquid metal from FeO, namely, Mn + O = (MnO). The fluxadditions also affect the extents of loss of alloying elements such as Cr, Mo,and Ni.
Therefore, the flux composition can affect the weld metal composition andhence mechanical properties rather significantly. The loss of alloying elementscan be made up by the addition of ferroalloy powder (e.g., Fe–50% Si andFe–80% Mn) to SAW fluxes or SMAW electrode coverings. In doing so, the
84 CHEMICAL REACTIONS IN WELDING
FeO
CaO
CaF2
-SiO2-MnO-CaF2 Flux-SiO2-MnO-CaO Flux AISI 4340-SiO2-MnO-FeO FluxSiO2 = 40 w/o (constant)
0 10 20 30 40Flux addition (wt.%)
2030405060MnO in the flux (wt.%)
-0.2
0.0
0.2
0.4
0.6
Del
ta w
eld
met
al m
anga
nese
(w
t.%)
Figure 3.19 Effect of flux additions to manganese silicate flux on extent of manganesetransfer to the weld metal in submerged arc welding of 4340 steel. Reprinted fromBurck et al. (38). Courtesy of American Welding Society.

alloying element recovery, that is, the percentage of the element transferredacross the arc and into the weld metal, should be considered. The recoveryvaries significantly from element to element. In SMAW, for example, it can beabout 100% for Ni and Cr, 75% for Mn, 70% for Nb, 45% for Si, and 5% forTi (40).
3.3.3 Types of Fluxes, Basicity Index, and Weld Metal Properties
The use of proper welding fluxes during fusion welding helps control the com-position of the weld metal as well as protect it from air. Welding fluxes can becategorized into the following three groups according to the types of main constituents (26):
(a) Halide-type fluxes: for example, CaF2–NaF, CaF2–BaCl2–NaF,KC1–NaCl–Na3AlF6, and BaF2–MgF2–CaF2–LiF.
(b) Halide–oxide-type fluxes: for example, CaF2–CaO–Al2O3,CaF2–CaO–SiO2, CaF2–CaO–Al2O3–SiO2, and CaF2–CaO–MgO–Al2O3.
(c) Oxide-type fluxes: for example, MnO–SiO2, FeO–MnO–SiO2, andCaO–TiO2–SiO2.
The halide-type fluxes are oxygen free and are used for welding titaniumand aluminum alloys (26, 41). The halide–oxide-type fluxes, which are slightlyoxidizing, are often used for welding high-alloy steels. The oxide-type fluxes,which are mostly oxidizing, are often used for welding low-carbon or low-alloysteels. When oxide-type fluxes are used for welding a reactive metal such astitanium, the weld metal can be contaminated with oxygen.
The oxides in a welding flux can be roughly categorized into the followingthree groups (26):
SLAG–METAL REACTIONS 85
SiO2
SiO2 saturation
XSiO
2
XMnO
X CaO
MnO saturationlime and lime
silicate saturation
0.060.13 0.17
0.210.25
0.37 0.41 0.590.67
CaO 0.2 0.4 0.6 MnO
0.6
0.4 0.6
0.4
Figure 3.20 Activity of MnO in CaO–MnO–SiO2 melts at 1500°C. Reprinted fromBurck et al. (38). Courtesy of American Welding Society.

(a) Acidic oxides, in the order of decreasing acidity: SiO2, TiO2, P2O5,V2O5.
(b) Basic oxides, in the order of decreasing basicity: K2O, Na2O, CaO, MgO,BaO, MnO, FeO, PbO, Cu2O, NiO.
(c) Amphoteric oxides: Al2O3, Fe2O3, Cr2O3, V2O3, ZnO.
Oxides that are donors of free oxide ions, O2-, are considered as basicoxides, CaO being the most well known example. Oxides that are acceptors ofO2- are considered as acidic oxides, SiO2 being the most well known example.Oxides that are neutral are considered as amphoteric oxides.
3.3.4 Basicity Index
The concept of the basicity index (BI) was adopted in steelmaking to explain the ability of the slag to remove sulfur from the molten steel. It was later broadened to indicate the flux oxidation capability. The BI of a flux(especially an oxide-type one) can be defined in the following general form(42):
(3.20)
The concept of the BI was applied to welding. Tuliani et al. (43) used thefollowing well-known formula for the fluxes in SAW:
(3.21)
where components are in weight fractions. Using the above expression, theflux is regarded as acidic when BI < 1, as neutral when 1.0 < BI < 1.2, and asbasic when BI > 1.2. The formula correlates well with the oxygen content insubmerged arc welds.
Eagar and Chai (44, 45), however, modified Equation (3.21) by consideringCaF2 as neutral rather than basic and omitting the CaF2 term. As shown inFigure 3.21, the formula correlates well with the oxygen content in submergedarc welds (44, 45).The oxygen content decreases as the basicity index increasesup to about 1.25 and reaches a constant value around 250ppm at larger basic-ity values.
Baune et al. (18, 46) modified Equation (3.21) for FCAW electrodes byusing the composition of the solidified slag after welding rather than the com-position of the flux before welding. Furthermore, mole fraction was used ratherthan weight fraction, and FeO was replaced by Fe2O3. The composition of thesolidified slag was thought to provide more information about the extent of
BI
CaF CaO MgO BaO SrO
Na O K O Li O MnO FeOSiO Al O TiO ZrO
=
+ + + ++ + + + +( )
+ + +( )
2
2 2 2
2 2 3 2 2
0 50 5
..
BIbasic oxides
nonbasic oxides=
( )( )Â
Â%
%
86 CHEMICAL REACTIONS IN WELDING

SLAG–METAL REACTIONS 87
Figure 3.21 Weld metal oxygen content in steel as a function of flux basicity in submerged arc welding. From Chai and Eagar (45).
Basicity index based onmeasured composition of solidified slag
515
510
505
500
495
490
485
480
475
470465
1.9 1.95 2 2.05 2.1 2.15
Wel
d m
etal
oxy
gen
cont
ent(
ppm
)
Wire #1Bl=1.94
Wire #2Bl=1.976
Wire #3Bl=1.982
Wire #4Bl=2.02
Wire #5Bl=2.13
[o]=-199.69B.l.+895.37R2 =0.9941
Figure 3.22 Weld metal oxygen content in steel as a function of flux basicity in flux-core arc welding. Reprinted from Baune et al. (46). Courtesy of American WeldingSociety.
the slag–metal reactions during welding than the composition of the fluxbefore welding. The Fe2O3 was thought to be the iron oxide that forms in awelding slag. As shown in Figure 3.22, the weld oxygen content correlates wellwith the new basicity index (46).
Oxide inclusions in steel welds can affect the formation of acicular ferrite,which improves the weld metal toughness (47–50). It has been reported thatacicular ferrite forms in the range of about 200–500ppm oxygen (51–53). Thiswill be discussed later in Chapter 9.
For SAW of high-strength, low-alloy steels with the CaF2–CaO–SiO2 fluxsystem, Dallam et al. (47) used the following simple formula for the basicityindex:

(3.22)
Figure 3.23 shows the effect of the basicity index on sulfur transfer (47).As the basicity index increases from 0 to 5, Dsulfur becomes increasingly negative, namely, more undesirable sulfur is transferred from the weld metalto the slag (desulfurization). This is because CaO is a strong desulfurizer,as shown previously by Equation (3.19).
Excessive weld metal oxygen and hence oxide inclusions can deteriorateweld metal mechanical properties. As shown in Figure 3.24, some inclusion
BICaOSiO
=2
88 CHEMICAL REACTIONS IN WELDING
-0.008
-0.012
-0.020
-0.016
0 1 2 3 4 5 CaO/SiO2
su
lfur
(wt%
)
-0.004
∞
∆
Figure 3.23 Desulfurization of high-strength, low-alloy steel welds as a function ofbasicity index CaO/SiO2 of CaF2–CaO–SiO2 type flux. Reprinted from Dallam et al.(47). Courtesy of American Welding Society.
Figure 3.24 Fracture initiation at an inclusion in flux-cored arc weld of high-strength,low-alloy steel. Reprinted from Bose et al. (54).

particles can act as a fracture initiation site (54). Besides oxide inclusions,oxygen in the weld pool can also react with carbon to form CO gas duringsolidification. As shown in Figure 3.25, this can result in gas porosity in steelwelds (55). The addition of deoxidizers such as Al, Ti, Si, and Mn in the fillermetal helps reduce the amount of porosity. Figure 3.26 shows that the toughness of the weld metal decreases with increasing oxygen content (56).However, if the content of the acicular ferrite in the weld metal increases withthe weld oxygen content, the weld metal toughness may in fact increase(Chapter 9).
Basic fluxes, however, can have some drawbacks. They are often found tohave a greater tendency to absorb moisture, which can result in hydrogenembrittlement unless they are dried before welding.The slag detachability may
SLAG–METAL REACTIONS 89
Figure 3.25 Wormhole porosity in weld metal. From Jackson (55).
Figure 3.26 Relationship between the toughness at 20°C and the oxygen content ofsteel welds. Reprinted from North et al. (56). Courtesy of American Welding Society.

not be very good in a fully basic flux. This makes slag removal more difficult,especially in multiple-pass or narrow-groove welding. In the case of FCAW,basic fluxes have also been observed to generate unstable arcs (57).
3.3.5 Electrochemical Reactions
Kim et al. (58, 59) studied the effect of electrochemical reactions on the weldmetal composition in SAW, and significant composition differences wereobserved when the electrode polarity was varied in DC welding. The follow-ing anodic oxidation reactions were proposed:
(3.23)
(3.24)
These reactions occur at the electrode tip–slag interface in the electrode-positive polarity or the weld pool–slag interface in the electrode-negativepolarity.Therefore, oxidation losses of alloying elements and pickup of oxygenare expected at the anode.
The following cathodic reduction reactions were also proposed:
(3.25)
(3.26)
(3.27)
The first two reactions are the reduction of metallic cations from the slag,and the third reaction is the removal (refining) of oxygen from the metal.These reactions occur at the electrode tip–slag interface in the electrode-negative polarity or the weld pool–slag interface in the electrode-positivepolarity. The current density is much higher at the electrode tip–slag interfacethan at the weld pool–slag interface. Therefore, reactions at the electrode tipmay exert a greater influence on the weld metal composition than those at theweld pool.
A carbon steel containing 0.18% C, 1.25% Mn, and 0.05% Si was sub-merged arc welded with a low-carbon steel wire of 0.06% C, 1.38% Mn, and0.05% Si and a flux of 11.2% SiO2, 18.14% Al2O3, 33.2% MgO, 25.3% CaF2,6.9% CaO, and 1.2% MnO. Figure 3.27 shows the oxygen contents of themelted electrode tips and the detached droplets for both polarities, the 20ppmoxygen content of the wire being included as a reference (58). A significantoxygen pickup in the electrode tips is evident for both polarities, suggestingthat the excess oxygen came from decomposition of oxide components in theflux and the surrounding atmosphere.The anodic electrode tip has about twiceas much oxygen as the cathodic electrode tip, suggesting the significant effectof electrochemical reactions. The difference in the oxygen content is due to
O e Ometal slag( ) + = ( )- -2 2
Si e Si4 4+ -( ) + = ( )slag metal
M e M2 2+ -( ) + = ( )slag metal
O O e2 2- -( ) = ( ) +slag metal
M nO MO nenmetal slag slag( ) + ( ) = ( ) +- -2 2
90 CHEMICAL REACTIONS IN WELDING

oxygen pickup at the anode and oxygen removal (refining) at the cathode. Ineither polarity the detached droplets contain more oxygen than the meltedelectrode tip. This suggests that the electrochemical reactions cease after thedroplets separate from the electrode tips, but the droplets pick up more oxygenfrom decomposed oxides while falling through the arc plasma. The higheroxygen content in the droplets separated from the anodic electrode tip is dueto the higher oxygen content of the melted anodic electrode tip.
Figure 3.28 shows the silicon change in the weld pool for both polarities(58). Since there is plenty of oxygen from the decomposition of oxides, loss of silicon from the weld pool due to the thermochemical reaction Si + 2O =(SiO2) is likely. But the silicon loss is recovered by the cathodic reduction (Si4+) + 4e- = Si and worsened by the anodic oxidation Si + 2(O2-) = (SiO2) +4e-. Consequently, the silicon loss is more significant at the anode than at thecathode.
Figure 3.29 shows the manganese change in the weld pool for both polari-ties (58). The manganese loss from the weld pool to the slag is significant inboth cases. This is because manganese is the richest alloying element in theweld pool (judging from the compositions of the workpiece and the fillermetal) and MnO is among the poorest oxides in the flux. As such, the ther-mochemical reaction Mn + O = (MnO) can shift to the right easily and causemuch manganese loss. Since manganese is known to have a high vapor pres-sure (Chapter 4), evaporation from the liquid can be another reason for muchmanganese loss. However, the manganese loss is partially recovered by thecathodic reduction (Mn2+) + 2e- = Mn and worsened by the anodic oxidationMn + (O2-) = (MnO) + 2e-. Consequently, the manganese loss is more signifi-cant at the anode than at the cathode.
SLAG–METAL REACTIONS 91
Oxy
gen
Con
cent
ratio
n (p
pm)
0
200
400
600
800
1000
1200
Wire ElectrodeTip
Droplet
AnodeWireCathode
Figure 3.27 Oxygen contents of the welding wire, melted electrode tips, and detacheddroplets for both electrode-positive and electrode-negative polarities. Reprinted fromKim et al. (58). Courtesy of American Welding Society.

REFERENCES
1. Rein, R. H., in Proceedings of a Workshop on Welding Research Opportunities, Ed.B. A. McDonald, Office of Naval Research, Washington, DC, 1974, p. 92.
92 CHEMICAL REACTIONS IN WELDING
Anode
Cathode
Silicon change in weld pool
0.0 0.8 1.6 2.4 3.2Travel speed (cm/s)
-0.15
-0.10
-0.05
0.00
0.05
0.10
0.15
s
ilico
n (w
t.%)
∆
Figure 3.28 Gain or loss of weld metal silicon due to reactions in weld pool for electrode-positive and electrode-negative polarities as a function of welding speed.Reprinted from Kim et al. (58). Courtesy of American Welding Society.
Anode
Cathode
Manganese change in weld pool
0.0 0.8 1.6 2.4 3.2Travel speed (cm/s)
-0.35
-0.30
-0.25
-0.20
-0.15
-0.10
-0.15
m
anga
nese
(w
t.%)
0.00
∆
Figure 3.29 Loss of weld metal manganese due to reactions in weld pool for elec-trode-positive and electrode-negative polarities as a function of welding speed.Reprinted from Kim et al. (58). Courtesy of American Welding Society.
2. Eagar, T. W., in Weldments: Physical Metallurgy and Failure Phenomena, Proceed-ings of the Fifth Bolton Landing Conference, General Electric Co., Schenectady,NY, 1979, p. 31.
3. Harwig, D. D., Fountain, C., Ittiwattana,W., and Castner, H., Weld. J., 79: 305s, 2000.4. Harwig, D. D., Ittiwattana, W., and Castner, H., Weld. J., 80: 126s, 2001.5. Darken, L. S., and Gurry, R. W., Physical Chemistry of Metals, McGraw-Hill, New
York, 1953.6. Elliott, J. F., and Gleiser, M., Thermochemistry for Steelmaking, Vol. I, Addison
Wesley, Reading, MA, 1960.7. Pehlke, R. D., and Elliott, J. F., Trans. Metall. Soc. AIME., 218: 1091, 1960.8. Elliott, J. F., Gleiser, M., and Ramakrishna, V., Thermochemistry for Steelmaking,
Vol. II, Addison Wesley, Reading, MA, 1963.9. Gedeon, S. A., and Eagar, T. W., Weld. J., 69: 264s, 1990.
10. Pehlke, R. D., Unit Processes in Extractive Metallurgy, Elsevier, New York, 1979.11. DebRoy, T., and David, S. A., Rev. Modern Phys., 67: 85, 1995.12. Krause, H. G., Weld. J., 66: 353s, 1987.13. Hooijmans, J. W., and Den Ouden, G., Weld. J., 76: 264s, 1997.
14. Sato, Y. S., Kokawa, H., and Kuwana, T., in Trends in Welding Research, Eds. J. M.Vitek, S. A. David, J. A. Johnson, H. B. Smartt, and T. DebRoy, ASM International,Materials Park, OH, June 1998, p. 131.
15. Seferian, D., The Metallurgy of Welding, Wiley, New York, 1962.16. Atarashi, N., Welding Metallurgy, Maruzen, Tokyo, 1972 (in Japanese).17. Welding Handbook, Vol. 2, 7th ed., American Welding Society, Miami, FL, 1978,
p. 134.18. Baune, E., Bonnet, C., and Liu, S., Weld. J., 79: 57s, 2000.19. Bracarense, A. Q., and Liu, S., Weld. J., 72: 529s, 1993.20. Christensen, N., Welding Metallurgy, Lecture Notes, Colorado School of Mines,
1979.21. Shutt, R. C., and Fink, D. A., Weld. J., 64: 19, 1985.22. Mirza, R. M., and Gee, R., Sci. Technol. Weld. Join., 4: 104, 1999.23. Albert, S. K., Remash, C., Murugesan, N., Gill, T. P. S., Periaswami, G., and
Kulkarni, S. D., Weld. J., 76: 251s, 1997.24. Smith, R. D., Benson, D. K., Maroef, I., Olson, D. L., and Wildeman, T. R., Weld. J.,
80: 122s, 2001.25. Fazackerley, W., and Gee, R., in Trends in Welding Research, Eds. H. B. Smartt,
J. A. Johnson, and S. A. David, ASM International, Materials Park, OH, June 1995,p. 435.
26. Principles and Technology of the Fusion Welding of Metal, Vol. 1., Mechanical Engineering Publishing Company, Peking, 1979 (in Chinese).
27. Flanigan, A. E., Weld. J., 26: 193s, 1947.28. Eastwood, L. W., Gases in Non-ferrous Metals and Alloys, American Society for
Metals, Cleveland, OH, 1953.29. Devletian, J. H., and Wood, W. E., Weld. Res. Council Bull., 290: December 1983.30. Shore, R. J., M.S. Thesis, Ohio State University, Columbus, OH, 1968.
REFERENCES 93

31. Pense, A. W., and Stout, R. D., Weld. Res. Council Bull., 152: July 1970.32. Fedoseev,V.A., Ryazantsev,V. I., Shiryaeva, N.V., and Arbuzov,Y. U. P., Svar. Proiz.,
6: 15, 1978.33. Ishchenko, A. Y., and Chayun, A. G., paper presented at the Second Interna-
tional Conference on Aluminum Weldments, Paper 110, Munich, F.R.G., May 1982.
34. Matsuda, F., Nakata, K., Miyanaga, Y., Kayano, T., and Tsukamoto, K., Trans. Jpn.Weld. Res. Inst., 7: 181, 1978.
35. Tomsic, M., and Barhorst, S., Weld. J., 63: 25, 1984.36. Baeslak, W. A. III, paper presented at the 1982 American Welding Society Con-
vention, Kansas City, MO, 1982.37. Chai, C. S., and Eagar, T. W., Weld. J., 61: 229s, 1982.38. Burck, P. A., Indacochea, J. E., and Olson, D. L., Weld. J., 69: 115s, 1990.39. Abraham, K. P., Davies, M. W., and Richardson, F. D., J. Iron Steel Inst., 196: 82,
1960.40. Linnert, G. E., in Welding Metallurgy,Vol. 1,American Welding Society, Miami, FL,
1965, Chapter 8, p. 367.41. Gurevich, S. M., Metallurgy and Technology of Welding Titanium and Its Alloys,
Naukova Dumka Publishing House, Kiev, 1979 (in Russian).42. Schenck, H., Physical Chemistry of Steelmaking, British Iron and Steel Research
Association, London, 1945.43. Tuliani, S. S., Boniszewski, T., and Eaton, N. F., Weld. Metal Fab., 37: 327, 1969.44. Eagar, T. W., Weld. J., 57: 76s, 1978.45. Chai, C. S., and Eagar, T. W., Metall. Trans., 12B: 539, 1981.46. Baune, E., Bonnet, C., and Liu, S., Weld. J., 79: 66s, 2000.47. Dallam, C. B., Liu, S., and Olson, D. L., Weld. J., 64: 140s, 1985.48. Lathabai, S., and Stout, R. D., Weld. J., 64: 303s, 1985.49. Fleck, N. A., Grong, O., Edwards, G. R., and Matlock, D. K., Weld. J., 65: 113s, 1986.50. Liu, S., and Olson, D. L., Weld. J., 65: 139s, 1986.51. Ito, Y., and Nakanishi, M., Sumitomo Search, 15: 42, 1976.52. Abson, D. J., Dolby, R. E., and Hart, P. M. H., Trend in Steel and Consumables fore
Welding, pp. 75–101, 1978.53. Cochrane, R. C., and Kirkwood, P. R., Trend in Steel and Consumables fore Welding,
pp. 103–121, 1978.54. Bose, W. W., Bowen, P., and Strangwood, M., in Trends in Welding Research, Eds.
H. B. Smartt, J. A. Johnson, and S. A. David, ASM International, Materials Park,OH, June 1995, p. 603.
55. Jackson, C. E., in Weldability of Steels, 3rd. ed., Eds. R. D. Stout and W. D. Doty,Welding Research Council, New York, 1978, p. 48.
56. North, T. H., Bell, H. B., Nowicki, A., and Craig, I., Weld. J., 57: 63s, 1978.57. Siewert, T. A., and Ferree, S. E., Metal Prog., 119: 58, 1981.58. Kim, J. H., Frost, R. H., Olson, D. L., and Blander, M., Weld. J., 69: 446s, 1990.59. Kim, J. H., Frost, R. H., and Olson, D. L., Weld. J., 77: 488s, 1998.
94 CHEMICAL REACTIONS IN WELDING

FURTHER READING
1. Olson, D. L., Liu, S., Frost, R. H., Edwards, G. R., and Fleming, D. A., in ASM Hand-book, Vol. 6: Welding, Brazing and Soldering, ASM International, Materials Park,OH, 1993, p. 55.
2. Gaskell, D. R., Introduction to Metallurgical Thermodynamics, 2nd ed., McGraw-Hill, New York, 1983.
3. Richardson, F. D., Physical Chemistry of Melts in Metallurgy, Vols. 1 and 2.Academic, London, 1974.
PROBLEMS
3.1 Lithium alloys are known to have severe hydrogen porosity problemsdue to the hydration of oxides and formation of hydrides on the work-piece surface. If you were to do GMAW of these alloys using Al–Li wires,can you avoid porosity? If so, how?
3.2 Do you prefer using an oxidizing or reducing flame in gas welding ofhigh-carbon steels? Explain why or why not.
3.3 (a) Will decreasing welding speed help reduce weld porosity in gas–tung-sten arc welds of aluminum if the source of hydrogen is on the work-piece surface?
(b) What about if the source of hydrogen is in the shielding gas? Explainwhy or why not.
3.4 When welding rimmed steels or when doing GMAW of carbon steelsusing CO2 as the shielding gas, Mn- or Si-containing electrodes are usedto prevent gas porosity. Explain why.
3.5 Austenitic stainless steels usually contain very low levels of carbon,around or below 0.05wt %. When welding stainless steels using CO2 asthe shielding gas or covered electrodes containing abundant CaCO3, theweld metal often tends to carburize. Explain why and indicate how toavoid the problem.
3.6 It has been reported that gas–tungsten arc welds of aluminum made inthe overhead position tend to have a significantly higher porosity levelthan those made in the flat position. Explain why.
3.7 The GTAW of pure iron with Ar–5% H2 as the shielding gas showed thatthe weld metal hydrogen content increased with increasing heat inputper unit length of the weld. Explain why.
3.8 Electromagnetic stirring has been reported to reduce hydrogen porosityin aluminum welds. Explain why.
PROBLEMS 95

3.9 A steel container was welded by SAW with a filler wire containing 1.38%Mn and 0.05% Si and a flux containing 11.22% SiO2 and 1.15% MnO. Isthe electrode tip Mn content expected to be greater or smaller than thewire Mn content and why? What about the Si content?
96 CHEMICAL REACTIONS IN WELDING

4 Fluid Flow and MetalEvaporation in Welding
In this chapter fluid flow in both the welding arc and the weld pool will be described. The effect of weld pool fluid flow on the geometry of the resultant weld will be discussed. Evaporation of alloying elements from theweld pool and its effect on the weld metal composition will be presented.Finally, the effect of active fluxes on weld penetration in GTAW will be discussed.
4.1 FLUID FLOW IN ARCS
Figure 4.1 shows a gas–tungsten arc in GTAW with DC electrode negative (1).The shape of the electrode tip is characterized by the tip angle (also calledincluded or vertex angle) and the extent to which the sharp point is removed,that is, the truncation.
4.1.1 Driving Force for Fluid Flow
The welding arc is an ionic gas, that is, a plasma, with an electric current passingthrough. The driving force for fluid flow in the arc is the electromagnetic forceor Lorentz force.The buoyancy force is negligible. Mathematically, the Lorentzforce F = J ¥ B, where J is the current density vector and B is the magneticflux vector. The current density vector J is in the direction the electric currentflows. According to the right-hand rule for the magnetic field, if the thumbpoints in the direction of the current, the magnetic flux vector B is in the direc-tion that the fingers curl around the path of the current. Vectors F, J, and Bare perpendicular to each other. According to the right-hand rule for the elec-tromagnetic force, F is in the direction out of and perpendicular to the palmif the thumb points in the direction of J and the fingers stretch out and pointin the direction of B.
4.1.2 Effect of Electrode Tip Geometry
The welding arc is more or less bell shaped. The tip angle of a tungsten electrode in GTAW is known to have a significant effect on the shape of
97
Welding Metallurgy, Second Edition. Sindo KouCopyright 2003 John Wiley & Sons, Inc.
ISBN: 0-471-43491-4
the arc (Chapter 2)—it tends to become more constricted as the electrode tip changes from sharp to blunt. The change in the shape of the electrode tipchanges fluid flow in the arc plasma, which in turn changes the shape of thearc.
A. Sharp Electrode Consider the case of GTAW with DC electrode nega-tive. The electric current converges from the larger workpiece to the smallerelectrode tip. It tends to be perpendicular to the electrode tip surface and theworkpiece surface, as illustrated in Figure 4.2a. The electric current inducesa magnetic field, and its direction is out of the plane of the paper (as indicatedby the front view of an arrow) on the left and into the paper (as indicated by the rear view of an arrow) on the right. The magnetic field and the con-verging electric current field together produce a downward and inward force F to push the ionic gas along the conical surface of the electrode tip.The downward momentum is strong enough to cause the high-temperature ionic gas to impinge on the workpiece surface and turn outward along the workpiece surface, thus producing a bell-shaped arc, as illustrated in Figure 4.2b.
Fluid flow in welding arcs has been studied by computer simulation (1–6).Tsai and Kou (1) investigated the effect of the electrode tip geometry on heatand fluid flow in GTAW arcs. Figure 4.3 (left) shows the current density dis-tribution in a 2-mm-long, 200-A arc produced by a 3.2-mm-diameter electrode
98 FLUID FLOW AND METAL EVAPORATION IN WELDING
Figure 4.1 Gas–tungsten welding arc. Reprinted from Tsai and Kou (1). Copyright1990 with permission from Elsevier Science.

with a 60° angle tip. The electric current near the electrode tip is essentiallyperpendicular to the surface. The electromagnetic force, shown in Figure 4.3(right), is downward and inward along the conical surface of the electrode tip.As shown in Figure 4.4, this force produces a high-velocity jet of more than200m/s maximum velocity and the jet is deflected radially outward along theworkpiece surface. This deflection of the high-temperature jet causes theisotherms to push outward along the workpiece surface, thus resulting in abell-shaped arc.
FLUID FLOW IN ARCS 99
Tungstenelectrode (-)
Tungstenelectrode (-)
Shieldinggas
Arc
Workpiece (+) Workpiece (+)
(a) (b)
Electriccurrent
F F
Figure 4.2 Arc produced by a tungsten electrode with a sharp tip: (a) Lorentz force(F); (b) fluid flow.
Tungstenelectrode (-)
0.5 mm
1.0 x 10⁸
A/m25.0 x 106
N/m3
0.5 mm
current density Lorentz force
Figure 4.3 Current density field (left) and Lorentz force field (right) in an arc pro-duced by a tungsten electrode with a 60° tip angle. Modified from Tsai and Kou (1).

B. Flat-End Electrode With a flat-end electrode, on the other hand, thereis no longer an electrode tip to act as a fixed cathode spot, where the electriccurrent enters the electrode. Consequently, the cathode spot moves aroundrather randomly and quickly in the flat electrode end. The time-averageddiameter of the area covered by the moving spot can be considered as theeffective cathode spot size. Without a conical surface at the electrode end, theresultant Lorentz force is still inward and downward but the downward com-ponent is reduced, as illustrated in Figure 4.5a. Consequently, the resultant arccan be expected to be more constricted, as shown in Figure 4.5b.
Figure 4.6 (left) shows the current density distribution in a 2-mm-long, 200-A arc produced by a 3.2-mm-diameter electrode with a flat end and a 2.4-mm-diameter cathode spot. The electromagnetic force, shown in Figure 4.6 (right),is less downward pointing than that in the case of a 60° electrode (Figure 4.3).As shown in Figure 4.7, the isotherms are not pushed outward as much andthe resultant arc is thus more constricted.
C. Power Density and Current Density Distributions These distributions atthe anode surface can be measured by the split-anode method (7–10). Figure4.8 shows such distributions for a 100-A, 2.7-mm-long gas–tungsten arc mea-sured by Lu and Kou (10). These distributions are often approximated by thefollowing Gaussian distributions:
100 FLUID FLOW AND METAL EVAPORATION IN WELDING
Tungstenelectrode (-)
0.5 mm
200 m/sec
velocity field and isotherms
Figure 4.4 Velocity and temperature fields in an arc produced by a tungsten electrodewith a 60° tip angle. The isotherms from right to left are 11,000, 13,000, 15,000, 17,000,19,000, and 21,000K. Modified from Tsai and Kou (1).

(4.1)
(4.2)
where q is the power density, Q the power transfer to the workpiece, a theeffective radius of the power density distribution, j the current density, I thewelding current, and b the effective radius of the current density distribution.
jI
brb
=-
ÊËÁ
ˆ¯̃
332
2
2pexp
qQa
ra
=-
ÊËÁ
ˆ¯̃
332
2
2pexp
FLUID FLOW IN ARCS 101
Tungstenelectrode (-)
Tungstenelectrode (-)
Workpiece (+)
F F
Workpiece (+)
Shieldinggas
(a) (b)
Electriccurrent
Figure 4.5 Arc produced by a tungsten electrode with a flat end: (a) Lorentz force(F); (b) fluid flow.
Tungstenelectrode (-)
0.5 mm
5.0 x 10⁷
A/m21.2 x 106
N/m3
current density Lorentz force
0.5 mm
Figure 4.6 Current density field (left) and Lorentz force field (right) in an arc pro-duced by a tungsten electrode with a flat end. Modified from Tsai and Kou (1).

The effective radius represents the location where q or j drops to 5% of itsmaximum value. Equation (4.1) is identical to Equation (2.20).
Lee and Na (6) studied, by computer simulation, the effect of the arc lengthand the electrode tip angle on gas–tungsten arcs. Figure 4.9 shows that boththe power and current density distributions at the anode (workpiece) flattenand widen as the arc length increases.
102 FLUID FLOW AND METAL EVAPORATION IN WELDING
Tungstenelectrode (-)
0.5 mm
200 m/sec
velocity field and isotherms
Figure 4.7 Velocity and temperature fields in an arc produced by a tungsten electrodewith a flat end.The isotherms from right to left are 11,000, 13,000, 15,000, 17,000, 19,000,and 21,000K. Modified from Tsai and Kou (1).
ExperimentGaussianapproximation
ExperimentGaussianapproximation
DC electrode negative100 A, 12 V, Ar2.7 mm arc length2.4 mm electrode50o tip angle
Radius, mmRadius, mm(a) (b)
Cur
rent
den
sity
, am
p/m
m2
Pow
er d
ensi
ty, W
/mm
2
0 2 4 60
10
20
30
0 2 4 60
20
40
60
80
j(r)=17.6e-0.54r2q(r)=65.0e-0.27r2
Figure 4.8 Gas–tungsten welding arc: (a) power density distribution; (b) currentdensity distribution. Reprinted from Lu and Kou (10). Courtesy of American WeldingSociety.

4.2 FLUID FLOW IN WELD POOLS
4.2.1 Driving Forces for Fluid Flow
The driving forces for fluid flow in the weld pool include the buoyancy force,the Lorentz force, the shear stress induced by the surface tension gradient at the weld pool surface, and the shear stress acting on the pool surface by thearc plasma. The arc pressure is another force acting on the pool surface, butits effect on fluid flow is small, especially below 200A (11, 12), which is usuallythe case for GTAW. The driving forces for fluid flow in the weld pool, shownin Figure 4.10, are explained next.
A. Buoyancy Force The density of the liquid metal (r) decreases withincreasing temperature (T). Because the heat source is located above thecenter of the pool surface, the liquid metal is warmer at point a and cooler atpoint b. Point b is near the pool boundary, where the temperature is lowest atthe melting point. As shown in Figure 4.10a, gravity causes the heavier liquid
FLUID FLOW IN WELD POOLS 103
CalculatedMeasured
3.2 mm
6.3 mm
12.7 mm arc length
3.2 mm
6.3 mm
I = 200 A
e = 30o
r-axis along base plate, mm
r-axis along base plate, mm
Hea
t flu
x, W
/mm
2C
urre
nt d
ensi
ty, A
/mm
2
0 1 2 3 4 5 6 7 8 9 10
0 1 2 3 4 5 6 7 8 9 10
0
20
40
60
80
100
0
20
40
60
80
100
I = 200 A
e = 30o
CalculatedMeasured
12.7 mm arc length
(a)
(b)
θ
θ
Figure 4.9 Effect of arc length on gas–tungsten welding arcs: (a) power density dis-tributions; (b) current density distributions. Modified from Lee and Na (6).

metal at point b to sink. Consequently, the liquid metal falls along the poolboundary and rises along the pool axis, as shown in Figure 4.10b.
B. Lorentz Force Gas–tungsten arc welding with DC electrode negative isused as an example for the purpose of discussion. The electric current in theworkpiece converges toward the tungsten electrode (not shown) and hencenear the center of the pool surface.This converging current field, together withthe magnetic field it induces, causes a downward and inward Lorentz force, asshown in Figure 4.10c.As such, the liquid metal is pushed downward along thepool axis and rises along the pool boundary, as shown in Figure 4.10d.The areaon the pool surface where the electric current goes through is called the anodespot (pb2, where b is the effective radius of the current density distribution).
104 FLUID FLOW AND METAL EVAPORATION IN WELDING
Arc Shear Stress
(g) (h)
F F
Surface Tension Force
F F
a bb
(e) (f)
Lorentz Force
electriccurrent
F F
(c) (d)
b
Buoyancy Forcea
(a) (b)T
b a
T
b a
weld pool
base metal
b
F F
γ
ρ
Figure 4.10 Driving forces for weld pool convection: (a, b) buoyancy force; (c, d)Lorentz force; (e, f ) shear stress caused by surface tension gradient; (g, h) shear stresscaused by arc plasma.

The smaller the anode spot, the more the current field converges from theworkpiece (through the weld pool) to the anode spot, and hence the greaterthe Lorentz force becomes to push the liquid metal downward.
C. Shear Stress Induced by Surface Tension Gradient In the absence of asurface-active agent, the surface tension (g) of the liquid metal decreases withincreasing temperature (T), namely, ∂g /∂T < 0. As shown in Figure 4.10e, thewarmer liquid metal with a lower surface tension at point a is pulled outwardby the cooler liquid metal with a higher surface tension at point b. In otherwords, an outward shear stress is induced at the pool surface by the surfacetension gradient along the pool surface. This causes the liquid metal to flowfrom the center of the pool surface to the edge and return below the poolsurface, as shown in Figure 4.10f. Surface-tension-driven convection is alsocalled thermocapillary convection or Marangoni convection.
D. Shear Stress Induced by Plasma Jet The plasma moving outward at highspeeds along a pool surface (Figure 4.4) can exert an outward shear stress atthe pool surface, as shown in Figure 4.10g. This shear stress causes the liquidmetal to flow from the center of the pool surface to the pool edge and returnbelow the pool surface, as shown in Figure 4.10h.
These driving forces are included either in the governing equations or asboundary conditions in the computer modeling of fluid flow in the weld pool(13). Oreper et al. (14) developed the first two-dimensional fluid flow modelfor stationary arc weld pools of known shapes. Kou and Sun (15) developed asimilar model but allowed the unknown pool shape to be calculated. Kou andWang (16–18) developed the first three-dimensional fluid flow model formoving arc and laser weld pools. Numerous computer models have beendeveloped subsequently for fluid flow in weld pools.
4.2.2 Buoyancy Convection
Figure 4.11 shows the buoyancy convection in a stationary weld pool of an alu-minum alloy calculated by Tsai and Kou (19). The liquid metal rises along thepool axis and falls along the pool boundary. The maximum velocity is alongthe pool axis and is only about 2cm/s. The pool surface is slightly above theworkpiece surface because of the expansion of the metal upon heating andmelting.
4.2.3 Forced Convection Driven by Lorentz Force
A. Flow Field Figure 4.12 shows the calculated results of Tsai and Kou (20)for a stationary weld pool in an aluminum alloy. The liquid metal falls alongthe pool axis and rises along the pool boundary (Figure 4.12a). The electriccurrent converges from the workpiece to the center of the pool surface (Figure4.12b).The Lorentz force is inward and downward (Figure 4.12c), thus pushing
FLUID FLOW IN WELD POOLS 105

106 FLUID FLOW AND METAL EVAPORATION IN WELDING
Figure 4.11 Buoyancy convection in aluminum weld pool. From Tsai and Kou (19).
(a)(b)
fluidflow
currentdensity
5 x 10⁵ N/m3
(c)
Lorentzforce
0.4 m/sec
5 x 10⁷ A/m21 mm
Figure 4.12 Convection in an aluminum weld pool caused by Lorentz force: (a) flow field; (b) current density field; (c) Lorentz force field. Modified from Tsai and Kou(20).

the liquid downward along the pool axis.The maximum velocity, about 40cm/s,is one order of magnitude greater than that in the case of buoyancy convec-tion (Figure 4.11). The parameters used for the calculation include 150A forthe welding current, 1800W for the power input, 2mm for the effective radiusof the power density distribution, and 4mm for the effective radius of thecurrent density distribution.
B. Deep Penetration Caused by Lorentz Force The Lorentz force (Figure4.12) makes the weld pool much deeper, as compared to the buoyancy force(Figure 4.11). The liquid pushed downward by the Lorentz force carries heatfrom the heat source to the pool bottom and causes a deep penetration.
C. Physical Simulation of Effect of Lorentz Force Kou and Sun (15) weldedWoods metal (a low-melting-point alloy) with a heated copper rod in contactwith it, as shown in Figure 4.13a. The weld became much deeper when a 75-A current was passed through to the weld pool (no arcing and negligible re-sistance heating), as shown in Figure 4.13b. This confirms the effect of theLorentz force on weld penetration.
4.2.4 Marangoni Convection
A. Heiple’s Model Heiple et al. (21–25) proposed that, when a surface-active agent is present in the liquid metal in a small but significant amount,∂g /∂T can be changed from negative to positive, thus reversing Marangoni con-vection and making the weld pool much deeper. Examples of surface-active
FLUID FLOW IN WELD POOLS 107
Weld
(a)
(b)
Heatedrod
75 Acurrent
Weld
Heatedrod
Woods metal Woods metal
Figure 4.13 Welds in Woods metal produced under the influence of (a) buoyancyforce and (b) Lorentz force. Modified from Kou and Sun (15).

agents in steel and stainless steel are S, O, Se, and Te. Figure 4.14 shows thesurface tension data of two different heats of the stainless steel, one withapproximately 160ppm more sulfur than the other (26). Figure 4.15 shows twoYAG laser welds made in 6.4-mm- (1/4-in.-) thick 304 stainless steel plates at3000W and 3.39mm/s (8 ipm). The plate with the shallower weld containsabout 40ppm sulfur and that with the deeper weld contains about 140ppmsulfur (27).
Heiple’s model is explained in Figure 4.16. In the absence of a surface-activeagent (Figures 4.16a–c), the warmer liquid metal of lower surface tension nearthe center of the pool surface is pulled outward by the cooler liquid metal ofhigher surface tension at the pool edge. In the presence of a surface-activeagent (Figures 4.16d–f ), on the other hand, the cooler liquid metal of lowersurface tension at the edge of the pool surface is pulled inward by the warmerliquid metal of higher surface tension near the center of the pool surface. Theflow pattern in Figure 4.16e favors convective heat transfer from the heatsource to the pool bottom. In other words, the liquid metal carries heat from
108 FLUID FLOW AND METAL EVAPORATION IN WELDING
Sur
face
Ten
sion
(m
N/m
)
1600
1700
1800
1900
2000
1400 1600 1800 2000 2200
Temperature ( oC)
low sulfurstainless steel
high sulfurstainless steel
Figure 4.14 Surface tension data of two different heats of 316 stainless steel, one with160ppm more sulfur than the other. Modified from Heiple and Burgardt (26).
Figure 4.15 YAG laser welds in two 304 stainless steels with (a) 40ppm sulfur and(b) 140ppm sulfur. From Limmaneevichitr and Kou (27).

the heat source to the pool bottom more effectively, thus increasing the weldpenetration.
B. Physical Simulation of Marangoni Convection Limmaneevichitr andKou (28) induced Marangoni convection in a transparent pool of NaNO3 witha defocused CO2 laser beam.The NaNO3 has a ∂g/∂T = -0.056dyn/cm/°C. Sinceits transmission range is from 0.35 to 3 mm, NaNO3 is opaque to CO2 laser (10.6mm wavelength) just like a metal weld pool is opaque to an arc. Figure 4.17
FLUID FLOW IN WELD POOLS 109
(c)(b)
(f)(e)
weldingdirection
distance, l
temperature,T
(a)
(d)
12
12
12
12
1 21
2
l
surf
ace
tens
ion,
su
rfac
e te
nsio
n,
temperature,T
γ
γγγ
Figure 4.16 Heiple’s model for Marangoni convection in a weld pool: (a, b, c) low-sulfur steel; (d, e, f) high-sulfur steel.
Figure 4.17 Marangoni convection with an outward surface flow in a NaNO3 pool.Reprinted from Limmaneevichitr and Kou (28). Courtesy of American WeldingSociety.

shows the flow pattern induced by a CO2 laser beam of 2.5W power and 3.2mm diameter (28). The pool surface is just below the two arrows that indicate the directions of flow at the pool surface. The two counterrotatingcells are, in fact, the two intersections between the donut-shaped flow patternand the meridian plane of the pool. The outward surface flow is much fasterthan the inward return flow, which is typical of Marangoni convection. As the beam diameter is reduced, convection grows stronger and penetratesdeeper.
It is worth noting that in conduction-mode (no-keyholing) laser beamwelding, the pool surface can be concave due to Marangoni convection andsurface tension (29) and, in fact, this has been shown to be the case experi-mentally (30) and by computer simulation (31). The concave NaNO3 poolsurface, however, is just a coincidence; the melt wets the container wall andthe meniscus makes the pool surface concave.
Limmaneevichitr and Kou (32) added C2H5COOK to the NaNO3 pool andreversed the direction of Marangoni convection. The C2H5COOK is a surface-active agent of NaNO3 and, like S reduces the surface tension of liquid steel,it reduces the surface tension of NaNO3, ∂g /∂C being -22dyn/(cm/mol %) (33).The NaNO3 pool shown in Figure 4.18 contains 2mol % of C2H5COOK andits surface flow is inward. This flow reversion is because the surface tension is now higher at the center of the pool surface than at the pool edge. At thecenter of the pool surface, C2H5COOK is lower in concentration because itdecomposes under the heating of the CO2 laser beam.
Blocks of solid NaNO3, both pure and with C2H5COOK, were welded witha defocused CO2 laser beam.As shown in Figure 4.19, the weld in pure NaNO3
is shallow and wide (32). This is because the thermal conductivity of NaNO3
is low and heat transfer is dominated by the outward surface flow to the pool
110 FLUID FLOW AND METAL EVAPORATION IN WELDING
Figure 4.18 Marangoni convection with an inward surface flow in a NaNO3 pool containing 2mol % C2H5COOK as a surface-active agent. Reprinted from Limmaneevitchitr and Kou (32). Courtesy of American Welding Society.

edge. The weld in NaNO3 with 2mol % C2H5COOK is deeper and slightly narrower, which is consistent with the inward surface flow observed duringwelding.
C. Thermodynamic Analysis of Surface Tension Sahoo et al. (34) andMcNallan and DebRoy (35) calculated the surface tension of liquid metalsbased on thermodynamic data. Figure 4.20 shows the surface tension of liquidiron as a function of temperature and the sulfur content (36). For pure Fe,∂g/∂T is negative at all temperatures. For sulfur-containing Fe, however, ∂g /∂Tcan be positive at lower temperatures, which is consistent with the surfacetension measurements by Sundell et al. (37).
Based on the surface tension data in Figure 4.20, Pitscheneder et al. (36)calculated Marangoni convection in stationary steel weld pools. Figure 4.21shows the results for a laser power of 5200W and an irradiation time of 5 s.
FLUID FLOW IN WELD POOLS 111
-3
-2
-1
0
-7 -6 -5 -4 -3 -2 -1 0 1 2 3 4 5 6 7 mm
mm
CO2 laser (12.4 W)
basematerial
weld
: with surface-active agent; : without
Figure 4.19 Laser welds in solid blocks of pure NaNO3 (open circles) and NaNO3 with2mol % C2H5COOK (solid squares). Reprinted from Limmaneevichitr and Kou (32).Courtesy of American Welding Society.
Tem
pera
ture
Coe
ffici
ent o
f
Sur
face
Ten
sion
x 1
04 (N
/mK
)
Percent SulfurTemperature (K)
Sur
face
Ten
sion
(N
/m)
0.02 0.01 0.00
(a)
2.2
1.7
1.2
28202420
20201620 2020 2420 2820
01
-1
3
5
-3
-5
Temperature (K)
(b)
20 ppm
150 ppm
40 ppm
Figure 4.20 Liquid iron with various levels of sulfur: (a) surface tension; (b) tem-perature coefficient of surface tension. Reprinted from Pitscheneder et al. (36).Courtesy of American Welding Society.

For the steel containing only 20ppm sulfur, the outward surface flow carriesheat from the heat source to the pool edge and results in a shallow and widepool (Figure 4.21a). For the steel containing 150ppm sulfur, on the other hand,the inward surface flow turns downward to deliver heat to the pool bottomand results in a much deeper pool (Figure 4.21b). In the small area near thecenterline of the pool surface, the temperature is above 2000K and the surfaceflow is outward because of negative ∂g /∂T (Figure 4.20). It is worth noting thatZacharia et al. (38) showed that computer simulations based on a positive∂g /∂T for liquid steel at all temperatures can overpredict the pool depth.
4.2.5 Forced Convection Driven by Plasma Jet
Matsunawa and Shinichiro (39, 40) demonstrated that the plasma shear stressinduced by a long arc in GTAW can outweigh both the Lorentz force in the
112 FLUID FLOW AND METAL EVAPORATION IN WELDING
Figure 4.21 Convection in stationary laser weld pools of steels with (a) 20ppm sulfurand (b) 150ppm sulfur. Reprinted from Pitscheneder et al. (36). Courtesy of AmericanWelding Society.

weld pool and the surface tension gradients along the pool surface. Figure 4.22shows two series of stationary gas–tungsten arc welds in mild steel with 150,180, and 210s of welding times, one with a 2-mm-long arc and the other witha 8-mm-long arc (39, 40). The 8-mm-arc welds are much wider and shallowerthan the 2-mm-arc welds. For a longer and thus wider arc, the Lorentz forcein the weld pool is smaller because of flatter and wider current density distri-bution at the pool surface (Figure 4.9b). The surface tension gradients are alsosmaller because of the flatter and wider power density distribution (Figure4.9a). However, location of the maximum shear stress shifts outward, thusallowing the shear stress to act on a greater portion of the pool surface.
As shown in Figure 4.23, with a 2-mm-arc length the gas–tungsten arc weldis much deeper in the 304 stainless steel containing 77ppm sulfur (39, 40). This
FLUID FLOW IN WELD POOLS 113
150 s
180 s
210 s
5 0 5 mm
2 mm arc length 8 mm arc length
5 0 5 mm
Figure 4.22 Stationary gas–tungsten arc welds in a mild steel made with a 2-mm arc(left) and an 8-mm arc (right) for 150, 180, and 210s. Modified from Matsunawa et al.(39).
S: 18 ppm S: 77 ppm
(a)
(b)
S: 18 ppm S: 77 ppm
2 mm arc length
5 mm
8 mm arc length
0< 0∂σ ∂Τ ∂σ ∂Τ =
Figure 4.23 Stationary GTA welds in 304 stainless steels with 18ppm sulfur and 77ppm sulfur made with an arc length of (a) 2mm and (b) 8mm. Modified from Matsunawa et al. (39).

is expected because sulfur makes ∂g/∂T either less negative or even positive.With a longer arc of 8mm, however, the welds are shallow regardless of thesulfur level. This further demonstrates that forced convection driven by thearc plasma dominates in the welds made with the 8-mm-long arc.
4.2.6 Effect of Turbulence
Choo and Szekely (41) first considered turbulence in gas–tungsten arc weldpools and showed that turbulence can affect the pool depth significantly.Hong et al. (42) demonstrated that a fluid flow model based on laminar can over-predict the pool depth, as shown in Figure 4.24a for a GTA weld in a 304 stainless steel. When turbulence is considered, however, the effec-tive viscosity increases (meff > m) and convection slows down. Furthermore,the effective thermal conductivity (keff > k) increases and the effect of con-vection on the pool shape thus decreases. Consequently, the calculated pool depth decreases and agrees better with the observed one, as shown in Figure 4.24b.
4.3 METAL EVAPORATION
4.3.1 Loss of Alloying Elements
Due to the intense heating of pool surface, evaporation from the weld poolcan be significant with some alloying elements. Evaporation-induced Mg losses
114 FLUID FLOW AND METAL EVAPORATION IN WELDING
Figure 4.24 Weld pool shapes and isotherms in a 304 stainless steel with 50ppm sul-fur calculated based on (a) laminar flow and (b) turbulent flow. Reprinted from Honget al. (42).
(a)
(b)

from laser welds of aluminum alloys have been reported (43–45), and Figure4.25 is an example (45). Since Al–Mg alloys are solution strengthened by alloy-ing with Mg, Mg loss can result in substantial reduction in the tensile strengthof the weld metal. Similarly, Figure 4.26 shows evaporation-induced Mn lossesin laser welds of stainless steels (46).
Figure 4.27 shows the vapor pressure of several metals (47). It is clear thatMg has a much higher vapor pressure than Al at any temperature; that is, Mghas a greater tendency to evaporate than Al.This explains Mg losses from laserwelds of aluminum alloys. It is also clear that Mn has a much higher vaporpressure than Fe, which explains Mn losses from laser welds of stainless steels.The Langmuir equation has been used to predict the evaporation rate of metalfrom the weld pool surface (47). However, according to DebRoy et al. (48–51),it can overpredict by a factor of 10 or more.
4.3.2 Explosion of Metal Droplets
Evaporation can also occur as metal droplets transfer from the filler wire tothe weld pool through the arc, considering the very high temperature of the
METAL EVAPORATION 115
Figure 4.25 Magnesium loss in a laser weld of an Al–Mg alloy. Reprinted from Pastoret al. (45). Courtesy of American Welding Society.

arc. Unstable metal transfer has been reported in GMAW with Al–Mg and Al–Mg–Zn filler wires (52). In fact, high-speed photography revealed in-flight explosions of metal droplets, resulting in much spattering. Figure 4.27 shows that Zn has an even higher vapor pressure than Mg. Obviously,the high vapor pressures of Mg and Zn are likely to have contributed to theexplosions.
4.4 ACTIVE FLUX GTAW
The use of fluxes in GTAW has been found to dramatically increase weld penetration in steels and stainless steels (53–58). The flux usually consists ofoxides and halides, and it is mixed with acetone or the like to form a paste and
116 FLUID FLOW AND METAL EVAPORATION IN WELDING
AISI 202AISI 201
USSTENELON
WELD ZONEBASE METAL
Horizontal Distance (mm)
Wei
ght %
Mn
0 0.4 0.8 1.2 1.63
4
5
6
7
15
16
17
1.8
Figure 4.26 Manganese losses in laser welds of stainless steels. Reprinted fromDebRoy (46).
Zn
Mg
LiMn
Al
800 1000 1200 1400 1600 1800 2000Temperature (K)
Vap
or p
ress
ure
(mm
Hg) 1x10²
1x100
1x10⁻²
1x10⁻⁴
1x10⁻⁶
1x10⁻⁸
Fe
Figure 4.27 Vapor pressure of several metals as a function of temperature.

painted as a thin coating over the area to be welded. Figure 4.28 shows gas–tungsten arc welds made, without and with a flux, in a 6-mm-thick 316L stain-less steel containing low S (0.005wt %) (56).
Howse and Lucus (56) observed that the arc becomes more constrictedwhen a flux is used. Consequently, they proposed that the deeper penetrationis caused by arc constriction and the vaporized flux constricts the arc by cap-turing electrons in the cooler outer region of the arc. For the same weldingcurrent, the more the arc is constricted, the smaller the area (pb2, where b isthe effective radius of the current density distribution) on the pool surface towhich the current field converges from the workpiece (through the weld pool),and hence the greater the Lorentz force (F in Figure 4.10c) and deeper penetration.
Tanaka et al. (57), however, proposed that the inward surface flow in thepresence of the oxygen from the oxide-containing flux causes the deeper penetration. They gas–tungsten arc welded a 304 stainless steel containinglittle (0.002wt %) S, with He for shielding and TiO2 as the flux (TiO2 is a mainingredient in several commercial fluxes). They observed both an inwardsurface flow and a significant decrease in the surface tension when the flux isused. As mentioned previously, ∂g/∂T can become positive and cause inwardsurface flow in the presence of a surface-active agent such as oxygen. Theyobserved a steep temperature gradient across the pool surface caused by theinward surface flow. Spectroscopic analysis of the arc showed that the blueluminous plasma appears to be mainly composed of metal vapor (Cr, Fe, etc.)from the weld pool. The steeper temperature gradient across the smaller poolsurface suggests a more localized metal evaporation and hence a more con-stricted arc, which also help increase the penetration.
REFERENCES
1. Tsai, M. C., and Kou, S., Int. J. Heat Mass Transfer, 33: 2089, 1990.2. Ushio, M., and Matsuda, F., Trans. JWM, 11: 7, 1982.
REFERENCES 117
Figure 4.28 Gas–tungsten arc welds of 6-mm-thick 316L stainless steel: (a) without aflux; (b) with a flux. Reprinted from Howse and Lucas (56).
3. Ushio, M., and Matsuda, F., J. Jpn. Weld. Soc., 6: 91, 1988.4. McKelliget, J., and Szekely, J., Metall. Trans. A, 17A: 1139, 1986.5. Choo, R. T. C., Szekely, J., and Westhoff, R. C., Weld. J., 69: 346, 1990.6. Lee, S.-Y., and Na, S.-J., Weld. J., 75: 269, 1996.7. Nestor, O. H., J. Appl. Phys., 33: 1638 (1962).8. Schoeck, P. A., in Modern Developments in Heat Transfer, Ed. W. Ibele, Academic,
New York, 1963, p. 353.9. Tsai, N., Ph.D. Thesis, MIT, Cambridge, MA, 1983.
10. Lu, M., and Kou, S., Weld. J., 67: 29s, 1988.11. Lawson, W. H. S., and Kerr, H. W., Welding Research International, Vol. 6, p. 1, 1976.12. Lin, M. L., and Eagar, T. W., Weld. J., 64: 63s, 985.13. Kou, S., Transport Phenomena in Materials Processing, Wiley, New York, 1996, pp.
3–115.14. Oreper, G. M., Eagar, T. W., and Szekely, J., Weld. J., 62: 307s, 1983.15. Kou, S., and Sun, D. K., Metall. Trans., 16A: 203, 1985.16. Kou, S., and Wang, Y. H., Weld. J., 65: 63s, 1986.17. Kou, S., and Wang, Y. H., Metall. Trans., 17A: 2265, 1986.18. Kou, S., and Wang, Y. H., Metall. Trans., 17A: 2271, 1986.19. Tsai, M. C., and Kou, S., Numerical Heat Transfer, 17A: 73, 1990.20. Tsai, M. C., and Kou, S., Weld. J., 69: 241s, 1990.21. Heiple, C. R., and Roper, J. R., Weld. J., 61: 97s, 1982.22. Heiple, C. R., and Roper, J. R., in Trends in Welding Research in the United States,
Ed. S. A. David, American Society for Metals, Metals Park, OH, 1982, pp. 489–520.
23. Heiple, C. R., Roper, J. R., Stagner, R. T., and Aden, R. J., Weld. J., 62: 72s, 1983.24. Heiple, C. R., Burgardt, P., and Roper, J. R., in Modeling of Casting and Welding
Processes, Vol. 2, Eds. J. A. Dantzig and J. T. Berry, TMS-AIME, Warrendale, PA,1984, pp. 193–205.
25. Heiple, C. R., and Burgardt, P., Weld. J., 64: 159s, 1985.26. Keene, B. J., Mills, K. C., and Brooks, R. F., Mater. Sci. Technol., 1: 568–571, 1985;
Heiple, C. R., and Burgardt, P., ASM Handbook, Vol. 6: Welding, Brazing and Soldering, ASM International, Materials Park, OH, 1993, p. 19.
27. Limmaneevichitr, C., and Kou, S., unpublished research, University of Wisconsin,Madison, WI, 2000.
28. Limmaneevichitr, C., and Kou, S., Weld. J., 79: 126s, 2000.29. Duley, W. W., Laser Welding, Wiley, New York, 1999, p. 76.30. Mazumder, J., and Voekel, D., in Laser Advanced Materials Processing—Science
and Applications, Vol. 1, Eds. A. Matsunawa and S. Katayama, High TemperatureSociety of Japan, Osaka, Japan, 1992, pp. 373–380.
31. Tsai, M. C., and Kou, S., Internal J. Numerical Methods Fluids, 9: 1503, 1989.32. Limmaneevichitr, C., and Kou, S., Weld. J., 79: 324s, 2000.33. Smechenko, V. K., and Shikobalova, L. P., Zh. Fiz. Khim., 21: 613, 1947.
118 FLUID FLOW AND METAL EVAPORATION IN WELDING

34. Sahoo, P., DebRoy, T., and McNallan, M. J., Metall. Trans. B., 19B: 483–491, 1988.35. McNallan, M. J., and DebRoy, T., Metall. Trans. B, 22B: 557–560, 1991.36. Pitscheneder,W., DebRoy,T., Mundra, K., and Ebner, R., Weld. J., 75: 71s–80s, 1996.37. Sundell, R. E., Correa, S. M., Harris, L. P., Solomon, H. D., and Wojcik, L.A., Report
86SRD013, General Electric Company, Schenectady, NY, December 1986.38. Zacharia, T., David, S. A., Vitek, J. M., and DebRoy, T., Weld. J., 68: 510s–519s, 1989.39. Matsunawa, A., and Shinichiro, Y., in Recent Trends in Welding Science and Tech-
nology, Eds. S. A. David and J. M. Vitek, ASM International, Materials Park, OH,1990, pp. 31–35.
40. Matsunawa, A., in International Trends in Welding Science and Technology, Eds.S.A. David and J. M.Vitek,ASM International, Materials Park, OH, 1993, pp. 3–16.
41. Choo, R. T. C., and Szekely, J., Weld. J., 73: 25s, 1994.42. Hong, K., Weckman, D. C., Strong, A. B., and Zheng, W., Science and Technology of
Welding and Joining, in press; Weckman, D. C., in Trends in Welding Research, Eds.J. M. Vitek, S. A. David, J. A. Johnson, H. S. Smartt, and T. DebRoy, ASM Interna-tional, Materials Park, OH, p. 3, 1999.
43. Moon, D. W., and Metzbower, E. A., Weld. J., 62: 53s, 1983.44. Cieslak, M. J., and Fuerschbach, P. W., Metall. Trans., 19B: 319, 1988.45. Pastor, M., Zhaq, H., Martukanitz, R. P., and Debroy, T., Weld. J, 78: 207s, 1999.46. DebRoy, T., in International Trends in Welding Science and Technology, Eds. S. A.
David and J. M. Vitek, ASM International, Materials Park, OH, 1993, p. 18.47. Block-Bolten, A., and Eagar, T. W., Metall. Trans., 15B: 461, 1984.48. Mundra, K., and DebRoy, T., Weld. J., 72: 1s, 1991.49. Mundra, K., and DebRoy, T., Metall. Trans., 24B: 146, 1993.50. Yang, Z., and DebRoy, T., Metall. Trans., 30B: 483, 1999.51. Zhao, H., and DebRoy, T., Metall. Trans., 32B: 163, 2001.52. Woods, R. A., Weld. J., 59: 59s, 1980.53. Gurevich, S. M., Zamkov, V. N., and Kushnirenko, N. A., Avtomat Svarka, Automat.
Weld., 9: 1, 1965.54. Gurevich, S. M., and Zamkov, V. N., Automat. Weld., 12: 13, 1966.55. Paskell, T., Lundin, C., and Castner, H., Weld, J., 76: 57, 1997.56. Howse, D. S., and Lucas, W., Sci. Technol. Weld. Join., 5: 189, 2000.57. Tanaka, M., Shimizu, T., Terasaki, H., Ushio, M., Koshi-ishi, F., and Yang, C.-L., Sci.
Technol. Weld. Join., 5: 397, 2000.58. Kuo, M., Sun, Z., and Pan, D., Sci. Technol. Weld. Join., 6: 17, 2001.
FURTHER READING
1. Szekely, J., Fluid Flow Phenomena in Metals Processing, Academic, New York, 1979.2. Kou, S., Transport Phenomena and Materials Processing, Wiley, New York, 1996.3. Lancaster, J. F., The Physics of Welding, Pergamon, Oxford, 1984.
FURTHER READING 119

120 FLUID FLOW AND METAL EVAPORATION IN WELDING
PROBLEMS
4.1 Experimental results show that the depth–width ratio of stainless steelwelds increases with increasing electrode tip angle. How does the angleaffect the effective radius of the electric current at the pool surface (theanode spot)? How does this radius in turn affect weld pool convectionand the weld depth–width ratio?
4.2 Experimental results show that the depth–width ratio of stainless steelwelds decreases with increasing arc length. Explain why.
4.3 It has been suggested that the weldability of stainless steels can beimproved by oxidizing the surface by subjecting it to an elevated tem-perature in an oxidizing environment. From the penetration point ofview, do you agree or disagree, and why?
4.4 Two heats of a stainless steel with the same nominal composition butsignificantly different sulfur contents are butt welded by autogenousGTAW. Which side of the weld is deeper and why?
4.5 Two GTA welds of the same 304 stainless steel were made, one with ashielding gas of Ar and the other with Ar plus 700ppm SO2 gas. Whichweld was deeper and why?
4.6 Consider Marangoni convection in a simulated weld pool of NaNO3
such as that shown in Figure 4.17.As the laser beam diameter is reducedat the same power from 5.9 to 1.5mm, does Marangoni convection inthe pool become faster or slower and why?
4.7 In electron beam welding with the surface melting mode, which drivingforce for flow is expected to dominate?
4.8 In conduction-mode laser beam welding of a 201 stainless steel sheet7mm thick, the welding speed was 3mm/s. The power was increasedfrom 400 to 600W. It was found that: (a) the Mn evaporation rateincreased, (b) the weld pool grew significantly larger in volume, and (c)the Mn concentration decrease in the resultant weld metal decreased.The Mn concentration was uniform in the resultant weld metal. Explain(c) based on (a) and (b).
4.9 (a) Name the four different driving forces for weld pool convection.
(b) In GMAW with spray metal transfer, is there an additional drivingforce for weld pool convection besides the four in (a)? If so,explain what it is and sketch the flow pattern in the pool causedby this force alone.
4.10 Paraffin has been used to study weld pool Marangoni convection. Thesurface tension of molten paraffin decreases with increasing tempera-ture, and convection is dominated by the surface tension effect. A thin

slice of paraffin is sandwiched between two pieces of glass, and its topsurface is in contact with the tips of two hot soldering irons to producea weld pool that penetrates downward into the thin slice, as shown inFigure P4.10. Sketch and explain the flow pattern and the shape of thepool.
PROBLEMS 121
Figure P4.10

5 Residual Stresses, Distortion,and Fatigue
In this chapter the causes of residual stresses, distortion, and fatigue failure inweldments will be discussed, and the remedies will be described.
5.1 RESIDUAL STRESSES
Residual stresses are stresses that would exist in a body if all external loadswere removed. They are sometimes called internal stresses. Residual stressesthat exist in a body that has previously been subjected to nonuniform tem-perature changes, such as those during welding, are often called thermalstresses (1).
5.1.1 Development of Residual Stresses
A. Three-Bar Arrangement The development of residual stresses can beexplained by considering heating and cooling under constraint (2). Figure 5.1shows three identical metal bars connected to two rigid blocks. All three barsare initially at room temperature. The middle bar alone is heated up, but itsthermal expansion is restrained by the side bars (Figure 5.1a). Consequently,compressive stresses are produced in the middle bar, and they increase withincreasing temperature until the yield stress in compression is reached. Theyield stress represents the upper limit of stresses in a material, at which plasticdeformation occurs. When heating stops and the middle bar is allowed to cooloff, its thermal contraction is restrained by the side bars (Figure 5.1b). Con-sequently, the compressive stresses in the middle bar drop rapidly, change totensile stresses, and increase with decreasing temperature until the yield stressin tension is reached. Therefore, a residual tensile stress equal to the yieldstress at room temperature is set up in the middle bar when it cools down toroom temperature. The residual stresses in the side bars are compressivestresses and equal to one-half of the tensile stress in the middle bar.
B. Welding Roughly speaking, the weld metal and the adjacent base metalare analogous to the middle bar, and the areas farther away from the weldmetal are analogous to the two side bars (Figure 5.1c). This is because the
122
Welding Metallurgy, Second Edition. Sindo KouCopyright 2003 John Wiley & Sons, Inc.
ISBN: 0-471-43491-4

expansion and contraction of the weld metal and the adjacent base metal arerestrained by the areas farther away from the weld metal. Consequently, aftercooling to the room temperature, residual tensile stresses exist in the weldmetal and the adjacent base metal, while residual compressive stresses existin the areas farther away from the weld metal. Further explanations are givenas follows.
Figure 5.2 is a schematic representation of the temperature change (DT)and stress in the welding direction (sx) during welding (2). The crosshatchedarea M–M¢ is the region where plastic deformation occurs. Section A–A isahead of the heat source and is not yet significantly affected by the heat input;the temperature change due to welding, DT, is essentially zero. Along sectionB–B intersecting the heat source, the temperature distribution is rather steep.Along section C–C at some distance behind the heat source, the temperaturedistribution becomes less steep and is eventually uniform along section D–Dfar away behind the heat source.
Consider now the thermally induced stress along the longitudinal direction,sx. Since section A–A is not affected by the heat input, sx is zero.Along sectionB–B, sx is close to zero in the region underneath the heat source, since theweld pool does not have any strength to support any loads. In the regionssomewhat away from the heat source, stresses are compressive (sx is negative)because the expansion of these areas is restrained by the surrounding metalof lower temperatures. Due to the low yield strength of the high-temperaturemetal in these areas, sx reaches the yield strength of the base metal at
RESIDUAL STRESSES 123
middle bar: heated,in compression
side bars in tension
afterheatingstops
middle bar: cooled, in tensionresidual tensile stresses
side bars: residualcompressive stresses
weld metal and adjacent base metal:residual tensile stresses
areas farther away from weld metal:residual compressive stresses
(a) (b)
(c)
Figure 5.1 Thermally induced stresses: (a) during heating; (b) during cooling;(c) residual stresses in weld.

corresponding temperatures. In the areas farther away from the weld sx istensile, and sx is balanced with compressive stresses in areas near the weld.
Along section C–C the weld metal and the adjacent base metal have cooledand hence have a tendency to contract, thus producing tensile stresses (sx ispositive). In the nearby areas sx is compressive. Finally, along section D–D theweld metal and the adjacent base metal have cooled and contracted further,thus producing higher tensile stresses in regions near the weld and compres-sive stresses in regions away from the weld. Since section D–D is well behindthe heat source, the stress distribution does not change significantly beyond it,and this stress distribution is thus the residual stress distribution.
5.1.2 Analysis of Residual Stresses
Figure 5.3 shows typical distributions of residual stresses in a butt weld.According to Masubuchi and Martin (3), the distribution of the longitudinalresidual stress sx can be approximated by the equation
(5.1)s sx yyb
yb
( ) = - ÊË
ˆ¯
È
ÎÍ
˘
˚˙ - Ê
ˈ¯
È
ÎÍ
˘
˚˙m 1
12
2 2
exp
124 RESIDUAL STRESSES, DISTORTION, AND FATIGUE
Figure 5.2 Changes in temperature and stresses during welding. Reprinted fromWelding Handbook (2). Courtesy of American Welding Society.

where sm is the maximum residual stress, which is usually as high as the yieldstrength of the weld metal. The parameter b is the width of the tension zoneof sx (Figure 5.3a).
The distribution of the transverse residual stress sy along the length of theweld is shown in Figure 5.3b. As shown, tensile stresses of relatively low mag-nitude are produced in the middle part of the weld, where thermal contrac-tion in the transverse direction is restrained by the much cooler base metalfarther away from the weld. The tensile stresses in the middle part of the weldare balanced by compressive stresses at the ends of the weld. If the lateral con-traction of the joint is restrained by an external constraint (such as a fixtureholding down the two sides of the workpiece), approximately uniform tensilestresses are added along the weld as the reaction stress (1). This external con-straint, however, has little effect on sx.
Figure 5.4 shows measured and calculated distributions of residual stressessx in a butt joint of two rectangular plates of 5083 aluminum (60cm long, 27.5cm wide, and 1cm thick) welded by GMAW (4). The calculated results arebased on the finite-element analysis (FEA), and the measured results are fromSatoh and Terasaki (5). The measurement and calculation of weld residualstresses have been described in detail by Masubuchi (1) and will not berepeated here. Residual stresses can cause problems such as hydrogen-inducedcracking (Chapter 17) and stress corrosion cracking (Chapter 18). Postweldheat treatment is often used to reduce residual stresses. Figure 5.5 shows theeffect of temperature and time on stress relief in steel welds (2). Table 5.1 listthe temperature ranges used for postweld heat treatment of various types ofmaterials (2). Other techniques such as preheat, peening, and vibration havealso been used for stress relief.
RESIDUAL STRESSES 125
weld
in te
nsio
nin
com
pres
sion
basemetal
(a)
weld
basemetal
in tension in compression
(b)
x
x
y
yb
with externalconstraint
σ
σ
Figure 5.3 Typical distributions of longitudinal (sx) and transverse (sy) residualstresses in butt weld. Modified from Welding Handbook (2).
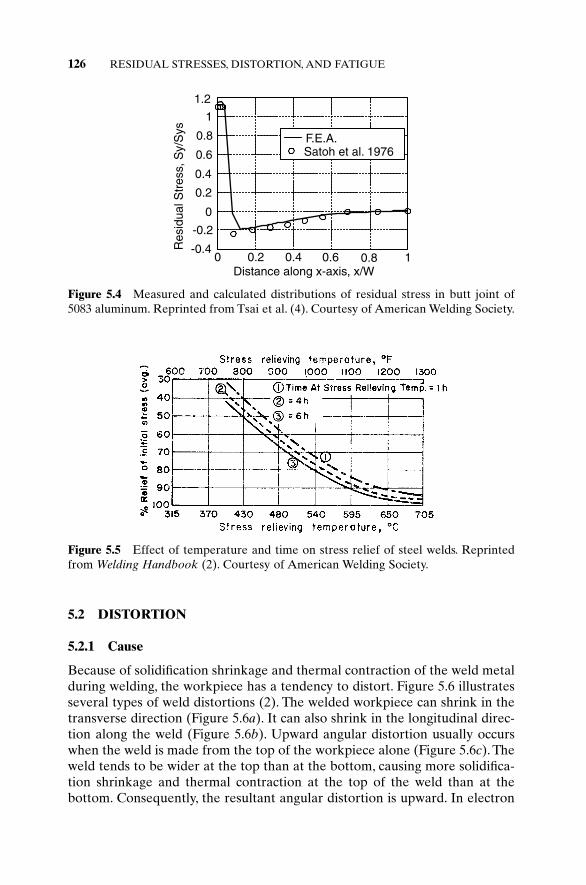
5.2 DISTORTION
5.2.1 Cause
Because of solidification shrinkage and thermal contraction of the weld metalduring welding, the workpiece has a tendency to distort. Figure 5.6 illustratesseveral types of weld distortions (2). The welded workpiece can shrink in thetransverse direction (Figure 5.6a). It can also shrink in the longitudinal direc-tion along the weld (Figure 5.6b). Upward angular distortion usually occurswhen the weld is made from the top of the workpiece alone (Figure 5.6c). Theweld tends to be wider at the top than at the bottom, causing more solidifica-tion shrinkage and thermal contraction at the top of the weld than at thebottom. Consequently, the resultant angular distortion is upward. In electron
126 RESIDUAL STRESSES, DISTORTION, AND FATIGUE
F.E.A.Satoh et al. 1976
0 0.2 0.4 0.6 0.8 1
0.2
0.4
0.6
0.8
1
1.2
0
-0.2
-0.4
Distance along x-axis, x/W
Res
idua
l Str
ess,
Sy/
Sys
Figure 5.4 Measured and calculated distributions of residual stress in butt joint of5083 aluminum. Reprinted from Tsai et al. (4). Courtesy of American Welding Society.
Figure 5.5 Effect of temperature and time on stress relief of steel welds. Reprintedfrom Welding Handbook (2). Courtesy of American Welding Society.

beam welding with a deep narrow keyhole, the weld is very narrow both atthe top and the bottom, and there is little angular distortion. When fillet weldsbetween a flat sheet at the bottom and a vertical sheet on the top shrink, theypull the flat sheet toward the vertical one and cause upward distortion in the
DISTORTION 127
TABLE 5.1 Typical Thermal Treatments for StressRelieving Weldments
SoakingMaterial Temperature (°C)
Carbon steel 595–680Carbon–1/2% Mo steel 595–7201/2% Cr–1/2% Mo steel 595–7201% Cr–1/2% Mo steel 620–73011/4% Cr–1/2% Mo steel 705–7602% Cr–1/2% Mo steel 705–76021/4% Cr–1% Mo steel 705–7705% Cr–1/2% Mo (Type 502) steel 705–7707% Cr–1/2% Mo steel 705–7609% Cr–1% Mo steel 705–76012% Cr (Type 410) steel 760–81516% Cr (Type 430) steel 760–81511/4% Mn–1/2% Mo steel 605–680Low-alloy Cr–Ni–Mo steels 595–6802–5% Ni steels 595–6509% Ni steels 550–585Quenched and tempered steels 540–550
Source: Welding Handbook (2).
(a) Transverse shrinkagein butt weld
(b) Longitudinalshrinkage in butt weld
(c) Angular distortionin butt weld
(d) Angular distortionin fillet welds
Figure 5.6 Distortion in welded structures. Modified from Welding Handbook (2).
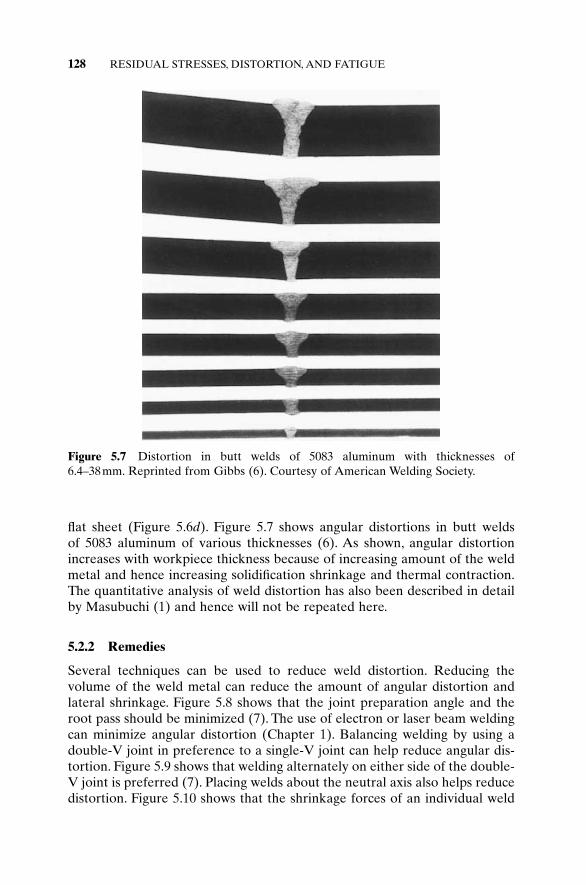
flat sheet (Figure 5.6d). Figure 5.7 shows angular distortions in butt welds of 5083 aluminum of various thicknesses (6). As shown, angular distortionincreases with workpiece thickness because of increasing amount of the weldmetal and hence increasing solidification shrinkage and thermal contraction.The quantitative analysis of weld distortion has also been described in detailby Masubuchi (1) and hence will not be repeated here.
5.2.2 Remedies
Several techniques can be used to reduce weld distortion. Reducing thevolume of the weld metal can reduce the amount of angular distortion andlateral shrinkage. Figure 5.8 shows that the joint preparation angle and theroot pass should be minimized (7). The use of electron or laser beam weldingcan minimize angular distortion (Chapter 1). Balancing welding by using adouble-V joint in preference to a single-V joint can help reduce angular dis-tortion. Figure 5.9 shows that welding alternately on either side of the double-V joint is preferred (7). Placing welds about the neutral axis also helps reducedistortion. Figure 5.10 shows that the shrinkage forces of an individual weld
128 RESIDUAL STRESSES, DISTORTION, AND FATIGUE
Figure 5.7 Distortion in butt welds of 5083 aluminum with thicknesses of 6.4–38mm. Reprinted from Gibbs (6). Courtesy of American Welding Society.

DISTORTION 129
larger angle
smaller angle
no angle
more distortion
less distortion
little distortion
Figure 5.8 Reducing angular distortion by reducing volume of weld metal and byusing single-pass deep-penetration welding. Modified from TWI (7).
one sidewelded first
alternatingwelding
moredistortion
lessdistortion
before welding
Figure 5.9 Reducing angular distortion by using double-V joint and welding alternately on either side of joint. Modified from TWI (7).
Neutralaxis
Neutralaxis
moredistortion
lessdistortion
Figure 5.10 Reducing distortion by placing welds around neutral axis. Modified fromTWI (7).
(a) (b)

can be balanced by placing another weld on the opposite side of the neutralaxis (7). Figure 5.11 shows three other techniques to reduce weld distortion(2, 8). Presetting (Figure 5.11a) is achieved by estimating the amount of distortion likely to occur during welding and then assembling the job withmembers preset to compensate for the distortion. Elastic prespringing (Figure5.11b) can reduce angular changes after the removal of the restraint. Pre-heating (Figure 5.11c), thermal management during welding, and postweldheating can also reduce angular distortion (4).
130 RESIDUAL STRESSES, DISTORTION, AND FATIGUE
Figure 5.11 Methods for controlling weld distortion: (a) presetting; (b) prespringing;(c) preheating (8). (a), (b) Reprinted from Welding Handbook (2). Courtesy of American Welding Society.

5.3 FATIGUE
5.3.1 Mechanism
Failure can occur in welds under repeated loading (9, 10). This type of failure,called fatigue, has three phases: crack initiation, crack propagation, and frac-ture. Figure 5.12 shows a simple type of fatigue stress cycling and how it canresult in the formation of intrusions and extrusions at the surface of a mater-ial along the slip planes (10). A discontinuity point in the material (e.g., inclu-sions, porosity) can serve as the source for a slip to initiate. Figure 5.13 showsa series of intrusions and extrusions at the free surfaces due to the alternat-ing placement of metal along slip planes (10). Eventually, these intrusions andextrusions become severe enough and initial cracks form along slip planes.The
FATIGUE 131
3 421
source
tensileforce
compressiveforce
tensileforce
compressiveforce
intrusion intrusion
extrusion
slipplane
Time0
max
min
Stress
1
2
3
4
cyclic loading
σ
σ
Figure 5.12 Fatigue stress cycling (top) and formation of intrusions and extrusions(bottom).
Figure 5.13 Fatigue surface showing extrusions and intrusions. From Hull (10).

direction of crack propagation is along the slip plane at the beginning and thenbecomes macroscopically normal to the maximum tensile stress (11).
5.3.2 Fractography
As pointed out by Colangelo and Heiser (11), the appearance of fatigue fail-ures is often described as brittle because of the little gross plastic deformationand the fairly smooth fracture surfaces. Fatigue failures are usually easy to dis-tinguish from other brittle failures because they are progressive and they leavecharacteristic marks. Macroscopically, they appear as “beach,” “clam-shell,” or“conchoidal” marks, which represent delays in the fatigue loading cycle. Figure5.14 shows a fatigue fracture surface, where the arrow indicates the origin offracture (12).
5.3.3 S–N Curves
Fatigue data are often presented in the form of S–N curves, where the appliedstress (S) is plotted against number of cycles to failure (N). As the appliedstress decreases, the number of cycles to failure increases. There are manyfactors (13) that affect the fatigue behavior, such as material properties, jointconfiguration, stress ratio, welding procedure, postweld treatment, loadingcondition, residual stresses, and weld reinforcement geometry. Figures5.15–5.17 show the effect of some of these factors observed by Sanders andDay (14) in aluminum welds.
132 RESIDUAL STRESSES, DISTORTION, AND FATIGUE
Figure 5.14 Fatigue fracture surface showing beach marks and origin of fracture.Reprinted, with permission, from Wulpi (12).

FATIGUE 133
As welded transverse square butt joint
Number of kilocycles
Log
max
imum
str
ess
- K
si
Log
max
imum
str
ess
- M
Pa
1 10 100 1,000 10,000 100,000
10
5
50
100500
100
50
10
5456-H116
5052-H326061-T6
5056-O
1
Figure 5.15 Effect of alloy and material properties on fatigue of transverse butt joint.Modified from Sanders and Day (14).
Log
max
imum
str
ess
- K
si
Log
max
imum
str
ess
- M
Pa
Number of kilocycles
As welded5083-O S.R. =0
Cruciform
Double transverse strap
Transverse attachment
Transversebutt weldLongitudinal butt weld
10 1,000 10,000 100,000
10
5
50
100
1
500
100
50
10
Cruciform
Double transverse strap
Transverse attachment
Transverse butt weld
Longitudinal butt weld
Figure 5.16 Effect of joint configurations on fatigue of 5083–O aluminum. Modifiedfrom Sanders and Day (14).

5.3.4 Effect of Joint Geometry
As pointed out by Sanders and Day (14), in developing any fatigue behaviorcriteria for welding, the severity of joint geometry is probably the most criti-cal factor. The more severe the geometry, the lower the fatigue strength, asshown in Figure 5.16. The severity level of the longitudinal butt weld is lowestbecause both the weld and the base metal carry the load. The severity level ofthe cruciform, on the other hand, is highest since the welds alone carry theload and the parts are joined perpendicular to each other.
5.3.5 Effect of Stress Raisers
It is well known that stress raisers tend to reduce fatigue life, namely, the so-called notch effect. Stress raisers can be mechanical, such as toes with a highreinforcement, lack of penetration, and deep undercuts. They can also be met-allurgical, such as microfissures (microcracks), porosity, inclusions, and brittleand sharp intermetallic compounds. Figure 5.18 shows a fatigue crack origi-nating from the toe (Chapter 1) of a gas–metal arc weld of a carbon steel (15).Figure 5.19 shows a fatigue failure originating from an undercut at the top ofan electron beam weld in a carbon steel and how undercutting can reducefatigue life (16).
5.3.6 Effect of Corrosion
As also shown in Figure 5.17, a corrosive environment (salt water in this case)can often reduce fatigue life (14). This is called corrosion fatigue (17, 18). Ithas been reported that the damage can be almost always greater than the sumof the damage by corrosion and fatigue acting separately.
134 RESIDUAL STRESSES, DISTORTION, AND FATIGUE
Transverse butt weld 5456-H117S.R. = -1.0
Number of kilocycles
Log
max
imum
str
ess
- K
si
Log
max
imum
str
ess
- M
Pa
10 100 1,000 10,000
10
5
50
100500
100
50
101
Reinforcement removed;
tested in salt waterAs weldedTested in salt water
Figure 5.17 Effect of reinforcement removal and saltwater environment on fatigue of5456-H117 aluminum. Modified from Sanders and Day (14).

5.3.7 Remedies
A. Shot Peening Welding and postweld grinding can create tensile residualstresses at the weld surface and promote fatigue initiation when under cyclicloading. Shot and hammer peening, on the other hand, can introduce surfacecompressive stresses to suppress the formation of intrusions and extrusionsand hence fatigue initiation (13). In shot peening, the metal surface is bom-barded with small spherical media called shot (19). Each piece of shot strik-
FATIGUE 135
Figure 5.18 Fatigue crack originating from weld toe of gas–metal arc weld of carbonsteel. Reprinted from Itoh (15). Courtesy of American Welding Society.
Figure 5.19 Effect of undercutting on fatigue in electron beam welds of carbon steel:(a) photograph; (b) fatigue life. Reprinted from Elliott (16). Courtesy of AmericanWelding Society.
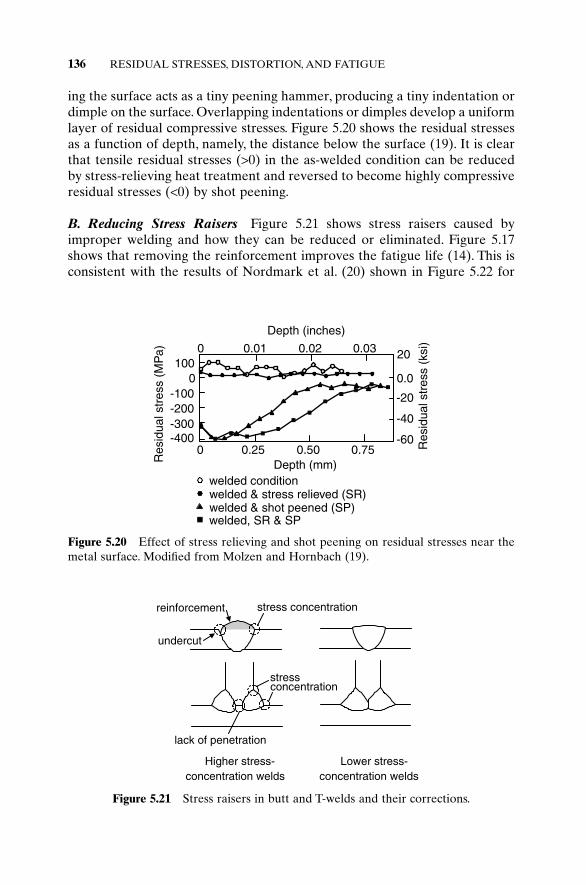
ing the surface acts as a tiny peening hammer, producing a tiny indentation ordimple on the surface. Overlapping indentations or dimples develop a uniformlayer of residual compressive stresses. Figure 5.20 shows the residual stressesas a function of depth, namely, the distance below the surface (19). It is clearthat tensile residual stresses (>0) in the as-welded condition can be reducedby stress-relieving heat treatment and reversed to become highly compressiveresidual stresses (<0) by shot peening.
B. Reducing Stress Raisers Figure 5.21 shows stress raisers caused byimproper welding and how they can be reduced or eliminated. Figure 5.17shows that removing the reinforcement improves the fatigue life (14). This isconsistent with the results of Nordmark et al. (20) shown in Figure 5.22 for
136 RESIDUAL STRESSES, DISTORTION, AND FATIGUE
welded conditionwelded & stress relieved (SR)
welded, SR & SPwelded & shot peened (SP)
Depth (inches)
0 0.01 0.02 0.03
-60
-40
-20
0.0
20
Res
idua
l str
ess
(ksi
)
Depth (mm)0 0.25 0.50 0.75
0-100-200-300-400
100
Res
idua
l str
ess
(MP
a)
Figure 5.20 Effect of stress relieving and shot peening on residual stresses near themetal surface. Modified from Molzen and Hornbach (19).
reinforcement stress concentration
undercut
lack of penetration
Higher stress-concentration welds
Lower stress-concentration welds
stress concentration
Figure 5.21 Stress raisers in butt and T-welds and their corrections.

transverse butt welds of 6.4-mm- (1/4-in.-) thick 5456-H116 aluminum.However, in the case of incomplete penetration, removing the reinforcementcan dramatically reduce the fatigue life.
5.4 CASE STUDIES
5.4.1 Failure of a Steel Pipe Assembly (21)
Figure 5.23a is a sketch showing a steel pipe of 10mm wall thickness bent toturn in 90° and welded at the ends (b) to connecting flanges. The pipe–flangeassembly was connected to a bottle-shaped container (a) and a heavy over-hanging valve weighing 95kg (e). The working pressure was 425kg/cm2 andthe operating temperature was 105°C. The assembly was subjected to vibra-tions from the compressors provided at intervals along the pipe system.Graphical recorders showed evidence of the vibrations. The assembly failedafter a service time of about 2500h.
Examination of the failed assembly showed two fractures: fracture A atposition c and fracture B at the weld at position d. Both fractures exhibitedradial lines and striations typical of a fatigue fracture. Fracture A (Figure5.23b) originated in small craters accidentally formed in the flange during arcwelding. Fracture B (Figure 5.23c) started at the weld toe, namely, the junc-tion between the weld reinforcement and the base metal surface. The fracturesurface (Figure 5.23d) shows the radial lines and striations of fatigue.
The composition of the steel was unavailable, though metallographyshowed that it had a ferrite–pearlite structure, and the grains are fine and
CASE STUDIES 137
reinforcementintact
reinforcementremoved
reinforcementremoved
10 4 10 5 10 6
Cycles to failure
incompletepenetration
reinforcementintact
completepenetration
Figure 5.22 Effect of weld reinforcement and penetration on fatigue life of transversebutt welds of 5456 aluminum. Reprinted from Nordmark et al. (20). Courtesy of American Welding Society.

equiaxed. Regarding fracture A, many cracks were observed in the fused metalin the craters and in the martensitic structure of the heat-affected zone. Underthe cyclic loading from the vibrations, these cracks served as the initiation sitesfor fatigue.As for fracture B, the notch effect due to reinforcement of the weldpromoted the fatigue failure.
5.4.2 Failure of a Ball Mill (22)
Figure 5.24 shows part of a ball mill used for ore crushing. The cylindrical shellof the ball mill was 10.3m in length, 4.4m in diameter, and 50mm in thickness.
138 RESIDUAL STRESSES, DISTORTION, AND FATIGUE
Figure 5.23 Failure of a steel pipe assembly (21): (a) pipe system; (b) fracture Acaused by craters at position c; (c) fracture B at weld at position d; (d) surface of fracture B.

CASE STUDIES 139
Figure 5.24 Failure of a ball mill: (a) design; (b) fatigue cracks (indicated by whitearrows); (c) origin of fatigue cracks. From Wallner (22).

A flange with 100mm wall thickness was welded to each end of the cylindri-cal shell (left half of Figure 5.24a). Both the cylindrical shell and the flangeswere made from a killed steel with the composition of the steel being 0.19%C, 0.25% Si, 0.65% Mn, 0.025% P, and 0.028% S. The entire weight of the millcharge was approximately 320 tons and the drum operated at a rotation speedof 14rpm.After about 3000h of operation, long cracks appeared on the outsidesurface of the drum (Figure 5.24b).
The failed drum was emptied, its inside inspected, and cracks ranging from100 to 1000mm long were observed. It was found that these cracks had orig-inated from nearby tack welds, which had been made for holding insulationduring stress relieving of the drum (Figure 5.24c). Apparently, the high notcheffect has greatly reduced the fatigue life of the drum. It was subsequently sug-gested that the new joint design shown in the right half of Figure 5.24a be usedand a new stress relief method be employed in order to avoid the use of similartack welds.
REFERENCES
1. Masubuchi, K., Analysis of Welded Structures, Pergamon, Elmsford, NY, 1980.2. Welding Handbook, 7th ed., Vol. 1, American Welding Society, Miami, FL, 1976.3. Masubuchi, K., and Martin, D. C., Weld. J., 40: 553s, 1961.4. Tsai, C. L., Park, S. C., and Cheng, W. T., Weld. J., 78: 156s, 1999.5. Satoh, K., and Terasaki, T., J. Jpn. Weld. Soc., 45: 42, 1976.6. Gibbs, F. E., Weld. J., 59: 23, 1980.7. TWI Job Knowledge for Welders, Part 34,Welding Institute, Cambridge, UK, March
21, 1998.8. Watanabe, M., Satoh, K., Morii, H., and Ichikawa, I., J. Jpn.Weld. Soc., 26: 591, 1957.9. Hertzberg, R. W., Deformation and Fracture Mechanics of Engineering Materials,
Wiley, New York, 1976, p. 422.10. Hull, D., J. Inst. Met., 86: 425, 1957.11. Colangelo, V. J., and Heiser, F. A., Analysis of Metallurgical Failures, Wiley, New
York, 1974.12. Wulpi, D., Understanding How Components Fail, American Society for Metals,
Metals Park, OH, 1985, p. 144.13. Sanders, W. W. Jr., Weld. Res. Council Bull., 171: 1972.14. Sanders, W. W. Jr., and Day, R. H., in Proceedings of the First International
Aluminum Welding Conference, Welding Research Council, New York, 1982.15. Itoh, Y., Weld. J., 66: 50s, 1987.16. Elliott, S., Weld. J., 63: 8s, 1984.17. Uhlig, H. H., Corrosion and Corrosion Control, 2nd ed., Wiley, New York, 1971.18. Fontana, M. G., and Greene, N. D., Corrosion Engineering, 2nd ed., McGraw-Hill,
New York, 1978.19. Molzen, M. S., and Hornbach, D., Weld. J., 80: 38, 2001.
140 RESIDUAL STRESSES, DISTORTION, AND FATIGUE

20. Nordmark, G. E., Herbein, W. C., Dickerson, P. B., and Montemarano, T. W.,Weld. J., 66: 162s, 1987.
21. Fatigue Fractures in Welded Constructions, Vol. II, International Institute ofWelding, London, 1979, p. 56.
22. Wallner, F., in Cracking and Fracture in Welds, Japan Welding Society, Tokyo, 1972,P. IA3.1.
FURTHER READING
1. Masubuchi, K., Analysis of Welded Structures, Pergamon, Elmsford, NY, 1980.2. Fatigue Fractures in Welded Constructions,Vol. II, International Institute of Welding,
London, 1979.3. Cracking and Fracture in Welds, Japan Welding Society, Tokyo, 1972.4. Gurney, T. R., Ed., Fatigue of Welded Structures, 2nd ed., Cambridge University
Press, Cambridge, 1979.
PROBLEMS
5.1 (a) Austenitic stainless steels have a high thermal expansion coefficientand a low thermal conductivity. Do you expect significant distortionin their welds?
(b) Name a few welding processes that help reduce weld distortion.
5.2 Aluminum alloys have a high thermal expansion coefficient, high thermalconductivity, and high solidification shrinkage. Do you expect significantdistortion in their welds?
5.3 The lower the weld reinforcement usually means the less the stress con-centration at the weld toe. One quick way to reduce the height of thereinforcement is to grind its upper half flat without changing its contactangle with the workpiece surface. In this a proper treatment of the rein-forcement? Explain why or why not.
PROBLEMS 141

PART IIThe Fusion Zone
Welding Metallurgy, Second Edition. Sindo KouCopyright 2003 John Wiley & Sons, Inc.
ISBN: 0-471-43491-4

6 Basic Solidification Concepts
In order to help explain the weld metal microstructure and chemical inho-mogeneities in subsequent chapters, some basic solidification concepts will bepresented first in this chapter. These concepts include solute redistribution,solidification modes, constitutional supercooling, microsegregation and band-ing, the dendrite-arm or cell spacing, and the solidification path.
6.1 SOLUTE REDISTRIBUTION DURING SOLIDIFICATION
When a liquid of uniform composition solidifies, the resultant solid is seldomuniform in composition.The solute atoms in the liquid are redistributed duringsolidification. The redistribution of the solute depends on both thermody-namics, that is, the phase diagram, and kinetics, that is, diffusion, undercooling,fluid flow, and so on.
6.1.1 Phase Diagram
Figure 6.1a is a portion of a phase diagram near the corner of a pure metal ofmelting point Tm, with S denoting the solid phase and L the liquid phase. Con-sider the solidification of alloy C0, that is, with initial melt composition C0. Avertical line through C0 intersects the liquidus line at the liquidus temperature,TL, and the solidus line at the solidus temperature, TS. Assume that under-cooling is negligible so that the solid begins to form when the liquid cools toTL. Also assume that equilibrium between the solid and the liquid is main-tained at the solid–liquid (S/L) interface throughout solidification. This meansat any temperature T the composition of the solid at the interface, CS, and thecomposition of the liquid at the interface, CL, follow the solidus line and theliquidus line, respectively.
A. Equilibrium Partition Ratio At any temperature T the equilibrium par-tition ratio, or the equilibrium segregation coefficient, k, is defined as
(6.1)
where CS and CL are the compositions of the solid and liquid at the S/L inter-face, respectively. The value of k depends on temperature T. For simplicity,
kCC
= S
L
145
Welding Metallurgy, Second Edition. Sindo KouCopyright 2003 John Wiley & Sons, Inc.
ISBN: 0-471-43491-4

k is assumed constant; that is, the solidus and liquidus lines are both assumedstraight lines.
The first solid to form will have the composition kC0 according to Equation (6.1) and the phase diagram, that is, CL = C0 at T = TL. Consider the case of k < 1 first. As the phase diagram in Figure 6.1a shows, the solidcannot accommodate as much solute as the liquid does, and the solid thusrejects the solute into the liquid during solidification. Consequently, the solutecontent of the liquid continues to rise during solidification. Since the solidgrows from the liquid, its solute content also continues to rise. As indicated bythe arrowheads on the solidus and liquidus lines in Figure 6.1a for k < 1, CS
and CL both increase as temperature T of the S/L interface drops during solidification.
Consider now the case of k > 1. As the phase diagram in Figure 6.1b shows,the solid can accommodate more solute than the liquid does, and the solid thusabsorbs the solute from the liquid during solidification. Consequently, thesolute content of the liquid continues to drop during solidification. Since thesolid grows from the liquid, its solute content also continues to drop. As indi-cated by the arrowheads on the solidus and liquidus lines in Figure 6.1b for k > 1, CS and CL both decrease as temperature T of the S/L interface dropsduring solidification.
146 BASIC SOLIDIFICATION CONCEPTS
solidus line liquidus line;slope m L < 0
Solute concentration, C
Tem
pera
ture
, T
Equilibriumsegregationcoefficient:k = CS/CL < 1
melt of initialcomposition, CO
S S + LL
kCO
Tm
CL
T
TL
CO
Tem
pera
ture
, T
CO
S
S + LL
kCO
Tm
CL
CS
T
TL
CO
Solute concentration, C
k = CS/CL > 1
(a)
(b)
CSTS
TS
liquidus line;slope m L > 0 solidus line
Figure 6.1 Portion of a binary phase diagram showing the equilibrium partition ratio k.

B. Slope of Liquidus Line The slope of the liquidus line, mL, is less than zerowhen k < 1 and vice versa, as shown in Figure 6.1. If the liquidus line is straight,a temperature T on the liquidus line can be expressed as
T = Tm + mLCL (6.2)
6.1.2 Complete Diffusion in Solid and Liquid
To help understand solute redistribution during solidification, consider theone-dimensional solidification experiment shown in Figure 6.2. A metal heldin a stationary container of an aluminum oxide tube is heated by a tubularfurnace at the top and cooled by a water cooler at the bottom. As thefurnace–cooler assembly rises steadily, the metal in the container solidifiesupward with a planar S/L interface. The growth rate R of the metal, that is,the travel speed of the S/L interface, can be adjusted by adjusting the risingspeed of the furnace–cooler assembly. The temperature gradient G in theliquid metal at the S/L interface can be adjusted by adjusting heating andcooling.
This case of complete diffusion in both the solid and the liquid is shown inFigure 6.3, where a liquid metal of uniform initial composition C0 is allowedto solidify in one direction with a planar S/L interface, just like in the direc-tional solidification experiment shown in Figure 6.2. This case is also calledequilibrium solidification because equilibrium exists between the entire solidand the entire liquid, not just at the interface. Diffusion is complete in the solidand the liquid, and the solid and liquid are thus uniform in composition.Uniform composition in the liquid requires either complete mixing by strongconvection or complete diffusion in the liquid. Complete diffusion of thesolute in the liquid requires DLt >> l2, where l is the initial length of the liquid,DL the diffusion coefficient of the solute in the liquid, and t the time available
SOLUTE REDISTRIBUTION DURING SOLIDIFICATION 147
water
container(stationary)
rising
tubularfurnace(rising)
cooler(rising)
dist
ance
, z
S/L (solid/liquid interface)
temperature, T
G: temperature gradient dT/dz at S/L
R: growth rate
L: liquid metalS: solid metal
L
R
s
Directional SolidificationExperiment
Figure 6.2 Directional solidification experiment.

for diffusion. This is because the square root of Dt is often considered as anapproximation for the diffusion distance, where D is the diffusion coefficient.This requirement can be met when l is very small, when solidification is so slowthat the solute has enough time to diffuse across the liquid, or when the dif-fusion coefficient is very high. Similarly, complete solute diffusion in the solidrequires DSt >> l2, where DS is the diffusion coefficient of the solute in thesolid. Since DS is much smaller than DL, complete diffusion is much more dif-ficult to achieve in solid than in liquid. Interstitial solutes (such as carbon insteel) tend to have a much higher DS than substitutional solutes (such as Crin steel) and are more likely to approach complete diffusion in solid.
During solidification the composition of the entire solid follows the solidusline and that of the entire liquid follows the liquidus line (Figure 6.3a). Thecomposition of the solid is a function of the fraction of the solid, that is, CS( fS).Likewise the composition of the liquid is a function of the fraction of the solid,
148 BASIC SOLIDIFICATION CONCEPTS
C
0
Co
fL = 1 - fSfS
solid liquid
CL
CS1
Concentration, C
Fraction of solid, fSkCo
Co C
0 1
Equilibriumsolidification
kCo Co/k
Co
Co/k
k < 1
(b)CL(fS)
CS(fS)
(c)
CSfS + CLfL = Co solid liquid total
S/L
liquidsolid
Concentration, C
L
initial meltcomposition,Co
k < 1
Tem
pera
ture
, T
S S + LL
TmTL
TS
k < 1T
CS
CL (a)
fS
total volume of material
Figure 6.3 Solute redistribution during solidification with complete diffusion in solidand liquid: (a) phase diagram; (b) CL( fs) and CS( fs); (c) composition profiles in solidand liquid.
that is, CL(fS). At the onset of solidification at TL, the fraction of solid fs = 0,and the compositions of the solid and the liquid are kC0 and C0, respectively.As solidification continues and temperature drops from TL to TS, the compo-sition of the entire solid rises from kC0 to C0 and that of the entire liquid fromC0 to C0/k (Figure 6.3b). At any time during solidification, the compositions ofthe solid and liquid are uniform (as shown by the thick horizontal lines inFigure 6.3c). Solidification ends at the solidus temperature TS and the resul-tant solid has a uniform composition of C0; that is, there is no solute segrega-tion at all.
In Figure 6.3c the hatched areas CS fS and CL fL represent the amounts of solute in the solid and liquid, respectively, where fS and fL are the fractionsof solid and liquid, respectively. The area C0( fS + fL) represents the amount ofsolute in the liquid before solidification. Based on the conservation of soluteand the fact that fS + fL = 1,
(6.3)
Substituting fS = 1 - fL into the above equation, the following equilibrium leverrule is obtained:
(6.4)
(6.5)
and the composition of the liquid is
(6.6)
6.1.3 No Solid Diffusion and Complete Liquid Diffusion
This case is shown in Figure 6.4. Diffusion in the solid is assumed negligible,and the solid is thus not uniform in composition. This requires that DSt << l 2.On the other hand, diffusion in the liquid is assumed complete, and the liquidis thus uniform in composition. This requires that DLt >> l 2. If mixing causedby strong convection is complete in the liquid, the liquid composition can alsobe uniform. Equilibrium exists between the solid and the liquid only at theinterface.
Unlike the case of equilibrium solidification, the solute cannot back diffuse into the solid and all the solute rejected by the growing solid has to go into the liquid. Consequently, CL rises more rapidly during solidificationthan in the case of equilibrium solidification. Since the solid grows from theliquid, its composition at the S/L interface CS also rises more rapidly than in
CC
f k fLL L
=+ -( )
0
1
fC CC CS
L
L S=
--
0
fC CC CL
S
L S=
--
0
C f C f C f f CS S L L S L+ = +( ) =0 0
SOLUTE REDISTRIBUTION DURING SOLIDIFICATION 149

the case of equilibrium solidification. When CL rises beyond C0 /k, CS risesbeyond C0 (Figure 6.4b).
The two hatched areas in Figure 6.4c represent the amounts of solute in thesolid and liquid, and their sum equals the amount of solute in the liquid beforesolidification, C0. Consider the conservation of solute shown in Figure 6.4d.Since the total amount of solute in the system (total hatched area) is con-served, the area under equals the area under. As such, hatchedarea 1 equals hatched area 2 and, therefore,
ab c d¢ ¢ ¢abcd
150 BASIC SOLIDIFICATION CONCEPTS
(a)
(b)
Fraction of Solid, fskC o
Co
C
0 1
c
f
Co /k
CompleteLiquid Diffusion
CL(fS)
CS(fS)
Concentration, CCokCo Co/k
k < 1
L
initial meltcomposition,Co
k < 1
Tem
pera
ture
, T
S S + L
TmTL
TS
T
CS
CL
C
0 1solid liquid
liquidsolid
Co
CL
CS
(c)
Fraction of Solid, fS
kCo
Co
Con
cent
ratio
n, C
0 1
CL
CS
dfS
dC L
(C L - CS )dfS = (1 - fS )dCL
area 1 area 2
area 1
area 2
fS
a b
c
d
d'c'
b'
S/L
fL = 1 - f S
solid liquid
k < 1
(d)
S/L
total volume of material
fS
Figure 6.4 Solute redistribution during solidification with complete diffusion in liquidand no diffusion in solid: (a) phase diagram; (b) CL( fs) and CS( fs); (c) composition pro-files in solid and liquid; (d) conservation of solute.

(6.7)
Substituting CS = kCL into the above equation and integrating from CL = C0
at fs = 0,
(6.8)
or
(6.9)
The above two equations are the well-known Scheil equation for solute seg-regation (1). Equation (6.9) can be written for the fraction liquid as follows:
(6.10)
The nonequilibrium lever rule, that is, the counterpart of Equation (6.5), canbe written as
(6.11)
From the Scheil equation the average composition of the solid, , can bedetermined as
(6.12)
As already mentioned, the solidus and liquidus lines are both assumedstraight.
From Figure 6.1a, it can be shown that (TL - Tm)/C0 = mL. Furthermore,based on the proportional property between two similar right triangles, it canbe shown that (Tm - TL)/(Tm - T) = C0/CL. Based on these relationships andEquation (6.10), the Scheil equation can be rewritten as follows:
(6.13)
This equation can be used to determine the fraction of solid fs at a tempera-ture T below the liquidus temperature TL.
f fT TT T
m CT T
ko
k
L Sm L
m
L
m= - =
--
ÊË
ˆ¯ =
-( )-
ÊË
ˆ¯
- -
11 1 1 1
CkC f df
df
C f
f
kf
f
k
SS S0
S0
S
S
S
S=
-( )=
- -( )[ ]-Ú
Ú0
101 1 1
CS
fC C
C CS
L
L S
=--
0
fCC
CC
k k
LL
L= Ê
ˈ¯ = Ê
ˈ¯
-( ) -( )
0
1 10
1 1
C C f kL L= -
01
C kC fk
S S= -( ) -0
11
C C df f dCL S S S L-( ) = -( )1
SOLUTE REDISTRIBUTION DURING SOLIDIFICATION 151

6.1.4 No Solid Diffusion and Limited Liquid Diffusion
This case is shown in Figure 6.5. In the solid diffusion is assumed negligible.In the liquid diffusion is assumed limited, and convection is assumed negligi-ble. Consequently, neither the solid nor the liquid is uniform in compositionduring solidification. Because of limited liquid diffusion, the solute rejected bythe solid piles up and forms a solute-rich boundary layer ahead of the growthfront, as shown in Figure 6.5c. Again, equilibrium exists between the solid andthe liquid only at the interface.
152 BASIC SOLIDIFICATION CONCEPTS
Concentration, C
Tem
pera
ture
, T
initial transient
final transientS S + L
L
(a)steadystate
Co/k
initial meltcomposition,Co
initi
altr
ansi
ent
final
tran
sien
tsteadystate
Fraction Solid, f S
(b)
kCo
Co
0 1
C
TmTLTS
CokC o Co/k
Limited LiquidDiffusion
k < 1
0 1
solute-richboundary layer
(c)solid liquid
C
CL(fS)
CS(fS)
Co/k
kCo
Co
S/L
liquidsolid
fS
total volume of material
Figure 6.5 Solute redistribution during solidification with limited diffusion in liquidand no diffusion in solid: (a) phase diagram; (b) CL( fs) and CS( fs); (c) composition pro-files in solid and liquid.

Unlike the previous case of complete liquid diffusion and no solid diffu-sion, the solute rejected by the growing solid forms a solute-rich boundarylayer ahead of the growth front, rather than spreading uniformly in the entireliquid. Consequently, CL and hence CS rise more rapidly than those in the caseof complete liquid diffusion and no solid diffusion. The period of rising CL andCS is called the initial transient (Figure 6.5b). When CL and CS reach C0 /k andC0, respectively, a steady-state period is reached, within which CL, CS, and theboundary layer (Figure 6.5c) remain unchanged.As the boundary layer movesforward, it takes in a liquid of composition C0 and it leaves behind a solid ofthe same composition C0. Since the input equals the output, the boundary layerremains unchanged. This steady-state condition continues until the boundarylayer touches the end of the liquid, that is, when the thickness of the remain-ing liquid equals that of the steady-state boundary layer. Here the volume of the remaining liquid is already rather small, and any further decrease involume represents a very significant percentage drop in volume. As such,the remaining liquid quickly becomes much more concentrated in solute assolidification continues, and CL and hence CS rise sharply. This final period ofrapidly rising CL and CS is called the final transient, and its length equals thethickness of the steady-state boundary layer.
The solute-rich boundary layer is further examined in Figure 6.6. It has beenshown mathematically (2) that the steady-state composition profile in theboundary layer is
SOLUTE REDISTRIBUTION DURING SOLIDIFICATION 153
solute-richboundarylayer
Concentration, CCo/kCo
TL
TSS
L
Tem
pera
ture
, T
C
Co
distance, x
DL /R
(a)
(b)
growth rate, R
kCo
Co/k
Tm
S + L
S/L
kCo
initial meltcomposition,Co
Limited LiquidDiffusion
Z
k < 1
liquidsolid
δ =
Figure 6.6 Solidification with limited diffusion in liquid and no diffusion in solid: (a)phase diagram; (b) solute-rich boundary layer.
(6.14)
where R is the growth rate and Z the distance from the S/L interface pointing into the liquid. At Z = 0, CL - C0 has a maximum value of C0 /k -C0 and at Z = DL/R it drops to 1/e (about one-third) of the maximum value. As such, the thickness of the boundary layer at the steady state can betaken as d � DL/R. As such, the characteristic length of the final transient isDL/R.
It also has been shown mathematically (3, 4) that, for k << 1, the composi-tion profile in the initial transient can be expressed as
(6.15)
where x is the distance from the starting point of solidification. At x = 0, C0 -CS has a maximum value of C0 - kC0 and at x = DL/kR it drops to 1/e of the maximum value. As such, the characteristic length of the initial transientis DL/kR, which is much greater than that of the final transient because k issignificantly less than 1.
Equation (6.15) can be rearranged as follows:
(6.16)
Upon taking the logarithm on both sides, the above equation becomes
(6.17)
The left-hand-side of Equation (6.17) can be plotted against the distance x. From the intercept the value of k can be checked, and from the slope the length of the initial transient DL/kR can be found. From this the growth rate R can be found if the diffusion coefficient DL is known or viceversa.
Figure 6.7 shows three different types of solute of redistributions that can occur when diffusion in the solid is negligible during solidification. In type 1 either liquid diffusion or convection-induced mixing in the liquid is complete, and the resultant solute segregation is most severe (Figure 6.7d).In type 3, on the other hand, liquid diffusion is limited and there is no convection-induced mixing in the liquid, and the resultant solute segrega-tion is least severe. Type 2 is intermediate, so is the resultant solute segregation.
log loglog
1 10
-ÊË
ˆ¯ = -( ) - Ê
ˈ¯
CC
ke
D kRxS
L
1 10
- = -( ) - ( )CC
k e k R D xS L
C CC kC
e k R D xL0
0 0
--
= - ( )S
C CC k C
e R D ZLL --
= -( )0
0 0
154 BASIC SOLIDIFICATION CONCEPTS

6.2 SOLIDIFICATION MODES AND CONSTITUTIONAL SUPERCOOLING
6.2.1 Solidification Modes
During the solidification of a pure metal the S/L interface is usually planar,unless severe thermal undercooling is imposed. During the solidification of analloy, however, the S/L interface and hence the mode of solidification can beplanar, cellular, or dendritic depending on the solidification condition and thematerial system involved. In order to directly observe the S/L interface duringsolidification, transparent organic materials that solidify like metals have beenused. Shown in Figure 6.8 are the four basic types of the S/L interface morphology observed during the solidification of such transparent materials:planar, cellular, columnar dendritic, and equiaxed dendritic (5, 6). Typical
SOLIDIFICATION MODES AND CONSTITUTIONAL SUPERCOOLING 155
liquid
CokCo
CokCo
Co/k
CokCo
Sol
ute
conc
entr
atio
n, C
CokCo
Type 1: complete liquiddiffusion or mixing
Type 3: limited liquid diffusion,no convection
Fraction Solid, f s
(a)
(b)
(c)
(d)Type 2Type 1 (mostsegregation)
Type 3 (least segregation)
Type 2: limited liquid diffusion,some convection
solid
solid
C
liquid
liquid
solid
solid
solid liquid
Figure 6.7 Solute redistributions in the absence of solid diffusion: (a) type 1; (b) type2; (c) type 3; (d) resultant segregation profiles.

microstructures resulting from the cellular, columnar dendritic, and equiaxeddendritic modes of solidification in alloys are shown in Figures 6.9a, b, and c,respectively (7–9). A three-dimensional view of dendrites is shown in Figure6.9d (10).
6.2.2 Constitutional Supercooling
Two major theories have been proposed to quantitatively describe the break-down of a planar S/L interface during solidification: the constitutional super-cooling theory by Chalmer and co-workers (11, 12) and the interface stabilitytheory by Mullins and Sekerka (13–15). The former theory considers only thethermodynamic aspect of the problem while the latter incorporates the inter-face kinetic and heat transfer aspects. For simplicity, however, only the con-stitutional supercooling theory will be described here.
Consider the solidification of alloy C0 at the steady state with a planar S/Linterface, as shown in Figure 6.10. As shown previously in Figure 6.6, the com-position distribution in the solute-rich boundary layer is shown in Figure 6.10b.
156 BASIC SOLIDIFICATION CONCEPTS
Figure 6.8 Basic solidification modes (magnification 67¥): (a) planar solidification ofcarbon tetrabromide (5); (b) cellular solidification of carbon tetrabromide with a smallamount of impurity (5); (c) columnar dendritic solidification of carbon tetrabromidewith several percent impurity (5); (d) equiaxed dendritic solidification of cyclohexanolwith impurity (6). From Solidification (5), pp. 132–134, with permission.

The liquidus temperature distribution corresponding to this composition dis-tribution can be constructed point by point from the liquidus line of the phasediagram and is shown in Figure 6.10c.A boundary layer consisting of the liquidphase alone is thermodynamically stable only if its temperature is above theliquidus temperature. If its temperature is below the liquidus temperature,solid and liquid should coexist.This means that the planar S/L interface should
SOLIDIFICATION MODES AND CONSTITUTIONAL SUPERCOOLING 157
Figure 6.9 Nonplanar solidification structure in alloys. (a) Transverse section of a cel-lularly solidified Pb–Sn alloy from Journal of Crystal Growth (7) (magnification 48¥).(b) Columnar dendrites in a Ni alloy. From New Trends in Materials Processing (8),with permission. (c) Equiaxed dendrites of a Mg–Zn alloy from Journal of Inst. ofMetals (9) (magnification 55¥). (d) Three-dimensional view of dendrites in a Ni-basesuperalloy. Reprinted from International Trends in Welding Science and Technology(10).

break down to a cellular or dendritic one so that solid cells or dendrites cancoexist with the intercellular or interdendritic liquid (Figures 6.8b–d). Theshaded area under the liquidus temperature distribution in Figure 6.10c indi-cates the region where the actual liquid temperature is below the liquidus tem-perature, that is, the region of constitutional supercooling. The shaded areabelow the liquidus line in Figure 6.10a, which depends on DL and R, indicatesthe corresponding region of constitutional supercooling in the phase diagram.Obviously, this area lies within the solid–liquid region of the phase diagram,that is, liquid alone is unstable and solid and liquid should coexist.
The temperature difference across the boundary layer is the equilibriumfreezing range DT = TL - TS. As shown previously, the thickness of the bound-ary layer at the steady state is DL/R. As such, the slope of the tangent to the liquidus temperature distribution at the S/L interface is DT/(DL/R) or RDT/DL.To ensure that a planar S/L interface is stable, the actual temperature gradientG at the S/L interface must be at least RDT/DL. Therefore, for a planar S/Linterface to be stable at the steady state, the following criterion must be met:
(6.18)GR
TD
≥D
L
158 BASIC SOLIDIFICATION CONCEPTS
distance from S/L
solute-richboundary layer
region ofconstitutionalsupercooling
Concentration, CCo/kCo
TL
TS S
L
T
Tem
pera
ture
, T T
T
C
Co/k
Co
L
G
DLRor <
actual slope G < DL /R
S
To avoid constitutionalsupercooling:
(a)
(b)
(c)
slope of tangent =
distance from S/L
S/L
growth rate, R
L
S+
TDL /R
initial meltcomposition,Co
T
T
GDLR
T
DL /R
liquidussolidus
>
∆
∆
∆∆∆
∆
δ =
Figure 6.10 Constitutional supercooling: (a) phase diagram; (b) composition profilein liquid; (c) liquidus temperature profile in liquid.

This is the steady-state form of the criterion for planar growth. It says that foran alloy to be able to grow with a planar solidification mode, the ratio G/Rmust be no less than DT/DL. The constitutional supercooling theory has beenverified experimentally by many investigators (16–23). In general, this theorypredicts fairly closely the conditions required to initiate the breakdown of aplanar S/L interface in alloys with isotropic surface energy.
According to Equation (6.18), the higher the temperature gradient G andthe lower the growth rate, the easier for a planar S/L interface to be stable.On the other hand, the higher the freezing range DT and the lower the diffu-sion coefficient DL, the more difficult for a planar S/L interface to be stable.For an Al–4% Cu alloy, for example, TL, TS and DL, are 650°C, 580°C, and 3 ¥10-5 cm2/s, respectively. If the temperature gradient G is 700°C/cm, the growthrate R has to be less than or equal to 3 ¥ 10-4 cm/sec in order to have planarsolidification. If the growth rate is higher than this, the planar S/L interfacewill break down and cellular or dendritic solidification will take place.
Figure 6.11 shows that the solidification mode changes from planar to cel-lular, to columnar dendritic, and finally to equiaxed dendritic as the degree ofconstitutional supercooling continues to increase. The region where dendrites(columnar or equiaxed) and the liquid phase coexist is often called the mushyzone (2). It is interesting to note that at a very high degree of constitutionalsupercooling (Figure 6.11d) the mushy zone can become so wide that it iseasier for equiaxed dendrites to nucleate than for columnar dendrites tostretch all the way across the mushy zone. Unfortunately, simple theories
SOLIDIFICATION MODES AND CONSTITUTIONAL SUPERCOOLING 159
Planar
Cellular
Columnardendritic
Equiaxeddendritic
L
L
L
LEquilibrium
Act
ual
M
M
S
S
S
S
Incr
easi
ng c
onst
itutio
nal s
uper
cool
ing
constitutionalsupercooling
(a)
(b)
(c)
(d)
Figure 6.11 Effect of constitutional supercooling on solidification mode: (a) planar;(b) cellular; (c) columnar dendritic; (d) equiaxed dendritic (S, L, and M denote solid,liquid, and mushy zone, respectively).

similar to the constitutional supercooling theory are not available for pre-dicting the transitions from the cellular mode to the columnar dendritic modeand from the columnar dendritic mode to the equiaxed dendritic mode.
Figure 6.12 is a series of photographs showing the breakdown of a planarS/L interface into a cellular one during the solidification of a pivalic acidalloyed with 0.32mol % ethanol (24). The temperature gradient G was15°C/mm, and the growth rate R was suddenly raised to a higher level of 5.7mm/s, to suddenly lower the G/R ratio and trigger the breakdown by con-stitutional supercooling.
6.3 MICROSEGREGATION AND BANDING
6.3.1 Microsegregation
Solute redistribution during solidification results in microsegregation acrosscells or dendrite arms. The analysis of solute redistribution during the direc-
160 BASIC SOLIDIFICATION CONCEPTS
Figure 6.12 Breakdown of a planar S/L interface during the solidification of pivalicacid–ethanol: (a) 0 s, (b) 120s, (c) 210s, (d) 270s, (e) 294s, (f) 338s, (g) 378s, (h) 456s,(i) 576s, and (j) 656s. Reprinted from Liu and Kirkaldy (24). Copyright 1994 with per-mission from Elsevier Science.

tional solidification of a liquid metal (Section 6.1) can be applied to soluteredistribution during the solidification of an intercellular or interdendriticliquid during welding (or casting). The total volume of material in directionalsolidification (Figures 6.3–6.5) is now a volume element in a cell or a dendritearm, as shown in Figure 6.13. Within the volume element the S/L interface is still planar even though the overall structure is cellular or dendritic. Thevolume element covers the region from the centerline of the cell or dendritearm to the boundary between cells or dendrite arms. Solidification begins in the volume element when the tip of the cell or dendrite arm reaches thevolume element.
The case of the equilibrium partition ratio k < 1 is shown in Figure 6.14a.No segregation occurs when diffusion is complete in both the liquid and solid.
MICROSEGREGATION AND BANDING 161
LS
S
L
(b)(a)
volumeelement
Figure 6.13 Volume elements for microsegregation analysis: (a) cellular solidification;(b) dendritic solidification.
kCo
kCo
Co
Co
boundary between cellsor dendrite arms
complete liquid diffusion,no solid diffusion
complete liquid &solid diffusion
limited liquid diffusion,no solid diffusion
Co
distance
com
posi
tion
centerline of cellor dendrite arm
cell
orde
ndrit
e ar
m
k < 1
volumeelement
kCo
kCo
Co
Co
complete liquid diffusion,no solid diffusion
complete liquid &solid diffusion
limited liquid diffusion,no solid diffusion
Co
distance
com
posi
tion
k > 1
cell
orde
ndrit
e ar
m
(a) (b)
Figure 6.14 Microsegregation profiles across cells or dendrite arms: (a) k < 1; (b) k > 1.

This requires that DLt >> l 2 and that DSt >> l 2, where l is now half the cell ordendrite arm spacing (the length of the volume element). Segregation is worstwith complete diffusion in the liquid but no diffusion in the solid.This requiresthat DLt >> l 2 and that DSt << l 2. Segregation is intermediate with limited dif-fusion in the liquid and no diffusion in the solid. When this occurs, there is a clear concentration minimum at the centerline of the cell or dendrite arm.Usually, there is some diffusion in the solid and the concentration minimummay not always be clear. The case of k > 1 is shown in Figure 6.14b. The seg-regation profiles are opposite to those of k < 1.
Consider the case of a eutectic phase diagram, which is common among aluminum alloys. Assume complete liquid diffusion and no solid diffusion. Asshown in Figure 6.15, the solid composition changes from kC0 to CSM, themaximum possible solute content in the solid, when the eutectic temperatureTE is reached. The remaining liquid at this point has the eutectic composition
162 BASIC SOLIDIFICATION CONCEPTS
Concentration, C
Tem
pera
ture
, T
SS + L
L(a)
(b)
Fraction of Solid, fs
kCo
Co
C
0 1
kCo
Co
initial meltcomposition,Co
Tm
TL
TS
C SM
Complete
Liquid Diffusion
C E
eutectic
C E
eutectic
CSM
TE
solid
fE
C L(f S)
C S(f S)
volumeelement
Figure 6.15 Solute redistribution during solidification with complete diffusion inliquid and no diffusion in solid: (a) eutectic phase diagram; (b) composition profiles inliquid and solid.

CE and, therefore, solidifies as solid eutectic at TE. The fraction of eutectic, fE,can be calculated from Equation (6.13) with fL = fE and T = TE, that is,
(6.19)
6.3.2 Banding
In addition to microsegregation, solute segregation can also occur as a resultof growth rate fluctuations caused by thermal fluctuations. This phenomenon,shown in Figure 6.16, is known as banding (2). As shown, steady-state solidi-fication occurs at the growth rate R1. When the growth rate is suddenlyincreased from R1 to R2, an extra amount of solute is rejected into the liquidat the S/L interface, causing its solute content to rise. As a result, the materialsolidifies right after the increase in the growth rate has a higher solute con-centration than that before the increase. The boundary layer at R2 is thinnerthan that at R1 because, as mentioned previously, the boundary layer thicknessis about DL/R. The solute concentration eventually resumes its steady value ifno further changes take place. If, however, the growth rate is then decreasedsuddenly from R2 back to R1, a smaller amount of solute is rejected into theliquid at the S/L interface, causing its solute content to drop. As a result, thematerial solidifies right after the decrease in the growth rate has a lower soluteconcentration than that just before the decrease. In practice, the growth ratecan vary as a result of thermal fluctuations during solidification caused byunstable fluid flow in the weld pool, and solute-rich and solute-depleted bandsform side by side along the solidification path. When the flow carrying heatfrom the heat source and impinging on the growth front suddenly speeds up,the growth rate is reduced and vice versa.
6.4 EFFECT OF COOLING RATE
It has been observed that the higher the cooling rate, that is, the shorter thesolidification time, the finer the cellular or dendritic structure becomes (2).
fT TT T
k
Em L
m E=
--
ÊË
ˆ¯
-( )1 1
EFFECT OF COOLING RATE 163
Sol
ute
conc
entr
atio
n, C
Co
Co /k
Time, t
R = R1R = R1 < R2R = R2 > R1
solute-rich band
solute-depleted band
Figure 6.16 Formation of banding due to changes in the solidification rate R.
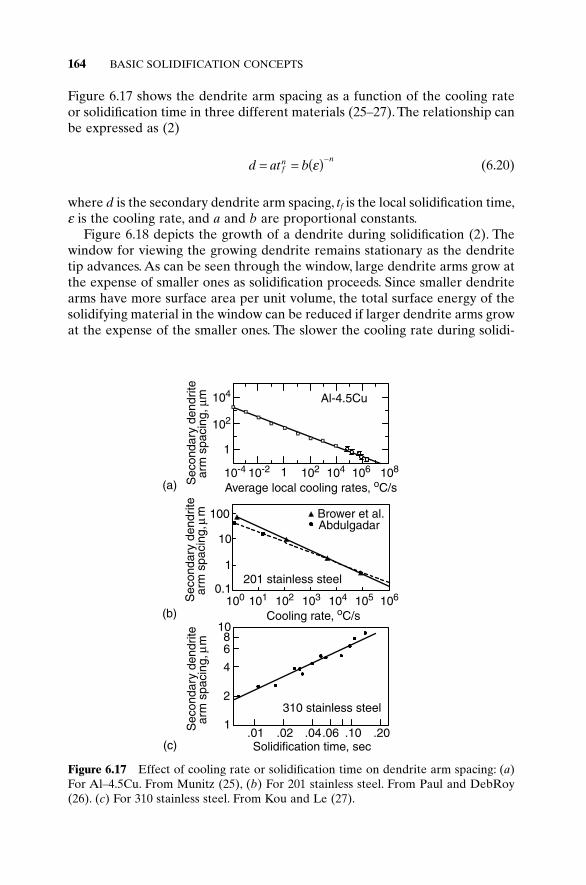
Figure 6.17 shows the dendrite arm spacing as a function of the cooling rateor solidification time in three different materials (25–27). The relationship canbe expressed as (2)
(6.20)
where d is the secondary dendrite arm spacing, tf is the local solidification time,e is the cooling rate, and a and b are proportional constants.
Figure 6.18 depicts the growth of a dendrite during solidification (2). Thewindow for viewing the growing dendrite remains stationary as the dendritetip advances. As can be seen through the window, large dendrite arms grow atthe expense of smaller ones as solidification proceeds. Since smaller dendritearms have more surface area per unit volume, the total surface energy of thesolidifying material in the window can be reduced if larger dendrite arms growat the expense of the smaller ones. The slower the cooling rate during solidi-
d at bfn n= = ( )-e
164 BASIC SOLIDIFICATION CONCEPTS
10-4 10-2 1 102 104 106 108
1
102
104
Average local cooling rates, oC/sSec
onda
ry d
endr
itear
m s
paci
ng,
m Al-4.5Cu
100 101 102 103 104 105 1060.1
1
10
100 Brower et al.
Cooling rate, oC/s
Abdulgadar
201 stainless steel
Sec
onda
ry d
endr
itear
m s
paci
ng,
m
Solidification time, sec.01 .02 .04.06 .10 .20
1
2
4
68
10
310 stainless steel
Sec
onda
ry d
endr
itear
m s
paci
ng,
mµ
µµ
Figure 6.17 Effect of cooling rate or solidification time on dendrite arm spacing: (a)For Al–4.5Cu. From Munitz (25), (b) For 201 stainless steel. From Paul and DebRoy(26). (c) For 310 stainless steel. From Kou and Le (27).
(a)
(b)
(c)

fication, the longer the time available for coarsening and the larger the den-drite arm spacing (Figure 6.17).
Figure 6.19 shows how GR affects the cell spacing in Sn–Pb alloys solidi-fied in the cellular mode (2, 28). The product GR (°C/cm times cm/s) is, in fact,the cooling rate, judging from its unit of °C/s. As shown, the higher the coolingrate, that is, the lower (GR)-1, the finer the cells become.
The effect of the temperature gradient G and the growth rate R on thesolidification microstructure of alloys is summarized in Figure 6.20. Together,G and R dominate the solidification microstructure. The ratio G/R determinesthe mode of solidification while the product GR governs the size of the solid-ification structure.
EFFECT OF COOLING RATE 165
Figure 6.18 Schematic showing dendritic growth of an alloy at a fixed position atvarious stages of solidification. Note that several smaller arms disappear while largerones grow. Reprinted from Flemings (2).
10 20 30 50 70 100 2000
20
40
60
80
100
(GR)-1 (oC/sec)-1
Cel
l spa
cing
(m
icro
ns)
Figure 6.19 Effect of GR on cell spacing in Sn–Pb alloys. Modified from Flemings (2)based on data from Plaskett and Winegard (28).

6.5 SOLIDIFICATION PATH
Consider the eutectic phase diagram of a binary system A–B shown by thebroken lines in Figure 6.21a. To the left of the eutectic point, the primary solidification phase is g, namely, g is the first thing to solidify. To the right, theprimary solidification phase is a. The solid line represents the solidificationpath of alloy C0. The arrow in the solidification path indicates the direction in which the liquid composition changes as temperature decreases. At step 1,where the fraction of the liquid phase L is fL = 1, g begins to form from theliquid phase, assuming negligible undercooling before solidification. The com-position of the liquid phase follows the solid line representing L Æ g. At step2, solidification is complete and fL = 0.
In the case of a ternary system A–B–C, the phase diagram is three dimen-sional, with the base plane showing the composition and the vertical directionshowing the temperature. The liquidus is a surface (curved) instead of a lineas in a binary phase diagram (Figure 6.21a). The intersection between two liq-uidus surfaces is a line called the line of twofold saturation, instead of a pointintersection between two liquidus lines in a binary phase diagram. As shownin Figure 6.21b, when projected vertically downward to the base plane, the liquidus surfaces show areas of primary solidification phases with the lines oftwofold saturation separating them.
The solid line shows the solidification path of alloy C0. At step 1, where thefraction of the liquid phase L is fL = 1, the solid phase g begins to form from
166 BASIC SOLIDIFICATION CONCEPTS
ahighG/R
G/R determines morphology of solidification structure
GxR determines size of solidification structure
higher cooling rate (GxR
);
finer structure
lower cooling rate (G
xR);
coarser structure
Pla
nar
Cellu
lar
Columnar
Dendritic
Equiaxed
DendriticLowG/R b
Growth rate, R
Tem
pera
ture
gra
dien
t, G
S L
S L
Figure 6.20 Effect of temperature gradient G and growth rate R on the morphologyand size of solidification microstructure.

the liquid phase. As temperature decreases, the composition of the liquidphase follows the solid line representing L Æ g until the line of twofold satu-ration is reached. At step 2, the a phase begins to form from the liquid,too. As temperature decreases further, the composition of the liquid phasefollows the solid line representing the ternary eutectic reaction L Æ g + a untilthe line of twofold saturation is reached. At step 3, the formation of a fromthe liquid stops and is taken over by the formation of b. As temperaturedecreases still further, the composition of the liquid phase follows the solidline representing the ternary eutectic reaction L Æ g + b. This can go on untilthe line representing binary A–B (the abscissa) is reached, if there is still liquidavailable to get there. The fraction of liquid fL = 0 when solidification is complete.
REFERENCES
1. Scheil, E., Z. Metallk., 34: 70, 1942.2. Flemings, M. C., Solidification Processing, McGraw-Hill, New York, 1974.3. Pohl, R. G., J. Appl. Phys., 25: 668, 1954.
3n
m3
REFERENCES 167
Tem
pera
ture
, T
wt % B
L
L
A B
A wt % B
wt %
C
LL L
fL = 1
fL = 1
fL = 0
fL = 0
1
2
2
1
3
4
(a)
(b)
Co
liquidus line
L m
n
primary primary
primary primary
primary primary
L
to pure B
to p
ure
C solidificationpath lines of twofold saturation:
m3, 3n and 34
solidificationpath
αγ
α+ αγ
γ + γ
γγ γ + α
γ + β
α
βγ
Figure 6.21 Solidification paths: (a) a binary A–B system; (b) a ternary A–B–Csystem.

4. Kou, S., Transport Phenomena and Materials Processing, Wiley, New York, 1996.5. Jackson, K. A., in Solidification, American Society for Metals, Metals Park, OH,
1971, p. 121.6. Jackson, K. A., Hunt, J. D., Uhlmann, D. R., Sewand III, T. P., Trans. AIME, 236:
149, 1966.7. Morris, L. R., and Winegard, W. C., J. Crystal Growth, 5: 361, 1969.8. Giamei, A. F., Kraft, E. H., and Lernkey, F. D., in New Trends in Materials Pro-
cessing, American Society for Metals, Metals Park, OH, 1976, p. 48.9. Kattamis, T. Z., Holmber, U. T., and Flemings, M. C., J. Inst. Metals, 55: 343, 1967.
10. David, S. A., and Vitek, J. M., in International Trends in Welding Science and Tech-nology, Eds. by S. A. David and J. M. Vitek, ASM International, Materials Park,OH, 1993, p. 147.
11. Rutter, J. W., and Chalmer, B., Can. J. Physiol., 31: 15, 1953.12. Tiller, W. A., Jackson, K. A., Rutter, J. W., and Chalmer, B., Acta Met., 1: 428, 1953.13. Mullins, W. W., and Sekerka, R. F., J. Appl. Physiol., 34: 323, 1963; 35: 444, 1964.14. Sekerka, R. F., J. Appl. Physiol., 36: 264, 1965.15. Sekerka, R. F., J. Phys. Chem. Solids, 28: 983, 1967.16. Flemings, M. C., Solidification Processing, McGraw-Hill, New York, 1974.17. Jackson, K. A., and Hunt, J. S., Acta Met., 13: 1212, 1965.18. Walton, D., Tiller, W. A., Rutter, J. W., and Winegard, W. C., Trans. AIME, 203: 1023,
1955.19. Cole, G. S., and Winegard, W. C., J. Inst. Metals, 92: 323, 1963.20. Hunt, M. D., Spittle, J. A., and Smith, R. W., The Solidification of Metals, Publica-
tion No. 110, Iron and Steel Institute, London, 1968, p. 57.21. Plaskett, T. S., and Winegard, W. C., Can. J. Physiol., 37: 1555, 1959.22. Bardsley, W., Callan, J. M., Chedzey, H. A., and Hurle, D. T. J., Solid-State Electron,
3: 142, 1961.23. Coulthard, J. O, and Elliott, R., The Solidification of Metals, Publication No. 110,
Iron and Steel Institute, 1968, p. 61.24. Liu, L. X., and Kirkaldy, J. S., J. Crystal Growth, 144: 335, 1994.25. Munitz, A., Metall. Trans., 16B: 149, 1985.26. Paul, A. J., and DebRoy, T., Rev. Modern Phys., 67: 85, 1995.27. Kou, S., and Le, Y., Metall. Trans., 13A: 1141, 1982.28. Plaskett, T. S., and Winegard, W. C., Can. J. Physiol., 38: 1077, 1960.
FURTHER READING
1. Chalmers, B., Principles of Solidification, Wiley, New York, 1964.2. Davies, G. J., Solidification and Casting, Wiley, New York, 1973.3. Davies, G. J., and Garland, J. G., Int. Metall. Rev., 20: 83, 1975.4. Flemings, M. C., Solidification Processing, McGraw-Hill, New York, 1974.5. Savage, W. F., Weld. World, 18: 89, 1980.
168 BASIC SOLIDIFICATION CONCEPTS
PROBLEMS
6.1 From the Al–Mg phase diagram, the equilibrium freezing range of 5052aluminum (essentially Al–2.5Mg) is about 40°C. Suppose the weldingspeed is 4mm/s and the diffusion coefficient DL is 3 ¥ 10-5 cm2/s. Calcu-late the minimum temperature gradient required for planar solidificationat the weld centerline. What is the corresponding cooling rate? Can thislevel of cooling rate be achieved in arc welding.
6.2 Let CE and CSM be respectively 35% and 15% Mg, and both the solidusand liquidus lines are essentially straight in the Al–Mg system. Themelting point of pure Al is 660°C, and the eutectic temperature is 451°C.What is the approximate volume fraction of the aluminum-rich dendritesin the fusion zone of autogenous 5052 aluminum weld?
6.3 It has been observed that aluminum alloys welded with the electronbeam welding process show much finer secondary dendrite arm spacingin the weld metal than those welded with GMAW. Explain why.
6.4 Which alloy has a greater tendency for planar solidification to breakdown, Al-0.01Cu or Al-6.3Cu and why?
6.5 How would preheating of the workpiece affect the secondary dendritearm spacing in welds of aluminum alloys and why?
PROBLEMS 169

7 Weld Metal Solidification I:Grain Structure
In this chapter we shall discuss the development of the grain structure in thefusion zone and the effect of welding parameters on the grain structure. Then,we shall discuss various mechanisms of and techniques for grain refining. Thegrain structure of the fusion zone can significantly affect its susceptibility tosolidification cracking during welding and its mechanical properties afterwelding.
7.1 EPITAXIAL GROWTH AT FUSION BOUNDARY
7.1.1 Nucleation Theory
Figure 7.1 shows the nucleation of a crystal from a liquid on a flat substratewith which the liquid is in contact (1, 2). The parameters gLC, gLS, and gCS arethe surface energies of the liquid–crystal interface, liquid–substrate interface,and crystal–substrate interface, respectively. According to Turnbull (2), theenergy barrier DG for the crystal to nucleate on the substrate is
(7.1)
where Tm is the equilibrium melting temperature, DHm the latent heat ofmelting, DT the undercooling below Tm, and q the contact angle. If the liquidwets the substrate completely, the contact angle q is zero and so is DG. Thismeans that the crystal can nucleate on the substrate without having to over-come any energy barrier required for nucleation. The energy barrier can besignificant if no substrate is available or if the liquid does not wet the substratecompletely.
In fusion welding the existing base-metal grains at the fusion line act as thesubstrate for nucleation. Since the liquid metal of the weld pool is in intimatecontact with these substrate grains and wets them completely (q = 0), crystalsnucleate from the liquid metal upon the substrate grains without difficulties.When welding without a filler metal (autogenous welding), nucleation occursby arranging atoms from the liquid metal upon the substrate grains without
DD D
GT
H T=
( )- +( )4
32 3
23pg
q qLC3
m2
m
cos cos
170
Welding Metallurgy, Second Edition. Sindo KouCopyright 2003 John Wiley & Sons, Inc.
ISBN: 0-471-43491-4

altering their existing crystallographic orientations. Such a growth initiationprocess, shown schematically in Figure 7.2, is called epitaxial growth or epi-taxial nucleation. The arrow in each grain indicates its <100> direction. Formaterials with a face-centered-cubic (fcc) or body-centered-cubic (bcc) crystalstructure, the trunks of columnar dendrites (or cells) grow in the <100> direc-tion. As shown, each grain grows without changing its <100> direction.
EPITAXIAL GROWTH AT FUSION BOUNDARY 171
Liquid (L)
Substrate (S)
Crystal (C)
Radiu
s (r)
LS CS
LC
γ
γ γθ
Figure 7.1 Spherical cap of a crystal nucleated on a planar substrate from a liquid.
Base Metal(substrate)
Fus
ion
Line
Wel
ding
Dire
ctio
n
Weld Pool(liquid)
<100>
EpitaxialGrowth
Grain(crystal)
Figure 7.2 Epitaxial growth of weld metal near fusion line.

7.1.2 Epitaxial Growth in Welding
Savage et al. (3–8) first discovered epitaxial growth in fusion welding. By usingthe Laue x-ray back-reflection technique, they confirmed the continuity ofcrystallographic orientation across the fusion boundary. Savage and Hrubec(6) also studied epitaxial growth by using a transparent organic material (camphene) as the workpiece, as shown in Figure 7.3. Three grains are visiblein the base metal at the fusion line. All dendrites growing from each grainpoint in one direction, and this direction varies from one grain to another.From the welds shown in Figure 7.4 epitaxial growth at the fusion line isevident (9).
Epitaxial growth can also occur when the workpiece is a material of morethan one phase. Elmer et al. (10) observed epitaxial growth in electron beamwelding of an austenitic stainless steel consisting of both austenite and ferrite.As shown in Figure 7.5, both austenite (A) and ferrite (F) grow epitaxially atthe fusion line (dotted line) from the base metal to the weld metal (resolidi-fied zone).
7.2 NONEPITAXIAL GROWTH AT FUSION BOUNDARY
When welding with a filler metal (or joining two different materials), the weldmetal composition is different from the base metal composition, and the weldmetal crystal structure can differ from the base metal crystal structure. When
172 WELD METAL SOLIDIFICATION I: GRAIN STRUCTURE
Figure 7.3 Epitaxial growth during the “welding” of camphene in the area indicatedby the square (magnification 75¥). Modified from Savage (6).

this occurs, epitaxial growth is no longer possible and new grains will have tonucleate at the fusion boundary.
Nelson et al. (11) welded a type 409 ferritic stainless steel of the bcc struc-ture with a Monel (70Ni–30Cu) filler metal of the fcc structure and produceda fcc weld metal. Figure 7.6 shows the fusion boundary microstructure. Theyproposed that, when the base metal and the weld metal exhibit two differentcrystal structures at the solidification temperature, nucleation of solid weldmetal occurs on heterogeneous sites on the partially melted base metal at thefusion boundary. The fusion boundary exhibits random misorientationsbetween base metal grains and weld metal grains as a result of heterogeneousnucleation at the pool boundary. The weld metal grains may or may not follow
NONEPITAXIAL GROWTH AT FUSION BOUNDARY 173
100 µm
FLGB 2
GB 2GB 1FL
GB 1
basemetal(b)
weldmetal
Figure 7.4 Epitaxial growth. (a) Near the fusion boundary of electron beam weld ofC103 alloy (magnification 400¥). Reprinted from O’Brien (9). Courtesy of AmericanWelding Society. (b) Near the fusion boundary of as-cast Al–4.5Cu welded with 4043filler (Al–5Si).
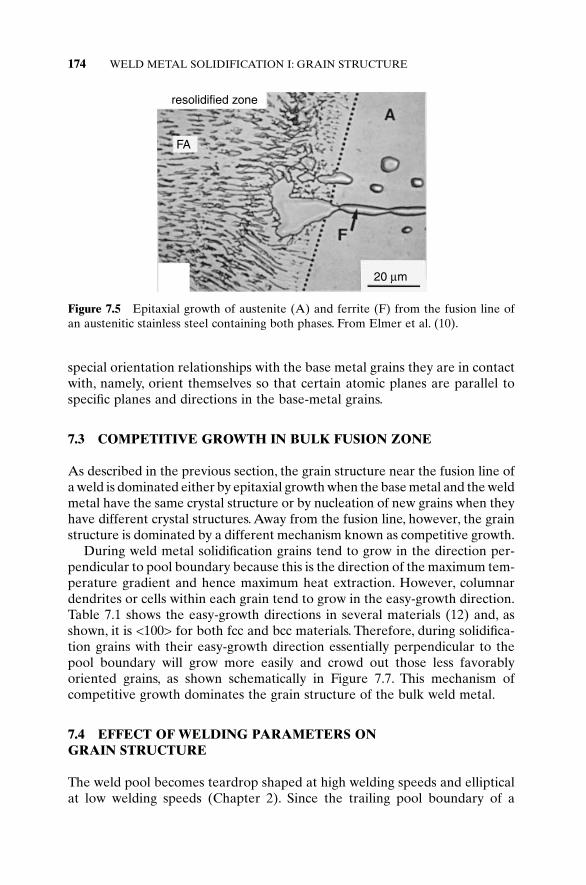
special orientation relationships with the base metal grains they are in contactwith, namely, orient themselves so that certain atomic planes are parallel tospecific planes and directions in the base-metal grains.
7.3 COMPETITIVE GROWTH IN BULK FUSION ZONE
As described in the previous section, the grain structure near the fusion line ofa weld is dominated either by epitaxial growth when the base metal and the weldmetal have the same crystal structure or by nucleation of new grains when theyhave different crystal structures. Away from the fusion line, however, the grainstructure is dominated by a different mechanism known as competitive growth.
During weld metal solidification grains tend to grow in the direction per-pendicular to pool boundary because this is the direction of the maximum tem-perature gradient and hence maximum heat extraction. However, columnardendrites or cells within each grain tend to grow in the easy-growth direction.Table 7.1 shows the easy-growth directions in several materials (12) and, asshown, it is <100> for both fcc and bcc materials. Therefore, during solidifica-tion grains with their easy-growth direction essentially perpendicular to thepool boundary will grow more easily and crowd out those less favorably oriented grains, as shown schematically in Figure 7.7. This mechanism of competitive growth dominates the grain structure of the bulk weld metal.
7.4 EFFECT OF WELDING PARAMETERS ON GRAIN STRUCTURE
The weld pool becomes teardrop shaped at high welding speeds and ellipticalat low welding speeds (Chapter 2). Since the trailing pool boundary of a
174 WELD METAL SOLIDIFICATION I: GRAIN STRUCTURE
resolidified zone
FA
20 µm
Figure 7.5 Epitaxial growth of austenite (A) and ferrite (F) from the fusion line ofan austenitic stainless steel containing both phases. From Elmer et al. (10).

Figure 7.6 Fusion boundary microstructure in 409 ferritic stainless steel (bcc) weldedwith Monel filler wire (fcc): (a) optical micrograph; (b) scanning electron micrograph.White arrows: fusion boundary; dark arrows: new grains nucleated along fusion bound-ary. Reprinted from Nelson et al. (11). Courtesy of American Welding Society.
TABLE 7.1 Easy-Growth Directions
Crystal Structure Easy-Growth Direction Examples
Face-centered-cubic (fcc) <100> Aluminum alloys,austenitic stainless steels
Body-centered-cubic (bcc) <100> Carbon steels, ferriticstainless steels
Hexagonal-close-packed (hcp) <101̄0> Titanium, magnesium
Body-centered-tetragonal (bct) <110> Tin
Source: From Chalmers (12).

teardrop-shaped weld pool is essentially straight, the columnar grains are alsoessentially straight in order to grow perpendicular to the pool boundary, asshown schematically in Figure 7.8a. On the other hand, since the trailingboundary of an elliptical weld pool is curved, the columnar grains are also
176 WELD METAL SOLIDIFICATION I: GRAIN STRUCTURE
BaseMetal
Fus
ion
Line
Wel
ding
Dire
ctio
n
WeldPool
<100>
CompetitiveGrowth
EpitaxialGrowth
Figure 7.7 Competitive growth in bulk fusion zone.
Figure 7.8 Effect of welding speed on columnar-grain structure in weld metal: (a, b)regular structure; (c, d) with axial grains.

curved in order to grow perpendicular to the pool boundary, as shown inFigure 7.8b. Figure 7.9 shows the gas–tungsten arc welds of high-purity(99.96%) aluminum made by Arata et al. (13). At the welding speed of 1000mm/min straight columnar grains point toward the centerline, while at250mm/min curved columnar grains point in the welding direction.
Axial grains can also exist in the fusion zone. Axial grains can initiate fromthe fusion boundary at the starting point of the weld and continue along thelength of the weld, blocking the columnar grains growing inward from thefusion lines. Like other columnar grains, these axial grains also tend to growperpendicular to the weld pool boundary. With a teardrop-shaped pool, onlya short section of the trailing pool boundary can be perpendicular to the axialdirection, and the region of axial grains is thus rather narrow, as shown inFigure 7.8c.With an elliptical weld pool, however, a significantly longer sectionof the trailing pool boundary can be perpendicular to the axial direction, andthe region of axial grains can thus be significantly wider, as shown in Figure7.8d. Figure 7.10 shows aluminum welds with these two types of grain
EFFECT OF WELDING PARAMETERS ON GRAIN STRUCTURE 177
Figure 7.9 Gas–tungsten arc welds of 99.96% aluminum: (a) 1000mm/min weldingspeed; (b) 250mm/min welding speed. From Arata et al. (13).

structure. Axial grains have been reported in aluminum alloys (14–16),austenitic stainless steels (17), and iridium alloys (18).
7.5 WELD METAL NUCLEATION MECHANISMS
The mechanisms of nucleation of grains in the weld metal will be discussed in the present section. In order to help understand these mechanisms,the microstructure of the material around the weld pool will be discussed first.
Figure 7.11 shows a 2219 aluminum (essentially Al–6.3% Cu) weld pool quenched with ice water during GTAW (19). The S + L region aroundthe weld pool consists of two parts (Figure 7.11a): the partially melted material
178 WELD METAL SOLIDIFICATION I: GRAIN STRUCTURE
Figure 7.10 Axial grains in GTAW: (a) 1100 aluminum at 12.7mm/s welding speed;(b) 2014 aluminum at 3.6mm/s welding speed.

(clear) associated with the leading portion of the pool boundary and themushy zone (shaded) associated with the trailing portion. Area 1 (Figure7.11b) covers a small portion of the partially melted material. Area 2 (Figure7.11c) covers a small portion of the mushy zone as well as the partially meltedmaterial.
Based on Figure 7.11, the microstructure around the weld pool boundaryof an alloy is shown schematically in Figure 7.12, along with thermal cycles atthe weld centerline and at the fusion line and a phase diagram. The eutectic-type phase diagram is common among aluminum alloys. As shown, the mushy
WELD METAL NUCLEATION MECHANISMS 179
Figure 7.11 Weld pool of 2219 aluminum quenched during GTAW: (a) overall view;(b) microstructure at position 1; (c) microstructure at position 2. Modified from Kouand Le (19). Courtesy of American Welding Society.

zone behind the trailing portion of the pool boundary consists of solid den-drites (S) and the interdendritic liquid (L). The partially melted materialaround the leading portion of the pool boundary, on the other hand, consistsof solid grains (S) that are partially melted and the intergranular liquid (L).In summary, there is a region of solid–liquid mixture surrounding the weldpool of an alloy.
Figure 7.13a shows three possible mechanisms for new grains to nucleateduring welding: dendrite fragmentation, grain detachment, and heterogeneousnucleation (19). Figure 7.13b shows the fourth nucleation mechanism, surfacenucleation. These mechanisms, which have been well documented in metalcasting, will be described briefly below. The techniques for producing newgrains in the weld metal by these mechanisms will be discussed in a subse-quent section.
7.5.1 Dendrite Fragmentation
Weld pool convection (Chapter 4) can in principle cause fragmentation of den-drite tips in the mushy zone, as illustrated in Figure 7.13a. These dendrite frag-ments are carried into the bulk weld pool and act as nuclei for new grains toform if they survive the weld pool temperature. It is interesting to note thatthis mechanism has been referred to frequently as the grain refining mecha-nism for weld metals without proof.
180 WELD METAL SOLIDIFICATION I: GRAIN STRUCTURE
pool (L)
distance, x
time, t
T
centerline
fusion line
centerline
fusion line
fusion line
base metal (S)
weldingdirection
TE
partially meltedmaterial (S+L)
fusi
onzo
ne (
S)
TL
(a)
(b)
(c)
Concentration, CA
Tem
pera
ture
, T
LS S + L
TL
TE
Co
mushy zone (S+L)
partially melted zone
Figure 7.12 Microstructure around the weld pool boundary: (a) phase diagram; (b)thermal cycles; (c) microstructure of solid plus liquid around weld pool.
7.5.2 Grain Detachment
Weld pool convection can also cause partially melted grains to detach them-selves from the solid–liquid mixture surrounding the weld pool, as shown inFigure 7.13a. Like dendrite fragments, these partially melted grains, if theysurvive in the weld pool, can act as nuclei for the formation of new grains inthe weld metal.
7.5.3 Heterogeneous Nucleation
Foreign particles present in the weld pool upon which atoms in the liquidmetal can be arranged in a crystalline form can act as heterogeneous nuclei.Figure 7.14 depicts heterogeneous nucleation and the growth of new grains inthe weld metal. Figure 7.15a shows two (dark) heterogeneous nuclei at thecenters of two equiaxed grains in an autogenous gas–tungsten arc weld of a6061 aluminum containing 0.043% titanium (20). Energy dispersive spec-trometry (EDS) analysis, shown in Figure 7.15b, indicates that these nuclei arerich in titanium (boron is too light to be detected by EDS). A scanning elec-tron microscopy (SEM) image of a nucleus is shown in Figure 7.15c. The
WELD METAL NUCLEATION MECHANISMS 181
Figure 7.13 Nucleation mechanisms during welding: (a) top view; (b) side view.Reprinted from Kou and Le (19). Courtesy of American Welding Society.
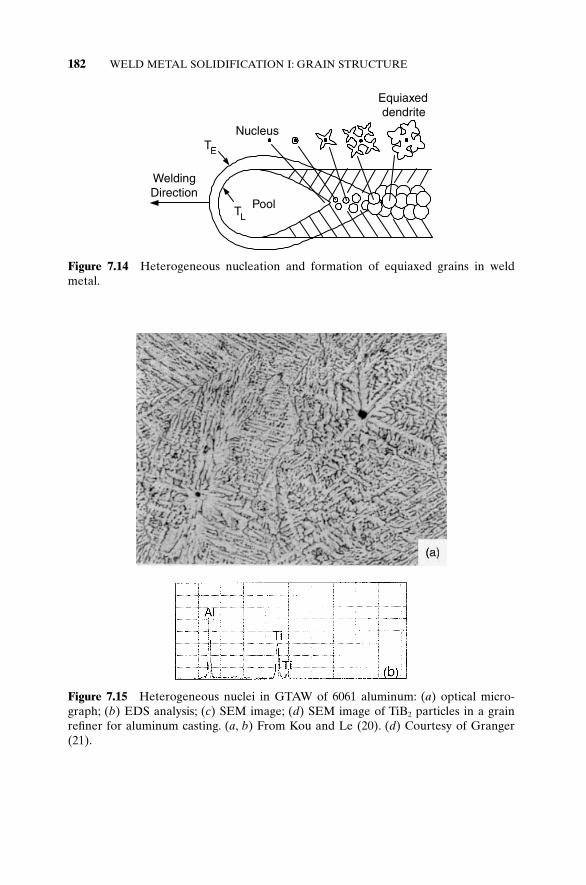
182 WELD METAL SOLIDIFICATION I: GRAIN STRUCTURE
TE
TLPool
WeldingDirection
Nucleus
Equiaxeddendrite
Figure 7.14 Heterogeneous nucleation and formation of equiaxed grains in weldmetal.
Figure 7.15 Heterogeneous nuclei in GTAW of 6061 aluminum: (a) optical micro-graph; (b) EDS analysis; (c) SEM image; (d) SEM image of TiB2 particles in a grainrefiner for aluminum casting. (a, b) From Kou and Le (20). (d) Courtesy of Granger(21).
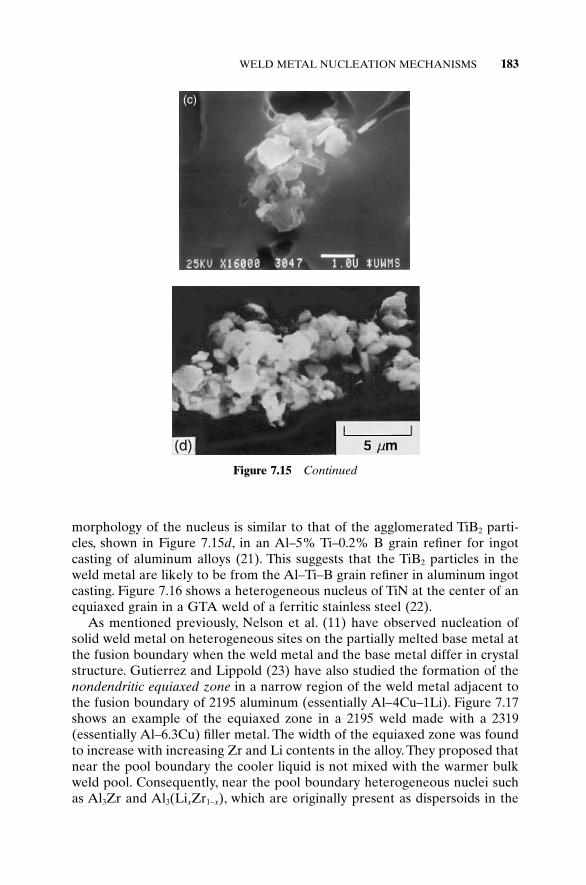
WELD METAL NUCLEATION MECHANISMS 183
(c)
Figure 7.15 Continued
morphology of the nucleus is similar to that of the agglomerated TiB2 parti-cles, shown in Figure 7.15d, in an Al–5% Ti–0.2% B grain refiner for ingotcasting of aluminum alloys (21). This suggests that the TiB2 particles in theweld metal are likely to be from the Al–Ti–B grain refiner in aluminum ingotcasting. Figure 7.16 shows a heterogeneous nucleus of TiN at the center of anequiaxed grain in a GTA weld of a ferritic stainless steel (22).
As mentioned previously, Nelson et al. (11) have observed nucleation ofsolid weld metal on heterogeneous sites on the partially melted base metal atthe fusion boundary when the weld metal and the base metal differ in crystalstructure. Gutierrez and Lippold (23) have also studied the formation of thenondendritic equiaxed zone in a narrow region of the weld metal adjacent tothe fusion boundary of 2195 aluminum (essentially Al–4Cu–1Li). Figure 7.17shows an example of the equiaxed zone in a 2195 weld made with a 2319(essentially Al–6.3Cu) filler metal. The width of the equiaxed zone was foundto increase with increasing Zr and Li contents in the alloy. They proposed thatnear the pool boundary the cooler liquid is not mixed with the warmer bulkweld pool. Consequently, near the pool boundary heterogeneous nuclei suchas Al3Zr and Al3(LixZr1-x), which are originally present as dispersoids in the

base metal, are able to survive and form the nondendritic equiaxed zone, asillustrated in Figure 7.18. By using a Gleeble thermal simulator, Kostrivas andLippold (24) found that the equiaxed zone could be formed by heating in thetemperature range of approximately 630–640°C and at temperatures above640°C the normal epitaxial growth occurred. This is consistent with the pro-posed mechanism in the sense that the heterogeneous nuclei can only survivenear the cooler pool boundary and not in the warmer bulk weld pool.
In the metal casting process the metal is superheated during melting beforeit is cast. Since the nuclei are unstable at higher temperatures, they dissolve inthe superheated liquid in the casting process. As such, there is no equiaxed
184 WELD METAL SOLIDIFICATION I: GRAIN STRUCTURE
Figure 7.16 TiN particle as heterogeneous nucleus in GTAW of ferritic stainless steel.Reprinted from Villafuerte and Kerr (22).
Figure 7.17 Nondendritic equiaxed zone in narrow region adjacent to fusion bound-ary of 2195 Al–Cu–Li alloy. Reprinted from Gutierrez and Lippold (23). Courtesy ofAmerican Welding Society.

zone in the weld of an as-cast alloy 2195. However, the equiaxed zone occursagain if the as-cast alloy 2195 is solution heat treated first and then welded.Gutierrez and Lippold (23) proposed that because of the relatively low solu-bility of Zr in solid aluminum,Al3Zr and Al3(LixZr1-x) particles precipitate outof the solid solution during heat treating.
7.5.4 Surface Nucleation
The weld pool surface can be undercooled thermally to induce surface nucle-ation by exposure to a stream of cooling gas or by instantaneous reduction orremoval of the heat input. When this occurs, solid nuclei can form at the weldpool surface, as illustrated in Figure 7.13b. These solid nuclei then grow intonew grains as they shower down from the weld pool surface due to their higherdensity than the surrounding liquid metal.
7.5.5 Effect of Welding Parameters on Heterogeneous Nucleation
Before leaving this section, an important point should be made about theeffect of welding parameters on heterogeneous nucleation. Kato et al. (25),Arata et al. (26), Ganaha et al. (16), and Kou and Le (20) observed in com-mercial aluminum alloys that the formation of equaixed grains is enhanced byhigher heat inputs and welding speeds. As shown in Figure 7.19, equiaxedgrains can form a band along the centerline of the weld and block off colum-nar grains as the heat input and welding speed are increased (20). Kou and Le(27) showed in Figure 7.20 that, as the heat input and the welding speed areincreased, the temperature gradient (G) at the end of the weld pool is reduced.Furthermore, as the welding speed is increased, the solidification rate of the
WELD METAL NUCLEATION MECHANISMS 185
weldingdirection
zone of nondendriticequiaxed grains formedby hetrogeneousnucleation
base metalcontainingnuclei
weak flow nearpool boundary
fusionboundary
cooler unmixedliquid containingnuclei
nuclei unableto survive inwarmer bulkweld pool
normal dendriticstructure
Figure 7.18 Mechanism for formation of nondendritic equiaxed zone in Al–Cu–Liweld according to Gutierrez and Lippold (23).

weld metal (R) is also increased. As illustrated in Figure 7.21, the ratio G/Rshould be decreased and the constitutional supercooling (28) in front of theadvancing solid–liquid interface should, therefore, be increased. Kato et al.(25) and Arata et al. (26) proposed that the transition to an equiaxed grain
186 WELD METAL SOLIDIFICATION I: GRAIN STRUCTURE
Figure 7.19 Effect of welding parameters on grain structure in GTAW of 6061 aluminum: (a) 70A ¥ 11V heat input and 5.1mm/s welding speed; (b) 120A ¥ 11Vheat input and 12.7mm/s welding speed. From Kou and Le (20).
Pool Pool
175 A 15 V
20 mm/sec
0 050 50100
Welding direction
1100 aluminum
500500
10001000
Tem
pera
ture
, o C
Tem
pera
ture
, o C 60 A10 V
1.7 mm/sec
Distance, mm(a)
Distance, mm(b)
Figure 7.20 Effect of welding parameters on temperature gradient at weld pool endof 1100 aluminum: (a) higher welding speed and heat input; (b) lower welding speedand heat input. From Kou and Le (27).

structure is due to the existence of a sufficiently long constitutionally under-cooled zone in the weld pool. Ganaha et al. (16), however, indicated that thetransition is not due to constitutional supercooling alone. In fact, it wasobserved that significant amounts of equiaxed grains formed only in thosealloys containing around or more than 0.01wt% Ti or 0.10wt% Zr. Further-more, tiny second-phase particles rich in titanium and/or zirconium (possiblyTixZryC compounds) existed at the dendrite centers of the equiaxed grains.Consequently, it was proposed that equiaxed grains in the fusion zone formby heterogeneous nucleation aided by constitutional supercooling. The obser-vation of Ganaha et al. (16) was confirmed by Kou and Le (19, 20, 29). Theeffect of welding parameters on grain refining in aluminum welds was dis-cussed by Kou and Le (20).
7.6 GRAIN STRUCTURE CONTROL
The weld metal grain structure can affect its mechanical properties signifi-cantly. Arata et al. (13) tensile tested aluminum welds in the welding direc-tion. The weld metal ductility of 99.96% aluminum dropped greatly when thecolumnar grains pointed to the weld centerline (Figure 7.9a), that is, when thegrains became nearly normal to the tensile axis. Also, the weld metal tensilestrength of 5052 aluminum increased as the amount of equiaxed grainsincreased.
GRAIN STRUCTURE CONTROL 187
Figure 7.21 Effect of welding parameters on heterogeneous nucleation: (a) low constitutional supercooling at low welding speed and heat input; (b) heterogeneousnucleation aided by high constitutional supercooling at high welding speed and heatinput.

The formation of fine equiaxed grains in the fusion zone has two mainadvantages. First, fine grains help reduce the susceptibility of the weld metalto solidification cracking during welding (Chapter 11). Second, fine grains canimprove the mechanical properties of the weld, such as the ductility and frac-ture toughness in the case of steels and stainless steels. Therefore, much efforthas been made to try to grain refine the weld fusion zone. This includes theapplication of grain refining techniques that were originally developed forcasting. Described below are several techniques that have been used to controlthe weld metal grain structure.
7.6.1 Inoculation
This technique has been used extensively in metal casting. It involves the addi-tion of nucleating agents or inoculants to the liquid metal to be solidified. Asa result of inoculation, heterogeneous nucleation is promoted and the liquidmetal solidifies with very fine equiaxed grains. In the work by Davies andGarland (1), inoculant powders of titanium carbide and ferrotitanium–titanium carbide mixtures were fed into the weld pool during the submergedarc welding of a mild steel and very fine grains were obtained. Similarly,Heintze and McPherson (30) grain refined submerged arc welds of C-Mn andstainless steels with titanium. Figure 7.22 shows the effect of inoculation onthe grain structure of the weld fusion zone of the C-Mn steel. It is interestingto note that Petersen (31) has grain refined Cr–Ni iron base alloys with alu-minum nitride and reported a significant increase in the ductility of the resul-tant welds, as shown in Figure 7.23.
Pearce and Kerr (32), Matsuda et al. (33), Yunjia et al. (34), and Sundaresan et al. (35) grain refined aluminum welds by using Ti and Zr asinoculants. Yunjia et al. (34) showed the presence of TiAl3 particles at theorigins of equiaxed grains in Ti microalloyed 1100 aluminum welds. Figure 7.24shows grain refining in a 2090 Al–Li–Cu alloy gas–tungsten arc welded with a2319 Al–Cu filler inoculated with 0.38% Ti (35).
7.6.2 External Excitation
Different dynamic grain refining techniques, such as liquid pool stirring, moldoscillation, and ultrasonic vibration of the liquid metal, have been employedin metal casting, and recently similar techniques, including weld pool stirring,arc oscillation, and arc pulsation, have been applied to fusion welding.
A. Weld Pool Stirring Weld pool stirring can be achieved by electromag-netic stirring, as shown in Figure 7.25, by applying an alternating magnetic fieldparallel to the welding electrode (36). Matsuda et al. (37, 38) and Pearce andKerr (32) increased the degree of grain refinement in aluminum alloys con-taining small amounts of titanium by electromagnetic pool stirring. Pearce andKerr (32) suggested that the increased grain refinement was due to heteroge-
188 WELD METAL SOLIDIFICATION I: GRAIN STRUCTURE

neous nucleation, rather than to dendrite fragmentation. This is because inGTAW, unlike ingot casting, the liquid pool and the mushy zone are rathersmall, and it is therefore difficult for the liquid metal in the pool to penetrateand break away dendrites, which are so short and so densely packed together.
GRAIN STRUCTURE CONTROL 189
Figure 7.22 Effect of inoculation on grain structure in submerged arc welds of C–Mnsteel (magnification 6¥): (a) without inoculation; (b) inoculation with titanium.Reprinted from Heintze and McPherson (30). Courtesy of American Welding Society.
0 0.04 0.120.08 0.16
100
0
200
300
400
Grain size, mm
Elo
ngat
ion,
%
Figure 7.23 Effect of grain size on weld metal ductility of a Cr–Ni iron base alloy at925°C. Modified from Petersen (31).

Stirring of the weld pool tends to lower the weld pool temperature, thushelping heterogeneous nuclei survive. Figure 7.26 shows the increased grainrefinement by weld pool stirring in an Al–2.5wt% Mg alloy containing 0.11wt% Ti (32). As shown in Figure 7.27, Villafuerte and Kerr (39) grainrefined a weld of 409 ferritic stainless steel containing 0.32% Ti by the sametechnique. The higher the Ti content, the more effective grain refining was.Titanium-rich particles were found at the origin of equiaxed grains, suggest-ing heterogeneous nucleation as the grain refining mechanism.
Pearce and Kerr (32) also found that by applying weld pool stirring, thepartially melted grains along the leading portion of the pool boundary, if theyare only loosely held together, could be swept by the liquid metal into the weld
190 WELD METAL SOLIDIFICATION I: GRAIN STRUCTURE
Figure 7.24 Effect of inoculation on grain structure in GTAW of 2090 Al–Li–Cu alloy:(a) 2319 Al–Cu filler metal; (b) 2319 Al–Cu filler metal inoculated with 0.38% Ti.Reprinted from Sundaresan et al. (35).
magnetic field
current field
coil
weld pool
workpiece
tungstenelectrode
welding direction
Figure 7.25 Schematic sketch showing application of external magnetic field duringautogenous GTAW. Modified from Matsuda et al. (36).

GRAIN STRUCTURE CONTROL 191
Figure 7.26 Widening of equiaxed zone in GTAW of alloy Al–2.5Mg–0.011Ti by magnetic stirring (at dotted line). Reprinted from Pearce and Kerr (32).
Figure 7.27 Effect of electromagnetic pool stirring on grain structure in GTAW of409 ferritic stainless steel: (a) without stirring; (b) with stirring. Reprinted from Villa-fuerte and Kerr (39). Courtesy of American Welding Society.

pool, where they served as nuclei. Significant amounts of equiaxed grains wereso produced in gas–tungsten arc welds of a 7004 aluminum alloy containingvery little Ti.
B. Arc Oscillation Arc oscillation, on the other hand, can be produced bymagnetically oscillating the arc column using a single- or multipole magneticprobe or by mechanically vibrating the welding torch. Davies and Garland (1)produced grain refining in gas–tungsten arc welds of Al–2.5wt% Mg alloy bytorch vibration. Resistance to weld solidification cracking was improved inthese welds. Figure 7.28 shows the effect of the vibration amplitude on thegrain size (1). Dendrite fragmentation was proposed as the grain refiningmechanism. It is, however, suspected that heterogeneous nucleation couldhave been the real mechanism, judging from the fact that the Al–2.5wt% Mgused actually contained about 0.15wt%Ti. Venkataraman et al. (40, 41)obtained grain refining in the electroslag welds of steels by electrode vibra-tion and enhanced electromagnetic stirring of the weld pool and improvedtheir toughness and resistance to centerline cracking. Dendrite fragmentationwas also considered as the mechanism for grain refining.
Sharir et al. (42) obtained grain refinement in gas–tungsten arc welds ofpure tantalum sheets by arc oscillation. Due to the high melting point of puretantalum (about 3000°C), the surface heat loss due to radiation was rather sig-nificant. As a result, the liquid metal was cooled down rapidly and was in factundercooled below its melting point when the heat source was deflected awayduring oscillated arc welding. This caused surface nucleation and resulted ingrain refinement.
192 WELD METAL SOLIDIFICATION I: GRAIN STRUCTURE
150A, 200 mm/minArc gap 2.4 mmArc vibration frequency 10 Hz
Arc vibration amplitude, mm
Gra
in s
ize,
mm
0 0.2 0.4 0.6 0.8 1.0 1.2 1.4
0.2
0.4
0.1
0.3
0.5
Parallel to welding directionPerpendicular to weldingdirection
Figure 7.28 Effect of arc vibration amplitude on grain size in Al–2.5Mg welds. Mod-ified from Davies and Garland (1).

Sundaresan and Janaki Ram (43) grain refined Ti alloys by magnetic arcoscillation and improved the weld metal tensile ductility. No specific grainrefining mechanism was identified.
C. Arc Pulsation Arc pulsation can be obtained by pulsating the weldingcurrent. Sharir et al. (42) also obtained grain refinement in gas–tungsten arcwelds of pure tantalum sheets by arc pulsation. The liquid metal was under-cooled when the heat input was suddenly reduced during the low-current cycleof pulsed arc welding. This caused surface nucleation and resulted in grainrefinement.
Figure 7.29 shows grain refining in a pulsed arc weld of a 6061 aluminumalloy containing 0.04wt% Ti (44). Heterogeneous nucleation, aided by thermalundercooling resulting from the high cooling rate produced by the relativelyhigh welding speed used and arc pulsation, could have been responsible forthe grain refinement in the weld.
7.6.3 Stimulated Surface Nucleation
Stimulated surface nucleation was originally used by Southin (45) to obtaingrain refinement in ingot casting. A stream of cool argon gas was directed onthe free surface of molten metal to cause thermal undercooling and inducesurface nucleation. Small solidification nuclei formed at the free surface andshowered down into the bulk liquid metal.These nuclei then grew and becamesmall equiaxed grains. This technique was used to produce grain refining inAl–2.5Mg welds by Davies and Garland (1) and in Ti alloys by Wells (46).
GRAIN STRUCTURE CONTROL 193
Figure 7.29 Equiaxed grains in pulsed arc weld of 6061 aluminum (magnification 9¥).From Kou and Le (44).

7.6.4 Manipulation of Columnar Grains
Kou and Le (14, 15, 47) manipulated the orientation of columnar grains in aluminum welds by low-frequency arc oscillation. Figure 7.30a shows a 2014aluminum weld made with 1Hz transverse arc oscillation, that is, with arc oscillating normal to the welding direction (14). Similarly, Figure 7.30b showsa 5052 aluminum weld made with 1Hz circular arc oscillation (15). In both
194 WELD METAL SOLIDIFICATION I: GRAIN STRUCTURE
Figure 7.30 Grain structures in oscillated arc welds of aluminum alloys. (a) For alloy2014 with transverse arc oscillation. From Kou and Le (14). (b) For alloy 5052 with circular arc oscillation. From Kou and Le (15).

cases, columnar grains grew perpendicular to the trailing portion of the weldpool, and the weld pool in turn followed the path of the moving oscillatingarc.
As will be discussed later in Chapter 11, periodic changes in grain orienta-tion, especially that produced by transverse arc oscillation at low frequencies,can reduce solidification cracking and improve both the strength and ductil-ity of the weld metal (47).
7.6.5 Gravity
Aidun and Dean (48) gas–tungsten arc welded 2195 aluminum under the highgravity produced by a centrifuge welding system and eliminated the narrowband of nondendritic equiaxed grains along the fusion boundary. As shown inFigure 7.31, the band disappeared when gravity was increased from 1 g to 10g. It was suggested that buoyancy convection enhanced by high gravitycaused Al3Zr and Al3(LixZr1-x) nuclei near the pool boundary to be swept intothe bulk pool and completely dissolved, thus eliminating formation ofequiaxed grains by heterogeneous nucleation.
REFERENCES
1. Davies, G. J., and Garland, J. G., Int. Metall. Rev., 20(196): 83, 1975.2. Turnbull, D., J. Chem. Physiol., 18: 198, 1950.3. Savage, W. F., Lundin, C. D., and Aronson, A. H., Weld. J., 44: 175s, 1965.4. Savage, W. F., and Aronson, A. H., Weld. J., 45: 85s, 1966.5. Savage, W. F., Lundin, C. D., and Chase, T. F., Weld. J., 47: 522s, 1968.6. Savage, W. F., and Hrubec, R. J., Weld. J., 51: 260s, 1972.
REFERENCES 195
Figure 7.31 Effect of gravity on grain structure in GTAW of 2090 Al–Li–Cu alloy: (a)1g; (b) 10g and with equiaxed zone (EQZ) near the fusion boundary eliminated.Reprinted from Aidun and Dean (48). Courtesy of American Welding Society.

7. Savage, W. F., Weld. World, 18: 89, 1980.8. Savage, W. F., in Weld Imperfections, Eds. A. R. Hunger and R. E. Lewis, Addison-
Wesley, Reading, MA, 1968, p. 13.9. 18th ed., O’brien R. L., Ed., Jefferson’s Welding Encyclopedia, American Welding
Society, Miami, FL, 1997, p. 316.10. Elmer, J. W., Allen, S. M., and Eagar, T. W., Metall. Trans. A, 20A: 2117, 1989.11. Nelson, T. W., Lippold, J. C., and Mills, M. J., Weld. J., 78: 329s, 1999.12. Chalmers, B., Principles of Solidification, Wiley, New York, 1964, p. 117.13. Arata, Y., Matsuda, F., Mukae, S., and Katoh, M., Trans. JWRI, 2: 55, 1973.14. Kou, S., and Le, Y., Metall. Trans., 16A: 1887, 1985.15. Kou, S., and Le, Y., Metall. Trans., 16A: 1345, 1985.16. Ganaha, T., Pearce, B. P., and Kerr, H. W., Metall. Trans., 11A: 1351, 1980.17. Kou, S., and Le, Y., Metall. Trans., 13A: 1141, 1982.18. David, S. A., and Liu, C. T., Metals Technol., 7: 102, 1980.19. Kou, S., and Le, Y., Weld. J., 65: 305s, 1986.20. Kou, S., and Le, Y., Metall. Trans., 19A: 1075, 1988.21. Granger, D. A., Practical Aspects of Grain Refining Aluminum Alloy Melts, paper
presented at International Seminar on Refining and Alloying of Liquid Aluminumand Ferro-Alloys, Trondheim, Norway, August 26–28, 1985.
22. Villafuerte, J. C., and Kerr, H. W., in International Trends in Welding Science andTechnology, Eds. S. A. David and J. M. Vitek, ASM International, Materials Park,OH, March 1993, p. 189.
23. Gutierrez, A., and Lippold, J. C., Weld. J., 77: 123s, 1998.24. Kostrivas, A., and Lippold, J. C., Weld. J., 79: 1s, 2000.25. Kato, M., Matsuda, F., and Senda, T., Weld. Res. Abroad, 19: 26, 1973.26. Arata, Y., Matsuda, F., and Matsui, A., Trans. Jpn. Weld. Res. Inst., 3: 89, 1974.27. Kou, S., and Le, Y., unpublished research, University of Wisconsin, Madison, 1985.28. Rutter, J. W., and Chalmer, B., Can. J. Physiol., 31: 15, 1953.29. Le,Y., and Kou, S., in Advances in Welding Science and Technology, Ed. S.A. David,
ASM International, Metals Park, OH, 1986, p. 139.30. Heintze, G. N., and McPherson, R., Weld. J., 65: 71s, 1986.31. Petersen, W. A., Weld. J., 53: 74s, 1973.32. Pearce, B. P., and Kerr, H. W., Metall. Trans., 12B: 479, 1981.33. Matsuda, F., Nakata, K., Tsukamoto, K., and Arai, K., Trans. JWRI, 12: 93, 1983.34. Yunjia, H., Frost, R. H., Olson, D. L., and Edwards, G. R., Weld. J., 68: 280s, 1983.35. Sundaresan, S., Janaki Ram, G. D., Murugesan, R., and Viswanathan, N., Sci.
Technol. Weld. Join., 5: 257, 2000.36. Matsuda, F., Ushio, M., Nakagawa, H., and Nakata, K., in Proceedings of the
Conference on Arc Physics and Weld Pool Behavior, Vol. 1, Welding Institute,Cambridge, 1980, p. 337.
37. Matsuda, F., Nakagawa, H., Nakata, K., and Ayani, R., Trans. JWRI, 7: 111, 1978.38. Matsuda, F., Nakata, K., Miyawaga,Y., Kayano,T., and Tsukarnoto, K., Trans. JWRI,
7: 181, 1978.39. Villafuerte, J. C., and Kerr, H. W., Weld. J., 69: 1s, 1990.
196 WELD METAL SOLIDIFICATION I: GRAIN STRUCTURE
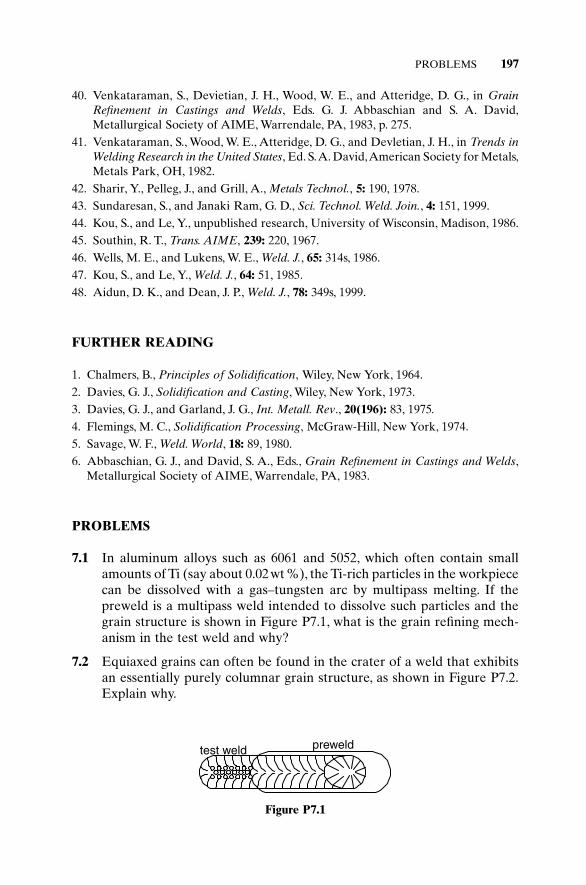
40. Venkataraman, S., Devietian, J. H., Wood, W. E., and Atteridge, D. G., in GrainRefinement in Castings and Welds, Eds. G. J. Abbaschian and S. A. David,Metallurgical Society of AIME, Warrendale, PA, 1983, p. 275.
41. Venkataraman, S., Wood, W. E., Atteridge, D. G., and Devletian, J. H., in Trends inWelding Research in the United States, Ed. S.A. David,American Society for Metals,Metals Park, OH, 1982.
42. Sharir, Y., Pelleg, J., and Grill, A., Metals Technol., 5: 190, 1978.43. Sundaresan, S., and Janaki Ram, G. D., Sci. Technol. Weld. Join., 4: 151, 1999.44. Kou, S., and Le, Y., unpublished research, University of Wisconsin, Madison, 1986.45. Southin, R. T., Trans. AIME, 239: 220, 1967.46. Wells, M. E., and Lukens, W. E., Weld. J., 65: 314s, 1986.47. Kou, S., and Le, Y., Weld. J., 64: 51, 1985.48. Aidun, D. K., and Dean, J. P., Weld. J., 78: 349s, 1999.
FURTHER READING
1. Chalmers, B., Principles of Solidification, Wiley, New York, 1964.2. Davies, G. J., Solidification and Casting, Wiley, New York, 1973.3. Davies, G. J., and Garland, J. G., Int. Metall. Rev., 20(196): 83, 1975.
4. Flemings, M. C., Solidification Processing, McGraw-Hill, New York, 1974.5. Savage, W. F., Weld. World, 18: 89, 1980.6. Abbaschian, G. J., and David, S. A., Eds., Grain Refinement in Castings and Welds,
Metallurgical Society of AIME, Warrendale, PA, 1983.
PROBLEMS
7.1 In aluminum alloys such as 6061 and 5052, which often contain smallamounts of Ti (say about 0.02wt%), the Ti-rich particles in the workpiececan be dissolved with a gas–tungsten arc by multipass melting. If thepreweld is a multipass weld intended to dissolve such particles and thegrain structure is shown in Figure P7.1, what is the grain refining mech-anism in the test weld and why?
7.2 Equiaxed grains can often be found in the crater of a weld that exhibitsan essentially purely columnar grain structure, as shown in Figure P7.2.Explain why.
PROBLEMS 197
test weld preweld
Figure P7.1
7.3 Gutierrez and Lippold (23) made a preweld in aluminum alloy 2195 andthen a test weld perpendicular to it, as shown in Figure P7.3. (a) Do youexpect to see a nondendritic equiaxed zone near the fusion boundary ofthe test weld in the overlap region and why or why not? (b) Same as (a)but with the workpiece and the preweld solution heat treated beforemaking the test weld.
7.4 Part of a pure Ni ingot with large columnar grains is welded perpendic-ular to the grains, as shown in Figure P7.4. Sketch the grain structure inthe weld.
7.5 A pulsed arc weld is shown in Figure P7.5. Sketch the grain structure inthe area produced by the last pulse.
198 WELD METAL SOLIDIFICATION I: GRAIN STRUCTURE
weld crater
Figure P7.2
preweld
testweld
Figure P7.3
Ni ingot Ni ingot(a) (b)
Figure P7.4
weldingdirection pulsed
arc weld
Figure P7.5

8 Weld Metal Solidification II:Microstructure within Grains
In this chapter we shall discuss the microstructure within the grains in thefusion zone, focusing on the solidification mode, dendrite spacing and cellspacing, how they vary across the weld metal, and how they are affected bywelding parameters. The advantages of fine microstructure and techniques formicrostructural refining will also be discussed.
8.1 SOLIDIFICATION MODES
As constitutional supercooling increases, the solidification mode changes fromplanar to cellular and from cellular to dendritic (Chapter 6). Figure 8.1 showsschematically the effect of constitutional supercooling on the microstructurewithin the grains in the weld metal. The solidification mode changes fromplanar to cellular, columnar dendritic, and equiaxed dendritic as the degree ofconstitutional supercooling at the pool boundary increases. Heterogeneousnucleation aided by constitutional supercooling promotes the formation ofequiaxed grains in the weld metal (Chapter 7).
8.1.1 Temperature Gradient and Growth Rate
While the solidification mode can vary from one weld to another (Figure 8.1),it can also vary within a single weld from the fusion line to the centerline. Thiswill be explained following the discussion on the growth rate R and the tem-perature gradient G.
Figure 8.2 shows the relationship between the growth rate R and thewelding speed V. The distance a given point on the pool boundary travels inthe normal direction n during a very small time interval dt is
(8.1)
Dividing the above equation by dtcos(a - b) yields
(8.2)RV
=-( )
coscos
aa b
R dt V dt Rdtn = ( ) = ( ) -( )cos cosa a b
199
Welding Metallurgy, Second Edition. Sindo KouCopyright 2003 John Wiley & Sons, Inc.
ISBN: 0-471-43491-4

200 WELD METAL SOLIDIFICATION II: MICROSTRUCTURE WITHIN GRAINS
T T
TT
S L
Planar(a)
x xLS
S+L
actu
al
equilibrium
weldpool
wel
ding
dire
ctio
n
<100>
<100>
fusi
onlin
e
basemetal
Cellular(b)
LS S + Lxx
Equiaxeddendritic
(d)
Columnardendritic
(c)
S + L
LS
constitutionalsupercooling
magnified
weldingdirection
weldpool
weldmetal
Figure 8.1 Effect of constitutional supercooling on solidification mode duringwelding: (a) planar; (b) cellular; (c) columnar dendritic; (d) equiaxed dendritic.Constitutional supercooling increases from (a) through (d).
pool boundaryat time, t
pool nR
V
centerline
fusion line
dendrite
n
Rdt
Vdt
Rn dt
t+dt
t
R
V
pool boundaryat time, t+dt
weldingspeed, V
dendrite
αβ
Figure 8.2 Relationship between growth rate R and welding speed V.

where a is the angle between the welding direction and the normal to the poolboundary and b is the angle between the welding direction and the growthdirection of a dendrite at the point (<100> in fcc and bcc materials). This rela-tionship has been shown by Nakagawa et al. (1). If the difference between thetwo angles is neglected (cos0° = 1) as an approximation, Equation (8.2)becomes
(8.3)
As shown in Figure 8.3, a = 0° and 90° at the weld centerline and the fusionline, respectively. Therefore, the solidification rate at the centerline RCL = V(maximum) while that at the fusion line RFL = 0 (minimum). As shown inFigure 8.4, the distance between the maximum pool temperature (Tmax) andthe pool boundary (TL) is greater at the centerline than at the fusion line
R V= cosa
SOLIDIFICATION MODES 201
centerline
fusion line
weldingspeed, V
pool boundaryat time t
pool boundaryat time t + dt
pool
Vdt
Rdt
Vdt Rdt
Vdt
at fusion line anywhere at centerline
Rdt 0
090α =0cos90 0=
cos 0FLR V α =
α
cosR V α(Vdt) cosαRdt =
00α =0cos0 1=
cosCLR V Vα = � �
�
�
Figure 8.3 Variation in growth rate along pool boundary.
weldingspeed, V
weld pool
centerline (CL)
fusion line (FL)
GFL
RCL=VGCL
RFL 0
G
Tmax
TL ≈
Figure 8.4 Variations in temperature gradient G and growth rate R along pool boundary.

because the weld pool is elongated. Consequently, the temperature gradientnormal to the pool boundary at the centerline, GCL, is less than that at thefusion line, GFL. Since GCL < GFL and RCL >> RFL,
(8.4)
8.1.2 Variations in Growth Mode across Weld
According to Equation (8.4), the ratio G/R decreases from the fusion linetoward the centerline. This suggests that the solidification mode may changefrom planar to cellular, columnar dendritic, and equiaxed dendritic across thefusion zone, as depicted in Figure 8.5. Three grains are shown to grow epitax-ially from the fusion line. Consider the one on the right. It grows with theplanar mode along the easy-growth direction <100> of the base-metal grain.A short distance away from the fusion line, solidification changes to the cellular mode. Further away from the fusion line, solidification changes to the columnar dendritic mode. Some of the cells evolve into dendrites and their side arms block off the neighboring cells. Near the weld centerlineequiaxed dendrites nucleate and grow, blocking off the columnar dendrites.The solidification-mode transitions have been observed in several differentmaterials (2–4).
Figure 8.6 shows the planar-to-cellular transition near the weld fusion lineof an autogenous gas–tungsten weld of Fe–49Ni (2). Figure 8.7 shows theplanar-to-cellular transition and the cellular-to-dendritic transition in 1100 alu-minum (essentially pure Al) welded with a 4047 (Al–12Si) filler metal. Figure8.8 shows the transition from columnar to equiaxed dendrites in an electronbeam weld of a Fe–15Cr–15Ni single crystal containing some sulfur (4). Thesecolumnar dendrites, with hardly visible side arms, follow the easy-growth
GR
GR
ÊË
ˆ¯ << Ê
ˈ¯
CL FL
202 WELD METAL SOLIDIFICATION II: MICROSTRUCTURE WITHIN GRAINS
columnardendritic
planar
cellular
equiaxeddendritic
weldpool
weldingdirection
basemetal
<100> <100> <100>
poolboundary
fusionline
centerline
Figure 8.5 Variation in solidification mode across the fusion zone.

direction <100> of the single crystal, which happens to be normal to the fusionline in this case.
Before leaving the subject of the solidification mode, it is desirable tofurther consider the weld metal microstructure of a workpiece with only oneand very large grain, that is, a single-crystal workpiece. Figure 8.9 shows thecolumnar dendritic structure in a Fe–15Cr–15Ni single crystal of high purityelectron beam welded along a [110] direction on a (001) surface (5). The weldis still a single crystal because of epitaxial growth. However, it can have
SOLIDIFICATION MODES 203
region ofplanar growth
region ofcellulargrowth
fusionline
solidifiedweld metal
�100� weld poolboundary
liquid weldmetal
Figure 8.6 Planar-to-cellular transition in an autogenous weld of Fe–49Ni. Modifiedfrom Savage et al. (2).
Figure 8.7 Planar-to-cellular and cellular-to-dendritic transitions in 1100 Al weldedwith 4047 filler.

204 WELD METAL SOLIDIFICATION II: MICROSTRUCTURE WITHIN GRAINS
Figure 8.8 Electron beam weld of single crystal of Fe–15Cr–15Ni with sulfur showingtransition from columnar to equiaxed dendrites. Reprinted from David and Vitek (4).
colonies of columnar dendrites of different orientations, as shown by the topweld pass in Figure 8.9b (f is one of the angles characterizing the normal tothe pool boundary). This is because of competitive growth between columnardendrites along the three <100> easy-growth directions [100], [010], and [001].Dendrites with an easy-growth direction closest to the heat flow direction(normal to the pool boundary) compete better.
8.2 DENDRITE AND CELL SPACING
The spacing between dendrite arms or cells, just as the solidification mode, canalso vary across the fusion zone.As already mentioned in the previous section,GCL < GFL and RCL >> RFL. Consequently,
(8.5)
where G ¥ R is the cooling rate, as explained previously in Chapter 6. Accord-ing to Equation (8.5), the cooling rate (G ¥ R) is higher at the weld centerlineand lower at the fusion line. This suggests that the dendrite arm spacingdecreases from the fusion line to the centerline because the dendrite armspacing decreases with increasing cooling rate (Chapter 6).
The variation in the dendrite arm spacing across the fusion zone can befurther explained with the help of thermal cycles (Chapter 2). Figure 8.10
G R G R¥( ) > ¥( )CL FL

shows a eutectic-type phase diagram and the thermal cycles at the weld cen-terline and fusion line of alloy C0. As shown, the cooling time through thesolidification temperature range is shorter at the weld centerline (24̄ /V) andlonger at the fusion line (13̄/V).As such, the cooling rate through the solidifi-cation temperature range increases and the dendrite arm spacing decreasesfrom the fusion line to the centerline. As shown by the aluminum weld in
DENDRITE AND CELL SPACING 205
Figure 8.9 Electron beam weld of single crystal of pure Fe–15Cr–15Ni made in a [110]direction on a (001) surface: (a) top cross section; (b) transverse cross section.Reprinted from Rappaz et al. (5).

Figure 8.11, the solidification microstructure gets finer from the fusion line tothe centerline (6). The same trend was observed in other aluminum welds byKou et al. (6, 7) and Lanzafame and Kattamis (8).
8.3 EFFECT OF WELDING PARAMETERS
8.3.1 Solidification Mode
The heat input and the welding speed can affect the solidification mode of theweld metal significantly. The solidification mode changes from planar to cel-
206 WELD METAL SOLIDIFICATION II: MICROSTRUCTURE WITHIN GRAINS
distancetime
T
1 2
3 4
ab
31
24
Concentration, C
TL
TE
(a)
(b)
(c)
welding direction
shorter solidificationtime, b, at centerline
fusion line(coarsermicrostructure)
A
Tem
pera
ture
, T L
S
S + L
TL
Co
TE
centerline (finermicrostructure)
longer solidificationtime, a, at fusion line
weldpool
Figure 8.10 Variation in dendrite arm spacing across fusion zone: (a) phase diagram;(b) thermal cycles; (c) top view of weld pool.
Figure 8.11 Transverse cross-section of gas–tungsten arc weld in 6061 aluminum:(a) finer microstructure near centerline; (b) coarser microstructure near fusion line.Magnification 115¥. Reprinted from Kou et al. (6). Courtesy of American WeldingSociety.

lular and dendritic as the ratio G/R decreases (Chapter 6). Table 8.1 summa-rizes the observations of Savage et al. (9) in HY-80 steel. At the welding speedof 0.85mm/s (2 ipm), the weld microstructure changes from cellular to den-dritic when the welding current increases from 150 to 450A. According toEquation (2.15), the higher the heat input (Q) under the same welding speed(V), the lower the temperature gradient G and hence the lower the ratio G/R.Therefore, at higher heat inputs G/R is lower and dendritic solidification pre-vails, while at lower heat inputs G/R is higher and cellular solidification pre-vails. Although analytical equations such as Equations (2.15) and (2.17) areoversimplified, they can still qualitatively tell the effect of welding parameters.
8.3.2 Dendrite and Cell Spacing
The heat input and the welding speed can also affect the spacing between den-drite arms and cells. The dendrite arm spacing or cell spacing decreases withincreasing cooling rate (Chapter 6). As compared to arc welding, the coolingrate in laser or electron beam welding is higher and the weld metal microstruc-ture is finer. The 6061 aluminum welds in Figure 8.12 confirm that this is thecase (10).
As shown in Table 8.1, at the welding current of 150A, the cells becomefiner as the welding speed increases. From Equation (2.17), under the sameheat input (Q), the cooling rate increases with increasing welding speed V.Therefore, at higher welding speeds the cooling rate is higher and the cells arefiner, while at lower welding speeds the cooling rate is lower and the cells arecoarser. Elmer et al. (11) also observed this trend in EBW of two austeniticstainless steels of similar compositions, as shown in Figure 8.13. The differencein the cell spacing can be seen even though the magnifications of the micro-graphs are different.
According to Equation (2.17), the cooling rate increases with decreasingheat input–welding speed ratio Q/V. This ratio also represents the amount
EFFECT OF WELDING PARAMETERS 207
TABLE 8.1 Effect of Welding Parameters on Weld Metal Microstructure
Travel speed 150A 300A 450A
0.85mm/s Cellular Cellular dendritic Coarse cellular(2 ipm) dendritic
1.69mm/s Cellular Fine cellular Coarse cellular(4 ipm) dendritic dendritic
3.39mm/s Fine cellular Cellular, slight Severe undercutting(8 ipm) undercutting
6.77mm/s Very fine cellular Cellular, Severe undercutting(16 ipm) undercutting
Source: From Savage et al. (9).

208 WELD METAL SOLIDIFICATION II: MICROSTRUCTURE WITHIN GRAINS
Figure 8.12 Autogenous welds of 6061 aluminum: (a) coarser solidification structurein gas–tungsten arc weld: (b) finer solidification structure in electron beam weld.Reprinted from Metals Handbook (10).
Figure 8.13 Effect of welding speed on cell spacing in EBW of austenitic stainlesssteels: (a) 100mm/s; (b) 25mm/s. From Elmer et al. (11).

of heat per unit length of the weld (J/cm or cal/cm). Therefore, the dendritearm spacing or cell spacing can be expected to increase with increasing Q/V or amount of heat per unit length of the weld. This has been observed in several aluminum alloys (7, 8, 12–14), including those shown in Fig-ure 8.14.
8.4 REFINING MICROSTRUCTURE WITHIN GRAINS
It has been shown in aluminum alloys that the finer the dendrite arm spacing,the higher the ductility (15) and yield strength (8, 15) of the weld metal andthe more effective the postweld heat treatment (8, 12, 15), due to the finer distribution of interdendritic eutectics.
REFINING MICROSTRUCTURE WITHIN GRAINS 209
10 20 30 40
10
20
(Heat input/welding speed, W/mm) 1/2
Den
drite
arm
spa
cing
, m
30 60 90(Heat input/welding speed, J/mm)1/2
(b)
(a)
just above toe of weldlevel with surface of plate
14
12
10
8
6
4
2100 20 30 40 50 60 70 80
Den
drite
spa
cing
, m
Heat input cal/cm length
0
0
µµ
Figure 8.14 Effect of heat input per unit length of weld on dendrite arm spacing.(a) For Al–Mg–Mn alloy. From Jordan and Coleman (13). (b) For 2014 Al–Cu alloy.Modified from Lanzafame and Kattamis (14). Courtesy of American Welding Society.

8.4.1 Arc Oscillation
Kou and Le (16) studied the microstructure in oscillated arc welds of 2014 alu-minum alloy. It was observed that the dendrite arm spacing was reduced sig-nificantly by transverse arc oscillation at low frequencies, as shown in Figure8.15. This reduction in the dendrite arm spacing has contributed to the signif-icant improvement in both the strength and ductility of the weld, as shown inFigure 8.16.
As illustrated in Figure 8.17, when arc oscillation is applied, the weld poolgains a lateral velocity, v, in addition to its original velocity u in the weldingdirection (16). The magnitude of v can be comparable with that of u depend-ing on the amplitude and frequency of arc oscillation.
As shown, the resultant velocity of the weld pool, w, is greater than that ofthe unoscillated weld pool, u. Furthermore, the temperature gradient ahead of the solid–liquid interface, G, could also be increased due to the smaller distance between the heat source and the pool boundary. Consequently, theproduct GR or the cooling rate is increased significantly by the action of arcoscillation. This explains why the microstructure is finer in the oscillated arcweld.
Example: Suppose the welding speed of a regular weld is 4.2mm/s (10 ipm).Calculate the increase in the velocity of the weld pool if the arc is oscillated
210 WELD METAL SOLIDIFICATION II: MICROSTRUCTURE WITHIN GRAINS
NOOSCILLATION
TRANSVERSEOSCILLATION
(a) (b)
Figure 8.15 Microstructures near fusion line of gas-tungsten arc welds of 2014 alu-minum: (a) coarser dendrites in weld made without arc oscillation; (b) finer dendritesin weld made with transverse arc oscillation. Magnification 200¥. Reprinted from Kouand Le (16). Courtesy of American Welding Society.

transversely at a frequency of 1Hz and an amplitude (the maximum deflec-tion of the arc from the weld centerline) of 1.9mm. Do you expect the den-drite arm spacing to keep on decreasing if the frequency keeps on increasingto, say, 100Hz?
REFINING MICROSTRUCTURE WITHIN GRAINS 211
Figure 8.16 Tensile testing of two gas–tungsten arc welds of 2014 aluminum madewithout arc oscillation and with transverse arc oscillation. From Kou and Le (16).
Nooscillation
u
vw
u
(a)
(b)
Transverseoscillation
Figure 8.17 Increase in weld pool travel speed due to transverse arc oscillation. Mod-ified from Kou and Le (16). Courtesy of American Welding Society.

Since the arc travels a distance equal to four oscillation amplitudes per second, v = 4 ¥ 1.9mm/s = 7.6mm/s. Therefore, the resultant velocity w =(u2 + v2)1/2 = (4.22 + 7.62)1/2 = 8.7mm/s. The increase in the weld pool velocityis 8.7 - 4.2 = 4.5mm/s. The increase in the weld pool velocity and hence thedecrease in the dendrite arm spacing cannot keep on going with increasingoscillation frequency. This is because when the arc oscillates too fast, say at100 Hz, the weld pool cannot catch up with it because there is not enough timefor melting and solidification to occur.
It is interesting to point out that Kou and Le (16) also observed that themicrostructure in oscillated arc welds is much more uniform than that in weldswithout oscillation. In oscillated arc welds the weld centerline is no longer alocation where the cooling rate (or GR) is clearly at its maximum.
Tseng and Savage (17) studied the microstructure in gas–tungsten arc welds of HY-80 steel made with transverse and longitudinal arc oscillation.Refining of the grain structure was not obtained, but refining of the dendriticstructure within grains (subgrain structure) was observed and solidificationcracking was reduced, as shown in Figure 8.18. It is possible that solidificationcracking was reduced because the crack-causing constituents were diluted to a greater extent by the larger interdendritic area in the welds with a finerdendritic structure.
212 WELD METAL SOLIDIFICATION II: MICROSTRUCTURE WITHIN GRAINS
Half-amplitude =1.65mm (0.065in)
0 0.23 0.42 1.200
10
20
30
Frequency of oscillation-Hz
Sub
grai
n di
amet
er(m
icro
ns)
Oscillation frequency
Amplitude =1.65mm(0.065in)
Nooscillation
0.42Hz
1.19Hz
Mea
n m
axim
umcr
ack
leng
th (
mm
)
0
0.25
0.50
0.75
Mea
n m
axim
umcr
ack
leng
th (
mils
)
0
10
20
30
(a)
(b)
Figure 8.18 Effect of magnetic arc oscillation on gas–tungsten arc welds of HY-80steel: (a) refining of microstructure within grains; (b) solidification cracking. Modifiedfrom Tseng and Savage (17).

8.4.2 Arc Pulsation
Becker and Adams (18) studied the microstructure in pulsed arc welds of titanium alloys. It was observed that the cell spacing varied periodically along the weld, larger where solidification took place during the high-currentportion of the cycle. Obviously, the cooling rate was significantly lower dur-ing the high-current portion of the cycle. This is because, from Equation (2.17), the cooling rate can be expected to decrease with increasing heat input, though, strictly speaking, this equation is for steady-state conditionsonly.
REFERENCES
1. Nakagawa, H., et al., J. Jpn. Weld. Soc., 39: 94, 1970.2. Savage, W. F., Nippes, E. F., and Erickson, J. S., Weld. J., 55: 213s, 1976.3. Kou, S., and Le, Y., unpublished research, University of Wisconsin, Madison, 1983.
4. David, S. A., and Vitek, J. M., Int. Mater. Rev., 34: 213, 1989.5. Rappaz, M., David, S. A., Vitek, J. M., and Boatner, L. A., in Recent Trends in
Welding Science and Technology, Eds. S. A. David and J. M. Vitek, ASM Interna-tional, Materials Park, OH, May 1989, p. 147.
6. Kou, S., Kanevsky, T., and Fyfitch, S., Weld. J., 61: 175s, 1982.7. Kou, S., and Le, Y., Metall. Trans. A, 14A: 2245, 1983.8. Lanzafame, J. N., and Kattamis, T. Z., Weld. J., 52: 226s, 1973.
9. Savage, W. F., Lundin, C. D., and Hrubec, R. J., Weld. J., 47: 420s, 1968.
10. Metals Handbook, Vol. 7, 8th ed., American Society for Metals, Metals Park, OH,1972, pp. 266, 269.
11. Elmer, J. W., Allen, S. M., and Eagar, T. W., Metall. Trans., 20A: 2117, 1989.12. Brown, P. E., and Adams, C. M. Jr., Weld. J., 39: 520s, 1960.13. Jordan, M. F., and Coleman, M. C., Br. Weld. J., 15: 552, 1968.14. Lanzafame, J. N., and Kattamis, T. Z., Weld. J., 52: 226s, 1973.15. Fukui, T., and Namba, K., Trans. Jpn. Weld. Soc., 4: 49, 1973.16. Kou, S., and Le, Y., Weld. J., 64: 51, 1985.17. Tseng, C., and Savage, W. F., Weld. J., 50: 777, 1971.18. Becker, D. W., and Adams, C. M. Jr., Weld. J., 58: 143s, 1979.19. Savage, W. F., in Weldments: Physical Metallurgy and Failure Phenomena, Eds.
R. J. Christoffel, E. F. Nippes, and H. D. Solomon, General Electric Co., Schenec-tady, NY, 1979, p. 1.
FURTHER READING
1. Davies, G. J., and Garland, J. G., Int. Metall. Rev., 20: 83, 1975.2. Savage, W. F., Weld. World, 18: 89, 1980.
FURTHER READING 213

3. David, S. A., and Vitek, J. M., Int. Mater. Rev., 34: 213, 1989.4. Flemings, M. C., Solidification Processing, McGraw-Hill, New York, 1974.
PROBLEMS
8.1 It has been suggested that the secondary dendrite arm spacing d alongthe weld centerline can be related quantitatively to the heat input perunit length of weld, Q/V. Based on the data of the dendrite arm spacingd as a function of cooling rate e, similar to those shown in Figure 6.17a,it can be shown that d = ae-1/b, where a and b are constant with b beingin the range of 2–3. (a) Express the dendrite arm spacing in terms of Q/Vfor bead-on-plate welds in thick-section aluminum alloys. (b) How do the preheat temperature and thermal conductivity affect the dendritearm spacing? (c) Do you expect the relationship obtained to be veryaccurate?
8.2 The size of the mushy zone is often an interesting piece of informationfor studying weld metal solidification. Let d = ae-1/b, where d is the den-drite arm spacing and e the cooling rate. Consider how measurements ofthe dendrite arm spacing across the weld metal can help determine the size of the mushy zone. Express the width of the mushy zone in thewelding direction Dx, as shown in Figure P8.2, in terms of the dendritearm spacing d, the welding speed V, and the freezing temperature rangeDT (= TL - TE).
8.3 It has been observed that the greater the heat input per unit length ofweld (Q/V), the longer it takes to homogenize the microsegregation inthe weld metal of aluminum alloys for improving its mechanical proper-ties. Let d = ae-1/b, where d is the dendrite arm spacing and e the coolingrate. Express the time required for homogenization (t) in terms of Q/V.
8.4 An Al–1% Cu alloy is welded autogenously by GTAW, and an Al–5%Cu alloy is welded under identical condition. Which alloy is expected todevelop more constitutional supercooling and why? Which alloy is likelyto have more equiaxed dendrites in the weld metal and why?
8.5 An Al–5% Cu alloy is welded autogenously by GTAW and by EBWunder the same welding speed but different heat inputs (much less in the
214 WELD METAL SOLIDIFICATION II: MICROSTRUCTURE WITHIN GRAINS
V
mushy zone
TE
weld pool
TL x∆
Figure P8.2

case of EBW). Which weld is expected to experience more constitutionalsupercooling and why? Which weld is likely to have more equiaxed den-drites and why?
8.6 In autogenous GTAW of aluminum alloys, how do you expect the amountof equiaxed grains in the weld metal to be affected by preheating andwhy?
8.7 In autogenous GTAW of aluminum alloys, how do you expect the den-drite arm spacing of the weld metal to be affected by preheating andwhy?
8.8 Figure P8.8 is a micrograph near the fusion line of an autogenousgas–tungsten arc weld in a Fe–49% Ni alloy sheet (19). Explain the solid-ification microstructure, which is to the right of the fusion line (dark ver-tical line).
PROBLEMS 215
Figure P8.8

9 Post-Solidification PhaseTransformations
Post-solidification phase transformations, when they occur, can change thesolidification microstructure and properties of the weld metal. It is, there-fore, essential that post-solidification phase transformations be understood in order to understand the weld metal microstructure and properties. In this chapter two major types of post-solidification phase transformations inthe weld metal will be discussed. The first involves the ferrite-to-austenitetransformation in welds of austenitic stainless steels, and the second involvesthe austenite-to-ferrite transformation in welds of low-carbon, low-alloy steels.
9.1 FERRITE-TO-AUSTENITE TRANSFORMATION INAUSTENITIC STAINLESS STEEL WELDS
9.1.1 Primary Solidification Modes
The welds of austenitic stainless steels normally have an austenite (fcc) matrixwith varying amounts of d-ferrite (bcc) (1–7). A proper amount of d-ferrite inaustenitic stainless steel welds is essential—too much d-ferrite (�10 vol %)tends to reduce the ductility, toughness, and corrosion resistance, while toolittle d-ferrite (�5 vol %) can result in solidification cracking.
A. Phase Diagram Figure 9.1 shows the ternary phase diagram of theFe–Cr–Ni system (8). The heavy curved line in Figure 9.1a represents thetrough on the liquidus surface, which is called the line of twofold saturation.The line declines from the binary Fe–Ni peritectic reaction temperature to the ternary eutectic point at 49Cr–43Ni–8Fe. Alloys with a composition onthe Cr-rich (upper) side of this line have d-ferrite as the primary solidificationphase, that is, the first solid phase to form from the liquid. On the other hand,alloys with a composition on the Ni-rich (lower) side have austenite as theprimary solidification phase. The heavy curved 1ines on the solidus surface inFigure 9.1b more or less follow the trend of the liquidus trough and convergeat the ternary eutectic temperature.
The development of weld metal microstructure in austenitic stainless steelsis explained in Figure 9.2.The weld metal ferrite can have three different types
216
Welding Metallurgy, Second Edition. Sindo KouCopyright 2003 John Wiley & Sons, Inc.
ISBN: 0-471-43491-4

Fig
ure
9.1
The
Fe–
Cr–
Ni t
erna
ry s
yste
m:(
a) li
quid
us s
urfa
ce;(
b) s
olid
us s
urfa
ce.R
epri
nted
fro
m M
etal
s H
andb
ook
(8).
217

218 POST-SOLIDIFICATION PHASE TRANSFORMATIONS
of morphology: interdendritic (Figure 9.2a), vermicular (Figure 9.2b), andlathy (Figure 9.2c). Figure 9.2d shows a schematic vertical (isoplethal) sectionof the ternary phase diagram in Figure 9.1, for instance, at 70 wt % Fe andabove 1200°C. This has also been called a pseudo-binary phase diagram. Theapex (point 1) of the three-phase eutectic triangle (L + g + d) corresponds tothe intersection between the vertical section and the heavy curved line inFigure 9.1a.The two lower corners (points 2 and 3) of the triangle, on the otherhand, correspond to the intersections between the vertical section and the twoheavy curved lines in Figure 9.1b.
B. Primary Austenite For an alloy on the Ni-rich (left-hand) side of the apexof the three-phase eutectic triangle, austenite (g) is the primary solidificationphase. The light dendrites shown in Figure 9.2a are austenite, while the darkparticles between the primary dendrite arms are the d-ferrite that forms when
interdendriticferrite
(a)
vermicularferrite
(b)
lathyferrite
(c)
liquidliquid liquid
L
Primary austenitesolidification
increasing Niincreasing Cr
(d)
ferrite, austenite,
L L
Tem
pera
ture
liquid, L1
2 3
4
or
Primary ferritesolidification
γ
γ γ
δ δ
γ
+ γ
+ γ + δ
γ
+ δ
δ + γ δ
Figure 9.2 Schematics showing solidification and postsolidification transformation inFe–Cr–Ni welds: (a) interdendritic ferrite; (b) vermicular ferrite; (c) lathy ferrite; (d)vertical section of ternary-phase diagram at approximately 70% Fe.
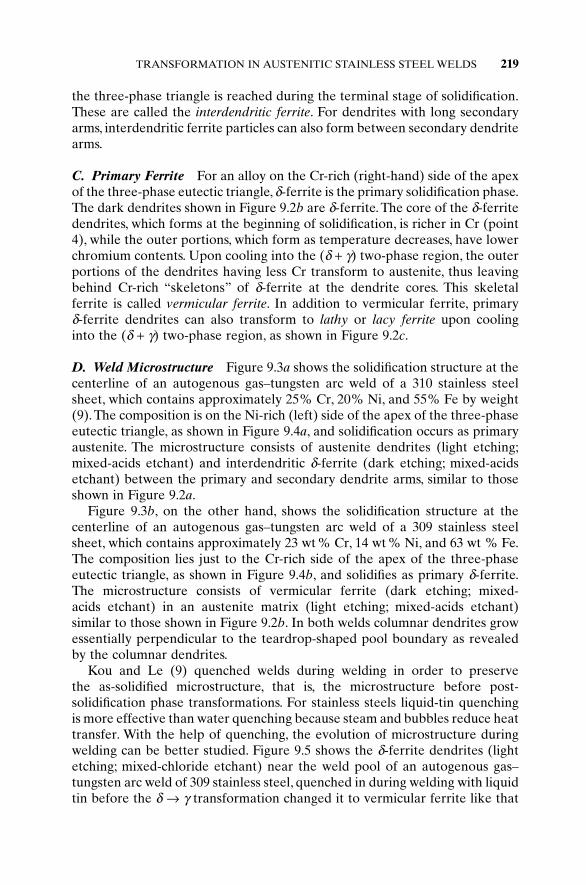
the three-phase triangle is reached during the terminal stage of solidification.These are called the interdendritic ferrite. For dendrites with long secondaryarms, interdendritic ferrite particles can also form between secondary dendritearms.
C. Primary Ferrite For an alloy on the Cr-rich (right-hand) side of the apexof the three-phase eutectic triangle, d-ferrite is the primary solidification phase.The dark dendrites shown in Figure 9.2b are d-ferrite. The core of the d-ferritedendrites, which forms at the beginning of solidification, is richer in Cr (point4), while the outer portions, which form as temperature decreases, have lowerchromium contents. Upon cooling into the (d + g) two-phase region, the outerportions of the dendrites having less Cr transform to austenite, thus leavingbehind Cr-rich “skeletons” of d-ferrite at the dendrite cores. This skeletalferrite is called vermicular ferrite. In addition to vermicular ferrite, primary d-ferrite dendrites can also transform to lathy or lacy ferrite upon cooling into the (d + g) two-phase region, as shown in Figure 9.2c.
D. Weld Microstructure Figure 9.3a shows the solidification structure at thecenterline of an autogenous gas–tungsten arc weld of a 310 stainless steelsheet, which contains approximately 25% Cr, 20% Ni, and 55% Fe by weight(9).The composition is on the Ni-rich (left) side of the apex of the three-phaseeutectic triangle, as shown in Figure 9.4a, and solidification occurs as primaryaustenite. The microstructure consists of austenite dendrites (light etching;mixed-acids etchant) and interdendritic d-ferrite (dark etching; mixed-acidsetchant) between the primary and secondary dendrite arms, similar to thoseshown in Figure 9.2a.
Figure 9.3b, on the other hand, shows the solidification structure at the centerline of an autogenous gas–tungsten arc weld of a 309 stainless steelsheet, which contains approximately 23 wt% Cr, 14 wt% Ni, and 63 wt % Fe.The composition lies just to the Cr-rich side of the apex of the three-phaseeutectic triangle, as shown in Figure 9.4b, and solidifies as primary d-ferrite.The microstructure consists of vermicular ferrite (dark etching; mixed-acids etchant) in an austenite matrix (light etching; mixed-acids etchant)similar to those shown in Figure 9.2b. In both welds columnar dendrites growessentially perpendicular to the teardrop-shaped pool boundary as revealedby the columnar dendrites.
Kou and Le (9) quenched welds during welding in order to preserve the as-solidified microstructure, that is, the microstructure before post-solidification phase transformations. For stainless steels liquid-tin quenchingis more effective than water quenching because steam and bubbles reduce heattransfer. With the help of quenching, the evolution of microstructure duringwelding can be better studied. Figure 9.5 shows the d-ferrite dendrites (lightetching; mixed-chloride etchant) near the weld pool of an autogenous gas–tungsten arc weld of 309 stainless steel, quenched in during welding with liquidtin before the d Æ g transformation changed it to vermicular ferrite like that
TRANSFORMATION IN AUSTENITIC STAINLESS STEEL WELDS 219

220 POST-SOLIDIFICATION PHASE TRANSFORMATIONS
Figure 9.3 Solidification structure at the weld centerline: (a) 310 stainless steel; (b)309 stainless steel. Magnification 190¥. Reprinted from Kou and Le (9).
L L L
55%Fe 63%Fe 73%Fe
1400
1000
600
1530
2520
3510
1027
2017
307
522
1512
252
wt%Crwt%Ni
Tem
pera
ture
, oC
(a) (b) (c)
L + γ + δγ
γ γδ
δδ
δ + γδ+γ
δ+γ
Figure 9.4 The Fe–Cr–Ni pseudo-binary phase diagrams: (a) at 55 wt % Fe; (b) at 63wt % Fe; (c) at 73 wt % Fe. Reprinted from Kou and Le (9).

TRANSFORMATION IN AUSTENITIC STAINLESS STEEL WELDS 221
shown in Figure 9.3b. Liquid-tin quenching was subsequently used by otherinvestigators to study stainless steel welds (10, 11).
9.1.2 Mechanisms of Ferrite Formation
Inoue et al. (11) studied vermicular and lathy ferrite in autogenous GTAW ofaustenitic stainless steels of 70% Fe with three different Cr–Ni ratios. It wasfound that, as the Cr–Ni ratio increases, the ratio of lathy ferrite to total ferritedoes not change significantly even though both increase. A schematic of theproposed formation mechanism of vermicular and lathy ferrite is shown inFigure 9.6.Austenite first grows epitaxially from the unmelted austenite grainsat the fusion boundary, and d-ferrite soon nucleates at the solidification front.The crystallographic orientation relationship between the d-ferrite and theaustenite determines the ferrite morphology after the postsolidification trans-formation. If the closed-packed planes of the d-ferrite are parallel to those ofthe austenite, the d Æ g transformation occurs with a planar d/g interface,resulting in vermicular ferrite. However, if the so-called Kurdjumov–Sachs ori-entation relationships, namely, (1̄10)d //(1̄11)g and [1̄1̄1]d //[1̄1̄0]g, exist betweenthe d-ferrite and the austenite, the transformation occurs along the austenitehabit plane into the d-ferrite dendrites. The resultant ferrite morphology islathy, as shown in Figure 9.7. For the lathy ferrite to continue to grow, the
Figure 9.5 Liquid-tin quenched solidification structure near the pool of an auto-genous gas–tungsten arc weld of 309 stainless steel. Magnification 70�. Mixed-chlorideetchant. Reprinted from Kou and Le (9).

222 POST-SOLIDIFICATION PHASE TRANSFORMATIONS
Figure 9.6 Mechanism for the formation of vermicular and lathy ferrite. Reprintedfrom Inoue et al. (11).
Figure 9.7 Lathy ferrite in an autogenous gas–tungsten arc weld of Fe–18.8Cr–11.2Ni.Reprinted from Inoue et al. (11).

TRANSFORMATION IN AUSTENITIC STAINLESS STEEL WELDS 223
preferred growth direction <100> of both d-ferrite and austenite must bealigned with the heat flow direction.
9.1.3 Prediction of Ferrite Content
Schaeffler (12) first proposed the quantitative relationship between the com-position and ferrite content of the weld metal. As shown by the constitutiondiagram in Figure 9.8, the chromium equivalent of a given alloy is determinedfrom the concentrations of ferrite formers Cr, Mo, Si, and Cb, and the austen-ite equivalent is determined from the concentrations of austenite formers Ni,C, and Mn. DeLong (13) refined Schaeffler’s diagram to include nitrogen, astrong austenite former, as shown in Figure 9.9. Also, the ferrite content isexpressed in terms of the ferrite number, which is more reproducible than theferrite percentage and can be determined nondestructively by magneticmeans. Figure 9.10 shows that nitrogen, introduced into the weld metal byadding various amounts of N2 to the Ar shielding gas, can reduce the weldferrite content significantly (14). Cieslak et al. (6), Okagawa et al. (7), andLundin et al. (15) have reported similar results previously.
The WRC-1992 diagram of Kotecki and Siewert (16), shown in Figure 9.11,was from the Welding Research Council in 1992. It was modified from theWRC-1988 diagram of McCowan et al. (17) by adding to the nickel equiva-lent the coefficient for copper (18) and showing how the axes could beextended to make Schaeffler-like calculations for dissimilar metal joining.
20
30
10
02010 30 40
Chromium equivalent =%Cr + %Mo + 1.5 X %Si + 0.5 X %Cb
Nic
kel e
quiv
alen
t =%
Ni +
30
X %
C +
0.5
X %
Mn
Austenite 0% F
errite
5%
20%
40%
100%
Ferrite
Martensite
M + F
A + M
0
28262422
12141618
8642
2 4 6 8 12 14 16 18 22 24 26 28 32 34 36 38
F + M
A + M + F
80%
10%
A + F
Figure 9.8 Schaeffler diagram for predicting weld ferrite content and solidificationmode. From Schaeffler (12).
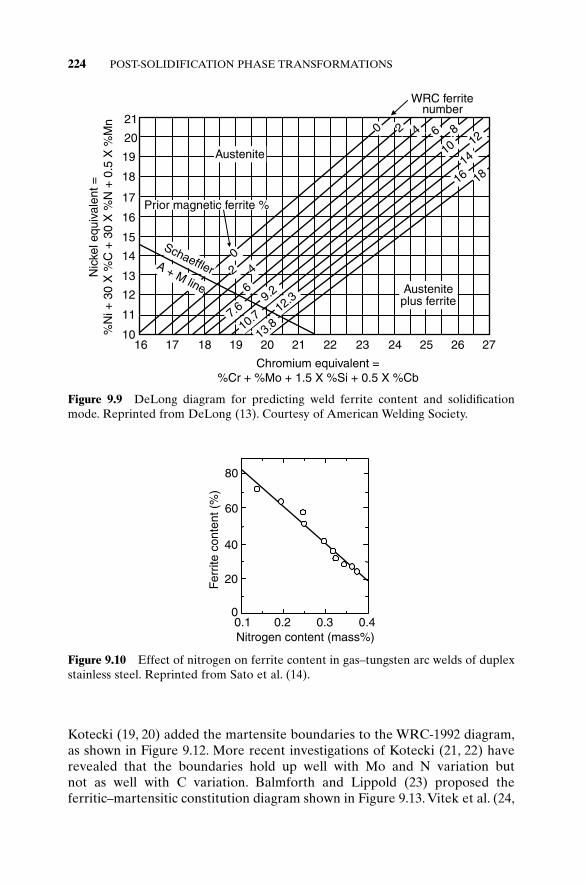
224 POST-SOLIDIFICATION PHASE TRANSFORMATIONS
Kotecki (19, 20) added the martensite boundaries to the WRC-1992 diagram,as shown in Figure 9.12. More recent investigations of Kotecki (21, 22) haverevealed that the boundaries hold up well with Mo and N variation but not as well with C variation. Balmforth and Lippold (23) proposed the ferritic–martensitic constitution diagram shown in Figure 9.13. Vitek et al. (24,
0 42
WRC ferritenumber
Austenite
Austeniteplus ferrite
SchaefflerA + M line
16 17 18 19 21 22 23 24 25 26 2710
11
12
13
14
15
16
17
18
19
20
21
Chromium equivalent =%Cr + %Mo + 1.5 X %Si + 0.5 X %Cb
Nic
kel e
quiv
alen
t =%
Ni +
30
X %
C +
30
X %
N +
0.5
X %
Mn
12
14
16 18
106 8
02 4
6
7.69.2
10.712.3
13.8
20
Prior magnetic ferrite %
Figure 9.9 DeLong diagram for predicting weld ferrite content and solidificationmode. Reprinted from DeLong (13). Courtesy of American Welding Society.
0.1 0.2 0.3 0.40
20
40
60
80
Nitrogen content (mass%)
Fer
rite
cont
ent (
%)
Figure 9.10 Effect of nitrogen on ferrite content in gas–tungsten arc welds of duplexstainless steel. Reprinted from Sato et al. (14).
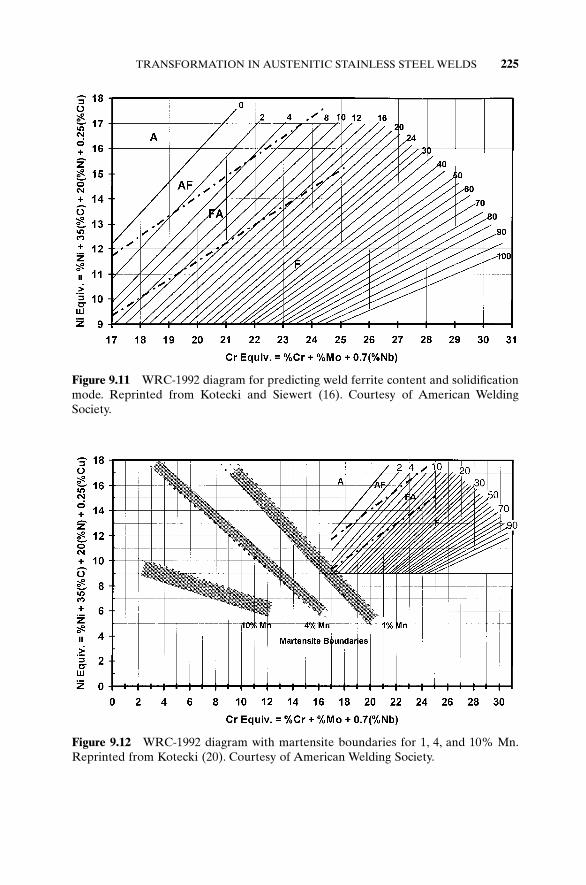
TRANSFORMATION IN AUSTENITIC STAINLESS STEEL WELDS 225
Figure 9.11 WRC-1992 diagram for predicting weld ferrite content and solidificationmode. Reprinted from Kotecki and Siewert (16). Courtesy of American WeldingSociety.
Figure 9.12 WRC-1992 diagram with martensite boundaries for 1, 4, and 10% Mn.Reprinted from Kotecki (20). Courtesy of American Welding Society.
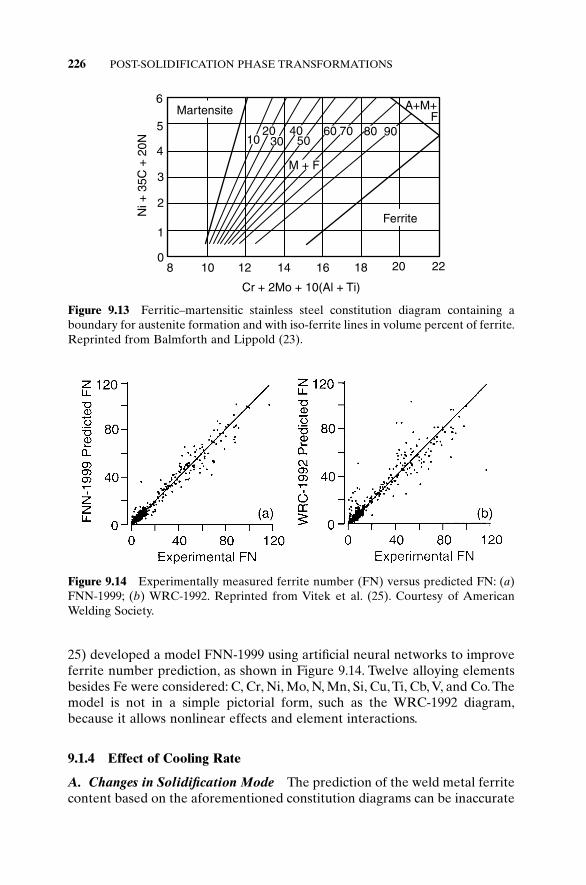
226 POST-SOLIDIFICATION PHASE TRANSFORMATIONS
25) developed a model FNN-1999 using artificial neural networks to improveferrite number prediction, as shown in Figure 9.14. Twelve alloying elementsbesides Fe were considered: C, Cr, Ni, Mo, N, Mn, Si, Cu, Ti, Cb, V, and Co. Themodel is not in a simple pictorial form, such as the WRC-1992 diagram,because it allows nonlinear effects and element interactions.
9.1.4 Effect of Cooling Rate
A. Changes in Solidification Mode The prediction of the weld metal ferritecontent based on the aforementioned constitution diagrams can be inaccurate
10 3020 40
5060 70 80 90
A+M+F
Cr + 2Mo + 10(Al + Ti)
Ni +
35C
+ 2
0N
2220181614121080
1
2
3
4
5
6
M + F
Martensite
Ferrite
Figure 9.13 Ferritic–martensitic stainless steel constitution diagram containing aboundary for austenite formation and with iso-ferrite lines in volume percent of ferrite.Reprinted from Balmforth and Lippold (23).
Figure 9.14 Experimentally measured ferrite number (FN) versus predicted FN: (a)FNN-1999; (b) WRC-1992. Reprinted from Vitek et al. (25). Courtesy of AmericanWelding Society.

TRANSFORMATION IN AUSTENITIC STAINLESS STEEL WELDS 227
when the cooling rate is high, especially in laser and electron beam welding(3, 26–37). Katayama and Matsunawa (28, 29), David et al. (31), and Brooksand Thompson (37) have compared microstructures that form in slow-cooling-rate arc welds with those that form in high-cooling-rate, high-energy-beamwelds.Their studies show two interesting trends. For low Cr–Ni ratio alloys theferrite content decreases with increasing cooling rate, and for high Cr–Ni ratioalloys the ferrite content increases with increasing cooling rate. Elmer et al.(33) pointed out that in general low Cr–Ni ratio alloys solidify with austeniteas the primary phase, and their ferrite content decreases with increasingcooling rate because solute redistribution during solidification is reduced athigh cooling rates. On the other hand, high Cr–Ni ratio alloys solidify withferrite as the primary phase, and their ferrite content increases with increas-ing cooling rate because the d Æ g transformation has less time to occur athigh cooling rates.
Elmer et al. (33, 34) studied a series of Fe–Ni–Cr alloys with 59% Fe andthe Cr–Ni ratio ranging from 1.15 to 2.18, as shown in Figure 9.15. The apexof the three-phase triangle is at about Fe–25Cr–16Ni. Figure 9.16 summarizesthe microstructural morphologies of small welds made by scanning an elec-tron beam over a wide range of travel speeds and hence cooling rates (33). Atlow travel speeds such as 0.1–1mm/s, the cooling rates are low and the alloyswith a low Cr–Ni ratio (especially alloys 1 and 2) solidify as primary austen-ite. The solidification mode is either single-phase austenite (A), that is, noferrite between austenite dendrites or cells (cellular–dendritic A), or primaryaustenite with second-phase ferrite (AF), that is, only a small amount of ferritebetween austenite dendrites (interdendritic F). The alloys with a high Cr–Ni
Cr 312927252321
A + F
L + AL + F
FA
Composition, wt%
Ni 101214161820
1 2 3 4 5 6 7
1200
1250
1300
1350
1400
1450
1500
1550
Tem
pera
ture
, oC
59% FeL
Figure 9.15 Vertical section of Fe–Ni–Cr phase diagram at 59% Fe showing sevenalloys with Cr–Ni ratio ranging from 1.15 to 2.18. Modified from Elmer et al. (33).

228 POST-SOLIDIFICATION PHASE TRANSFORMATIONS
ratio (especially alloys 5–7), on the other hand, solidify as primary ferrite. Thesolidification mode is primary ferrite with second-phase austenite (FA), thatis, vermicular ferrite, lacy ferrite, small blocks of austenite in a ferrite matrix(blocky A), or Widmanstatten austenite platelets originating from ferrite grainboundaries (Widmanstatten A).
At very high welding speeds such as 2000mm/s, however, the cooling ratesare high and the alloys solidify in only the single-phase austenite mode (A) orthe single-phase ferrite mode (F). An example of the former is the alloy 3(about Fe–24.75Cr–16.25Ni) shown in Figure 9.17a. At the travel speed of 25mm/s (2 ¥ 103 °C/s cooling rate) the substrate solidifies as primary austen-ite in the AF mode, with austenite cells and intercellular ferrite. At the muchhigher travel speed of 2000mm/s (1.5 ¥ 106 °C/s cooling rate) the weld at thetop solidifies as primary austenite in the A mode, with much smaller austen-ite cells and no intercellular ferrite (cellular A). An example of the latter isalloy 6 (about Fe–27.5Cr–13.5Ni) shown in Figure 9.17b. At 25mm/s the sub-strate solidifies as primary ferrite in the FA mode, with blocky austenite in aferrite matrix. At 2000mm/s the weld at the top solidifies as primary ferrite inthe F mode, with ferrite cells alone and no austenite (cellular F).
Figure 9.16 also demonstrates that under high cooling rates an alloy thatsolidifies as primary ferrite at low cooling rates can change to primary austen-ite solidification. For instance, alloy 4 (about Fe–25.5Cr–15.5Ni) can solidifyas primary ferrite at low cooling rates (vermicular F) but solidifies as primary
10-1
Widmanstatten A
blocky A
lacy F
vermicular F
intercellular A
interdendritic F intercellular F
cellular-dendritic A
cellular F
massive A
cellular A
100 101 102 103 104
Electron-beam travel speed, mm/s
Com
posi
tion,
wt%
1
234
5
67
Cr30
28
24
22
20
Ni11
13
15
17
19
21
26
alloys
Figure 9.16 Electron beam travel speed (cooling rate) versus composition map ofmicrostructural morphologies of the seven alloys in Figure 9.15 (A and F denoteaustenite and ferrite, respectively). The solid lines indicate the regions of the fourprimary solidification modes, while the dashed lines represent the different morpholo-gies resulting from postsolidification transformation from ferrite to austenite. Modifiedfrom Elmer et al. (33).

TRANSFORMATION IN AUSTENITIC STAINLESS STEEL WELDS 229
austenite at higher cooling rates (intercellular F or cellular A). Another inter-esting point seen in the same figure is that at high cooling rates alloy 5 cansolidify in the fully ferritic mode and undergoes a massive (diffusionless) trans-formation after solidification to austenite (massive A). Under very highcooling rates there is no time for diffusion to occur.
B. Dendrite Tip Undercooling Vitek et al. (27) attributed the change solid-ification mode, from primary ferrite to primary austenite, at high cooling ratesto dendrite tip undercooling. Brooks and Thompson (37) explained this under-cooling effect based on Figure 9.18. Alloy C0 solidifies in the primary ferritemode at low cooling rates. Under rapid cooling in laser or electron beamwelding, however, the melt can undercool below the extended austenite liquidus (CLg), and it becomes thermodynamically possible for the melt tosolidify as primary austenite. The closer C0 is to the apex of the three-phasetriangle, the easier sufficient undercooling can occur to switch the solidifica-tion mode from primary ferrite to primary austenite.
Figure 9.17 Microstructure of the low-cooling-rate substrate (2 ¥ 103 °C/s) and thehigh-cooling-rate electron beam weld at the top: (a) alloy 3 in Figure 9.15; (b) alloy 6.Reprinted from Elmer et al. (34).
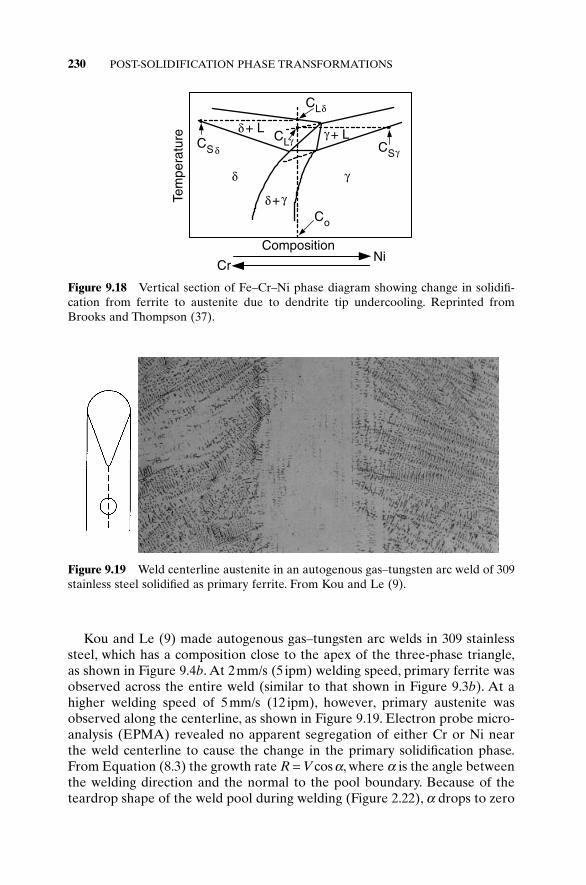
230 POST-SOLIDIFICATION PHASE TRANSFORMATIONS
Kou and Le (9) made autogenous gas–tungsten arc welds in 309 stainlesssteel, which has a composition close to the apex of the three-phase triangle,as shown in Figure 9.4b. At 2mm/s (5 ipm) welding speed, primary ferrite wasobserved across the entire weld (similar to that shown in Figure 9.3b). At ahigher welding speed of 5mm/s (12 ipm), however, primary austenite wasobserved along the centerline, as shown in Figure 9.19. Electron probe micro-analysis (EPMA) revealed no apparent segregation of either Cr or Ni nearthe weld centerline to cause the change in the primary solidification phase.From Equation (8.3) the growth rate R = Vcos a, where a is the angle betweenthe welding direction and the normal to the pool boundary. Because of theteardrop shape of the weld pool during welding (Figure 2.22), a drops to zero
NiCr
Tem
pera
ture
Composition
+ L + L
+ Co
CS CS
CL
CL
δ γ
γ
δ
δ γ
γδ
γδ
Figure 9.18 Vertical section of Fe–Cr–Ni phase diagram showing change in solidifi-cation from ferrite to austenite due to dendrite tip undercooling. Reprinted fromBrooks and Thompson (37).
Figure 9.19 Weld centerline austenite in an autogenous gas–tungsten arc weld of 309stainless steel solidified as primary ferrite. From Kou and Le (9).

TRANSFORMATION IN AUSTENITIC STAINLESS STEEL WELDS 231
and R increases abruptly at the weld centerline.As such, the cooling rate (GR)increases abruptly at the weld centerline, as pointed out subsequently byLippold (38).
Elmer et al. (34) calculated the dendrite tip undercooling for the alloys inFigure 9.16 under various electron beam travel speeds. An undercooling of45.8°C was calculated at the travel speed of 175mm/s, which is sufficient todepress the dendrite tip temperature below the solidus temperature (Figure9.15). This helps explain why alloy 4 can change from primary ferrite solidifi-cation at low travel speeds to primary austenite solidification at much highertravel speeds.
9.1.5 Ferrite Dissolution upon Reheating
Lundin and Chou (39) observed ferrite dissolution in multiple-pass or repairaustenitic stainless steel welds. This region exists in the weld metal of a previ-ous deposited weld bead, adjacent to but not contiguous with the fusion zoneof the deposited bead under consideration. Both the ferrite number and duc-tility are lowered in this region, making it susceptible to fissuring under strain.This is because of the dissolution of d-ferrite in the region of the weld metalthat is reheated to below the g-solvus temperature. Chen and Chou (40)reported, in Figure 9.20, a significant ferrite loss in a 316 stainless steel weld
Figure 9.20 Effect of thermal cycles on ferrite content in 316 stainless steel weld: (a)as welded; (b) subjected to thermal cycle of 1250°C peak temperature three times afterwelding. Reprinted from Chen and Chou (40).

232 POST-SOLIDIFICATION PHASE TRANSFORMATIONS
subjected to three postweld thermal cycles with a 1250°C peak temperature,which is just below the g + d two-phase region of about 1280–1425°C.
9.2 AUSTENITE-TO-FERRITE TRANSFORMATION IN LOW-CARBON, LOW-ALLOY STEEL WELDS
9.2.1 Microstructure Development
The dendrites or cells in the weld metal are not always discernible. First, sig-nificant solute partitioning does not occur during solidification if the partitionratio k is too close to 1. The miscrosegregation, especially solute segregationto the interdendritic or intercellular regions, in the resultant weld metal canbe too little to bring out the dendritic or cellular structure in the grain inte-rior even though the grain structure itself can still be very clear. Second, ifsolid-state diffusion occurs rapidly, microsegregation either is small or ishomogenized quickly, and the dendrites or cells in the resultant weld metalcan be unclear. Third, post-solidification phase transformations, if they occur,can produce new microstructures in the grain interior and/or along grainboundaries and the subgrain structure in the resultant weld metal can be overshadowed.
Several continuous-cooling transformation (CCT) diagrams have beensketched schematically to explain the development of the weld metalmicrostructure of low-carbon, low-alloy steels (41–45). The one shown inFigure 9.21 is based on that of Onsoien et al. (45). The hexagons represent thetransverse cross sections of columnar austenite grains in the weld metal. Asaustenite (g) is cooled down from high temperature, ferrite (a) nucleates atthe grain boundary and grows inward.The grain boundary ferrite is also called“allotriomorphic” ferrite, meaning that it is a ferrite without a regular faceted
grain boundary ferrite
sideplate ferrite
accicular ferrite
bainite
austenitegrain
log Time
Tem
pera
ture
inclusion particle
grain boundary
martensite
coolingcurve
austenite
Figure 9.21 Continuous-cooling transformation diagram for weld metal of low-carbon steel.

TRANSFORMATION IN LOW-CARBON, LOW-ALLOY STEEL WELDS 233
shape reflecting its internal crystalline structure. At lower temperatures themobility of the planar growth front of the grain boundary ferrite decreasesand Widmanstatten ferrite, also called side-plate ferrite, forms instead. Theseside plates can grow faster because carbon, instead of piling up at the planargrowth front, is pushed to the sides of the growing tips. Substitutional atomsdo not diffuse during the growth of Widmanstatten ferrite. At even lower tem-peratures it is too slow for Widmanstatten ferrite to grow to the grain interiorand it is faster if new ferrite nucleates ahead of the growing ferrite. This newferrite, that is, acicular ferrite, nucleates at inclusion particles and has randomlyoriented short ferrite needles with a basket weave feature.
Figure 9.22 shows the microstructure of the weld metal of a low-carbon,low-alloy steel (46). It includes in Figure 9.22a grain boundary ferrite (A),
Figure 9.22 Micrographs showing typical weld metal microstructures in low-carbonsteels: A, grain boundary ferrite; B, polygonal ferrite; C, Widmanstatten ferrite; D,acicular ferrite; E, upper bainite; F, lower bainite. Reprinted from Grong and Matlock(46).
(a)
(b)

234 POST-SOLIDIFICATION PHASE TRANSFORMATIONS
Widmanstatten ferrite (C), and acicular ferrite (D) and in Figure 9.22bupper bainite (E) and lower bainite (F). A polygonal ferrite (B) is also found.Examination with transmission electron microscopy (TEM) is usually neededto identify the upper and lower bainite. The microstructure of a low-carbonsteel weld containing predominately acicular ferrite is shown in Figure 9.23and at a higher magnification in Figure 9.24 (47). The dark particles are inclusions.
9.2.2 Factors Affecting Microstructure
Bhadeshia and Suensson (48) showed in Figure 9.25 the effect of severalfactors on the development of microstructure of the weld metal: the weldmetal composition, the cooling time from 800 to 500°C (Dt8–5), the weld metaloxygen content, and the austenite grain size. The vertical arrows indicate thedirections in which these factors increase in strength. This will be explainedwith the help of CCT curves.
A. Cooling Time Consider the left CCT curves (broken lines) in Figure 9.26.As cooling slows down (Dt8–5 increases) from curve 1 to curve 2 and curve 3,and the transformation product can change from predominately bainite(Figure 9.25c), to predominately acicular ferrite (Figure 9.25b) to predomi-nately grain boundary and Widmanstatten ferrite (Figure 9.25a).
Figure 9.23 Predominately acicular ferrite microstructure of a low-carbon, low-alloysteel weld. Reprinted from Babu et al. (47).
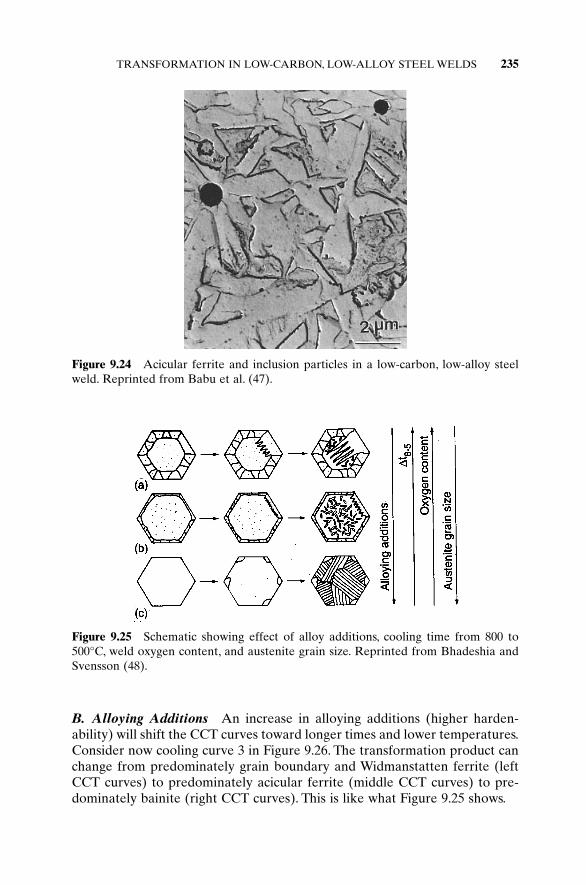
TRANSFORMATION IN LOW-CARBON, LOW-ALLOY STEEL WELDS 235
Figure 9.24 Acicular ferrite and inclusion particles in a low-carbon, low-alloy steelweld. Reprinted from Babu et al. (47).
Figure 9.25 Schematic showing effect of alloy additions, cooling time from 800 to500°C, weld oxygen content, and austenite grain size. Reprinted from Bhadeshia andSvensson (48).
B. Alloying Additions An increase in alloying additions (higher harden-ability) will shift the CCT curves toward longer times and lower temperatures.Consider now cooling curve 3 in Figure 9.26. The transformation product canchange from predominately grain boundary and Widmanstatten ferrite (leftCCT curves) to predominately acicular ferrite (middle CCT curves) to pre-dominately bainite (right CCT curves). This is like what Figure 9.25 shows.

236 POST-SOLIDIFICATION PHASE TRANSFORMATIONS
C. Grain Size Similar to the effect of alloying additions, an increase in theaustenite grain size (less grain boundary area for ferrite nucleation) will alsoshift the CCT curves toward longer times and lower temperatures.
D. Weld Metal Oxygen Content The effect of the weld metal oxygencontent on the weld metal microstructure is explained as follows. First, asshown in Figure 9.27, Fleck et al. (49) observed in submerged arc welds thatthe austenite grain size before transformation decreases with increasing weld metal oxygen content. Liu and Olson (50) observed that increasing theweld metal oxygen content increased the inclusion volume fraction anddecreased the average inclusion size. In fact, a large number of smaller sizeinclusions of diameters less than 0.1 mm was found. Since fine second-phaseparticles are known to increasingly inhibit grain growth by pinning the grainboundaries as the particles get smaller and more abundant (51), increasing theweld metal oxygen content should decrease the prior austenite grain size.
321
grain boundary ferritesideplate ferrite
acicular ferrite
bainite
austenite
log Time
Tem
pera
ture
increasing alloying additionsincreasing grain sizedecreasing oxygen
Figure 9.26 Effect of alloying elements, grain size, and oxygen on CCT diagrams forweld metal of low-carbon steel.
Q&T C-Mn-Mo-Nbplate 3.0 MJ/m welds
Weld metal oxygen content, wt %0.01 0.02 0.03 0.04 0.05
70
80
90
100
110
Prio
r au
sten
ite g
rain
diam
eter
,
m µ
Figure 9.27 Prior austenite grain diameter as a function of weld metal oxygen contentin submerged arc welds. Reprinted from Fleck et al. (49). Courtesy of AmericanWelding Society.

TRANSFORMATION IN LOW-CARBON, LOW-ALLOY STEEL WELDS 237
Therefore, the effect of decreasing the weld metal oxygen content is similar tothat of increasing the prior austenite grain size. This is just like what Figure9.25 shows.
Second, larger inclusions, which are favored by lower weld metal oxygencontents, can act as favorable nucleation sites for acicular ferrite (50). Appro-priate inclusions appear to be in the size range 0.2–2.0 mm, and the mean sizeof about 0.4 mm has been suggested to be the optimum value (49, 51–53). Foxet al. (54) suggested in submerged arc welds of HY-100 steel that insufficientinclusion numbers are generated for the nucleation of acicular ferrite if theoxygen content is too low (<200ppm). On the other hand, many small oxideinclusions (<0.2mm) can be generated if the oxygen content is too high (>300ppm). These inclusions, though too small to be effective nuclei for aci-cular ferrite, reduce the grain size and thus provide much grain boundary areafor nucleation of grain boundary ferrite. As such, an optimum oxygen contentcan be expected for acicular ferrite to form. This is just like what Figure 9.25bshows.
The existence of an optimum oxygen content for acicular ferrite to formhas also been reported by Onsoien et al. (45) in GMAW with oxygen or carbondioxide added to argon, as shown clearly in Figure 9.28. With Ar–O2 as theshielding gas, the shielding gas oxygen equivalent is the volume percentage ofO2 in the shielding gas. With Ar–CO2 as the shielding gas, it becomes thevolume percentage of CO2 in the shielding gas that will produce the sameoxygen content in the weld metal. As expected, the experimental results showthat the higher the shielding gas oxygen equivalent, the more hardenabilityelements such as Mn and Si from the filler wire are oxidized. Consider againcooling curve 3 in Figure 9.26. As the shielding gas oxygen equivalent isreduced, the CCT curves can shift from left (broken lines) to middle (solid
0 5 10 15 200
20
40
60
80
100
Shielding gas oxygenequivalent (vol. pct.)
Aci
cula
r fe
rrite
con
tent
(vo
l. pc
t.) ER 70S-3, 1.8 MJ/m Oxygen in shielding gas Carbon dioxide in shielding gas
Figure 9.28 Acicular ferrite content as a function of shielding gas oxygen equivalentfor gas–metal arc welds. Reprinted from Onsoien et al. (45). Courtesy of AmericanWelding Society.

238 POST-SOLIDIFICATION PHASE TRANSFORMATIONS
lines) and a predominately acicular microstructure is produced. However, asthe shielding gas oxygen equivalent is reduced further, the CCT curves canshift from middle (solid lines) to right (dotted lines) and acicular ferrite nolonger predominates.
Other factors have also been reported to affect amount of acicular ferritein the weld metal. For example, it has been reported that acicular ferriteincreases with increasing basicity index of the flux for submerged arc welding(54), Ti (55, 56), and Mn and Ni (57).
9.2.3 Weld Metal Toughness
Acicular ferrite is desirable because it improves the toughness of the weldmetal (55, 56). As shown in Figure 9.29, Dallam et al. (57) observed that the
Volume percent acicular ferrite
Ene
rgy
abso
rbed
(ft-
lbs)
Joul
es
30 40 50 60 70 800
10
20
40
30
30
10
20
40
50Q&T C-Mn-Mo-Nb plate3.0 MJ/m weldstest temp. -40oC
7.6 X 7.6 mm izod tests
Figure 9.29 Subsize Charpy V-notch toughness values as a function of volume fraction of acicular ferrite in submerged arc welds. Reprinted from Fleck et al. (49).Courtesy of American Welding Society.
0 2 4 6 8 10-60
-50
-40
-30
-20
-10
0
Shielding gas oxygenequivalent (vol. pct.)
Tran
sitio
n te
mpe
ratu
re a
t35
J (d
eg. C
)
Figure 9.30 Weld metal Charpy V-notch toughness expressed as transition tempera-ture as a function of shielding gas oxygen equivalent. Reprinted from Onsoien et al.(45). Courtesy of American Welding Society.

REFERENCES 239
weld metal Charpy V-notch toughness in submerged arc welds increases withincreasing volume fraction of acicular ferrite in the weld metal. The inter-locking nature of acicular ferrite, together with its fine grain size, provides themaximum resistance to crack propagation by cleavage. The formation of grainboundary ferrite, ferrite side plates, or upper bainite is detrimental to weldmetal toughness, since these microstructures provide easy crack propagationpaths.
Onsoien et al. (45) tested the Charpy V-notch toughness of GMA weldmetal using an energy absorption of 35 J as the criterion for measuring thetransition temperature for ductile-to-brittle fracture. Figure 9.30 showed thatthe maximum toughness (minimum transition temperature)occurs at a shield-ing gas oxygen equivalent of about 2 vol %. This, as can be seen from Figure9.28, essentially corresponds to the maximum amount of acicular ferrite in theweld metal, thus clearly demonstrating the beneficial effect of acicular ferriteon weld metal toughness. Ahlblom (58) has shown earlier a clear minimum inthe plots of Charpy V-notch transition temperature versus weld metal oxygencontent.
REFERENCES
1. David, S. A., Goodwin, G. M., and Braski, D. N., Weld. J., 58: 330s, 1979.2. David, S. A., Weld. J., 60: 63s, 1981.3. Lippold, J. C., and Savage, W. F., Weld. J., 58: 362s, 1974.4. Lippold, J. C., and Savage, W. F., Weld. J., 59: 48s, 1980.5. Cieslak, M. J., and Savage, W. F., Weld. J., 59: 136s, 1980.6. Cieslak, M. J., Ritter, A. M., and Savage, W. F., Weld. J., 62: 1s, 1982.7. Okagawa, R. K., Dixon, R. D., and Olson, D. L., Weld. J., 62: 204s, 1983.8. Metals Handbook, Vol. 8, 8th ed., American Society for Metals, Metals Park, OH,
1973.9. Kou, S., and Le, Y., Metall. Trans., 13A: 1141, 1982.
10. Brooks, J. A., and Garrison, Jr., W. M., Weld. J., 78: 280s, 1999.11. Inoue, H., Koseki, T., Ohkita, S., and Fuji, M., Sci. Technol. Weld. Join., 5: 385, 2000.12. Schaeffler, A. L., Metal Prog., 56: 680, 1949.13. Delong, W. T., Weld. J., 53: 273s, 1974.14. Sato, Y. S., Kokawa, H., and Kuwana, T., Sci. Technol. Weld. Join., 4: 41, 1999.15. Lundin, C. D., Chou, C. P. D., and Sullivan, C. J., Weld. J., 59: 226s, 1980.16. Kotecki, D. J., and Siewert, T. A., Weld. J., 71: 171s, 1992.17. McCowan, C. N., Siewert, T. A., and Olson, D. L., WRC Bull., 342: 1–36, 1989.18. Lake, F. B., Expansion of the WRC-1988 Ferrite Diagram and Nitrogen Prediction,
Abstracts of Papers, 1988 AWS Convention, Detroit, MI, pp. 214–215.19. Kotecki, D. J., Weld. J., 78: 180s, 1999.20. Kotecki, D. J., Weld. J., 79: 346s, 2000.

240 POST-SOLIDIFICATION PHASE TRANSFORMATIONS
21. Kotecki, D. J., Weld Dilution and Martensite Appearance in Dissimilar MetalWelding, IIW Document II-C-195-00, 2000.
22. Kotecki, D. J., private communications, Lincoln Electric Company, Cleveland, OH,2001.
23. Balmforth, M. C., and Lippold, J. C., Weld. J., 79: 339s, 2000.24. Vitek, J. M., Iskander, Y. S., and Oblow, E. M., Weld. J., 79: 33s, 2000.25. Vitek, J. M., Iskander, Y. S., and Oblow, E. M., Weld. J., 79: 41s, 2000.26. Vitek, J. M., and David, S. A., in Trends in Welding Research in the United States,
Ed. S. A. David, American Society for Metals, Metals Park, OH, 1982.27. Vitek, J. M., DasGupta, A., and David, S. A., Metall. Trans., 14A: 1833, 1983.28. Katayama, S., and Matsunawa, A., Proc. International Congress on Applications of
Laser and Electro-Optics 84, 44: 60–67, 1984.29. Katayama, S., and Matsunawa, A., in Proc. International Congress on Applications
of Laser and Electro-Optics 85, San Francisco, 1985, IFS Ltd., Kempston, Bedford,UK, 1985, p. 19.
30. Olson, D. L., Weld. J., 64: 281s, 1985.31. David, S. A., Vitek, J. M., and Hebble, T. L., Weld. J., 66: 289s, 1987.32. Bobadilla, M., Lacaze, J., and Lesoult, G., J. Crystal Growth, 89: 531, 1988.33. Elmer, J. W., Allen, S. M., and Eagar, T. W., Metall. Trans., 20A: 2117, 1989.34. Elmer, J. W., Eagar, T. W., and Allen, S. M., in Weldability of Materials, Eds. R. A.
Patterson and K. W. Mahin, ASM International, Materials Park, OH, 1990,pp. 143–150.
35. Lippold, J. C., Weld. J., 73: 129s, 1994.36. Koseki, T., and Flemings, M. C., Metall. Mater. Trans., 28A: 2385, 1997.37. Brooks, J. A., and Thompson, A. W., Int. Mater. Rev., 36: 16, 1991.38. Lippold, J. C., Weld. J., 64: 127s, 1985.39. Lundin, C. D., and Chou, C. P. D., Weld. J., 64: 113s, 1985.40. Chen, M. H., and Chou, C. P., Sci. Technol. Weld. Join., 4: 58, 1999.41. Abson, D. J., and Dolby, R. E., Weld. Inst. Res. Bull., 202: July 1978.42. Dolby, R. E., Metals Technol. 10: 349, 1983.43. Classification of Microstructure in Low Carbon Low Alloy Weld Metal, IIW Doc.
IX-1282-83, 1983, International Institute of Welding, London, UK.44. Vishnu, P. R., in ASM Handbook, Vol. 6: Welding, Brazing and Soldering, ASM
International, Materials Park, OH, 1993, pp. 70–87.45. Onsoien, M. I., Liu, S., and Olson, D. L., Weld. J., 75: 216s, 1996.46. Grong, O., and Matlock, D. K., Int. Metals Rev., 31: 27, 1986.47. Babu, S. S., Reidenbach, F., David, S. A., Bollinghaus, Th., and Hoffmeister, H., Sci.
Technol. Weld. Join., 4: 63, 1999.48. Bhadeshia, H. K. D. H., and Svensson, L. E., in Mathematical Modelling of Weld
Phenomena, Eds. H. Cerjak and K. Easterling, Institute of Materials, 1993.49. Fleck, N. A., Grong, O., Edwards, G. R., and Matlock, D. K., Weld. J., 65: 113s, 1986.50. Liu, S., and Olson, D. L., Weld. J., 65: 139s, 1986.51. Ashby, M. F., and Easterling, K. E., Acta Metall., 30: 1969, 1982.

52. Bhadesia, H. K. D. H., in Bainite in Steels, Institute of Materials, London, 1992,Chapter 10.
53. Edwards, G. R., and Liu, S., in Proceedings of the first US-Japan Symposium on Advanced Welding Metallurgy, AWA/JWS/JWES, San Francisco, CA, and Yokohama, Japan, 1990, pp. 213–292.
54. Fox, A. G., Eakes, M. W., and Franke, G. L., Weld. J., 75: 330s, 1996.55. Dolby, R. E., Research Report No. 14/1976/M, Welding Institute, Cambridge 1976.56. Glover, A. G., McGrath, J. T., and Eaton, N. F., in S Toughness Characterization and
Specifications for HSLA and Structural Steels. ed. P. L. Manganon, MetallurgicalSociety of AIME, NY, pp. 143–160.
57. Dallam, C. B., Liu, S., and Olson, D. L., Weld. J., 64: 140s, 1985.58. Ahlblom, B., Document No. IX-1322-84, International Institute of Welding,
London, 1984.
FURTHER READING
1. Grong, O., and Matlock, D. K., Int. Meter. Rev., 31: 27, 1986.2. Brooks, J. A., and Thompson, A. W., Int. Mater. Rev., 36: 16, 1991.3. Vishnu, P. R., in ASM Handbook, Vol. 6: Welding, Brazing and Soldering, ASM
International, Materials Park, OH, 1993, pp. 70–87.4. Brooks, J. A., and Lippold, J. C., in ASM Handbook, Vol. 6: Welding, Brazing and
Soldering, ASM International, Materials Park, OH, 1993, pp. 456–470.
PROBLEMS
9.1 (a) Construct pseudobinary phase diagrams for 55% and 74% Fe. Markon the diagrams the approximate compositions of 310 (essentiallyFe–25 Cr–20 Ni) and 304 (essentially Fe–18Cr–8Ni) stainless steels.
(b) From the diagrams and the approximate compositions, indicate theprimary solidification phases.
9.2 A 308 stainless-steel filler (essentially Fe–20Cr–10Ni) is used to weld 310stainless steel.What is the primary solidification phase if the dilution ratiois about 60%?
9.3 A 304 stainless-steel sheet with a composition given below is weldedautogenously with the GTAW process.The shielding gas is Ar-2% N2, andthe nitrogen content of the weld metal is about 0.13%. The contents ofother alloying elements are essentially the same as those in the basemetal.(a) Calculate the ferrite numbers for the base metal and the weld metal.(b) The weld metal exhibits the primary solidification phase of austen-
ite, and the ferrite content measurements indicate essentially zero
PROBLEMS 241
ferrite number. Is the calculated ferrite number for the weld metalconsistent with the observed one? (Composition: 18.10Cr, 8.49Ni,0.060C, 0.66Si, 1.76Mn, 0.36Mo, 0.012S, 0.036P, and 0.066N.)
9.4 A significant amount of ferrite is lost in a 316 stainless steel weld afterbeing subjected to three postweld thermal cycles with a 1250°C peak tem-perature, which is just below the g + d two-phase region of about 1280 to1425°C. Sketch a curve of ferrite number vs. temperature from 900 to1400°C and explain it.
9.5 Kou and Le (9) quenched 309 stainless steel during autogenous GTAW.The weld metal side of the quenched pool boundary showed dendritesof d-ferrite but the weld pool side showed dendrites of primary austen-ite. Explain why.
9.6 It has been observed in welding austenitic stainless steel with a teardrop-shaped weld pool that the weld metal solidifies with primary ferriteexcept near the centerline, where it solidifies as primary austenite. Sketcha curve of the growth rate R versus the distance y away from the weldcenterline. How does your result explain the ferrite content change nearthe centerline?
242 POST-SOLIDIFICATION PHASE TRANSFORMATIONS

10 Weld Metal ChemicalInhomogeneities
In this chapter we shall discuss chemical inhomogeneities in the weld metal,including solute segregation, banding, inclusions, and gas porosity. Solute seg-regation can be either microsegregation or macrosegregation. Microsegrega-tion refers to composition variations across structures of microscopic sizes, forinstance, dendrite arms or cells (Chapter 6). Macrosegregation, on the otherhand, refers to variations in the local average composition (composition aver-aged over many dendrites) across structures of macroscopic sizes, for instance,the weld. Macrosegregation has been determined by removing samples acrossthe weld metal with a small drill for wet chemical analysis (1). Microsegrega-tion, on the other hand, has been determined by electron probe microanalysis(EPMA) (2–8) or scanning transmission electron microscopy (STEM) (9–14).The spacial resolution is lower in the former (e.g., about 1 mm) and higher inthe latter (e.g., about 0.1 mm).
10.1 MICROSEGREGATION
Alloying elements with an equilibrium segregation coefficient k < 1 tend tosegregate toward the boundary between cells or dendrite arms, and those withk > 1 tend to segregate toward the core of cells or dendrite arms (Chapter 6).Microsegregation can have a significant effect on the solidification crackingsusceptibility of the weld metal (Chapter 11).
10.1.1 Effect of Solid-State Diffusion
Microsegregation can be reduced significantly by solid-state diffusion duringand after solidification. Consequently, microsegregation measured afterwelding may not represent the true microsegregation during welding, which ismore relevant to solidification cracking (Chapter 11).
Kou and Le (15) quenched stainless steels with liquid tin during autoge-nous GTAW in order to preserve the high-temperature microstructure aroundthe pool boundary. In 430 ferritic stainless steel the dendrites were clear nearthe quenched pool boundary but became increasingly blurred away from it,suggesting homogenization of microsegregation by the solid-state diffusion.
243
Welding Metallurgy, Second Edition. Sindo KouCopyright 2003 John Wiley & Sons, Inc.
ISBN: 0-471-43491-4

Ferrite has a body-centered-cubic (bcc) structure, which is relatively open and thus easy for diffusion. In 310 austenitic stainless steel, however, the dendrites were clear even away from the quenched pool boundary, suggestingmuch less homogenization due to solid-state diffusion. Austenite has a face-centered-cubic (fcc) structure, which is more close packed than bcc and thusmore difficult for diffusion.
Brooks and Garrison (8) quenched a precipitation-strengthened marten-sitic stainless steel with liquid tin during GTAW. They measured microsegre-gation across the columnar dendrites, as shown in Figure 10.1a, where thequenched weld pool is in the upper right corner of the micrograph. The weldmetal solidified as a single-phase ferrite. As shown in Figure 10.1b, near the
244 WELD METAL CHEMICAL INHOMOGENEITIES
Figure 10.1 Microsegregation across columnar dendrites near quenched weld pool ina martensitic stainless steel: (a, b) near growth front; (c) 400mm behind. Reprinted fromBrooks and Garrison (8). Courtesy of American Welding Society.

solidification front segregation of Ni, Cu, and Nb toward the boundariesbetween dendrites is clear, the measured equilibrium segregation coefficientsbeing 0.85, 0.9, and 0.36, respectively. The concentration peaks correspond tothe dendrite boundaries. The microsegregation profiles at 400 mm behind thesolidification front are shown in Figure 10.1c. As shown, microsegregation isreduced significantly by solid-state diffusion at elevated temperatures.
Instead of using the Scheil equation (Chapter 6), Brooks and Baskes(16–19) calculated weld metal microsegregation considering solid-state diffu-sion and Lee et al. (20) further incorporated the kinetics of dendrite coarsen-ing. Figure 10.2a shows the calculated microsegregation in a Fe–23Cr–12Nistainless steel that solidifies as ferrite (17, 18), where r is the radius of thegrowing cell and R is the final cell radius. Since k > 1 for Cr, the cell core (r =0) is rich in Cr. The cell grows to about 60% of its full radius in 0.015s aftersolidification starts and 100% in 0.15s, with Cr diffusing away from the cell
MICROSEGREGATION 245
0 0.2 0.4 0.6 0.8 1
10
20
30
40
0
Normalized Distance (r/R)
Cr
Con
cent
ratio
n (
wt %
)
t=.18 sec
t= 3.2 secCr
Ni
0 0.2 0.4 0.6 0.8 115
20
25
30
Normalized Distance (r/R)
Cr
Con
cent
ratio
n (
wt %
) t=.015 sec
t=.075 sect=.25 sec
t=.75 sec
t=.15 sec
(a)
(b)
Figure 10.2 Calculated microsegregation: (a) Fe–23Cr–12Ni (solid-state diffusion sig-nificant); (b) Fe–21Cr–14Ni. Reprinted from Brooks (18).

core as solidification proceeds. Diffusion is fast in ferrite because of its relatively loosely packed bcc structure. Chromium diffusion continues aftersolidification is over (0.25s) and the resultant cell is nearly completely homogenized in 0.75s after solidification starts. Figure 10.2b, shows the calcu-lated microsegregation in a Fe–21Cr–14Ni stainless steel that solidifies asaustenite at the time of final solidification (0.18s) and 3 s later. Both Cr andNi are highly segregated to the cell boundary. Little solid-state diffusion occursduring cooling except near the cell boundary, where some diffusion occursbecause of the steep concentration gradients. Diffusion is slow in austenitebecause of its more densely packed fcc structure.
Figure 10.3 shows the STEM microsegregation profiles across a dendritearm in the weld metal of 308 austenitic stainless steel (about Fe–20Cr–10Ni)measured by David et al. (10). The primary solidification phase is d-ferrite
246 WELD METAL CHEMICAL INHOMOGENEITIES
Figure 10.3 Microsegregation in 308 stainless steel weld: (a) phase diagram; (b) TEMmicrograph of a dendrite arm; (c) microsegregation across the arm. Reprinted fromDavid et al. (10). Courtesy of American Welding Society.

(Figure 10.3a), but the dendrite arm has transformed to g except for theremaining d-ferrite core (Figure 10.3b). Nickel (k < 1) segregates toward thedendrite boundary, while Cr (k > 1) segregates toward the dendrite core(Figure 10.3c). Similar microsegregation profiles have been measured in weldsof 304L (11, 12) and 309 (13) stainless steels, and it has been confirmed thatdiffusion occurs during the d Æ g transformation (6, 7, 10, 14).
10.1.2 Effect of Dendrite Tip Undercooling
In addition to solid-state diffusion, microsegregation can also be affected bythe extent of dendrite tip undercooling. The difference between the equilib-rium liquidus temperature TL and the dendrite tip temperature Tt is the totalundercooling DT, which can be divided into four parts:
DT = DTC + DTR + DTT + DTK (10.1)
where DTC = concentration-induced undercoolingDTR = curvature-induced undercoolingDTT = thermal undercoolingDTK = kinetic undercooling
The solute rejected by the dendrite tip into the liquid can pile up and causeundercooling at the dendrite tip DTC, similar to constitutional supercooling ata planar growth front (Chapter 6). The equilibrium liquidus temperature in aphase diagram is for a flat solid–liquid interface, and it is suppressed if theinterface has a radius of curvature like a dendrite tip. Thermal undercoolingis present where there is a significant nucleation barrier for the liquid to transform to solid. The kinetic undercooling, which is usually negligible, is associated with the driving force for the liquid atoms to become attached tothe solid. It has been observed that the higher the velocity of the dendrite tip,Vt, the smaller the radius of the dendrite tip, Rt, and the larger the undercoolingat the dendrite tip, DT (21). This is shown schematically in Figure 10.4. Modelshave been proposed for dendrite tip undercooling, including those by Burdenand Hunt (22) and Kurz et al. (23).
Brooks et al. (19) calculated weld metal microsegregation in Fe–Nb alloysconsidering dendrite tip undercooling as well as solid-state diffusion. Compo-sition analyses of tin-quenched gas–tungsten arc welds indicated a dendrite tipundercooling of 3.07°C in Fe–1.8Nb and 5.63°C in Fe–3.3Nb. Figure 10.5a showthe calculated results for a Fe–3.3Nb alloy, based on the model of Kurz et al.(23) with k = 0.28 for Nb and DL = 6.8cm2/s. Undercooling results in a highercore Nb concentration during the initial stages of solidification (0.08s). But assolidification proceeds to completion (1.2 s) and the weld cools (5.6 s), the con-centration profiles with and without undercooling start to converge due to the significant effect of solid-state diffusion. It was, therefore, concluded that
MICROSEGREGATION 247

248 WELD METAL CHEMICAL INHOMOGENEITIES
TL
Tt1
Vt1
Vt2
Tt2
Rt1
Rt2
lower tip velocity,larger tip radius,
smaller tipundercooling
T1 T2
higher tip velocity,smaller tip radius,
larger tipundercooling
Liquid
Tem
pera
ture
, T
Distance, x
Dendrite Tips:
∆∆
Figure 10.4 Dendrite tip undercooling.
0.0 0.1 0.2 0.3 0.4 0.5 0.6 0.7 0.8 0.9 1.00
1
2
3
4
5With tip undercoolingWithout tip undercooling
t = 5.6s
t = 1.2s
t = 0.08s
Fraction solidified ( r/R)
Nb
conc
entr
atio
n (w
t%)
0.0 0.1 0.2 0.3 0.4 0.5 0.6 0.7 0.8 0.9 1.01
2
3
4
5With tip undercoolingWithout tip undercooling
t = 0.008s
Fraction solidified (r/R)
Nb
conc
entr
atio
n (w
t%)
t = 0.08s
(a)
(b)
Figure 10.5 Calculated microsegregation in a Fe–3.3Nb weld: (a) slower cooling rate;(b) higher cooling rate. Reprinted from Brooks et al. (19).

although tip undercooling can result in a higher Nb concentration duringinitial solidification, its effect on the final microsegregation is small because ofthe overwhelming effect of solid-state diffusion. With a very high cooling rateof 104°C/s such as in high-energy beam welding (less time for solid-state dif-fusion), Figure 10.5b shows that the effect of undercooling can be importantthroughout solidification and subsequent cooling. Final microsegregation issignificantly less with dendrite tip undercooling than without.
10.2 BANDING
10.2.1 Compositional and Microstructural Fluctuations
In addition to microsegregation across dendrites, microsegregation can also exist in the weld metal as a result of banding during weld pool solidification (Chapter 6). Banding in welds can cause perturbations in thesolidification structure as well as the solute concentration (24). Figure 10.6shows banding and rippling near the centerline of the as-welded top surfaceof a YAG laser weld (conduction mode) in a 304 stainless steel, with alternat-ing bands of dendritic and planarlike structures. Figure 10.7 shows alternat-ing bands of austenite (light) and martensite (dark) in an A36 steel welded with a E309LSi filler by GTAW (25). The composition of A36 isFe–0.71Mn–0.29Cu–0.18Si–0.17C–0.13Ni–0.09Cr–0.05Mo and that of E309LSiis Fe–23.16Cr–13.77Ni–1.75Mn–0.79Si–0.20Cu–0.16Mo–0.11N–0.02C. Thehigh hardness (smaller indentation marks) in the darker regions reflects thepresence of martensite. The hydrogen crack in the martensite near but within
BANDING 249
Figure 10.6 Banding and rippling near centerline of as-welded top surface of a 304stainless steel YAG laser welded in conduction mode.

the fusion boundary was promoted by the use of Ar–6% H2 as the shieldinggas.
10.2.2 Causes
Banding in the weld metal can occur due to a number of reasons. Fluctuationsin the welding speed during manual welding or arc pulsing during pulsed arcwelding can cause banding. However, even under steady-state welding condi-tions, banding can still occur, as evidenced by the surface rippling of the weld.Beside fluctuations in the welding speed and the power input, the followingmechanisms also have been proposed: Solidification halts due to the rapid evo-lution of latent heat caused by high solidification rates during welding (26–28),oscillations of weld pool metal due to uncontrollable variations in arc stabil-ity and the downward stream of the shielding gas (29), and fluctuations in weldpool turbulence due to electromagnetic effects (30, 31).
10.3 INCLUSIONS AND GAS POROSITY
Inclusions and gas porosity tend to deteriorate the mechanical properties of theweld metal. Gas–metal and slag–metal reactions can produce gas porosity andinclusions in the weld metal and affect the weld metal properties (Chapter 3).Inclusions can also result from incomplete slag removal during multiple-passwelding (32), the large dark-etching particle near position D in Figure 10.8being one example (33). Figure 10.9 shows trapped surface oxides as inclusionsin the weld metal and their elimination by modifying the joint design (34).
250 WELD METAL CHEMICAL INHOMOGENEITIES
Figure 10.7 Banding near fusion boundary of a carbon steel welded with an austeniticstainless steel filler metal. Reprinted from Rowe et al. (25). Courtesy of AmericanWelding Society.

Various ways of reducing gas porosity in the weld metal have already beendescribed in Chapter 3. Gas pores can be round or interdendritic, as shown inFigure 10.10, which shows a gas–metal arc weld in 7075 aluminum made witha 4043 filler metal. Similar gas pores have been reported in other aluminumwelds (35–37). Although round gas pores can be randomly distributed in theweld metal, they can also line up and form bands of porosity when banding is severe during weld metal solidification (35, 36). It is often difficult to tellwhether interdendritic pores are due to gas formation or due to solidification
INCLUSIONS AND GAS POROSITY 251
Figure 10.8 Multipass weld with slag inclusions (D) and other defects, including lackof fusion (A), lamellar tearing (B), poor profile (C), and undercut (E). Reprinted fromLochhead and Rodgers (33). Courtesy of American Welding Society.
Figure 10.9 Joint designs and trapping of surface oxides in aluminum welding: (a)oxide trapped; (b) oxide not trapped (34).

shrinkage (21). However, if they are due to gas formation, they must haveformed during the latter stages of solidification, where the dendritic structurehas essentially been established.
10.4 INHOMOGENEITIES NEAR FUSION BOUNDARY
Dissimilar metal welding is often encountered in welding, where a filler metaldifferent in composition from the base metal is used or where two base metalsdifferent in composition are welded together. In dissimilar metal welding, theregion near the fusion boundary often differ significantly from the bulk weldmetal in composition and sometimes even microstructure and properties. Theregion, first discovered by Savage et al. (38, 39), has been called the unmixedzone (38, 39), filler-metal-depleted area (40), partially mixed zone (41), inter-mediate mixed zone (42), and hard zone (43). It has been observed in variouswelds, including stainless steels, alloy steels, aluminum alloys, and superalloys(38–47).
10.4.1 Composition Profiles
Ornath et al. (46) determined the composition profiles across the fusionboundary of a low-alloy steel welded with a stainless steel filler ofFe–18Cr–8Ni–7Mn, as shown in Figure 10.11. Plotting the concentrationagainst the distance from the fusion boundary according to Equation (6.17)(for solute segregation during the initial transient of solidification), theyobtained a straight line. As such, they proposed that segregation rather thandiffusion is responsible for the observed composition profiles. In other words,the composition profiles are caused by the rejection of Cr, Ni, and Mn into themelt by the solid weld metal during the initial stage of solidification.
252 WELD METAL CHEMICAL INHOMOGENEITIES
Figure 10.10 Porosity in aluminum weld showing both spherical and interdendriticgas pores. One interdendritic pore is enlarged for clarity.
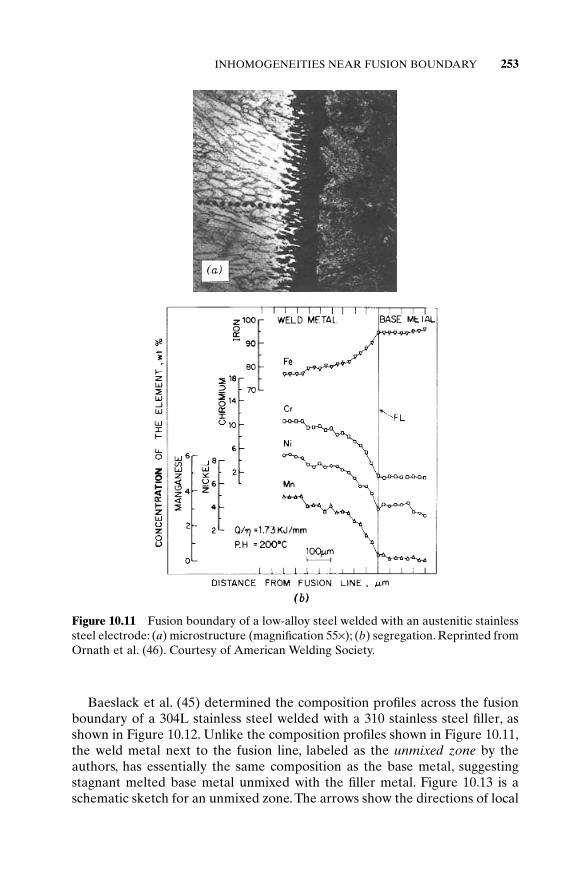
Baeslack et al. (45) determined the composition profiles across the fusionboundary of a 304L stainless steel welded with a 310 stainless steel filler, asshown in Figure 10.12. Unlike the composition profiles shown in Figure 10.11,the weld metal next to the fusion line, labeled as the unmixed zone by theauthors, has essentially the same composition as the base metal, suggestingstagnant melted base metal unmixed with the filler metal. Figure 10.13 is aschematic sketch for an unmixed zone.The arrows show the directions of local
INHOMOGENEITIES NEAR FUSION BOUNDARY 253
Figure 10.11 Fusion boundary of a low-alloy steel welded with an austenitic stainlesssteel electrode: (a) microstructure (magnification 55¥); (b) segregation. Reprinted fromOrnath et al. (46). Courtesy of American Welding Society.

Figure 10.12 Unmixed zone in a 304L stainless steel welded with a 310 filler metal:(a) microstructure; (b) composition profiles. Reprinted from Baeslack et al. (45). Cour-tesy of American Welding Society.
heat-affectedzone
partiallymelted zone
unmixed zone
base metal
fusionboundary
bulk weld metal
Figure 10.13 Zone of unmixed melted base metal along the fusion boundary.
254 WELD METAL CHEMICAL INHOMOGENEITIES

fluid flow during welding, which is not strong enough for thorough mixing butstrong enough to move parts of the melted base metal.Also shown in the figureare the partially melted zone (Chapters 12 and 13) and the heat-affected zone(Chapters 14–18).
10.4.2 Effect of Inhomogeneities
Inhomogeneities in the region along the fusion boundary have been reportedto cause problems, including hydrogen cracking (48, 49), corrosion (50), andstress corrosion cracking (45). Martensite often exists in the region in carbonor alloy steels welded with austenitic stainless steel fillers. This is because theweld metal composition here can be within the martensite region of the con-stitutional diagrams (Chapter 9). This composition transition shown in Figure10.11 covers compositions in the martensite range of the Schaeffler diagram,thus explaining the formation of martensite (46). Linnert (48) observedmartensite and hydrogen cracking in weld metal along the fusion boundary ofa Cr–Ni–Mo steel welded with a 20Cr–10Ni stainless steel filler. Savage et al.(49) reported similar hydrogen cracking in HY-80 welds. Rowe et al. (25)showed hydrogen cracking along the weld metal side of the fusion boundaryin a A36 steel gas–tungsten arc welded with a ER308 stainless steel filler metaland an Ar-6% H2 shielding gas.
Omar (43) welded carbon steels to austenitic stainless steels by SMAW.Figure 10.14 shows that the hard martensite layer in the weld metal along thecarbon steel side of the fusion boundary can be eliminated by using a Ni-basefiller metal plus preheating and controlling the interpass temperature. Theaustenitic stainless steel electrode E309, which has much less Ni and more Cr,did not work as well.
10.5 MACROSEGREGATION IN BULK WELD METAL
Weld pool convection (Chapter 4) can usually mix the weld pool well to minimize macrosegregation across the resultant weld metal. Houldcroft (1) foundno appreciable macrosegregation in pure aluminum plates single-pass welded with Al–5% Cu filler.Similar results were observed in Al–l.0Si–l.0Mg plates single-pass welded using either Al–4.9% Si or Al–1.4% Si as the filler metal (1).However, in single-pass dissimilar-metal welding, macrosegregation can still occurif weld pool mixing is incomplete. In multiple-pass dissimilar-metal welding,macrosegregation can still occur even if weld pool mixing is complete in each pass.
10.5.1 Single-Pass Welds
Macrosegregation can occur in a dissimilar weld between two different basemetals because of insufficient mixing in the weld pool. Matsuda et al. (51)showed Cu macrosegregation across an autogenous gas–tungsten arc weld between thin sheets of 1100 aluminum (essentially pure Al) and 2024
MACROSEGREGATION IN BULK WELD METAL 255

256 WELD METAL CHEMICAL INHOMOGENEITIES
(a)
(b)
Figure 10.14 Carbon steel side of weld metal in a weld between a carbon steel andan austenitic stainless steel made with a Ni-based filler metal: (a) martensite alongfusion boundary; (b) martensite avoided by preheating and controlling interpass tem-perature. Reprinted from Omar (43). Courtesy of American Welding Society.
(a) (b)
Figure 10.15 Macrosegregation in a laser beam weld between Ti–6Al–4V andTi–3Al–8V–6Cr–4Mo–4Zr (bC): (a) transverse cross section; (b) composition profiles.Reprinted from Liu et al. (53). Courtesy of American Welding Society.

aluminum (essentially Al–4.4Cu). Macrosegregation was reduced throughenhanced mixing by magnetic weld pool stirring. In laser or electron beam welding, the welding speed can be too high to give the weld metal sufficient time to mix well before solidification (52, 53). Figures 10.15 shows macrosegregation in a laser weld between Ti–6Al–4V (left) andTi–3Al–8V–6Cr–4Mo–4Zr (right) (53).
Macrosegregation due to lack of weld pool mixing has also been observedin GTAW of some powder metallurgy alloys. Such alloys are made by con-solidation of rapidly solidified powder having some special properties, forinstance, extended solubility of alloying elements. Figure 10.16 shows the lack
MACROSEGREGATION IN BULK WELD METAL 257
(a)
(b)
Figure 10.16 Powder metallurgy Al–10Fe–5Ce alloy gas–tungsten arc welded withAl–5Si filler metal: (a) AC; (b) DCEN. Reprinted from Metzger (54). Courtesy ofAmerican Welding Society.
Filler D
Basemetal A
Basemetal Bd
a bc
Backing C
(2) % element E in weld bead =
[a (% E in a) + b (% E in b) + c (% E in c)+ d (% E in d)] / (a + b + c + d)
(1) % dilution =
×
a + b + c100
a + b + c + d
Figure 10.17 Filler metal dilution and composition in dissimilar-metal welding.Reprinted from Estes and Turner (55). Courtesy of American Welding Society.

258 WELD METAL CHEMICAL INHOMOGENEITIES
Figure 10.18 Macrosegregation in a multiple-pass weld between 4130 steel and 304stainless steel. Reprinted from Estes and Turner (55). Courtesy of American WeldingSociety.

of mixing between an Al–10Fe–5Ce powder metallurgy base metal and a 4043(Al–5Si) filler metal in AC GTAW and improved mixing and reduced gasporosity with DCEN GTAW (54). This may be because in GTAW weld pene-tration is higher with DCEN than with AC (Chapter 1).
10.5.2 Multiple-Pass Welds
Figure 10.17 shows the filler metal dilution and composition of the first bead(root pass) in a dissimilar-metal weld (55). The composition of the beaddepends not only on the compositions of the base and filler metals but also onthe extent of dilution. Apparently, the second bead to be deposited on top ofthe first bead will have a different composition from the first bead regardlessof the extent of weld pool mixing.
Figure 10.18 shows the composition profiles across a multiple-pass weldbetween 4130 alloy steel and 304 stainless steel with a 312 stainless steel asthe filler metal (55). Composition differences between beads are evident. Forinstance, the Cr content varies from 18% in the first bead to 25% in the third.As a result of such macrosegregation, the ferrite content (which affects theresistance to solidification cracking and corrosion) varies from one bead toanother, as shown in Figure 10.19.
MACROSEGREGATION IN BULK WELD METAL 259
Figure 10.19 Variations in microstructure in a multiple-pass weld between 4130 steeland 304 stainless steel. Reprinted from Estes and Turner (55). Courtesy of AmericanWelding Society.
REFERENCES
1. Houldcroft, R. T., Br. Weld. J., 1: 468, 1954.2. Lippold, J. C., and Savage, W. F., Weld. J., 58: 362s, 1979.3. Takalo, T., Suutala, N., and Moisio, T., Metall. Trans., 10A: 1173, 1979.4. Suutala, N., Takalo, T., and Moisio, T., Metall. Trans., 10A: 1183, 1979.5. Ciestak, M. J., and Savage, W. F., Weld. J., 59: 136s, 1980.6. Suutala, N., Takalo, T., and Moisio, T., Weld. J., 60: 92s, 1981.7. Leone, G. L., and Kerr, H. W., Weld. J., 61: 13s, 1982.8. Brooks, J. A., and Garrison, W. M. Jr., Weld. J., 78: 280s, 1999.9. Gould, J. C., Ph.D. Thesis, Carnegie-Mellon University, Pittsburgh, PA, 1983.
10. David, S. A., Goodwin, G. M., and Braski, D. N., Weld. J., 58: 330s, 1979.11. Lyman, C. E., Manning, P. E., Duquette, D. J., and Hall, E., Scan. Electron. Microsc.,
1: 213, 1978.12. Lyman, C. E., Weld. J., 58: 189s, 1979.13. Brooks, J. A., Ph.D. Thesis, Carnegie-Mellon University, Pittsburgh, PA, 1982.14. Cieslak, M. J., Ritter, A. M., and Savage, W., Weld. J., 61: 1s, 1982.15. Kou, S., and Le, Y., Metall. Trans. A, 13A: 1141, 1982.16. Brooks, J. A., and Baskes, M. I., in Advances in Welding Science and Technology,
Ed. S. A. David, ASM International, Materials Park, OH, March 1986, p. 93.17. Brooks, J. A., and Baskes, M. I., in Recent Trends in Welding Science and Technol-
ogy, Eds. S. A. David and J. M. Vitek, ASM International, Materials Park, OH,March 1990, p. 153.
18. Brooks, J. A., in Weldability of Materials, Eds. R. A. Patterson and K. W. Mahin,ASM International, Materials Park, OH, March 1990, p. 41.
19. Brooks, J. A., Li, M., Baskes, M. I., and Yang, N. C. Y., Sci. Technol. Weld. Join., 2:160, 1997.
20. Lee, J. Y., Park, J. M., Lee, C. H., and Yoon, E. P., in Synthesis/Processing of Light-weight Metallic Materials II, Eds. C. M. Ward-Close, F. H. Froes, S. S. Cho, and D. J.Chellman, The Minerals, Metals and Materials Society, Warrendale, PA 1996, p. 49.
21. Flemings, M. C., Solidification Processing, McGraw-Hill, New York, 1974.22. Burden, M. H., and Hunt, J. D., J. Crystal Growth, 22: 109, 1974.23. Kurz, W., Giovanola, B., and Trivedi, R., Acta Metall., 34: 823, 1986.24. Davies, G. J., and Garland, J. G., Int. Metall. Rev., 20: 83, 1975.25. Rowe, M. D., Nelson, T. W., and Lippold, J. C., Weld. J., 78: 31s, 1999.26. Gurev, H. S., and Stout, R. D., Weld. J., 42: 298s, 1963.27. Cheever, D. L., and Howden, D. G., Weld. J., 48: 179s, 1969.28. Morchan, B. A., and Abitdnar, A., Automat. Weld., 21: 4, 1968.29. Ishizaki, K., J. Jpn. Weld. Soc., 38: 1963.30. Jordan, M. F., and Coleman, M. C., Br. Weld. J., 15: 552, 1968.31. Waring, J., Aust. Weld. J., 11: 15, 1967.32. Gurney, T. R., Fatigue of Welded Structures, Cambridge University Press,
Cambridge, 1968, p. 156.
260 WELD METAL CHEMICAL INHOMOGENEITIES

33. Lochhead, J. C., and Rodgers, K. J., Weld. J., 78: 49, 1999.34. Inert Gas Welding of Aluminum Alloys, Society of the Fusion Welding of Light
Metals, Tokyo, Japan, 1971 (in Japanese).35. D’Annessa, A. T., Weld. J., 45: 569s, 1966.36. D’Annessa, A. T., Weld. J., 49: 41s, 1970.37. D’Annessa, A. T., Weld. J., 46: 491s, 1967.38. Savage, W. F., and Szekeres, E. S., Weld. J., 46: 94s, 1967.39. Savage, W. F., Nippes, E. F., and Szekeres, E. S., Weld. J., 55: 260s, 1976.40. Duvall, D. S., and Owczarski, W. A., Weld. J., 47: 115s, 1968.41. Kadalainen, L. P., Z. Metallkde., 70: 686, 1979.42. Doody, T., Weld. J., 61: 55, 1992.43. Omar, A. A., Weld. J., 67: 86s, 1998.44. Lippold, J. C., and Savage, W. F., Weld. J., 59: 48s, 1980.45. Baeslack, W. A. III, Lippold, J. C., and Savage, W. F., Weld. J., 58: 168s, 1979.46. Ornath, F., Soudry, J., Weiss, B. Z., and Minkoff, I., Weld. J., 60: 227s, 1991.47. Albert, S. K., Gills,T. P. S.,Tyagi,A. K., Mannan, S. L., Kulkarni, S. D., and Rodriguez,
P., Weld. J., 66: 135s, 1997.48. Linnert, G. E., Welding Metallurgy, Vol. 2. American Welding Society, Miami, FL,
1967.49. Savage, W. F., Nippes, E. F., and Szekeres, E. S., Weld. J., 55: 276s, 1976.50. Takalo, T., and Moisio, T., IIW Annual Assembly, Tel Aviv, 1975.51. Matsuda, F., Ushio, M., Nakagawa, H., and Nakata, K., in Proceedings of the
Conference on Arc Physics and Weld Pool Behavior, Vol. 1, Welding Institute,Arbington Hall, Cambridge, 1980, p. 337.
52. Seretsky, J., and Ryba, E. R., Weld. J., 55, 208s, 1976.53. Liu, P. S., Baeslack III, W. A., and Hurley, J., Weld. J., 73: 175s, 1994.54. Metzger, G. E., Weld. J., 71: 297s, 1992.55. Estes, C. L., and Turner, P. W., Weld. J., 43: 541s, 1964.
FURTHER READING
1. Davies, G. J., Solidification and Casting, Wiley, New York, 1973.2. Davies, G. J., and Garland, J. G., Int. Metall. Rev., 20: 83, 1975.3. Flemings, M. C., Solidification Processing, McGraw-Hill, New York, 1974.4. Savage, W. F., Weld. World, 18: 89, 1980.
PROBLEMS
10.1 With the help of Schaeffler’s diagram, show that martensite can form inthe fusion zone at 70 mm from the fusion boundary of the weld shownin Figure 10.11.
PROBLEMS 261
10.2 Butt welding of 5052 aluminum (Al–2.5Mg) with a single-V joint iscarried out with 5556 filler (Al–5.1Mg). The dilution ratio of the firstpass is 80%. In the second pass 40% of the material comes from thefiller wire, 40% from the base metal, and 20% from the first pass.Calculate the compositions of the two passes, assuming uniform mixingin both.
10.3 Suppose that in the previous problem the workpiece composition isFe–25Cr–20Ni and the filler composition is Fe–20Cr–10Ni. What is thedifference in the ferrite content between the two passes based on Schaeffler’s diagram.
10.4 Consider the pseudo-binary-phase diagram shown in Figure 10.3a.Sketch the Ni and Cr concentration profiles across a dendrite arm foran alloy that has a composition just to the left of point b.
10.5 Consider welding Ni to Ti. Can macrosegregation occur in LBW? Whyor why not? Is the chance of macrosegregation higher or lower inGTAW than in LBW?
10.6 Explain why gas porosity can be severe in the GTAW of powder met-allurgy alloy Al–10Fe–5Ce (Figure 10.16a). Explain why gas porositycan be significantly less with DCEN than with AC.
10.7 Consider banding in the YAG laser weld of 304 stainless steel (Figure10.6). What could have caused banding in this weld? Is the growth ratehigher during dendritic or planarlike solidification and why?
262 WELD METAL CHEMICAL INHOMOGENEITIES
11 Weld Metal Solidification Cracking
Solidification cracking in the weld metal will be described, the metallurgicaland mechanical factors affecting the crack susceptibility will be discussed, andthe methods for reducing cracking will be presented.
11.1 CHARACTERISTICS, CAUSE, AND TESTING
11.1.1 Intergranular Cracking
Solidification cracking, which is observed frequently in castings and ingots, canalso occur in fusion welding, as shown in Figure 11.1. Such cracking, as shownin Figure 11.2, is intergranular, that is, along the grain boundaries of the weldmetal (1). It occurs during the terminal stage of solidification, when the tensilestresses developed across the adjacent grains exceed the strength of the almostcompletely solidified weld metal (2–4). The solidifying weld metal tends tocontract because of both solidification shrinkage and thermal contraction. Thesurrounding base metal also tends to contract, but not as much, because it isneither melted nor heated as much on the average. Therefore, the contractionof the solidifying metal can be hindered by the base metal, especially if theworkpiece is constrained and cannot contract freely. Consequently, tensilestresses develop in the solidifying weld metal. The severity of such tensilestresses increases with both the degree of constraint and the thickness of theworkpiece.
The various theories of solidification cracking (4–7) are effectively identicaland embody the concept of the formation of a coherent interlocking solidnetwork that is separated by essentially continuous thin liquid films and thusruptured by the tensile stresses (2). The fracture surface often reveals the den-dritic morphology of the solidifying weld metal, as shown in Figure 11.3 for308 stainless steel fractured under augmented strain during GTAW (8). If asufficient amount of liquid metal is present near the cracks, it can “backfill”and “heal” the incipient cracks.
The terminal stage of solidification mentioned above refers to a fraction ofsolid, fS, close to 1, and not necessarily a temperature near the lower limit ofthe solidification temperature range. Depending on how it varies with tem-perature in an alloy, fS can be close to 1 and an essentially coherent inter-
263
Welding Metallurgy, Second Edition. Sindo KouCopyright 2003 John Wiley & Sons, Inc.
ISBN: 0-471-43491-4

264 WELD METAL SOLIDIFICATION CRACKING
Figure 11.1 Solidification cracking in a gas–metal arc weld of 6061 aluminum.
Figure 11.2 Solidification cracking in an autogenous bead-on-plate weld of 7075 aluminum (magnification 140¥). From Kou and Kanevsky (1).
locking solid network can form even though the temperature is only slightlybelow the liquidus temperature. In fact, Matsuda et al. (9, 10) have reportedthat solidification cracking occurs in some carbon and stainless steels at tem-peratures slightly below their liquidus temperatures.
11.1.2 Susceptibility Testing
A. Houldcroft Test This test, also called the fishbone test, is shown in Figure 11.4 (11, 12). It is often used for evaluating the solidification cracking

CHARACTERISTICS, CAUSE, AND TESTING 265
Figure 11.3 SEM fracture surface of a 308 stainless steel weld fractured under augmented strain during GTAW. Reprinted from Li and Messeler (8). Courtesy ofAmerican Welding Society.
Figure 11.4 Houldcroft test: (a) design (11); (b) cracking in an aluminum alloy specimen. Reprinted from Liptax and Baysinger (12). Courtesy of American WeldingSociety.

susceptibility of sheet gage materials. The crack length from the starting edge of the test specimen is used to indicate the susceptibility to cracking(11–14).
The specimen is free from constraints and a progression of slots of vary-ing depth allows the dissipation of stresses within it. In such a test, solidi-fication cracking initiates from the starting edge of the test specimen and propagates along its centerline. As the heat source moves inward from thestarting edge of the test specimen, solidification begins and the solidifyingstructure is torn apart because the starting edge continues to expand as a resultof continued heat input to the specimen. The reason for using the slots isexplained with the help of specimens cracking under tension, as shown in Figure 11.5. The crack may run all the way through the entire length of the specimen (Figure 11.5a). Reducing the width of the specimen can reducethe amount of stress along the length and bring the crack to a stop (Figure11.5b). In order not to dramatically change the heat flow condition along the length of the weld, however, the material next to the slots is not cut off(Figure 11.5c).
B. Varestraint Test This test was developed by Savage and Lundin (15). Asshown in Figure 11.6a, an augmented strain is applied to the test specimen(usually 12.7mm thick) by bending it to a controlled radius at an appropriatemoment during welding (15). Both the amount of the applied strain and thecrack length (either the total length of all cracks or the maximum crack length)serve as an index of cracking sensitivity. The specimen can also be bent trans-verse to the welding direction, that is, the transverse Varestraint test, as shownin Figure 11.6b (16). This may promote cracking inside the weld metal morethan that outside. Figure 11.6c shows the cracking pattern observed in a Vare-straint test specimen of a 444 Nb-stabilized ferritic stainless (17). Figure 11.7compares the solidification cracking susceptibility of several materials by Vare-straint testing (18).
Other methods have also been used for testing the solidification crackingsusceptibility of weld metals (19, 20), including the circular patch test (21–23)and Sigamajig test (24).
266 WELD METAL SOLIDIFICATION CRACKING
(a) (b) (c)
Figure 11.5 Three types of specimens cracking under tension: (a) uniform width alongcrack; (b) decreasing width along crack; (c) uniform width along crack but slotted.

Figure 11.6 Solidification cracking tests: (a) Varestraint (15); (b) transverse Varestraint (16); (c) cracking in a ferritic stainless steel Varestraint specimen (17).(c) Reprinted from Krysiak et al. (17), courtesy of ASM International.
HR-160
Max
imum
cra
ck le
ngth
, mm
0 21 3 4 50
0.5
1.0
1.5
2.0
2.5
3.0
IN718
310SS
304SS
Applied strain, %
Figure 11.7 Varestraint test results showing solidification cracking susceptibility ofseveral different materials. Reprinted from DuPont et al. (18). Courtesy of AmericanWelding Society.
(c)

11.2 METALLURGICAL FACTORS
Metallurgical factors that have been known to affect the solidification crack-ing susceptibility of weld metals include (i) the solidification temperaturerange, (ii) the amount and distribution of liquid at the terminal stage of solid-ification, (iii) the primary solidification phase, (iv) the surface tension of thegrain boundary liquid, and (v) the grain structure.All these factors are directlyor indirectly affected by the weld metal composition. The first two factors areaffected by microsegregation during solidification. Microsegregation in turncan be affected by the cooling rate during solidification. In fact, in austeniticstainless steels the primary solidification phase can also be affected by thecooling rate. These metallurgical factors will be discussed in what follows.
11.2.1 Solidification Temperature Range
Generally speaking, the wider the solidification (freezing) temperature range,the larger the (S + L) region in the weld metal or the mushy zone and thusthe larger the area that is weak and susceptible to solidification cracking. Thesolidification temperature range of an alloy increases as a result of either thepresence of undesirable impurities such as sulfur (S) and phosphorus (P) insteels and nickel-base alloys or intentionally added alloying elements.
A. Effect of S and P Impurities such as S and P are known to cause severesolidification cracking in carbon and low-alloy steels even at relatively lowconcentrations. They have a strong tendency to segregate at grain boundaries(25) and form low-melting-point compounds (FeS in the case of S), thus widen-ing the solidification temperature range. In addition, S and P can cause severesolidification cracking in nickel-base alloys (26–28) and ferritic stainless steels(29). In the case of austenitic stainless steels, their detrimental effect on solidi-fication cracking can be significantly affected by the primary solidificationphase, as will be discussed subsequently.
Figure 11.8 shows the effect of various elements, including S and P, on thesolidification temperature range of carbon and low-alloy steels (30).As shown,S and P tend to widen the solidification temperature range of steels tremen-dously. The wider the solidification temperature range, the more grain bound-ary area in the weld metal remains liquid during welding and hence susceptibleto solidification cracking, as depicted in Figure 11.9.
B. Effect of Reactions during Terminal Solidification Reactions, especiallyeutectic reactions, can often occur during the terminal stage of solidificationand extend the solidification temperature range, for instance, in aluminumalloys and superalloys.
Dupont et al. (31–35) studied the effect of eutectic reactions on the solidification temperature range and solidification cracking. The materialsstudied include some superalloys and stainless steels containing niobium (Nb).
268 WELD METAL SOLIDIFICATION CRACKING

Figure 11.10 shows the weld metal microstructure of a Nb-bearing superalloy(34). Two eutectic-type constituents are present in the microstructure, g-NbCand g-Laves. The liquid solidifies as the primary g and two eutectic reactionsoccur during the terminal stage of solidification, first L Æ g + NbC and thenL Æ g + Laves. The second eutectic reaction, when it occurs, takes place at aconsiderably lower temperature than the first, thus extending the solidification
METALLURGICAL FACTORS 269
S
B
P
C
Si
500
100
200
300
Weight %
Free
zing
ran
ge, C
10
o
Figure 11.8 Effect of alloying elements on the solidification temperature range of carbon and low-alloy steels. Modified from Principles and Technology of the FusionWelding of Metals (30).
Pool (L) Weld (S)
no grain boundary(GB) liquid
GB
GB
(a)
(b)
(d)
(c)
pure Fe: zero freezingtemperature range;not susceptible
Fe with silicon: narrowfreezing temperaturerange; somewhatsusceptible
Fe with sulfur: widefreezing temperaturerange; highly susceptible
GB
GB
GB
GB
grain boundaryliquid
L
L
L
S
S
S
grain boundaryliquid
Figure 11.9 Effect of impurities on grain boundary liquid of weld metal: (a) weldmetal near pool; (b) no liquid in pure Fe; (c) some liquid with a small amount of Si;(d) much more liquid with a small amount of sulfur.
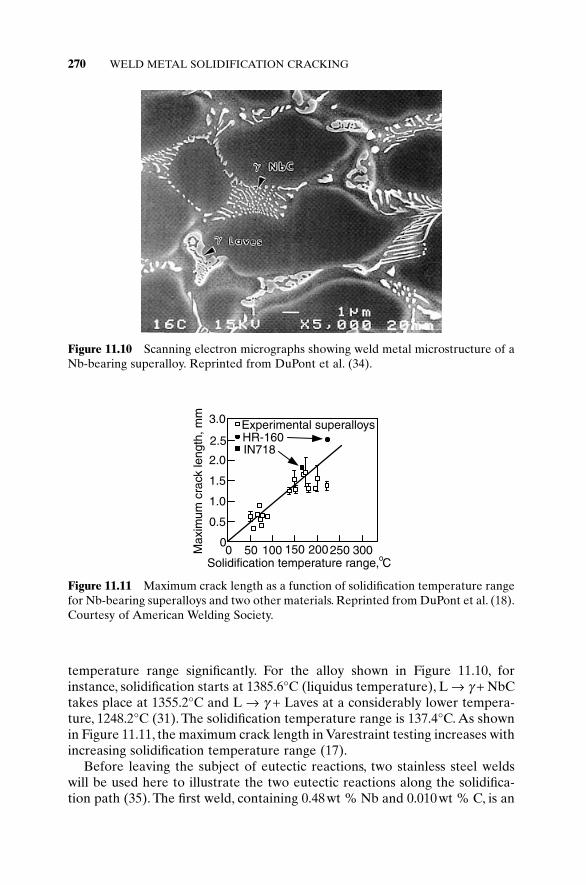
temperature range significantly. For the alloy shown in Figure 11.10, forinstance, solidification starts at 1385.6°C (liquidus temperature), L Æ g + NbCtakes place at 1355.2°C and L Æ g + Laves at a considerably lower tempera-ture, 1248.2°C (31). The solidification temperature range is 137.4°C. As shownin Figure 11.11, the maximum crack length in Varestraint testing increases withincreasing solidification temperature range (17).
Before leaving the subject of eutectic reactions, two stainless steel weldswill be used here to illustrate the two eutectic reactions along the solidifica-tion path (35). The first weld, containing 0.48wt % Nb and 0.010wt % C, is an
270 WELD METAL SOLIDIFICATION CRACKING
Figure 11.10 Scanning electron micrographs showing weld metal microstructure of aNb-bearing superalloy. Reprinted from DuPont et al. (34).
Experimental superalloysHR-160IN718
Max
imum
cra
ck le
ngth
, mm
0.5
1.0
1.5
2.0
2.5
3.0
0
Solidification temperature range, C50 100 150 200250 3000
o
Figure 11.11 Maximum crack length as a function of solidification temperature rangefor Nb-bearing superalloys and two other materials. Reprinted from DuPont et al. (18).Courtesy of American Welding Society.

autogenous gas–tungsten arc weld of a Nb-stabilized austenitic stainless steel20Cb-3. To increase the Nb content, a relatively large composite weld wasmade in alloy 20Cb-3 with an INCO 112 filler wire containing 3.81wt % Nband then machined flat at the top surface for further welding.The second weld,containing 2.20wt % Nb and 0.014wt % C, is an autogenous gas–tungsten arcweld within the 20Cb-3–INCO 112 composite weld.
The solidification paths of the two welds are shown in Figures 11.12. Asmentioned previously in Chapter 6, the arrows in the solidification path indi-cate the directions in which the liquid composition changes as temperaturedecreases. Here, solidification of the 20Cb-3 weld initiates by a primary L Æg reaction, as shown in Figure 11.12a. Because of the relatively high C–Nb ratioof the alloy, the interdendritic liquid becomes enriched in C until the g/NbCtwofold saturation line is reached. Here, the L Æ g + NbC reaction takes over.However, since the fraction of liquid is already very small ( fL = 0.005), solidi-fication is soon over ( fL = 0) at about 1300°C before the L Æ g + Laves reac-tion takes place. In contrast, the lower C–Nb ratio of the 20Cb-3–INCO 112composite weld caused the interdendritic liquid to become more highlyenriched in Nb as shown in Figure 11.12b. The solidification path barely inter-sects the g /NbC twofold saturation line (fL = 0.01) before it reaches the g /Lavestwofold saturation line ( fL = 0.008). The L Æ g + NbC reaction takes onlybriefly, and the L Æ g + Laves reaction takes over until solidification is com-plete ( fL = 0) at about 1223°C, which is significantly lower than 1300°C.
11.2.2 Amount and Distribution of Liquid during Terminal Solidification
A. Amount of Liquid Figures 11.13a–d show the effect of composition onthe solidification cracking sensitivity of several aluminum alloys (36–41).Figure 11.13e shows the crack sensitivity in pulsed laser welding of Al–Cu
METALLURGICAL FACTORS 271
(b)
NbC
fL=0.005
302520151050
0.25
0.20
0.15
0.10
0.05
0Liqu
id c
ompo
sitio
n, w
t% C
Liquid composition, wt% Nb
20Cb-3
fL=0
LavesfL=1
NbC
fL=0.01
302520151050
0.25
0.20
0.15
0.10
0.05
0
20Cb-3/INCO 112
fL=0 Laves
fL=1
fL=0.008
(a)
γγ
Figure 11.12 Solidification paths (solid lines) of Nb-stabilized austenitic stainlesssteels: (a) 20Cb-3; (b) 20Cb-3–INCO 112 composite. Reprinted from DuPont (35).Courtesy of American Welding Society.

alloys (41). Figure 11.14a shows an aluminum weld with little Cu (alloy 1100gas–metal arc welded with filler 1100), and there is no evidence of cracking.Figure 11.14b shows a crack in an aluminum weld with about 4% Cu (alloy2219 gas–metal arc welded with filler 1100). Figure 11.14c shows a crack healedby the eutectic liquid in an aluminum weld with about 8% Cu (alloy 2219gas–metal arc welded with filler 2319 plus extra Cu).
272 WELD METAL SOLIDIFICATION CRACKING
00
1 2 3 4 5 6 7 8
0
0
0
Composition of weld, % alloying element
(a) Al-Si (Singeret al. 1947)
(b) Al-Cu(Pumphrey et
al. 1948
(c) Al-Mg(Dowd, 1952)
(d) Al-Mg2Si(Jennings et al. 1948)
Rel
ativ
e cr
ack
sens
itivi
ty
0 1 2 3 4 5 6 7 8Copper content (wt%)
0
10
20
30
Tota
l cra
ck le
ngth
(m
m)
(e) Al-Cu(Michaud et al. 1995)
)
Figure 11.13 Effect of composition on crack sensitivity of some aluminum alloys.(a–d) From Dudas and Collins (40). (e) Reprinted from Michaud et al. (41).
Figure 11.14 Aluminum welds with three different levels of Cu: (a) almost no Cu; (b)4% Cu; (c) 8% Cu.

As shown in Figure 11.13, the maximum crack sensitivity occurs somewherebetween pure aluminum and highly alloyed aluminum (say no less than 6wt% solute). The presence of a maximum in the crack susceptibility compositioncurve (Figure 11.13) is explained qualitatively with the help of Figure 11.15.Pure aluminum is not susceptible to solidification cracking because there is nolow-melting-point eutectic present at the grain boundary to cause solidifica-tion cracking. In highly alloyed aluminum, on the other hand, the eutecticliquid between grains can be abundant enough to “heal” incipient cracks (3).Somewhere in between these two composition levels, however, the amount ofliquid between grains can be just large enough to form a thin, continuous grainboundary film to make the materials rather susceptible to solidification crack-ing but without extra liquid for healing cracks.A fine equiaxed dendritic struc-ture with abundant liquid between grains (Figure 11.15f) can deform moreeasily under stresses than a coarse columnar dendritic structure (Figure11.15e) and thus has a lower susceptibility to cracking.
B. Calculation of Fraction Liquid Dupont et al. (31–35) calculated thefraction of the liquid ( fL) as a function of distance (x) within the mushy zonein Nb-bearing superalloys and austenitic stainless steels. The fL–x curve pro-vides the quantitative information for the amount and distribution of inter-dendritic liquid in the mushy zone. The two stainless steel welds discussedpreviously will be considered here, namely, the weld in alloy 20Cb-3 and the
METALLURGICAL FACTORS 273
I. pure metal: no grainboundary (GB) liquid; notsusceptible to cracking
GB
(b)
(e)
(d)L L
S
(f)
II: some solute: just enoughliquid to form a continuousGB film; most susceptible
Pool (L) Weld (S)
(a)
S
III. more solute: more GBliquid to heal cracks; lesssusceptible to cracking
IV. much more solute: muchGB liquid to heal cracks andless rigid dendritic structure;least susceptible to cracking
L L
I
II
III
IV
crac
ksu
scep
tibili
ty
solute content
(c)
Figure 11.15 Effect of composition on crack susceptibility: (a) weld; (b) crack sus-ceptibility curve; (c) pure metal; (d) low solute; (e) more solute; ( f) much more solute.

weld in the 20Cb-3–INCO 112 composite weld. According to DuPont et al.(35), Nb, Si, and C are treated as solutes in these alloys and, as an approxi-mation, the remaining elements in the solid solution with g are treated as the“g-solvent.”
Assume that the slopes of the liquidus surface with respect to Nb, Si, andC, that is, mL,Nb, mL,Si, and mL,C, respectively, are constant. Equation (6.2) canbe extended to find the temperature of a liquid on the liquidus surface T asfollows:
T = Tm + mL,NbCL,Nb + mL,SiCL,Si + mL,CCL,C (11.1)
Assuming negligible solid diffusion but complete liquid diffusion for Nband Si, the following equations can be written based on the Scheil equation[Equation (6.9)]:
(11.2)
(11.3)
Since diffusion in solid and liquid is fast for a small interstitial solute such asC, the following equation can be written based on the equilibrium lever rule[Equation (6.6)]:
(11.4)
Note that the equilibrium partition ratios kNb, kSi, ans kC have been assumedconstant in Equations (11.2)–(11.4) for simplicity. Inserting these equationsinto Equation (11.1) yields the following relationship between temperatureand fraction liquid:
(11.5)
The cooling rate (e or GR) can be determined from the secondary dendritespacing (d). According to Equation (6.20),
(11.6)
For instance, from the dendrite arm spacing of the weld metal the cooling rateGR is about 250°C/s. The growth rate at the weld centerline R is the weldingspeed 3mm/s. As such, the temperature gradient G is about 83°C/mm.
Assuming that G is constant in the mushy zone and taking x = 0 at the liquidus temperature of the alloy TL,
d at b b GRfn n n= = ( ) = ( )- -e
T T m C f m C f mC
f k fk k= + + +
+ -( )ÊË
ˆ¯
-( ) -( )m L,Nb 0,Nb L L,Si 0,Si L L,C
C
L C L
Nb Si1 1 0
1,
CC
f k fL,C0,C
L C L=
+ -( )1
C C f kL,Si 0,Si L
Si= -( )1
C C f kL,Nb 0,Nb L
Nb= -( )1
274 WELD METAL SOLIDIFICATION CRACKING

(11.7)
which can be used to find the temperature T at any distance x.Equations (11.5) and (11.7) can be combined to determine how the liquid
fraction fL varies with distance x within the mushy zone, and the results areshown in Figure 11.16. The liquid fraction drops rapidly with distance near thepool boundary but slowly further into the mushy zone. Also, the mushy zoneis significantly wider in the 20Cb-3–INCO 112 composite weld than in the20Cb-3 weld due to the significantly larger solidification temperature range ofthe former. This explains why the former is more susceptible to solidificationcracking.
C. Liquid Distribution As shown previously in Figure 11.11 for Nb-bearingsuperalloys, the alloys with a narrower solidification temperature range areless susceptible to solidification cracking. In fact, some of these alloys have awide solidification temperature range just like the more susceptible alloys. Asin the more crack-susceptible alloys, the L Æ g + Laves reaction follows the LÆ g + NbC reaction during the terminal stage of solidification. However, asshown in Figure 11.17 for one of these less susceptible alloys, the amount ofterminal liquid undergoing the L Æ g + Laves reaction in these alloys is smalland remains isolated. This type of morphology, unlike the continuous grainboundary liquid undergoing the L Æ g + Laves reaction in the more crack-susceptible alloys, should be more resistant to crack propagation throughoutthe mushy zone. Since an isolated L Æ g + Laves reaction does not really contribute to solidification cracking, it should not have to be included in thesolidification temperature range, and the lower bound of the effective solidi-fication temperature range should more accurately be represented by the LÆ g + NbC reaction (31, 34).
xT T
G=
-L
METALLURGICAL FACTORS 275
1.000
Fra
ctio
n liq
uid
Distance along centerline, mm
20Cb-3/INCO 112
(a)
20Cb-3
1.0
0.8
0.6
0.4
0.2
2.0 3.0 4.0 1.000
20Cb-3/INCO 112
(b)
20Cb-3
0.10
0.08
0.06
0.04
0.02
2.0 3.0 4.0
L
L γ
γ
Figure 11.16 Fraction liquid as a function of distance within the mushy zone of 20Cb-3 and 20Cb-3–INCO 112 composite (a) and enlarged (b). Reprinted fromDuPont (35). Courtesy of American Welding Society.

11.2.3 Ductility of Solidifying Weld Metal
The less ductile a solidifying weld metal is, the more likely it will crack duringsolidification. Nakata and Matsuda (16) used the transverse Varestraint test(Figure 11.6b) to determine the so-called ductility curve, as illustrated in Figure11.18. At any given strain the ductility curve ranges from the liquidus tem-perature TL to the temperature at the tip of the longest crack. To construct thecurve, a strain of e1 is applied during welding, and the maximum crack lengthis examined after welding (Figure 11.18a). From the temperature distribution
276 WELD METAL SOLIDIFICATION CRACKING
Figure 11.17 Scanning electron micrographs showing morphology of g-NbC and g-Laves constituents in solidification cracks of a Nb-bearing superalloy. Reprinted fromDuPont et al. (34).
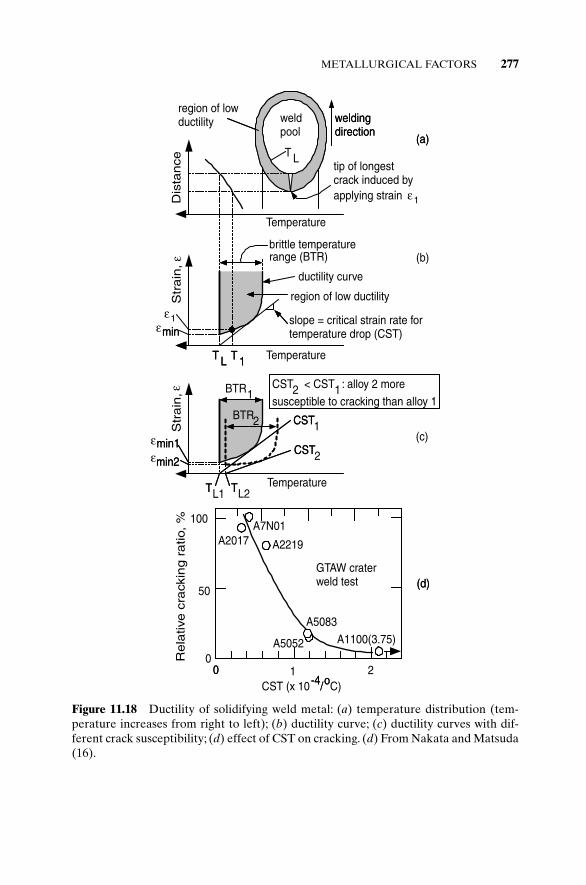
METALLURGICAL FACTORS 277
T 1
Str
ain
,
min
T L
brittle temperaturerange (BTR)
slope = critical strain rate fortemperature drop (CST)
Dis
tance
Temperature
tip of longestcrack induced byapplying strain
weldpool
T L
(a)
(b)
weldingdirection
100
50
01 2
Rela
tive c
rack
ing r
ati o
, %
CST (x 10-4/oC)0
A7N01A2017 A2219
A5052 A1100(3.75)
A5083
GTAW craterweld test (d)
region of low ductility
region of lowductility
TL2
Str
ain
,
min1
TL1
(c)
BTR1
BTR CST
CST min2
CST < CST : alloy 2 more
susceptible to cracking than alloy 1
Temperature
ductility curve
T 1
min
T L
(a)
weldingdirection
-4/o0
(d)
T
min1
T
2 CST1
CST2 min2
2 1
Temperature
1ε
1εε
εε
εε
Figure 11.18 Ductility of solidifying weld metal: (a) temperature distribution (tem-perature increases from right to left); (b) ductility curve; (c) ductility curves with dif-ferent crack susceptibility; (d) effect of CST on cracking. (d) From Nakata and Matsuda(16).

along the weld centerline measured with a thermocouple during welding, thetemperature T1 at the tip of the longest crack and hence the point (T1, e1) canbe determined (Figure 11.18b). By repeating the experiment for variousapplied strains and finding the corresponding crack tip temperatures, the duc-tility curve can be determined. The maximum crack length and hence the tem-perature range of the ductility curve first increase with increasing appliedstrain but then level off as the applied strain increases further.The widest tem-perature range covered by the ductility curve is called the brittle temperaturerange (BTR).The weld metal is “brittle” in the sense that it is much less ductilein this temperature range than either the weld pool or the completely solidi-fied weld metal. The minimum strain required to cause cracking is called emin.The slope of the tangent to the ductility curve is called the critical strain ratefor temperature drop (CST), that is, the critical rate at which the strain varieswith temperature drop.
In general, the lower emin, the greater BTR or the smaller CST is, the greaterthe susceptibility to solidification cracking (Figure 11.18c). According toNakata and Matsuda (16), CST best correlates with the cracking susceptibil-ity of the weld metal (Figure 11.18d). It should be pointed out, however, thatthe values of CST in Figure 11.18d were not determined exactly as describedabove. Because the emin values were too small to be determined, a slow-bendingtransverse Varestraint test had to be used to modify the ductility curve.
For a given material cracking can be avoided if the strain rate for temper-ature drop can be kept below the critical value, that is, if -de/dT < CTS. Math-ematically, -de/dT = (∂e/∂t)/(-∂T/∂t), where t is time. The strain rate (∂e/∂t)consists of both the self-induced tensile strain in the solidifying weld metalwhose contraction is hindered by the adjacent base metal and the augmentedstrain if it is applied. -∂T/∂t is the cooling rate, for instance, 150°C/s. In Varestraint testing an augmented strain is applied essentially instantaneously,and the high ∂e/∂t and hence -de/dT easily cause cracking. If the augmentedstrain were applied very slowly on a solidifying weld metal whose self-inducedstrain rate during solidification is low, ∂e/∂t can be small enough to keep -de/dT below the CST, and the weld metal can solidify without cracking. Crack-ing can also be avoided if the cooling rate -∂T/∂t is increased dramatically toreduce -de/dT to below the CST. Yang et al. (42) avoided solidification crack-ing in GTAW of 2024 aluminum sheets by directing liquid nitrogen behind theweld pool to increase the cooling rate. They also showed, with finite-elementmodeling of heat flow and thermal stresses, that the condition -de/dT < CTScan be achieved by cooling the area right behind the weld pool.
Before leaving the subject of the ductility curve, the relationship betweenthe BTR and the solidification temperature range needs to be discussed.Nakata and Matsuda (16) observed in aluminum alloys such as alloys 2017,2024, and 2219 that the cooling curve showed a clear solidification tempera-ture range. A distinct point of arrest (a short flat region) in the curve corre-sponding to the formation of eutectics was observed as well as a discontinuityat the liquidus temperature corresponding to the formation of the aluminum-
278 WELD METAL SOLIDIFICATION CRACKING

rich solid. For these alloys the BTR was found to be the same as the solidifi-cation temperature range, that is, TL to TE. In other words, the region of lowductility behind the weld pool corresponds to the mushy zone discussed in pre-vious chapters. On the other hand, for aluminum alloys such as alloys 5052,5083, and 6061, the cooling curve did not show a distinct point of arrest, andthe inflection point in the curve had to be taken as the “nominal” solidus tem-perature TS. For these alloys the BTR was found significantly (about 20%)larger than the nominal solidification temperature range of TL to TS and wasthus a more realistic representation of the nonequilibrium solidification tem-perature range of TL to TE. Presumably, eutectics still formed below TS but notin quantities enough to show a distinct point of arrest in the cooling curve. Itis not clear if differential thermal analysis was tried, which is known to detecteutectic temperatures well.
In the case of steels and stainless steels, the solidification temperature rangeis relatively narrow, and impurities such as P and S are found to enlarge theBTR, presumably by forming eutectics with a low melting point (16).
11.2.4 Primary Solidification Phase
For austenitic stainless steels the susceptibility to solidification cracking ismuch lower when the primary solidification phase is d-ferrite rather thanaustenite (43–45). As the ratio of the Cr equivalent to the Ni equivalentincreases, the primary solidification phase changes from austenite to d-ferrite,and cracking is reduced. As shown by Takalo et al. (44) in Figure 11.19a forarc welding, this change occurs at Creq/Nieq = 1.5. Similarly, as shown by Lienert(45) in Figure 11.19b for pulsed laser welding, this change occurs in theCreq/Nieq range of 1.6–1.7. In both cases Creq = Cr + 1.37Mo + 1.5Si + 2Nb +3Ti and Nieq = Ni + 0.3Mn + 22C + 14.2N + Cu. As discussed previously(Chapter 9), under high cooling rates in laser or electron beam welding, a weldmetal that normally solidifies as primary ferrite can solidify as primary austen-ite because of undercooling, and this is consistent with the change occurringat a higher Creq–Nieq ratio in pulsed laser welding.
In general, austenitic stainless steels containing 5–10% d-ferrite are signifi-cantly more resistant to solidification cracking than fully austenitic stainlesssteels (46).As mentioned previously in Chapter 9, ferrite contents significantlygreater than 10% are usually not recommended, for the corrosion resistancewill be too low (47–50). Furthermore, upon exposure to elevated temperatures(600–850°C), d-ferrite can transform to brittle s-ferrite and impair the me-chanical properties of austenitic stainless steels, unless the ferrite content is kept low (51).
It is generally believed that, since harmful impurities such as sulfur andphosphorus are more soluble in d-ferrite than in austenite (see Table 11.1), theconcentration of these impurities at the austenite grain boundaries, and thustheir damaging effect on solidification cracking, can be reduced if d-ferrite ispresent in significant amounts (43, 52, 53). In addition, it is also believed that
METALLURGICAL FACTORS 279

280 WELD METAL SOLIDIFICATION CRACKING
no crackingcracking
Creq/Nieq
Tota
l S+
P+
B (
wt %
)
1.2 1.3 1.4 1.5 1.6 1.7 1.8 1.9 2.00.00
0.01
0.02
0.03
0.04
0.05
0.06
0.07
0.08
pulsedNd:YAGlaser welds
(b)
1.6 1.8 2.01.41.21.0
0.04
0.08
0.12
0.16
0.20
0
Creq/Nieq
susceptiblesomewhat susceptiblenot susceptible
crackingno cracking
Tota
l S+
P (
wt %
)
(a)
primaryaustenite m
ixed primary
ferrite
primary austenite primary ferrite
Figure 11.19 Solidification crack susceptibility of austenitic stainless steels:(a) arc welds; (b) laser welds. (a) From Takalo et al. (44). (b) Reprinted from Lienert (45).
TABLE 11.1 Solubility of Sulfur and Phosphorus inFerrite and Austenite (wt%)
In d-Ferrite In Austenite
Sulfure 0.18 0.05Phosphorus 2.8 0.25
Source: Borland and Younger (52).
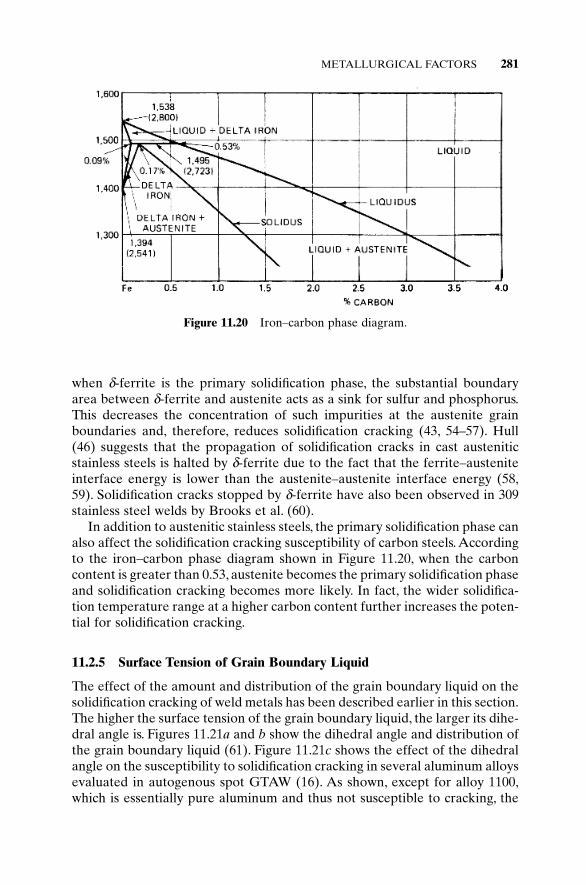
when d-ferrite is the primary solidification phase, the substantial boundaryarea between d-ferrite and austenite acts as a sink for sulfur and phosphorus.This decreases the concentration of such impurities at the austenite grainboundaries and, therefore, reduces solidification cracking (43, 54–57). Hull(46) suggests that the propagation of solidification cracks in cast austeniticstainless steels is halted by d-ferrite due to the fact that the ferrite–austeniteinterface energy is lower than the austenite–austenite interface energy (58,59). Solidification cracks stopped by d-ferrite have also been observed in 309stainless steel welds by Brooks et al. (60).
In addition to austenitic stainless steels, the primary solidification phase canalso affect the solidification cracking susceptibility of carbon steels. Accordingto the iron–carbon phase diagram shown in Figure 11.20, when the carboncontent is greater than 0.53, austenite becomes the primary solidification phaseand solidification cracking becomes more likely. In fact, the wider solidifica-tion temperature range at a higher carbon content further increases the poten-tial for solidification cracking.
11.2.5 Surface Tension of Grain Boundary Liquid
The effect of the amount and distribution of the grain boundary liquid on thesolidification cracking of weld metals has been described earlier in this section.The higher the surface tension of the grain boundary liquid, the larger its dihe-dral angle is. Figures 11.21a and b show the dihedral angle and distribution ofthe grain boundary liquid (61). Figure 11.21c shows the effect of the dihedralangle on the susceptibility to solidification cracking in several aluminum alloysevaluated in autogenous spot GTAW (16). As shown, except for alloy 1100,which is essentially pure aluminum and thus not susceptible to cracking, the
METALLURGICAL FACTORS 281
Figure 11.20 Iron–carbon phase diagram.

susceptibility decreases with increasing dihedral angle of the grain boundaryliquid.
The effect of the surface tension of the grain boundary liquid on solidifica-tion cracking is further depicted in Figure 11.22. If the surface tension betweenthe solid grains and the grain boundary liquid is very low, a liquid film will
282 WELD METAL SOLIDIFICATION CRACKING
100
50
020 40 60 80R
elat
ive
crac
king
rat
io, %
Dihedral angle , degree0
A7N01A2017
A2219
A5052 A5083A1100
GTAW craterweld test
= 120 o
(a)
(b)
= 60 o = 0o
GB liquid
(c)
grainboundary(GB)GB
liquid
θ θ θ
θ
θ
Figure 11.21 Grain boundary liquid: (a) dihedral angle; (b) distribution of liquid atgrain boundary; (c) effect of dihedral angle on solidification cracking. (c) From Nakataand Matsuda (16).
(b)GB
GBL S
grain boundaryliquid
(c)GB
GBL S
grain boundaryliquid
continuous grainboundary liquid;highly susceptible
isolated grainboundary liquid;less susceptible
Pool (L) Weld (S) (a)
Figure 11.22 Effect of grain boundary liquid morphology on crack susceptibility: (a)weld; (b) continuous; (c) isolated.

form between the grains and the solidification cracking susceptibility is high.On the other hand, if the surface tension is high, the liquid phase will be glob-ular and will not wet the grain boundaries. Such discontinuous liquid globulesdo not significantly reduce the strength of the solid network and, therefore,are not as harmful. For example, FeS forms films at the grain boundaries ofsteels while MnS forms globules. Due to its globular morphology and highermelting point, MnS has been known to be far less harmful than FeS.
11.2.6 Grain Structure of Weld Metal
Fine equiaxed grains are often less susceptible to solidification cracking thancoarse columnar grains (16, 62–64), as shown in Figure 11.23a (16) for several
METALLURGICAL FACTORS 283
Figure 11.23 Effect of grain structure on solidification cracking: (a) aluminum alloys;(b) centerline cracking in a coarse-grain 310 stainless steel weld. (a) From Nakata andMatsuda (16). (b) From Kou and Le (65).
(a)
(b)

aluminum alloys. Alloy A1070 is not susceptible to solidification crackingbecause it is essentially pure aluminum. Fine equiaxed grains can deform toaccommodate contraction strains more easily, that is, it is more ductile, thancolumnar grains. Liquid feeding and healing of incipient cracks can also bemore effective in fine-grained material. In addition, the grain boundary areais much greater in fine-grained material and, therefore, harmful low-melting-point segregates are less concentrated at the grain boundary.
It is interesting to note that, due to the steep angle of abutment betweencolumnar grains growing from opposite sides of the weld pool, welds madewith a teardrop-shaped weld pool tend to be more susceptible to centerlinesolidification cracking than welds made with an elliptical-shaped weld pool. Asteep angle seems to favor the head-on impingement of columnar grainsgrowing from opposite sides of the weld pool and the formation of the con-tinuous liquid film of low-melting-point segregates at the weld centerline. Asa result, centerline solidification cracking occurs under the influence of trans-verse contraction stresses. Centerline cracking is often observed in welding.Figure 11.23b is an example in an autogenous gas–tungsten arc weld of a 310stainless steel made with a teardrop-shaped weld pool (65).
11.3 MECHANICAL FACTORS
11.3.1 Contraction Stresses
So far, the metallurgical factors of weld solidification cracking have beendescribed. But without the presence of stresses acting on adjacent grainsduring solidification, no cracking can occur. Such stresses, as already men-tioned, can be due to thermal contraction or solidification shrinkage or both.Austenitic stainless steels have relatively high thermal expansion coefficients(as compared with mild steels) and, therefore, are often prone to solidificationcracking.
Aluminum alloys have both high thermal expansion coefficients and highsolidification shrinkage (5). As a result, solidification cracking can be ratherserious in some aluminum alloys, especially those with wide solidification tem-perature ranges.
11.3.2 Degree of Restraint
The degree of restraint of the workpiece is another mechanical factor of solidification cracking. For the same joint design and material, the greater the restraint of the workpiece, the more likely solidification cracking willoccur.
Figure 11.24 illustrates the effect of workpiece restraint on solidifica-tion cracking (66). As shown, solidification cracking occurred in the second(left-hand-side) weld of the inverse “T” joint due to the fact that the degree
284 WELD METAL SOLIDIFICATION CRACKING
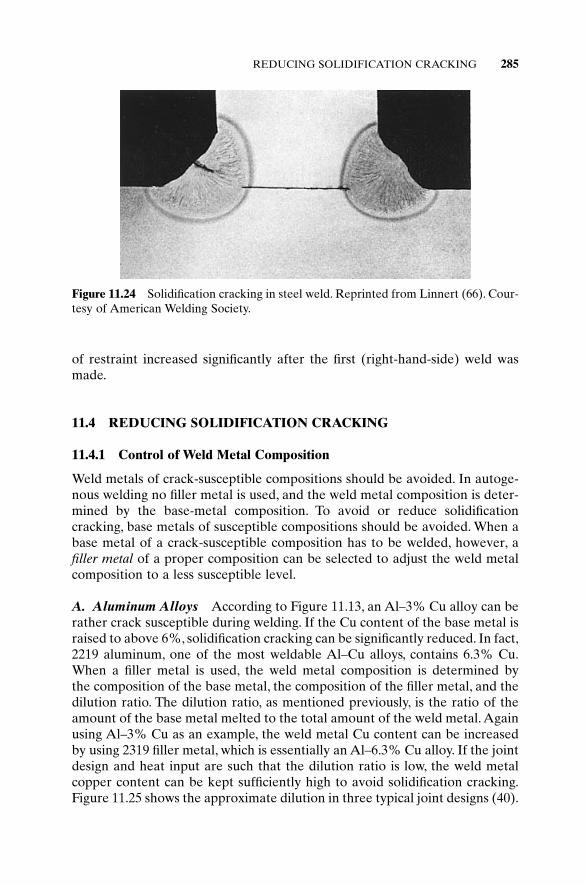
of restraint increased significantly after the first (right-hand-side) weld wasmade.
11.4 REDUCING SOLIDIFICATION CRACKING
11.4.1 Control of Weld Metal Composition
Weld metals of crack-susceptible compositions should be avoided. In autoge-nous welding no filler metal is used, and the weld metal composition is deter-mined by the base-metal composition. To avoid or reduce solidificationcracking, base metals of susceptible compositions should be avoided. When abase metal of a crack-susceptible composition has to be welded, however, afiller metal of a proper composition can be selected to adjust the weld metalcomposition to a less susceptible level.
A. Aluminum Alloys According to Figure 11.13, an Al–3% Cu alloy can berather crack susceptible during welding. If the Cu content of the base metal israised to above 6%, solidification cracking can be significantly reduced. In fact,2219 aluminum, one of the most weldable Al–Cu alloys, contains 6.3% Cu.When a filler metal is used, the weld metal composition is determined by the composition of the base metal, the composition of the filler metal, and thedilution ratio. The dilution ratio, as mentioned previously, is the ratio of theamount of the base metal melted to the total amount of the weld metal. Againusing Al–3% Cu as an example, the weld metal Cu content can be increasedby using 2319 filler metal, which is essentially an Al–6.3% Cu alloy. If the jointdesign and heat input are such that the dilution ratio is low, the weld metalcopper content can be kept sufficiently high to avoid solidification cracking.Figure 11.25 shows the approximate dilution in three typical joint designs (40).
REDUCING SOLIDIFICATION CRACKING 285
Figure 11.24 Solidification cracking in steel weld. Reprinted from Linnert (66). Cour-tesy of American Welding Society.

Table 11.2 is a guide to choice of filler metals for minimizing solidificationcracking in welds of high-strength aluminum alloys (40). Experimental datasuch as those in Figure 11.26 from solidification cracking testing by ring castingcan also be useful (67, 68).
286 WELD METAL SOLIDIFICATION CRACKING
Figure 11.25 Approximate dilution of three weld joints by base metal in aluminumwelding. Reprinted from Dudas and Collins (40). Courtesy of American WeldingSociety.
TABLE 11.2 Guid to Choice of Filler Metals for Minimizing Solidification Cracking inWelds of High-Strength Aluminum Alloys
7000 7000 6000 5000 2000Base Metals (Al–Zn–Mg–Cu) (Al–Zn–Mg) (Al–Mg–Si) (Al–Mg) (Al–Cu)
2000 (Al–Cu) NRa NR NR NR 404341452319
5000 (Al–Mg) 5356 5356 5356 5356 —b
5556 5556 55565183 5183 5183
6000 (Al–Mg–Si) 5356 5356 4043 — —5556 46435183 5356
7000 (Al–Zn–Mg) 5356 5356 — — —5556
7000 (Al–Zn–Mg–Cu) 5356 — — — —5556
a NR, not recommend.b Charts that recommend filler choice for many applications are available from filler metal suppliers.
Source: Dudas and Collins (40).

REDUCING SOLIDIFICATION CRACKING 287
Figure 11.26 Solidification cracking susceptibility of aluminum alloys: (a) Al–Mg–Si;(b) Al–Cu–Si (c) Al–Mg–Cu. (a, b) Modified from Jennings et al. (67). (c) Modifiedfrom Pumphrey and Moore (68).

Minor alloying elements have also been found to affect the solidificationcracking susceptibility of aluminum alloys. For example, the Fe–Si ratio hasbeen found to significantly affect the solidification cracking susceptibility of3004 and other Al–Mg alloys (69, 70); therefore, proper control of the contentof minor alloying elements can be important in some materials.
B. Carbon and Low-Alloy Steels The weld metal manganese content cansignificantly affect solidification cracking. It is often kept high enough toensure the formation of MnS rather than FeS. This, as described previously, isbecause the high melting point and the globular morphology of MnS tend torender sulfur less detrimental. Figure 11.27 shows the effect of the Mn–S ratioon the solidification cracking tendency of carbon steels (71). At relatively lowcarbon levels the solidification cracking tendency can be reduced by increas-ing the Mn–S ratio. However, at higher carbon levels (i.e., 0.2–0.3% C),increasing the Mn–S ratio is no longer effective (72). In such cases loweringthe weld metal carbon content, if permissible, is more effective.
One way of lowering the weld metal carbon content is to use low-carbonelectrodes. In fact, in welding high-carbon steels one is often required to makethe first bead (i.e., the root bead) with a low-carbon electrode. This is because,as shown in Figure 11.28, the first bead tends to have a higher dilution ratioand a higher carbon content than subsequent beads (73). A high carboncontent is undesirable because it promotes not only the solidification crack-ing of the weld metal but also the formation of brittle martensite and, hence,the postsolidification cracking of the weld metal. Therefore, in welding steelsof very high carbon contents (e.g., greater than 1.0% C), extra steps should betaken to avoid introducing excessive amounts of carbon from the base metalinto the weld metal. As shown in Figure 11.29, one way to achieve this is to
288 WELD METAL SOLIDIFICATION CRACKING
Carbon content, %0
00.10 0.12 0.14 0.16
10
20
50
40
30
Rat
io o
f man
gane
se to
sul
fur
Intermediate Zone
No Cracking
Cracking
Figure 11.27 Effect of Mn–S ratio and carbon content on solidification cracking sus-ceptibility of carbon steel weld metal. Reprinted from Smith (71).

“butter” the groove faces of the base metal with austenitic stainless steel (suchas 25–20 stainless) electrodes before welding (73). In welding cast irons, purenickel electrodes have also been used for buttering. In any case, the surfacelayers remain in the ductile austenitic state, and the weld can then be com-pleted either with stainless electrodes or with other cheaper electrodes.
C. Nb-Bearing Stainless Steels and Superalloys The C–Nb ratio of the weldmetal can affect the susceptibility to solidification cracking significantly (17,31–35). A high C–Nb ratio can reduce solidification cracking by avoiding thelow-temperature L Æ g + Laves reaction, which can widen the solidificationtemperature range.
D. Austenitic Stainless Steels As mentioned previously, it is desirable tomaintain the weld ferrite content at a level of 5–10% in order to obtain soundwelds. The quantitative relationship between the weld ferrite content and theweld metal composition in austenitic stainless steels has been determined bySchaeffler (74), DeLong (75), Kotecki (76, 77), Balmforth and Lippold (78),and Vitek et al. (79, 80). These constitution diagrams have been shown previ-ously in Chapter 9. Alloying elements are grouped into ferrite formers (Cr,Mo, Si, and Cb) and austenite formers (Ni, C, and Mn) in order to determinethe corresponding chromium and nickel equivalents for a given alloy.
Example: Consider the welding of a 1010 steel to a 304 stainless steel. Forconvenience, let us assume the dilution ratio is 30%, half from 304 stainlesssteel and half from 1010 steel, as shown in Figure 11.30. Estimate the ferritecontent and the solidification cracking susceptibility of a weld made with atype 310 electrode that contains 0.12% carbon and a weld made with a type309 ELC (extra low carbon) electrode that contains 0.03% carbon.
For the weld made with the 310 stainless steel electrode, the weld metalcomposition can be calculated as follows:
REDUCING SOLIDIFICATION CRACKING 289
Figure 11.28 Schematic sketch of multipass welding. Note that the root pass has thehighest dilution ratio. From Jefferson and Woods (73).
Figure 11.29 Buttering the groove faces of very high carbon steel with a 310 stainlesswire steel before welding. From Jefferson and Woods (73).

Element Electrode ¥70% Type 304 ¥15% 1010 Steel ¥15% Weld Metal
Cr 26.0 18.2 18.0 2.7 0 0 20.9Ni 21.0 14.7 8.0 1.2 0 0 15.9C 0.12 0.084 0.05 0.0075 0.10 0.015 0.1065Mn 1.75 1.23 2.0 0.30 0.4 0.06 1.59Si 0.4 0.28 — — 0.2 0.03 0.31
According to the WRC-1992 diagram shown in Figure 9.11, the chromium andnickel equivalents of the weld metal are as follows:
Chromium equivalent = 20.9Nickel equivalent = 15.9 + 35 ¥ 0.1065 = 19.6
Based on the diagram, the weld metal is fully austenitic and, therefore, is sus-ceptible to solidification cracking. If the 309 ELC electrode is used, the weldmetal composition can be calculated as follows:
Element Electrode ¥70% Type 304 ¥15% 1010 Steel ¥15% Weld Metal
Cr 24 16.8 18.0 2.7 0 0 19.5Ni 13 9.1 8.0 1.2 0 0 10.3C 0.03 0.021 0.05 0.0075 0.10 0.015 0.0435Mn 1.98 1.39 2.0 0.30 0.4 0.06 1.75Si 0.4 0.28 0 0 0.2 0.03 0.31
Therefore, the chromium and nickel equivalents of the weld metal are
Chromium equivalent = 19.5Nickel equivalent = 10.3 + 35 ¥ 0.0435 = 11.8
According to the WRC-1992 diagram, the weld metal now is austenitic with aferrite number of about 8 and, therefore, should be much more resistant tosolidification cracking.
290 WELD METAL SOLIDIFICATION CRACKING
Figure 11.30 Welding 304 stainless steel to 1010 carbon steel.

It should be emphasized that neither the constitution diagrams nor the magnetic measurements of the weld metal ferrite content (such as those determined by Magne–Gage readings) reveal anything about the weld metalsolidification. In fact, the primary solidification phase and the quantity of d-ferrite at high temperatures (i.e., during solidification) are more importantthan the amount of ferrite retained in the room temperature microstructurein determining the sensitivity to solidification cracking (81). Also, the amountof harmful impurities such as sulfur and phosphorus should be considered in determining the weldability of a material; a material with a higher ferritecontent can be more susceptible to solidification cracking than another mate-rial with a lower ferrite content if the impurity level of the former is alsohigher. The cooling rate during solidification is another factor that the consti-tution diagrams fail to recognize (Chapter 9).
11.4.2 Control of Solidification Structure
A. Grain Refining As mentioned previously, welds with coarse columnargrains are often more susceptible to solidification cracking than those with fineequiaxed grains. It is, therefore, desirable to grain refine the weld metal. Infact, both 2219 aluminum and 2319 filler metal are designed in such a way thatthey not only have a non-crack-sensitive copper content but also have smallamounts of grain refining agents such as Ti and Zr to minimize solidificationcracking. Dudas and Collins (40) produced grain refining and eliminated solid-ification cracking in a weld made with an Al–Zn–Mg filler metal by addingsmall amounts of Zr to the filler metal. Garland (82) has grain refined weldsof aluminum–magnesium alloys by vibrating the arc during welding, therebyreducing solidification cracking.
B. Magnetic Arc Oscillation Magnetic arc oscillation has been reported to reduce solidification cracking in aluminum alloys, HY-80 steel, and iridiumalloys (83–88). Kou and Le (86–88) studied the effect of magnetic arc oscilla-tion on the grain structure and solidification cracking of aluminum alloy welds.As already shown in Figure 7.30, transverse arc oscillation at low frequenciescan produce alternating columnar grains. Figure 11.31 demonstrates that thistype of grain structure can be effective in reducing solidification cracking (86).As illustrated in Figure 11.32, columnar grains that reverse their orientationat regular intervals force the crack to change its direction periodically, thusmaking crack propagation difficult (87). Figure 11.33 shows the effect of theoscillation frequency on the crack susceptibility of 2014 aluminum welds (86).As shown, a minimum crack susceptibility exists at a rather low frequency,where alternating grain orientation is most pronounced. This frequency canvary with the welding speed.
As shown in Figure 11.34, arc oscillation at much higher frequencies than1Hz, though ineffective in 2014 aluminum, is effective in 5052 aluminum (87).
REDUCING SOLIDIFICATION CRACKING 291

As shown in Figure 11.35, this is because grain refining occurs in alloy 5052welds at high oscillation frequencies (88). Heterogeneous nucleation isbelieved to be mainly responsible for the grain refining, since a 0.043wt% Tiwas found in the 5052 aluminum used.
292 WELD METAL SOLIDIFICATION CRACKING
Figure 11.31 Effect of transverse arc oscillation (1Hz) on solidification cracking ingas–tungsten arc welds of 2014 aluminum. Reprinted from Kou and Le (86).
Figure 11.32 Schematic sketches showing effect of arc oscillation on solidificationcracking. From Kou and Le (87).

REDUCING SOLIDIFICATION CRACKING 293
2014 aluminumtransverse oscillation
Frequency, Hz
Cra
ck le
ngth
, mm
0 5 10 35
150
100
50
0
Figure 11.33 Effect of oscillation frequency on solidification cracking in gas–tungstenarc welds of 2014 aluminum. From Kou and Le (86).
5052 aluminumtransverse oscillation
Frequency, Hz
Cra
ck le
ngth
, mm
0 10 20
150
100
50
0
amplitude 1.1 mm
1.9 mm
Figure 11.34 Effect of arc oscillation frequency on the solidification cracking ingas–tungsten arc welds of 5052 aluminum. From Kou and Le (87).
Figure 11.35 Grain structure of gas–tungsten arc welds of 5052 aluminum: (a) no arcoscillation; (b) 20Hz transverse arc oscillation. Reprinted from Kou and Le (87).

11.4.3 Use of Favorable Welding Conditions
A. Reducing Strains As mentioned previously in Chapter 1, the use of high-intensity heat sources (electron or laser beams) significantly reduces thedistortion of the workpiece and hence the thermally induced strains. Lessrestraint and proper preheating of the workpiece can also help reduce strains.
Dyatlov and Sidoruk (89) and Nikov (90) found that preheating the work-piece decreased the magnitude of strains induced by welding. Sekiguchi andMiyake (91) reduced solidification cracking in steel plates by preheating.Hernandez and North (92) positioned additional torches behind and along theside of the welding head and inhibited solidification cracking in aluminumalloy sheets. It was suggested that the local heating decreased the amount ofplastic straining resulting from the welding operation and produced a lessstressful situation behind the weld pool.
B. Improving Weld Geometry The weld bead shape can also affect solidifi-cation cracking (93). When a concave single-pass fillet weld cools and shrinks,the outer surface is stressed in tension, as show in Figure 11.36a. The outersurface can be considered as being pulled toward the toes and the root.However, by making the outer surface convex, as shown in Figure 11.36b,pulling toward the root actually compresses the outer surface and offsets thetension caused by pulling toward the toes. Consequently, the tensile stressesalong the outer surface are reduced, and the tendency for solidification crack-ing to initiate from the outer surface is lowered. It should be pointed out,however, that excessive convexity can produce stress concentrations andinduce fatigue cracking (Section 5.3) or hydrogen cracking (Section 17.4) atthe toes. In multiple-pass welding, as illustrated in Figure 11.37, solidificationcracking can also initiate from the weld surface if the weld passes are too wideand concave (93).
The weld width-to-depth ratio can also affect solidification cracking. Asdepicted in Figure 11.38, deep narrow welds with a low width-to-depth ratiocan be susceptible to weld centerline cracking (93) This is because of the steepangle of the abutment between columnar grains growing from opposite sides
294 WELD METAL SOLIDIFICATION CRACKING
surface intension
Concave fillet weld Convex fillet weld
(a)
surface lessin tension
(b)
root toe
toe
Figure 11.36 Effect of weld bead shape on state of stress at center of outer surface:(a) concave fillet weld; (b) convex fillet weld. Modified from Blodgett (93).

of the weld pool. This type of cracking is often observed in deep and narrowwelds produced by EBW or SAW.
11.5 CASE STUDY: FAILURE OF A LARGE EXHAUST FAN
Figure 11.39a shows a schematic sketch of a large six-bladed exhaust fan fordrawing chemical mist from a chemical processing chamber (94). The hub ofthe fan had a diameter of about 178mm (7 in.) and a washer-shaped verticalfin. Two flat-bar spokes were welded to the fin at each 60° interval and pro-vided the support for the fan blades. The fan acted only as the drawing forceto pull the mist from the process area; it did not come into direct contact withthe mist. A “scrubber” was positioned between the fan and the process unit toremove the chemical from the exhausted air mass.The spokes and blades werefabricated from type 316 austenitic stainless steel bars and plates, and the elec-trodes used for welding were type E316 covered electrodes. The fan measuredabout 1.5m (5 ft) between blade tips, weighed about 320kg (700 lb), androtated at 1200rpm in service. It failed after 12 weeks service time.
Figure 11.39b shows the fractured fillet weld joining the underside of the blade to the supporting spoke. The weld metal was nonmagnetic, that is, containing little d-ferrite, and was therefore susceptible to solidification cracking. Note the jagged nature of the microfissures following the columnargrain structure above the arrowhead, as compared with the smooth cracktypical of fatigue failure below the arrowhead. In fact, the fracture surface of
CASE STUDY: FAILURE OF A LARGE EXHAUST FAN 295
Crack Crack NoCrack
too wide and concave(also poor slag
removal)
washed up toohigh andconcave
flat or slightly convexnot quite full width
(also good slag removal)
(a) (b) (c)
Figure 11.37 Effect of weld bead shape on solidification in multipass weld: (a)concave; (b) concave; (c) convex. Modified from Blodgett (93).
No Crack
(b)
Crack
(a)
Figure 11.38 Effect of weld depth–width ratio on centerline cracking: (a) ratio toohigh; (b) ratio correct. Modified from Blodgett (93).

the failed spoke member exhibited the “clam shell” markings typical of fatiguefailure.
In summary, the fully austenitic weld metal produced by type E316 elec-trodes suffered from solidification cracking, which in turn initiated fatiguecracking and led to final failure. Type 309 or 308 electrodes, which containmore d-ferrite to resist solidification cracking, could have been used to avoidsolidification cracking in the weld metal (94).
REFERENCES
1. Kou, S., and Kanevsky, Y., unpublished research, Carnegie-Mellon University,Pittsburgh, PA, 1980.
2. Davies, G. J., and Garland, J. G., Int. Metal Rev., 20: 83, 1975.3. Lees, D. C. G., J. Inst. Metals, 72: 343, 1946.4. Singer, A. R. E., and Jennings, P. H., J. Inst. Metals, 73: 273, 1947.5. Flemings, M. C., Solidification Processing, McGraw-Hill, New York, 1974.6. Bishop, H. F., Ackerlind, C. G., and Pellini, W. S., Trans. AFS, 65: 247, 1957.7. Borland, J. C., Br. Weld. J., 7: 508, 1960.8. Li, L., and Messler, Jr., R. W., Weld. J., 78: 387s, 1999.9. Matsuda, F., Nakagawa, H., and Sorada, K., Trans. JWS1, 11: 67, 1982.
10. Matsuda, F., Nakagawa, H., Kohomoto, H., Honda, Y., and Matsubara, Y., Trans.JWSI, 12: 73, 1983.
11. Houldcroft, P. T., Br. Weld. J., 2: 471, 1955.12. Liptax, J. A., and Baysinger, F. R., Weld. J., 47: 173s, 1968.
296 WELD METAL SOLIDIFICATION CRACKING
Figure 11.39 Failure of a large welded exhaust fan (94): (a) location of failure; (b)failed component.

13. Garland, J. G., and Davies, G. J., Metals Const. Br. Weld. J., vol. 1, p. 565, December1969.
14. Rogerson, J. H., Cotterell, B., and Borland, J. C., Weld. J., 42: 264s, 1963.15. Savage, W. F., and Lundin, C. D., Weld. J., 44: 433s, 1965.16. Nakata, K., and Matsuda, F., Trans. JWRI, 24: 83, 1995.17. Krysiak, K. F., Grubb, J. F., Pollard, B., and Campbell, R. D., in Welding, Brazing,
and Soldering, Vol. 6, ASM International, Materials Park, OH, December 1993,p. 443.
18. DuPont, J. N., Michael, J. R., and Newbury, B. D., Weld. J., 78: 408s, 1999.19. Stout, R. D., in Weldability of Steels, 3rd ed., Eds. R. D. Stout and W. D. Doty,
Welding Research Council, New York, 1978, p. 252.20. Messler, R. W., Jr., Principles of Welding, Processes, Physics, Chemistry and Metal-
lurgy, Wiley, New York, 1999, pp. 557–589.21. Cieslak, M. J., Weld. J., 66: 57s, 1987.22. David, S. A., and Woodhouse, J. J., Weld. J., 66: 129s, 1987.23. Nelson, T. W., Lippold, J. C., Lin, W., and Baeslack III, Weld. J., 76: 110s, 1997.24. Goodwin, G. M., Weld. J., 66: 33s, 1987.25. Hondros, E. D., and Seah, M. P., Int. Metals Rev., 222: 12, 1977.26. Pease, G. R., Weld. J., 36: 330s, 1957.27. Canonico, D. A., Savage, W. F., Werner, W. J., and Goodwin, G. M., paper presented
at Effects of Minor Elements on the Weldability of High-Nickel Alloys, WeldingResearch Council, NY, 1969, p. 68.
28. Savage, W. F., Nippes, E. F., and Goodwin, G. M., Weld. J., 56: 245s, 1977.29. Kah, D. H., and Dickinson, D. W., Weld. J., 60: 135s, 1981.30. Principles and Technology of the Fusion Welding of Metals,Vol. 1, Mechanical Engi-
neering Publishing Co., Peking, China, 1979 (in Chinese).31. DuPont, J. N., Robino, C. V., and Marder, A. R., Weld. J., 77: 417s, 1998.32. DuPont, J. N., Robino, C. V., Marder, A. R., Notis, M. R., and Michael, J. R., Metall.
Mater. Trans. A., 29A: 2785, 1998.33. DuPont, J. N., Robino, C. V., and Marder, A. R., Acta Mater., 46: 4781, 1998.34. DuPont, J. N., Robino, C. V., and Marder, A. R., Sci. Technol. Weld. Join., 4: 1, 1999.35. DuPont, J. N., Weld. J., 78: 253s, 1999.36. Singer, A. R. E., and Jennings, P. H., J. Inst. Metals, 73: 197, 1947.37. Pumphrey, W. I., and Lyons, J. V., J. Inst. Metals, 74: 439, 1948.38. Dowd, J. D., Weld. J., 31: 448s, 1952.39. Jennings, P. H., Singer, A. R. E., and Pumphrey, W. L., J. Inst. Metals, 74: 227, 1948.40. Dudas, J. H., and Collins, F. R., Weld. J., 45: 241s, 1966.41. Michaud, E. J., Kerr, H. W., and Weckman, D. C., in Trends in Welding Research,
Eds. H. B. Smartt, J. A. Johnson, and S. A. David, ASM International, MaterialsPark OH, June 1995, p. 154.
42. Yang, Y. P., Dong, P., Zhang, J., and Tian, X., Weld. J., 79: 9s, 2000.43. Gueussier, A., and Castro, R., Rev. Metall., 57: 117, 1960.44. Takalo, T., Suutala, N., and Moisio, T., Metall. Trans., 10A: 1173, 1979.
REFERENCES 297

45. Lienert, T. J., in Trends in Welding Research, Eds. J. M. Vitek, S. A. David, J. A.Johnson, H. B. Smartt, and T. DebRoy, ASM International, Materials Park, OH,June 1998, p. 726.
46. Hull, F. C., Weld. J., 46: 399s, 1967.47. Baeslack, W. A., Duquette, D. J., and Savage, W. F., Corrosion, 35: 45, 1979.48. Baeslack, W. A., Duquette, D. J., and Savage, W. F., Weld. J., 57: 175s, 1978.49. Baeslack, W. A., Duquette, D. J., and Savage, W. F., Weld. J., 58: 83s, 1979.50. Manning, P. G., Duquette, D. J., and Savage, W. F., Weld. J., 59: 260s, 1980.51. Thomas, R. G., Weld. J., 57: 81s, 1978.52. Borland, J. C., and Younger, R. N., Br. Weld. J., 7: 22, 1960.53. Thomas, R. D. Jr., Metals Prog., 70: 73, 1956.54. Medovar, B. I., Avtomatischeskaya Svarka, 6: 3, 1953.55. Curran, R. M., and Rankin, A. W., Weld. J., 34: 205, 1955.56. Borland, J. C., Br. Weld. J., 7: 558, 1960.57. Rollason, E. C., and Bystram, M. C. T., J. Iron Steel Inst., 169: 347, 1951.58. Smith, C. S., Interphase Imperfections in Nearly Perfect Crystals, Wiley, New York,
1952, pp. 377–401.59. Taylor, J. W., J. Inst. Metals, 86: 456, 1958.60. Brooks, J. A., Thompson, A. W., and Williams, J. C., in Physical Metallurgy of Metal
Joining, Eds. R. Kossowsky and M. E. Glickstein, Metallurgical Society of AIME,Warrendale, PA, 1980, p. 117.
61. Smith, C. R., Trans. AIME, 175: 15, 1948.62. Matsuda, F., Nakata, K., Tsukamoto, K., and Arai, K., Trans. JWRI, 12: 93, 1983.63. Matsuda, F., Nakata, K.,Tsukamoto, K., and Uchiyama,T., Trans. JWRI, 13: 57, 1984.64. Dvornak, M. J., Frost, R. H., and Olson, D. L., Weld. J., 68: 327s, 1989.65. Kou, S., and Le, Y., unpublished research, Carnegie-Mellon University, Pittsburgh,
PA, 1981.66. Linnert, G. E., Welding Metallurgy, Vol. 2, 3rd ed., American Welding Society, New
York, 1967.67. Jennings, P. H., Singer, A. R. E., and Pumphrey, W. I., J. Inst. Metals, 74: 227, 1948.68. Pumphrey, W. I., and Moore, D. C., J. Inst. Metals, 73: 425, 1948.69. Savage, W. F., Nippes, E. F., and Varsik, J. D., Weld. J., 58: 45s, 1979.70. Evancho, J. W., and Baker, C. L., Weld Crack Susceptibility of Al-Mg Alloys,
ALCOA Report, ALCOA Technology Center, ALCOA Center, PA, March 1980.71. Smith, R. B., in Welding, Brazing, and Soldering, Vol. 6, ASM International,
Materials Park, OH, December 1993, p. 642.72. Borland, J. C., Br. Weld. J., 8: 526, 1961.73. Jefferson, T. B., and Woods, G., Metals and How to Weld Them, James Lincoln Arc
Welding Foundation, Cleveland, OH, 1961.74. Schaeffler, A. L., Metal. Prog., 56: 680, 1949.75. DeLong, W. T., Weld. J., 53: 273s, 1974.76. Kotecki, D. J., Weld. J., 78: 180s, 1999.77. Kotecki, D. J., Weld. J., 79: 346s, 2000.
298 WELD METAL SOLIDIFICATION CRACKING

78. Balmforth, M. C., and Lippold, J. C., Weld. J., 79: 339s, 2000.79. Vitek, J. M., Iskander, Y. S., and Oblow, E. M., Weld. J., 79: 33s, 2000.80. Vitek, J. M., Iskander, Y. S., and Oblow, E. M., Weld. J., 79: 41s, 2000.81. Cieslak, M. J., and Savage, W. F., Weld. J., 60: 131s, 1981.82. Garland, J. G., Metal Const. Br. Weld. J., 21: 121, 1974.83. Tseng, C., and Savage, W. F., Weld. J., 50: 777, 1971.84. David, S. A., and Liu, C. T., in Grain Refinement in Castings and Welds, Eds. G. J.
Abbaschian and S.A. David, Metals Society of AIME,Warrendale, PA, 1983, p. 249.85. Scarbrough, J. D., and Burgan, C. E., Weld. J., 63: 54, 1984.86. Kou, S., and Le, Y., Metall. Trans., 16A: 1887, 1985.87. Kou, S., and Le, Y., Metall. Trans., 16A: 1345, 1985.88. Kou, S., and Le, Y., Weld. J., 64: 51, 1985.89. Dyatlov, V. I., and Sidoruk, V. S., Autom. Weld., 3: 21, 1966.90. Nikov, N. Y., Weld. Production, 4: 25, 1975.91. Sekiguchi, H., and Miyake, H., J. Jpn. Weld. Soc., 6(1): 59, 1975.92. Hernandez, I. E., and North, T. H., Weld. J., 63: 84s, 1984.93. Blodgett, O. W., Weld. Innovation Q., 2(3): 4, 1985.94. Fatigue Fractures in Welded Constructions, Vol. 11, International Institute of
Welding, London, 1979.
FURTHER READING
1. Davies, G. J., and Garland, J. G., Int. Metall. Rev., 20: 83, 1975.2. Flemings, M. C., Solidification Processing, McGraw-Hill, New York, 1974.
PROBLEMS
11.1 Compare the solidification temperature range and fraction eutectic ofAl–3.0Cu with those of Al–6.0Cu. For simplicity, assume Scheil’s equa-tion is a valid approximation and both the solidus and liquidus linesare straight in the Al–Cu system. CSM = 5.65, CE = 33, TE = 548°C, andTm = 660°C (pure Al).
11.2 Centerline cracking is often observed in deep-penetration electron orlaser beam welds. Explain why.
11.3 Fillet welds of 5052 Al (essentially Al–2.5Mg) are made with 5556 filler(essentially Al–5.1Mg). What are the approximate dilution ratio andweld metal composition? Is the weld metal susceptible to solidificationcracking?
11.4 Solidification cracking in 2014 aluminum sheets can be reduced significantly by using low-frequency transverse arc oscillation. Low-
PROBLEMS 299

frequency circular and longitudinal arc oscillations, however, are lesseffective. Explain why.
11.5 Low-frequency arc pulsation during autogenous GTAW of aluminumalloys, such as 6061 and 2014, is often found detrimental rather thanbeneficial in controlling solidification cracking. Explain why.
11.6 A structural steel has a nominal composition of 0.16 C, 1.4 Mn, 0.4 Si,0.022 S, and 0.016 P. Because of macrosegregation of carbon duringingot casting, some of the steel plates produced contained as much as0.245% C. Severe solidification cracking was reported in welds of thesesteel plates. Explain why. The problem was solved by using a differentfiller wire. Comment on the carbon content of the new filler wire.
11.7 Consider welding 1018 steel to 304 stainless steel by GMAW (dilutionnormally between 30 and 40%). Assume approximately equal contri-bution to weld metal dilution from each side of the joint. Will the weldmetal be susceptible to solidification cracking if ER308L Si is used asthe electrode? Will the weld metal be dangerously close to the marten-site boundary? 1018 steel: 0.18C–0.02Cr–0.03Ni–0.01Mo–0.07Cu–0.01N; 304 stainless steel: 0.05C–18.30Cr–8.80Ni–0.05Mo–0.08Cu–0.04N; ER308L Si: 0.03C–19.90Cr–10.20Ni–0.21Mo–0.19Cu–0.06N.
11.8 Repeat the previous problem but with ER309L Si as the electrode.ER309L Si: 0.02C–24.10Cr–12.70Ni–0.13Mo–0.16Cu–0.05N.
11.9 Stainless steels normally considered resistant to solidification crackingin arc welding based on the constitution diagram (such as Schaeffleror WRC 1992), for instance, 304L, 316L, and 321Mo, can become rathersusceptible in laser or electron beam welding. Explain why.
11.10 It has been observed in 1100 aluminum alloy that the Ti or Zr contentof the alloy, up to about 0.5wt%, can significantly affect its suscepti-bility to solidification cracking. Explain how Ti or Zr affects weld metalsolidification cracking of the alloy and why.
11.11 It has been reported that autogenous gas–tungsten arc welds of Invar (Fe–36wt% Ni) are rather susceptible to solidification cracking.Explain why based on a constitution diagram. The addition of Ti (e.g., 0.5–1.0%) has been found to change the Mn sulfide films alongthe grain boundaries to tiny Ti sulfide particles entrapped betweendendrite arms. What is the effect of the Ti addition on solidificationcracking?
300 WELD METAL SOLIDIFICATION CRACKING

PART IIIThe Partially Melted Zone
Welding Metallurgy, Second Edition. Sindo KouCopyright 2003 John Wiley & Sons, Inc.
ISBN: 0-471-43491-4

12 Formation of the PartiallyMelted Zone
Severe liquation can occur in the partially melted zone during welding. Severalfundamental liquation-related phenomena are discussed in this chapter,including liquation mechanisms, solidification of the grain boundary (GB)liquid, and the resultant GB segregation.
12.1 EVIDENCE OF LIQUATION
The partially melted zone (PMZ) is the area immediately outside the weldmetal where liquation can occur during welding. Figure 12.1a shows a portionof the PMZ in a gas–metal arc weld of a 6061 aluminum made with a 4145filler metal. The presence of dark-etching GBs along the fusion boundary inthis micrograph is an indication of GB liquation.The microstructure inside thewhite rectangle is enlarged in Figure 12.1b.The liquated and resolidified mate-rial along the GB consists of a dark-etching eutectic GB and a lighter etchinga (Al-rich) band along the GB.
Figure 12.2 shows the PMZ microstructure in alloy 2219, which is essen-tially Al–6.3Cu (1). The liquated and resolidified material along the GB con-sists of a dark-etching eutectic GB and a light-etching a band along the GB.The a bands here appear lighter than those in Figure 12.1b because of the useof a different etching solution. As shown, the large dark-etching eutectic par-ticles within grains are surrounded by a light-etching a phase, thus indicatingthat liquation also occurs within grains.
The formation of the PMZ in 2219 aluminum is explained in Figure 12.3.As shown in the phase diagram (Figure 12.3a), the composition of alloy 2219is C0 = 6.3% Cu. As shown by the thermal cycles (Figure 12.3b), the materialat position b is heated up to between the eutectic temperature TE and the liq-uidus temperature TL during welding.Therefore, the material becomes a solid-plus-liquid mixture (a + L), that is, it is partially melted. The material atposition a is completely melted while that at position c is not melted at all. Asimilar explanation for the formation of the PMZ, in fact, has been given pre-viously in Figure 7.12.
303
Welding Metallurgy, Second Edition. Sindo KouCopyright 2003 John Wiley & Sons, Inc.
ISBN: 0-471-43491-4

12.2 LIQUATION MECHANISMS
Huang et al. (1–5) have conducted a series of studies on liquation and solidi-fication in the PMZ of aluminum welds. Figure 12.4 shows five different PMZliquation mechanisms. The phase diagram shown in Figure 12.4a is similar tothe Al-rich side of the Al–Cu phase diagram. Here, AxBy is an intermetalliccompound, such as Al2Cu in the case of Al–Cu alloys. Alloy C1 is within thesolubility limit of the a phase, CSM, and alloy C2 is beyond it. In the as-castcondition both alloys C1 and C2 usually consist of an a matrix and the eutec-tic a + AxBy along GBs and in between dendrite arms.
12.2.1 Mechanism 1: AxBy Reacting with Matrix
This mechanism is shown in Figure 12.4b. Here alloy C2, for instance, alloy2219, consists of an a matrix and AxBy particles at any temperature up to the
304 FORMATION OF THE PARTIALLY MELTED ZONE
Figure 12.1 PMZ microstructure of gas–metal arc weld in 6061 aluminum made with4145 aluminum filler wire. Rectangular area in (a) enlarged in (b).

eutectic temperature TE, regardless of the heating rate to TE during welding.At TE liquation is initiated by the eutectic reaction AxBy + a Æ L.
The liquation mechanism for alloy 2219 can be explained with the help of Figure 12.5. The base metal contains large and small q (Al2Cu) particlesboth within grains and along GBs (Figure 12.5a), as shown by the SEM image at the top. At the border line between the PMZ and the base metal (Figure 12.5b), the material is heated to the eutectic temperature TE.Regardless of the heating rate q (Al2Cu) particles are always present when TE is reached. Consequently, liquation occurs by the eutectic reaction a +q Æ LE, where LE is the liquid of the eutectic composition CE. Upon cool-ing, the eutectic liquid solidifies into the eutectic solid without composi-tion changes and results in eutectic particles and some GB eutectic (Figure12.5e).
Above TE, that is, inside the PMZ, liquation intensifies. The a matrix sur-rounding the eutectic liquid dissolves and the liquid increases in volume
LIQUATION MECHANISMS 305
Figure 12.2 PMZ microstructure of gas–metal arc weld in 2219 aluminum made with2319 aluminum filler wire: (a) left of weld; (b) right of weld. Reprinted from Huangand Kou (1). Courtesy of American Welding Society.
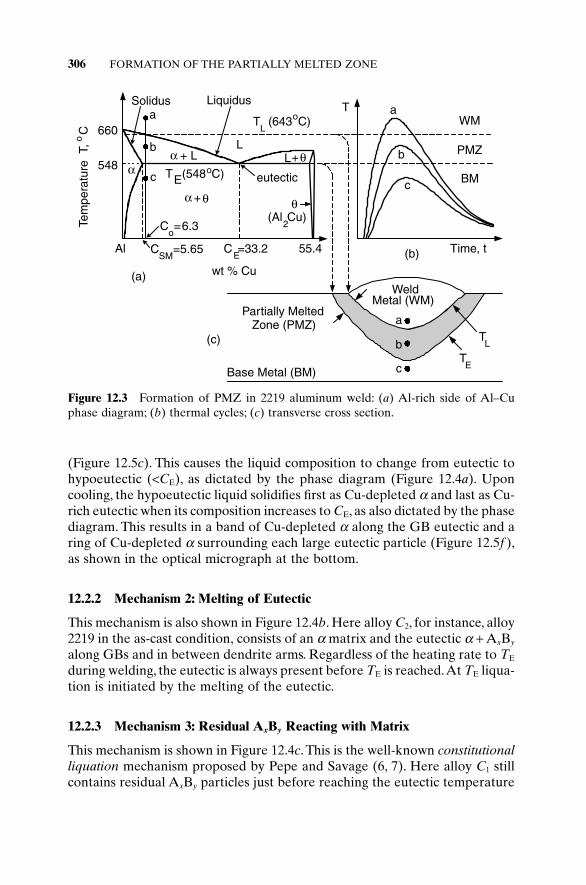
(Figure 12.5c). This causes the liquid composition to change from eutectic tohypoeutectic (<CE), as dictated by the phase diagram (Figure 12.4a). Uponcooling, the hypoeutectic liquid solidifies first as Cu-depleted a and last as Cu-rich eutectic when its composition increases to CE, as also dictated by the phasediagram. This results in a band of Cu-depleted a along the GB eutectic and aring of Cu-depleted a surrounding each large eutectic particle (Figure 12.5f ),as shown in the optical micrograph at the bottom.
12.2.2 Mechanism 2: Melting of Eutectic
This mechanism is also shown in Figure 12.4b. Here alloy C2, for instance, alloy2219 in the as-cast condition, consists of an a matrix and the eutectic a + AxBy
along GBs and in between dendrite arms. Regardless of the heating rate to TE
during welding, the eutectic is always present before TE is reached.At TE liqua-tion is initiated by the melting of the eutectic.
12.2.3 Mechanism 3: Residual AxBy Reacting with Matrix
This mechanism is shown in Figure 12.4c. This is the well-known constitutionalliquation mechanism proposed by Pepe and Savage (6, 7). Here alloy C1 stillcontains residual AxBy particles just before reaching the eutectic temperature
306 FORMATION OF THE PARTIALLY MELTED ZONE
L
Al
wt % Cu
L+
Co=6.3
(Al2Cu)Te
mpe
ratu
re T
, oC
Solidus Liquidusa
b
c
PMZ
BM
WM
(a)
(b) Time, t
660
548
55.4
+
eutectic
TL
(643oC)T
TE(548oC)
+ L
Base Metal (BM)T
E
WeldMetal (WM)
a
b
c
TL
Partially MeltedZone (PMZ)
(c)
CE=33.2
a
b
c
CSM
=5.65
α
α
α
θ
θ
θ
Figure 12.3 Formation of PMZ in 2219 aluminum weld: (a) Al-rich side of Al–Cuphase diagram; (b) thermal cycles; (c) transverse cross section.

TE. Examples of such AxBy include the titanium sulfide inclusion in 18% Nimaraging steel, Ni2Nb Laves phase in Inconel 718, carbides in Ni-base super-alloys, and several intermetallic compounds in aluminum alloys.
When alloy C1 is heated very slowly to above the solvus temperature TV,AxBy dissolves completely in the a matrix by solid-state diffusion, and the alloy becomes a homogeneous a solid solution of composition C1. However,when alloy C1 is heated rapidly to above TV, as often the case in welding, AxBy
does not have enough time to dissolve completely in the a matrix becausesolid-state diffusion is slow. That is, AxBy remains in the a matrix above TV.Consequently, upon heating to the eutectic temperature TE, the residual AxBy
reacts with the surrounding a matrix and forms the liquid eutectic CE at the
LIQUATION MECHANISMS 307
L
A
Concentration of B, C
L + AxBy
CSM
C2
Tem
pera
ture
, T
solidusliquidus
(a)
Tm
TE
CE AxBy
eutecticTL2
+ L
PMZ (1 or 2)
Base Metal (BM)
(b)
(c)
TL1
C1
PMZ (3 or 4)
TS1
TL1
TS1
C2 > CSMC1 < CSM
PMZ (5)
TL2
TE
WeldMetal
TE
WeldMetal
solvus
3. Residual AxBy reacting with matrix: (constitutional liquation) AxBy+ L at TE if AxBy still present at TE
5. Melting of matrix: L at TS1 if no AxBy or eutectic present at TE
1. AxBy reacting with matrix:
AxBy+ L at TE AxBy always present at TE regardless of heating rate
BM
TV
4. Melting of residual eutectic: eutetic(S) eutectic(L) at TE if eutectic still present at TE
2. Melting of eutectic: eutectic(S) eutectic(L) at TE eutectic always present at TE regardless of heating rate
+ AxBy
αα
α
αα
α
Figure 12.4 Five mechanisms for liquation in PMZ of aluminum alloys: (a) phasediagram; (b) two mechanisms for an alloy beyond the solid solubility limit (CSM); (c)three mechanisms for an alloy within the solid solubility limit.

308 FORMATION OF THE PARTIALLY MELTED ZONE
Figure 12.5 Microstructure evolution in PMZ of 2219 aluminum with SEM image ofthe base metal on the top and optical micrograph of the PMZ at the bottom. Reprintedfrom Huang and Kou (1). Courtesy of American Welding Society.

interface. Further heating to above TE would allow additional time for furtherdissolution of AxBy and further formation of the liquid phase. Therefore, it isclear that localized melting should be possible with rapid heating rates at tem-peratures significantly below the equilibrium solidus temperature TS1.
Figure 12.6 shows the microstructure of the PMZ of a resistance spot weldof 18-Ni maraging steel (6). This micrograph reveals the four stages leading toGB liquation.The first stage, visible at point A, shows a rodlike titanium sulfideinclusion beginning to form a thin liquid film surrounding the inclusion. Thesecond stage is visible at point B, which is closer to the fusion boundary andhence experiences a higher peak temperature than at point A.As shown, liqua-tion is more extensive and an elliptical liquid pool surrounds the remainingsmall gray inclusion. Still closer to the fusion boundary, at point C, no moresolid inclusion remains in the liquid pool, and penetration of GBs by the liquidphase is evident along the GBs intersecting with the liquid phase. Finally, atposition D, GB penetration by the liquid phase is so extensive that the GBsare liquated.
Constitutional liquation has also been observed in several nickel-basealloys (8–11), such as Udimet 700,Waspaloy, Hastelloy X, and Inconel 718, andin 347 stainless steel (12). Constitutional liquation can be initiated by the inter-action between the matrix and particles of carbide or other intermetallic com-pounds. Examples include M6C in Hastelloy X, MC carbide in Udimet 700,Waspaloy and Inconel 718, and Ni2Nb Laves phase in Inconel 718. Figure 12.7shows the PMZ of an Inconel 718 weld (13). Constitutional liquation occursby the eutectic reaction between the Ni2Nb Laves phase and the nickel matrix.
LIQUATION MECHANISMS 309
Figure 12.6 PMZ of an electric resistance spot weld of 18-Ni maraging steel showingconstitutional liquation. The fusion zone is at the top. Magnification 385¥. Reprintedfrom Pepe and Savage (6). Courtesy of American Welding Society.

Constitutional liquation alone, however, is not enough to cause the liquidto penetrate most GBs in the PMZ. For this to occur in Ni-base alloys, GBmigration is also needed. Figure 12.8 shows schematically the formation of GBfilms in the PMZ due to the simultaneous occurrence of constitutional liqua-tion and GB migration (6). The microstructure at location d0 is representativeof the as-received plate. At location d1, significant grain growth occurs abovethe effective grain coarsening temperature. Meanwhile, some of the movingGBs intersect with the solute-rich pools formed by constitutional liquation,thus allowing the solute-rich liquid to penetrate these GBs.At location d2 moregrain growth occurs and sufficient solute-rich liquid penetrates the GBs andforms GB films. These GBs are pinned due to the wetting action of the films.No further grain growth is expected until either the solute-rich liquid phase isdissipated by homogenization or the local temperature decreases to below theeffective solidus of the solute-rich liquid to cause it to solidify. If insufficienttime is available to dissipate the solute-rich liquid GB films before the localtemperature decreases to below the effective solidus of the liquid, the liquidGB films will solidify as a solute-rich GB network. A “ghost” GB network willthus remain fixed when grain growth resumes, as shown by the dashed linesat location d3. Grain growth will continue until either an equilibrium GBnetwork is formed or the temperature decreases to below the effective graincoarsening temperature. Figure 12.9 shows the ghost GB network near thefusion boundaries of gas–tungsten arc welds of 18-Ni maraging steel (6) anda Ni-base superalloy 690 (14).
310 FORMATION OF THE PARTIALLY MELTED ZONE
Figure 12.7 PMZ of Inconel 718 weld showing constitutional liquation due to Laveseutectic reaction. Reprinted from Kelly (13).

Figure 12.8 Schematic representation of constitutional liquation and formation ofghost GB network. Reprinted from Pepe and Savage (6). Courtesy of AmericanWelding Society.
Figure 12.9 Ghost GBs near fusion boundary of gas–tungsten arc welds: (a) 18-Nimaraging steel; magnification 125¥. Reprinted from Pepe and Savage (6). Courtesy ofAmerican Welding Society. (b) Ni-base superalloy 690. Reprinted from Lee and Kuo(14).
(a)
(b)
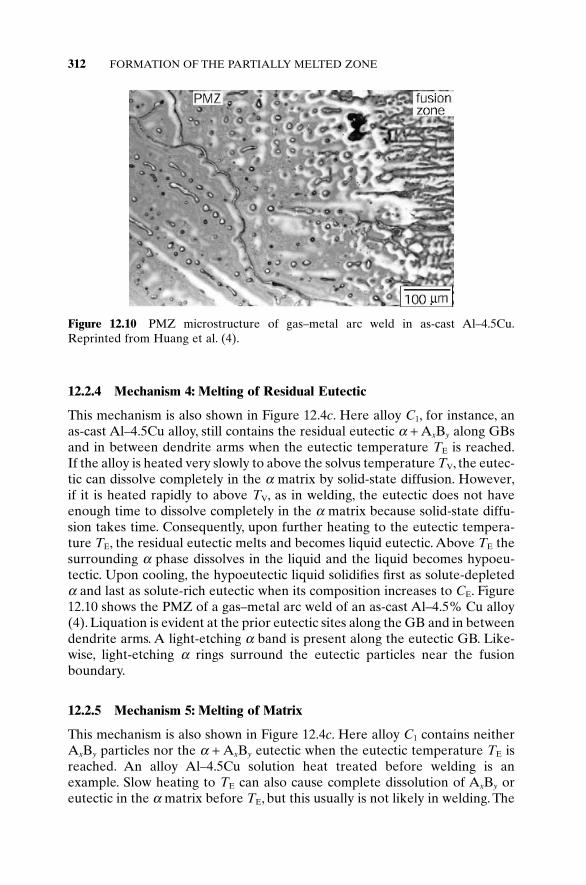
12.2.4 Mechanism 4: Melting of Residual Eutectic
This mechanism is also shown in Figure 12.4c. Here alloy C1, for instance, anas-cast Al–4.5Cu alloy, still contains the residual eutectic a + AxBy along GBsand in between dendrite arms when the eutectic temperature TE is reached.If the alloy is heated very slowly to above the solvus temperature TV, the eutec-tic can dissolve completely in the a matrix by solid-state diffusion. However,if it is heated rapidly to above TV, as in welding, the eutectic does not haveenough time to dissolve completely in the a matrix because solid-state diffu-sion takes time. Consequently, upon further heating to the eutectic tempera-ture TE, the residual eutectic melts and becomes liquid eutectic. Above TE thesurrounding a phase dissolves in the liquid and the liquid becomes hypoeu-tectic. Upon cooling, the hypoeutectic liquid solidifies first as solute-depleteda and last as solute-rich eutectic when its composition increases to CE. Figure12.10 shows the PMZ of a gas–metal arc weld of an as-cast Al–4.5% Cu alloy(4). Liquation is evident at the prior eutectic sites along the GB and in betweendendrite arms. A light-etching a band is present along the eutectic GB. Like-wise, light-etching a rings surround the eutectic particles near the fusionboundary.
12.2.5 Mechanism 5: Melting of Matrix
This mechanism is also shown in Figure 12.4c. Here alloy C1 contains neitherAxBy particles nor the a + AxBy eutectic when the eutectic temperature TE isreached. An alloy Al–4.5Cu solution heat treated before welding is anexample. Slow heating to TE can also cause complete dissolution of AxBy oreutectic in the a matrix before TE, but this usually is not likely in welding. The
312 FORMATION OF THE PARTIALLY MELTED ZONE
Figure 12.10 PMZ microstructure of gas–metal arc weld in as-cast Al–4.5Cu.Reprinted from Huang et al. (4).

PMZ ranges from the solidus temperature (TS1) to the liquidus temperature(TL1), instead of from the eutectic temperature to the liquidus temperature,as in all previous cases. Figure 12.11 shows the PMZ microstructure in anAl–4.5% Cu alloy solution heat treated and quenched before GMAW (4).Eutectic is present both along GBs and within grains in the PMZ even thoughthe base metal is free of eutectic. Another example is a 6061-T6 aluminumcontaining submicrometer-size Mg2Si precipitate, which is reverted in the amatrix before reaching TE during GMAW (5).
12.2.6 Mechanism 6: Segregation-Induced Liquation
Lippold et al. (15) proposed a segregation-induced liquation mechanism foraustenitic and duplex stainless steels. In such a mechanism the alloy and/orimpurity elements that depress the melting point segregate to GBs, lower the melting point, and cause GB liquation. In other words, GB segregationtakes place first and GB liquation next.This is opposite to all the other mecha-nisms described in this chapter, where liquation takes place first and segrega-tion occurs during the solidification of the liquated material, as will bediscussed subsequently. They suggested that such GB segregation can be
LIQUATION MECHANISMS 313
Figure 12.11 PMZ microstructure of gas–metal arc weld in cast Al–4.5Cu homoge-nized before welding (a) and magnified (b). Reprinted from Huang et al. (4).

caused by (i) equilibrium diffusion of atoms of the elements to GBs, (ii) GBsweeping of such atoms into migrating GBs during grain growth, and (iii)“pipeline” diffusion of such atoms along GBs in the fusion zone that are con-tinuous across the fusion boundary into the PMZ. More details are availableelsewhere (15, 16).
12.3 DIRECTIONAL SOLIDIFICATION OF LIQUATED MATERIAL
Huang et al. (1, 4) observed that the GB liquid has a tendency to solidify essen-tially upward and toward the weld regardless of its location with respect to theweld, as shown schematically in Figure 12.12. This directional solidification iscaused by the high-temperature gradients toward the weld during welding. Ithas been generally accepted that the GB liquid between two neighboringgrains solidifies from both grains to the middle between them. However, themicrographs in Figure 12.2 show that it solidifies from one grain to the other—in the direction upward and toward the weld. This, in fact, suggests GB migra-tion in the same direction.
However, if the grains in the PMZ are very thin or very long, there may notbe much GB area facing the weld. Consequently, solidification of the GB liquidis still directional but just upward (5).
12.4 GRAIN BOUNDARY SEGREGATION
As the GB liquid solidifies, solute atoms are rejected by the solid into theliquid if the equilibrium partition coefficient k < 1, such as in the phase diagram
314 FORMATION OF THE PARTIALLY MELTED ZONE
Partially MeltedZone
Base Metal
WeldMetal
: direction ofsolidification
Rollingdirection
eutectic
solute-depleted α
Figure 12.12 Directional solidification of GB liquid in PMZ.

shown in Figure 12.3a. The GB liquid solidifies first as a solute-depleted a butfinally as eutectic when the liquid composition reaches CE.
Figure 12.13 depicts the GB segregation that develops during solidificationof the GB liquid in the PMZ (5). Take alloy 2219 as an example. Let C0 be theconcentration of Cu in the base metal (6.3%).Theoretically, the measured con-centration of the GB eutectic, Ce, is the eutectic composition CE (33%) if theGB eutectic is normal and q or Al2Cu (55%) if it is divorced. A normal eutec-tic refers to a eutectic with a composite-like structure of a + q. A divorcedeutectic, on the other hand, refers to a eutectic that nucleates upon an exist-ing a matrix and thus looks like q alone. In practice, with EPMA (electronprobe microanalysis) the value of Ce can be less than CE if the GB is thinnerthan the volume of material excited by the electrons, that is, the surroundinga of low-Cu is included in the composition analysis. This volume depends onthe voltage used in EPMA and the material being analyzed.
In the absence of back diffusion, the concentration of the element at thestarting edge of the a strip should be kC0, where k is the equilibrium partitionratio of the element. The dashed line shows the resultant GB segregation ofthe element. However, if back diffusion of the solute from the growth frontinto the solute-depleted a strip is significant, the concentration of the elementat the starting edge of the a strip will be greater than kC0, as the solid lineindicates.
Severe GB segregation of alloying elements has been observed in the PMZof gas–metal arc welds of alloys 2219, 2024, 6061, and 7075 (2, 5). Figure 12.14shows that in alloy 2219 the composition varies from about 2% Cu at the start-ing edge of the a strip to 30% Cu at the GB eutectic (2).The 2–3% Cu contentof the a strip is significantly lower than that of the base metal (C0 = 6.3% Cu),
GRAIN BOUNDARY SEGREGATION 315
Partially MeltedZone
Base Metal
WeldMetal
(a)
(b)
GB eutectic
a
b
Distance, z
Sol
ute
Con
cent
ratio
n, C
(c)
a b
k < 1
backdiffusion
no backdiffusion
Co
kCo
Ce
solute-depleted
α
α
Figure 12.13 Grain boundary segregation in PMZ. From Huang and Kou (5).

thus confirming that the a strip is Cu depleted.The 2% Cu content at the start-ing edge of the a strip is higher than kC0 (1.07% = 0.17 ¥ 6.3%), thus implyingback diffusion of Cu into the a strip during GB solidification.The 30% Cu con-centration at the GB is close to the 33% Cu composition of a normal eutectic.
12.5 GRAIN BOUNDARY SOLIDIFICATION MODES
As shown in Figures 12.1, 12.2, and 12.11, the a band along the eutectic GB isplanar, namely, without cells or dendrites. This suggests that the solidificationmode of the GB liquid is planar. The vertical temperature gradient G and the
316 FORMATION OF THE PARTIALLY MELTED ZONE
Figure 12.14 Grain boundary segregation in PMZ of 2219 aluminum weld: (a) elec-tron micrograph; (b) composition profile. Reprinted from Huang and Kou (2). Cour-tesy of American Welding Society.
Partially MeltedZone
Base Metal
WeldMetal
(a)
(b) (c)
eutecticeutectic
Grain
CellularSolidification
PlanarSolidification
thickerthinner
ba
planar solute-depleted
cellular solute-depleted α αα α
Figure 12.15 Solidification modes of GB liquid in PMZ.

GRAIN BOUNDARY SOLIDIFICATION MODES 317
Figure 12.16 Solidification modes of GB liquid in PMZ of 2219 aluminum weld: (a)planar; (b) cellular. Reprinted from Huang and Kou (3). Courtesy of American WeldingSociety.
vertical growth rate R were determined in the PMZ of alloy 2219 and theupward solidification of the GB liquid was analyzed (3). The ratio G/R forplanar GB solidification was found to be on the order of 105 °Cs/cm2, which isclose to that required for planar solidification of Al–6.3% Cu.

Although planar solidification of the GB liquid predominates in the PMZ,cellular solidification can also occur (3, 5). These cellular a bands share twocommon characteristics. First, they are often located near the weld bottom.Second, on average, they appear significantly thicker than the planar a bandsnearby. These characteristics, depicted in Figure 12.15, can be because of thelower vertical temperature gradient G in the area or backfilling of liquid fromthe weld pool (3, 5). Since a thicker GB liquid has to solidify faster, the verti-cally upward solidification rate R is higher. The lower G/R in the area suggestsa greater chance for constitutional supercooling and hence cellular instead of planar solidification. Figure 12.16 shows the PMZ microstructure in agas–metal arc weld of alloy 2219 (3). However, it should be pointed out thatplanar solidification changes to cellular solidification gradually, and a thinnerGB liquid may not have enough room for the transition to take place. There-fore, planar GB solidification may not necessarily mean that G/R is highenough to avoid cellular solidification.
12.6 PARTIALLY MELTED ZONE IN CAST IRONS
Figure 12.17 shows the PMZ in a cast iron weld, where g, a, and C representaustenite, ferrite, and graphite, respectively. This area tends to freeze as whiteiron due to the high cooling rates and becomes very hard (17).
REFERENCES
1. Huang, C., and Kou, S., Weld. J., 79: 113s, 2000.2. Huang, C., and Kou, S., Weld. J., 80: 9s, 2001.
318 FORMATION OF THE PARTIALLY MELTED ZONE
1 2FeCarbon, wt%
Tem
pera
ture
, oC
1600
1200
800
L
+ C
+ C
L
3 4
(a)(b)
Cast iron
partially melted zone
heat-affected zone
base metal
fusion zone
+ γ
γ
γ
α
Figure 12.17 PMZ in a cast iron.

3. Huang, C., and Kou, S., Weld. J., 80: 46s, 2001.4. Huang, C., Kou, S., and Purins, J. R., in Proceedings of Merton C. Flemings Sym-
posium on Solidification and Materials Processing, Eds. R. Abbaschian, H. Brody,and A. Mortensen, Minerals, Metals and Materials Society, Warrendale, PA, 2001,p. 229.
5. Huang, C., and Kou, S., Weld. J., in press.6. Pepe, J. J., and Savage, W. F., Weld. J., 46: 411s, 1967.7. Pepe, J. J., and Savage, W. F., Weld. J., 49: 545s, 1970.8. Owczarski, W. A., Duvall, D. S., and Sullivan, C. P., Weld. J., 45: 145s, 1966.9. Duvall, D. S., and Owczarski, W. A., Weld. J., 46: 423s, 1967.
10. Savage, W. F., and Krantz, B. M., Weld. J., 45: 13s, 1966.11. Thompson, R. G., and Genculu, S., Weld. J., 62: 337s, 1983.12. Dudley, R., Ph.D. Thesis, Rensselaer Polytechnic Institute, Troy, NY, 1962.13. Kelly, T. J., in Weldability of Materials, Eds. R. A. Patterson and K. W. Mahin, ASM
International, Materials Park, OH, 1990, p. 151.14. Lee, H. T., and Kuo, T. Y., Sci. Technol. Weld. Join., 4: 94, 1999.15. Lippold, J. C., Baselack III, W. A., and Varol, I., Weld. J., 71: 1s, 1992.16. Lippold, J. C., in Technology and Advancements and New Industrial Applications
in Welding, Proceedings of the Taiwan International Welding Conference ’98, Eds.C. Tsai and H. Tsai, Tjing Ling Industrial Research Institute, National University,Taipei, Taiwan, 1998.
17. Bushey, R. A., in ASM Handbook, Vol. 6: Welding, Brazing and Soldering, ASMInternational, Materials Park, OH, 1993, p. 708.
PROBLEMS
12.1 Sheets of alloy 2219 (Al–6.3Cu) 1.6mm thick are welded with theGTAW process using the following welding conditions: I = 60A, E = 10V, U = 3mm/s. Suppose the arc efficiency is 70%. Estimate the PMZwidth using the Adams two-dimensional equation (Chapter 2). AssumeTL = 645°C and TE = 548°C.
12.2 The heating rate in resistance spot welding can be much faster than thatin GTAW. Is constitutional liquation expected to be more severe in thePMZ of 18-Ni-250 maraging steel in resistance spot welding or GTAW?Explain why.
12.3 It has been pointed out that Fe3C tends to dissociate upon heating more easily than most other alloy carbides. Also, the diffusion rate ofthe interstitial solute, carbon, is much faster than substitutional solutes,for example, sulfur in the case of titanium sulfide inclusion. Do youexpect a plain carbon eutectoid steel containing fine Fe3C particles tobe susceptible to constitutional liquation when heated to the eutectictemperature under normal heating rates during welding (say less than500°C/s)? Why or why not?
PROBLEMS 319

12.4 It has been reported that by replacing Cb with Ta in Ni-base superalloy718, the Laves eutectic reaction temperature increases from 1185 to1225°C. Does the width of the PMZ induced by constitutional liquation(and liquation-induced cracking) increase or decrease in the alloy andwhy?
12.5 It has been suggested that in welding cast irons reducing the peak tem-peratures and the duration at the high temperatures is the most effec-tive way to reduce PMZ problems. Is the use of a low-melting-point fillermetal desirable in this respect? Is the use of high preheat temperature(to prevent the formation of martensite) desirable in this respect?
12.6 Based on the PMZ microstructure of the as-cast alloy Al–4.5Cu shownin Figure 12.10, what can be said about the solidification direction andmode of the grain boundary liquid and why?
12.7 Based on the PMZ microstructure of the homogenized alloy Al–4.5Cushown in Figure 12.11, what can be said about the solidification direc-tion and mode of the grain boundary liquid and why?
320 FORMATION OF THE PARTIALLY MELTED ZONE

13 Difficulties Associated with thePartially Melted Zone
The partially melted zone (PMZ) can suffer from liquation cracking, loss ofductility, and hydrogen cracking. Liquation cracking, that is, cracking inducedby grain boundary liquation in the PMZ during welding, is also called PMZcracking or hot cracking. The causes of these problems and the remedies,especially for liquation cracking, will be discussed in this chapter. Liquationcracking and ductility loss are particularly severe in aluminum alloys. For convenience of discussion, the nominal compositions of several commercialaluminum alloys and filler wires are listed in Table 13.1 (1).
13.1 LIQUATION CRACKING
Figure 13.1 shows the longitudinal cross section at the bottom of a gas–metalarc weld of 2219 aluminum made with a filler wire of 1100 aluminum. Therolling direction of the workpiece is perpendicular to the plane of the micro-graph. Liquation cracking in the PMZ is intergranular (2–6). Liquation crack-ing can also occur along the fusion boundary (3). The presence of a liquidphase at the intergranular fracture surface can be either evident (4) or unclear(5, 6).
13.1.1 Crack Susceptibility Tests
The susceptibility of the PMZ to liquation cracking can be evaluated usingseveral different methods, such as Varestraint testing, circular-patch testingand hot-ductility testing, etc.
A. Varestraint Testing This is usually used for partially penetrating welds inplates (Chapter 11). In brief, the workpiece is subjected to augmented strainsduring welding, and the extent of cracking in the PMZ is used as the index forthe susceptibility to liquation cracking (7–12).
B. Circular-Patch Testing This is usually used for fully penetrating welds inthin sheets. A relatively high restraint is imposed on the weld zone transverseto the weld (5). The fixture design shown in Figure 13.2 was used for liquation
321
Welding Metallurgy, Second Edition. Sindo KouCopyright 2003 John Wiley & Sons, Inc.
ISBN: 0-471-43491-4

cracking test of aluminum welds (13). The specimen is sandwiched betweentwo copper plates (the upper one having a big round opening for welding) andtightened by tightening the bolts against the stainless steel base plate.A similardesign was used by Nelson et al. (14) for assessing solidification cracking insteel welds. Cracking is at the outer edge of the weld, not the inner. This isbecause contraction of the weld during cooling is hindered by the restraint,thus rendering the outer edge in tension and the inner edge in compression.Figure 13.3a shows a circular weld made in 6061 aluminum with a 1100 alu-minum filler. The three cracks in the photo all initiate from the PMZ near theouter edge of the weld and propagate into the fusion zone along the welding
322 DIFFICULTIES ASSOCIATED WITH THE PARTIALLY MELTED ZONE
TABLE 13.1 Nominal Compositions of Some Commercial Aluminum Alloys
Si Cu Mn Mg Cr Ni Zn Ti Zr Fe
1100 — 0.122014 0.8 4.4 0.8 0.52024 — 4.4 0.6 1.52219 — 6.3 0.3 — — — — 0.06 0.182319 — 6.3 0.3 — — — — 0.15 0.184043 5.25083 — — 0.7 4.4 0.155356 — — 0.12 5.0 0.12 — — 0.136061 0.6 0.28 — 1.0 0.26063 0.4 — — 0.76082 0.9 — 0.5 0.7 — — — — — 0.37002 — 0.75 — 2.5 — — 3.57075 — 1.6 — 2.5 0.23 — 5.6
Source: Aluminum Association (1).
Figure 13.1 PMZ cracking in 2219 aluminum welded with filler metal 1100.

direction (clockwise). Figure 13.3b shows a circular weld between 2219 alu-minum and 1100 aluminum made with a 1100 aluminum filler (13). A longPMZ crack runs along the outer edge of the weld.
C. Hot Ductility Testing This has been used extensively for evaluating thehot-cracking susceptibility of nickel-base alloys (15, 16). It is most often per-formed on a Gleeble weld simulator (Chapter 2), which is also a tensile testinginstrument. The specimen is resistance heated according to a predeterminedthermal cycle resembling that in the PMZ. It is tensile tested, for instance, ata stroke rate of 5cm/s, at predetermined temperatures along the thermal cycle,either during heating to the peak temperature of the thermal cycle or duringcooling from it. Several different criteria have been used for interpreting hotductility curves (17). For instance, one of the criteria is based on the ability ofthe material to reestablish ductility, that is, how fast ductility recovers duringcooling from the peak temperature. If ductility recovers right below the peaktemperature, the alloy is considered crack resistant, such as that shown inFigure 13.4a for a low-B Cabot alloy 214 (6). On the other hand, if ductilityrecovers well below the peak temperature, the alloy is considered crack sen-sitive, such as that shown in Figure 13.4b for a high-B Cabot 214. The mecha-nism that boron affects liquation cracking in Ni-base superalloys is not clear(18).
LIQUATION CRACKING 323
stainless steel base plate
copperplate
specimen
threads
washer
2.5cm
10 cm
specimen
weld
10 cm
weld
hole
bolt copperplate witha hole
Figure 13.2 Schematic sketch of a circular-patch test.

Figure 13.3 Cracking in circular-patch welds: (a) 6061 aluminum made with a 1100filler wire; (b) 2219 aluminum (outside) welded to 1100 aluminum (inside) with a 1100filler wire. From Huang and Kou (13).
OCPeaktemperature(1345 oC)
900 1000 1100 1200 1300 14000
20
40
60
80
1001650 1830 2010 2370 2550
Temperature, oC
Temperature, oF
Red
uctio
n of
are
a, %
2019
OH
OC
Peaktemperature(1345 oC)
900 1000 1100 1200 1300 14000
20
40
60
80
1001650 1830 2010 2370 2550
Temperature, oC
Temperature, oF
Red
uctio
n of
are
a, %
2019
OH
(a) (b)
Figure 13.4 Hot ductility response of Cabot alloy 214 with two different boron levels:(a) 0.0002 wt% B; (b) 0.003 wt% B. OH, testing done on heating to 1345°C; OC, oncooling from 1345°C. From Cieslak (6). Reprinted from ASM Handbook, vol. 6, ASMInternational.
324 DIFFICULTIES ASSOCIATED WITH THE PARTIALLY MELTED ZONE

13.1.2 Mechanisms of Liquation Cracking
Figure 13.5a is a schematic showing the formation of liquation cracking in thePMZ of a full-penetration aluminum weld (13). Since the PMZ is weakenedby grain boundary liquation, it cracks when the solidifying weld metal con-tracts and pulls it. Most aluminum alloys are susceptible to liquation cracking.This is because of their wide PMZ (due to wide freezing temperature rangeand high thermal conductivity), large solidification shrinkage (solid densitysignificantly greater than liquid density), and large thermal contraction (largethermal expansion coefficient). The solidification shrinkage of aluminum is ashigh as 6.6%, and the thermal expansion coefficient of aluminum is roughlytwice that of iron base alloys. Figure 13.5b shows liquation cracking in an alloy6061 circular weld (Figure 13.3a). The light etching a band along the grainboundary is a clear evidence of the grain boundary liquid that weakened thePMZ during welding.
LIQUATION CRACKING 325
weldpool
solidifying weldmetal pulling PMZ
pullingcrack
magnified
grain
fusion boundary
weldpool base metal
PMZ weakened by grainboundary (GB) liquation
PMZ
Figure 13.5 Formation of PMZ cracking in a full-penetration aluminum weld: (a)schematic; (b) PMZ cracking in 6061 aluminum. From Huang and Kou (13).
(a)

Figure 13.6 shows the effect of the weld metal composition on liquationcracking in 2219 aluminum, which is essentially Al-6.3Cu (13). The circular-patch weld on the right is identical to the PMZ (or the base metal) in com-position, that is, Al-6.3Cu. No liquation cracking occurs. The circular-patchweld on the left (same as that in Figure 13.3b), however, has a significantlylower Cu content than the PMZ, and liquation cracking was severe. This effectof the weld metal composition will be explained as follows.
Since the cooling rate during welding is too high for equilibrium solidifica-tion, it is inappropriate to discuss liquation cracking based on the solidus temperature from an equilibrium phase diagram. From Equation (6.13) fornonequilibrium solidification, the fraction of liquid fL at any given tempera-ture T can be expressed as follows:
(13.1)
where mL (<0) is the slope of the liquidus line in the phase diagram, Co thesolute content of the alloy, Tm the melting point of pure aluminum, and kthe equilibrium partition ratio. Therefore, at any temperature T the lower Co,the smaller fL is, that is, the stronger the solid/liquid mixture becomes.Consider the circular-patch weld on the left in Figure 13.6. The weld metal has
fm C
T T
k
LL o
m=
-( )-
ÊË
ˆ¯
-1 1
326 DIFFICULTIES ASSOCIATED WITH THE PARTIALLY MELTED ZONE
Al wt % Cu
L
10 20 30400
500
600
700
Te
mpe
ratu
re, o C
+ TE = 548 oC
620
solid solubility limit at 5.65
liquationcracking
solidificationcracking
decreasing liquation cracking inalloy 2219 (essentially Al-6.3Cu)
+ L
2 cm
2219
weldingdirection
circular-patch welds in workpiece of alloy 2219
weldweld
αα
α θ
Figure 13.6 Effect of weld metal composition on PMZ cracking in 2219 aluminum.From Huang and Kou (13).

a significantly lower Co (Al-0.95Cu) than the PMZ (Al-6.3Cu). This suggeststhat at any temperature T the weld metal is significantly stronger than thePMZ, thus causing liquation cracking. As for the circular-patch on the right,the weld metal and the PMZ have the same Co and hence the similar strengthlevel. As such, no liquation cracking occurs.
Figure 13.7a is a schematic showing the formation of liquation cracking inthe PMZ of a partial-penetration GMA weld of an aluminum alloy. The pap-illary (nipple) type penetration pattern shown in the figure is common inGMAW of aluminum alloys with Ar shielding, where spray transfer is themode of filler metal transfer through the arc (13).The welding direction is per-
LIQUATION CRACKING 327
(a)
pullingforce
weld pool
partially meltedzone
solidifying and contracting weld metal
grainboundary
rollingdirectionbase
metal
cracks form if weld metal develops sufficientstrength to pull away while GBs are still liquated
grain boundary(GB) liquid
fusion boundary
Figure 13.7 Weld metal pulling and tearing PMZ: (a) schematic sketch; (b) 7075 alu-minum welded with filler 1100. From Huang and Kou (13).

pendicular to the rolling direction. The weld metal in the papillary pen-etration, as indicated by its very fine cell spacing of the solidification micro-structure, solidifies rapidly. This suggests that the rapidly solidifying and thuscontracting weld metal in the papillary penetration pulls the PMZ that is weakened by grain boundary liquation. Figure 13.7b shows the transversecross section near the bottom of a GMA weld of 7075 aluminum made witha filler wire of 1100 aluminum. As shown, the weld metal pulls and tears thePMZ near the tip of the papillary penetration (13).
13.2 LOSS OF STRENGTH AND DUCTILITY
As mentioned in the previous chapter, Huang and Kou (19–21) studied liqua-tion in the PMZ of 2219 aluminum gas–metal arc welds and found both a Cu-depleted a band next to the Cu-rich GB eutectic and a Cu-depleted a ringsurrounding each large Cu-rich eutectic particle in the grain interior. Results ofmicrohardness testing showed that the Cu-depleted a was much softer than theCu-rich eutectic. This suggests that the liquated material solidifies with severesegregation and results in a weak PMZ microstructure with a soft ductile a anda hard brittle eutectic right next to each other. Under tensile loading, the ayields without much resistance while the eutectic fractures badly.
Figure 13.8 shows the tensile testing results of a weld made perpendicularto the rolling direction (20). The maximum load and elongation before failureare both much lower in the weld specimen than in the base-metal specimen,as shown in Figure 13.8a. Fracture of eutectic is evident both along the GBand at large eutectic particles in the grain interior, as shown in Figures 13.8band c. The fluctuations in the tensile load in Figure 13.8a are likely to be asso-ciated with the fracture of the eutectic.
13.3 HYDROGEN CRACKING
Savage et al. (22) studied hydrogen-induced cracking in HY-80 steel. Theyobserved intergranular cracking in the PMZ and the adjacent region in thefusion zone where mixing between the filler and the weld metal is incomplete,as shown in Figure 13.9.
It was pointed out that the creation of liquated films on the GBs in the PMZprovides preferential paths along which hydrogen from the weld metal candiffuse across the fusion boundary. This, according to Savage et al. (22), isbecause liquid iron can dissolve approximately three to four times morenascent hydrogen than the solid, thus making the liquated GBs serve as“pipelines” along which hydrogen from the weld metal can readily diffuseacross the fusion boundary. When these segregated films resolidify, they notonly are left supersaturated with hydrogen but also exhibit a higher harden-ability due to solute segregation. Consequently, they serve as preferred nucle-ation sites for hydrogen-induced cracking.
328 DIFFICULTIES ASSOCIATED WITH THE PARTIALLY MELTED ZONE

Figure 13.8 Results of tensile testing of a gas–metal arc weld of 2219 aluminum madeperpendicular to the rolling direction. Reprinted from Huang and Kou (20). Courtesyof American Welding Society.
Figure 13.9 Hydrogen-induced cracking in the PMZ of HY-80 steel. Reprinted fromSavage et al. (22). Courtesy of American Welding Society.
HYDROGEN CRACKING 329
13.4 REMEDIES
Remedies for the problems associated with the PMZ can be grouped into fourcategories: filler metal, heat source, degree of restraint, and base metal. Thesewill be discussed below.
13.4.1 Filler Metal
Liquation cracking can be reduced by selecting the proper filler metal.Metzger (23) reported the significant effect of the weld metal composition onliquation cracking in aluminum alloys. Liquation cracking occurred in 6061aluminum welds produced with Al–Mg fillers at high dilution ratios but not inwelds made with Al–Si fillers at any dilution ratios. Metzger’s study has beenconfirmed by subsequent studies on alloys 6061, 6063, and 6082 (5, 10–12,24–26).
Gittos and Scott (5) studied liquation cracking in alloy 6082 welded with5356 and 4043 fillers using the circular-patch test. Like Metzger (23), Gittosand Scott (5) observed liquation cracking welds made with the 5356 filler athigh dilution ratios (about 80%) but not in welds made with the 4043 filler atany dilution ratios. When it occurred, liquation cracking was along the outeredge of the weld and no cracking was observed along the inner edge.
Gittos and Scott (5) proposed the criterion of TWS > TBS for liquation crack-ing to occur, where TWS and TBS are the solidus temperatures of the weld metaland the base metal, respectively. They assumed that if the weld metal compo-sition is such that TWS > TBS, then the PMZ will solidify before the weld metaland thus resist tensile strains arising from weld metal solidification. The weldmetal solidus temperature TWS and the base-metal solidus temperature TBS
were taken from Figure 13.10, which shows the solidus temperatures in the Al-rich corner of the ternary Al–Mg–Si system (27). They found the variations inTWS and TBS with the dilution ratio shown in Figure 13.11a to be consistentwith the results of their circular-patch testing.
Katoh and Kerr (10, 11) and Miyazaki et al. (12) studied liquation crackingin 6000 alloys, including 6061, using Varestraint testing. Longitudinal liquationcracking occurred when alloy 6061 was welded with a 5356 filler but not witha 4043 filler. They measured the solidus temperatures of the base metals andfiller metals by differential thermal analysis. The solidus temperature TBS ofalloy 6061 was 597°C. Contrary to the TWS > TBS cracking criterion proposedby Gittos and Scott (5), Miyazaki et al. (12) found TWS < TBS whether the fillermetal was 5356 or 4043 (12). This is shown in Figure 13.11b. It was proposedthat the base metal of 6061 aluminum probably liquated at 559°C by consti-tutional liquation induced by the Al–Mg2Si–Si ternary eutectic.
It should be noted that when attempting to avoid liquation cracking in thePMZ by choosing a proper filler metal, the solidification cracking susceptibil-ity of the fusion zone still needs to be checked. Solidification cracking–composition diagrams (Figure 11.26) can be useful for this purpose (28).
330 DIFFICULTIES ASSOCIATED WITH THE PARTIALLY MELTED ZONE

REMEDIES 331
560
570
560
00
0.5 1.0 1.5 2.0 2.5 3.0 3.5 4.0
0.5
1.0
1.5
2.0
2.5
3.0
3.5
4.0
5.0
4.5
5.5
6.0
5.04.5 5.5 6.0 7.06.5
Al - Mg2Si - Si555 oC
Qua
si-B
inar
y
Mag
nesi
um, w
t%
Silicon, wt%
570
580
590
580
570
590
595
580
550
560
Solidus Temperatures forTernary Al-Mg-Si System
590
600
610620
570
Al
6082 workpiece
6061 workpiece
4043 filler
5356 filler
Figure 13.10 Ternary Al–Mg–Si phase diagram showing the solidus temperature.Modified from Phillips (27).
0 20 40 60 80 100550
560
570
580
590
600
base metal
5356
4043
Dilution by base metal, D(%)
Sol
idus
tem
pera
ture
, T
s(o C)
(a)
0 20 40 60 80 100500
520
540
560
580
600
5356
4043
Dilution by base metal, D(%)
Sol
idus
tem
pera
ture
, T
s(o C
) 6061
(b)
Figure 13.11 Variation of weld metal solidus temperature with dilution: (a) in 6082aluminum (5); (b) in 6061 aluminum (12). (a) from Gittos et al. (5) and (b) fromMiyazaki et al. (12). Reprinted from Welding Journal, Courtesy of American WeldingSociety.

13.4.2 Heat Source
The size of the PMZ and hence the extent of PMZ liquation can be reducedby reducing the heat input, as illustrated in Figure 13.12. Figure 13.13 showsthe effect of the heat input on liquation cracking in Varestraint testing ofgas–metal arc welds of alloy 6061 made with a 5356 filler metal (12). To min-imize the difficulties associated with the PMZ, the heat input can be kept lowby using multipass welding or low-heat-input welding processes (such as EBWand GTAW) when possible.
Kou and Le (29) reduced GB liquation and thus liquation cracking in thePMZ of 2014 aluminum alloy by using transverse arc oscillation (1Hz) duringGTAW. The extent of GB melting is significantly smaller with arc oscillation.With the same welding speed, the resultant speed of the heat source isincreased by transverse arc oscillation (Chapter 8). This results in a smallerweld pool and a narrower PMZ.
13.4.3 Degree of Restraint
Liquation cracking and hydrogen-induced cracking in the PMZ are bothcaused by the combination of a susceptible microstructure and the presenceof tensile stresses. The sensitivity of the PMZ to both types of cracking can be
332 DIFFICULTIES ASSOCIATED WITH THE PARTIALLY MELTED ZONE
fusion zone
lower Q/V, narrower PMZhigher Q/V, wider PMZ
Q/V: (heat input)/(welding speed) orheat input per unit length of weld
fusion zonepool pool
Figure 13.12 Effect of heat input on width of PMZ.
Q/V=9.2kJ/cm
Q/V=5.6kJ/cm
Q/V=3.4kJ/cm
Longitudinal crack
0.0 1.0 2.0 3.0 4.0 5.0 6.00
4
8
12
16
Augmented strain, (%)
Cra
ck le
ngth
, L(
mm
)
ε
Figure 13.13 Effect of heat input on liquation cracking in Varestraint testing of 6061aluminum welded with 5356 filler metal. Modified from Miyazaki et al. (12). Courtesyof American Welding Society.

reduced by decreasing the degree of restraint and hence the level of tensilestresses.
13.4.4 Base Metal
Liquation cracking can be reduced by selecting the proper base metal forwelding if it is feasible. The base-metal composition, grain structure, andmicrosegregation can affect the susceptibility of the PMZ to liquation crack-ing significantly.
A. Impurities When impurities such as sulfur and phosphorus are present,the freezing temperature range can be widened rather significantly (Chapter11). The widening of the freezing temperature range is due to the lowering ofthe incipient melting temperature, which is effectively the same as the liqua-tion temperature in the sense of liquation cracking. The detrimental effect ofsulfur and phosphorus on the liquation cracking of nickel-base alloys has beenrecognized (15, 16).The effect of minor alloying elements on the liquation tem-perature of 347 stainless steel is shown in Figure 13.14 (30).
B. Grain Size The coarser the grains are, the less ductile the PMZ becomes.Furthermore, the coarser the grains are, the less the GB area is and hence themore concentrated the impurities or low-melting-point segregates are at theGB, as shown in Figure 13.15. Consequently, a base metal with coarser grainsis expected to be more susceptible to liquation cracking in the PMZ, as shownin Figure 13.16 by Varestraint testing the gas–tungsten arc welds of 6061 alu-minum (12). Thompson et al. (31) showed the effect of the grain size on liqua-tion cracking in Inconel 718 caused by constitutional liquation. Guo et al. (32)showed in Figure 13.17 the effect of both the grain size and the boron contenton the total crack length of electron beam welded Inconel 718 specimens.Figure 13.18 shows liquation cracking in gas–metal arc welds of two Al–4.5%Cu alloys of different grain sizes (33). Cracking is much more severe withcoarse grains.
REMEDIES 333
0 0.16 0.24 0.32 0.402380
2400
2420
2440
2460
2480
1/2%Cb / 30 (%C) + 50 (%N)
Liqu
atio
n te
mpe
ratu
re, o F
1305
1315
1325
1335
1345
1355
Liqu
atio
n te
mpe
ratu
re, o C
0.08
Figure 13.14 Effect of minor alloying elements on liquation temperature of 347 stain-less steel. From Cullen and Freeman (30).

C. Grain Orientation Lippold et al. (34) studied liquation cracking in the PMZ of 5083 aluminum alloy and found that PMZ cracking was more severe in welds made transverse to the rolling direction than those made parallel to the rolling direction. It was suggested that in the latter the elongated grains produced by the action of rolling were parallel to theweld and, therefore, it was more difficult for cracks to propagate into the basemetal.
D. Microsegregation In the welding of as-cast materials, the PMZ is par-ticularly susceptible to liquation cracking because of the presence of
334 DIFFICULTIES ASSOCIATED WITH THE PARTIALLY MELTED ZONE
finer grains
more grainboundary area
lower concentration ofliquation-inducing material
at grain boundary(a)
coarser grains
less grainboundary area
higher concentration ofliquation-inducing material
at grain boundary(b)
Figure 13.15 Effect of grain size on concentration of liquation-causing material atgrain boundaries.
0 2 4 6 8 100
1
2
3
4
5 = 3.0%
Average grain size, d(mm)
Max
imum
cra
ck le
ngth
, Lm
ax(m
m)
ε
Figure 13.16 Effect of grain size on liquation cracking in Varestraint testing of 6061aluminum gas–tungsten arc welds. Reprinted from Miyazaki et al. (12). Courtesy ofAmerican Welding Society.
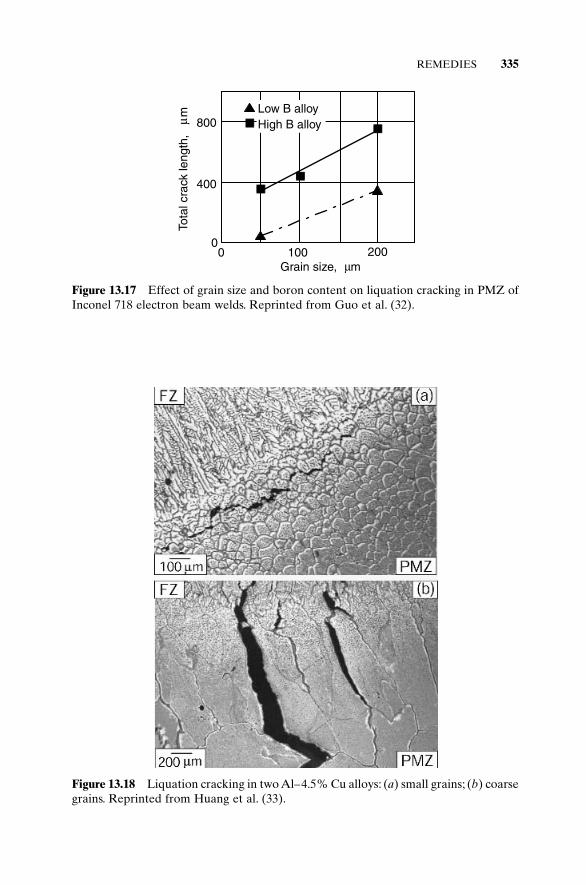
REMEDIES 335
Low B alloyHigh B alloy
0 100 2000
400
800
Grain size, m
Tota
l cra
ck le
ngth
,
m
µ
µ
Figure 13.17 Effect of grain size and boron content on liquation cracking in PMZ ofInconel 718 electron beam welds. Reprinted from Guo et al. (32).
Figure 13.18 Liquation cracking in two Al–4.5% Cu alloys: (a) small grains; (b) coarsegrains. Reprinted from Huang et al. (33).

low-melting-point GB segregates. Upon heating during welding, excessive GBliquation occurs in the PMZ, making it highly susceptible to liquation crack-ing. Figure 13.19 shows liquation cracking in a cast 304 stainless steel (35) anda cast corrosion-resistant austenitic stainless steel (36). It initiates from thePMZ and propagates into the fusion zone.
REFERENCES
1. Aluminum Association, Aluminum Standards and Data, Aluminum Association,Washington, DC, 1982, p. 15.
2. Kreischer, C. H., Weld. J., 42: 49s, 1963.3. Dudas, J. H., and Collins, F. R., Weld. J., 45: 241s, 1966.4. Thompson, R. G., in ASM Handbook, Vol. 6, ASM International, Materials Park,
OH, 1993, p. 566.
336 DIFFICULTIES ASSOCIATED WITH THE PARTIALLY MELTED ZONE
Figure 13.19 Liquation cracking originated from PMZ extending into the fusion zone.(a) Cast 304 stainless steel. Reprinted from Apblett (35). Courtesy of AmericanWelding Society. (b) Cast corrosion-resistant austenitic stainless steel. Reprinted fromCieslak (36).

5. Gittos, N. F., and Scott, M. H., Weld. J., 60: 95s, 1981.6. Cieslak, M. J., in ASM Handbook, Vol. 6: Welding, Brazing and Soldering, ASM
International, Materials Park, OH, 1993, p. 88.7. Savage, W. F., and Dickinson, D. W., Weld. J., 51: 555s, 1972.8. Savage, W. F., and Lundin, C. D., Weld. J., 44: 433s, 1965.9. Lippold, J. C., Nippes, E. F., and Savage, W. F., Weld. J., 56: 171s, 1977.
10. Katoh, M., and Kerr, H. W., Weld. J., 66: 360s, 1987.11. Kerr, H. W., and Katoh, M., Weld. J., 66: 251s, 1987.12. Miyazaki, M., Nishio, K., Katoh, M., Mukae, S., and Kerr, H. W., Weld. J., 69: 362s,
1990.13. Huang, C., and Kou, S., Weld. J., submitted for publication.14. Nelson, T. W., Lippold, J. C., Lin, W., and Baselack III, W. A., Weld. J., 76: 110s, 1997.15. Effects of Minor Elements on the Weldability of High-Nickel Alloys, Welding
Research Council, 1969.16. Methods of High-Alloy Weldability Evaluation, Welding Research Council, 1970.17. Yeniscavich, W., in Methods of High-Alloy Weldability Evaluation, p. 1.18. Kelly, T. J., in Weldability of Materials, Eds. R. A. Patterson and K. W. Mahin, ASM
International, Materials Park, OH, 1990, p. 151.19. Huang, C., and Kou, S., Weld. J., 79: 113s, 2000.20. Huang, C., and Kou, S., Weld. J., 80: 9s, 2001.21. Huang, C., and Kou, S., Weld. J., 80: 46s, 2001.22. Savage, W. F., Nippes, E. F., and Szekeres, E. S., Weld. J., 55: 276s, 1976.23. Metzger, G. E., Weld. J., 46: 457s, 1967.24. Gitter, R., Maier, J., Muller, W., and Schwellinger, P., in Proceedings of the Fifth
International Conference on Aluminum Weldments, Eds. D. Kosteas, R. Ondra, andF. Ostermann, Technische Universita Munchen, Munchen, 1992, pp. 4.1.1–4.1.13.
25. Powell, G. L. F., Baughn, K., Ahmed, N., Dalton J. W., and Robinson, P., in Pro-ceedings of International Conference on Materials in Welding and Joining, Instituteof Metals and Materials Australasia, Parkville, Victoria, Australia, 1995.
26. Ellis, M. B. D., Gittos, M. F., and Hadley, I., Weld. Inst. J., 6: 213, 1997.27. Philips, H. W. L., Annotated Equilibrium Diagrams of Some Aluminum Alloy
Systems, Institute of Metals, London, 1959, p. 67.28. Jennings, P. H., Singer, A. R. E., and Pumphrey, W. I., J. Inst. Metals, 74: 227, 1948.29. Kou, S., and Le, Y., Weld. J., 64: 51, 1985.
30. Cullen, T. M., and Freeman, J. W., J. Eng. Power, 85: 151, 1963.31. Thompson, R. G., Cassimus, J. J., Mayo, D. E., and Dobbs, J. R., Weld. J., 64: 91s,
1985.32. Guo, H., Chaturvedi, M. C., and Richards, N. L., Sci. Technol. Weld. Join., 4: 257,
1999.33. Huang, C., Kou, S., and Purins, J. R., in Proceedings of Merton C. Flemings Sym-
posium on Solidification and Materials Processing, Eds. R. Abbaschian, H. Brody,and A. Mortensen, Minerals, Metals and Materials Society, Warrendale, PA, 2001,p. 229.
REFERENCES 337

34. Lippold, J. C., Nippes, E. F., and Savage, W. F., Weld. J., 56: 171s, 1977.35. Apblett, W. R., and Pellini, W. S., Weld. J., 33: 83s, 1954.36. Cieslak, M. J., in ASM Handbook, Vol. 6: Welding, Brazing and Soldering, ASM
International, Materials Park, OH, 1993, p. 495.
PROBLEMS
13.1 Hot-ductility testing was performed on an 18% Ni maraging steel fol-lowing a thermal cycle with a peak temperature of 1400°C. The on-heating part of the testing showed that the ductility dropped to zero at1380°C (called the nil ductility temperature), and the on-cooling partshowed that the ductility recovered from zero to about 7% at 1360°C.Is this maraging steel very susceptible to liquation cracking? Explainwhy or why not. Do you expect the specimen tensile tested on heatingat 1380°C to exhibit brittle intergranular fracture of ductile transgran-ular dimple fracture? Why? What do you think caused PMZ liquationin this maraging steel?
13.2 (a) The effect of the carbon content and the Mn–S ratio on weld metalsolidification cracking in steels has been described in Chapter 11. It hasbeen reported that a similar effect also exists in the liquation crackingof the PMZ of steels. Explain why. (b) Because of the higher strengthof HY-130 than HY-80, its chemical composition should be more strictlycontrolled if liquation cracking is to be avoided. Assume the followingcontents: HY-80: £0.18 C; 0.1–0.4 Mn; £0.025 S; £0.025 P; HY-130: £0.12C; 0.6–0.9 Mn; £0.010 S; £0.010 P. Do these contents suggest a more strictcomposition control in HY-130?
13.3 Sulfur can form a liquid with nickel that has a eutectic temperature of635°C. Do you expect high-strength alloy steels containing Ni (say morethan 2.5%) to be rather susceptible to liquation cracking due to sulfur?Explain why or why not.
13.4 Low-transverse-frequency arc oscillation (Figure 8.17) has beenreported to reduce PMZ liquation. Sketch both the weld and the PMZbehind the weld pool and show how this can be true.
13.5 Consider the circular-patch weld in Figure 13.3b. Will liquation crack-ing occur if the outer piece is alloy 1100 (essentially pure aluminum)and the inner piece (the circular patch) is alloy 2219 (Al-6.3Cu)?Explain why or why not.
13.6 Like aluminum alloy 7075, alloy 2024 is very susceptible to liquationcracking. In GMAW of alloy 2024 do you expect liquation cracking tobe much more severe with filler metal 4043 or 1100? Why?
338 DIFFICULTIES ASSOCIATED WITH THE PARTIALLY MELTED ZONE

13.7 In a circular-patch test alloy 2219 (Al-6.3Cu) is welded with alloy 2319(Al-6.3Cu) plus extra Cu as the filler metal. The resultant compositionof the weld metal is about Al-8.5Cu. Do you expect liquation crackingto occur? Explain why or why not.
13.8 Do you expect liquation cracking to occur in autogenous GTAW of7075? Why or why not?
PROBLEMS 339

PART IVThe Heat-Affected Zone
Welding Metallurgy, Second Edition. Sindo KouCopyright 2003 John Wiley & Sons, Inc.
ISBN: 0-471-43491-4

14 Work-Hardened Materials
Metals can be strengthened in several ways, including solution hardening, workhardening, precipitation hardening, and transformation hardening. The effec-tiveness of the last three methods can be reduced significantly by heatingduring welding in the area called the heat-affected zone (HAZ), where thepeak temperatures are too low to cause melting but high enough to cause the microstructure and properties of the materials to change significantly.Solution-hardening materials are usually less affected unless they have beenwork hardened and thus will not be discussed separately. This chapter shallfocus on recrystallization and grain growth in the HAZ of work-hardenedmaterials, which can make the HAZ much weaker than the base metal.
14.1 BACKGROUND
When a metal is cold worked and plastically deformed, for instance, cold rolled or extruded, numerous dislocations are generated. These dislocationscan interact with each other and form dislocations tangles. Such dislocationtangles hinder the movement of newly generated dislocations and, hence,further plastic deformation of the metal. In this way, a metal is strengthenedor hardened by cold working. This strengthening mechanism is called workhardening.
14.1.1 Recrystallization
Most of the energy expended in work hardening appears in the form of heatbut, as shown in Figure 14.1, a finite fraction is stored in the material as strainenergy (1). When a work-hardened material is annealed, the deformed grainsin the material tend to recrystallize by forming fresh, strain-free grains thatare soft, just like grains that have not been deformed. The stored strain energyis the driving force for recrystallization of a work-hardened material (2), andthis energy is released as fresh, strain-free grains form. Figure 14.2 shows thevarious stages of recrystallization in a work-hardened brass (3). Slip bands,which have formed during severe work hardening, serve as the nucleation sitesfor new grains.
The extent of recrystallization increases with increasing annealing tempera-ture and time (4). Therefore, it can be expected that the strength or hardness
343
Welding Metallurgy, Second Edition. Sindo KouCopyright 2003 John Wiley & Sons, Inc.
ISBN: 0-471-43491-4

0 10 20 30 400
5
10
15
Fraction of energystored
Stored energy
Percent elongation
Sto
red
ener
gy, c
al/m
ole
Frac
tion
of s
tore
d en
ergy
, %
Figure 14.1 Stored energy and fraction of stored energy as a function of tensile elon-gation during cold working of high-purity copper. From Gordon (l).
Figure 14.2 Deformation and recrystallization structures of a-brass: (a) 33% coldreduction; (b) short anneal at 580°C; (c) longer anneal; (d) completely recrystallized;(e) grain growth. From Burke (3).
344 WORK-HARDENED MATERIALS

of a work-hardened material tends to decrease with increasing annealing temperature and time. Figure 14.3 shows the hardness of a work-hardened cartridge brass as a function of annealing temperature (5).
Table 14.1 summarizes the recrystallization temperature for various metals.For most metals the recrystallization temperature is around 40–50% of theirmelting point in degrees Kelvin (6). It should be pointed out that the recrys-tallization temperature of a metal can be affected by the degree of work hard-ening and the purity level (2).
In fact, before recrystallization takes place, there exists a period of timeduring which certain properties of the work-hardened material, for instance,the electrical resistivity, tend to recover without causing any microstructuralchanges. This phenomenon is called recovery. However, since the mechanicalproperties of the material, such as strength or hardness, do not change sig-nificantly during recovery, recovery is not important in welding.
BACKGROUND 345
20
40
60
80
100
120400 800 1200 1600
200 400 600 800Drawn63%
Tensilestrength
150
300
450
600
750
Annealing temperature, oC
Annealing temperature, oF
Str
engt
h, k
si
Str
engt
h, M
Pa
Figure 14.3 Strength of cartridge brass (Cu–35Zn) cold rolled to an 80% reductionin area and then annealed at various temperatures for 60min. Reprinted from MetalsHandbook (5).
TABLE 14.1 Recrystallization Temperatures forVarious Metals
MinimumRecrystallization Melting
Metal Temperature (°C) Temperature (°C)
Aluminum 150 660Magnesium 200 659Copper 200 1083Iron 450 1530Nickel 600 1452Molybdenum 900 2617Tantalum 1000 3000
Source: Brick et al. (6).

14.1.2 Grain Growth
Upon completion of recrystallization, grains begin to grow. The driving forcefor grain growth is the surface energy. The total grain boundary area and thusthe total surface energy of the system can be reduced if fewer and coarsergrains are present. This can be illustrated by the growth of soap cells in a flatcontainer (7), as shown in Figure 14.4. It should be pointed out that since thedriving force for grain growth is the surface energy rather than the storedstrain energy, grain growth is not limited to work-hardened materials.
Like recrystallization, the extent of grain growth also increases with increas-ing annealing temperature and time. Figure 14.5 shows grain growth in cold-rolled brass as a function of temperature and time (5).
346 WORK-HARDENED MATERIALS
Figure 14.4 Growth of soap cells in a flat container.The numbers indicate growth timein minutes. From Smith (7).
0.080.060.040.030.02
1 10 1004006008001000120014001600
300400500600700800900
Grain size,mm
Duration of annealing, min Ann
ealin
g te
mpe
ratu
re, o F
Ann
ealin
g te
mpe
ratu
re, o C
Figure 14.5 Grain growth of Cu–35Zn brass cold rolled to 63% reduction in area.Reprinted from Metals Handbook (5).

It is worth noting that carbide and nitride particles can inhibit grain growth in steels by hindering the movement of grain boundaries (2). Theseparticles, if not dissolved during welding, tend to inhibit grain growth in theHAZ.
14.2 RECRYSTALLIZATION AND GRAIN GROWTH IN WELDING
The effect of work hardening is completely gone in the fusion zone becauseof melting and is partially lost in the HAZ because of recrystallization andgrain growth. These strength losses should be taken into account in structuraldesigns involving welding.
14.2.1 Microstructure
Figure 14.6 shows the weld microstructure of a work-hardened 304 stainlesssteel (8). The microstructure of the same material before work hardening isalso included for comparison (Figure 14.6a). Recrystallization (Figure 14.6d)and grain growth (Figure 14.6e) are evident in the HAZ. Figure 14.7 showsgrain growth in the HAZ of a molybdenum weld (9). Severe HAZ graingrowth can result in coarse grains in the fusion zone because of epitaxialgrowth (Chapter 7). Fracture toughness is usually poor with coarse grains inthe HAZ and the fusion zone.
RECRYSTALLIZATION AND GRAIN GROWTH IN WELDING 347
Figure 14.6 Microstructure across the weld of a work-hardened 304 stainless steel: (a)before work hardening; (b) base metal; (c) carbide precipitation at grain boundaries;(d) recrystallization; (e) grain growth next to fusion boundary; ( f) fusion zone. Mag-nification 137¥. Reprinted from Metals Handbook (8).

14.2.2 Thermal Cycles
The loss of strength in the HAZ can be explained with the help of thermalcycles, as shown in Figure 14.8. The closer to the fusion boundary, the higherthe peak temperature becomes and the longer the material stays above
348 WORK-HARDENED MATERIALS
Figure 14.7 Grain growth in electron beam weld of molybdenum, arrows indicatingfusion boundary. Reprinted from Wadsworth et al. (9). Copyright 1983 with permissionfrom Elsevier Science.
Tx
3
2
1
1 2 3
1
2
3
(a)
Tem
pera
ture
, T
Str
engt
h or
hard
ness
Distance
Weld
(b)
HAZ
TL
Work-hardenedbase metal
loss ofstrength
Time, t
Figure 14.8 Softening of work-hardened material caused by welding: (a) thermalcycles; (b) strength or hardness profile.

the effective recrystallization temperature, Tx. Under rapid heating duringwelding, the recrystallization temperature may increase because recrystalliza-tion requires diffusion and diffusion takes time. Since the strength of a work-hardened material decreases with increasing annealing temperature and time, the strength or hardness of the HAZ decreases as the fusion boundaryis approached. Figure 14.9 shows the HAZ strength profiles of two work-hardened 5083 aluminum plates (10). It appears that the harder the base metal,the greater the strength loss is.
Grain growth in the HAZ can also be explained with the help of thermalcycles, as shown in Figure 14.10. The closer to the fusion boundary, the higherthe peak temperature becomes and the longer the material stays at high tem-peratures. Since grain growth increases with increasing annealing temperatureand time (Figure 14.5), the grain size in the HAZ increases as the fusionboundary is approached.
14.3 EFFECT OF WELDING PARAMETERS AND PROCESS
The effect of welding parameters on the HAZ strength is explained in Figure14.11. Both the size of the HAZ and the retention time above the effectiverecrystallization temperature Tx increase with increasing heat input per unitlength of the weld, that is, the ratio of heat input to welding speed. Con-sequently, the loss of strength in the HAZ becomes more severe as the heatinput per unit length of the weld is increased. Figure 14.12 shows the effect of
EFFECT OF WELDING PARAMETERS AND PROCESS 349
Distance from weldcenterline, cm
Distance from weldcenterline, in
Yie
ld s
tren
gth,
KS
I
0 2.5 5
0 1 2
H32
H113
10
20
30
40
Yie
ld s
tren
gth,
MP
a
100
200
150
250
Figure 14.9 Yield strength profiles across welds of two work-hardened 5083 alu-minum plates. Reprinted from Cook et al. (10). Courtesy of American Welding Society.

welding parameters on the HAZ strength of a work-hardened 5356-H321 alu-minum alloy (11).
Finally, Figure 14.13 shows the effect of the welding process on the HAZmicrostructure of a work-hardened 2219 aluminum (12). Because of the lowheat input and the high cooling rate in EBW, very little recrystallization isobserved in the HAZ of the work-hardened material. On the other hand,
350 WORK-HARDENED MATERIALS
Time, tWeight %, C
L
S
Tx
Co 3
2
1
1 2 3
1
2 3
(b)(a)
Tem
pera
ture
, T
Gra
in s
ize
Distance
Weld
(c)
HAZT
m
TL
Figure 14.10 Grain growth in HAZ: (a) phase diagram; (b) thermal cycles; (c) grainsize variations.
1
2
3
(a)
(b)(c)
1 2 3
Distance fromweld centerline
0
Str
engt
h or
hard
ness
Incr
easi
ng h
eat
inpu
t per
uni
tle
ngth
of w
eld
1 2 3TL
Tx
Time
Figure 14.11 Effect of heat input per unit length of weld on: (a) width of HAZ(shaded), (b) thermal cycles near fusion boundary, and (c) strength or hardness profiles.

because of the higher heat input and lower cooling rate in GTAW, recrystal-lization and even some grain growth are observed in the HAZ.
REFERENCES
1. Gordon, P., Trans. AIME, 203: 1043, 1955.2. Reed-Hill, R. E., Physical Metallurgy Principles, 2d ed., Van Nostrand, New York,
1973.3. Burke, J. E., in Grain Control in Industrial Metallurgy,American Society for Metals,
Cleveland, OH, 1949.4. Decker, B. F., and Harker, D., Trans. AIME, 188: 887, 1950.
REFERENCES 351
3,940 J/cm (10,000 J/in)
5,905 J/cm(15,000 J/in)
11,810 J/cm (30,000 J/in)
Distance from weld centerline, cm0 2.5
Distance from weld centerline, in
5
0 1 2
Har
dnes
s, R
B
10
20
30
40
50
Figure 14.12 Effect of heat input per unit length of weld on HAZ hardness in a work-hardened 5356 aluminum. Reprinted from White et al. (11). Courtesy of AmericanWelding Society.
Figure 14.13 Microstructure near fusion boundary of a work-hardened 2219-T37 aluminum: (a) electron beam weld; (b) gas–tungsten arc weld. Magnification 80¥.Reprinted from Metals Handbook (12).

5. Metals Handbook, 8th ed., Vol. 2, American Society for Metals, Metals Park, OH,1972, p. 285.
6. Brick, R. M., Pense, A. W., and Gordon, R. B., Structure and Properties of Engi-neering Materials, 4th ed., McGraw-Hill, New York, 1977, p. 81.
7. Smith, C. S., ASM Seminar, Metal Interfaces, ASM, Metals Park, OH, 1952, p. 65.8. Metals Handbook, 8th ed., Vol. 7, American Society for Metals, Metals Park, OH,
1972, p. 135.9. Wadsworth, J., Morse, G. R., and Chewey, P. M., Mater. Sci. Eng., 59: 257 (1983).
10. Cook, L. A., Channon, S. L., and Hard, A. R., Weld. J., 34: 112, 1955.11. White, S. S., Manchester. R. E., Moffatt, W. G., and Adams, C. M., Weld. J., 39: 10s,
1960.12. Metals Handbook, 8th ed., Vol. 7, American Society for Metals, Metals Park, OH,
1972, p. 268.
FURTHER READING
1. Reed-Hill, R. E., Physical Metallurgy Principles, 2nd ed., Van Nostrand, New York,1973.
2. Brick, R. M., Pense,A.W., and Gordon, R. B., Structure and Properties of EngineeringMaterials, 4th ed., McGraw-Hill, New York, 1977.
PROBLEMS
14.1 A 301 stainless steel sheet work-hardened to about 480 Knoop hard-ness was welded, and in the HAZ the hardness droped to a minimumof about 240. Explain the loss of strength in the HAZ. The weld rein-forcement was machined off and the whole sheet including the weld wascold rolled. What was the purpose of cold rolling?
14.2 It is known that bcc is less close-packed than fcc and thus has a higherdiffusion coefficient. Are ferritic stainless steels (bcc at high tempera-tures) more or less susceptible to HAZ grain growth than austeniticstainless steels (fcc at high temperatures)? Explain why.
14.3 Do you expect grain growth during the welding of tantalum (Tm =2996°C) to be more severe than during the welding of Al? Explain why.
352 WORK-HARDENED MATERIALS

15 Precipitation-HardeningMaterials I: Aluminum Alloys
Aluminum alloys are more frequently welded than any other types of nonferrous alloys because of their widespread applications and fairly goodweldability. In general, higher strength aluminum alloys are more susceptibleto (i) hot cracking in the fusion zone and the PMZ and (ii) losses of strength/ductility in the HAZ. Aluminum–lithium alloys and PM (powder metallurgy)aluminum alloys can be rather susceptible to porosity in the fusion zone.Table15.1 summarizes typical problems in aluminum welding and recommendedsolutions. The problems associated with the fusion zone and the PMZ havebeen discussed previously. In this chapter, we shall focus on the HAZ phe-nomena in heat-treatable aluminum alloys, which are strengthened throughprecipitation hardening.Table 15.2 shows the designation for aluminum alloys.As shown, the 2000, 6000, and 7000 series are heat treatable, while the rest arenon–heat treatable.
15.1 BACKGROUND
Aluminum–copper alloys are a typical example of precipitation-hardeningmaterials. As shown in the Al-rich side of the Al–Cu phase diagram in Figure 15.1, the solubility of Cu in the a phase increases with increasing temperature—a necessary criterion for precipitation hardening. Consider theprecipitation hardening of Al–4% Cu as an example. Step 1, solution heattreating, is to heat treat the alloy in the a-phase temperature range until itbecomes a solid solution. Step 2, quenching, is to rapidly cool the solid solu-tion to room temperature to make it supersaturated in Cu. Step 3, aging, is toallow the strengthening phase to precipitate from the supersaturated solidsolution. Aging by heating (e.g., at 190°C) is called artificial aging and agingwithout heating is called natural aging. In the heat-treating terminology, T6and T4 refer to a heat-treatable aluminum alloy in the artificially aged condi-tion and the naturally aged condition, respectively.
Five sequential structures can be identified during the artificial aging ofAl–Cu alloys:
(15.1)Supersaturated solid solution GP Al Cu2Æ Æ ¢¢ Æ ¢ Æ ( )q q q
353
Welding Metallurgy, Second Edition. Sindo KouCopyright 2003 John Wiley & Sons, Inc.
ISBN: 0-471-43491-4

where q (Al2Cu) is the equilibrium phase with a body-centered-tetragonal(bct) structure. The GP zones (Guinier–Preston, sometimes called GP1), theq≤ phase (sometimes called GP2), and the q¢ phase are metastable phases.Figure 15.2 shows the solvus curves of these metastable phases, which repre-sent the highest temperatures these phases can exist (1, 2).
The GP zones are coherent with the crystal lattice of the a solid solution.They consist of disks a few atoms thick (4–6Å) and about 80–100Å in diam-eter, formed on the {100} planes of the solid solutions (3). Since a Cu atom isabout 11% smaller than an Al atom in diameter and the GP zones are richerin Cu than the solid solution, the crystal lattice is strained around the GPzones.The strain fields associated with the GP zones allow them to be detectedin the electron microscope.The q≤ phase is also coherent with the crystal lattice
354 PRECIPITATION-HARDENING MATERIALS I: ALUMINUM ALLOYS
TABLE 15.1 Typical Welding Problems in Aluminum Alloys
SectionsTypical Problems Alloy Type Solutions in book
Porosity Al-Li alloys (severe) Surface scraping or milling 3.2Thermovacuum treatment 10.3Variable-polarity keyhole
PAW
Powder-metallurgy Thermovacuum treatment 3.2alloys (severe) Minimize powder oxidation
and hydration duringatomization and consolidation
Other types (less Clean workpiece and wire 3.2severe) surface
Variable-polarity keyholePAW
Solidification Higher-strength alloys Use proper filler wires and 11.4cracking in FZ (e.g., 2014, 6061, dilution
7075) In autogenous GTA welding, 11.4use arc oscillation or less 7.6susceptible alloys (2219)
Hot cracking and Higher-strength alloys Use low heat inputa 13.1low ductility in Use proper filler wires 13.2PMZ Low-frequency arc oscillation
Softening in HAZ Work-hardened Use low-heat input 14.2materials 14.3
Heat-treatable alloys Use low-heat input 15.2Postweld heat treating 15.3
a Low heat input processes (e.g., EBW, GTAW) or multiple-pass welding with low-heat input ineach pass and low interpass temperature.

355
TAB
LE
15.
2D
esig
nati
on o
f Wro
ught
Alu
min
um A
lloys
Not
Hea
tH
eat
Not
Hea
tN
ot H
eat
Not
Hea
tH
eat
Trea
tabl
eTr
eata
ble
Trea
tabl
eTr
eata
ble
Trea
tabl
eH
eat T
reat
able
Trea
tabl
e
Seri
es10
0020
0030
0040
0050
0060
0070
00
Maj
orN
one
Cu
Mn
SiM
gM
g/Si
Zn
allo
ying
elem
ents
Adv
anta
ges
Ele
ctri
cal/
Stre
ngth
Form
abili
tyFi
ller
Stre
ngth
Stre
ngth
,St
reng
thth
erm
alw
ires
afte
rex
trud
abili
tyco
nduc
tivi
tyw
eldi
ng
Exa
mpl
e11
0022
1930
0340
4350
5260
6170
75

of the solid solution, its size ranging from 10 to 40Å in thickness and 100 to1000Å in diameter. The q¢ phase, on the other hand, is semicoherent with thelattice of the solid solution. It is not related to the GP zones or the q≤ phase;it nucleates heterogeneously, especially on dislocations.The size of the q¢ phaseranges from 100 to 150Å in thickness and 100 to 6000Å or more in diameterdepending on the time and temperature of aging (4). Figure 15.3 shows a trans-mission electron micrograph of the q¢ phase in 2219 aluminum (Al–6Cu) (5).Finally, the q phase, which can either form from q¢ or directly from the solidsolution, is incoherent with the lattice of the solid solution.
Figure 15.4 shows the correlation of these structures with the hardness of Al–4Cu (6). The maximum hardness (or strength) occurs when the amountof q≤ (or GP2) is at a maximum, although some contribution may also be provided by q¢ (6). As q¢ grows in size and increases in amount, the coherentstrains decrease and the alloy becomes overaged. As aging continues evenfurther, the incoherent q phase forms and the alloy is softened far beyond its maximum-strength condition. As shown schematically in Figure 15.5,the lattice strains are much more severe around a coherent precipitate
356 PRECIPITATION-HARDENING MATERIALS I: ALUMINUM ALLOYS
200
400
600
2 4 6 8 10Wt % Cu
Al2
3
1
Tem
pera
ture
, oC Liquid
5.6
α
θ
Figure 15.1 Aluminum-rich side of Al–Cu phase diagram showing the three steps ofprecipitation hardening.
2 4 6 8AlWt % Cu
200
400
600Liquid5.6
''
'
GPTem
pera
ture
, o C
αθ
θθ
Figure 15.2 Metastable solvus curves for GP, q≤, and q¢ in Al–Cu phase diagram. FromHornbogeni (1) and Beton and Rollason (2).

(Figure 15.5b) than around an incoherent one (Figure 15.5c).The severe latticestrains associated with the coherent precipitate make the movement of dis-locations more difficult and, therefore, strengthen the material to a greaterextent.
Similar to Al–Cu alloys, the precipitation structure sequence may be rep-resented as follows for other alloy systems (8):
BACKGROUND 357
Figure 15.3 Transmission electron micrograph of a 2219 aluminum heat treated tocontain q¢ phase. From Dumolt et al. (5).
0.01 0.1 101.0 100 100040
60
80
100
120
140
Aging time, days
Vic
kers
har
dnes
s nu
mbe
r
'
GP[1] 190 oC (374F)
130 oC (266F)
GP[2]
θ
θ
Figure 15.4 Correlation of structures and hardness of Al–4Cu at two aging tempera-tures. From Silcock et al. (6).

(15.2)
(15.3)
(15.4)
where SS denotes the supersaturated solid solution.Table 15.3 shows the com-positions of the commercial aluminum alloys mentioned above (10). It shouldbe pointed out, however, that coherency strains are not observed in the GPzones or b¢ transition stages of precipitation in Al–Mg–Si alloys such as 6061.
Al–Zn–Mg e.g., 7005 SS GP Zn Mg Zn Mg2 2( ) Æ Æ ¢ ( ) Æ ( ): h h
Al–Mg–Si e.g., 6061 SS GP Mg Si Mg Si2 2( ) Æ Æ ¢ ( ) Æ ( ): b b
Al–Cu–Mg e.g., 2024 SS GP S Al CuMg S Al CuMg2 2( ) Æ Æ ¢ ( ) Æ ( ):
358 PRECIPITATION-HARDENING MATERIALS I: ALUMINUM ALLOYS
Figure 15.5 Three types of structure in Al–Cu precipitation hardening: (a) super-saturated solid solution; (b) coherent metastable phase; (c) incoherent equilibriumphase. From Guy (7).
TABLE 15.3 Compositions of Some Heat-TreatableAluminum Alloys
Alloy Si Cu Mn Mg Cr Ni Zn Ti
2014 0.8 4.4 0.8 0.5 — — — —2024 — 4.4 0.6 1.5 — — — —2219 — 6.3 0.3 — — — — 0.066061 0.6 0.3 — 1.0 0.2 — — —7005 — — 0.4 1.4 0.1 — 4.5 0.047039 0.3 0.1 0.2 2.8 0.2 — 4.0 0.17146 0.2 — — 1.3 — — 7.1 0.06
Source: Aluminum Standards and Data (10).

Therefore, it has been suggested that precipitation hardening in such aluminum alloys is due to the increased energy required for the dislocationsto break the Mg–Si bonds as they pass through the precipitate, rather than due to coherency strains (4).
Figure 15.6 shows the precipitation-hardening curves of 6061 aluminum (8).The alloy has been naturally aged at room temperature (T4) before heat treat-ing. The initial strength decrease is due to reversion (dissolution) of the GPzones formed in natural aging.As shown, the higher the temperature, the fasteroveraging occurs and the strength decreases.
15.2 Al–Cu–Mg AND Al–Mg–Si ALLOYS
15.2.1 Welding in Artificially Aged Condition
The 2000-series (Al–Cu–Mg) and 6000-series (Al–Mg–Si) heat-treatablealloys are known to have a tendency to overage during welding, especiallywhen welded in the fully aged condition (T6).
Dumolt et al. (5) studied the HAZ microstructure of 2219 aluminum, abinary Al–6.3Cu alloy. Figure 15.7 shows the transmission electron micro-graphs of a 2219 aluminum plate artificially aged to contain only onemetastable phase, q¢, before welding and preserved in liquid nitrogen afterwelding to inhibit natural aging (5). Since the composition of alloy 2219 isbeyond the maximum solid solubility, large q particles are still present afterheat treating, but the matrix is still a containing fine q¢ precipitate. As shownin the TEM images, the volume fraction of q¢ decreases from the base metalto the fusion boundary because of the reversion of q¢ during welding. Thereversion of q¢ is accompanied by coarsening; that is, a few larger q¢ particles
Al–Cu–Mg AND Al–Mg–Si ALLOYS 359
120oC(250oF)
150oC(300oF)
170oC(340oF)
205oC(400oF)
230oC(450oF)
260oC(500oF)172.5
207
241.5
310.5
276
345
25
30
35
40
45
50
0 0.01 0.1 1 10 100 103 104 105
6061 aluminum
Duration of precipitation heat treatment, hr
Tens
ile s
tren
gth,
MP
a
Tens
ile s
tren
gth,
100
0 ps
i
Figure 15.6 Aging characteristics for 6061-T4 aluminum (9). Modified from MetalsHandbook, vol. 2, 8th edition, American Society for Metals, 1964, p. 276.

grow at the expense of many small ones (middle TEM image). The presenceof such coarse precipitates suggests overaging and hence inability to recoverstrength by postweld artificial aging, as will be discussed later.
The microstructure in Figure 15.7 can be explained with the help of Figure15.8.The base metal is heat treated to contain the q¢ phase. Position 4 is heatedto a peak temperature below the q¢ solvus and thus unaffected by welding.Positions 2 and 3 are heated to above the q¢ solvus and partial reversion occurs.Position 1 is heated to an even higher temperature and q¢ is fully reverted. Thecooling rate here is too high for reprecipitation of q¢ to occur during coolingto room temperature. The q¢ reversion causes the hardness to decrease in theHAZ, which is evident in the as-welded condition (AW). During postweldnatural aging (PWNA), the GP zones form in the solutionized area near posi-tion 1, causing its hardness to increase and leaving behind a hardness minimumnear position 2. During postweld artificial aging (PWAA), q≤ and some q¢ pre-cipitate near position 1 and cause its hardness to increases significantly. How-ever, near position 2, where overaging has occurred during welding due to q¢ coarsening, the hardness recovery is not as much.
A somewhat similar situation is welding a workpiece that has been heattreated to the T6 condition. Figure 15.9 shows the hardness profiles in a 3.2-mm-thick 6061 aluminum autogenous gas–tungsten arc welded in the T6 condition at 10V, 110A, and 4.2mm/s (10 ipm) (11). A hardness minimum isevident after PWNA and especially after PWAA. Malin (12) welded 6061-T6aluminum by pulsed GMAW with a filler metal of 4043 aluminum (essentiallyAl–5Si) and measured the HAZ hardness distribution after postweld natural
360 PRECIPITATION-HARDENING MATERIALS I: ALUMINUM ALLOYS
Figure 15.7 Transmission electron micrographs of a 2219 aluminum artificially agedto contain q¢ before welding. From Dumolt et al. (5).

aging. He observed a hardness minimum similar to the PWNA hardness profilein Figure 15.9, where the peak temperature was 380°C (716°F) during weldingand where failure occurred in tensile testing after welding. He pointed out that the precipitation range for the most effective strengthening phase b¢¢
Al–Cu–Mg AND Al–Mg–Si ALLOYS 361
4
AWPWNA
PWAA
Hardness
Distancefrom weld
Tem
pera
ture
Time TimeConcentration
(a) (b) (c)
(d)
(e)
Weld
HAZ edge
1 2
1
3 '
' reversion
4
' '
3
'
2
α θ θ θ
θθ
α
Figure 15.8 Al–Cu alloy heat treated to contain q ¢ before welding: (a) phase diagram;(b) thermal cycles; (c) reversion of q ¢; (d) microstructure; (e) hardness distribution. qin base metal not shown.
Postweld artificial aging(155 C, 18 hours)Postweld natural aging(7 days)Right after welding
Distance from fusion line, mm0 15 30
50
100
Kno
op h
ardn
ess
(500
g)
o
Figure 15.9 HAZ hardness profiles in a 6061 aluminum welded in T6 condition. FromKou and Le (11).

is 160–240°C (320–464°F) and that for the less effective strengthening phaseb¢ is 240–380°C (464–716°F) (13, 14). He proposed that the losses of hardnessand strength is a result of overaging due to b≤ coarsening and b¢ formation.Malin also observed a sharp hardness decrease immediately outside the fusionboundary (PMZ) and speculated that this was caused by Mg migration intothe Mg-poor weld.
Rading et al. (15) determined the fully naturally aged HAZ hardness pro-files in a 9.5-mm-thick 2095 aluminum (essentially Al–4.3Cu–1.3Li) welded inthe peak aged T8 condition with a 2319 filler metal (Al–6.3Cu), as shown inFigure 15.10. The T8 condition stands for solution heat treating, cold working,followed by artificially aging. The principal strengthening precipitate in the T8condition is T1 (Al2CuLi) while in the naturally aged (T4) condition strength-ening is provided mainly by d¢ (Al3Li) (16). The hardness profiles in Figure15.10 are similar to the PWNA hardness profile in Figure 15.9 except for thesharp decrease near the fusion line (FL). According to TEM micrographs, thehardness minimum at 5mm from the fusion line is due to overaging caused byT1 coarsening during welding, while the hardness peak at 2mm from the fusionline is caused by d¢ precipitation during natural aging. It was proposed that thesharp hardness decrease near the fusion boundary is caused by diffusion of Liinto the Li-poor weld, which reduces the propensity for d¢ precipitation.
15.2.2 Welding in Naturally Aged Condition
Figure 15.11 shows TEM micrographs of a 2219 aluminum heat treated tocontain GP zones alone before welding and preserved in liquid nitrogen after
362 PRECIPITATION-HARDENING MATERIALS I: ALUMINUM ALLOYS
HAZ BMWM
Line1
Line2
Line3
Line4
FL I II III IV
-5 0 5 10 15 20 2550
100
150
250
200
Har
dnes
s (H
V1)
Distance from fusion line (mm)
Figure 15.10 HAZ hardness profiles in a 2095 aluminum welded in T8 condition and measured after natural aging. Reprinted from Rading et al. (15). Courtesy of American Welding Society.
welding to inhibit natural aging (5). The GP zones in the HAZ are easilyreverted during welding because of their small size. Precipitation of q¢ occursin the middle of the HAZ. Figure 15.12 shows the optical micrograph of a 2024aluminum (Al–4.4Cu–1.5Mg) plate that was welded in the T4 (naturally aged)condition (17).The precipitation region in the HAZ is visible as a dark-etchingband.
The microstructure in Figure 15.11 can be explained with the help of Figure15.13. Positions 1–3 are heated to above the solvus of the GP zones, and GPzones are thus reverted. Since position 2 is heated to a maximum temperaturewithin the precipitation temperature of q¢, q¢ precipitates and causes a smallhardness peak right after welding (AW), as shown in Figure 15.13e. Precipita-tion of q ≤, however, is not expected since the time typical of a welding cycleis not sufficient for its formation (18). During PWNA, the hardness increasesslightly in the solutionized area at position 1 because of the formation of theGP zones. During PWAA, the hardness increases significantly in both this areaand the base metal because of q≤ and q¢ precipitation. The hardness recovery,however, is not as good near position 2, where some overaging has occurredduring welding due to q¢ precipitation.
Figure 15.14 shows the results of hardness measurements in a 3.2-mm-thick6061 aluminum gas–tungsten arc welded in the T4 condition at 10V, 110A, and4.2mm/s (10 ipm) (11).A small peak appears in the as-welded condition, whichis still visible after PWNA here but may be less clear in other cases. Similarresults have been reported by Burch (19).
Al–Cu–Mg AND Al–Mg–Si ALLOYS 363
Figure 15.11 Transmission electron micrographs of a 2219 aluminum aged to containGP zones before welding. From Dumolt et al. (5).

Figure 15.12 Precipitation zone in HAZ of a 2024 aluminum welded in naturally agedcondition (weld metal at upper right corner). Reprinted from Arthur (17). Courtesy ofAmerican Welding Society.
GP
1
2
4
1 2 4
AWPWNA
PWAAHardness
Distance from weld
GP
' precipitationGP reversion
Tem
pera
ture
Time TimeConcentration(a) (b) (c)
(d)
(e) HAZ edge
Weld
3
3
"
'
'
' precipitationC-curve
α θ
θ
α
θ
θ
θ
α
Figure 15.13 Al–Cu alloy heat treated to contain GP zones before welding: (a) phasediagram; (b) thermal cycles; (c) precipitation C curves; (d) microstructure; (e) hardnessdistribution. q in base metal not shown.
364 PRECIPITATION-HARDENING MATERIALS I: ALUMINUM ALLOYS

Figure 15.15 shows the results of hardness measurements in a 6061 aluminum (20). It suggests that welding a heat-treatable 6000- or 2000-seriesalloy in the T6 (artificially aged) condition can result in severe loss of strength(hardness) due to overaging. For this reason, welding in the T4 condition isoften preferred to welding in the T6 condition (19, 20).
15.2.3 Effect of Welding Processes and Parameters
The loss of strength in the HAZ can be significantly affected by the weldingprocess and by the heat input and welding speed. Figure 15.16 shows that as
Al–Cu–Mg AND Al–Mg–Si ALLOYS 365
Distance from fusion line, mm0 15 30
50
100
Kno
op h
ardn
ess
(500
g)
Right after welding
Postweld artificialaging (155 C, 18hours)
Postweld naturalaging (7 days)
o
Figure 15.14 HAZ hardness profiles in a 6061 aluminum gas–tungsten arc welded inT4 condition. From Kou and Le (11).
Distance from fusion line, cm0 0.5 1.0 1.5 2.0 2.5
0.2 0.4 0.6 0.8 1.0Distance from fusion line, in
0
Har
dnes
s, D
PH
(50
0g)
60
70
80
90
100
110
T4, Postweld AA
T6, Postweld AA
T6, Postweld NA
T4, Postweld NA
Figure 15.15 HAZ hardness profiles in 6061 aluminum welded in T4 or T6 and postweld naturally or artificially aged. Reprinted from Metzger (20). Courtesy of American Welding Society.
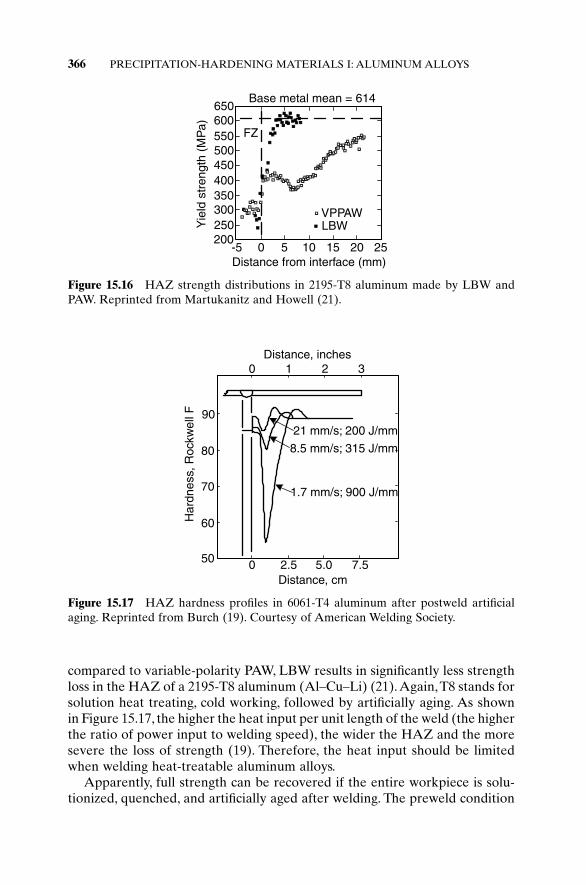
compared to variable-polarity PAW, LBW results in significantly less strengthloss in the HAZ of a 2195-T8 aluminum (Al–Cu–Li) (21). Again, T8 stands forsolution heat treating, cold working, followed by artificially aging. As shownin Figure 15.17, the higher the heat input per unit length of the weld (the higherthe ratio of power input to welding speed), the wider the HAZ and the moresevere the loss of strength (19). Therefore, the heat input should be limitedwhen welding heat-treatable aluminum alloys.
Apparently, full strength can be recovered if the entire workpiece is solu-tionized, quenched, and artificially aged after welding. The preweld condition
366 PRECIPITATION-HARDENING MATERIALS I: ALUMINUM ALLOYS
Base metal mean = 614
FZ
VPPAWLBW
Distance from interface (mm)
Yie
ld s
tren
gth
(MP
a)
-5 0 5 10 15 20 25200250300350400450500550600650
Figure 15.16 HAZ strength distributions in 2195-T8 aluminum made by LBW andPAW. Reprinted from Martukanitz and Howell (21).
Distance, cm
21 mm/s; 200 J/mm
8.5 mm/s; 315 J/mm
1.7 mm/s; 900 J/mm
0
0Distance, inches
1 2 3
2.5 5.0 7.550
60
70
80
90
Har
dnes
s, R
ockw
ell F
Figure 15.17 HAZ hardness profiles in 6061-T4 aluminum after postweld artificialaging. Reprinted from Burch (19). Courtesy of American Welding Society.

can be either solution heat treated or fully annealed, although the latter issomewhat inferior due to its poor machinability (18). However, for largewelded structures heat-treating furnaces may not be available. In addition,distortion of the welded structure developed during postweld solution heattreating and quenching may be unacceptable.
15.3 Al–Zn–Mg ALLOYS
The age hardening of Al–Zn–Mg alloys is quite different from that of either6000- or 2000-series aluminum alloys. As shown in Figure 15.18, alloy 7005(Al–4.5Zn–1.2Mg) ages much more slowly than alloy 2014 (Al–4.5Cu–0.6Mg)(22). In fact, Al–Zn–Mg alloys, such as 7005, 7039, and 7146, age much moreslowly than either 6000- or 2000-series aluminum alloys. As a result,Al–Zn–Mg alloys have a much smaller tendency to overage during weldingthan the other alloys. Furthermore, unlike 6000- or 2000-series aluminumalloys, Al–Zn–Mg alloys recover strength slowly but rather significantly bynatural aging. For these reasons Al–Zn–Mg alloys are attractive when post-weld heat treatment is not practical. Figure 15.19 shows the hardness profilesin alloy 7005 after welding (23). Welding such an alloy in its naturally agedcondition is most ideal since the strength in the HAZ can be recovered almost
Al–Zn–Mg ALLOYS 367
20oC
100oC150oC
200oC
100oC
20oC
120oC
130oC
15 30 60 120 180
30
34
38
42
60
70
80
90
100
0 1 10 100 1000
Time, hr
Time, hr
Tens
ile s
tren
gth
b
x 9.
8, N
/mm
2
Har
dnes
s, R
ockw
ell F (b)
(a)σ
Figure 15.18 Aging characteristics of heat-treatable aluminum alloys: (a)Al–4.5Cu–0.6Mg quenched from 500°C; (b) Al–4.5Zn–1.2Mg quenched from 450°C(22).
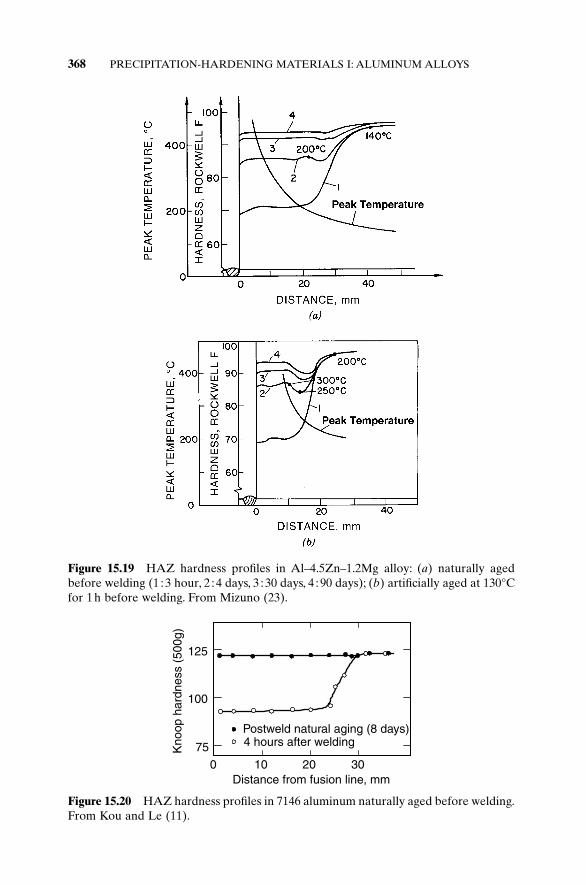
368 PRECIPITATION-HARDENING MATERIALS I: ALUMINUM ALLOYS
Figure 15.19 HAZ hardness profiles in Al–4.5Zn–1.2Mg alloy: (a) naturally agedbefore welding (1 :3 hour, 2 :4 days, 3 :30 days, 4 :90 days); (b) artificially aged at 130°Cfor 1h before welding. From Mizuno (23).
Postweld natural aging (8 days)4 hours after welding
0 10 20 30Distance from fusion line, mm
Kno
op h
ardn
ess
(500
g)
75
100
125
Figure 15.20 HAZ hardness profiles in 7146 aluminum naturally aged before welding.From Kou and Le (11).

completely by postweld natural aging. Figure 15.20 shows similar results inalloy 7146 (Al–7.1Zn–1.3Mg) (11).
Similar to the welding of 6000- or 2000-series alloys, excessive heat inputsshould be avoided in welding Al–Zn–Mg alloys in the artificially aged condi-tion. Figure 15.21 shows the hardness profiles in the HAZ of alloy 7039 arti-ficially aged before welding (24).As shown, the loss of strength can be reducedsignificantly by increasing the number of passes (thus decreasing the heat inputin each pass) and maintaining a low interpass temperature.
Welding a heat-treatable aluminum alloy in the annealed condition isalmost the opposite of welding it in the aged condition. Figure 15.22 shows thehardness profiles in an annealed heat-treatable aluminum alloy after welding(11). The base metal is relatively soft because of annealing. The HAZ is solu-tionized during welding and thus gets stronger by solution strengthening,as evident from the hardness increase in the HAZ after welding. The further
Al–Zn–Mg ALLOYS 369
Figure 15.21 HAZ hardness profiles in 3-cm-thick artificially aged 7039 aluminum:(a) 4 passes, continuous welding; (b) 16 passes, 150°C interpass temperature. Reprintedfrom Kelsey (24). Courtesy of American Welding Society.

hardness increases in the HAZ after natural aging are consistent with theremarkable ability of Al–Zn–Mg alloys to gain strength by natural aging.
15.4 FRICTION STIR WELDING OF ALUMINUM ALLOYS
Friction stir welding is a solid-state joining process developed at the WeldingInstitute (25). As shown in Figure 15.23a, a rotating cylindrical tool with aprobe is plunged into a rigidly clamped workpiece and traversed along thejoint to be welded. Welding is achieved by plastic flow of frictionally heatedmaterial from ahead of the probe to behind it. For welding aluminum alloys,the tool is usually made of tool steel. As shown in Figure 15.23b, the resultantweld consists of three zones: thermally affected zone, thermomechanicallyaffected zone, and dynamically recrystallized zone. In the thermally affectedzone the grain structure is not affected by welding. In the thermomechanicallyaffected zone, however, the grains are severely twisted. In the dynami-cally recrystallized zone, which is also called the weld nugget, all old grains
370 PRECIPITATION-HARDENING MATERIALS I: ALUMINUM ALLOYS
Distance from fusion line, mm
Kno
op h
ardn
ess
(500
g)
0 10 20 30
75
100
125
4 hours after welding
Postweld naturalaging (8 days)
Postweld natural aging(30 days)
Figure 15.22 HAZ hardness profiles in alloy 7146 welded in annealed condition. FromKou and Le (11).
friction stir weld
dynamicallyrecrystallized zone
thermomechanicallyaffected zone
thermally affected zone
(b)
workpiece
probe
rotatingtool welding
direction
joint
(a)
toolshoulder
Figure 15.23 Friction stir welding: (a) process; (b) transverse cross section of resultant weld.

disappear and numerous small new grains recrystallize. As in the HAZ infusion welds of precipitation-hardened aluminum alloys, heating duringwelding can cause considerable loss of strength. Reversion of precipitate,overaging, and solutionizing occur during welding, from near the base metalto the weld centerline. Figure 15.24 shows a typical hardness distribution inprecipitation-hardened aluminum alloys (26).
REFERENCES
1. Hornbogen, E., Aluminum, 43(part 11): 9, 1967.2. Beton, R. H., and Rollason, E. C., J. Inst. Metals, 86: 77, 1957–58.3. Nutting, J., and Baker, R. G., The Microstructure of Metals, Institute of Metals.
London, 1965, pp. 65, 67.4. Smith, W. F., Structure and Properties of Engineering Alloys, McGraw-Hill, New
York, 1981.5. Dumolt, S. D., Laughlin, D. E., and Williams, J. C., in Proceedings of the First Inter-
national Aluminum Welding Conference, Welding Research Council, New York,p. 115.
6. Silcock, J. M., Heal, J. J., and Hardy, H. K., J. Inst. Metals, 82: 239, 1953.7. Guy, A. G., Elements of Physical Metallurgy, Addison-Wesley, Reading, MA, 1959.8. Hundicker, H. Y., in Aluminum, Vol. 1, American Society for Metals, Metals Park,
OH, 1967, Chapter 5, p. 109.9. Metals Handbook, vol. 2, 8th edition, American Society for Metals, Metals Park,
OH, 1964, p. 276.10. Aluminum Standards and Data, Aluminum Association, New York, 1976, p. 15.11. Kou, S., and Le. Y., unpublished research, Carnegie-Mellon University, Pittsburgh,
PA, 1982.12. Malin, V., Weld. J., 74: 305s, 1995.13. Panseri, C., and Federighi, T., J. Inst. Metals, 94: 94, 1966.14. Miyauchi, T., Fujikawa, S., and Hirano, K., J. Jpn. Inst. Light Metals, 21: 595, 1971.15. Rading, G. O., Shamsuzzoha, M., and Berry, J. T., Weld. J., 77: 411s, 1998.
REFERENCES 371
Distance from weld centerline, mm
160
140
120
100
0 5 10 15-10-15 -5
Vic
kers
mic
roha
rdne
ss(V
HN
)2024 Al
Figure 15.24 Hardness profile across friction stir weld of an artificially aged alloy 2024(26). The arrows indicate the weld nugget.

16. Langan, T. J., and Pickens, J. R., in Aluminum-Lithium Alloys, Vol. II, Eds. T. H.Sanders, Jr. and E. A. Starke, Jr., Materials and Component Engineering Publica-tions, Birmingham, UK, p. 691.
17. Arthur, J. B., Weld. J., 34: 558s, 1955.18. Introductory Welding Metallurgy, American Welding Society, Miami, FL, 1968,
p. 65.19. Burch, W. L., Weld. J., 37: 361s, 1958.20. Metzger, G. E., Weld. J., 46: 457s, 1967.21. Martukanitz, R. P., and Howell, P. R., in Trends in Welding Research, Eds. H. B.
Smartt, J. A. Johnson, and S. A. David, ASM International, Materials Park, OH,1996, p. 553.
22. Principles and Technology of the Fusion Welding of Metals, Vol. 2, MechanicalEngineering Publishing Co., Peking, China, 1981 (in Chinese).
23. Mizuno, M., Takada, T., and Katoh, S., J. Japanese Welding Society, vol. 36, 1967,pp. 74–81.
24. Kelsey, R. A., Weld. J., 50: 507s, 1971.25. Dawes, C. J., Friction Stir Welding of Aluminum, IIW-DOC XII-1437-96, 1996,
pp. 49–57.26. Murr, L. E., Li, Y., Trillo, E. A., Nowak, B. M., and McClure, J. C., Alumin. Trans.,
1(1), 141–154, 1999.27. A. Umgeher and H. Cerjak, in Recent Trends in Welding Science and Technology,
Eds. S. A. David and J. M. Vitek, ASM International, Materials Park, OH, 1990,p. 279.
FURTHER READING
1. Aluminum, edited by J. E. Hatch, American Society for Metals, Metals Park, OH,1984.
2. Mondolfo, L. F., Aluminum Alloys: Structure and Properties, Butterworths, London,1976.
3. Polmear, I. J., Light Alloys, Edward Arnold, London, 1981.4. Smith, W. F., Structure and Properties of Engineering Alloys. McGraw-Hill, New
York, 1981.
PROBLEMS
15.1 A reciprocal relationship between the tensile strength of 2219 alu-minum (essentially Al–6.3Cu) weldments and the heat input per unitlength of weld per unit thickness has been observed. Explain why.
15.2 (a) Based on the results of mechanical testing for 2219 aluminumgiven in Table P15.2, comment on the effect of postweld heat treat-ment on the tensile strength.
372 PRECIPITATION-HARDENING MATERIALS I: ALUMINUM ALLOYS

(b) The bend angle (i.e., the maximum angle the specimen can be bentprior to failure) is an indication of the ductility of the material.Does the weld ductility seem to recover as effectively as the tensilestrength? Explain why or why not.
15.3 A 12.7-mm-thick plate of 6061-T6 aluminum (TL = 652°C) was gas–tungsten arc welded with DC electrode negative. The welding para-meters were I = 222A, E = 10.4V, and V = 5.1mm/s. Microhardness measurements after welding indicated that softening due to overagingstarts about 5.3mm from the fusion line and gradually increases as thefusion line is approached. Thermal measurements during weldingrevealed a peak temperature of about 300°C at the position where soft-ening started. Calorimetric measurements showed that the arc efficiencywas around 80%. How does the width of the HAZ compare with thatpredicted from Adams’s equation (Chapter 2)?
15.4 Figure P15.4 show the hardness distributions measured by Umgeher andCerjak (27) in 7075 aluminum after natural aging three months at roomtemperature (pwna), after artificial aging (pwaa), and after full postweld
PROBLEMS 373
TABLE P15.2 2219 Aluminum
Tensile Strength Bend AngleTest Specimen Procedure (N/mm2) (deg)
Base metal SS 320 180SS + AA 412 121
Weldment SS + welding 254 64SS + AA + welding 287 54SS + welding + AA 300 44SS + welding + SS + AA 373 84AN + welding + SS + AA 403 93
Abbreviations: SS, solid solution; AA, artificial aging; AN, annealing.
10 20 30 40080
120
160
distance from fusion line, mmpe
ak te
mpe
ratu
r e, o
C
hard
ness
, HV
5
600
400
200
0
pwna
pwaa
pwsh
peak temp
Figure P15.4

heat treatment of solutionizing, quenching, and then artificial aging(pwsh). Indicate the temperature ranges in which overaging and solu-tionizing occur during welding. Explain how these hardness distribu-tions compare with each other.
15.5 Al–Li–Cu alloy 2095 was welded by LBW, GTAW, and GMAW and theHAZ hardness profiles of the resultant welds were measured. Rank thewelds in the order of increasing hardness in the HAZ.
15.6 Al–Li–Cu alloy 2090 was welded with various filler metals such as 2319,2090, 4047, and 4145. Joint efficiencies up to 65% of base-metal strengthwere obtained in the as-welded condition. After postweld solution heattreatment and artificial aging, joint efficiencies up to 98% wereobtained. Explain why.
15.7 Sketch the hardness profiles in the following aluminum alloys after friction stir welding: (a) artificially aged 2219; (b) work-hardened 5083.
374 PRECIPITATION-HARDENING MATERIALS I: ALUMINUM ALLOYS
16 Precipitation-HardeningMaterials II: Nickel-Base Alloys
Because of their high strength and good corrosion resistance at high temperatures, Ni-base alloys have become the most extensively used high-temperature alloys.Table 16.1 summarizes typical welding problems in Ni-basealloys and recommended solutions. The problems associated with the fusionzone and the PMZ have been discussed previously. In this chapter, we shallfocus on weakening the HAZ and postweld heat treatment cracking in heat-treatable Ni-base alloys.
16.1 BACKGROUND
Table 16.2 shows the chemical compositions of several representative heat-treatable Ni-base alloys (1, 2). Aluminum and Ti are the two major pre-cipitation-hardening constituents in heat-treatable Ni-base alloys, equivalentto Cu in heat-treatable Al–Cu alloys. As can be seen in Figure 16.1, the solu-bility of Ti or Al in the g phase increases significantly with increasing temper-ature—a necessary criterion for precipitation hardening as in Al–Cu alloys (3).
Like heat-treatable Al alloys, the precipitation hardening of heat-treatable Ni-base alloys can be obtained by solutionizing at temperaturesabove the solvus, followed first by water quenching and then by artificial agingin the precipitation temperature range. In mill practice, however, the alloys areusually air cooled from the solutionizing temperature (usually in the range1040–1180°C, or 1900–2150°F) to an intermediate aging temperature and heldthere for a number of hours before being further air cooled to a final agingtemperature of about 760°C (1400°F). After aging at this final temperature forabout 16h, the alloys can be air cooled to room temperature. For best resultssome alloys are aged at two, rather than one, intermediate temperatures. Forexample, both Udimet 700 and Astroloy are sometimes aged first at 980°C(1975°F) for 4h, then at 815°C (1500°F) for 24h before the 16-h final aging at 760°C (1400°F). For applications at low temperatures, the aging operationcan be carried out solely at 760°C (1400°F) to avoid grain boundary carbideprecipitation (2, 4).
The precipitation reaction to form the strengthening phase g ¢ can be writtenas follows (2):
375
Welding Metallurgy, Second Edition. Sindo KouCopyright 2003 John Wiley & Sons, Inc.
ISBN: 0-471-43491-4
376 PRECIPITATION-HARDENING MATERIALS II: NICKEL-BASE ALLOYS
TABLE 16.1 Typical Problems in Welding Nickel-Base Alloys
Sections inTypical Problems Alloy Types Solutions Book
Low strength in Heat-treatable Resolution and artificial aging 16.2HAZ alloys after welding
Reheat cracking Heat-treatable Use less susceptible gradealloys (Inconel 718)
Heat treat in vacuum or inertatmosphere
Welding in overaged condition 16.3(good for Udimet 500)
Rapid heating through criticaltemperature range, if possible
Hot cracking in PMZ All types Reduce restraint 13.1Avoid coarse-grain structure 13.2
and Laves phase
TABLE 16.2 Composition of Heat-Treatable Nickel-Base Superalloys
Alloy C Cr Co W Mo Al Ti Others
Inconel X-750 0.04 16 — — — 0.6 2.5 7Fe, 1CbWaspaloy 0.07 19 14 — 3 1.3 3.0 0.1ZrUdimet 700 0.10 15 19 — 5.2 4.3 3.5 0.02BInconel 718 0.05 18 — — 3 0.6 0.9 18Fe, 5CbNimonic 80A 0.05 20 <2 — — 1.2 2.4 <5FeMar-M200 0.15 9 10 12 — 5.0 2.0 1Cb, 2HfRene 41 0.1 20 10 — 10 1.5 3.0 0.01B
Source: Owczarski (1) and Sims (2).
(16.1)
where g is a fcc matrix while g ¢, the precipitate, is an ordered fcc intermetal-lic compound. The Ni3(Al,Ti) is only the abbreviation of g ¢; the exact compo-sition of g ¢ can be much more complicated. For example, the compositions ofg ¢ in Inconel 713C and IN-731 have been determined to be (5)
(Ni0.980Cr0.004Mo0.004)3(Al0.714Cb0.099Ti0.048Mo0.038Cr0.103)g ¢ in Inconel 713C
and
(Ni0.884Co0.070Cr0.032Mo0.008V0.003)3(Al0.632Ti0.347V0.013Cr0.006Mo0.002)g ¢ in IN-731
Ni, Cr, Co, Mo, Al, Ti Ni Al, Ti Cr, Co, Mo
matrix components3( ) Æ ( )
¢+ ( )
g g1 24444 34444 1 24 34 1 244 344

The precipitate g ¢ can assume several different shapes, such as spherical,cubical, and elongated. Figure 16.2 shows examples of cubical and spherical g ¢precipitates in two different Ni-base alloys (6). It is interesting to note that,after the general precipitation of the dominant g ¢ particles, very fine g ¢ parti-cles can further precipitate during cooling to room temperature. Such g ¢, called“cooling g ¢,” often generates roughening of the g matrix. It should be pointedout here that the precipitation of g ¢ depletes the surrounding g matrix of Aland Ti and results in a decrease in the lattice parameter of the matrix. Thisdecrease creates the so-called aging contraction, which has been reported tobe of the order of 0.1% (0.001 in./in.) in Rene 41 and 0.05% (0.0005 in./in.) inInconel X-750 (7). As will be mentioned later in this chapter, the contraction
BACKGROUND 377
Figure 16.1 Effect of alloying elements on the solvus temperature of g ¢: (a) Ti; (b) Al.From Betteridge (3).
Figure 16.2 g ¢ in Ni-base alloys: (a) cubical g ¢ in IN-100 (magnification 13,625¥);(b) spherical and cooling g ¢ in U500 (magnification 5450¥). From Decker and Sims (6).
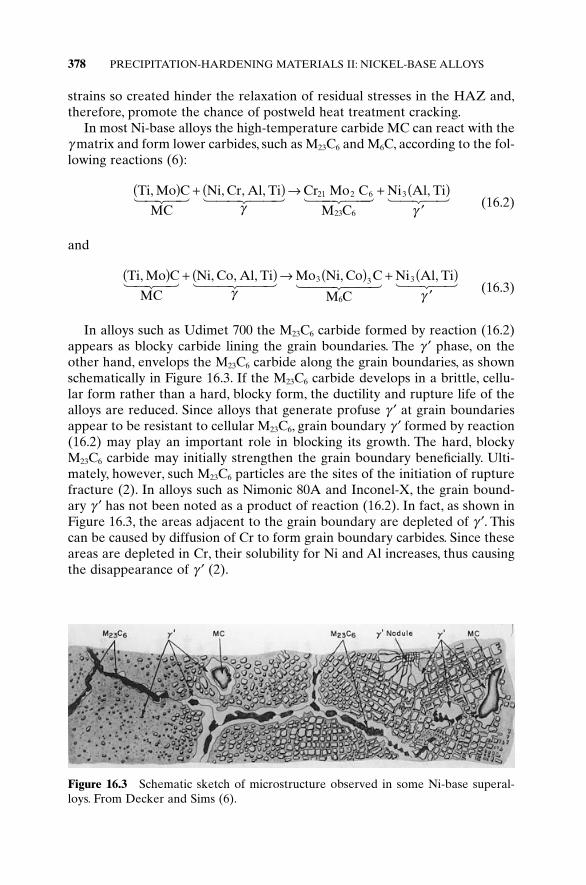
strains so created hinder the relaxation of residual stresses in the HAZ and,therefore, promote the chance of postweld heat treatment cracking.
In most Ni-base alloys the high-temperature carbide MC can react with theg matrix and form lower carbides, such as M23C6 and M6C, according to the fol-lowing reactions (6):
(16.2)
and
(16.3)
In alloys such as Udimet 700 the M23C6 carbide formed by reaction (16.2)appears as blocky carbide lining the grain boundaries. The g ¢ phase, on theother hand, envelops the M23C6 carbide along the grain boundaries, as shownschematically in Figure 16.3. If the M23C6 carbide develops in a brittle, cellu-lar form rather than a hard, blocky form, the ductility and rupture life of thealloys are reduced. Since alloys that generate profuse g ¢ at grain boundariesappear to be resistant to cellular M23C6, grain boundary g ¢ formed by reaction(16.2) may play an important role in blocking its growth. The hard, blockyM23C6 carbide may initially strengthen the grain boundary beneficially. Ulti-mately, however, such M23C6 particles are the sites of the initiation of rupturefracture (2). In alloys such as Nimonic 80A and Inconel-X, the grain bound-ary g ¢ has not been noted as a product of reaction (16.2). In fact, as shown inFigure 16.3, the areas adjacent to the grain boundary are depleted of g ¢. Thiscan be caused by diffusion of Cr to form grain boundary carbides. Since theseareas are depleted in Cr, their solubility for Ni and Al increases, thus causingthe disappearance of g ¢ (2).
Ti, Mo C
MC
Ni, Co, Al, Ti Mo Ni, Co C
M C
Ni Al, Ti3
6
3( ) + ( ) Æ ( ) + ( )¢
1 24 34 1 244 344 1 244 344 1 24 34g g
3
Ti, Mo C
MC
Ni, Cr, Al, Ti Cr Mo C
M C
Ni Al, Ti21 2
23 6
3( ) + ( ) Æ + ( )¢
1 24 34 1 244 344 1 244 344 1 24 34g g
6
378 PRECIPITATION-HARDENING MATERIALS II: NICKEL-BASE ALLOYS
Figure 16.3 Schematic sketch of microstructure observed in some Ni-base superal-loys. From Decker and Sims (6).

From the above discussion it is clear that the high strength of heat-treatable Ni-base alloys is due primarily to the precipitation hardening of g ¢and the resistance to grain boundary sliding provided by carbides. However,Inconel 718 is an exception. It utilizes niobium (Nb) as its primary strength-ening alloying element, and g ≤ (an ordered bct intermetallic compound ofcomposition Ni3Nb) rather than g ¢ is responsible for precipitation hardeningduring aging.
In addition to g ¢, g ≤, and carbides, a group of phases called topologicallyclose packed phases can also be present in certain Ni-base alloys where com-position control has not been carefully watched (6). Such phases, for instance,s and m, often appear as hard, thin plates and thus promote lowered rupturestrength and ductility. However, in most Ni-base alloys such undesired phasesdo not usually appear, unless significant alteration of the matrix compositionhas occurred as a result of extensive exposure in the aging temperature range.Therefore, they are not of great concern during welding (4). Nevertheless, itshould be pointed out that the presence of the Laves phase, which is also atopologically close packed phase, has been reported to promote hot crackingin Inconel 718 and A-286 due to its lower melting point (8–10).
Like heat-treatable Al alloys, heat-treatable Ni-base alloys can also overage.As seen in Figure 16.4a, the optimum aging temperature for Inconel X-750 isaround 760°C (1400°F), above which it tends to overage. The aging charac-teristics of several heat-treatable Ni-base alloys at this temperature are shownin Figure 16.4b. Inconel 718, which is precipitation hardened by g ≤, ages muchmore slowly than other alloys. As will be discussed later in this chapter, theslow aging characteristic of Inconel 718 makes it more resistant to crackingduring postweld heat treatment.
16.2 REVERSION OF PRECIPITATE AND LOSS OF STRENGTH
Consider welding a heat-treatable Ni-base alloy in the aged condition, asshown in Figure 16.5. The area adjacent to the weld is heated above the pre-cipitation temperature range of g ¢. Reversion of g ¢ ranges from partial rever-sion near the edge of the HAZ (point 2) to full reversion near the fusionboundary (point 1). This g ¢ reversion causes loss of hardness or strength in theHAZ.
16.2.1 Microstructure
Owczarski and Sullivan (13) studied the reversion of the strengthening pre-cipitates in the HAZ of Udimet 700 during welding. This material was in thefull aged condition produced by the following heat treatment before welding:
1165°C/4h + air cool (solution)1080°C/4h + air cool (primary age)
REVERSION OF PRECIPITATE AND LOSS OF STRENGTH 379

845°C/4h + air cool (intermediate age)760°C/16h + air cool (final age)
The resultant HAZ microstructure is shown in Figure 16.6. The unaffectedbase metal consists of coarse angular g ¢ and fine spherical g ¢ between thecoarse g ¢ (Figure 16.6a). The initial stage of reversion just inside the HAZ ischaracterized by the disappearing of the fine g ¢ and the rounding of the coarseangular g ¢ (Figure 16.6b). Further reversion of coarse g ¢ is evident in themiddle of the HAZ (Figure 16.6c). Since this material is highly alloyed with
380 PRECIPITATION-HARDENING MATERIALS II: NICKEL-BASE ALLOYS
Figure 16.4 Aging characteristics of Ni-base alloys. (a) Inconel X-750. From Eiselstein (11). (b) Some other Ni-base alloys. Reprinted from Wilson and Burchfield(12). Courtesy of American Welding Society.
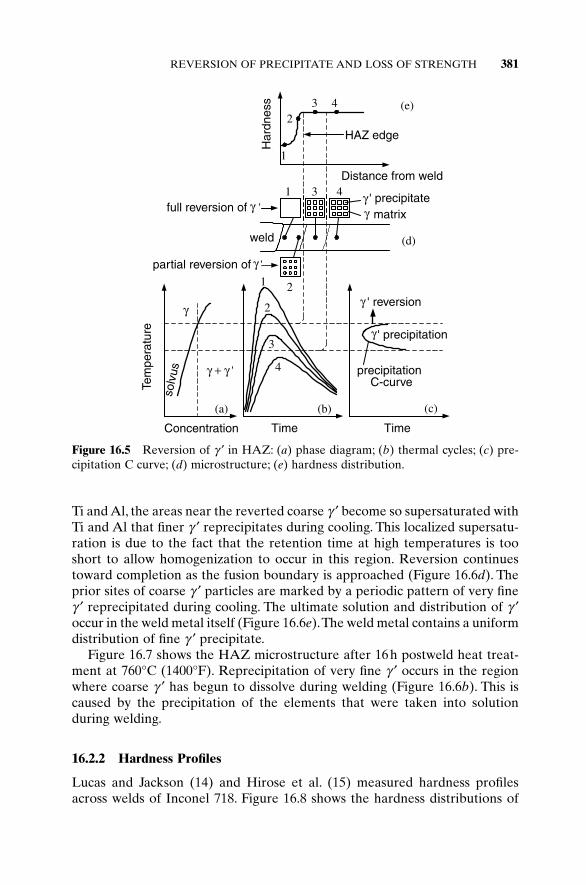
Ti and Al, the areas near the reverted coarse g ¢ become so supersaturated withTi and Al that finer g ¢ reprecipitates during cooling. This localized supersatu-ration is due to the fact that the retention time at high temperatures is tooshort to allow homogenization to occur in this region. Reversion continuestoward completion as the fusion boundary is approached (Figure 16.6d). Theprior sites of coarse g ¢ particles are marked by a periodic pattern of very fineg ¢ reprecipitated during cooling. The ultimate solution and distribution of g ¢occur in the weld metal itself (Figure 16.6e).The weld metal contains a uniformdistribution of fine g ¢ precipitate.
Figure 16.7 shows the HAZ microstructure after 16h postweld heat treat-ment at 760°C (1400°F). Reprecipitation of very fine g ¢ occurs in the regionwhere coarse g ¢ has begun to dissolve during welding (Figure 16.6b). This iscaused by the precipitation of the elements that were taken into solutionduring welding.
16.2.2 Hardness Profiles
Lucas and Jackson (14) and Hirose et al. (15) measured hardness profilesacross welds of Inconel 718. Figure 16.8 shows the hardness distributions of
REVERSION OF PRECIPITATE AND LOSS OF STRENGTH 381
Concentration
Tem
pera
ture
matrix
1
2
3
1
23 4
Distance from weld
weld
TimeTime
' precipitation
(a) (b) (c)
(d)
(e)
1
2
3
4
4
HAZ edge
' reversion
partial reversion of '
full reversion of ' ' precipitate
'
Har
dnes
s
precipitationC-curve
solv
us
γγγ
γ
γ
γ + γ
γ
γ
Figure 16.5 Reversion of g ¢ in HAZ: (a) phase diagram; (b) thermal cycles; (c) pre-cipitation C curve; (d) microstructure; (e) hardness distribution.

382 PRECIPITATION-HARDENING MATERIALS II: NICKEL-BASE ALLOYS
Figure 16.6 Microstructure of Udimet 700 weld: (a) as-received material (magnifica-tion 10,000¥); (b) initial solution of fine g ¢; (c) further solution of coarse g ¢; (d)advanced stage of solution of coarse g ¢; (e) weld metal containing fine g ¢. (b–d). Mag-nification 15,000¥. Reprinted from Owczarski and Sullivan (13). Courtesy of AmericanWelding Society. Reduced to 84% in reproduction.
Hirose et al. (15) in Inconel 718 laser and gas–tungsten arc welded in the as-welded condition. The solutionized and laser-welded (SL) workpiece was notmuch affected by welding. The workpiece solutionized, aged, and laser welded(AL), however, became much softer in the HAZ. This is because of precipi-tate reversion in the HAZ and the fusion zone. The HAZ is much narrowerin the laser weld (AL) than in the gas–tungsten arc weld (AT) because of thelower heat input used in the former. Aging after welding helped achieve themaximum hardness, either aged after welding or solutionized and then agedafter welding, as shown in Figure 16.9.

REVERSION OF PRECIPITATE AND LOSS OF STRENGTH 383
Figure 16.7 HAZ of Udimet 700 showing reprecipitation of fine g ¢ in region wherecoarse g ¢ begins to dissolve. Magnification 16,000¥. Reprinted from Owczarski and Sullivan (13). Courtesy of American Welding Society.
Weld metal
SLALV
icke
rs h
ardn
ess,
Hv
(load
: 1.9
6N)
0 2 4 6 8 10200
250
300
350
400
450
500(a)
HAZ
Weldmetal
STAT
0 2 4 6 8 10
(b)
HAZ
Distance from weld centerline, mm
Vic
kers
har
dnes
s,H
v (lo
ad: 1
.96N
)
200
250
300
350
400
450
500
Distance from weld centerline, mm
Figure 16.8 Hardness profiles in Inconel 718 welds in as-welded condition: (a) laserwelds; (b) gas–tungsten arc welds. S: solutionized; A: aged after solutionization; L: laserwelded; T: gas–tungsten arc welded. Broken line indicates fusion line. From Hirose et al. (15).

16.3 POSTWELD HEAT TREATMENT CRACKING
Cracking can occur during the postweld heat treatment of heat-treatable Ni-base alloys. Hot cracking in both the fusion zone and the partially melted zoneof heat-treatable Ni-base alloys (8, 14, 16–28) are similar to those in othermaterials (Chapters 11–13) and will not be discussed separately here.
16.3.1 Reasons for Postweld Heat Treatment
Heat-treatable Ni-base alloys are often postweld heat treated for two reasons:(i) to relieve stress, and (ii) to develop the maximum strength. To develop itsmaximum strength, the weldment is first solutionized and then aged. Duringsolutionization the residual stresses in the weldment are also relieved. Theproblem is that aging may occur in the weldment while it is being heated upto the solutionization temperature because the aging temperature range isbelow the solutionization temperature. Since this aging action occurs beforethe residual stresses are relieved, it can cause cracking during postweld heattreatment. Such postweld heat treatment cracking is also called strain-age
384 PRECIPITATION-HARDENING MATERIALS II: NICKEL-BASE ALLOYS
Weldmetal
SLAALA
Distance from weld centerline (mm)
Vic
kers
har
dnes
s, H
v(lo
ad: 1
.96N
)
0 2 4 6 8 10200
250
300
350
400
450
500
(a)
ALSA
Weldmetal
STAATA
0 2 4 6 8 10
(b)
ATSA
Distance from weld centerline (mm)
Vic
kers
har
dnes
s, H
v(lo
ad: 1
.96N
)
200
250
300
350
400
450
500
Figure 16.9 Hardness profiles in Inconel 718 welds after postweld heat treating: (a)laser welds; (b) gas–tungsten arc welds. S: solutionized; A: aged after solutionization;L: laser welded; T: gas–tungsten arc welded. Broken line indicates fusion line. FromHirose et al. (15).

cracking or simply reheat cracking. The term strain-age cracking arises fromthe fact that cracking occurs in highly restrained weldments, as they are heatedthrough the temperature range in which aging occurs.
16.3.2 Development of Cracking
Figure 16.10 shows the development of postweld heat treatment cracking. Theprecipitation temperature range is from T1 to T2 (Figure 16.10a). To relievethe residual stresses after welding, the workpiece is brought up to the solu-tionization temperature (Figure 16.10b). It passes through the precipitationtemperature range. Unless the heating rate is high enough to avoid inter-secting the precipitation C curve, precipitation and hence cracking will occur(Figure 16.6c). The microstructural changes in the HAZ are illustrated inFigures 16.10d and e.
Postweld heat treatment cracks usually, though not always, initiate in theHAZ. However, as shown in the weld circle-patch test in Figure 16.11a, it canpropagate into regions unaffected by the welding heat (4). Such a test, whichis often used for evaluating the strain-age cracking tendency of a material, isachieved by welding the circle-patch specimen to a stiffener (strong back) sothat the combination can be heat treated without relaxation (stress relief) dueto mechanical factors. As shown in Figure 16.11b, the cracks in the HAZ areintergranular (29).
POSTWELD HEAT TREATMENT CRACKING 385
matrix
residual stresses + aging cracking
solutionizing
aging
precipitationtemperature
residualstresses
Time, t Time, t
wel
ding
FZ
TT
(a) (b) (c)Concentration, C
Co
t1 t2 t3
2
3
4 2
1 1
T1
T2
(d) a b
'
Tem
pera
ture
, T
precipitate(e)
t1 t2 t4t3
heat
ing
t4
cooling
heat
ing
precipitationC-curve
g
g + g
range
Figure 16.10 Postweld heat treatment cracking: (a) phase diagram; (b) thermal cyclesduring welding and heat treating; (c) precipitation C curve; (d) weld cross-section;(e) changes in microstructure.

16.3.3 Effect of Composition
Figure 16.12 shows the effect of Al and Ti contents on the postweld heat treat-ment cracking tendency in Ni-base alloys (30). Such a plot was first proposedby Prager and Shira (4). As can be seen, the g ¢-strengthened Ni-base alloyswith high Al and Ti contents are particularly difficult to weld because of high
386 PRECIPITATION-HARDENING MATERIALS II: NICKEL-BASE ALLOYS
Figure 16.11 Postweld heat treatment cracking. (a) Circular-patch specimen of Rene41. From Prager and Shira (4). (b) Scanning electron micrograph showing intergranu-lar cracking. Reprinted from McKeown (29). Courtesy of American Welding Society.
Inconel 909
Inconel 718Rene` 62 Inconel X-750
M 252
Rene` 41
Inconel X
Waspaloy
IN939Unitemp 1753
Udiment500
Inconel 700GMR 235
AstroloyUdimet 700
Udimet 600AF2-1DA
Mar-M-200IN 100
B1900R`108
713C
0 1 2 3 4 5 60
1
2
3
4
5
6
Titanium, Wt %
Alu
min
um, W
t %
Easy to weld
Difficult to weld
Figure 16.12 Effect of Al and Ti contents on postweld heat treatment cracking. Mod-ified from Kelly (30).

susceptibility to cracking.This is because such alloys tend to age harden ratherrapidly and because their ductility is low.
16.3.4 Proposed Mechanisms
Postweld heat treatment cracking in Ni-base alloys is a result of low ductilityand high strains in the HAZ (31, 32). So far several mechanisms have beenproposed for the causes of low ductility in the HAZ, including, for example,embrittlement of the grain boundary due to liquidation or solid-state reactionsduring welding (33–36), embrittlement of the grain boundary by oxygen duringheat treatment (37–39), and a change in deformation mode from transgranu-lar slip to grain boundary sliding (14, 19, 22). The causes of high strains in theHAZ, on the other hand, can be the welding stresses and the thermal expan-sion and contraction of the material. In heat-treatable Ni-base alloys, the pre-cipitation of strengthening phases results in contraction during aging. Thisaging contraction, in fact, has been proposed by several investigators (7, 22,33, 40) to be a contributing factor to postweld heat treatment cracking in heat-treatable Ni-base alloys.
16.3.5 Remedies
Several different methods of avoiding postweld heat treatment cracking have been recommended. Most of these methods are based on experimen-tally observed crack susceptibility C curves. A crack susceptibility C curve is a curve indicating the onset of postweld heat-treatment cracking in a temperature–time plot. It is usually obtained by isothermal heat treating ofwelded circle patches at different temperatures for different periods of timeand checking for cracking. Such a curve usually resembles the shape of a “C”and, therefore, is called a crack susceptibility C curve. Since the aging rate atthe lower end of the aging temperature range is relatively slow, the occurrenceof cracking approaches asymptotically some lower temperature limit. Like-wise, since residual stresses are relaxed at the higher temperature end of theaging temperature range and precipitates formed at lower temperature aredissolved, the occurrence of cracking approaches asymptotically some highertemperature limit. At any temperature between the upper and lower asymp-totic limits, there exists a minimum time, prior to which no cracking is possi-ble and beyond which cracking is certain to occur (37).
Figure 16.13 shows the crack susceptibility C curves of Waspaloy andInconel 718 (1). Inconel 718 ages much more sluggishly than g ¢-strengthenedNi-base alloys (Figure 16.4b). As a result, the C curve of Inconel 718 is far tothe right of the C curve of Waspaloy, suggesting that the former is much moreresistant to postweld heat treatment cracking. In fact, Inconel 718 is a mate-rial designed specifically to minimize postweld heat treatment cracking andshould be considered when postweld heat treatment cracking is of majorconcern. However, other alloys may still have to be used because of specific
POSTWELD HEAT TREATMENT CRACKING 387

requirements involved, and the following approaches to reduce the crackingsusceptibility are worth considering.
Preweld overaging, either by multistep-type overaging or simply by coolingslowly from the solutionizing temperature, appears to significantly reducepostweld heat treatment cracking in Rene 41 (36, 37, 41), Figure 16.14 beingan example (36).The base metal of an overaged workpiece is more ductile anddoes not age contract during postweld heat treatment, and this helps preventsevere residual stresses in the HAZ. But, as Franklin and Savage (32) pointedout, the overaged precipitate is dissolved in the HAZ during welding, and con-sequently the HAZ may still harden and age contract during postweld heattreatment.
The effect of preweld solution annealing appears to be controversial.Gottlieb (42) reported that solution-annealed Rene 41 (solutionized at 1080°C,or 1975°F, for half an hour followed by water quenching) is in fact more sus-ceptible to postweld heat treatment cracking than fully age hardened Rene 41
388 PRECIPITATION-HARDENING MATERIALS II: NICKEL-BASE ALLOYS
1200
1400
1600
1800
No cracks
aging rate andcrack reduced
Waspaloy Alloy 718
Time (minutes)
Tem
pera
ture
, oF
Tem
pera
ture
, oC
700
800
900
1000
1 101 102 103 104 105 106
Figure 16.13 Crack susceptibility C curves for Waspaloy and Inconel 718 welds.Reprinted, with permission, from Owczarski (l).
uncracked
1.0 10.0 100.0 1000.0
110012001300140015001600170018001900
Agi
ng te
mpe
ratu
re, o
C
600
1000
700
800
900
Agi
ng te
mpe
ratu
re, o
F
Figure 16.14 Crack susceptibility C curve for a Rene 41 solution annealed beforewelding and crack test data (�) from a Rene 41 overaged before welding. Reprintedfrom Berry and Hughes (36). Courtesy of American Welding Society.

[solutionized at 1080°C for half an hour, water quenched, aged at 760°C(1400°F) for 4–16h and then air cooled]. Berry and Hughes (36), on the otherhand, reported that fully age hardened Rene 41 behaves essentially the sameas solution-annealed Rene 41 during postweld heat treatment.
It is true that the base metal of a solution-annealed workpiece can age con-tract as well as harden during postweld heat treatment, and effective stressrelief can be difficult. However, if the same weldment is heated rapidly duringpostweld heat treatment, effective stress relief can be achieved before it has achance to harden and age contract, thus avoiding cracking (36, 37). As shownin Figure 16.15, no cracking occurs if the weldment is heated rapidly to avoidintersecting the crack susceptibility C curve (36). This approach is feasiblewhen the welded structure can be heated rapidly in a furnace and when dis-tortions due to nonuniform heating are not excessive.
POSTWELD HEAT TREATMENT CRACKING 389
C-Curve
0.1 1.0 10.0 100.0
800
1000
Time, min.
Tem
pera
ture
, oC
Notcracked Cracked
Figure 16.15 Effect of heating rate on postweld heat treatment cracking of a Rene41 solution annealed before welding. Reprinted from Berry and Hughes (36). Cour-tesy of American Welding Society.
Heat 95285
Heat 8179
Filled point = melt-through
10,000 30,000 50,000 70,00000
4
8
12
16
20
Weld energy, joules/inch
Tota
l cra
ck le
ngth
, inc
hes4,000 12,000 20,000
Weld energy, joules/cm
Tota
l cra
ck le
ngth
, cm
10
20
30
40
50
0
Figure 16.16 Effect of welding heat input on postweld heat treatment cracking ofRene 41. Reprinted from Thompson et al. (37). Courtesy of American Welding Society.

Another way of avoiding postweld heat treatment cracking is to use vacuumor inert atmospheres for heat treating (4, 36–38). It has been postulated thatthis technique is effective since there is no oxygen present to embrittle the grain boundary during postweld heat treatment (37–39, 43). Other re-commended approaches include using low welding heat inputs (Figure 16.16),using small grain-size materials (36, 39), and controlling the composition(Figure 16.17). Of course, using low-restraint joint designs is helpful.
Finally, reheat cracking has also been reported in other alloys including1/2Cr–1/2Mo–1/4V steel (a creep-resistant ferritic steel),A517F (T1) steel (a struc-tural steel), and 18Cr–12Ni–1Nb steel (a Nb-stabilized stainless steel) (44).Thereheat cracking of creep-resistant ferritic steels will be discussed in Chapter17.
REFERENCES
1. Owczarski, W. A., in Physical Metallurgy of Metal Joining, Eds. R. Kossowsky andM. E. Glicksman, Metallurgical Society of AIME, New York, 1980, p. 166.
2. Sims, C. T., J. Metals, 18: 1119, October 1966.3. Betteridge, W., The Nimonic Alloys, Arnold, London, 1959.4. Prager, M., and Shira, C. S., Weld. Res. Council Bull., 128: 1968.5. Mihalisin, J. R., and Pasquzne, D. L., Structural Stability in Superalloys, vol. 1, Joint
ASTM-ASME, 1968, pp. 134–170.6. Decker, R. F., and Sims, C. T., in The Superalloys, Eds. C. T. Sims and W. C. Hagel,
Wiley, New York, 1972, p. 33.7. Blum, B. S., Shaw, P., and Wickesser, A., Technical Report ASD-TRD-63-601,
Republic Aviation Corp., Farmingdale, NY, June 1963.8. Thompson, E. G., Weld. J., 48: 70s, 1969.9. Thompson, E. G., unpublished research, University of Alabama, Birmingham, 1981.
10. Brooks, J. A., Weld. J., 53: 517s, 1974.
390 PRECIPITATION-HARDENING MATERIALS II: NICKEL-BASE ALLOYS
1 10 100 1000
1200
1400
1600
1800
2000High Fe, Si,Mn and S Low Fe, Si,
Mn and S
Agi
ng te
mpe
ratu
re, o
F
600
700
800
1000
900A
ging
tem
pera
ture
, oC
1000
Figure 16.17 Effect of composition on postweld heat treatment cracking of Rene 41.Reprinted from Berry and Hughes (36). Courtesy of American Welding Society.

11. Eiselstein, H. L., Adv. Technol. Stainless Steels, Special Technical Publication No.369.
12. Wilson, R. M. Jr., and Burchfield, L. W. G., Weld. J., 35: 32s, 1956.13. Owczarski, W. A., and Sullivan, C. P., Weld. J., 43: 393s, 1964.14. Lucas, M. J. Jr., and Jackson, C. E., Weld. J., 49: 46s, 1970.15. Hirose, A., Sakata, K., and Kobayahi, K. F., in Solidification Processing 1997, Eds.
J. Beech and H. Jones, Department of Engineering Materials, University ofSheffield, Sheffield, United Kingdom, 1997, p. 675.
16. Savage, W. F., Nippes, E. F., and Goodwin, G. M., Weld. J., 56: 245s, 1977.17. Savage, W. F., and Krantz, B. M., Weld. J., 50: 29s, 1971.18. Savage, W. F., and Krantz, B. M., Weld. J., 45: 13s, 1966.19. Owczarski, W. A., Duvall, D. S., and Sullivan, C. P., Weld. J., 45: 145s, 1966.20. Duvall, D. S., and Owczarski, W. A., Weld. J., 46: 423s, 1967.21. Yeniscavich, W., Weld. J., 45: 344s, 1966.22. Wu, K. C., and Herfert, R. E., Weld. J., 46: 32s, 1967.23. Yeniscavich, W., in Proceedings of the Conference on Methods of High-Alloy
Weldability Evaluation, Welding Research Council, New York, 1970, p. 2.24. Gordine, J., in Proceedings of the Conference on Methods of High-Alloy Weldabil-
ity Evaluation, Welding Research Council, New York, 1970, p. 28.25. Owczarski, W. A., in Proceedings of the Conference on Effects of Minor Elements
on the Weldability of High-Nickel Alloys, Welding Research Council, New York,1967, p. 6.
26. Canonico, D. A., Savage, W. F., Werner, W. J., and Goodwin, G. M., in Proceedingsof the Conference on Effects of Minor Elements on The Weldability of High-NickelAlloys, Welding Research Council, New York, 1967, p. 68.
27. Valdez, P. J., and Steinman, J. B., in Proceedings of the Conference on Effects ofMinor Elements on The Weldability of High-Nickel Alloys, Welding ResearchCouncil, New York, 1967, p. 93.
28. Grotke, G. E., in Proceedings of the Conference on Effects of Minor Elements onThe Weldability of High-Nickel Alloys,Welding Research Council, New York, 1967,p. 138.
29. McKeown, D., Weld. J., 50: 201s, 1971.30. Kelly, T. J., in Weldability of Materials, Eds. R. A. Patterson and K. W. Mahin, ASM
International, Materials Park, OH, 1990, p. 151.31. Baker, R. G., and Newman, R. P., Metal Construction Br. Weld. J., 1: 4, 1969.32. Franklin, J. G., and Savage, W. F., Weld. J., 53: 380s, 1974.33. Chang, W. H., Report DM58302 (58AD-16), General Electric, October 1958.34. Hughes, W. P., and Berry, T. F., Weld. J., 46: 361s, 1967.35. Morris, R. J., Metal Prog. 76: 67, 1959.36. Berry, T. F., and Hughes, W. P., Weld. J., 46: 505s, 1969.37. Thompson, E. G., Nunez, S., and Prager, M., Weld. J., 47: 299s, 1968.38. Carlton, J. B., and Prager, M., Weld. Res. Council Bull., 150: 13, 1970.39. Prager, M., and Sines, G., Weld. Res. Council Bull., 150: 24, 1970.40. Schwenk, W., and Trabold, A. F., Weld. J., 42: 460s, 1963.
REFERENCES 391

41. Fawley, R. W., and Prager, M., Weld. Res. Council Bull., 150: 1, 1970.42. Gottlieb, T.: unpublished Rocketdyne data.43. Prager, M.A., and Thompson, E. G., Report R-71 11, Rocketdyne, September 1967.44. Nichols, R. W., Weld. World, 7(4): 1969, p. 245.
FURTHER READING
1. Sims, C. T., and Hagel, W. C., Eds., The Superalloys, Wiley, New York, 1972.2. Thamburaj, R., Wallace, W., and Goldak, J. A., Int. Metals Rev., 28: 1, 1983.
PROBLEMS
16.1 Explain why the susceptibility of Rene 41 welded in the solution annealcondition to postweld heat treatment cracking increases with increasingwelding heat input.
16.2 It has been observed that the temperature of solution heat treatmentbefore welding can significantly affect the susceptibility of Rene 41 topostweld heat treatment cracking. For instance, specimens subjected to 2150°F preweld solution heat treatment have been found to be moresusceptible than those subjected to a 1975°F treatment. Explain why.
16.3 It has been reported that, in developing strain-age cracking C curves forRene 41, water quenching following isothermal heat treatment of thewelded circle patches often results in cracking. (a) Do you expect the C curves so developed to be reliable? (b) It has been suggested that atthe end of isothermal heat treatment the furnace temperature be raisedto 1975°F and kept there for 30min and that the welded circle patches then be allowed to furnace cool at a rate of about 3–8°F/min (1.7–4.4°C/min). Cracking during cooling has been eliminated this way.Explain why. Do you expect the cracking C curves so obtained to bemore reliable than those mentioned earlier?
16.4 Two rules are often quoted in postweld heat treatment of nickel-basealloys. First, never directly age weldments of heat-treatable nickel-basealloys. Second, the aging temperatures should exceed the service tem-peratures of the weldments. Explain why.
392 PRECIPITATION-HARDENING MATERIALS II: NICKEL-BASE ALLOYS

17 Transformation-HardeningMaterials: Carbon and Alloy Steels
Carbon and alloy steels are more frequently welded than any other materialsbecause of their widespread applications and good weldability. In general,carbon and alloy steels with higher strength levels are more difficult to weldbecause of the risk of hydrogen cracking. Table 17.1 summarizes some typicalwelding problems in carbon and alloy steels and their solutions. The problemsassociated with the fusion zone and the partially melted zone have been dis-cussed in previous chapters. This chapter deals with basic HAZ phenomena inselected carbon and low-alloy steels.
17.1 PHASE DIAGRAM AND CCT DIAGRAMS
The HAZ in a carbon steel can be related to the Fe–C phase diagram, as shownin Figure 17.1, if the kinetic effect of rapid heating during welding on phasetransformations is neglected. The HAZ can be considered to correspond tothe area in the workpiece that is heated to between the lower critical temperature A1 (the eutectoid temperature) and the peritectic temperature.Similarly, the PMZ can be considered to correspond to the areas between the peritectic temperature and the liquidus temperature, and the fusion zoneto the areas above the liquidus temperature.
The Fe–C phase diagram and the continuous-cooling transformation (CCT)diagrams for heat treating carbon steels can be useful for welding as well, butsome fundamental differences between welding and heat treating should berecognized. The thermal processes during the welding and heat treating of acarbon steel differ from each other significantly, as shown in Figure 17.2. First,in welding the peak temperature in the HAZ can approach 1500°C. In heattreating, however, the maximum temperature is around 900°C, which is notmuch above the upper critical temperature A3 required for austenite (g) toform. Second, the heating rate is high and the retention time above A3 is shortduring most welding processes (electroslag welding being a notable excep-tion). In heat treating, on the other hand, the heating rate is much slower andthe retention time above A3 is much longer.The A1 and A3 temperatures duringheating (chauffage) are often referred to as the Ac1 and Ac3 temperatures,respectively.
393
Welding Metallurgy, Second Edition. Sindo KouCopyright 2003 John Wiley & Sons, Inc.
ISBN: 0-471-43491-4
For kinetic reasons the Ac1 and Ac3 temperatures tend to be higher thanthe equilibrium A1 and A3 temperatures, respectively, and they tend to increasewith increasing heating rate during welding (1, 2). Kinetically, phase transfor-mations require diffusion (the transformation to martensite is a well-knownexception) and diffusion takes time. Consequently, upon rapid heating duringwelding, phase transformations may not occur at the equilibrium A1 and A3
temperatures but at higher temperatures Ac1 and Ac3. For steels containinggreater amounts of carbide-forming elements (such as V, W, Cr, Ti, and Mo),
394 TRANSFORMATION-HARDENING MATERIALS
TABLE 17.1 Typical Welding Problems and Practical Solution in Carbon andAlloy Steels, and Their Locations in the Text
Typical Problems Alloy Types Solutions Locations
Porosity Carbon and low- Add deoxidizers (Al, Ti, 3.2alloy steels Mn) in filler metal 3.3
Hydrogen cracking Steels with high Use low-hydrogen or 3.2carbon equivalent austenitic stainless 17.4
steel electrodesPreheat and postheat
Lamellar tearing Carbon and low- Use joint designs that 17.6alloy steels minimize transverse
restrainButter with a softer
layer
Reheat cracking Corrosion and heat- Use low heat inputa to 17.5resisting steels avoid grain growth
Minimize restraint andstress concentrations
Heat rapidly throughcritical temperaturerange, if possible
Solidification cracking Carbon and low- Keep proper Mn/S 11.4alloy steels ration
Low HAZ toughness Carbon and low- Use carbide and nitride 17.2due to grain growth alloy steels formers to suppress 17.3
grain growthUse low heat inputa
Low fusion-zone Carbon and low- Grain refining 7.6toughness due to alloy steels Use multipass welding 17.2coarse columnar to refine grainsgrains
a Low heat input processes (GMAW and SMAW vs. SAW and ESW) or multipass welding withlow heat input in each pass.

the effect of the heating rate becomes more pronounced. This is because thediffusion rate of such elements is orders of magnitude lower than that ofcarbon and also because they hinder the diffusion of carbon.As a result, phasetransformations are delayed to a greater extent.
The combination of high heating rates and short retention time above Ac3
in welding can result in the formation of inhomogeneous austenite duringheating. This is because there is not enough time for carbon atoms in austen-ite to diffuse from the prior pearlite colonies of high carbon contents to priorferrite colonies of low carbon contents. Upon rapid cooling, the former can
PHASE DIAGRAM AND CCT DIAGRAMS 395
1 2FeCarbon, wt%
Temperature, oC
1600
1200
800
L +
+ Fe3C
+ Fe3C
L
3 4
(a)(b)
Carbon steel
partially melted zone
heat-affected zone
base metal
fusion zone
A1
A3
γ
γ
γ
α
Figure 17.1 Carbon steel weld: (a) HAZ; (b) phase diagram.
A3
Tem
pera
ture
Time
Heat Treating
Welding (much highermaximum temperature andshorter time above A3temperature)
TL
(a) (b)1 2FeCarbon, wt%
1600
1200
800
400
L+
+Fe 3C
+Fe 3C
Liquid, L
Austenite, A3
3 4 5
A1Ferrite,
Ferrite,
T, oC
γ
γ
α
γ
δ
α
Figure 17.2 Comparison between welding and heat treating of steel: (a) thermalprocesses; (b) Fe–C phase diagram.

transform into high-carbon martensite colonies while the latter into low-carbon ferrite colonies. Consequently, the microhardness in the HAZ canscatter over a wide range in welds made with high heating rates.
As a result of high peak temperatures during welding, grain growth can takeplace near the fusion boundary. The slower the heating rate, the longer theretention time above Ac3 is and hence the more severe grain growth becomes.In the heat treating, however, the maximum temperature employed is onlyabout 900°C in order to avoid grain growth.
The CCT diagrams (Chapter 9) for welding can be obtained by using a weldthermal simulator (Chapter 2) and a high-speed dilatometer that detects thevolume changes caused by phase transformations (3–6). However, since CCTdiagrams for welding are often unavailable, those for heat treating have beenused. These two types of CCT diagrams can differ from each other because of kinetic reasons. For instance, grain growth in welding can shift the CCTdiagram to longer times favoring transformation to martensite. This is becausegrain growth reduces the grain boundary area available for ferrite and pearliteto nucleate during cooling. However, rapid heating in welding can shift theCCT diagram to shorter times, discouraging transformation to martensite.Carbide-forming elements (such as Cr, Mo, Ti, V, and Nb), when they are dis-solved in austenite, tend to increase the hardenability of the steel. Because ofthe sufficient time available in heat treating, such carbides dissolve more completely and thus enhance the hardenability of the steel. This is usually notpossible in welding because of the high heating rate and the short high-temperature retention time encountered in the HAZ (7).
17.2 CARBON STEELS
According to the American Iron and Steel Institute (AISI), carbon steels maycontain up to 1.65wt% Mn, 0.60wt% Si, and 0.60wt% Cu in addition to much smaller amounts of other elements. This definition includes the Fe–Csteels of the 10XX grades (up to about 0.9% Mn) and the Fe–C–Mn steels ofthe 15XX grades (up to about 1.7% Mn). The last two digits in the alloy des-ignation number denote the nominal carbon content in weight percent, forinstance, about 0.20% C in a 1020 and about 0.41% C in a 1541 steel. Man-ganese is an inexpensive alloying element that can be added to carbon steelsto help increase hardenability.
17.2.1 Low-Carbon Steels
These steels, in fact, include both carbon steels with up to 0.15% carbon, calledlow-carbon steels, and those with 0.15–0.30% carbon, called mild steels (8).For the purpose of discussion 1018 steel, which has a nominal carbon contentof 0.18%, is used as an example. Figure 17.3 shows the micrographs of agas–tungsten arc weld of 1018 steel. The base metal consists of a light-etching
396 TRANSFORMATION-HARDENING MATERIALS

CARBON STEELS 397
A C
DB
Figure 17.3 HAZ microstructure of a gas–tungsten arc weld of 1018 steel (magnifi-cation 200¥).

ferrite and a dark-etching pearlite (position A). The HAZ microstructure canbe divided into essentially three regions: partial grain-refining, grain-refining,and grain-coarsening regions (positions B–D).The peak temperatures at thesepositions are indicated in the phase diagram.
The partial grain-refining region (position B) is subjected to a peak tem-perature just above the effective lower critical temperature, Ac1. As explainedin Figure 17.4, the prior pearlite (P) colonies transform to austenite (g) andexpand slightly into the prior ferrite (F) colonies upon heating to above Ac1
and then decompose into extremely fine grains of pearlite and ferrite duringcooling. The prior ferrite colonies are essentially unaffected. The grain-refin-ing region (position C) is subjected to a peak temperature just above the effec-tive upper critical temperature Ac3, thus allowing austenite grains to nucleate.Such austenite grains decompose into small pearlite and ferrite grains duringsubsequent cooling. The distribution of pearlite and ferrite is not exactlyuniform because the diffusion time for carbon is limited under the high heatingrate during welding and the resultant austenite is not homogeneous.The grain-coarsening region (position D) is subjected to a peak temperature well aboveAc3, thus allowing austenite grains to grow. The high cooling rate and largegrain size encourage the ferrite to form side plates from the grain boundaries,called the Widmanstatten ferrite (9).
Grain coarsening near the fusion boundary results in coarse columnargrains in the fusion zone that are significantly larger than the HAZ grains onthe average. As shown in Figure 17.5, in multiple-pass welding of steels thefusion zone of a weld pass can be replaced by the HAZs of its subsequentpasses (10). This grain refining of the coarse-grained fusion zone by multiple-pass welding has been reported to improve the weld metal toughness.
Although martensite is normally not observed in the HAZ of a low-carbonsteel, high-carbon martensite can form when both the heating and the cooling
398 TRANSFORMATION-HARDENING MATERIALS
1 2FeCarbon, wt%
Tem
pera
ture
, o C
1600
1200
800
400
L
+ Fe3C
+ Fe3C
Liquid, L
Austenite,
A3
3 4 5
A1
13
2
Ferrite,
Ferrite,
P
PP
P
Pearlite, P
2 31δ
α
+ γ
γ
α
α α
αα
α α
αα
α α
α
αα
γ
γ γγ
Figure 17.4 Mechanism of partial grain refining in a carbon steel.

rates are very high, as in the case of some laser and electron beam welding.Figure 17.6 shows the HAZ microstructure in a 1018 steel produced by a high-power CO2 laser beam (11). At the bottom of the HAZ (position B) high-carbon martensite (and, perhaps, a small amount of retained austenite) formedin the prior-pearlite colonies. The high-carbon austenite formed in thesecolonies during heating did not have time to allow carbon to diffuse out, andit transformed into hard and brittle high-carbon martensite during subsequentrapid cooling. Hard, brittle martensite embedded in a much softer matrix offerrite can significantly degrade the HAZ mechanical properties. Further upinto the HAZ (positions C and D), both the peak temperature and the diffu-sion time increased. As a result, the prior-pearlite colonies expanded whiletransforming into austenite and formed martensite colonies of lower carboncontents during subsequent cooling.
High-carbon martensite can also form in the HAZ of an as-cast low-carbonsteel, where microsegregation during casting causes high carbon contents inthe interdendritic areas. Aidun and Savage (12) have studied the repairing of
CARBON STEELS 399
(b)
Figure 17.5 Grain refining in multiple-pass welding: (a) single-pass weld; (b)microstructure of multiple-pass weld. Reprinted from Evans (10). Courtesy of American Welding Society.

400 TRANSFORMATION-HARDENING MATERIALS
Figure 17.6 HAZ microstructure of 1018 steel produced by a high-power CO2 laser.Magnification of (A)–(D) 415¥ and of (E) 65¥. From Kou et al. (11).

cast steels used in the railroad industry. A series of materials with 0.21–0.31%C, 0.74–1.57% Mn, 0.50% Si, and up to about 0.20% Cr and Mo were spotwelded using covered electrodes E7018. As a result of the microsegregationof carbon and alloying elements during casting, continuous networks of inter-dendritic pearlite nodules with carbon contents ranging from about 0.5 to0.8% were present in the as-cast materials, as shown in Figure 17.7a.The resul-tant HAZ microstructure is shown in Figure 17.8. During welding of the as-castmaterials, the continuous networks of pearlite nodules formed continuous net-works of high-carbon austenite upon heating, which in turn transformed tocontinuous networks of high-carbon martensite upon cooling (region E). Theislands scattered in the networks are untransformed ferrite. These networksof interdendritic pearlite nodules can be eliminated by homogenizing at 954°Cfor 2h, as shown in Figure 17.7b.
17.2.2 Higher Carbon Steels
These steels include carbon steels with 0.30–0.50% carbon, called medium-carbon steels, and those with 0.50–1.00% carbon, called high-carbon steels (8). Welding of higher carbon steels is more difficult than welding lower
CARBON STEELS 401
Figure 17.7 Microstructure of a carbon steel: (a) as-cast condition; (b) after homog-enization. Reprinted from Aidun and Savage (12). Courtesy of American WeldingSociety.

carbon steels because of the greater tendency of martensite formation in the HAZ and hence hydrogen cracking. For the purpose of discussion,1040 steel, which has a nominal carbon content of 0.40%, is used as anexample.
Figure 17.9 shows the micrographs of a gas-tungsten arc weld of 1040 steel.The base metal of the 1040 steel weld consists of a light-etching ferrite and adark-etching pearlite (position A), as in the 1018 steel weld discussed previ-ously. However, the volume fraction of pearlite (C rich with 0.77 wt % C) issignificantly higher in the case of the 1040 steel because of its higher carboncontent. As in the case of the 1018 steel, the HAZ microstructure of the 1040steel weld can be divided essentially into three regions: the partial grain-refining, grain-refining, and grain-coarsening regions (positions B–D). TheCCT diagram for the heat treating of 1040 steel shown in Figure 17.10 can beused to explain qualitatively the HAZ microstructure (13). In the grain coars-ening region (position D), both the high cooling rate and the large grain sizepromote the formation of martensite.The microstructure is essentially marten-site, with some dark-etching bainite (side plates) and pearlite (nodules). In thegrain-refining region (position C), on the other hand, both the lower coolingrate and the smaller grain size encourage the formation of pearlite and ferrite.The microstructure is still mostly martensitic but has much smaller grains and more pearlite. Some ferrite and bainite may also be present at grainboundaries.
Because of the formation of martensite, preheating and control of interpasstemperature are often required when welding higher carbon steels. For 1035 steel, for example, the recommended preheat and interpass tempera-tures are about 40°C for 25-mm (1-in.) plates, 90°C for 50-mm (2-in.) plates,and 150°C for 75-mm (3-in.) plates (assuming using low-hydrogen electrodes).For 1040 steel, they are about 90°C for 25-mm (1-in.) plates, 150°C for 50-mm (2-in.) plates, and 200°C for 75-mm (3-in.) plates (14). The reason for
402 TRANSFORMATION-HARDENING MATERIALS
Figure 17.8 HAZ microstructure of a stationary repair weld of an as-cast carbon steel.Fusion zone: A, B; HAZ: C–F; base metal: G. Reprinted from Aidun and Savage (12).Courtesy of American Welding Society.

CARBON STEELS 403
A
B
C
D
Figure 17.9 HAZ microstructure of a gas–tungsten arc weld of 1040 steel (magnifi-cation 400¥).
more preheating for thicker plates is because for a given heat input the cooling rate is higher in a thicker plate (Chapter 2). In addition to the higher cooling rate, a thicker plate often has a slightly higher carbon contentin order to ensure proper hardening during the heat-treating step of the steel-making process.

The hardness profile of the HAZ of the 1040 steel weld is shown in Figure17.11a. When welded with preheating, the size of the HAZ increases but themaximum hardness decreases, as shown in Figure 17.11b. Examination of theHAZ microstructure near the fusion boundary of the preheated weld revealsmore pearlite and ferrite but less martensite. This is because the cooling ratedecreases significantly with preheating (Chapter 2).
17.3 LOW-ALLOY STEELS
Three major types of low-alloy steels will be considered here: high-strength,low-alloy steels; quenched-and-tempered low-alloy steels; and heat-treatablelow-alloy steels.
404 TRANSFORMATION-HARDENING MATERIALS
Ac3F
P
B
M
1 10 102 103 104 105
200
400
600
8001,600
1,400
1,200
1,000
800
600
400
200
Tem
pera
ture
, o F
Tem
pera
ture
, o C
Cooling time, sec
10%Bainite
50% Ferrite50% Pearlite
AISI 1040 steel:0.39C, 0.72Mn, 0.23SiF: ferrite; P: pearliteB: bainite; M: martensite
Figure 17.10 Continuous cooling transformation diagram for 1040 steel. Modifiedfrom Atlas of Isothermal Transformation and Cooling Transformation Diagrams (13).
0 1010 0 1010
400
800FZ
HAZa b c d
a b
Distance, mm Distance, mm
knoo
p ha
rdne
ss (
1000
g)
(a) (b)
c d
FZ
HAZ
250 oCpreheating
Nopreheating
Figure 17.11 Hardness profiles across HAZ of a 1040 steel; (a) without preheating;(b) with 250°C preheating.

17.3.1 High-Strength, Low-Alloy Steels
High-strength, low-alloy (HSLA) steels are designed to provided higherstrengths than those of carbon steels, generally with minimum yield strengthsof 275–550MPa (40–80ksi). Besides manganese (up to about 1.5%) and silicon (up to about 0.7%), as in carbon steels, HSLA steels often contain verysmall amounts of niobium (up to about 0.05%), vanadium (up to about 0.1%), and titanium (up to about 0.07%) to ensure both grain refinement and precipitation hardening. As such, they are also called microalloyed steels. Typically the maximum carbon content is less than 0.2% and the totalalloy content is less than 2%. Alloys A242, A441, A572, A588, A633, and A710are examples of HSLA steels, and their compositions are available elsewhere(15).
Niobium (Nb), vanadium (V), and titanium (Ti) are strong carbide andnitride formers. Fine carbide or nitride particles of these metals tend to hinderthe movement of grain boundaries, thus reducing the grain size by makinggrain growth more difficult. The reduction in grain size in HSLA steelsincreases their strength and toughness at the same time. This is interestingbecause normally the toughness of steels decreases as their strength increases.Among the carbides and nitrides of Nb, V, and Ti, titanium nitride (TiN) ismost stable; that is, it has the smallest tendency to decompose and dissolve athigh temperatures. This makes it most effective in limiting the extent of graingrowth in welding.
The higher the heat input during welding, the more likely the carbide andnitride particles will dissolve and lose their effectiveness as grain growthinhibitors. The low toughness of the coarse-grain regions of the HAZ is unde-sirable. It has been reported that steels containing titanium oxide (Ti2O3) tendto have better toughness (16, 17). The Ti2O3 is more stable than TiN and doesnot dissolve even at high heat inputs. The undissolved Ti2O3 particles do notactually stop grain growth but act as effective nucleation sites for acicularferrite. Consequently, acicular ferrite forms within the coarse austenite grainsand improves the HAZ toughness (16).
The HSLA steels are usually welded in the as-rolled or the normalized con-dition, and the weldability of most HSLA steels is similar to that of mild steel.Since strength is often the predominant factor in the applications of HSLAsteels, the filler metal is often selected on the basis of matching the strengthof the base metal (15). Any common welding processes can be used, but low-hydrogen consumables are preferred.
The preheat and interpass temperatures required are relatively low. Formost alloys they are around 10°C for 25-mm (1-in.) plates, 50°C for 50-mm (2-in.) plates, and 100°C for 75-mm (3-in.) plates. For alloy A572 (grades 60 and65) and alloy A633 (grade E), they are about 50°C higher (15). The amountof preheating required increases with increasing carbon and alloy content andwith increasing steel thickness.
LOW-ALLOY STEELS 405

17.3.2 Quenched-and-Tempered Low-Alloy Steels
The quenched-and-tempered low-alloy (QTLA) steels, usually containing lessthan 0.25% carbon and less than 5% alloy, are strengthened primarily byquenching and tempering to produce microstructures containing martensiteand bainite. The yield strength ranges from approximately 345 to 895MPa (50to 130ksi), depending on the composition and heat treatment. Alloys A514,A517, A543, HY-80, HY-100, and HY-130 are some examples of QTLA steels,and their compositions are available elsewhere (15).
Low carbon content is desired in such alloys for the following two reasons:(i) to minimize the hardness of the martensite and (ii) to raise the Ms (marten-site start) temperature so that any martensite formed can be tempered auto-matically during cooling. Due to the formation of low-carbon auto-temperedmartensite, both high strength and good toughness can be obtained. Alloyingwith Mn, Cr, Ni, and Mo ensures the hardenability of such alloys. The use ofNi also significantly increases the toughness and lowers the ductile–brittletransition temperature in these alloys.
Any common welding processes can be used to join QTLA steels, but theweld metal hydrogen must be maintained at very low levels. Preheating is oftenrequired in order to prevent hydrogen cracking. The preheat and interpasstemperatures required are higher than those required for HSLA steels but stillnot considered high. For HY130, for example, the preheat and interpass tem-peratures are about 50°C for 13-mm (0.5-in.) plates, 100°C for 25-mm (1-in.)plates, and 150°C for 38-mm (1.5-in.) plates (15). However, too high a preheator interpass temperature is undesirable. It can decrease the cooling rate of theweld metal and HAZ and cause austenite to transform to either ferrite orcoarse bainite, both of which lack high strength and good toughness. Postweldheat treatment is usually not required.
Excessive heat input can also decrease the cooling rate and produce unfa-vorable microstructures and properties. High heat input processes, such asESW or multiple-wire SAW, should be avoided. Figure 17.12 shows the CCTcurves of T1 steel, that is, A514 and A517 grade F QTLA steel (18). Curves p,f, and z represent the critical cooling rates for the formation of pearlite, ferrite,and bainite, respectively. The hatched area represents the region of optimumcooling rates. If the cooling rate during welding is too low, for instance,between curve p and the hatched area indicated, a substantial amount offerrite forms.This can, in fact, be harmful since the ferrite phase tends to rejectcarbon atoms and turn its surrounding areas into high-carbon austenite. Suchhigh-carbon austenite can in turn transform to high-carbon martensite andbainite during cooling, thus resulting in a brittle HAZ. Therefore, the heatinput and the preheating of the workpiece should be limited when weldingquenched-and-tempered alloy steels.
On the other hand, if the cooling rate during welding is too high, to the left of curve z in Figure 17.12, insufficient time is available for the auto-tempering of martensite. This can result in hydrogen cracking if hydrogen is
406 TRANSFORMATION-HARDENING MATERIALS

present. Therefore, low-hydrogen electrodes or welding processes and a smallamount of preheating are recommended. The hatched area in the figure represents the region of best cooling rates for welding this steel.
To meet the requirements of both limited heat inputs and proper preheat-ing, multiple-pass welding is often used in welding thick sections of QTLAsteels. In so doing, the interpass temperature is maintained at the same levelas the preheat temperature. Multiple-pass welding with many small stringerbeads improves the weld toughness as a result of the grain-refining and tem-pering effect of successive weld passes. The martensite in the HAZ of a weldpass is tempered by the heat resulting from deposition in subsequent passes.As a result, the overall toughness of the weld metal is enhanced. Figure 17.13shows the effect of bead tempering (19). The HAZ of bead E is tempered by bead F and is, therefore, softer than the HAZ of bead D, which is not tempered by bead F of any other beads.
17.3.3 Heat-Treatable Low-Alloy Steels
The heat-treatable low-alloy (HTLA) steels refer to medium-carbonquenched-and-tempered low-alloy steels, which typically contain up to 5% oftotal alloy content and 0.25–0.50% carbon and are strengthened by quench-ing to form martensite and tempering it to the desired strength level (15). Thehigher carbon content promotes higher hardness levels and lower toughnessand hence a greater susceptibility to hydrogen cracking than the quenched-and-tempered low-alloy steels discussed in the previous section. Alloys 4130,4140, and 4340 are examples of HTLA steels.
The HTLA steels are normally welded in the annealed or overtemperedcondition except for weld repairs, where it is usually not feasible to anneal orovertemper the base metal before welding. Immediately after welding, the
LOW-ALLOY STEELS 407
Figure 17.12 CCT curves for A514 steel. From Inagaki et al. (18).

entire weldment is heat treated, that is, reaustenized and then quenched andtempered to the desired strength level, or at least stress relieved or temperedto avoid hydrogen cracking.Any of the common welding processes can be usedto join HTLA steels. To avoid hydrogen cracking, however, the weld metalhydrogen must be maintained at very low levels, proper preheat and interpasstemperatures must be used, and preheat must be maintained after welding iscompleted until the commencement of postweld heat treatment.
In applications where the weld metal is required to respond to the samepostweld heat treatment as the base metal in order to match the base metalin strength, a filler metal similar to the base metal in composition is used. Inrepair welding where it is possible to use the steel in the annealed or overtem-pered condition, the filler metal does not have to be similar to the base metalin composition. The weldment is stress relieved or tempered after welding.In some repair welding where neither annealing or overtempering the steelbefore welding nor stress relieving the weld upon completion is feasible, elec-trodes of austenitic stainless steels or nickel alloys can be used. The resultantweld metal has lower strength and greater ductility than the quenched-and-tempered base metal, and high shrinkage stresses during welding can result inplastic deformation of the weld metal rather than cracking of the HAZ.
High preheat and interpass temperatures are often required for weldingHTLA steels. For alloy 4130, for instance, they are around 200°C for 13-mm
408 TRANSFORMATION-HARDENING MATERIALS
0102030
405060
AC
B
Weldmetal
DF
E
Hardness traverseof upper welded face
Limit of temperingby beads C and F
Limit of hardeningby beads C and F
Hardness traverseof lower welded face
Zone hardened bybeads B and E
Zone hardenedby beads A and D
Roc
kwel
l C h
ardn
ess
Figure 17.13 Tempering bead technique for multiple-pass welding of a butt joint in aquenched-and-tempered alloy steel. Reprinted form Linnert (19). Courtesy of Ameri-can Welding Society.

(0.5-in.) plates, 250°C for 25-mm (1-in.) plates, and almost 300°C for 50-mm(2-in.) plates. For alloys 4140 and 4340, they are even higher (15).
In addition to the use of preheating, the weldment of heat-treatable alloysteels is often immediately heated for stress-relief heat treatment beforecooling to room temperature. During the stress-relief heat treatment, marten-site is tempered and, therefore, the weldment can be cooled to room temper-ature without danger of cracking. After this, the weldment can be postweldheat treated to develop the strength and toughness the steel is capable ofattaining.
A sketch of the thermal history during welding and postweld stress reliev-ing is shown in Figure 17.14a. The preheat temperature and the temperatureimmediately after welding are both maintained slightly below the martensite-finish temperature Mf. Stress relieving begins immediately after welding, at atemperature below the A1 temperature.
This can be further explained using a 25-mm (1-in.) 4130 steel as anexample. Based on the isothermal transformation diagram for 4130 steel (13)shown in Figure 17.15, the ideal welding procedure for welding 4130 steel isto use a filler metal of the same composition, preheat to 250°C (about 500°F),weld while maintaining a 250°C interpass temperature using low-hydrogenelectrodes, and stress-relief heat treat at about 650°C (1200°F) immediatelyupon completion of welding (19). The postweld heat treatment of the entireweldment can be done in the following sequence: austenitizing at about 850°C(about 1600°F), quenching, and then tempering in the temperature range400–600°C (about 800–1100°F).
As shown in Figure 17.14a, the HAZ should be cooled to a temperatureslightly below the martensite-finish temperature Mf before being heated forstress relieving. If this temperature is above Mf, as shown in Figure 17.14b,there can be untransformed austenite left in the HAZ and it can decomposeinto ferrite and pearlite during stress relieving or transform to untemperedmartensite upon cooling to room temperature after stress relieving.
In the event that stress-relief heat treatment cannot be carried out imme-diately upon completion of welding, the temperature of the completed weld-ment can be raised to approximately 400°C (750°F), which is the vicinity ofthe bainite “knee” for 4130 and most other heat-treatable alloy steels. By
LOW-ALLOY STEELS 409
Welding
Stress relieving
Preheating
TimeTe
mpe
ratu
reTime
Tem
pera
ture
(a) (b)
A1 A1Mf Mf
Figure 17.14 Thermal history during welding and postweld stress relieving of a heat-treatable alloy steel: (a) desired; (b) undesired.

holding at this temperature for about 1h or less, the remaining austenite cantransform to bainite, which is more ductile than martensite. Therefore, whenthe weldment is subsequently cooled to room temperature, no cracking shouldbe encountered. Further heat treatment can be carried out later in order tooptimize the microstructure and properties of the weldment.
In cases where heat-treatable low alloy steels cannot be postweld heattreated and must be welded in the quenched-and-tempered condition, HAZsoftening as well as hydrogen cracking can be a problem. To minimize soften-ing, a lower heat input per unit length of weld (i.e., a lower ratio of heat inputto welding speed) should be employed. In addition, the preheat, interpass, andstress-relief temperatures should be at least 50°C below the tempering tem-perature of the base metal before welding. Since postweld heat treating of theweldment is not involved, the composition of the filler metal can be substan-tially different from that of the base metal, depending on the strength level ofthe weld metal required.
17.4 HYDROGEN CRACKING
Several aspects of hydrogen cracking have been described previously (Chapter3), including the various sources of hydrogen during welding, the hydrogen
410 TRANSFORMATION-HARDENING MATERIALS
Figure 17.15 Isothermal transformation curves for 4130 steel. Reprinted from Atlasof Isothermal Transformation and Cooling Transformation Diagrams (13).

levels in welds made with various welding processes, the solubility of hydro-gen in steels, the methods for measuring the weld hydrogen content, and thetechniques for reducing the weld hydrogen content have been described pre-viously in Chapter 3.
17.4.1 Cause
Hydrogen cracking occurs when the following four factors are present simul-taneously: hydrogen in the weld metal, high stresses, susceptible microstruc-ture (martensite), and relatively low temperature (between -100 and 200°C).High stresses can be induced during cooling by solidification shrinkage andthermal contraction under constraints (Chapter 5). Martensite, especially hardand brittle high-carbon martensite, is susceptible to hydrogen cracking. Sincethe martensite formation temperature Ms is relatively low, hydrogen crackingtends to occur at relatively low temperatures. For this reason, it is often called“cold cracking.” It is also called “delayed cracking,” due to the incubation timerequired for crack development in some cases.
Figure 17.16 depicts the diffusion of hydrogen from the weld metal to theHAZ during welding (20). The terms TF and TB are the austenite/(ferrite +pearlite) and austenite/martensite transformation temperatures, respectively.As the weld metal transforms from austenite (g) into ferrite and pearlite (a +Fe3C), hydrogen is rejected by the former to the latter because of the lowersolubility of hydrogen in ferrite than in austenite. The weld metal is usuallylower in carbon content than the base metal because the filler metal usuallyhas a lower carbon content than the base metal. As such, it is likely that theweld metal transforms from austenite into ferrite and pearlite before the HAZtransforms from austenite into martensite (M). The build-up of hydrogen inthe weld metal ferrite causes it to diffuse into the adjacent HAZ austenitenear the fusion boundary, as indicated by the short arrows in the figure. Asshown in Figure 17.17, the diffusion coefficient of hydrogen is much higher inferritic materials than austenitic materials (21). The high diffusion coefficient
HYDROGEN CRACKING 411
+Fe3C
B H+ H+
TF
TBA
martensite
H+H+H+
H+ H+ H+
crack
austenite ( )
base metal
welding direction
weldpool
arcelectrode
α
γ
γ
Figure 17.16 Diffusion of hydrogen from weld metal to HAZ during welding. Modi-fied from Granjon (20).

of hydrogen in ferrite favors this diffusion process. On the contrary, the muchlower diffusion coefficient of hydrogen in austenite discourages hydrogen dif-fusion from the HAZ to the base metal before the HAZ austenite transformsto martensite. This combination of hydrogen and martensite in the HAZ pro-motes hydrogen cracking.
The mechanism for hydrogen cracking is still not clearly understood, thoughnumerous theories have been proposed. It is not intended here to discuss thesetheories since this is more a subject of physical metallurgy than welding met-allurgy. For practical purposes, however, it suffices to recognize that Troiano(22) proposed that hydrogen promotes crack growth by reducing the cohesivelattice strength of the material. Petch (23) proposed that hydrogen promotescrack growth by reducing the surface energy of the crack. Beachem (24) pro-posed that hydrogen assists microscopic deformation ahead of the crack tip.Savage et al. (25) explained weld hydrogen cracking based on Troiano’s theory.Gedeon and Eagar (26) reported that their results substantiated and extendedBeachem’s theory.
17.4.2 Appearance
Figure 17.18 is a typical form of hydrogen crack called “underbead crack” (27).The crack is essentially parallel to the fusion boundary. Hydrogen cracking can
412 TRANSFORMATION-HARDENING MATERIALS
600500
400300
20010010
10-3
10-4
10-5
10-6
10-7
10-8
1000/T, where T is temperature oK4 3 2 1
Ferriticmaterials
Austeniticmaterials
10-9
Ove
rall
diffu
sion
coe
ffici
ent,
cm2 se
c-1
Temperature, oC
Figure 17.17 Diffusion coefficient of hydrogen in ferritic and austenitic materials asa function of temperature. Modified from Coe (21).
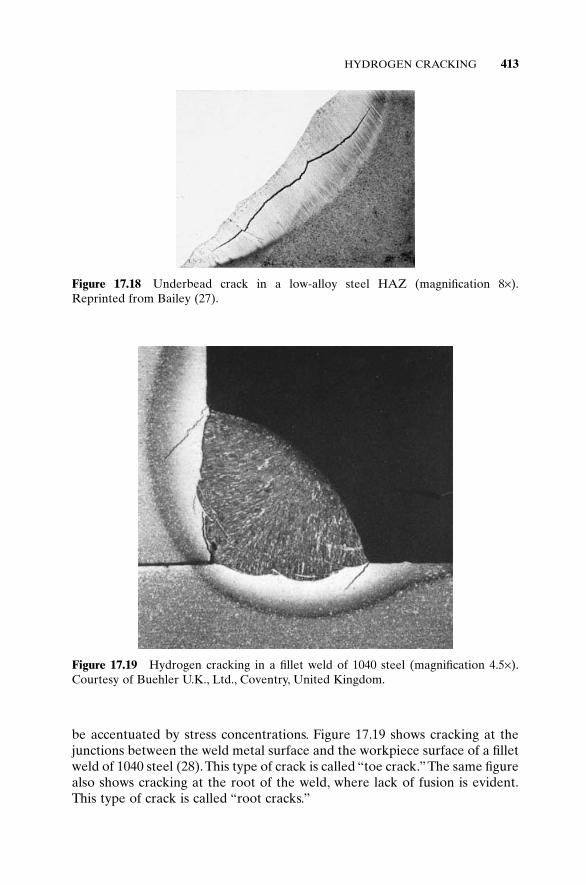
be accentuated by stress concentrations. Figure 17.19 shows cracking at thejunctions between the weld metal surface and the workpiece surface of a filletweld of 1040 steel (28).This type of crack is called “toe crack.”The same figurealso shows cracking at the root of the weld, where lack of fusion is evident.This type of crack is called “root cracks.”
HYDROGEN CRACKING 413
Figure 17.18 Underbead crack in a low-alloy steel HAZ (magnification 8¥).Reprinted from Bailey (27).
Figure 17.19 Hydrogen cracking in a fillet weld of 1040 steel (magnification 4.5¥).Courtesy of Buehler U.K., Ltd., Coventry, United Kingdom.

17.4.3 Susceptibility Tests
There are various methods for testing the hydrogen cracking susceptibility ofsteels, such as the implant test (20, 29), the Lehigh restraint test (30), the RPIaugmented strain cracking test (31), the controlled thermal severity test (32),and the Lehigh slot weldability test (33). Due to the limitation in space, onlythe first two tests will be described here.
Figure 17.20 is a schematic of the implant test. In this test, a cylindrical spec-imen is notched and inserted in a hole in a plate made from a similar mater-ial. A weld run is made over the specimen, which is located in such a way thatits top becomes part of the fusion zone and its notch lies in the HAZ. Afterwelding and before the weld is cold, a load is applied to the specimen and thetime to failure is determined. As an assessment of hydrogen cracking suscep-tibility, the stress applied is plotted against the time to failure, as shown inFigure 17.21 for a high-strength, low-alloy pipeline steel (33). In this caseloading was applied to the specimen when the weld cooled down to 125°C. As
414 TRANSFORMATION-HARDENING MATERIALS
weld
HAZ
load
base metal
testspecimen
arc
Figure 17.20 Implant test for hydrogen cracking.
800
700
600
500
400
300
20010 100 1000 10000 100000
Time to Failure (sec)
Str
ess
to F
ailu
re (
MP
a)
(Ar + 2% O2 )
E7018
E7010
Involved in AE StudyNo Fracture
Figure 17.21 Implant test results for a HSLA pipe line steel. Reprinted from Vasudevan et al. (33). Courtesy of American Welding Society.
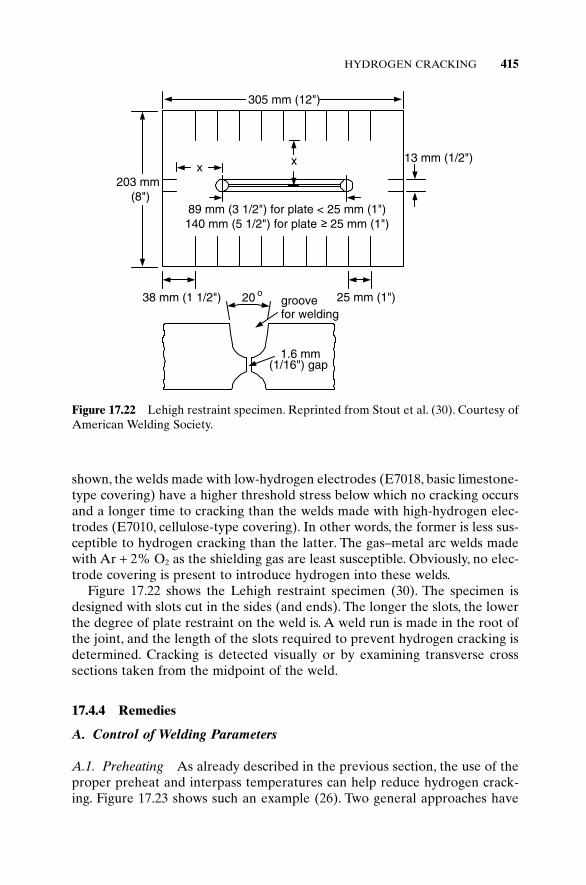
shown, the welds made with low-hydrogen electrodes (E7018, basic limestone-type covering) have a higher threshold stress below which no cracking occursand a longer time to cracking than the welds made with high-hydrogen elec-trodes (E7010, cellulose-type covering). In other words, the former is less sus-ceptible to hydrogen cracking than the latter. The gas–metal arc welds madewith Ar + 2% O2 as the shielding gas are least susceptible. Obviously, no elec-trode covering is present to introduce hydrogen into these welds.
Figure 17.22 shows the Lehigh restraint specimen (30). The specimen isdesigned with slots cut in the sides (and ends). The longer the slots, the lowerthe degree of plate restraint on the weld is. A weld run is made in the root ofthe joint, and the length of the slots required to prevent hydrogen cracking isdetermined. Cracking is detected visually or by examining transverse cross sections taken from the midpoint of the weld.
17.4.4 Remedies
A. Control of Welding Parameters
A.1. Preheating As already described in the previous section, the use of theproper preheat and interpass temperatures can help reduce hydrogen crack-ing. Figure 17.23 shows such an example (26). Two general approaches have
HYDROGEN CRACKING 415
groovefor welding
20 o
1.6 mm(1/16") gap
38 mm (1 1/2") 25 mm (1")
x
305 mm (12")
203 mm(8")
89 mm (3 1/2") for plate < 25 mm (1")140 mm (5 1/2") for plate 25 mm (1")
13 mm (1/2")x
<
Figure 17.22 Lehigh restraint specimen. Reprinted from Stout et al. (30). Courtesy ofAmerican Welding Society.

been used to select the most appropriate temperatures. One approach is touse empirically derived tables that list the steels and the recommendedwelding procedures, including the preheat and interpass temperatures, forinstance, for various grades of carbon steels (14) and low-alloy steels (15). Theother approach is to relate the cracking tendency to the hardenability of steelsbased on the carbon equivalence. One such formula for the carbon equiva-lence of alloy steel is as follows (34):
(17.1)
Figure 17.24 shows the recommended preheat and interpass temperaturesbased on this formula (34).
A.2. Postweld Heating Postweld heat treatment, as described in the previoussection, can be used to stress relieve the weld before it cools down to roomtemperature. In the event that stress relief heat treatment cannot be carriedout immediately upon completion of welding, the completed weldment can beheld at a proper temperature to allow austenite to transform into a less sus-ceptible microstructure than martensite. Postweld heating can also help hydro-gen diffuse out of the workpiece (Chapter 3). For most carbon steels, thepostweld heat treatment temperature range is 590–675°C (1100–1250°F) (14).
A.3. Bead Tempering Bead tempering in multiple-pass welding can also beeffective in reducing hydrogen cracking. This has been described previously.
B. Use of Proper Welding Processes and Materials
B.1. Use of Low-Hydrogen Processes and Consumables The use of lowerhydrogen welding processes (such as GTAW or GMAW insead of SMAW or
Carbon equivalence %C%Mn
6%Si24
%Ni40
%Cr5
%Mo4
= + + + + +
416 TRANSFORMATION-HARDENING MATERIALS
150
300
450
600
20
40
60
80
100
Time to failure (min)100 101 102 103
No preheat80 oC (150 oF) preheat140 oC (250 oF) preheat
Str
ess
(ksi
)
Str
ess
(MP
a)
Figure 17.23 Effect of preheating on hydrogen cracking of a high-strength steel.Reprinted from Gedeon and Eagar (26). Courtesy of American Welding Society.

FCAW) or consumables (such as basic rather than cellulosic SMAW elec-trodes) reduces the amount of hydrogen present in the welding zone (Chapter3). The electrodes should be kept in sealed containers. If they are exposed,they may need to be baked around 300–400°C (600–800°F) to dry them out.
B.2. Use of Lower Strength Filler Metals The use of filler metals of lowerstrength than the base metal can help reduce the stress levels in the HAZ and,hence, the chance of hydrogen cracking.
B.3. Use of Austenitic Stainless Steel Filler Metals Austenitic stainless steelsand Ni-based alloys have been used as the filler metal for welding HTLAsteels. The diffusion coefficient of hydrogen is much lower in austenite (whichincludes Ni-based alloys) than ferrite (Figure 17.17). As such, hydrogen istrapped in the austenitic weld metal and unable to reach the HAZ to causecracking. Furthermore, the good ductility of austenitic weld metal can helpprevent the buildup of excessively high residual stresses in the HAZ, thusreducing the susceptibility of hydrogen cracking.
HYDROGEN CRACKING 417
Figure 17.24 Effect of carbon equivalent on preheat requirement to prevent hydro-gen cracking. Reprinted from Lesnewich (34).

17.5 REHEAT CRACKING
Reheat cracking is a well-recognized problem in low-alloy ferritic steels thatcontain chromium, molybdenum, and sometimes vanadium and tungsten toenhance corrosion resistance and elevated-temperature strength. These alloysteels, sometimes called creep-resistant ferritic steels, are frequently used forelevated-temperature service for nuclear and fossil energy applications.
Creep-resistant ferritic steels are reheated, often to about 550–650°C, afterwelding to relieve stresses and hence reduce susceptibility to hydrogen crack-ing or stress corrosion cracking. However, cracking can occur in the HAZduring reheating. Examples of ferritic steels susceptible to reheat crackinginclude 0.5Cr–0.5Mo–0.25V, 0.5Cr–1Mo–1V, and 2.25Cr–1Mo. Nakamura et al.(35) have proposed the following formula for the effect of alloying elementson crack susceptibility:
(17.2)
When the value of CS is equal to or greater than zero, the steel may be sus-ceptible to reheat cracking.
17.5.1 Appearance
Figure 17.25a shows reheat cracking in a CrMoV steel (27). Cracks are alongthe prior austenite grain boundaries in the HAZ, as shown in Figure 17.25b.Figure 17.26 shows a scanning electron micrograph of the fracture surface in
CS %Cr 3.3 %Mo 8.1 %V 2= + ¥ ( ) + ¥ ( ) -
418 TRANSFORMATION-HARDENING MATERIALS
Figure 17.25 Reheat cracking in a CrMoV steel: (a) macrostructure (magnification¥35); (b) microstructure (magnification ¥1000). The cracks are along the prior austen-ite grain boundaries of the bainitic structure. From Bailey (27).

a 2.25Cr–1Mo steel subjected to a Gleeble thermal weld simulation and atensile stress that was maintained during cooling and throughout reheating atan elevated temperature (36). Intergranular cracking is evident.
17.5.2 Cause
The mechanism of reheat cracking (37–41) is explained as follows. Duringwelding the HAZ near the fusion line is heated to temperatures very high inthe austenite phase field, where preexisting carbides of Cr, Mo, and V dissolveand the austenite grains grow. Subsequent rapid cooling does not allow enoughtime for carbides to reprecipitate, resulting in supersaturation of these alloy-ing elements as the austenite transforms to martensite (if hardenability is suf-ficient). When the coarse-grained HAZ is reheated to elevated temperaturefor stress relieving, fine carbides precipitate at dislocations in the prior austen-ite grain interiors and strengthen them before stresses are relieved. Since the grain interiors are strengthened more than the grain boundaries and sincethis occurs before stresses are relieved, cracking can occur along the grainboundaries.
17.5.3 Susceptibility Tests
The reheat cracking susceptibility can be evaluated by measuring the extentof crack growth in a compact tension specimen (42) or simply a CharpyV-notch specimen (43), which is loaded and kept at the reheat temperature(say around 600°C). The Vinckier test shown in Figure 17.27 has also beenused (44). The test specimens are made by welding two pieces of 50-mm-thickplates together. The ends of the test specimens are welded to a stainless steelblock. Upon reheating, the test specimens are subjected to tensile loadingcaused by the higher thermal expansion coefficient of the stainless steel block.
REHEAT CRACKING 419
Figure 17.26 SEM micrograph of the fracture surface of a 2.25Cr–1Mo ferritic steelcaused by reheat cracking. Reprinted from Nawrocki et al. (36). Courtesy of AmericanWelding Society.

The following formula (44) can be used to determine the overall strain in thetest specimen:
(17.3)
where e is the overall strain in the test specimen, a the thermal expansion co-efficient, E Young’s modulus, T the reheat temperature, and A the cross-sectional area. Subscripts 1 and 2 refer to the test specimen and the stainlesssteel block, respectively. Figure 17.25a, in fact, is the macrograph of the HAZof a Vinckier test specimen.
17.5.4 Remedies
Multiple-pass welding has been reported to reduce reheat cracking in creep-resistant ferritic steels (42, 43, 45). Figure 17.28 shows the results of a new
es a a
11
1
2 1
1 1 2 2 1= =
-( )( ) +E
TE A E A
420 TRANSFORMATION-HARDENING MATERIALS
Figure 17.27 Vinckier test for reheat cracking. From Glover et al. (44).
Figure 17.28 SEM micrographs of fracture surfaces of a 2.4Cr–1.5W–0.2V ferriticsteel: (a) single-pass sample; (b) multiple-pass sample. Reprinted from Nawrocki et al.(36, 45). Courtesy of American Welding Society.

ferritic steel, 2.4Cr–1.5W–0.2V, that was subjected to a Gleeble weld thermalsimulation and a tensile stress that was maintained during cooling and through-out reheating to elevated temperatures (45). With a single simulated weld pass(36), reheat cracking is evident from the brittle intergranular failure modeshown in Figure 17.28a. With two simulated weld passes (45), however, reheatcracking is avoided, as evident from the microvoid coalescence failure modeshown in Figure 17.28b and the increase in the time to failure. Figure 17.29
REHEAT CRACKING 421
1. 1315 degrees C
- austenite ( )- alloying elements dissolve
- lath martensite- alloying elements trapped in solution- may be some undissolved carbides
Single-pass simulation Multi-pass simulation
2. After cooling to room temperature from first pass
3. After second pass cooled to room temperature
- reduced austenite grain and packet size- interlath and intralath carbides- undissolved carbides at prior austenite grain boundaries- possible tempering of 1st pass structure
4. After post-weld heat treatment
voidsperpendicularto tensile axis
strain concentrated insoft denuded zone
5. Tensile stress applied
elemental segregation at prioraustenite grain boundaries
precipitate-freedenuded zonegrain boundary carbides
alloy carbides in grain interiors
- carbides have coarsened
gg
Figure 17.29 Microstructural changes and failure mode of single- and multiple-passsamples of a 2.4Cr–1.5W–0.2V ferritic steel. Modified from Nawrocki et al. (45).Courtesy of American Welding Society.

explains the effect of the multiple-pass weld procedure (45).With a single-passweld procedure, the grains are coarse. As mentioned previously, during re-heating fine carbides precipitate at dislocations in the grain interior. Mean-while, coarse carbides can also form at the grain boundaries and deplete the adjacent region of carbide-forming alloying elements. This can cause a precipitation-free denuded zone to form along the grain boundaries. As such,fine carbides strengthen the grain interiors and the precipitation-free denudedzone, if it is present, can weaken the grain boundaries. In any case, since thegrain interiors are strengthened more than the grain boundaries, intergranu-lar cracking occurs along the grain boundaries. With a multiple-pass weld pro-cedure, however, the coarse grains are refined, fine grain interior carbidescoarsen, and there is no longer a precipitation-free denuded zone along thegrain boundaries.
Reducing the level of residual stresses, which can be achieved by minimiz-ing the restraint during welding, can also reduce reheat cracking in creep-resistant ferritic steels. Stress concentrations, such as fillet toes and prior liqua-tion cracks, tend to accentuate the problem. As in heat-treatable nickel-basealloys, rapid heating through the carbide precipitation range, if possible, canalso be considered. Based on the crack susceptibility C curves shown in Figure17.30, this seems more feasible with 2.25Cr–1Mo than with 0.5Cr–Mo–V (46).
17.6 LAMELLAR TEARING
17.6.1 Cause
The cause of lamellar tearing in welded structures has been described byseveral investigators (47–52). In brief, it is the combination of high localizedstresses due to weld contraction and low ductility of the base metal in itsthrough-thickness direction due to the presence of elongated stringers of nonmetallic inclusions parallel to its rolling direction. Tearing is triggered by
422 TRANSFORMATION-HARDENING MATERIALS
Time to fracture, min.0.1 1 10 100 1000
500
600
700
Unb
roke
nC steel
5Cr Mo9Cr 1Mo
CrMoV12
Test
tem
pera
ture
, o C
1Cr Mo1212
MoB12
Cr 1Mo2 14
Figure 17.30 Temperature vs. time to fracture in ferritic steels. From Murray (46).
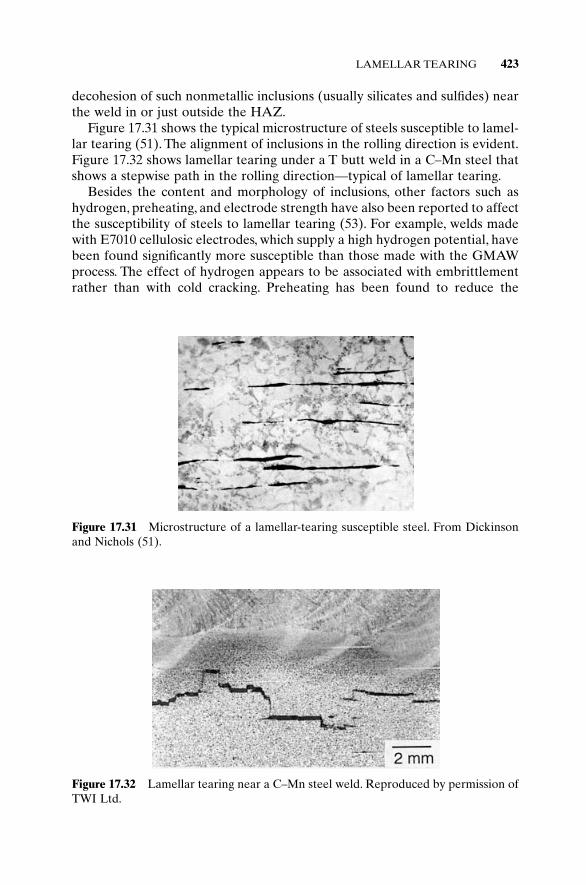
decohesion of such nonmetallic inclusions (usually silicates and sulfides) nearthe weld in or just outside the HAZ.
Figure 17.31 shows the typical microstructure of steels susceptible to lamel-lar tearing (51). The alignment of inclusions in the rolling direction is evident.Figure 17.32 shows lamellar tearing under a T butt weld in a C–Mn steel thatshows a stepwise path in the rolling direction—typical of lamellar tearing.
Besides the content and morphology of inclusions, other factors such ashydrogen, preheating, and electrode strength have also been reported to affectthe susceptibility of steels to lamellar tearing (53). For example, welds madewith E7010 cellulosic electrodes, which supply a high hydrogen potential, havebeen found significantly more susceptible than those made with the GMAWprocess. The effect of hydrogen appears to be associated with embrittlementrather than with cold cracking. Preheating has been found to reduce the
LAMELLAR TEARING 423
Figure 17.31 Microstructure of a lamellar-tearing susceptible steel. From Dickinsonand Nichols (51).
Figure 17.32 Lamellar tearing near a C–Mn steel weld. Reproduced by permission ofTWI Ltd.

susceptibility to lamellar tearing, especially when high hydrogen potentialswere present (53). It should be noted that preheating, if added to the final con-traction strains in a restrained joint in service, may not be effective in reduc-ing the susceptibility to lamellar tearing. As can be expected, electrodes oflower strength levels provide the weld metal the ability to accommodate forcontraction strains and, therefore, improve the resistance to lamellar tearing.The strength level of the electrode used, of course, cannot be lower than thatrequired by design purposes.
17.6.2 Susceptibility Tests
The lamellar tearing susceptibility of steels can be evaluated in several ways,for instance, the Lehigh cantilever lamellar tearing test (53), the Cranefieldlamellar tearing test (54), and the tensile lamellar tearing test (55). Figure 17.33shows the Lehigh cantilever lamellar tearing test (53). As shown, a multiple-pass weld is made in a V-groove between the test specimen and a beveled 50-mm- (2-in.-) thick beam set at a right angle to it.
17.6.3 Remedies
A practical way of avoiding lamellar tearing is to employ joint designs thatallow the contraction stresses to act more in the rolling direction of the sus-ceptible material and less in the transverse (through-thickness) direction.Figure 17.34 shows the use of one such joint design.
424 TRANSFORMATION-HARDENING MATERIALS
Figure 17.33 The Lehigh cantilever lamellar tearing test. Reprinted from Kaufman etal. (53). Courtesy of American Welding Society.

17.7 CASE STUDIES
17.7.1 Failure of Socket/Pipe Welds (56)
Figure 17.35a shows the fracture region of a saddle socket/pipe weldment. Thesteel pipe (150mm outside diameter) has 0.51% C and 0.75% Mn, and thesteel socket has less than 0.1% C.As shown in Figure 17.35b, underbead crack-ing is evident in the pipe. The microstructure in the area, as shown in Figure17.35c, is martensitic and its hardness level is around 700–800 HV. No pre-heating or postheating was used, and the failure occurred during cooling afterwelding.
17.7.2 Failure of Oil Engine Connecting Rod (57)
Figure 17.36a shows the top end of one of the connecting rods of a verticalfour-cylinder engine. The rod was made from a medium-carbon or low-alloysteel in the hardened-and-tempered condition, according to the microstruc-ture analysis of the base metal. The top end bearings of the connecting rodsin this engine were originally fed with oil from the bottom ends by means ofexternal pipes carried along the side flutes in the rods. Due to the subsequentmodification in the method of lubrication, the holes at the top ends of the rodswere sealed off with deposits of weld metal. The connecting rods failed aboutfive years after the modification. Figures 17.36b shows underbead cracks in theHAZ.The HAZ exhibited a martensitic structure with a hardness of 450 VPN,which was measured with a diamond pyramid and a load of 3kg. Because asmall weld deposit was laid onto a mass of cold metal, the cooling rate wasrather high, resulting in underbead cracking. These cracks served as the start-ing points of fatigue cracking, which led to the final rupture of the rods. Thefracture surface, as shown in Figure 17.36a was smooth, conchoidal, and char-acteristic of that resulting from fatigue.
17.7.3 Failure of Water Turbine Pressure Pipeline (58)
Figure 17.37a shows a big crack along the submerged arc weld of a turbinepressure pipeline. The inside diameter of the pipeline was 1.2m and the wall
CASE STUDIES 425
(a) (b)
No tearingLamellar tearing
Figure 17.34 Lamellar tearing of a corner joint: (a) improper design; (b) improveddesign.

Figure 17.35 Failure in a socket/pipe weldment: (a) fracture region (magnification0.4¥); (b) underbead cracking (magnification 7.5¥); (c) martensitic microstructure in thecracked region (magnification 370¥). Reprinted, with permission, from Naumann (56).
(a) (b)
Figure 17.36 Failure of an oil engine connecting rod: (a) top end of connecting rodshowing fracture surface and weld deposit; (b) section through weld deposit showingunderbead cracking (magnification 3.5¥). From Hutchings and Unterweiser (57).

thickness varied from 6 to 11mm. The pipeline was made from two flat sheetsof steel containing 0.1% C, 0.4% Mn, 0.02% S, and 0.02% P. The pipe had twolongitudinal seams.After the welding of the first seam between the two sheets,a cold-rolling operation followed. Then, the second seam was welded and thepipe was cold rolled again after welding for roundness. The pipe was mountedon saddle supports spaced 14m apart.
Figure 17.37b shows the microstructure around the fracture area.As shown,lamellar tearing, possibly due to stringers of nonmetallic inclusions of sulfurand phosphorus, was evident. The cold-rolling operation, the gravity forceacting on the part of the pipeline between the saddle supports, and the inter-nal pressure cycles could have all contributed to the stresses required forlamellar tearing.
REFERENCES
1. Verein, Deutscher Eisenhuttenlcute, Steel—A Handbook for Materials Researchand Engineering, Vol. 1: Fundamentals, Springer Verlag, Berlin, 1992, p. 175.
2. Albutt, K. J., and Garber, S., J. Iron Steel Inst., 204: 1217, 1966.3. Nippes, E. F., and Savage, W. F., Weld. J., 28: 534s, 1949.4. Nippes, E. F., and Nelson, E. C., Weld. J., 37: 30s, 1958.5. Nippes, E. F., Savage, W. F., and Paez, J. M., Weld. J., 38: 475s, 1959.
REFERENCES 427
Figure 17.37 Failure of a water turbine pressure pipeline (58): (a) cracking in thepipeline; (b) weld microstructure along the crack showing lamellar tearing.

6. D’Andrea, M. M. Jr., and Adams, C. M. Jr., Weld. J., 42: 503s, 1963.7. Kou, S., Welding Metallurgy, 1st ed., Wiley, New York, 1987.8. Welding Handbook, 7th ed, Vol. 4, American Welding Society, Miami, FL, 1982,
p. 9.9. Chadwick, G. A., Metallography of Phase Transformations, Crane, Russak and Co.,
New York, 1972.10. Evans, G. M., Weld. J., 59: 67s, 1980.11. Kou, S., Sun, D. K., and Le, Y., Metall. Trans., 14A: 643, 1983.12. Aidun, D. K., and Savage, W. F., Weld. J., 63: 1984; 64: 97s, 1985.13. Atlas of Isothermal Transformation and Cooling Transformation Diagrams,
American Society for Metals, Metals Park, OH, 1977.14. Smith, R. B., in ASM Handbook, Vol. 6: Welding, Brazing and Soldering, ASM
International, Materials Park, OH, 1993, p. 641.15. Winsor, F. J., in ASM Handbook, Vol. 6: Welding, Brazing and Soldering, ASM
International, Materials Park, OH, 1993, p. 662.16. Homma, H., Ohkida, S., Matsuda, and Yamamoto, K., Weld. J., 66: 301s, 1987.17. Yurika, N., paper preseuted at Fifth International Symposium, Japan Welding
Society, Tokyo, April 1990.18. Inagaki, M., et al., Fusion Welding Processing, Seibundo Shinko Sha, Tokyo, 1971
(in Japanese).19. Linnert, G. E., Welding Metallurgy, 3rd ed., Vol. 2, American Welding Society.
Miami, FL, 1967.20. Granjon, H., in Cracking and Fracture in Welds, Japan Welding Society,Tokyo, 1972,
p. IB1.1.21. Coe, F. R., Welding Steels without Hydrogen Cracking, Welding Institute,
Cambridge, 1973.22. Troiano, A. R., Trans. ASM, 52: 54, 1960.23. Petch, H. J., Nature, 169: 842, 1952.24. Beachem, C. D., Metal. Trans., 3: 437, 1972.25. Savage, W. F., Nippes, E. F., and Szekeres, E. S., Weld. J., 55: 276s, 1976.26. Gedeon, S. A., and Eagar, T. W., Weld. J., 69: 213s, 1990.27. Bailey, N., in Residual Stresses, Welding Institute, Cambridge, 1981, p. 28.28. Welding Metallography, Metallurgical Services Laboratories, Betchworth, Surrey,
United Kingdom 1970, p. 22.29. Sawhill, J. M. Jr., Dix, A. W., and Savage, W. F., Weld. J., 53: 554s, 1974.30. Stout, R. D., Tor, S. S., McGeady, L. J., and Doan, G. E., Weld. J., 26: 673s, 1947.31. Savage, W. F., Nippes, E. F., and Husa, E. I., Weld. J., 61: 233s, 1982.32. Cottrell, C. L. M., Weld. J., 32: 257s, 1953.33. Vasudevan, R., Stout, R. D., and Pense, A. W., Weld. J., 60: 155s, 1981.34. Lesnewich, A., in ASM Handbook, Vol. 6: Welding, Brazing and Soldering, ASM
International, Materials Park, OH, 1993, p. 408.35. Nakamura, H., Naiki, T., and Okabayashi, H., in Proceedings of the First Interna-
tional Conference on Fracture, Sendai, Japan, Vol. 2, 1966, p. 863.
428 TRANSFORMATION-HARDENING MATERIALS

36. Nawrocki, J. G., Dupont, J. N., Robino, C. V., and Marder, A. R., Weld. J., 79: 355s,2000.
37. Swift, R. A., Weld. J., 50: 195s, 1971.38. Swift, R. A., and Rogers, H. C., Weld. J., 50: 357s, 1971.39. Meitzner, C. F., WRC Bull., 211: 1, 1975.40. McPherson, R., Metals Forum, 3: 175, 1980.41. Dhooge, A., and Vinckier, A., Weld. World, 30: 44, 1992.42. Gooch, D. J., and King, B. L., Weld. J., 59: 10s, 1980.43. Batte, A. D., and Murphy, M. C., Metals Technol., 6: 62, 1979.44. Glover, A. G., Jones, W. K. C., and Price, A. T., Metals Technol., 4: 326, 1977.45. Nawrocki, J. G., Dupont, J. N., Robino, C. v., and Marder, A. R., Weld. J., 80: 18s,
2001.46. Murray, J. D., Br. Weld. J., 14: 447, 1967.47. Kihara, H., Suzuki, H., and Ogura, N., J. Jpn. Weld. Soc., 24: 94, 1956.48. Jubb, J. E. M., Weld. Res. Council Bull., 168: 1971.49. Ganesh, S., and Stout, R. D., Weld. J., 55: 341s, 1976.50. Skinner, D. H., and Toyama, M., Weld. Res. Council Bull., 232: 1977.51. Dickinson, F. S., and Nichols, R. W., in Cracking and Fractures in Welds, Japan
Welding Society, Tokyo, 1972, p. IA4.1.52. Bailey, N., Weldability of Ferritic Steels, Arbington Publishing, Arbington
Hall, Cambridge, England, and ASM International, Materials Park, OH, 1994,p. 103.
53. Kaufman, E. J., Pense, A. W., and Stout, R. D., Weld. J., 60: 43s, 1981.54. Kanazawa, S., Weld. Res. Abroad, 21(5): 2, 1975.55. Wold, G., and Kristoffersen, T., Sverseteknikk, 27: 33, 1972.56. Naumann, F. K., Failure Analysis: Case Histories and Methodology, Riederer Verlag
GmbH, Stuttgart, Germany, and American society for Metals, Metals Park, OH,1983.
57. Hutchings, F. R., and Unterweiser, P. M., Failure Analysis: The British Engine Tech-nical Reports, American Society of Metals, Metals Park, OH, 1981.
58. Fatigue Fractures in Welded Constructions, Vol. II, International Institute ofWelding, London, 1979.
FURTHER READING
1. ASM Handbook, Vol. 6: Welding, Brazing and Soldering, ASM International,Materials Park, OH, 1993, pp. 70–87, 405–415, 641–676.
2. Easterling, K., Introduction to the Physical Metallurgy of Welding, 2nd ed.,Butterworths, London, 1992.
3. Bailey, N., Weldability of Ferritic Steels, Arbington Publishing, Cambridge, 1994.4. Evans, G. M., and Bailey, N., Metallurgy of Basic Weld Metal, Arbington Publishing,
Cambridge, 1997.
FURTHER READING 429

PROBLEMS
17.1 In welding quenched-and-tempered alloy steels, the maximum allow-able heat input per unit length of weld can be higher, say by about 25%,in T-joints than in butt joints. Explain why.
17.2 Type E14018 electrodes have been recommended for SMAW of HY-130steel. (a) A moisture level lower than 0.1% in the electrode covering isrequired. Explain why such a low moisture level is required. (b) It issuggested that in multipass welding an interpass temperature not lessthan 60°C (135°F) be maintained for 1h or longer between two con-secutive passes. Explain why such a long waiting time is suggested.
17.3 Would you consider using the electroslag welding process for weldingquenched-and-tempered alloy steels and heat-treatable alloy steelsrequiring postweld heat treatment? Why or why not?
17.4 It has been observed that 2.25Cr–1Mo steel specimens subjected to asimulated HAZ thermal cycle with a peak temperature of 1000°Cexhibit intragranular cracking when reheated to 500–700°C understrain. However, under the same testing conditions the same specimenssubjected to a simulated thermal cycle with a 1350°C peak temperatureexhibit intergranular cracking typical of reheat cracking. Can youcomment on these observations from the viewpoint of grain growth andcarbide dissolution at high temperatures and carbide reprecipitationduring reheating?
17.5 A fatigue failure was reported in the main leaf of a large laminatedspring used in heavy motive machinery. The spring consisted of alloysteel sections heat treated to spring temper. It was found that fatiguecracking originated from the martensite under a weld spatter acciden-tally formed during welding repairs to the undercarriage. (a) Explainhow martensite had formed. (b) Comment on the danger of spattering,careless arc striking, and accidentally touching some part of the struc-ture with the electrode.
17.6 The development of the high-speed ESW process has led to a signifi-cant improvement in weld toughness over the conventional ESWprocess. One technique of achieving high welding speed is through theaddition of metal powder into the molten slag. In some structural steelsthe maximum grain size in the HAZ has been reduced from 500 to 250mm, resulting in significantly better joint toughness. Explain why thereduction in HAZ grain size can be obtained by adding metal powder.
430 TRANSFORMATION-HARDENING MATERIALS
18 Corrosion-Resistant Materials:Stainless Steels
Stainless steels are widely used in various industries because of their resistanceto corrosion. The welding of stainless steels, especially the austenitic grades, isimportant in energy-related systems, for instance, power generation and petro-chemical refining systems. Table 18.1 summarizes typical welding problems instainless steels and some recommended solutions. The problems associatedwith the fusion zone and the partially-melted zone have been addressed inprevious chapters.This chapter focuses on HAZ phenomena in stainless steels.
18.1 CLASSIFICATION OF STAINLESS STEELS
Stainless steels are a class of Fe-base alloys that are noted for their high cor-rosion and oxidation resistance. They usually contain from 12 to 27% Cr and1 to 2% Mn by weight, with the addition of Ni in some grades.A small amountof carbon is also present, either deliberately added or as an unavoidable impu-rity. As shown in Table 18.2, stainless steels can be classified into three majorcategories based on the structure: ferritic, martensitic, and austenitic (1).
18.1.1 Ferritic Stainless Steels
These are composed mainly of a bcc phase. Chromium (bcc) tends to stabilizea-Fe (bcc) and its high-temperature counterpart d-Fe (bcc), which merge toform the so-called closed g loop, as shown in Figure 18.1 (2). It can be said thatferritic stainless steels have metallurgical characteristics similar to those ofFe–Cr alloys containing sufficient (more than about 12%) Cr to remainoutside the g loop. They are essentially ferritic over the whole solid-state tem-perature range. To avoid forming an excessive amount of the brittle s phase,however, the maximum Cr content of ferritic stainless steels is in general keptbelow 27%.
18.1.2 Martensitic Stainless Steels
These stainless steels can be said to behave like Fe–Cr alloys containing lessthan about 12% Cr (inside the g loop). These alloys solidify as d-ferrite and
431
Welding Metallurgy, Second Edition. Sindo KouCopyright 2003 John Wiley & Sons, Inc.
ISBN: 0-471-43491-4
transform to austenite during cooling. When the cooling rate is sufficientlyrapid, as in the case of welding, the austenite that forms transforms intomartensite. It should be emphasized that the Fe–Cr phase diagram can be usedonly as a convenient basis for distinguishing the above two different structuralcategories of stainless steels. The presence of minor elements, especiallycarbon, can significantly displace the boundaries of the austenite and ferriteranges. These effects will be considered later in this chapter.
18.1.3 Austenitic Stainless Steels
The addition of Ni (fcc) into Fe–Cr alloys, as shown in Figure 18.2, tends towiden the range over which austenite (fcc) exists and increase its stability atlow temperatures (3). Generally speaking, austenitic stainless steels contain atleast 15% Cr and enough Ni to maintain a stable austenitic structure over thetemperature range from 1100°C to room temperature without the formation
432 CORROSION-RESISTANT MATERIALS: STAINLESS STEELS
TABLE 18.1 Typical Welding Problems in Stainless Steels
SectionsTypical Problems Solutions in book
Austenitic Solidification cracking Use proper filler wires anddilution to keep 4–10% 11.4ferrite
Weld decay Use stabilized grades (321 347) or low-carbon grades (304L and 316L)
Postweld heat-treat to 18.2dissolve carbides, followedby quenching
Knife-line attack (in Use low-carbon gradesstabilized grades) Add La and Ce to stabilized
grades 18.2Postweld heat-treat to
dissolve carbidesHot cracking in partially Switch from 347 to 304 or 316 13.1
melted zone Use low heat inputs 13.2
Ferritic Low toughness due to HAZ Use low heat inputs or addgrain growth and grain- carbide and nitride formersboundary martensite to suppress grain growth 18.3
Add Ti or Nb to reducemartensite
Martensitic Hydrogen cracking Preheat and postheatUse low-hydrogen or
austenitic stainless steel 18.4electrodes

of martensite (4). For instance, for a stainless steel bearing 15–16% Cr, about6–8% Ni is required. The most widely used stainless steel is 304 stainless steel.It is also known as 18-8 stainless steel because of its composition of 18% Crand 8% Ni.
18.2 AUSTENITIC STAINLESS STEELS
18.2.1 Weld Decay
The HAZ of austenitic stainless steels containing more than about 0.05% Ccan be susceptible to a form of intergranular corrosion called weld decay.Figure 18.3 shows the microstructure in the HAZ of a 0.05% C 304 austeniticstainless steel subjected to an accelerated corrosion test (5). The preferentialattack at the grain boundaries is evident.
AUSTENITIC STAINLESS STEELS 433
TABLE 18.2 Nominal Composition of Wrought Stainless Steels
Nominal Composition (%)
AISI Type C Mn Cr Ni Other
Austenitic grades301 0.15 max 2.0 16–18 6–8302 0.15 max 2.0 17–19 8–10304 0.08 max 2.0 18–20 8–12304L 0.03 max 2.0 18–20 8–12309 0.20 max 2.0 22–24 12–15310 0.25 max 2.0 24–26 19–22316 0.08 max 2.0 16–18 10–14 2–3% Mo316L 0.03 max 2.0 16–18 10–14 2–3% Mo321 0.08 max 2.0 17–19 9–12 (5 ¥ %C) Ti min347 0.08 max 2.0 17–19 9–13 (10 ¥ %C) Nb–Ta min
Martensitic grades403 0.15 max 1.0 11.5–13410 0.15 max 1.0 11.5–13416 0.15 max 1.2 12–14 0.15% S min420 0.15 min 1.0 12–14431 0.20 max 1.0 15–17 1.2–2.5440A 0.60–0.75 1.0 16–18 0.75% Mo max440B 0.75–0.95 1.0 16–18 0.75% Mo max440C 0.95–1.20 1.0 16–18 0.75% Mo max
Ferritic grades405 0.08 max 1.0 11.5–14.5 0.1–0.3% Al430 0.15 max 1.0 14–18446 0.20 max 1.5 23–27
Source: Fisher and Maciag (1).
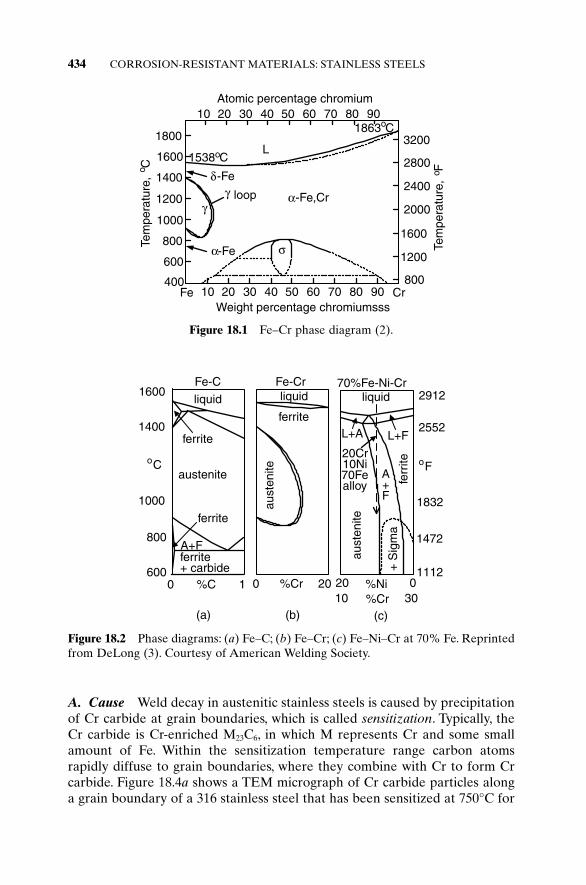
A. Cause Weld decay in austenitic stainless steels is caused by precipitationof Cr carbide at grain boundaries, which is called sensitization. Typically, theCr carbide is Cr-enriched M23C6, in which M represents Cr and some smallamount of Fe. Within the sensitization temperature range carbon atomsrapidly diffuse to grain boundaries, where they combine with Cr to form Crcarbide. Figure 18.4a shows a TEM micrograph of Cr carbide particles alonga grain boundary of a 316 stainless steel that has been sensitized at 750°C for
434 CORROSION-RESISTANT MATERIALS: STAINLESS STEELS
-Fe,Cr
Weight percentage chromiumsss
L
Fe Cr
1863oC
1538oC
10 20 30 40 50 60 70 80 90400
600
800
1000
1200
1400
1600
1800
1200
800
1600
2000
2400
2800
3200Te
mpe
ratu
re,
o C
Tem
pera
ture
, o F
10 20 30 40 50 60 70 80 90Atomic percentage chromium
loop
-Fe
-Fe
γδ
α
αγ
σ
Figure 18.1 Fe–Cr phase diagram (2).
liquid
ferrite
austenite
ferrite
ferrite+ carbide
A+F
Fe-Cliquid liquid
ferritefe
rrite
L+FL+A
20Cr10Ni70Fealloy
aust
enite
aust
enite
A+F
+ S
igm
aFe-Cr 70%Fe-Ni-Cr
0 %C 1 0 %Cr 20 20 %Ni 010 %Cr 30
(a) (b) (c)
600
800
1000
1400
1600
oC oF
1112
1472
1832
2552
2912
Figure 18.2 Phase diagrams: (a) Fe–C; (b) Fe–Cr; (c) Fe–Ni–Cr at 70% Fe. Reprintedfrom DeLong (3). Courtesy of American Welding Society.

Figure 18.3 Intergranular corrosion in HAZ of a 304 stainless steel containing 0.05%C. From Fukakura et al. (5).
(a)
(b)
Figure 18.4 Chromium carbide precipitation at a grain boundary in 316 stainless steel:(a) TEM micrograph; (b) Cr concentration profile across grain boundary. From Magulaet al. (6).

1h (6). Composition analyses show that these particles contain 63–71wt % Cr.The Cr concentration distribution measured along the straight line in Figure18.4a is shown in Figure 18.4b, and it clearly indicates Cr depletion at the grainboundary. Because of Cr carbide precipitation at the grain boundary, the areasadjacent to the grain boundary are depleted of Cr, as shown schematically inFigure 18.5. These areas become anodic to the rest of the grain and hence arepreferentially attacked in corrosive media, resulting in intergranular corrosion(Figure 18.3).
Figure 18.6 shows the isothermal precipitation or time–temperature–sensiti-zation (TTS) curves of a 304 stainless steel containing 0.05% C (7). As shown,the sensitization temperature range of Cr carbide is about 600–850°C. Figure18.7 shows the solvus curves of Cr23C6 and TiC (and NbC) in 18Cr–8Ni stain-less steel (8). The marked areas indicate the precipitation temperature ranges
436 CORROSION-RESISTANT MATERIALS: STAINLESS STEELS
Grain boundaryCr-depleted zone
Cr-carbide precipitate
Grain
Grain
Grain
Figure 18.5 Grain boundary microstructure in sensitized austenitic stainless steel.
M23C6 precipitates}
M23C6 does not precipitate}
Holding temp.
Holding temp.1100oC
Curve 1
Curve 2
0.05%C
0.01 0.1 1 10
550
0
650
750
850
950
Time (min)
Tem
pera
ture
(o C
)
Curve 1Curve 2
Figure 18.6 Isothermal precipitation curve for Cr23C6 in 304 stainless steel. FromIkawa et al. (7).

of the carbides, about 600–850°C for Cr23C6 and up to about 1100°C for TiC.Chromium carbide dissolves at temperatures above its solvus curve. Uponcooling slowly from above the solvus temperature, Cr carbide can precipitateagain. However, if the cooling rate is high, Cr carbide may not have enoughtime to precipitate and the material can be supersaturated with free carbon.
Solomon and Lord (9–11) have reported TTS curves for 304 stainless steelwith 0.077% C. It was also observed that deformation prior to welding or strainduring cooling can enhance sensitization. According to Solomon (12), this isperhaps due to the fact that dislocations can increase the carbide nucleationrate and the diffusion rate.
Weld decay does not occur immediately next to the fusion boundary, wherethe peak temperature is highest during welding. Instead, it occurs at a shortdistance away from it, where the peak temperature is much lower. This phe-nomenon can be explained with the help of thermal cycles during welding, asshown in Figure 18.8. At position 1 near the fusion boundary, the materialexperiences the highest peak temperature and cooling rate (Chapter 2). Con-sequently, the cooling rate through the precipitation range is too high to allowCr carbide precipitation to occur. At position 2, which is farther away fromthe fusion line, the retention time of the material in the sensitization tempera-ture range is long enough for precipitation to take place. At position 3,outside the HAZ, the peak temperature is too low to allow any precipitation.Figure 18.9 shows thermal cycles measured during the welding of 304 stain-less steel and the location of the resultant weld decay (13). Consider themicrostructure of a 304 stainless steel weld shown previously in Figure 14.6.At position c, which is away from the fusion boundary, the thick, dark grainboundaries are the evidence of weld decay due to grain boundary precipita-
AUSTENITIC STAINLESS STEELS 437
TiC so
lvus
Cr 23C 6
solvus
0.05 0.1 0.20
400
600
800
1000
1200
1400
Tem
pera
ture
, oC
Carbon content, wt%
TiCprecipitation
Cr23
C6
precipitation
NbC so
lvus
Figure 18.7 Solvus curves for Cr23C6 and TiC in 304 stainless steel. Modified fromPrinciple and Technology of the Fusion Welding of Metals (8).

tion.At position e, which is immediately adjacent to the fusion boundary, thereare no signs of grain boundary precipitation.
B. Effect of Carbon Content The carbon content of the material can affectthe degree of sensitization. As shown in Figure 18.10, sensitization takes place
438 CORROSION-RESISTANT MATERIALS: STAINLESS STEELS
a b c d
area of weld decay
Tem
pera
ture
, oC 1000
870
650
500
10 2000
a
b
c
d
Time, sec
7 sec
9 sec
weld
Figure 18.9 Thermal cycles and weld decay in 304 stainless steel weld. Modified fromFontana and Greene (13).
Cr23C6 at grain
boundaries
Cr23C6precipitation
(d)
3
FZ
1
sensitized region
1
2
3
Time, t(b)
+Cr23C6
(c) Time, t
Ta
Tem
pera
ture
, T
(a) wt%, C
Co
2
T T
solv
us
TbCr23C6precipitationC-curve
Weld decay inausteniticstainless steel
α
α
Figure 18.8 Sensitization in austenitic stainless steel: (a) phase diagram; (b) thermalcycle; (c) precipitation curve; (d) microstructure.

more rapidly in 304 stainless steel as its carbon content is increased (14). Ikawaet al. (14) showed that under a given heat input and welding speed weld decayin 304 stainless steel increases with increasing carbon content.
C. Effect of Heat Input Ikawa et al. (14) also showed that for a 304 stain-less steel of a given carbon content weld decay increases with increasing heatinput per unit length of weld. The higher the heat input, the wider the regionof sensitization and the longer the retention time in the sensitization tempera-ture range. It is interesting to point out that in the case of resistance spotwelding the metal is rapidly heated by a momentary electric current followedby a naturally rapid cooling, As such, sensitization may not occur (13).
D. Remedies Weld decay in austenitic stainless steels can be avoided asfollows (15)
D.1. Postweld Heat Treatment The weldment can be heat treated at1000–1100°C followed by quenching. The high-temperature heat treatmentdissolves the Cr carbide that has precipitated during welding, and quenchingprevents its re-formation. This treatment is not always possible, however,because of the size and/or the quenching-induced distortion of the weldment.
D.2. Reduction of Carbon Content Low-carbon grades such as 304L and316L stainless steels can be used. These stainless steels are designed to haveless than 0.035% C to reduce susceptibility to weld decay (Table 18.2). Figure18.11 shows that alloy 316L is much less susceptible to sensitization than alloy316 (6). The TTS curve of the former is much farther to the right (longer time)than that of the latter.
D.3. Addition of Strong Carbide Formers Elements such as titanium (Ti) andniobium (Nb) have a higher affinity for C than Cr and thus form carbides moreeasily than Cr. Types 321 and 347 stainless steels are essentially identical to
AUSTENITIC STAINLESS STEELS 439
0.07%C 0.05%C
0.0385%C0.03%C
0.01 0.1 1 10 100 10000
550650750850950
Time, min
Tem
pera
ture
, o C
Figure 18.10 Effect of carbon content on isothermal precipitation of Cr23C6 in 304stainless steel. From Ikawa et al. (14).

304 stainless steel except for the addition of Ti and Nb, respectively. As shownin Figure 18.12, the stabilized grade is more resistant to weld decay since Crcarbide precipitation is suppressed during welding (16).
18.2.2 Knife-Line Attack
Although stabilized austenitic stainless steels such as 321 and 347 are not sus-ceptible to weld decay, they can be susceptible to a different kind of inter-granular corrosion attack, called knife-line attack. Like weld decay, knife-lineattack is also caused by precipitation of Cr carbide at grain boundaries. Knife-line attack differs from weld decay in two ways: (i) knife-line attack occurs ina narrow region immediately adjacent to the weld metal and (ii) knife-lineattack occurs in stabilized-grade stainless steels (13, 17). Figure 18.13 showsknife-line attack next to the weld metal (left) in a 321 stainless steel.
440 CORROSION-RESISTANT MATERIALS: STAINLESS STEELS
1oC
.5oC
.2oC
.1oC
.05oC
316, not etched316, etched316L, not etched316L, etched
.01 .1 1 10 100Time (h)
400
500
600
700
800
900
1000
Tem
pera
ture
(oC
)
930oC
Figure 18.11 Intergranular attack (etching) of 316 and 316L stainless steels by oxalicacid. From Magula et al. (6).
Figure 18.12 Welds in austenitic stainless steels: (a) weld decay in 304 stainless steel;(b) no weld decay in 321 stainless steel. From Linnert (16).

A. Cause Knife-line attack in stabilized austenitic stainless steels can beexplained with the help of thermal cycles during welding, as shown in Figure18.14. Position 1 is very close to the fusion boundary and is thus subjected toa high peak temperature and a high cooling rate during welding. Since this
AUSTENITIC STAINLESS STEELS 441
Figure 18.13 Knife-line attack in a stabilized austenitic stainless steel. Reproduced bypermission of TWI, Ltd.
Cr23
C6 at grain
boundaries
(d) FZ 1
sensitized region
1
2
Time, t(b)
+ TiC
(c) Time, t
TL
Tem
pera
ture
, T
(a) wt%, C
Co
2
T
T
solv
us
Ta
TiCprecipitationC-curve
TiC reversion
melting
Knife-line attack in321 stainless steel
α
α
Figure 18.14 Sensitization in stabilized austenitic stainless steel: (a) phase diagram;(b) thermal cycle; (c) precipitation curve; (d) microstructure.

peak temperature is above the solvus temperature of Ti carbide,Ti carbide dis-solves in this area. Due to the rapid cooling rate through its precipitation tem-perature range, Ti carbide does not reprecipitate during cooling, thus leavingabundant free carbon atoms in this area. When the weld is reheated in the Crcarbide precipitation range (for stress-relief or in multiple-pass welding), Ticarbide does not form appreciably since the temperature level is not highenough. Consequently, Cr carbide precipitates at grain boundaries, and thisarea becomes susceptible to intergranular corrosion attack. Position 2, how-ever, is not susceptible because of its low peak temperature. Because of thehigh temperate gradient near the fusion boundary (this is especially true for austenitic stainless steels due to the low thermal conductivity) and the highTi carbide dissolution temperature, the region in which Ti carbide dissolvesduring welding is very narrow. As a result, subsequent intergranular corrosionattack occurs in a very narrow strip immediately adjacent to the fusion bounda-ry, and thus the name knife-line attack.
Figure 18.15 shows the transmission electron micrographs in the area imme-diately outside the fusion boundary of a 347 stainless steel (18). Precipitationof Cr carbides is clearly visible at grain boundaries after postweld sensitizingheat treating at 650°C for 50h. Figure 18.16 shows the intergranular corrosionattack in the same area by a corrosive liquid for 15h.
B. Remedies The knife-line attack of stabilized austenitic stainless steels canbe avoided as follows.
B.1. Postweld Heat Treatment Annealing in the temperature range of1000–1100°C after welding helps Cr carbide dissolve. Since Ti carbide and Nbcarbide form in this temperature range (Figure 18.7), subsequent quenchingto avoid Cr carbide precipitation is not necessary.
442 CORROSION-RESISTANT MATERIALS: STAINLESS STEELS
Figure 18.15 Transmission electron micrographs near fusion boundary of 347 stain-less steel. From Ikawa et al. (18).

B.2. Using Low-Carbon Grades As in the case of weld decay, low-carbongrades reduce the chance of Cr carbide precipitation.
B.3. Adjusting Welding Procedure Sometimes, it is possible to avoid knife-line attack by modifying the welding procedure. Figure 18.17 shows one suchexample involving the dual-pass seam weld of a stainless steel pipe of the sta-bilized grade, the first pass on the inside of the pipe and the second pass onthe outside (8). During the deposition of the first pass, Ti or Nb carbide nearits fusion boundary dissolves.As shown in Figure 18.17a, the sensitization tem-perature range (600–850°C) of the second pass overlaps the fusion boundary
AUSTENITIC STAINLESS STEELS 443
Figure 18.16 Intergranular corrosion near fusion boundary of 347 stainless steel.From Ikawa et al. (18).
corrosive liquid
(a)
knife-line attack
sensitizationtemperature range
of 2nd pass
corrosive liquid
(b)
no attack
inner wall
Figure 18.17 Dual-pass weld of stabilized austenitic stainless steel: (a) knife-lineattack; (b) no attack. Modified from Principle and Technology of the Fusion Weldingof Metals (8).

of the first pass at the pipe inner wall and causes Cr carbide to precipitate,thus making the inner wall susceptible to attack by the corrosive liquid insidethe pipe. To correct the problem, the size of the first pass should be increasedand that of the second pass decreased so that the sensitization temperaturerange of the second pass overlaps the fusion boundary of the first pass awayfrom the pipe inner wall, as shown in Figure 18.17b. The problem can also becorrected by making the first pass from the outside of the pipe and the secondpass from the side if this is possible to do.
B.4. Adding Rare Earth Metals It has been shown that adding rare earthmetals (REMs) such as La and Ce can reduce the knife-line attack of stabi-lized stainless steels (18, 19). High-resolution electron micrographs reveal thatcarbide precipitation in the grain interior is accelerated in these materials, thusleaving less free carbon atoms for carbide precipitation at grain boundaries.Figure 18.18 shows the reduction in the rate of intergranular corrosion in a347 stainless steel by addition of a small amount of REMs. As can be seen bycomparing Figure 18.19 with Figure 18.15b, treating with REMs significantlyreduces Cr carbide precipitation at grain boundaries. Similar results have beenobserved in REM-treated 321 stainless steel. Addition of small amounts ofREMs in stabilized stainless steels does not appear to have an adverse effecton their mechanical properties (18).
C. Susceptibility Tests The susceptibility of austenitic stainless steels to welddecay or knife-line attack can be evaluated by the Huey test (13). This test(ASTM A-262) consists of exposure of sensitized materials to boiling 65%nitric acid for five 48-h periods. A less time-consuming method is the Streichertest (13). This test (ASTM A-262–55T) consists of polishing a small specimen,
444 CORROSION-RESISTANT MATERIALS: STAINLESS STEELS
Aswelded Sensitizing time (h)
Cor
rosi
on r
ate
(g/c
m2
h)347SS347SS+0.11REM
1 10 1000
0.5
1.0
1.5
2.0
2.5
3.0x10⁻³
Figure 18.18 Effect of addition of REMs on knife-line attack sensitivity of 347 stain-less steel. From Ikawa et al. (19).

through No. 000 emery paper, etching in 10% oxalic acid for 1.5min under anapplied current density of 1A/cm2, and then examining the surface at 250–500magnification. The specimen is the anode and a stainless steel beaker is usedas the cathode.
18.2.3 Stress Corrosion Cracking
Due to the low thermal conductivity and high thermal expansion coefficientof austenitic stainless steels, severe residual stresses can be present in thesematerials after welding. When exposed to corrosive media, stress corrosion
AUSTENITIC STAINLESS STEELS 445
Figure 18.19 Transmission electron micrograph near fusion boundary of REM-treated 347 stainless steel. From Ikawa et al. (18).
Figure 18.20 Stress corrosion cracking in a 304 stainless steel pipe gas–tungsten arcwelded and exposed to a corrosive liquid.
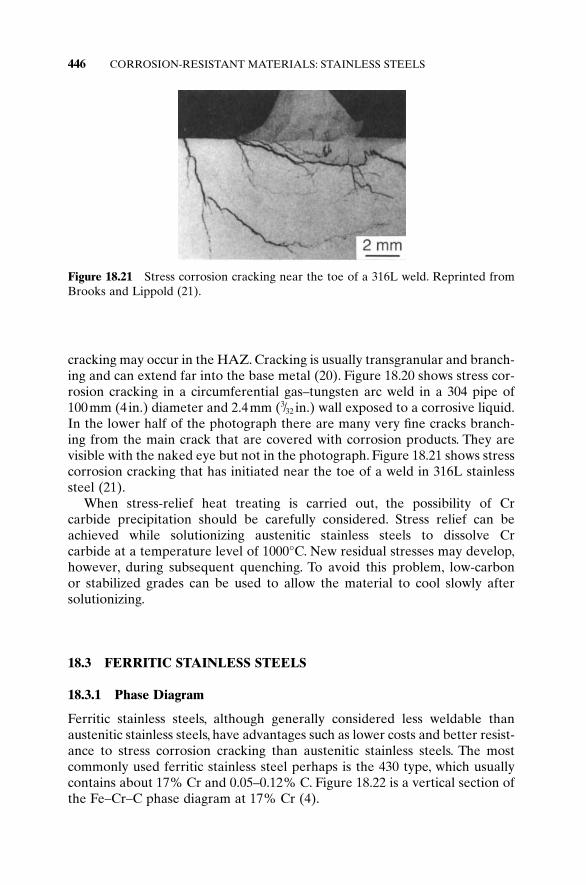
cracking may occur in the HAZ. Cracking is usually transgranular and branch-ing and can extend far into the base metal (20). Figure 18.20 shows stress cor-rosion cracking in a circumferential gas–tungsten arc weld in a 304 pipe of 100mm (4 in.) diameter and 2.4mm (3/32 in.) wall exposed to a corrosive liquid.In the lower half of the photograph there are many very fine cracks branch-ing from the main crack that are covered with corrosion products. They arevisible with the naked eye but not in the photograph. Figure 18.21 shows stresscorrosion cracking that has initiated near the toe of a weld in 316L stainlesssteel (21).
When stress-relief heat treating is carried out, the possibility of Cr carbide precipitation should be carefully considered. Stress relief can beachieved while solutionizing austenitic stainless steels to dissolve Cr carbide at a temperature level of 1000°C. New residual stresses may develop,however, during subsequent quenching. To avoid this problem, low-carbon or stabilized grades can be used to allow the material to cool slowly after solutionizing.
18.3 FERRITIC STAINLESS STEELS
18.3.1 Phase Diagram
Ferritic stainless steels, although generally considered less weldable thanaustenitic stainless steels, have advantages such as lower costs and better resist-ance to stress corrosion cracking than austenitic stainless steels. The most commonly used ferritic stainless steel perhaps is the 430 type, which usuallycontains about 17% Cr and 0.05–0.12% C. Figure 18.22 is a vertical section ofthe Fe–Cr–C phase diagram at 17% Cr (4).
446 CORROSION-RESISTANT MATERIALS: STAINLESS STEELS
Figure 18.21 Stress corrosion cracking near the toe of a 316L weld. Reprinted fromBrooks and Lippold (21).

18.3.2 Sensitization
Sensitization of ferritic stainless steels (such as 430 and 446) is quite differentfrom that of austenitic stainless steels (unstabilized, such as 304). The sensi-tizing range for ferritic stainless steels lies above 925°C, and immunity to inter-granular corrosion is restored by annealing in the range of 650–815°C forabout 10–60min (15). These temperatures are essentially the opposite of those applying to austenitic stainless steels. Because of the high sensitizationtemperature range, the weld decay in ferritic stainless steels occurs close tothe weld metal, rather than at a distance away, as in the case of austenitic stainless steels. Furthermore, unlike in austenitic stainless steels, lowering thecarbon content is not very effective in preventing weld decay in ferritic stain-less steels. In fact, a 430 stainless steel with a carbon content as low as 0.009%C was found still susceptible to weld decay. As in the case of austenitic stain-less steels, addition of Ti or Nb was found helpful (15).
Because the diffusion rates of C and Cr are much higher in ferrite (bcc)than in austenite (fcc), rapid cooling from above 925°C during welding doesnot really suppress precipitation of Cr carbide at grain boundaries in ferriticstainless steels. For the same reason, lowering the carbon content does noteffectively prevent Cr carbide from precipitating, unless the carbon content isextremely low (e.g., 0.002% in 446 stainless steel). According to Uhlig (15),postweld annealing in the range of 650–815°C encourages diffusion of Cratoms to the Cr-depleted region adjacent to Cr carbide precipitates and thushelps reestablish a uniform Cr composition to resist intergranular corrosion.
FERRITIC STAINLESS STEELS 447
LL+δ
δ δ + γ γ
L+ δ + γL+ γ
L+ γ+C 2
γ+C2
γ+C 1+C2
γ+C1
δ + γ +C 1
α+C1
0 0.2 0.4 0.6 0.8 1.0600
800
1000
1200
1400
1600
1110
1470
1830
2190
2550
2910
Carbon content, %
Tem
pera
ture
, °C
Tem
pera
ture
, °F
Figure 18.22 Vertical section of Fe–Cr–C phase diagram at 17% Cr. Reprinted, withpermission, from Castro and De Cadenet (4). Copyright 1974 Cambridge UniversityPress.

18.3.3 Martensite Formation and Grain Growth
Figure 18.23 shows the microstructure of 430 stainless steel in the base metaland the HAZ (22). Position b (away from the fusion boundary) reaches theaustenite formation ranges (d + g + C1 and d + g) of the phase diagram (Figure18.22 at about 0.08%C). Here, austenite formed along grain boundaries and,upon fast cooling during welding, transformed into martensite (Figure 18.23b).Little grain growth took place. Position a (near the fusion boundary), on theother hand, reaches the d-ferrite range and excessive grain growth takes placeat high temperatures (Figure 18.23a). During cooling through the austeniteformation ranges, a considerable amount of austenite formed at the grainboundaries. The austenite appears needlelike because of the large grain sizeand the high cooling rate. During further rapid cooling to room temperature,the austenite transforms into needlelike martensite.
Because of excessive grain coarsening and formation of needlelike marten-site at grain boundaries, the notch toughness of as-welded 430 stainless steel
448 CORROSION-RESISTANT MATERIALS: STAINLESS STEELS
(a) (b)
(c)
Figure 18.23 Microstructure of 430 stainless steel (magnification 212¥): (a) nearfusion boundary; (b) near base metal; (c) base metal. From Kou and Le (22).

is poor. Postweld heat treatment at 800°C (martensite tempering) significantlyimproves the notch toughness. Suppressing martensite formation by adding0.5% Ti or 1% Nb also helps (4). This is probably because both Ti and Nbincrease the stability of d-ferrite, thus suppressing the formation of austenite.Furthermore, as mentioned previously, they tend to form carbides at high tem-peratures. Therefore, the carbon content is reduced and the tendency to formmartensite decreases. Excessive grain growth can be avoided, of course, byusing lower welding heat inputs. It has also been suggested that nitride andcarbide formers such as B,Al,V, and Zr can be added to ferritic stainless steelsto suppress grain growth during welding (23).
18.4 MARTENSITIC STAINLESS STEELS
18.4.1 Phase Diagram
Martensitic stainless steels are employed because of the combination of highstrength and good corrosion resistance. The commercial 13% Cr steel con-taining more than 0.08% C is the most widely used martensitic stainless steel.Figure 18.24 shows a vertical section of the Fe–Cr–C at 13% Cr (4). Thisdiagram is somewhat similar to that shown in Figure 18.22 at 17% Cr.The tem-perature and composition ranges of the austenite phase (g), however, are muchwider in the case of 13% Cr steel.
MARTENSITICS STAINLESS STEELS 449
LL+δ
δ
δ + γγ
L+ γ
γ +C2
γ +C1+C2
γ +C1
α+C1
0 0.2 0.4 0.6 0.8 1.0600
800
1000
1200
1400
1600
1110
1470
1830
2190
2550
2910
Carbon content, %
Tem
pera
ture
, °C
Tem
pera
ture
, °F
α+γ+C1
α+C1+C2
α
Figure 18.24 Vertical section of Fe–Cr–C phase diagram at 13% Cr. Reprinted, withpermission, from Castro and De Cadenet (4). Copyright 1974 Cambridge UniversityPress.

18.4.2 Underbead Cracking
The hardness of martensitic stainless steels increases rather significantly withincreasing carbon content. For 12% Cr steel quenched from 1050°C, forinstance, the hardness increases from 364 HV at 0.07% C to 620 HV at 0.60%C (4). Consequently, martensitic stainless steels with higher carbon contentsare rather susceptible to underbead cracking, especially when hydrogen ispresent during welding. Because of the internal stresses induced by the volumeincrease associated with the austenite-to-martensite transformation, under-bead cracking can still occur even if relatively low restraint is employed duringwelding. As a result, martensitic stainless steels with a carbon content above0.25–0.30% are not normally welded.
18.4.3 Remedies
To avoid underbead cracking in martensitic stainless steels, both preheatingand postweld tempering (between 600 and 850°C) are usually employed. Inaddition, filler metals of austenitic stainless steels are often used. This isbecause the weld metal so produced remains ductile, thus reducing the chanceof underbead cracking. Also, due to the greater solubility of hydrogen inaustenite, hydrogen can dissolve in the weld metal and the possibility of under-bead cracking is thus reduced.
As in the case of welding heat-treatable alloy steels, martensitic stainlesssteels are usually not allowed to cool directly to room temperature upon thecompletion of welding in order to avoid underbead cracking. Figure 18.25shows the postweld heat treatment for a creep-resistant 12% Cr steel (12%Cr/0.2% C/1% Mo/0.4% W/0.3% V) and the resultant microstructure (4).
450 CORROSION-RESISTANT MATERIALS: STAINLESS STEELS
(a)(b)
Figure 18.25 Proper postweld heat treatment and resultant microstructure of a 12%Cr martensitic steel (magnification 500¥). Reprinted, with permission, from Castro andDe Cadenet (4). Copyright 1974 Cambridge University Press.
Upon the completion of welding, the weldment is held at 150°C in order toavoid cracking. After about 1h the weldment can be heat treated at 750°C for4h to temper the martensite that has formed. The resultant microstructure ofthe HAZ is essentially tempered martensite. Figure 18.26 shows a differentpostweld heat treatment and the resultant microstructure (4). From the view-point of completely avoiding the possibility of underbead cracking, it mightseem better to hold the weldment at a temperature higher than MS (say 300°C)so that no martensite can form after welding. During subsequent heat treat-ing at 750°C, however, the untransformed austenite phase decomposes and themicrostructure of the HAZ becomes ferritic with agglomerated carbides pre-cipitated at the grain boundaries. Unfortunately, such microstructure is ratherbrittle and is, in fact, inferior to that of tempered martensite.
18.5 CASE STUDY: FAILURE OF A PIPE
Figure 18.27a shows a section from a failed 304 stainless steel pipe (24). Thepipe, about 100mm in diameter, was seam welded first from the inside andthen from the outside. It was carrying hot, dilute nitric acid and it was in serviceonly two months before it failed.
The transverse cross section of the seam weld and its surrounding area isshown in Figure 18.27b. The attack is about 1.5–3.0mm from the inner weldpass, thus suggesting that weld decay is the cause of failure. Corrosion is inter-granular judging from the missing grains in the microstructure shown in Figure18.27c, and this is consistent with the intergranular characteristics of weld decay. During welding the corroded areas were heated up into the sensitization temperature range, causing Cr carbide to precipitate along grainboundaries.
CASE STUDY: FAILURE OF A PIPE 451
(b)(a)
Figure 18.26 Improper postweld heat treatment and resultant microstructure of a12% Cr martensitic steel (magnification 500¥). Reprinted, with permission, from Castroand De Cadenet (4). Copyright 1974 Cambridge University Press.

REFERENCES
1. Fisher, G. J., and Maciag, R. J., in Handbook of Stainless Steels, Eds. D. Peckner andI. M. Bernstein, McGraw-Hill, New York, 1977, p. 1.
2. Metals Handbook, 8th ed., Vol. 8, American Society for Metals, Metals Park, OH,1973, p. 291.
3. Delong, W. T., Weld. J., 54: 273s, 1974.4. Castro, R., and De Cadenet, J. J., Welding Metallurgy of Stainless and Heat Resist-
ing Steels, Cambridge University Press, London, 1974.
452 CORROSION-RESISTANT MATERIALS: STAINLESS STEELS
Figure 18.27 Failure of a 304 stainless steel pipe (10cm diameter): (a) section fromfailed pipe; (b) transverse cross section of seam weld; (c) microstructure of weld decayarea. Reprinted from Welding Handbook (24). Courtesy of American Welding Society.

5. Fukakura, J., Kashiwaya, H., Mori, T., Iwasaki, S., and Arii, M., in Weldments: Phys-ical Metallurgy and Failure Phenomena, Eds. R. J. Christoffel, E. F. Nippes, and H.D. Solomon, General Electric Co., Schenectady, NY, 1979, p. 173.
6. Magula,V., Liao, J., Ikeuchi, K., Kuroda,T., Kikuchi,Y., and Matsuda, F., Trans. Japn.Weld. Res. Inst., 25: 49, 1996.
7. Ikawa, H., Nakao, Y., and Nishimoto, K., Technol. Repts. Osaka Univ., 28(1434):1978.
8. Principle and Technology of the Fusion Welding of Metals, Vol. 2, Mechanical Engi-neering Publishing Co., Peking, 1979 (in Chinese).
9. Solomon, H. D., Corrosion, 34: 183, 1978.10. Solomon, H. D., Corrosion, 36: 356, 1980.11. Solomon, H. D., and Lord, D. C., Corrosion, 36: 395, 1980.12. Solomon, H. D., in Weldments: Physical Metallurgy and Failure Phenomena, Eds.
R. J. Christoffel, E. F. Nippes, and H. D. Solomon, General Electric Company,Schenectady, NY, 1979, p. 149.
13. Fontana, M. G., and Greene, N. D., Corrosion Engineering, 2nd ed., McGraw-Hill,New York, 1978.
14. Ikawa, H., Nakao, Y., and Nishimoto, K., Technol. Repts. Osaka Univ., 29(1648):1979.
15. Uhlig, H. H., Corrosion and Corrosion Control, 2nd ed., Wiley, New York,1971.
16. Linnert, G. E., in Source Book on Stainless Steels, American Society for Metals,Metals Park, OH, 1976, p. 237.
17. Ikawa, H., Shin, S., Nakao, Y., and Nishimoto, K., Technol. Repts. Osaka Univ.,25(1262): 1975.
18. Ikawa, H., Nakao, Y., and Nishimoto, K., Technol. Repts. Osaka Univ., 28(1402):1978.
19. Ikawa, H., Nakao, Y., and Nishimoto, K., Trans. Jpn. Weld. Soc., 8: 9, 1977.20. Metals Handbook, 8th ed., Vol. 7, American Society for Metals, Metals Park, OH,
1972, p. 135.21. Brooks, J. A., and Lippold, J. C., in ASM Handbook, Vol. 6, ASM International,
Materials Park, OH, 1993, p. 456.22. Kou, S., and Le, Y., Metall. Trans., 13A: 1141, 1982.23. Kah, D. H., and Dickinson, D. W., Weld. J., 60: 135s, 1981.24. Welding Handbook, 7th ed., Vol. 4, American Welding Society, Miami, FL, 1982.
FURTHER READING
1. Fontana, M. G., and Greene, N. D., Corrosion Engineering, 2nd ed., McGraw-Hill,New York, 1978.
2. Uhlig, H. H., Corrosion and Corrosion Control, 2nd ed., Wiley, New York, 1971.3. Peckner, D., and Bernstein, I. M., Handbook of Stainless Steels, McGraw-Hill, New
York, 1977.
FURTHER READING 453

PROBLEMS
18.1 Two welds are made at 90° to each other in a stabilized-grade stainlesssteel (e.g., alloy 321), as shown in Figure P18.1. Indicate the locationswhere knife-line attack is expected.
18.2 Is sensitization expected to be more serious in SAW or GTAW of 304stainless steel and why?
18.3 Sketch the concentration profiles of TiC and M23C6 across the HAZfrom the fusion line in of a 321 stainless steel (Ti-stabilized) weld sub-jected to a postweld sensitization heat treatment at 650°C.
18.4 Rate 410, 420, and 440 stainless steels in the decreasing order of H-cracking susceptibility and explain why.
454 CORROSION-RESISTANT MATERIALS: STAINLESS STEELS
1st pass
2nd pass
Figure P18.1

INDEX
Acicular ferrite, 66, 74, 88, 90, 233–239,405
Alternating grain orientation, 291Aluminum alloys,
Al-Li alloys, 80, 95, 188, 195, 354, 371,374
designation, 355filler metals, 183, 202, 251, 255, 285,
286, 291, 300, 303, 326, 328, 330, 332,338, 339, 360, 362, 374
heat treatable, 353, 355, 359, 365–366,369, 379
heat-affected zone softening, 352, 354,373
partially melted zone cracking, 321,334
partially melted zone liquation,303–317, 330
porosity, 66, 80, 81, 95, 251, 259, 262,353–354, 394
solidification cracking, 271, 273, 278,281, 284–286, 288, 291, 294, 299, 300,322, 330
typical welding problems, 354Angular distortion, 5Annealing, 343, 345, 346, 349, 369, 373,
374, 388, 408, 442, 447Arc,
blow, 23, 34efficiency, 37–41, 43, 46, 56, 63, 64, 319,
352, 373fluid flow, 99–102length, 113oscillation, 188, 192–195, 210–212,
291–293, 300, 332, 338, 354pulsation, 188, 193, 213, 300stabilizers, 12vibration, 192
Arc welding processes,electroslag welding, 3, 6, 7, 24–27, 56,
393, 394, 406flux-cored arc welding, 3, 6, 7, 22, 23,
36, 73, 79, 86, 88, 91gas metal arc welding, 6, 19, 20, 32, 79
gas tungsten arc welding, 6, 13, 18, 28,56, 67, 78
plasma arc welding, 3, 6, 17–19, 40, 42,74, 80, 81, 354, 366
shielded metal arc welding, 3, 6, 11, 12,66, 67, 75, 76
submerged arc welding, 3, 6, 22, 24, 90,189, 238, 295
Argon, 14–16, 19, 31, 32, 70, 73, 193, 237Artificial aging,
Al alloys, 353, 357, 359, 360, 363–367,373
Ni-base alloys, 375, 376, 380Austenite,
high-carbon, 401retained, 399stainless steel, 174
Autogenous welding, 16, 170, 285Auto-tempered martensite, 406Axial grains, 176, 178
Banding, 160, 163, 249–251Basicity index, 85–89, 238Bead shape, 294, 295Bead tempering, 407, 408, 416Bessel function, 50Boundary layer, 153Buoyancy force, 104, 107Buttering, 289
Carbide-forming elements, 394Carbide precipitation,
in austenitic stainless steels, 435–437,440–444, 446
in ferritic steel, 421, 422in Ni-base alloys, 378
Carbon equivalent, 394, 416, 417Cell spacing, 165, 204–209, 213, 327 (see
also dendrite arm spacing)Cellular solidification, 156, 160Circular patch test, 323, 330, 386Coarsening, 165
455
Welding Metallurgy, Second Edition. Sindo KouCopyright 2003 John Wiley & Sons, Inc.
ISBN: 0-471-43491-4
Welding Metallurgy, Second Edition. Sindo KouCopyright 2003 John Wiley & Sons, Inc.
ISBN: 0-471-43491-4
Welding Metallurgy, Second Edition. Sindo KouCopyright 2003 John Wiley & Sons, Inc.
ISBN: 0-471-43491-4
Welding Metallurgy, Second Edition. Sindo KouCopyright 2003 John Wiley & Sons, Inc.
ISBN: 0-471-43491-4
Welding Metallurgy, Second Edition. Sindo KouCopyright 2003 John Wiley & Sons, Inc.
ISBN: 0-471-43491-4
Welding Metallurgy, Second Edition. Sindo KouCopyright 2003 John Wiley & Sons, Inc.
ISBN: 0-471-43491-4
456 INDEX
Columnar dendrites, 156, 157, 159Competitive growth, 174, 176, 204Convection (see weld pool convection
and arc fluid flow)Constitution diagrams, 223–226Constitutional liquation, 306, 309–311,
330, 333Constitutional supercooling, 156–160,
186, 187, 199, 200, 247, 318Contact angle, 170, 171Continuous cooling transformation
diagrams, 232, 236, 393, 402, 404,406, 407
Contraction stresses, 284, 424Cooling rate, 164, 204, 207, 212, 226–231,
249, 268, 274, 278, 291, 318, 325, 350,351, 360, 398, 402–407, 425, 432, 437,441, 442, 448
Crack susceptibility C-curves,Ni-base alloys, 387–390ferritic steels, 422
Cracking,cold, 411, 423delayed, 411hot, 321, 353, 354, 376, 379, 384, 432hydrogen, 12, 66, 75, 255, 294, 321, 328,
329, 393, 402, 406–408, 410–418, 428,432 (see hydrogen cracking)
fatigue, 135, 139intergranular, 263, 328, 419, 422, 430liquation, 324–327, 335, 336reheat, 376, 385, 390, 394, 418–422, 430
(see reheat cracking)solidification, 66, 71, 170, 188, 192, 195,
212, 216, 243, 259, 263–300, 322, 330,338, 392, 432 (see solidificationcracking)
strain-age, 384, 385, 392stress corrosion, 125, 255, 445, 446toe, 135, 136, 413underbead, 412, 413, 425, 426, 450 (see
also lamellar tearing)Critical transformation temperatures,
393, 394, 398Current density distribution, 99, 101–103
Degree of restraint, 284, 332DeLong diagram, 224Dendrite arm spacing, 164, 165, 204–213,
274Dendrite fragmentation, 180, 181, 189,
192Dendritic solidification, 156, 159
Dendrite tip undercooling, 230, 248Deoxidizer, 12, 66, 394Deposition rate, 26Diffusion of hydrogen, 76, 411, 412Dihedral angle, 281, 282Dilution ratio, 257, 285, 286, 288, 289,
330Direct-current electrode positive, 15, 16,
19, 23Direct-current electrode negative, 14, 17,
19, 259Directional solidification, 147, 314Dissimilar metal welds, 29, 33, 223, 252,
255, 257, 259Distortion in weldments, 4, 11, 24, 25, 29,
32, 126–130, 294, 367, 389, 439Ductile-brittle transition temperature,
406Ductility curve, 277
Easy-growth directions, 175Electrodes, 408, 423, 424
bias, 27flux-core arc welding, 22–24gas-metal arc welding, 19, 21–22,
41–43, 53, 65, 80gas-tungsten arc welding, 15, 16, 41–43,
104high hydrogen, 415low carbon, 288low hydrogen, 394, 402, 407, 409, 415,
432plasma arc welding, 17, 18, 74submerged arc welding, 66, 91, 92shielded metal arc welding, 75, 76, 78,
84, 295, 296, 401, 417tip angle, 45–47, 97–100, 102
Electrode coverings, 11–13, 22, 66, 75, 78,84, 415
Electromagnetic pool stirring, 191Electron beam welding, 3, 5, 6, 27–29, 43,
173, 207, 208, 227, 229, 279, 295, 332,351, 354
Electroslag welding, 3, 6, 7, 24–27, 56,394, 406
Epitaxial growth, 170–174, 184, 203 (seealso nonepitaxial growth)
Equiaxed dendrites, 157 (see alsonondendritic equiaxed zone)
Equiaxed grains, 181–186, 191, 193Equilibrium partition ratio or
equilibrium segregation ratio, 145,146

INDEX 457
Evaporation from weld pool, 28, 82, 91,114, 115, 117
Fatigue, 131–140beach marks, 132extrusions, 131intrusions, 131joint design, 133stress raisers, 134, 135remedies, 135–137
Ferrite,acicular, 66, 74, 88, 90, 233–239, 405delta (d), 174, 216–223, 231, 232,
244–247, 279–281, 291, 295, 296, 431,448, 449
grain boundary, 232, 233, 237, 239side-plate, 233, 239, 398Widmanstatten, 232, 233, 398
Ferrite content,effect of cooling rate, 226–231effect of multipass welding, 259effect of nitrogen, 66, 71, 224effect of reheating, 231example of calculation, 290prediction, 223–226solidification cracking, 279, 289, 291
Ferrite morphology, 218–221, 259Fluid flow (see weld pool convection and
arc fluid flow)Flux core arc welding, 3, 6, 7, 22, 23, 36,
73, 79, 86, 88, 91Fluxes, 22, 23, 67, 82–88, 90, 91, 94, 97,
116, 117FNN-1999, 226Free energy of nucleation, 170Free energy of reactions, 68Freezing range or solidification
temperature range, 158, 159,268–271
Friction stir welding, 370
Gas metal arc welding, 6, 19, 20, 32, 79Gas-metal reactions, 68–82
hydrogen-metal, 68, 75nitrogen-metal, 68, 71oxygen-metal, 68, 73Sievert’s law, 68
Gas tungsten arc welding, 6, 13, 18, 28,56, 67, 78
active flux, 116, 117Gas welding, 3, 6, 7–11, 74Gaussian distribution, 47, 57, 100, 101
Ghost grain boundary, 310, 311Gleeble (thermal simulator), 58, 59, 184,
323, 419, 421GP zone, 354–364Grain boundary ferrite, 232, 233, 237, 239Grain boundary liquid, 282Grain boundary liquation, 303, 309, 313,
321, 325, 327, 332, 336Grain boundary migration, 310, 314Grain boundary segregation, 315, 316Grain detachment, 180, 181Grain growth, 236, 310, 343–352,
394–396, 405, 432, 448, 449Grain growth inhibitors, 405Grain refining,
in fusion zone, 170, 180, 187–193, 197,291, 292, 394, 398, 402, 407
in heat-affected zone, 394, 397–399,402, 403, 407
Grain size, 60, 189, 192, 235–239, 283,333–335, 349, 398, 402, 405, 448
Grain structure, 170–195effect of welding parameters, 174control of, 187, 291
Growth rate, 166, 200, 201
Heat-affected zone softening,Al alloys, 354, 373Low alloy steels, 410Ni-base alloys, 381–383work-hardened materials, 343–351
Heat flow, 37–60Adams equations, 51, 52computer simulation, 54, 58cooling rate, 55, 57effect of preheating, 57effect of welding parameters, 53effect of weldment thickness, 57Rosenthal’s equations, 48–51
Heat input, 4, 5, 41, 42, 332, 350, 351, 389Heat source,
efficiency, 37–43power-density distribution, 45, 57, 58,
107current-density distribution, 47
Heat treatable alloy steels, 407Heat treatable aluminum alloys, 353–371
Al-Cu-Mg, 359Al-Mg-Si, 359Al-Zn-Mg, 367
Heat treating of steels, 395Helium, 14–16, 19, 31, 32Heiple’s model, 109

458 INDEX
Heterogeneous nucleation, 173, 180–199,292
Heterogeneous nuclei, 181–184, 190, 234,235
High-energy density welding processes, 3electron beam welding, 27laser beam welding, 29
Hot cracking in partially melted zone,321–336 (see also liquationcracking)
Hot ductility test, 323, 324Houldcroft test, 264, 265HY-80 steel, 207, 212, 255, 328, 329, 406Hydrogen cracking, 12, 66, 75
in martensitic stainless steels, 432, 450in steels, 255, 328–329, 402, 406–408,
410–418methods of reduction, 415requirements, 411test methods, 414
Hydrogen level,effect on welds, 66free energy of reaction, 68solubility in weld pool, 70measurement of, 76–78methods of reduction, 78–82
Implant test, 414Inclusions, 66, 250, 251
fatigue initiation, 131fracture initiation, 88lamellar tearing, 422, 423, 427liquation, 307–309nitride, 72nucleation site for acicular ferrite, 74,
233–237oxide, 73, 88–90, 237tungsten, 16
Inoculation, 188–190Intergranular corrosion, 433, 436, 440,
442, 444, 447Intergranular cracking,
hot cracking in partially melted zoneor liquation cracking, 321–327
hydrogen cracking, 328postweld heat-treatment cracking or
reheat cracking, 385reheat cracking, 418–422solidification cracking, 263, 264
Interpass temperature, 57, 255, 256, 354,369, 402, 405–409, 415, 416
Ionization potential, 15, 16Iron nitride, 72
Isothermal precipitation curves, 436, 439Isothermal transformation diagrams,
410
Joint design, 7, 8, 251
Keyhole, 4, 17, 18, 27, 28, 43, 74, 80, 81,127, 354
Knife-line attack, 432, 440–444
Lamellar tearing, 394, 422–425, 427Laser,
CO2 laser, 30, 31diode laser, 31YAG laser, 30, 108
Laser assisted gas metal arc welding, 32Laser beam welding, 3, 6, 29, 30, 31, 36,
37, 60, 110, 128, 366Laves, 276, 310Lehigh cantilever test, 424Lehigh restraint test, 414, 415,Liquation, 303–336
constitutional, 306, 309–311, 319, 320,330, 333
cracking, 321–327, 330–336 (see alsohot cracking in partially meltedzone)
mechanisms, 304–314temperature, 333
Liquidus surface, 217Lorentz force, 104, 106, 107Lorentz force field, 99, 101Low hydrogen electrodes, 12, 75, 409
Macrosegregation, 255–259Magnesium, 74, 115, 116Magnetic field, 190 (see also arc
oscillation)Manganese, 76, 84, 92, 116Manganese/sulfur ratio, 288, 394Maraging steel, 307, 309, 310Marangoni convection, 109, 110 (see also
weld pool convection)Martensite,
auto-tempered, 406formation temperature, 405, 411high carbon, 399–401microstructure, 400, 403, 426, 448, 450tempering, 406, 449
Melting efficiency, 44

INDEX 459
Mechanical propertieseffect of annealing, 345effect of ferrite content, 238, 279effect of grain size, 187–188effect o flux composition, 84effect of inclusions and porosity, 250effect of liquation, 329effect of nitrogen content, 72effect of oxygen content, 75, 89effect of oxygen/acetylene ratio, 74effect of porosity, 81
Mercury method, 77Metal transfer, 19, 21, 22, 74, 116, 326
short-circuiting, 21globular, 21spray, 21
Microsegregation, 160–163, 232, 243–249,268, 333, 334, 399, 401
Mushy zone, 179–182, 187, 275
Natural aging, 353, 359–365, 367–370Ni-base alloys, 310, 375–390
compositions, 376constitutional liquation, 309, 310heat-affected zone softening, 376, 381,
383partially-melted zone cracking or
liquation cracking, 335, 376precipitation reaction, 376reheat cracking, 376, 384–390solidification cracking, 268–271,
273–276typical welding problems, 376
Nitride formers, 66, 72, 405, 432Nitrogen, 65–72, 224–226Nondendritic equiaxed zone, 184, 185,
195Nonepitaxial growth, 175Nucleation in weld metal
mechanisms, 178–187acicular ferrite, 233–235heterogeneous (see also
heterogeneous nucleation)Nuclei (see heterogeneous nuclei)
Oxyacetylene welding process, 3–11, 74Oxygen/acetylene ratio, 74Oxygen equivalence, 73Oxygen equivalent, 237, 238Oxygen level, 66–70, 73–76, 83, 87, 89, 91
effect of basicity index, 83, 87effect on acicular ferrite, 235–238
effect on grain size, 236effect of oxygen/acetylene ratio, 74
Partially grain refining, 396–403Partially melted zone, 303–336
liquation cracking or hot cracking,321–327
ductility loss, 328, 329, 354hydrogen cracking, 328liquation mechanism, 304–314
Partially mixed zone, 252Phase diagrams,
Al-Cu, 306, 356Al-Mg-Si, 331Fe-Cr-Ni, 217, 220, 227, 434Fe-C, 281, 318, 395, 434Fe-Cr, 434Fe-Cr-C, 447, 449Ni-base, 377304 stainless steel, 437
Phosphorus, 280Planar solidification, 156, 159, 160, 316Plasma arc welding, 3, 6, 17–19, 40, 42,
74, 80, 81, 354, 366Polarity, 14, 15, 17, 19, 74, 80, 81, 91, 92,
354, 366Pool shape, 54, 55Porosity,
fatigue initiation, 131in aluminum alloys, 66, 80, 81, 95, 252,
257, 259, 354in copper, 82in steel, 10, 28, 89, 90, 394
Post-solidification phase transformations,ferrite-austenite, 216–232austenite-ferrite, 232–239
Postweld heat treating,Al alloys, 354, 363–370effect on distortion, 130steels, 79, 125, 127, 407–410, 416Ni-base alloys, 384–386stainless steels, 432, 439, 442, 450, 451
Postweld heat-treatment cracking,384–390 (see also reheat cracking)
Powder metallurgy, 257Power density, 3, 4, 11, 27, 28, 45 (see
also power density distribution)Power density distribution, 45–47, 57, 58,
101–103, 107Precipitation hardening, 353, 358, 359,
375, 379, 405Preheat, 56, 57, 125, 130, 255, 256, 294,
394, 402, 404, 405–410, 415–417

460 INDEX
Primary solidification phase, 166,216–219, 230, 246, 279, 281, 291
Quenched and tempered steels, 127,406–408
Reactive and refractory metals, 29Recrystallization, 343–345, 347Reheat cracking,
ferritic steels, 394, 418–422Ni-base alloys, 376, 384–390test methods, 419–420
Reinforcement, 7, 132, 134, 136, 137Residual stresses, 122–126, 132–136, 378,
384–388, 417, 422, 445, 446Resistance spot welds, 309, 439Reversion, 360–364, 381, 382Rimmed steels, 28Root cracks, 413
Schaeffler diagram, 223, 255Scheil equation, 151, 245, 274Self-shielded arc welding, 66, 67, 72Sensitization,
austenitic stainless steels, 433–440, 451,452
effect of carbon content, 438, 439ferritic stainless steels, 447location in welds, 438remedies, 439, 440stabilized austenitic stainless steels,
441–444Shear stress, 104Shielded metal arc welding, 3, 6, 11, 12,
66, 67, 75, 76Shielding gas,
argon, 19, 40, 47, 65, 70, 120, 326Ar-CO2, 237Ar-H2, 77, 95, 250, 255Ar-N2, 71, 223, 241Ar-O2, 21–22, 237, 415CO2, 21, 65, 73flux-core arc welding, 23He-10%Ar, 32He, 20, 65, 117hydrogen containing, 78, 79laser beam welding, 31nitrogen, 71properties, 16oxygen containing, 73, 237–239
Shot peening, 135, 136
Silicon, 76, 92Slag inclusions, 251Slag-metal reactions, 82–92Solidification cracking, 263–296, 330
Al alloys, 271, 273, 277–287, 291–293control of, 285–295effect of bead shape, 294, 295effect of composition, 272, 273,
285–291effect of ductility of solidifying weld
metal, 276–279effect of grain boundary liquid,
271–276, 281–283effect of grain structure, 283–284effect of primary solidification phase,
279–281effect of solidification temperature
range, 268–271stainless steels, 66, 71, 212, 216, 432steels, 394, 432test methods, 264–267, 322theories, 263
Solidification modes, 155–156, 159, 199,200, 202–206, 216, 316–317
Solidification paths, 166, 167, 271Solidification temperature range,
268–271 (see also freezing range)Solidification time, 164Solidus surface, 217Solidus temperature, 331Solute redistribution, 145–155, 162Solution heat treating, 185, 312, 313, 353,
362Split-anode method, 100Stabilized austenitic stainless steels,
440–445Stainless steels, 431–452
austenitic, 59, 172, 175, 178, 207, 208,216–232, 244–246, 253–255, 267,279–281, 336, 408, 417, 432–446, 451,452
classification, 431, 432duplex, 71ferritic, 173, 175, 183, 184, 243, 268,
431, 446–449martensitic, 244, 431, 432, 449–451typical welding problems, 432
Steels, (see also stainless steels)alloy steels, 19, 21, 83–85, 88, 232–239,
252, 253, 258, 259, 268–269, 288, 394,404–417, 425
carbon steels, 5, 6, 10, 21, 50, 90, 127,134, 135, 175, 234, 255, 281, 288,396–404

INDEX 461
cast steels, 401ferritic steels, 418–422heat treatable steels, 407–410maraging steels, 307, 309, 310quenched and tempered alloy steels,
127, 406–408rimmed steels, 28typical welding problems, 394
Stick welding, (see also shielded-metalarc welding)
Stress corrosion cracking, 125, 445, 446Stress raisers, 134–136, 294, 413Stress relief, 125, 126, 136, 140, 385, 389,
409, 442, 446Subgrain structure, 212Submerged arc welding, 3, 6, 22, 24, 189,
238Sulfur, 108–114, 280Surface-active agent, 108–112Surface nucleation, 181, 185, 193Surface tension,
convection induced by, 104, 109, 110(see also Maragoni convection)
of grain boundary liquid, 281, 282temperature dependence of, 104, 105,
108–113, 117
Temperature gradient, 166, 186, 201Tempering bead technique, 408Titanium, 67, 73Thermal cycles, 52–56Thermal expansion coefficients, 284, 325,
419, 420, 445Thermal properties, 50Thermal simulator (Gleeble), 58, 59, 184,
323, 419, 421
Toe crack, 135, 413Toughness, 72, 75, 89, 238
Underbead crack, 412, 425, 426, 450Undercut, 20, 134–135, 207Unmixed zone, 254
Vapor pressure, 82, 91, 115, 116Varestraint test, 266, 267, 270, 276, 278,
321, 330, 332–334Vinckier test, 419–420
Weld decay, 432–440 (see alsosensitization)
Weld pool,evaporation, 114–116electromagnetic stirring of, 188–192shapes, 53–55, 112–114, 176 (see also
weld pool convection)Weld pool convection, 103–114
driving forces, 104effect on macrosegregation (weld pool
mixing), 243, 255, 257, 259effect on nucleation, 180, 185effect on penetration, 107–114laminar flow, 114,NaNO3, 109–111turbulent flow, 114
Weld simulator, 58, 59Welding positions, 9Welding processes, 3, 6, 26, 66 (see also
arc welding processes)Work-hardened materials, 343–354WRC-1992 diagram, 225