Welcome to the NNN Conference 2020
52
ntd-ngonetwork.org Virtual Event 8 th – 10 th September 2020 With thanks to our sponsors Welcome to the NNN Conference 2020 Accelerating to 2030: Building Resilient NTD Programmes in a Changing World
Transcript of Welcome to the NNN Conference 2020

ntd-ngonetwork.org
Virtual Event
8th – 10th September 2020With thanks to our
sponsors
Welcome to the
NNN Conference
2020
Accelerating to 2030:
Building Resilient NTD
Programmes in a
Changing World
ntd-ngonetwork.org
9 September 2020
Workshop 2.4
Applying a Quality Improvement Model to
Neglected Tropical Diseases Program
Implementation: supporting programs in
identifying keys for sustaining operations
Dr Bruno Bouchet, Director Health Systems Strengthening, FHI 360Dr Kisito Ogoussan, Implementation Management Lead, Act |West, FHI 360Dr Ibrahim Kargbo-Labour, NTD Program Manager, Sierra LeoneDr Benjamin Marfo, NTD Program Manager, Ghana
ntd-ngonetwork.org
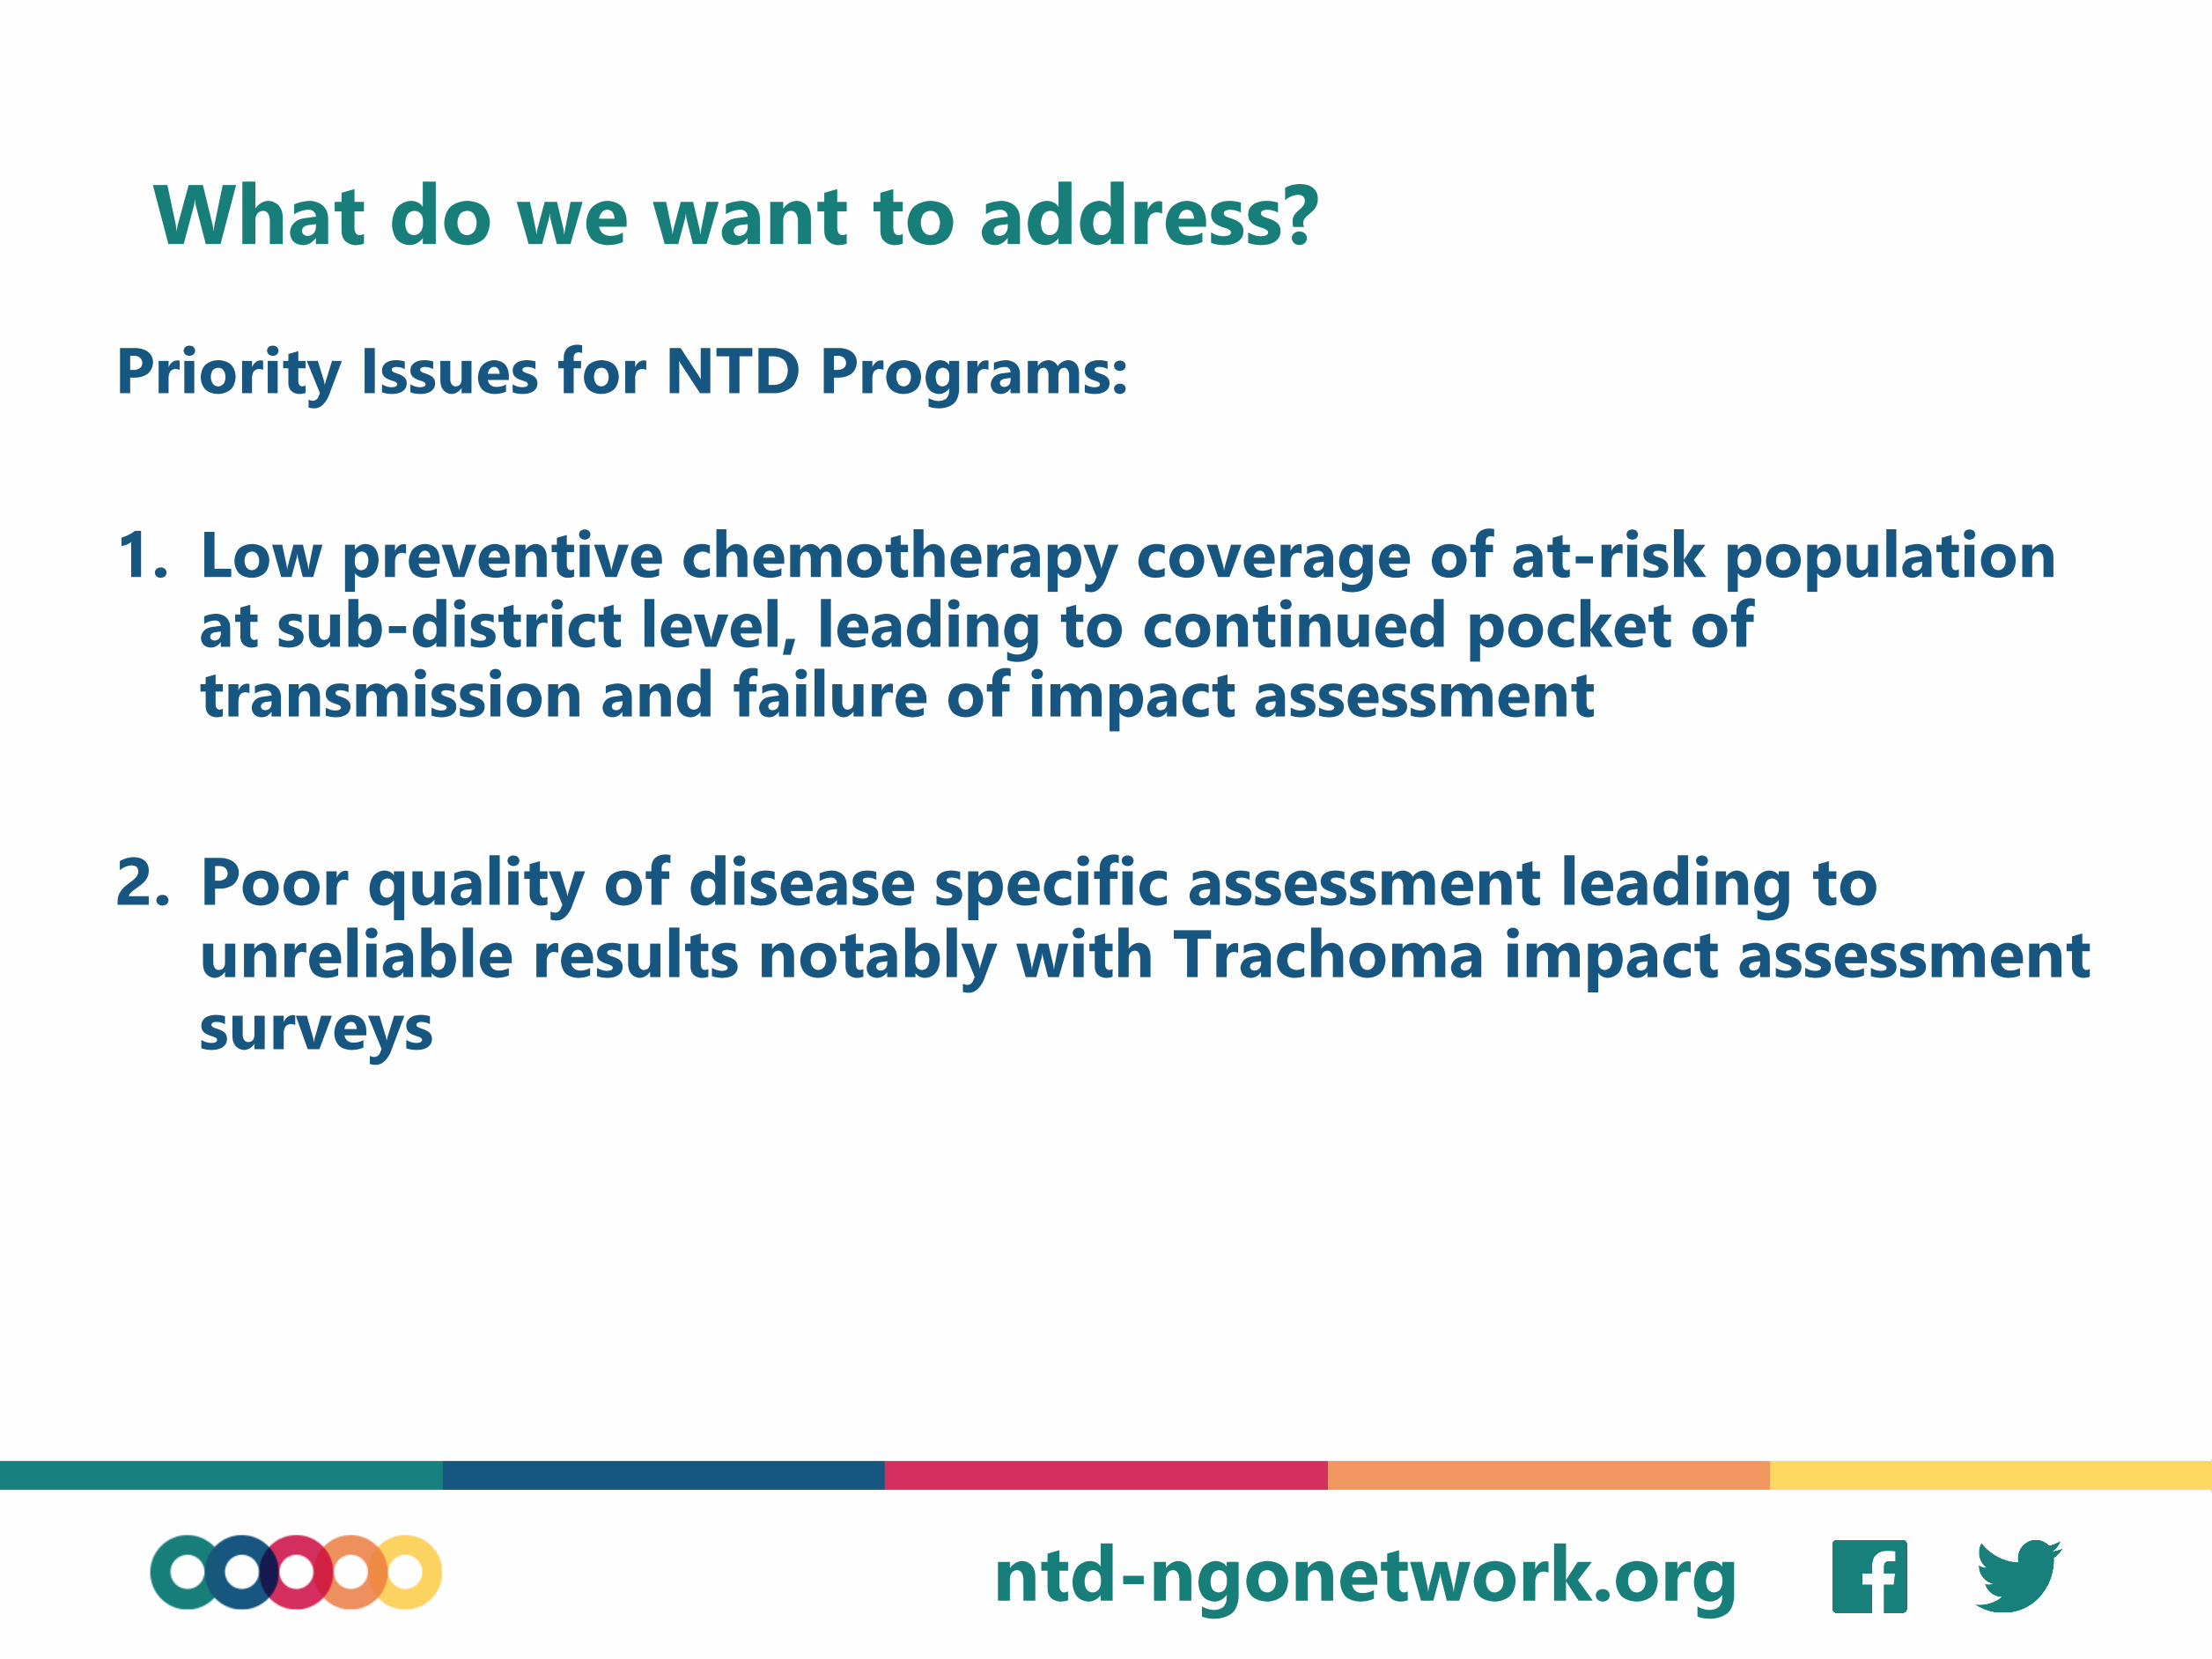
What do we want to address?
Priority Issues for NTD Programs:
1. Low preventive chemotherapy coverage of at-risk population at sub-district level, leading to continued pocket of transmission and failure of impact assessment
2. Poor quality of disease specific assessment leading to unreliable results notably with Trachoma impact assessment surveys
ntd-ngonetwork.org
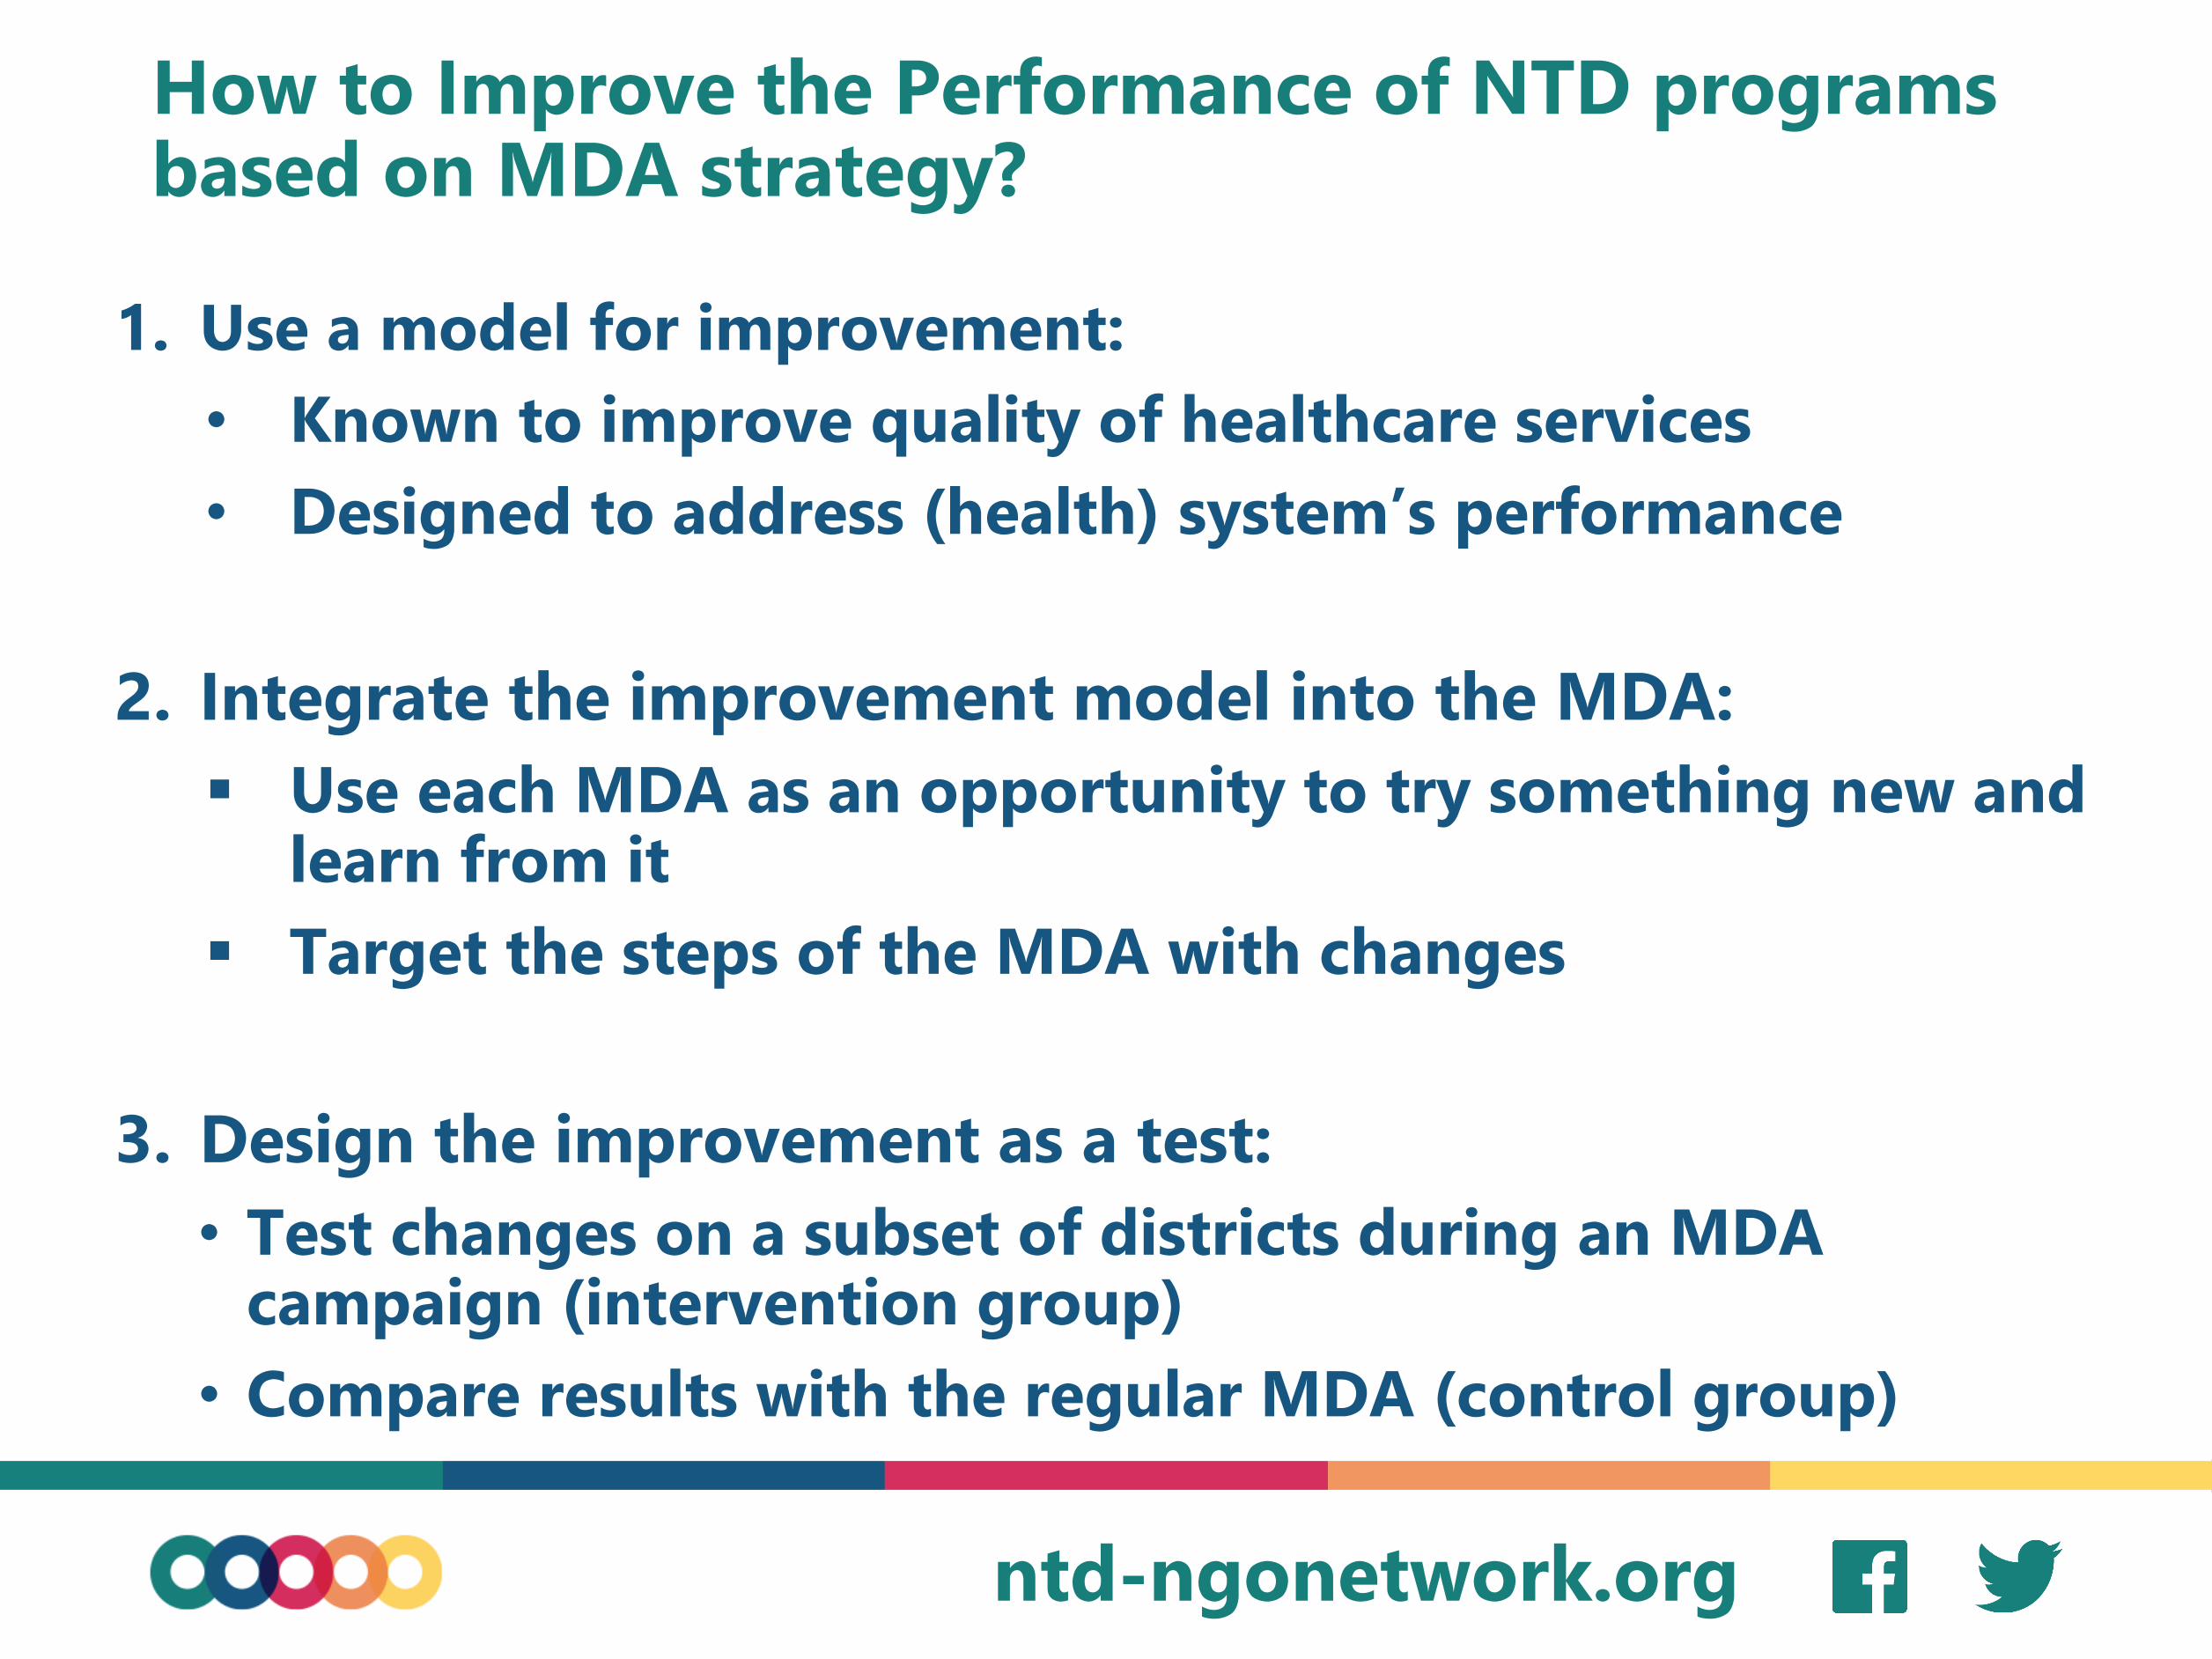
How to Improve the Performance of NTD programs based on MDA strategy?
1. Use a model for improvement:
• Known to improve quality of healthcare services
• Designed to address (health) system’s performance
2. Integrate the improvement model into the MDA:
▪ Use each MDA as an opportunity to try something new and learn from it
▪ Target the steps of the MDA with changes
3. Design the improvement as a test:
• Test changes on a subset of districts during an MDA campaign (intervention group)
• Compare results with the regular MDA (control group)

ntd-ngonetwork.org
Presentations
1. The QI model: Dr. Kisito Ogoussan
2. Planning in Sierra Leone: Dr. Ibrahim Kargbo-Labour
3. Results from Ghana: Dr. Benjamin Marfo

ntd-ngonetwork.org
Questions for Debate
1. How to integrate QI into a program that operates through campaigns?
2. How to measure the effect of changes for NTD programs?
3. How to test the validity & measure the added value of QI for NTD programs, using a mix of implementation science and formative research?

ntd-ngonetwork.org
QUALITY IMPROVEMENT MODEL
AND TOOLS AND NTD PROGRAMS
PRESENTED BY: DR KISITO OGOUSSAN
IMPLEMENTATION MANAGEMENT LEAD
USAID ACT NTD | WEST PROGRAM, FHI 360
NNN CONFERENCE 2020, SEPTEMBER 9TH , 2020

ntd-ngonetwork.org
This presentation is made possible by the generous support of the American people through the United States Agency for International Development (USAID).
The contents are the sole responsibility of the Act to End NTDs | West Program, led by FHI 360 in partnership with Helen Keller International, Health and Development International, Deloitte, World Vision, Americares, and The AIM Initiative under Cooperative Agreement No. 7200AA18CA00011 and do not necessarily reflect the views of USAID or the United States Government.
• Title of Presentation Goes Here
ntd-ngonetwork.org
Fundamentals Of Quality
Improvement Model

ntd-ngonetwork.org
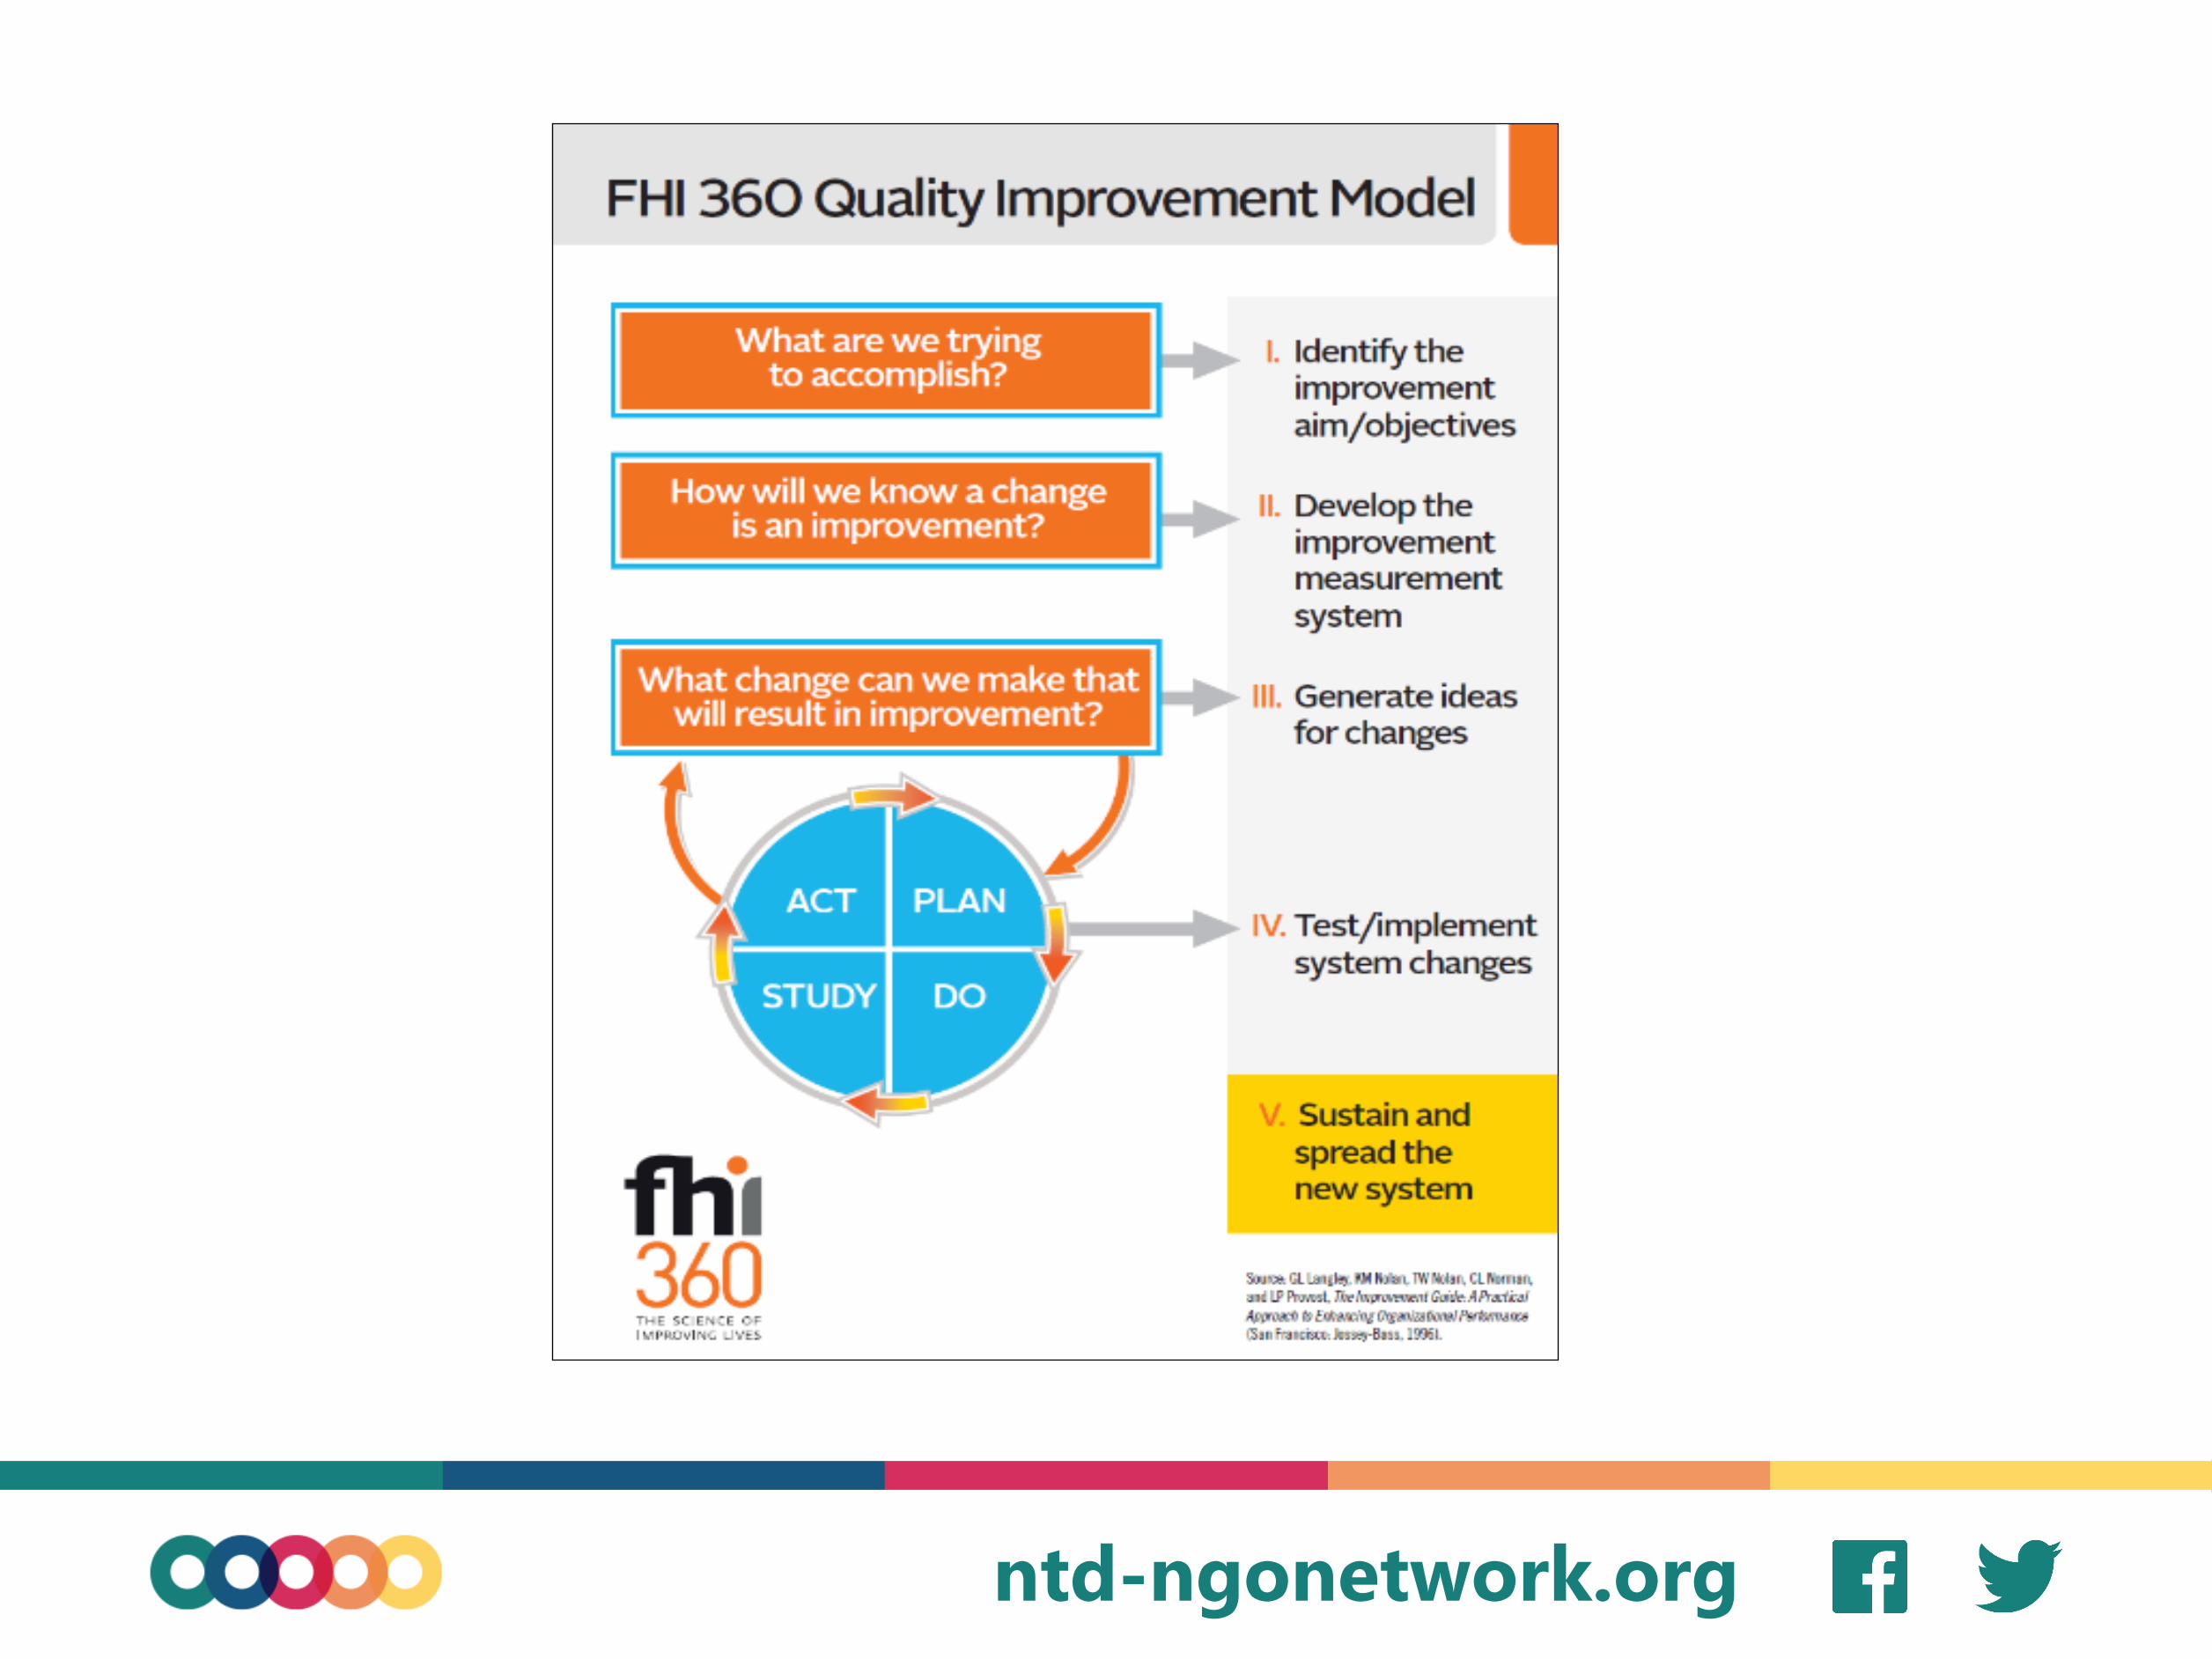
Principles of (Quality) Improvement
10
• There is no improvement in performance of a system without systems changes
•An NTD program is a complex system, with many components (inputs and process) that interact to produce a result
•We need a model for improvement that promotes systems thinking and is designed for testing changes and learning from it
ntd-ngonetwork.org
11
ntd-ngonetwork.org
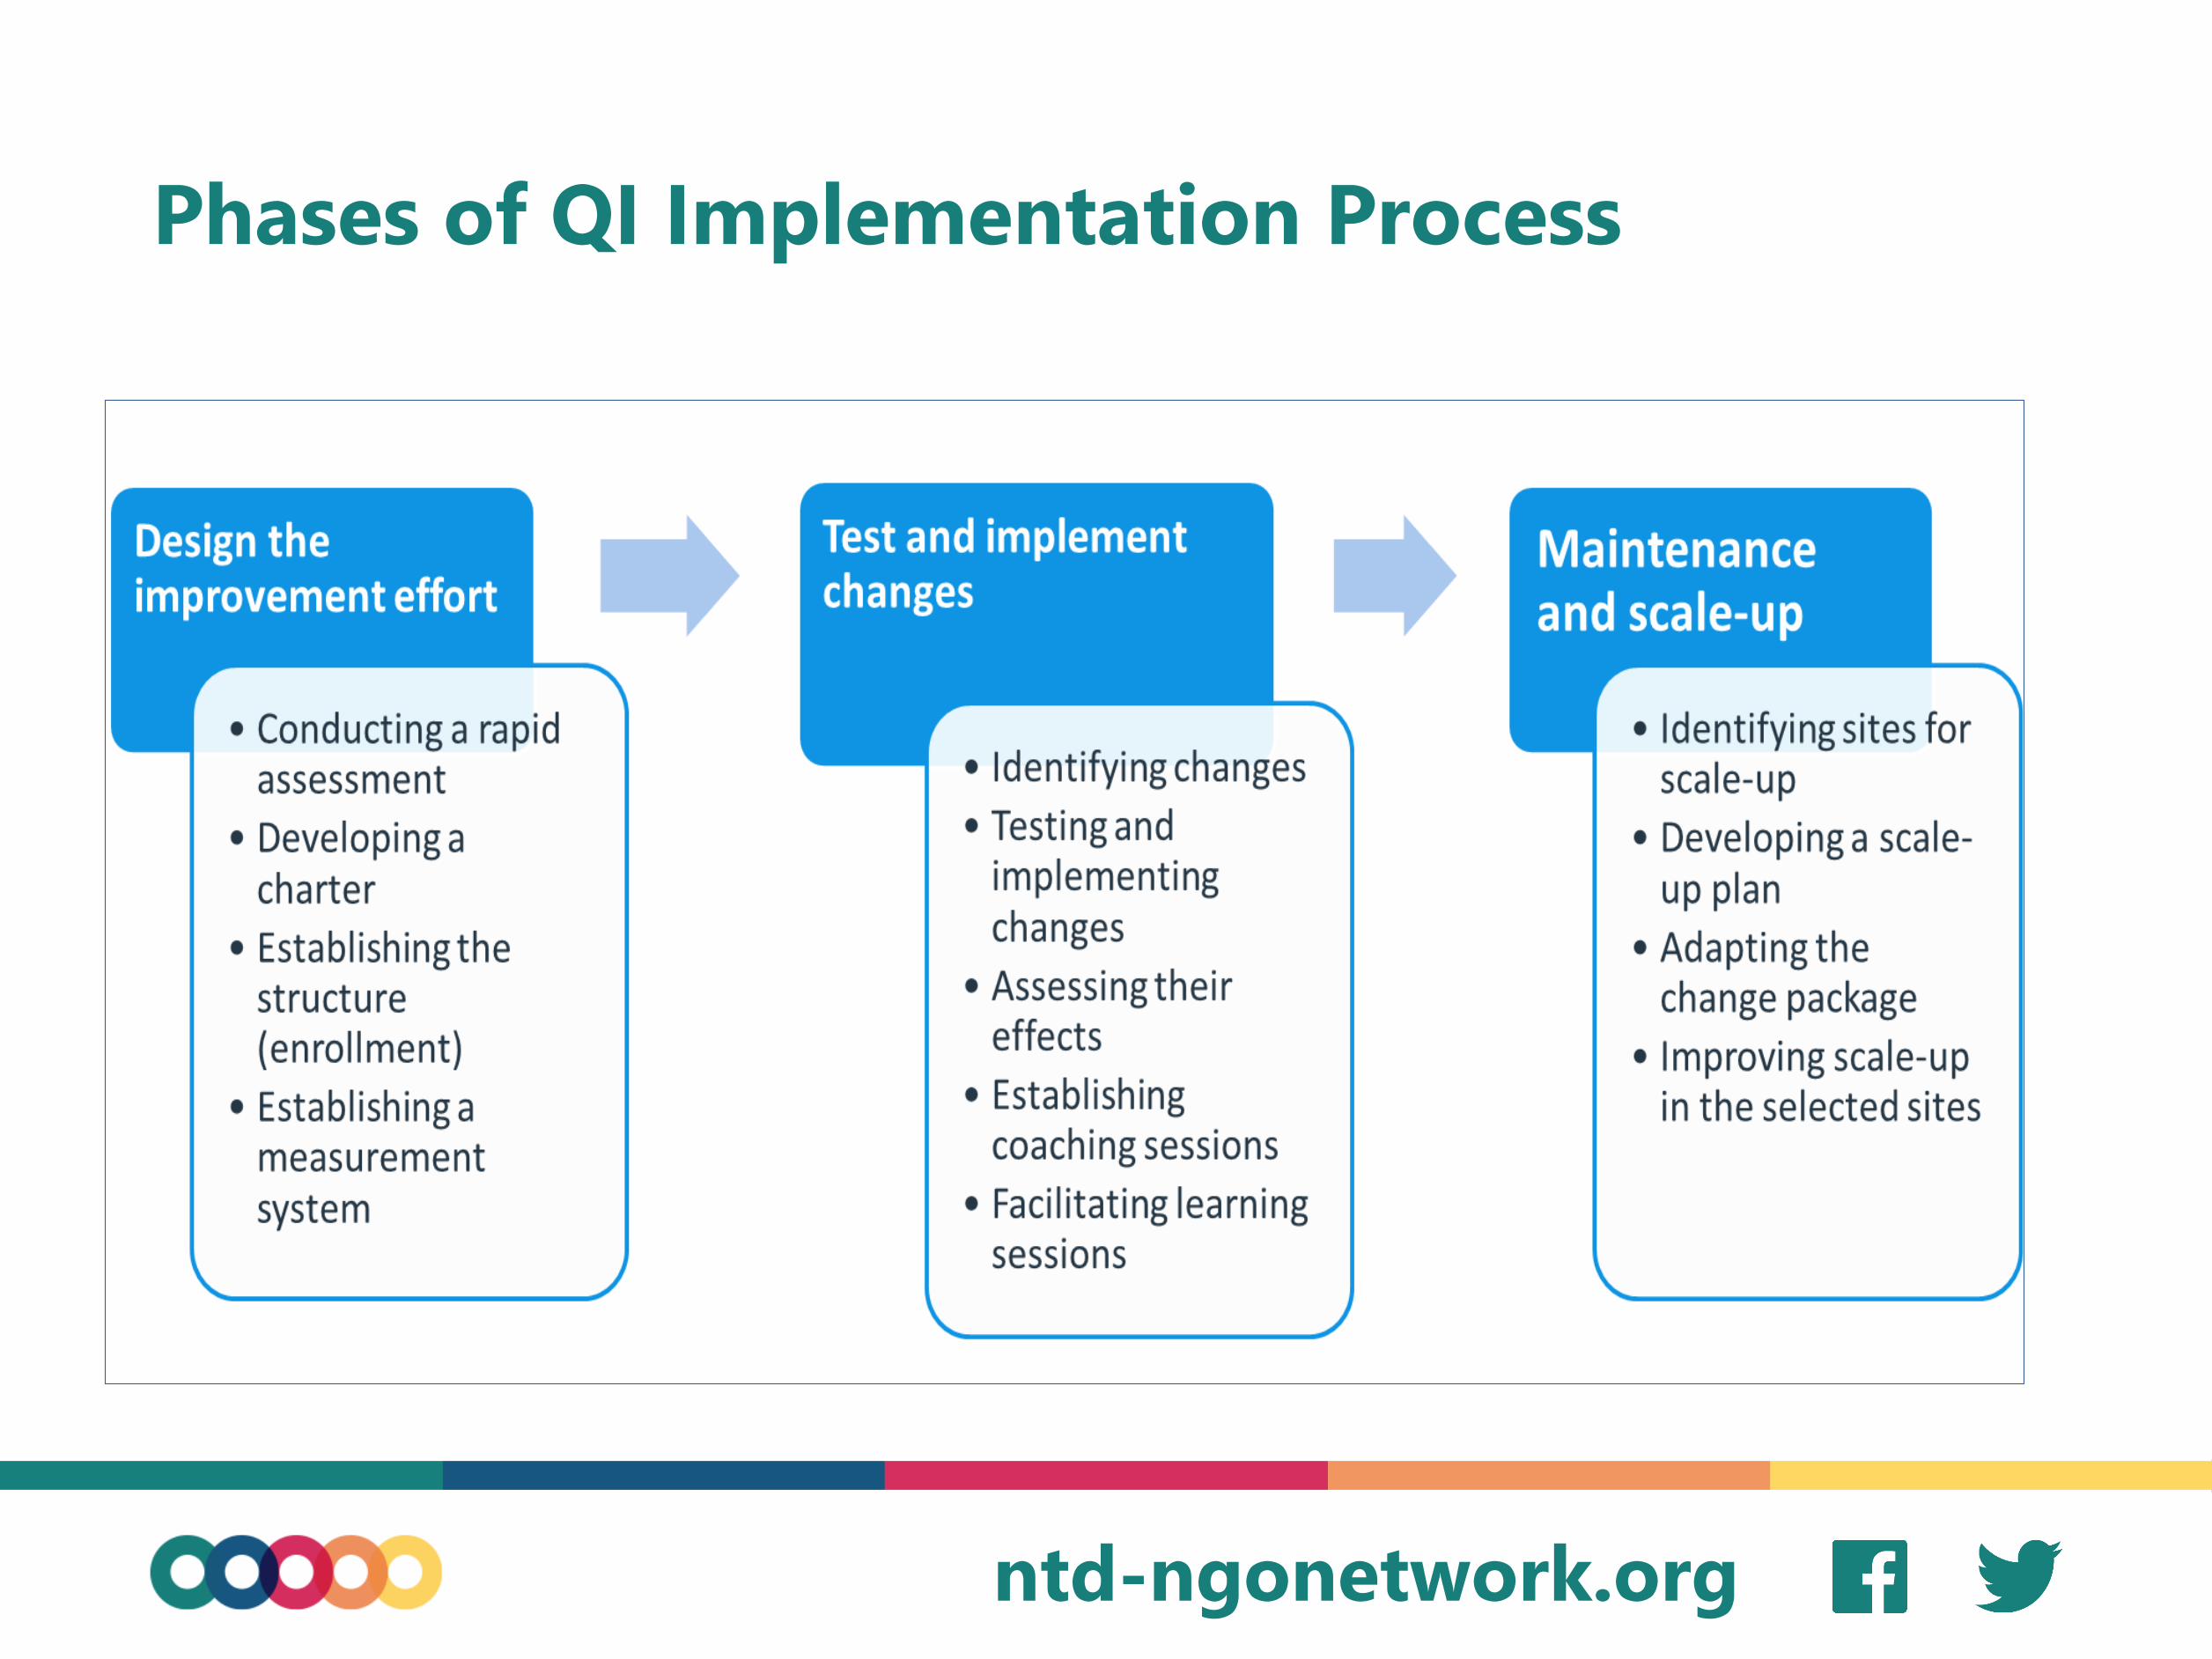
Phases of QI Implementation Process

ntd-ngonetwork.org
Tools Of Quality
Improvement Model

ntd-ngonetwork.org
Root-Cause Analysis Of Performance :Health Systems Issues
25% of TB
patients in
district X did
not
complete
their
treatment
under DOTs
for the past
3 months
Leadership Financing
Information
Systems
Human Resources
Facilities & Supplies
Community
Why?
Wh
y?
Wh
y?

ntd-ngonetwork.org
Driver Diagram
Visual display of a team’s theory of relationship between
•What “drives,” (Primary drivers)
• or contributes to (secondary drivers), the achievement of a project aim.

ntd-ngonetwork.org
The PDSA Cycle
16
ACT• What changes
should we maintain?
• Next cycle?
PLAN• State Objective
• Questions and
predictions (why)
• Plan to carry out
the cycle (who,
what, where, when, how)
STUDY• Complete the
analysis of the data
•Compare data to
predictions
•Summarize what
was learned
DO• Carry out the plan
• Document problems
and unexpected
observations
• Begin analysis
of the data

ntd-ngonetwork.org
Designing the Improvement effort : Situation analysis and the QI charter
• The rapid Assessment/Situation analysis to define the borders of the system, assess the process and obtain expectation among the stakeholders.
•A quality improvement charter is a document that describes the improvement effort and is structured according to the QI models to provide a roadmap for implementation of an improvement effort.

ntd-ngonetwork.org
Expertise needed for a successful improvement effort
• QI team(s)
• Deliver the service and their customers
• Analyze systems
• Test/implement changes
• Measure/analyze/report results
• Leadership/management team
• Manage the effort
• Communicate to central level
• Review results, approve changes and provide “political” support
• Technical content expert(s)
• Authorities in the topic matter
• Review/validate the scientific evidence
• Train and communicate evidence-based standards/best practices
• QI expert (s)
• Know QI model and tools
• Train teams on QI tools
• Coach & support QI teams
• Support documentation & lessons learned
ntd-ngonetwork.org
Applying The Improvement Model to a
NTD Program
ntd-ngonetwork.org
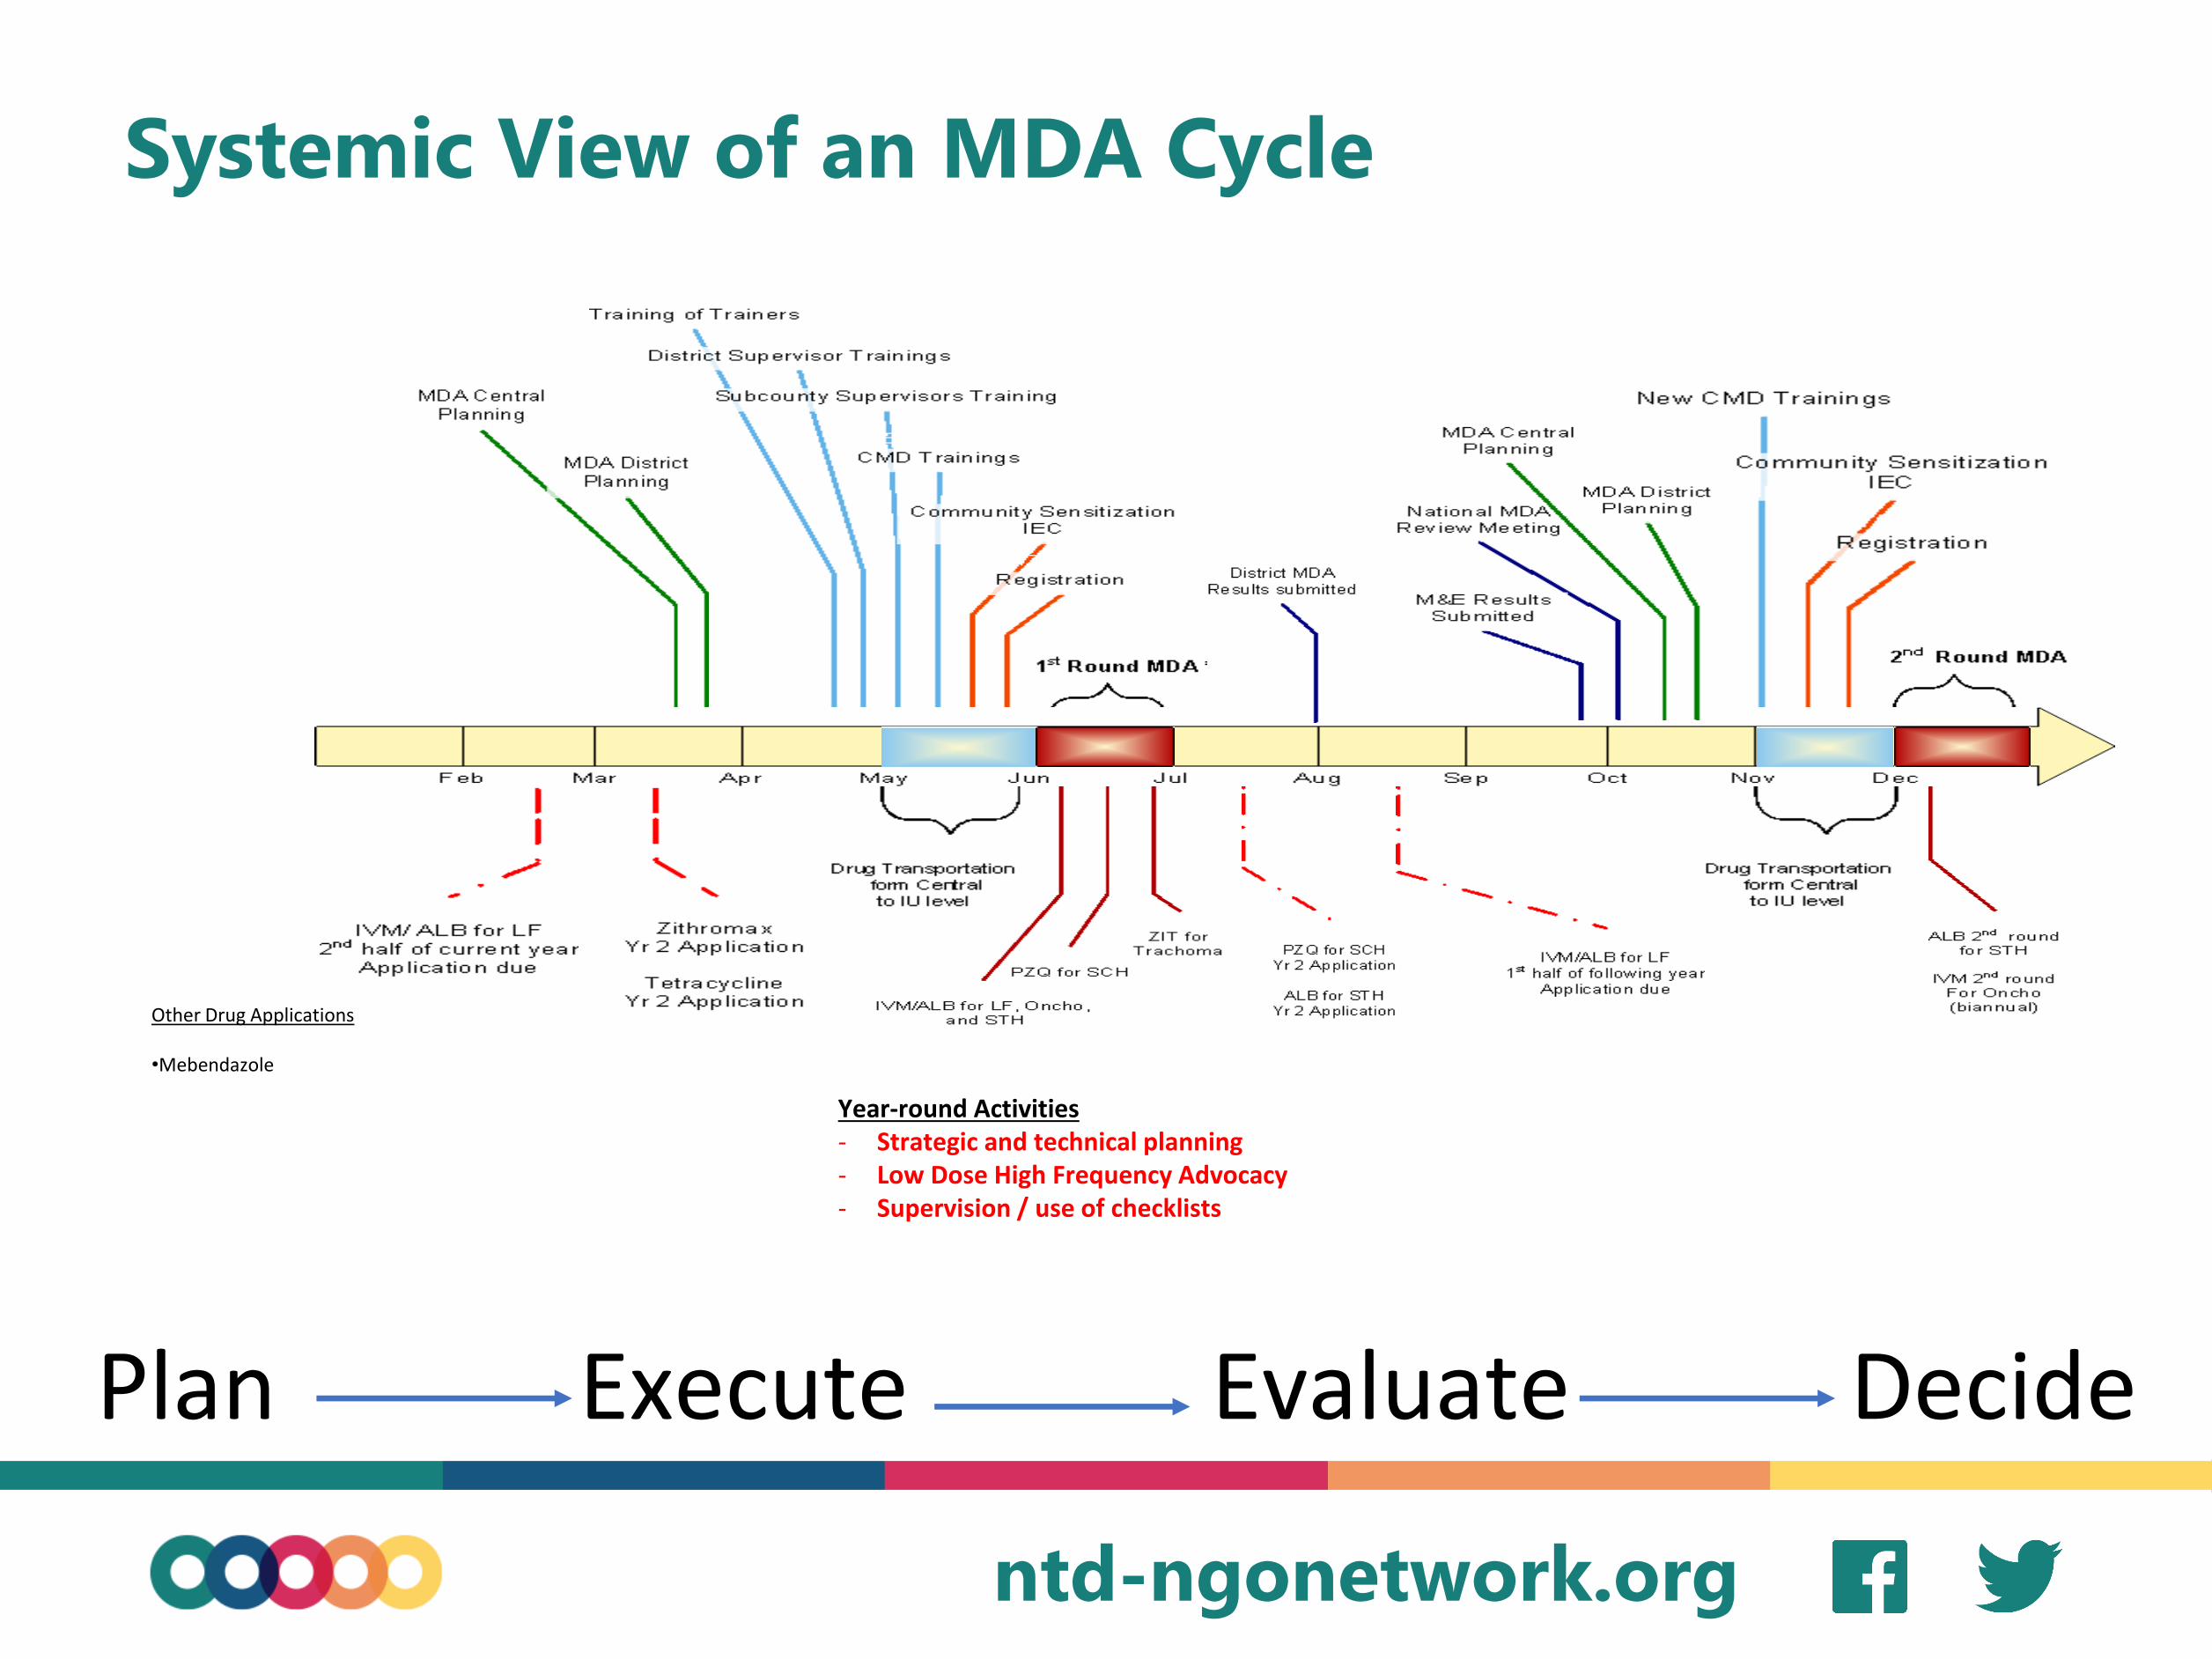
Systemic View of an MDA Cycle
Other Drug Applications
•Mebendazole
Year-round Activities- Strategic and technical planning- Low Dose High Frequency Advocacy- Supervision / use of checklists
Plan Execute Evaluate Decide

ntd-ngonetwork.org
NTDP Interventions Challenges
Challenges in FY 19 and FY20 to address through QI :
❑Low coverage;
Especially hard-to-reached conflict/insecurity areas, migrant, nomadic, transient boarders, and mining populations ( Sierra Leone)
❑DSA implementation;
✓LF pre-TAS repeat failure (Sierra Leone, Ghana)
✓LF TAS1 failure (…)
✓Trachoma TIS & TSS failure ( …)
ntd-ngonetwork.org
THANK YOU

ntd-ngonetwork.org
PLANNING FOR QUALITY IMPROVEMENT INITIATION IN SIERRA LEONE/HOW TO DESIGN YOUR TEST OF CHANGE
PRESENTED BY: DR. IBRAHIM KARGBO-LABOUR
NTDP MANAGER MINISTRY OF HEALTH AND SANITATION
NNN, Wednesday September 9, 2020

ntd-ngonetwork.org
≥10%
<5%
5%<10%
Not Endemic
Lymphatic Filariasis Baseline Prevalence
Background
•Mapping 2005: Higher prevalence in northern districts bordering Guinea (frequent seasonal migration by pastoralist and traders Fulani and Mandingo)
•Mass Drug Administration for Lymphatic filariasis (LF MDA) commenced in 2008
•In 2013 & 2017, four districts failed a pre-Transmission Assessment Survey (pre-TAS) using mf despite having reported ≥65% epidemiologic coverage since 2009
•In 2017 Western Area Rural also failed the pre-TAS despite having reported ≥65% epidemiologic coverage since 2010
ntd-ngonetwork.org
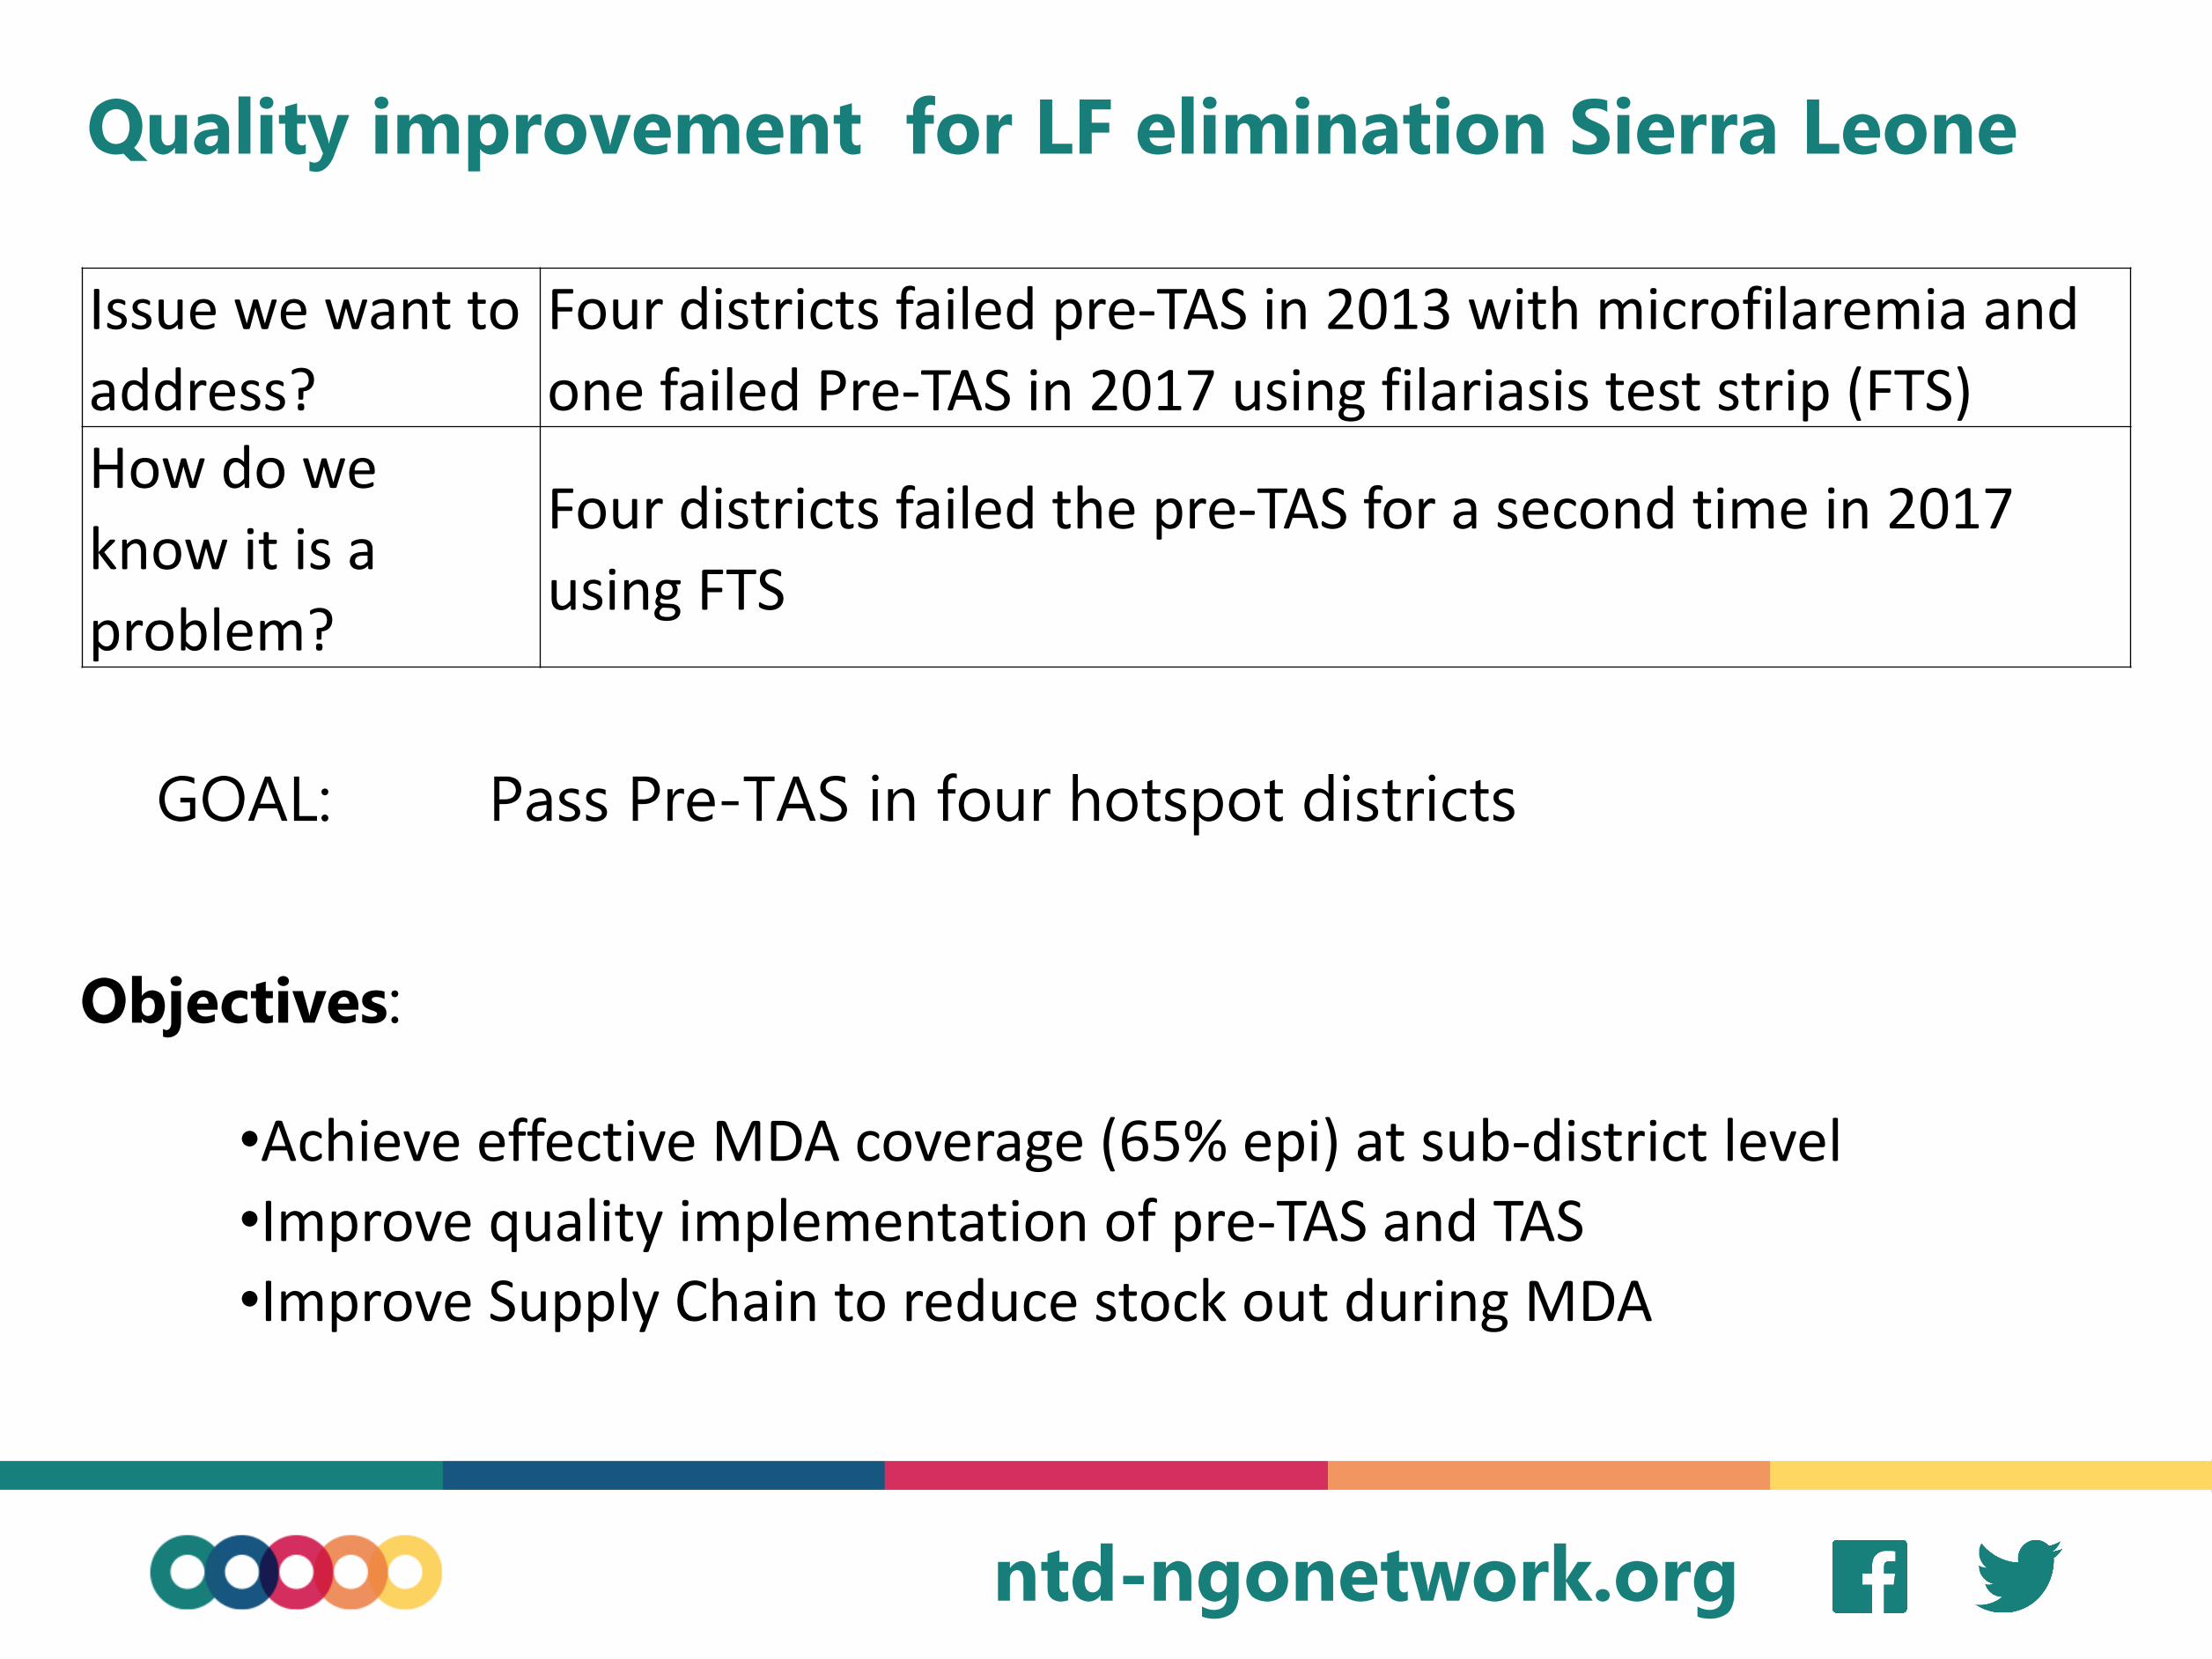
Quality improvement for LF elimination Sierra Leone
GOAL: Pass Pre-TAS in four hotspot districts
Objectives:
•Achieve effective MDA coverage (65% epi) at sub-district level
•Improve quality implementation of pre-TAS and TAS
•Improve Supply Chain to reduce stock out during MDA
Issue we want to
address?
Four districts failed pre-TAS in 2013 with microfilaremia and
one failed Pre-TAS in 2017 using filariasis test strip (FTS)How do we
know it is a
problem?
Four districts failed the pre-TAS for a second time in 2017
using FTS

ntd-ngonetwork.org
Quality improvement for LF elimination
The results of root-cause analysis identified four themes that required attention:
•Data Quality•Enhanced Community Engagement•Supply Chain Management•Pre-TAS preparation, training, implementation and supervision

ntd-ngonetwork.org
Data Quality Issue: sub-district analysis
Root-Causes:• CDD census inaccuracies• Urbanisation• Migration for
employment, schooling, trade
• People have accessed MDA outside their catchment community
District
Epi Coverage (%)
No. of PHUs with MDA coverage, 2019
<65% ≥65%≥100%
#PHU with inadequate Coverage (% to total PHU)
Kailahun 79.5 1 78 3 4 (4.9%)
Bombali 83.8 3 106 2 5(4.5%)
Koinadugu 78.8 13 45 20 33(42.3%)
Kenema 79.2 17 81 24 41(33.6%)

ntd-ngonetwork.org
Data Quality : Ideas to Enhance Quality
Change
• Update community drug distributors (CDDs) village census and registers
• Payments for CDDs
• Collect sub-district data asap and
immediately implement MDA support
and/or repeated mop-ups
Intervention
•Increase District Health Management
Team (DHMT) supervision, logistics and
utilize supervisor’s coverage tool (SCT)
• Revise training manuals
• Increase training days for peripheral
health unit (PHU) staff and in separate
cohorts for large districts, even pre-
COVID

ntd-ngonetwork.org
Supply Chain : Improvement Ideas
•Recruit staff: Pharmacist,
Storekeeper and M&E Officer 2
• Improve NTD drugs inventory
at the District Medical Store
•Strengthening NTD logistics
management information
system (LMIS)
•Training on NTD inventory
management
• Strengthening reverse logistics

ntd-ngonetwork.org
Quality Implementation of Pre-TAS
• Training of field supervisors and survey teams on approved survey protocol
by national NTDP, Helen Keller and FHI 360 LF technical Advisor
• Sensitization of communities at selected sites prior to survey implementation
• Survey implementation: sample collection using LF bench Aid
• Supervision of Pre-TAS by NTDP, Helen Keller and FHI 360 LF technical Advisor
• The use of electronic data collection forms for the collection of supervisory and survey data.

ntd-ngonetwork.org
Community Engagement Issues
• Urban communities are partially influenced by non-traditional opinion leaders
and social media
• Young people do not feel ‘at risk’ of LF or Covid-19 and will be hesitant to participate
• Adolescents/youth are concerned about fertility during LF MDA
• Communities are very wary/hostile of outsiders entering their villages during an epidemic (Ebola and COVID) especially in ‘opposition’ areas
• The Fullah ethnic group needs a parallel system of traditional leaders to accept messages

ntd-ngonetwork.org
Rapid assessment
• Rapid assessment of the social dynamics in the four LF hotpot districts that may influence Pre-TAS and MDA compliance in the context of Covid-19 by adapting the approach used during the Ebola vaccine trails:
• focus group discussions
• in depth interviews (chiefs, councilors, women’s leaders, youth leaders)
• ethnographic observation
• power mapping and
• rumor tracking
• Findings will help to start the process of identifying the change of idea.
ntd-ngonetwork.org
THANK YOU !!!

ntd-ngonetwork.org
USING QUALITY IMPROVEMENT TO STRENGTHEN THE NTD
PROGRAM IN GHANA : RESULTS & LESSONS LEARNED
Dr Benjamin Marfo
NTD Programme Manager
Public Health Division
MDA
Small scale test
Adaptation andfollow-up tests
Scale up
Make sure successfulchange is permanent

ntd-ngonetwork.org
Background
■Ghana began the LF Program in 2001
■114/260 districts endemic
■At risk population: 12 million
■Broken transmission in 99/114 districts
■In 2019, treatable population in the 15 districts is 1,169,357
■High prevalence of LF in 15 districts despite 15-19 MDA rounds
– Persistent pre-TAS failure
– Which factors are responsible?

ntd-ngonetwork.org
Outlook of Impact Assessments (Pre-TAS)
LF District
2014
Prevalence %
2015
Prevalence
%
2017
Prevalence
%
2018
Prevalence
%
2019
Prevalence
%
Sunyani Municipal 2.1% (NBS) - 10.3% (FTS) - 2.8 (FTS)
Sunyani West 0.9% (NBS) - 10.1% (FTS) - 4.2 (FTS)Bole 5.6% (NBS) - 9.7% (FTS) - 8.4 (FTS)
Sawla-Tuna-Kalba 1.7% (NBS) - 12.3% (FTS) - 6.3 (FTS)North Gonja 0% (NBS) - 2.0% (FTS) - 0.3 (FTS)West Gonja 4.3% (NBS) - 0.9% (FTS) -
Nabdam - 1.0% (NBS) - 11.0% (FTS)Kassena Nankana West 1.7% (NBS) - - 1.4% (FTS)Jirapa - 1.4% (NBS) - 9.1% (FTS)Lawra - 1.0% (NBS) - 8.8% (FTS)Wa East - 1.0% (NBS) - 3.7% (FTS)Wa West - 1.9% (NBS) - 2.6% (FTS)Ahanta West 1.4% (NBS) - 12.6% (FTS) - 4.2 (FTS)Axim Municipal 3.75% (NBS) - 7.0% (FTS) - 3.0 (FTS)Ellembelle 4.5% (NBS) - 6.8% (FTS) - 2.2 (FTS)

ntd-ngonetwork.org
Magnitude of the Problem
❖High non-compliance (Refusals & Absenteeism)
▪ Compliance (44%) meaning Non-compliance (56%) for 2012 MDA-Offei M. et al (2014)
❖Poor data quality (untimely, incomplete & inaccurate data)
▪ Data quality assessment results show that over 60% of reported MDA data in 2015 was inaccurate. de Souza DK et al (2016) in 10/12 (83.3%) sites assessed
ntd-ngonetwork.org
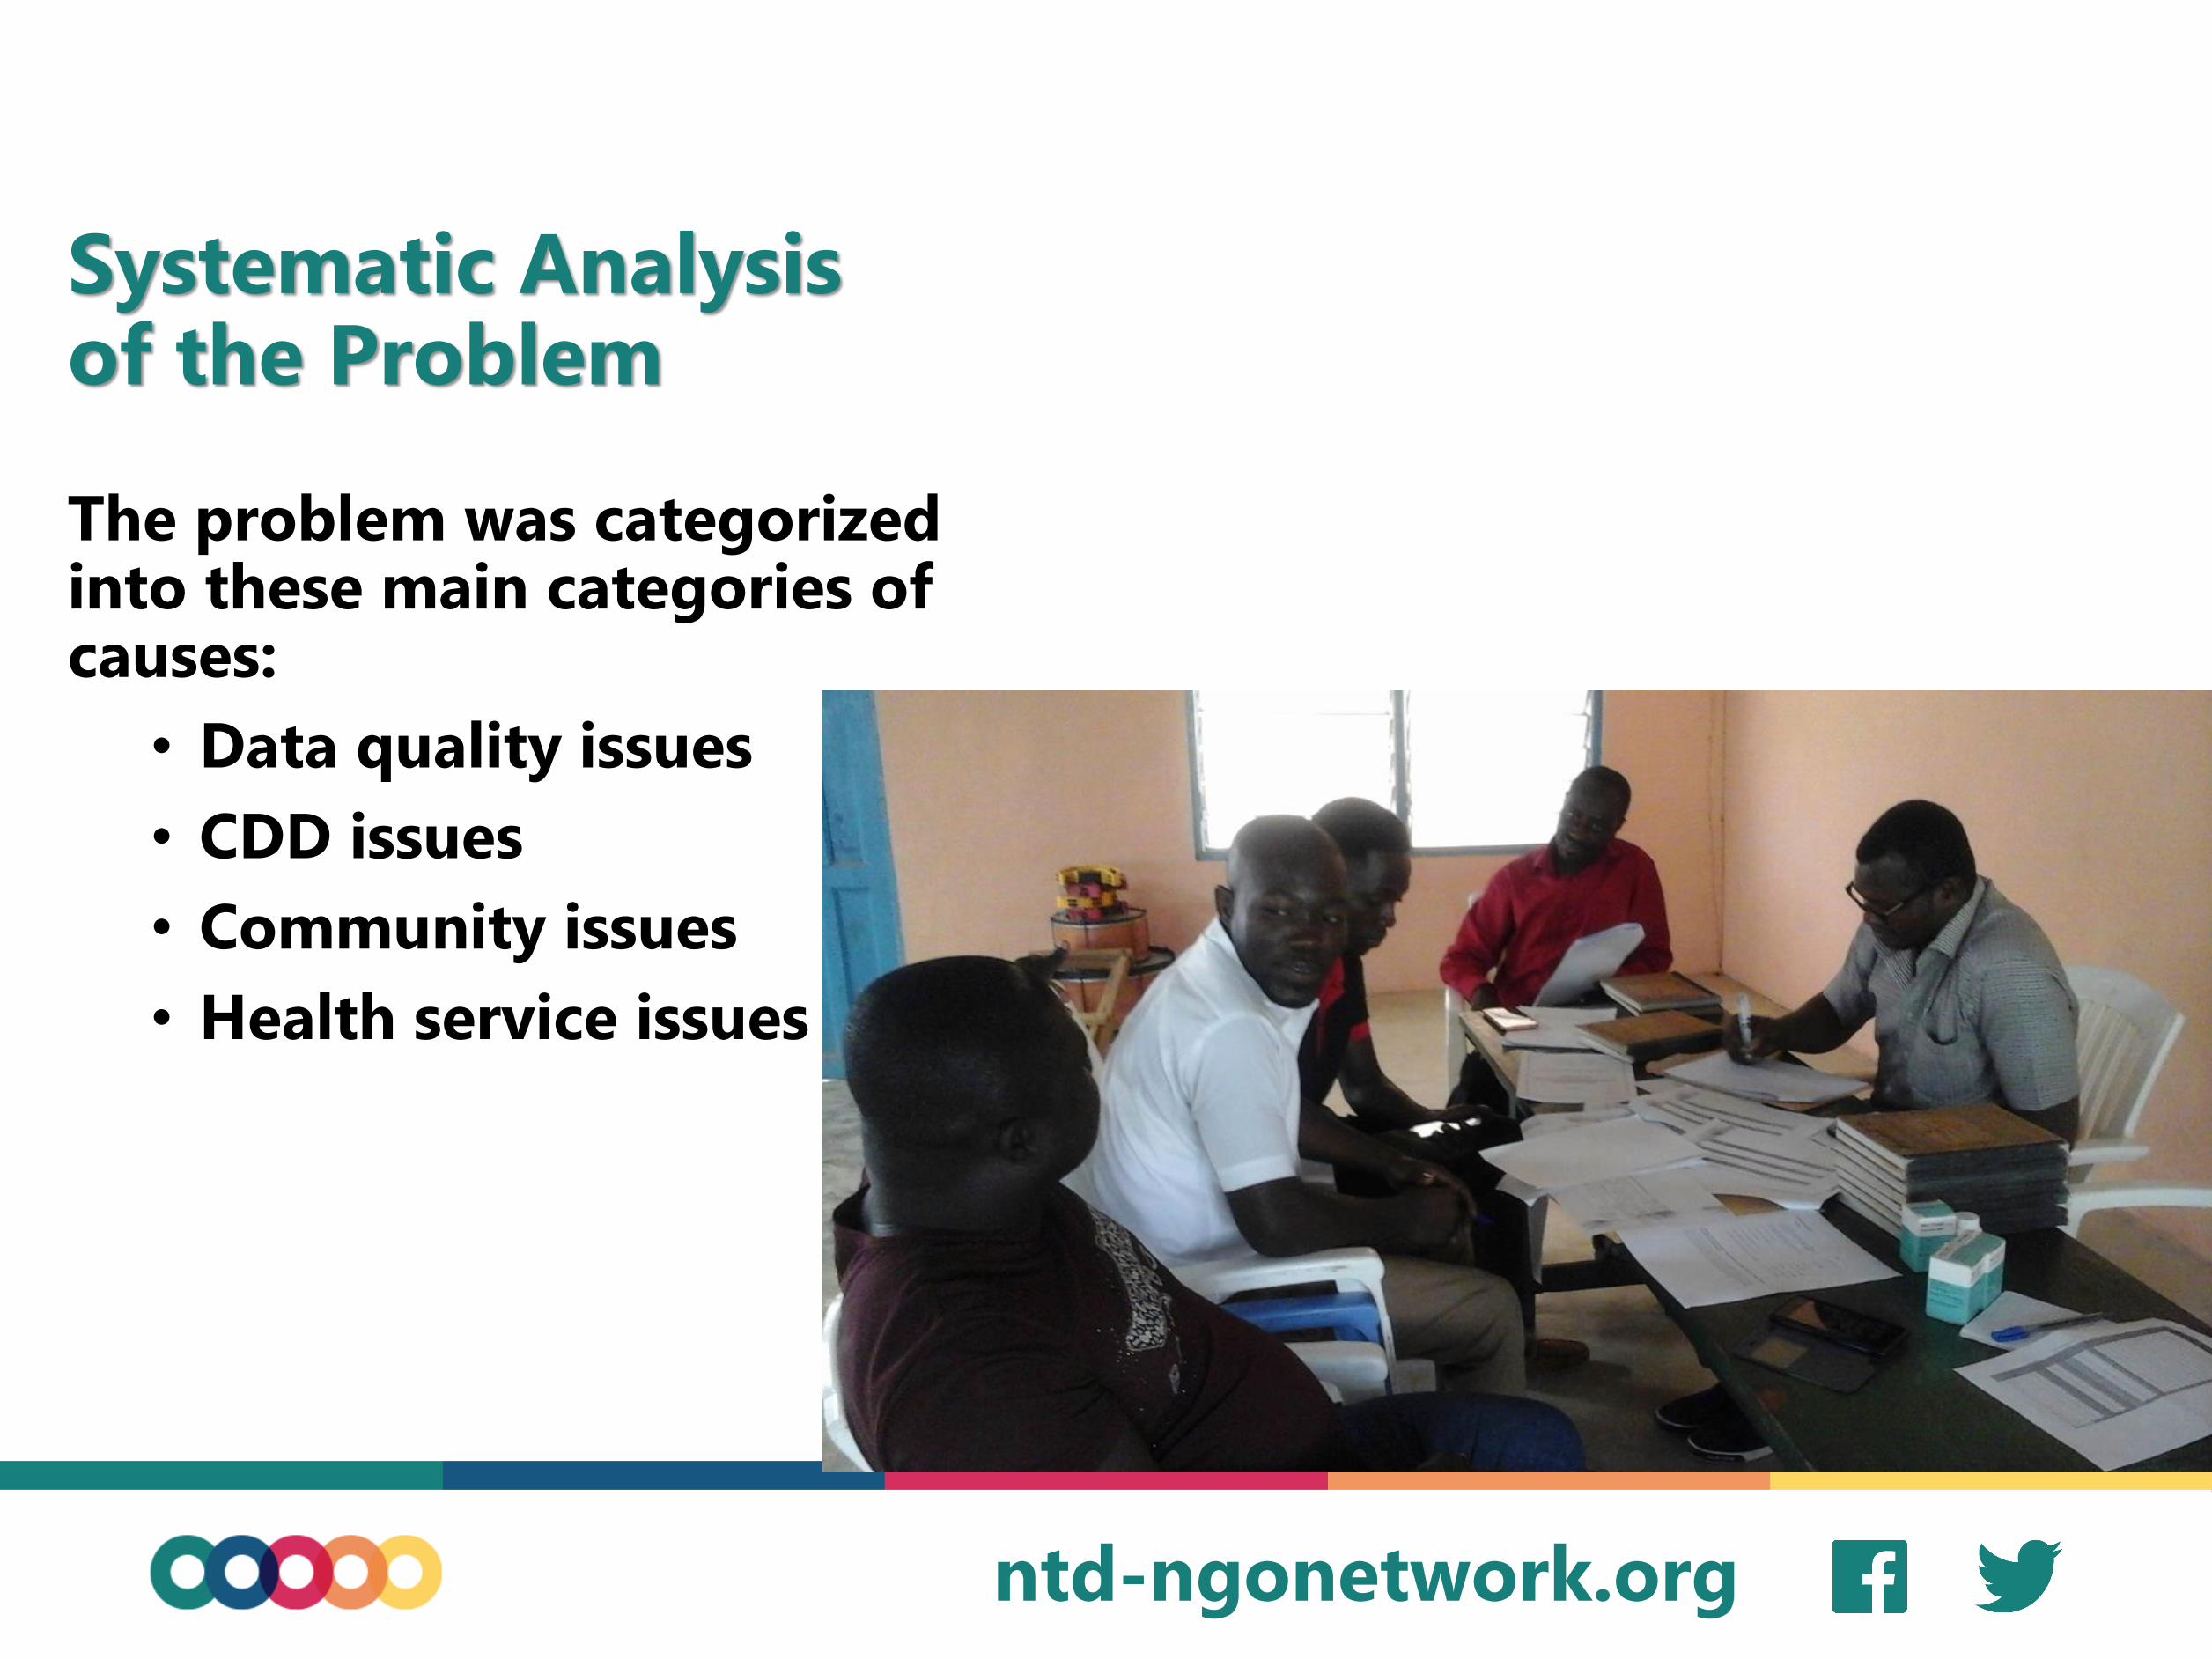
Systematic Analysis of the Problem
The problem was categorized into these main categories of causes:
• Data quality issues
• CDD issues
• Community issues
• Health service issues
ntd-ngonetwork.org
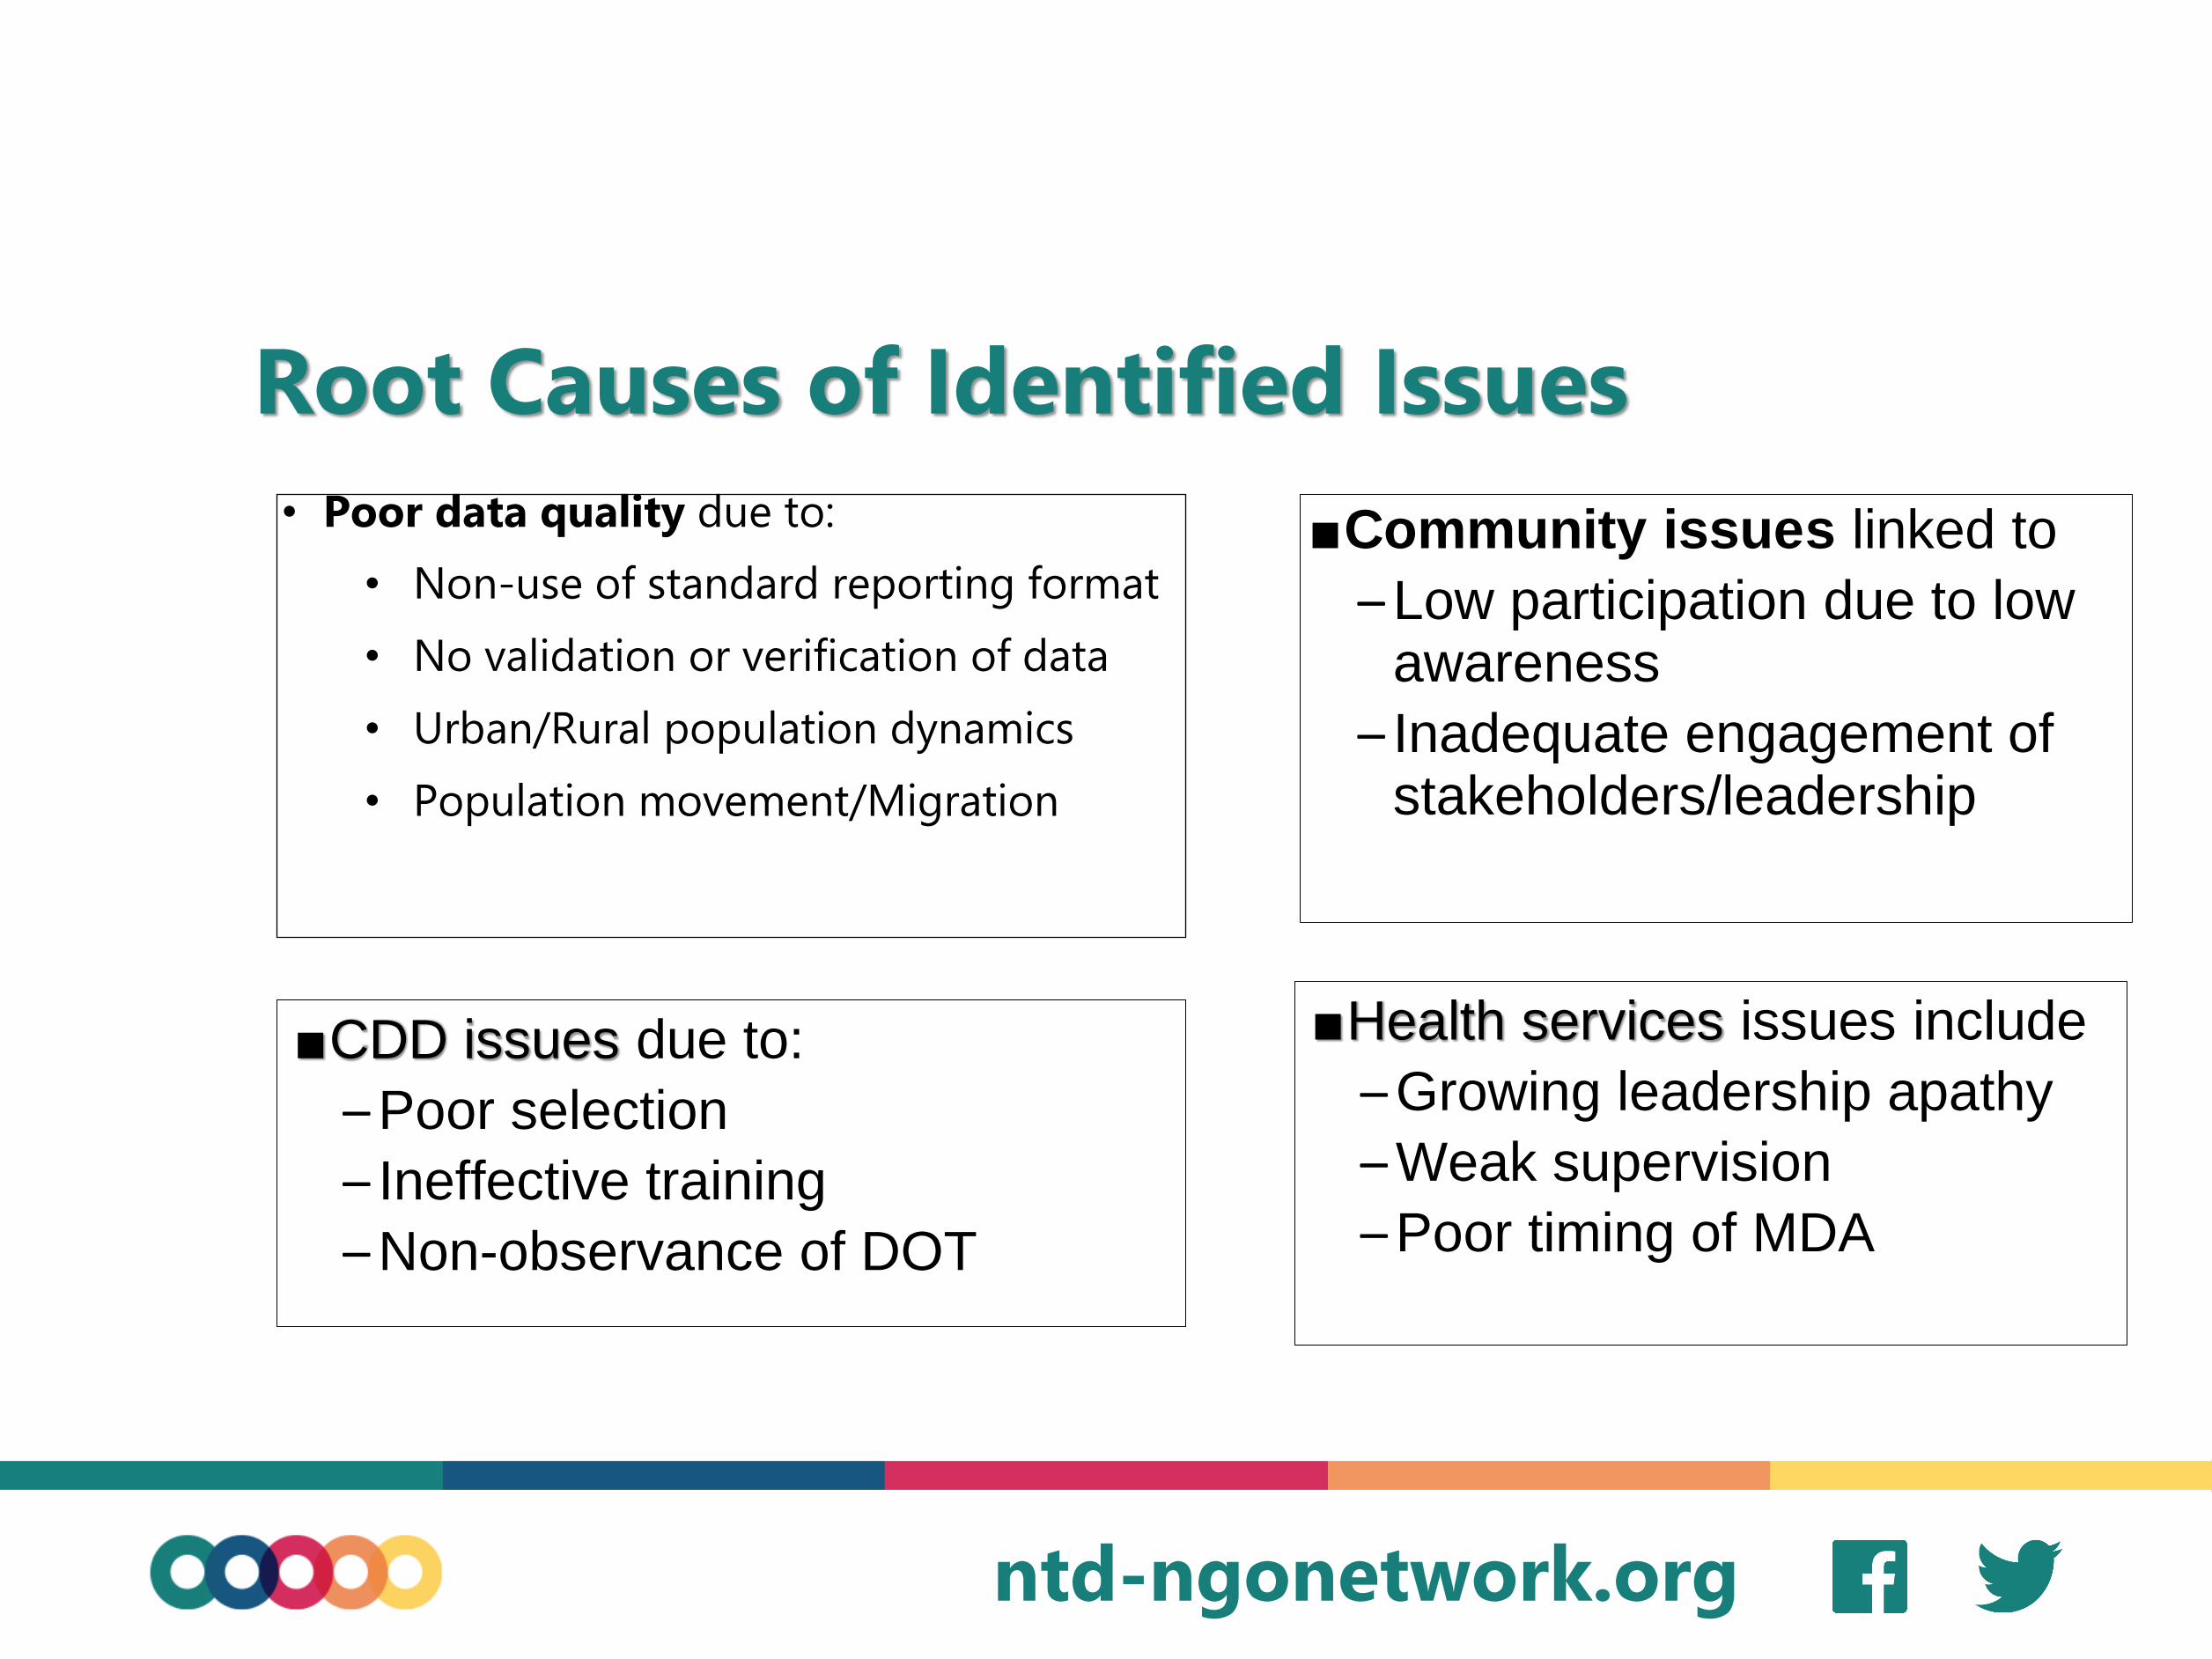
Root Causes of Identified Issues
• Poor data quality due to:
• Non-use of standard reporting format
• No validation or verification of data
• Urban/Rural population dynamics
• Population movement/Migration
■CDD issues due to:
– Poor selection
– Ineffective training
– Non-observance of DOT
■Community issues linked to
– Low participation due to low awareness
– Inadequate engagement of stakeholders/leadership
■Health services issues include
– Growing leadership apathy
– Weak supervision
– Poor timing of MDA
ntd-ngonetwork.org
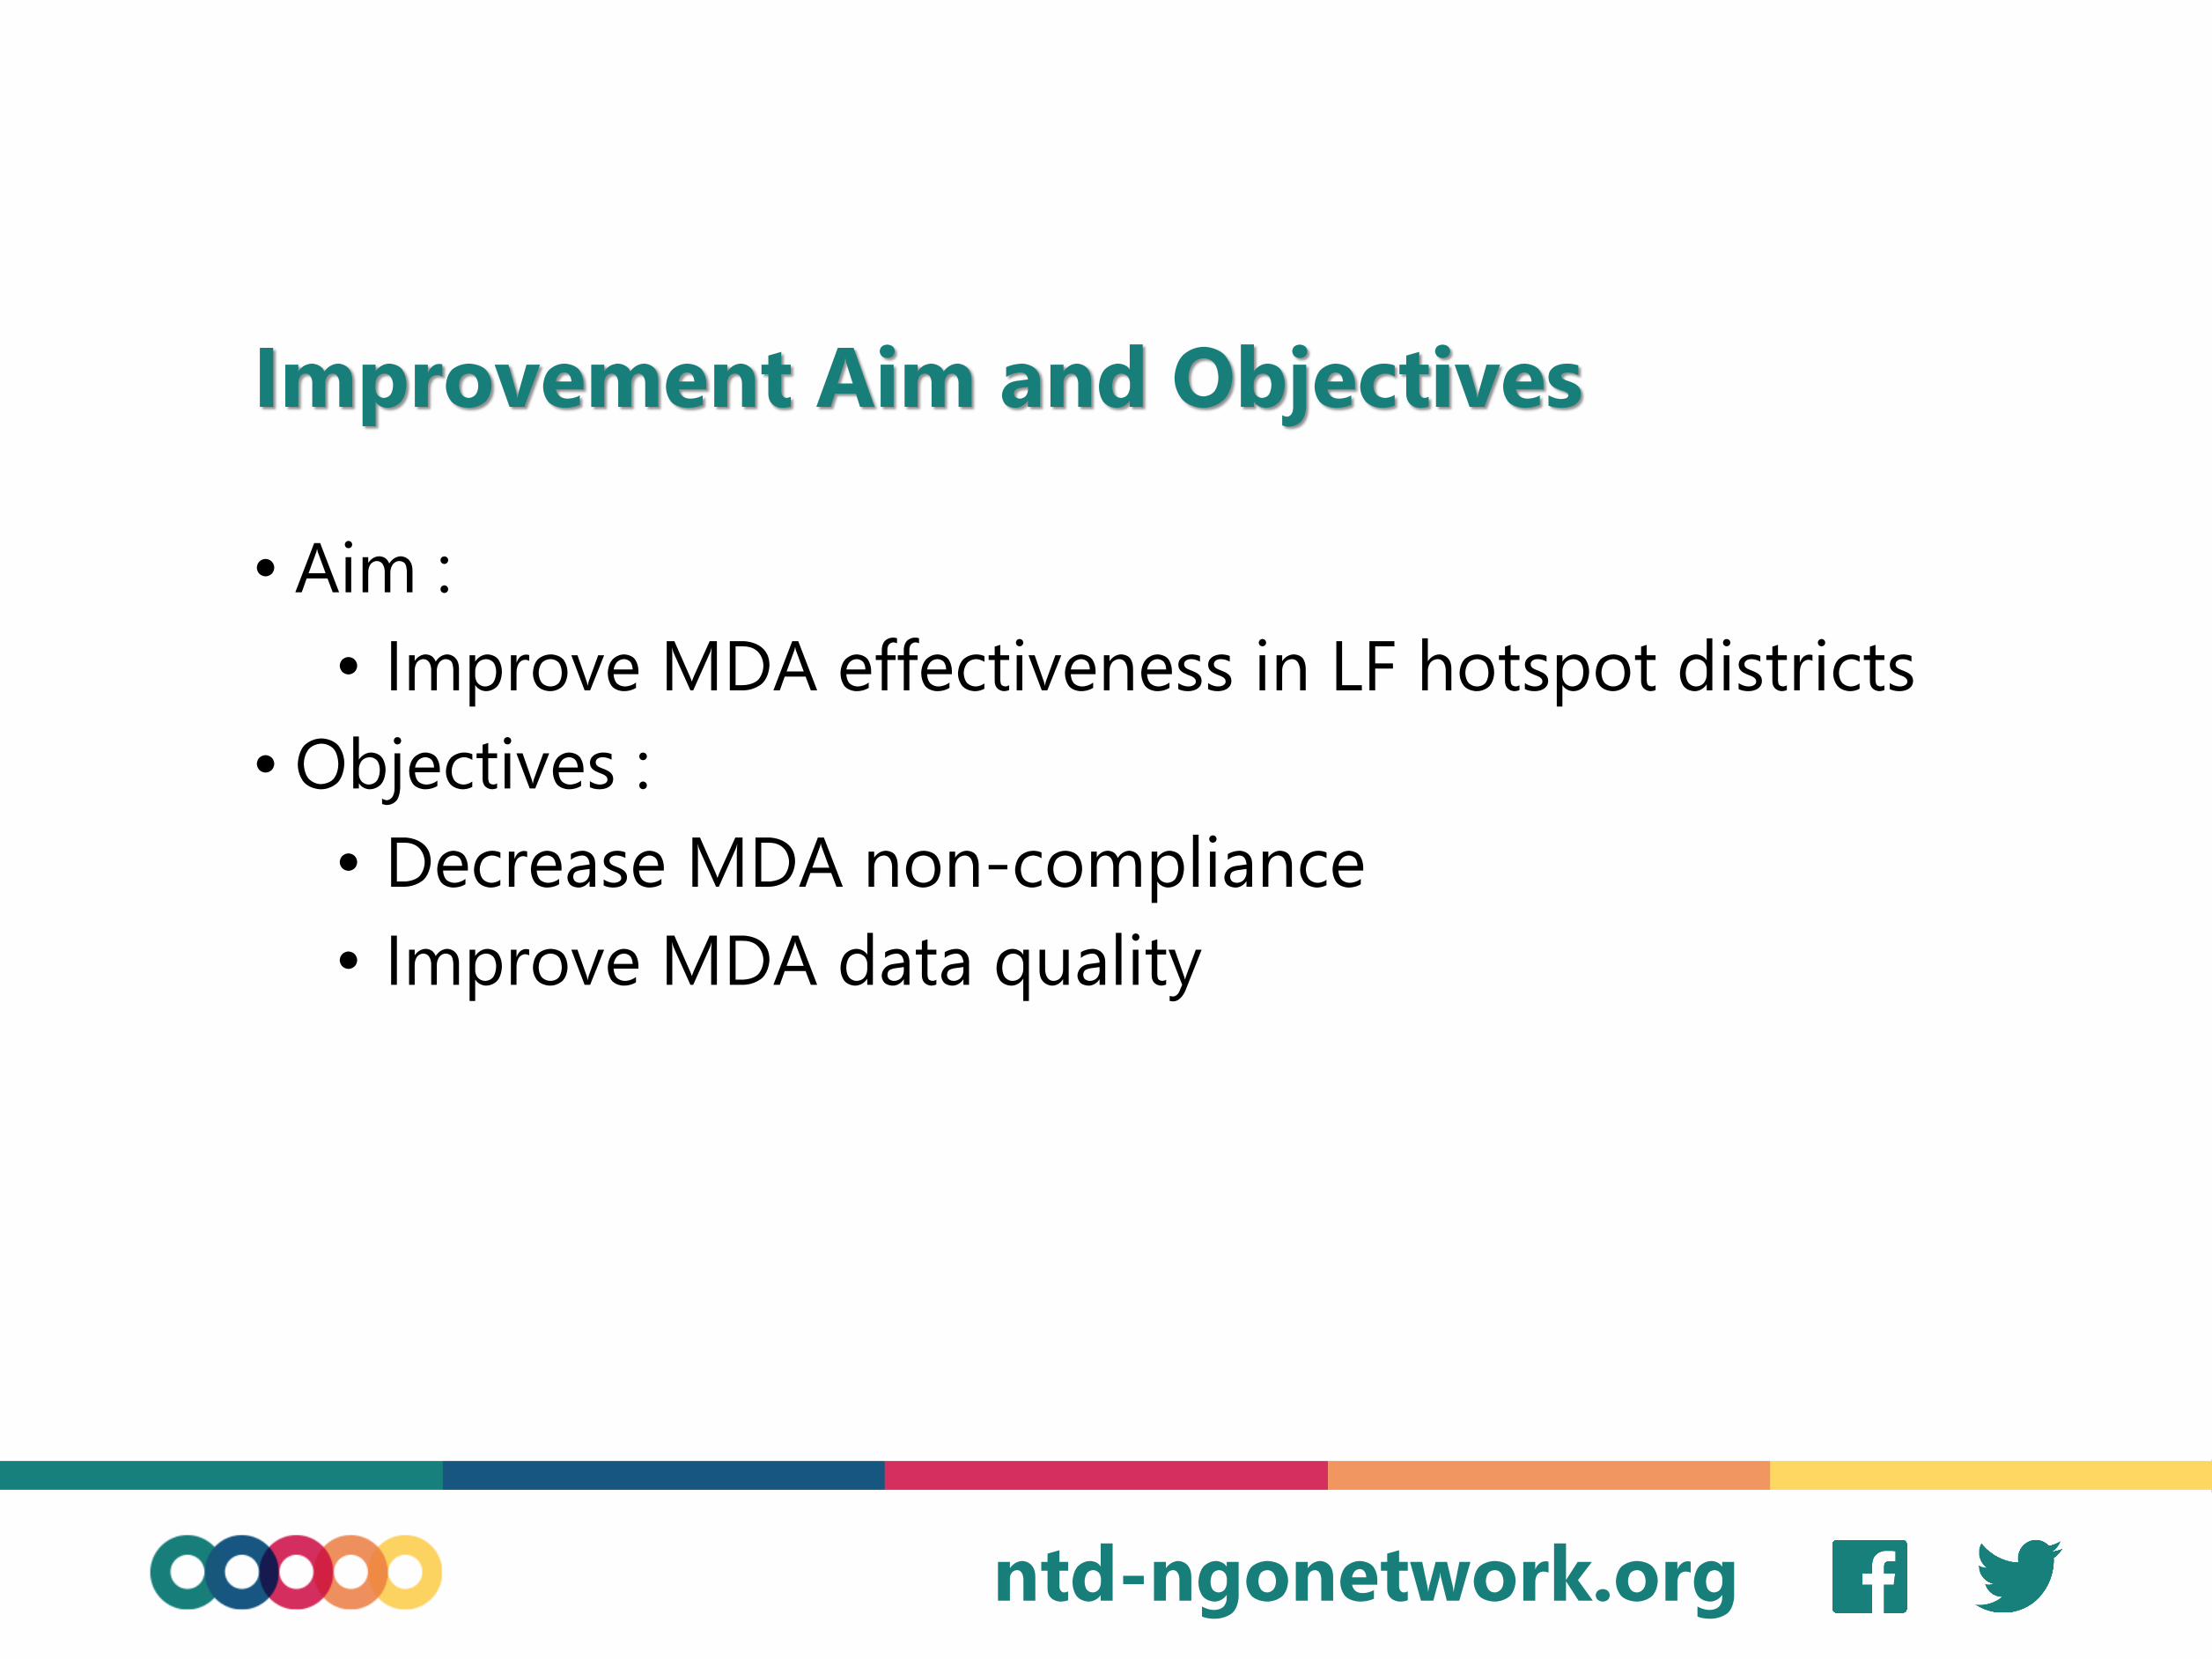
Improvement Aim and Objectives
• Aim :
• Improve MDA effectiveness in LF hotspot districts
• Objectives :
• Decrease MDA non-compliance
• Improve MDA data quality

ntd-ngonetwork.org
Applying QI Model (Collaborative) to strengthen NTDP
LS1 LS2 LS3MDA1 MDA2 MDA3
AP1 AP2 AP3
LFET
Application
of QI Models
Intensive support from sub-district change agents
Leadership engagement
& buy-in
Establish program fundamentals
Peer review session
Consolidate on gains
Objective:

ntd-ngonetwork.org
Change Ideas Tested – Data Quality
• Reviewed data management training module
• Instituted data validation and verification
• Population figures: Separation of migrant settlements (special population) from main communities

ntd-ngonetwork.org
Change ideas tested
CDD related
Community related▪ Improved sensitization
▪ Effective engagement of social groups
▪ Review CDD training manual
▪ Enhanced CDD incentives
Health system factors
▪ Engagement of stakeholders, including partners, to review MDA treatment cycle
▪ Use of the new supervisory coverage tool
▪ Empower/delegation to regions and districts staff to own program
ntd-ngonetwork.org
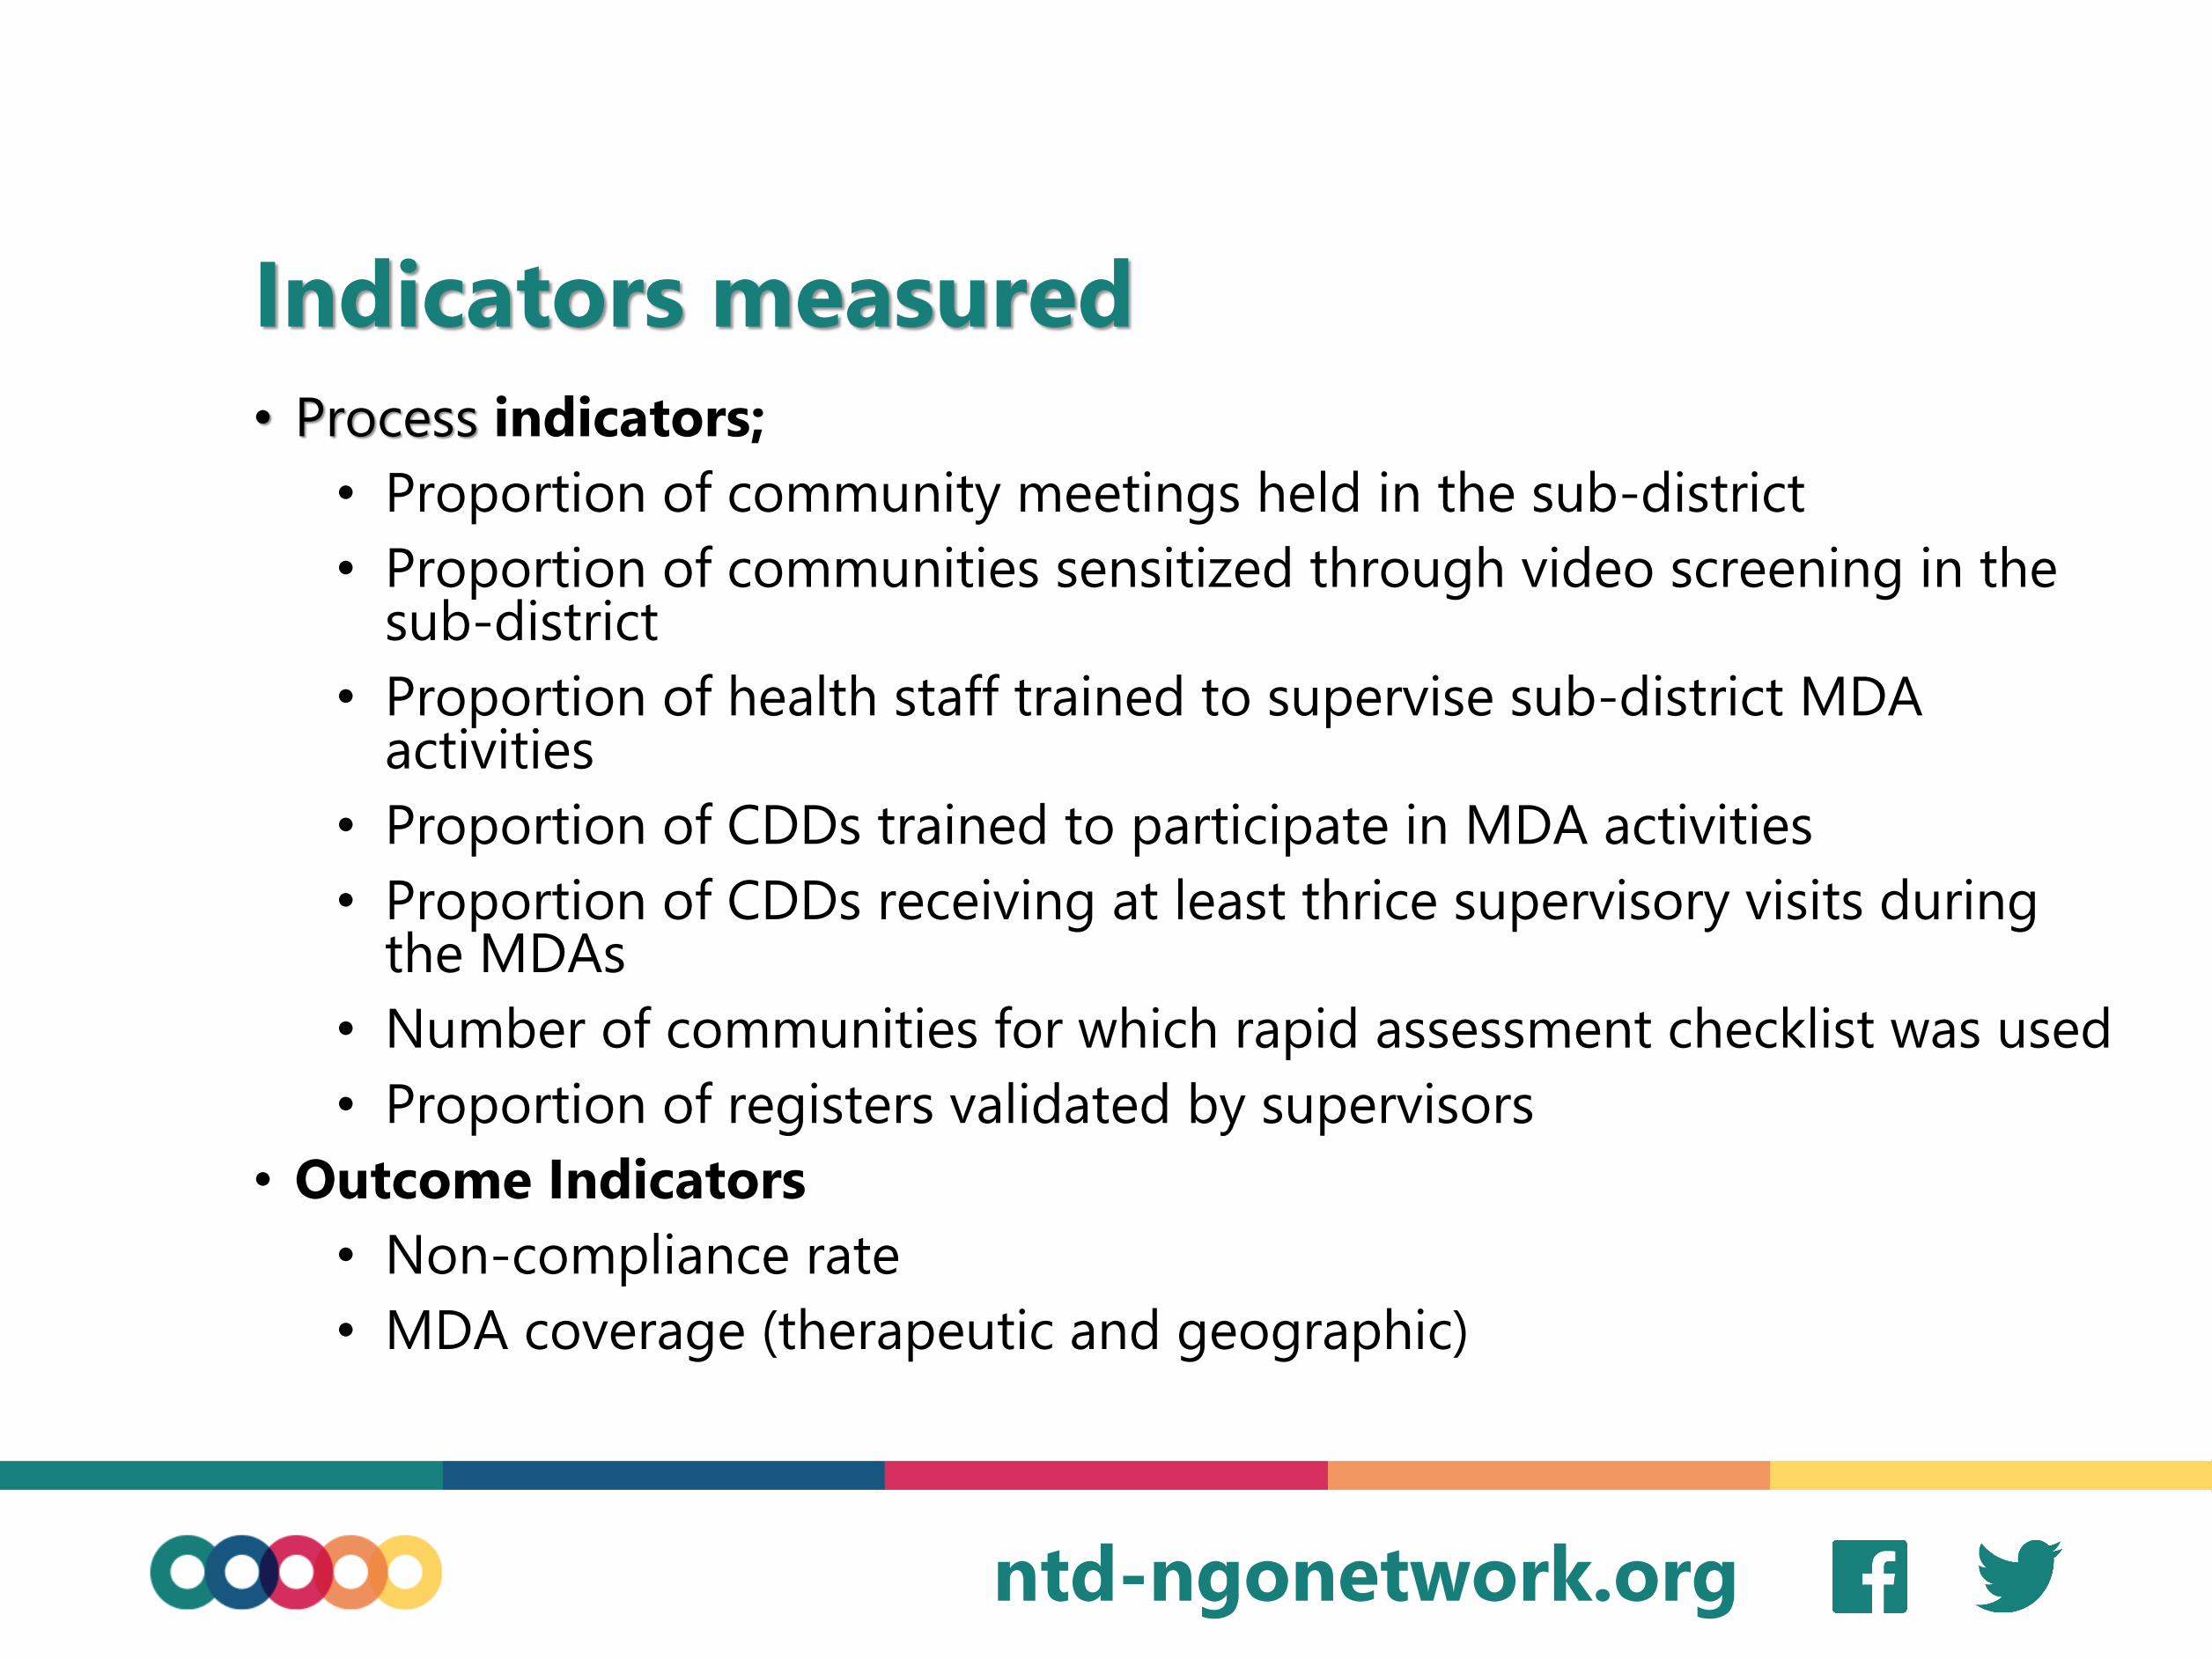
Indicators measured
• Process indicators;
• Proportion of community meetings held in the sub-district
• Proportion of communities sensitized through video screening in the sub-district
• Proportion of health staff trained to supervise sub-district MDA activities
• Proportion of CDDs trained to participate in MDA activities
• Proportion of CDDs receiving at least thrice supervisory visits during the MDAs
• Number of communities for which rapid assessment checklist was used
• Proportion of registers validated by supervisors
• Outcome Indicators
• Non-compliance rate
• MDA coverage (therapeutic and geographic)
ntd-ngonetwork.org
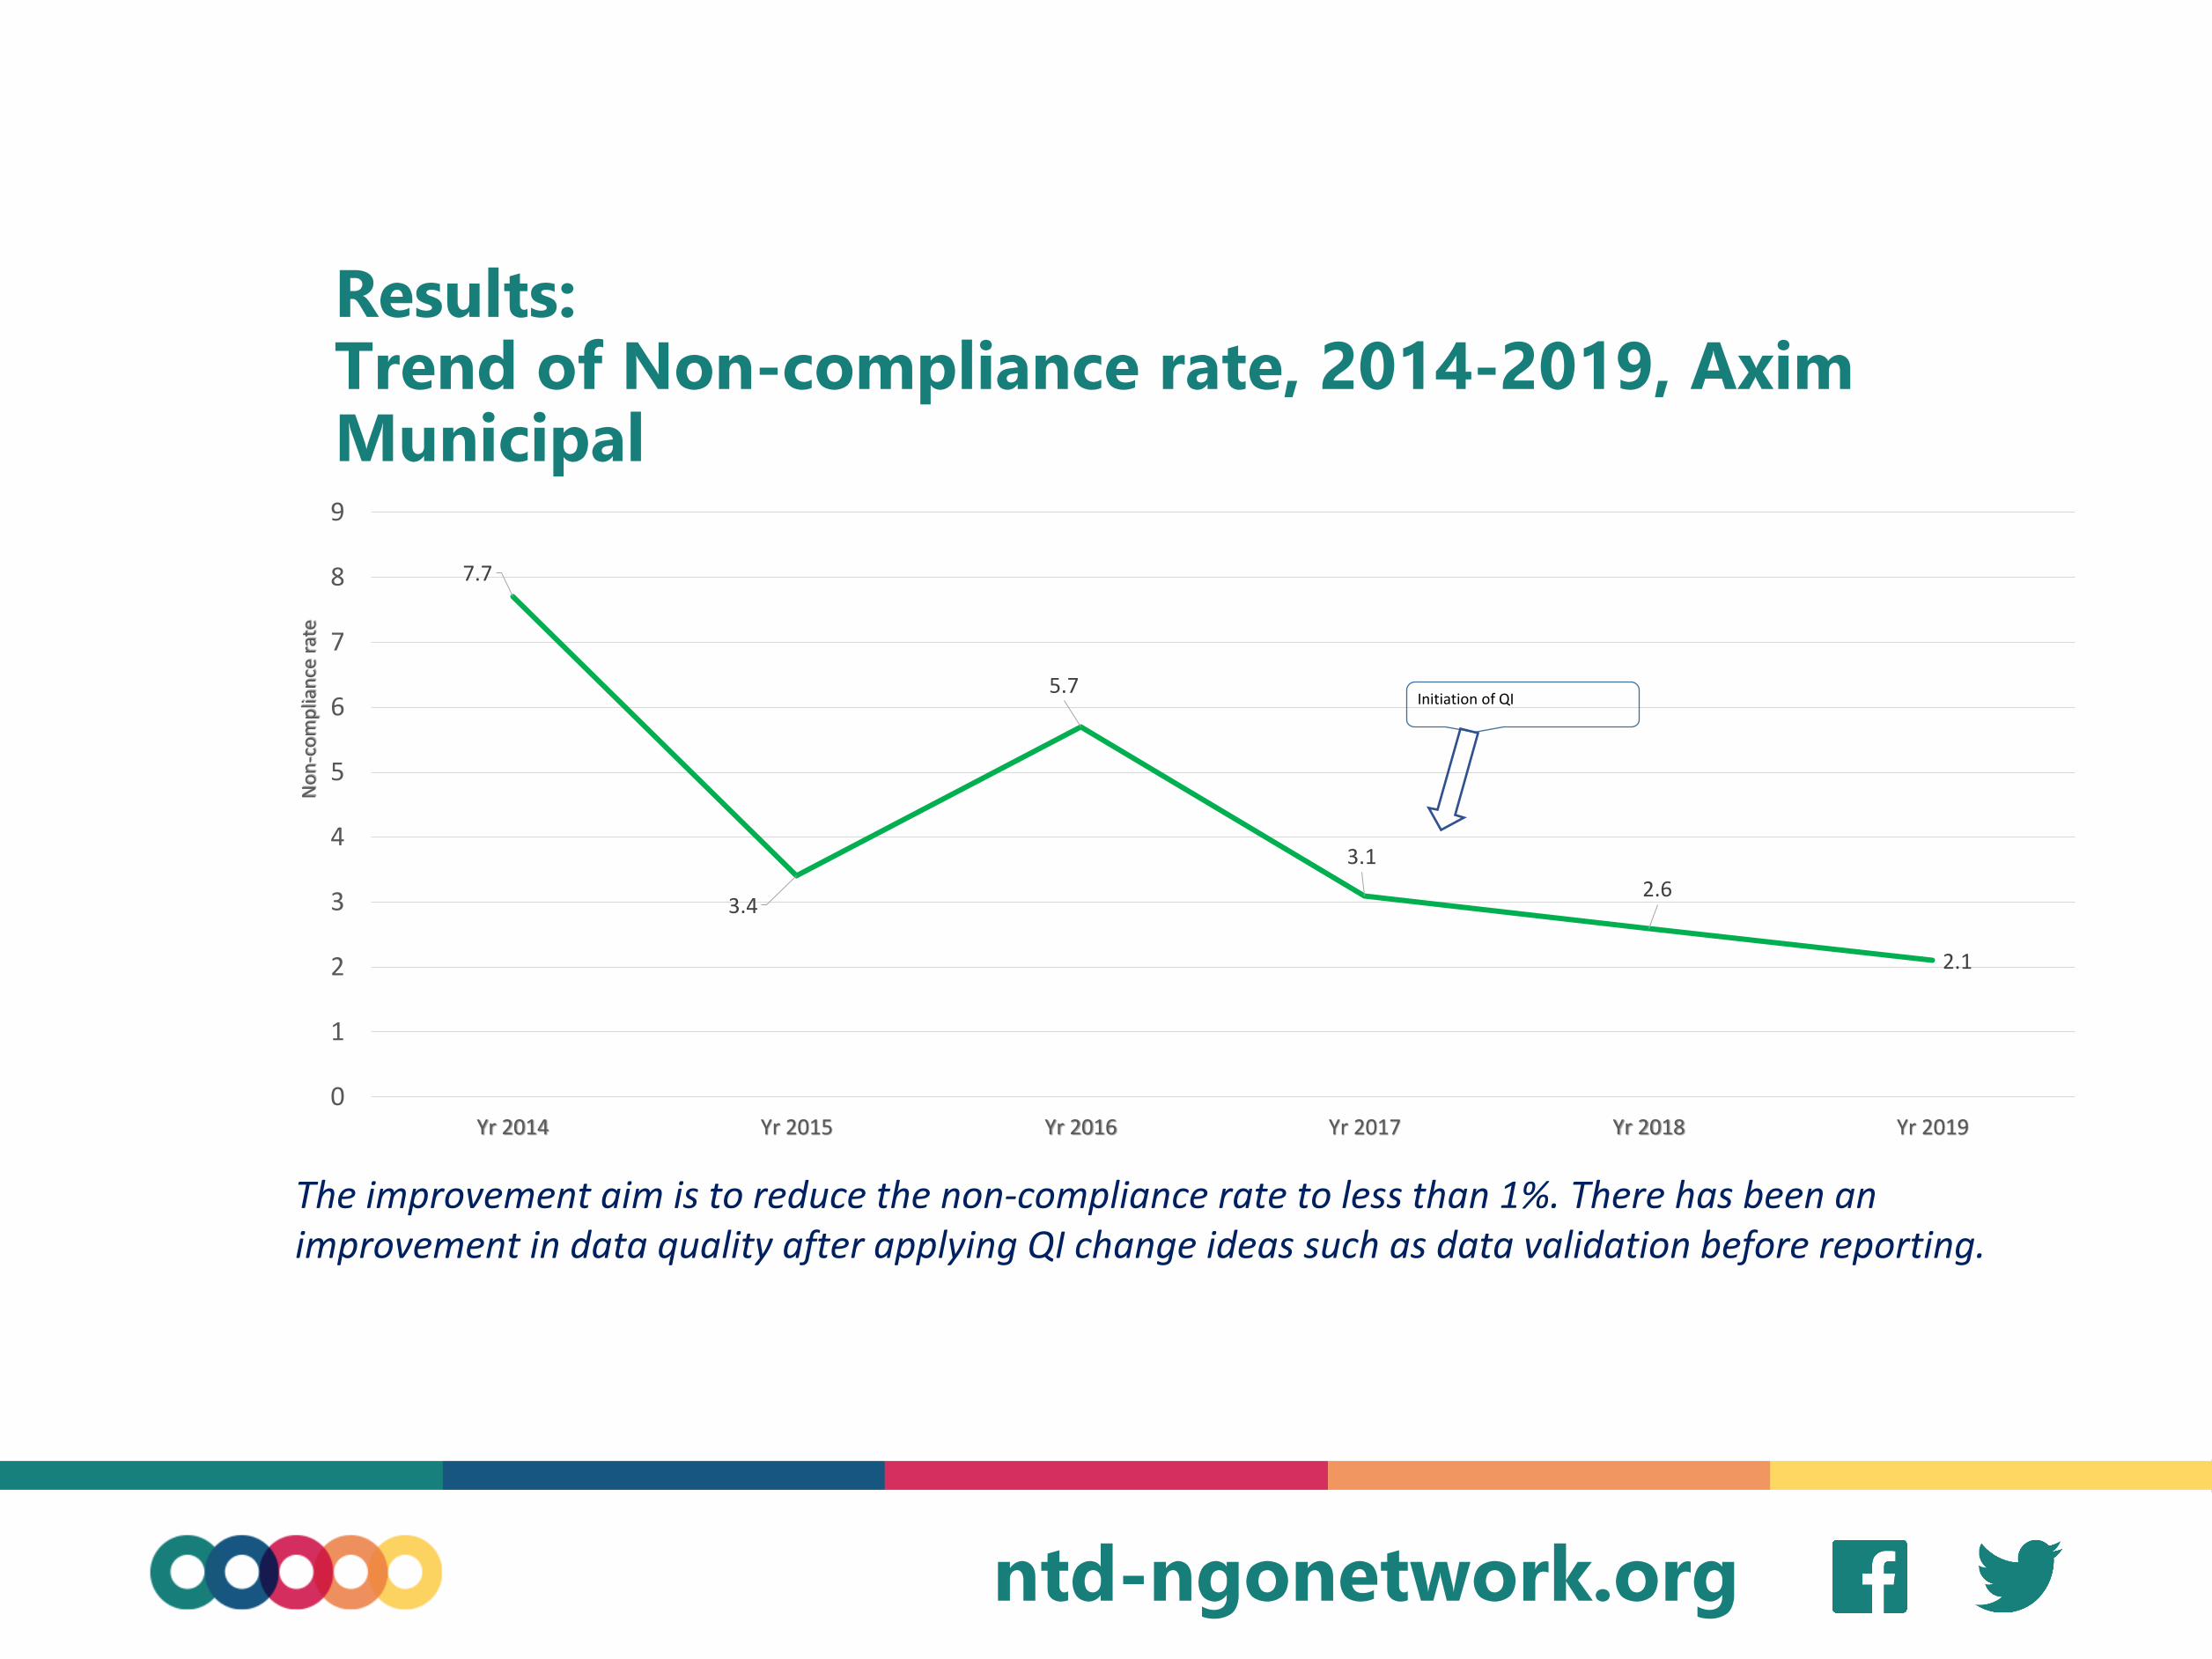
Results:Trend of Non-compliance rate, 2014-2019, Axim Municipal
7.7
3.4
5.7
3.1
2.6
2.1
0
1
2
3
4
5
6
7
8
9
Yr 2014 Yr 2015 Yr 2016 Yr 2017 Yr 2018 Yr 2019
No
n-c
om
plia
nce
rat
e
Initiation of QI
The improvement aim is to reduce the non-compliance rate to less than 1%. There has been an improvement in data quality after applying QI change ideas such as data validation before reporting.
ntd-ngonetwork.org
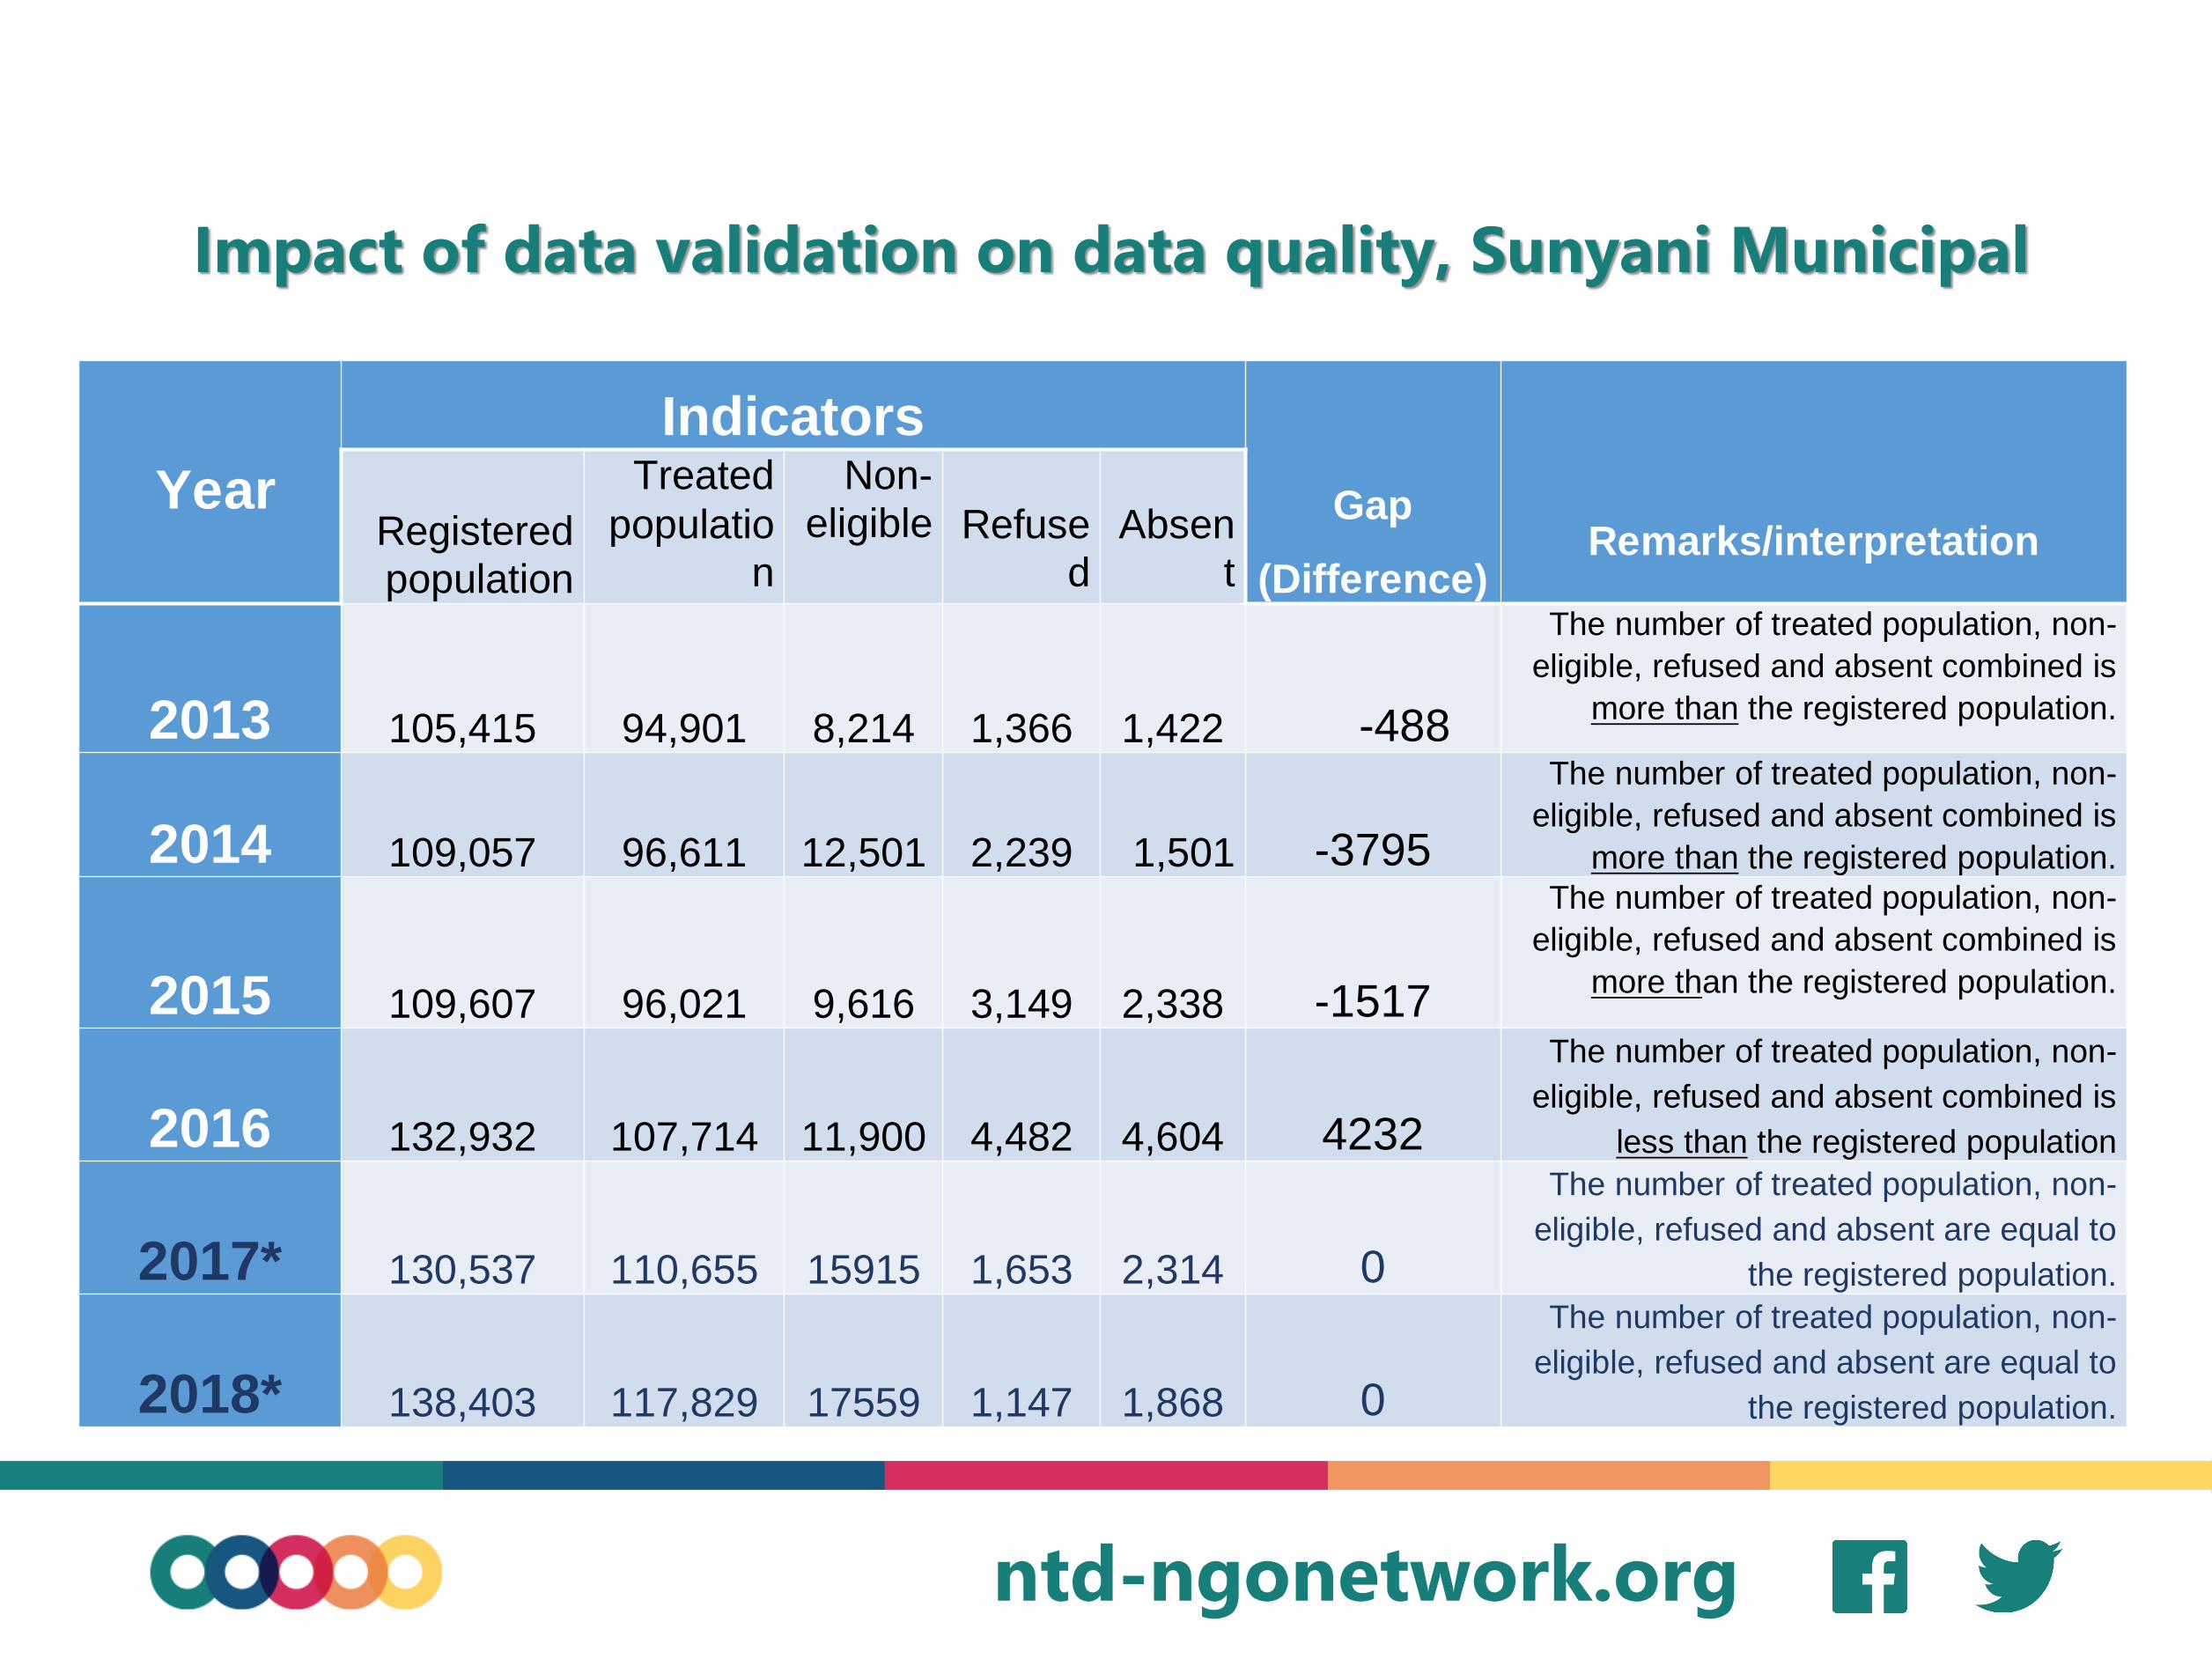
Impact of data validation on data quality, Sunyani Municipal
Year
Indicators
Gap
(Difference)Remarks/interpretation Registered
population
Treated
populatio
n
Non-
eligible Refuse
d
Absen
t
2013 105,415 94,901 8,214 1,366 1,422 -488
The number of treated population, non-
eligible, refused and absent combined is
more than the registered population.
2014 109,057 96,611 12,501 2,239 1,501 -3795
The number of treated population, non-
eligible, refused and absent combined is
more than the registered population.
2015 109,607 96,021 9,616 3,149 2,338 -1517
The number of treated population, non-
eligible, refused and absent combined is
more than the registered population.
2016 132,932 107,714 11,900 4,482 4,604 4232
The number of treated population, non-
eligible, refused and absent combined is
less than the registered population
2017* 130,537 110,655 15915 1,653 2,314 0
The number of treated population, non-
eligible, refused and absent are equal to
the registered population.
2018* 138,403 117,829 17559 1,147 1,868 0
The number of treated population, non-
eligible, refused and absent are equal to
the registered population.

ntd-ngonetwork.org
Impact of data validation on 2019 MDA data quality
District Population
Pop
Treated
Non-
Eligible Refused Absent Gap
Sunyani Mun 128549 109756 16092 1058 1643 0
Sunyani West 101945 86164 12074 1180 2527 0
Ahanta West 103756 92269 9355 998 1134 0
Ellembelle 91860 81826 4409 1384 4241 0
Axim Mun 68830 59237 7919 400 1274 0
Sawla T. Kalba 86926 76756 4074 949 5147 0
Bole 76282 64410 5322 1420 5130 0
West Gonja 36319 29874 1918 60 4467 0

ntd-ngonetwork.org
Lesson learned
▪ Improved sensitization
• District teams through an enhanced sensitization activities ensured every household and groups were reached with MDA messages
• Used laminated photos of LF morbidities in the campaign
• Some LF sufferers offered to campaign as ambassadors of the program
▪ Use of the new supervisory coverage tool
• The definition of refusal and absent were reviewed to fully accommodate three (3) revisits by CDDs and ensure compliance of the DOT strategy
■ Instituted data validation and verification
• Institution of data verification and validation measures at the community and sub-district levels helped to prevent under and over registration of registrants
• All supervisors received training on data validation to verify and validate data at all levels
■ Mitigation Fluctuating population Indigenous population must be separated from migrants and other temporal settlements and registered separately.

ntd-ngonetwork.org
Way forward
• Institutionalize the best practices in all the districts
• Continue to use QI model to test new ideas of change

ntd-ngonetwork.org
THANK YOU
ntd-ngonetwork.org
Questions for Debate
1. How to integrate QI into a program that operates through campaigns?
2. How to measure the effect of changes for NTD programs?
3. How to test the validity & measure the added value of QI for NTD programs, using a mix of implementation science and formative research?
ntd-ngonetwork.org