Welcome to the Bellingham City Council Town Hall Files... · 2017-06-23 · Affordability is a...
35
Welcome to the Bellingham City Council Town Hall June 13, 2017
Transcript of Welcome to the Bellingham City Council Town Hall Files... · 2017-06-23 · Affordability is a...

Welcome to the Bellingham City Council
Town Hall
June 13, 2017

Affordable housing and homelessness
June 2017

Affordability and homelessness
Since 2012 – What happened?
Next steps
Housing prices are growing – Washington State
Source: http://www.zillow.com/home‐values/

Housing prices are growing – Texas
Source: http://www.zillow.com/home‐values/

Rents are growing – Washington State
Source: http://www.zillow.com/home‐values/

Rents are growing – Whatcom County
Source: http://www.zillow.com/home‐values/
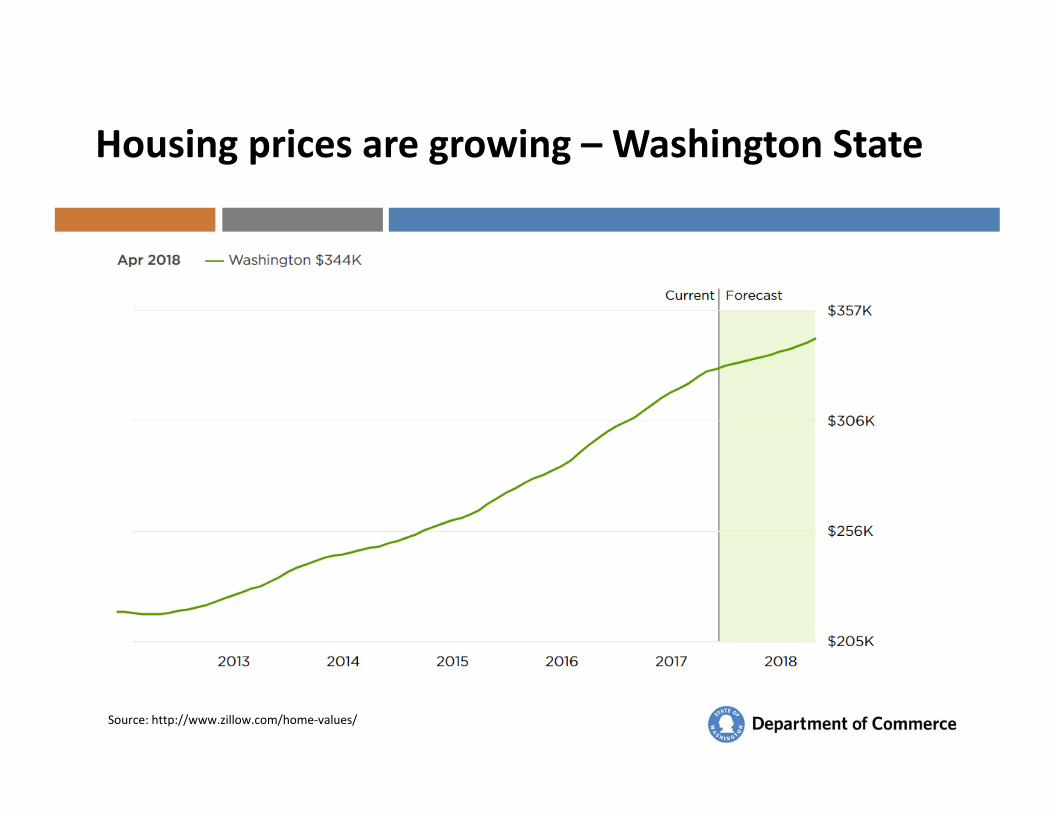
Rents are growing – Salt Lake City
Source: http://www.zillow.com/home‐values/

Rents are growing – Dallas
Source: http://www.zillow.com/home‐values/

Rents are growing – Vancouver, WA
Source: http://www.zillow.com/home‐values/

Washington’s rental vacancy rates are below average
Source: American Community Survey 1‐Year Estimateshttp://factfinder.census.gov/faces/tableservices/jsf/pages/productview.xhtml?pid=ACS_14_1YR_DP04&prodType=table
2010 2012 2014 2015
United States 8.2% 6.8% 6.3% 5.9%
California 5.9% 4.5% 3.9% 3.3%
Massachusetts 5.8% 4.5% 4.0% 3.5%
Oregon 5.6% 4.7% 3.6% 3.6%
Texas 10.6% 8.5% 7.3% 7.0%
Washington 5.8% 5.3% 4.2% 3.3%
Clark County 8.2% 3.4% 2.4% 2.2%
King County 5.2% 4.1% 2.5% 2.6%
Pierce County 6.6% 5.4% 5.7% 3.3%
Spokane County 4.0% 7.2% 5.5% 3.7%
Yakima County 3.1% 4.5% 5.1% 3.6%
Island County 6.7% 6.5% 0.9% 2.8%
Whatcom 3.9% 5.5% 4.1% 1.8%Seattle 4.0% 3.5% 1.2% 2.7%
San Francisco 4.4% 2.8% 2.5% 2.5%
Houston 15.9% 11.2% 7.2% 7.7%

Vacancy rates and rent increases are inversely related
Source: American Community Survey 1‐Year Estimates
0.0%
1.0%
2.0%
3.0%
4.0%
5.0%
6.0%
3.0%
3.5%
4.0%
4.5%
5.0%
5.5%
6.0%
6.5%
2006 2007 2008 2009 2010 2011 2012 2013 2014 2015
Annu
al re
nt cha
nge
Vacancy rate
Vacancy rate Median contract rent change

Rents are growing with the economy, but middle & low income growth lags
Median rent+18%
‐Median income+3%
‐15.00%
‐10.00%
‐5.00%
0.00%
5.00%
10.00%
15.00%
20.00%
2006 2007 2008 2009 2010 2011 2012 2013 2014 2015
% cha
nge infla
tion ad
justed
$
Low incomes (bottom 20% of households) +0%
Data sources: U.S. Census Bureau American Community Survey 1‐Year Estimates; inflation adjusted using the Bureau of Labor Statistics CPI‐U.
Lowest quartile rent+13%

Rents have grown faster than incomes in Whatcom County
Source: American Community Survey 1‐Year Estimates, Whatcom County
0.0%
5.0%
10.0%
15.0%
20.0%
25.0%
30.0%
35.0%
2006 2007 2008 2009 2010 2011 2012 2013 2014 2015
Rents
Income

Affordability – what is “too expensive” ?
Source: State of Washington Housing Needs Assessment, January 2015commerce.wa.gov/housingneeds
“Cost burdened”: >30% of income for housing costs“Severely cost burdened”: >50% of income for housing costs
“Affordable home ownership”: <25% of income for mortgage using following assumptions:

Cost burden is an issue throughout Washington

Affordability by income
Source: State of Washington Housing Needs Assessment, January 2015commerce.wa.gov/housingneeds
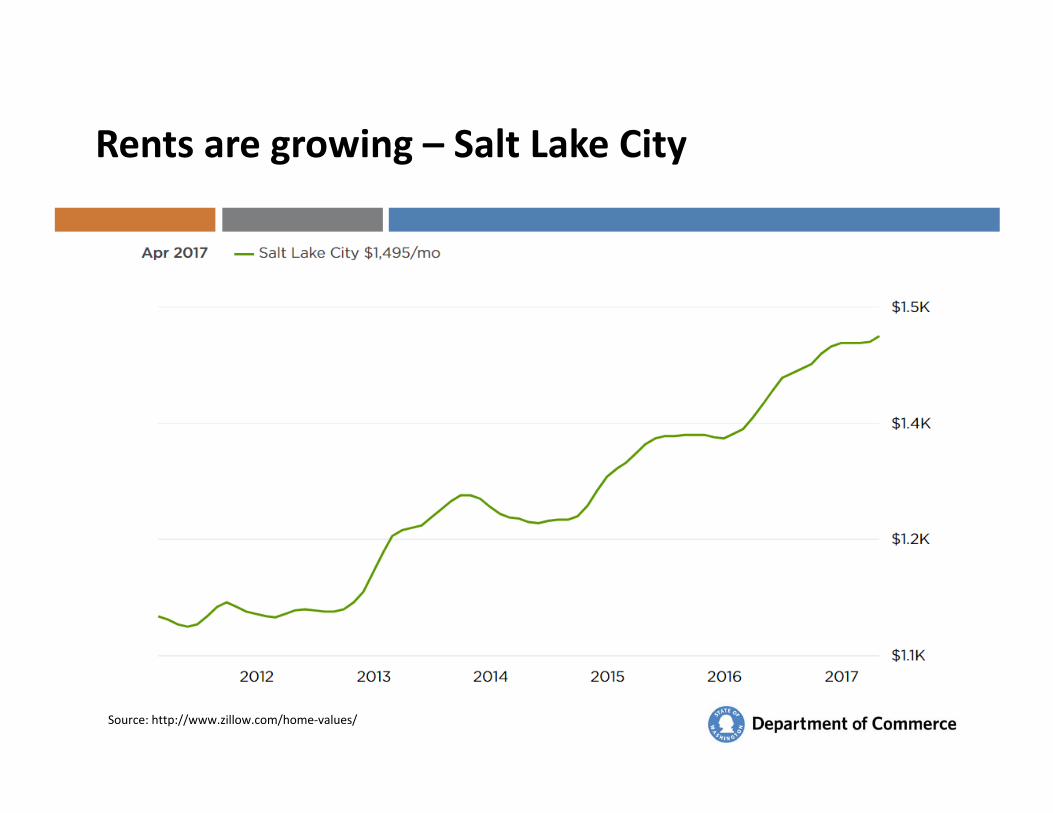
Home purchase affordability
Source: Runstad Center for Real Estate Studies / University of Washington, Washington State’s Housing Market

Affordability is a driver of homelessness
Every $100 increase in rent is associated with:
• 6% increase in homelessness in metro areas
• 32% increase in homelessness in non‐metro areas
• This relationship between rent and homelessness means all things being equal in Washington +$100 in rent = 2,900 (+14%) more people experiencing homelessness at a point in time.
Source: Journal of Urban Affairs, New Perspectives on Community‐Level Determinants of Homelessness, 2012

Change in homelessness accounting for population increases (per‐capita homelessness)
‐ ‐0.8%‐2.5%
‐0.4%
‐4.2%
‐15.1% ‐15.9%
‐27.4%
‐23.8% ‐23.9%
‐18.1%
‐30.00%
‐25.00%
‐20.00%
‐15.00%
‐10.00%
‐5.00%
0.00%2006 2007 2008 2009 2010 2011 2012 2013 2014 2015 2016
Chan
ge in
prevalance of hom
elessness

Since 2012 – Rent appears to be the only significant driver of change in homelessness
Other factors are stable or improving:
• Educational attainment/skills• Family stability/structure (divorce, out of
wedlock birth, teenage pregnancy)• Overall alcohol and other drug dependence• Percent of people employed (not recovered to 2006 level, but higher than 2012)

Why are rents increasing
Combination of interplay between:
• Jobs/People moving into the state• Very low vacancy rates statewide• Construction industry hobbled by recession not
capable of meeting demand• Local land use and other regulations limiting the
number and types of units that can be built• Infrastructure not keeping pace with growth
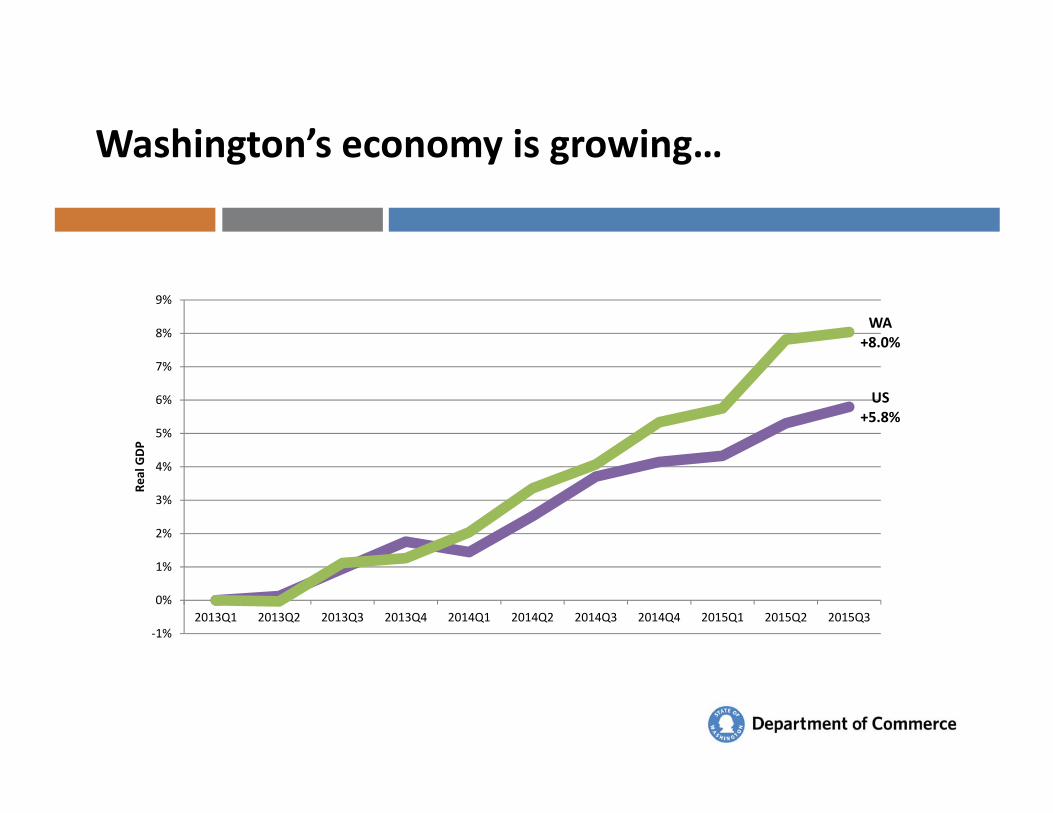
Washington’s economy is growing…
US+5.8%
WA +8.0%
‐1%
0%
1%
2%
3%
4%
5%
6%
7%
8%
9%
2013Q1 2013Q2 2013Q3 2013Q4 2014Q1 2014Q2 2014Q3 2014Q4 2015Q1 2015Q2 2015Q3
Real GDP

Why are rents increasing – WA #1 in GDP growth

Bellingham a leader in GDP growth
https://www.bea.gov/newsreleases/regional/gdp_metro/2016/pdf/gdp_metro0916_FW_Highlights.pdf

Growth in number of housing units lags job growth in Washington State
+ 1% Number of jobs (population)= 0.95% rent increase
+1% Incomes= 1.74% rent increase
+1 0.7%
1.5%
2.5%
3.6%
4.8%
1.6%
2.5%
4.3%
6.5%
9.7%
2012 2013 2014 2015 2016
Change in number of jobs
Change in number of housing units
Sources: WA OFM postcensal estimates of April 1 housing units,WA ESD Nonagricultural wage and salary employment, not seasonally adjusted

Rough estimate of key drivers of housing price increases – San Francisco 1965‐2015
+ 1% Number of jobs (population)= 0.95% rent increase
+1% Incomes= 1.74% rent increase
+1% Supply of housing (number of units)= 1.70% rent decrease
http://experimental‐geography.blogspot.com/2016/05/employment‐construction‐and‐cost‐of‐san.html

Bringing incomes and rent back in sync
Question:
Is there enough leverage in local and state land use policy, other regulations, and infrastructure policy to keep median market rate rents in sync with median incomes over the long term?

Any supply helps
Even expensive new buildings are critical:
• Rent depreciate in real terms about 1.9% each year
Source: American Economic Review 2014, 104(2): 687–706

Today’s expensive units are tomorrow’s affordable units
$709/month, 394 sqft“Filtering” works…
…in markets where the supply is adequate
Year
Rent depreciating at 1.9% annually
Affordable rent, full‐time minimum
wage2016 $709 $675 2017 $696 $675 2018 $682 $675 2019 $669 $675 2020 $657 $675 2021 $644 $675 2022 $632 $675 2023 $620 $675 2024 $608 $675 2025 $597 $675 2026 $585 $675

Let the market build some of the low end again
Supply of any kind helps with affordability, but a supply of small units helps more
In most places it is illegal to build the affordable housing of 100 years ago – small units

In the past, there were more unsubsidized housing options at the low‐end
Duplexes could be build anywhere; built in 1901:

State Housing Affordability Response Team –Draft recommendations to Governor
1. Provide funding and support to local governments to plan for housing at every income level, especially for lower‐income levels.
2. Provide funding to local governments to assess land capacity through “buildable lands” reports
3. Provide broad‐based education to assist communities to facilitate the development of more affordable housing.

State Housing Affordability Response Team –Draft recommendations to Governor
recommendations continued…
4. Seek responsible changes to development‐related statutes and regulations to facilitate housing development. Small changes to statutes such as the Project Review Act, Subdivision Act, the State Building Code, impact fees, multifamily tax exemptions, community revitalization financing, and prevailing wage determinations could add up to make a difference.
5. Provide stable and dependable state funding for housing, by providing predictable funding to the Housing Trust Fund, making document recording fees permanent, and encouraging local adoption of local housing levies.
6. Ask public agencies to consider underutilized publicly owned property as an opportunity for affordable housing.
7. Continue this work into the future by finding opportunities to collaborate with existing work groups and projects to carry these ideas forward.

www.commerce.wa.gov
Presented by:
Tedd KelleherManaging DirectorHousing Assistance Unit360.725.2930
35