Welcome to San Francisco! NRS 2010 Regional Training.
89
Welcome to San Welcome to San Francisco! Francisco! NRS 2010 Regional NRS 2010 Regional Training Training
-
Upload
peter-roberts -
Category
Documents
-
view
215 -
download
0
Transcript of Welcome to San Francisco! NRS 2010 Regional Training.

Welcome to San Francisco!Welcome to San Francisco!NRS 2010 Regional TrainingNRS 2010 Regional Training

Diving Deep into the NRS Diving Deep into the NRS LocalLocal Data Pool: Attendance, Data Pool: Attendance, Educational Gain, and Educational Gain, and Transition OutcomesTransition Outcomes
2010 Regional Training2010 Regional Training

33
Objectives
At the end of this training, participants will be able to:
• Dive Deeper: Explore local data, analyze results
• Produce an Analysis: Develop a “My Program” summary on attendance, level gain, or transition
• Customize Tools/Exercise: Adapt tools for use by programs or classes within the state
• Plan a Local Level Change: Plan to roll out the NRS Local Data Tool to make a change and create new levels of data use at the local level
• Collaborate: Share ideas with other states and programs; work together across and within state teams
04/19/23

44
Agenda• Tuesday
– History of Data Training: Why Look at Data– Taking a Dip in the Water: Data Carousel – Wading Further In: Asking Questions of Your Data &
Creating Data Exercises for Local Program Staff
• Wednesday– Diving Deep: Using the Local Program Data Tool– Creating a Local Program Data Report
• Thursday – Identifying Local Program Changes– Building an Action Plan
04/19/23

55
Test your NRSAbility!Instructions
1. Select a judge/timer/scorekeeper from your group.
2. First person draws a card and must describe the first word without using any variation (no “ABE”) of any words on the card.
3. Everyone at the table tries to guess the word within 1 minute. If guessed right, the table earns a point. If not, the card goes to the bottom of the pile.
4. Next person selects a card and repeat.
5. Table with the most points wins!
04/19/23
Word/Concept
Can’t say this word
Can’t say this word
Can’t say this word
Can’t say this word
Can’t say this word
66
Before You Arrived
NRSWeb• History of the NRS• What is the NRS? (and what it is not)• Data Quality Guide Review, Chapter 2
– Were there any surprises? – Things you learned that you did not know? – Where were you (in the adult education system)
when the NRS took shape? And has your opinion about the NRS changed since then?
04/19/23

What is the NRS?What is the NRS?

88
What is the National Reporting System (NRS) for Adult Education?
• The accountability system for the federally supported adult education program
– Provides a framework for providing information on students and their outcomes to a federal audience.
• Includes core (required) and secondary (optional) measures
• Outlines methodologies for collecting the measures
04/19/23

99
The NRS Does Not
• Preclude states from collecting other measures and using them for state accountability.
• Preclude use of other educational functioning levels.
• Specify which test or assessment that must be used.
• Require which software or record-keeping system t use.
• Specify skill areas or topics to teach students.
04/19/23

Brief History of the NRSBrief History of the NRS
1111
Brief History: Overview of the NRS
• Wave 1: Development– Pre-NRS: Emergence of accountability
– Development process
• Wave 2: Implementation– Refinement of measures and procedures (1999–2001)
– State implementation(2000–2003)
– Training and T/A on requirements, data quality & use
• Wave 3: Focus on Improvement
• Wave 4: Maturity and Growth
04/19/23

1212
History of Data Diving
• Data Quality – 2002 – “What!? You can’t make me!”
• Data Use – 2003 – “Huh? Are we still talking about data?”
• Data Monitoring for Program Improvement – 2004– “Oh, data can do that?”
• Developing an MIS – 2004– “Web-based? Nah, my floppy disk works fine.”
• Developing State and Local Report Cards – 2005/2007– “Now this is fun! But don’t tell Mike we said so.”
04/19/23

1313
History Data Diving (Cont’d.)• Learning to be an NRS Data Detective – 2006
– “I’m really good at this data work.”• Desk Monitoring – 2007
– “How useful! I’m saving time and money.”• Building and Sustaining Quality in the NRS – 2008
– “It’s review, but we’ve got new staff who need it…great!”
• The Local Connection: Building a Data Use Learning Community – 2009– “We need to build a culture of local data use.”
• Diving Deep into the NRS Local Pool – 2010– Local programs dive deep into data to make changes
04/19/23

NRS Data DivingNRS Data Diving

1515
Why Look at Data?
Data help us to…
• Replace hunches and anecdotes with facts concerning the changes that are needed;
• Identify root causes of problems;
• Identify whether student or program goals are being met; and
• Tell our stakeholders, including students, about the value of our programs and the return on their investments.
04/19/23

1616
Data: A Carrot or a Stick?
Data may be used…
• To highlight, clarify, and explain what’s happening in your program
OR
• To show what’s not happening in your program.
“However beautiful the strategy, you should occasionally look at the results.”
–W. Churchill
04/19/23
1717
Data Tell You
• Where you’ve been• Where you are• Where you’re going• How to get there
Data can help you design a quality program to help meet learners’ goals.
04/19/23

1818
The importance of data for administrators, policymakers, and teachers in the classroom—to be able to break data down and know where the strengths and weaknesses reside—is crucial if you want to make any kind of improvement.
-Monte Moses, Superintendent,
Cherry Creek (CO) School District
The Importance of Data
04/19/23

1919
Applied to Adult Education…
Data can:• Guide you to improve instruction
• Measure program success & effectiveness
• Tell you if what you are doing is making a difference
• Tell you which classes are getting the results you want—and which are not
• Get to the root of problems, such as poor retention, low educational gains, or low transition rates
04/19/23

Starting the DiveStarting the Dive

2121
Starting the Dive
• Attendance
• Educational Gain
• Transition Outcomes
04/19/23

2222
Attendance
• Contact hours of instruction the learner receives (NRS)
• Includes intensity and duration• Can help to tell us whether:
– Instruction is successful– Content and materials are relevant– Students are motivated– Students are reaching their goals
See Guide pages 10-20
04/19/23

2323
Examples: What Increases Attendance
• Quality instruction and relevant content
• Well-trained teachers
• Clear goals set at intake, revisited regularly, and matched to teachers and content
• Reduction of obstacles – flexibility in programming, support services, and access to site off-hours
(NCREL; Lieb, 1991; Comings, 2007; Beder, 1988; Beder, 1991; Comings, Parella, & Soricone, 1999; Kerka, 2005; Thoms, 2001; Porter, Cuban & Comings, 2005)
04/19/23

2424
Educational Gain
• Advancement through 12 educational functioning levels
• Core NRS measure • Can tell us:
– Whether the program/students are meeting goals – Which sites/classes/teachers are most effective – Extent of student progress– Impact of changes
See Guide pages 20-31
04/19/23

2525
Examples: What Increases Ed Gain
• Make classes learner-centered
• Focus on relevant knowledge
• Opportunity for practice and application
• Coherence
• Sufficient Intensity and Duration
(NRC, 1999; Garet, Porter, Desimone, Birman, & Yoon, 2001)
04/19/23

2626
Transition Outcomes
• Four “follow-up” measures: entered employment, retained employment, entry into postsecondary education, attainment of a secondary credential
• Only track students with the related goal
• Transition outcomes can tell you
– Whether the program/students are meeting goals
– Which sites/classes/teachers are most effective
– The extent of student progress
– The impact of changes made in the program
04/19/23
See Guide pages 32-44

2727
Examples: What Increases Outcomes
• Match student needs and goals
• Use SMART goal setting
• Tie content to employment or academic skills and necessary background knowledge
• Utilize college-based instructional practices (for college transition)
• Build strong relationships with external entities
(Zafft, Kallenbach, and Spohn, 2006)
04/19/23

2828
Discussion: Challenges & Strategies
• Refer to “Challenges & Strategies” Handout• At your table (20 minutes)
– Choose one topic: Attendance, Educational Gain, or Transition Outcomes
– Describes challenges you have had in this area– Describe strategies you used to address this issue
• Report out—one person per table
04/19/23
See Handout 1: “Challenges & Strategies: Attendance, Educational Gain, and Transition Outcomes”

Levels of DivingLevels of Diving

3030
Diving Deep: Analyzing and Improving Performance
• Data disaggregation – diving deep requires access to disaggregated data to analyze the site, classroom/teacher, and student information to identify issues and evaluate solutions
• Data comparisons – meaningful analysis requires comparison data from other programs or classes, the state, or a defined standard
• Questions – a good analytic plan for program improvement begins by asking specific questions about data and program performance
04/19/23

3131
Levels of Diving: Data Quality
04/19/23

3232
Data Quality
Data Quality = Good Data Collection Process
Good Data Collection requires:
1. Staff training in data collection, administration, and review; staff roles are clear
2. Standardized processes for entering, checking, and correcting information
3. Clear, common understanding of data definitions, forms, and coding through written documentation
4. Continuous monitoring by staff at multiple levels (program director, data administrators, teachers, students)
04/19/23

333304/19/23

3434
Do You Trust Your Data?
Data analysis is only as good as the original data allow.
Keys to good data collection systems include:• Clear policies and procedures for data entry• Data is entered & reviewed daily, weekly, or monthly• Teachers, staff, administrator all have access to data
and review regularly• Teachers share data with students
What does your program do to ensure data is accurate, reporting is timely, and staff have access to the data?
What does your program do to ensure data is accurate, reporting is timely, and staff have access to the data?
04/19/23

3535
Tips for Monitoring Data Quality
1. Perform error and validity checks: Check ranges
2. Look for trends over time: Flag changes, e.g., > 10%
3. Compare data within and across programs
Look for the red flags.
04/19/23

3636
Dive into the National Pool
For each of the next few slides showing national data, write down five observations for discussion
• What do you see?
• What is interesting or unusual?
• Do any questions or hypotheses come to mind as a result?
See Handout 2: “Dive into the National Pool”
04/19/23

3737
Write 5 Observations/Thoughts
04/19/23
Educational Gain Trends for States with the Highest Percent of Students Completing a Level in PY 2007-08: PY 2003-04 to PY 2007-08*

3838
Write 5 Observations/Thoughts
04/19/23
Educational Gain Trends for States with the Lowest Percent of Students Completing a Level in PY 2007-08: PY 2003-04 to PY 2007-08*

3939
Write 5 Observations/Thoughts
04/19/23
National Trends for Transition Outcomes: PY 2003-04 to PY 2007-08

404004/19/23
Write 5 Observations/Thoughts
States with Highest Percentage of Students Entering Employment in 2007-2008: PY 2003-04 to PY 2007-08

4141
Write 5 Observations/Thoughts
04/19/23
Attendance Trends for States Reporting the Highest Attendance Hours per Students Enrolled in PY 2007 8: PY 2003-04 - PY 2007-08

Take a Dip in the Data PoolTake a Dip in the Data Pool

4343
Take a Dip in the Data Pool
Data Carousel Activity
• Participants count off 1 to 5, then split into 5 groups
• Each group begins at one wall chart
• Write observations, possible causes, and next steps (spend only 3 minutes per graph)
• Cycle to next graph until all 5 graphs are analyzed
• Return to first graph when done; report out on observations, possible causes, next steps
See Handout 3: “Data Carousel Exercise”

4444
Take a Dip in the Data Pool (cont’d.)
Tell Your Program’s Story
• Each table is assigned one program (Capitol City, Rugbyville, Quaintly, Brasiltown, Pronto)
• Consider the observations, possible causes, and next steps for your assigned program
• Write the “story” of your program based on data
• Report out your program’s story
04/19/23
Handout 3 (cont’d.)

4545
Diving Deep into Classroom Data
Data Carousel Activity: Class Level Data
• Exercise for Local Programs to use with program staff and teachers
• Instructions for activity same as first Data Carousel
• Use fake data first, non-threatening, then substitute real data and alternate graphs
04/19/23

Wading Further In…Wading Further In…

4747
NRS as Inquiry
Inquiry-based learning is learning directed by students’ questions. It requires students to work together to solve problems (based on their questions) rather than receiving direct instructions on what to do from the teacher.
NRS as inquiry helps local programs to ask questions about their data and discover what’s happening in the site and classroom—by looking at NRS data.
(Source: http://en.wikipedia.org/wiki/Inquiry-based_learning )

4848
?Begins with a Question
04/19/23

4949
Levels of Diving: Students, Teachers, Instruction, and Program & Policies
04/19/23

5050
Questions: AttendanceAttendance & Retention
Sample questions Further questions
Data collection & quality
Who enters attendance data at each site? How often is attendance data entered?
Who checks the data? How often?
Students How does attendance differ by student type (ESL vs. ABE)?
When in the term do students tend to drop/stop-out most? Is this the same across sites?
Teachers Which classes have very high (or low) attendance?
Do teachers with high attendance have greater educational gains?
Instruction Does attendance vary by instructional content (e.g. GED, workplace) or level?
How many hours does it take to achieve a goal, on average?
Program What is the average attendance for my program?
Are my program’s attendance hours similar to other programs?
Program policy Are my managed enrollment classes more successful than open classes?
Does managed enrollment result in higher ed gains or greater goal achievement?

5151
Questions: Educational GainEducational Gain Sample question Further questions
Data collection & quality
What is the range of pre/posttest scores in my program/site?
Are all the test scores within the correct range for the test and class level?
Students Which students are most likely to complete a level (student characteristics)?
Do students with higher contact hours have greater completion rates?
Teachers What teacher characteristics are most related to level completion?
How high is teacher turnover at each site? Which sites retain teachers longest/best?
Instruction Which instructional approaches have the greatest impact on gain?
Do assessments match course content?
Program How many hours of PD do our teachers participate in?
Which PD have the greatest impact on student learning?
Program policy Do placement policies differ among sites?
Which placement policies have an impact on educational gains?

5252
Questions: Transition OutcomesTransition Sample question Further questions
Data collection & quality
How are data collected, e.g., who administers the survey or oversees the match?
How do response rates or matches differ by site? Who verifies the data?
Students Which types of students have which goals?
Which student variables are related to the goals set, e.g., postsecondary placement?
Teachers How do goals set compare across similar classes (i.e., ESL to ESL)?
Does goal achievement differ by class?
Instruction Do college transition classes show greater goal achievement for post-secondary?
How do college transition classes’ course content differ from other ASE classes?
Program How do sites compare with each other and the program average on goal achievement?
For sites with high goal achievement, are there programmatic differences?
Program policy
What linkages exist between the program and colleges/businesses?
Do sites/classes with linkages show different outcomes than those without linkages?

5353
What Do I Want to Know?
With what question would you like to begin your local program line of
inquiry?
See Handout 4: “What do I want to know?”
04/19/23
5454
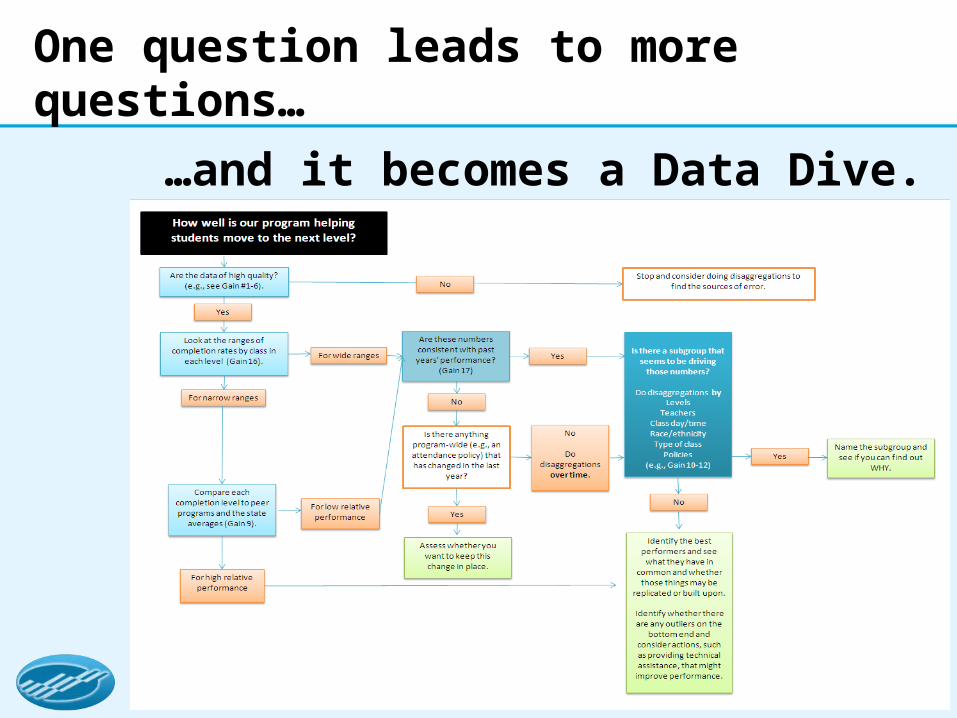
One question leads to more questions…
04/19/23
…and it becomes a Data Dive.

5555
Make A Dive Plan
04/19/23
How well are we serving students who are seeking a GED?
• Create (individually) a dive plan for this question
• Share your dive plans and reflect– Did the dive plans begin the same way?– Did they cover the same topics? Same order? – What additional data did others consider?
See Handout 5: “Make A Dive Plan”

5656
Examples to begin…
04/19/23
How well are we serving students seeking a GED?
What are the %s of students with GED as a goal by class type (e.g., Low ASE) averaged over the last three years?
What are the %s of students with GED as a goal by class type (e.g., Low ASE) averaged over the last three years?
How do our pass rates for the GED compare across classes and to the general
public? What percentage of scores are above 3000?
How do our pass rates for the GED compare across classes and to the general
public? What percentage of scores are above 3000?
What are the average # of contact hours for GED attainment by class? Do day or
evening programs have a higher attainment rate?
What are the average # of contact hours for GED attainment by class? Do day or
evening programs have a higher attainment rate?

Wading Further In…(cont’d.)Wading Further In…(cont’d.)

5858
Ways to Cut the Data
1. What does it look like now?– What is the mean, median, mode, and range (i.e., shape
and range of the distribution)
2. How does it compare?– Over time
– To peers, now and over time
– To the state/nation or a benchmark, now and over time
3. How do the different subgroups contribute?– Redo 1 and 2 with subgroups
4. Are any part of subgroups doing better in any circumstances? (i.e., look for interactions)
04/19/23

5959
Ways to Cut the Data (Cont’d.)
5. What are the key relationships (ratios) to outcomes– Speed of improvement (outcomes/time)– Efficiency (outcomes/money)– Impact (outcomes/participants or dosage)
6. What other factors might be related?– E.g., attendance on completion; professional
development on student completion
04/19/23

6060
Checklist: Ways to Look at your Data
Quality: Are the data credible?
Averages: What is the average?
Variation: What are the ranges?
Rates: What are the outcomes by time, cost, or resource?
Benchmarks: On each of the above, how do we compare to the standard or our best peers?
Trend: On each of the above, how do the numbers change over time?

6161
Strengths and Areas to Target
• Consistently identifying the highest and lowest performers will provide information you might use later in developing a plan for making changes, for example:
– Building on your strengths, including people (e.g., Gallup)
– Being targeted (tiered?) in providing technical assistance to lowest performers (e.g., response to intervention)
04/19/23

Visualize Your DiveVisualize Your Dive

6363
Diving Details: Analysis, Graphing
Qualitative and Quantitative
Choosing the right graph
Data display recommendations
04/19/23

6464
Quantitative vs. Qualitative
Select quantitative or qualitative data, depending on the goals
Quantitative Qualitative
Number of contact hours Classroom environment
Retention rates Intake and orientation
Educational gain Professional development
Pre-posttest rates Teacher interview reports
Follow-up outcomes Follow-up processes
Goal setting/goal attainment Other services (e.g., child care)
Student Demographics Community partnerships
Teacher Characteristics State or program policies04/19/23
6565
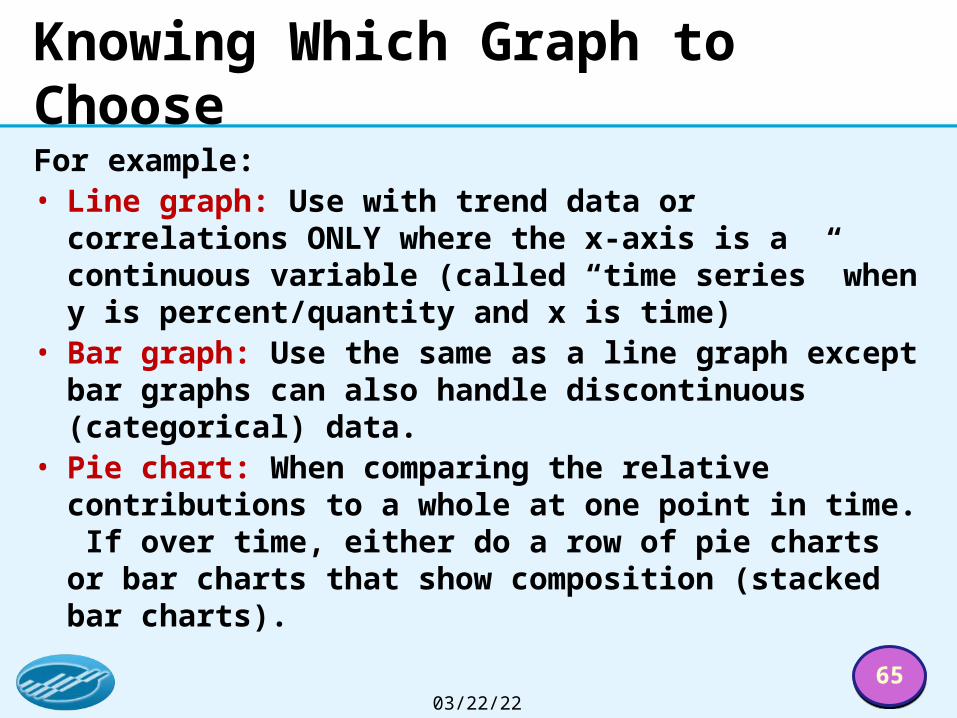
Knowing Which Graph to Choose
For example:• Line graph: Use with trend data or correlations ONLY
where the x-axis is a continuous variable (called “time series” when y is percent/quantity and x is time)
• Bar graph: Use the same as a line graph except bar graphs can also handle discontinuous (categorical) data.
• Pie chart: When comparing the relative contributions to a whole at one point in time. If over time, either do a row of pie charts or bar charts that show composition (stacked bar charts).
04/19/23

6666• http://extremepresentation.typepad.com/blog/2006/09/choosing_a_good.html
6767
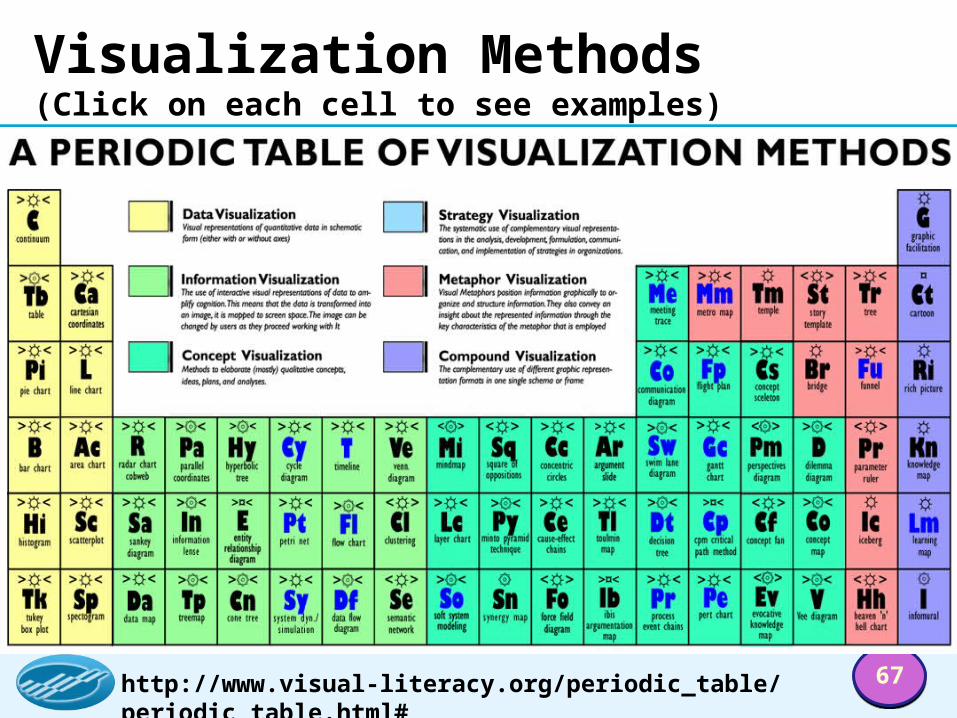
Visualization Methods(Click on each cell to see examples)
http://www.visual-literacy.org/periodic_table/periodic_table.html#

Plan Your DivePlan Your Dive

6969
Reminder: Levels of Diving
04/19/23

7070
Create Your Dive Plan
With what question would you like to begin your data dive?
•Reference questions selected on Handout 4
•Thoughts on what to include in your dive plan
•Draft your dive plan
•Peer-to-peer sharing of dive plan
•Revise your dive plan
04/19/23
See Handout 6: “Create Your Dive Plan”

Diving Deep into DataDiving Deep into Data
7272
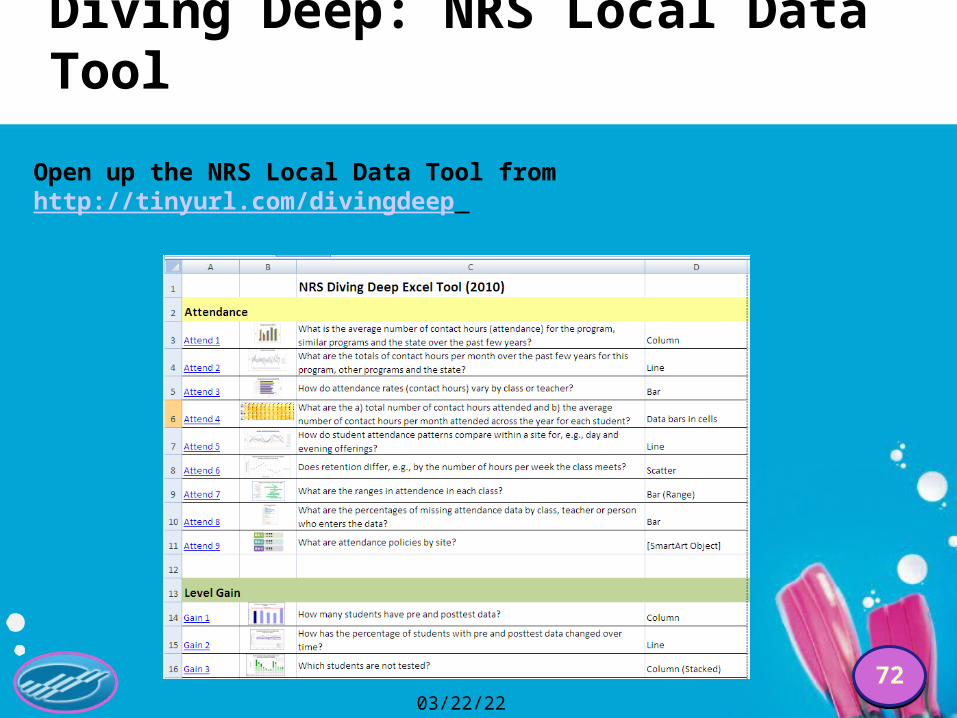
Diving Deep: NRS Local Data Tool
Open up the NRS Local Data Tool from http://tinyurl.com/divingdeep
04/19/23

7373
Introduction to “My Program” Report
Building “My Program” Report – a report to track the change you have identified; serves as a data review tool for you and your staff in your local program
My Program Report includes: Standard, regularly reviewed data and charts Ad hoc charts that change regularly, depending on
staff needs/interests
04/19/23

7474
Using the Tool: Identify and Describe Strengths and Challenges for Local Programs
• Pick one local program and use other programs and state data for comparison charts.
• Identify the area of focus: Attendance, Ed Gain, or Follow Up Measures (Goals)
• Make observations, identify additional data to review, consider your plans.
• At the end of the section explain what you learned—what are the strengths and challenges of your program.
• Identify a change (at least one);• Explain how you will measure that change, what data
will be used to verify that the change was implemented, what impact the change had, how to evaluate
04/19/23

7575
Telling Your Local Program Story
Each breakout room assigned one data dive (Attendance, Educational Gain, or Transition Outcomes)•Address the question identified from “What do I want to know about my program?”•Using local program data, create 3-5 graphs, tables, or charts to investigate your questions; identify strengths and areas for improvement; notice patterns/themes in your data•Report out on your local program story
Continue until you have completed your “My Program” Report with questions on each: Attendance, Educational Gain, and Transition Outcomes
04/19/23

7676
By the end of the day…
You should have the “My Program” report completed with at least three graphs.
Report-outs in breakout rooms using the My Program booklet or PowerPoint slides.
04/19/23

Deep Diving to Make a Deep Diving to Make a ChangeChange

The greatest danger for most of us
is not that our aim is too high
and we miss it, but that it is too low and
we reach it.Michelangelo

7979
Making Data Diving Changes: Attendance
Making changes to improve attendance or persistence? Consider the research to ensure that •Instruction is successful;•Content and materials are relevant;•Students are motivated to show up, persist over time; and•Students are reaching their goals.
04/19/23
See Guide pages 10-20

8080
Making Data Diving Changes: Educational Gain
Making changes to improve educational gain? Consider the research to ensure that•Students have clear goals for achievement,•Classes are student-centered and learner-driven,•Tests measure student learning and progress, and•Students are engaged and learning is relevant.
04/19/23
See Guide pages 20-31
8181
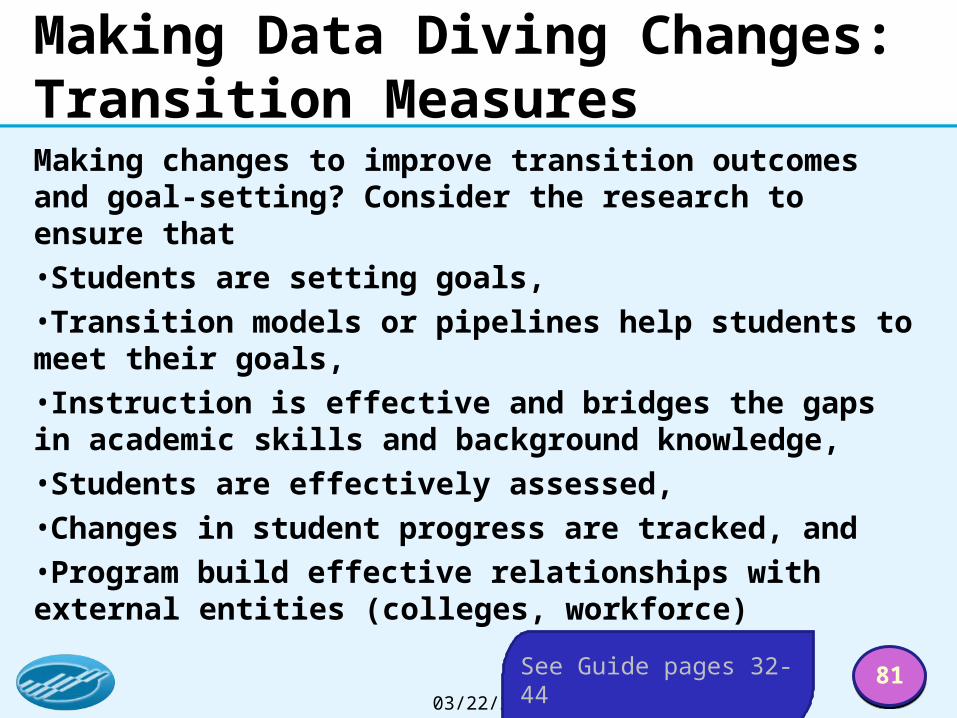
Making Data Diving Changes: Transition MeasuresMaking changes to improve transition outcomes and goal-setting? Consider the research to ensure that•Students are setting goals,•Transition models or pipelines help students to meet their goals, •Instruction is effective and bridges the gaps in academic skills and background knowledge, •Students are effectively assessed, •Changes in student progress are tracked, and•Program build effective relationships with external entities (colleges, workforce)
04/19/23
See Guide pages 32-44

8282
Making a Change
Re-examine your data and clarify your focus:
• What changes do you want to make in your local program?
• What are the strengths of your program and how will you replicate them?
• State Teams Report Out–3-5 minutes:
– What we learned
– What we will change, and
– How we will evaluate/measure that change
04/19/23
See Handout 7: “Making a Change in Your Local Program”
8383
What Do You Need to Make a Change?
• Local Program Director: Identify the data, resources, and other tools you will need to support your plans for local program change and prioritize.
• State Team: Discuss the list of local program needs and priorities as a state team. Identify which resources the state can provide in the near-term, the long-term, or not at all currently.
Share highlights with the group.
04/19/23
See Handout 8: “What do you Need to Make a Change? The Wish List”

Making a Splash!Making a Splash!
8585
Action Plan
• Local Plan for Making a Change – as a local program director, how will you introduce this change to your staff? How will you involve them in reviewing data, recognizing the change, implementing the change, tracking data to review and evaluate the change?
• State Plan (for state teams without local staff in attendance) – Professional Development on Creating a Local Data Report
04/19/23

8686
Local Program Making a Change Plan
Change Identified
My Program Report Data
Resources Needed
Staff to Review/ Update
Timeframe to Implement
Evaluation Method/ Measure
New goal setting process
•Goals•Follow up •Attendance
Access to MIS, reports on similar programs’ data
Program director, MIS person, teachers (names here)
Fall & spring terms; review monthly
20% increased ed gain with ABE students; student & teacher survey feedback on goal-setting
04/19/23
See Handout 9A: “Action Plan: Local Program Making a Change”

8787
Feedback on Action PlansProvide feedback to your colleagues• What is the change identified? Is it achievable? • What data was provided to support this change and
what additional data will need to be reviewed?• Is access to the needed data and resources available? • Is the timeframe for this change realistic? • What is the follow-up plan to measure and evaluate this
change? • What additional questions do you have for the state
team/local program?• What suggestions do you have for the state team/local
program?
04/19/23
See Handout 9B: “Feedback Form: Local Program Change Plan”

8888
State Roll-out of PD Plan for Local Programs
04/19/23
See Handout 10: “Action Plan: State Roll-out of Professional Development Plan for Local Programs”

8989
Next Steps, Wrap-up, and Evaluation
• Follow-up Webinar: State & Local Program staff report on:– Breaking through data culture barriers in
Local Programs– Successful changes– Lessons learned
• Evaluation Form
04/19/23