Welcome to ÅF’s Capital Markets Day - AF Consult ... · ÅF Capital Markets Day Stockholm,...
67
Welcome to ÅF’s Capital Markets Day
Transcript of Welcome to ÅF’s Capital Markets Day - AF Consult ... · ÅF Capital Markets Day Stockholm,...

Welcome to ÅF’sCapital Markets Day

Agenda for the day
09.15 History and ÅF in brief
Current position
Strategy
Divisional introduction
BREAK
11.20
12.40
13.00
Deep Dives
• Automotive
• Energy
• Design
• Smart City
Summary and questions
Closing and LUNCH

3
ÅF Capital Markets DayStockholm, November 8, 2017
Jonas Gustavsson, CEO

Development and ÅF in brief

• #3 among Nordic engineering companies
• Markets most comprehensive portfolio of service offer across industries
• International footprint
• ~10,000 employees
• Net sales 11.1 BSEK (2016)
ÅF in brief

Strong positions with diversified portfolio
INFRASTRUCTURE
INDUSTRY
ENERGY
DIGITAL

Private69%
Public31%
Diversified portfolio
Power
15%
Automotive &
Vehicle
16%
Rail & Roads
21%
Real Estate
18%
Life Science, Food &
Pharma
8%
Pulp&Paper
4%
Defence
2%
Telecom
3%
Mining&Steel
Production
2%
Petrocemical
3%
Financial
Services
2%
Other - Mfg
primarily…
Numbers from 2016

Top 10 clients – mix of strong national and international clients
(Volvo Cars
and AB Volvo)
~30 % of total
revenue
Combination of
private and public
clients
Strong base for
international growth

Solid financial performance
3,864,57 4,69 4,34
5,135,80
8,348,80
9,8511,07
2007 2008 2009 2010 2011 2012 2013 2014 2015 2016
344
486396
323
436491
843756
817
992
2007 2008 2009 2010 2011 2012 2013 2014 2015 2016
ÅF has shown strong growth and competitive performance in the last decade and has outgrown the market ~3 times in the past 10 years with stable margins at 8-9%
+12% p.a. +12% p.a.
Net Sales,
BSEK
EBITA,
MSEK

ÅF has combined solid organic growth with strong inorganic growth
12 10
-1 -4
10 63 3 5 3
129
4
-3
9
7
41
37 10
2007 15121009 14
-8
1308 11 2016
Organic
Inorganic
Inorganic/organic sales growth split, % change from previous year
▪ ÅF has grown by 12% p.a. over the last 10 years
– 8% acquired growth
– 4% organic growth
▪ The largest single contributor to the company’s growth is the acquisition of Epsilon in 2012 (impacting the sales in 2013)

ÅF has combined solid organic growth with strategic acquisitions
Acquired sales, BSEK
2.15
Epsilon 2012
7.01
Advansia 2012
80 additional acquisitions
0.430.32
0.36
Reinertsen 2016
0.55
Edy Toscano 2016
3.21
PRC 2015 Total
▪ Between 2008 and 2017, ÅF acquired 85 companies
▪ More than 50% of the total acquired sales stems from the five largest acquisitions
▪ Epsilon is the single largest acquisition

Good shareholder return
Total return
SEK
Source: Nasdaq OMX Nordic

Continued increase of dividends
0,410,31
0,130,25
0,50
0,880,69
1,00
1,88
0,44
1,631,63
0,25
0,00
0,33
0,630,75
1,631,63
2,002,00
2,50
2,75
3,25
3,50
3,75
4,50
0,00
0,50
1,00
1,50
2,00
2,50
3,00
3,50
4,00
4,50
5,00
1991
1992
1993
1994
1995
1996
1997
1998
1999
2000
2001
2002
2003
2004
2005
2006
2007
2008
2009
2010
2011
2012
2013
2014
2015
2016
2017
14
SEK
Ex Date Split
From
Split
To
Adjustment
Factor
13/06/2014 1 2 2
31/05/2010 1 2 2
02/05/2006 1 2 2
Stock Splits
Source: Nasdaq OMX Nordic

Current position and new structure

Today #3 among Nordic engineering companies
11,070
13,486
16,531
5,019
ÅF has the market’s most comprehensive range of competencies and services to meet current global trends
SEK M

Four divisions with full P&L and international responsibility
International
Divisions
Decentralised
governance
BA:s with different
challenges
INFRASTRUCTURE INDUSTRY ENERGY DIGITAL
SOLUTIONS
39% 34% 12% 16%
Approx share of total net sales

International
Divisions
Decentralised
governance
BA:s with different
challengesBA BA BA BA
BA
• Buildings
• Rail&Road
• Project Management
• Water and Environment
• Architecture & Design
INFRASTRUCTURE INDUSTRY ENERGY DIGITAL
SOLUTIONS
Four divisions with full P&L and international responsibility

International
Divisions
Decentralised
governance
BA:s with different
challengesBA BA BA BA
BA BA BA
• Advanced
Manufacturing
• Automotive R&D
• Food & Pharma
• Process Industry
• Product
Development
• Product
Development
• Plant
Engineering
• Advanced
Technical
Service
• Buildings
• Rail&Road
• Project Management
• Water and
Environment
• Architecture &
Design
INFRASTRUCTURE INDUSTRY ENERGY DIGITAL
SOLUTIONS
Four divisions with full P&L and international responsibility
BA BA BA BA
BA

International
Divisions
Decentralised
governance
BA:s with different
challenges
• Buildings
• Rail&Road
• Project Management
• Water and
Environment
• Architecture &
Design
• Advanced
Manufacturing
• Automotive R&D
• Food & Pharma
• Process Industry
• Product
Development
• Product
Development
• Plant
Engineering
• Advanced
Technical
Service
• Energy Scandinavia
• Energy Switzerland
• Energy Czech
Republic
• Energy Finland
• International
Operations
Four divisions with full P&L and international responsibility
INFRASTRUCTURE INDUSTRY ENERGY
BA BA BA BA
BA BA BA
BA BA BA BA
BA
BA BA BA BA
BA
DIGITAL
SOLUTIONS

International
Divisions
Decentralised
governance
BA:s with different
challenges
• Advanced
Manufacturing
• Automotive R&D
• Food & Pharma
• Process Industry
• Product
Development
• Product
Development
• Plant
Engineering
• Advanced
Technical
Service
• Energy Scandinavia
• Energy Switzerland
• Energy Czech
Republic
• Energy Finland
• International
Operations
• Experience Design
• IT Solutions
• Embedded Systems
• Systems
Management
Four divisions with full P&L and international responsibility
INFRASTRUCTURE INDUSTRY ENERGY DIGITAL
SOLUTIONS
BA BA BA BA
BA BA BA
BA BA BA BA
BA
BA BA BA BA
BA
BA BA BA BA
• Buildings
• Rail&Road
• Project Management
• Water and
Environment
• Architecture &
Design

INFRASTRUCTURE INDUSTRY ENERGY DIGITAL
SOLUTIONS
… and structured country organisations supporting efficiency and local business

Strategy

Providing leading solutions for generations to come
ÅF - Making Future
Our vision

We create sustainable engineering and design solutions
Our mission

Our values
Brave
Devoted
Team players
WE ARE

27
Smart cities and
infrastructure
Industrial
digitalisation
Future
mobility
Changing
energy
landscape
Growth drivers

Changing customer dynamic
Partnership and alliances
related to new disruptive areas
Function and project delivery in
customers development process
Internationalisation with strong
partners
Design thinking
R&D

29
• ”The Sweden negotiation” – Highspeed trains, subways and residences.
• ” Norwegian National TransportationPlan 2018” –100 Bn NOK/each year
Urbanisation drives public investments

Internationalexpansion into
leading positions
GROWTH
Business modelshift to deliverhigher value
VALUE CREATION
Operationalexcellence
OPERATIONS
Best in classpeople practices
PEOPLE
Strategy based on four pillars

The new strategy

Geographical expansion in
core countries
• Solid market growth and
market share gain
• Leading/substantial
position
• Infrastructure, and full
leverage from Industry,
Energy and Digital
International growth in
selected niches
• Distinct ÅF competences
and capabilities - establish
footprint and expand
• Current areas:
o Automotive R&D
o Advanced Manufacturing
o Food & Pharma
o Process Industries
o Lighting
Expansion in global
investment projects
• Expert competence
services and projects
related to significant one-
off CAPEX project globally
• Structured evaluation to
ensure leverage in core-
countries
GROWTH - International expansion into leading positions
M&A – “bolt” on and platforms

VALUE CREATION
Business model shift to deliver higher value
Scale and leverage
– repetitive deliveries
State of the art project model – enabling most
complex projects
Partnering and cooperation
Development of “professional service model”
– XF-Teams

Professional services (T&M)
“Professional Team” (T&M)
T&M Projects
Fixed price projects
Solutions
Pro-ducts
~50%
~45%
<5%
1 Cross ÅF projects
and solutions
2 Digitalization
3 After market and
operational maintenance
VALUE CREATION
Business model shift to deliver higher value

OPERATIONSOperational excellence
INFRASTRUCTURE INDUSTRY ENERGY DIGITAL
SOLUTIONS
BA BA BA BA
BA BA BA
BA BA BA BA
BA
BA BA BA BA
BA
BA BA BA BA
Clear structure with full
P&L and accountability
Distinct plans for each BA
– turnaround – profitability
- growth
Strengthened
performance management

36
-10,0%
-5,0%
0,0%
5,0%
10,0%
15,0%
20,0%
25,0%
-15,0% -5,0% 5,0% 15,0% 25,0% 35,0% 45,0%
EB
IT
A %
GROWTH %
OPERATIONSOperational excellence
Business Area portfolio
with different challenges
Evaluated on attractivity
and profitable growth
potential
Strong performance
management with
increased accountability
Portfolio Management

OPERATIONSOperational excellence
Adjusted financial steering
• Support cross collaboration
• Continuously improve project steering
• Strengthen performance- and portfolio management
Optimised pricing and sourcing
• Implementation of structured Low Cost Sourcing for key projects and deliveries
• Partner network 27,000
• Strengthening strategic pricing process across ÅF
Ethical commitment
• Adopted rules and principles creating the foundation of ÅF:s Ethical commitment

PEOPLEBest in class people practices

Strategy activation – new clear strategic direction will increase engagement
The most interesting careers
Competence development via own academy – ÅF Academy
Competitive compensation and benefits
PEOPLEPeople engagement and development

PEOPLELeadership
Common leadership platform – manager ‘guiding stars’
Leadership development in ÅF Academy
Proactive and structured management & succession planning

41
PEOPLEEmployer Branding
42
▪ So far this year we have welcomed
1500 new talents to ÅF
▪ We have 30 recruiters working to
support our hiring managers
▪ Our recruiters are top 1% best
recruiters on LinkedIn (globally!)
▪ We are thereby one of Sweden’s
largest and best recruitment firms!
PEOPLERecruitment

43
PEOPLEDiversity and inclusion

Thank you!

Financial targets
GROWTH
• 10 % organic growth and add on
acquisitions
• Platform acquisitions on top

Growth - Net Sales
46
3,864,57 4,69 4,34
5,135,80
8,348,80
9,8511,07
2007 2008 2009 2010 2011 2012 2013 2014 2015 2016
+12% p.a.

47
▪ Solid▪ Reinertsen (inkl Tegn 3)▪ Erstad & Lekven▪ Optiman
500
▪ Edy Toscano 430
▪ Aries 50
▪ Midtconsult▪ Traffic team
225
Estimated annual net sales 2,100 MSEK
▪ Koncept Stockholm▪ Vatten & Miljöbyrån▪ Teknoplan▪ Quality Engineering▪ Reinertsen▪ Reinertsen Oil & Gas
850▪ Sjöland&Thyselius▪ Ingenjörsprojekt▪ Alteco▪ sandellsandberg▪ inUse▪ Eitechs Automation business
▪ Light Bureau 6
Growth by acquisitions 2016-2017

Financial targets
EBITA MARGIN
• 10 % over a business cycle
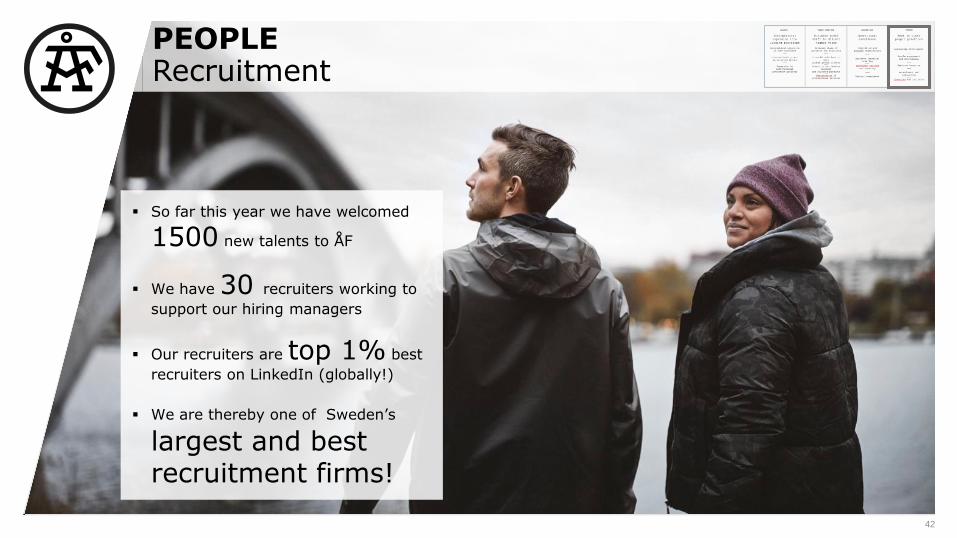
Profitability
49
0%
2%
4%
6%
8%
10%
12%
0
200
400
600
800
1 000
1 200
2005 2006 2007 2008 2009 2010 2011 2012 2013 2014 2015 2016
MSEK %
EBIT and EBIT % excl. items affecting comparability

Financial targets
NET DEBT
• Net debt/EBITA 2.5

0
50
100
150
200
250
300
350
-100
0
100
200
300
400
500
600
700
Cash Flow from operating acivities Dividend paid
Stable cash flow
51
Div
idend p
aid
Cash F
low
fro
m o
pera
ting a
ctivitie
s
MSEK

Low volatility in earnings
52
ÅF EBIT marginQ1 2008 – Q2
2017At 3.0x ND/EBITDA

Financial targets
GROWTH
• 10 % organic growth and add on
acquisitions
• Platform acquisitions on top
EBITA MARGIN
• 10 % over a business cycle
NET DEBT
• Net debt/EBITA 2.5

Summarisingour strategy
GROWTH
• 10 % organic growth and
add on acquisitions
• Platform acquisitions on
top
EBITA MARGIN
• 10 % over a business
cycle
NET DEBT
• Net debt/EBITA 2.5
FINANCIAL TARGETS


57
INFRASTRUCTURE DIVISION
Mats PåhlssonDivisional Manager
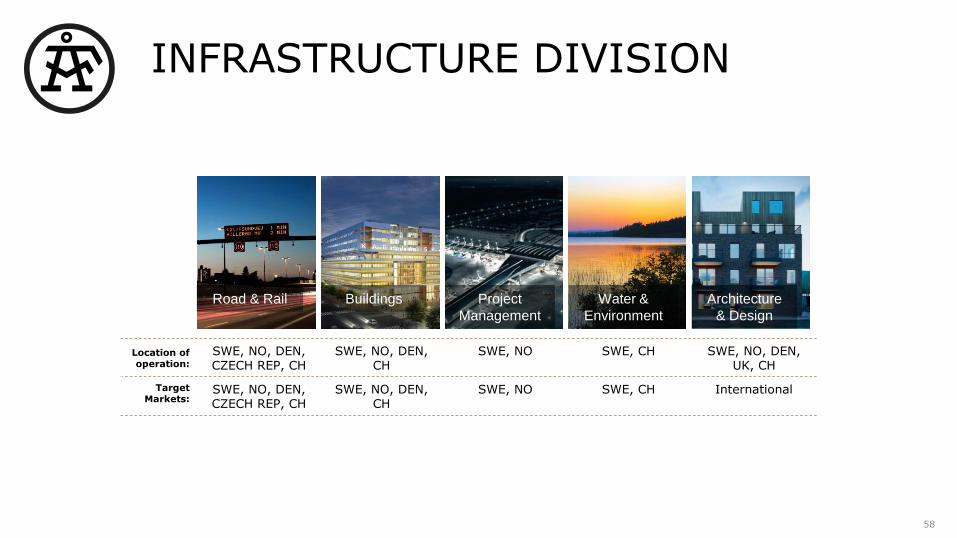
INFRASTRUCTURE DIVISION
58
Location of operation:
SWE, NO, DEN, CZECH REP, CH
SWE, NO, DEN, CH
SWE, NO SWE, CH SWE, NO, DEN, UK, CH
Target Markets:
SWE, NO, DEN, CZECH REP, CH
SWE, NO, DEN, CH
SWE, NO SWE, CH International
Road & Rail Buildings Project
Management
Water &
Environment
Architecture
& Design
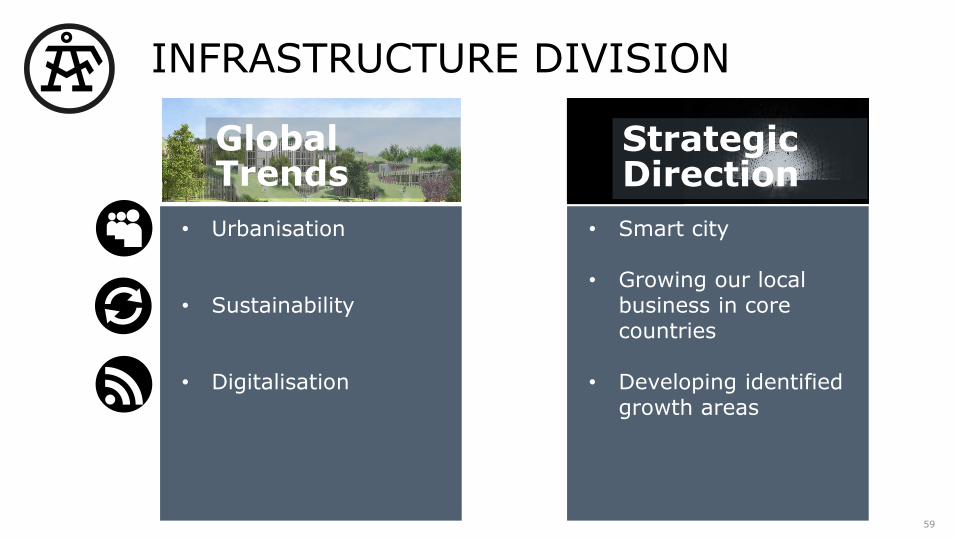
INFRASTRUCTURE DIVISION
59
• Urbanisation
• Sustainability
• Digitalisation
Global Trends
as
StrategicDirection
• Smart city
• Growing our local business in core countries
• Developing identified growth areas

60
INDUSTRY DIVISION
Jonas LarssonDivisional Manager

INDUSTRY DIVISION
61
AUTOMOTIVER&D
FOOD &PHARMA
PROCESSINDUSTRY
INDUSTRIALENGINEERING
SPECIALIZED TECHNICAL SERVICES
ADVANCEDMANUFACTURING
PRODUCT DEVELOPMENT
Location of
operation:
SWE SWE, China, BrazilUK
SWE, Denmark, Estonia, NOR
SWE, Czech Republic
SWE, NOR SWE, Denmark SWE
Target Markets:
International International International International SWE, NOR, DEN, FIN
SWE, NOR, DEN, FIN
SWE, NOR, DEN, FIN

INDUSTRY DIVISION
62
High pace in technology development. Calls for partnering and outsourcing of “packages”.
Need for new technology areas, e.g. software/R&D, additive manufacturing
Need for productivity improvements in manufacturing processes.
Changing landscape within Automotive, i.e. electro mobility, autonomy, connectivity.
Global Trends
as
StrategicDirection
Accelerated international growth in four distinct segments.
Strengthen position in Sweden, with growth into core countries for the other three.
Leverage profitability from specialized services in all segments.
Spearhead Industrial digitalization by process and business knowledge

63
ENERGY DIVISION
Roberto GerosaDivisional Manager

ENERGY DIVISION
64
World electricity generation increase of 69% by 2040 due to:• population and economic growth in the
emerging countries• smart cities and future mobility going ”from
fossil fuels to electricity”.
Transition of the energy markets in the European Core markets:
Main growth in Renewable Energy, demand for reliable transmission and distribution networks, storage and digital solutions.”
Bulk energy needed in International markets:
• Investments in traditional generation projectsand T&D grids providing base load capacity
Global Trends
as
StrategicDirection
Core markets:
Stretch along the value chain in each market and expand offering.
“Become the country’s #1 leading energy company.”
International operations:
Selected markets where international competence is valued and which are rich in energy investment opportunities.
“Be a leading player in selected markets.”

ENERGY DIVISION
SegmentsHeat & Power
Nuclear EnergyHydropowerRenewable &
Energy StrategyTransmission &
Distribution
BA International Energy
OperationsBA Switzerland
BA Czech Republic
BA FinlandBA Scandinavia
Sales

66
DIGITAL SOLUTIONS DIVISION
Lennart WaldenströmDivisional Manager

DIGITAL SOLUTIONS DIVISION
67
IT SOLUTIONS
Location of
operation:
SWE, USA SWE, NOR SWE SWE
Target Markets:
International Scandinavian International Scandinavian
EMBEDDED SYSTEMS
SYSTEMS
MANAGEMENT
EXPERIENCE
DESIGN

DIGITAL SOLUTIONS DIVISION
68
Intelligence inside products increasing
Increasing demand for connectivity and low latency communication
Connected products increase the need of analytics, usability and service design
Defense industry is in great demand
Global Trends
as
StrategicDirection
Full service digitalization partner within ÅF Growth pillars
Increase solution delivery in Sweden, and select countries
National expertise in connectivity and information infrastructure
Scandinavian expertise within Systems Engineering for Defense