Welcome and Action Plan Updates - WRAP · Welcome and Action Plan Updates Simon Drury, Supply Chain...
63
Welcome and Action Plan Updates Simon Drury, Supply Chain Partnership Manager Michael Savage, Resource Efficiency Advisor
-
Upload
dangnguyet -
Category
Documents
-
view
228 -
download
0
Transcript of Welcome and Action Plan Updates - WRAP · Welcome and Action Plan Updates Simon Drury, Supply Chain...
Welcome and Action Plan Updates
Simon Drury, Supply Chain Partnership Manager
Michael Savage, Resource Efficiency Advisor
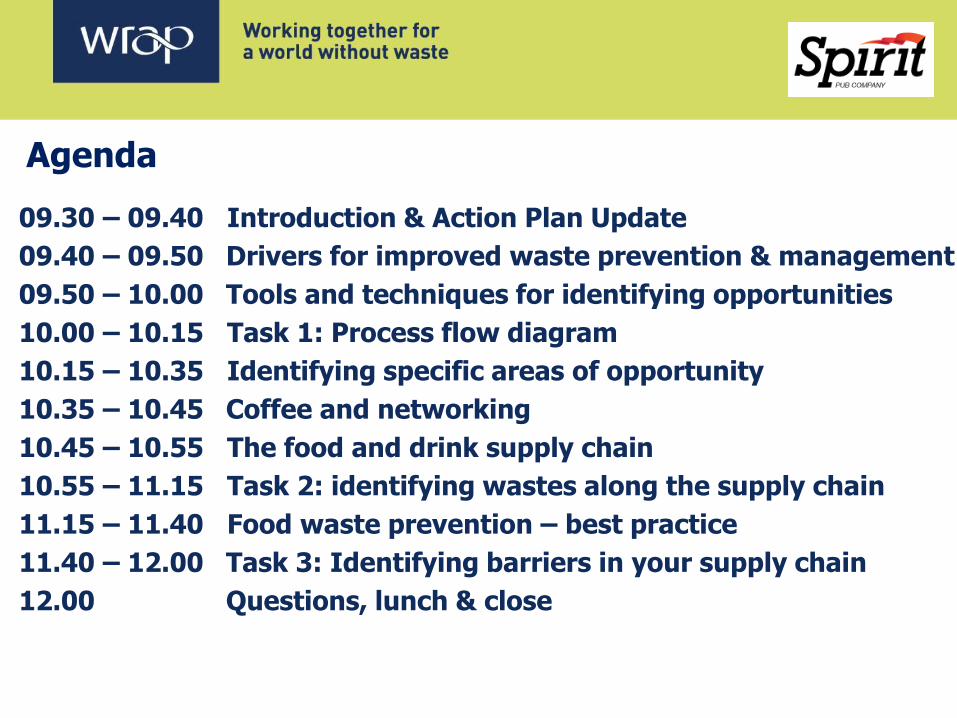
Agenda
09.30 – 09.40 Introduction & Action Plan Update
09.40 – 09.50 Drivers for improved waste prevention & management
09.50 – 10.00 Tools and techniques for identifying opportunities
10.00 – 10.15 Task 1: Process flow diagram
10.15 – 10.35 Identifying specific areas of opportunity
10.35 – 10.45 Coffee and networking
10.45 – 10.55 The food and drink supply chain
10.55 – 11.15 Task 2: identifying wastes along the supply chain
11.15 – 11.40 Food waste prevention – best practice
11.40 – 12.00 Task 3: Identifying barriers in your supply chain
12.00 Questions, lunch & close

Our priorities Business Plan period (2011-2015)
Minimising resource use in products and buildings
Diverting priority materials from landfill

Drivers for waste prevention and improved waste management
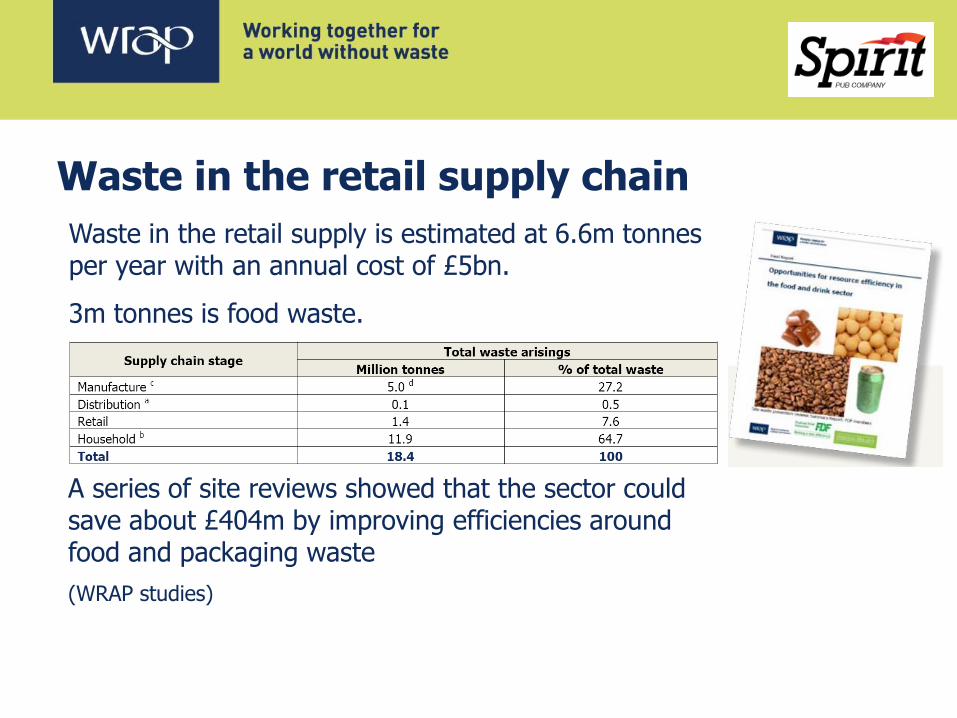
Waste in the retail supply chain
A series of site reviews showed that the sector could save about £404m by improving efficiencies around food and packaging waste
(WRAP studies)
Waste in the retail supply is estimated at 6.6m tonnes per year with an annual cost of £5bn.
3m tonnes is food waste.

Waste in the Hospitality and Food Service sector
A study of the Hospitality and Food Service sector identified 3.4 million tonnes of waste/year from the profit subsector
600,000 tonnes is food waste Eliminating avoidable food waste could save the sector £722 million/year WRAP studies ongoing in the cost subsector
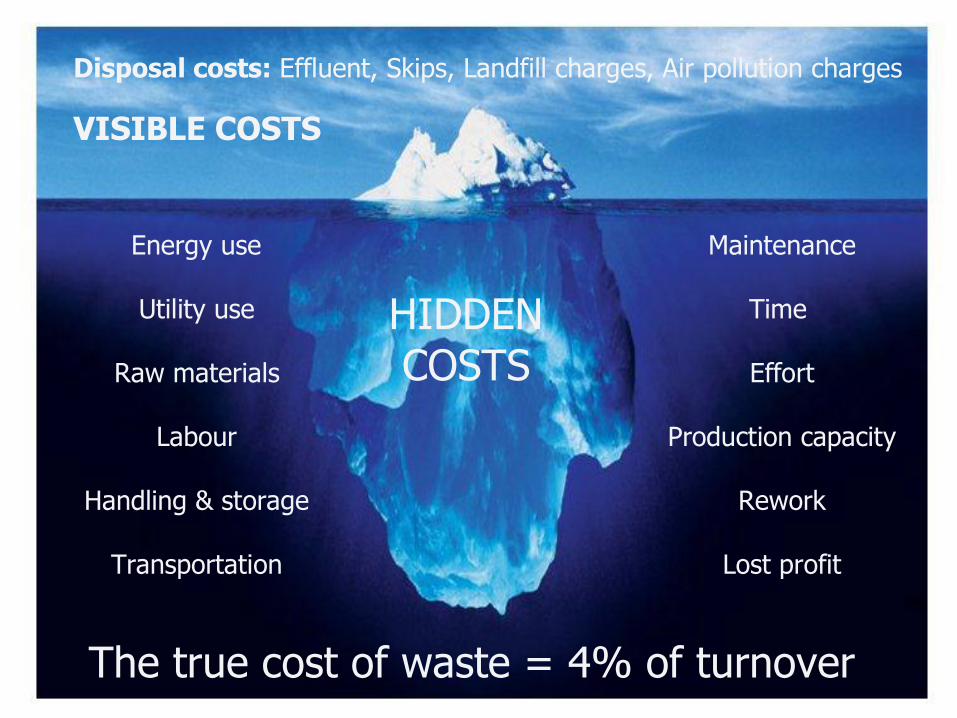
HIDDENCOSTS
VISIBLE COSTS
Disposal costs: Effluent, Skips, Landfill charges, Air pollution charges
Energy use
Utility use
Raw materials
Labour
Handling & storage
Transportation
The true cost of waste = 4% of turnover
Maintenance
Time
Effort
Production capacity
Rework
Lost profit
Hospitality & Food Service Agreement
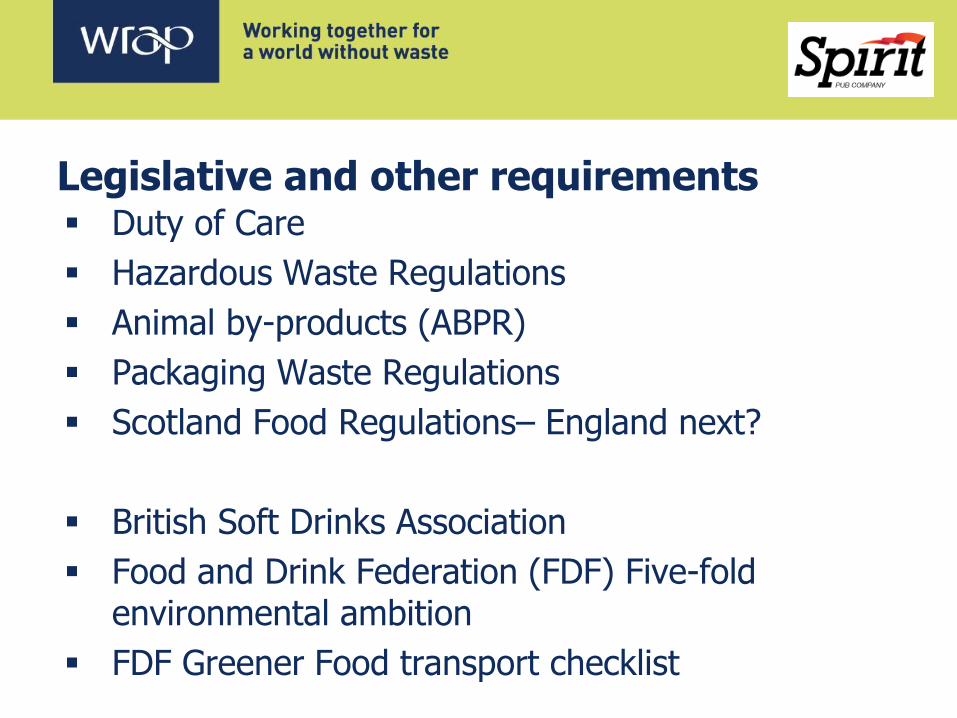
Legislative and other requirements Duty of Care
Hazardous Waste Regulations
Animal by-products (ABPR)
Packaging Waste Regulations
Scotland Food Regulations– England next?
British Soft Drinks Association
Food and Drink Federation (FDF) Five-fold environmental ambition
FDF Greener Food transport checklist
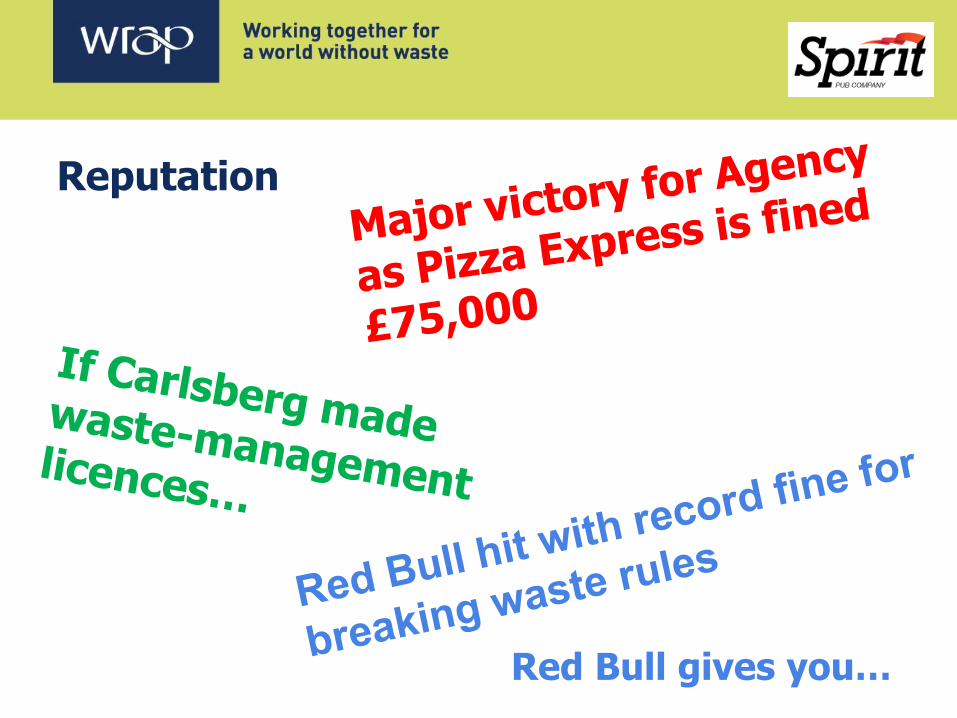
Reputation
Red Bull gives you…
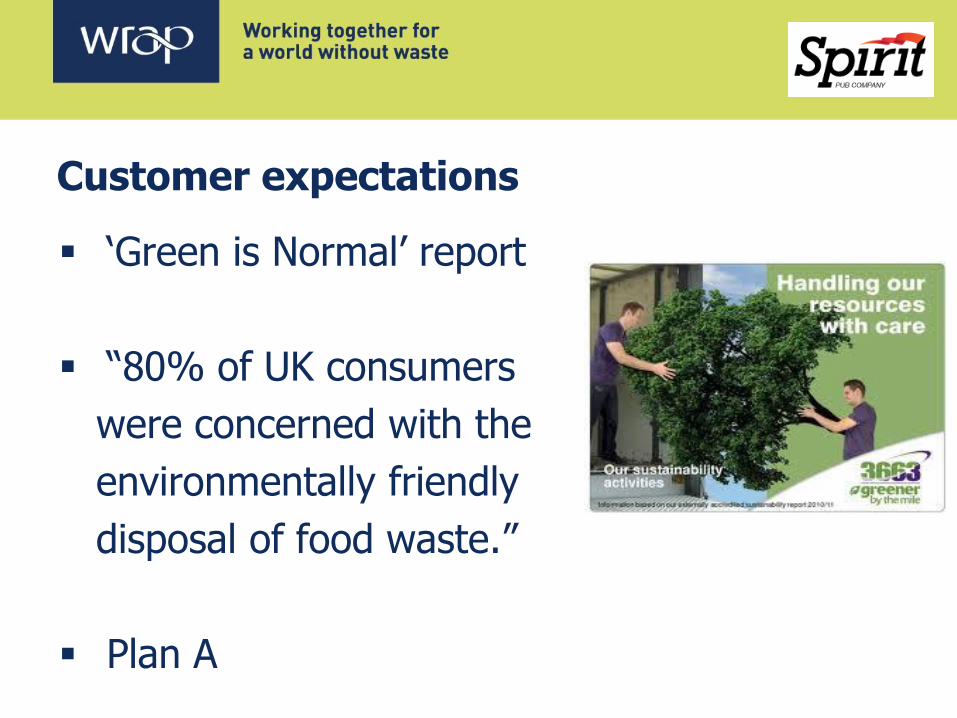
Customer expectations
‘Green is Normal’ report
“80% of UK consumers
were concerned with the
environmentally friendly
disposal of food waste.”
Plan A
Tools and techniques for identifying opportunities

The Waste Hierarchy
The EU’s Waste Framework Directive has been the primary mechanism for driving changes in legislation, and includes the ‘waste hierarchy’.
Prevention
Preparing for Reuse
Recycling
Other Recovery
Disposal
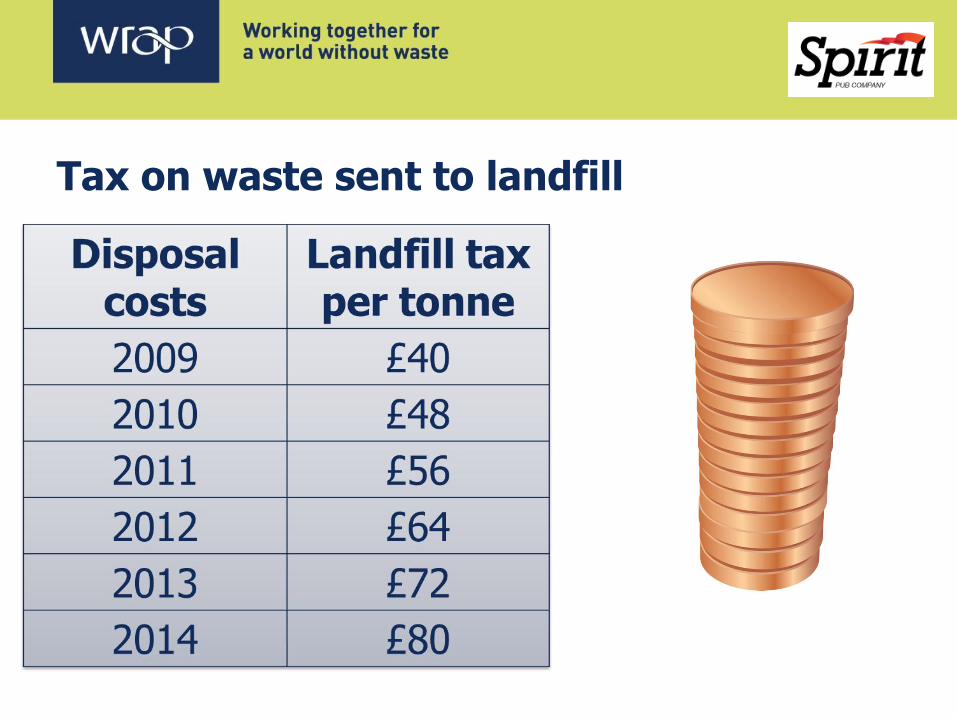
Tax on waste sent to landfill
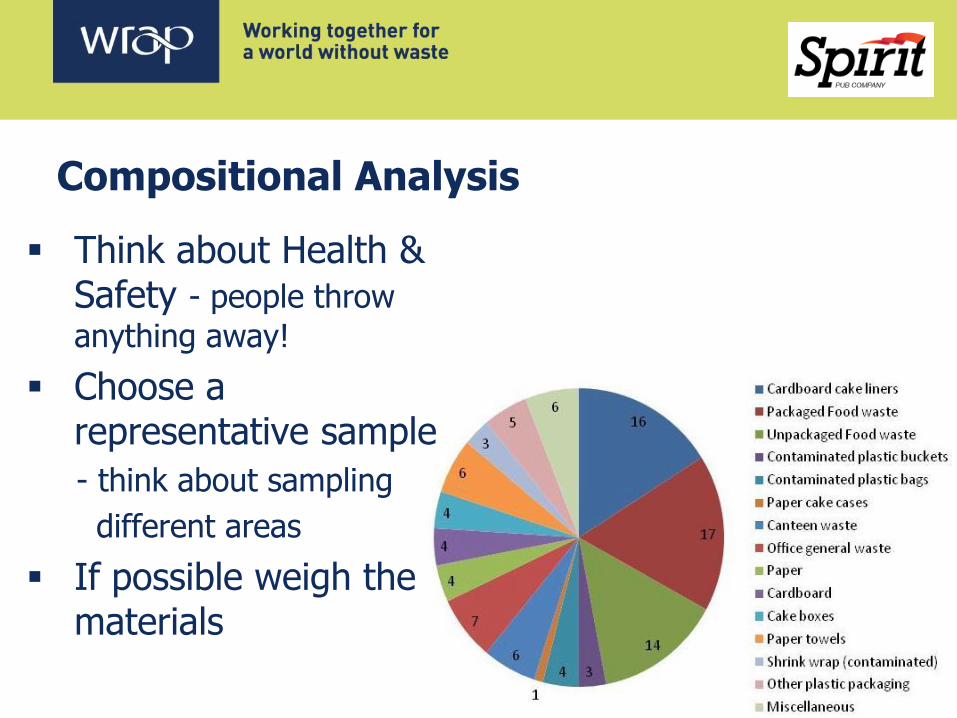
Compositional Analysis
Think about Health & Safety - people throw
anything away!
Choose a representative sample
- think about sampling
different areas
If possible weigh the materials
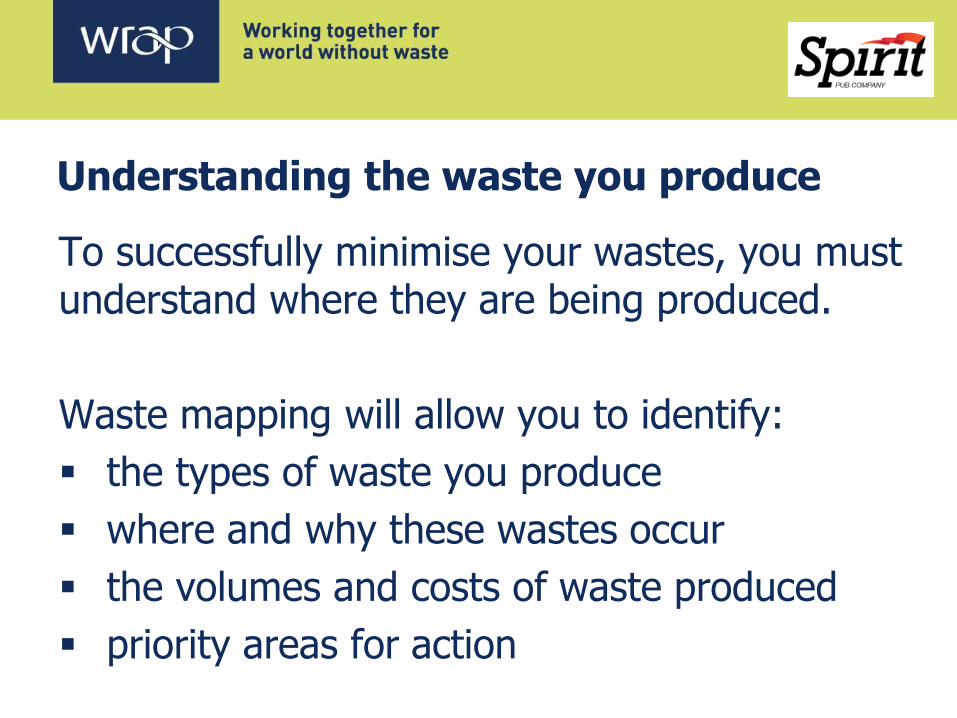
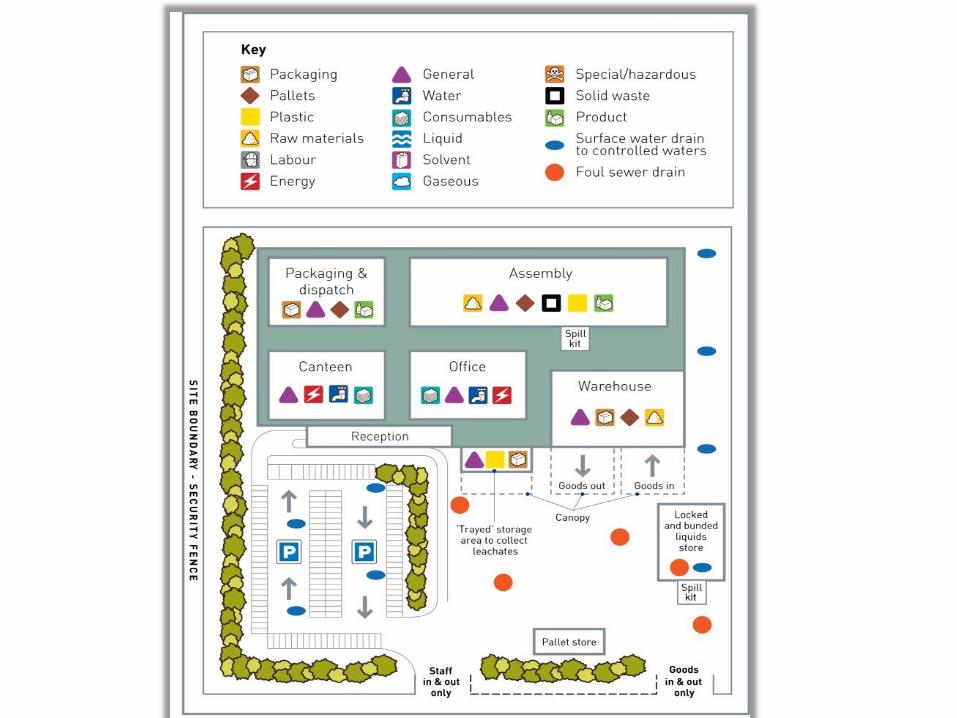
Understanding the waste you produce
To successfully minimise your wastes, you must understand where they are being produced.
Waste mapping will allow you to identify:
the types of waste you produce
where and why these wastes occur
the volumes and costs of waste produced
priority areas for action

Waste mapping process
Take photographs
Talk to key people
Gather information on amounts and costs
Estimate the potential savings associated with a few of the more promising opportunities to reduce resource use

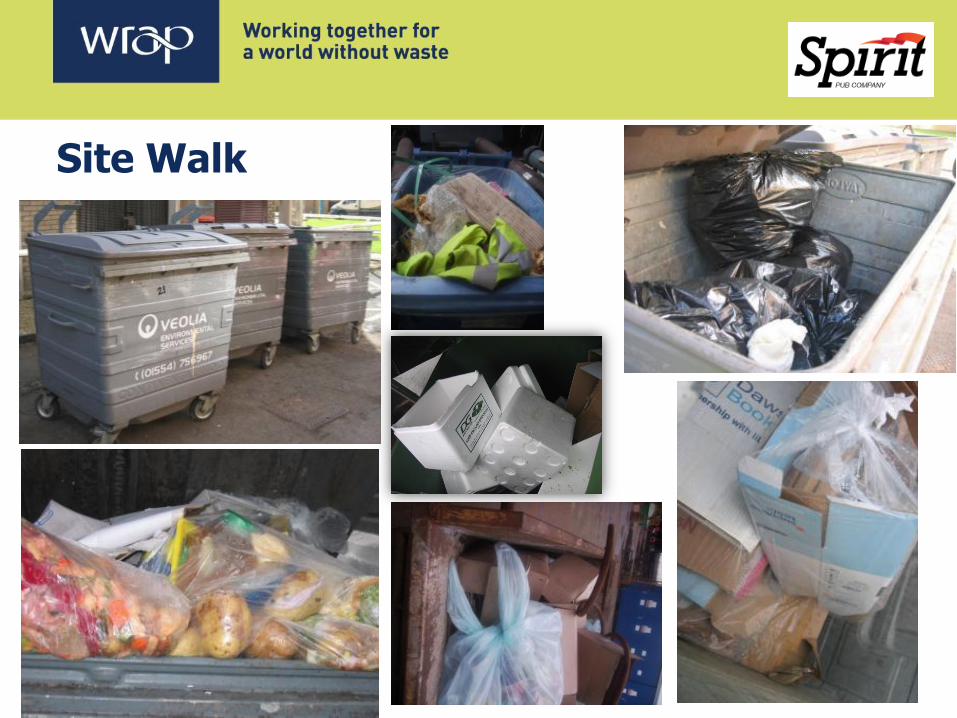
Site Walk
Next step – process diagrams
By producing a waste map, you will have identified the waste types your organisation produces and where on your site they arise
You should now be able to identify the individual processes and areas in your organisation that produce your waste
Each process will have inputs (materials and utilities) and outputs (wastes and emissions)
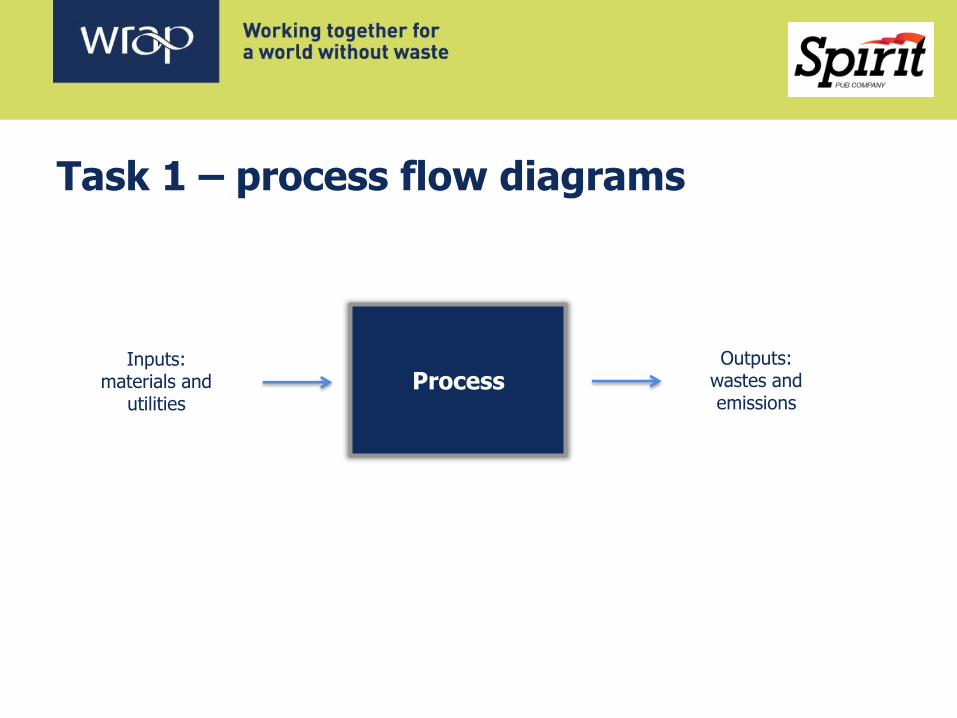
Task 1 – process flow diagrams
Inputs: materials and
utilities Process
Outputs: wastes and emissions
Aim: create a simple process diagram for an area of your organisation that creates a lot of waste
Complete the inputs and outputs for that area Add as much detail as possible Don’t forget those items disposed of infrequently Once you have completed the list try and rank the
items in terms of low, medium or high cost
You have 10 mins in total for the exercise and a group discussion
Identifying specific areas of opportunity
Identifying specific areas of opportunity
Where should you focus first?
Which wastes are costing you most?
Which wastes occur most often?
Which wastes are avoidable?
Identify the cause of waste Understanding the root ‘cause’ of waste and the
‘effect’ it has on your costs and processes is one way to better understand where your waste recycling/reuse opportunities lie.
It will also help you understand why your waste is being created.
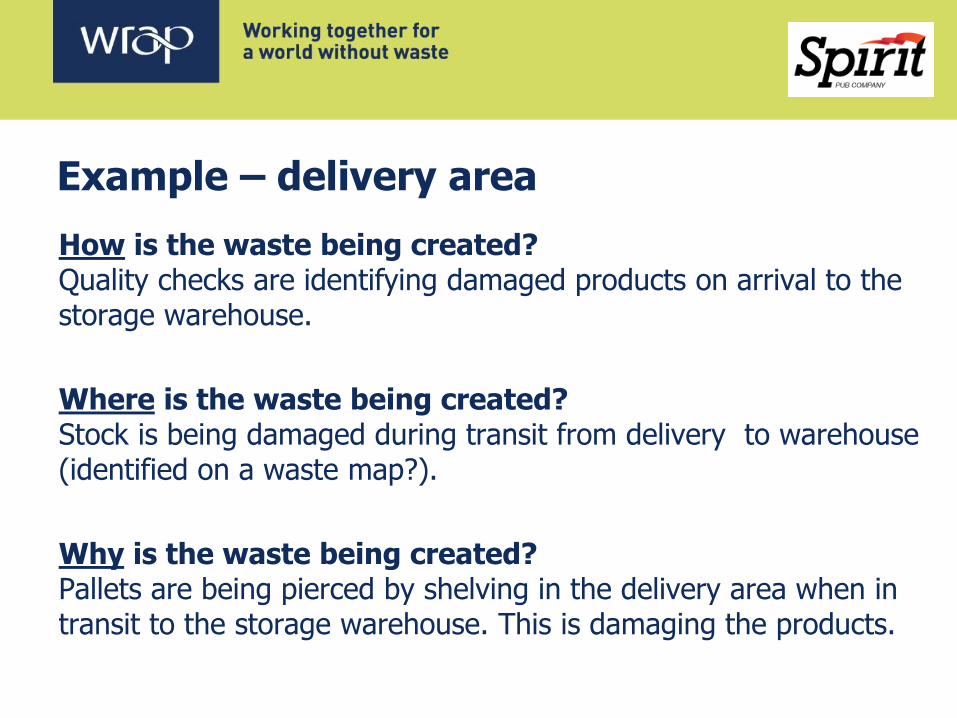
Example – delivery area
How is the waste being created? Quality checks are identifying damaged products on arrival to the storage warehouse.
Where is the waste being created? Stock is being damaged during transit from delivery to warehouse (identified on a waste map?).
Why is the waste being created? Pallets are being pierced by shelving in the delivery area when in transit to the storage warehouse. This is damaging the products.
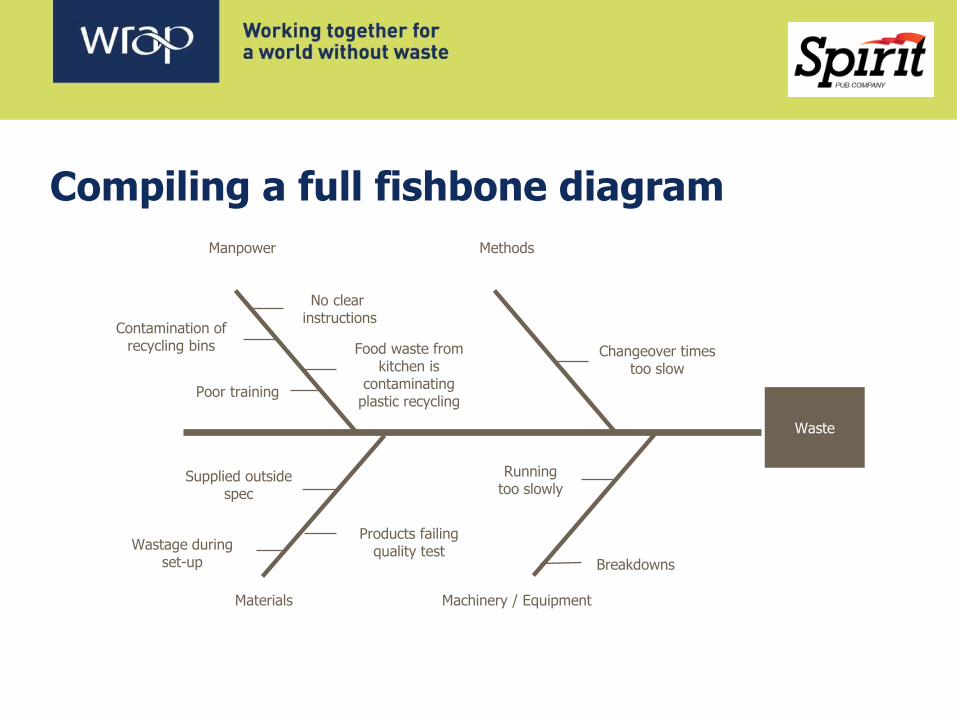
Compiling a full fishbone diagram
Waste
No clear instructions
Poor training
Manpower
Changeover times too slow
Methods
Supplied outside spec
Wastage during set-up
Materials
Breakdowns
Running too slowly
Machinery / Equipment
Food waste from kitchen is
contaminating plastic recycling
Contamination of recycling bins
Products failing quality test
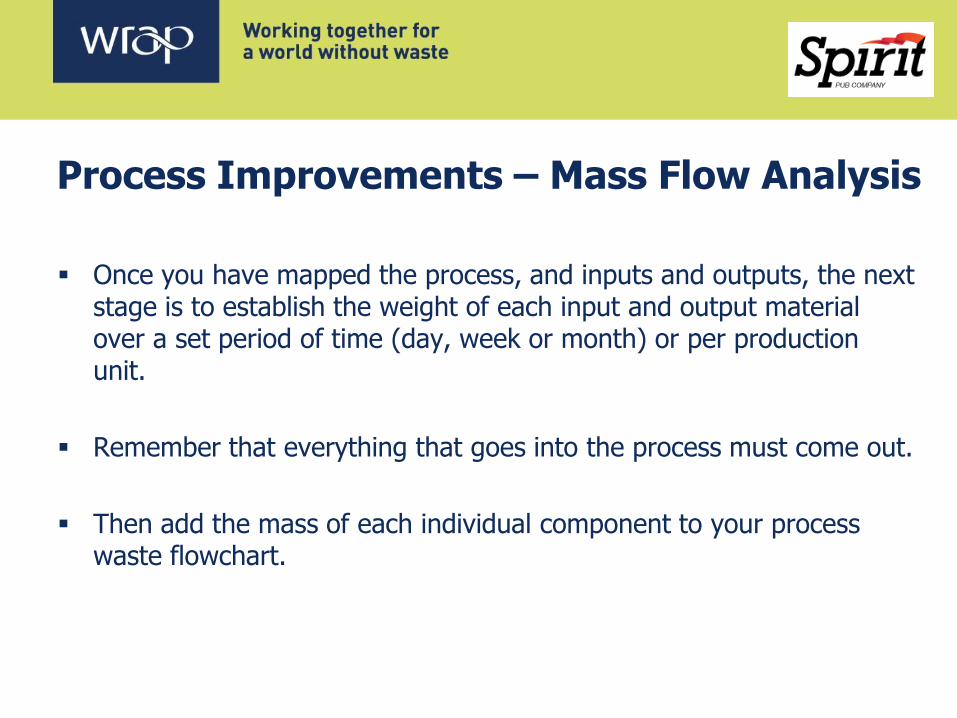
Process Improvements – Mass Flow Analysis
Once you have mapped the process, and inputs and outputs, the next stage is to establish the weight of each input and output material over a set period of time (day, week or month) or per production unit.
Remember that everything that goes into the process must come out.
Then add the mass of each individual component to your process waste flowchart.

Mass Flow Analysis – Biscuit Manufacture
The following process waste flowchart illustrates a mass flow analysis completed on a chocolate chip biscuit manufacturing process.
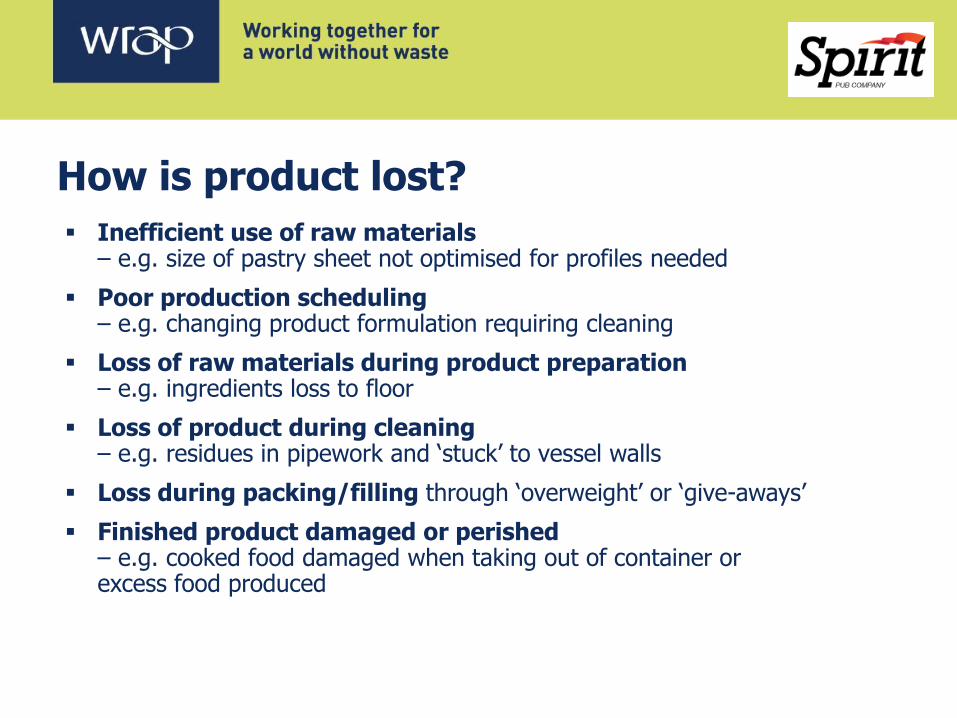
How is product lost?
Inefficient use of raw materials – e.g. size of pastry sheet not optimised for profiles needed
Poor production scheduling – e.g. changing product formulation requiring cleaning
Loss of raw materials during product preparation – e.g. ingredients loss to floor
Loss of product during cleaning – e.g. residues in pipework and ‘stuck’ to vessel walls
Loss during packing/filling through ‘overweight’ or ‘give-aways’
Finished product damaged or perished – e.g. cooked food damaged when taking out of container or excess food produced
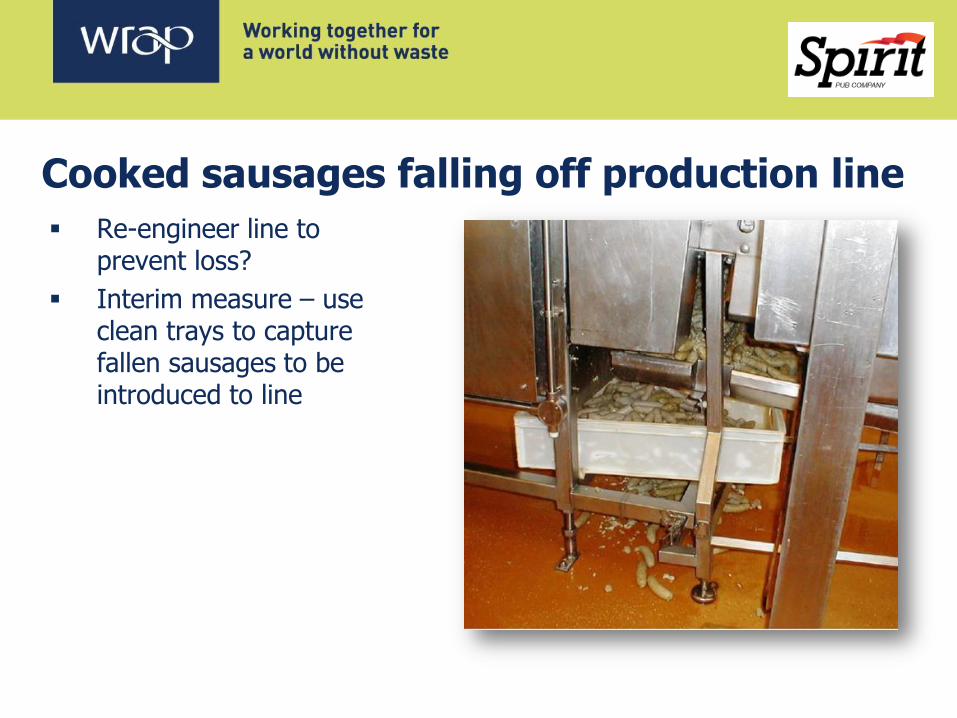
Re-engineer line to prevent loss?
Interim measure – use clean trays to capture fallen sausages to be introduced to line
Cooked sausages falling off production line
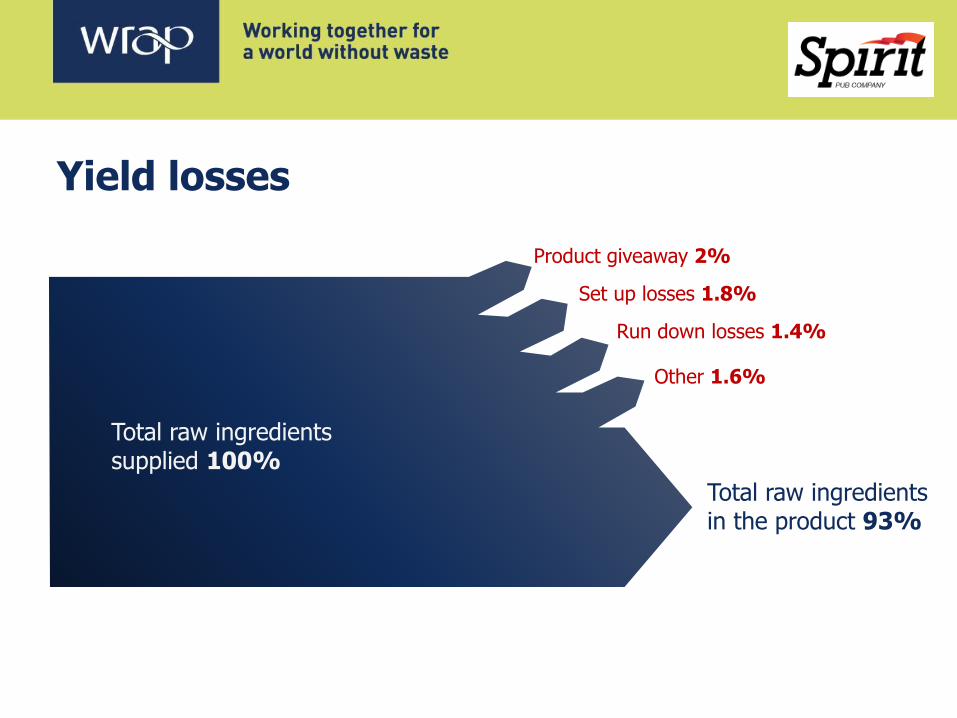
Yield losses
Total raw ingredients supplied 100%
Product giveaway 2%
Set up losses 1.8%
Run down losses 1.4%
Other 1.6%
Total raw ingredients in the product 93%
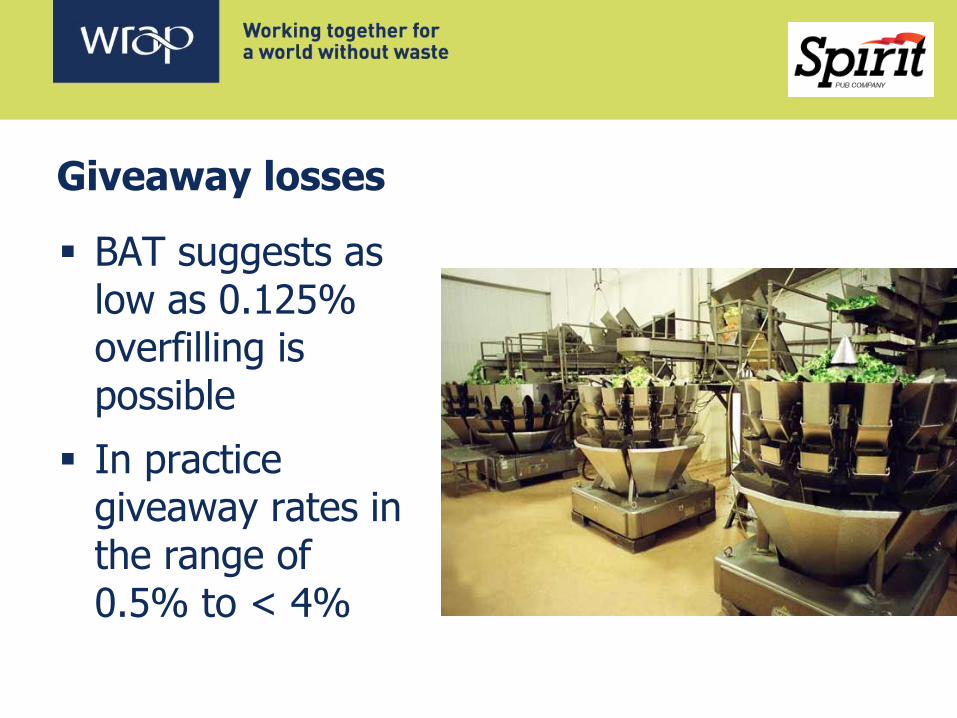
Giveaway losses
BAT suggests as low as 0.125% overfilling is possible
In practice giveaway rates in the range of 0.5% to < 4%

Set up and run down losses
Monitoring of product changeover
Improved product scheduling
Feedback systems
Smart monitoring
Overproduction
Key economic issues associated with overproduction
Collaborative programmes
Reducing variance
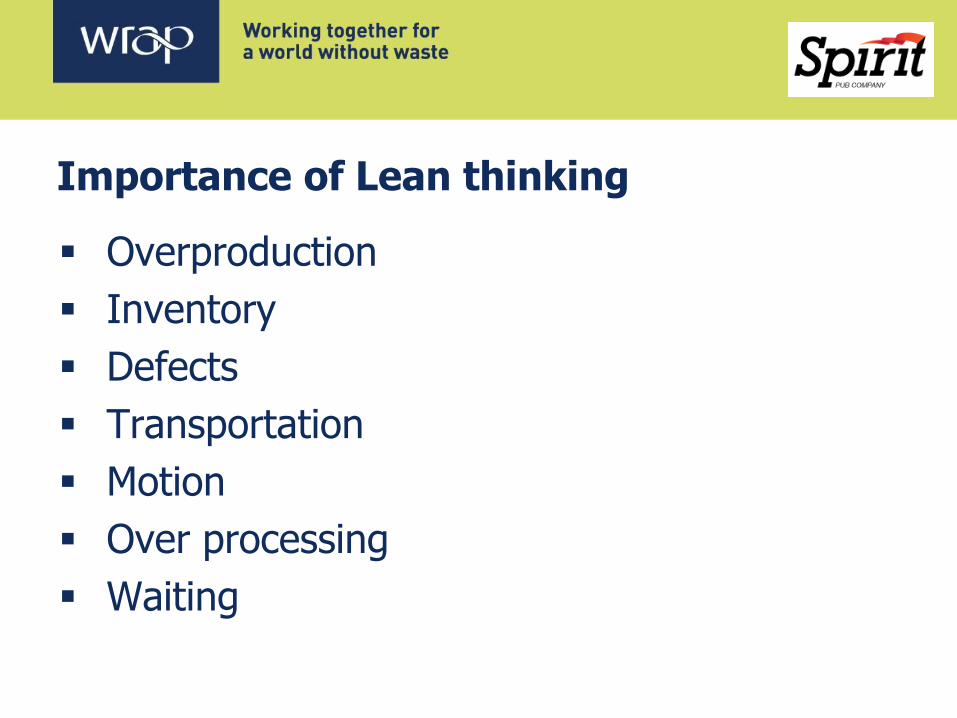
Importance of Lean thinking
Overproduction
Inventory
Defects
Transportation
Motion
Over processing
Waiting
The Food and Drink Supply Chain
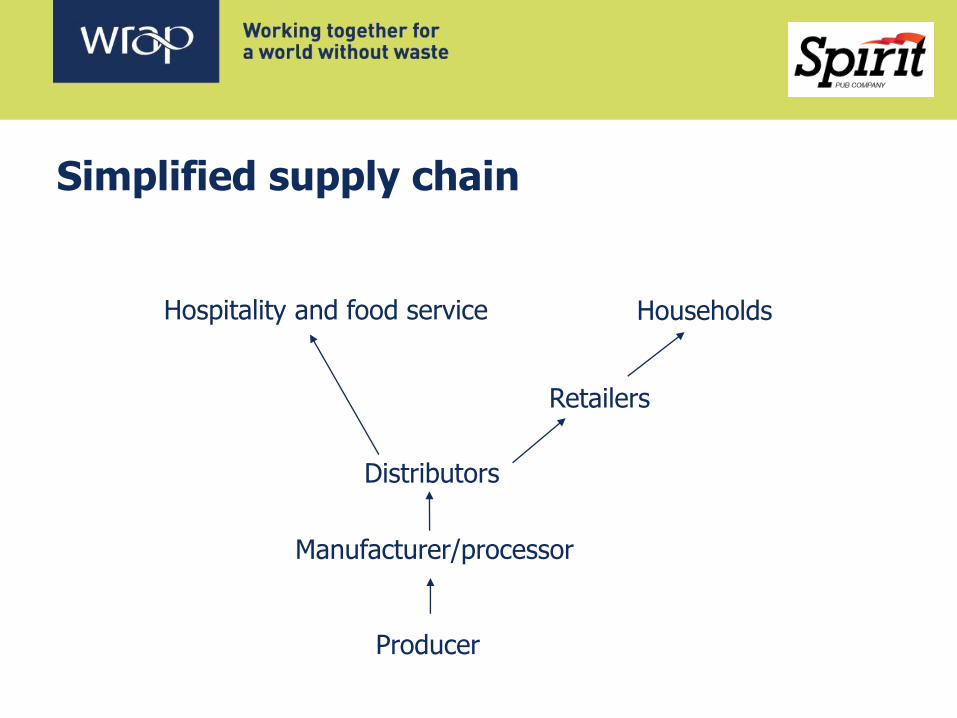
Simplified supply chain
Manufacturer/processor
Producer
Hospitality and food service
Retailers
Households
Distributors
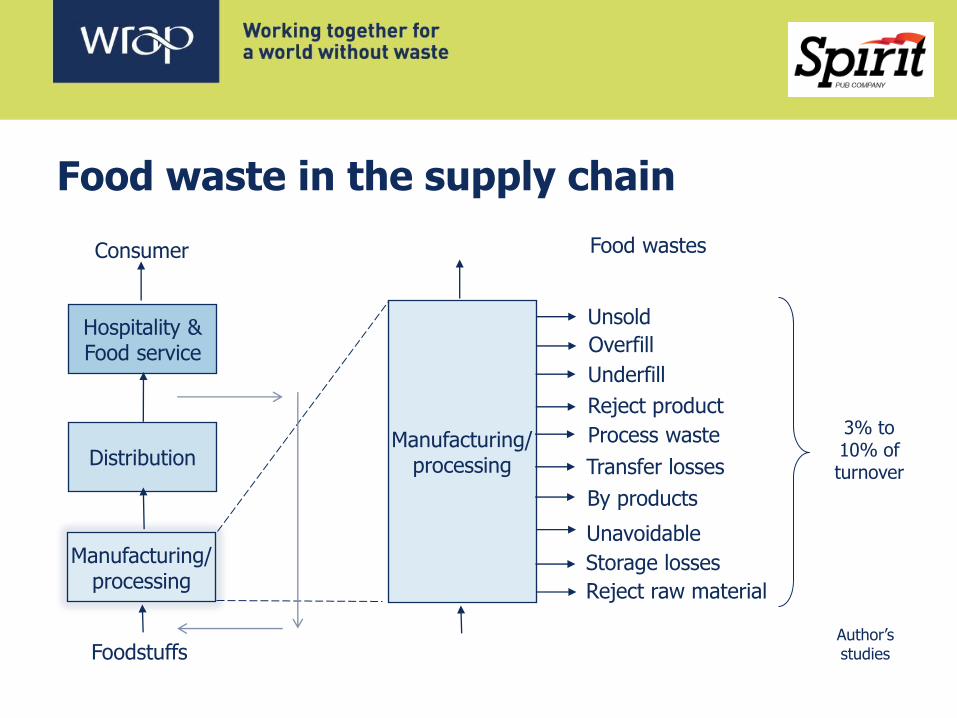
Food waste in the supply chain
Hospitality & Food service
Distribution
Manufacturing/ processing
Consumer
Foodstuffs
Manufacturing/ processing
Overfill
Reject product
Underfill
Process waste
By products
Unavoidable
Unsold
Transfer losses
Storage losses
Reject raw material
3% to 10% of turnover
Author’s studies
Food wastes
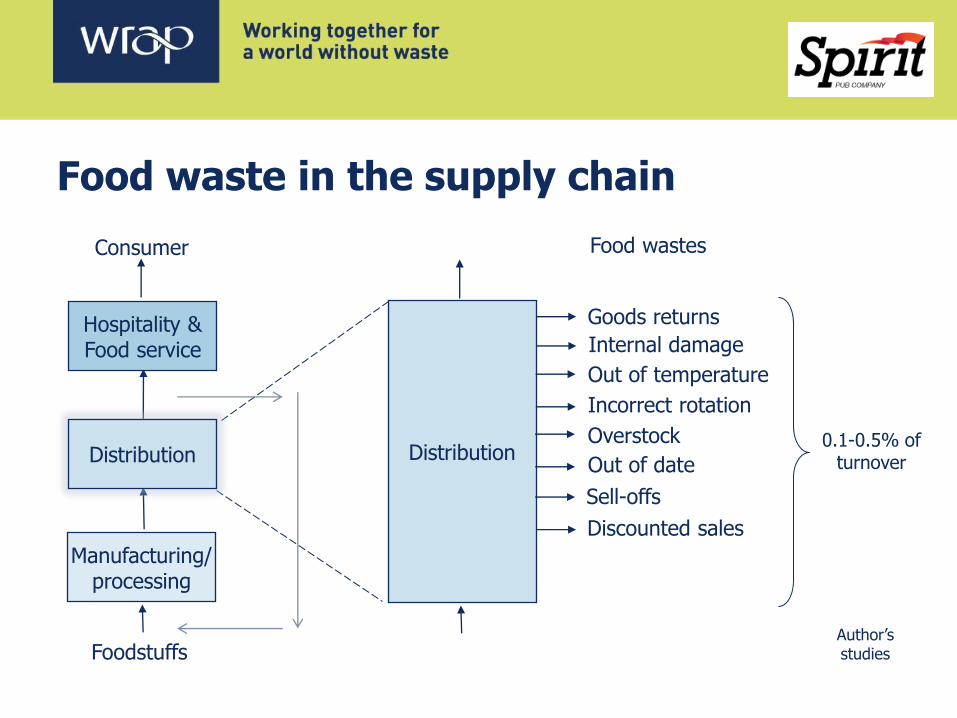
Food waste in the supply chain
Consumer
Foodstuffs
Distribution
Internal damage
Overstock
Out of temperature
Out of date
Discounted sales
Goods returns
Sell-offs
0.1-0.5% of turnover
Author’s studies
Incorrect rotation
Food wastes
Hospitality & Food service
Distribution
Manufacturing/ processing
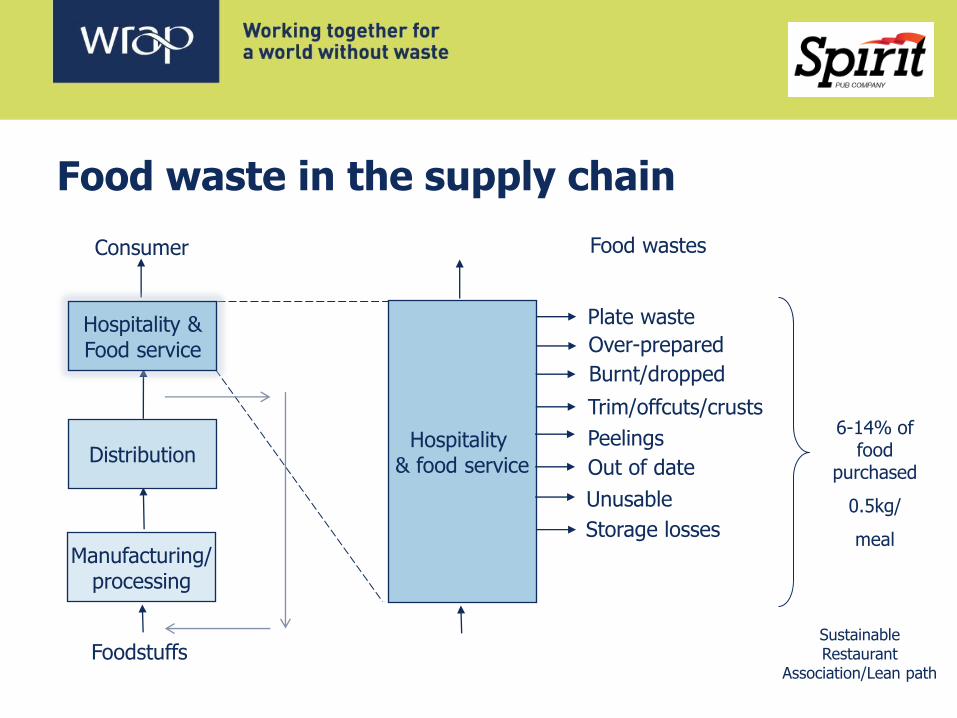
Food waste in the supply chain
Consumer
Foodstuffs
Hospitality & food service
Over-prepared
Peelings
Trim/offcuts/crusts
Out of date
Plate waste
Unusable
Storage losses
6-14% of food
purchased
0.5kg/
meal
Sustainable Restaurant
Association/Lean path
Burnt/dropped
Food wastes
Hospitality & Food service
Distribution
Manufacturing/ processing

Task 2 - identifying wastes along the supply chain
Hospitality & Food service
Distribution
Manufacturing/ processing
Consumer
Foodstuffs
In groups look to identify the key stages of the supply chain for the product on your table. Map out the supply chain of the product and the key wastes at each stage. Try to identify those wastes that will have the highest costs associated with them. Consider some key opportunities for waste prevention throughout the supply chain of the product.
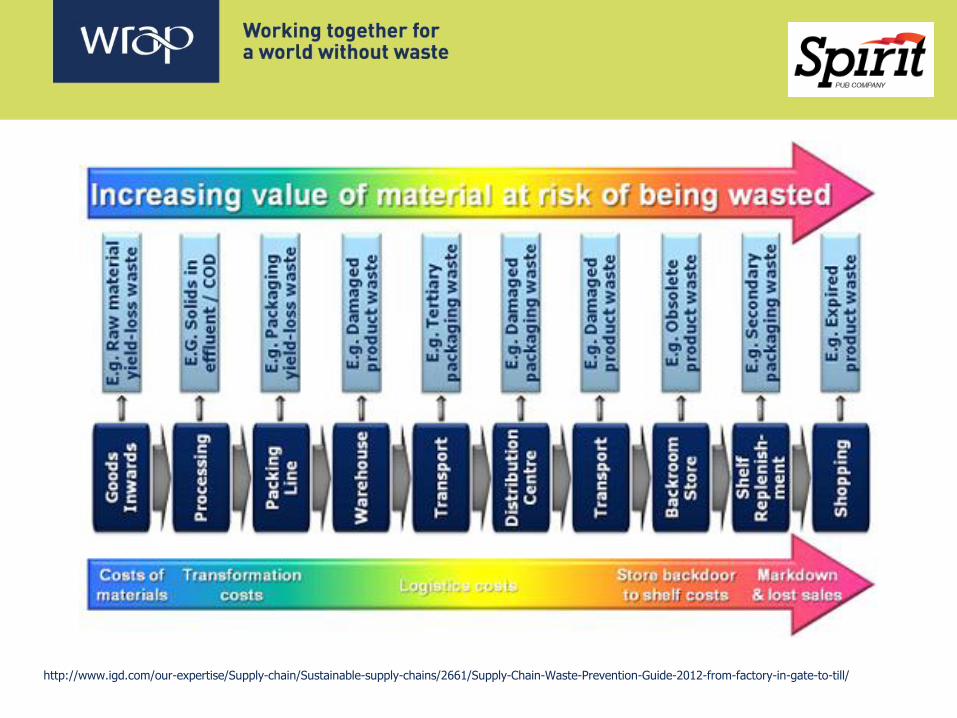
http://www.igd.com/our-expertise/Supply-chain/Sustainable-supply-chains/2661/Supply-Chain-Waste-Prevention-Guide-2012-from-factory-in-gate-to-till/
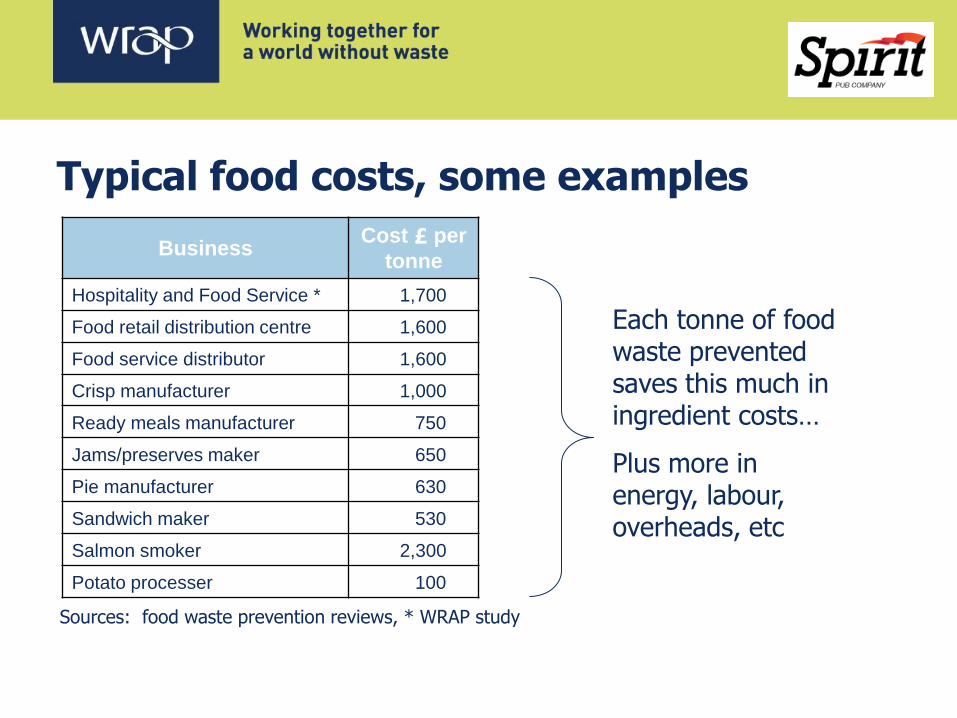
Typical food costs, some examples
Sources: food waste prevention reviews, * WRAP study
Business Cost £ per
tonne
Hospitality and Food Service * 1,700
Food retail distribution centre 1,600
Food service distributor 1,600
Crisp manufacturer 1,000
Ready meals manufacturer 750
Jams/preserves maker 650
Pie manufacturer 630
Sandwich maker 530
Salmon smoker 2,300
Potato processer 100
Each tonne of food waste prevented saves this much in ingredient costs…
Plus more in energy, labour, overheads, etc
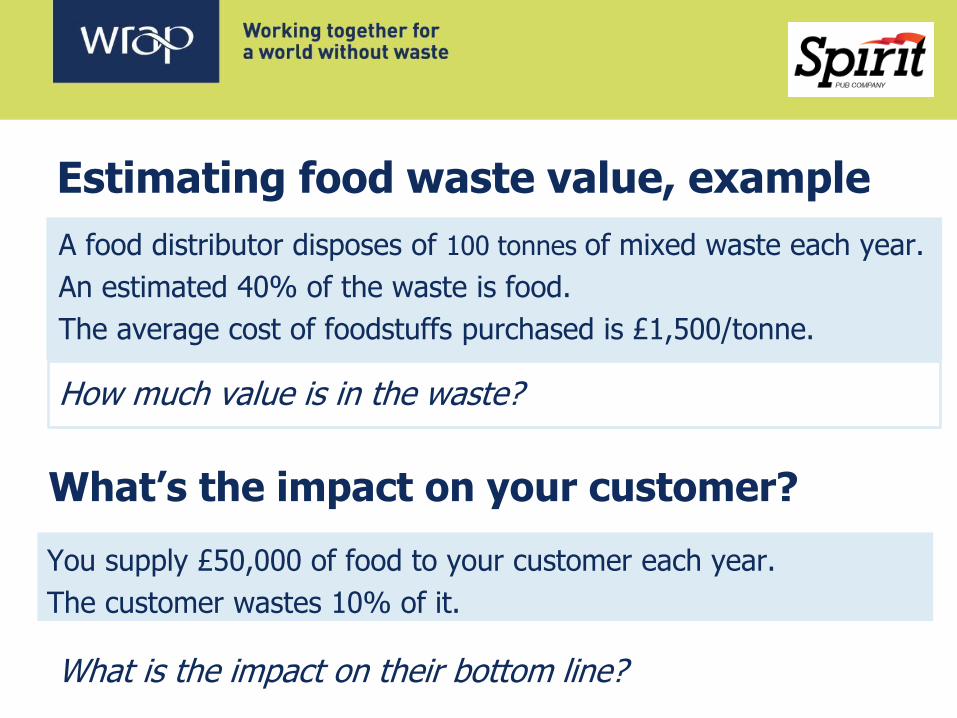
Estimating food waste value, example
A food distributor disposes of 100 tonnes of mixed waste each year.
An estimated 40% of the waste is food.
The average cost of foodstuffs purchased is £1,500/tonne.
How much value is in the waste?
What’s the impact on your customer?
You supply £50,000 of food to your customer each year.
The customer wastes 10% of it.
What is the impact on their bottom line?
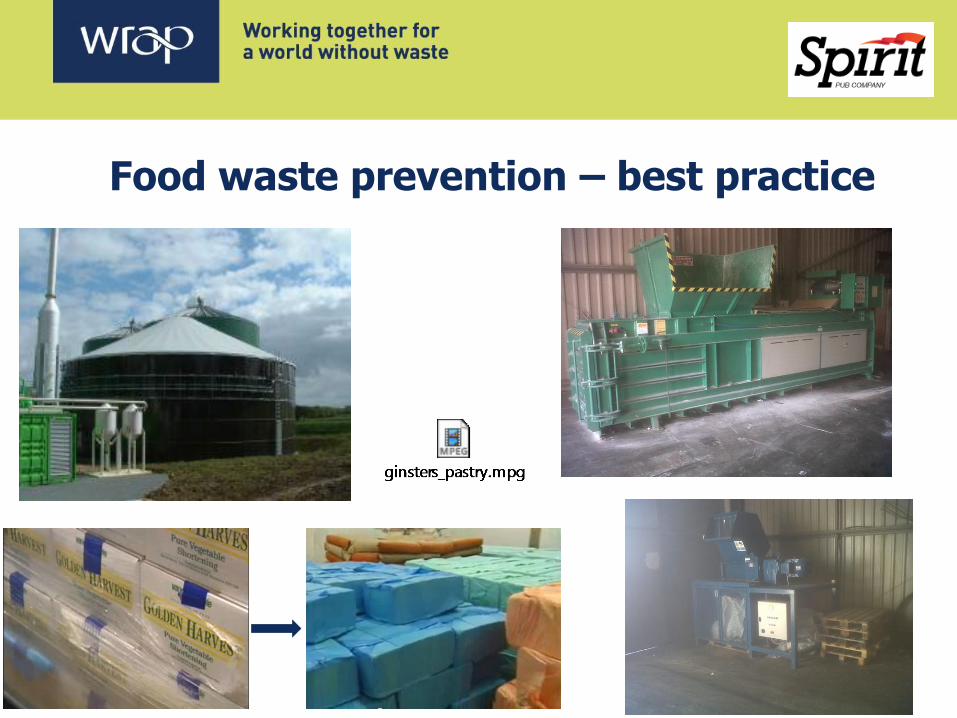
Food waste prevention – best practice

Before…… ……After
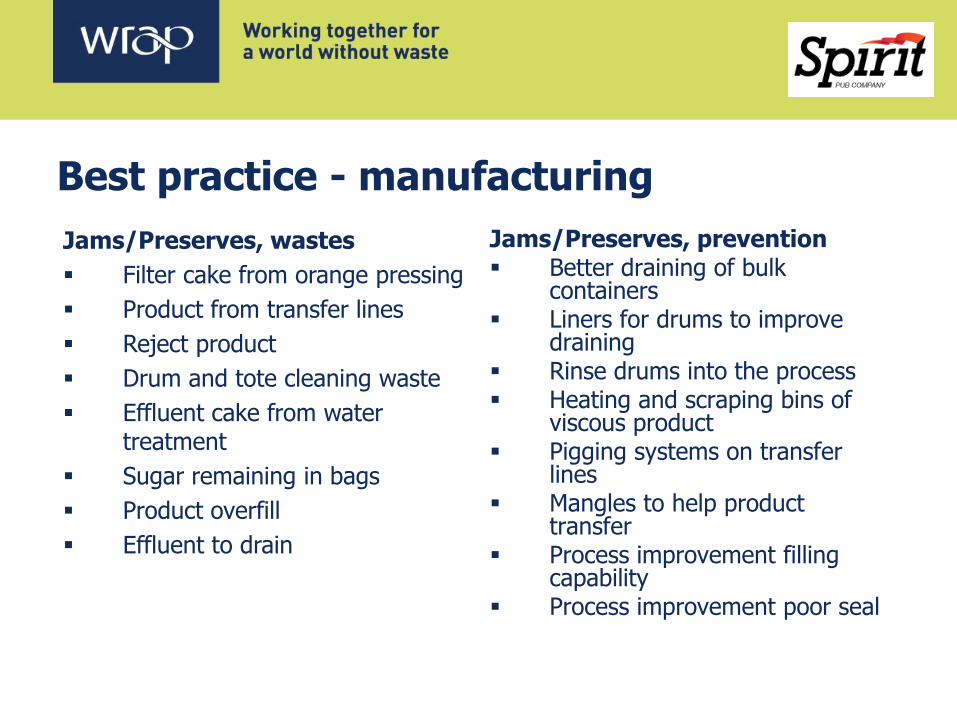
Best practice - manufacturing
Jams/Preserves, prevention Better draining of bulk
containers Liners for drums to improve
draining Rinse drums into the process Heating and scraping bins of
viscous product Pigging systems on transfer
lines Mangles to help product
transfer Process improvement filling
capability Process improvement poor seal
Jams/Preserves, wastes
Filter cake from orange pressing
Product from transfer lines
Reject product
Drum and tote cleaning waste
Effluent cake from water treatment
Sugar remaining in bags
Product overfill
Effluent to drain
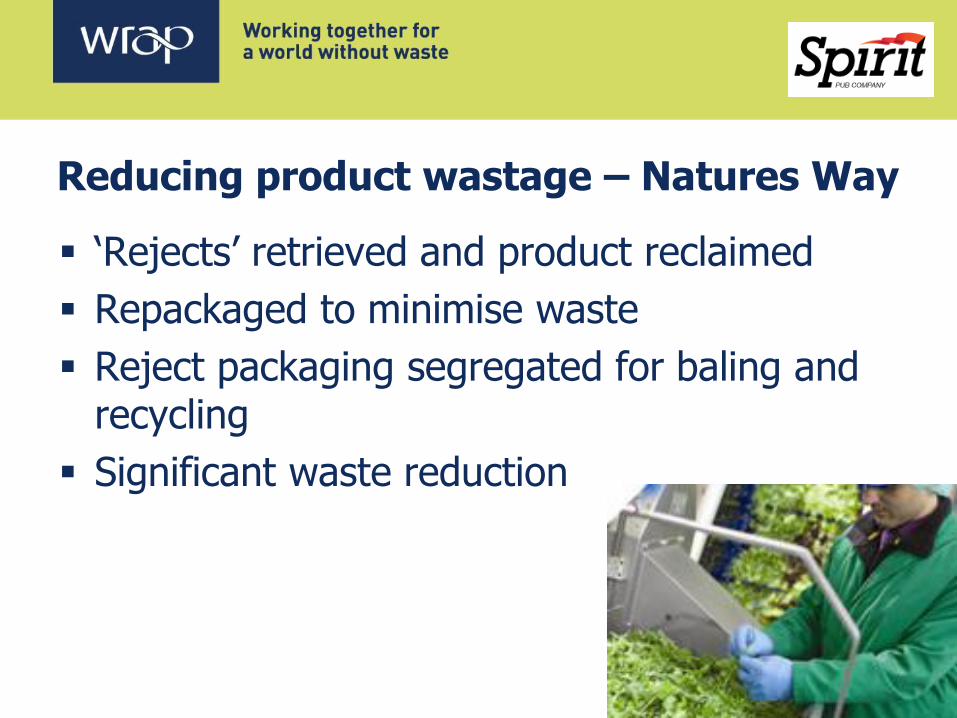
Reducing product wastage – Natures Way
‘Rejects’ retrieved and product reclaimed
Repackaged to minimise waste
Reject packaging segregated for baling and recycling
Significant waste reduction
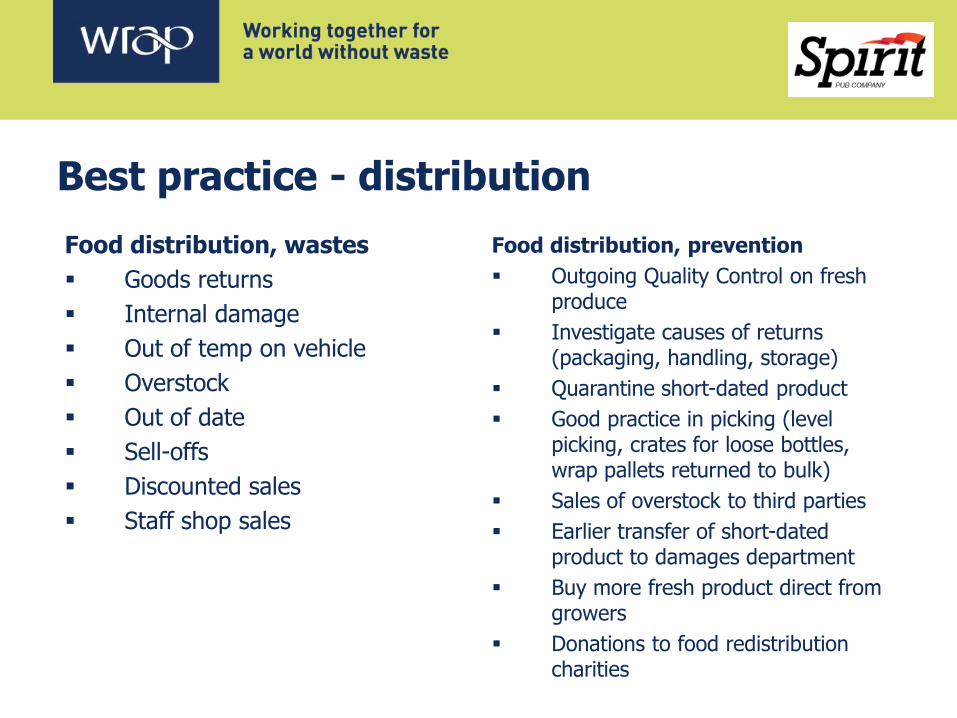
Best practice - distribution
Food distribution, wastes
Goods returns
Internal damage
Out of temp on vehicle
Overstock
Out of date
Sell-offs
Discounted sales
Staff shop sales
Food distribution, prevention
Outgoing Quality Control on fresh produce
Investigate causes of returns (packaging, handling, storage)
Quarantine short-dated product
Good practice in picking (level picking, crates for loose bottles, wrap pallets returned to bulk)
Sales of overstock to third parties
Earlier transfer of short-dated product to damages department
Buy more fresh product direct from growers
Donations to food redistribution charities
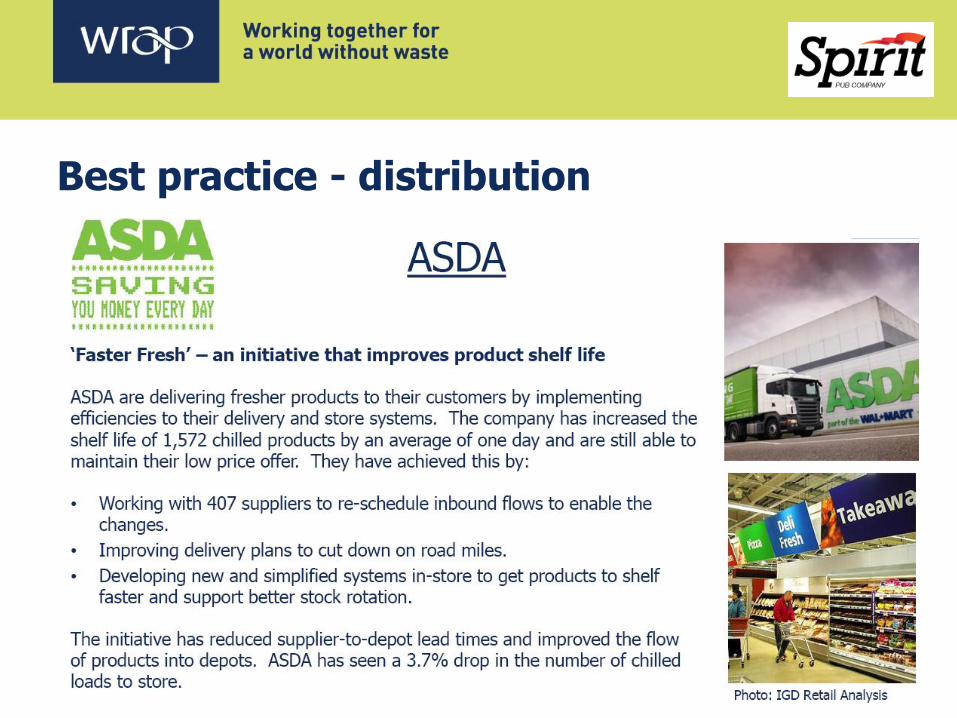
Best practice - distribution
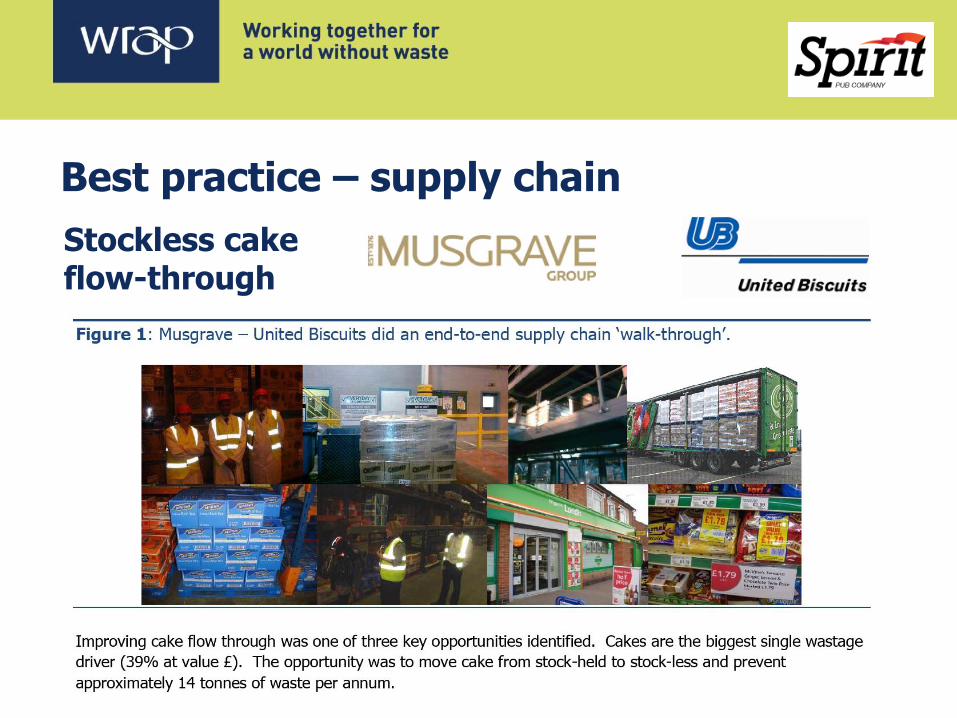
Best practice – supply chain
Stockless cake flow-through
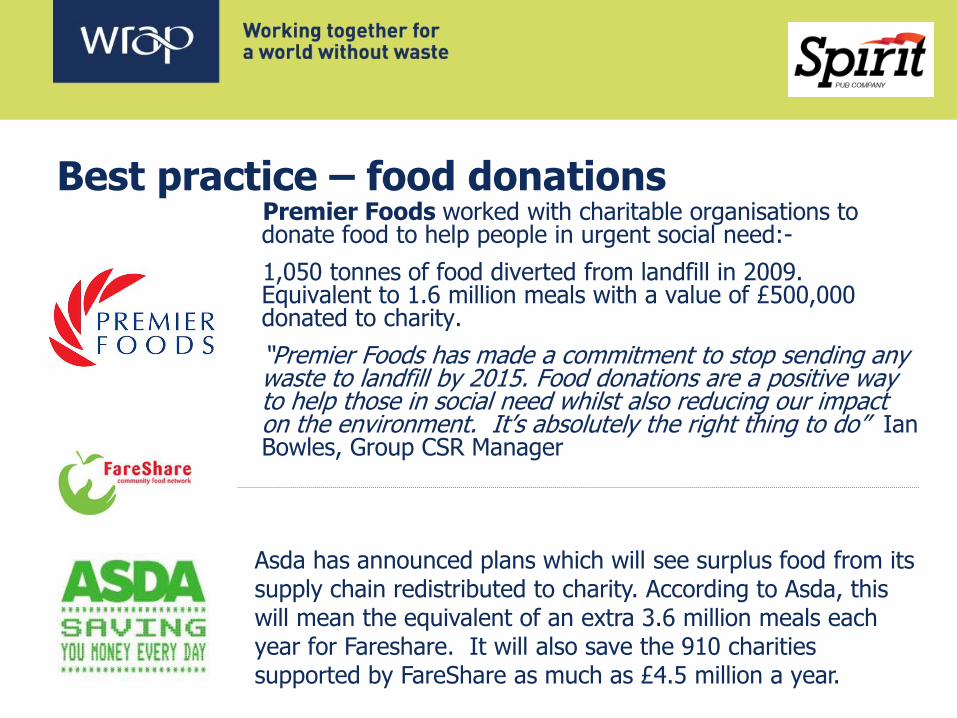
Best practice – food donations Premier Foods worked with charitable organisations to donate food to help people in urgent social need:-
1,050 tonnes of food diverted from landfill in 2009. Equivalent to 1.6 million meals with a value of £500,000 donated to charity.
“Premier Foods has made a commitment to stop sending any waste to landfill by 2015. Food donations are a positive way to help those in social need whilst also reducing our impact on the environment. It’s absolutely the right thing to do” Ian Bowles, Group CSR Manager
Asda has announced plans which will see surplus food from its supply chain redistributed to charity. According to Asda, this will mean the equivalent of an extra 3.6 million meals each year for Fareshare. It will also save the 910 charities supported by FareShare as much as £4.5 million a year.
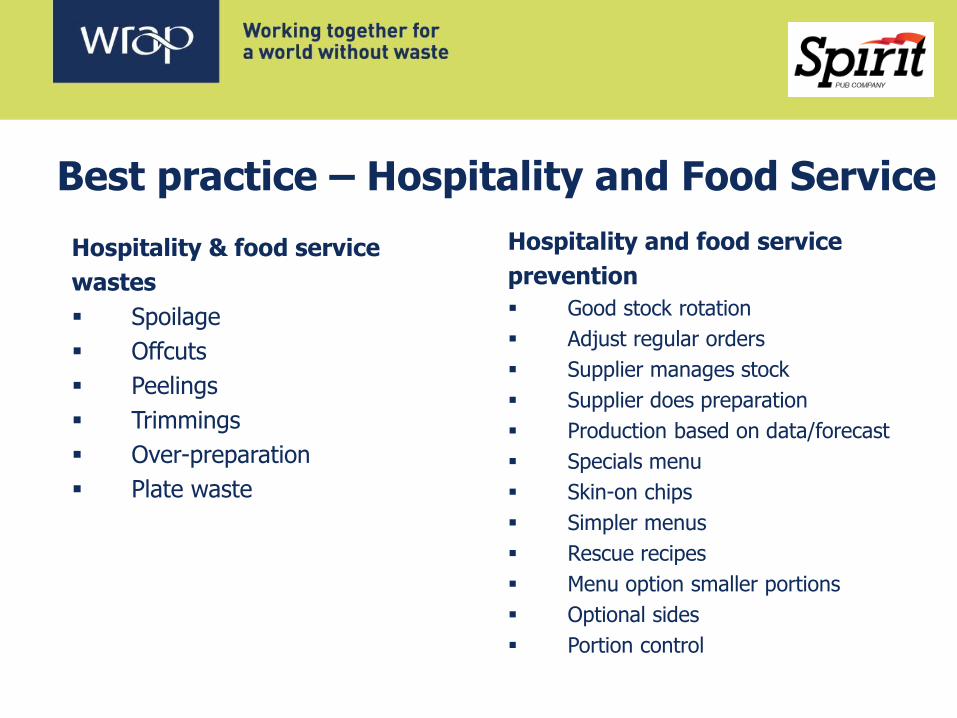
Hospitality and food service
prevention
Good stock rotation
Adjust regular orders
Supplier manages stock
Supplier does preparation
Production based on data/forecast
Specials menu
Skin-on chips
Simpler menus
Rescue recipes
Menu option smaller portions
Optional sides
Portion control
Best practice – Hospitality and Food Service
Hospitality & food service
wastes
Spoilage
Offcuts
Peelings
Trimmings
Over-preparation
Plate waste
Task 3
What food waste is in YOUR supply chain?
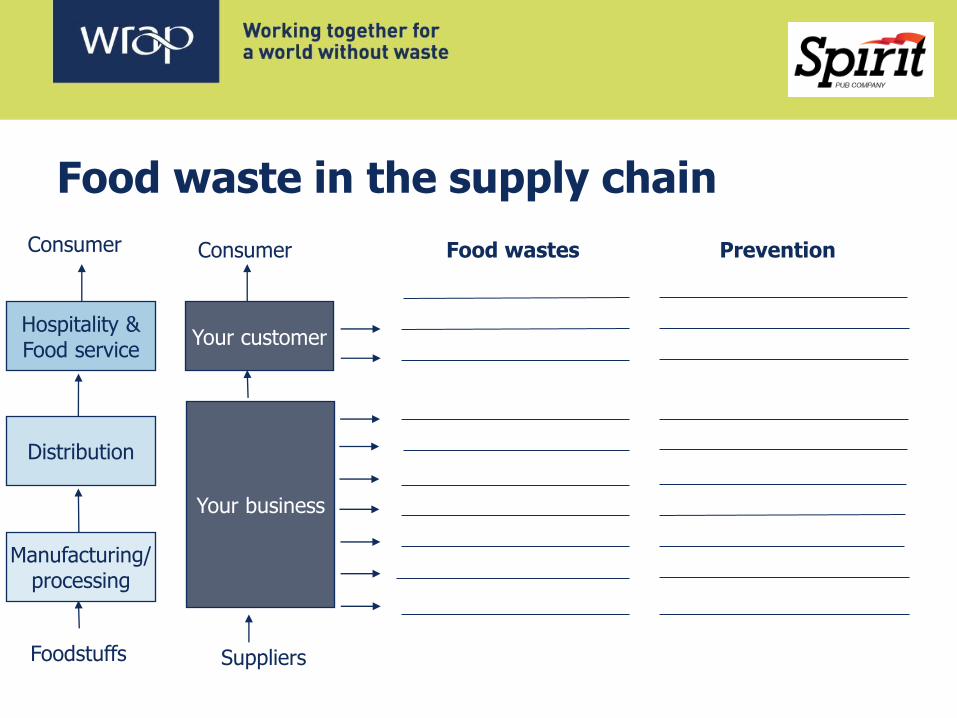
Food waste in the supply chain
Consumer
Foodstuffs
Your business
Your customer
Consumer
Suppliers
Prevention
Hospitality & Food service
Distribution
Manufacturing/ processing
Food wastes
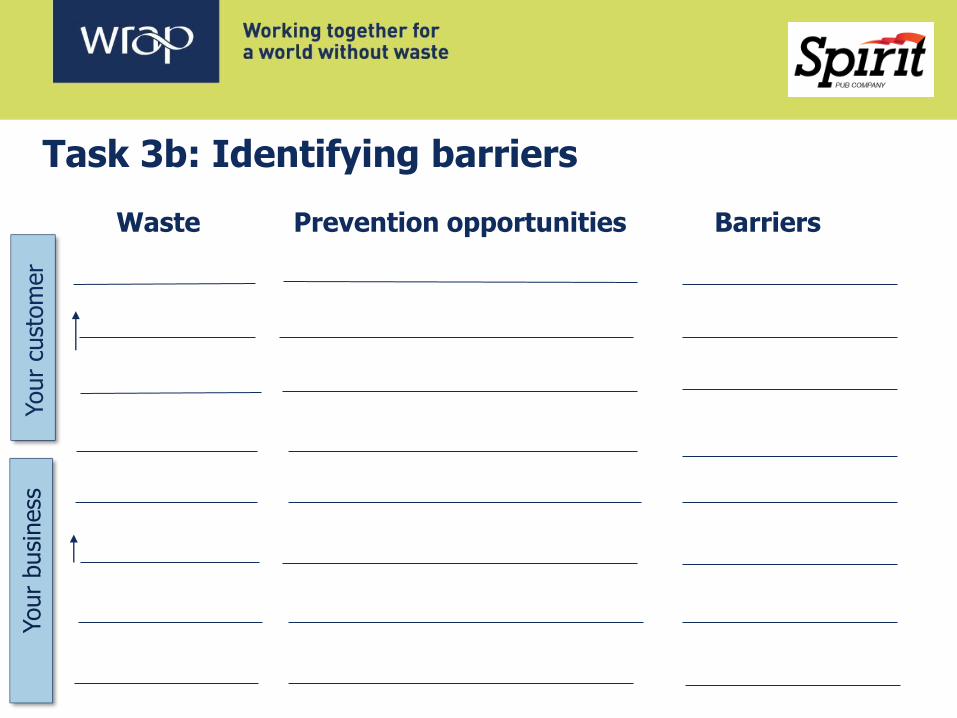
Waste Prevention opportunities Barriers
Task 3b: Identifying barriers
Your
busi
ness
Your
cust
om
er
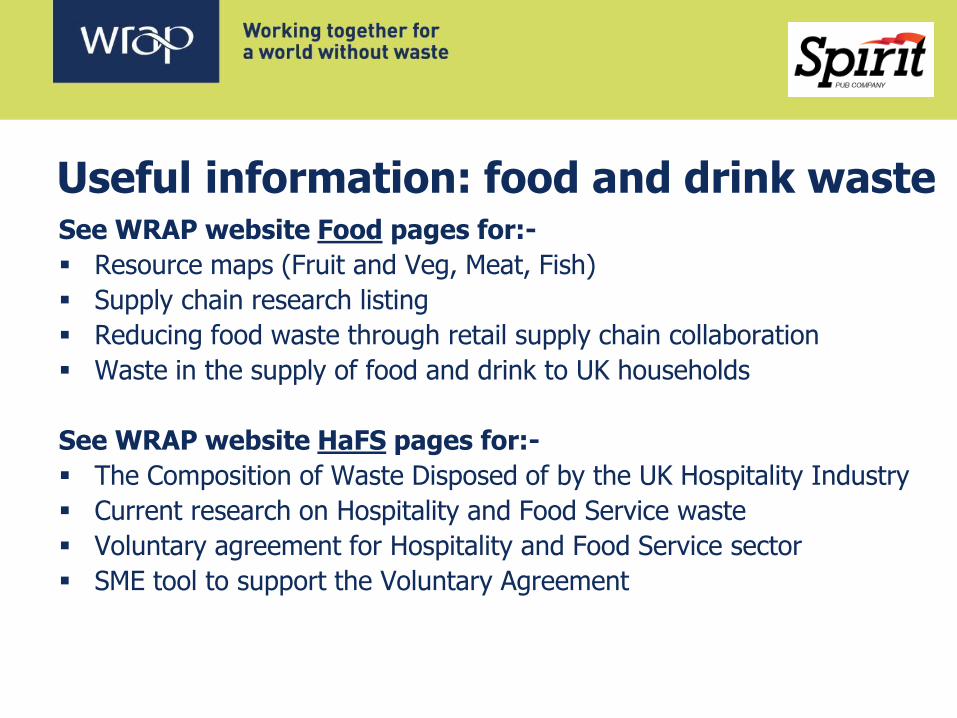
Useful information: food and drink waste See WRAP website Food pages for:-
Resource maps (Fruit and Veg, Meat, Fish)
Supply chain research listing
Reducing food waste through retail supply chain collaboration
Waste in the supply of food and drink to UK households
See WRAP website HaFS pages for:-
The Composition of Waste Disposed of by the UK Hospitality Industry
Current research on Hospitality and Food Service waste
Voluntary agreement for Hospitality and Food Service sector
SME tool to support the Voluntary Agreement
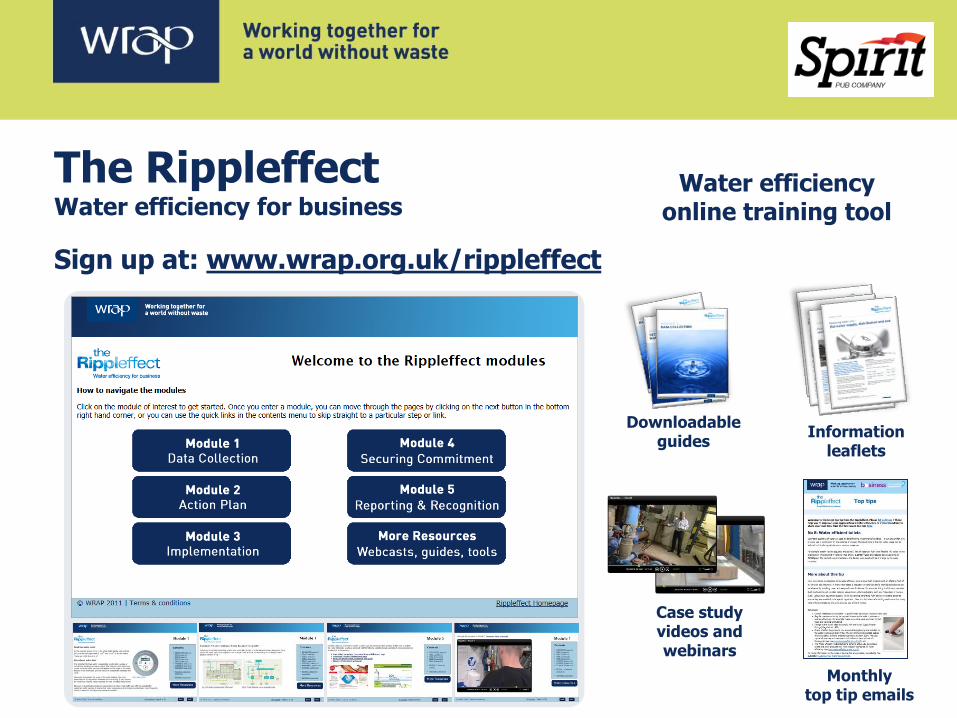
The Rippleffect Water efficiency for business
Sign up at: www.wrap.org.uk/rippleffect
Information leaflets
Monthly top tip emails
Downloadable guides
Case study videos and webinars
Water efficiency online training tool
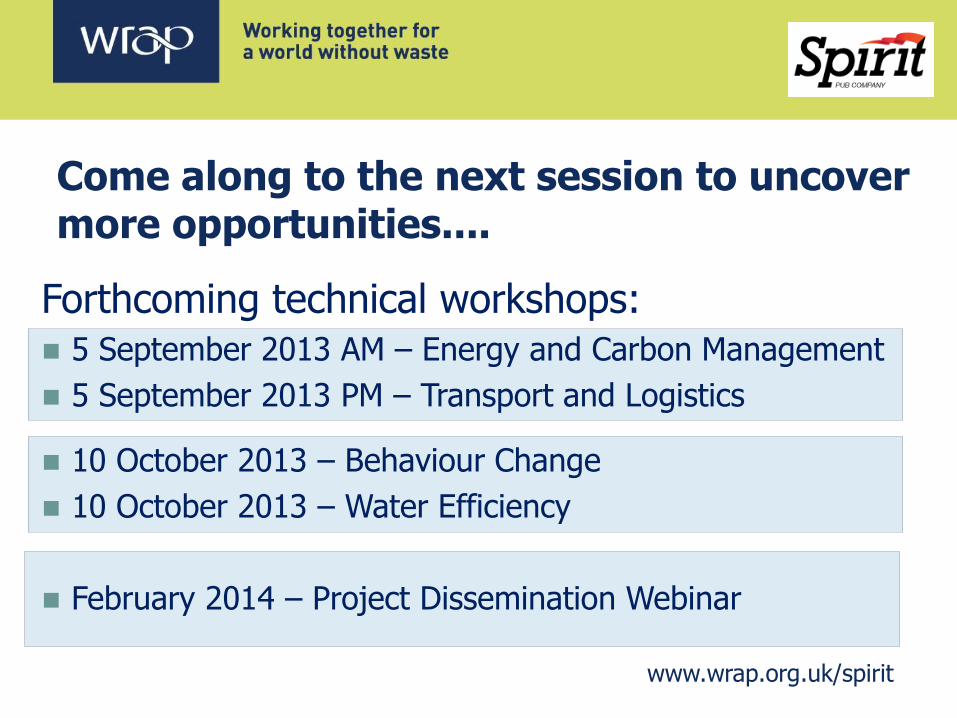
Come along to the next session to uncover more opportunities....
Forthcoming technical workshops:
5 September 2013 AM – Energy and Carbon Management
5 September 2013 PM – Transport and Logistics
10 October 2013 – Behaviour Change
10 October 2013 – Water Efficiency
February 2014 – Project Dissemination Webinar
www.wrap.org.uk/spirit
Any Questions ?
![Welcome [software.utah.edu]...3. Legen Sie fest, wie Updates verwaltet werden sollen. Verfügbare Optionen: • Updates sind deaktiviert. • Updates werden von einem internen Adobe](https://static.fdocuments.net/doc/165x107/5f6771c789421702ce67bf92/welcome-3-legen-sie-fest-wie-updates-verwaltet-werden-sollen-verfgbare.jpg)