WEEKLY SHIPPING MARKET REPORT -...
18
WEEKLY SHIPPING MARKET REPORT WEEK 8 - 20 th February – to 24 th February 2012 - Legal Disclamer The information contained herein has been obtained by various sources. Although every effort has been made to ensure that this information is accurate, complete and up to date, Shiptrade Services S.A. does not accept any responsibility whatsoever for any loss or damage occasioned or claimed, upon reliance on the information, opinions and analysis contained in this report. Researched and compiled by: Shiptrade Services SA, Market Research on behalf of the Sale & Purchase, Dry Cargo Chartering and Tanker Chartering Departments. For any questions please contact: [email protected] Shiptrade Services SA Tel +30 210 4181814 [email protected] 1st Floor, 110/112 Notara Street Fax +30 210 4181142 [email protected] 185 35 Piraeus, Greece www.shiptrade.gr [email protected]
-
Upload
duongxuyen -
Category
Documents
-
view
239 -
download
19
Transcript of WEEKLY SHIPPING MARKET REPORT -...
WEEKLY SHIPPING
MARKET REPORT WEEK 8
- 20th February – to 24th February 2012 -
Legal Disclamer
The information contained herein has been obtained by various sources. Although every effort has been made to ensure that this information is accurate, complete and up to date, Shiptrade Services S.A. does not accept any responsibility whatsoever for any loss or damage occasioned or claimed, upon reliance on the information, opinions and analysis contained in this report.
Researched and compiled by: Shiptrade Services SA, Market Research on behalf of the Sale & Purchase, Dry Cargo Chartering and Tanker Chartering Departments. For any questions please contact: [email protected]
Shiptrade Services SA Tel +30 210 4181814 [email protected] 1st Floor, 110/112 Notara Street Fax +30 210 4181142 [email protected] 185 35 Piraeus, Greece www.shiptrade.gr [email protected]

1
RBCT coal terminal expansion to 100 million tonne likely
Major South African coal producers that own shares in the Richards Bay Coal Terminal may invest to expand the terminal to handle up to 100 million tonnes of coal a year. Mr Mxolisi Mgojo head of Exxaro's coal unit said that coal miners had been surprised by the improved rate at which logistics group Transnet transported their coal via rail to the port in the second half of last year. While Transnet's volumes are still below the terminal's annual capacity of 91 million tonnes, the transport group has been quickly catching up. Mr Mgojo said that "The pressure is back on us as RBCT shareholders to say, beyond 91 million tonnes what can we do? We need to get to at least 100 million tonnes.” He said the expansion would depend on the timing of Transnet's upgrades on the coal export line. For years miners had blamed Transnet for failing to improve much-needed infrastructure, but the group has put money into new wagons and locomotives and plans to build a line via Swaziland, which would ease congestion on the main coal export line and raise capacity to close to 100 million tonnes. Exxaro, South Africa's second-largest coal producer and a big supplier to power utility Eskom, exported 4.9 million tonnes of coal last year and expects to ship 5 million in 2012. Mr Mgojo said there was more focus than ever on developing the Waterberg coal fields, seen as the next major coal hub as reserves in the Witbank area near depletion. This is after the government highlighted the project as one of its economic priorities along with the need to secure coal supplies for South African power plants, now supplying 85% of the electricity powering Africa's biggest economy. Exxaro also said it planned to more than double its capital expansion this year to ZAR 10.93 billion (USD 1.4 billion) as it seeks to diversify into other commodities such as iron ore. (Reuters)
Chinese copper concentrate imports in 2012 seen up by10pct
China's imports of copper concentrate are expected to rise by about 10% in 2012 on strong smelter demand, curbing end users' appetite for overseas purchases of the refined metal. Mr Yang Changhua senior analyst at state backed research firm Antaike said that concentrate imports would rise to an
average of about 580,000 tonnes per month this year compared to 531,000 tonnes per month in 2011. (Reuters)
Oil-Tanker Returns Slide for Third Day as Ship Surplus Persists
Returns for the largest oil tankers hauling Middle East crude to Asia fell for a third session as a surplus of ships persisted
and fuel prices rose. Daily income for very large crude carriers on the benchmark Saudi Arabia-to-Japan route slid 1.6 percent to $13,929, according to figures from the London-based Baltic Exchange today. That pared the gain from the start of the year to 13
percent. Each VLCC can hold 2 million barrels of oil. The number of ships available to load cargoes in the Persian Gulf over the next four weeks was unchanged, according to Kevin Sy, a Singapore-based freight-derivatives broker at Marex Spectron Group. Fuel (BUNKI380) prices, vessel owners’ main expense, are at the highest level since at least October 2008, figures collected by Bloomberg from 25 ports
worldwide show. “Despite more action at the end of the week, there were also more ships added to the 4-week list, hence the unchanged count,” Sy said in a report. There are 22 tankers available until
March 10 and 37 more until March 20, it showed. The exchange’s assessments of shipowners’ earnings don’t reflect speed cuts aimed at reducing fuel costs. Owners can curb those expenses, boosting returns, by slowing ships on return journeys after unloading cargoes. Fuel prices rose for
an eighth session in a row today to $728.34 a metric ton. Hire costs for VLCCs on the benchmark voyage gained 0.5 percent to 53.41 industry-standard Worldscale points, according to the exchange. That was the biggest advance
since Feb. 16, the data showed. Worldscale points are a percentage of a nominal rate, or flat rate, for more than 320,000 specific routes. Flat rates for every voyage, quoted in U.S. dollars a ton, are revised annually by the Worldscale Association in London to reflect
changing fuel costs, port tariffs and exchange rates. The Baltic Dirty Tanker Index, a broader measure of oil- shipping costs that includes vessels smaller than VLCCs,
declined 0.3 percent to 796, the lowest level since Feb. 14. (Bloomberg)
Shipping , Commodities & Financial News

2
In Brief: Market had some positive signs on certain routes but in general the sentiment was not positive with the BDI increasing only one point to 718.
Capes: A better week for the capes with rates slightly rising The market moved upwards due to more cargo volume with the average of the four T/C Routes closing at USD 5,996 , a USD 413 increase. The T/A round remained at below USD 5,000 levels as there are still plenty of vessels available at the region while only the fronthaul trips showed some movement with rates rising up a bit. In the Pacific, Australian majors are still able to fix tonnage at USD 1-2.000 on t/c equivalent as owners have already been spot for many days waiting for some better rates and resisting fixing so low. If owners persist on holding this attitude the cheap tonnage will disappear pushing charterers to fix at higher levels reaching the USD 8.00 mark. On the period side rates remained at same levels around USD 12,500.
Panamax: The market had another week with declining rates Over supply of tonnage (there are approximately 2,5 Pmx vessels per cargo) has resulted in another slow week with ballasters making the situation even worse. The Transatlantic has been trading at USD 5,000 levels, declining about USD 2,000 than last week. Most spot vessels appeared at the Continent where the lack of cargoes pushed the rates downwards. The front haul was fixed at around USD 15,000, a USD 2,500 fall from last week. On the Pacific, the market showed some more positive sentiment with NOPAC rounds being fixed at better levels than last week around low USD 8,000 while Indonesian rounds were at stable levels of USD 7,500. Market saw some movement on short period with the average rates to conclude at USD 10.500.
Supramax: Another week with low rates but with some more fixtures
Atlantic was relatively stable with physical market keeping same levels than last week and indices slightly dropping. The Transatlantic round was being fixed at around USD 10,000 levels with ex USG trips holding up while Continent and Med were short of cargoes, even fertilizers and scrap, and very low on rates. The fronthaul trips ex USG were paying upper teens while ex ECSA low teens and bb. In the Pacific we saw another positive week mainly due to the increased volume of Indonesian nickel ore. Owners avoided the back haul trips since Atlantic is not in good mood and preferred to take short duration trips to SEASIA/CHINA range for low/mid teens while NOPAC round was fixed at USD 8,500. The most problematic area was West Coast of India with iron ore running low and few trips to china being done at USD 10,000. Owners were reluctant to fix their vessels on period for less than 5 digits levels which could not be met by charterers. Handysize: Once more the week followed a stable but low rate pattern In the Atlantic, over supply of tonnage remained and low cargo volume, as the ECSA season is not there yet, continued to generate low levels for the vessels competing. The negative sentiment kept on with the TA round ending up slightly better than last week at USD 5,000. Trips ex MED to USG remained at extremely low levels, even without hire on some occasions, while the front haul trips were paying around USD 12,500. In spite that fact most owners insisted to keep their vessels trading in Atlantic as the back haul trips remained at zero up to USD 2.000 paying levels. In the pacific we saw some movement mainly on the nickel ore side and the sulphur ex Iran to Far East. The round trip was at USD 4,000 and the sentiment is negative for the upcoming week as well. Vessels open at PG and India continued to suffer with most movement and somehow better rates to be seen for trips with sulphur ex Iran to China. At East Coast of India there was massacre with very few orders, many open vessels resulting to exceptionally low numbers. Period levels were around USD 9,000 with owners refraining from fixing.
Dry Bulk - Chartering

3
Baltic Indices – Dry Market (*Friday’s closing values)
Index Week 8 Week 7 Change (%) BDI 718 717 0,14
BCI 1504 1461 2,94
BPI 836 949 -11,91
BSI 662 641 3,28
BHSI 395 379 4,22
T/C Rates (1 yr - $/day)
Type Size Week 8 Week 7 Change (%)
Capesize 160 / 175,000 12500 13500 -7,41
Panamax 72 / 76,000 11000 11250 -2,22
Supramax 52 / 57,000 11750 10200 15,20
Handysize 30 / 35,000 9100 9100 0,00
Average Spot Rates
Type Size Route Week 8 Week 7 Change %
Capesize 160 / 175,000
Far East – ATL -7700 -7700 -
Cont/Med – Far East 20800 19500 6,67
Far East RV 5600 4700 19,15
TransAtlantic RV 4500 4600 -2,17
Panamax 72 / 76,000
Far East – ATL -230 -150 -
ATL / Far East 14300 16500 -13,33
Pacific RV 8100 7600 6,58
TransAtlantic RV 4400 6300 -30,16
Supramax 52 / 57,000
Far East – ATL 2900 2000 45,00
ATL / Far East 12100 11800 2,54
Pacific RV 8100 7500 8,00
TransAtlantic RV 5000 6000 -16,67
Handysize 30 / 35,000
Far East – ATL 3800 3700 2,70
ATL / Far East 12600 12500 0,80
Pacific RV 4000 4000 0,00
TransAtlantic RV 5100 4800 6,25
Dry Bulk - Chartering

4
ANNUAL
DECEMBER 2011 – FEBRUARY 2012
Dry Bulk - Chartering
5
Dry Bulk - Chartering
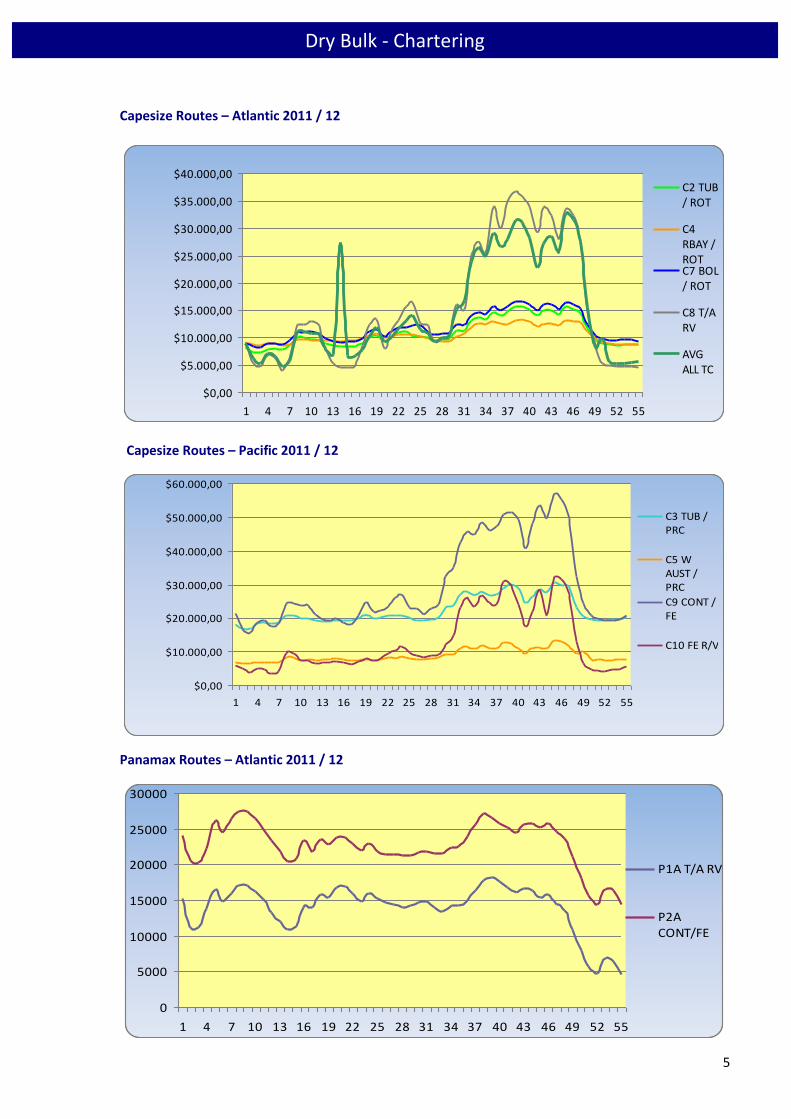
Capesize Routes – Atlantic 2011 / 12
$0,00
$5.000,00
$10.000,00
$15.000,00
$20.000,00
$25.000,00
$30.000,00
$35.000,00
$40.000,00
1 4 7 10 13 16 19 22 25 28 31 34 37 40 43 46 49 52 55
C2 TUB/ ROT
C4RBAY /ROTC7 BOL/ ROT
C8 T/ARV
AVGALL TC
Capesize Routes – Pacific 2011 / 12
$0,00
$10.000,00
$20.000,00
$30.000,00
$40.000,00
$50.000,00
$60.000,00
1 4 7 10 13 16 19 22 25 28 31 34 37 40 43 46 49 52 55
C3 TUB /PRC
C5 WAUST /PRC
C9 CONT /FE
C10 FE R/V
Panamax Routes – Atlantic 2011 / 12
0
5000
10000
15000
20000
25000
30000
1 4 7 10 13 16 19 22 25 28 31 34 37 40 43 46 49 52 55
P1A T/A RV
P2ACONT/FE

6
Dry Bulk - Chartering
Panamax Routes – Pacific 2011 /12
-$5.000,00
$0,00
$5.000,00
$10.000,00
$15.000,00
$20.000,00
1 4 7 10 13 16 19 22 25 28 31 34 37 40 43 46 49 52 55
P3A FE R/V
P4 FE/CON
AVG ALL TC
Supramax Routes – Atlantic 2011 /12
0
5000
10000
15000
20000
25000
30000
35000
40000
1 4 7 10 13 16 19 22 25 28 31 34 37 40 43 46 49 52 55
S1A CON / FE
S1B BSEA / FE
S4A USG /CONT
S4B CONT /USG
S5 WAFR / FE
Supramax Routes – Pacific 2011 / 12
$0,00
$2.000,00
$4.000,00
$6.000,00
$8.000,00
$10.000,00
$12.000,00
$14.000,00
$16.000,00
$18.000,00
$20.000,00
1 4 7 10 13 16 19 22 25 28 31 34 37 40 43 46 49 52 55
S2 FE R/V
S3 FE / CON
S6 FE / INDI
S7 ECI / CHI
AVG ALL TC
7
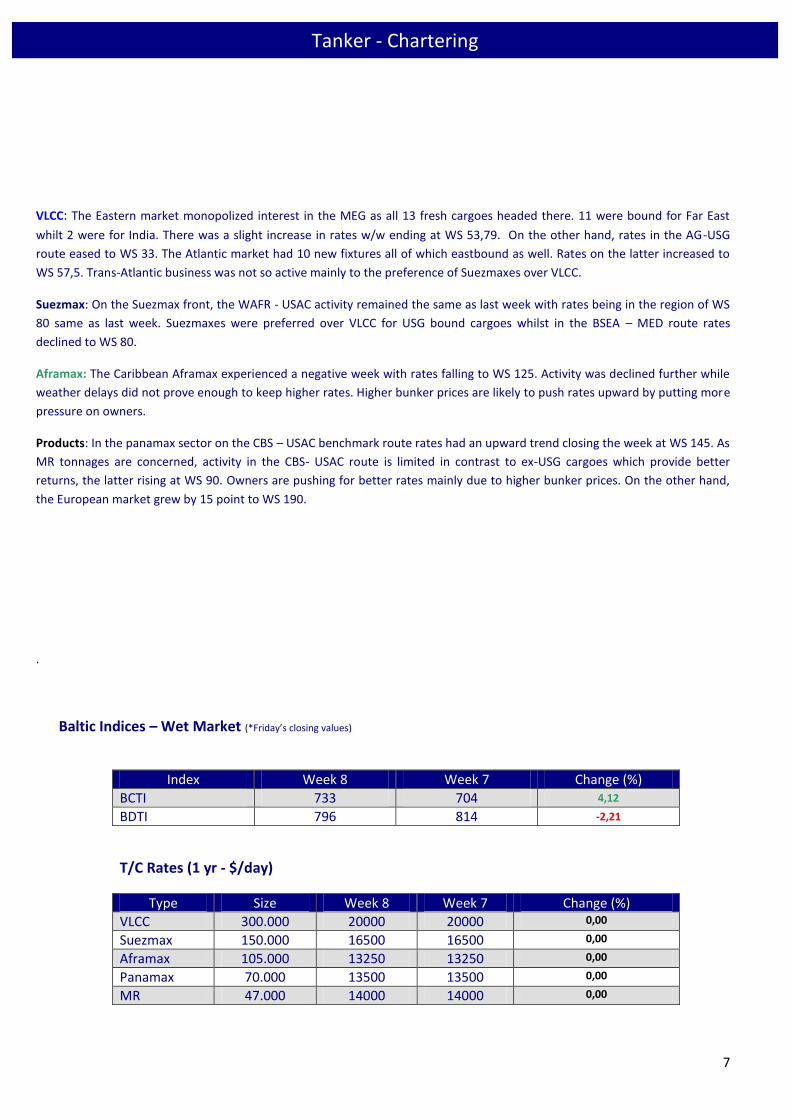
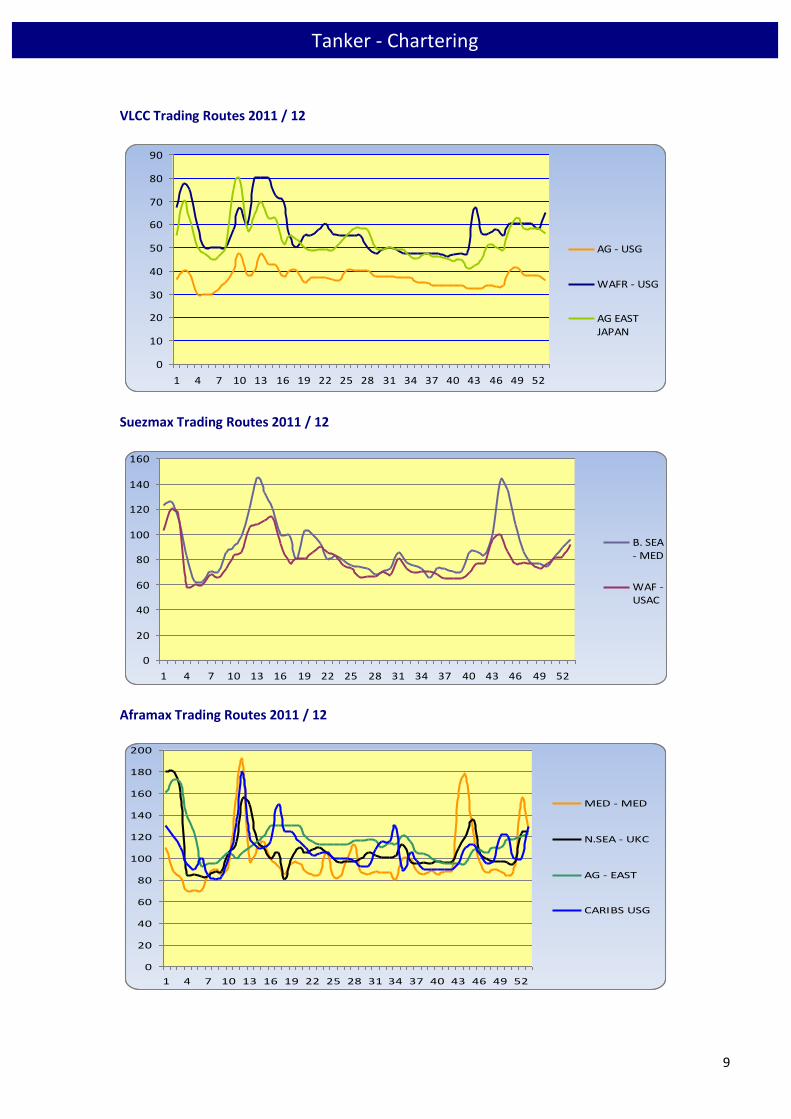
VLCC: The Eastern market monopolized interest in the MEG as all 13 fresh cargoes headed there. 11 were bound for Far East
whilt 2 were for India. There was a slight increase in rates w/w ending at WS 53,79. On the other hand, rates in the AG-USG
route eased to WS 33. The Atlantic market had 10 new fixtures all of which eastbound as well. Rates on the latter increased to
WS 57,5. Trans-Atlantic business was not so active mainly to the preference of Suezmaxes over VLCC.
Suezmax: On the Suezmax front, the WAFR - USAC activity remained the same as last week with rates being in the region of WS
80 same as last week. Suezmaxes were preferred over VLCC for USG bound cargoes whilst in the BSEA – MED route rates
declined to WS 80.
Aframax: The Caribbean Aframax experienced a negative week with rates falling to WS 125. Activity was declined further while
weather delays did not prove enough to keep higher rates. Higher bunker prices are likely to push rates upward by putting more
pressure on owners.
Products: In the panamax sector on the CBS – USAC benchmark route rates had an upward trend closing the week at WS 145. As
MR tonnages are concerned, activity in the CBS- USAC route is limited in contrast to ex-USG cargoes which provide better
returns, the latter rising at WS 90. Owners are pushing for better rates mainly due to higher bunker prices. On the other hand,
the European market grew by 15 point to WS 190.
.
Baltic Indices – Wet Market (*Friday’s closing values)
Index Week 8 Week 7 Change (%)
BCTI 733 704 4,12
BDTI 796 814 -2,21
T/C Rates (1 yr - $/day)
Type Size Week 8 Week 7 Change (%)
VLCC 300.000 20000 20000 0,00
Suezmax 150.000 16500 16500 0,00
Aframax 105.000 13250 13250 0,00
Panamax 70.000 13500 13500 0,00
MR 47.000 14000 14000 0,00
Tanker - Chartering
Tanker - Chartering

8
Crude Tanker Average Spot Rates
Type Size (Dwt) Route Week 8 WS
Week 7 WS
Change %
VLCC
280,000 AG – USG 34 33 3,03
260,000 W.AFR – USG 57,5 60 -4,17
260,000 AG – East / Japan 55 49 12,24
Suezmax 135,000 B.Sea – Med 90 80 12,50
130,000 WAF – USAC 80 77,5 3,23
Aframax
80,000 Med – Med 85 80 6,25
80,000 N. Sea – UKC 87,5 87,5 0,00
80,000 AG – East 85 85 0,00
70,000 Caribs – USG 140 130 7,69
Product Tanker Average Spot Rates
Type Size (Dwt) Route Week 8 WS
Week 7 WS
Change %
Clean
75,000 AG – Japan 85 85 0,00
55,000 AG – Japan 100 100 0,00
38,000 Caribs – USAC 145 115 26,09
37,000 Cont – TA 175 150 16,67
Dirty
55,000 Cont – TA 125 125 0,00
50,000 Caribs – USAC 140 140 0,00
Tanker - Chartering
9
VLCC Trading Routes 2011 / 12
0
10
20
30
40
50
60
70
80
90
1 4 7 10 13 16 19 22 25 28 31 34 37 40 43 46 49 52
AG - USG
WAFR - USG
AG EASTJAPAN
Suezmax Trading Routes 2011 / 12
0
20
40
60
80
100
120
140
160
1 4 7 10 13 16 19 22 25 28 31 34 37 40 43 46 49 52
B. SEA- MED
WAF -USAC
Aframax Trading Routes 2011 / 12
0
20
40
60
80
100
120
140
160
180
200
1 4 7 10 13 16 19 22 25 28 31 34 37 40 43 46 49 52
MED - MED
N.SEA - UKC
AG - EAST
CARIBS USG
Tanker - Chartering
Tanker - Chartering

10
Clean Trading Routes – 2011 / 12
0
50
100
150
200
250
300
1 4 7 10 13 16 19 22 25 28 31 34 37 40 43 46 49 52
AG - JAPAN(75,000)
AG - JAPAN(55,000)
CARIBS - USAC(38,000)
CONT - TA(37,000)
Dirty Trading Routes – 2011 / 12
0
50
100
150
200
250
1 4 7 10 13 16 19 22 25 28 31 34 37 40 43 46 49 52
CONT - TA(55,000)
CARIBS -USAC(50,000)

11
Buying interest increases
Increased activity this week for the SNP market especially in the dry sector were a handful of handies changed hands.
Prices continue to be fragile, reaching new lows and wondering where the bottom may be.
A number of owners considering selling their tonnages are now starting to hold their horses instead of facing current
values.
In Shiptrade’s enquiry index Handymaxes and Panamaxes were the main focus in the dry sector. In the tanker activity was
very low with MR monopolizing buying interest.
Japanese owners M/V “Mineral Star” (76,286 DWT built in 2005 in Tsuneishi, JPN) is reported sold to Greek buyers for USD
21,6 Mill.
M/V “Ken Ann Maru” (32,115 DWT built in 1997 in Onomichi, JPN) was reported sold for USD 9,6 Mill to Greek buyers. The
price is a new low for the sector, which so far was less fluctuative.
Greek buyers are also reported to be behind the acquisition of M/V “Diamond Glory” (28,515 DWT built in 1997 in
Tsuneishi, JPN) for USD 9, 1 Mill. The vessel was reported sold in the beginning of the year for USD 10,5 Mil..
In the tanker sector the most significant fixation was that of stainless steel chemical tanker M/T “Oak Galaxy” (19,997 DWT
built in 2005 in Shin Kurushima, JPN) which was reported sold for USD 19 Mill to Singaporean buyers.
NEWBUILDNGS
In the newbuilding market, we have seen 6 vessels reported to have been contracted.
6 Bulk Carriers (Kamsarmax & Capesize)
DEMOLITION
The market in Bangladesh continues to be weak with only a few buyers having the ability to acquire LC’s. In India buyers
are being picky with the oversupply of tonnage for demolition not leaving any space for improvement in prices. Pakistan
has availability and ability to purchase tonnage, especially tankers with some VLCC’s being committed by the end of the
week. The Chinese market had absorbed a fair share of tonnage, although many Chinese owners negotiated directly with
the yards.
Sale & Purchase
12
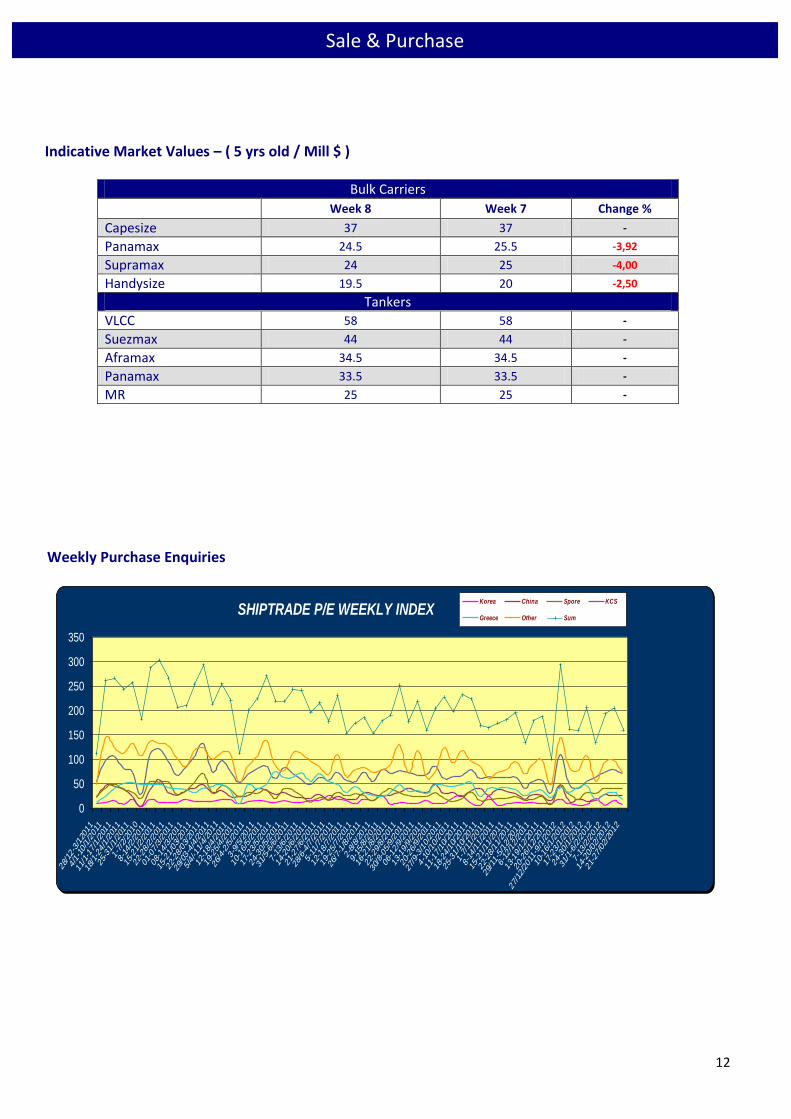
Indicative Market Values – ( 5 yrs old / Mill $ )
Bulk Carriers
Week 8 Week 7 Change %
Capesize 37 37 -
Panamax 24.5 25.5 -3,92
Supramax 24 25 -4,00
Handysize 19.5 20 -2,50
Tankers
VLCC 58 58 -
Suezmax 44 44 -
Aframax 34.5 34.5 -
Panamax 33.5 33.5 -
MR 25 25 -
Weekly Purchase Enquiries
SHIPTRADE P/E WEEKLY INDEX
0
50
100
150
200
250
300
350
28/12
-3/120
11
4/1-10/1/2011
11/1-17/1/201
1
18/1-24/1/201
1
25-31/1/201
1
1-7/2/2010
8-14/2/2011
15-21/2/201
1
22-28/2/201
1
01-07/3/201
1
08-14/3/201
1
15-21/03/20
11
22-28/03/20
11
29/03
-4/4/201
1
5/4/-11/4/20
11
12-18/4/201
1
19-25/4/201
1
26/4-2/5/2011
3-9/5/2011
10-16/5/201
1
17-23/5/201
1
24-30/5/201
1
31/5-6/6/2011
7-13/6/2011
14-20/6/201
1
21-27/6/201
1
28/6-4/7/2011
5-11/7/2011
12-18/7/201
1
19-25/7/201
1
26/7-1/8/2011
2-8/8/2011
9-15/8/2011
16-21/8/201
1
22-29/8/201
1
30/8-05/9/201
1
06-12/9/201
1
13-19/9/201
1
20-26/9/201
1
27/9-3/10/201
1
4-10/10/201
1
11-17/10/20
11
18-24/10/20
11
25-31/10/20
11
1-7/11/2011
8-14/11/201
1
15-21/11/20
11
22-28/11/20
11
29/11
-5/12/20
11
6-12/12/201
1
13-19/12/20
11
20-26/12/20
11
27/12
/2011
-9/1/2012
10-16/1/201
2
17-23/1/201
2
24-30/1/201
2
31/1-6/2/2012
7-13/2/2012
14-20/02/20
12
21-27/02/20
12
Korea China Spore KCS
Greece Other Sum
Sale & Purchase

13
Reported Second-hand Sales
Bulk Carriers Name Dwt DoB Yard SS Engine Gear Price Buyer
Mineral Star 76.286 2005 Tsuneishi, JPN 10/2014 B&W - 21.6 mill Greeks
Labro 41.093 1984 Oshima, JPN 03/2015 Sulzer 4 X 25 T 3.8 mill Undisclosed
Aladdin Rainbow 32.260 1999 Kanda, JPN 03/2014 Mit 4 X 30 T 10.5 mill Undisclosed
Ken Ann Maru 32.115 1997 Onomichi, JPN 07/2012 Mit 4 X 30 T 9.6 mill Greeks
Diamond Glory 28.515 1997 Tsuneishi, JPN 08/2012 B&W 4 X 30 T 9.1 mill Greeks
Tankers Name Dwt DoB Yard SS Engine Hull Price Buyer
Oak Galaxy 19.997 2005 Kurushima, JPN 05/2015 Mit DH 19 mill Singapore
Sale & Purchase

14
Newbuilding Orders
No Type Dwt / Unit Yard Delivery Owner Price 2 BC 209.000 Universal 2014 Kawasaki Kissen -
2 BC 209.000 Universal 2014 NYK -
2 BC 82.000 Oshima 2013 Nisshin Kaiun -
Newbuilding Prices (Mill $) – Japanese/ S. Korean Yards
Newbuilding Resale Prices
Bulk Carriers
Capesize 45 45
Panamax 31 32
Supramax 30 31
Handysize 23 22
Tankers
VLCC 93 85
Suezmax 60 58
Aframax 48 45
Panamax 41 48
MR 34 35
Newbuilding Resale Prices
Bulk Carriers (2008 – Today) Tankers (2008 – Today)
Newbuildings
15
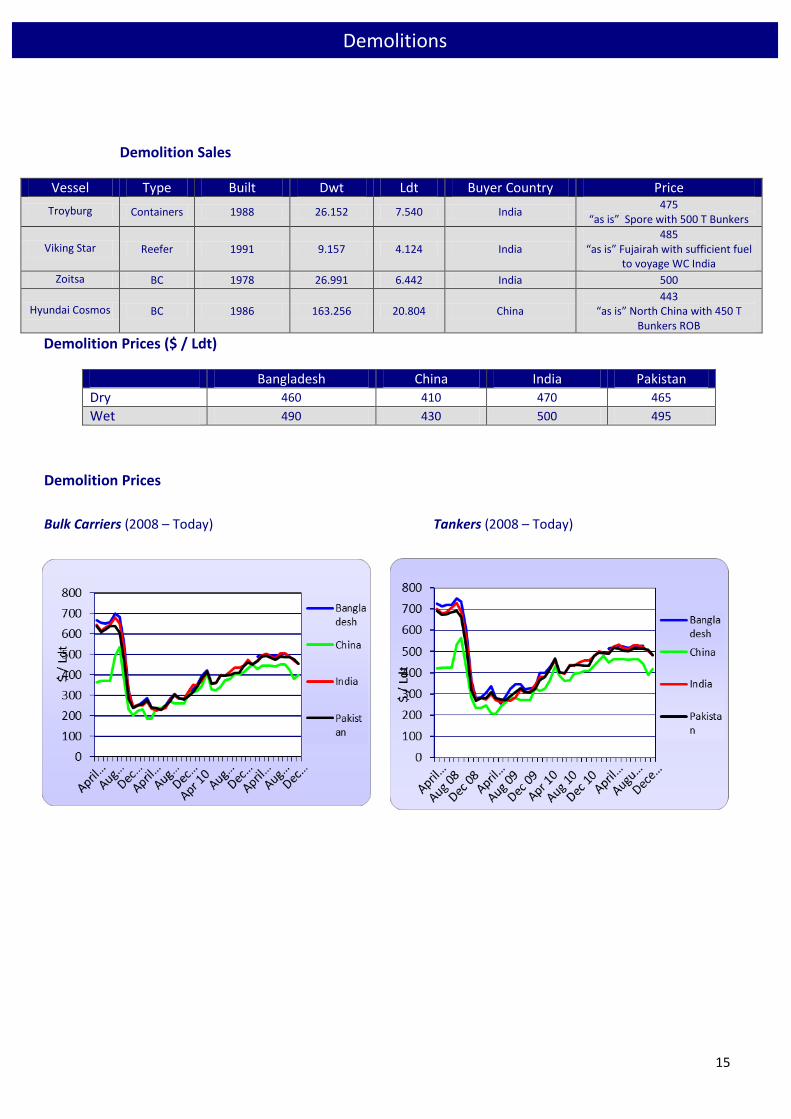
Demolition Sales
Vessel Type Built Dwt Ldt Buyer Country Price
Troyburg Containers 1988 26.152 7.540 India 475
“as is” Spore with 500 T Bunkers
Viking Star Reefer 1991 9.157 4.124 India 485
“as is” Fujairah with sufficient fuel to voyage WC India
Zoitsa BC 1978 26.991 6.442 India 500
Hyundai Cosmos BC 1986 163.256 20.804 China 443
“as is” North China with 450 T Bunkers ROB
Demolition Prices ($ / Ldt)
Bangladesh China India Pakistan
Dry 460 410 470 465
Wet 490 430 500 495
Demolition Prices
Bulk Carriers (2008 – Today) Tankers (2008 – Today)
Demolitions

16
Shipping Stocks
Commodities
Commodity Week 8 Week 7 Change (%) Brent Crude (BZ) 123 121 1,65
Natural Gas (NG) 2,53 2,64 -4,17
Gold (GC) 1779 1761 1,02
Copper (LME) 3,82 3,73 2,41
Wheat (W) 277 271 2,21
Dry Bulk
Company Stock Exchange Week 8 Week 7 Change % Baltic Trading Ltd (BALT) NYSE 4,49 4,48 0,22
Diana Shipping Inc (DSX) NASDAQ 9,22 9,71 -5,05
Dryships Inc (DRYS) NASDAQ 3,62 3,71 -2,43
Euroseas Ltd (ESEA) NASDAQ 2,95 2,98 -1,01
Excel Maritime Carriers (EXM) NYSE 1,97 2,08 -5,29
Eagle Bulk Shipping Inc (EGLE) NASDAQ 1,88 2,01 -6,47
Freeseas Inc (FREE) NASDAQ 1,22 1,71 -28,65
Genco Shipping (GNK) NYSE 7,00 8,78 -20,27
Navios Maritime (NM) NYSE 3,88 4,19 -7,40
Navios Maritime PTN (NMM) NYSE 16,09 16,31 -1,35
Paragon Shipping Inc (PRGN) NASDAQ 0,92 0,92 0,00
Star Bulk Carriers Corp (SBLK) NASDAQ 0,97 0,97 0,00
Seanergy Maritime Holdings Corp (SHIP) NASDAQ 3,95 3,38 16,86
Safe Bulkers Inc (SB) NYSE 7,28 7,65 -4,84
Golden Ocean Oslo Bors (NOK) 5,17 5,58 -7,35
Tankers Capital Product Partners LP (CPLP) NASDAQ 7,76 7,74 0,26
Omega Navigation Enterprises (ONAV) NASDAQ 0,18 0,18 0,00
TOP Ships Inc (TOPS) NASDAQ 3,03 2,25 34,67
Tsakos Energy Navigation (TNP) NYSE 6,56 6,63 -1,06
Other Aegean Maritime Petrol (ANW) NYSE 7,22 6,28 14,97
Danaos Corporation (DAC) NYSE 4,27 4,17 2,40
StealthGas Inc (GASS) NASDAQ 4,77 4,64 2,80
Rio Tinto (RTP) NYSE 58,29 57,90 0,67
Vale (VALE) NYSE 25,69 24,98 2,84
ADM Archer Daniels Midland (ADM) NYSE 31,96 31,35 1,95
BHP Billiton (BHP) NYSE 77,79 76,11 2,21
Financial Market Data

17
Currencies
Week 8 Week 7 Change (%) EUR / USD 1,33 1,31 1,53
USD / JPY 79,74 78,83 1,15
USD / KRW 1125 1123 0,18
USD / NOK 5,61 5,70 -1,58
Bunker Prices
IFO 380 IFO 180 MGO Piraeus 722 755 1045
Fujairah 745 769 1050
Singapore 730 740 1000
Rotterdam 700 720 1015
Houston 720 750 1055
Port Congestion*
Port No of Vessels
China Rizhao 18
Lianyungang 38
Qingdao 67
Zhanjiang 30
Yantai 25
India
Chennai 6
Haldia 25
New Mangalore 10
Kakinada 12
Krishnapatnam 11
Mormugao 11
Kandla 19
Mundra 7
Paradip 13
Vizag 44
South America
River Plate 246
Paranagua 44
Praia Mole 6
* The information above exhibits the number of vessels, of various types and sizes, that are at berth, awaiting anchorage, at
anchorage, working, loading or expected to arrive in various ports of China, India and South America during week 8 of year
2012.
Financial Market Data / Bunker Prices / Port Congestion