Weekly Outlook for Nifty and major indices
10
D ATE : 14/08/2015 W EEKLY O UTLOOK FOR N IFTY AND M AJOR I NDICES (17/08/2015 - 21/08/2015) © EquityPandit Financial Services Pvt. Ltd. | www.equitypandit.com | [email protected] Jagrut Shah Darpan Shah Sr. Research Analyst Head - Research EquityPandit Financial Services Pvt. Ltd. 305, Trinity Business Centre, L. P. Savani Road, Surat - 395009 Gujarat An ISO 9001:2008 Certified Company www.equitypandit.com
-
Upload
equitypandit -
Category
Economy & Finance
-
view
18 -
download
3
Transcript of Weekly Outlook for Nifty and major indices

DATE: 14/08/2015
WEEKLY OUTLOOK FOR
NIFTY AND
MAJOR INDICES
(17/08/2015 - 21/08/2015)
© EquityPandit Financial Services Pvt. Ltd. | www.equitypandit.com | [email protected]
Jagrut Shah Darpan Shah
Sr. Research Analyst Head - Research
EquityPandit Financial Services Pvt. Ltd.
305, Trinity Business Centre, L. P. Savani Road,
Surat - 395009
Gujarat
An ISO 9001:2008 Certified Company
www.equitypandit.com
CNX NIFTY PAGE 2
© EquityPandit Financial Services Pvt. Ltd. | www.equitypandit.com | [email protected]
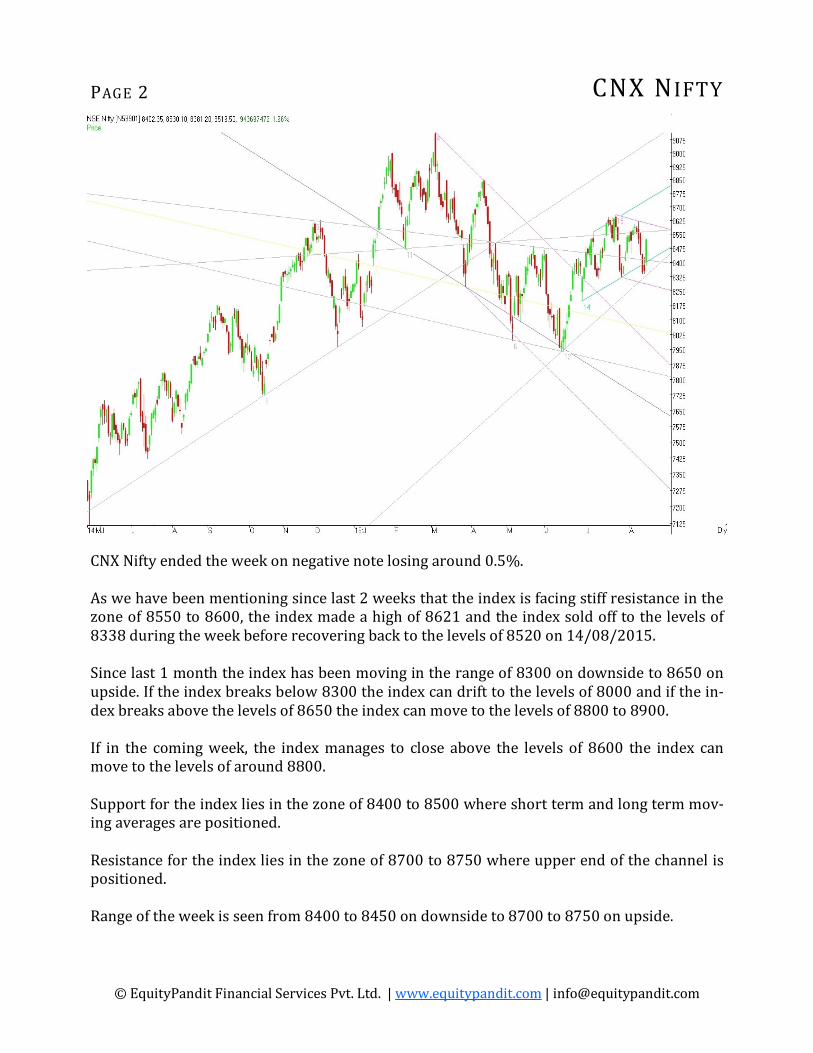
CNX Nifty ended the week on negative note losing around 0.5%.
As we have been mentioning since last 2 weeks that the index is facing stiff resistance in the
zone of 8550 to 8600, the index made a high of 8621 and the index sold off to the levels of
8338 during the week before recovering back to the levels of 8520 on 14/08/2015.
Since last 1 month the index has been moving in the range of 8300 on downside to 8650 on
upside. If the index breaks below 8300 the index can drift to the levels of 8000 and if the in-
dex breaks above the levels of 8650 the index can move to the levels of 8800 to 8900.
If in the coming week, the index manages to close above the levels of 8600 the index can
move to the levels of around 8800.
Support for the index lies in the zone of 8400 to 8500 where short term and long term mov-
ing averages are positioned.
Resistance for the index lies in the zone of 8700 to 8750 where upper end of the channel is
positioned.
Range of the week is seen from 8400 to 8450 on downside to 8700 to 8750 on upside.

PAGE 3
© EquityPandit Financial Services Pvt. Ltd. | www.equitypandit.com | [email protected]
Bank Nifty ended the week on negative note losing around 1%.
As we have been mentioning since last 2 weeks that the index is facing significant resistance
around the zone of 19100 to 19200 levels where upper end of downward sloping channel is
positioned, this week also the index has hit a high of 19070 levels and retraced back to the
levels of 18030 before closing the week around the levels of 18730.
As we have mentioned last week that if 18800 on the index is broken the index can drift to
the levels of 18650 where short term moving averages are positioned. Around the zone of
18400 - 18500 the index has major support where 100 Daily SMA and 200 Daily SMA are po-
sitioned, but the index drifted to the levels of 18000 where upwards moving trend-line was
positioned.
Support for the index lies in the zone of 18000 to 18300 where short term and long term
moving averages are positioned.
Resistance for the index lies in the zone of 19000 where downward sloping channel is posi-
tioned above which the index can move to the levels of 19500.
Range for the week is seen from 18300 to 18500 on downside to 19200 to 19500 on upside.
BANK NIFTY
PAGE 4
© EquityPandit Financial Services Pvt. Ltd. | www.equitypandit.com | [email protected]
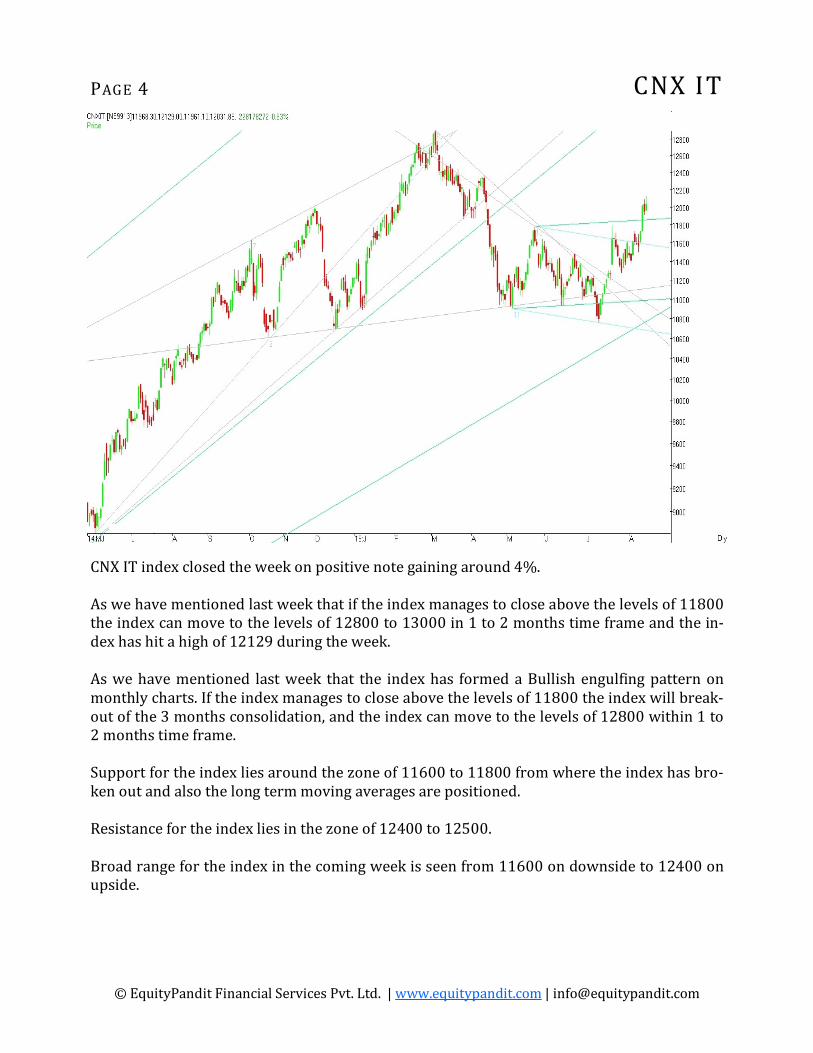
CNX IT index closed the week on positive note gaining around 4%.
As we have mentioned last week that if the index manages to close above the levels of 11800
the index can move to the levels of 12800 to 13000 in 1 to 2 months time frame and the in-
dex has hit a high of 12129 during the week.
As we have mentioned last week that the index has formed a Bullish engulfing pattern on
monthly charts. If the index manages to close above the levels of 11800 the index will break-
out of the 3 months consolidation, and the index can move to the levels of 12800 within 1 to
2 months time frame.
Support for the index lies around the zone of 11600 to 11800 from where the index has bro-
ken out and also the long term moving averages are positioned.
Resistance for the index lies in the zone of 12400 to 12500.
Broad range for the index in the coming week is seen from 11600 on downside to 12400 on
upside.
CNX IT

PAGE 5
© EquityPandit Financial Services Pvt. Ltd. | www.equitypandit.com | [email protected]
CNX FMCG index closed the week on negative note losing around 2.5%.
As we have mentioned last week that the index has formed a Doji pattern on weekly charts
indicating the indecision among the traders about the further direction of the index and the
index corrected to the levels of 20180 during the week.
The index has formed a Evening star pattern on weekly charts indicating the trend reversal
in an uptrend. The index has to move above the levels of 21000 to negate this pattern.
The index has formed a Doji on daily charts indicating the exhaustion of selling pressure. If
the index manages to close above the levels of 20500 the short term downtrend will reverse.
Support for the index lies in the zone of 20000 to 20200 where upward moving trend-line
and 100 Daily SMA are positioned.
Resistance for the index lies in the zone of 20400 where 200 Daily SMA is positioned. If the
index manages to close above the resistance zone of 20400 the index can move to the levels
of 21000.
Broad range for the index in the coming week is seen from 19800 on downside to 20800 on
upside.
CNX FMCG
PAGE 6
© EquityPandit Financial Services Pvt. Ltd. | www.equitypandit.com | [email protected]
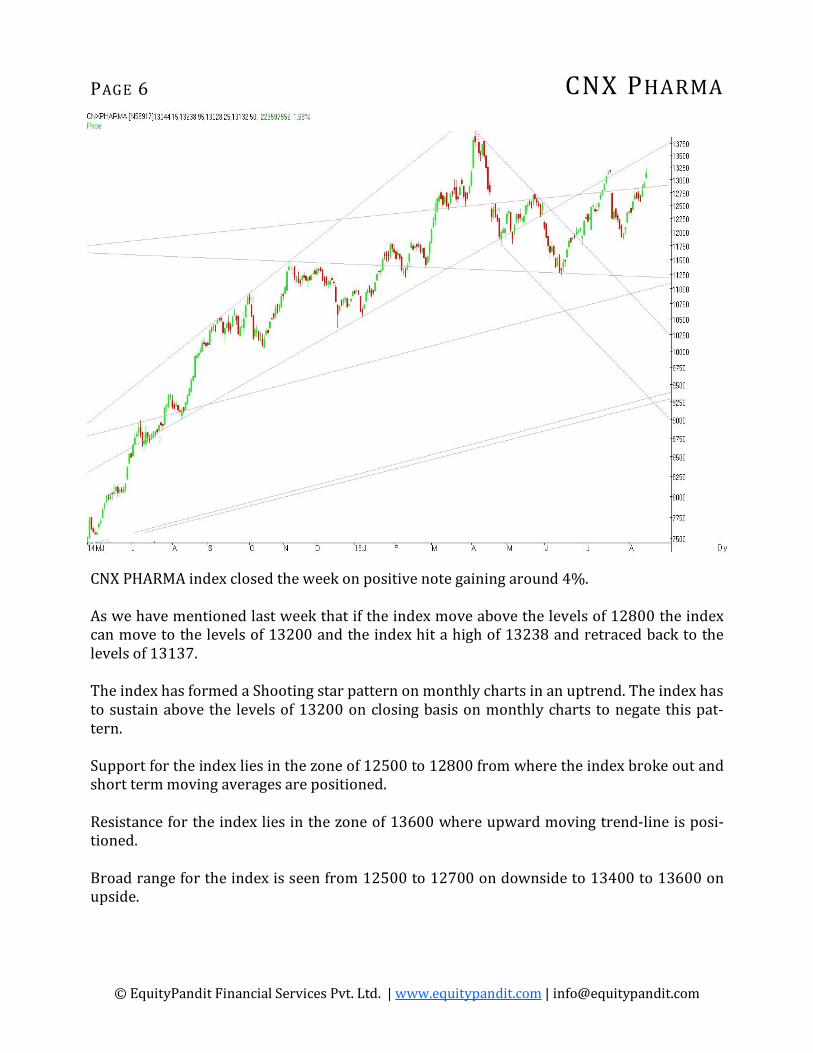
CNX PHARMA index closed the week on positive note gaining around 4%.
As we have mentioned last week that if the index move above the levels of 12800 the index
can move to the levels of 13200 and the index hit a high of 13238 and retraced back to the
levels of 13137.
The index has formed a Shooting star pattern on monthly charts in an uptrend. The index has
to sustain above the levels of 13200 on closing basis on monthly charts to negate this pat-
tern.
Support for the index lies in the zone of 12500 to 12800 from where the index broke out and
short term moving averages are positioned.
Resistance for the index lies in the zone of 13600 where upward moving trend-line is posi-
tioned.
Broad range for the index is seen from 12500 to 12700 on downside to 13400 to 13600 on
upside.
CNX PHARMA

PAGE 7
© EquityPandit Financial Services Pvt. Ltd. | www.equitypandit.com | [email protected]
CNX AUTO index closed the week on negative note losing around 2%.
As we have mentioned last week that the index has formed a Shooting star pattern on daily
charts on 07/08/2015 indicating the trend reversal in an uptrend and the index corrected to
the levels of 8400 before closing the week on 8618 levels.
The index has formed a Morning star pattern on daily charts in downtrend indicating the
trend reversal. The index managed to close above the downward sloping trend-line from
where the index had broken out last week.
Support for the index lies in the zone of 8400 to 8500 from where the index has broken out,
short term moving averages and long term moving averages are positioned around this lev-
els.
Resistance for the index lies in the zone of 8800 to 8850 above which the index can move to
the levels of 9000.
Broad range for the index is seen from 8400 to 8500 on downside to 8900 to 9000 on upside.
CNX AUTO

PAGE 8
© EquityPandit Financial Services Pvt. Ltd. | www.equitypandit.com | [email protected]
CNX ENERGY index closed the week on negative note losing around 3%.
As we have mentioned last week that the support for the index lies in the zone of 8600 below
which the index can drift to the levels of around 8100 where 1000 Daily SMA is lying and the
index hit a low of 8227 and closed the week at around the levels of 8418.
The index has formed a Morning star pattern on daily charts in an downtrend indicating the
trend reversal.
The index has formed a Shooting Star pattern on monthly charts in an uptrend indicating the
trend reversal. The index has to close above the levels of 9000 to negate bearish pattern on
monthly charts.
Support for the index lies in the zone of 8100 to 8200 where 1000 Daily SMA and 200
Weekly SMA are positioned.
Resistance for the index lies in the zone of 8500 to 8600 where downward sloping trend-line
and 100 & 500 Daily SMA are positioned.
Broad range for the index is seen between 8100 to 8200 on downside to 8600 to 8650 on up-
side.
CNX ENERGY

PAGE 9
© EquityPandit Financial Services Pvt. Ltd. | www.equitypandit.com | [email protected]
About EquityPandit
EquityPandit was established in year 2005. Today, EquityPandit is one of
the Leading Equity Research Company in India, with around 33400 active
subscribers around the globe, who enjoy huge profits in association with
EquityPandit.
We have been in this industry for a LONG time. In fact, we were among the
First few Indian entities in the Advisory domain to venture onto the Inter-
net.
Today, we have subscribers... in 32 countries worldwide who trust us!
We are an ISO Certified company for quality of our services.
We were the First Company to bring research and advisory based on Tech-
nical analysis on internet in India, until then, only investment research
was available on internet in India.
Disclaimer:
The recommendations made herein do not constitute an offer to sell or a solicitation to buy any of the securities
mentioned. No representations can be made that the recommendations contained herein will be profitable or
that they will not result in losses. Readers using the information contained herein are solely responsible for
their actions. Information is obtained from sources deemed to be reliable but is not guaranteed as to accuracy
and completeness. Minimum amount mentioned here depends upon stock prices and market conditions and
will vary accordingly.

PAGE 10
© EquityPandit Financial Services Pvt. Ltd. | www.equitypandit.com | [email protected]
EquityPandit Premium Services
EP-F&O Special is EquityPandit’s huge profits generating package. In this service we provide you with an ex-
cellent F&O calls in equity and Indexes like Nifty and bank Nifty. This service is basically for F&O Traders. Here
you will receive 2-4 calls daily. Huge profits are earned every month.
In this package we provide huge profits every month on consistent basis. Our subscribers earn huge profits every month.
Know more about EP-F&O Special package
EP-Basic is Intraday Package which is meant for intraday traders. Calls are provided live during market hours
by SMS. 2-3 Intraday calls are given within a day. EquityPandit provides assured daily profits in this package i.e
everyday you would end up with profits. High accuracy of 90-95% is maintained consistently. Know more
about EP-Basic package
EP-Investor is EquityPandit's Flagship product. This package is for short term investments. Recommenda-
tions given in this package are midcap and smallcap multibaggers. Each and every call provided in this package
gives 15-25% profits in short term and most of our call gives more than 100% profits in small time duration. A
most famous and appreciated package among investors in Indian Stock Market. Know more about EP-Investor
package