
Weekly Market Report - files.irwebpage.comfiles.irwebpage.com/reports/shipping/0YgU35Tu0z...x ˜˛...
7
Broker’s insight by Nikos Papantonopoulos While China is celebrang the start of the Dragon's Year, the shipping mar- kets are wondering about the effect of an EU sancon against Iranian crude oil.IranisthefihlargestoilproduceraerSaudiArabia,Russia,Norwayand Libya giving Tehran a leading role in the Arabian Gulf area. Thus, they are threatening that if US and EU sancons come into force, they are going to close Hormuz Strait. However, if Iran doesn't carry out its threat, this is likely to favour the tanker market, as Iranian vessels would sll be banned from calling European and US ports, essenally removing them from the global trade,whileatthesamemewearegoingtoseeincreaseddemandforves- selstobeusedasstoragefacilies,ascrudeoilproduconcannotshutdown completely. In this scenario, ton-miles will remain stable (EU importers will replacetheIraniancrudewithimportsfromotherGulfcountries)theremov- alofsignificanttonnagefromthemarketisgoingtohaveaposiveeffecton freight rates. At the same me, the Iranian government will reduce the price of crude oil for Far East refineries in order to dominate the trade in this area. The strate- gic goal is to fulfil the increasing needs of Far East, aer the shi of Saudi exports to Europe. Thus, Iranian tonnage will be occupied in this trade but ton-mileswillbeslightlyreducedinrelaontotheEuropeantrade. In the worst case scenario that sancons against Iran are also applied from Far Eastern countries like Japan, then the soluon of floang storage will takeplaceasanalternave.Itmaygivebreathingspaceforthelargetankers market on top of the other market relief measures such as scrapping and layup. On the other hand, assuming that Iran carries out its threats and closes the strait,itwillhaveaseriousimpactintankermarket.Giventhat43%ofcrude oil trade passes from the Hormuz Strait, predicng its influences is a very hard task. The obvious alternave way for oil transport is the three current pipelines from the Gulf to the Red sea, which can reach a transportaon capacitylessthanahalfofthecurrentproduconlevelsinthearea.Itmeans thatinanycasewewillfaceaglobalshortageofoilproduconwhilethiswill prove to be a barrier for increasing OPEC producon levels. This therefore creates a potenal threat of sky rockeng oil prices which could even touch levelsashighasUSD200p.b. Finally, as a side effect, the product tankers market may benefit from an increase of ton-miles. This can be caused by the fact that more and more refineries will find it hard to operate at full ulizaon levels due to the diffi- cules in sourcing crude oil, meaning that a greater deal of oil products will needtobetransportedbysea. Having said that, all this is just in theory as it is difficult to tell how it will eventually all pan out and will depend greatly on if the sancons take place andwhatcourseofacontheIraniangovernmentwilltake.Asitseemshow- ever the very thought of this scenario materializing has already boosted the market increasing demand as countries aempt to increase their stock piles ofcrudeoilinordertominimiseanypotenalshortages. Chartering (Wet: Stable+ / Dry: Soer- ) The Dry bulk Index has now recorded 25 consecuve negave sessions. Things have now goen considerably difficult for most size segments while earnings are reaching close to record low levels not seen since early 2009. The next couple of days don't look like they will be any different as charters are expected to remain fairly inacve and tonnage lists are fairly swollen. The BDI closed on Tuesday (24/01/2012) closed at 807 points, a decrease of 34 points compared to Monday’s (23/01/2012) closure, and down by 167 points compared to the previ- ous Tuesday’s levels (17/01/2012). With acvity picking up for yet an- other week, large crude carriers were able to see another significant improvement in freight rates while the market is now prime for further improvement over the next couple of days. The BDTI Monday (23/01/2012),wasat805,42pointupandtheBCTIat691,adecreaseof 10pointscomparedtothepreviousMonday’slevels(16/01/2012). Sale & Purchase (Wet: Soer- / Dry: Soer- ) The market connues to remain fairly subdued, with secondhand prices connuing their drop, especially in the dry bulk market where freight rates have deteriorated considerably since early December 2011. Things areexpectedtocalmdownfurtherinthenexttwoweeksasfesviesin theFarEastintensifyfortheLunarNewYear.OntheTankersside,most notable was the sale of the “Samho Dream” (319,360dwt-blt 02 S. Ko- rea) which went to Greek buyers Embiricos for a price of $ 28.3m via auconinHongKong.Whileonthedrybulkerofinterestwasthesaleof theHandysize“Inviken”(30,070dwt-blt86Spain)whichwenttoEurope- anbuyersforareportedpriceofaround$3.9m. Newbuilding (Wet: Stable- / Dry: Stable- ) It seems that we had a slight surge in acvity this week compared to a couple of weeks back, despite being on the approach to the Lunar New Year. However things are now expected to slow down considerably as the freight market has once again deteriorated, while many of the Far Eastern yards have already wined down their markeng efforts. Even aertheFesviespass,weexpectcondionstobeconsiderablytough- er, as most owners are very worry of the opon of placing further new- building orders. At the same me however, interest in the Gas and Off- shoresectorsconnuestoholdfirmandislikelytoonceagaincoverthe biggest poron of the shipbuilders new order targets for the year. With regard to orders this week, most noteworthy reported deal was that made by Russian buyers for two firm Handysize (35,000dwt) bulkers at China’sQingshanShipyardforanundisclosedprice. Demolion (Wet: Firm+ / Dry: Firm+ ) With senment improving rapidly and all four major markets showing increased appete to secure candidates, offered price levels improved for yet another week. All this improved senment seemed to have even sparked a lot of speculave buying from Pakistani and Indian breakers. At the same me China has also showed a firmer approach and we will likely see prices increase there as well over the coming days closing the price gap further between them and the Indian Sub-connent. Offered Prices have firmed somewhat this week, with wet tonnages rising to around440-500$/ldtanddryunitsincreasingtoabout420-475$/ldt. Weekly Market Report Week03|Tuesday24thJanuary2012
Transcript of Weekly Market Report - files.irwebpage.comfiles.irwebpage.com/reports/shipping/0YgU35Tu0z...x ˜˛...

Broker’s insight
by Nikos Papantonopoulos
While China is celebra�ng the start of the Dragon's Year, the shipping mar-
kets are wondering about the effect of an EU sanc�on against Iranian crude
oil. Iran is the fi$h largest oil producer a$er Saudi Arabia, Russia, Norway and
Libya giving Tehran a leading role in the Arabian Gulf area. Thus, they are
threatening that if US and EU sanc�ons come into force, they are going to
close Hormuz Strait. However, if Iran doesn't carry out its threat, this is likely
to favour the tanker market, as Iranian vessels would s�ll be banned from
calling European and US ports, essen�ally removing them from the global
trade, while at the same �me we are going to see increased demand for ves-
sels to be used as storage facili�es, as crude oil produc�on cannot shut down
completely. In this scenario, ton-miles will remain stable (EU importers will
replace the Iranian crude with imports from other Gulf countries) the remov-
al of significant tonnage from the market is going to have a posi�ve effect on
freight rates.
At the same �me, the Iranian government will reduce the price of crude oil
for Far East refineries in order to dominate the trade in this area. The strate-
gic goal is to fulfil the increasing needs of Far East, a$er the shi$ of Saudi
exports to Europe. Thus, Iranian tonnage will be occupied in this trade but
ton-miles will be slightly reduced in rela�on to the European trade.
In the worst case scenario that sanc�ons against Iran are also applied from
Far Eastern countries like Japan, then the solu�on of floa�ng storage will
take place as an alterna�ve. It may give breathing space for the large tankers
market on top of the other market relief measures such as scrapping and
layup.
On the other hand, assuming that Iran carries out its threats and closes the
strait, it will have a serious impact in tanker market. Given that 43% of crude
oil trade passes from the Hormuz Strait, predic�ng its influences is a very
hard task. The obvious alterna�ve way for oil transport is the three current
pipelines from the Gulf to the Red sea, which can reach a transporta�on
capacity less than a half of the current produc�on levels in the area. It means
that in any case we will face a global shortage of oil produc�on while this will
prove to be a barrier for increasing OPEC produc�on levels. This therefore
creates a poten�al threat of sky rocke�ng oil prices which could even touch
levels as high as USD 200 p.b.
Finally, as a side effect, the product tankers market may benefit from an
increase of ton-miles. This can be caused by the fact that more and more
refineries will find it hard to operate at full u�liza�on levels due to the diffi-
cul�es in sourcing crude oil, meaning that a greater deal of oil products will
need to be transported by sea.
Having said that, all this is just in theory as it is difficult to tell how it will
eventually all pan out and will depend greatly on if the sanc�ons take place
and what course of ac�on the Iranian government will take. As it seems how-
ever the very thought of this scenario materializing has already boosted the
market increasing demand as countries a?empt to increase their stock piles
of crude oil in order to minimise any poten�al shortages.
Chartering (Wet: Stable+ / Dry: So�er- )
The Dry bulk Index has now recorded 25 consecu�ve nega�ve sessions.
Things have now go?en considerably difficult for most size segments
while earnings are reaching close to record low levels not seen since
early 2009. The next couple of days don't look like they will be any
different as charters are expected to remain fairly inac�ve and tonnage
lists are fairly swollen. The BDI closed on Tuesday (24/01/2012) closed
at 807 points, a decrease of 34 points compared to Monday’s
(23/01/2012) closure, and down by 167 points compared to the previ-
ous Tuesday’s levels (17/01/2012). With ac�vity picking up for yet an-
other week, large crude carriers were able to see another significant
improvement in freight rates while the market is now prime for further
improvement over the next couple of days. The BDTI Monday
(23/01/2012), was at 805, 42 point up and the BCTI at 691, a decrease of
10 points compared to the previous Monday’s levels (16/01/2012).
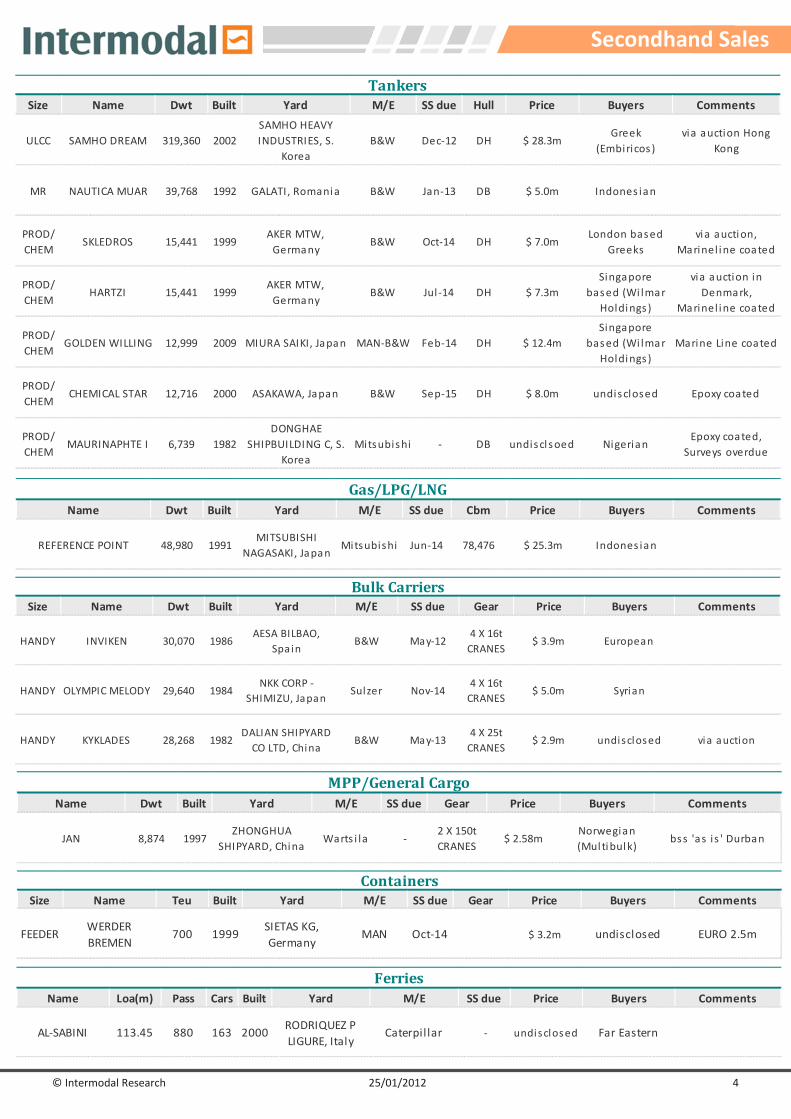
Sale & Purchase (Wet: So�er- / Dry: So�er- )
The market con�nues to remain fairly subdued, with secondhand prices
con�nuing their drop, especially in the dry bulk market where freight
rates have deteriorated considerably since early December 2011. Things
are expected to calm down further in the next two weeks as fes�vi�es in
the Far East intensify for the Lunar New Year. On the Tankers side, most
notable was the sale of the “Samho Dream” (319,360dwt-blt 02 S. Ko-
rea) which went to Greek buyers Embiricos for a price of $ 28.3m via
auc�on in Hong Kong. While on the dry bulker of interest was the sale of
the Handysize “Inviken” (30,070dwt-blt 86 Spain) which went to Europe-
an buyers for a reported price of around $ 3.9m.
Newbuilding (Wet: Stable- / Dry: Stable- )
It seems that we had a slight surge in ac�vity this week compared to a
couple of weeks back, despite being on the approach to the Lunar New
Year. However things are now expected to slow down considerably as
the freight market has once again deteriorated, while many of the Far
Eastern yards have already wined down their marke�ng efforts. Even
a$er the Fes�vi�es pass, we expect condi�ons to be considerably tough-
er, as most owners are very worry of the op�on of placing further new-
building orders. At the same �me however, interest in the Gas and Off-
shore sectors con�nues to hold firm and is likely to once again cover the
biggest por�on of the shipbuilders new order targets for the year. With
regard to orders this week, most noteworthy reported deal was that
made by Russian buyers for two firm Handysize (35,000dwt) bulkers at
China’s Qingshan Shipyard for an undisclosed price.
Demoli&on (Wet: Firm+ / Dry: Firm+ )
With sen�ment improving rapidly and all four major markets showing
increased appe�te to secure candidates, offered price levels improved
for yet another week. All this improved sen�ment seemed to have even
sparked a lot of specula�ve buying from Pakistani and Indian breakers.
At the same �me China has also showed a firmer approach and we will
likely see prices increase there as well over the coming days closing the
price gap further between them and the Indian Sub-con�nent. Offered
Prices have firmed somewhat this week, with wet tonnages rising to
around 440-500$/ldt and dry units increasing to about 420-475$/ldt.
Weekly Market Report
Week 03|Tuesday 24th January 2012

© Intermodal Research 25/01/2012 2
6080100120140160180200220240260
WS points
CLEAN - WS RATESTC2 TC4 TC6 TC1
20
40
60
80
100
120
140
160
WS points
DIRTY - WS RATESTD3 TD5 TD8 TD4
Jan-12 Dec-11 ±% 2012 2011 2010
300KT DH 63.7 58.0 9.8% 63.9 77.6 87.2
150KT DH 49.7 47.0 5.7% 49.9 54.4 62.6
105KT DH 37.7 35.4 6.4% 37.9 39.1 44.7
70KT DH 32.5 31.4 3.5% 32.8 35.2 38.8
45KT DH 26.4 25.8 2.3% 26.6 28.4 26.5
Aframax
Panamax
VLCC
Suezmax
Indicative Market Values ($ Million) - Tankers
Vessel 5yrs old
MR
Week 3 Week 2 ±% Diff 2012 2011
300k 1yr TC 19,500 19,500 0.0% 0 19,250 25,197
300k 3yr TC 26,250 25,500 2.9% 750 25,450 31,681
150k 1yr TC 16,500 16,500 0.0% 0 16,250 19,837
150k 3yr TC 20,500 20,500 0.0% 0 20,200 23,830
105k 1yr TC 14,000 14,000 0.0% 0 13,750 15,707
105k 3yr TC 16,500 16,500 0.0% 0 16,200 18,335
70k 1yr TC 13,500 13,500 0.0% 0 13,250 14,995
70k 3yr TC 14,750 14,750 0.0% 0 14,450 16,263
45k 1yr TC 14,500 14,500 0.0% 0 14,167 13,918
45k 3yr TC 15,000 15,000 0.0% 0 14,617 14,738
36k 1yr TC 12,750 12,750 0.0% 0 12,500 12,471
36k 3yr TC 13,500 13,500 0.0% 0 13,200 13,412
Panamax
MR
Handy
size
TC Rates
$/day
VLCC
Suezmax
Aframax
2012 2011
WS
points$/day
WS
points$/day $/day $/day
265k AG-JAPAN 63 43,946 53 26,335 20% 32,118 18,217
280k AG-USG 38 8,966 34 3,242 10% 4,306 2,504
260k WAF-USG 68 53,178 68 53,788 0% 48,891 25,714
130k MED-MED 90 35,623 100 44,894 -10% 42,012 25,125
130k WAF-USAC 80 21,129 95 33,292 -16% 25,782 13,373
130k AG-CHINA 85 24,057 83 21,670 3% 22,613 14,815
80k AG-EAST 110 17,092 105 14,917 5% 15,656 12,726
80k MED-MED 89 13,445 103 20,824 -13% 19,854 13,577
80k UKC-UKC 120 40,141 100 24,256 20% 31,535 18,604
70k CARIBS-USG 125 20,015 93 6,734 35% 12,581 8,240
75k AG-JAPAN 88 3,565 88 3,577 0% 5,509 10,467
55k AG-JAPAN 105 4,233 96 1,107 9% 3,213 7,768
37K UKC-USAC 165 14,832 150 11,530 10% 14,471 11,022
30K MED-MED 180 26,317 183 27,088 -1% 27,611 18,458
55K UKC-USG 118 12,811 110 10,130 7% 12,360 11,266
55K MED-USG 118 11,425 110 8,999 7% 11,184 9,676
50k CARIBS-USAC 100 4,359 105 6,158 -5% 6,659 10,700
Spot Rates
Vessel Routes
Week 3 Week 2
±%
Dir
tyA
fram
ax
Cle
an
VL
CC
Su
ezm
ax
Chartering
With demand firming considerably for yet another week, VLCC owners were
able to push for a considerable increase in freight levels. The winter weath-
er that has taken over most of the northern hemisphere has been the
source for much op�mism while fears of a poten�al price in crude oil has
mo�vated several traders to move sooner and secure quan��es at the cur-
rent going rate. Although there is li?le evidence that this can last long, we
may well see even firmer ac�vity in the coming days as Far Eastern traders
return back from their Lunar New Year Fes�vi�es.
Unlike the VLCCs, Suezmaxes have witnessed somewhat quieter market
condi�ons with a decrease in the number of fixtures being noted in both
the WAF and Black Sea/Med regions. With ac�vity remaining subdued and
tonnage lists beginning to pile up, it was inevitable that owners would slow-
ly have to step back and accept lower rates. However even a$er the recent
correc�ons, rates are s�ll holding at fairly good levels.
Aframaxes con�nued to see market condi�ons deteriorate in the Black Sea/
Med region as there was hardly any movements from charterers puSng
rates under considerable pressure once again. Things were quite different
in the North Sea, as the intense ac�vity seen there started to create a short-
age of available vessels leaving rates no choice but to head up. Similar con-
di�ons were seen in the Caribs where we also noted the largest freight rise.
Sale & Purchase
Most notable deal this week was the reported sale of the “Samho
Dream” (319,360dwt-blt 02 S. Korea) which went to Greek buyers Embiricos
for a price of $ 28.3m via auc�on in Hong Kong.
Also worth men�oning is the sale of the Product/Chemical Tanker “Golden
Willing” (12,999dwt-blt 09 Japan) which went to Singapore based Wilmar
Holdings for a price of around $ 12.4m.
Wet Market
Indicative Period Charters
- 12 mos - 'Agamemnon II' 2008 51,000dwt
- in D/C $ 14,000/day + 50/50 PS - BP
- 24 mos - 'Ayrton II' 2009 51,000dwt
- in D/C $ 14,000 - 15,000/day - BP
© Intermodal Research 25/01/2012 3
Index $/day Index $/day Index Index
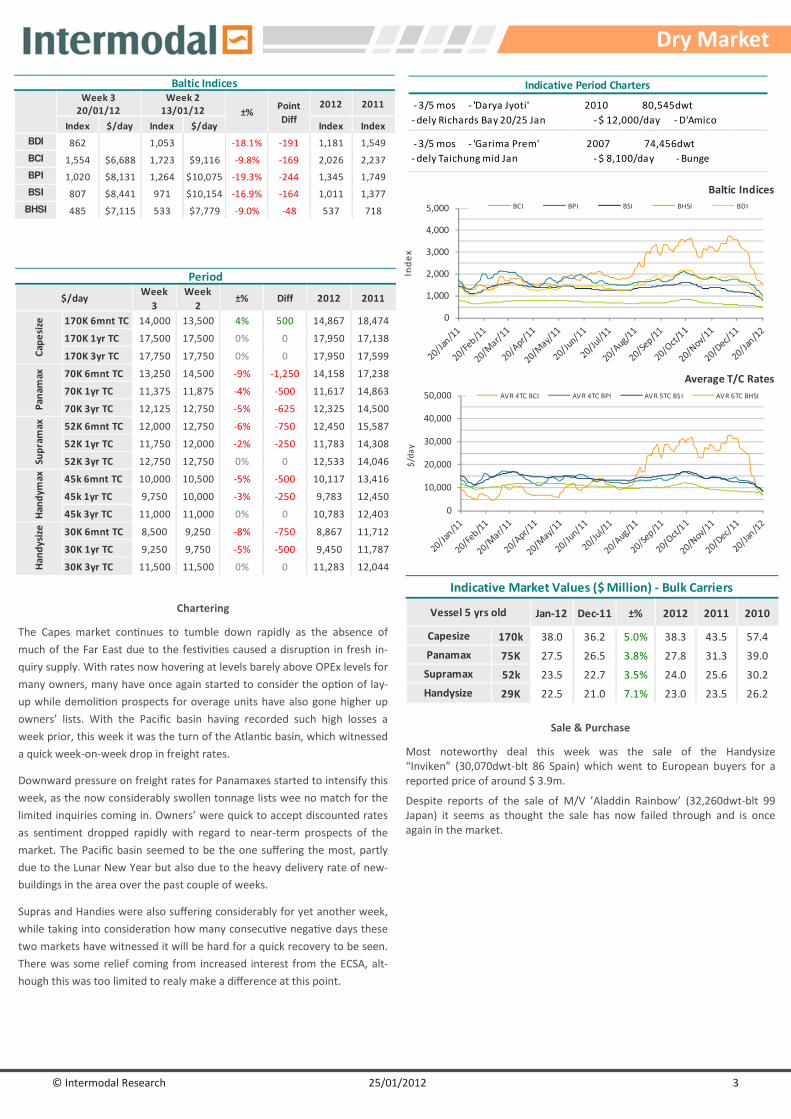
BDI 862 1,053 -18.1% -191 1,181 1,549
BCI 1,554 $6,688 1,723 $9,116 -9.8% -169 2,026 2,237
BPI 1,020 $8,131 1,264 $10,075 -19.3% -244 1,345 1,749
BSI 807 $8,441 971 $10,154 -16.9% -164 1,011 1,377
BHSI 485 $7,115 533 $7,779 -9.0% -48 537 718
20/01/12
Week 2
±%2012 2011Point
Diff13/01/12
Baltic IndicesWeek 3
0
1,000
2,000
3,000
4,000
5,000
Index
Baltic Indices
BCI BPI BSI BHSI BDI
170K 6mnt TC 14,000 13,500 4% 500 14,867 18,474
170K 1yr TC 17,500 17,500 0% 0 17,950 17,138
170K 3yr TC 17,750 17,750 0% 0 17,950 17,599
70K 6mnt TC 13,250 14,500 -9% -1,250 14,158 17,238
70K 1yr TC 11,375 11,875 -4% -500 11,617 14,863
70K 3yr TC 12,125 12,750 -5% -625 12,325 14,500
52K 6mnt TC 12,000 12,750 -6% -750 12,450 15,587
52K 1yr TC 11,750 12,000 -2% -250 11,783 14,308
52K 3yr TC 12,750 12,750 0% 0 12,533 14,046
45k 6mnt TC 10,000 10,500 -5% -500 10,117 13,416
45k 1yr TC 9,750 10,000 -3% -250 9,783 12,450
45k 3yr TC 11,000 11,000 0% 0 10,783 12,403
30K 6mnt TC 8,500 9,250 -8% -750 8,867 11,712
30K 1yr TC 9,250 9,750 -5% -500 9,450 11,787
30K 3yr TC 11,500 11,500 0% 0 11,283 12,044
Ha
nd
yma
xH
an
dy
size
Period
2011
Pa
nam
axSu
pra
ma
x
Week
3
Week
2
Cap
esi
ze
2012$/day ±% Diff
Chartering
The Capes market con�nues to tumble down rapidly as the absence of
much of the Far East due to the fes�vi�es caused a disrup�on in fresh in-
quiry supply. With rates now hovering at levels barely above OPEx levels for
many owners, many have once again started to consider the op�on of lay-
up while demoli�on prospects for overage units have also gone higher up
owners’ lists. With the Pacific basin having recorded such high losses a
week prior, this week it was the turn of the Atlan�c basin, which witnessed
a quick week-on-week drop in freight rates.
Downward pressure on freight rates for Panamaxes started to intensify this
week, as the now considerably swollen tonnage lists wee no match for the
limited inquiries coming in. Owners’ were quick to accept discounted rates
as sen�ment dropped rapidly with regard to near-term prospects of the
market. The Pacific basin seemed to be the one suffering the most, partly
due to the Lunar New Year but also due to the heavy delivery rate of new-
buildings in the area over the past couple of weeks.
Supras and Handies were also suffering considerably for yet another week,
while taking into considera�on how many consecu�ve nega�ve days these
two markets have witnessed it will be hard for a quick recovery to be seen.
There was some relief coming from increased interest from the ECSA, alt-
hough this was too limited to realy make a difference at this point.
Sale & Purchase
Most noteworthy deal this week was the sale of the Handysize
“Inviken” (30,070dwt-blt 86 Spain) which went to European buyers for a
reported price of around $ 3.9m.
Despite reports of the sale of M/V ’Aladdin Rainbow’ (32,260dwt-blt 99
Japan) it seems as thought the sale has now failed through and is once
again in the market.
0
10,000
20,000
30,000
40,000
50,000
$/day
Average T/C Rates
AVR 4TC BCI AVR 4TC BPI AVR 5TC BSI AVR 6TC BHSI
Jan-12 Dec-11 ±% 2012 2011 2010
170k 38.0 36.2 5.0% 38.3 43.5 57.4
75K 27.5 26.5 3.8% 27.8 31.3 39.0
52k 23.5 22.7 3.5% 24.0 25.6 30.2
29K 22.5 21.0 7.1% 23.0 23.5 26.2Handysize
Capesize
Panamax
Supramax
Indicative Market Values ($ Million) - Bulk Carriers
Vessel 5 yrs old
Dry Market
Indicative Period Charters
- 3/5 mos - 'Darya Jyoti' 2010 80,545dwt
- dely Richards Bay 20/25 Jan - $ 12,000/day - D'Amico
- 3/5 mos - 'Garima Prem' 2007 74,456dwt
- dely Taichung mid Jan - $ 8,100/day - Bunge
© Intermodal Research 25/01/2012 4
Secondhand Sales
Size Name Dwt Built Yard M/E SS due Hull Price Buyers Comments
ULCC SAMHO DREAM 319,360 2002
SAMHO HEAVY
INDUSTRIES, S.
Korea
B&W Dec-12 DH $ 28.3mGreek
(Embiricos )
via auction Hong
Kong
MR NAUTICA MUAR 39,768 1992 GALATI, Romania B&W Jan-13 DB $ 5.0m Indones ian
PROD/
CHEMSKLEDROS 15,441 1999
AKER MTW,
GermanyB&W Oct-14 DH $ 7.0m
London based
Greeks
via auction,
Marinel ine coated
PROD/
CHEMHARTZI 15,441 1999
AKER MTW,
GermanyB&W Jul-14 DH $ 7.3m
Singapore
based (Wi lmar
Holdings )
via auction in
Denmark,
Marinel ine coated
PROD/
CHEMGOLDEN WILLING 12,999 2009 MIURA SAIKI, Japan MAN-B&W Feb-14 DH $ 12.4m
Singapore
based (Wi lmar
Holdings )
Marine Line coated
PROD/
CHEMCHEMICAL STAR 12,716 2000 ASAKAWA, Japan B&W Sep-15 DH $ 8.0m undisclosed Epoxy coated
PROD/
CHEMMAURINAPHTE I 6,739 1982
DONGHAE
SHIPBUILDING C, S.
Korea
Mitsubishi - DB undiscl soed NigerianEpoxy coated,
Surveys overdue
Tankers
Name Dwt Built Yard M/E SS due Cbm Price Buyers Comments
REFERENCE POINT 48,980 1991MITSUBISHI
NAGASAKI, JapanMitsubishi Jun-14 78,476 $ 25.3m Indones ian
Gas/LPG/LNG
Size Name Dwt Built Yard M/E SS due Gear Price Buyers Comments
HANDY INVIKEN 30,070 1986AESA BILBAO,
SpainB&W May-12
4 X 16t
CRANES$ 3.9m European
HANDY OLYMPIC MELODY 29,640 1984NKK CORP -
SHIMIZU, JapanSulzer Nov-14
4 X 16t
CRANES$ 5.0m Syrian
HANDY KYKLADES 28,268 1982DALIAN SHIPYARD
CO LTD, ChinaB&W May-13
4 X 25t
CRANES$ 2.9m undisclosed via auction
Bulk Carriers
Name Dwt Built Yard M/E SS due Gear Price Buyers Comments
JAN 8,874 1997ZHONGHUA
SHIPYARD, ChinaWarts i la -
2 X 150t
CRANES$ 2.58m
Norwegian
(Mul tibulk)bss 'as is ' Durban
MPP/General Cargo
Size Name Teu Built Yard M/E SS due Gear Price Buyers Comments
FEEDERWERDER
BREMEN700 1999
SIETAS KG,
GermanyMAN Oct-14 $ 3.2m undisclosed EURO 2.5m
Containers
Name Loa(m) Pass Cars Built Yard M/E SS due Price Buyers Comments
AL-SABINI 113.45 880 163 2000RODRIQUEZ P
LIGURE, ItalyCaterpillar - undisclosed Far Eastern
Ferries

© Intermodal Research 25/01/2012 5
Week
3
Week
2±% 2012 2011 2010
Bangladesh 485 485 0.0% 485 523 422
India 500 490 2.0% 490 511 427
Pakistan 495 485 2.1% 488 504 425
China 440 440 0.0% 440 451 383
Bangladesh 460 465 0.0% 463 498 375
India 475 470 1.1% 465 484 394
Pakistan 470 460 2.2% 462 477 388
China 420 420 0.0% 420 432 364
Dry
Indicative Demolition Prices ($/ldt)
Markets
We
t
350
400
450
500
550
600
$/ldt
Dry Demolition Prices
Bangladesh India Pakistan China
350
400
450
500
550
600
$/ldt
Wet Demolition Prices
Bangladesh India Pakistan China
With sen�ment improving rapidly and all four major markets showing in-
creased appe�te to secure candidates, offered price levels improved for yet
another week. All this improved sen�ment seemed to have even sparked a
lot of specula�ve buying from Pakistani and Indian breakers. At the same
�me China has also showed a firmer approach and we will likely see prices
increase there as well over the coming days closing the price gap further
between them and the Indian Sub-con�nent. Offered Prices have firmed
somewhat this week, with wet tonnages rising to around 440-500$/ldt and
dry units increasing to about 420-475$/ldt.
Most notable this week was the price paid by Indian breakers for the contain-
er vessel ‘MSC Rugby’ (30,941dwt-13,891ldt-blt 83) which reportedly went
for a price of about $ 523/Ldt.
Demoli&on Market
Name Size Ldt Built Yard Type $/ldt Breakers Comments
SETSUYO STAR 170,808 24,077 1985 IHI - KURE, Japan BULKER $ 475/Ldt Indian India-Pakistan range
DONG-A HERMES 145,856 22,290 1992 FINCANTIERI, Italy BULKER $ 447/Ldt Chinese
TRIDONAWATI 154,970 20,187 1991 HYUNDAI, S.Korea TANKER $ 508/Ldt Pakistani
TRIRASA 154,970 20,187 1991 HYUNDAI, S.Korea TANKER $ 508/Ldt Pakistani
IONIAN SEA 98,827 16,787 1992 HYUNDAI, S.Korea TANKER $ 495/Ldt Pakistani
MSC CARINA 45,725 15,553 1986 TSUNEISHI, Japan CONT $ 514/Ldt Indian
LEMNO 86,722 14,425 1982 IHI - KURE, Japan BULKER $ 490/Ldt Indian India-Pakistan range
MSC RUGBY 30,941 13,891 1983 IHI - AIOI, Japan CONT $ 523/Ldt Indian
CASTILLO DE
SOUTOMAIOR75,497 13,200 1981 VEROLME, Brazi l BULKER $ 485/Ldt Indian incl 250-300T bunkers ROB
DAFFODIL 63,883 12,537 1983 SAMSUNG, S. Korea BULKER $ 490/Ldt Indian India-Pakistan range
SAFEER EXPRESS 54,500 12,478 1983UDDEVALLAVARVET,
SwedenBULKER $ 500/Ldt Bangladesh bss dely 'as is' Chittagong
MSC PALERMO 45,696 12,297 1992BREMER VULKAN,
GermanyCONT $ 495/Ldt Indian
FORTUNE CARRIER 63,395 12,118 1982 HYUNDAI, S.Korea BULKER $ 439/Ldt Chinese
PANAMAX SUN 64,150 12,105 1982 B&W, Denmark BULKER $ 505/Ldt Indian
ANGGRAINI 31,225 10,830 1995KHERSONSKIY,
UkraineTANKER $ 517/Ldt Bangladesh
MEGA ACE 41,216 9,600 1982KURUSHIMA ONISHI,
JapanBULKER $ 447/Ldt Chinese incl 240T of bunkers ROB
ESTEEM C 21,725 9,442 1986 SIMA CALLAO, Peru GC $ 468/Ldt Chinese
RAFFLES 37,696 7,320 1984 SASEBO, Japan BULKER $ 424/Ldt Indian
TIGER DA JI 14,101 6,635 1989MATHIAS-THESEN,
GermanyGC $ 485/Ldt Indian
NAMA 14,312 4,735 1988 CCN MAUA, Brazi l GC $ 482/Ldt Indian India-Pakistan range
Demolition Sales

© Intermodal Research 25/01/2012 6
Week
3
Week
2±% 2012 2011 2010
Capesize 170k 47.5 47.5 0.0% 47 53 58
Panamax 75k 28.0 28.0 0.0% 28 33 35
Supramax 57k 26.5 26.5 0.0% 26 30 31
Handysize 30k 22.0 22.0 0.0% 22 25 27
VLCC 300k 98.5 98.5 0.0% 97 102 104
Suezmax 150k 60.0 60.0 0.0% 59 64 66
Aframax 110k 51.5 51.5 0.0% 51 54 55
LR1 70k 42.5 43.5 -2.3% 43 45 46
MR 47k 34.5 34.5 0.0% 34 36 36
LPG M3 80k 71.5 71.5 0.0% 71 73 72
LPG M3 52k 62.5 62.5 0.0% 62 64 65
LPG M3 23k 45.5 45.5 0.0% 45 46 46
Indicative Newbuilding Prices (million$)
Ga
s
Vessel
Bu
lke
rsTa
nk
ers
It seems that we had a slight surge in ac�vity this week compared to a couple
of weeks back, despite being on the approach to the Lunar New Year. How-
ever things are now expected to slow down considerably as the freight mar-
ket has once again deteriorated, while many of the Far Eastern yards have
already wined down their marke�ng efforts. Even a$er the Fes�vi�es pass,
we expect condi�ons to be considerably tougher, as most owners are very
worry of the op�on of placing further newbuilding orders. At the same �me
however, interest in the Gas and Offshore sectors con�nues to hold firm and
is likely to once again cover the biggest por�on of the shipbuilders new order
targets for the year.
With regard to orders this week, most noteworthy reported deal was that
made by Russian buyers for two firm Handysize (35,000dwt) bulkers at Chi-
na’s Qingshan Shipyard for an undisclosed price.
10
20
30
40
50
60
70million $
Bulk Carriers Newbuilding Prices (m$)
Capesize Panamax Supramax Handysize
20
40
60
80
100
120
million $
Tankers Newbuilding Prices (m$)
VLCC Suezmax Aframax LR1 MR
Newbuilding Market
Units Type Yard Delivery Buyer Price Comments
2 Bulker 35,000 dwt Qingshan, China 2013 Russian undisclosed
4 Gas12,000-
17,000cbm Qidong Dajiang, China 2014-2015 Danish (Evergas AS) undisclosed
Ethylene/LPG, size
to be declared in
the coming mos
1 Gas 3,500 cbmTaizhou Yuanyang,
China11/2013 Indonesia (Pertamina) $ 14.0m LPG
1 Gen. Cargo 12,000 dwt Shin Kurushima, Japan 05/2013 Japanese (Daiichi Chuo) undisclosed
Size
Newbuilding Orders
The informa�on contained in this report has been obtained from various sources, as reported in the market. Intermodal Shipbrokers Co. believes such informa�on to be factual and reliable without mak-
ing guarantees regarding its accuracy or completeness. Whilst every care has been taken in the produc�on of the above review, no liability can be accepted for any loss or damage incurred in any way
whatsoever by any person who may seek to rely on the informa�on and views contained in this material. This report is being produced for the internal use of the intended recipients only and no re-
producing is allowed, without the prior wri?en authoriza�on of Intermodal Shipbrokers Co.
Compiled by Intermodal Research Department | Mr George Lazaridis
E-mail: [email protected]
On behalf of Intermodal Sale & Purchase, Newbuilding and Chartering Departments
E-mail: [email protected], [email protected], [email protected]
1,560
1,580
1,600
1,620
1,640
1,660
80
90
100
110
120
130
goldoil
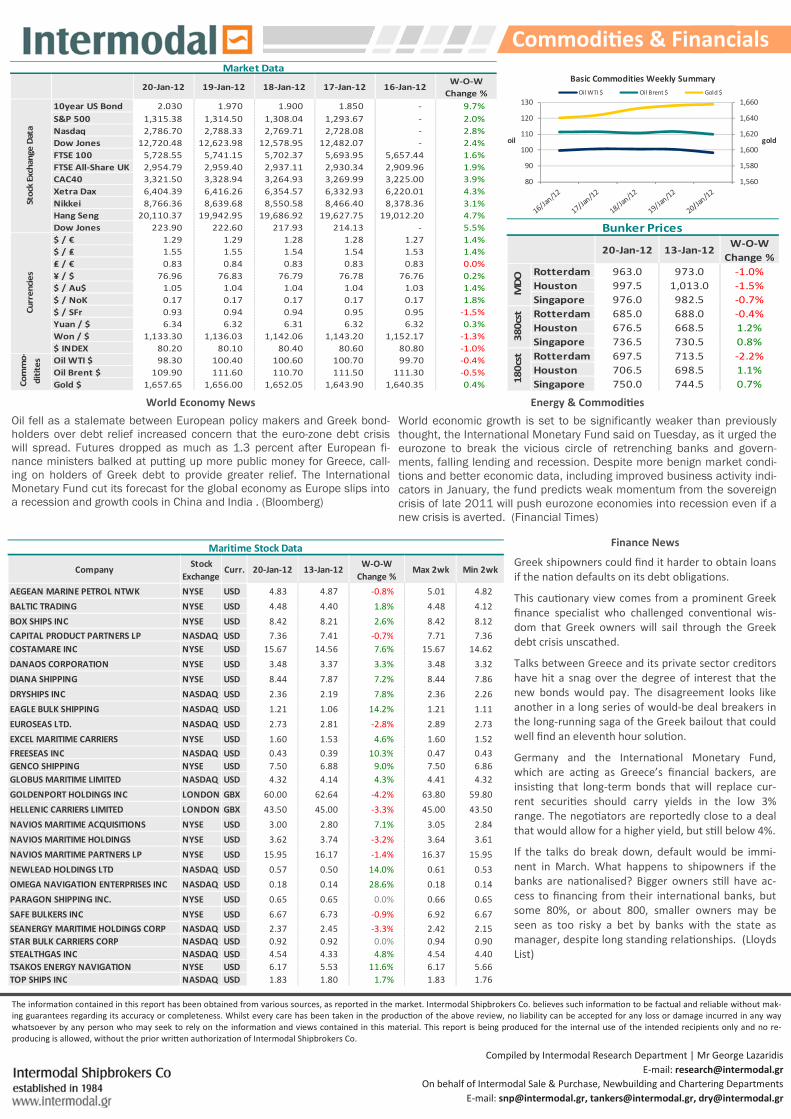
Basic Commodities Weekly Summary
Oil WTI $ Oil Brent $ Gold $
20-Jan-12 13-Jan-12W-O-W
Change %
Rotterdam 963.0 973.0 -1.0%
Houston 997.5 1,013.0 -1.5%
Singapore 976.0 982.5 -0.7%
Rotterdam 685.0 688.0 -0.4%
Houston 676.5 668.5 1.2%
Singapore 736.5 730.5 0.8%
Rotterdam 697.5 713.5 -2.2%
Houston 706.5 698.5 1.1%
Singapore 750.0 744.5 0.7%
Bunker Prices
MD
O3
80
cst
18
0cs
t
World Economy News
Oil fell as a stalemate between European policy makers and Greek bond-holders over debt relief increased concern that the euro-zone debt crisis will spread. Futures dropped as much as 1.3 percent after European fi-nance ministers balked at putting up more public money for Greece, call-ing on holders of Greek debt to provide greater relief. The International Monetary Fund cut its forecast for the global economy as Europe slips into a recession and growth cools in China and India . (Bloomberg)
Energy & Commodi&es
World economic growth is set to be significantly weaker than previously thought, the International Monetary Fund said on Tuesday, as it urged the eurozone to break the vicious circle of retrenching banks and govern-ments, falling lending and recession. Despite more benign market condi-tions and better economic data, including improved business activity indi-cators in January, the fund predicts weak momentum from the sovereign crisis of late 2011 will push eurozone economies into recession even if a new crisis is averted. (Financial Times)
Finance News
Greek shipowners could find it harder to obtain loans
if the na�on defaults on its debt obliga�ons.
This cau�onary view comes from a prominent Greek
finance specialist who challenged conven�onal wis-
dom that Greek owners will sail through the Greek
debt crisis unscathed.
Talks between Greece and its private sector creditors
have hit a snag over the degree of interest that the
new bonds would pay. The disagreement looks like
another in a long series of would-be deal breakers in
the long-running saga of the Greek bailout that could
well find an eleventh hour solu�on.
Germany and the Interna�onal Monetary Fund,
which are ac�ng as Greece’s financial backers, are
insis�ng that long-term bonds that will replace cur-
rent securi�es should carry yields in the low 3%
range. The nego�ators are reportedly close to a deal
that would allow for a higher yield, but s�ll below 4%.
If the talks do break down, default would be immi-
nent in March. What happens to shipowners if the
banks are na�onalised? Bigger owners s�ll have ac-
cess to financing from their interna�onal banks, but
some 80%, or about 800, smaller owners may be
seen as too risky a bet by banks with the state as
manager, despite long standing rela�onships. (Lloyds
List)
CompanyStock
ExchangeCurr. 20-Jan-12 13-Jan-12
W-O-W
Change %Max 2wk Min 2wk
AEGEAN MARINE PETROL NTWK NYSE USD 4.83 4.87 -0.8% 5.01 4.82
BALTIC TRADING NYSE USD 4.48 4.40 1.8% 4.48 4.12
BOX SHIPS INC NYSE USD 8.42 8.21 2.6% 8.42 8.12
CAPITAL PRODUCT PARTNERS LP NASDAQ USD 7.36 7.41 -0.7% 7.71 7.36
COSTAMARE INC NYSE USD 15.67 14.56 7.6% 15.67 14.62
DANAOS CORPORATION NYSE USD 3.48 3.37 3.3% 3.48 3.32
DIANA SHIPPING NYSE USD 8.44 7.87 7.2% 8.44 7.86
DRYSHIPS INC NASDAQ USD 2.36 2.19 7.8% 2.36 2.26
EAGLE BULK SHIPPING NASDAQ USD 1.21 1.06 14.2% 1.21 1.11
EUROSEAS LTD. NASDAQ USD 2.73 2.81 -2.8% 2.89 2.73
EXCEL MARITIME CARRIERS NYSE USD 1.60 1.53 4.6% 1.60 1.52
FREESEAS INC NASDAQ USD 0.43 0.39 10.3% 0.47 0.43
GENCO SHIPPING NYSE USD 7.50 6.88 9.0% 7.50 6.86
GLOBUS MARITIME LIMITED NASDAQ USD 4.32 4.14 4.3% 4.41 4.32
GOLDENPORT HOLDINGS INC LONDON GBX 60.00 62.64 -4.2% 63.80 59.80
HELLENIC CARRIERS LIMITED LONDON GBX 43.50 45.00 -3.3% 45.00 43.50
NAVIOS MARITIME ACQUISITIONS NYSE USD 3.00 2.80 7.1% 3.05 2.84
NAVIOS MARITIME HOLDINGS NYSE USD 3.62 3.74 -3.2% 3.64 3.61
NAVIOS MARITIME PARTNERS LP NYSE USD 15.95 16.17 -1.4% 16.37 15.95
NEWLEAD HOLDINGS LTD NASDAQ USD 0.57 0.50 14.0% 0.61 0.53
OMEGA NAVIGATION ENTERPRISES INC NASDAQ USD 0.18 0.14 28.6% 0.18 0.14
PARAGON SHIPPING INC. NYSE USD 0.65 0.65 0.0% 0.66 0.65
SAFE BULKERS INC NYSE USD 6.67 6.73 -0.9% 6.92 6.67
SEANERGY MARITIME HOLDINGS CORP NASDAQ USD 2.37 2.45 -3.3% 2.42 2.15
STAR BULK CARRIERS CORP NASDAQ USD 0.92 0.92 0.0% 0.94 0.90
STEALTHGAS INC NASDAQ USD 4.54 4.33 4.8% 4.54 4.40
TSAKOS ENERGY NAVIGATION NYSE USD 6.17 5.53 11.6% 6.17 5.66
TOP SHIPS INC NASDAQ USD 1.83 1.80 1.7% 1.83 1.76
Maritime Stock Data
20-Jan-12 19-Jan-12 18-Jan-12 17-Jan-12 16-Jan-12W-O-W
Change %
10year US Bond 2.030 1.970 1.900 1.850 - 9.7%
S&P 500 1,315.38 1,314.50 1,308.04 1,293.67 - 2.0%
Nasdaq 2,786.70 2,788.33 2,769.71 2,728.08 - 2.8%
Dow Jones 12,720.48 12,623.98 12,578.95 12,482.07 - 2.4%
FTSE 100 5,728.55 5,741.15 5,702.37 5,693.95 5,657.44 1.6%
FTSE All-Share UK 2,954.79 2,959.40 2,937.11 2,930.34 2,909.96 1.9%
CAC40 3,321.50 3,328.94 3,264.93 3,269.99 3,225.00 3.9%
Xetra Dax 6,404.39 6,416.26 6,354.57 6,332.93 6,220.01 4.3%
Nikkei 8,766.36 8,639.68 8,550.58 8,466.40 8,378.36 3.1%
Hang Seng 20,110.37 19,942.95 19,686.92 19,627.75 19,012.20 4.7%
Dow Jones 223.90 222.60 217.93 214.13 - 5.5%
$ / € 1.29 1.29 1.28 1.28 1.27 1.4%
$ / ₤ 1.55 1.55 1.54 1.54 1.53 1.4%
₤ / € 0.83 0.84 0.83 0.83 0.83 0.0%
¥ / $ 76.96 76.83 76.79 76.78 76.76 0.2%
$ / Au$ 1.05 1.04 1.04 1.04 1.03 1.4%
$ / NoK 0.17 0.17 0.17 0.17 0.17 1.8%
$ / SFr 0.93 0.94 0.94 0.95 0.95 -1.5%
Yuan / $ 6.34 6.32 6.31 6.32 6.32 0.3%
Won / $ 1,133.30 1,136.03 1,142.06 1,143.20 1,152.17 -1.3%
$ INDEX 80.20 80.10 80.40 80.60 80.80 -1.0%
Oil WTI $ 98.30 100.40 100.60 100.70 99.70 -0.4%
Oil Brent $ 109.90 111.60 110.70 111.50 111.30 -0.5%
Gold $ 1,657.65 1,656.00 1,652.05 1,643.90 1,640.35 0.4%
Market Data
Cu
rre
nci
es
Co
mm
o-
dit
ite
sSt
ock
Exch
an
ge
Dat
a
Commodi&es & Financials


