Weekly Coronavirus Disease 2019 (COVID 19) Surveillance ... · Community surveillance Year: 2020...
22
1 Virological surveillance: Secondary care surveillance: Primary care surveillance: Community surveillance: Weekly Coronavirus Disease 2019 (COVID-19) Surveillance Report Summary of COVID-19 surveillance systems Year: 2020 Week: 20 One of PHE’s core functions is disease surveillance, which involves the gathering and analysis of a variety of data about a disease from a range of sources to understand how the outbreak of a disease affects a country and its regions. Surveillance is also undertaken to inform decisions and actions across the public health system. This report summarises the information from the surveillance systems which are used to monitor the Coronavirus Disease 2019 (COVID-19) pandemic in England. The report is based on week 19 (data between 4 May and 10 May 2020) and where available daily data up to 13 May 2020. COVID-19 is the disease name and SARS-CoV-2 is the virus name. As of 09:00 on 13 May 2020, there have been a total of 139, 086 laboratory confirmed cases of COVID-19 in England. © Crown copyright 2020 • a total of 460 acute respiratory outbreaks have been reported in week 19, of which 173 (160 in care homes, 5 in hospitals and 8 in other settings) were confirmed SARS-CoV-2 outbreaks Mortality surveillance: • the overall RCGP swabbing positivity for week 18 was 10.0% compared to 13.8% in the previous week • through the syndromic surveillance systems, potential COVID-19 indicators through the NHS 111 service (calls and online assessments) and GP in Hours (consultations) remained stable • through GP out of hours, daily percentages for difficulty breathing and ILI decreased • data across all syndromic surveillance systems should be treated with caution because of recent guidance on where the public should seek health care and changes in coding • the hospital admission rate through CHESS was at 1.18 per 100,000 (13 May 2020) compared to 1.37 per 100,000 for the same day (06 May 2020) in the previous week • the ICU/HDU admission rate through CHESS was at 0.15 per 100,000 (13 May 2020) compared to 0.16 per 100,000 (06 May 2020) for the same day in the previous week • a total of 152 laboratory confirmed COVID-19 admissions have been reported from the 5 Severe Respiratory Failure (SRF) Centres in England • the overall % positivity through the SGSS and Respiratory DataMart was 2.9%in week 20 (based on daily data up to 12 May 2020) compared to 7.9% for the same day (5 May 2020) in the previous week • statistically significant excess all cause mortality was observed in week 19 in England by age in the 15 to 64 and 65+ year olds and subnationally (all ages) in all regions
Transcript of Weekly Coronavirus Disease 2019 (COVID 19) Surveillance ... · Community surveillance Year: 2020...

1
Virological surveillance:
Secondary care surveillance:
Primary care surveillance:
Community surveillance:
Weekly Coronavirus Disease 2019 (COVID-19) Surveillance Report
Summary of COVID-19 surveillance systems
Year: 2020 Week: 20
One of PHE’s core functions is disease surveillance, which involves the gathering and analysis of
a variety of data about a disease from a range of sources to understand how the outbreak of a
disease affects a country and its regions. Surveillance is also undertaken to inform decisions and
actions across the public health system.
This report summarises the information from the surveillance systems which are used to monitor
the Coronavirus Disease 2019 (COVID-19) pandemic in England.
The report is based on week 19 (data between 4 May and 10 May 2020) and where available
daily data up to 13 May 2020.
COVID-19 is the disease name and SARS-CoV-2 is the virus name.
As of 09:00 on 13 May 2020, there have been a total of 139, 086 laboratory confirmed cases
of COVID-19 in England.
© Crown copyright 2020
• a total of 460 acute respiratory outbreaks have been reported in week 19, of
which 173 (160 in care homes, 5 in hospitals and 8 in other settings) were
confirmed SARS-CoV-2 outbreaks
Mortality surveillance:
• the overall RCGP swabbing positivity for week 18 was 10.0% compared to
13.8% in the previous week
• through the syndromic surveillance systems, potential COVID-19 indicators
through the NHS 111 service (calls and online assessments) and GP in Hours
(consultations) remained stable
• through GP out of hours, daily percentages for difficulty breathing and ILI
decreased
• data across all syndromic surveillance systems should be treated with caution
because of recent guidance on where the public should seek health care and
changes in coding
• the hospital admission rate through CHESS was at 1.18 per 100,000 (13 May
2020) compared to 1.37 per 100,000 for the same day (06 May 2020) in the
previous week
• the ICU/HDU admission rate through CHESS was at 0.15 per 100,000 (13 May
2020) compared to 0.16 per 100,000 (06 May 2020) for the same day in the
previous week
• a total of 152 laboratory confirmed COVID-19 admissions have been reported
from the 5 Severe Respiratory Failure (SRF) Centres in England
• the overall % positivity through the SGSS and Respiratory DataMart was
2.9%in week 20 (based on daily data up to 12 May 2020) compared to 7.9%
for the same day (5 May 2020) in the previous week
• statistically significant excess all cause mortality was observed in week 19 in
England by age in the 15 to 64 and 65+ year olds and subnationally (all ages)
in all regions
2
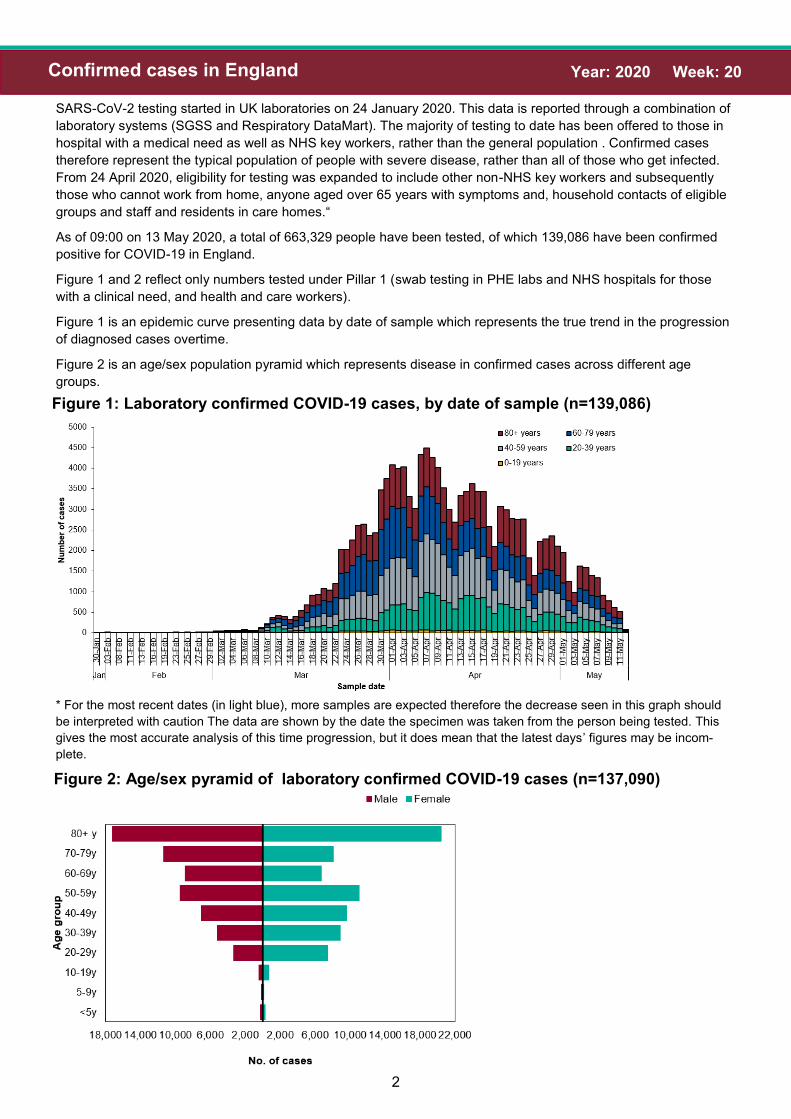
Year: 2020 Week: 20 Confirmed cases in England
SARS-CoV-2 testing started in UK laboratories on 24 January 2020. This data is reported through a combination of
laboratory systems (SGSS and Respiratory DataMart). The majority of testing to date has been offered to those in
hospital with a medical need as well as NHS key workers, rather than the general population . Confirmed cases
therefore represent the typical population of people with severe disease, rather than all of those who get infected.
From 24 April 2020, eligibility for testing was expanded to include other non-NHS key workers and subsequently
those who cannot work from home, anyone aged over 65 years with symptoms and, household contacts of eligible
groups and staff and residents in care homes.“
As of 09:00 on 13 May 2020, a total of 663,329 people have been tested, of which 139,086 have been confirmed
positive for COVID-19 in England.
Figure 1 and 2 reflect only numbers tested under Pillar 1 (swab testing in PHE labs and NHS hospitals for those
with a clinical need, and health and care workers).
Figure 1 is an epidemic curve presenting data by date of sample which represents the true trend in the progression
of diagnosed cases overtime.
Figure 2 is an age/sex population pyramid which represents disease in confirmed cases across different age
groups.
Figure 2: Age/sex pyramid of laboratory confirmed COVID-19 cases (n=137,090)
Figure 1: Laboratory confirmed COVID-19 cases, by date of sample (n=139,086)
* For the most recent dates (in light blue), more samples are expected therefore the decrease seen in this graph should
be interpreted with caution The data are shown by the date the specimen was taken from the person being tested. This
gives the most accurate analysis of this time progression, but it does mean that the latest days’ figures may be incom-
plete.

3
Year: 2020 Week: 20 Confirmed cases in England
Figure 3: Ethnic group of laboratory confirmed COVID-19 cases (n= 125,934)
Table 1: Cumulative total number of cases (n=133,300) and people tested by PHE Cen-
tres (n=597,026)
4
Year: 2020 Week: 20 Confirmed cases in England
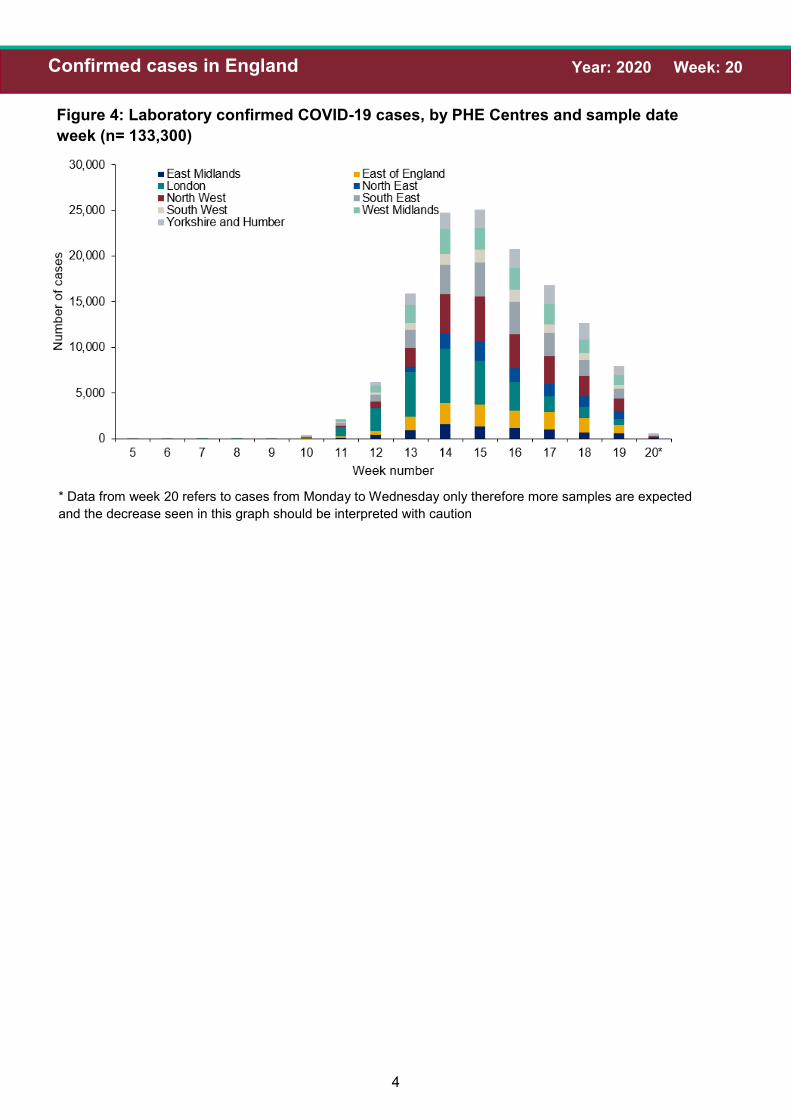
Figure 4: Laboratory confirmed COVID-19 cases, by PHE Centres and sample date
week (n= 133,300)
* Data from week 20 refers to cases from Monday to Wednesday only therefore more samples are expected
and the decrease seen in this graph should be interpreted with caution
5
Year: 2020 Week: 20 Community surveillance
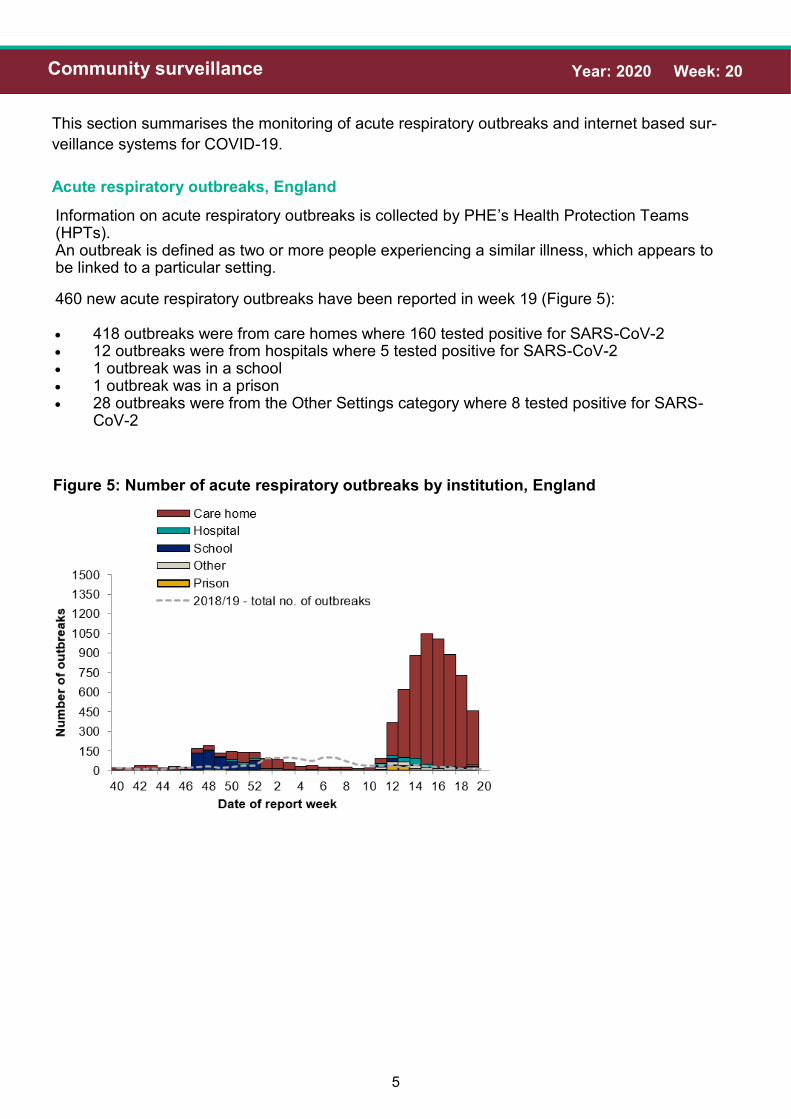
This section summarises the monitoring of acute respiratory outbreaks and internet based sur-
veillance systems for COVID-19.
Acute respiratory outbreaks, England
460 new acute respiratory outbreaks have been reported in week 19 (Figure 5):
• 418 outbreaks were from care homes where 160 tested positive for SARS-CoV-2• 12 outbreaks were from hospitals where 5 tested positive for SARS-CoV-2• 1 outbreak was in a school• 1 outbreak was in a prison• 28 outbreaks were from the Other Settings category where 8 tested positive for SARS-
CoV-2
Figure 5: Number of acute respiratory outbreaks by institution, England
Information on acute respiratory outbreaks is collected by PHE’s Health Protection Teams (HPTs). An outbreak is defined as two or more people experiencing a similar illness, which appears to be linked to a particular setting.
6
Year: 2020 Week: 20 Community surveillance
NHS 111
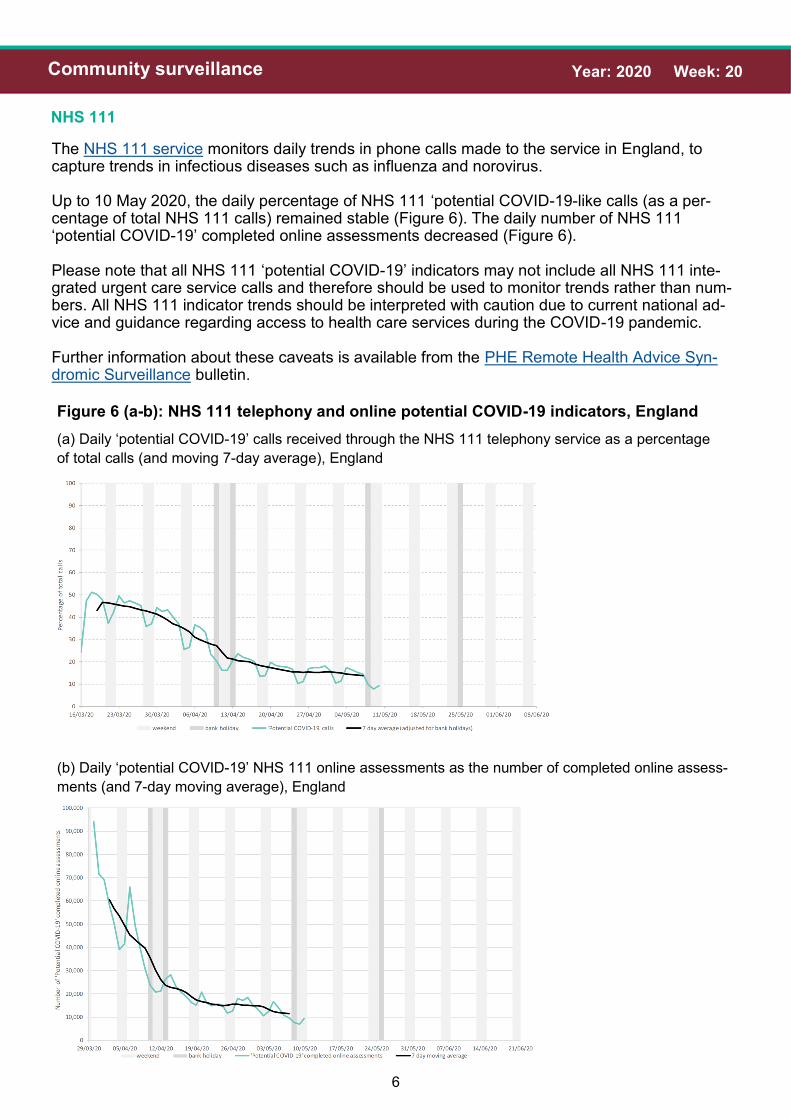
The NHS 111 service monitors daily trends in phone calls made to the service in England, to capture trends in infectious diseases such as influenza and norovirus.
Up to 10 May 2020, the daily percentage of NHS 111 ‘potential COVID-19-like calls (as a per-centage of total NHS 111 calls) remained stable (Figure 6). The daily number of NHS 111 ‘potential COVID-19’ completed online assessments decreased (Figure 6).
Please note that all NHS 111 ‘potential COVID-19’ indicators may not include all NHS 111 inte-grated urgent care service calls and therefore should be used to monitor trends rather than num-bers. All NHS 111 indicator trends should be interpreted with caution due to current national ad-vice and guidance regarding access to health care services during the COVID-19 pandemic.
Further information about these caveats is available from the PHE Remote Health Advice Syn-dromic Surveillance bulletin.
Figure 6 (a-b): NHS 111 telephony and online potential COVID-19 indicators, England
(a) Daily ‘potential COVID-19’ calls received through the NHS 111 telephony service as a percentage
of total calls (and moving 7-day average), England
(b) Daily ‘potential COVID-19’ NHS 111 online assessments as the number of completed online assess-
ments (and 7-day moving average), England

7
Year: 2020 Week: 20 Community surveillance
Internet based surveillance
PHE’s internet based surveillance systems aim to monitor the volume of people searching for typical symptoms of COVID-19 on the internet as well as tracking self-reported respiratory symp-toms and health seeking behaviour patterns related to COVID-19.
Google search queries
This is a web-based syndromic surveillance system which uses daily search query frequency statistics obtained from the Google Health Trends API.[1] This model focuses on search queries about COVID-19 symptoms as well as generic queries about “coronavirus” (for example “covid-19”). The search query frequency time series has been weighted based on symptom frequency as report-ed in other data sources. Frequency of searches for symptoms is compared with a baseline cal-culated from historical daily data.
The overall and media-debiaising weighted scores continued to decrease throughout week 19, with slight increases noted towards the end of the week (Figure 7).
[1] For more information about this model, please see https://arxiv.org/abs/2003.08086
Figure 7: Normalised Google search score for COVID-19 symptoms, with weighted score
for media-de-biasing and historical trend, England

8
Year: 2020 Week: 20 Community surveillance
Internet based surveillance
An internet based surveillance system has been developed based on FluSurvey. FluSurvey is a web tool survey designed to monitor trends of influenza like illness (ILI) in the community using self-reported respiratory symptoms from registered participants. The platform has been adapted to capture respiratory symptoms, exposure risk and healthcare seeking behaviours among reg-istered participants to contribute to national surveillance of COVID-19 activity.
A total of 3,930 participants completed the weekly COVID-19 surveillance survey in week 19. The proportion of participants reporting cough or fever continued to decrease while the most commonly reported method of access to healthcare services was through telephone services (Figure 8), which is in line with current government recommendations.
Figure 8: Rate of contact with different healthcare services among FluSurvey participants
reporting fever or cough symptoms, week 09 to 19, England
FluSurvey

9
Year: 2020 Week: 20 Primary care surveillance
GP In Hours (GPIH), Syndromic surveillance
The GP In Hours (GPIH) syndromic surveillance system monitors the number of GP visits dur-ing regular hours of known clinical indicators. This system covers around 55% of England’s population.
Figure 9 (a to d) represents daily incidence rates for all ages in England for (a) potential COVID-19 GP consultations, (b) ILI, (c) pneumonia and (d) lower respiratory tract infection (LRTI), with a 7-day moving average for each respectively.
Up to 10 May 2020, COVID-19-like GP consultations remained stable, while pneumonia consul-tations decreased slightly (Figure 9). Please note GP data should be interpreted with caution due to changes in advice regarding accessing GP surgeries due to COVID-19. Influenza-like-illness (ILI) rates are now approaching baseline levels after a recent change in the use of a new COVID-19 Care Pathway template which had affected recording of influenza-like illness from mid-April (Figure 9(b)). Further information about these caveats is available from the PHE GP In Hours Syndromic Surveillance bulletin.
Figure 9 (a to d): GPIH clinical indicators, England
(a) Potential COVID-19 GP consultations, daily incidence
rates per 100,000 population, all ages, England
(b) Influenza-like illness, daily incidence rates per
100,000 population, all ages, England
(c) Pneumonia, daily incidence rates per 100,000 pop-
ulation, all ages, England
(d) LRTI, daily incidence rates per 100,000 population,
all ages, England

10
Year: 2020 Week: 20 Primary care surveillance
GP Out of Hours (GPOOH), Syndromic surveillance
The GP Out of Hours (GPOOH) syndromic surveillance system monitors the numbers of daily unscheduled visits and calls to GPs during evenings, overnight, on weekends and on public hol-idays. This system covers approximately 55% of England’s out of hours activity and comple-ments the existing GP surveillance systems that cover daily daytime consultations.
Figure 10 (a to c) represents the daily percentage (as a percentage of total contacts with a Read code) for all ages in England for (a) acute respiratory infection (ARI) (b) difficulty breathing/wheeze/asthma and (c) influenza-like illness with a 7-day moving average for each respectively.
Up to 10 May 2020, the daily percentages for ARI, difficulty breathing/wheeze/asthma and ILI all decreased (Figure 10).
Figure 10 (a to c): GPOOH indicators, England
(a) Acute Respiratory Infection, daily contacts, all ages, England
(b) Difficulty breathing/wheeze/asthma, daily contacts, all ages, England
(c) Influenza-like illness (ILI), daily contacts, all ages, England
11
Year: 2020 Week: 20 Primary care surveillance
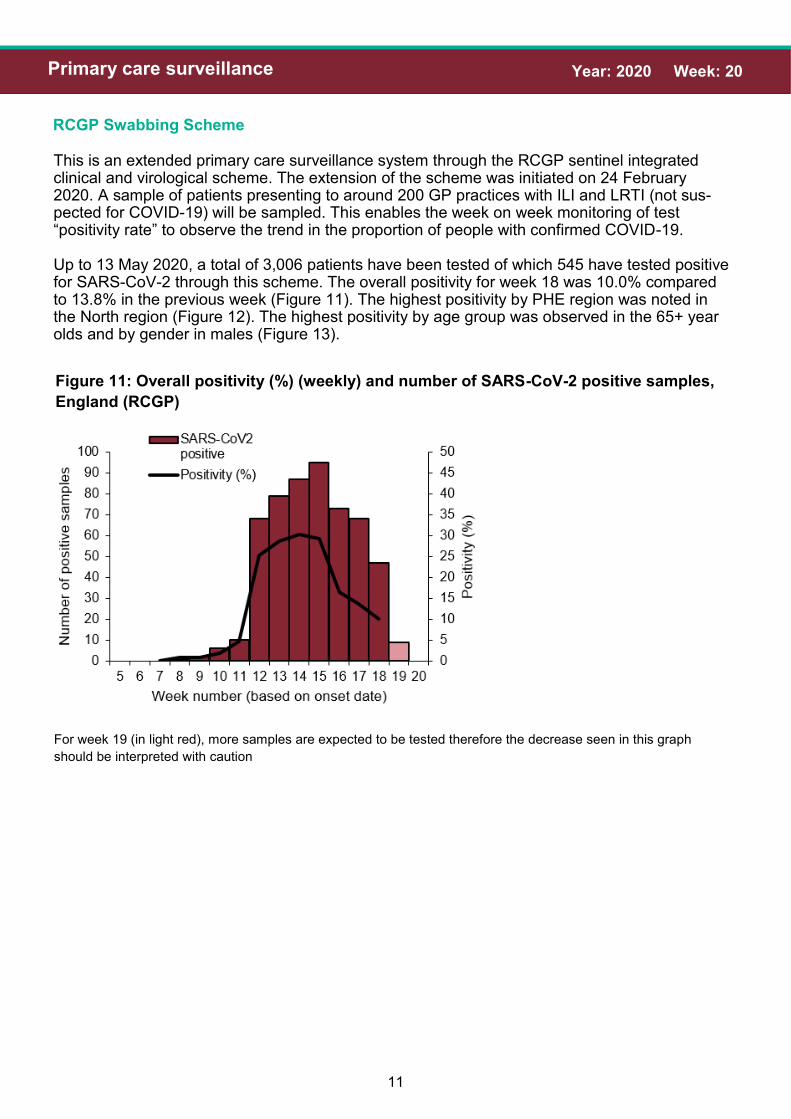
RCGP Swabbing Scheme
This is an extended primary care surveillance system through the RCGP sentinel integrated clinical and virological scheme. The extension of the scheme was initiated on 24 February 2020. A sample of patients presenting to around 200 GP practices with ILI and LRTI (not sus-pected for COVID-19) will be sampled. This enables the week on week monitoring of test “positivity rate” to observe the trend in the proportion of people with confirmed COVID-19.
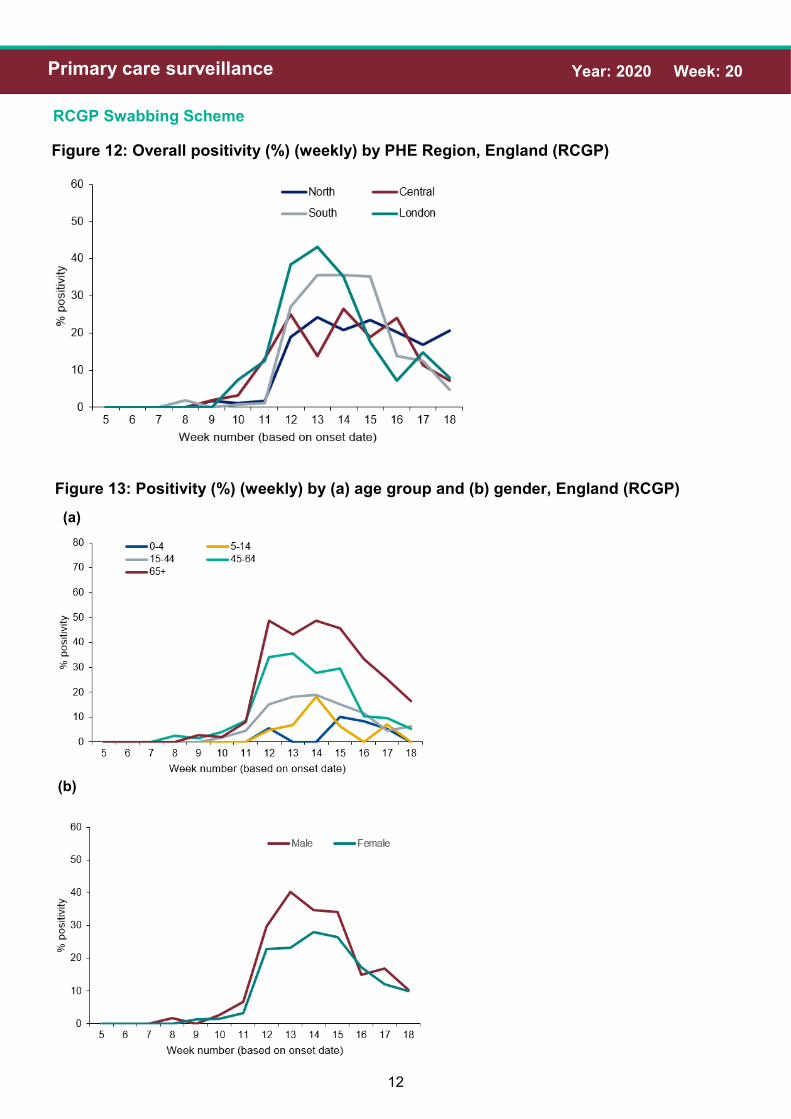
Up to 13 May 2020, a total of 3,006 patients have been tested of which 545 have tested positive for SARS-CoV-2 through this scheme. The overall positivity for week 18 was 10.0% compared to 13.8% in the previous week (Figure 11). The highest positivity by PHE region was noted in the North region (Figure 12). The highest positivity by age group was observed in the 65+ year olds and by gender in males (Figure 13).
Figure 11: Overall positivity (%) (weekly) and number of SARS-CoV-2 positive samples,
England (RCGP)
For week 19 (in light red), more samples are expected to be tested therefore the decrease seen in this graph
should be interpreted with caution
12
Year: 2020 Week: 20 Primary care surveillance
RCGP Swabbing Scheme
Figure 13: Positivity (%) (weekly) by (a) age group and (b) gender, England (RCGP)
(a)
(b)
Figure 12: Overall positivity (%) (weekly) by PHE Region, England (RCGP)
13
Year: 2020 Week: 20 Primary care surveillance
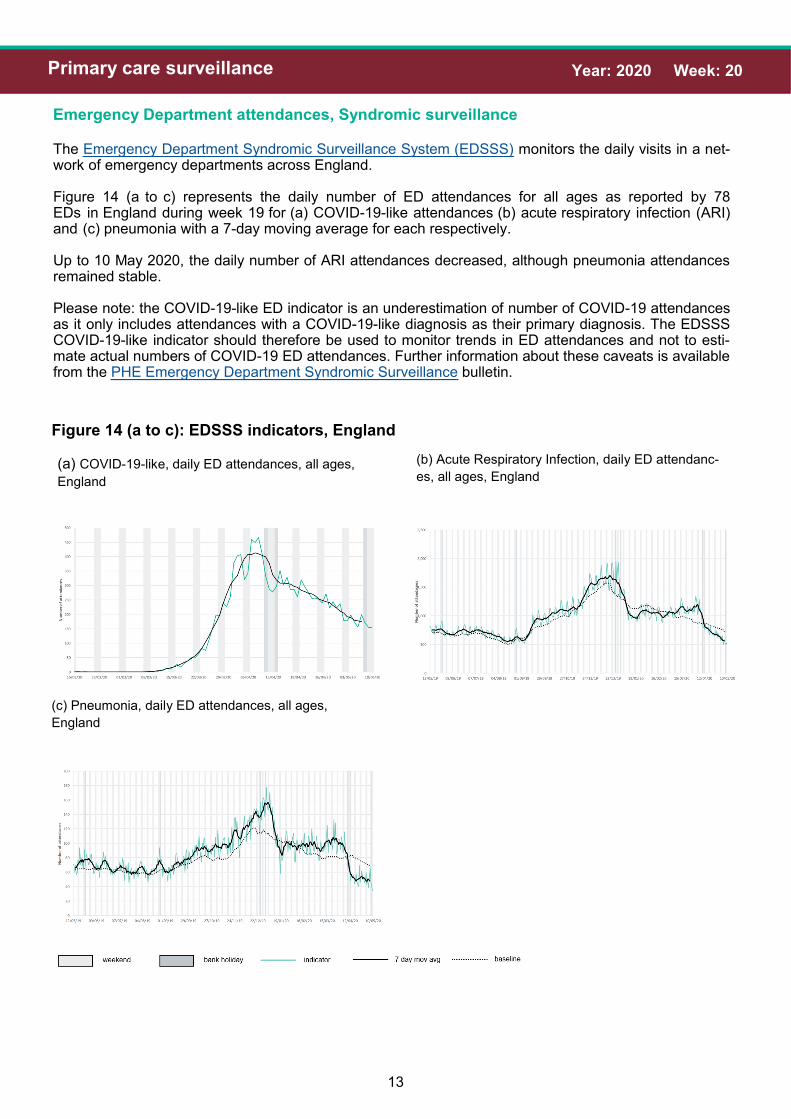
Emergency Department attendances, Syndromic surveillance
The Emergency Department Syndromic Surveillance System (EDSSS) monitors the daily visits in a net-work of emergency departments across England.
Figure 14 (a to c) represents the daily number of ED attendances for all ages as reported by 78 EDs in England during week 19 for (a) COVID-19-like attendances (b) acute respiratory infection (ARI) and (c) pneumonia with a 7-day moving average for each respectively.
Up to 10 May 2020, the daily number of ARI attendances decreased, although pneumonia attendances remained stable.
Please note: the COVID-19-like ED indicator is an underestimation of number of COVID-19 attendances as it only includes attendances with a COVID-19-like diagnosis as their primary diagnosis. The EDSSS COVID-19-like indicator should therefore be used to monitor trends in ED attendances and not to esti-mate actual numbers of COVID-19 ED attendances. Further information about these caveats is available from the PHE Emergency Department Syndromic Surveillance bulletin.
Figure 14 (a to c): EDSSS indicators, England
(a) COVID-19-like, daily ED attendances, all ages,
England
(b) Acute Respiratory Infection, daily ED attendanc-
es, all ages, England
(c) Pneumonia, daily ED attendances, all ages,
England
14
Year: 2020 Week: 20 Secondary care surveillance
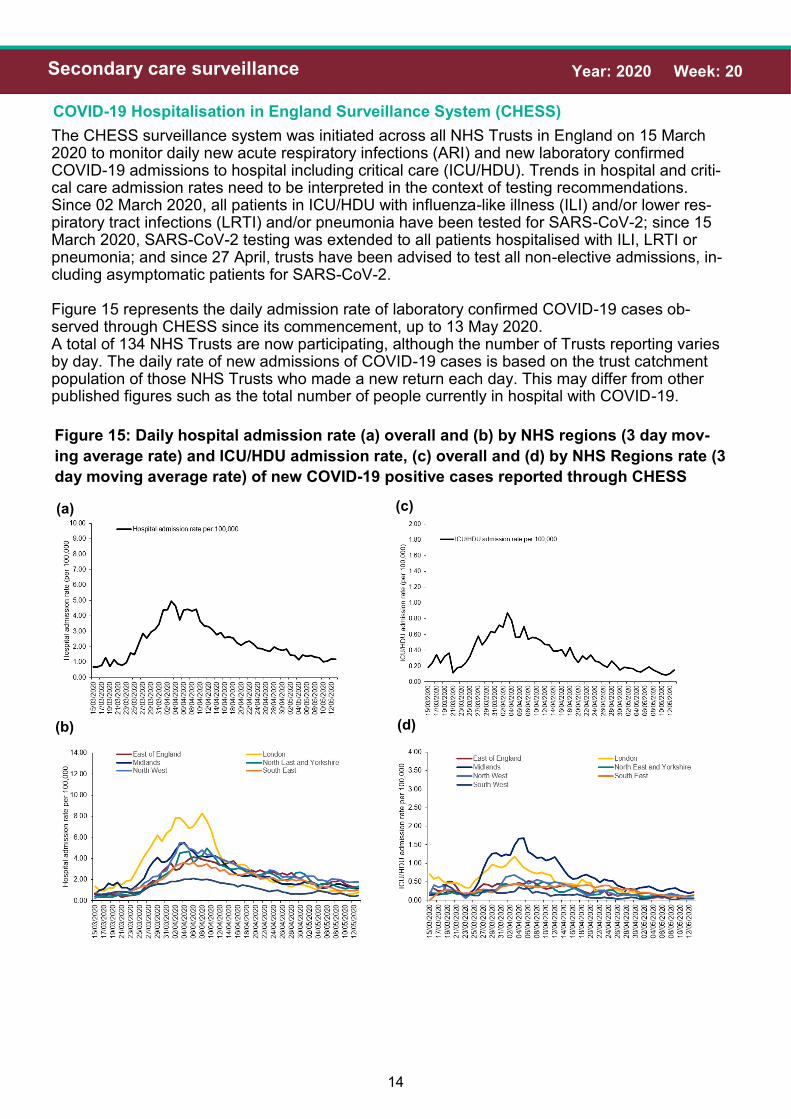
COVID-19 Hospitalisation in England Surveillance System (CHESS)
The CHESS surveillance system was initiated across all NHS Trusts in England on 15 March 2020 to monitor daily new acute respiratory infections (ARI) and new laboratory confirmed COVID-19 admissions to hospital including critical care (ICU/HDU). Trends in hospital and criti-cal care admission rates need to be interpreted in the context of testing recommendations. Since 02 March 2020, all patients in ICU/HDU with influenza-like illness (ILI) and/or lower res-piratory tract infections (LRTI) and/or pneumonia have been tested for SARS-CoV-2; since 15 March 2020, SARS-CoV-2 testing was extended to all patients hospitalised with ILI, LRTI or pneumonia; and since 27 April, trusts have been advised to test all non-elective admissions, in-cluding asymptomatic patients for SARS-CoV-2.
Figure 15 represents the daily admission rate of laboratory confirmed COVID-19 cases ob-served through CHESS since its commencement, up to 13 May 2020. A total of 134 NHS Trusts are now participating, although the number of Trusts reporting varies by day. The daily rate of new admissions of COVID-19 cases is based on the trust catchment population of those NHS Trusts who made a new return each day. This may differ from other published figures such as the total number of people currently in hospital with COVID-19.
Figure 15: Daily hospital admission rate (a) overall and (b) by NHS regions (3 day mov-
ing average rate) and ICU/HDU admission rate, (c) overall and (d) by NHS Regions rate (3
day moving average rate) of new COVID-19 positive cases reported through CHESS
(c) (a)
(b) (d)

15
Year: 2020 Week: 20 Secondary care surveillance
COVID-19 Hospitalisation in England Surveillance System (CHESS)
Figure 16: Age/sex pyramid of new (a) hospital (lower level of care) (n=7,865) and (b) ICU/
HDU (n=3,561) COVID-19 cases reported through CHESS, England
(a)
(b)
Figure 16 and 17 are based on individual patient level data which are provided to CHESS from a subset of NHS Acute Trusts, therefore the data should be interpreted with caution as the distribution of age, sex and ethnic group may not be representative of all hospitalised patients.

16
Year: 2020 Week: 20 Secondary care surveillance
COVID-19 Hospitalisation in England Surveillance System (CHESS)
Figure 17: Ethnic group of new hospitalisations (lower level of care) (n=7,084) and ICU/
HDU (n=2,912) COVID-19 cases reported through CHESS, England
UK Severe Respiratory Failure (SRF) centres admissions
Up to 13 May 2020, a total of 152 laboratory confirmed COVID-19 admissions have been reported from the 5 SRFs in England (Figure 18).
Figure 18: all COVID-19 and non-COVID-19 laboratory confirmed admissions to SRFs, UK

17
Year: 2020 Week: 20 Virological surveillance
Second Generation Surveillance System (SGSS) and Respiratory Datamart positivity, England
The SGSS is the national laboratory reporting system used in England to capture routine labor-atory data on mainly infectious diseases and antimicrobial resistance. The Respiratory Datamart has been used to monitor major respiratory viruses circulating in England bringing to-gether this data from PHE laboratories in England since 2009. Both SGSS and Respiratory Datamart have been adapted and combined to capture detections of SARS-CoV-2.
The overall daily positivity has decreased to 2.9% up to 12 April compared to 7.9% on the same day in the previous week (Figure 19). In week 19, the highest positivity was observed in the 65+ year olds (Figure 20(a)). The highest positivity was in the North East PHE centre (Figure 20(b)).
Figure 19: overall positivity (%) (daily) and number of SARS-CoV-2 positive samples
(n=139,005), England (SGSS and Respiratory DataMart)
* For the most recent dates (in light red), more samples are expected therefore the decrease seen in this graph
should be interpreted with caution

18
Year: 2020 Week: 20 Virological surveillance
Second Generation Surveillance System (SGSS) and Respiratory Datamart positivity, England
Figure 20: positivity (%) (weekly) by (a) age group (n=137,849) and (b) PHE centre
(n=132,121) (c) gender (n=135,992), England (SGSS and Respiratory DataMart)
(a)
(b)
(c)
19
Year: 2020 Week: 20 Mortality surveillance
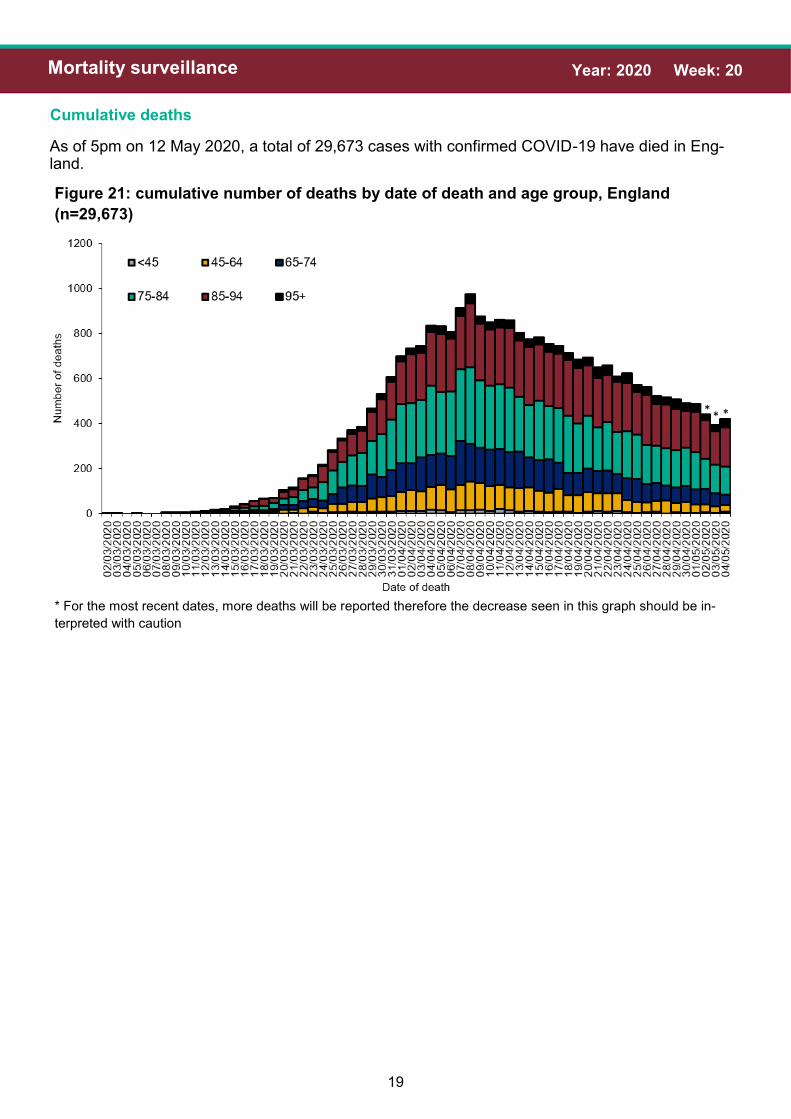
Cumulative deaths
As of 5pm on 12 May 2020, a total of 29,673 cases with confirmed COVID-19 have died in Eng-land.
Figure 21: cumulative number of deaths by date of death and age group, England
(n=29,673)
* For the most recent dates, more deaths will be reported therefore the decrease seen in this graph should be in-
terpreted with caution
** *

20
Year: 2020 Week: 20 Mortality surveillance
Cumulative deaths
Figure 22: age/sex pyramid of laboratory confirmed COVID-19 deaths (n=29,673)
Figure 23: Ethnic group of confirmed COVID-19 deaths, England (n= 29,500)
21
Year: 2020 Week: 20 Mortality surveillance
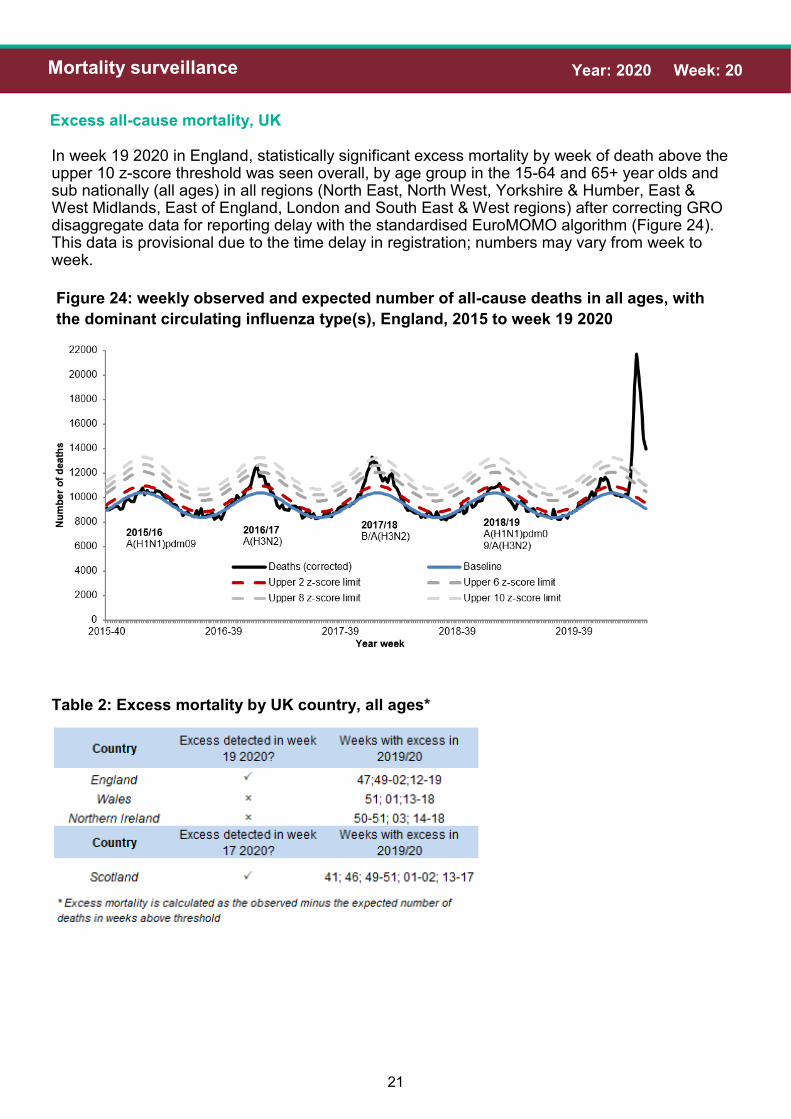
Excess all-cause mortality, UK
In week 19 2020 in England, statistically significant excess mortality by week of death above the upper 10 z-score threshold was seen overall, by age group in the 15-64 and 65+ year olds and sub nationally (all ages) in all regions (North East, North West, Yorkshire & Humber, East & West Midlands, East of England, London and South East & West regions) after correcting GRO disaggregate data for reporting delay with the standardised EuroMOMO algorithm (Figure 24). This data is provisional due to the time delay in registration; numbers may vary from week to week.
Figure 24: weekly observed and expected number of all-cause deaths in all ages, with
the dominant circulating influenza type(s), England, 2015 to week 19 2020
Table 2: Excess mortality by UK country, all ages*

22
Year: 2020 Week: 20 International situation
Global situation
Globally, up to 13 May 2020, a total of 4,202,466 laboratory-confirmed cases of COVID-19 in-fection have been reported worldwide, including 290,466 COVID-19 related deaths.
Figure 25: Global map of COVID-19 cases by classification
PHE has delegated authority, on behalf of the Secretary of State, to process Patient Confidential Data under Regulation 3 The Health Service (Control of Patient Information) Regulations 2002
http://www.legislation.gov.uk/uksi/2002/1438/regulation/3/made. Regulation 3 makes provision for the processing of patient information for the recognition, control and prevention of communicable disease and other risks to public health.