Weekly Coronavirus Disease 2019 (COVID 19) surveillance ......4 Confirmed cases in England Year:...
39
1 Weekly Coronavirus Disease 2019 (COVID-19) surveillance report Summary of COVID-19 surveillance systems Year: 2020 Week: 36 This report summarises the information from the surveillance systems which are used to monitor the Coronavirus Disease 2019 (COVID-19) pandemic in England. More information on the surveillance systems are available here. The report is based on week 35 (data between 24 August and 30 August 2020) and where available daily data up to 1 September 2020. References to COVID-19 represent the disease name and SARS-CoV-2 represent the virus name. Summary Some surveillance indicators suggest that there have been small increases in COVID-19 activity at a national level during week 35 while other indicators remain stable. Case detections in England increased from 6,744 in week 34 to 7,122 in week 35. Case rates were highest in North West and Yorkshire and Humber. At a local authority level, incidence was highest in Bolton, followed by Oldham. Case rates were highest in the 15-44 year age group. Pillar 1 and Pillar 2 positivity increased slightly compared to the previous week, with a particular increase noted in Pillar 2 positivity in the 15-44 year olds in both males and females. The following local authorities have been included in the watchlist following the weekly Local Action Committee meeting:Pendle,Oldham,Blackburn,Bradford,Rochdale,Manchester,Bolton,Tameside,Trafford,Bury,Preston,Salfo rd,Leicester,Kirklees,Calderdale,Hyndburn,Burnley,Great,Sandwell,Swindon,Birmingham,Breckland,Northampto n,Rossendale,Stockport,Norwich,King's,South,Broadland,North,Corby,Kettering,Oadby,Leeds,South,Middlesbro ugh,Peterborough,Stoke-on-Trent,Luton. The overall number of acute respiratory infection incidents reported to PHE Health Protection Teams increased slightly from the previous week. There have been declines in the number of incidents in care homes and food outlet/restaurant settings in comparison to the previous week but increases in incidents in workplaces and other settings. Community and syndromic surveillance indicators remained stable during week 35, although an increase in NHS 111 cold/flu calls was noted. Through the GP sentinel swabbing scheme, detections of cases continue to be low with an overall positivity of 0.0% among those with symptom onset (0/12) in week 35 compared to 3.0% (1/33) in the previous week. There has been a decline in testing through the GP sentinel scheme which is likely due to increased access to testing through other routes. Emergency department attendances with a COVID-19-like diagnosis and overall hospitalisation and ICU/HDU admission rates for confirmed COVID-19 admissions remained stable. The highest hospitalisation rates were in Tameside and Manchester. COVID-19 deaths continue to decline and no excess mortality was observed overall in week 34. New adjusted seroprevalence estimates based on samples from adult blood donors in East of England and the South East were 4.4% and 3.7% respectively. The change in prevalence seen in some regions is likely to be largely driven by changes in the precise locations of sample collection and differences in the donor population as lockdown measures are relaxed. There is also some suggestion that waning immunity may be a contributing factor to declines in prevalence seen in some areas. © Crown copyright 2020
Transcript of Weekly Coronavirus Disease 2019 (COVID 19) surveillance ......4 Confirmed cases in England Year:...

1
Weekly Coronavirus Disease 2019 (COVID-19) surveillance report
Summary of COVID-19 surveillance systems
Year: 2020 Week: 36
This report summarises the information from the surveillance systems which are used to monitor the Coronavirus
Disease 2019 (COVID-19) pandemic in England. More information on the surveillance systems are available here.
The report is based on week 35 (data between 24 August and 30 August 2020) and where available daily data up to 1
September 2020. References to COVID-19 represent the disease name and SARS-CoV-2 represent the virus name.
Summary
Some surveillance indicators suggest that there have been small increases in COVID-19 activity at a national level during week 35 while other indicators remain stable. Case detections in England increased from 6,744 in week 34 to 7,122 in week 35. Case rates were highest in North West and Yorkshire and Humber. At a local authority level, incidence was highest in Bolton, followed by Oldham. Case rates were highest in the 15-44 year age group. Pillar 1 and Pillar 2 positivity increased slightly compared to the previous week, with a particular increase noted in Pillar 2 positivity in the 15-44 year olds in both males and females.
The following local authorities have been included in the watchlist following the weekly Local Action Committee meeting:Pendle,Oldham,Blackburn,Bradford,Rochdale,Manchester,Bolton,Tameside,Trafford,Bury,Preston,Salford,Leicester,Kirklees,Calderdale,Hyndburn,Burnley,Great,Sandwell,Swindon,Birmingham,Breckland,Northampton,Rossendale,Stockport,Norwich,King's,South,Broadland,North,Corby,Kettering,Oadby,Leeds,South,Middlesbrough,Peterborough,Stoke-on-Trent,Luton.
The overall number of acute respiratory infection incidents reported to PHE Health Protection Teams increased slightly from the previous week. There have been declines in the number of incidents in care homes and food outlet/restaurant settings in comparison to the previous week but increases in incidents in workplaces and other settings.
Community and syndromic surveillance indicators remained stable during week 35, although an increase in NHS 111 cold/flu calls was noted.
Through the GP sentinel swabbing scheme, detections of cases continue to be low with an overall positivity of 0.0% among those with symptom onset (0/12) in week 35 compared to 3.0% (1/33) in the previous week. There has been a decline in testing through the GP sentinel scheme which is likely due to increased access to testing through other routes.
Emergency department attendances with a COVID-19-like diagnosis and overall hospitalisation and ICU/HDU admission rates for confirmed COVID-19 admissions remained stable. The highest hospitalisation rates were in Tameside and Manchester.
COVID-19 deaths continue to decline and no excess mortality was observed overall in week 34.
New adjusted seroprevalence estimates based on samples from adult blood donors in East of England and the South East were 4.4% and 3.7% respectively. The change in prevalence seen in some regions is likely to be largely driven by changes in the precise locations of sample collection and differences in the donor population as lockdown measures are relaxed. There is also some suggestion that waning immunity may be a contributing factor to declines in prevalence seen in some areas.
© Crown copyright 2020

2
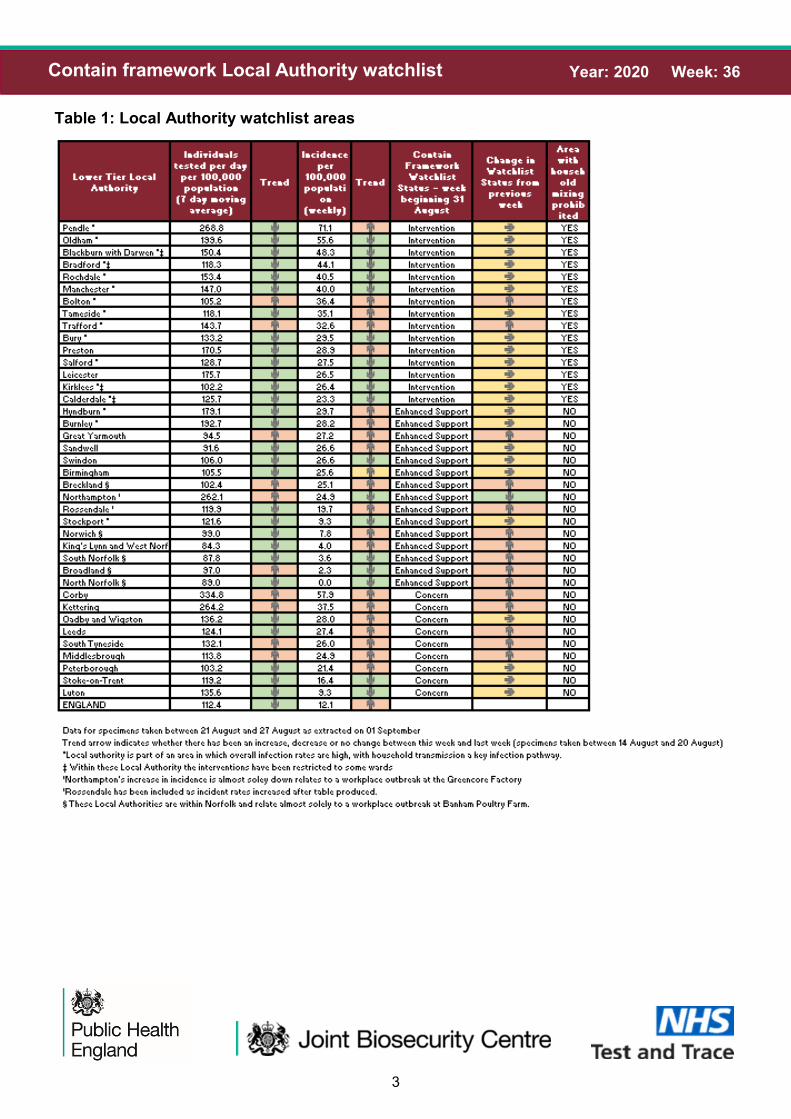
Year: 2020 Week: 36 Contain framework Local Authority watchlist
Following this week’s meeting of the Local Action Committee, the Secretary of State for Health and
Social Care, drawing on epidemiological advice from the CMO, NHS Test and Trace, JBC and PHE,
has determined the following Watchlist (Table 1), highlighting the local authorities of greatest con-
cern.
The Watchlist is produced by first considering the lower tier local authorities with the highest weekly
incidence rate and its trend, combined with a range of other indicators including the test positivity
rate, an assessment of the local response and plans, and the trend of other metrics such as
healthcare activity and mortality. The classification decision is therefore a blended assessment draw-
ing on professional judgement.
Whilst this list is determined at the granularity of lower tier local authority, the Contain Framework
places responsibility for local action at the level of the upper tier local authority. Later in this report,
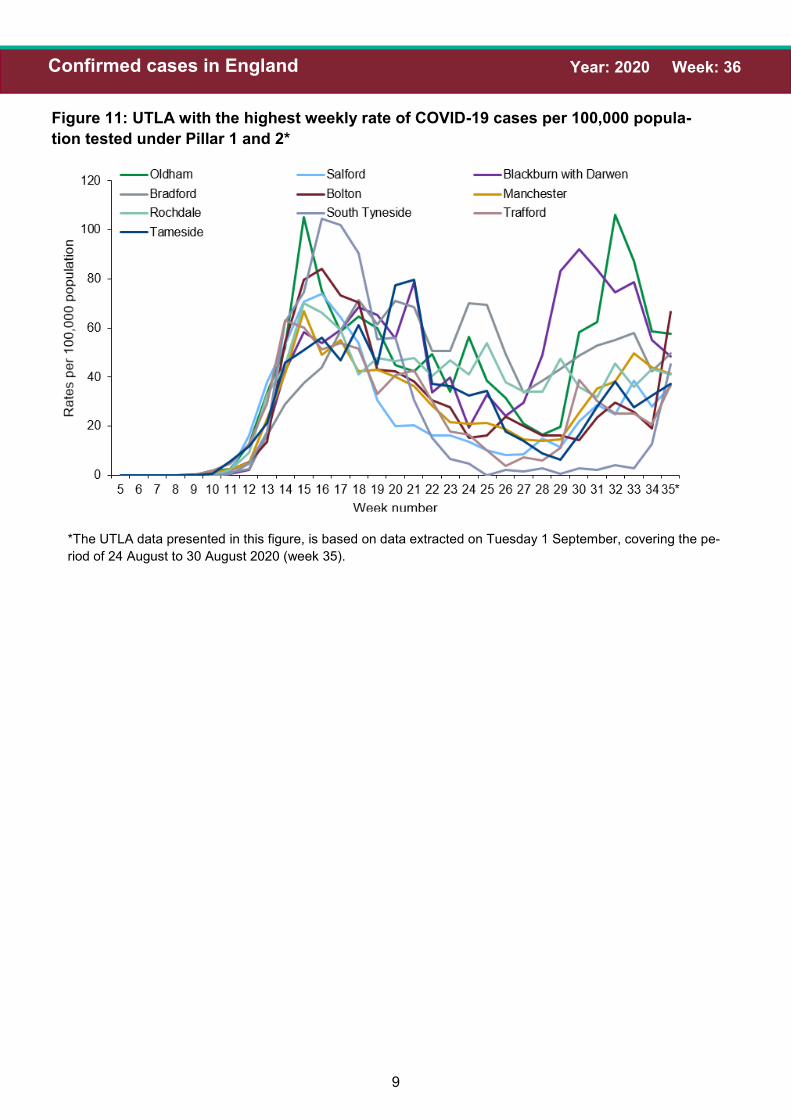
we list the UTLA with the highest incidence rate in the country from a purely statistical viewpoint
(Figure 11).
The Watchlist classification uses definitions as set out in the Contain Framework:
• area(s) of concern—for areas with the highest prevalence, where the local area is taking tar-
geted actions to reduce prevalence eg additional testing in care homes and increased commu-
nity engagement with high risk groups
• area(s) for enhanced support—for areas at medium/high risk of intervention where there is a
more detailed plan, agreed with the national team and with additional resources being provided
to support the local team (eg epidemiological expertise, additional mobile testing capacity)
• area(s) of intervention—where there is divergence from the measures in place in the rest of
England because of the significance of the spread, with a detailed action plan in place, and
local resources augmented with a national support
Maps representing the areas from this week’s Watchlist (Table 1) by Lower Layer Super Output Area
(LSOA) are available here.
3
Year: 2020 Week: 36 Contain framework Local Authority watchlist
Table 1: Local Authority watchlist areas

4
Year: 2020 Week: 36 Confirmed cases in England
As of 09:00 on 1 September 2020, a total of 291,179 have been confirmed positive for COVID-
19 in England under Pillar 1 and 2.
Overall case numbers and positivity increased in week 35, with the majority of cases reported
from Pillar 2. The highest case rates continued to be seen in the 15-44 year olds followed by 45
-64 year olds. Positivity was highest amongst males aged 15-44 and amongst females aged
85+. Cases rates and positivity continue to be highest in the North and Central regions of Eng-
land.
Figure 1: Laboratory confirmed COVID-19 cases tested under Pillar 1 (n=167,294) and
Pillar 2 (n=123,881), based on sample week with overall positivity for Pillar 1 and 2 (%)
* For the most recent week, more samples are expected therefore the decrease seen in this graph should be interpreted
with caution. The data are shown by the week the specimen was taken from the person being tested. This gives the
most accurate analysis of this time progression, but it does mean that the latest days’ figures may be incomplete.

5
Confirmed cases in England
Figure 4: Weekly laboratory confirmed COVID-19 case rates per 100,000, tested under Pil-
lar 1 and Pillar 2 , by age group
Figure 3: Weekly laboratory confirmed COVID-19 case rates per 100,000, tested under
Pillar 1 and Pillar 2, by sex
Figure 2: Age/sex pyramids for laboratory confirmed COVID-19 cases tested under Pillar 1
and 2 (a) cumulative number since week 05 (n=287,389) and (b) in weeks 34 and 35
(n=13,820)
Age and gender
Year: 2020 Week: 36
(a) (b)

6
Confirmed cases in England
Figure 5: Weekly positivity (%) of laboratory confirmed COVID-19 cases tested over-
all and by sex under (a) Pillar 1 and (b) Pillar 2, (SGSS and Respiratory DataMart)
(a)
(a) Male (Pillar 1) (b) Female (Pillar 1)
Year: 2020 Week: 35
Figure 6: Weekly positivity (%) of laboratory confirmed COVID-19 cases tested un-
der Pillar 1, (a) by male and age group and (b) by female and age group and;
under Pillar 2, (c) by male and age group and (d) by female and age group, (SGSS
and Respiratory DataMart)
(b)
(c) Male (Pillar 2) (d) Female (Pillar 2)

7
Year: 2020 Week: 36 Confirmed cases in England
Table 2: Cumulative number of cases under Pillar 1 and 2 (n=282,335) and total number
of people tested under Pillar 1 and 2 (6,490,232) by PHE Centres
Figure 7: Weekly laboratory confirmed COVID-19 case rates per 100,000 population
tested under Pillar 1 and Pillar 2, by PHE Centres and sample week
Figure 8: Weekly positivity of laboratory confirmed COVID-19 cases tested under (a) Pillar
1 (%) and (b) Pillar 2 (%), by PHE Centres and sample week, (SGSS and Respiratory
DataMart)
Geography
(a) (b)
8
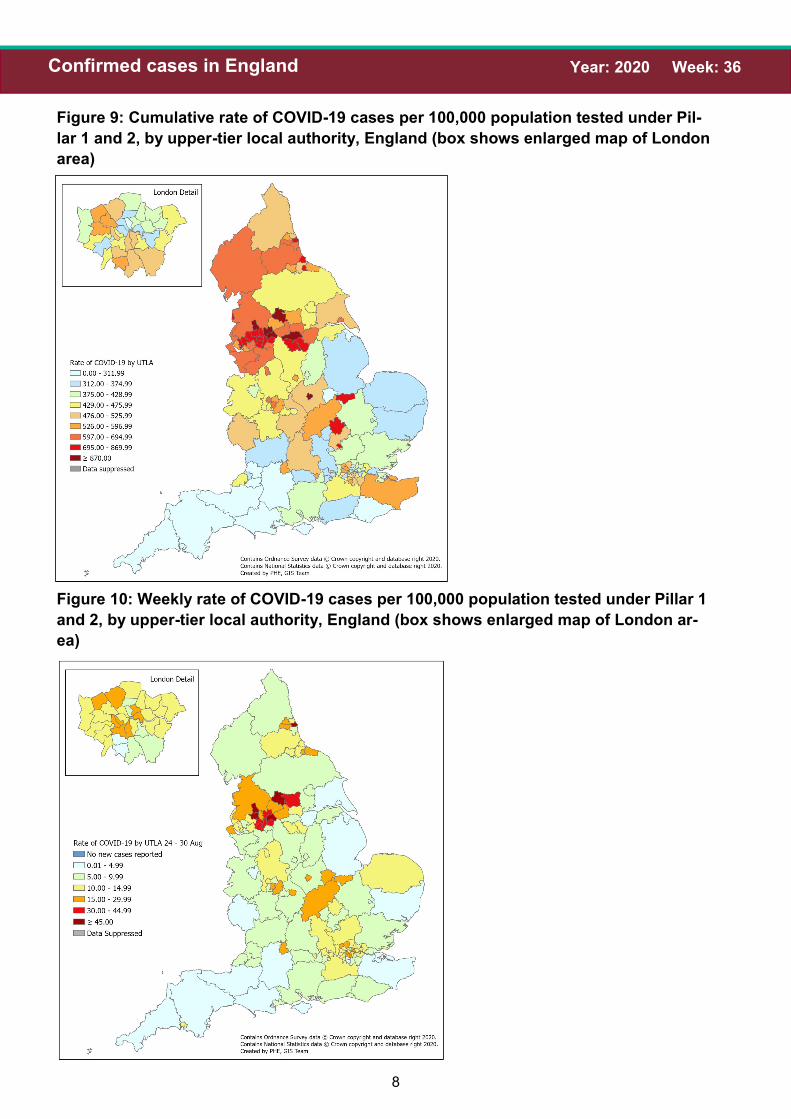
Year: 2020 Week: 36 Confirmed cases in England
Figure 9: Cumulative rate of COVID-19 cases per 100,000 population tested under Pil-
lar 1 and 2, by upper-tier local authority, England (box shows enlarged map of London
area)
Figure 10: Weekly rate of COVID-19 cases per 100,000 population tested under Pillar 1
and 2, by upper-tier local authority, England (box shows enlarged map of London ar-
ea)
9
Year: 2020 Week: 36
Figure 11: UTLA with the highest weekly rate of COVID-19 cases per 100,000 popula-
tion tested under Pillar 1 and 2*
Confirmed cases in England
*The UTLA data presented in this figure, is based on data extracted on Tuesday 1 September, covering the pe-
riod of 24 August to 30 August 2020 (week 35).
10
Year: 2020 Week: 36 Confirmed cases in England
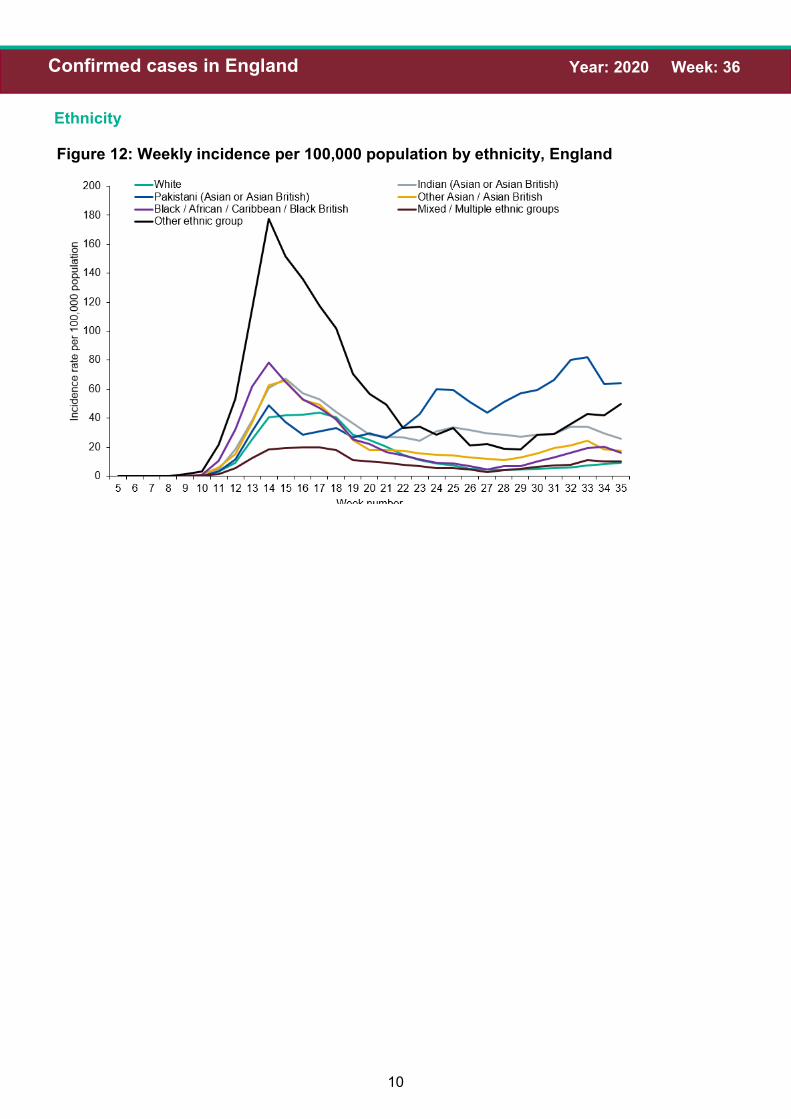
Figure 12: Weekly incidence per 100,000 population by ethnicity, England
Ethnicity

11
Year: 2020 Week: 36 Confirmed cases in England
Figure 13: Weekly incidence per 100,000 population by age group and region, weeks 31-
35
Incidence rates by region
In the regions with the highest overall rates and with most local authorities on the watchlist, the
age groups most affected appears to be young working age adults (20-29 years). This is con-
sistent with mixing patterns in this age group who may be more likely to be working away from
home, including in public facing roles. In those regions, highest rates are also observed in Asian
communities of either Indian or Pakistani origin, most likely reflecting the ethnic mix in the most
affected local areas. In some regions the daily numbers of cases in each ethnic group can be
small, so minor variations in rates should be interpreted with caution.

12
Year: 2020 Week: 36 Confirmed cases in England
*Data presented in Figures 13 & 14 are calculated using Government Office Region denominators
Figure 14: Weekly incidence per 100,000 population by ethnicity and region, weeks 31-35

13
Year: 2020 Week: 36 Community surveillance
This section summarises the monitoring of acute respiratory infection incidents and internet
based surveillance systems for COVID-19.
Acute respiratory infection incidents, England
187 new ARI incidents have been reported in week 35 (Figure 15): • 58 incidents were from care homes where 43 had at least one linked case that tested pos-
itive for SARS-CoV-2 • 5 incidents were from hospitals where all had at least one linked case that tested positive
for SARS-CoV-2 • 9 incidents were from educational settings where 5 had at least one linked case that test-
ed positive for SARS-CoV-2 • 1 incident was from prison • 45 incidents were from workplace settings where 32 had at least one linked case that test-
ed positive for SARS-CoV-2 • 21 incidents were from food outlet/restaurant settings where 19 had at least one linked
case that tested positive for SARS-CoV-2 • 48 incidents were from the other settings category where 34 had at least one linked case
that tested positive for SARS-CoV-2
Information on acute respiratory infection (ARI) incidents is based on situations reported to PHE Health Protection Teams (HPTs). These include: • confirmed outbreaks of acute respiratory infections ie two or more laboratory confirmed
cases (COVID-19, influenza or other respiratory pathogen) linked to a particular setting • situations where an outbreak is suspected. All suspected outbreaks are further investigat-
ed by the HPT in liaison with local partners and a significant proportion do not meet the criteria of a confirmed outbreak. For example if suspected cases test negative for COVID-19 or other respiratory pathogens, or cases are subsequently found not to have direct links to the setting. Since Pillar 2 testing became open to everyone during week 21 more incidents of mild disease have been detected in settings with healthy young populations.
Processes for reporting ARI incidents vary between PHE Centres. The number of incidents in each setting with at least one laboratory confirmed case of COVID-19 are reported below.

14
Year: 2020 Week: 36 Community surveillance
Acute respiratory infection incidents, England
Table 3: Total number of situations/incidents by institution and PHE Centres over the
past four weeks with the total number in the last week in brackets
Figure 15: Number of acute respiratory infection (ARI) incidents by institution, England

15
Year: 2020 Week: 36 Community surveillance
Contact tracing
Figure 16: Contacts by exposure/activity setting in week 35, England (Data source: NHS Test and Trace)
Once a person has a confirmed positive test result for coronavirus, this person is transferred to NHS Test and Trace and a case is opened for them. The NHS Test and Trace service will get in contact via a text, email alert or phone call. People are asked to share details of other people with whom they have had close, recent contact and places they have visited. They can respond online via a secure website or by telephone with a contract tracer. Once contacts have been identified, they will be contacted in turn by the NHS Test and Trace service and advised to self-isolate. Contacts in Figure 16 are those named by people testing positive and contact traced by NHS Test and Trace. The setting is the potential exposure setting as reported by the person who tested positive, when they had close interaction with the named contact. The most common setting was the household, where 59.6% of all contacts were identified. The next most common setting was visitors to the household of the person who tested positive (10.8%). The number of contacts excludes those identified as part of management of complex cases: such as those investigated as part of an outbreak, for example, if someone works in or has re-cently visited a health or care setting such as a hospital or care home, a prison or other secure setting, or a school for people with special needs. For complex cases, contacts are often man-aged at a situation rather than individual level, with advice being issued to the contact institu-tion (for example in a care home or prison). Therefore information on individual contacts asso-ciated with these situations is not available.
Note: categories have been grouped as follows: leisure / community includes eating out, attending events and cel-ebrations, exercising, worship, arts, entertainment or recreation, community activities and attending play groups or organised trips; other workplace includes: retail, manufacturing or construction, hospitality, transport, emergency services or border force, food production and agriculture, prison, financial services, civil service or local govern-ment, information and communication, military, critical national infrastructure. Personal services includes hairdressers, barbers, tattooists and nail bars.

16
Year: 2020 Week: 36 Community surveillance
NHS 111 The NHS 111 service monitors daily trends in phone calls made to the service in England, to capture trends in infectious diseases such as influenza and norovirus. Up to 31 August 2020, the daily percentage of NHS 111 ‘potential COVID-19-like’ calls (as a per-centage of total NHS 111 calls) and number of online assessments were stable, whereas the daily percentage of cold/flu calls (as a percentage of total NHS 111 calls) and completed online assessments increased (Figure 17 and 18). Please note that NHS 111 callers (from 11 May 2020) and NHS 111 online users (from 11 June 2020), who are assessed as having probable COVID-19 symptoms are now triaged using symp-tom specific pathways eg cold/flu, which are included in routine syndromic indicators. Further information about these caveats is available from the PHE Remote Health Advice Syn-dromic Surveillance bulletin.
Figure 17 (a-b): NHS 111 telephony indicators (and 7-day moving average), England
(a) Daily potential COVID-19 calls as a percent-
age of total calls, all ages
(b) Daily cold/flu calls as a percentage of total
calls, all ages
(a) Daily ‘potential COVID-19’ online assessments
as the number of completed online assessments,
all ages
Figure 18 (a-b): NHS 111 completed online assessments (and 7-day moving average),
England
(b) Daily cold/flu online assessments as the num-
ber of completed online assessments, all ages

17
Year: 2020 Week: 36 Community surveillance
Internet based surveillance
This is a web-based syndromic surveillance system which uses daily search query frequency statistics obtained from the Google Health Trends API [1]. This model focuses on search queries about COVID-19 symptoms as well as generic queries about “coronavirus” (eg “covid-19”). The search query frequency time series has been weighted based on symptom frequency as report-ed in other data sources. Frequency of searches for symptoms is compared with a baseline cal-culated from historical daily data.
The overall and media-debiasing weighted scores, whilst remaining above the historical trend line, decreased during week 35 (Figure 19).
[1] For more information about this model, please see https://arxiv.org/abs/2003.08086
Google search queries
Figure 19: Normalised Google search score for COVID-19 symptoms, with weighted
score for media-debiasing and historical trend, England
PHE’s internet based surveillance systems aim to monitor the volume of people searching for typical symptoms of COVID-19 on the internet as well as tracking self-reported respiratory symp-toms and health seeking behaviour patterns related to COVID-19.
18
Year: 2020 Week: 36 Community surveillance
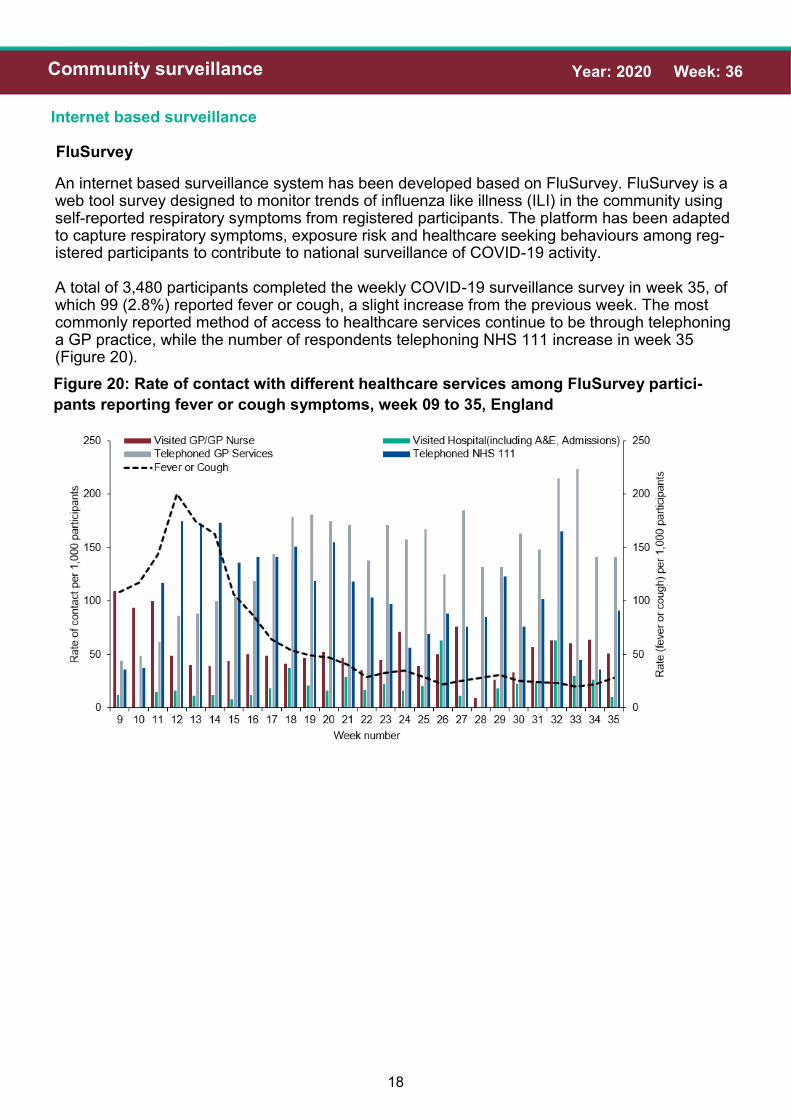
Internet based surveillance
An internet based surveillance system has been developed based on FluSurvey. FluSurvey is a web tool survey designed to monitor trends of influenza like illness (ILI) in the community using self-reported respiratory symptoms from registered participants. The platform has been adapted to capture respiratory symptoms, exposure risk and healthcare seeking behaviours among reg-istered participants to contribute to national surveillance of COVID-19 activity. A total of 3,480 participants completed the weekly COVID-19 surveillance survey in week 35, of which 99 (2.8%) reported fever or cough, a slight increase from the previous week. The most commonly reported method of access to healthcare services continue to be through telephoning a GP practice, while the number of respondents telephoning NHS 111 increase in week 35 (Figure 20).
Figure 20: Rate of contact with different healthcare services among FluSurvey partici-
pants reporting fever or cough symptoms, week 09 to 35, England
FluSurvey
19
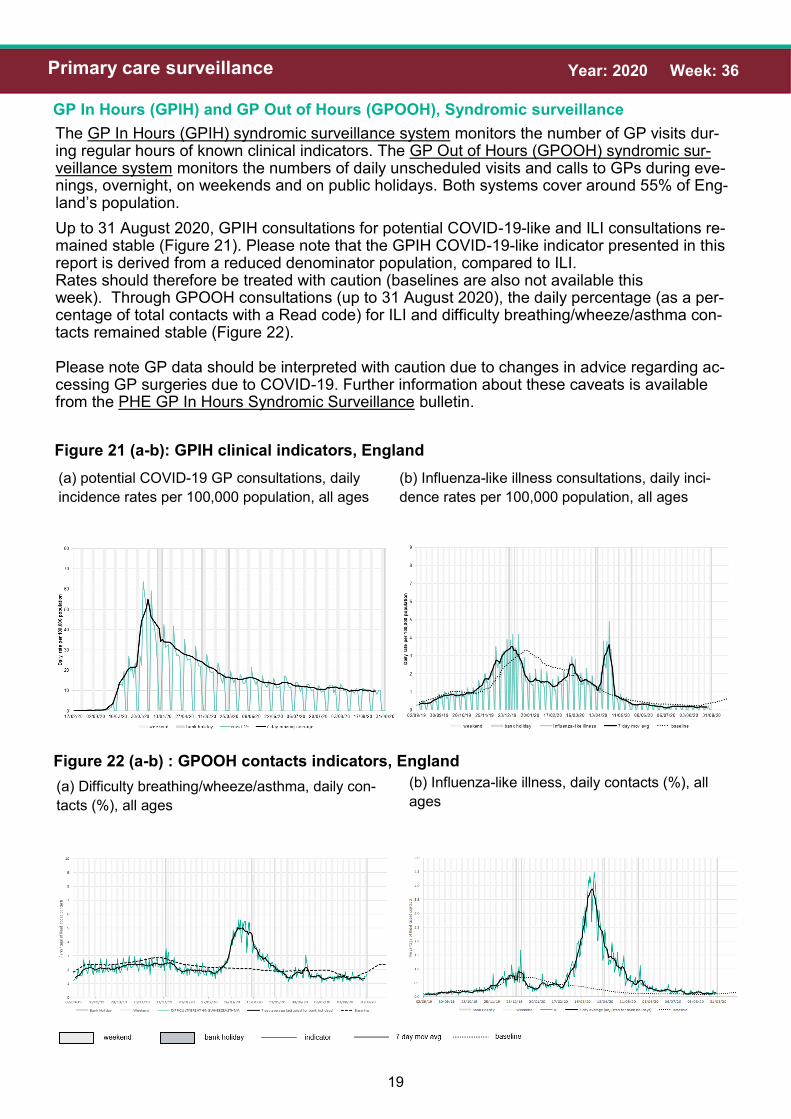
Year: 2020 Week: 36 Primary care surveillance
Figure 21 (a-b): GPIH clinical indicators, England
GP In Hours (GPIH) and GP Out of Hours (GPOOH), Syndromic surveillance
The GP In Hours (GPIH) syndromic surveillance system monitors the number of GP visits dur-ing regular hours of known clinical indicators. The GP Out of Hours (GPOOH) syndromic sur-veillance system monitors the numbers of daily unscheduled visits and calls to GPs during eve-nings, overnight, on weekends and on public holidays. Both systems cover around 55% of Eng-land’s population.
Up to 31 August 2020, GPIH consultations for potential COVID-19-like and ILI consultations re-mained stable (Figure 21). Please note that the GPIH COVID-19-like indicator presented in this report is derived from a reduced denominator population, compared to ILI. Rates should therefore be treated with caution (baselines are also not available this week). Through GPOOH consultations (up to 31 August 2020), the daily percentage (as a per-centage of total contacts with a Read code) for ILI and difficulty breathing/wheeze/asthma con-tacts remained stable (Figure 22). Please note GP data should be interpreted with caution due to changes in advice regarding ac-cessing GP surgeries due to COVID-19. Further information about these caveats is available from the PHE GP In Hours Syndromic Surveillance bulletin.
Figure 22 (a-b) : GPOOH contacts indicators, England
(a) potential COVID-19 GP consultations, daily
incidence rates per 100,000 population, all ages
(b) Influenza-like illness consultations, daily inci-
dence rates per 100,000 population, all ages
(a) Difficulty breathing/wheeze/asthma, daily con-
tacts (%), all ages
(b) Influenza-like illness, daily contacts (%), all
ages

20
Year: 2020 Week: 36 Primary care surveillance
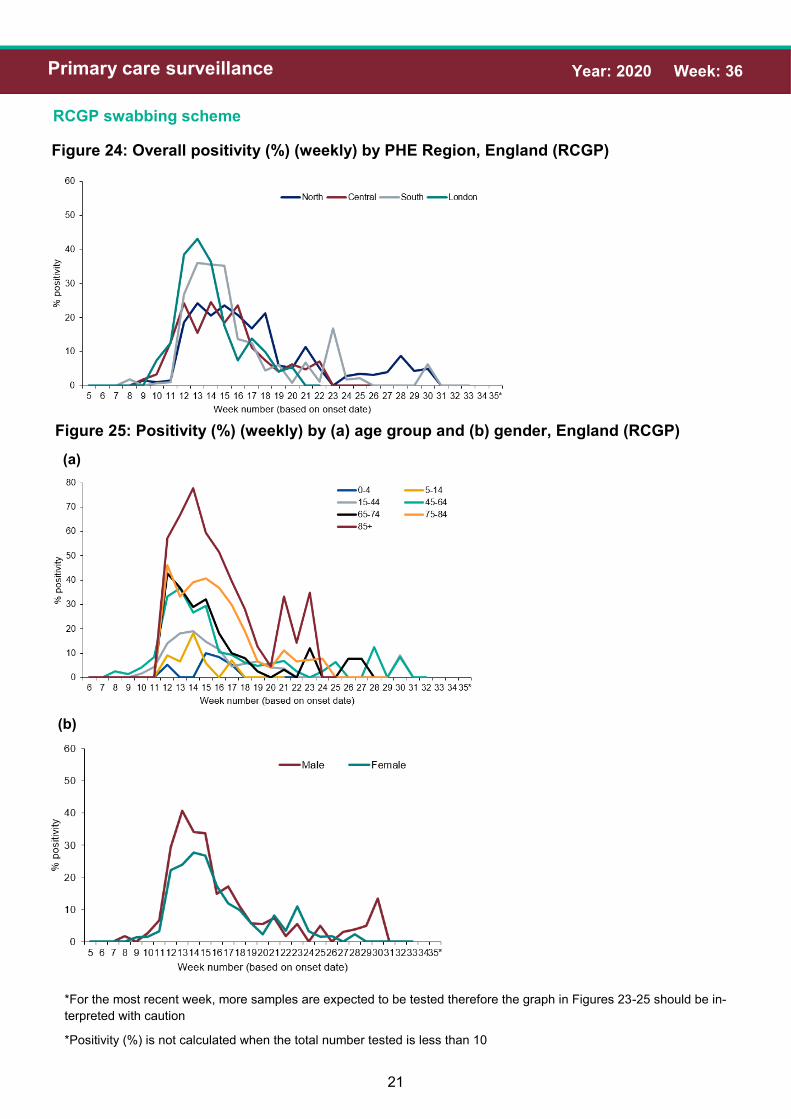
RCGP swabbing scheme
This is an extended primary care surveillance system through the RCGP sentinel integrated clinical and virological scheme. The extension of the scheme was initiated on 24 February 2020. A sample of patients presenting to around 300 GP practices with Influenza-like Illness (ILI) and Lower Respiratory Tract Infections (LRTI) (not suspected for COVID-19) will be tested. This enables the week on week monitoring of test “positivity rate” to observe the trend in the proportion of people with confirmed COVID-19. Up to 01 September 2020, a total of 5,289 patients have been tested of which 615 have tested positive for SARS-CoV-2 through this scheme. The overall positivity was at 0.0% (0/12) in week 35 compared to 3.0% (1/33) in the previous week (Figure 23). This should be interpreted with caution as the overall denominator for patients tested through GPs has decreased due to an increase in patients being tested under Pillar 2. Consultations for ILI and LRTI remained stable (Figure 23).
Figure 23: Overall weekly positivity (%), ILI and LRTI consultations rates (per 100,000),
RCGP, England
*For the most recent week, more samples are expected to be tested therefore the graph in Figures 23-25 should be in-
terpreted with caution
*Positivity (%) is not calculated when the total number tested is less than 10
21
Year: 2020 Week: 36 Primary care surveillance
RCGP swabbing scheme
Figure 25: Positivity (%) (weekly) by (a) age group and (b) gender, England (RCGP)
(a)
(b)
Figure 24: Overall positivity (%) (weekly) by PHE Region, England (RCGP)
*For the most recent week, more samples are expected to be tested therefore the graph in Figures 23-25 should be in-
terpreted with caution
*Positivity (%) is not calculated when the total number tested is less than 10

22
Year: 2020 Week: 36 Secondary care surveillance
Figure 26: COVID-19-like, daily ED attendances, all ages, England
Emergency Department attendances, Syndromic surveillance
The Emergency Department Syndromic Surveillance System (EDSSS) monitors the daily visits in a network of emergency departments across England. Up to 30 August 2020, the daily number of ED attendances for all ages as reported by 81 EDs in England during week 34, for COVID-19-like attendances were stable (Figure 26). Please note: the COVID-19-like ED indicator is an underestimation of the number of COVID-19 attendances as it only includes attendances with a COVID-19-like diagnosis as their primary di-agnosis. The EDSSS COVID-19-like indicator should therefore be used to monitor trends in ED attendances and not to estimate actual numbers of COVID-19 ED attendances. Further infor-mation about these caveats is available from the PHE Emergency Department Syndromic Sur-veillance bulletin.

23
Year: 2020 Week: 36 Secondary care surveillance
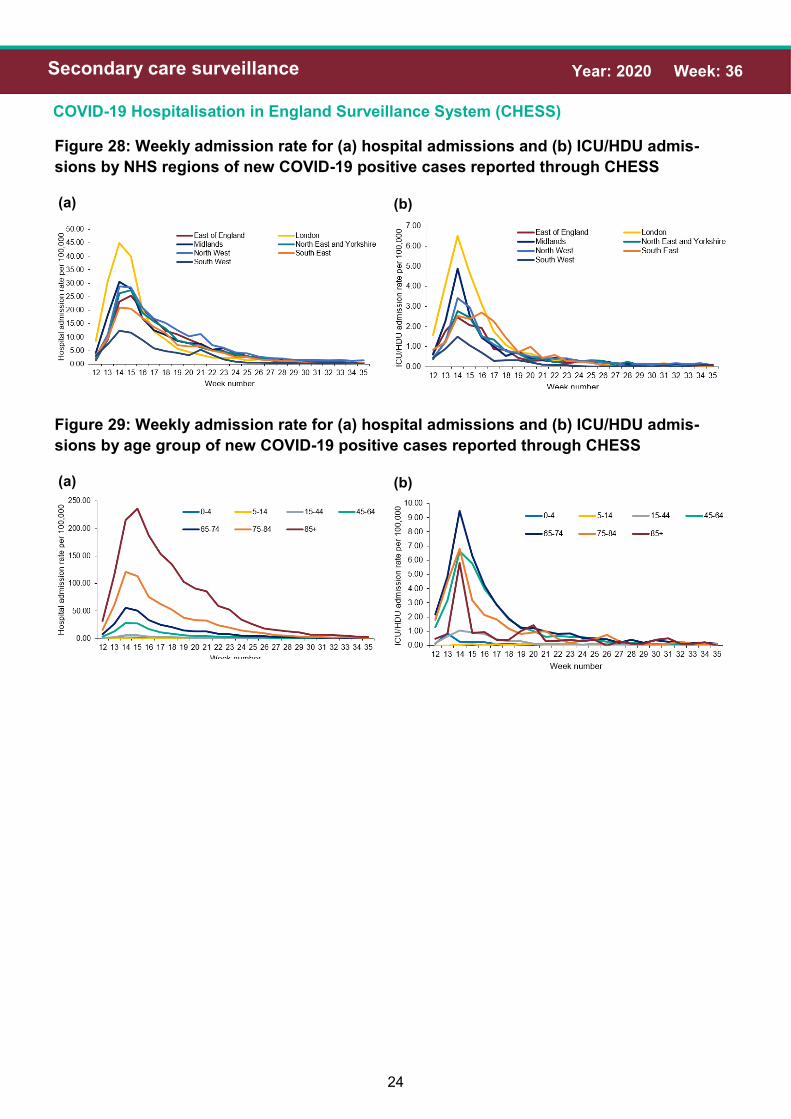
COVID-19 Hospitalisation in England Surveillance System (CHESS)
The CHESS surveillance system monitors daily new acute respiratory infections (ARI) and new laboratory confirmed COVID-19 admissions to hospital including critical care (ICU/HDU). Trends in hospital and critical care admission rates need to be interpreted in the context of test-ing recommendations. A total of 134 NHS Trusts are now participating, although the number of Trusts reporting varies by day. The weekly rate of new admissions of COVID-19 cases is based on the trust catchment population of those NHS Trusts who made a new return. This may differ from other published figures such as the total number of people currently in hospital with COVID-19. In week 35, the weekly admission rates for both hospitalisations and ICU/HDU COVID-19 ad-missions decreased slightly. The hospitalisation rate was at 0.47 per 100,000 in week 35 compared to 0.59 per 100,000 in the previous week. The ICU/HDU rate was at 0.06 per 100,000 in week 35 compared to 0.08 per 100,000 in the previous week (Figure 27). By NHS regions, the highest hospitalisation and ICU/HDU rates continued to be observed in the North (Figure 28). By age group, the highest hospitalisation rate was observed in the 85+ year olds and the highest ICU/HDU rate was ob-served in the 75-84 year olds (Figure 29).
Figure 27: Weekly overall hospital and ICU/HDU admission rates per 100,000 of new
COVID-19 positive cases reported through CHESS, England
24
Year: 2020 Week: 36 Secondary care surveillance
COVID-19 Hospitalisation in England Surveillance System (CHESS)
(a) (b)
Figure 28: Weekly admission rate for (a) hospital admissions and (b) ICU/HDU admis-
sions by NHS regions of new COVID-19 positive cases reported through CHESS
(a) (b)
Figure 29: Weekly admission rate for (a) hospital admissions and (b) ICU/HDU admis-
sions by age group of new COVID-19 positive cases reported through CHESS

25
Year: 2020 Week: 36 Secondary care surveillance
Figure 30: Weekly admission rates for (a) hospitalised and (b) ICU/HDU laboratory con-
firmed COVID-19 cases reported through CHESS, week 35
(a)
(b)

26
Year: 2020 Week: 36 Secondary care surveillance
COVID-19 Hospitalisation in England Surveillance System (CHESS)
Figure 31: Age/sex pyramid of new (a) hospital (lower level of care) (n=14,422) and (b) ICU/
HDU (n=5,753) COVID-19 cases reported through CHESS, England
(a)
(b)
Figure 31 and 32 are based on individual patient level data which are provided to CHESS from a subset of NHS Acute Trusts, therefore the data should be interpreted with caution as the distribution of age, sex and ethnic group may not be representative of all hospitalised patients.

27
Year: 2020 Week: 36 Secondary care surveillance
COVID-19 Hospitalisation in England Surveillance System (CHESS)
Figure 32: Ethnic group of new hospitalisations (lower level of care) (n=13,860) and ICU/
HDU (n=5,286) COVID-19 cases reported through CHESS, England
UK Severe Respiratory Failure (SRF) centres admissions
Between 3 March and 1 September 2020, a total of 222 laboratory confirmed COVID-19 admis-
sions have been reported from the 5 SRFs in England. There was no new laboratory confirmed
COVID-19 admission reported in week 35.
Figure 33: Laboratory confirmed ECMO admissions (COVID-19 and non-COVID-19 con-
firmed) to SRFs, England

28
Year: 2020 Week: 36 Mortality surveillance
Cumulative deaths
Changes to the definitions of COVID-19 related deaths in England are described in more detail in an accompanying PHE technical summary. The current definitions used for mortality surveillance of COVID-19 in England are: (a) 28 day definition: A death in a person with a laboratory-confirmed positive COVID-19 test
and died within (equal to or less than) 28 days of the first positive specimen date (b) 60 day definition: A death in a person with a laboratory-confirmed positive COVID-19 test
and either: died within 60 days of the first specimen date OR died more than 60 days after the first specimen date only if COVID-19 is mentioned on the death certificate
The introduction of these definitions will affect the numbers which have been presented in past reports and therefore Figure 34 represents these differences by definition.
Figure 34: Cumulative number of deaths by week of death and time since laboratory
confirmation of COVID-19, England
* For the most recent week, more deaths will
be reported therefore the decrease seen in
this graph should be interpreted with caution

29
Year: 2020 Week: 36 Mortality surveillance
Figure 35: Age/sex pyramid of laboratory confirmed COVID-19 deaths
Table 5: Cumulative number of COVID-19 deaths and time since laboratory confirmation
of COVID-19 by PHE Centres
Table 4: Ethnic group (%) of COVID-19 deaths and time since laboratory confirmation of
COVID-19, England

30
Year: 2020 Week: 36 Mortality surveillance
Figure 36: Cumulative mortality rate of COVID-19 cases per 100,000 population tested
under Pillar 1 and 2 by (a) 28 day definition and (b) 60 day definition
(a)
(b)

31
Year: 2020 Week: 36 Mortality surveillance
Figure 37: Cumulative mortality rate of COVID-19 cases per 100,000 population tested
under Pillar 1 and 2 by the 28 day definition for the past four weeks

32
Year: 2020 Week: 36 Mortality surveillance
Figure 38: Daily excess all-cause deaths in all ages, England, 1 January 2020 to 25 Au-
gust 2020
Daily excess all-cause mortality, UK
Deaths occurring from 1 January to 25 August 2020 were assessed to calculate the daily ex-cess above a baseline using age-group and region specific all cause deaths as provided daily by the General Register Office (GRO). The deaths were corrected to allow for delay to registra-tion based on past data on these delays and the baseline was from the same day of the year in the previous 5 years +/- 7 days with an extrapolated time trend, and with 2 and 3 standard devi-ation (SD) limits shown (Figure 38). Weeks in which at least 2 days exceeded the 3SD threshold are shown in Table 6 and the daily difference from the baseline by age and region is given in Figure 39. Note that as these data are by date of death with delay corrections, numbers are subject to change each week, particu-larly for more recent days. No significant excess all-cause mortality was observed in week 34 overall, by age group or sub-nationally. The excess noted in the previous week coincides with a heat wave occurring in week 33 (Figure 38, 39 and Table 6).
^ based on same day in previous 5 years +/- 1 week with a linear trend projected
* corrected for delay to registration from death

33
Year: 2020 Week: 36 Mortality surveillance
Daily excess all-cause mortality, UK
Table 6: Excess all-cause deaths by (a) age group and (b) PHE centres , England
(a)
(b)

34
Year: 2020 Week: 36 Mortality surveillance
Daily excess all-cause mortality, UK
Figure 39: Daily excess all-cause deaths by (a) age group and (b) PHE centres , Eng-
land, 1 March 2020 to 25 August 2020
(a)
(b)
35
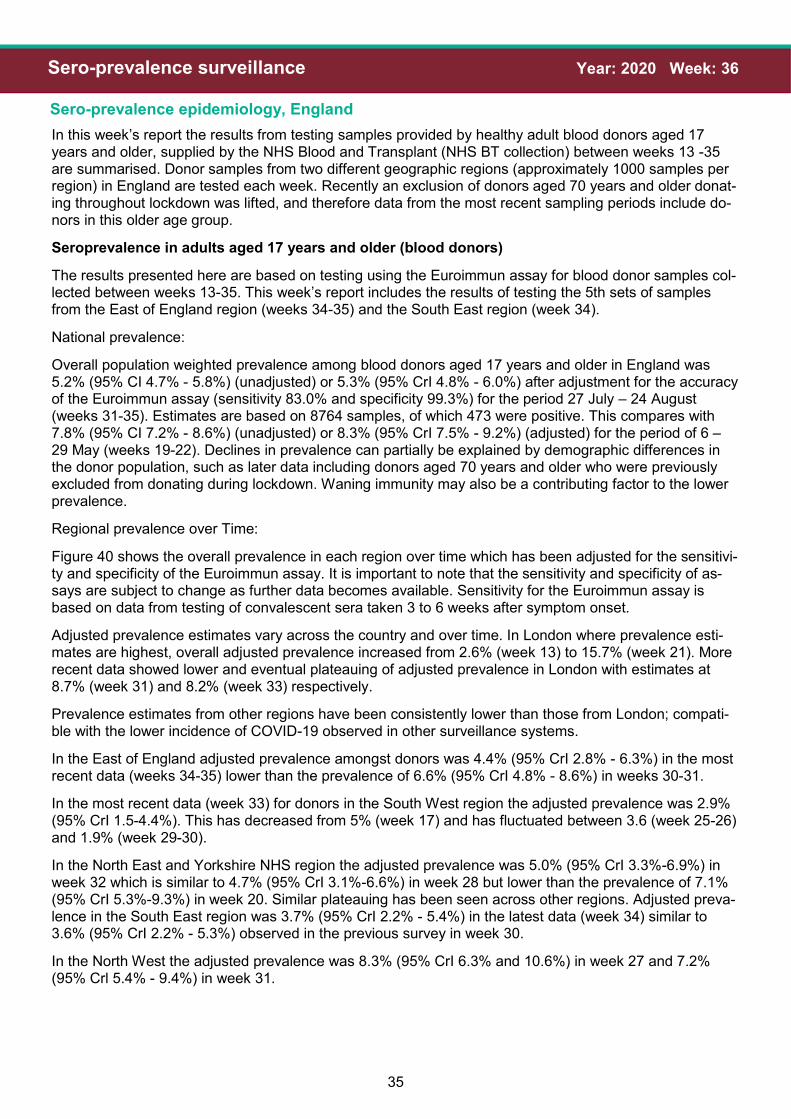
Year: 2020 Week: 36 Sero-prevalence surveillance
Sero-prevalence epidemiology, England
In this week’s report the results from testing samples provided by healthy adult blood donors aged 17 years and older, supplied by the NHS Blood and Transplant (NHS BT collection) between weeks 13 -35 are summarised. Donor samples from two different geographic regions (approximately 1000 samples per region) in England are tested each week. Recently an exclusion of donors aged 70 years and older donat-ing throughout lockdown was lifted, and therefore data from the most recent sampling periods include do-nors in this older age group.
Seroprevalence in adults aged 17 years and older (blood donors)
The results presented here are based on testing using the Euroimmun assay for blood donor samples col-lected between weeks 13-35. This week’s report includes the results of testing the 5th sets of samples from the East of England region (weeks 34-35) and the South East region (week 34).
National prevalence:
Overall population weighted prevalence among blood donors aged 17 years and older in England was 5.2% (95% CI 4.7% - 5.8%) (unadjusted) or 5.3% (95% CrI 4.8% - 6.0%) after adjustment for the accuracy of the Euroimmun assay (sensitivity 83.0% and specificity 99.3%) for the period 27 July – 24 August (weeks 31-35). Estimates are based on 8764 samples, of which 473 were positive. This compares with 7.8% (95% CI 7.2% - 8.6%) (unadjusted) or 8.3% (95% CrI 7.5% - 9.2%) (adjusted) for the period of 6 – 29 May (weeks 19-22). Declines in prevalence can partially be explained by demographic differences in the donor population, such as later data including donors aged 70 years and older who were previously excluded from donating during lockdown. Waning immunity may also be a contributing factor to the lower prevalence.
Regional prevalence over Time:
Figure 40 shows the overall prevalence in each region over time which has been adjusted for the sensitivi-ty and specificity of the Euroimmun assay. It is important to note that the sensitivity and specificity of as-says are subject to change as further data becomes available. Sensitivity for the Euroimmun assay is based on data from testing of convalescent sera taken 3 to 6 weeks after symptom onset.
Adjusted prevalence estimates vary across the country and over time. In London where prevalence esti-mates are highest, overall adjusted prevalence increased from 2.6% (week 13) to 15.7% (week 21). More recent data showed lower and eventual plateauing of adjusted prevalence in London with estimates at 8.7% (week 31) and 8.2% (week 33) respectively.
Prevalence estimates from other regions have been consistently lower than those from London; compati-ble with the lower incidence of COVID-19 observed in other surveillance systems.
In the East of England adjusted prevalence amongst donors was 4.4% (95% CrI 2.8% - 6.3%) in the most recent data (weeks 34-35) lower than the prevalence of 6.6% (95% CrI 4.8% - 8.6%) in weeks 30-31.
In the most recent data (week 33) for donors in the South West region the adjusted prevalence was 2.9% (95% CrI 1.5-4.4%). This has decreased from 5% (week 17) and has fluctuated between 3.6 (week 25-26) and 1.9% (week 29-30).
In the North East and Yorkshire NHS region the adjusted prevalence was 5.0% (95% CrI 3.3%-6.9%) in week 32 which is similar to 4.7% (95% CrI 3.1%-6.6%) in week 28 but lower than the prevalence of 7.1% (95% CrI 5.3%-9.3%) in week 20. Similar plateauing has been seen across other regions. Adjusted preva-lence in the South East region was 3.7% (95% CrI 2.2% - 5.4%) in the latest data (week 34) similar to 3.6% (95% CrI 2.2% - 5.3%) observed in the previous survey in week 30.
In the North West the adjusted prevalence was 8.3% (95% CrI 6.3% and 10.6%) in week 27 and 7.2% (95% Crl 5.4% - 9.4%) in week 31.

36
Year: 2020 Week: 36 Sero-prevalence surveillance
The adjusted prevalence for donors in the Midlands was 4.6% (95% CrI 3.0% - 6.5%) in week 32 which is lower than that seen in the previous survey in week 28 when prevalence was 6.5% (95% CrI 4.7% - 8.6%).
These stable or lower prevalence estimates in more recent sampling periods suggest that recent transmis-sion levels are very low.
The change in prevalence seen in some regions is likely to be largely driven by changes in the precise locations of sample collection, for example in the most recent East of England collection, greater numbers of samples came from areas closer to London where prevalence appears to be higher. Declines in preva-lence can be partially explained by demographic differences in the donor population as lockdown measures are relaxed, for example regular donors aged 70 years and above were not allowed to donate during lockdown, but this exclusion was lifted from week 26. Waning immunity may also be a contributing factor to the lower prevalence.
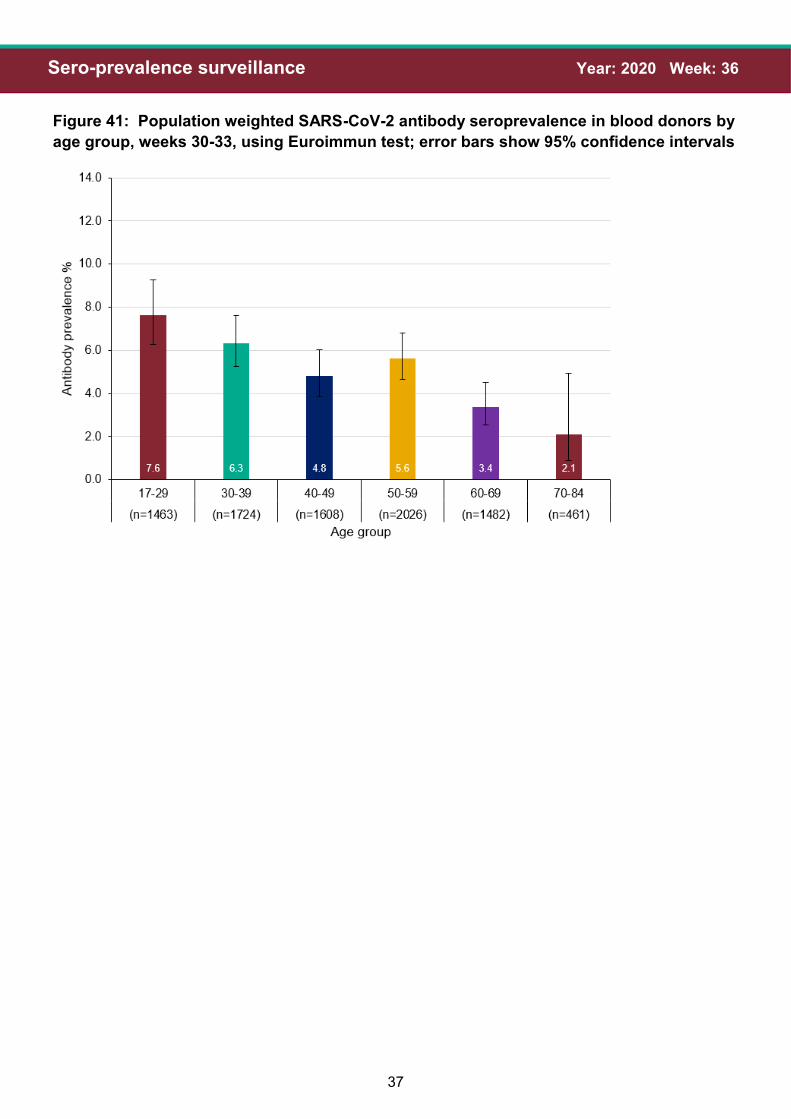
Prevalence by age group:
Population weighted antibody prevalence (unadjusted) estimates in donors aged 70-84 years are included in the most recent data (weeks 31-35) as this age group, who were advised to shield during lockdown, have been able to return to donor clinics since week 26 (Figure 41). Prevalence is highest in the youngest age group (age 17-29) and lowest in the oldest age group (age 70-84).
Figure 40: Overall SARS-CoV-2 antibody seroprevalence (%) in blood donors by PHE
centres, using Euroimmun test adjusted for sensitivity (83.0%) and specificity (99.3%) and
95% confidence intervals (dashed lines)
37
Year: 2020 Week: 36 Sero-prevalence surveillance
Figure 41: Population weighted SARS-CoV-2 antibody seroprevalence in blood donors by
age group, weeks 30-33, using Euroimmun test; error bars show 95% confidence intervals

38
Year: 2020 Week: 36 International situation
Global situation
Globally, up to 1 September 2020, a total of 25,547,591 cases of COVID-19 infection have been reported worldwide, including 851,813 COVID-19 related deaths.
Figure 42: Global map of cumulative COVID-19 cases

39
Year: 2020 Week: 36 International situation
Global situation
Figure 43: Global map of weekly COVID-19 case incidence rate per 100,000, week 35 2020
PHE has delegated authority, on behalf of the Secretary of State, to process Patient Confidential Data under Regulation 3 The Health Service (Control of Patient Information) Regulations 2002
http://www.legislation.gov.uk/uksi/2002/1438/regulation/3/made. Regulation 3 makes provision for the processing of patient information for the recognition, control and prevention of communicable disease and other risks to public health.