Weekly BULLETIN - Ministry of International Trade and Industry
25
1 MITI Tower, No. 7, Jalan Sultan Haji Ahmad Shah, 50480 Kuala Lumpur, Malaysia Tel: +603 - 8000 8000 Fax: +603 - 6202 9446 VOLUME 559 MINISTRY OF INTERNATIONAL TRADE AND INDUSTRY Weekly BULLETIN 05 November 2019 | NO. ISSN : 2180-0448 Labour Productivity, Second Quarter 2019 Media Release Industry4WRD Summit, 30 October 2019 YB Datuk Darell Leiking launched the Industry4WRD Summit held in MITEC, Kuala Lumpur on 30 October 2019. Industry4WRD is jointly organised by the Ministry of International Trade and Industry (MITI) and Federation of Malaysian Manufacturers (FMM) is held for two days beginning 30-31 October 2019. Themed “Accelerating Transformation towards Smart Manufacturing”, the Summit will feature three conferences and exhibition by Industry 4.0 solution, technology, training providers and financial institutions. In conjunction with the one-year implementation of the Industry4WRD: National Policy on Industry 4.0 launched on 31 October 2019, the Summit aims to update business communities on the latest development in Industry4WRD initiatives and encourage the adoption of Industry 4.0 by industry players especially SMEs. Industry players, business associations, academicians, researchers, students and members of the public are invited to attend the Summit. The three conferences i.e. “Accelerating Industrial Transformation”, “Future-Proofing Talents” and “Financing Industry 4.0 Adoption” will feature leading speakers from the Government, industry and academia. They will discuss the potential and challenges of Industry 4.0 adoption while more than 40 exhibitors will showcase their latest offering of technologies, solutions, programmes and financial products to support digital transformation in the second day exhibition. Ministry of International Trade and Industry 30 October 2019
Transcript of Weekly BULLETIN - Ministry of International Trade and Industry
1MITI Tower, No. 7, Jalan Sultan Haji Ahmad Shah, 50480 Kuala Lumpur, Malaysia Tel: +603 - 8000 8000 Fax: +603 - 6202 9446
VOLUME 559
MINISTRY OF INTERNATIONAL TRADE AND INDUSTRYWeekly
B U L L ET I N05 November 2019 | NO. ISSN : 2180-0448
Labour Productivity, Second Quarter 2019
Med
ia R
elea
se
Industry4WRD Summit, 30 October 2019
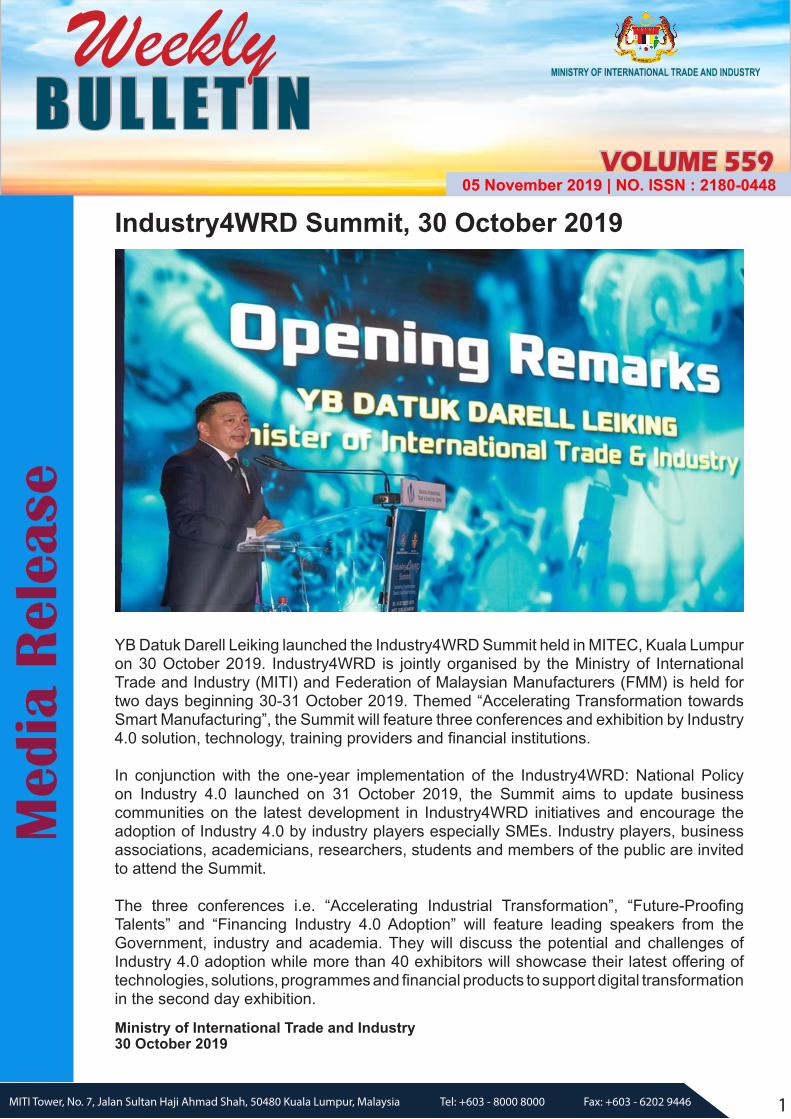
YB Datuk Darell Leiking launched the Industry4WRD Summit held in MITEC, Kuala Lumpur on 30 October 2019. Industry4WRD is jointly organised by the Ministry of International Trade and Industry (MITI) and Federation of Malaysian Manufacturers (FMM) is held for two days beginning 30-31 October 2019. Themed “Accelerating Transformation towards Smart Manufacturing”, the Summit will feature three conferences and exhibition by Industry 4.0 solution, technology, training providers and financial institutions.
In conjunction with the one-year implementation of the Industry4WRD: National Policy on Industry 4.0 launched on 31 October 2019, the Summit aims to update business communities on the latest development in Industry4WRD initiatives and encourage the adoption of Industry 4.0 by industry players especially SMEs. Industry players, business associations, academicians, researchers, students and members of the public are invited to attend the Summit.
The three conferences i.e. “Accelerating Industrial Transformation”, “Future-Proofing Talents” and “Financing Industry 4.0 Adoption” will feature leading speakers from the Government, industry and academia. They will discuss the potential and challenges of Industry 4.0 adoption while more than 40 exhibitors will showcase their latest offering of technologies, solutions, programmes and financial products to support digital transformation in the second day exhibition.
Ministry of International Trade and Industry30 October 2019
2MITI Tower, No. 7, Jalan Sultan Haji Ahmad Shah, 50480 Kuala Lumpur, Malaysia Tel: +603 - 8000 8000 Fax: +603 - 6202 9446
MITI Weekly Bulletin | www.miti.gov.myMITI Weekly Bulletin | www.miti.gov.my
Med
ia R
elea
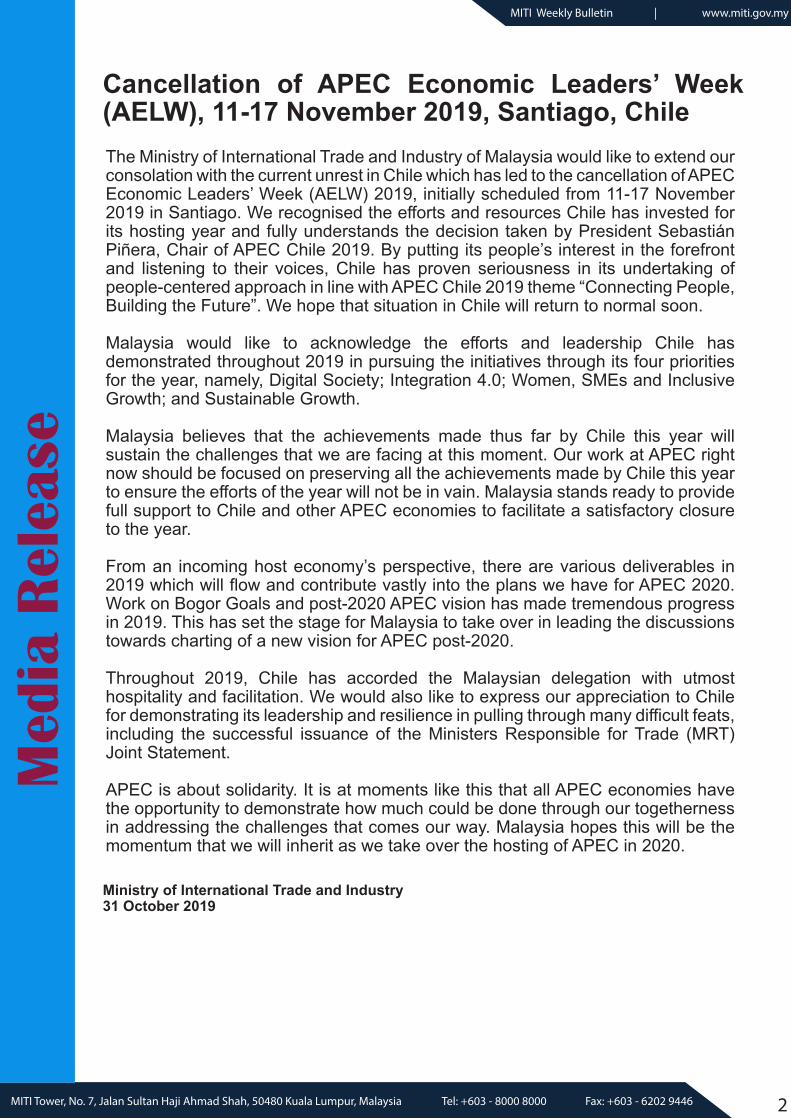
seCancellation of APEC Economic Leaders’ Week (AELW), 11-17 November 2019, Santiago, ChileThe Ministry of International Trade and Industry of Malaysia would like to extend our consolation with the current unrest in Chile which has led to the cancellation of APEC Economic Leaders’ Week (AELW) 2019, initially scheduled from 11-17 November 2019 in Santiago. We recognised the efforts and resources Chile has invested for its hosting year and fully understands the decision taken by President Sebastián Piñera, Chair of APEC Chile 2019. By putting its people’s interest in the forefront and listening to their voices, Chile has proven seriousness in its undertaking of people-centered approach in line with APEC Chile 2019 theme “Connecting People, Building the Future”. We hope that situation in Chile will return to normal soon.
Malaysia would like to acknowledge the efforts and leadership Chile has demonstrated throughout 2019 in pursuing the initiatives through its four priorities for the year, namely, Digital Society; Integration 4.0; Women, SMEs and Inclusive Growth; and Sustainable Growth.
Malaysia believes that the achievements made thus far by Chile this year will sustain the challenges that we are facing at this moment. Our work at APEC right now should be focused on preserving all the achievements made by Chile this year to ensure the efforts of the year will not be in vain. Malaysia stands ready to provide full support to Chile and other APEC economies to facilitate a satisfactory closure to the year.
From an incoming host economy’s perspective, there are various deliverables in 2019 which will flow and contribute vastly into the plans we have for APEC 2020. Work on Bogor Goals and post-2020 APEC vision has made tremendous progress in 2019. This has set the stage for Malaysia to take over in leading the discussions towards charting of a new vision for APEC post-2020.
Throughout 2019, Chile has accorded the Malaysian delegation with utmost hospitality and facilitation. We would also like to express our appreciation to Chile for demonstrating its leadership and resilience in pulling through many difficult feats, including the successful issuance of the Ministers Responsible for Trade (MRT) Joint Statement.
APEC is about solidarity. It is at moments like this that all APEC economies have the opportunity to demonstrate how much could be done through our togetherness in addressing the challenges that comes our way. Malaysia hopes this will be the momentum that we will inherit as we take over the hosting of APEC in 2020.
Ministry of International Trade and Industry31 October 2019

3MITI Tower, No. 7, Jalan Sultan Haji Ahmad Shah, 50480 Kuala Lumpur, Malaysia Tel: +603 - 8000 8000 Fax: +603 - 6202 9446
MITI Weekly Bulletin | www.miti.gov.my
Med
ia R
elea
seTrade Performance for September 2019 and the Period of January- September 2019
January-September 2019 Trade Surplus Highest in the Decade
Malaysia’s trade surplus in January to September 2019 was valued at RM100.86 billion, expanded by 15.3% compared to RM87.47 billion registered for the same period of 2018. This was the largest January-September trade surplus recorded in the last 10 years.
Total trade in the first nine months of 2019 decreased by 2.2% to RM1.356 trillion. Lower trade was recorded with Singapore, Hong Kong SAR, France and Japan. Higher trade however was registered with the United States (US), Saudi Arabia and the Philippines. In tandem with subdued external demand, exports decreased by 1.1% to RM728.52 billion while imports contracted by 3.3% to RM627.66 billion.
Total trade in September 2019 stood at RM147.07 billion, decreased by 2.7% year-on-year (y-o-y). Lower trade was recorded with Singapore, Hong Kong SAR, Taiwan, Australia, Thailand and the Netherlands. However, higher trade was registered with China, India, the Republic of Korea (ROK), the US and Saudi Arabia. Exports decreased by 6.8% to RM77.7 billion. Imports amounted to RM69.37 billion, an increase of 2.4% from September 2018.Trade surplus in September 2019 was valued at RM8.34 billion, declined by 46.5% compared to September 2018. This marked the 263rd consecutive months of trade surplus since November 1997.
On a month-on-month (m-o-m) basis, total trade, exports, imports and trade surplus registered a decline of 3.1%, 4.5%, 1.6% and 23.5%, respectively.
Total trade in the third quarter (Q3) of 2019 contracted by 3.7% to RM460.53 billion compared to Q3 2018. Total exports reached RM247.02 billion, 1.9% lower from the same period last year while imports contracted by 5.8% to RM213.51 billion. Trade surplus in Q3 2019 recorded a double-digit increase of 33.3% to RM33.51 billion from RM25.14 billion registered in Q3 2018.
Compared with the second quarter (Q2) of 2019, total trade, exports and trade surplus increased by 0.01%, 0.6% and 10.2% respectively, while imports slipped by 0.7%.
Export Performance of Major Sectors
Manufactured Goods Contributed 85.4% of Exports in September 2019 .
Exports of manufactured goods in September 2019 which amounted to RM66.34 billion or 85.4% of total exports, contracted by 5.8% mainly due to lower exports of electrical and electronic (E&E) products, petroleum products, chemicals and chemical products as well as textiles, apparels and footwear. However, increases were registered in exports of transport equipment, optical and scientific equipment as well as machinery, equipment and parts.
Exports of mining goods (7.3% share) was valued at RM5.69 billion, declined by 15.2% on account of lower exports of crude petroleum due to lower volume and Average Unit Value (AUV).Exports of agriculture goods (6.7% share) totalled RM5.17 billion, down by 8.3% due to lower exports of palm oil and palm oil-based agriculture products, especially palm oil which recorded a decline of 9.3% to RM3.05 billion following lower volume and AUV.
Major exports in September 2019:
• E&E products, valued at RM29.04 billion and constituted 37.4% of total exports, decreased by 12.2% from September 2018;
• Petroleum products, RM5.34 billion, 6.9% of total exports, decreased by 13.4%;
• Chemicals and chemical products, RM4.33 billion, 5.6% of total exports, decreased by 11.5%;
• Optical and scientific equipment, RM3.55 billion, 4.6% of total exports, increased by 12.8%; and
• Palm oil and palm oil-based agriculture products, RM3.43 billion, 4.4% of total exports, decreased by 9.4%.

4MITI Tower, No. 7, Jalan Sultan Haji Ahmad Shah, 50480 Kuala Lumpur, Malaysia Tel: +603 - 8000 8000 Fax: +603 - 6202 9446
MITI Weekly Bulletin | www.miti.gov.my
Med
ia R
elea
seCompared to August 2019, exports of manufactured goods, agriculture goods and mining goods exports declined by 3.4%, 13.5% and 5%, respectively.
During January to September 2019, exports of manufactured goods decreased marginally by 0.1% to RM614.7 billion compared to the same period of 2018, underpinned by lower exports of petroleum products, E&E products and manufactures of metal. Exports of mining goods contracted by 5.1% to RM60.19 billion due mainly to lower exports of crude petroleum. Exports of agriculture goods decreased by 4.6% to RM48.22 billion attributed to lower exports of palm oil and palm oil-based agriculture products.
Trade Performance with Major Markets
Exports to ASEAN Sustained at Almost the Same Level in January-September 2019
Trade with ASEAN in September 2019 which made up 26.2% of Malaysia’s total trade decreased by 8.1% y-o-y to RM38.54 billion. Exports to ASEAN decreased by 8.6% to RM21.62 billion, owing to lower exports of E&E products. E&E exports decreased by 23.7% to RM6.68 billion, accounting for 30.9% of Malaysia’s exports to the region. Meanwhile, machinery, equipment and parts, transport equipment, manufactures of metal as well as iron and steel products recorded expansion. Imports from ASEAN contracted by 7.4% to RM16.92 billion.
Breakdown of exports to ASEAN countries:• Singapore RM10.72 billion, decreased by 11.7%• Thailand RM4.02 billion, ↓4.3%• Viet Nam RM2.46 billion, ↓5.4%• Indonesia RM2.42 billion, ↓11.8%• Philippines RM1.42 billion, ↓4.2%• Cambodia RM205.1 million, ↑76.7%• Myanmar RM194.8 million, ↑9.5%• Brunei RM174.4 million, ↓1.5%• Lao PDR RM3.3 million, ↑22.7%
Exports to major markets in ASEAN that recorded contraction were Singapore, which decreased by RM1.42 billion and Thailand (↓RM181.1 million) due to lower exports of E&E products and Viet Nam (↓RM140.1 million, petroleum products).
On a m-o-m basis, trade and exports recorded a decline of 3.1% and 5.6% respectively and imports increased by 0.3%.
From January to September 2019, trade with ASEAN contracted by 4% to RM360.41 billion compared to the same period of 2018. Exports to this region sustained at almost the same level at RM209.1 billion compared to RM209.95
billion in the same period last year. Lower exports registered for petroleum products, crude petroleum, E&E products as well as palm oil and palm oil based agriculture products. Imports slipped by 8.5% to RM151.32 billion.
China - Trade Pick Up in September 2019
In September 2019, trade with China which represented 17.2% of Malaysia’s total trade or RM25.25 billion, rebounded by 3.8% y-o-y after a decline of 7.9% in August. Exports was valued at RM10.85 billion, contracted by 3% on lower exports of E&E products, chemicals and chemical products, petroleum products and liquefied natural gas (LNG). Products that recorded increases were palm oil and palm oil based agriculture products, paper and pulp products, optical and scientific equipment as well as processed food. Imports from China expanded by 9.7% to RM14.4 billion.
Compared to August 2019, trade, exports and imports dipped by 4.7%, 5.6% and 4%, respectively.
Trade with China for the period of January to September 2019 stood at RM229 billion, decreased by 0.7% compared to the same period of 2018. Exports to China declined marginally by 0.4% to RM99.81 billion, on account of lower exports of E&E products, petroleum products and rubber products. However, exports expansion was seen for LNG, iron and steel products as well as chemicals and chemical products. Imports from China registered a decrease of 0.8% to RM129.19 billion.
EU – Exports of E&E Products, Petroleum Products and Machinery Recorded Increases in January-September 2019
Trade with the European Union (EU) which contributed 9.2% to Malaysia’s total trade in September 2019, decreased by 3.3% y-o-y to RM13.47 billion. Exports amounted to RM7.36 billion, declining by 10.8% on account of lower exports of E&E products as well as palm oil and palm oil-based agriculture products. Imports from the EU totalled RM6.11 billion, up by 7.5%. On a m-o-m basis, trade, exports and imports fell by 6.9%, 8.5% and 4.8%, respectively.
For the first 9 months of 2019, trade with the EU was valued at RM132.16 billion, decreased by 3.9% compared to the same period of 2018. Exports amounted to RM72.82 billion, contracted by 2.4% due to lower exports of manufactures of metal, palm oil and palm oil-based agriculture products as well as chemicals and chemical

5MITI Tower, No. 7, Jalan Sultan Haji Ahmad Shah, 50480 Kuala Lumpur, Malaysia Tel: +603 - 8000 8000 Fax: +603 - 6202 9446
MITI Weekly Bulletin | www.miti.gov.my
Med
ia R
elea
seproducts. Increases in exports were recorded for E&E products, petroleum products as well as machinery, equipment and parts. Imports from the EU decreased by 5.8% to RM59.34 billion.
Exports to the US Continued to Expand in September 2019
Trade with the US in September 2019 rose by 3.8% y-o-y to RM13.79 billion, accounting for 9.4% of Malaysia’s total trade. Exports to the US continued to grow for 6 straight months with an increase of 6.6% y-o-y to RM8.22 billion in September 2019. Higher exports of manufactured goods were recorded particularly E&E products, wood products, manufactures of metal, non-metallic mineral products as well as transport equipment. Imports from the US decreased marginally by 0.04% to RM5.56 billion.
Compared to August 2019, trade, exports and imports decreased by 4.5%, 1.2% and 9%, respectively.
During the first 9 months of 2019, trade with the US expanded by 4.8% to RM120.26 billion compared to the same period of 2018. Exports grew by 4.6% to RM69.99 billion driven by higher exports of E&E products, wood products, manufactures of plastics, processed food and rubber products. Imports from the US increased by 5% to RM50.27 billion.
Japan - Trade Rebounded after 3 Months of Contraction
In September 2019, trade with Japan which absorbed 7.3% of Malaysia’s total trade improved by 0.6% y-o-y to RM10.74 billion. Exports totalled RM5.42 billion, decreasing by 1.7% due to lower exports of wood products, LNG and manufactures of metal. However, expansion in exports were recorded for crude petroleum, paper and pulp products, palm oil and palm oil-based agriculture products as well as transport equipment. Imports from Japan rose by 3% to RM5.32 billion. On a m-o-m basis, trade, exports and imports expanded by 4.6%, 9.2% and 0.3%, respectively.
For the period of January to September 2019, trade with Japan was valued at RM95.59 billion, decreased by 3.4% compared to the same period of 2018. Exports amounted to RM49.47 billion, a decline of 3.8% due to lower exports of LNG, optical and scientific equipment as well as wood products. Increases in exports were recorded for transport equipment, processed food as well as textiles, apparels and footwear. Imports from Japan were lower by 2.9% to RM46.12 billion.
Trade with FTA Partners
In September 2019, trade with Free Trade Agreement (FTA) partners which constituted 62.6% of Malaysia’s total trade stood at RM91.99 billion, a decline of 1.8% y-o-y. Exports to FTA partners was valued at RM47.18 billion, a decrease of 5.9% and imports totalled RM44.82 billion, an increase of 2.8%.Increases in exports were recorded to India, by 10.6% to RM2.94 billion mainly attributed by higher uptake of palm oil and palm oil-based agriculture products and Pakistan (↑34.6% to RM472.6 million) due to petroleum products.Compared to August 2019, trade, exports and imports recorded a decrease of 2.1%, 3.9% and 0.1%, respectively.
Trade with FTA partners for the first 9 months of 2019 which made up 62% of Malaysia’s total trade amounted to RM841.16 billion, declined by 2.4%. Exports were valued at RM445.99 billion, a decrease of 1.1% while imports reduced by 3.9% to RM395.17 billion.
Import Performance
Total imports in September 2019 grew by 2.4% to RM69.37 billion from RM67.77 billion in September 2018. The three main categories of imports by end use which accounted for 77.4% of total imports were:
• Intermediate goods, valued at RM39.93 billion or 57.6% share of total imports, increased by 11.1%, following higher imports of primary fuel and lubricants particularly mineral fuels and oils;
• Capital goods, valued at RM7.85 billion or 11.3% of total imports, up by 7.3%, due mainly to higher imports of capital good (except transport equipment) particularly parts of electrical machinery and equipment; and
• Consumption goods, valued at RM5.93 billion or 8.5% of total imports, expanded by 15.1%, as a result of higher imports of semi-durables particularly plastics and articles.
During January to September 2019, imports amounted to RM627.66 billion, declined by 3.3% from the same period of 2018. Intermediate goods totalled RM346.79 billion, increased by 1.1%, capital goods (RM73.45 billion, ↓11.5%) and consumption goods (RM54.31 billion, ↑1.8%).
Ministry of International Trade and Industry04 November 2019

6MITI Tower, No. 7, Jalan Sultan Haji Ahmad Shah, 50480 Kuala Lumpur, Malaysia Tel: +603 - 8000 8000 Fax: +603 - 6202 9446
MITI Weekly Bulletin | www.miti.gov.my
Mal
aysi
a St
atis
tics
Overview of External Trade, January-September 2019
Source: Department of Statistics, Malaysia
Note: Number in percentage refers to share to total exports/imports/trade
45%
9%
46% RM1,356.2 billion(-2.2%)
Re-exports
Impo
rts
Domestic Exports
Total Trade 71.2
87.5100.9
Trade Balance for Jan-Sep(RM billion)
20172018
2019
60%
40%
Agriculture
53%47%
ManufacturedManufactured
56%
44%
Mining
Total Trade RM80.2 billion
Total Trade RM1,151.7
billion
Total Trade RM107.7
billion
Exports Imports
Total Exports RM728.5 billion
Total Imports RM627.7
billion
Trade performance Major Sectors
Exports ImportsTop Five
Destinations Sources
SingaporeRM99.83b
P.R.ChinaRM99.81b
USARM69.99b
Hong Kong SARRM49.14b
JapanRM49.47b
P.R.ChinaRM129.19b
SingaporeRM64.89b
USARM50.27b
Hong Kong SARRM42.81b
JapanRM46.12b
Top Five Industries
Compiled by Ministry of International Trade and Industry
Electrical & Electronics Products
RM276.63b
Petroleum ProductsRM52.40b
Chemicals &Chemical ProductsRM42.30b
Manufactures of Metal
RM31.37b
Palm Oil & Palm Oil Based
Agriculture ProductsRM31.83b
Electrical & Electronics Products
RM181.17b
Petroleum ProductsRM55.62b
Chemicals &Chemical ProductsRM61.80b
Manufactures of Metal
RM33.14b
Machinery, Equipment &
PartsRM52.36b
7MITI Tower, No. 7, Jalan Sultan Haji Ahmad Shah, 50480 Kuala Lumpur, Malaysia Tel: +603 - 8000 8000 Fax: +603 - 6202 9446
MITI Weekly Bulletin | www.miti.gov.my
Mal
aysi
a St
atis
tics
Source: Department of Statistics, Malaysia
Petroleum ProductsRM55.62b
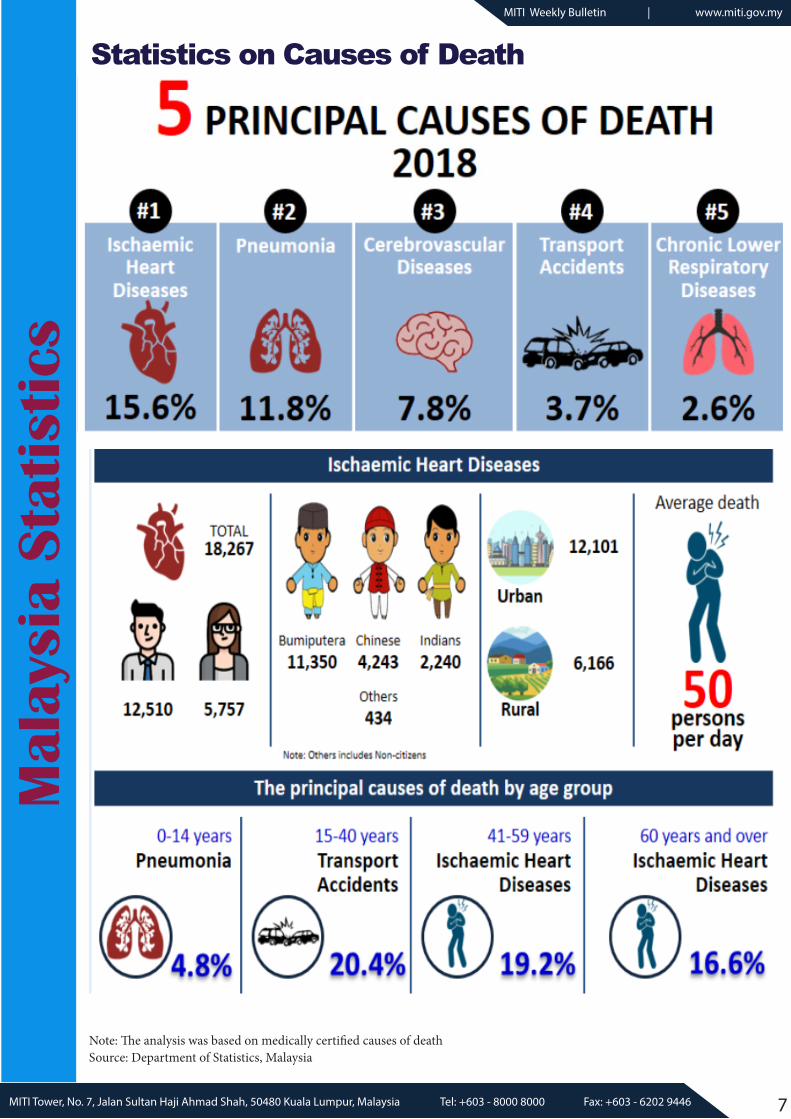
Statistics on Causes of Death
Note: The analysis was based on medically certified causes of death
8MITI Tower, No. 7, Jalan Sultan Haji Ahmad Shah, 50480 Kuala Lumpur, Malaysia Tel: +603 - 8000 8000 Fax: +603 - 6202 9446
MITI Weekly Bulletin | www.miti.gov.my
Sust
aina
ble
Dev
elop
men
t Goa
ls In
dica
tors
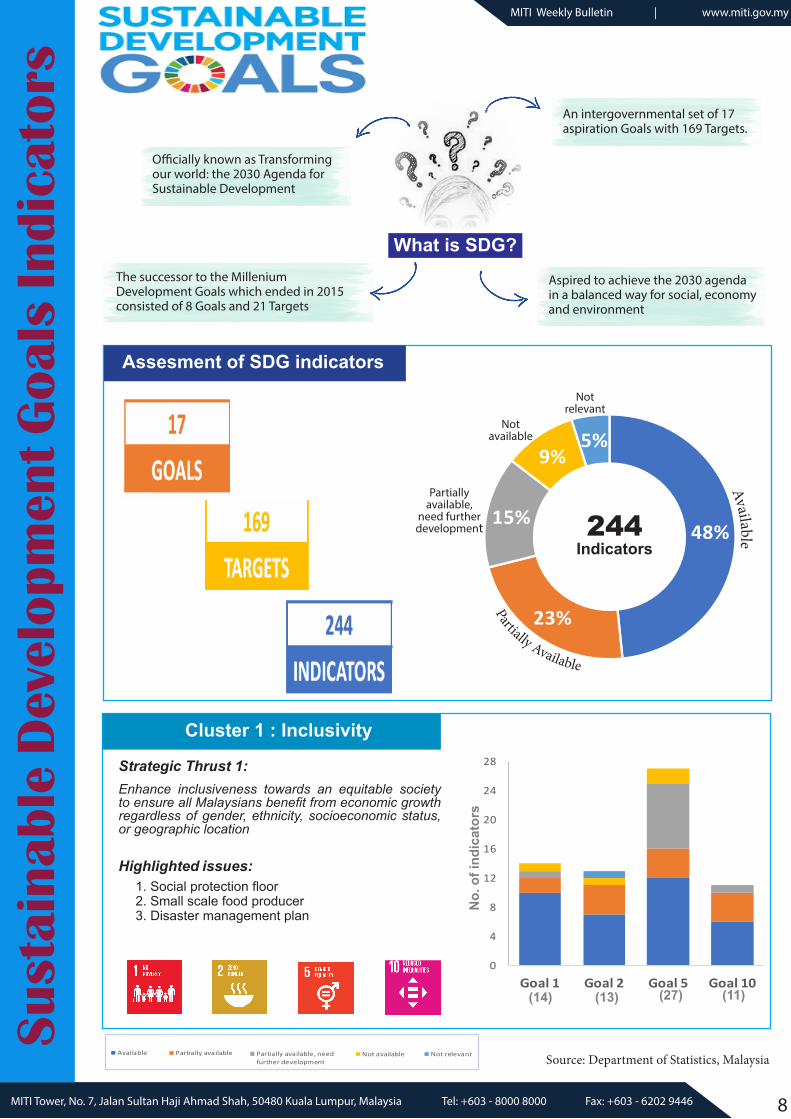
What is SDG?
Officially known as Transforming our world: the 2030 Agenda for Sustainable Development
An intergovernmental set of 17 aspiration Goals with 169 Targets.
The successor to the Millenium Development Goals which ended in 2015 consisted of 8 Goals and 21 Targets
Aspired to achieve the 2030 agenda in a balanced way for social, economy and environment
0
4
8
12
16
20
24
28
Goal 1 Goal 2 Goal 5 Goal 10
Not relevant
Not available
Partially available, needfurther development
Partially available
Available
0
4
8
12
16
20
24
28
Goal 1 Goal 2 Goal 5 Goal 10
Not relevant
Not available
Partially available, needfurther development
Partially available
Available
0
4
8
12
16
20
24
28
Goal 1 Goal 2 Goal 5 Goal 10
Not relevant
Not available
Partially available, needfurther development
Partially available
Available
0
4
8
12
16
20
24
28
Goal 1 Goal 2 Goal 5 Goal 10
Not relevant
Not available
Partially available, needfurther development
Partially available
Available
0
4
8
12
16
20
24
28
Goal 1 Goal 2 Goal 5 Goal 10
Not relevant
Not available
Partially available, needfurther development
Partially available
Available
0
4
8
12
16
20
24
28
Goal 1 Goal 2 Goal 5 Goal 10
Not relevant
Not available
Partially available, needfurther development
Partially available
Available
(14) (13) (11)(27)
Cluster 1 : Inclusivity
Strategic Thrust 1: Enhance inclusiveness towards an equitable society to ensure all Malaysians benefit from economic growth regardless of gender, ethnicity, socioeconomic status, or geographic location
Highlighted issues: 1. Social protection floor2. Small scale food producer3. Disaster management plan
No.
of i
ndic
ator
s
Assesment of SDG indicators
Partially available,
need further development 48%
23%
15%
9%5%
Available
Partially Available
Not available
Not relevant
244Indicators
Source: Department of Statistics, Malaysia

9MITI Tower, No. 7, Jalan Sultan Haji Ahmad Shah, 50480 Kuala Lumpur, Malaysia Tel: +603 - 8000 8000 Fax: +603 - 6202 9446
MITI Weekly Bulletin | www.miti.gov.my
0
4
8
12
16
20
24
28
Goal 1 Goal 2 Goal 5 Goal 10
Not relevant
Not available
Partially available, needfurther development
Partially available
Available
0
4
8
12
16
20
24
28
Goal 1 Goal 2 Goal 5 Goal 10
Not relevant
Not available
Partially available, needfurther development
Partially available
Available
0
4
8
12
16
20
24
28
Goal 1 Goal 2 Goal 5 Goal 10
Not relevant
Not available
Partially available, needfurther development
Partially available
Available
0
4
8
12
16
20
24
28
Goal 1 Goal 2 Goal 5 Goal 10
Not relevant
Not available
Partially available, needfurther development
Partially available
Available
0
4
8
12
16
20
24
28
Goal 1 Goal 2 Goal 5 Goal 10
Not relevant
Not available
Partially available, needfurther development
Partially available
Available
0
4
8
12
16
20
24
28
Goal 3 Goal 11 Goal 16
Not relevant
Not available
Partially available, needfurther development
Partially available
Available
(27) (15) (23)
Cluster 2 : Well beingStrategic Thrust 2: Improve the well-being for all to promote a social advanced Malaysia with healthy individuals and happy households, living in cohesive and united communities
Highlighted issues: 1. Urbanization2. Crime statistics N
o. o
f ind
icat
ors
Sust
aina
ble
Dev
elop
men
t Goa
ls In
dica
tors
Cluster 3 : Human capital
Strategic Thrust 3: Accelerate human capital development for an advanced nation to improve labour productivity, deliver a higher-skilled workforce, and create a virtuous cycle of job creation, growth and social development
Highlighted issues: 1. Pelan Pendidikan2. NER3. Literacy & Numeracy4. Drop out5. 43 UNESCO indicators
0
2
4
6
8
10
12
Goal 4
(11)
No.
of i
ndic
ator
s
0
2
4
6
8
10
12
14
Goal 6 Goal 7 Goal 12 Goal 13 Goal 14 Goal 15(11) (6) (8)(13)
Cluster 1 : Inclusivity
Strategic Thrust 4: Pursue green growth for sustainability and resilience to ensure “green growth” will be a way of life and lead to strengthened food,water, and energy security; lower environmental risks; and ultimately, better well-being and quality of life
Highlighted issues: 1. SCP Blueprint
No.
of i
ndic
ator
s
Cluster 4 : Environment & natural resources
(14)(10)
Cluster 5 : Economic growth
Strategic Thrust 5: Strengthen infrastructure to support economic expansion to ensure all Malaysians will have access to basic amenities and be connected through integrated transport and high-speed Internet
No.
of i
ndic
ator
s
Strategic Thrust 6: Re-engineer growth for greater prosperity to ensure quality growth and international competitiveness. All economic sectors will migrate towards more knowledge-intensive and high value-added activities with greater productivity
0
4
8
12
16
20
24
28
Goal 8 Goal 9 Goal 17
(17) (12) (25)
Source: Department of Statistics, MalaysiaSource: Department of Statistics, Malaysia
10MITI Tower, No. 7, Jalan Sultan Haji Ahmad Shah, 50480 Kuala Lumpur, Malaysia Tel: +603 - 8000 8000 Fax: +603 - 6202 9446
MITI Weekly Bulletin | www.miti.gov.my
Inte
rnat
iona
l R
epor
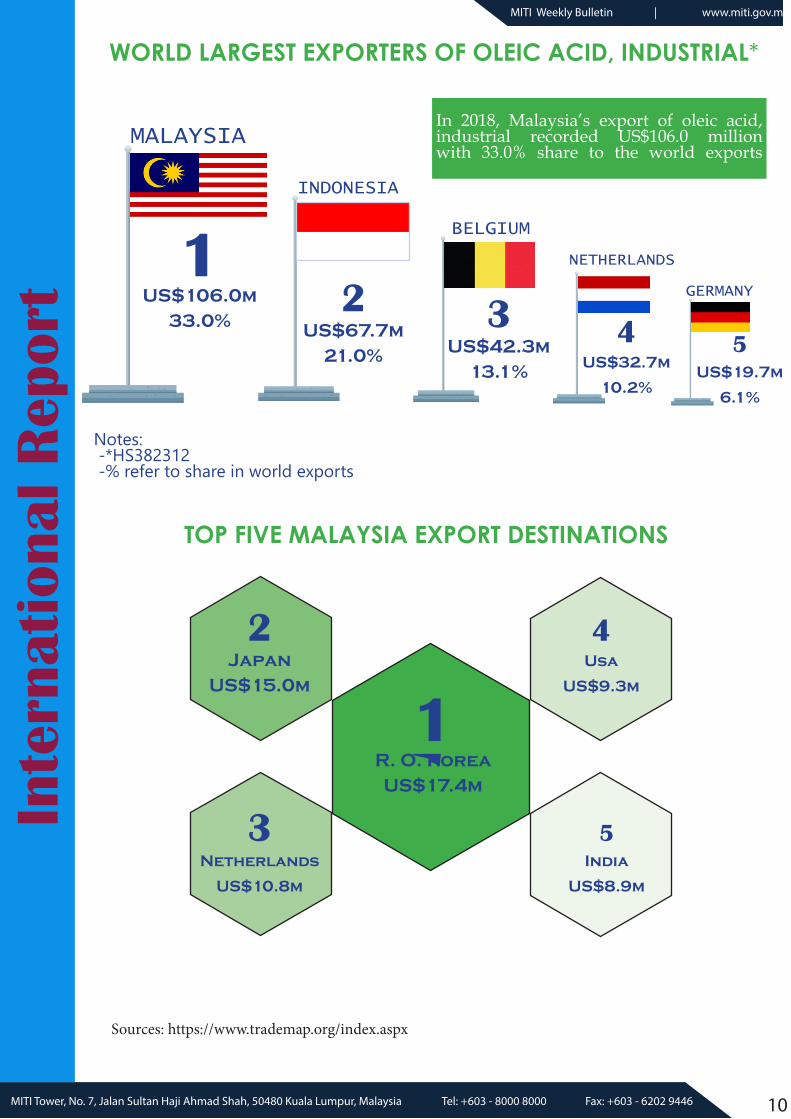
tWORLD LARGEST EXPORTERS OF OLEIC ACID, INDUSTRIAL*
MALAYSIA
GERMANY
NETHERLANDS
BELGIUM
INDONESIA
1US$106.0m
33.0%5
US$19.7m
6.1%
4US$32.7m
10.2%
3US$42.3m
13.1%
2US$67.7m
21.0%
In 2018, Malaysia’s export of oleic acid, industrial recorded US$106.0 million with 33.0% share to the world exports
Notes: -*HS382312 -% refer to share in world exports
TOP FIVE MALAYSIA EXPORT DESTINATIONS
1R. O. KoreaUS$17.4m
2Japan
US$15.0m
3Netherlands
US$10.8m
4Usa
US$9.3m
5India
US$8.9m
Sources: https://www.trademap.org/index.aspx

11MITI Tower, No. 7, Jalan Sultan Haji Ahmad Shah, 50480 Kuala Lumpur, Malaysia Tel: +603 - 8000 8000 Fax: +603 - 6202 9446
MITI Weekly Bulletin | www.miti.gov.my
T e c h n i c a l N o t e sSource: https://www.wto.org
#MyAPEC2020 | Malaysia
Be part of something BIG?Come and join us, be a volunteer for APEC 2020!
For more information about the volunteer program, kindly click the following links:
https://www.miti.gov.my/index.php/pages/view/5657?mid=626
5US$19.7m
6.1%
Malaysia's Top Three Export Sectors to Major APEC Economies 2018
Electrical & Electronics Products
Petroleum Products
Chemicals &Chemical Products
207.5225.8 234.7
277.9319.8
2014 2015 2016 2017 2018
60.8
45.4 46.9
63.5 64.5
2014 2015 2016 2017 2018
30.0 32.6 34.639.5
49.0
2014 2015 2016 2017 2018
RM billion RM billionRM billion
SingaporeRM64.1b
Hong Kong SARRM58.6b
PRCRM55.5b
SingaporeRM21.6b
P.R.ChinaRM11.3b
Viet NamRM9.1b
PRCRM17.3b
IndonesiaRM6.4b
ThailandRM5.0b
Source: Department of Statistics, Malaysia
12MITI Tower, No. 7, Jalan Sultan Haji Ahmad Shah, 50480 Kuala Lumpur, Malaysia Tel: +603 - 8000 8000 Fax: +603 - 6202 9446
MITI Weekly Bulletin | www.miti.gov.myMITI Weekly Bulletin | www.miti.gov.my
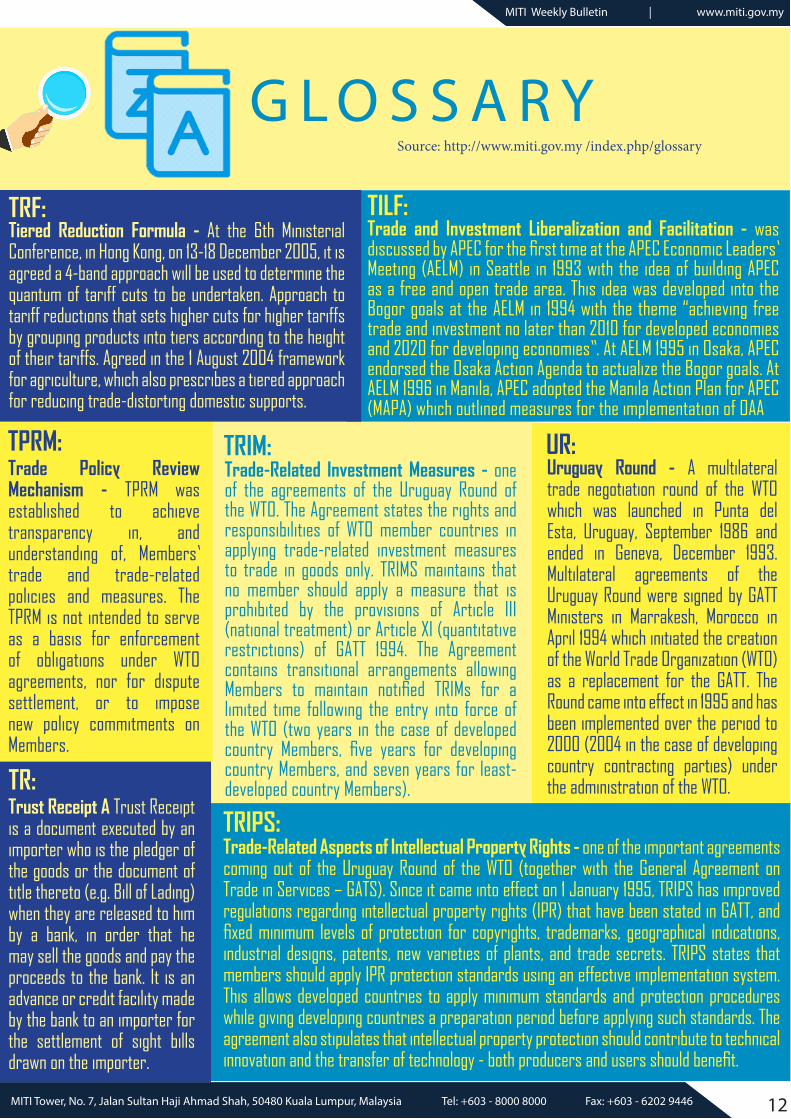
Trade and Investment Liberalization and Facilitation - was discussed by APEC for the first time at the APEC Economic Leaders’ Meeting (AELM) in Seattle in 1993 with the idea of building APEC as a free and open trade area. This idea was developed into the Bogor goals at the AELM in 1994 with the theme “achieving free trade and investment no later than 2010 for developed economies and 2020 for developing economies”. At AELM 1995 in Osaka, APEC endorsed the Osaka Action Agenda to actualize the Bogor goals. At AELM 1996 in Manila, APEC adopted the Manila Action Plan for APEC (MAPA) which outlined measures for the implementation of OAA
TILF:
Uruguay Round - A multilateral trade negotiation round of the WTO which was launched in Punta del Esta, Uruguay, September 1986 and ended in Geneva, December 1993. Multilateral agreements of the Uruguay Round were signed by GATT Ministers in Marrakesh, Morocco in April 1994 which initiated the creation of the World Trade Organization (WTO) as a replacement for the GATT. The Round came into effect in 1995 and has been implemented over the period to 2000 (2004 in the case of developing country contracting parties) under the administration of the WTO.
UR:
TRIPS:Trade-Related Aspects of Intellectual Property Rights - one of the important agreements coming out of the Uruguay Round of the WTO (together with the General Agreement on Trade in Services – GATS). Since it came into effect on 1 January 1995, TRIPS has improved regulations regarding intellectual property rights (IPR) that have been stated in GATT, and fixed minimum levels of protection for copyrights, trademarks, geographical indications, industrial designs, patents, new varieties of plants, and trade secrets. TRIPS states that members should apply IPR protection standards using an effective implementation system. This allows developed countries to apply minimum standards and protection procedures while giving developing countries a preparation period before applying such standards. The agreement also stipulates that intellectual property protection should contribute to technical innovation and the transfer of technology - both producers and users should benefit.
TR:Trust Receipt A Trust Receipt is a document executed by an importer who is the pledger of the goods or the document of title thereto (e.g. Bill of Lading) when they are released to him by a bank, in order that he may sell the goods and pay the proceeds to the bank. It is an advance or credit facility made by the bank to an importer for the settlement of sight bills drawn on the importer.
G L O S S A R YSource: http://www.miti.gov.my /index.php/glossary
Trade Policy Review Mechanism - TPRM was established to achieve transparency in, and understanding of, Members’ trade and trade-related policies and measures. The TPRM is not intended to serve as a basis for enforcement of obligations under WTO agreements, nor for dispute settlement, or to impose new policy commitments on Members.
TPRM:
Tiered Reduction Formula - At the 6th Ministerial Conference, in Hong Kong, on 13-18 December 2005, it is agreed a 4-band approach will be used to determine the quantum of tariff cuts to be undertaken. Approach to tariff reductions that sets higher cuts for higher tariffs by grouping products into tiers according to the height of their tariffs. Agreed in the 1 August 2004 framework for agriculture, which also prescribes a tiered approach for reducing trade-distorting domestic supports.
TRF:
Trade-Related Investment Measures - one of the agreements of the Uruguay Round of the WTO. The Agreement states the rights and responsibilities of WTO member countries in applying trade-related investment measures to trade in goods only. TRIMS maintains that no member should apply a measure that is prohibited by the provisions of Article III (national treatment) or Article XI (quantitative restrictions) of GATT 1994. The Agreement contains transitional arrangements allowing Members to maintain notified TRIMs for a limited time following the entry into force of the WTO (two years in the case of developed country Members, five years for developing country Members, and seven years for least-developed country Members).
TRIM:
13MITI Tower, No. 7, Jalan Sultan Haji Ahmad Shah, 50480 Kuala Lumpur, Malaysia Tel: +603 - 8000 8000 Fax: +603 - 6202 9446
MITI Weekly Bulletin | www.miti.gov.myMITI Weekly Bulletin | www.miti.gov.my
T e c h n i c a l N o t e sSource: https://www.wto.org
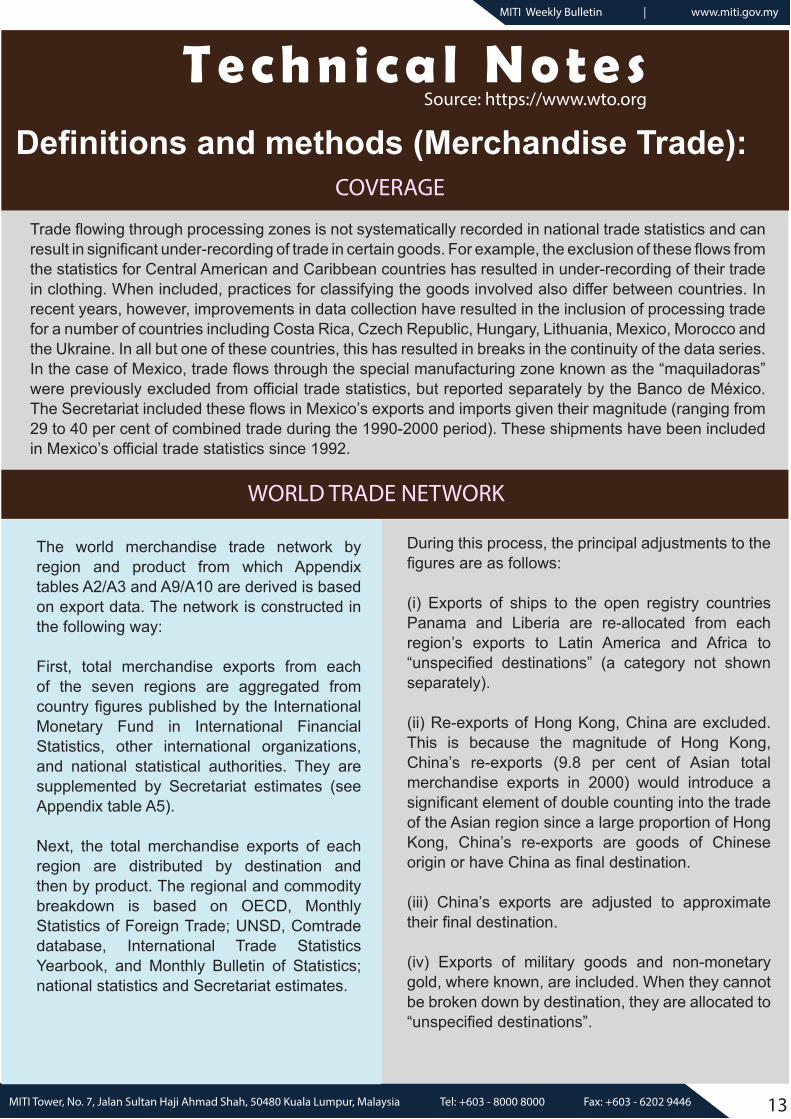
Definitions and methods (Merchandise Trade):
During this process, the principal adjustments to the figures are as follows:
(i) Exports of ships to the open registry countries Panama and Liberia are re-allocated from each region’s exports to Latin America and Africa to “unspecified destinations” (a category not shown separately).
(ii) Re-exports of Hong Kong, China are excluded. This is because the magnitude of Hong Kong, China’s re-exports (9.8 per cent of Asian total merchandise exports in 2000) would introduce a significant element of double counting into the trade of the Asian region since a large proportion of Hong Kong, China’s re-exports are goods of Chinese origin or have China as final destination.
(iii) China’s exports are adjusted to approximate their final destination.
(iv) Exports of military goods and non-monetary gold, where known, are included. When they cannot be broken down by destination, they are allocated to “unspecified destinations”.
COVERAGE
Trade flowing through processing zones is not systematically recorded in national trade statistics and can result in significant under-recording of trade in certain goods. For example, the exclusion of these flows from the statistics for Central American and Caribbean countries has resulted in under-recording of their trade in clothing. When included, practices for classifying the goods involved also differ between countries. In recent years, however, improvements in data collection have resulted in the inclusion of processing trade for a number of countries including Costa Rica, Czech Republic, Hungary, Lithuania, Mexico, Morocco and the Ukraine. In all but one of these countries, this has resulted in breaks in the continuity of the data series. In the case of Mexico, trade flows through the special manufacturing zone known as the “maquiladoras” were previously excluded from official trade statistics, but reported separately by the Banco de México. The Secretariat included these flows in Mexico’s exports and imports given their magnitude (ranging from 29 to 40 per cent of combined trade during the 1990-2000 period). These shipments have been included in Mexico’s official trade statistics since 1992.
The world merchandise trade network by region and product from which Appendix tables A2/A3 and A9/A10 are derived is based on export data. The network is constructed in the following way:
First, total merchandise exports from each of the seven regions are aggregated from country figures published by the International Monetary Fund in International Financial Statistics, other international organizations, and national statistical authorities. They are supplemented by Secretariat estimates (see Appendix table A5).
Next, the total merchandise exports of each region are distributed by destination and then by product. The regional and commodity breakdown is based on OECD, Monthly Statistics of Foreign Trade; UNSD, Comtrade database, International Trade Statistics Yearbook, and Monthly Bulletin of Statistics; national statistics and Secretariat estimates.
WORLD TRADE NETWORK
14MITI Tower, No. 7, Jalan Sultan Haji Ahmad Shah, 50480 Kuala Lumpur, Malaysia Tel: +603 - 8000 8000 Fax: +603 - 6202 9446
MITI Weekly Bulletin | www.miti.gov.my
Sales Value
Note: *Provisional Data Source: Ministry of International Trade and Industry, Malaysia
-
20
40
60
80
100
120
140
0
5
10
15
20
25
30
35
11 A
ug
18 A
ug
25 A
ug
1 Se
p
8 Se
p
15 S
ep
22 S
ep
29 S
ep
6 O
ct
13 O
ct
20 O
ct
27 O
ct
No.
of C
ertif
icat
e of
Orig
in
RM m
il.
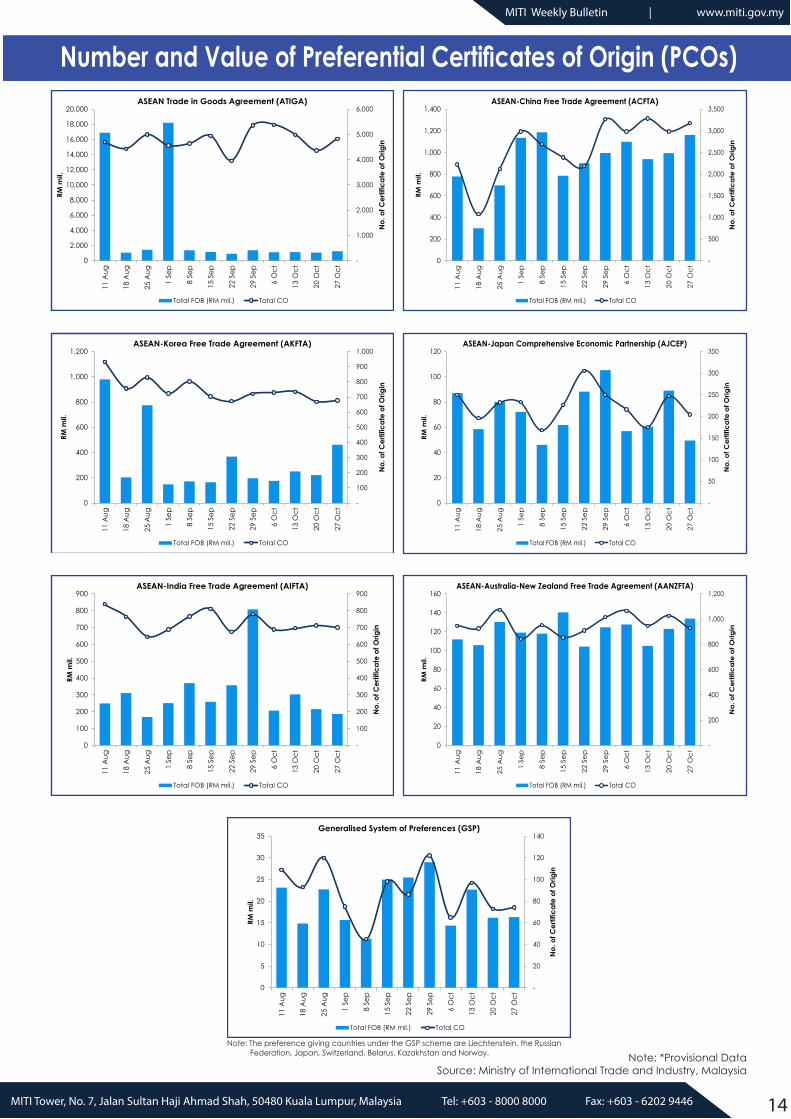
Generalised System of Preferences (GSP)
Total FOB (RM mil.) Total CO
Note: The preference giving countries under the GSP scheme are Liechtenstein, the Russian Federation, Japan, Switzerland, Belarus, Kazakhstan and Norway.
Number and Value of Preferential Certificates of Origin (PCOs)
-
1,000
2,000
3,000
4,000
5,000
6,000
0
2,000
4,000
6,000
8,000
10,000
12,000
14,000
16,000
18,000
20,00011
Aug
18 A
ug
25 A
ug
1 Se
p
8 Se
p
15 S
ep
22 S
ep
29 S
ep
6 O
ct
13 O
ct
20 O
ct
27 O
ct
No.
of C
ertif
icat
e of
Orig
in
RM m
il.
ASEAN Trade in Goods Agreement (ATIGA)
Total FOB (RM mil.) Total CO
-
500
1,000
1,500
2,000
2,500
3,000
3,500
0
200
400
600
800
1,000
1,200
1,400
11 A
ug
18 A
ug
25 A
ug
1 Se
p
8 Se
p
15 S
ep
22 S
ep
29 S
ep
6 O
ct
13 O
ct
20 O
ct
27 O
ct
No.
of C
ertif
icat
e of
Orig
in
RM m
il.
ASEAN-China Free Trade Agreement (ACFTA)
Total FOB (RM mil.) Total CO
-
100
200
300
400
500
600
700
800
900
1,000
0
200
400
600
800
1,000
1,200
11 A
ug
18 A
ug
25 A
ug
1 Se
p
8 Se
p
15 S
ep
22 S
ep
29 S
ep
6 O
ct
13 O
ct
20 O
ct
27 O
ct
No.
of C
ertif
icat
e of
Orig
in
RM m
il.
ASEAN-Korea Free Trade Agreement (AKFTA)
Total FOB (RM mil.) Total CO
-
50
100
150
200
250
300
350
0
20
40
60
80
100
120
11 A
ug
18 A
ug
25 A
ug
1 Se
p
8 Se
p
15 S
ep
22 S
ep
29 S
ep
6 O
ct
13 O
ct
20 O
ct
27 O
ct
No.
of C
ertif
icat
e of
Orig
in
RM m
il.
ASEAN-Japan Comprehensive Economic Partnership (AJCEP)
Total FOB (RM mil.) Total CO
-
100
200
300
400
500
600
700
800
900
0
100
200
300
400
500
600
700
800
900
11 A
ug
18 A
ug
25 A
ug
1 Se
p
8 Se
p
15 S
ep
22 S
ep
29 S
ep
6 O
ct
13 O
ct
20 O
ct
27 O
ct
No.
of C
ertif
icat
e of
Orig
in
RM m
il.
ASEAN-India Free Trade Agreement (AIFTA)
Total FOB (RM mil.) Total CO
-
200
400
600
800
1,000
1,200
0
20
40
60
80
100
120
140
160
11 A
ug
18 A
ug
25 A
ug
1 Se
p
8 Se
p
15 S
ep
22 S
ep
29 S
ep
6 O
ct
13 O
ct
20 O
ct
27 O
ct
No.
of C
ertif
icat
e of
Orig
in
RM m
il.
ASEAN-Australia-New Zealand Free Trade Agreement (AANZFTA)
Total FOB (RM mil.) Total CO
15MITI Tower, No. 7, Jalan Sultan Haji Ahmad Shah, 50480 Kuala Lumpur, Malaysia Tel: +603 - 8000 8000 Fax: +603 - 6202 9446
MITI Weekly Bulletin | www.miti.gov.myMITI Weekly Bulletin | www.miti.gov.my
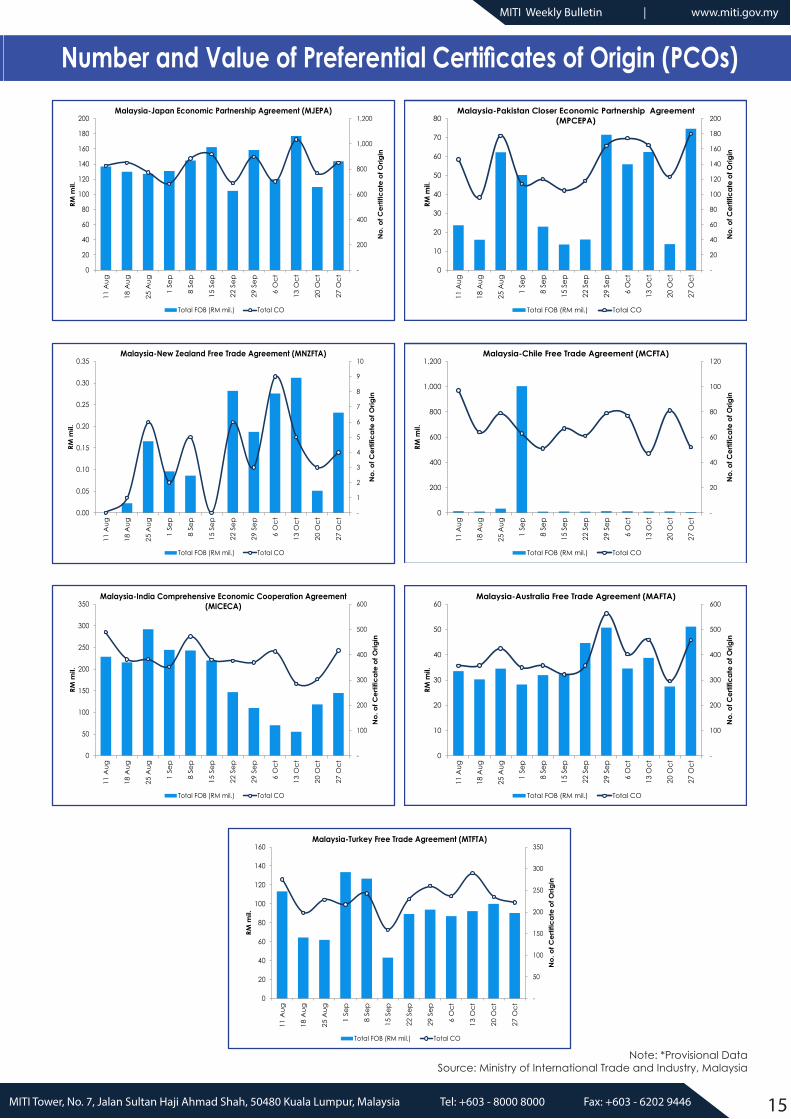
Number and Value of Preferential Certificates of Origin (PCOs)
-
200
400
600
800
1,000
1,200
0
20
40
60
80
100
120
140
160
180
200
11 A
ug
18 A
ug
25 A
ug
1 Se
p
8 Se
p
15 S
ep
22 S
ep
29 S
ep
6 O
ct
13 O
ct
20 O
ct
27 O
ct
No.
of C
ertif
icat
e of
Orig
in
RM m
il.
Malaysia-Japan Economic Partnership Agreement (MJEPA)
Total FOB (RM mil.) Total CO
-
20
40
60
80
100
120
140
160
180
200
0
10
20
30
40
50
60
70
80
11 A
ug
18 A
ug
25 A
ug
1 Se
p
8 Se
p
15 S
ep
22 S
ep
29 S
ep
6 O
ct
13 O
ct
20 O
ct
27 O
ct
No.
of C
ertif
icat
e of
Orig
in
RM m
il.
Malaysia-Pakistan Closer Economic Partnership Agreement (MPCEPA)
Total FOB (RM mil.) Total CO
-
1
2
3
4
5
6
7
8
9
10
0.00
0.05
0.10
0.15
0.20
0.25
0.30
0.35
11 A
ug
18 A
ug
25 A
ug
1 Se
p
8 Se
p
15 S
ep
22 S
ep
29 S
ep
6 O
ct
13 O
ct
20 O
ct
27 O
ct
No.
of C
ertif
icat
e of
Orig
in
RM m
il.
Malaysia-New Zealand Free Trade Agreement (MNZFTA)
Total FOB (RM mil.) Total CO
-
20
40
60
80
100
120
0
200
400
600
800
1,000
1,200
11 A
ug
18 A
ug
25 A
ug
1 Se
p
8 Se
p
15 S
ep
22 S
ep
29 S
ep
6 O
ct
13 O
ct
20 O
ct
27 O
ct
No.
of C
ertif
icat
e of
Orig
in
RM m
il.
Malaysia-Chile Free Trade Agreement (MCFTA)
Total FOB (RM mil.) Total CO
-
100
200
300
400
500
600
0
50
100
150
200
250
300
350
11 A
ug
18 A
ug
25 A
ug
1 Se
p
8 Se
p
15 S
ep
22 S
ep
29 S
ep
6 O
ct
13 O
ct
20 O
ct
27 O
ct
No.
of C
ertif
icat
e of
Orig
in
RM m
il.
Malaysia-India Comprehensive Economic Cooperation Agreement (MICECA)
Total FOB (RM mil.) Total CO
-
100
200
300
400
500
600
0
10
20
30
40
50
60
11 A
ug
18 A
ug
25 A
ug
1 Se
p
8 Se
p
15 S
ep
22 S
ep
29 S
ep
6 O
ct
13 O
ct
20 O
ct
27 O
ct
No.
of C
ertif
icat
e of
Orig
in
RM m
il.
Malaysia-Australia Free Trade Agreement (MAFTA)
Total FOB (RM mil.) Total CO
-
50
100
150
200
250
300
350
0
20
40
60
80
100
120
140
160
11 A
ug
18 A
ug
25 A
ug
1 Se
p
8 Se
p
15 S
ep
22 S
ep
29 S
ep
6 O
ct
13 O
ct
20 O
ct
27 O
ct
No.
of C
ertif
icat
e of
Orig
in
RM m
il.
Malaysia-Turkey Free Trade Agreement (MTFTA)
Total FOB (RM mil.) Total CO
Note: *Provisional Data Source: Ministry of International Trade and Industry, Malaysia
16MITI Tower, No. 7, Jalan Sultan Haji Ahmad Shah, 50480 Kuala Lumpur, Malaysia Tel: +603 - 8000 8000 Fax: +603 - 6202 9446
MITI Weekly Bulletin | www.miti.gov.myMITI Weekly Bulletin | www.miti.gov.my
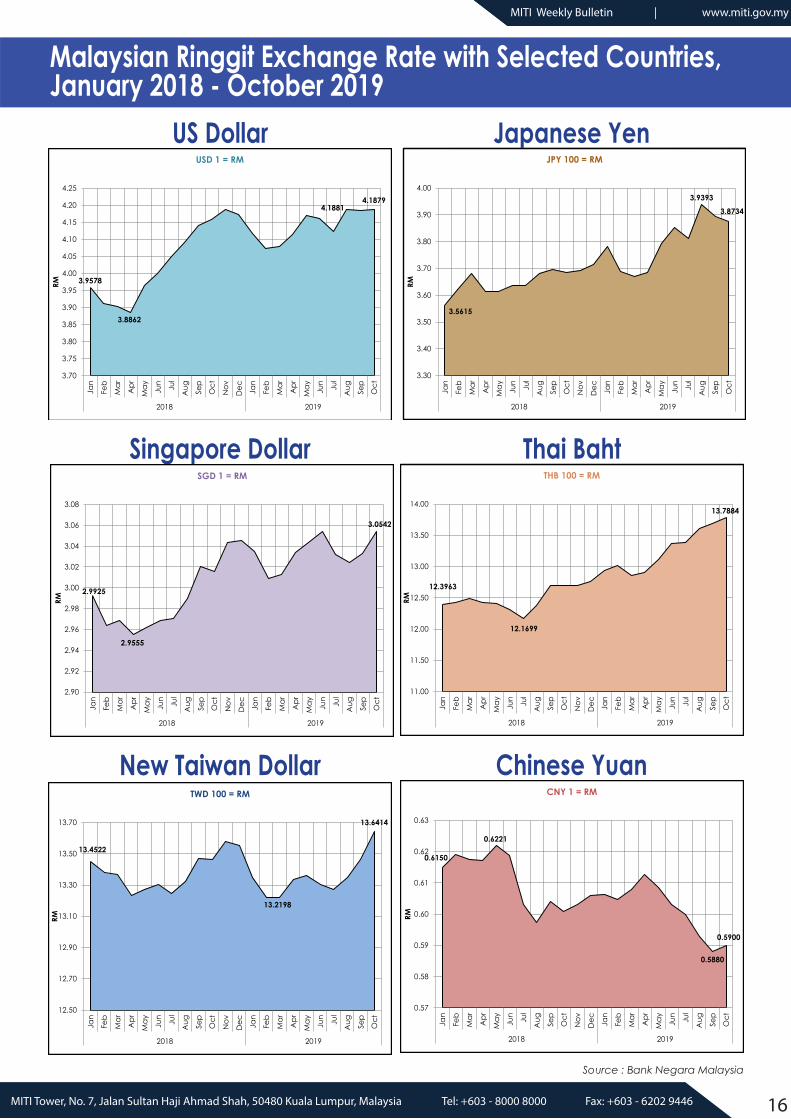
Source : Bank Negara Malaysia
Malaysian Ringgit Exchange Rate with Selected Countries,January 2018 - October 2019
US Dollar
Singapore Dollar
New Taiwan Dollar
Japanese Yen
Thai Baht
Chinese Yuan
3.9578
3.8862
4.18814.1879
3.70
3.75
3.80
3.85
3.90
3.95
4.00
4.05
4.10
4.15
4.20
4.25
Jan
Feb
Ma
r
Apr
Ma
y
Jun
Jul
Aug Se
p
Oct
Nov
Dec Ja
n
Feb
Ma
r
Apr
Ma
y
Jun
Jul
Aug Se
p
Oct
2018 2019
RM
USD 1 = RM
2.9925
2.9555
3.0542
2.90
2.92
2.94
2.96
2.98
3.00
3.02
3.04
3.06
3.08
Jan
Feb
Ma
r
Apr
Ma
y
Jun
Jul
Aug Se
p
Oct
Nov
Dec Ja
n
Feb
Ma
r
Apr
Ma
y
Jun
Jul
Aug Se
p
Oct
2018 2019
RM
SGD 1 = RM
13.4522
13.2198
13.6414
12.50
12.70
12.90
13.10
13.30
13.50
13.70
Jan
Feb
Ma
r
Apr
Ma
y
Jun
Jul
Aug Se
p
Oct
Nov
Dec Ja
n
Feb
Ma
r
Apr
Ma
y
Jun
Jul
Aug Se
p
Oct
2018 2019
RM
TWD 100 = RM
3.5615
3.9393
3.8734
3.30
3.40
3.50
3.60
3.70
3.80
3.90
4.00
Jan
Feb
Ma
r
Apr
Ma
y
Jun
Jul
Aug Se
p
Oct
Nov
Dec Ja
n
Feb
Ma
r
Apr
Ma
y
Jun
Jul
Aug Se
p
Oct
2018 2019RM
JPY 100 = RM
12.3963
12.1699
13.7884
11.00
11.50
12.00
12.50
13.00
13.50
14.00
Jan
Feb
Ma
r
Apr
Ma
y
Jun
Jul
Aug Se
p
Oct
Nov
Dec Ja
n
Feb
Ma
r
Apr
Ma
y
Jun
Jul
Aug Se
p
Oct
2018 2019
RM
THB 100 = RM
0.6150
0.6221
0.5880
0.5900
0.57
0.58
0.59
0.60
0.61
0.62
0.63
Jan
Feb
Ma
r
Apr
Ma
y
Jun
Jul
Aug Se
p
Oct
Nov
Dec Ja
n
Feb
Ma
r
Apr
Ma
y
Jun
Jul
Aug Se
p
Oct
2018 2019
RM
CNY 1 = RM

17MITI Tower, No. 7, Jalan Sultan Haji Ahmad Shah, 50480 Kuala Lumpur, Malaysia Tel: +603 - 8000 8000 Fax: +603 - 6202 9446
MITI Weekly Bulletin | www.miti.gov.my
0.5%*US$61.7
0.6%*US$43.8
3.9%* US$1,623.9
7.7%*US$280.0
(high)
1 November 2019
4.0%*US$260.0
(low)
Sources: Ministry of International Trade and Industry Malaysia, Malaysian Palm Oil Board, Malaysian Rubber Board, Malaysian Cocoa Board, Malaysian Iron and Steel Industry Federation, and Bloomberg.
Commodity Prices
Notes: All figures have been rounded to the nearest decimal point * Refer to % change from the previous week’s price i Average price in the year except otherwise indicated
CRUDE PETROLEUM (BRENT) -per bbl-
1 November 2019
CRUDE PALM OIL -per MT-
3.4%*US$583.5
1 November 2019
RUBBER SMR 20 -per MT-
1.2%*US$1,337.5
COCOA SMC 2 -per MT-
COAL -per MT-
SUGAR -per lbs-
1.1%*US$12.5
SCRAP IRON HMS -per MT-
5 Oct 2018 : US$84.2
Highest2018/2019
17 May 2019 : US$72.2
9 Aug 2019 : US$54.5 28 Dec 2018 : US$52.2
Lowest2018/2019
9 Mar 2018 : US$691.5
Highest2018/2019
1 Nov 2019 : US$583.5
26 July 2019 : US$488.5 23 Nov 2018 : US$448.5
Lowest2018/2019
Average Price 2018 i : US$71.5 Average Price 2018 i : US$600.1
Average Price 2018 i : US$1,371.0 Average Price 2018 i : US$1,535.6 Average Price 2018 i : US¢12.3
Average Price 2018 i : US$380.7 (high)Average Price 2018 i : US$359.6 (low)Average Price 2018 i : US$66.9
Domestic Prices1 November 2019
Steel Bars(per MT)
RM1,910– RM2,060
Billets(per MT)
RM1,650 - RM1,700
1 November 2019 1 November 2019 1 November 2019
1 November 2019
18MITI Tower, No. 7, Jalan Sultan Haji Ahmad Shah, 50480 Kuala Lumpur, Malaysia Tel: +603 - 8000 8000 Fax: +603 - 6202 9446
MITI Weekly Bulletin | www.miti.gov.my
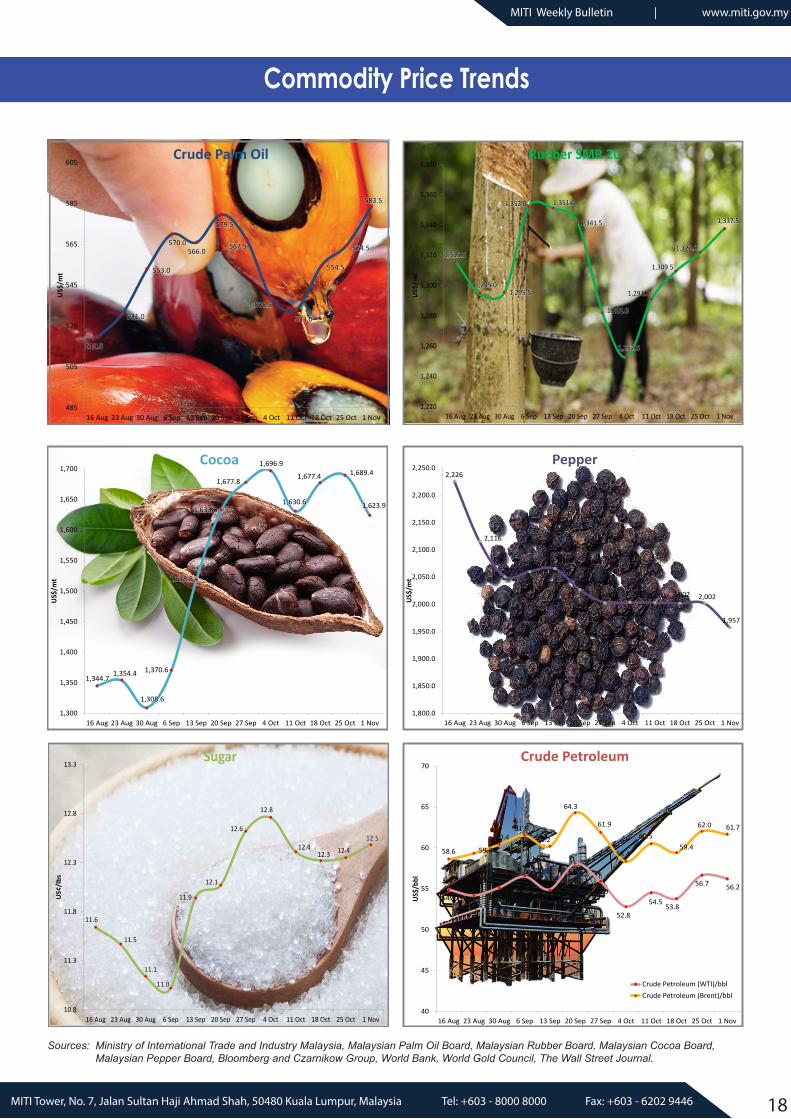
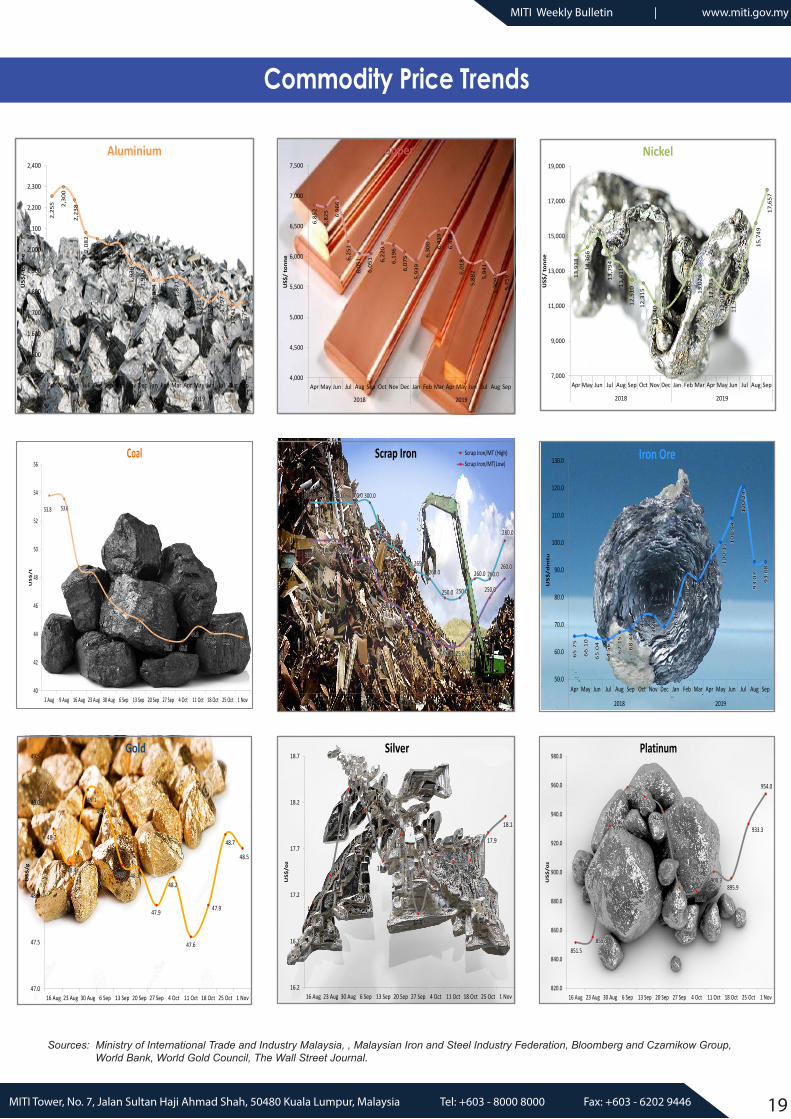
Commodity Price Trends
Sources: Ministry of International Trade and Industry Malaysia, Malaysian Palm Oil Board, Malaysian Rubber Board, Malaysian Cocoa Board, Malaysian Pepper Board, Bloomberg and Czarnikow Group, World Bank, World Gold Council, The Wall Street Journal.
1,344.71,354.4
1,308.6
1,370.6
1,518.8
1,633.0
1,677.8
1,696.9
1,630.6
1,677.4 1,689.4
1,623.9
1,300
1,350
1,400
1,450
1,500
1,550
1,600
1,650
1,700
16 Aug 23 Aug 30 Aug 6 Sep 13 Sep 20 Sep 27 Sep 4 Oct 11 Oct 18 Oct 25 Oct 1 Nov
US$
/mt
Cocoa2,226
2,116
2,0502,059
2,066
2,0272,002 2,004 2,003 2,002 2,002
1,957
1,800.0
1,850.0
1,900.0
1,950.0
2,000.0
2,050.0
2,100.0
2,150.0
2,200.0
2,250.0
16 Aug 23 Aug 30 Aug 6 Sep 13 Sep 20 Sep 27 Sep 4 Oct 11 Oct 18 Oct 25 Oct 1 Nov
US$
/mt
Pepper
1,315.5
1,295.01,295.5
1,352.0 1,351.0
1,341.5
1,282.0
1,252.5
1,291.0
1,309.5
1,322.0
1,337.5
1,220
1,240
1,260
1,280
1,300
1,320
1,340
1,360
1,380
16 Aug 23 Aug 30 Aug 6 Sep 13 Sep 20 Sep 27 Sep 4 Oct 11 Oct 18 Oct 25 Oct 1 NovU
S$/m
t
Rubber SMR 20
54.954.2
55.1
56.5
54.9
58.1
55.9
52.8
54.553.8
56.7 56.2
58.6 59.3
60.461.5
60.2
64.3
61.9
58.4
60.559.4
62.0 61.7
40
45
50
55
60
65
70
16 Aug 23 Aug 30 Aug 6 Sep 13 Sep 20 Sep 27 Sep 4 Oct 11 Oct 18 Oct 25 Oct 1 Nov
US$
/bbl
Crude Petroleum
Crude Petroleum (WTI)/bbl Crude Petroleum (Brent)/bbl
519.5
531.0
553.0
570.0566.0
579.5
567.5
538.5
533.0
554.5
564.5
583.5
485
505
525
545
565
585
605
16 Aug 23 Aug 30 Aug 6 Sep 13 Sep 20 Sep 27 Sep 4 Oct 11 Oct 18 Oct 25 Oct 1 Nov
US$
/mt
Crude Palm Oil
11.6
11.5
11.1
11.0
11.9
12.1
12.6
12.8
12.412.3 12.4
12.5
10.8
11.3
11.8
12.3
12.8
13.3
16 Aug 23 Aug 30 Aug 6 Sep 13 Sep 20 Sep 27 Sep 4 Oct 11 Oct 18 Oct 25 Oct 1 Nov
US¢
/lbs
Sugar
19MITI Tower, No. 7, Jalan Sultan Haji Ahmad Shah, 50480 Kuala Lumpur, Malaysia Tel: +603 - 8000 8000 Fax: +603 - 6202 9446
MITI Weekly Bulletin | www.miti.gov.my
17.1
17.4
18.3
18.1
17.6
17.8
17.0
17.617.5 17.6
17.9
18.1
16.2
16.7
17.2
17.7
18.2
18.7
16 Aug 23 Aug 30 Aug 6 Sep 13 Sep 20 Sep 27 Sep 4 Oct 11 Oct 18 Oct 25 Oct 1 Nov
US$
/oz
Silver
48.7
48.4
49.1
49.0
48.3 48.3
47.9
48.2
47.6
47.9
48.7
48.5
47.0
47.5
48.0
48.5
49.0
49.5
16 Aug 23 Aug 30 Aug 6 Sep 13 Sep 20 Sep 27 Sep 4 Oct 11 Oct 18 Oct 25 Oct 1 Nov
US
$/g
Gold
Sources: Ministry of International Trade and Industry Malaysia, , Malaysian Iron and Steel Industry Federation, Bloomberg and Czarnikow Group, World Bank, World Gold Council, The Wall Street Journal.
2,25
5 2,30
0
2,23
8
2,08
2
2,05
2
2,02
6
2,03
0
1,93
9
1,92
0
1,85
4
1,86
3
1,87
1
1,84
5
1,78
1
1,75
6
1,79
7
1,74
1
1,75
4
1,400
1,500
1,600
1,700
1,800
1,900
2,000
2,100
2,200
2,300
2,400
Apr May Jun Jul Aug Sep Oct Nov Dec Jan Feb Mar Apr May Jun Jul Aug Sep
2018 2019
US$
/ to
nn
e
Aluminium
6,85
2
6,82
5 6,96
6
6,25
1
6,05
1
6,05
1 6,22
0
6,19
6
6,07
5
5,93
9
6,30
0 6,43
9
6,43
8
6,01
8
5,88
2
5,94
1
5,70
9
5,75
9
4,000
4,500
5,000
5,500
6,000
6,500
7,000
7,500
Apr May Jun Jul Aug Sep Oct Nov Dec Jan Feb Mar Apr May Jun Jul Aug Sep
2018 2019
US$
/ to
nne
Copper
13,9
38
14,3
66
15,1
06
13,7
94
13,4
11
12,5
10
12,3
15
11,2
40
10,8
35
11,5
23 12
,685
13,0
26
12,7
73
12,0
16
11,9
44
13,5
46
15,7
49
17,6
57
7,000
9,000
11,000
13,000
15,000
17,000
19,000
Apr May Jun Jul Aug Sep Oct Nov Dec Jan Feb Mar Apr May Jun Jul Aug Sep
2018 2019
US$
/ to
nne
Nickel
Commodity Price Trends
65
.75
66
.10
65
.04
64
.56
67
.15
68
.44 7
3.4
1
73
.26
69
.15
76
.16
88
.22
86
.47
93
.70
10
0.1
51
08
.94
12
0.2
4
93
.07
93
.08
50.0
60.0
70.0
80.0
90.0
100.0
110.0
120.0
130.0
Apr May Jun Jul Aug Sep Oct Nov Dec Jan Feb Mar Apr May Jun Jul Aug Sep
2018 2019
US
$/d
mtu
Iron Ore
851.5855.3
931.7
958.5952.2
942.6
889.2 886.9
900.3895.9
933.3
954.0
820.0
840.0
860.0
880.0
900.0
920.0
940.0
960.0
980.0
16 Aug 23 Aug 30 Aug 6 Sep 13 Sep 20 Sep 27 Sep 4 Oct 11 Oct 18 Oct 25 Oct 1 Nov
US
$/o
z
Platinum
300.0 300.0 300.0 300.0 300.0
280.0275.0
265.0260.0
250.0 250.0
260.0 260.0
280.0
280.0280.0 280.0
270.0 270.0
250.0
245.0
235.0230.0
225.0 225.0
235.0
250.0
260.0
200
220
240
260
280
300
320
2 Aug 9 Aug 16 Aug 23 Aug 30 Aug 6 Sep 13 Sep 20 Sep 27 Sep 4 Oct 11 Oct 18 Oct 25 Oct 1 Nov
US
$/m
t
Scrap Iron Scrap Iron/MT (High) Scrap Iron/MT(Low)
53.8 53.6
48.8 48.3
46.6
45.6
45.144.1
43.6 43.6
44.644.1 44.1 43.8
40
42
44
46
48
50
52
54
56
2 Aug 9 Aug 16 Aug 23 Aug 30 Aug 6 Sep 13 Sep 20 Sep 27 Sep 4 Oct 11 Oct 18 Oct 25 Oct 1 Nov
US
$/t
Coal

20MITI Tower, No. 7, Jalan Sultan Haji Ahmad Shah, 50480 Kuala Lumpur, Malaysia Tel: +603 - 8000 8000 Fax: +603 - 6202 9446
MITI Weekly Bulletin | www.miti.gov.my
MIT
I PR
OG
RAM
MES
MITI Minister launched the Industry4WRD Summit, MITEC Kuala Lumpur, 30 October 2019
21MITI Tower, No. 7, Jalan Sultan Haji Ahmad Shah, 50480 Kuala Lumpur, Malaysia Tel: +603 - 8000 8000 Fax: +603 - 6202 9446
MITI Weekly Bulletin | www.miti.gov.my
MIT
I PR
OG
RAM
MES
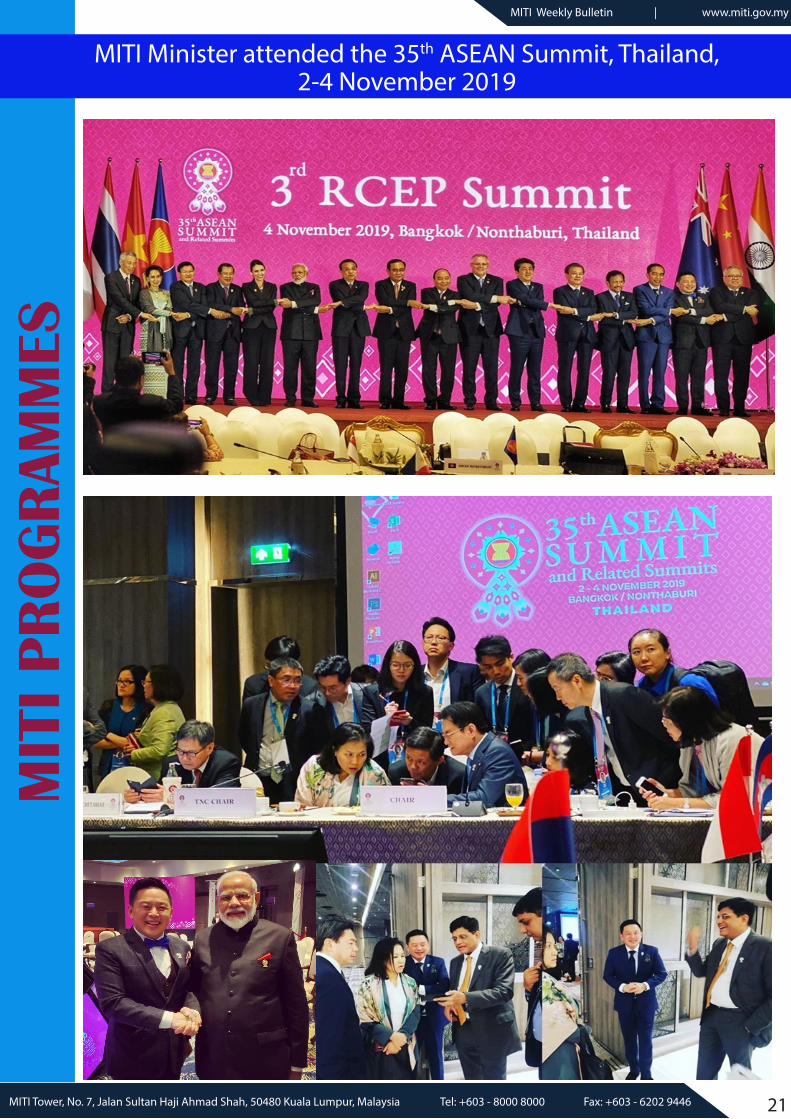
MITI Minister attended the 35th ASEAN Summit, Thailand, 2-4 November 2019
22MITI Tower, No. 7, Jalan Sultan Haji Ahmad Shah, 50480 Kuala Lumpur, Malaysia Tel: +603 - 8000 8000 Fax: +603 - 6202 9446
MITI Weekly Bulletin | www.miti.gov.myMITI Weekly Bulletin | www.miti.gov.my
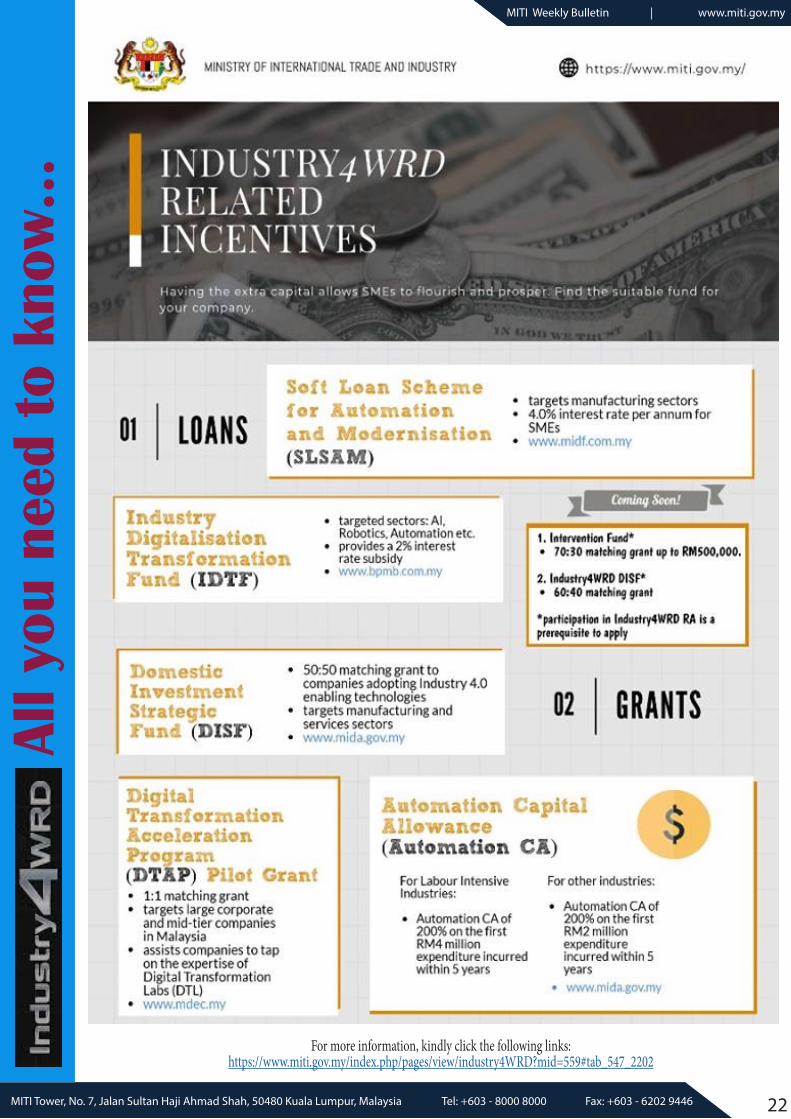
For more information, kindly click the following links:https://www.miti.gov.my/index.php/pages/view/industry4WRD?mid=559#tab_547_2202
All yo
u ne
ed t
o kn
ow...
23MITI Tower, No. 7, Jalan Sultan Haji Ahmad Shah, 50480 Kuala Lumpur, Malaysia Tel: +603 - 8000 8000 Fax: +603 - 6202 9446
MITI Weekly Bulletin | www.miti.gov.myMITI Weekly Bulletin | www.miti.gov.my
All yo
u ne
ed t
o kn
ow...
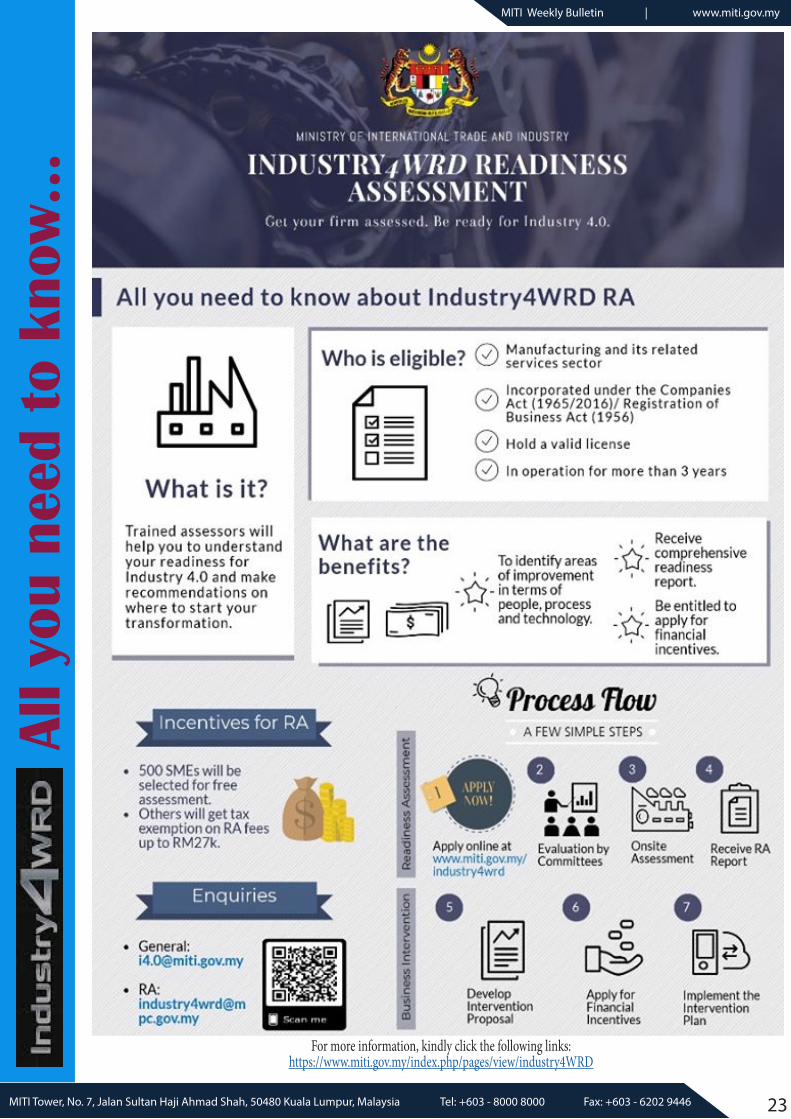
For more information, kindly click the following links:https://www.miti.gov.my/index.php/pages/view/industry4WRD
24MITI Tower, No. 7, Jalan Sultan Haji Ahmad Shah, 50480 Kuala Lumpur, Malaysia Tel: +603 - 8000 8000 Fax: +603 - 6202 9446
MITI Weekly Bulletin | www.miti.gov.myMITI Weekly Bulletin | www.miti.gov.my
ANNO
UNCEM
ENTS
ANNO
UNCEM
ENTS For more information, kindly click the following links:
http://www.miti.gov.my/index.php/pages/view/4761
For more information, kindly click the following links:https://www.miti.gov.my/index.php/pages/view/aki?mid=535
For more information, kindly click the following links:https://bit.ly/2MyIPFt
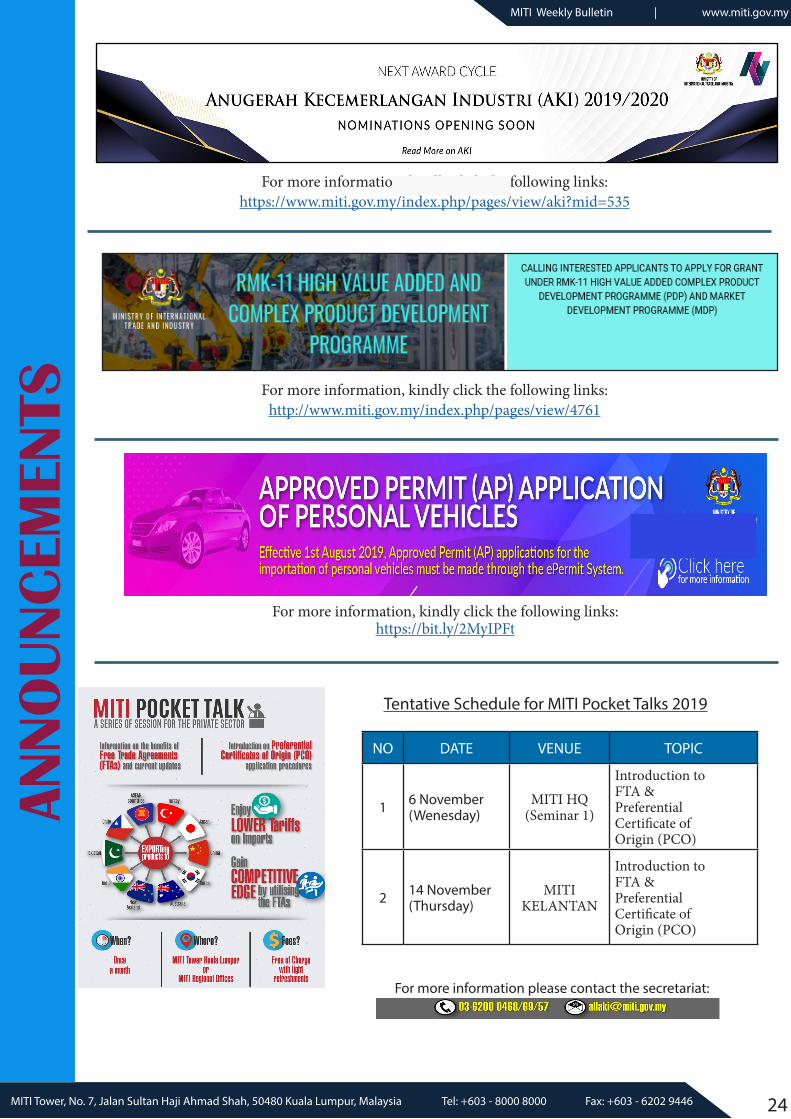
Tentative Schedule for MITI Pocket Talks 2019
For more information please contact the secretariat:
NO DATE VENUE TOPIC
1 6 November (Wenesday)
MITI HQ(Seminar 1)
Introduction to FTA & Preferential Certificate of Origin (PCO)
2 14 November (Thursday)
MITI KELANTAN
Introduction to FTA & Preferential Certificate of Origin (PCO)
25MITI Tower, No. 7, Jalan Sultan Haji Ahmad Shah, 50480 Kuala Lumpur, Malaysia Tel: +603 - 8000 8000 Fax: +603 - 6202 9446
MITI Weekly Bulletin | www.miti.gov.my
For more information, kindly click the following links:http://www.miti.gov.my/index.php/pages/view/4761
For more information, kindly click the following links:https://www.miti.gov.my/index.php/pages/view/aki?mid=535
NO DATE VENUE TOPIC
1 6 November (Wenesday)
MITI HQ(Seminar 1)
Introduction to FTA & Preferential Certificate of Origin (PCO)
2 14 November (Thursday)
MITI KELANTAN
Introduction to FTA & Preferential Certificate of Origin (PCO)
ANNO
UNCEM
ENTS
ANNO
UNCEM
ENTS
Dear Readers,
Kindly click the link below for any comments in this issue. MWB reserves the right to edit and republish letters as reprints. http://www.miti.gov.my/index.php/forms/form/13
MITI Weekly Bulletin (MWB) Mobile AppsMITI MWB APPs is now available for IOS, Android and Windows platforms. MWB APPs can be download from Gallery of Malaysian Government Mobile APPs (GAMMA) at the link: http://gamma.malaysia.gov.my/#/appDetails/85
MITI @ Your Service
NURFADHILAH SYAMIMI
MITI REGIONAL OFFICE (MELAKA)
JURITA MOHD RASUL
ASSISTANT ADMINISTRATIVE OFFICER ADMINISTRATIVE ASST.
Maulidur Rasul 12 Rabiul Awal 1441H 9 November 2019
Salam