WEEK2: Ab Initio Thermodynamics via Cluster Expansions DFT … · 2016-10-02 · WEEK2: Ab Initio...
22
1 Materials Computation Center and Materials Science and Engineering, University of Illinois Urbana-Champaign ©D.D. Johnson (2005) and Board of Trustees WEEK2: Ab Initio Thermodynamics via Cluster Expansions and DFT-based Energy Databases Materials Computation Center Summer School June 20-23, 2005 First of all, WELCOME back to week 2! Hopefully week 1 was very fruitful. You enjoyed the Summer School picnic on Friday. We hope that week 2 has similarly good fruit. This week’s speakers are here in bursts (due to travel), make the most of their time here. Please ask questions, interrupt for clarification. Please grab Richard Martin, Jeognim Kim, Amy Young, or myself if you need assistance. Materials Computation Center and Materials Science and Engineering, University of Illinois Urbana-Champaign ©D.D. Johnson (2005) and Board of Trustees WEEK2: Ab Initio Thermodynamics via Cluster Expansions and DFT-based Energy Databases Materials Computation Center Summer School June 20-23, 2005 Approach: Learn the rudiments and pitfalls of cluster expansions. Goal: Predict energy of any atomic arrangement σ on a fixed lattice by fitting to a few DFT structural energies for use in Thermodynamics. E σ = V i Φ i σ i ∑ Cluster correlations Effective Interactions N structures DFT → E σ CE → V i Monte Carlo → Thermodynamics 1 st n.n. 2 nd n.n. L1 2 DO 22 DO 23
Transcript of WEEK2: Ab Initio Thermodynamics via Cluster Expansions DFT … · 2016-10-02 · WEEK2: Ab Initio...
1
Materials Computation Center and Materials Science and Engineering, University of Illinois Urbana-Champaign ©D.D. Johnson (2005) and Board of Trustees
WEEK2: Ab Initio Thermodynamics via Cluster Expansionsand DFT-based Energy Databases
Materials Computation CenterSummer School June 20-23, 2005
First of all, WELCOME back to week 2!
Hopefully week 1 was very fruitful.
You enjoyed the Summer School picnic on Friday.
We hope that week 2 has similarly good fruit.
This week’s speakers are here in bursts (due to travel),make the most of their time here.
Please ask questions, interrupt for clarification.
Please grab Richard Martin, Jeognim Kim, Amy Young, or myself ifyou need assistance.
Materials Computation Center and Materials Science and Engineering, University of Illinois Urbana-Champaign ©D.D. Johnson (2005) and Board of Trustees
WEEK2: Ab Initio Thermodynamics via Cluster Expansionsand DFT-based Energy Databases
Materials Computation CenterSummer School June 20-23, 2005
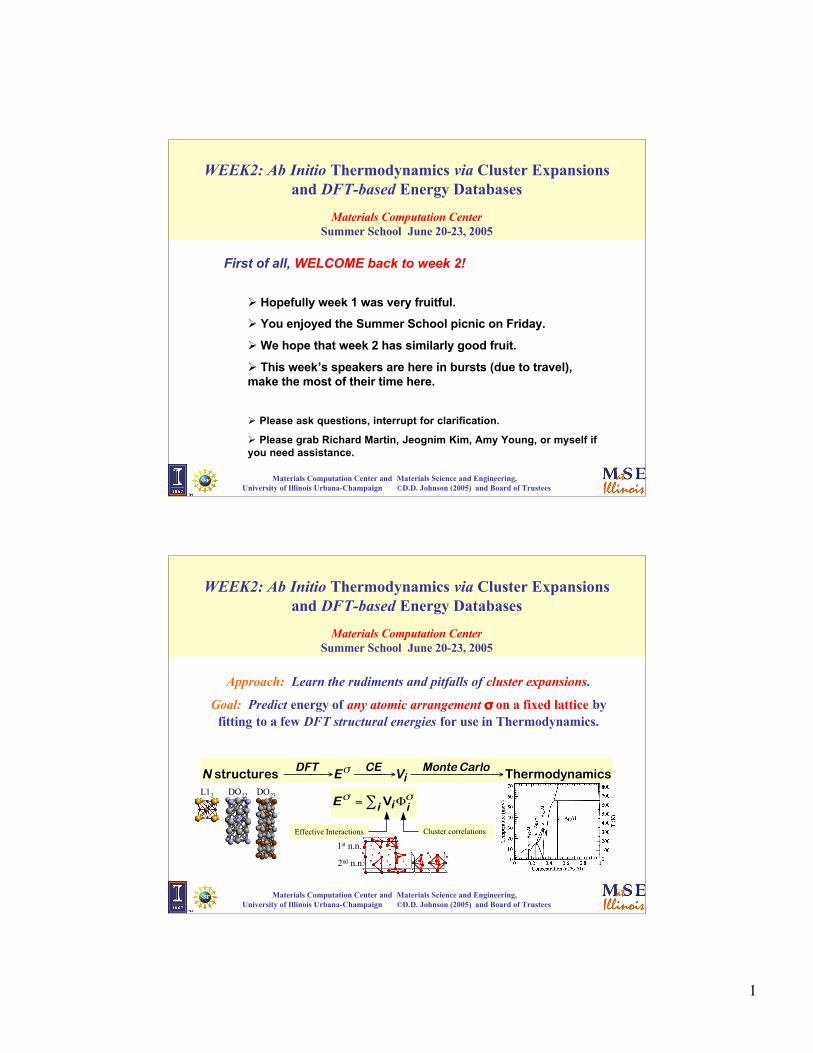
Approach: Learn the rudiments and pitfalls of cluster expansions.
Goal: Predict energy of any atomic arrangement σ on a fixed lattice byfitting to a few DFT structural energies for use in Thermodynamics.
€
Eσ = ViΦiσ
i∑
Cluster correlationsEffective Interactions
€
N structures DFT → Eσ CE
→ ViMonte Carlo
→ Thermodynamics
1st n.n.
2nd n.n.
L12 DO22 DO23

2
Materials Computation Center and Materials Science and Engineering, University of Illinois Urbana-Champaign ©D.D. Johnson (2005) and Board of Trustees
Week 2 Lecturers for Cluster Expansions
Predict energy of any atomic arrangement σ by fitting to a few DFT structural energies.
€
Eσ = ViΦiσ
i∑
Cluster correlationsEffective Interactions
€
N structures DFT → Eσ CE
→ ViMonte Carlo
→ ThermodynamicsL12 DO22 DO23
D.D. Johnson, MSEU. of Illinois
G. Hart, PhysicsNorthern Arizona U.
D. Morgan, MSEU. of Wisconsin
A. Van der Walle, MSENorthwestern
A. Van der Ven, MSEU. of Michigan
Alloy Energiesand Basic CE
Strain Effects andGA fitting of CE
Phase Diagramsand the CE
“Automated” CEand Phonon Effects
Alloy Diffusionand CE
Materials Computation Center and Materials Science and Engineering, University of Illinois Urbana-Champaign ©D.D. Johnson (2005) and Board of Trustees
ground state AlAghcp Al-Ag
metastable hcp Al-Ag
(Meta-)Stable Phases
Energies of Disorderedand Ordered Phases
Phases DiagramsLong- and Short- Range Order
Off-StochiometricPhases
metastable AlAg
Zarkevich and Johnson, Acta Mater. 50, 2443 (2002).
Interpret Experimental Data
Zarkevich and Johnson, PRB 67, 064104 (2003).
Theory HR-TEM
hcp Al-Ag
fcc vs. hcpAl-Ag
€
Eσ (v) = Vi (v)Φiσ
i∑With DFT based CE: We can predict/interpret:
Explaining Characterization Experiments from Cluster Expansions

3
Materials Computation Center and Materials Science and Engineering, University of Illinois Urbana-Champaign ©D.D. Johnson (2005) and Board of Trustees
Coming Topics / Connecting to Experiment
Temperature-CompositionPhase Diagrams
Phonons and Strain Affect
Stability of (precipitate) Phases
Phase Diagramse.g., vacancy-ordering
Stabilization via Lattice Vibrations • Al2Cu phase stable with phonons (correct)• CaF2 phase stable without (incorrect)
Anton van der Ven
Axel van der Walle
Wolverton and Ozolins (2001)Ceder et al. (2000)
van de Walle and Ceder (2000, 2002)
Diffusion by VacanciesBatteries: e.g., Li1-x�xCoO2
Dane Morgan
Size-Mismatch/Relaxationsa(Al) > a(Cu) Gus Hart
Materials Computation Center and Materials Science and Engineering, University of Illinois Urbana-Champaign ©D.D. Johnson (2005) and Board of Trustees
Cluster Expansion Free Energies and Experiment
-30
-25
-20
-15
-10
-5
0
0 0.1 0.2 0.3 0.4
Al Concentration
ΔG
(k
J/m
ole
)
?
? ?
EMF Measurements(Samokhval et al., 1971)
Monte-CarloCalculations
Gibbs Free Energies (T=960 K)
Van der Walle and Mark Asta
• Finite-Temperature effects can be critical for comparison to experiment.• e.g., for dilute, size-mismatched alloys, phonon entropy can be critical.
V. Ozolins and Mark Asta (2001).

4
Materials Computation Center and Materials Science and Engineering, University of Illinois Urbana-Champaign ©D.D. Johnson (2005) and Board of Trustees
Part 1: Electronic Structure Effects andEnergies of Alloy Transformations
D.D. Johnson, Materials Science & EngineeringMaterials Computation Center, Summer School June 20, 2005
Present: Rudiments, needs, and pitfalls ofDFT Structural Energies
Goal: Provide background to performCluster Expansions
€
N structures DFT → Eσ
L12 DO22 DO23
• Develop reliable structural-energy database for Bravais lattices (fcc, bcc,hex, …). What are some things consider for “reliable”?
• Utilize “small” unit cells to limit CPU but include some low-symmetrycells to provide some structural relaxations (volume and strain) info.
• Describe electronic origins for transformations that must be considered(band-filling, Fermi-surface, strain, Jahn-Teller, size-mismatch,…).
Energies for each directly calculated arrangement.
Materials Computation Center and Materials Science and Engineering, University of Illinois Urbana-Champaign ©D.D. Johnson (2005) and Board of Trustees
My background (briefly)Duane D. Johnson, Professor of Materials Science Engineering, Physics, and
Mechanical Engineering, U. of Illinois Urbana-Champaign Ph.D. in Condensed Matter Physics.
Alloy Theory and Electronic Structure of (Dis)Ordered Alloys• Developed “fast”, even O(N), methods using Multiple-Scattering TheoryKorringa-Kohn-Rostoker (KKR) Green’s fcts. for Disordered Alloys.• Electronic-Structure of Disordered Alloys via KKR methods and the CoherentPotential Approximation (CPA).• Derived DFT for disordered alloys for total energies on par to standard DFT forordered alloys (Generalized Mermin’s thm.).
Developed KKR-CPA-based thermodynamic linear-response to calculateddirectly Short-Range Order in high-T disordered alloys.
• Determines directly electronic origin of SRO and phase transitions.
Apply KKR-CPA to Partial Long-Range Order alloys, as mostcharacterization experiments are on samples having imperfect order.
• Defect energies (antiphase boundaries, stacking faults, …) in such alloys.• Mechanical properties in such alloys (e.g., yield-strength anomalies).• Defect-solute interactions (e.g., rapid formation of nanoprecipitates).
Publications may be found on www.mse.uiuc.edu link

5
Materials Computation Center and Materials Science and Engineering, University of Illinois Urbana-Champaign ©D.D. Johnson (2005) and Board of Trustees
My background (briefly)
Besides previous areas, multiscale modeling:• in time via Genetic Programming/Genetic Algorithms (by machine-learning potential energy surfaces)• in space via rigorous coupling of Velocity-Verlet Molecular-Dynamicswithin Space-Time Discontinuous Galerkin finite-elements, based uponflux-balance laws.
Electronic and structural properties of nanoclusters on supports forexplanation of characterization experiments.
….etc….
AND….Cluster Expansions because my KKR-CPA resultsoften agreed with experiments --- but CE results often did not inthe same system.
Question often posed: Why?
Publications may be found on www.mse.uiuc.edu link
Materials Computation Center and Materials Science and Engineering, University of Illinois Urbana-Champaign ©D.D. Johnson (2005) and Board of Trustees
Part 1: Electronic Structure Effects andEnergies of Alloy Transformations
D.D. Johnson, Materials Science & EngineeringMaterials Computation Center, Summer School June 20, 2005
Assumption: Using Density-Functional Theory (DFT) for energies.
• DFT Total Energy and what is a Structural Formation Energy, orFormation Enthalpy (SFE)?
• What does Formation Enthalpy indicate about Phase Diagram?
• Considerations: How do you get “reliable” SFE?
• How are electronic effects manifested in relative energies?

6
Materials Computation Center and Materials Science and Engineering, University of Illinois Urbana-Champaign ©D.D. Johnson (2005) and Board of Trustees
Characterization: Processing ⇒ Structure ⇒ Properties ⇒ Performance
liquid
solid solution
A Bat. %
ASRO T>To
disordered T>>To
LRO T<To
Real WorldProcessing
Infinitesimal (unstable) fluctuationsbut potentially long-lived
Finite stable ordering
Where do atoms go and why?
Thermodynamics as well as Kinetic affect comparison to characterization expts.
Materials Computation Center and Materials Science and Engineering, University of Illinois Urbana-Champaign ©D.D. Johnson (2005) and Board of Trustees
Formation Enthalpy or Structural Formation Energies
€
ΔHfx x = O(ordered) or D(disordered)Enthalpy: H = E + PV
Measured by calorimetry
Consider binary A-B alloy (P=0): Formation Energyenergy of A1-cBc relative to phase segregated pure A and B
€
ΔEσ (V ) = Eσ (V ) − cαEα (Vα )α=A,B∑
€
ΔEO−L10 (VL10) = EO−L10 (VL10) −12
ENi +12
EPt
Consider fcc L10 NiPt:cNi = 1/2
€
ΔHf(meV )
atoms mix (SRO)then order (LRO)
e.g. Ni-Pt
Ni Pt
L10
ca a
x-y plane: a
Along c-axistetragonal: c/a ≠ 1
€
ΔED (VD ) = ED (VD ) −12
ENi +12
EPt

7
Materials Computation Center and Materials Science and Engineering, University of Illinois Urbana-Champaign ©D.D. Johnson (2005) and Board of Trustees
Structural Formation Energies and Ground States
For binary A-B alloy, there are many states but only a few constituteground-state configurations (or compete at finite-T with GS).
Stefan Muller, J. Phys: Cond. Matt. 15,R1429-1500 (2003): Fig. 6
Phase diagram would have 3 phases for T vs. c
Find Many Crystal Lattice Structures on web: http://cst-www.nrl.navy.mil/lattice/
Then, for the fixed latticesymmetry, Ground-States
are: A, B, α,β, and σ
Materials Computation Center and Materials Science and Engineering, University of Illinois Urbana-Champaign ©D.D. Johnson (2005) and Board of Trustees
Mixing vs Ordering Energies
Formation Enthalpy or Formation Energies at P=0
€
ΔHfD −ΔHf
O
Note: 1 mRydberg (1mRy) = 13.6 meV and R.T. is 1/40 eV or 25 meV.In temperature units kBT: 1 mRy = 158 K.
“Ordering Energy” is therefore a few mRy or few 10’s of meV. For phase stability, need DFT relative error in ΔHf ~ 2 meV !
€
ΔHfD enthalpy of mixing
€
ΔHfO ordering enthalpy
Ordering energy
€
ΔHf(meV )
€
ΔHfD
€
ΔHfO
€
ΔHfD −ΔHf
O
e.g., electronic origin of size-effect and difference of mixing and ordering energy:F.J. Pinski, et al., "Origins of Compositional Order in NiPt," Phys. Rev. Lett. 66, 766-69 (1991).F.J. Pinski, etl al., Reply to Comment, Phys. Rev. Lett. 68, 1962-5 (1992).
€
ΔHfD−SRO
€
ΔHfD −ΔHf
D−SRO Short-Range Ordering energy
€
ΔHfD−SRO −ΔHf
O
8
Materials Computation Center and Materials Science and Engineering, University of Illinois Urbana-Champaign ©D.D. Johnson (2005) and Board of Trustees
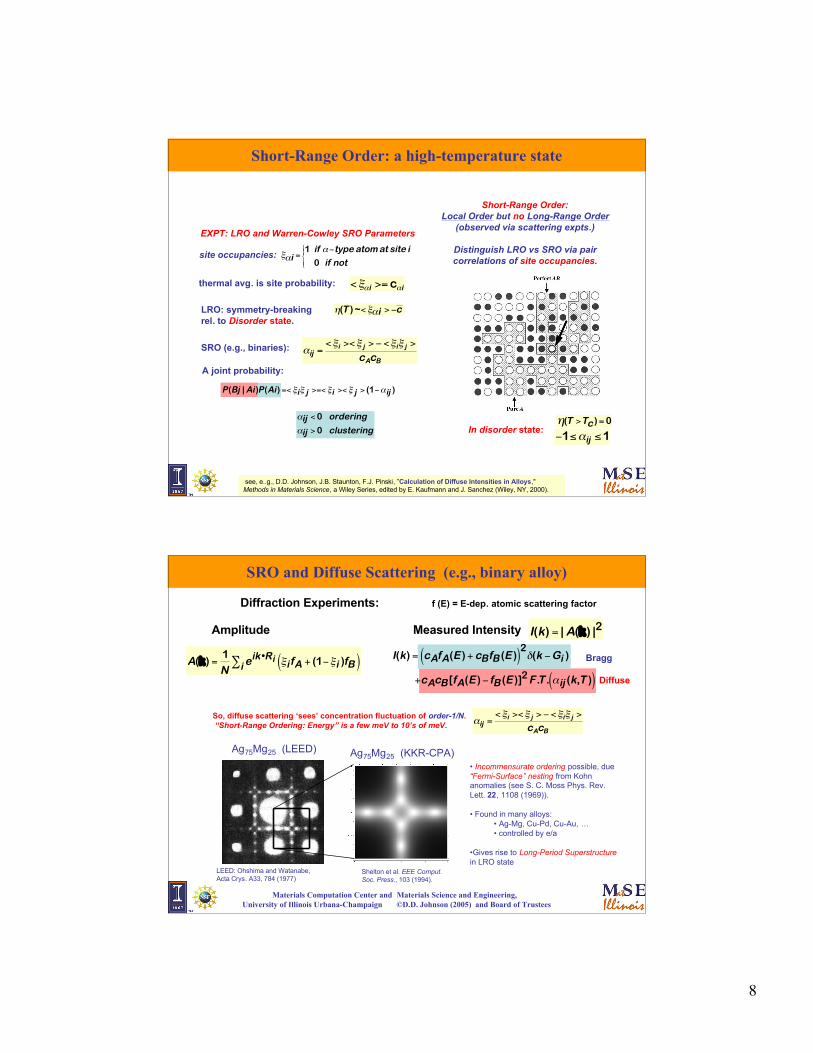
Short-Range Order: a high-temperature state
Short-Range Order:Local Order but no Long-Range Order
(observed via scattering expts.)
Distinguish LRO vs SRO via paircorrelations of site occupancies.
see, e..g., D.D. Johnson, J.B. Staunton, F.J. Pinski, ”Calculation of Diffuse Intensities in Alloys,"Methods in Materials Science, a Wiley Series, edited by E. Kaufmann and J. Sanchez (Wiley, NY, 2000).
EXPT: LRO and Warren-Cowley SRO Parameters
€
ξαi =1 if α−type atom at site i
0 if not
site occupancies:
thermal avg. is site probability:
€
<ξαi >= cαi
LRO: symmetry-breakingrel. to Disorder state.
€
η(T ) ~<ξαi > −c
€
P(Bj | Ai)P(Ai) =< ξiξ j >=< ξi >< ξ j > (1−αij )
A joint probability:
SRO (e.g., binaries):
€
αij =<ξi ><ξ j > − <ξiξ j >
cAcB
In disorder state:
€
η(T >Tc) = 0
€
−1≤αij ≤1
€
αij < 0 ordering
αij > 0 clustering
Materials Computation Center and Materials Science and Engineering, University of Illinois Urbana-Champaign ©D.D. Johnson (2005) and Board of Trustees
SRO and Diffuse Scattering (e.g., binary alloy)
Diffraction Experiments: f (E) = E-dep. atomic scattering factor
Amplitude Measured Intensity
€
A(k) =1N
eik•Rii∑ ξifA + (1−ξi )fB( )
€
I(k) = | A(k) |2
€
I(k) = cAfA(E) + cBfB (E)( )2δ(k −Gi )
+cAcB [fA(E)− fB (E)]2 F.T. αij (k,T )( )Bragg
Diffuse
€
αij =<ξi ><ξ j > − <ξiξ j >
cAcB
So, diffuse scattering ‘sees’ concentration fluctuation of order-1/N. “Short-Range Ordering: Energy” is a few meV to 10’s of meV.
Ag75Mg25 (LEED)
LEED: Ohshima and Watanabe,Acta Crys. A33, 784 (1977)
Shelton et al. EEE Comput.Soc. Press., 103 (1994).
Ag75Mg25 (KKR-CPA)• Incommensurate ordering possible, due“Fermi-Surface” nesting from Kohnanomalies (see S. C. Moss Phys. Rev.Lett. 22, 1108 (1969)).
• Found in many alloys:• Ag-Mg, Cu-Pd, Cu-Au, …• controlled by e/a
•Gives rise to Long-Period Superstructurein LRO state

9
Materials Computation Center and Materials Science and Engineering, University of Illinois Urbana-Champaign ©D.D. Johnson (2005) and Board of Trustees
Measured SRO ∝ Free Energy (high-T case)
SRO is chemical ordering mode analogous to phonon modes
T >>Tsp
T >Tsp
T ~Tsp
δc, η Unstable modes for N-component alloysdepend on eigenvectors of stability matrix
SRO becomes LRO in second-ordertransformations, like A2 - B2
€
ΔΩO−D = 12
δci* δ
2<Ω>
δciδc j
ij
∑
c0
δcj +K
∝ 12
δci* αij
−1
ij∑
c0
δcj ⇒ 12
|δck |2 α−1(k;T )k∑ ~ η
kmax
2 α−1(kmax;T )
Energy lowered for certainfavored kmax for SRO/LRO.
SRO
Amplitude larger
To compare to expt., these can be calculated in multicomponent alloys:J.D. Althoff, et al., Phys. Rev. Lett. 74, 138 (1995); Phys. Rev. B 53, 10610 (1996)
Materials Computation Center and Materials Science and Engineering, University of Illinois Urbana-Champaign ©D.D. Johnson (2005) and Board of Trustees
Formation Enthalpies and Phase Diagrams
Clearly, for Intermetallic Compounds, e.g., AmBn stoichiometry,
€
ΔHf (AmBn ) =1
m + nEtot (AmBn )−mEtot (VA)−nEtot (VB )
€
ΔHf(meV )
€
concentration, c
atoms mix (SRO)then order (LRO)
clustering (SRO)but LRO at low T
ordering-type SROsegregate at low T
Ordering/clustering SROOrder/segregate at low T
Maxwell Construction:ordered phase + pure B
(miscibility gap)
miscibility gap,e.g. Pd-Rh
e.g. Au-Ag
e.g. Al-Ag e.g. Ni-Pt
€
cA =m
m + n

10
Materials Computation Center and Materials Science and Engineering, University of Illinois Urbana-Champaign ©D.D. Johnson (2005) and Board of Trustees
Gibbs Free Energy and Configurational Entropy
“Point” Entropy is largestconfigurational contribution
€
S pt = –kB (cA lncA + cB lncB )
€
S pt ≤ 0.693kB at c = 1/2
€
Gx = Hconfigx + Hvibr
x −TSconfigx −TSvibr
x
In alloys, the largest entropy arises from configurational effects (usually), butvibrational effects can be quite pronounced (lectures later this week).
Sanchez, Duscatelle and Gratias, “General Cluster Decriptions ofMulticomponent Systems,” 128 A, 334 (1984).Clusters and Entropy and variational free energy
point
pairs
triplets
quadruplets
Phase transition occurs between 2 phases when Gibbs Free Energies per particle are equal(I.e., same chemical potentials), or ΔG = ΔH –TΔS = 0.
Gibbs Free Energies
Materials Computation Center and Materials Science and Engineering, University of Illinois Urbana-Champaign ©D.D. Johnson (2005) and Board of Trustees
Generic Phase Diagram Types
↑ CE: Connolly and Williams, Phys. Rev. B 27, 5169 (1983)
Volume: Terakura et al., Phys. Rev. B 35, 2169 (1987). →
€
ΔHfx x = O(ordered) or D(disordered)Free Energy: G = H - TS
Simple estimate of structural Tc
Clustering: TOD ~ ΔHD/SD
Ordering: TOD ~ (ΔHD - ΔHO)/SD
Later our est. TOD ~ (ΔHD - ΔHO)
TOD ~ 0 (stays solid solution)
€
Δaa
=aCu −aAu
aCu + aAu /2= 12%
Later: Size-mismatch can leadto ordering or phase separation.(e.g., Hume-Rothery’s 15%-rule)
Lab today will address these issues.

11
Materials Computation Center and Materials Science and Engineering, University of Illinois Urbana-Champaign ©D.D. Johnson (2005) and Board of Trustees
Miscibility Gap in fcc Pd-Rh
Simple estimate of segregation T
Clustering: TOD ~ ΔHD/SD
Calculated formation energy for Tc
estimate is quite good!
1.00.80.60.40.20.00
200
400
600
800
1000
1200
1400
SR To
NR ToExpt. Misc. Gap
Rh composition (at. %)
Tem
pera
ture
(K)
Expt
Theory
fcc solid solution
phase separated
Direct calculation with disorderKKR-CPA calculations for disordered Pd-Rh
D.D. Johnson (1992)
Materials Computation Center and Materials Science and Engineering, University of Illinois Urbana-Champaign ©D.D. Johnson (2005) and Board of Trustees
Vibrational Entropy (example)
“Point” Entropy is largestconfigurational contribution
€
S pt = kB (cA lncA + cB lncB )
€
S pt ≤ 0.693kB at c = 1/2
See lectures by, e.g., Axel van der Walle
€
Gx = Hconfigx + Hvibr
x −TSconfigx −TSvibr
x
€
Tconfig+vibrα→β ≈Tconfig
α→β 1+ΔSvibr
α→β
ΔSconfigα→β
−1
Ozolins et al. PRB 58, R5897 (1998)
Example: CuAu
AnharmonicHarmonic
L10 CuAuNo vibr. w/ vibr. Expt.660 K 560 K 683 K
Too low a calculated formationenergies may explain discrepancy.See later.
Some Initial ideas also by Mohri et al. J. Phys: Cond. Mat. 5, 1473 (1993)

12
Materials Computation Center and Materials Science and Engineering, University of Illinois Urbana-Champaign ©D.D. Johnson (2005) and Board of Trustees
Generic Classification of Ordering Types
Ordering or segregation can dependent on coherency strain
O= ordered R= random CS=coherency strain
Pure A and B
A and Bon system lattice
Wolverton et al., J. Phys: CM, 12, 2749 (2001); PRB 57, 4532 (1998)
Materials Computation Center and Materials Science and Engineering, University of Illinois Urbana-Champaign ©D.D. Johnson (2005) and Board of Trustees
Strain Energy (e.g., surface misfit strain)
Consider ML of fcc Ag-Cu on hcp Ru(0001)aCu < aRu(0001) < aAg Ru(0001)
• fcc Ag-Cu orders at surface to remove large misfit strain!• similar happens in bulk alloying too.
€
ΔE AgCu(asurf ) = Eσ (asurf ) − cAgE Ag(aAg ) + cCuECu(aCu )
Consider ΔHf
Get Coherency Strain: Add and subtract Enthalpy of lattice (volume) deformation:
€
ΔEAgCu (asurf ) = Eσ (asurf ) − cAgEAg(asurf )+ cCuE
Cu (asurf )( )+ cAg EAg(asurf )− E
Ag(aAg )( ) + cCu ECu (asurf )− ECu (aCu )( )
First line: purely “chemical ordering” energy Can be +/–.Second line: purely lattice/volume effect Always + (costs)!
fcc Ag-Cu segregate in bulk
self-organized Co pillars on Au(111), Voigtländer et al., Phys. Rev. B 44, 10354 (1991)
Energy tostrain to asur
Formation E at asur
Note: tomorrow’s lectures on bulk coherency strain utilize this! In bulk have interfacelattice constant (not surface) and c-axis lattice constant - so more compicated.

13
Materials Computation Center and Materials Science and Engineering, University of Illinois Urbana-Champaign ©D.D. Johnson (2005) and Board of Trustees
Generic Phase Diagram: favorable mixing and ordering
Stefan Muller, J. Phys: Cond. Matt. 15, R1429-1500 (2003): Fig. 1 (modified)
No long-range order (broken symmetry of Bravais lattice)
But short-range order (pair correlations)
Order/Disorder TemperatureCalorimetry or Resistivity
Diffuse peaks indiffraction
Superlattice peaksin diffraction
• Now need H and G to get phase diagram.• With accurate but rapidly evaluated model for H, could use Monte Carlo.• Then determine SRO, LRO, phase boundaries, …
DFT accurate, but too many configurations, and too slow!Need to coarse-grain DFT info somehow (e.g., Cluster Expansion).
Materials Computation Center and Materials Science and Engineering, University of Illinois Urbana-Champaign ©D.D. Johnson (2005) and Board of Trustees
DFT Energies for Structural Transformations: considerations
Predicting thermodynamics first requires Accurate DFT Energy Database:
• Which DFT method should you use?• all-electron Full-Potential methods: FLAPW, FLMTO, FP-KKR…• pseudo-potential methods: VASP, ABINIT, PW-SCF…• all-electron approximate methods: Atomic Sphere Approx., Muffin-TinApprox., Pseudo-FP, …
• Which DFT exchange-correlation functional?• Local-Density Appr. (LDA), Generalized-Gradient-Corrected (GGA):PW91, PBE, PBE0, BLYP, …. (Which? Depends on systems, as some arebetter on molecules and others on solids.)• Need to validate results.
• Convergence Issues: Lmax or PW energy-cutoffs. K-point grid, …
Paramount consideration is accuracy (relative error min. necessary). symmetry of cell shape dictates requirements and these change evenfor the same alloy system versus composition, symmetry, size,… Generally DFT results have good energy differences.
14
Materials Computation Center and Materials Science and Engineering, University of Illinois Urbana-Champaign ©D.D. Johnson (2005) and Board of Trustees
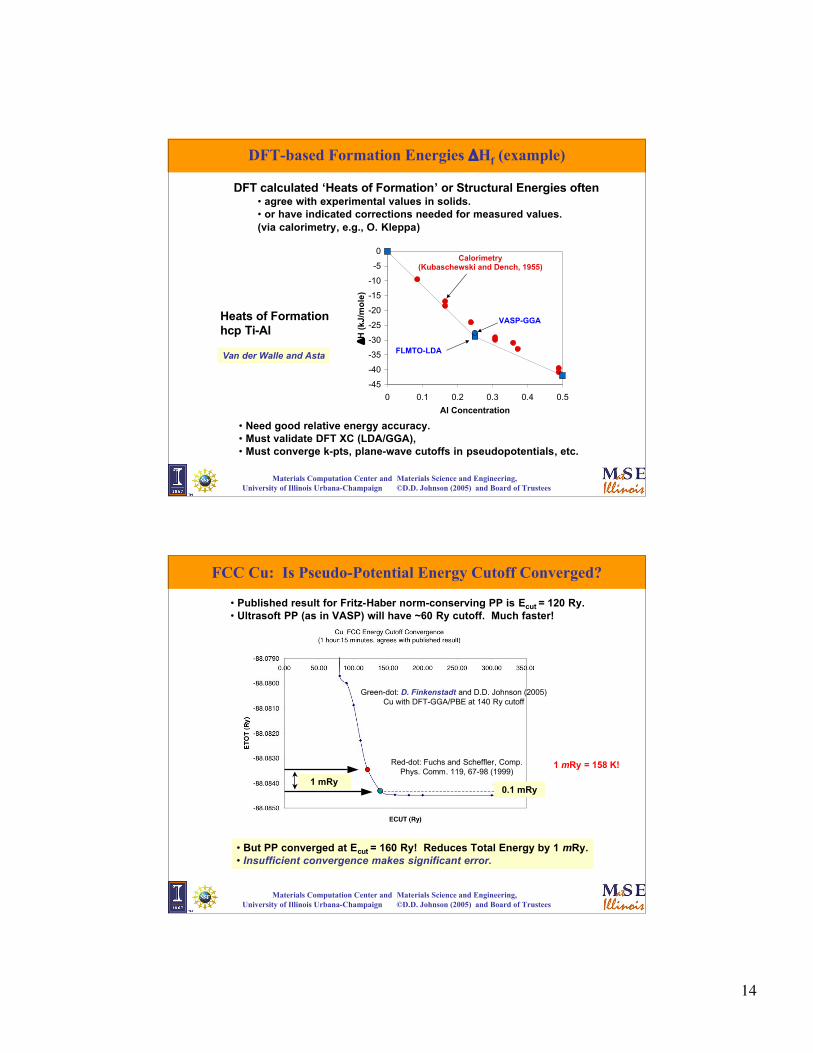
DFT-based Formation Energies ΔHf (example)
-45
-40
-35
-30
-25
-20
-15
-10
-5
0
0 0.1 0.2 0.3 0.4 0.5
Al Concentration
ΔH
(kJ
/mo
le)
Calorimetry(Kubaschewski and Dench, 1955)
FLMTO-LDA
VASP-GGAHeats of Formationhcp Ti-Al
Van der Walle and Asta
DFT calculated ‘Heats of Formation’ or Structural Energies often• agree with experimental values in solids.• or have indicated corrections needed for measured values.(via calorimetry, e.g., O. Kleppa)
• Need good relative energy accuracy.• Must validate DFT XC (LDA/GGA), • Must converge k-pts, plane-wave cutoffs in pseudopotentials, etc.
Materials Computation Center and Materials Science and Engineering, University of Illinois Urbana-Champaign ©D.D. Johnson (2005) and Board of Trustees
FCC Cu: Is Pseudo-Potential Energy Cutoff Converged?
• Published result for Fritz-Haber norm-conserving PP is Ecut = 120 Ry.• Ultrasoft PP (as in VASP) will have ~60 Ry cutoff. Much faster!
• But PP converged at Ecut = 160 Ry! Reduces Total Energy by 1 mRy.• Insufficient convergence makes significant error.
0.1 mRy1 mRy
Green-dot: D. Finkenstadt and D.D. Johnson (2005)Cu with DFT-GGA/PBE at 140 Ry cutoff
Red-dot: Fuchs and Scheffler, Comp.Phys. Comm. 119, 67-98 (1999)
1 mRy = 158 K!

15
Materials Computation Center and Materials Science and Engineering, University of Illinois Urbana-Champaign ©D.D. Johnson (2005) and Board of Trustees
FCC Cu: Total Energy vs. k-point Convergence
Total Energy must have Brillouin Zone integration converged vs. k-ptsfor each cell, symmetry and concentration (can be done ~intelligently).
How few k-ptsare sufficient
for “converged”total energy?
16x16x16 lowerby 0.3 mRy
How few k-points are allowed? A lab exercise this afternoon
D. Finkenstadt and D.D. Johnson (2005)Cu with DFT-GGA/PBE for 120 Ry E-cutoff
Materials Computation Center and Materials Science and Engineering, University of Illinois Urbana-Champaign ©D.D. Johnson (2005) and Board of Trustees
For ALLOYS,• Use constant density of k-pts for each structure for good relative error.• (Special Points Methods) For fixed-symmetry structures 1 and 2,
use rule-of-thumb:
• In alloy, if one atomic species is under converged, structural formationenergies will have skewed error, affecting defect energies, transitiontemperatures, etc.
• How do you know? Must validate EVERY system and symmetry.
• Relative energies (e.g., formation energies) are more reliable, as theycancel systematic errors, such as in DFT absolute energies.
Total Energy vs. k-point Convergence
Total Energy must have Brillouin Zone integration converged vs. k-pts.
€
Natoms1 Nk−pts
1 = Natoms2 Nk−pts
1

16
Materials Computation Center and Materials Science and Engineering, University of Illinois Urbana-Champaign ©D.D. Johnson (2005) and Board of Trustees
• For special pts method on cubic system (symorphic group), best to use4n x 4n x 4n, n = 1, 2, … Convergence is smoother.• Note: k-point convergence is non-monotonic! (No reason it should be.)• Metals usually need lots of k-points. Use rule:• Cost is Nkpts*(Natom)3.
k-point convergence: bcc W (B2 two-atom cubic cell)
Structuralconvergence faster
energy
€
Natoms1 Nk−pts
1 = Natoms2 Nk−pts
1
Zarkevich and Johnson (2005): somewhat of overkill
Materials Computation Center and Materials Science and Engineering, University of Illinois Urbana-Champaign ©D.D. Johnson (2005) and Board of Trustees
Example: fcc Cu-Au Formation Energies
Cu-Au: First use of DFT energies and CELater, size-mismatch will be critical!
CE: Connolly and Williams, Phys. Rev. B 27, 5169 (1983)Volume: Terakura et al., Phys. Rev. B 35, 2169 (1987).
0.0
-91
0.0
EXPT(meV/atom)
A1
L12
L10
L12
A1
structure
0.01.04.1620.0Au
-17.31.04.061-35.6CuAu3
-48.20.9134.059-64.9CuAu
-37.31.03.818-49.8Cu3Au
0.01.03.6770.0Cu
FLAPW(meV/atom)
c/aa (A)ABINIT(meV/atom)
System(FCC)
Cu-Au: relaxed Structural Formation Energy (SFE) energy/atom
ABINIT (GGA/PBE): Finkenstadt and Johnson (2005) Enery-cutoff=140 Ry, k-pts 12x12x12 or better.FLAPW (GGA/PW91): e.g., Ozolins et al., Phys. Rev. B 57, 6427 (1998).EXPT: Oriani and Murphy, J. Phys. Chem. 62, 327 (1958); Orr, Acta Metall. 8, 489 (1960).
Why don’t ABINIT and the “better” FLAPW results compare? • Likely because FLAPW k-pt mesh were only 8x8x8.• Literature results often under converge on k-pts, even by experts!

17
Materials Computation Center and Materials Science and Engineering, University of Illinois Urbana-Champaign ©D.D. Johnson (2005) and Board of Trustees
Bands and Density of States
• Is it easy to estimate DOS?• “molecular” like approach can construct most DOS.
• Many systems driven by band-filling and/or Fermi-surface effects.• e.g., Ni-Fe properties driven by magnetism and band-filling.
Warren E. Pickett and Jagadeesh S. MooderaMay 2001 Physics Today
Gaps, as in silicon No gaps, as in Fe (but magnetic exchange-splitting)
Materials Computation Center and Materials Science and Engineering, University of Illinois Urbana-Champaign ©D.D. Johnson (2005) and Board of Trustees
Types of Orbitals Dictate Bands and How They “Run”
s-states • lower in energy at k=0 due to better overlap.• highest at k= π/a due to maximum number of nodes in wave-fct.• non-bonding state at k= π/2a due to nodes at mid H-atoms.
Solids and Surfaces: A Chemist’s View of Bonding in Extended Structures, Roald Hoffmann ( Wiley-VCH, 1988)
s-states (H-atom) on infinite chain run up vs. k
Local orbitals - e.g. s-states, Y00
n = 0 1 2 3 4
a
€
χ0
€
χ1
€
χ2
€
χ3
€
χ4
€
ψk = n∑ eiknaχn
€
ψk=0 = n∑ χn = χ0 + χ1 + χ2 + χ3 + χ 4k = 0
k = π/a
€
ψk=π /2 = (−1)nn∑ χn = χ0 − χ1 + χ2 − χ3 + χ 4
1,2 anti-bonding1,3 bonding
1,2 bonding1,3 bonding
1,2 non-bonding
1,3 anti-bonding
€
ni (E) =dS
4π3Si (E )∫ ∇Ei (k)

18
Materials Computation Center and Materials Science and Engineering, University of Illinois Urbana-Champaign ©D.D. Johnson (2005) and Board of Trustees
Types of Orbitals Dictate Bands and How They “Run”
p-states • higher in energy at k=0 due to nodes in wave-fcts.• lower energy at k= π/a due to lack of nodes.• non-bonding state at k= π/2a due to nodes at mid H-atoms.
p-states on infinite chain run down vs. k
€
ψk=0 = χ0 + χ1 + χ2 + χ3 + ...
€
ψk=π /2 = χ0 − χ1 + χ2 − χ3 + ...
nodes = higher energy
k → π/a0
↑E
Materials Computation Center and Materials Science and Engineering, University of Illinois Urbana-Champaign ©D.D. Johnson (2005) and Board of Trustees
Estimating Density of States
• “molecular” like approach can construct most DOS in bulkand surfaces, as well as molecules at surface.
e.g., pure fcc Ni
Solids and Surfaces: A Chemist’s View of Bonding in Extended Structures, Roald Hoffmann ( Wiley-VCH, 1988)
“molecular” type of view Real tight-binding (Debye-Hückle)
Recall level filling inatoms: 3d, 4s, 4p.
3d is more local, and4s more extended,ionized first.

19
Materials Computation Center and Materials Science and Engineering, University of Illinois Urbana-Champaign ©D.D. Johnson (2005) and Board of Trustees
Band-Width Dictated by Size (lattice constant)
Solids and Surfaces: A Chemist’s View of Bonding in Extended Structures, Roald Hoffmann ( Wiley-VCH, 1988)
€
E± =<ψ | H |ψ >
<ψ |ψ >
Orbitals Bonding + vs. Anti-Bonding –
Example H-H
€
E± =H11 ± H12
1±S12
Or, in terms of overlap matrices, Sij,and Hamiltonian matrix elements, Hij
As lattice decreases, overlap increases, so
+ case: bonding orbitals less stabilized
– case: antibonding more destabilized!
atomic level-13.6 eV
More atomic-like
H2 - Real tight-binding (Debye-Hückle)
Bandwidth reflects “size” of atoms: if you ‘squeeze’ atoms bandwidth increases and destabilizes systems.
Materials Computation Center and Materials Science and Engineering, University of Illinois Urbana-Champaign ©D.D. Johnson (2005) and Board of Trustees
H on Square Lattice: Band Widths and Nodes
• “molecular” like approach can construct most bands.
Solids and Surfaces: A Chemist’s View of Bonding in Extended Structures, Roald Hoffmann ( Wiley-VCH, 1988)
M point hasmost nodes

20
Materials Computation Center and Materials Science and Engineering, University of Illinois Urbana-Champaign ©D.D. Johnson (2005) and Board of Trustees
DOS, Band-filling, and magnetism: fcc Ni-Fe
FM disordered Ni75Fe25 and ordered L12-Ni3Fe DOS
Disordered - or mixed
Nilarger Z
Fe
3d
4s
4p
Spin up e-
Nilarger Z
Fe
Spin down e-
Larger exchange-splitting in Fe• moves Fe down states higher• spin-orbit small, no spin flips.
Materials Computation Center and Materials Science and Engineering, University of Illinois Urbana-Champaign ©D.D. Johnson (2005) and Board of Trustees
Density of States of fcc Ni-Fe: KKR-CPA
FM disordered Ni75Fe25 and ordered L12-Ni3Fe DOS
• Ni-Fe alloy properties driven by magnetism and band-filling.• As are INVAR properties, see papers by D.D. Johnson et al.
Maj. up
Min. dn
• Disordered fcc Ni3Fe: mixed• spin down states at higher E.• spin up states common band(low resistivity - s-carriers).• provides spin-up carriers
• L10 Ni3Fe: ordered•orders due to opening pseudo-gap between minority-spin low-energy “Ni” states and high-energy “Fe” states.
• For ordered state, note furthersplitting of up and down states.
Liu and Johnson, using lmax=3 and ASA.KKR (black) and KKR-CPA (red)
21
Materials Computation Center and Materials Science and Engineering, University of Illinois Urbana-Champaign ©D.D. Johnson (2005) and Board of Trustees
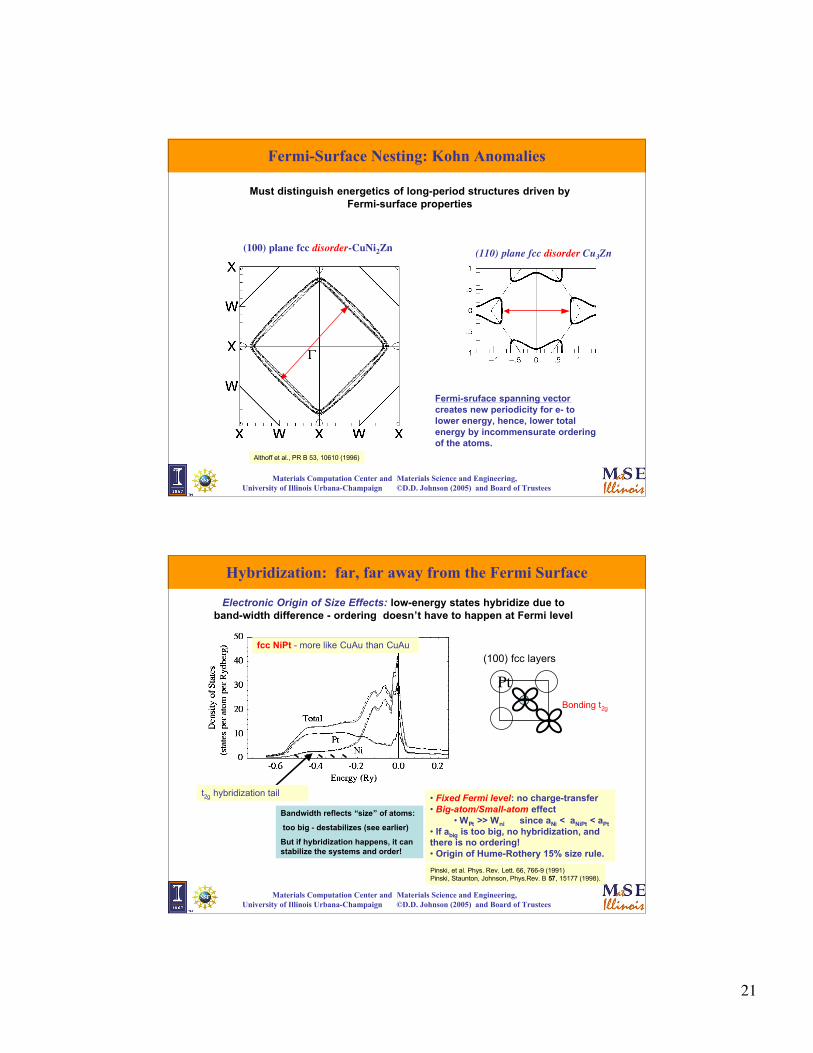
Fermi-Surface Nesting: Kohn Anomalies
(100) plane fcc disorder-CuNi2Zn (110) plane fcc disorder Cu3Zn
Fermi-sruface spanning vectorcreates new periodicity for e- tolower energy, hence, lower totalenergy by incommensurate orderingof the atoms.
Must distinguish energetics of long-period structures driven byFermi-surface properties
Althoff et al., PR B 53, 10610 (1996)
Materials Computation Center and Materials Science and Engineering, University of Illinois Urbana-Champaign ©D.D. Johnson (2005) and Board of Trustees
Hybridization: far, far away from the Fermi Surface
Pinski, et al. Phys. Rev. Lett. 66, 766-9 (1991)Pinski, Staunton, Johnson, Phys.Rev. B 57, 15177 (1998).
Pt
Electronic Origin of Size Effects: low-energy states hybridize due toband-width difference - ordering doesn’t have to happen at Fermi level
t2g hybridization tail • Fixed Fermi level: no charge-transfer• Big-atom/Small-atom effect
• WPt >> Wni since aNi < aNiPt < aPt
• If abig is too big, no hybridization, andthere is no ordering!• Origin of Hume-Rothery 15% size rule.
(100) fcc layers
Bonding t2g
fcc NiPt - more like CuAu than CuAu
Bandwidth reflects “size” of atoms:
too big - destabilizes (see earlier)
But if hybridization happens, it canstabilize the systems and order!

22
Materials Computation Center and Materials Science and Engineering, University of Illinois Urbana-Champaign ©D.D. Johnson (2005) and Board of Trustees
Coupling States Near the Fermi Surface: fcc CuPt
Clark et al., Phys. Rev. Lett. 74, 3225-8 (1995)
CuPt: the only metal that orders in L11, or so-called CuPt order.
Holes at L and electrons at X couple:van Hove singularities in DOS
• Ordering along <111> breakssymmetry of x-y-z equally.
• Jahn-Teller-like effect.
• Induced by van Hove singularities
Disordered L11 L10
Along 111 Along 001
Materials Computation Center and Materials Science and Engineering, University of Illinois Urbana-Champaign ©D.D. Johnson (2005) and Board of Trustees
Summary
• Calculating reliable DFT-based formation enthalpies possible.
• Great care must be taken to validate results: convergence issues,exchange-correlation issues, etc.
• Calculating DFT structural energies are CPU intensive and cannotdo search for global ground-search unless know where to look, or arealways extremely lucky! NEED ANOTHER MEANS
• DFT-based approach can provide very useful insight tocharacterization experiments, which narrowed your search.
• For Phase Stability and Prediction, require a means to coarse-grainDFT energies (and electronic-structure information) into simplerHamiltonian, which can be used in Monte Carlo, but including theimportant physics for each system.
• Structural Databases can be useful tool: provides energyinformation and never start from scratch
Next, let us look at the Cluster Expansion for Coarse-Graining