Weeding risk
76
WEEDING RISK Financial Impacts of Climate Change and Water Scarcity on Asia’s Food and Beverage Sector India, Indonesia, Malaysia, Philippines, Thailand, Vietnam WRI Dana Krechowicz Shally Venugopal Amanda Sauer HSBC Sandeep Somani Shipra Pandey
-
Upload
kotharipriyank123 -
Category
Data & Analytics
-
view
188 -
download
3
Transcript of Weeding risk
WEEDING RISKFinancial Impacts of Climate Change and Water Scarcity on Asia’s Food and Beverage SectorIndia, Indonesia, Malaysia, Philippines, Thailand, Vietnam
WRI
Dana Krechowicz
Shally Venugopal
Amanda Sauer
HSBC
Sandeep Somani
Shipra Pandey
ISBN: 978-1-56973-741-5
ABOUT WRI
The World Resources Institute (WRI) is an environmental think tank that goes beyond research to create practical ways to protect the Earth and improve people’s lives. Our mission is to move human society to live in ways that protect the Earth’s environment for current and future generations.
Our programs meet global challenges by using knowledge to catalyze public and private action.
• To reverse damage to ecosystems. We protect the capacity of ecosystems to sustain life and prosperity.
• To expand participation in environmental decisions. We collaborate with partners worldwide to increase people’s access to information and influence over decisions about natural resources.
• To avert dangerous climate change. We promote public and private action to ensure a safe climate and a sound world economy.
• To increase prosperity while improving the environment. We challenge the private sector to grow by improving environmental and community well-being.
In all its policy research, and work with institutions, WRI tries to build bridges between ideas and actions, meshing the insights of scientifi c research, economic and institutional analyses, and practical experience with the need for open and participatory decision making.
ABOUT HSBC CLIMATE CHANGE CENTRE OF EXCELLENCEThe HSBC Climate Change Centre of Excellence was created in 2007, to help advise HSBC and its clients on the evolution and impacts of climate change. The team performs macro research on climate change science, policies and markets.
The Centre also publishes joint research pieces in collaboration with fundamental analysts, helping highlight valuation impacts of climate change. Global and country-specifi c reports highlight investment potential related to policy and market changes.
10 G Street, NESuite 800Washington, DC 20002www.wri.org
Each World Resources Institute (WRI) report represents a timely and scholarly treatment of a subject of public concern. WRI takes responsibility for choosing the study topics and guaranteeing its authors and researchers freedom of inquiry. It also solicits and responds to the guidance of advisory panels and expert reviewers. Unless otherwise stated, however, all the interpretations and findings set forth in WRI publications are those of the authors.
ISBN: 978-1-56973-741-5
Copyright 2010 World Resources Institute ©
1World Resources Institute
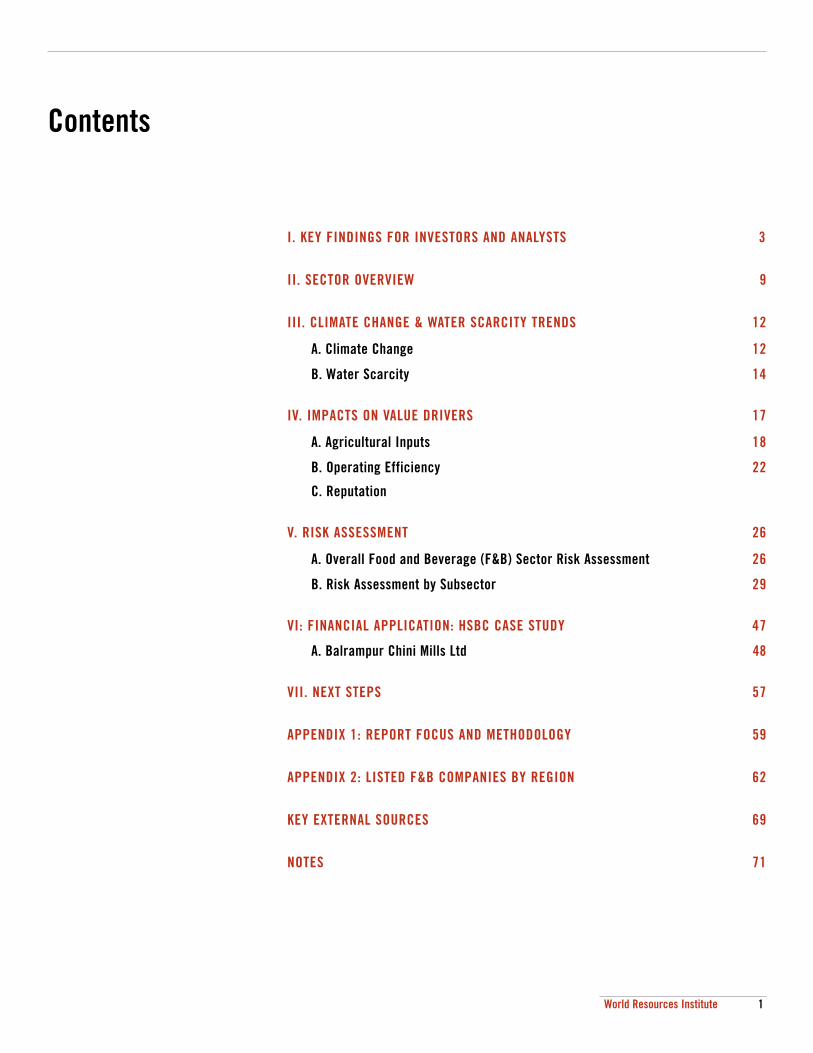
Contents
I. KEY FINDINGS FOR INVESTORS AND ANALYSTS 3
II. SECTOR OVERVIEW 9
III. CLIMATE CHANGE & WATER SCARCITY TRENDS 12
A. Climate Change 12
B. Water Scarcity 14
IV. IMPACTS ON VALUE DRIVERS 17
A. Agricultural Inputs 18
B. Operating Efficiency 22
C. Reputation
V. RISK ASSESSMENT 26
A. Overall Food and Beverage (F&B) Sector Risk Assessment 26
B. Risk Assessment by Subsector 29
VI: FINANCIAL APPLICATION: HSBC CASE STUDY 47
A. Balrampur Chini Mills Ltd 48
VII. NEXT STEPS 57
APPENDIX 1: REPORT FOCUS AND METHODOLOGY 59
APPENDIX 2: LISTED F&B COMPANIES BY REGION 62
KEY EXTERNAL SOURCES 69
NOTES 71
ABOUT THE PROJECT This report would not have been possible without the financial support of the International Finance Corporation (IFC) and grant funding from the Government of Japan. The research project’s objective is to guide investors and analysts through assessing the financial impacts of select environmental trends on listed companies in India, Indonesia, Malaysia, Philippines, Thailand, and Vietnam. Other research reports produced within this series are listed below. More information on the project and copies of the reports are available for download at www.wri.org/project/envest.
Emerging Risk: Impacts of Key Environmental Trends in Emerging Asia.
Undisclosed Risk: Corporate Environmental and Social Reporting in Emerging Asia.
Over Heating: Financial Risks from Water Constraints on Power Generation in Asia.
Surveying Risk, Building Opportunity: Financial Impacts of Energy Insecurity, Water Scarcity and Climate Change on Asia’s Commercial Real Estate Sector.
Weeding Risk, Over Heating, and Surveying Risk include contributions from HSBC, provided by HSBC’s Climate Change Centre of Excellence and HSBC Global Research's India Equity Research Division.
ACKNOWLEDGMENTS Special thanks to our World Resources Institute colleagues, Janet Ranganathan, Polly Ghazi, Piet Klop, John Finisdore, Norbert Henninger, Jeffrey Wielgus and Evan Branosky who gener-ously contributed their time and expertise to reviewing early drafts of this report and improv-ing the analysis. We would also like to thank ISciences LLC for the water scarcity maps. We are also grateful for the thoughtful contributions by Kavita Prakash-Mani (formerly of SustainAbility), Mark Eckstein (WWF), Lauren Torres and Cedric Besnard (HSBC), Ivo Knoepfel (onValues), and Daniel Beneat. Special thanks are owed to Euan Marshall (IFC) and Berit Lindholdt Lauridsen (IFC) for providing ongoing guidance on the scope and direction of this research. HSBC’s food and beverage analysts in India, Sandeep Somani and Shipra Pandey, interviewed the companies and developed the financial modeling and analysis for the case study. HSBC's Climate Change Centre of Excellence based in the UK and India, especially Roshan Padamadan and Charanjit Singh, provided guidance on the context and general feed-back. Also thank you to Jennie Hommel for managing the review process, Allison Sobel for her excellent copyediting, and Maggie Powell for her creative effort in laying out the report.
ABOUT THE AUTHORS Dana Krechowicz is an Associate in the Envest project at WRI. [email protected] Shally Venugopal is an Associate in the Envest project at WRI. [email protected] Sauer is a Senior Associate in the Envest project at WRI. [email protected]
COVER PHOTO CREDIT iStockphoto
April 2010
I . K E Y F I N D I N G S F O R I N V E S T O R S A N D A N A L Y S T S
3World Resources Institute
I. Key Findings for Investors and Analysts
This report identifies the potential financial impacts arising from climate change and water scarcity on the publicly listed companies in the USD1 $40 billion food and beverage (F&B) sector in South and Southeast Asia. It focuses on domestic companies that process and package foods and non-alcoholic beverages in India, Indonesia, Malaysia, Philippines, Thailand, and Vietnam.
The report examines the potential impact of climate change and water scarcity on three key value drivers (agricultural inputs, operating efficiency, and reputation) for each of the seven most important F&B subsectors — aquaculture, beverages, confectionary, dairy/poultry, edi-ble oils, starches, and sugar.
This report offers a road map for analysts and investors seeking to factor environmental trends and their potential financial impacts into their assessments of companies’ strategic positioning in this sector and region.
In a case study, HSBC examines the financial implications of climate change and water scarcity on an Indian sugar company, Balrampur Chini Mills.
CONTEXT Climate change and water scarcity are two major global environmental trends that are accelerating and already impacting many sectors of the economy worldwide.
Climate change and water scarcity are complex, long-term and inter-related environmen-tal trends that can create a wide range of consequences for companies and sectors worldwide.
The specific impacts of these trends and the financial implications for investors vary by company, sector and country. Pertinent characteristics of these trends are provided in Table 1:
TABLE 1. Aspects of Environmental Trends Examined in this Report
Climate Change Water Scarcity
Temperature increase Physical scarcity (geography, timing)
Change in precipitation Decrease in water quality due to pollution
Increase in incidence of extreme weather events Cost increases due to scarcity
Rising atmospheric carbon dioxide (CO2) concentrations Increased conflicts with other users
Source: WRI
W E E D I N G R I S K
4 World Resources Institute
South and Southeast Asia are particularly at risk from climate change and water scarcity due to the magnitude of predicted regional impacts and demographic trends.
The region is already struggling with increased demand for water from population and economic growth while facing diminishing supplies in certain areas, especially parts of India and urban zones in Southeast Asia.
Climate change models predict that impacts will be severe in this region and will exacer-bate water scarcity problems.
The Food and Beverage (F&B) sector is especially vulnerable to climate change and water scarcity because of its close ties to agricultural productivity and changing con-sumer preferences.
Access to water supplies and stable climatic conditions are prerequisites for the reliable production of the agricultural inputs required for the F&B industry.
The agricultural sector’s high reliance on chemical inputs and mono crops (growing the same one variety of crop every year on the same land) has made food systems more at risk for disruption from climate change and water scarcity.
Consumer trends in the region towards more processed foods and increased meat and dairy consumption are requiring more agricultural and natural resources, including water, per unit of food sold.
Together, these trends are increasing the sector’s use of natural resources at the same time that climate change and water scarcity threaten to reduce their supply.
KEY FINDINGS This report draws on consultations with experts and the best available literature to assess the financial implications of climate change and water scarcity on the F&B sector in South and Southeast Asia. Our analysis and findings focus on three commonly-accept-ed value drivers: agricultural inputs, operating efficiency, and reputation.
The most financially material impacts of climate change and water scarcity on the F&B sector are increased agricultural input prices and increased processing costs.
The impact of climate change and water scarcity on agricultural input prices and pro-cessing costs affects all F&B subsectors examined in this report.
The significance of the impact depends on a number of factors, including location of suppliers and factories, ability to pass costs onto consumers and the sustainability of supplier cultivation practices.
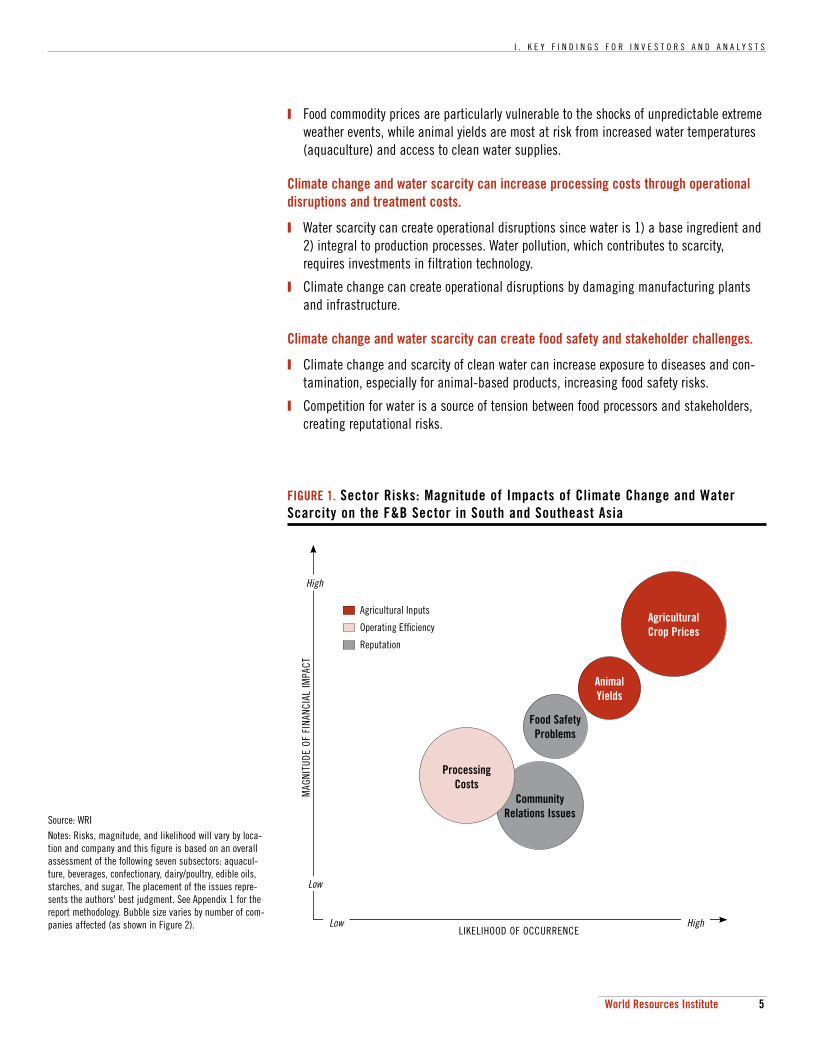
Figure 1 assesses the likelihood and magnitude of the following risks on the F&B sector:
Climate change and water scarcity can raise agricultural commodity prices and increase price volatility by decreasing yields.
Climate change and water scarcity can have a direct impact on the availability, quality and price of key food commodity inputs by negatively impacting animal and crop yields.
I . K E Y F I N D I N G S F O R I N V E S T O R S A N D A N A L Y S T S
5World Resources Institute
Food commodity prices are particularly vulnerable to the shocks of unpredictable extreme weather events, while animal yields are most at risk from increased water temperatures (aquaculture) and access to clean water supplies.
Climate change and water scarcity can increase processing costs through operational disruptions and treatment costs.
Water scarcity can create operational disruptions since water is 1) a base ingredient and 2) integral to production processes. Water pollution, which contributes to scarcity, requires investments in filtration technology.
Climate change can create operational disruptions by damaging manufacturing plants and infrastructure.
Climate change and water scarcity can create food safety and stakeholder challenges.
Climate change and scarcity of clean water can increase exposure to diseases and con-tamination, especially for animal-based products, increasing food safety risks.
Competition for water is a source of tension between food processors and stakeholders, creating reputational risks.
Source: WRINotes: Risks, magnitude, and likelihood will vary by loca-tion and company and this figure is based on an overall assessment of the following seven subsectors: aquacul-ture, beverages, confectionary, dairy/poultry, edible oils, starches, and sugar. The placement of the issues repre-sents the authors' best judgment. See Appendix 1 for the report methodology. Bubble size varies by number of com-panies affected (as shown in Figure 2).
FIGURE 1. Sector Risks: Magnitude of Impacts of Climate Change and Water Scarcity on the F&B Sector in South and Southeast Asia
Agricultural Crop Prices
HighLow
MAG
NITU
DE O
F FI
NANC
IAL
IMPA
CT
LIKELIHOOD OF OCCURRENCE
High
Low
Agricultural Inputs
Operating Effi ciency
Reputation
Food Safety Problems
Community Relations Issues
Animal Yields
Processing Costs
W E E D I N G R I S K
6 World Resources Institute
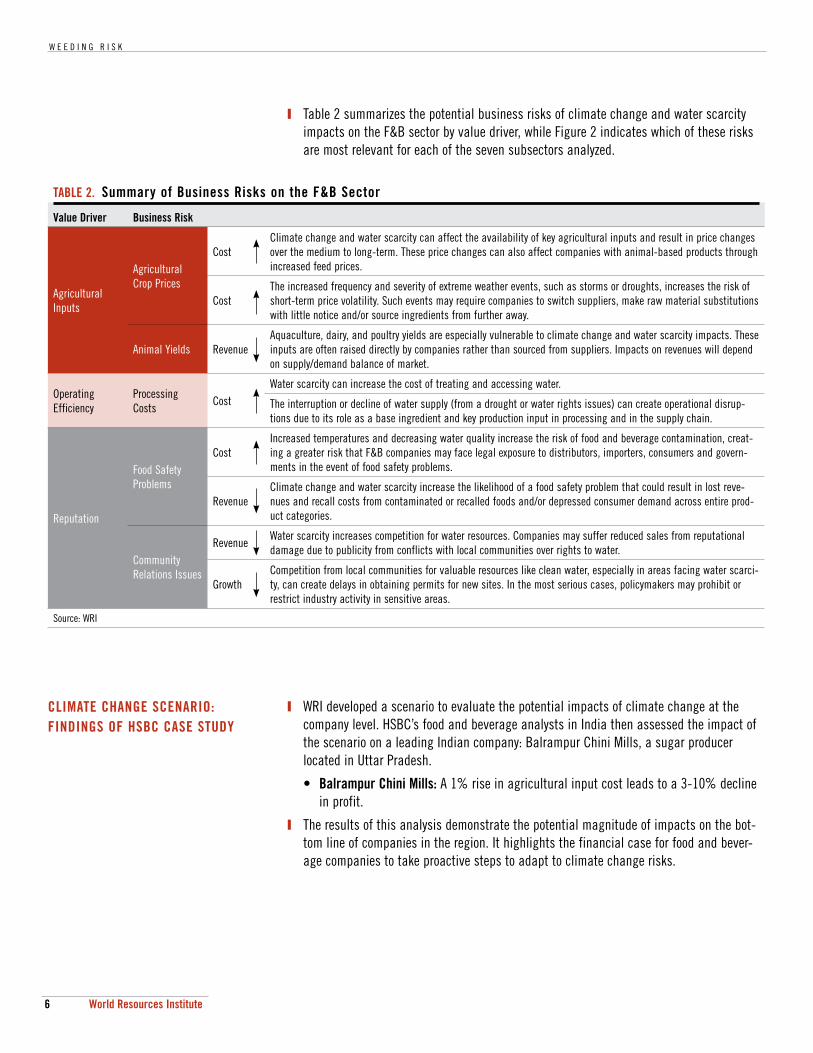
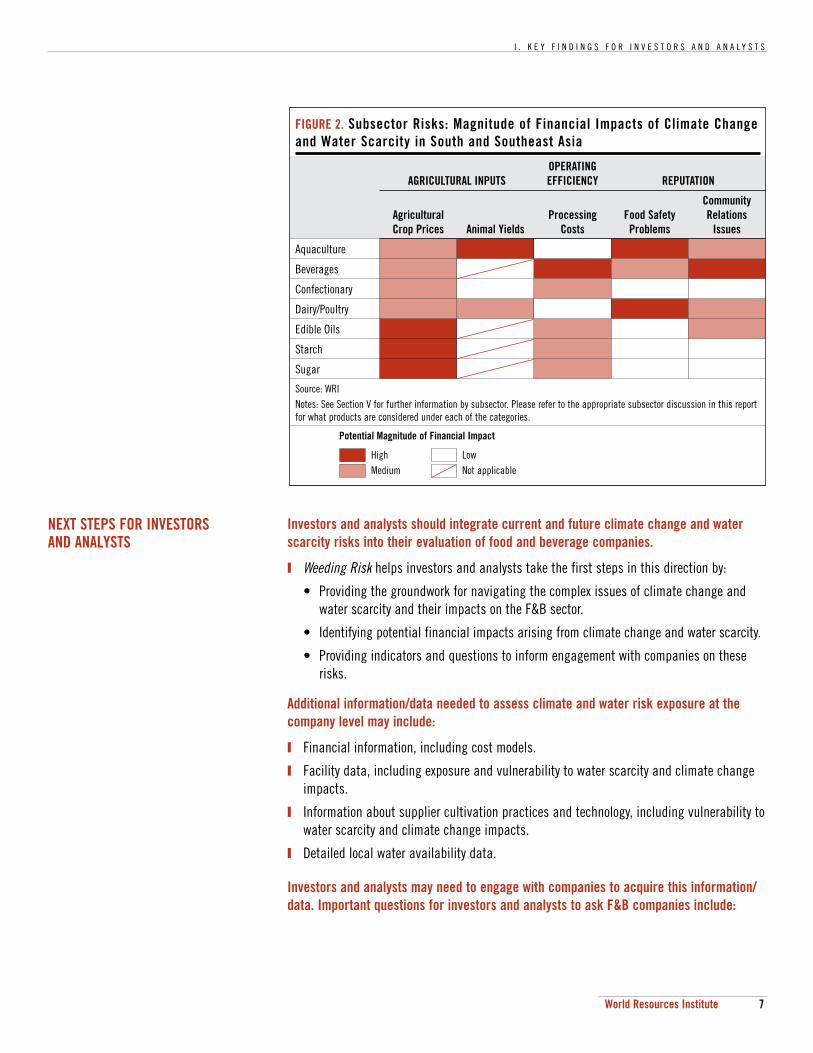
Table 2 summarizes the potential business risks of climate change and water scarcity impacts on the F&B sector by value driver, while Figure 2 indicates which of these risks are most relevant for each of the seven subsectors analyzed.
WRI developed a scenario to evaluate the potential impacts of climate change at the company level. HSBC’s food and beverage analysts in India then assessed the impact of the scenario on a leading Indian company: Balrampur Chini Mills, a sugar producer located in Uttar Pradesh.
• Balrampur Chini Mills: A 1% rise in agricultural input cost leads to a 3-10% decline in profit.
The results of this analysis demonstrate the potential magnitude of impacts on the bot-tom line of companies in the region. It highlights the financial case for food and bever-age companies to take proactive steps to adapt to climate change risks.
TABLE 2. Summary of Business Risks on the F&B Sector
Value Driver Business Risk
Agricultural Inputs
Agricultural Crop Prices
CostClimate change and water scarcity can affect the availability of key agricultural inputs and result in price changes over the medium to long-term. These price changes can also affect companies with animal-based products through increased feed prices.
CostThe increased frequency and severity of extreme weather events, such as storms or droughts, increases the risk of short-term price volatility. Such events may require companies to switch suppliers, make raw material substitutions with little notice and/or source ingredients from further away.
Animal Yields RevenueAquaculture, dairy, and poultry yields are especially vulnerable to climate change and water scarcity impacts. These inputs are often raised directly by companies rather than sourced from suppliers. Impacts on revenues will depend on supply/demand balance of market.
Operating Efficiency
Processing Costs
CostWater scarcity can increase the cost of treating and accessing water.
The interruption or decline of water supply (from a drought or water rights issues) can create operational disrup-tions due to its role as a base ingredient and key production input in processing and in the supply chain.
Reputation
Food Safety Problems
CostIncreased temperatures and decreasing water quality increase the risk of food and beverage contamination, creat-ing a greater risk that F&B companies may face legal exposure to distributors, importers, consumers and govern-ments in the event of food safety problems.
RevenueClimate change and water scarcity increase the likelihood of a food safety problem that could result in lost reve-nues and recall costs from contaminated or recalled foods and/or depressed consumer demand across entire prod-uct categories.
Community Relations Issues
RevenueWater scarcity increases competition for water resources. Companies may suffer reduced sales from reputational damage due to publicity from conflicts with local communities over rights to water.
GrowthCompetition from local communities for valuable resources like clean water, especially in areas facing water scarci-ty, can create delays in obtaining permits for new sites. In the most serious cases, policymakers may prohibit or restrict industry activity in sensitive areas.
Source: WRI
CLIMATE CHANGE SCENARIO: FINDINGS OF HSBC CASE STUDY
I . K E Y F I N D I N G S F O R I N V E S T O R S A N D A N A L Y S T S
7World Resources Institute
NEXT STEPS FOR INVESTORS AND ANALYSTS
Investors and analysts should integrate current and future climate change and water scarcity risks into their evaluation of food and beverage companies.
Weeding Risk helps investors and analysts take the first steps in this direction by:
• Providing the groundwork for navigating the complex issues of climate change and water scarcity and their impacts on the F&B sector.
• Identifying potential financial impacts arising from climate change and water scarcity.
• Providing indicators and questions to inform engagement with companies on these risks.
Additional information/data needed to assess climate and water risk exposure at the company level may include:
Financial information, including cost models.
Facility data, including exposure and vulnerability to water scarcity and climate change impacts.
Information about supplier cultivation practices and technology, including vulnerability to water scarcity and climate change impacts.
Detailed local water availability data.
Investors and analysts may need to engage with companies to acquire this information/data. Important questions for investors and analysts to ask F&B companies include:
FIGURE 2. Subsector Risks: Magnitude of Financial Impacts of Climate Change and Water Scarcity in South and Southeast Asia
AGRICULTURAL INPUTSOPERATING EFFICIENCY REPUTATION
Agricultural Crop Prices Animal Yields
Processing Costs
Food Safety Problems
Community Relations
Issues
Aquaculture
Beverages
Confectionary
Dairy/Poultry
Edible Oils
Starch
Sugar
Source: WRINotes: See Section V for further information by subsector. Please refer to the appropriate subsector discussion in this report for what products are considered under each of the categories.
Potential Magnitude of Financial Impact
HighMedium
LowNot applicable
W E E D I N G R I S K
8 World Resources Institute
Is the facility (or supplier facility) located in a water scarce or climate change prone region?
What factors threaten the facility’s water supply? Are these threats growing in signifi-cance? Has the risk of climate change been taken into account?
What is the facility’s water usage? If not reported, what water reducing technologies are in place?
How is the facility’s water supply secured? What degree of volatility exists under this arrangement? Which water users are given priority in scarcity situations?
What are the supplier practices in the areas of food safety, fertilizer use and crop rota-tion?
With this information, examples of approaches that can be taken to integrate climate and water risks into the analysis of F&B companies include:
Sensitivity analysis: For facilities dependent on freshwater resources, conduct a facility level sensitivity analysis of financial impacts (on costs and sales) of water supply distri-butions. This will reveal which companies have the highest financial risk tied to disrup-tions.
Scenario analysis: Develop scenarios around water availability at the river basin level for a given facility based on future projections (if available) or key risk factors present at the local level. When combined with the sensitivity analysis above, this provides insight into which companies are most at risk from water constraints and the potential magnitude of financial impact.
Management quality analysis: Assess and rank companies based on the ability of corpo-rate initiatives, including comprehensive water management strategies, and advanced technologies, such as water reuse and recycling, to mitigate water risk. Use this informa-tion to appropriately adjust conclusions from the sensitivity and scenarios analyses.
How, or if, the results from these approaches can be integrated into financial models will depend on factors including the analyst’s view on the probability of impact and the reliabili-ty of the underlying data. However, even if they cannot be integrated into financial models they can be used to inform the general view on management quality. This subjective view-point on a company, combined with investor data on companies, can inform the following investment decisions: buy/sell decisions, engagement of various intensities and stock/sector weightings in portfolios.
I I . S E C T O R O V E R V I E W
9World Resources Institute
II. Sector Overview
This report examines how two environmental trends—climate change and water scarcity—may impact the profitability and competitive positioning of locally listed food and beverage (F&B) companies in India, Indonesia, Malaysia, Philippines, Thailand, and Vietnam.
Though the focus of this report is on locally listed F&B companies (including local subsidiar-ies of foreign based companies), foreign companies that are not listed on local stock exchanges also have a significant presence in these six countries. The risks outlined in this report apply to all F&B companies with local operations and/or supply chains.
KEY POINTS:
Demographic changes are shifting the F&B sector towards more processed foods, increased consumption of animal products, and a higher reliance on retail distribution (especially supermarkets).
As a result, the F&B sector is requiring a greater amount of energy, water, and agricultur-al crops per unit of output.
The food and beverage industry is an important economic driver in the region, with close ties to local markets and small scale producers.
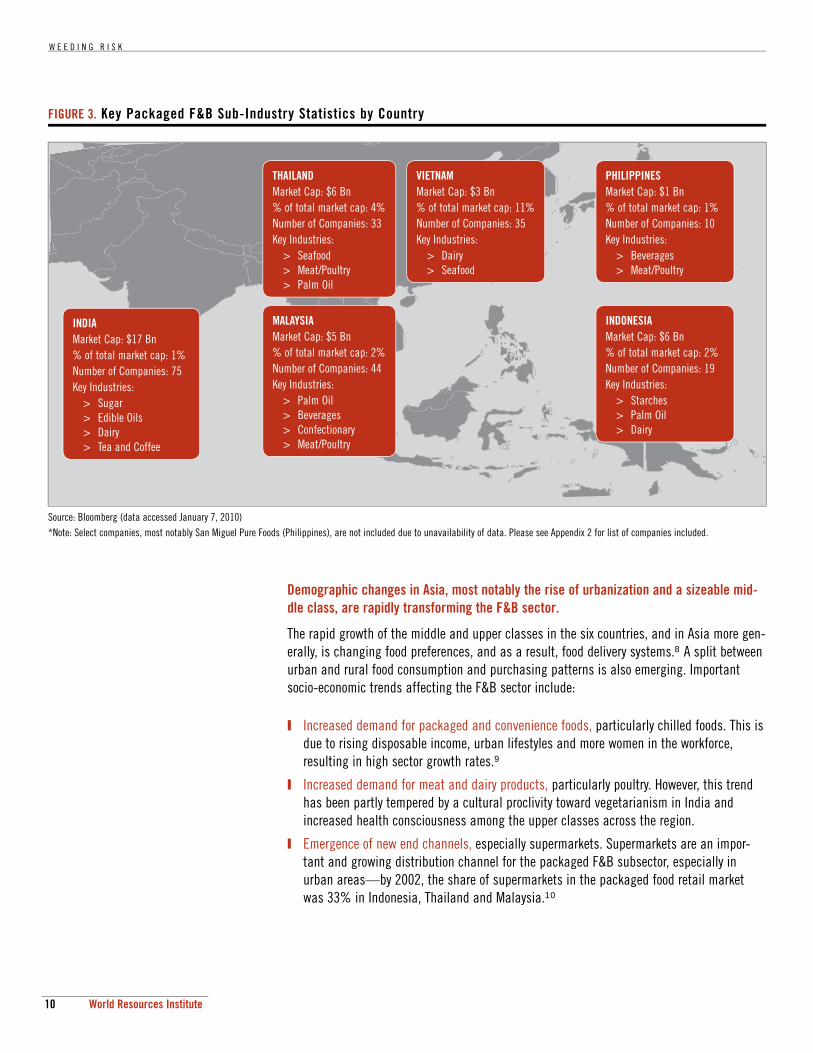
In India, Indonesia, Malaysia, Philippines, Thailand, and Vietnam, the F&B sector includes 216 listed companies with a total market capitalization of USD $40.9 Billion.2 Figure 3 shows a breakdown of market cap and critical sectors by country. See Appendix 2 for a list of packaged F&B companies in the region.
Most processed foods are sourced, manufactured and sold locally, with only 6% traded inter-nationally.3 Supply chains are often located within country borders and products are manu-factured as close as possible to the end consumer to minimize costs, especially in the case of beverages.4 However, exports are significant for certain individual food processors, espe-cially in India, Thailand, Vietnam and the Philippines.
Small scale production is significant as listed F&B companies make up a small percentage of the overall F&B industry size and output in each country. The industry is fragmented and dominated by small and medium sized enterprises (SMEs). Some of these SMEs even operate outside of the national legal and regulatory system, as is the case in India, where they account for 75% of food processing industry output.5
Given the reliance of listed F&B companies on small producers, relationships with suppliers are critical. F&B companies can influence the agricultural practices of their suppliers, though vertical integration and direct sourcing from farmers may be constrained (as in the case of India) by law.6&7
W E E D I N G R I S K
10 World Resources Institute
Demographic changes in Asia, most notably the rise of urbanization and a sizeable mid-dle class, are rapidly transforming the F&B sector.
The rapid growth of the middle and upper classes in the six countries, and in Asia more gen-erally, is changing food preferences, and as a result, food delivery systems.8 A split between urban and rural food consumption and purchasing patterns is also emerging. Important socio-economic trends affecting the F&B sector include:
Increased demand for packaged and convenience foods, particularly chilled foods. This is due to rising disposable income, urban lifestyles and more women in the workforce, resulting in high sector growth rates.9
Increased demand for meat and dairy products, particularly poultry. However, this trend has been partly tempered by a cultural proclivity toward vegetarianism in India and increased health consciousness among the upper classes across the region.
Emergence of new end channels, especially supermarkets. Supermarkets are an impor-tant and growing distribution channel for the packaged F&B subsector, especially in urban areas—by 2002, the share of supermarkets in the packaged food retail market was 33% in Indonesia, Thailand and Malaysia.10
FIGURE 3. Key Packaged F&B Sub-Industry Statistics by Country
Source: Bloomberg (data accessed January 7, 2010)*Note: Select companies, most notably San Miguel Pure Foods (Philippines), are not included due to unavailability of data. Please see Appendix 2 for list of companies included.
INDIAMarket Cap: $17 Bn% of total market cap: 1%Number of Companies: 75Key Industries:
> Sugar> Edible Oils> Dairy> Tea and Coffee
THAILANDMarket Cap: $6 Bn% of total market cap: 4%Number of Companies: 33Key Industries:
> Seafood> Meat/Poultry> Palm Oil
MALAYSIAMarket Cap: $5 Bn% of total market cap: 2%Number of Companies: 44Key Industries:
> Palm Oil> Beverages> Confectionary> Meat/Poultry
VIETNAMMarket Cap: $3 Bn% of total market cap: 11%Number of Companies: 35Key Industries:
> Dairy> Seafood
PHILIPPINESMarket Cap: $1 Bn% of total market cap: 1%Number of Companies: 10Key Industries:
> Beverages> Meat/Poultry
INDONESIAMarket Cap: $6 Bn% of total market cap: 2%Number of Companies: 19Key Industries:
> Starches> Palm Oil> Dairy
I I . S E C T O R O V E R V I E W
11World Resources Institute
The sector’s shift towards more processed foods, increased consumption of animal prod-ucts, and a higher reliance on retail distribution are increasing the natural resource intensity of the F&B sector.
Packaged and convenience foods require significant amounts of energy and water to pro-cess, package, store and transport, in addition to the resource inputs required to produce the underlying agricultural commodities. Transforming fresh food into packaged foods with an extended shelf life requires resource intensive processes such as dehydration, heating and cooling. Meat and dairy products are also resource intensive, particularly their use of water. For example, on average, one kilogram of chicken requires approximately 3,900 metric tons of water to produce, due mainly to the water required to grow the grains the chicken consumes. Preserving meat, dairy, frozen and other chilled foods requires energy-intensive refrigeration throughout the supply chain of procurement, distribution and sales.
W E E D I N G R I S K
12 World Resources Institute
III. Climate Change and Water Scarcity Trends
This report considers the physical impacts of climate change and water scarcity on the F&B sector in South and Southeast Asia. Other important environmental issues affecting the sec-tor, including land and water management, pollution and waste, are discussed only as they relate to climate change and water scarcity.
Climate change and water scarcity are interconnected because climate change is a major contributor to water scarcity. For example, climate change will exacerbate water scarcity in some areas due to lower precipitation, and in other areas could cause flash floods due to higher precipitation. In the long term, melting glaciers can change river patterns, causing some of the perennial rivers to become more seasonal. Therefore the discussion of water scarcity also implies climate change unless specifically noted in the text.
KEY POINTS:
The physical impacts of climate change are predicted to affect operating and growing conditions for the F&B industry and its agricultural inputs.
As a large water user, the F&B industry and its agricultural inputs will face increased water scarcity in some regions due to climate change as well as declining water quality.
A. CLIMATE CHANGE Climate change is predicted to increase temperatures, alter precipitation patterns, and increase the frequency and intensity of extreme weather events.
The burning of fossil fuels and land use changes such as deforestation have resulted in rap-idly increasing global emissions of greenhouse gases (GHGs). The accumulation of these heat trapping gases in the atmosphere creates changes in the earth’s climate, also known as global climate change, which is leading to floods, droughts, and extreme weather events. Concern over the physical impacts of climate change has accelerated in recent years, result-ing in international pressure to reduce GHG emissions and shift to low-carbon technologies and practices.
Global climate change is expected to induce gradual shifts in climatic conditions that over time have the potential for dramatic impacts on the F&B sector’s direct operations and sup-ply chains. In South and Southeast Asia, the physical impacts of climate change—specifi-cally, changes in precipitation patterns, temperature and the intensity and frequency of extreme weather events—are likely to have a significant impact on many sectors.
The physical impacts of climate change most relevant to the F&B sector include:
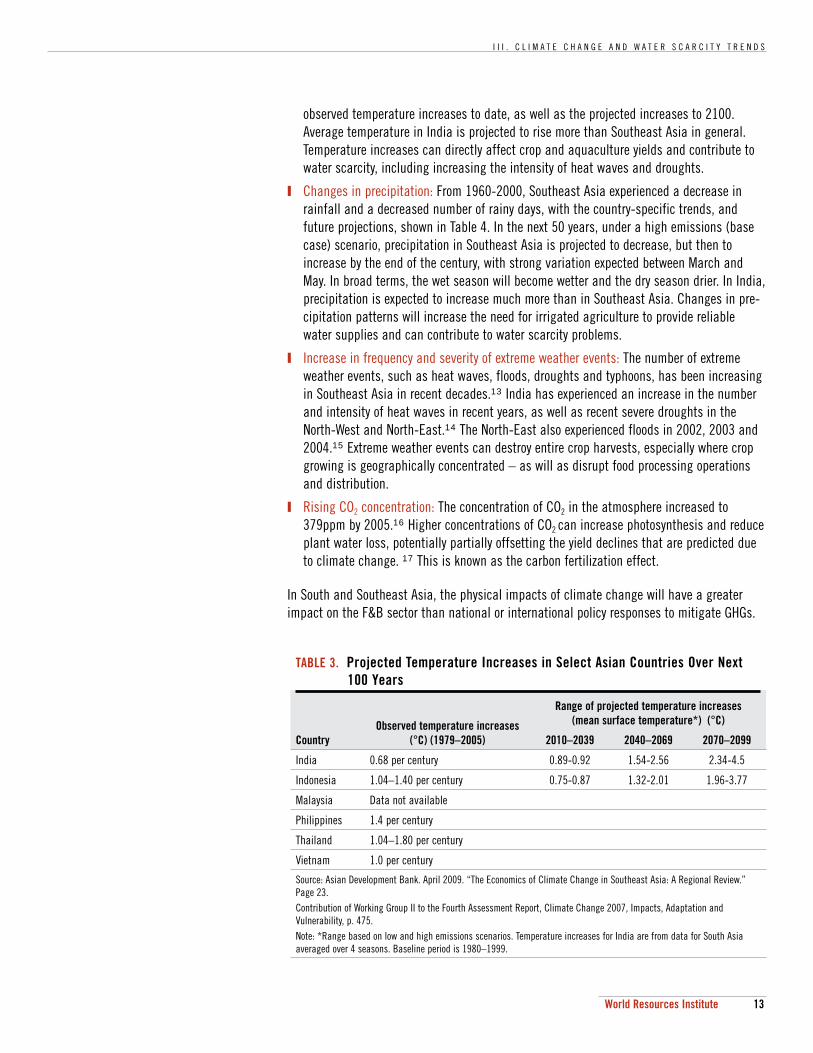
Temperature increases: The mean surface temperature in Southeast Asia is projected to rise by more than the global average over the next 100 years.12 Table 3 shows the
I I I . C L I M A T E C H A N G E A N D W A T E R S C A R C I T Y T R E N D S
13World Resources Institute
observed temperature increases to date, as well as the projected increases to 2100. Average temperature in India is projected to rise more than Southeast Asia in general. Temperature increases can directly affect crop and aquaculture yields and contribute to water scarcity, including increasing the intensity of heat waves and droughts.
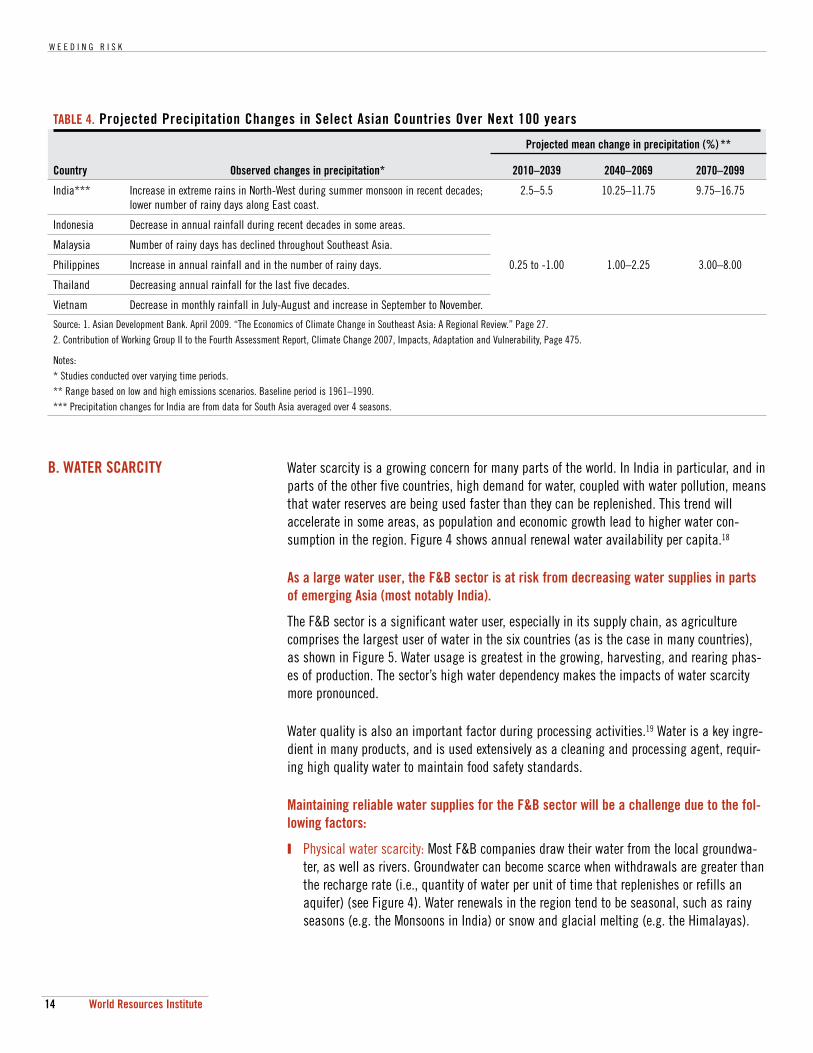
Changes in precipitation: From 1960-2000, Southeast Asia experienced a decrease in rainfall and a decreased number of rainy days, with the country-specific trends, and future projections, shown in Table 4. In the next 50 years, under a high emissions (base case) scenario, precipitation in Southeast Asia is projected to decrease, but then to increase by the end of the century, with strong variation expected between March and May. In broad terms, the wet season will become wetter and the dry season drier. In India, precipitation is expected to increase much more than in Southeast Asia. Changes in pre-cipitation patterns will increase the need for irrigated agriculture to provide reliable water supplies and can contribute to water scarcity problems.
Increase in frequency and severity of extreme weather events: The number of extreme weather events, such as heat waves, floods, droughts and typhoons, has been increasing in Southeast Asia in recent decades.13 India has experienced an increase in the number and intensity of heat waves in recent years, as well as recent severe droughts in the North-West and North-East.14 The North-East also experienced floods in 2002, 2003 and 2004.15 Extreme weather events can destroy entire crop harvests, especially where crop growing is geographically concentrated – as will as disrupt food processing operations and distribution.
Rising CO2 concentration: The concentration of CO2 in the atmosphere increased to 379ppm by 2005.16 Higher concentrations of CO2 can increase photosynthesis and reduce plant water loss, potentially partially offsetting the yield declines that are predicted due to climate change. 17 This is known as the carbon fertilization effect.
In South and Southeast Asia, the physical impacts of climate change will have a greater impact on the F&B sector than national or international policy responses to mitigate GHGs.
TABLE 3. Projected Temperature Increases in Select Asian Countries Over Next 100 Years
CountryObserved temperature increases
(°C) (1979–2005)
Range of projected temperature increases (mean surface temperature*) (°C)
2010–2039 2040–2069 2070–2099
India 0.68 per century 0.89-0.92 1.54-2.56 2.34-4.5
Indonesia 1.04–1.40 per century 0.75-0.87 1.32-2.01 1.96-3.77
Malaysia Data not available
Philippines 1.4 per century
Thailand 1.04–1.80 per century
Vietnam 1.0 per century
Source: Asian Development Bank. April 2009. “The Economics of Climate Change in Southeast Asia: A Regional Review.” Page 23.Contribution of Working Group II to the Fourth Assessment Report, Climate Change 2007, Impacts, Adaptation and Vulnerability, p. 475.Note: *Range based on low and high emissions scenarios. Temperature increases for India are from data for South Asia averaged over 4 seasons. Baseline period is 1980–1999.
W E E D I N G R I S K
14 World Resources Institute
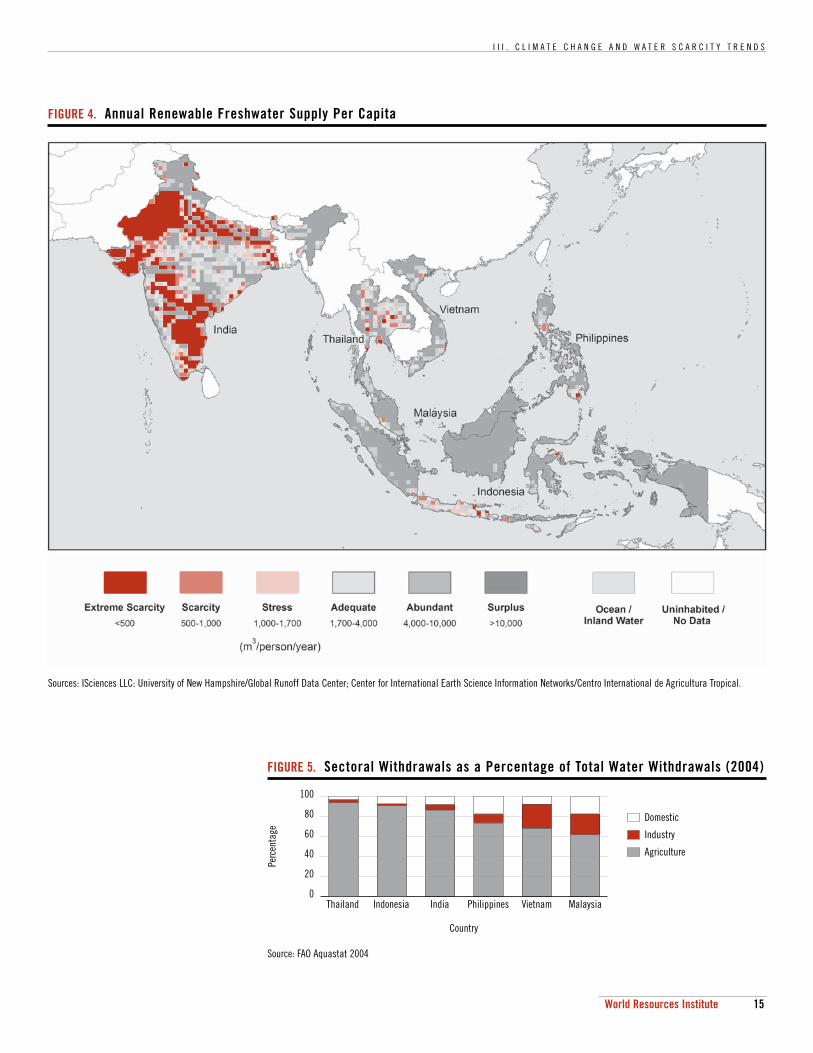
B. WATER SCARCITY Water scarcity is a growing concern for many parts of the world. In India in particular, and in parts of the other five countries, high demand for water, coupled with water pollution, means that water reserves are being used faster than they can be replenished. This trend will accelerate in some areas, as population and economic growth lead to higher water con-sumption in the region. Figure 4 shows annual renewal water availability per capita.18
As a large water user, the F&B sector is at risk from decreasing water supplies in parts of emerging Asia (most notably India).
The F&B sector is a significant water user, especially in its supply chain, as agriculture comprises the largest user of water in the six countries (as is the case in many countries), as shown in Figure 5. Water usage is greatest in the growing, harvesting, and rearing phas-es of production. The sector’s high water dependency makes the impacts of water scarcity more pronounced.
Water quality is also an important factor during processing activities.19 Water is a key ingre-dient in many products, and is used extensively as a cleaning and processing agent, requir-ing high quality water to maintain food safety standards.
Maintaining reliable water supplies for the F&B sector will be a challenge due to the fol-lowing factors:
Physical water scarcity: Most F&B companies draw their water from the local groundwa-ter, as well as rivers. Groundwater can become scarce when withdrawals are greater than the recharge rate (i.e., quantity of water per unit of time that replenishes or refills an aquifer) (see Figure 4). Water renewals in the region tend to be seasonal, such as rainy seasons (e.g. the Monsoons in India) or snow and glacial melting (e.g. the Himalayas).
TABLE 4. Projected Precipitation Changes in Select Asian Countries Over Next 100 years
Country Observed changes in precipitation*
Projected mean change in precipitation (%) **
2010–2039 2040–2069 2070–2099
India*** Increase in extreme rains in North-West during summer monsoon in recent decades; lower number of rainy days along East coast.
2.5–5.5 10.25–11.75 9.75–16.75
Indonesia Decrease in annual rainfall during recent decades in some areas.
0.25 to -1.00 1.00–2.25 3.00–8.00
Malaysia Number of rainy days has declined throughout Southeast Asia.
Philippines Increase in annual rainfall and in the number of rainy days.
Thailand Decreasing annual rainfall for the last five decades.
Vietnam Decrease in monthly rainfall in July-August and increase in September to November.
Source: 1. Asian Development Bank. April 2009. “The Economics of Climate Change in Southeast Asia: A Regional Review.” Page 27.2. Contribution of Working Group II to the Fourth Assessment Report, Climate Change 2007, Impacts, Adaptation and Vulnerability, Page 475.
Notes:* Studies conducted over varying time periods. ** Range based on low and high emissions scenarios. Baseline period is 1961–1990.*** Precipitation changes for India are from data for South Asia averaged over 4 seasons.
I I I . C L I M A T E C H A N G E A N D W A T E R S C A R C I T Y T R E N D S
15World Resources Institute
FIGURE 4. Annual Renewable Freshwater Supply Per Capita
Sources: ISciences LLC: University of New Hampshire/Global Runoff Data Center; Center for International Earth Science Information Networks/Centro International de Agricultura Tropical.
FIGURE 5. Sectoral Withdrawals as a Percentage of Total Water Withdrawals (2004)
Source: FAO Aquastat 2004
100
80
60
40
20
0
Perc
enta
ge
Thailand Indonesia India Philippines Vietnam Malaysia
Domestic
Industry
Agriculture
Country
W E E D I N G R I S K
16 World Resources Institute
The Himalayan glaciers continue to melt. Though the complete disappearance of the gla-ciers is not imminent, changes in river flow patterns might arise.
Decrease in water quality due to pollution: Water pollution in the six countries, from a variety of industrial and household sources, has been worsening in recent years. Water pollution, which F&B companies also contribute to, can reduce the amount of usable water available, which increases the cost of filtration (if filtration is possible).
Increased conflicts with other users: Water allocations to the F&B sector and supply chains are often determined by the local legal structure governing water access. As water scarcity increases, competition for water resources will become more intense from domestic and industrial users. For example, Coca-Cola’s perceived over-extraction of groundwater in some parts of India has made it the target of local communities and activist groups.
The magnitude and scope of climate change and water scarcity trends will influence the continuing transformation of the F&B sector in emerging Asia.
The industry trends described in Section II are increasing the resource intensity of F&B pro-duction at the same time that climate change and water scarcity impacts are constraining them. Water and agricultural inputs, including animal feed, are most at risk. The conver-gence of industry and environmental trends ensure that climate change and water scarcity will have a greater impact on the F&B sector in the future.
I V . I M P A C T S O N V A L U E D R I V E R S
17World Resources Institute
IV. Impacts on Value Drivers
This section analyzes how climate change and water scarcity trends can create risks and financial impacts for three of the food and beverage sector’s widely-accepted value drivers – agricultural inputs, operating efficiency, and reputation. The assessment draws on primary and secondary research, including interviews with experts. The methodology is described in Appendix 1.
KEY POINTS:
Climate change and water scarcity could lead to declining crop yields that can contribute to higher prices for agricultural inputs. Declining animal yields can directly impact aqua-culture, meat, and dairy production.
Climate change and water scarcity can increase operating costs through expenditures to adapt to lower water availability and quality as well as operational disruptions from lack of water or extreme weather events.
The impacts of climate change and water scarcity can increase reputational and legal risks from food safety and community relations problems.
This report focuses on key value drivers for the F&B sector, including:
1. Agricultural Inputs: The F&B sector depends on plant and animal agricultural products as key raw material inputs. A company’s ability to source these inputs from suppliers at the right cost, at the right time, and in the right quality is important to maintaining profit-able operations. For aquaculture, meat and dairy operations, animal-based inputs are often produced within the company rather than sourced from suppliers.
2. Operating Efficiency: F&B operations, including processing, packaging and storage com-prise the backbone of the sector’s business. F&B companies’ operations are heavily dependent on water as a key ingredient, processing agent and cleansing agent.
3. Reputation: A company’s reputation and sales can be tarnished by local and international scandals that receive media attention. Such incidents can have financial impacts even if they occur for a competitor as consumer demand may decrease across an entire product category. Food safety and stakeholder relations regarding shared natural resources are two important issues that can impact a company’s reputation.
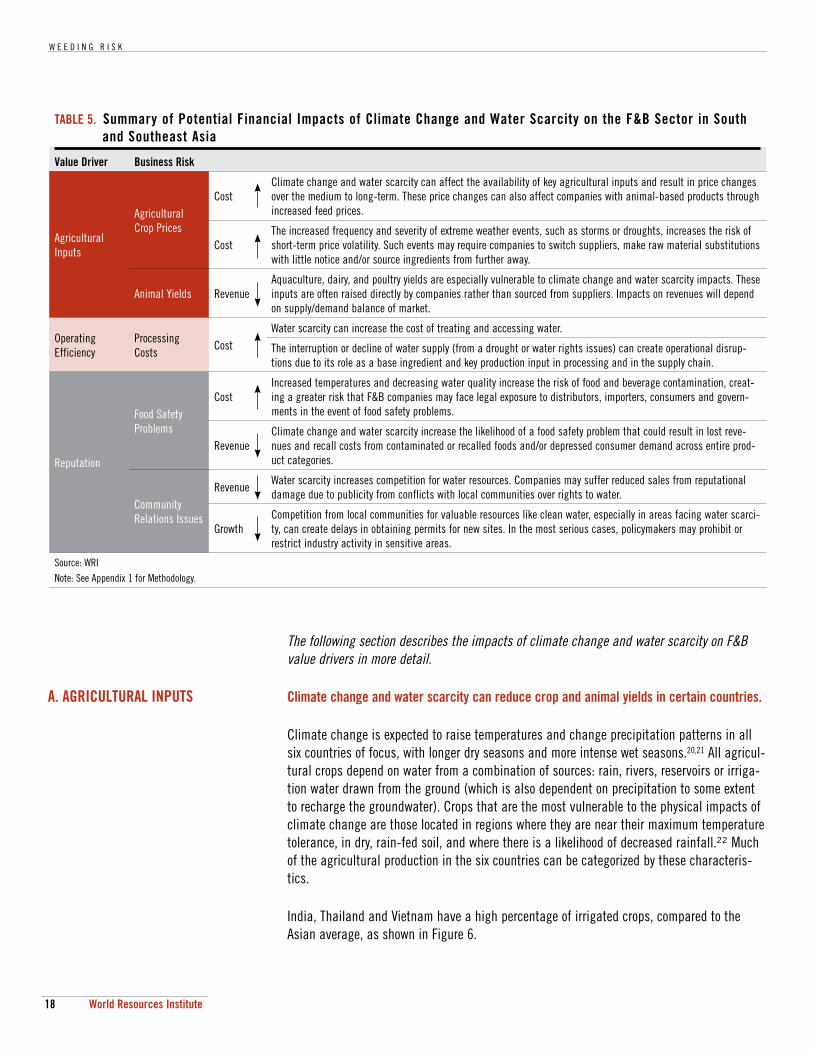
The financial impacts of the environmental trends on each of these value drivers for F&B companies in South and Southeast Asia are summarized in Table 5.
W E E D I N G R I S K
18 World Resources Institute
The following section describes the impacts of climate change and water scarcity on F&B value drivers in more detail.
A. AGRICULTURAL INPUTS Climate change and water scarcity can reduce crop and animal yields in certain countries.
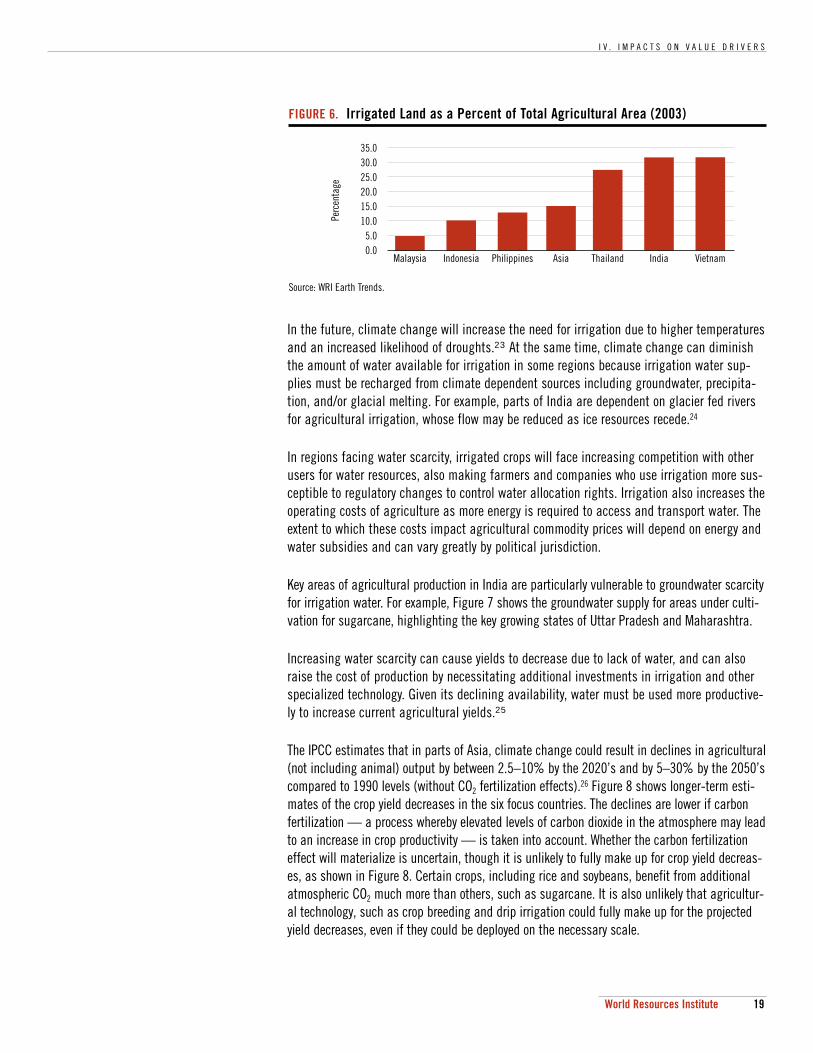
Climate change is expected to raise temperatures and change precipitation patterns in all six countries of focus, with longer dry seasons and more intense wet seasons.20,21 All agricul-tural crops depend on water from a combination of sources: rain, rivers, reservoirs or irriga-tion water drawn from the ground (which is also dependent on precipitation to some extent to recharge the groundwater). Crops that are the most vulnerable to the physical impacts of climate change are those located in regions where they are near their maximum temperature tolerance, in dry, rain-fed soil, and where there is a likelihood of decreased rainfall.22 Much of the agricultural production in the six countries can be categorized by these characteris-tics.
India, Thailand and Vietnam have a high percentage of irrigated crops, compared to the Asian average, as shown in Figure 6.
TABLE 5. Summary of Potential Financial Impacts of Climate Change and Water Scarcity on the F&B Sector in South and Southeast Asia
Value Driver Business Risk
Agricultural Inputs
Agricultural Crop Prices
CostClimate change and water scarcity can affect the availability of key agricultural inputs and result in price changes over the medium to long-term. These price changes can also affect companies with animal-based products through increased feed prices.
CostThe increased frequency and severity of extreme weather events, such as storms or droughts, increases the risk of short-term price volatility. Such events may require companies to switch suppliers, make raw material substitutions with little notice and/or source ingredients from further away.
Animal Yields RevenueAquaculture, dairy, and poultry yields are especially vulnerable to climate change and water scarcity impacts. These inputs are often raised directly by companies rather than sourced from suppliers. Impacts on revenues will depend on supply/demand balance of market.
Operating Efficiency
Processing Costs
CostWater scarcity can increase the cost of treating and accessing water.
The interruption or decline of water supply (from a drought or water rights issues) can create operational disrup-tions due to its role as a base ingredient and key production input in processing and in the supply chain.
Reputation
Food Safety Problems
CostIncreased temperatures and decreasing water quality increase the risk of food and beverage contamination, creat-ing a greater risk that F&B companies may face legal exposure to distributors, importers, consumers and govern-ments in the event of food safety problems.
RevenueClimate change and water scarcity increase the likelihood of a food safety problem that could result in lost reve-nues and recall costs from contaminated or recalled foods and/or depressed consumer demand across entire prod-uct categories.
Community Relations Issues
RevenueWater scarcity increases competition for water resources. Companies may suffer reduced sales from reputational damage due to publicity from conflicts with local communities over rights to water.
GrowthCompetition from local communities for valuable resources like clean water, especially in areas facing water scarci-ty, can create delays in obtaining permits for new sites. In the most serious cases, policymakers may prohibit or restrict industry activity in sensitive areas.
Source: WRINote: See Appendix 1 for Methodology.
I V . I M P A C T S O N V A L U E D R I V E R S
19World Resources Institute
In the future, climate change will increase the need for irrigation due to higher temperatures and an increased likelihood of droughts.23 At the same time, climate change can diminish the amount of water available for irrigation in some regions because irrigation water sup-plies must be recharged from climate dependent sources including groundwater, precipita-tion, and/or glacial melting. For example, parts of India are dependent on glacier fed rivers for agricultural irrigation, whose flow may be reduced as ice resources recede.24
In regions facing water scarcity, irrigated crops will face increasing competition with other users for water resources, also making farmers and companies who use irrigation more sus-ceptible to regulatory changes to control water allocation rights. Irrigation also increases the operating costs of agriculture as more energy is required to access and transport water. The extent to which these costs impact agricultural commodity prices will depend on energy and water subsidies and can vary greatly by political jurisdiction.
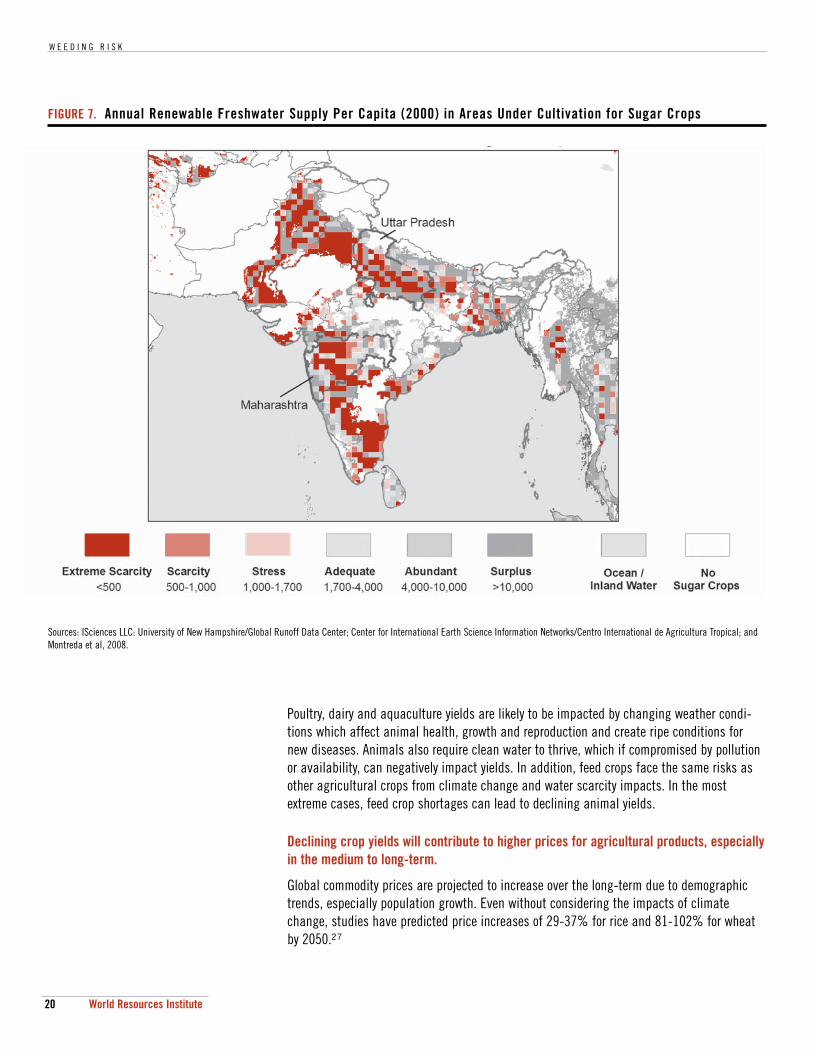
Key areas of agricultural production in India are particularly vulnerable to groundwater scarcity for irrigation water. For example, Figure 7 shows the groundwater supply for areas under culti-vation for sugarcane, highlighting the key growing states of Uttar Pradesh and Maharashtra.
Increasing water scarcity can cause yields to decrease due to lack of water, and can also raise the cost of production by necessitating additional investments in irrigation and other specialized technology. Given its declining availability, water must be used more productive-ly to increase current agricultural yields.25
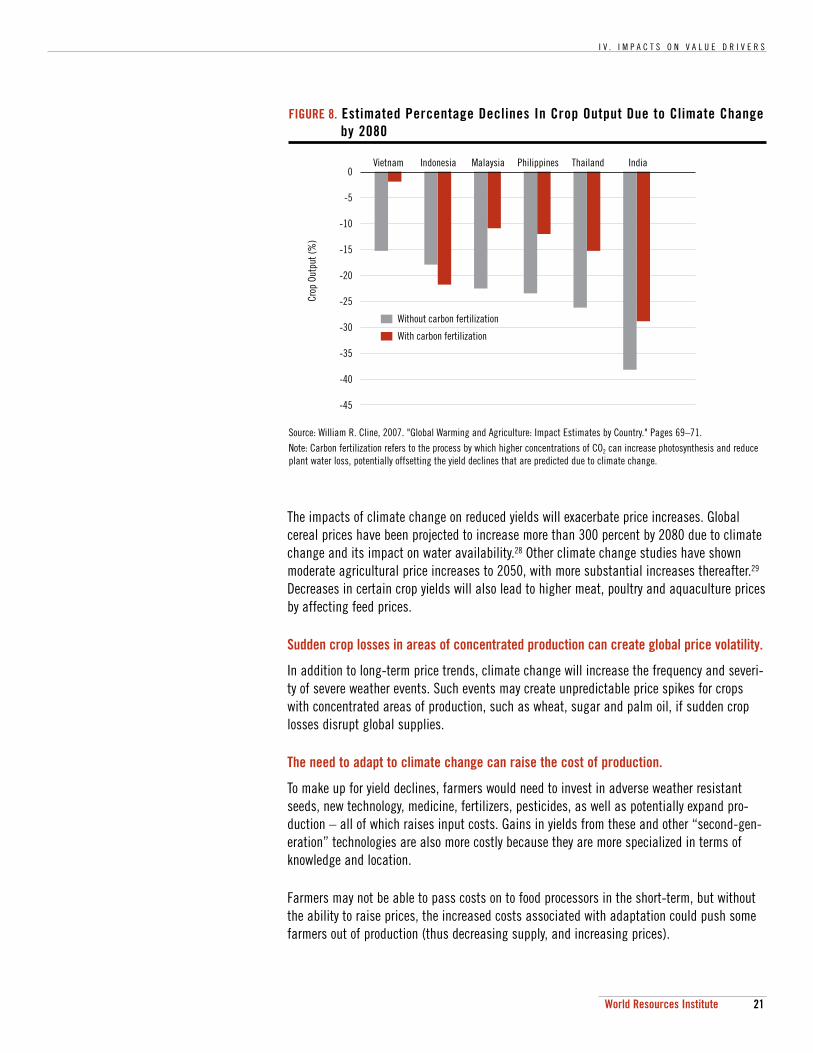
The IPCC estimates that in parts of Asia, climate change could result in declines in agricultural (not including animal) output by between 2.5–10% by the 2020’s and by 5–30% by the 2050’s compared to 1990 levels (without CO2 fertilization effects).26 Figure 8 shows longer-term esti-mates of the crop yield decreases in the six focus countries. The declines are lower if carbon fertilization — a process whereby elevated levels of carbon dioxide in the atmosphere may lead to an increase in crop productivity — is taken into account. Whether the carbon fertilization effect will materialize is uncertain, though it is unlikely to fully make up for crop yield decreas-es, as shown in Figure 8. Certain crops, including rice and soybeans, benefit from additional atmospheric CO2 much more than others, such as sugarcane. It is also unlikely that agricultur-al technology, such as crop breeding and drip irrigation could fully make up for the projected yield decreases, even if they could be deployed on the necessary scale.
FIGURE 6. Irrigated Land as a Percent of Total Agricultural Area (2003)
Source: WRI Earth Trends.
35.030.025.020.015.010.0
5.00.0
Perc
enta
ge
Malaysia Indonesia Philippines Thailand India VietnamAsia
W E E D I N G R I S K
20 World Resources Institute
Poultry, dairy and aquaculture yields are likely to be impacted by changing weather condi-tions which affect animal health, growth and reproduction and create ripe conditions for new diseases. Animals also require clean water to thrive, which if compromised by pollution or availability, can negatively impact yields. In addition, feed crops face the same risks as other agricultural crops from climate change and water scarcity impacts. In the most extreme cases, feed crop shortages can lead to declining animal yields.
Declining crop yields will contribute to higher prices for agricultural products, especially in the medium to long-term.
Global commodity prices are projected to increase over the long-term due to demographic trends, especially population growth. Even without considering the impacts of climate change, studies have predicted price increases of 29-37% for rice and 81-102% for wheat by 2050.27
FIGURE 7. Annual Renewable Freshwater Supply Per Capita (2000) in Areas Under Cultivation for Sugar Crops
Sources: ISciences LLC: University of New Hampshire/Global Runoff Data Center; Center for International Earth Science Information Networks/Centro International de Agricultura Tropical; and Montreda et al, 2008.
I V . I M P A C T S O N V A L U E D R I V E R S
21World Resources Institute
The impacts of climate change on reduced yields will exacerbate price increases. Global cereal prices have been projected to increase more than 300 percent by 2080 due to climate change and its impact on water availability.28 Other climate change studies have shown moderate agricultural price increases to 2050, with more substantial increases thereafter.29 Decreases in certain crop yields will also lead to higher meat, poultry and aquaculture prices by affecting feed prices.
Sudden crop losses in areas of concentrated production can create global price volatility.
In addition to long-term price trends, climate change will increase the frequency and severi-ty of severe weather events. Such events may create unpredictable price spikes for crops with concentrated areas of production, such as wheat, sugar and palm oil, if sudden crop losses disrupt global supplies.
The need to adapt to climate change can raise the cost of production.
To make up for yield declines, farmers would need to invest in adverse weather resistant seeds, new technology, medicine, fertilizers, pesticides, as well as potentially expand pro-duction – all of which raises input costs. Gains in yields from these and other “second-gen-eration” technologies are also more costly because they are more specialized in terms of knowledge and location.
Farmers may not be able to pass costs on to food processors in the short-term, but without the ability to raise prices, the increased costs associated with adaptation could push some farmers out of production (thus decreasing supply, and increasing prices).
FIGURE 8. Estimated Percentage Declines In Crop Output Due to Climate Change by 2080
Source: William R. Cline, 2007. "Global Warming and Agriculture: Impact Estimates by Country." Pages 69–71.Note: Carbon fertilization refers to the process by which higher concentrations of CO2 can increase photosynthesis and reduce plant water loss, potentially offsetting the yield declines that are predicted due to climate change.
0
-5
-10
-15
-20
-25
-30
-35
-40
-45
Crop
Out
put (
%)
MalaysiaIndonesia Philippines Thailand IndiaVietnam
Without carbon fertilization
With carbon fertilization
W E E D I N G R I S K
22 World Resources Institute
F&B companies will face increasing uncertainty over agricultural input costs.
F&B companies may be able to hedge against longer-term price increases to some extent, but are less able to prepare for sudden price spikes. Companies may increasingly need to buy agricultural supplies from foreign or even overseas rather than local markets, creating price and transport cost uncertainty, and likely, increases.
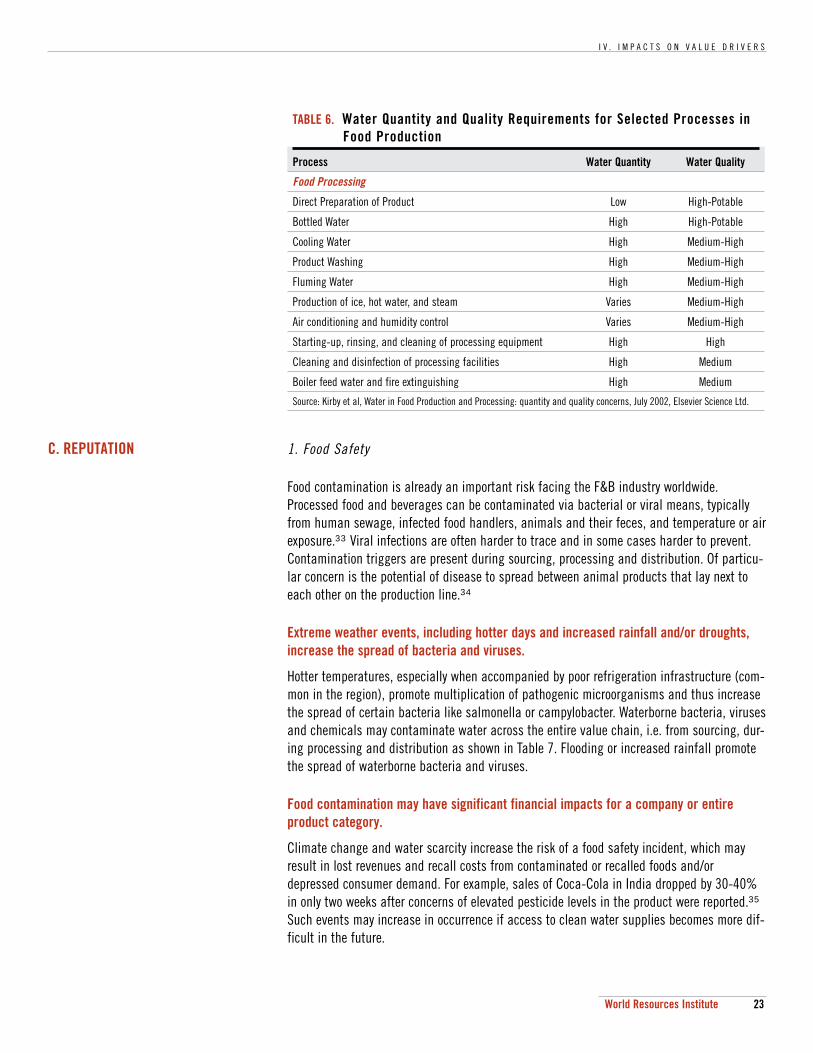
B. OPERATING EFFICIENCY Water is a base ingredient and a key production input for F&B products, as shown in Table 6. Food and beverage production requires 1) the right amount of water at 2) the right quality at 3) the right time, and at 4) the right place.30 Water availability can be diminished not only from a physical lack of groundwater, but also from legal disputes over water access or a pol-luted local water supply.
The physical interruption of water supply can create operational disruptions, due to its role as a base ingredient and key production input in processing and in the supply chain.
A disruption in water supply can have a significant impact on an F&B company’s financials.
Water scarcity can also affect energy availability and cost because thermal power generators are dependent on water for cooling. Lack of water can reduce local power production and force F&B companies to run on expensive emergency generators. The same is true for hydro power generation in the event of low water reserves.31
Extreme weather events like floods, cyclones and heavy rains are expected to increase in fre-quency and severity due to climate change. Although unpredictable, these events can create operational disruptions due to physical damage to manufacturing facilities. These weather events can also hinder access to municipal resources used during production, like energy and water, and can affect end market demand patterns.
Water scarcity can increase the cost of obtaining, treating and accessing water.
For companies operating in areas where water is becoming increasingly scarce or heavily polluted, investments in water efficient and filtration technology is essential. In additional to these investments, companies can also reconfigure their production line layout in order to increase water-use efficiency and prevent water dormancy. For example, water used for prod-uct rinse water can be used for the production of ice, hot water or steam.32 Companies who do not plan ahead for operating in water scarce conditions will be forced to ship in water to keep plants running at full capacity, which is expensive, and not a long-term solution to managing water scarcity risks.
I V . I M P A C T S O N V A L U E D R I V E R S
23World Resources Institute
C. REPUTATION 1. Food Safety
Food contamination is already an important risk facing the F&B industry worldwide. Processed food and beverages can be contaminated via bacterial or viral means, typically from human sewage, infected food handlers, animals and their feces, and temperature or air exposure.33 Viral infections are often harder to trace and in some cases harder to prevent. Contamination triggers are present during sourcing, processing and distribution. Of particu-lar concern is the potential of disease to spread between animal products that lay next to each other on the production line.34
Extreme weather events, including hotter days and increased rainfall and/or droughts, increase the spread of bacteria and viruses.
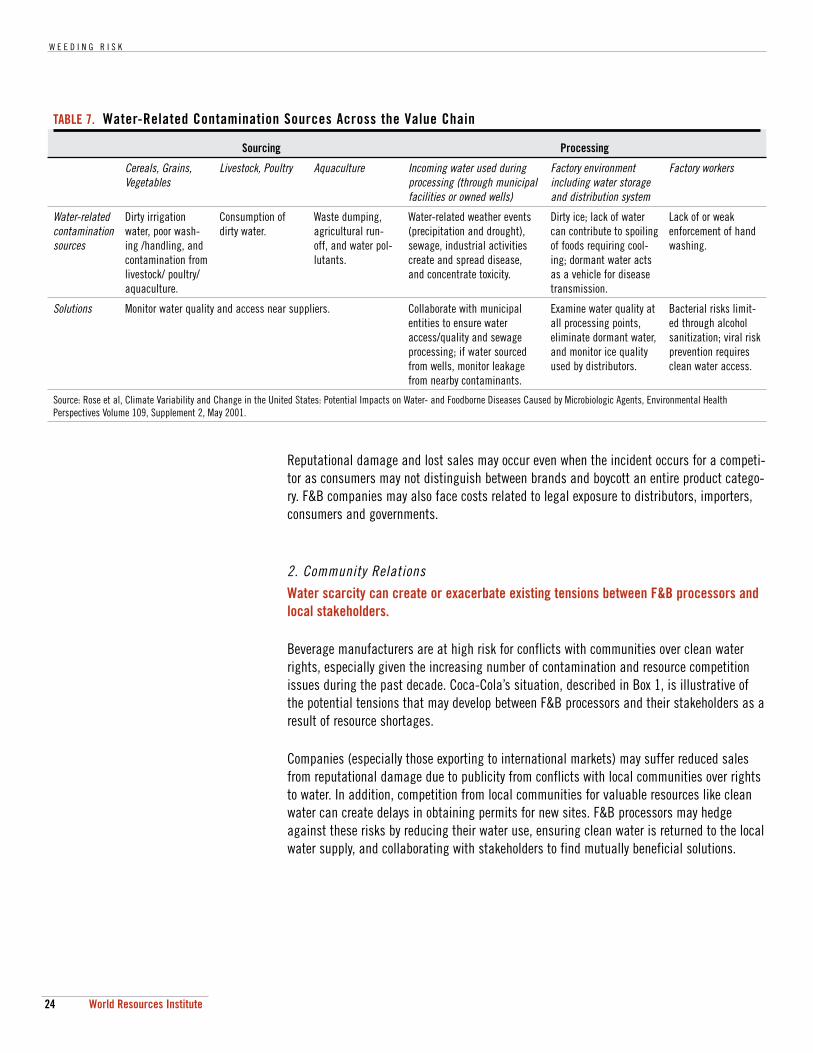
Hotter temperatures, especially when accompanied by poor refrigeration infrastructure (com-mon in the region), promote multiplication of pathogenic microorganisms and thus increase the spread of certain bacteria like salmonella or campylobacter. Waterborne bacteria, viruses and chemicals may contaminate water across the entire value chain, i.e. from sourcing, dur-ing processing and distribution as shown in Table 7. Flooding or increased rainfall promote the spread of waterborne bacteria and viruses.
Food contamination may have significant financial impacts for a company or entire product category.
Climate change and water scarcity increase the risk of a food safety incident, which may result in lost revenues and recall costs from contaminated or recalled foods and/or depressed consumer demand. For example, sales of Coca-Cola in India dropped by 30-40% in only two weeks after concerns of elevated pesticide levels in the product were reported.35 Such events may increase in occurrence if access to clean water supplies becomes more dif-ficult in the future.
TABLE 6. Water Quantity and Quality Requirements for Selected Processes in Food Production
Process Water Quantity Water Quality
Food Processing
Direct Preparation of Product Low High-Potable
Bottled Water High High-Potable
Cooling Water High Medium-High
Product Washing High Medium-High
Fluming Water High Medium-High
Production of ice, hot water, and steam Varies Medium-High
Air conditioning and humidity control Varies Medium-High
Starting-up, rinsing, and cleaning of processing equipment High High
Cleaning and disinfection of processing facilities High Medium
Boiler feed water and fire extinguishing High Medium
Source: Kirby et al, Water in Food Production and Processing: quantity and quality concerns, July 2002, Elsevier Science Ltd.
W E E D I N G R I S K
24 World Resources Institute
Reputational damage and lost sales may occur even when the incident occurs for a competi-tor as consumers may not distinguish between brands and boycott an entire product catego-ry. F&B companies may also face costs related to legal exposure to distributors, importers, consumers and governments.
2. Community RelationsWater scarcity can create or exacerbate existing tensions between F&B processors and local stakeholders.
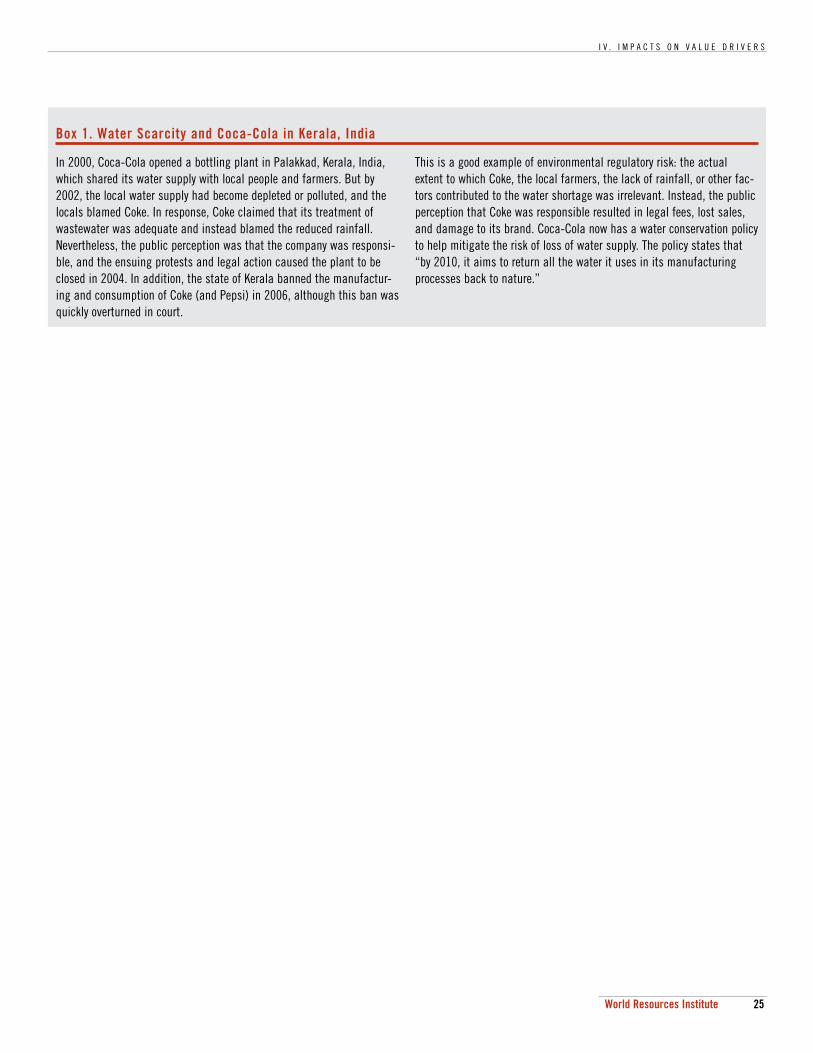
Beverage manufacturers are at high risk for conflicts with communities over clean water rights, especially given the increasing number of contamination and resource competition issues during the past decade. Coca-Cola’s situation, described in Box 1, is illustrative of the potential tensions that may develop between F&B processors and their stakeholders as a result of resource shortages.
Companies (especially those exporting to international markets) may suffer reduced sales from reputational damage due to publicity from conflicts with local communities over rights to water. In addition, competition from local communities for valuable resources like clean water can create delays in obtaining permits for new sites. F&B processors may hedge against these risks by reducing their water use, ensuring clean water is returned to the local water supply, and collaborating with stakeholders to find mutually beneficial solutions.
TABLE 7. Water-Related Contamination Sources Across the Value Chain
Sourcing Processing
Cereals, Grains, Vegetables
Livestock, Poultry Aquaculture Incoming water used during processing (through municipal facilities or owned wells)
Factory environment including water storage and distribution system
Factory workers
Water-related contamination sources
Dirty irrigation water, poor wash-ing /handling, and contamination from livestock/ poultry/ aquaculture.
Consumption of dirty water.
Waste dumping, agricultural run-off, and water pol-lutants.
Water-related weather events (precipitation and drought), sewage, industrial activities create and spread disease, and concentrate toxicity.
Dirty ice; lack of water can contribute to spoiling of foods requiring cool-ing; dormant water acts as a vehicle for disease transmission.
Lack of or weak enforcement of hand washing.
Solutions Monitor water quality and access near suppliers. Collaborate with municipal entities to ensure water access/quality and sewage processing; if water sourced from wells, monitor leakage from nearby contaminants.
Examine water quality at all processing points, eliminate dormant water, and monitor ice quality used by distributors.
Bacterial risks limit-ed through alcohol sanitization; viral risk prevention requires clean water access.
Source: Rose et al, Climate Variability and Change in the United States: Potential Impacts on Water- and Foodborne Diseases Caused by Microbiologic Agents, Environmental Health Perspectives Volume 109, Supplement 2, May 2001.
I V . I M P A C T S O N V A L U E D R I V E R S
25World Resources Institute
Box 1. Water Scarcity and Coca-Cola in Kerala, India
In 2000, Coca-Cola opened a bottling plant in Palakkad, Kerala, India, which shared its water supply with local people and farmers. But by 2002, the local water supply had become depleted or polluted, and the locals blamed Coke. In response, Coke claimed that its treatment of wastewater was adequate and instead blamed the reduced rainfall. Nevertheless, the public perception was that the company was responsi-ble, and the ensuing protests and legal action caused the plant to be closed in 2004. In addition, the state of Kerala banned the manufactur-ing and consumption of Coke (and Pepsi) in 2006, although this ban was quickly overturned in court.
This is a good example of environmental regulatory risk: the actual extent to which Coke, the local farmers, the lack of rainfall, or other fac-tors contributed to the water shortage was irrelevant. Instead, the public perception that Coke was responsible resulted in legal fees, lost sales, and damage to its brand. Coca-Cola now has a water conservation policy to help mitigate the risk of loss of water supply. The policy states that “by 2010, it aims to return all the water it uses in its manufacturing processes back to nature.”
W E E D I N G R I S K
26 World Resources Institute
V. Risk Assessment
This section analyzes the effect of the physical impacts of climate change and water scarci-ty on the overall industry as well as the following seven F&B subsectors:
1. Aquaculture
2. Beverages (including soft drinks, tea and water)
3. Confectionary
4. Dairy and Poultry
5. Edible Oils (including Palm Oil)
6. Starches
7. Sugar
Some of these subsectors are interlinked (for example, soy is a critical feed stock for meat, poultry and aquaculture). This report attempts to consider some of the more obviously related risks, but the authors acknowledge that this is not an exhaustive analysis of linked factors.
To illustrate how analysts and investors can apply the information in this section, a case study on a sugar company in India is presented in section VI.
KEY POINTS:
Water scarcity and climate change impacts can affect agricultural input prices and pro-cessing costs for all F&B subsectors examined in this report.
Risks vary substantially between countries and companies, even within the same subsec-tor.
There is a common set of risk factors that can help investors and analysts determine a company’s exposure to climate change and water scarcity risks.
Analysts and investors should engage companies to solicit relevant information in order to assess potential financial impacts.
The authors examined several factors when evaluating the effect of the climate change and water scarcity trends on the industry as a whole and each subsector. Specifically:
Cost structure of subsectors (if information is available)
Availability of substitute ingredients/products in the marketplace
Nature of product (branded or commodity-like), i.e. ability to pass costs on
The bargaining power of F&B companies relative to suppliers and customers
Location of costs in the value chain
A. OVERALL F&B SECTOR RISK ASSESSMENT
V . R I S K A S S E S S M E N T
27World Resources Institute
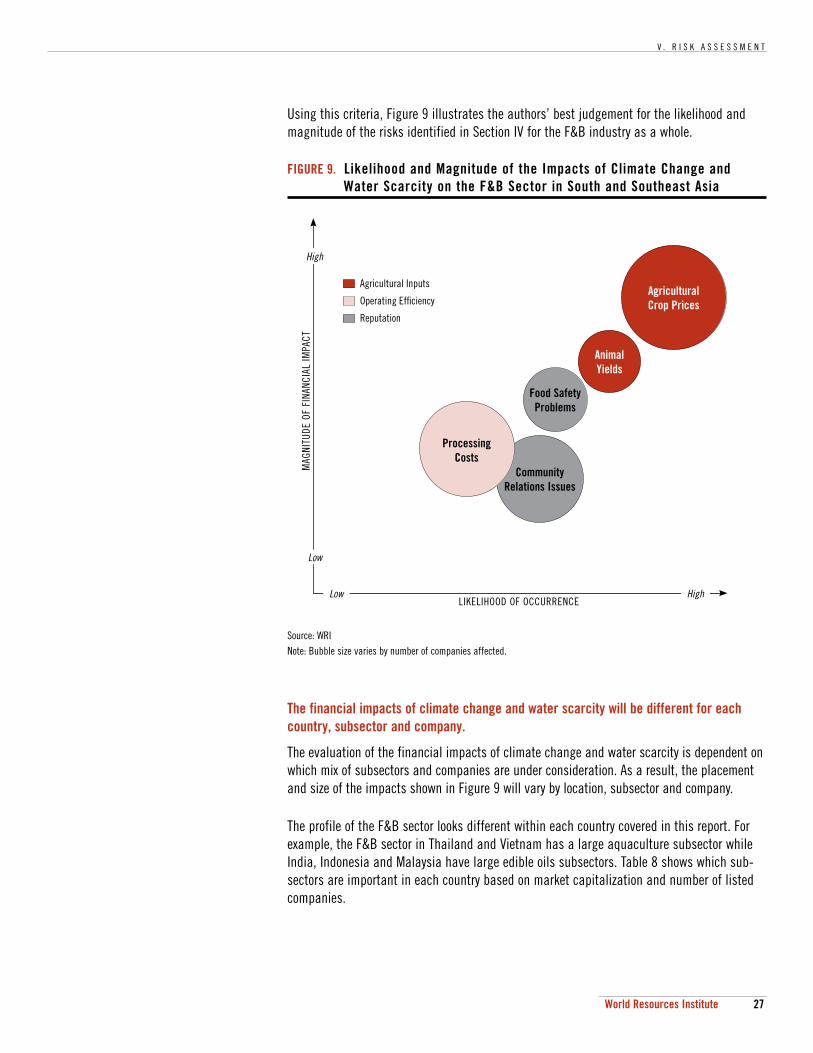
Using this criteria, Figure 9 illustrates the authors’ best judgement for the likelihood and magnitude of the risks identified in Section IV for the F&B industry as a whole.
The financial impacts of climate change and water scarcity will be different for each country, subsector and company.
The evaluation of the financial impacts of climate change and water scarcity is dependent on which mix of subsectors and companies are under consideration. As a result, the placement and size of the impacts shown in Figure 9 will vary by location, subsector and company.
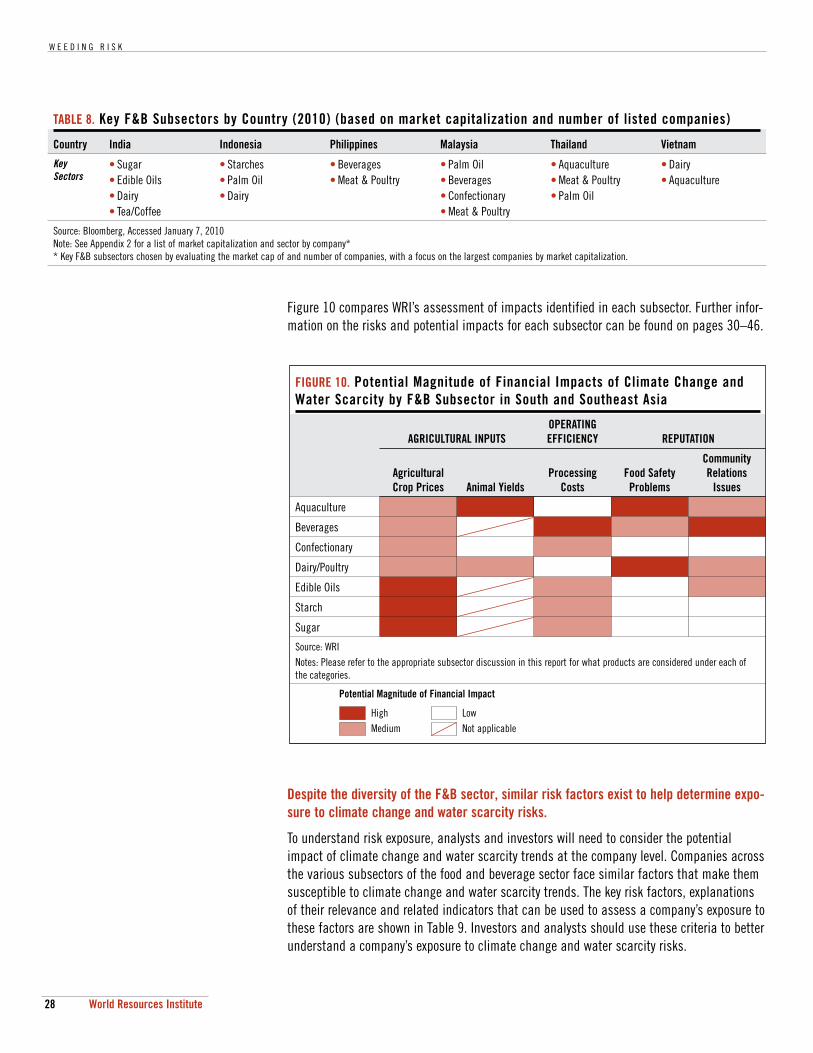
The profile of the F&B sector looks different within each country covered in this report. For example, the F&B sector in Thailand and Vietnam has a large aquaculture subsector while India, Indonesia and Malaysia have large edible oils subsectors. Table 8 shows which sub-sectors are important in each country based on market capitalization and number of listed companies.
FIGURE 9. Likelihood and Magnitude of the Impacts of Climate Change and Water Scarcity on the F&B Sector in South and Southeast Asia
Source: WRINote: Bubble size varies by number of companies affected.
Agricultural Crop Prices
HighLow
MAG
NITU
DE O
F FI
NANC
IAL
IMPA
CT
LIKELIHOOD OF OCCURRENCE
High
Low
Agricultural Inputs
Operating Effi ciency
Reputation
Food Safety Problems
Community Relations Issues
Animal Yields
Processing Costs
W E E D I N G R I S K
28 World Resources Institute
Figure 10 compares WRI’s assessment of impacts identified in each subsector. Further infor-mation on the risks and potential impacts for each subsector can be found on pages 30–46.
Despite the diversity of the F&B sector, similar risk factors exist to help determine expo-sure to climate change and water scarcity risks.
To understand risk exposure, analysts and investors will need to consider the potential impact of climate change and water scarcity trends at the company level. Companies across the various subsectors of the food and beverage sector face similar factors that make them susceptible to climate change and water scarcity trends. The key risk factors, explanations of their relevance and related indicators that can be used to assess a company’s exposure to these factors are shown in Table 9. Investors and analysts should use these criteria to better understand a company’s exposure to climate change and water scarcity risks.
TABLE 8. Key F&B Subsectors by Country (2010) (based on market capitalization and number of listed companies)
Country India Indonesia Philippines Malaysia Thailand Vietnam
Key Sectors
• Sugar• Edible Oils• Dairy• Tea/Coffee
• Starches• Palm Oil• Dairy
• Beverages• Meat & Poultry
• Palm Oil• Beverages• Confectionary• Meat & Poultry
• Aquaculture• Meat & Poultry• Palm Oil
• Dairy• Aquaculture
Source: Bloomberg, Accessed January 7, 2010Note: See Appendix 2 for a list of market capitalization and sector by company** Key F&B subsectors chosen by evaluating the market cap of and number of companies, with a focus on the largest companies by market capitalization.
FIGURE 10. Potential Magnitude of Financial Impacts of Climate Change and Water Scarcity by F&B Subsector in South and Southeast Asia
AGRICULTURAL INPUTSOPERATING EFFICIENCY REPUTATION
Agricultural Crop Prices Animal Yields
Processing Costs
Food Safety Problems
Community Relations
Issues
Aquaculture
Beverages
Confectionary
Dairy/Poultry
Edible Oils
Starch
Sugar
Source: WRINotes: Please refer to the appropriate subsector discussion in this report for what products are considered under each of the categories.
Potential Magnitude of Financial Impact
HighMedium
LowNot applicable
V . R I S K A S S E S S M E N T
29World Resources Institute
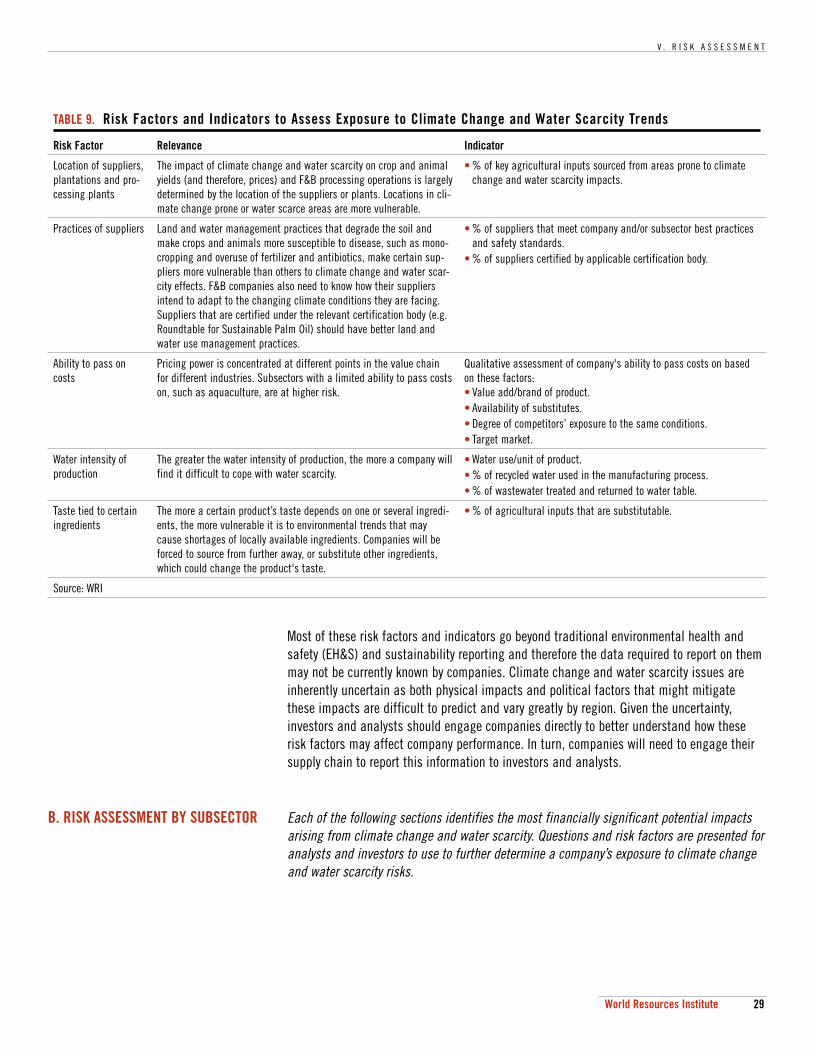
Most of these risk factors and indicators go beyond traditional environmental health and safety (EH&S) and sustainability reporting and therefore the data required to report on them may not be currently known by companies. Climate change and water scarcity issues are inherently uncertain as both physical impacts and political factors that might mitigate these impacts are difficult to predict and vary greatly by region. Given the uncertainty, investors and analysts should engage companies directly to better understand how these risk factors may affect company performance. In turn, companies will need to engage their supply chain to report this information to investors and analysts.
B. RISK ASSESSMENT BY SUBSECTOR Each of the following sections identifies the most financially significant potential impacts arising from climate change and water scarcity. Questions and risk factors are presented for analysts and investors to use to further determine a company’s exposure to climate change and water scarcity risks.
TABLE 9. Risk Factors and Indicators to Assess Exposure to Climate Change and Water Scarcity Trends
Risk Factor Relevance Indicator
Location of suppliers, plantations and pro-cessing plants
The impact of climate change and water scarcity on crop and animal yields (and therefore, prices) and F&B processing operations is largely determined by the location of the suppliers or plants. Locations in cli-mate change prone or water scarce areas are more vulnerable.
• % of key agricultural inputs sourced from areas prone to climate change and water scarcity impacts.
Practices of suppliers Land and water management practices that degrade the soil and make crops and animals more susceptible to disease, such as mono-cropping and overuse of fertilizer and antibiotics, make certain sup-pliers more vulnerable than others to climate change and water scar-city effects. F&B companies also need to know how their suppliers intend to adapt to the changing climate conditions they are facing. Suppliers that are certified under the relevant certification body (e.g. Roundtable for Sustainable Palm Oil) should have better land and water use management practices.
• % of suppliers that meet company and/or subsector best practices and safety standards.
• % of suppliers certified by applicable certification body.
Ability to pass on costs
Pricing power is concentrated at different points in the value chain for different industries. Subsectors with a limited ability to pass costs on, such as aquaculture, are at higher risk.
Qualitative assessment of company's ability to pass costs on based on these factors: • Value add/brand of product.• Availability of substitutes.• Degree of competitors’ exposure to the same conditions.• Target market.
Water intensity of production
The greater the water intensity of production, the more a company will find it difficult to cope with water scarcity.
• Water use/unit of product.• % of recycled water used in the manufacturing process.• % of wastewater treated and returned to water table.
Taste tied to certain ingredients
The more a certain product’s taste depends on one or several ingredi-ents, the more vulnerable it is to environmental trends that may cause shortages of locally available ingredients. Companies will be forced to source from further away, or substitute other ingredients, which could change the product's taste.
• % of agricultural inputs that are substitutable.
Source: WRI
W E E D I N G R I S K
30 World Resources Institute
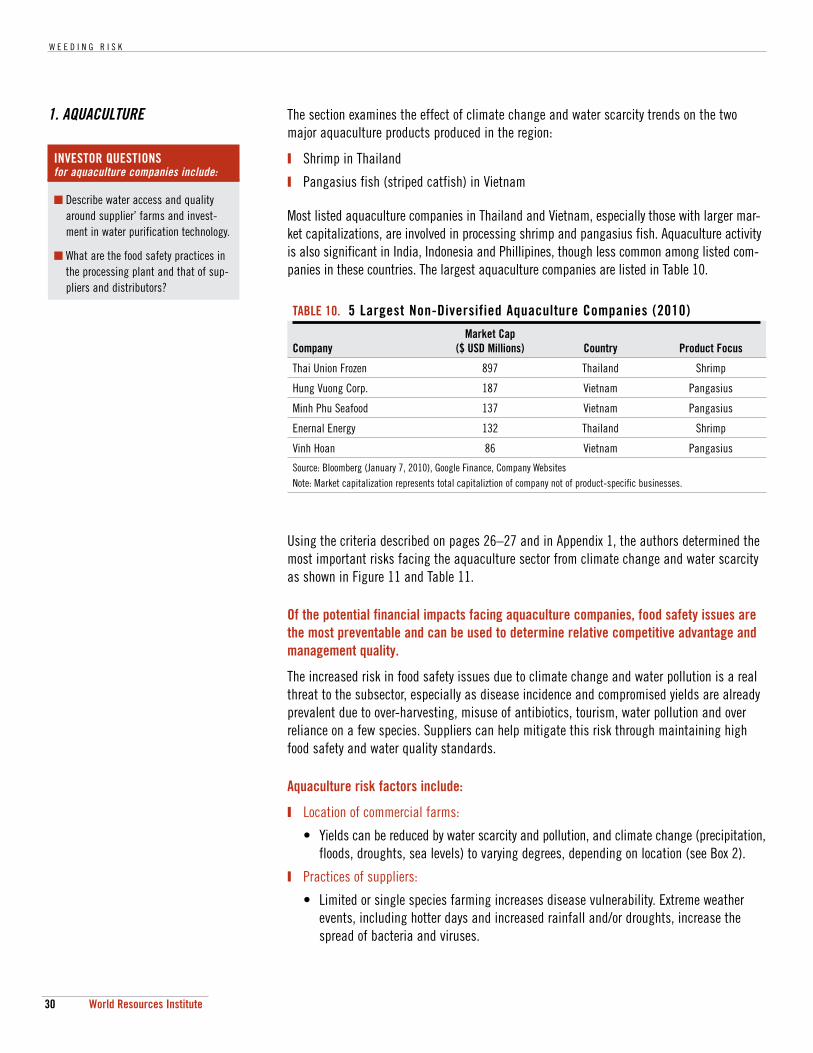
1. AQUACULTURE The section examines the effect of climate change and water scarcity trends on the two major aquaculture products produced in the region:
Shrimp in Thailand
Pangasius fish (striped catfish) in Vietnam
Most listed aquaculture companies in Thailand and Vietnam, especially those with larger mar-ket capitalizations, are involved in processing shrimp and pangasius fish. Aquaculture activity is also significant in India, Indonesia and Phillipines, though less common among listed com-panies in these countries. The largest aquaculture companies are listed in Table 10.
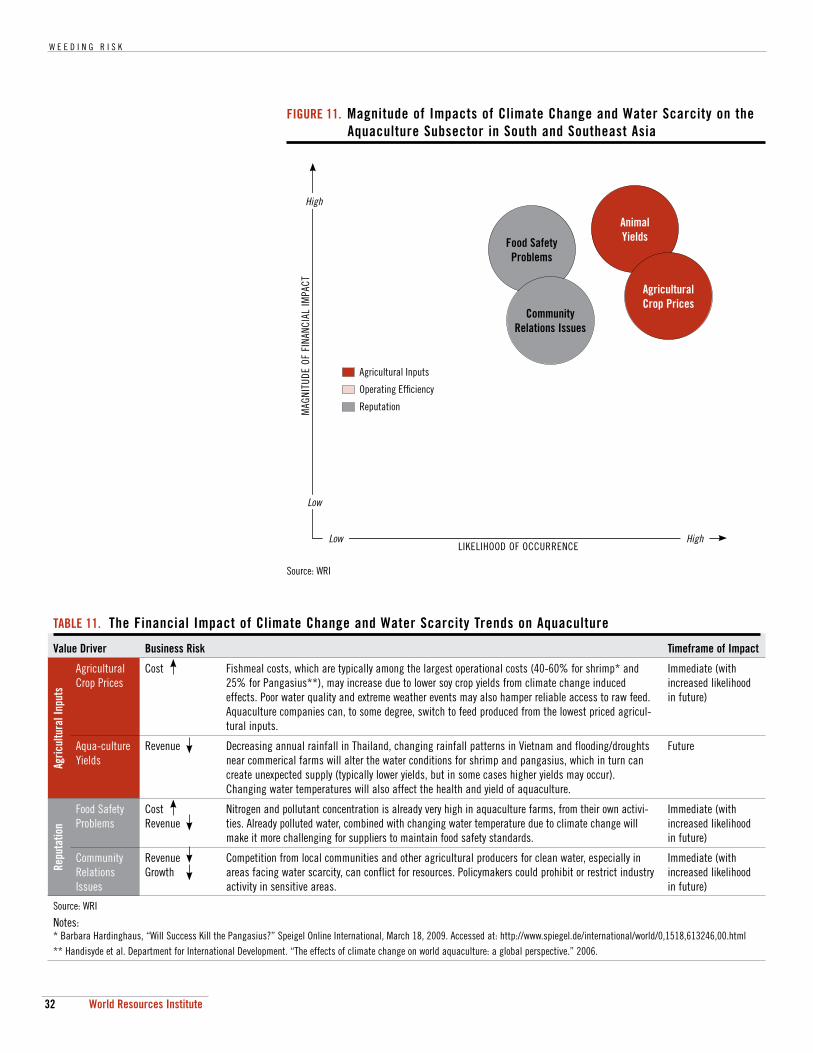
Using the criteria described on pages 26–27 and in Appendix 1, the authors determined the most important risks facing the aquaculture sector from climate change and water scarcity as shown in Figure 11 and Table 11.
Of the potential financial impacts facing aquaculture companies, food safety issues are the most preventable and can be used to determine relative competitive advantage and management quality.
The increased risk in food safety issues due to climate change and water pollution is a real threat to the subsector, especially as disease incidence and compromised yields are already prevalent due to over-harvesting, misuse of antibiotics, tourism, water pollution and over reliance on a few species. Suppliers can help mitigate this risk through maintaining high food safety and water quality standards.
Aquaculture risk factors include:
Location of commercial farms:
• Yields can be reduced by water scarcity and pollution, and climate change (precipitation, floods, droughts, sea levels) to varying degrees, depending on location (see Box 2).
Practices of suppliers:
• Limited or single species farming increases disease vulnerability. Extreme weather events, including hotter days and increased rainfall and/or droughts, increase the spread of bacteria and viruses.
TABLE 10. 5 Largest Non-Diversified Aquaculture Companies (2010)
CompanyMarket Cap
($ USD Millions) Country Product Focus
Thai Union Frozen 897 Thailand Shrimp
Hung Vuong Corp. 187 Vietnam Pangasius
Minh Phu Seafood 137 Vietnam Pangasius
Enernal Energy 132 Thailand Shrimp
Vinh Hoan 86 Vietnam Pangasius
Source: Bloomberg (January 7, 2010), Google Finance, Company Websites Note: Market capitalization represents total capitaliztion of company not of product-specific businesses.
INVESTOR QUESTIONS for aquaculture companies include:
Describe water access and quality around supplier’ farms and invest-ment in water purification technology.
What are the food safety practices in the processing plant and that of sup-pliers and distributors?
V . R I S K A S S E S S M E N T
31World Resources Institute
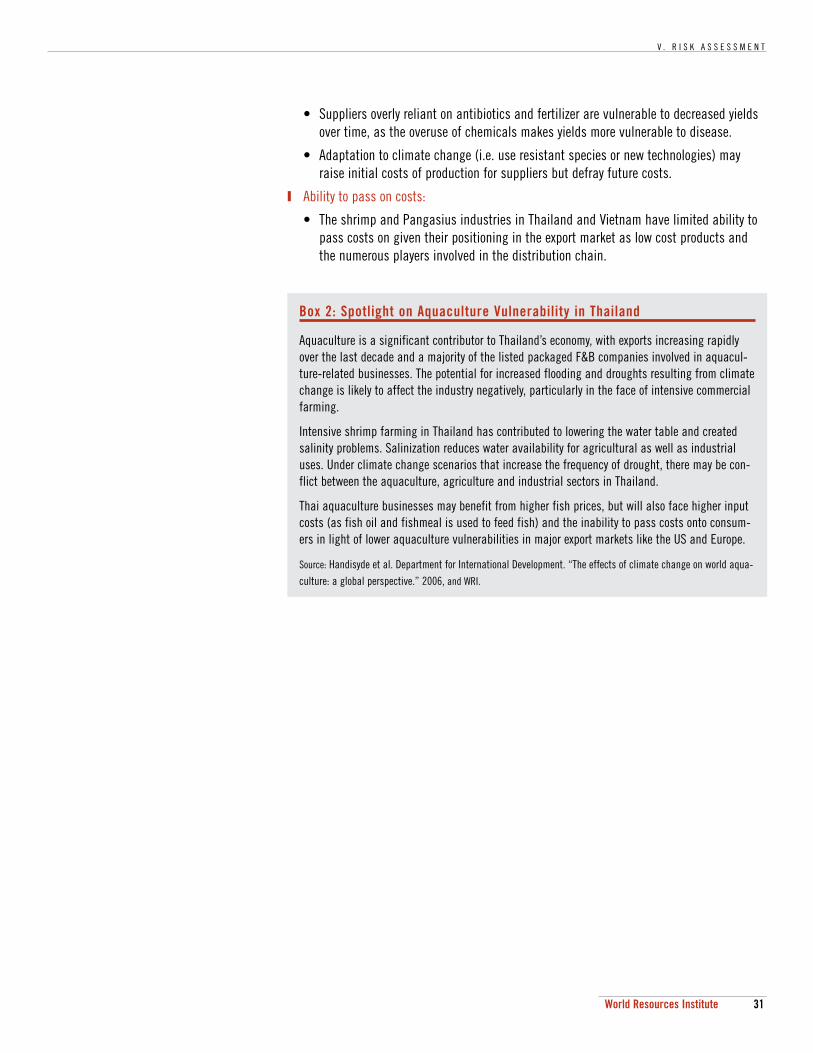
• Suppliers overly reliant on antibiotics and fertilizer are vulnerable to decreased yields over time, as the overuse of chemicals makes yields more vulnerable to disease.
• Adaptation to climate change (i.e. use resistant species or new technologies) may raise initial costs of production for suppliers but defray future costs.
Ability to pass on costs:
• The shrimp and Pangasius industries in Thailand and Vietnam have limited ability to pass costs on given their positioning in the export market as low cost products and the numerous players involved in the distribution chain.
Box 2: Spotlight on Aquaculture Vulnerability in Thailand
Aquaculture is a significant contributor to Thailand’s economy, with exports increasing rapidly over the last decade and a majority of the listed packaged F&B companies involved in aquacul-ture-related businesses. The potential for increased flooding and droughts resulting from climate change is likely to affect the industry negatively, particularly in the face of intensive commercial farming.
Intensive shrimp farming in Thailand has contributed to lowering the water table and created salinity problems. Salinization reduces water availability for agricultural as well as industrial uses. Under climate change scenarios that increase the frequency of drought, there may be con-flict between the aquaculture, agriculture and industrial sectors in Thailand.
Thai aquaculture businesses may benefit from higher fish prices, but will also face higher input costs (as fish oil and fishmeal is used to feed fish) and the inability to pass costs onto consum-ers in light of lower aquaculture vulnerabilities in major export markets like the US and Europe.
Source: Handisyde et al. Department for International Development. “The effects of climate change on world aqua-
culture: a global perspective.” 2006, and WRI.
W E E D I N G R I S K
32 World Resources Institute
TABLE 11. The Financial Impact of Climate Change and Water Scarcity Trends on Aquaculture
Value Driver Business Risk Timeframe of Impact
Agric
ultu
ral I
nput
s
Agricultural Crop Prices
Cost Fishmeal costs, which are typically among the largest operational costs (40-60% for shrimp* and 25% for Pangasius**), may increase due to lower soy crop yields from climate change induced effects. Poor water quality and extreme weather events may also hamper reliable access to raw feed. Aquaculture companies can, to some degree, switch to feed produced from the lowest priced agricul-tural inputs.
Immediate (with increased likelihood in future)
Aqua-culture Yields
Revenue Decreasing annual rainfall in Thailand, changing rainfall patterns in Vietnam and flooding/droughts near commerical farms will alter the water conditions for shrimp and pangasius, which in turn can create unexpected supply (typically lower yields, but in some cases higher yields may occur). Changing water temperatures will also affect the health and yield of aquaculture.
Future
Repu
tatio
n
Food Safety Problems
CostRevenue
Nitrogen and pollutant concentration is already very high in aquaculture farms, from their own activi-ties. Already polluted water, combined with changing water temperature due to climate change will make it more challenging for suppliers to maintain food safety standards.
Immediate (with increased likelihood in future)
Community Relations Issues
RevenueGrowth
Competition from local communities and other agricultural producers for clean water, especially in areas facing water scarcity, can conflict for resources. Policymakers could prohibit or restrict industry activity in sensitive areas.
Immediate (with increased likelihood in future)
Source: WRI
Notes:* Barbara Hardinghaus, “Will Success Kill the Pangasius?” Speigel Online International, March 18, 2009. Accessed at: http://www.spiegel.de/international/world/0,1518,613246,00.html ** Handisyde et al. Department for International Development. “The effects of climate change on world aquaculture: a global perspective.” 2006.
FIGURE 11. Magnitude of Impacts of Climate Change and Water Scarcity on the Aquaculture Subsector in South and Southeast Asia
Community Relations Issues
Food Safety Problems
Agricultural Crop Prices
Animal Yields
HighLow
MAG
NITU
DE O
F FI
NANC
IAL
IMPA
CT
LIKELIHOOD OF OCCURRENCE
High
Low
Agricultural Inputs
Operating Effi ciency
Reputation
Source: WRI
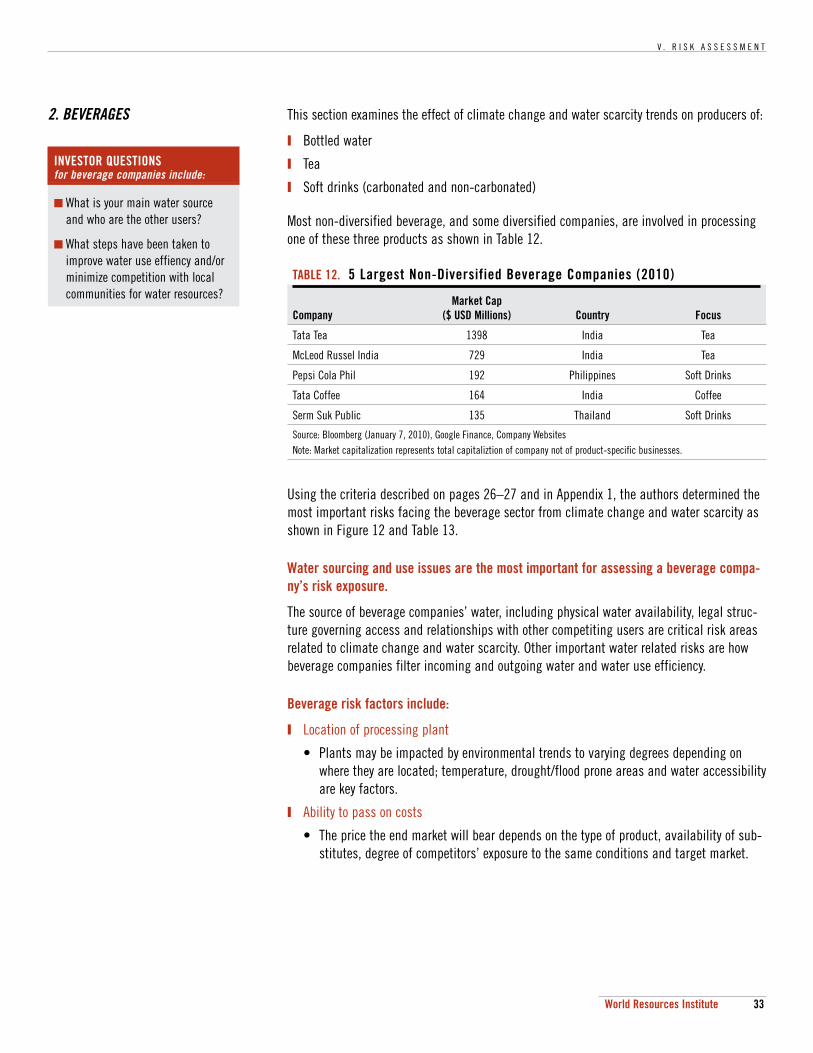
V . R I S K A S S E S S M E N T
33World Resources Institute
2. BEVERAGES This section examines the effect of climate change and water scarcity trends on producers of:
Bottled water
Tea
Soft drinks (carbonated and non-carbonated)
Most non-diversified beverage, and some diversified companies, are involved in processing one of these three products as shown in Table 12.
TABLE 12. 5 Largest Non-Diversified Beverage Companies (2010)
CompanyMarket Cap
($ USD Millions) Country Focus
Tata Tea 1398 India Tea
McLeod Russel India 729 India Tea
Pepsi Cola Phil 192 Philippines Soft Drinks
Tata Coffee 164 India Coffee
Serm Suk Public 135 Thailand Soft Drinks
Source: Bloomberg (January 7, 2010), Google Finance, Company Websites Note: Market capitalization represents total capitaliztion of company not of product-specific businesses.
Using the criteria described on pages 26–27 and in Appendix 1, the authors determined the most important risks facing the beverage sector from climate change and water scarcity as shown in Figure 12 and Table 13.
Water sourcing and use issues are the most important for assessing a beverage compa-ny’s risk exposure.
The source of beverage companies’ water, including physical water availability, legal struc-ture governing access and relationships with other competiting users are critical risk areas related to climate change and water scarcity. Other important water related risks are how beverage companies filter incoming and outgoing water and water use efficiency.
Beverage risk factors include:
Location of processing plant
• Plants may be impacted by environmental trends to varying degrees depending on where they are located; temperature, drought/flood prone areas and water accessibility are key factors.
Ability to pass on costs
• The price the end market will bear depends on the type of product, availability of sub-stitutes, degree of competitors’ exposure to the same conditions and target market.
INVESTOR QUESTIONS for beverage companies include:
What is your main water source and who are the other users?
What steps have been taken to improve water use effiency and/or minimize competition with local communities for water resources?
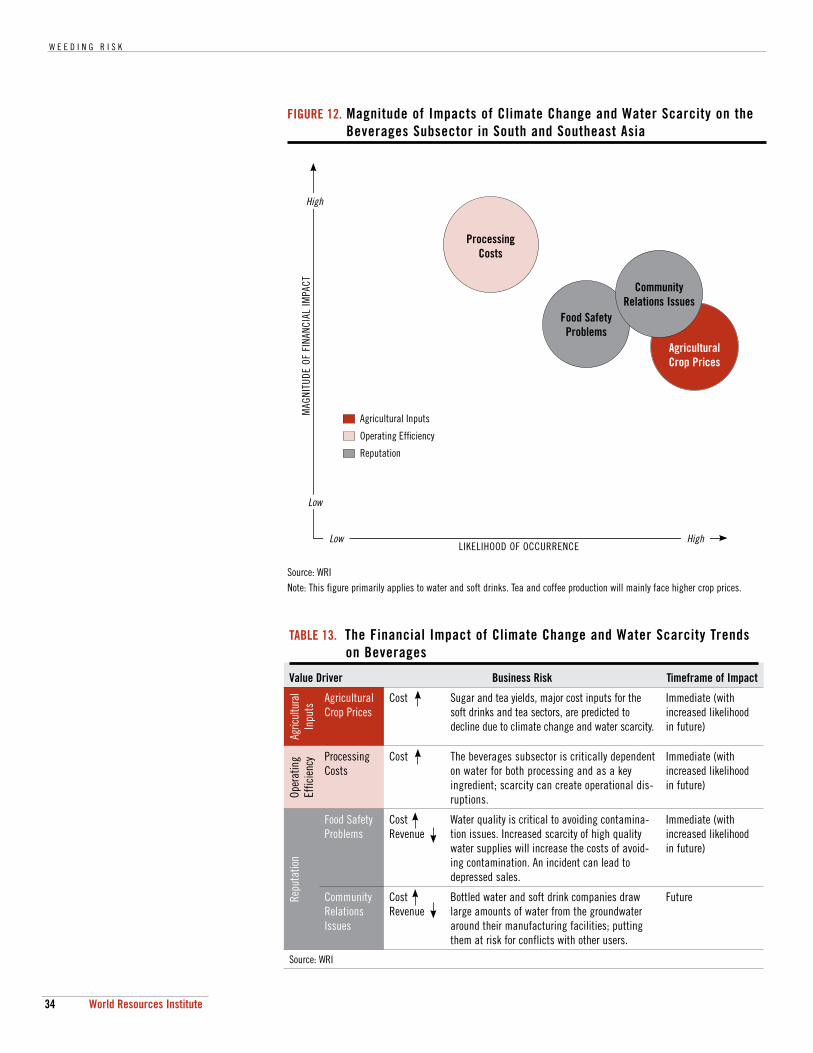
W E E D I N G R I S K
34 World Resources Institute
TABLE 13. The Financial Impact of Climate Change and Water Scarcity Trends on Beverages
Value Driver Business Risk Timeframe of Impact
Agric
ultu
ral
Inpu
ts
Agricultural Crop Prices
Cost Sugar and tea yields, major cost inputs for the soft drinks and tea sectors, are predicted to decline due to climate change and water scarcity.
Immediate (with increased likelihood in future)
Oper
atin
g Ef
ficie
ncy Processing
CostsCost The beverages subsector is critically dependent
on water for both processing and as a key ingredient; scarcity can create operational dis-ruptions.
Immediate (with increased likelihood in future)
Repu
tatio
n
Food Safety Problems
CostRevenue
Water quality is critical to avoiding contamina-tion issues. Increased scarcity of high quality water supplies will increase the costs of avoid-ing contamination. An incident can lead to depressed sales.
Immediate (with increased likelihood in future)
Community Relations Issues
CostRevenue
Bottled water and soft drink companies draw large amounts of water from the groundwater around their manufacturing facilities; putting them at risk for conflicts with other users.
Future
Source: WRI
FIGURE 12. Magnitude of Impacts of Climate Change and Water Scarcity on the Beverages Subsector in South and Southeast Asia
Agricultural Crop Prices
HighLow
MAG
NITU
DE O
F FI
NANC
IAL
IMPA
CT
LIKELIHOOD OF OCCURRENCE
High
Low
Agricultural Inputs
Operating Effi ciency
Reputation
Food Safety Problems
Processing Costs
Community Relations Issues
Source: WRINote: This figure primarily applies to water and soft drinks. Tea and coffee production will mainly face higher crop prices.
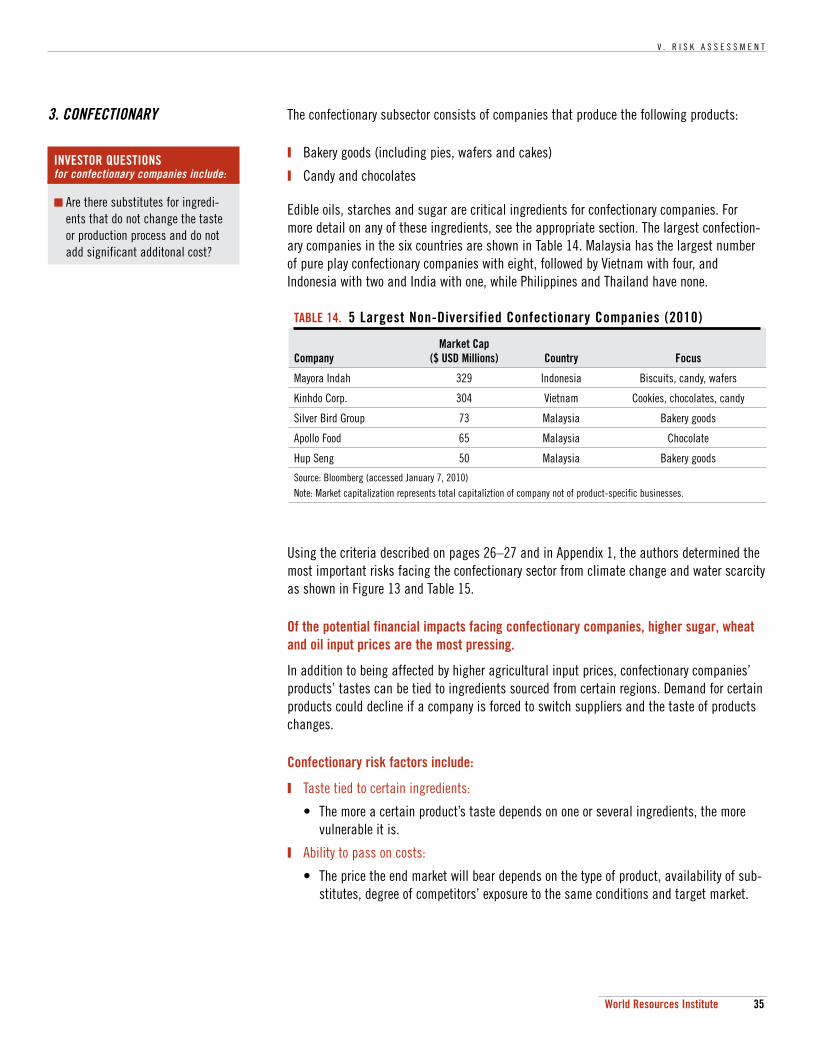
V . R I S K A S S E S S M E N T
35World Resources Institute
3. CONFECTIONARY The confectionary subsector consists of companies that produce the following products:
Bakery goods (including pies, wafers and cakes)
Candy and chocolates
Edible oils, starches and sugar are critical ingredients for confectionary companies. For more detail on any of these ingredients, see the appropriate section. The largest confection-ary companies in the six countries are shown in Table 14. Malaysia has the largest number of pure play confectionary companies with eight, followed by Vietnam with four, and Indonesia with two and India with one, while Philippines and Thailand have none.
Using the criteria described on pages 26–27 and in Appendix 1, the authors determined the most important risks facing the confectionary sector from climate change and water scarcity as shown in Figure 13 and Table 15.
Of the potential financial impacts facing confectionary companies, higher sugar, wheat and oil input prices are the most pressing.
In addition to being affected by higher agricultural input prices, confectionary companies’ products’ tastes can be tied to ingredients sourced from certain regions. Demand for certain products could decline if a company is forced to switch suppliers and the taste of products changes.
Confectionary risk factors include:
Taste tied to certain ingredients:
• The more a certain product’s taste depends on one or several ingredients, the more vulnerable it is.
Ability to pass on costs:
• The price the end market will bear depends on the type of product, availability of sub-stitutes, degree of competitors’ exposure to the same conditions and target market.
TABLE 14. 5 Largest Non-Diversified Confectionary Companies (2010)
Company Market Cap
($ USD Millions) Country Focus
Mayora Indah 329 Indonesia Biscuits, candy, wafers
Kinhdo Corp. 304 Vietnam Cookies, chocolates, candy
Silver Bird Group 73 Malaysia Bakery goods
Apollo Food 65 Malaysia Chocolate
Hup Seng 50 Malaysia Bakery goods
Source: Bloomberg (accessed January 7, 2010)Note: Market capitalization represents total capitaliztion of company not of product-specific businesses.
INVESTOR QUESTIONS for confectionary companies include:
Are there substitutes for ingredi-ents that do not change the taste or production process and do not add significant additonal cost?
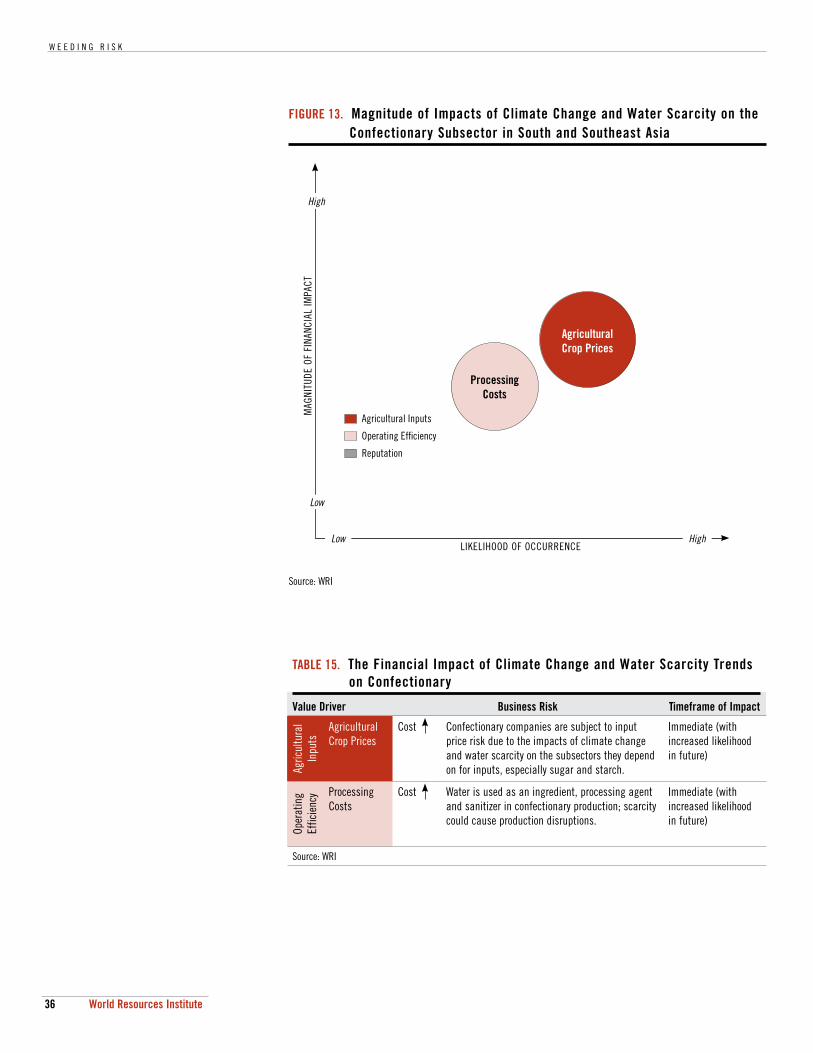
W E E D I N G R I S K
36 World Resources Institute
TABLE 15. The Financial Impact of Climate Change and Water Scarcity Trends on Confectionary
Value Driver Business Risk Timeframe of Impact
Agric
ultu
ral
Inpu
ts
Agricultural Crop Prices
Cost Confectionary companies are subject to input price risk due to the impacts of climate change and water scarcity on the subsectors they depend on for inputs, especially sugar and starch.
Immediate (with increased likelihood in future)
Oper
atin
g Ef
ficie
ncy Processing
CostsCost Water is used as an ingredient, processing agent
and sanitizer in confectionary production; scarcity could cause production disruptions.
Immediate (with increased likelihood in future)
Source: WRI
FIGURE 13. Magnitude of Impacts of Climate Change and Water Scarcity on the Confectionary Subsector in South and Southeast Asia
Source: WRI
HighLow
MAG
NITU
DE O
F FI
NANC
IAL
IMPA
CT
LIKELIHOOD OF OCCURRENCE
High
Low
Agricultural Inputs
Operating Effi ciency
Reputation
ProcessingCosts
Agricultural Crop Prices
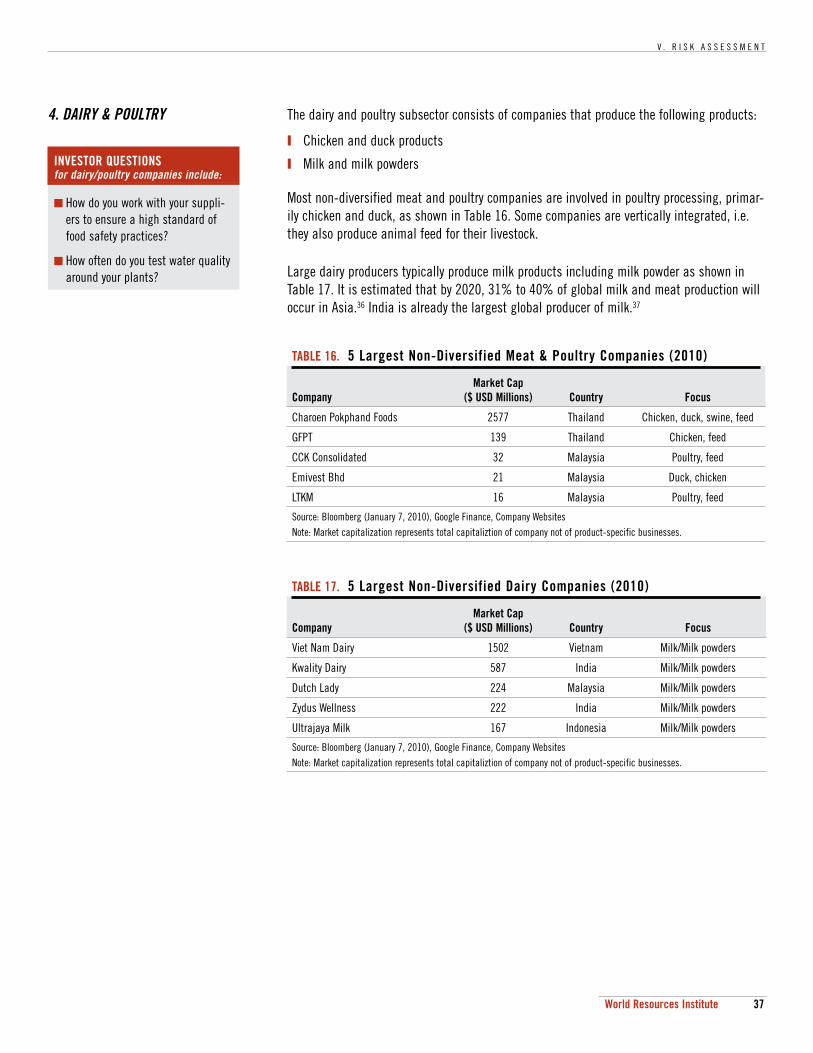
V . R I S K A S S E S S M E N T
37World Resources Institute
4. DAIRY & POULTRY The dairy and poultry subsector consists of companies that produce the following products:
Chicken and duck products
Milk and milk powders
Most non-diversified meat and poultry companies are involved in poultry processing, primar-ily chicken and duck, as shown in Table 16. Some companies are vertically integrated, i.e. they also produce animal feed for their livestock.
Large dairy producers typically produce milk products including milk powder as shown in Table 17. It is estimated that by 2020, 31% to 40% of global milk and meat production will occur in Asia.36 India is already the largest global producer of milk.37
TABLE 16. 5 Largest Non-Diversified Meat & Poultry Companies (2010)
CompanyMarket Cap
($ USD Millions) Country Focus
Charoen Pokphand Foods 2577 Thailand Chicken, duck, swine, feed
GFPT 139 Thailand Chicken, feed
CCK Consolidated 32 Malaysia Poultry, feed
Emivest Bhd 21 Malaysia Duck, chicken
LTKM 16 Malaysia Poultry, feed
Source: Bloomberg (January 7, 2010), Google Finance, Company WebsitesNote: Market capitalization represents total capitaliztion of company not of product-specific businesses.
TABLE 17. 5 Largest Non-Diversified Dairy Companies (2010)
CompanyMarket Cap
($ USD Millions) Country Focus
Viet Nam Dairy 1502 Vietnam Milk/Milk powders
Kwality Dairy 587 India Milk/Milk powders
Dutch Lady 224 Malaysia Milk/Milk powders
Zydus Wellness 222 India Milk/Milk powders
Ultrajaya Milk 167 Indonesia Milk/Milk powders
Source: Bloomberg (January 7, 2010), Google Finance, Company WebsitesNote: Market capitalization represents total capitaliztion of company not of product-specific businesses.
INVESTOR QUESTIONS for dairy/poultry companies include:
How do you work with your suppli-ers to ensure a high standard of food safety practices?
How often do you test water quality around your plants?
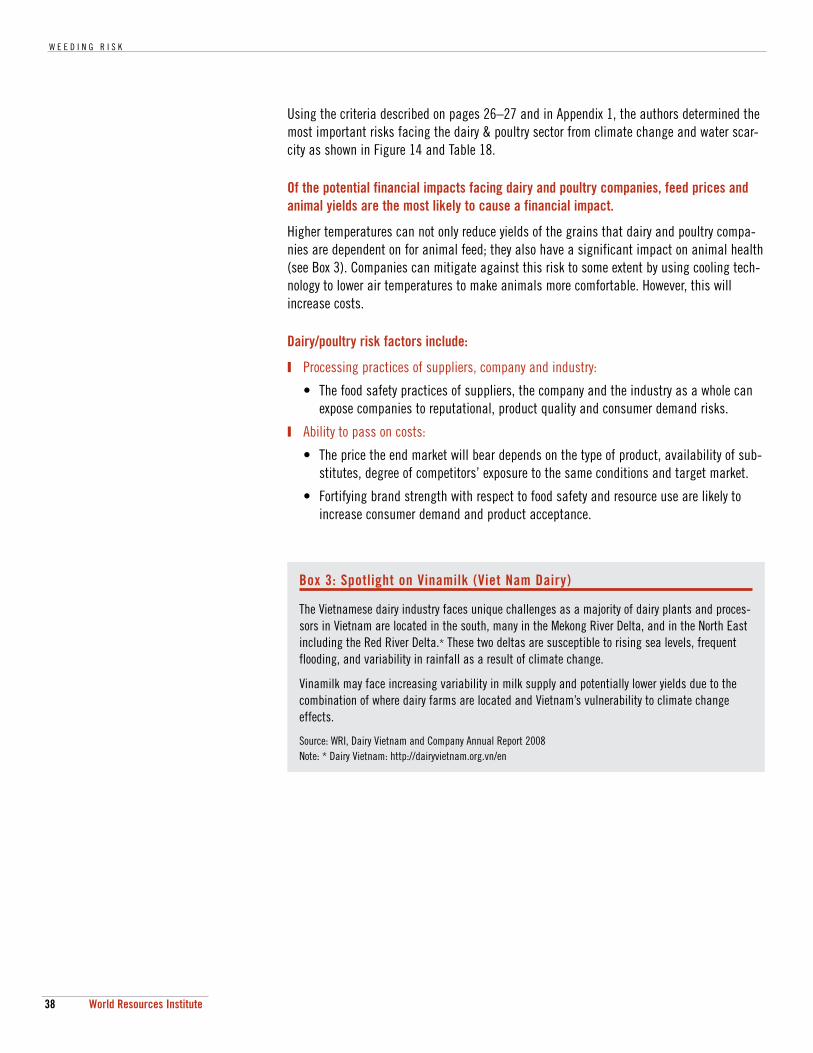
W E E D I N G R I S K
38 World Resources Institute
Using the criteria described on pages 26–27 and in Appendix 1, the authors determined the most important risks facing the dairy & poultry sector from climate change and water scar-city as shown in Figure 14 and Table 18.
Of the potential financial impacts facing dairy and poultry companies, feed prices and animal yields are the most likely to cause a financial impact.
Higher temperatures can not only reduce yields of the grains that dairy and poultry compa-nies are dependent on for animal feed; they also have a significant impact on animal health (see Box 3). Companies can mitigate against this risk to some extent by using cooling tech-nology to lower air temperatures to make animals more comfortable. However, this will increase costs.
Dairy/poultry risk factors include:
Processing practices of suppliers, company and industry:
• The food safety practices of suppliers, the company and the industry as a whole can expose companies to reputational, product quality and consumer demand risks.
Ability to pass on costs:
• The price the end market will bear depends on the type of product, availability of sub-stitutes, degree of competitors’ exposure to the same conditions and target market.
• Fortifying brand strength with respect to food safety and resource use are likely to increase consumer demand and product acceptance.
Box 3: Spotlight on Vinamilk (Viet Nam Dairy)
The Vietnamese dairy industry faces unique challenges as a majority of dairy plants and proces-sors in Vietnam are located in the south, many in the Mekong River Delta, and in the North East including the Red River Delta.* These two deltas are susceptible to rising sea levels, frequent flooding, and variability in rainfall as a result of climate change.
Vinamilk may face increasing variability in milk supply and potentially lower yields due to the combination of where dairy farms are located and Vietnam’s vulnerability to climate change effects.
Source: WRI, Dairy Vietnam and Company Annual Report 2008Note: * Dairy Vietnam: http://dairyvietnam.org.vn/en
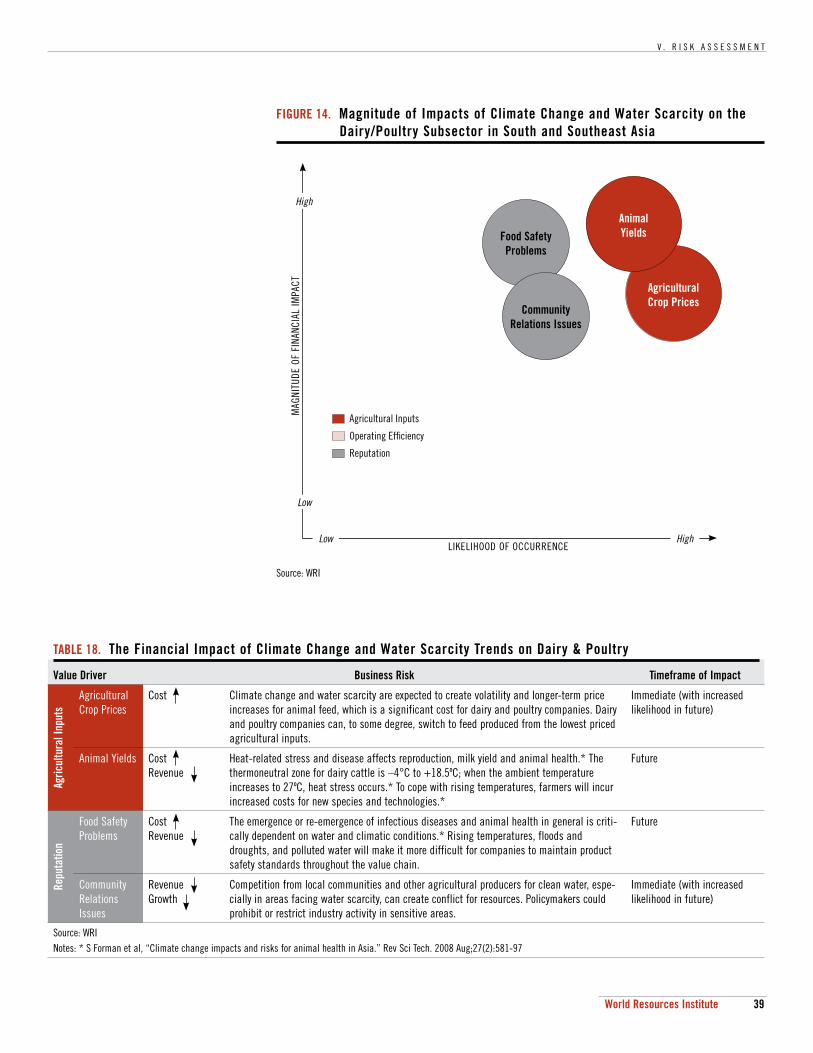
V . R I S K A S S E S S M E N T
39World Resources Institute
FIGURE 14. Magnitude of Impacts of Climate Change and Water Scarcity on the Dairy/Poultry Subsector in South and Southeast Asia
Source: WRI
HighLow
MAG
NITU
DE O
F FI
NANC
IAL
IMPA
CT
LIKELIHOOD OF OCCURRENCE
High
Low
Agricultural Inputs
Operating Effi ciency
Reputation
Food Safety Problems
Agricultural Crop Prices
Community Relations Issues
AnimalYields
TABLE 18. The Financial Impact of Climate Change and Water Scarcity Trends on Dairy & Poultry
Value Driver Business Risk Timeframe of Impact
Agric
ultu
ral I
nput
s
Agricultural Crop Prices
Cost Climate change and water scarcity are expected to create volatility and longer-term price increases for animal feed, which is a significant cost for dairy and poultry companies. Dairy and poultry companies can, to some degree, switch to feed produced from the lowest priced agricultural inputs.
Immediate (with increased likelihood in future)
Animal Yields CostRevenue
Heat-related stress and disease affects reproduction, milk yield and animal health.* The thermoneutral zone for dairy cattle is –4°C to +18.5ºC; when the ambient temperature increases to 27ºC, heat stress occurs.* To cope with rising temperatures, farmers will incur increased costs for new species and technologies.*
Future
Repu
tatio
n
Food Safety Problems
CostRevenue
The emergence or re-emergence of infectious diseases and animal health in general is criti-cally dependent on water and climatic conditions.* Rising temperatures, floods and droughts, and polluted water will make it more difficult for companies to maintain product safety standards throughout the value chain.
Future
Community Relations Issues
RevenueGrowth
Competition from local communities and other agricultural producers for clean water, espe-cially in areas facing water scarcity, can create conflict for resources. Policymakers could prohibit or restrict industry activity in sensitive areas.
Immediate (with increased likelihood in future)
Source: WRINotes: * S Forman et al, “Climate change impacts and risks for animal health in Asia.” Rev Sci Tech. 2008 Aug;27(2):581-97
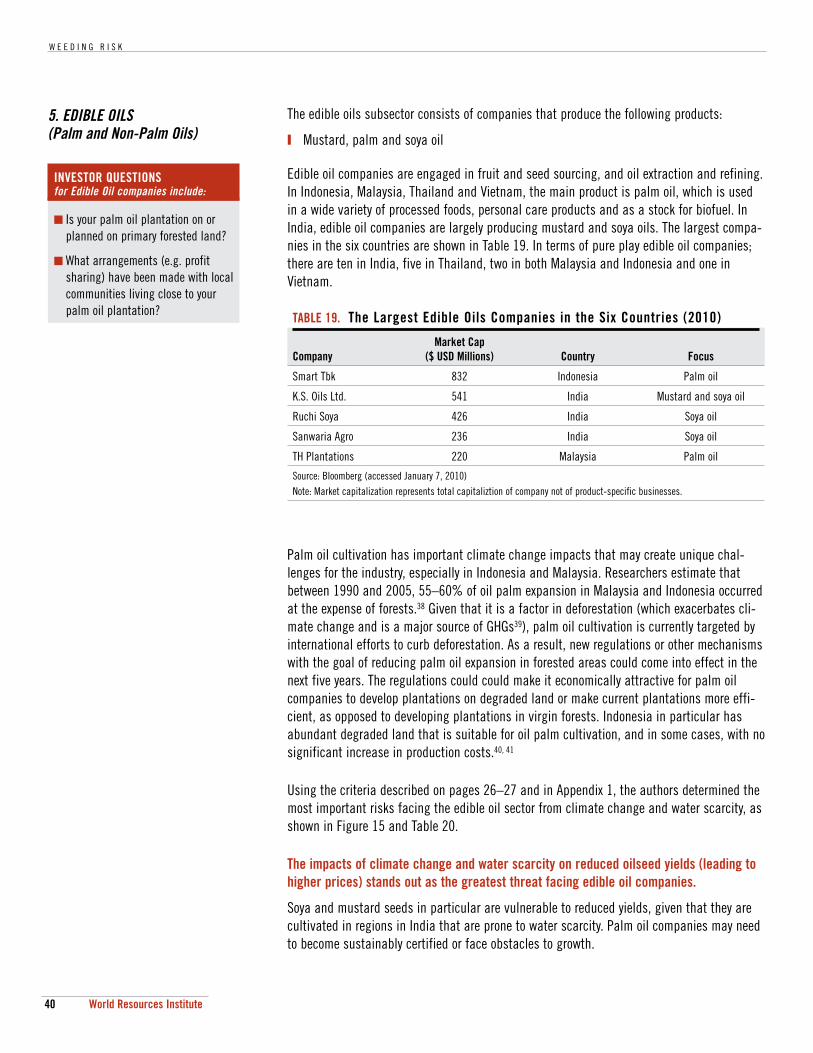
W E E D I N G R I S K
40 World Resources Institute
5. EDIBLE OILS (Palm and Non-Palm Oils)
The edible oils subsector consists of companies that produce the following products:
Mustard, palm and soya oil
Edible oil companies are engaged in fruit and seed sourcing, and oil extraction and refining. In Indonesia, Malaysia, Thailand and Vietnam, the main product is palm oil, which is used in a wide variety of processed foods, personal care products and as a stock for biofuel. In India, edible oil companies are largely producing mustard and soya oils. The largest compa-nies in the six countries are shown in Table 19. In terms of pure play edible oil companies; there are ten in India, five in Thailand, two in both Malaysia and Indonesia and one in Vietnam.
TABLE 19. The Largest Edible Oils Companies in the Six Countries (2010)
Company Market Cap
($ USD Millions) Country Focus
Smart Tbk 832 Indonesia Palm oil
K.S. Oils Ltd. 541 India Mustard and soya oil
Ruchi Soya 426 India Soya oil
Sanwaria Agro 236 India Soya oil
TH Plantations 220 Malaysia Palm oil
Source: Bloomberg (accessed January 7, 2010)Note: Market capitalization represents total capitaliztion of company not of product-specific businesses.
Palm oil cultivation has important climate change impacts that may create unique chal-lenges for the industry, especially in Indonesia and Malaysia. Researchers estimate that between 1990 and 2005, 55–60% of oil palm expansion in Malaysia and Indonesia occurred at the expense of forests.38 Given that it is a factor in deforestation (which exacerbates cli-mate change and is a major source of GHGs39), palm oil cultivation is currently targeted by international efforts to curb deforestation. As a result, new regulations or other mechanisms with the goal of reducing palm oil expansion in forested areas could come into effect in the next five years. The regulations could could make it economically attractive for palm oil companies to develop plantations on degraded land or make current plantations more effi-cient, as opposed to developing plantations in virgin forests. Indonesia in particular has abundant degraded land that is suitable for oil palm cultivation, and in some cases, with no significant increase in production costs.40, 41
Using the criteria described on pages 26–27 and in Appendix 1, the authors determined the most important risks facing the edible oil sector from climate change and water scarcity, as shown in Figure 15 and Table 20.
The impacts of climate change and water scarcity on reduced oilseed yields (leading to higher prices) stands out as the greatest threat facing edible oil companies.
Soya and mustard seeds in particular are vulnerable to reduced yields, given that they are cultivated in regions in India that are prone to water scarcity. Palm oil companies may need to become sustainably certified or face obstacles to growth.
INVESTOR QUESTIONS for Edible Oil companies include:
Is your palm oil plantation on or planned on primary forested land?
What arrangements (e.g. profit sharing) have been made with local communities living close to your palm oil plantation?
V . R I S K A S S E S S M E N T
41World Resources Institute
Edible Oil risk factors include:
Location of supplier/processing plant:
• Farms, plantations and plants will be impacted by environmental trends to varying degrees depending on where they are located.
Practices of supplier:
• Palm oil producers who expand into forested lands face legal, reputational and com-munity relations risks.
• Monocrops are more vulnerable to disease.42
• Need to adapt to climate change (i.e. use drought resistant seeds) can raise the costs of production for suppliers.
• Key concern is whether suppliers can manage in the face of environmental risks.
Ability to pass on costs:
• The price the end market will bear depends on the type of product, availability of sub-stitutes, degree of competitors’ exposure to the same conditions and target market.
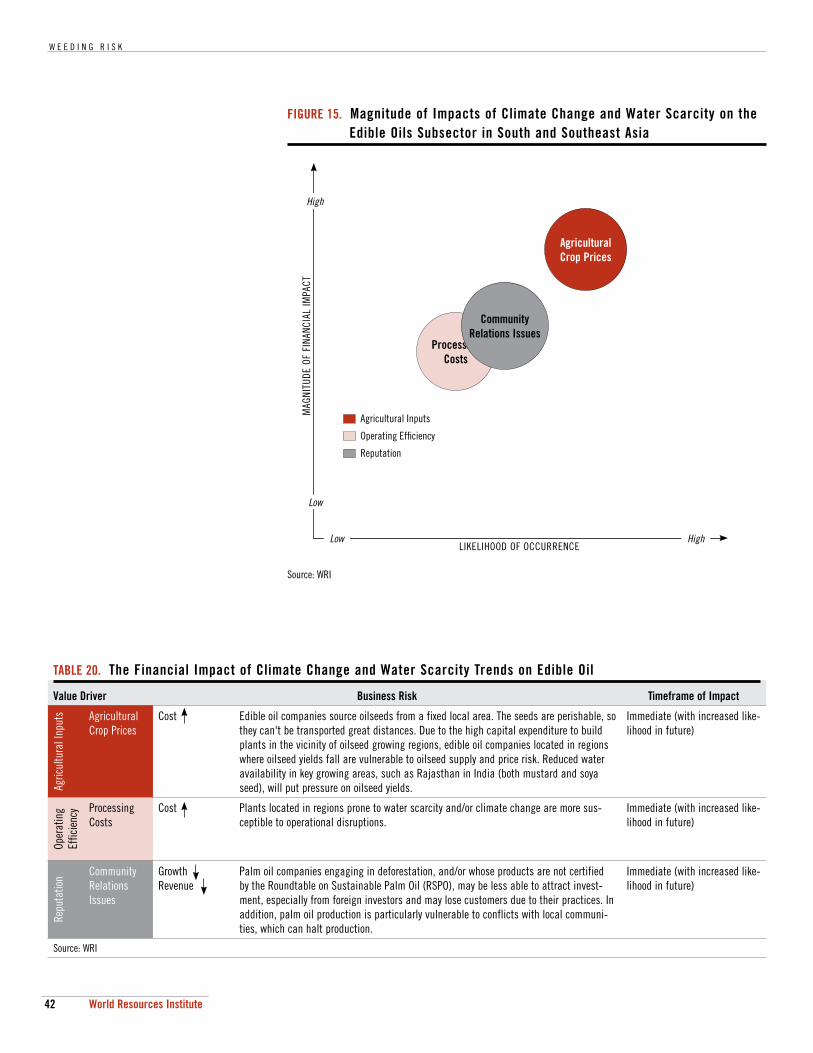
W E E D I N G R I S K
42 World Resources Institute
FIGURE 15. Magnitude of Impacts of Climate Change and Water Scarcity on the Edible Oils Subsector in South and Southeast Asia
Source: WRI
ProcessingCosts
HighLow
MAG
NITU
DE O
F FI
NANC
IAL
IMPA
CT
LIKELIHOOD OF OCCURRENCE
High
Low
Agricultural Inputs
Operating Effi ciency
Reputation
Community Relations Issues
Agricultural Crop Prices
TABLE 20. The Financial Impact of Climate Change and Water Scarcity Trends on Edible Oil
Value Driver Business Risk Timeframe of Impact
Agric
ultu
ral I
nput
s Agricultural Crop Prices
Cost Edible oil companies source oilseeds from a fixed local area. The seeds are perishable, so they can't be transported great distances. Due to the high capital expenditure to build plants in the vicinity of oilseed growing regions, edible oil companies located in regions where oilseed yields fall are vulnerable to oilseed supply and price risk. Reduced water availability in key growing areas, such as Rajasthan in India (both mustard and soya seed), will put pressure on oilseed yields.
Immediate (with increased like-lihood in future)
Oper
atin
g Ef
ficie
ncy Processing
CostsCost Plants located in regions prone to water scarcity and/or climate change are more sus-
ceptible to operational disruptions.Immediate (with increased like-lihood in future)
Repu
tatio
n Community Relations Issues
GrowthRevenue
Palm oil companies engaging in deforestation, and/or whose products are not certified by the Roundtable on Sustainable Palm Oil (RSPO), may be less able to attract invest-ment, especially from foreign investors and may lose customers due to their practices. In addition, palm oil production is particularly vulnerable to conflicts with local communi-ties, which can halt production.
Immediate (with increased like-lihood in future)
Source: WRI
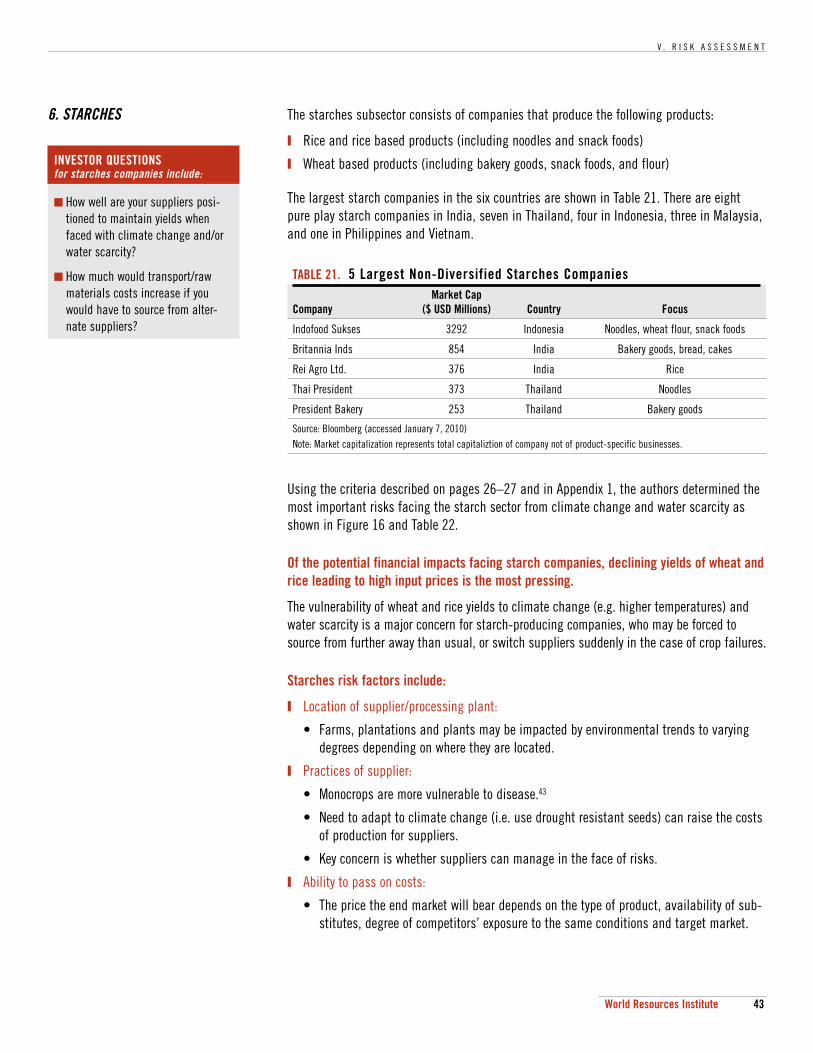
V . R I S K A S S E S S M E N T
43World Resources Institute
6. STARCHES The starches subsector consists of companies that produce the following products:
Rice and rice based products (including noodles and snack foods)
Wheat based products (including bakery goods, snack foods, and flour)
The largest starch companies in the six countries are shown in Table 21. There are eight pure play starch companies in India, seven in Thailand, four in Indonesia, three in Malaysia, and one in Philippines and Vietnam.
Using the criteria described on pages 26–27 and in Appendix 1, the authors determined the most important risks facing the starch sector from climate change and water scarcity as shown in Figure 16 and Table 22.
Of the potential financial impacts facing starch companies, declining yields of wheat and rice leading to high input prices is the most pressing.
The vulnerability of wheat and rice yields to climate change (e.g. higher temperatures) and water scarcity is a major concern for starch-producing companies, who may be forced to source from further away than usual, or switch suppliers suddenly in the case of crop failures.
Starches risk factors include:
Location of supplier/processing plant:
• Farms, plantations and plants may be impacted by environmental trends to varying degrees depending on where they are located.
Practices of supplier:
• Monocrops are more vulnerable to disease.43
• Need to adapt to climate change (i.e. use drought resistant seeds) can raise the costs of production for suppliers.
• Key concern is whether suppliers can manage in the face of risks.
Ability to pass on costs:
• The price the end market will bear depends on the type of product, availability of sub-stitutes, degree of competitors’ exposure to the same conditions and target market.
TABLE 21. 5 Largest Non-Diversified Starches Companies
Company Market Cap
($ USD Millions) Country Focus
Indofood Sukses 3292 Indonesia Noodles, wheat flour, snack foods
Britannia Inds 854 India Bakery goods, bread, cakes
Rei Agro Ltd. 376 India Rice
Thai President 373 Thailand Noodles
President Bakery 253 Thailand Bakery goods
Source: Bloomberg (accessed January 7, 2010)Note: Market capitalization represents total capitaliztion of company not of product-specific businesses.
INVESTOR QUESTIONS for starches companies include:
How well are your suppliers posi-tioned to maintain yields when faced with climate change and/or water scarcity?
How much would transport/raw materials costs increase if you would have to source from alter-nate suppliers?
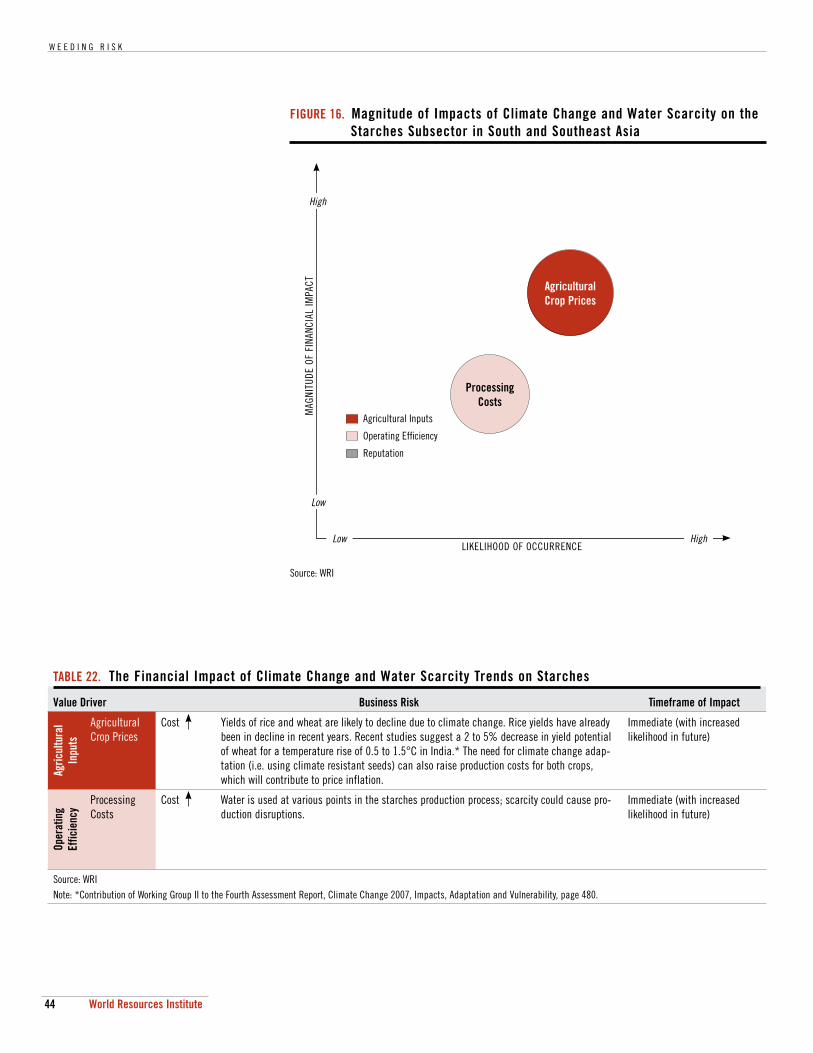
W E E D I N G R I S K
44 World Resources Institute
FIGURE 16. Magnitude of Impacts of Climate Change and Water Scarcity on the Starches Subsector in South and Southeast Asia
Source: WRI
HighLow
MAG
NITU
DE O
F FI
NANC
IAL
IMPA
CT
LIKELIHOOD OF OCCURRENCE
High
Low
Agricultural Inputs
Operating Effi ciency
Reputation
ProcessingCosts
Agricultural Crop Prices
TABLE 22. The Financial Impact of Climate Change and Water Scarcity Trends on Starches
Value Driver Business Risk Timeframe of Impact
Agric
ultu
ral
Inpu
ts
Agricultural Crop Prices
Cost Yields of rice and wheat are likely to decline due to climate change. Rice yields have already been in decline in recent years. Recent studies suggest a 2 to 5% decrease in yield potential of wheat for a temperature rise of 0.5 to 1.5°C in India.* The need for climate change adap-tation (i.e. using climate resistant seeds) can also raise production costs for both crops, which will contribute to price inflation.
Immediate (with increased likelihood in future)
Oper
atin
g Ef
ficie
ncy
Processing Costs
Cost Water is used at various points in the starches production process; scarcity could cause pro-duction disruptions.
Immediate (with increased likelihood in future)
Source: WRINote: *Contribution of Working Group II to the Fourth Assessment Report, Climate Change 2007, Impacts, Adaptation and Vulnerability, page 480.
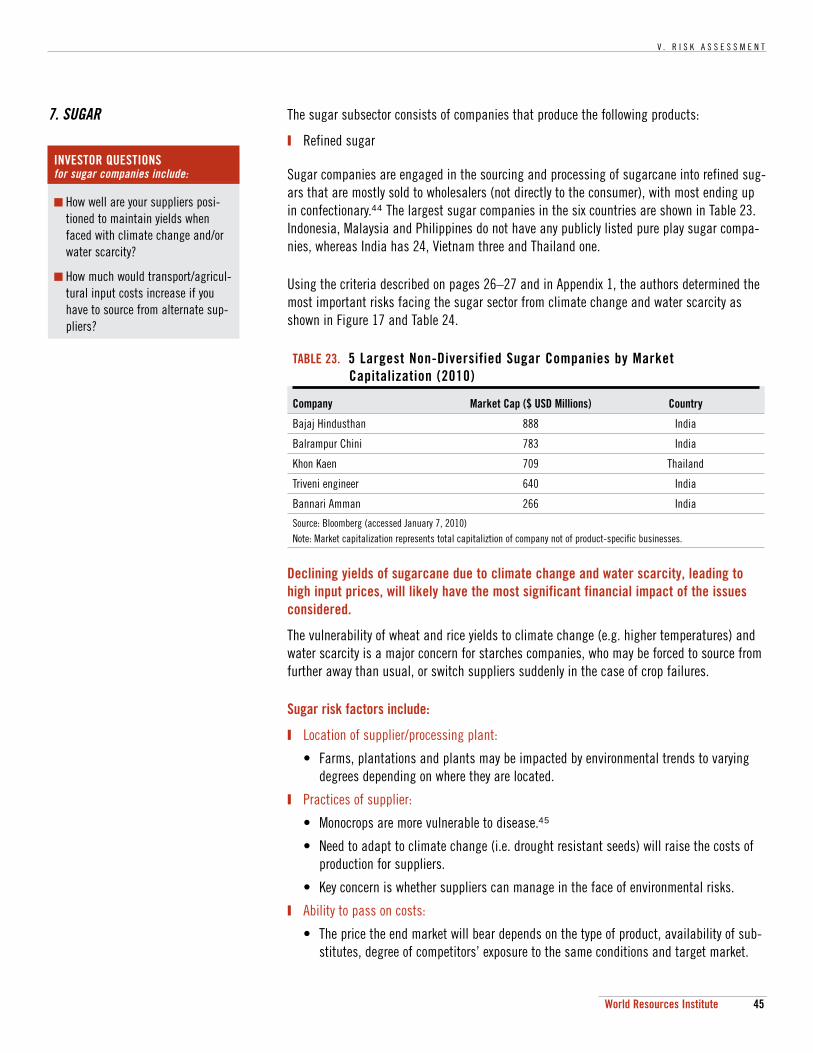
V . R I S K A S S E S S M E N T
45World Resources Institute
7. SUGAR The sugar subsector consists of companies that produce the following products:
Refined sugar
Sugar companies are engaged in the sourcing and processing of sugarcane into refined sug-ars that are mostly sold to wholesalers (not directly to the consumer), with most ending up in confectionary.44 The largest sugar companies in the six countries are shown in Table 23. Indonesia, Malaysia and Philippines do not have any publicly listed pure play sugar compa-nies, whereas India has 24, Vietnam three and Thailand one.
Using the criteria described on pages 26–27 and in Appendix 1, the authors determined the most important risks facing the sugar sector from climate change and water scarcity as shown in Figure 17 and Table 24.
Declining yields of sugarcane due to climate change and water scarcity, leading to high input prices, will likely have the most significant financial impact of the issues considered.
The vulnerability of wheat and rice yields to climate change (e.g. higher temperatures) and water scarcity is a major concern for starches companies, who may be forced to source from further away than usual, or switch suppliers suddenly in the case of crop failures.
Sugar risk factors include:
Location of supplier/processing plant:
• Farms, plantations and plants may be impacted by environmental trends to varying degrees depending on where they are located.
Practices of supplier:
• Monocrops are more vulnerable to disease.45
• Need to adapt to climate change (i.e. drought resistant seeds) will raise the costs of production for suppliers.
• Key concern is whether suppliers can manage in the face of environmental risks.
Ability to pass on costs:
• The price the end market will bear depends on the type of product, availability of sub-stitutes, degree of competitors’ exposure to the same conditions and target market.
TABLE 23. 5 Largest Non-Diversified Sugar Companies by Market Capitalization (2010)
Company Market Cap ($ USD Millions) Country
Bajaj Hindusthan 888 India
Balrampur Chini 783 India
Khon Kaen 709 Thailand
Triveni engineer 640 India
Bannari Amman 266 India
Source: Bloomberg (accessed January 7, 2010)Note: Market capitalization represents total capitaliztion of company not of product-specific businesses.
INVESTOR QUESTIONS for sugar companies include:
How well are your suppliers posi-tioned to maintain yields when faced with climate change and/or water scarcity?
How much would transport/agricul-tural input costs increase if you have to source from alternate sup-pliers?
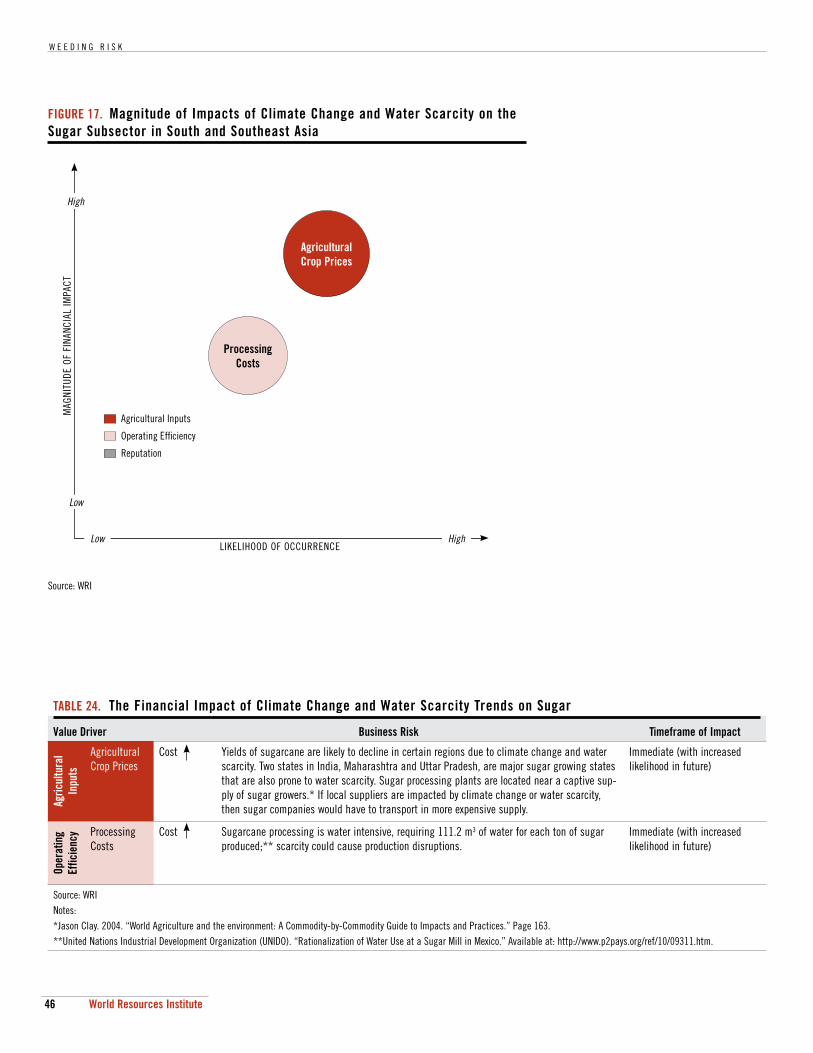
W E E D I N G R I S K
46 World Resources Institute
FIGURE 17. Magnitude of Impacts of Climate Change and Water Scarcity on the Sugar Subsector in South and Southeast Asia
Source: WRI
HighLow
MAG
NITU
DE O
F FI
NANC
IAL
IMPA
CT
LIKELIHOOD OF OCCURRENCE
High
Low
Agricultural Inputs
Operating Effi ciency
Reputation
ProcessingCosts
Agricultural Crop Prices
TABLE 24. The Financial Impact of Climate Change and Water Scarcity Trends on Sugar
Value Driver Business Risk Timeframe of Impact
Agric
ultu
ral
Inpu
ts
Agricultural Crop Prices
Cost Yields of sugarcane are likely to decline in certain regions due to climate change and water scarcity. Two states in India, Maharashtra and Uttar Pradesh, are major sugar growing states that are also prone to water scarcity. Sugar processing plants are located near a captive sup-ply of sugar growers.* If local suppliers are impacted by climate change or water scarcity, then sugar companies would have to transport in more expensive supply.
Immediate (with increased likelihood in future)
Oper
atin
g Ef
ficie
ncy Processing
CostsCost Sugarcane processing is water intensive, requiring 111.2 m3 of water for each ton of sugar
produced;** scarcity could cause production disruptions.Immediate (with increased likelihood in future)
Source: WRINotes: *Jason Clay. 2004. “World Agriculture and the environment: A Commodity-by-Commodity Guide to Impacts and Practices.” Page 163. **United Nations Industrial Development Organization (UNIDO). “Rationalization of Water Use at a Sugar Mill in Mexico.” Available at: http://www.p2pays.org/ref/10/09311.htm.
V I . F I N A N C I A L A P P L I C A T I O N : S U B S E C T O R C A S E S T U D Y
47World Resources Institute
HS
BC
CA
SE
ST
UD
Y
Written by Sandeep Somani and Shipra Pandey, HSBC India VI. Financial Application:
Subsector Case Study
The case study below is written by an HSBC equity research analyst and is based on his/her knowledge of the climatic and environmental factors that have an impact on the business of companies in this sector. It does not constitute investment research and is not part of the analyst’s ongoing research coverage. Readers of this report, whether existing clients of HSBC or not, should in no circumstances rely on this material when making investment decisions or use it as the basis of an investment strategy.
HSBC, with input from WRI, developed an in depth case study of an Indian sugar company, Balrampur Chini Mills. Appendix 1 describes the methodology used, and why this company was chosen for analysis.
KEY POINTS
For Balrampur Chini Mills, the impact of an change in raw material cost has a manifold impact on profit. Each 1% change results in a change in earnings of about 3-10%, depending on the sugarcane supply-demand cycle. The effect can be both on the upside and downside.
The case study analyzes the impact of climate change on a key value driver highlighted throughout this report: agricultural inputs. A hypothetical scenario is applied to Balrampur Chini Mills in order to explore the risks and opportunities climate change poses both for investors and a specific company.
A key takeaway from this analysis is that companies can take cost-effective actions that will mitigate their exposure to environmental risks, even if there is considerable uncer-tainty about the timing and magnitude of the risk.
In assessing the effect of climate change on these companies’ prospects, HSBC analysts faced the following challenges:
Obtaining facility level data.
Obtaining financial data broken down along product lines.
Obtaining reliable information on local climate change trends, soil fertility levels and water table levels in order to estimate long-term availability of feedstock.
Translating climate change trends into physical effects, especially since the weather is already a variable factor.
Given the volatile nature of agricultural commodity prices, driven by national and interna-tional supply-demand factors, it is difficult to model with sufficient certainty the timing and financial magnitude of environmental impacts in a discounted cash flow (DCF) model.
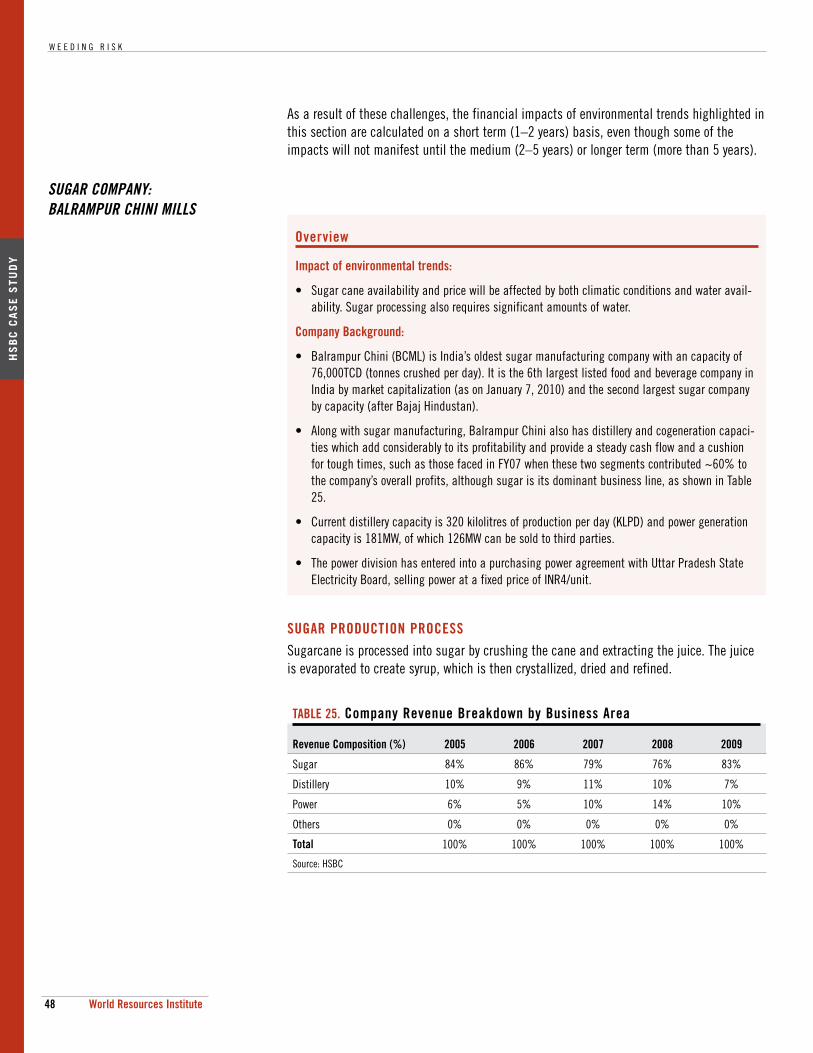
W E E D I N G R I S K
48 World Resources Institute
HS
BC
CA
SE
ST
UD
Y
As a result of these challenges, the financial impacts of environmental trends highlighted in this section are calculated on a short term (1–2 years) basis, even though some of the impacts will not manifest until the medium (2–5 years) or longer term (more than 5 years).
SUGAR COMPANY: BALRAMPUR CHINI MILLS
Overview
Impact of environmental trends:
• Sugar cane availability and price will be affected by both climatic conditions and water avail-ability. Sugar processing also requires significant amounts of water.
Company Background:
• Balrampur Chini (BCML) is India’s oldest sugar manufacturing company with an capacity of 76,000TCD (tonnes crushed per day). It is the 6th largest listed food and beverage company in India by market capitalization (as on January 7, 2010) and the second largest sugar company by capacity (after Bajaj Hindustan).
• Along with sugar manufacturing, Balrampur Chini also has distillery and cogeneration capaci-ties which add considerably to its profitability and provide a steady cash flow and a cushion for tough times, such as those faced in FY07 when these two segments contributed ~60% to the company’s overall profits, although sugar is its dominant business line, as shown in Table 25.
• Current distillery capacity is 320 kilolitres of production per day (KLPD) and power generation capacity is 181MW, of which 126MW can be sold to third parties.
• The power division has entered into a purchasing power agreement with Uttar Pradesh State Electricity Board, selling power at a fixed price of INR4/unit.
SUGAR PRODUCTION PROCESS
Sugarcane is processed into sugar by crushing the cane and extracting the juice. The juice is evaporated to create syrup, which is then crystallized, dried and refined.
TABLE 25. Company Revenue Breakdown by Business Area
Revenue Composition (%) 2005 2006 2007 2008 2009
Sugar 84% 86% 79% 76% 83%
Distillery 10% 9% 11% 10% 7%
Power 6% 5% 10% 14% 10%
Others 0% 0% 0% 0% 0%
Total 100% 100% 100% 100% 100%
Source: HSBC
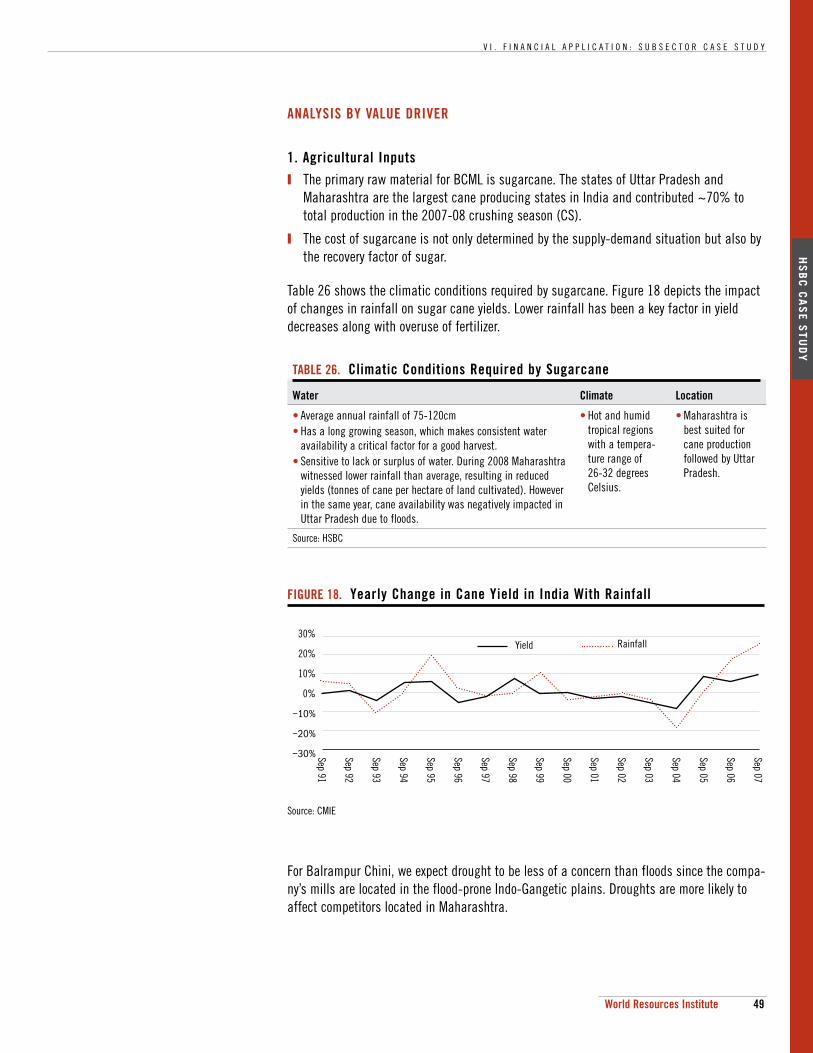
V I . F I N A N C I A L A P P L I C A T I O N : S U B S E C T O R C A S E S T U D Y
49World Resources Institute
HS
BC
CA
SE
ST
UD
Y
ANALYSIS BY VALUE DRIVER
1. Agricultural Inputs
The primary raw material for BCML is sugarcane. The states of Uttar Pradesh and Maharashtra are the largest cane producing states in India and contributed ~70% to total production in the 2007-08 crushing season (CS).
The cost of sugarcane is not only determined by the supply-demand situation but also by the recovery factor of sugar.
Table 26 shows the climatic conditions required by sugarcane. Figure 18 depicts the impact of changes in rainfall on sugar cane yields. Lower rainfall has been a key factor in yield decreases along with overuse of fertilizer.
TABLE 26. Climatic Conditions Required by Sugarcane
Water Climate Location
• Average annual rainfall of 75-120cm• Has a long growing season, which makes consistent water
availability a critical factor for a good harvest.• Sensitive to lack or surplus of water. During 2008 Maharashtra
witnessed lower rainfall than average, resulting in reduced yields (tonnes of cane per hectare of land cultivated). However in the same year, cane availability was negatively impacted in Uttar Pradesh due to floods.
• Hot and humid tropical regions with a tempera-ture range of 26-32 degrees Celsius.
• Maharashtra is best suited for cane production followed by Uttar Pradesh.
Source: HSBC
FIGURE 18. Yearly Change in Cane Yield in India With Rainfall
Source: CMIE
30%
20%
10%
0%
−10%
−20%
−30% Sep 07
Sep 06
Sep 05
Sep 04
Sep 03
Sep 02
Sep 01
Sep 00
Sep 99
Sep 98
Sep 97
Sep 96
Sep 95
Sep 94
Sep 93
Sep 92
Sep 91
Yield Rainfall
For Balrampur Chini, we expect drought to be less of a concern than floods since the compa-ny’s mills are located in the flood-prone Indo-Gangetic plains. Droughts are more likely to affect competitors located in Maharashtra.
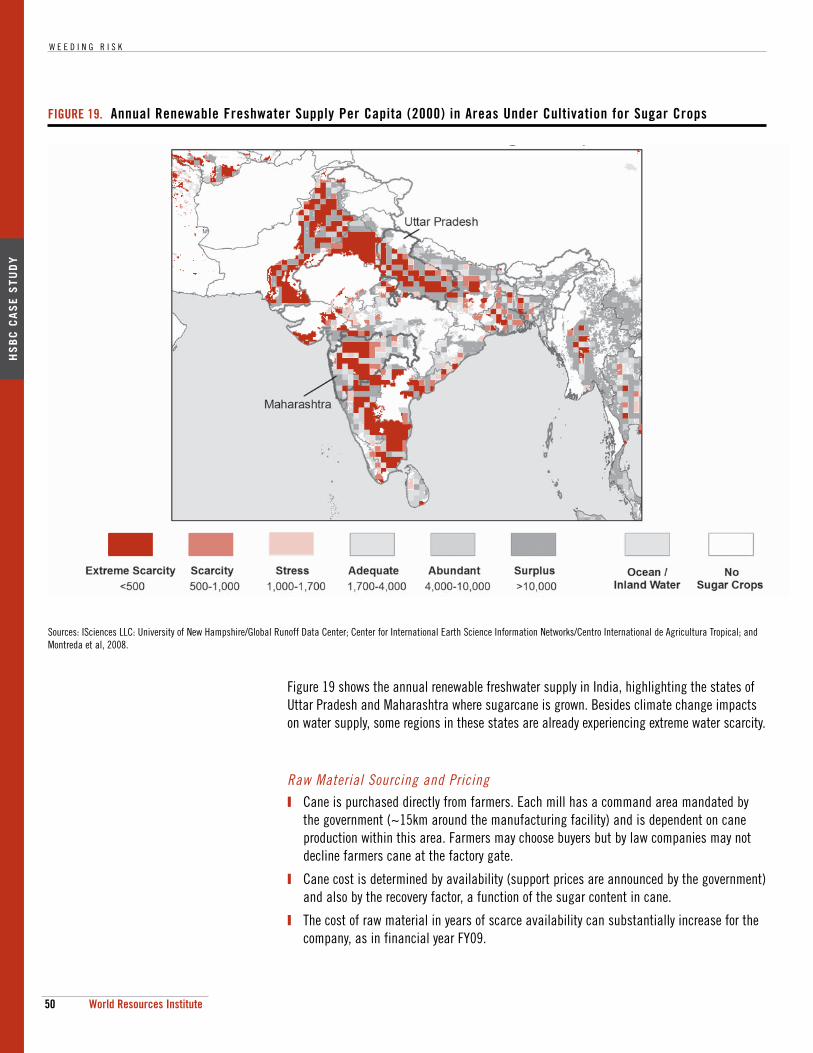
W E E D I N G R I S K
50 World Resources Institute
HS
BC
CA
SE
ST
UD
Y
Figure 19 shows the annual renewable freshwater supply in India, highlighting the states of Uttar Pradesh and Maharashtra where sugarcane is grown. Besides climate change impacts on water supply, some regions in these states are already experiencing extreme water scarcity.
Raw Material Sourcing and Pricing Cane is purchased directly from farmers. Each mill has a command area mandated by
the government (~15km around the manufacturing facility) and is dependent on cane production within this area. Farmers may choose buyers but by law companies may not decline farmers cane at the factory gate.
Cane cost is determined by availability (support prices are announced by the government) and also by the recovery factor, a function of the sugar content in cane.
The cost of raw material in years of scarce availability can substantially increase for the company, as in financial year FY09.
FIGURE 19. Annual Renewable Freshwater Supply Per Capita (2000) in Areas Under Cultivation for Sugar Crops
Sources: ISciences LLC: University of New Hampshire/Global Runoff Data Center; Center for International Earth Science Information Networks/Centro International de Agricultura Tropical; and Montreda et al, 2008.
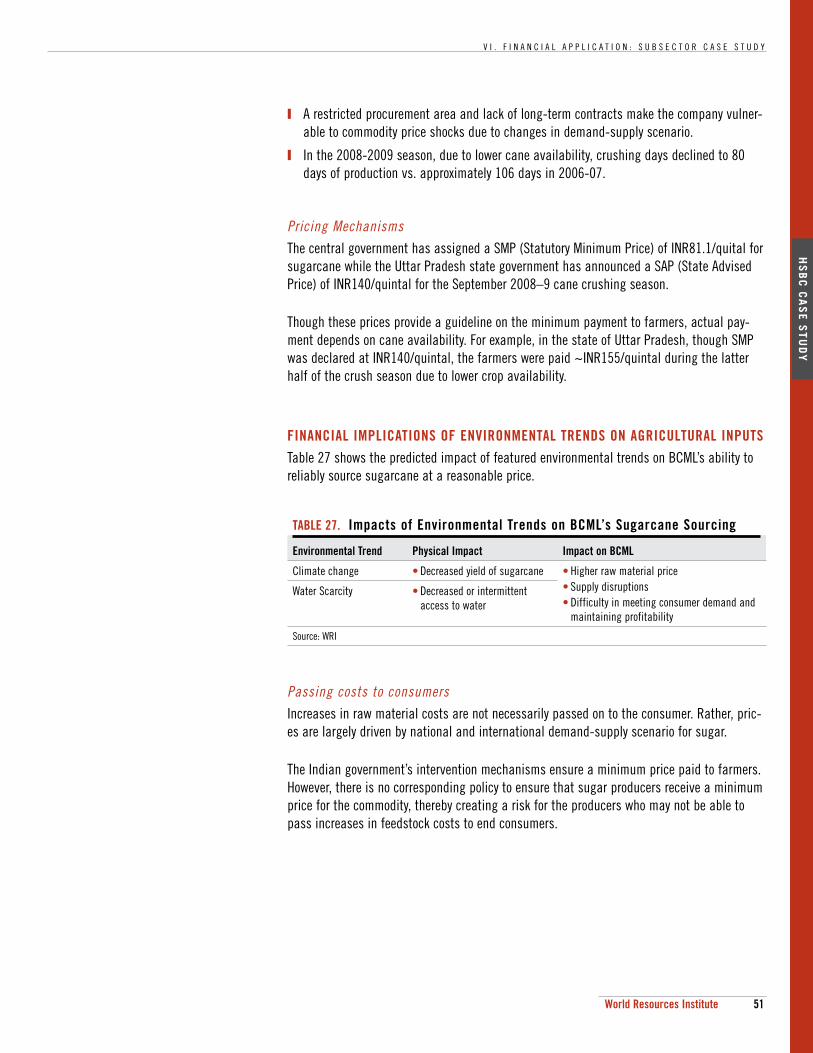
V I . F I N A N C I A L A P P L I C A T I O N : S U B S E C T O R C A S E S T U D Y
51World Resources Institute
HS
BC
CA
SE
ST
UD
Y
A restricted procurement area and lack of long-term contracts make the company vulner-able to commodity price shocks due to changes in demand-supply scenario.
In the 2008-2009 season, due to lower cane availability, crushing days declined to 80 days of production vs. approximately 106 days in 2006-07.
Pricing MechanismsThe central government has assigned a SMP (Statutory Minimum Price) of INR81.1/quital for sugarcane while the Uttar Pradesh state government has announced a SAP (State Advised Price) of INR140/quintal for the September 2008–9 cane crushing season.
Though these prices provide a guideline on the minimum payment to farmers, actual pay-ment depends on cane availability. For example, in the state of Uttar Pradesh, though SMP was declared at INR140/quintal, the farmers were paid ~INR155/quintal during the latter half of the crush season due to lower crop availability.
FINANCIAL IMPLICATIONS OF ENVIRONMENTAL TRENDS ON AGRICULTURAL INPUTS
Table 27 shows the predicted impact of featured environmental trends on BCML’s ability to reliably source sugarcane at a reasonable price.
TABLE 27. Impacts of Environmental Trends on BCML’s Sugarcane Sourcing
Environmental Trend Physical Impact Impact on BCML
Climate change • Decreased yield of sugarcane • Higher raw material price• Supply disruptions• Difficulty in meeting consumer demand and
maintaining profitability
Water Scarcity • Decreased or intermittent access to water
Source: WRI
Passing costs to consumersIncreases in raw material costs are not necessarily passed on to the consumer. Rather, pric-es are largely driven by national and international demand-supply scenario for sugar.
The Indian government’s intervention mechanisms ensure a minimum price paid to farmers. However, there is no corresponding policy to ensure that sugar producers receive a minimum price for the commodity, thereby creating a risk for the producers who may not be able to pass increases in feedstock costs to end consumers.
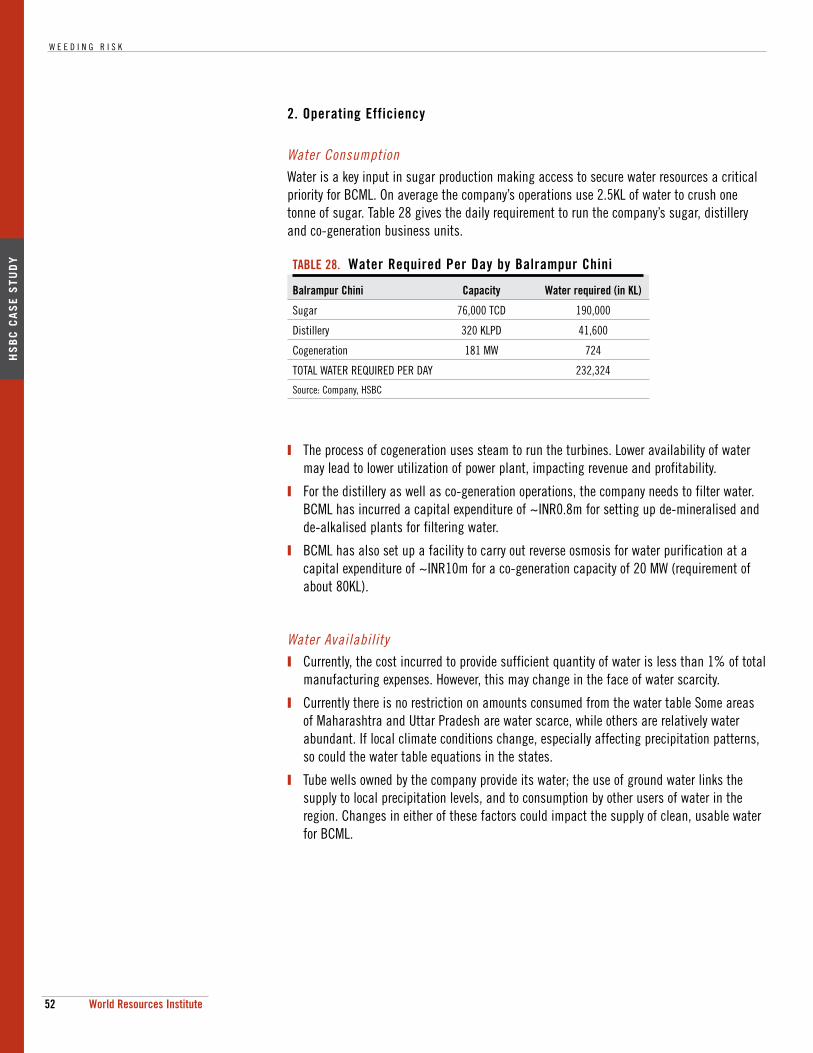
W E E D I N G R I S K
52 World Resources Institute
HS
BC
CA
SE
ST
UD
Y
2. Operating Efficiency
Water ConsumptionWater is a key input in sugar production making access to secure water resources a critical priority for BCML. On average the company’s operations use 2.5KL of water to crush one tonne of sugar. Table 28 gives the daily requirement to run the company’s sugar, distillery and co-generation business units.
TABLE 28. Water Required Per Day by Balrampur Chini
Balrampur Chini Capacity Water required (in KL)
Sugar 76,000 TCD 190,000
Distillery 320 KLPD 41,600
Cogeneration 181 MW 724
TOTAL WATER REQUIRED PER DAY 232,324
Source: Company, HSBC
The process of cogeneration uses steam to run the turbines. Lower availability of water may lead to lower utilization of power plant, impacting revenue and profitability.
For the distillery as well as co-generation operations, the company needs to filter water. BCML has incurred a capital expenditure of ~INR0.8m for setting up de-mineralised and de-alkalised plants for filtering water.
BCML has also set up a facility to carry out reverse osmosis for water purification at a capital expenditure of ~INR10m for a co-generation capacity of 20 MW (requirement of about 80KL).
Water Availability Currently, the cost incurred to provide sufficient quantity of water is less than 1% of total
manufacturing expenses. However, this may change in the face of water scarcity.
Currently there is no restriction on amounts consumed from the water table Some areas of Maharashtra and Uttar Pradesh are water scarce, while others are relatively water abundant. If local climate conditions change, especially affecting precipitation patterns, so could the water table equations in the states.
Tube wells owned by the company provide its water; the use of ground water links the supply to local precipitation levels, and to consumption by other users of water in the region. Changes in either of these factors could impact the supply of clean, usable water for BCML.
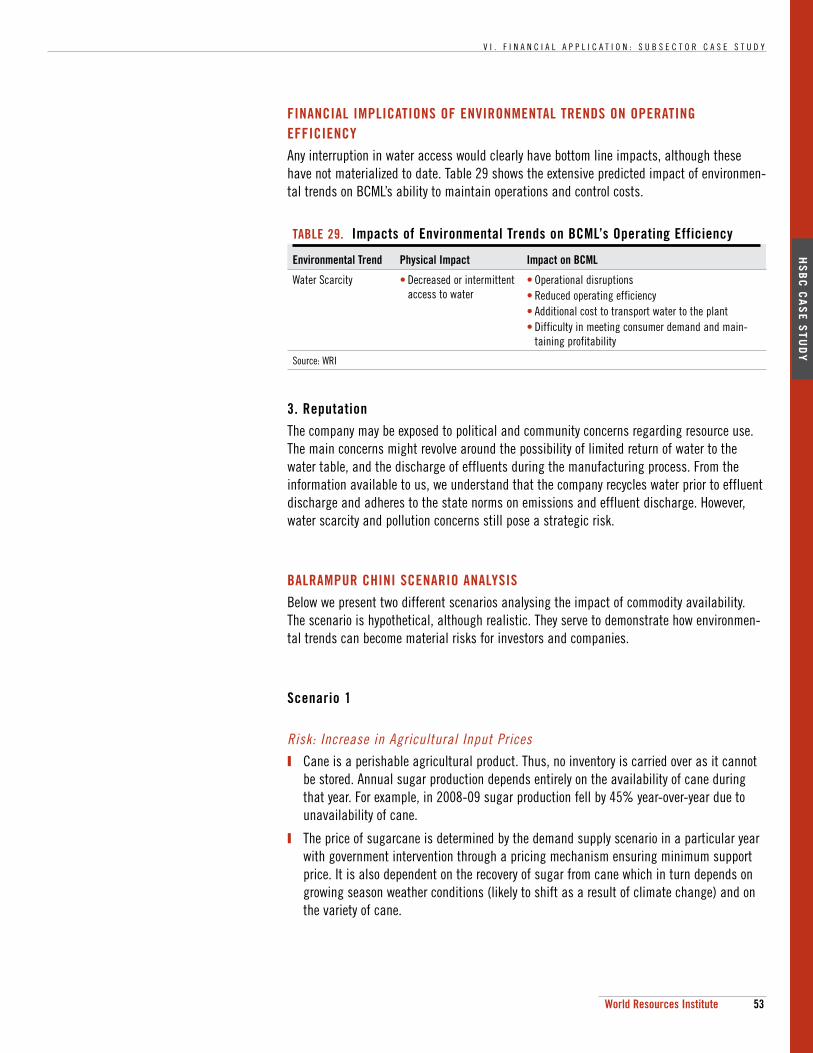
V I . F I N A N C I A L A P P L I C A T I O N : S U B S E C T O R C A S E S T U D Y
53World Resources Institute
HS
BC
CA
SE
ST
UD
Y
FINANCIAL IMPLICATIONS OF ENVIRONMENTAL TRENDS ON OPERATING EFFICIENCY
Any interruption in water access would clearly have bottom line impacts, although these have not materialized to date. Table 29 shows the extensive predicted impact of environmen-tal trends on BCML’s ability to maintain operations and control costs.
TABLE 29. Impacts of Environmental Trends on BCML’s Operating Efficiency
Environmental Trend Physical Impact Impact on BCML
Water Scarcity • Decreased or intermittent access to water
• Operational disruptions• Reduced operating efficiency• Additional cost to transport water to the plant• Difficulty in meeting consumer demand and main-
taining profitability
Source: WRI
3. Reputation
The company may be exposed to political and community concerns regarding resource use. The main concerns might revolve around the possibility of limited return of water to the water table, and the discharge of effluents during the manufacturing process. From the information available to us, we understand that the company recycles water prior to effluent discharge and adheres to the state norms on emissions and effluent discharge. However, water scarcity and pollution concerns still pose a strategic risk.
BALRAMPUR CHINI SCENARIO ANALYSIS
Below we present two different scenarios analysing the impact of commodity availability. The scenario is hypothetical, although realistic. They serve to demonstrate how environmen-tal trends can become material risks for investors and companies.
Scenario 1
Risk: Increase in Agricultural Input Prices Cane is a perishable agricultural product. Thus, no inventory is carried over as it cannot
be stored. Annual sugar production depends entirely on the availability of cane during that year. For example, in 2008-09 sugar production fell by 45% year-over-year due to unavailability of cane.
The price of sugarcane is determined by the demand supply scenario in a particular year with government intervention through a pricing mechanism ensuring minimum support price. It is also dependent on the recovery of sugar from cane which in turn depends on growing season weather conditions (likely to shift as a result of climate change) and on the variety of cane.
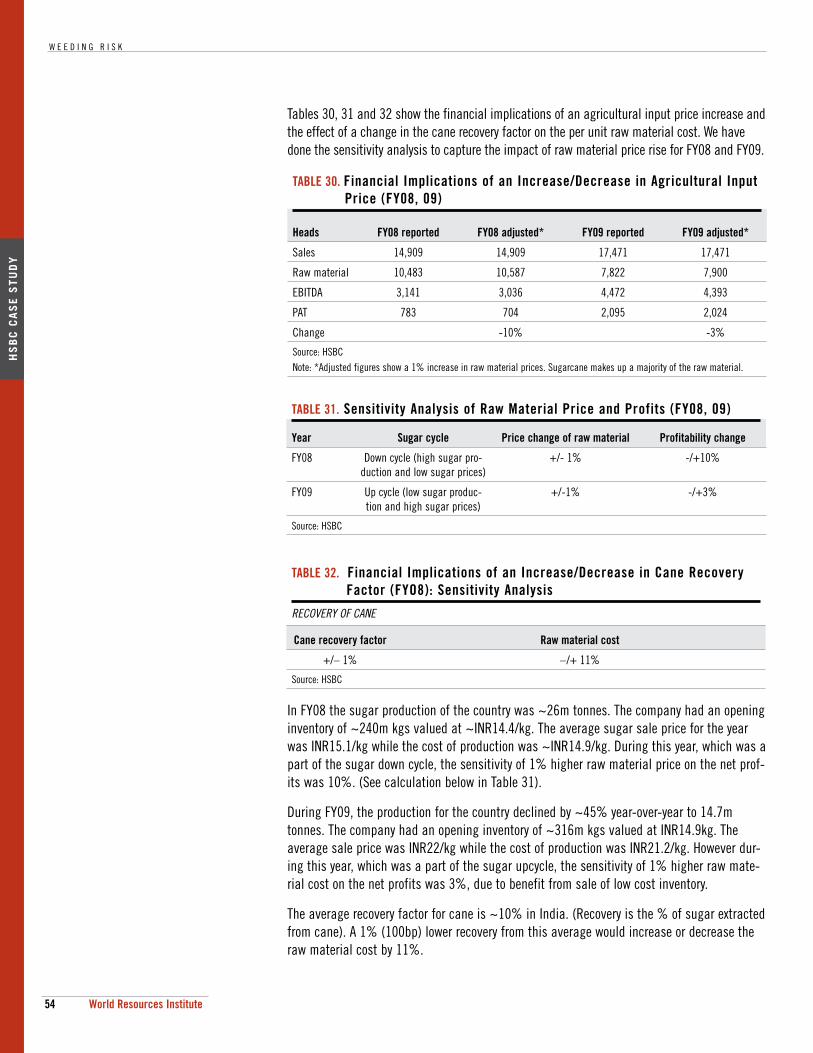
W E E D I N G R I S K
54 World Resources Institute
HS
BC
CA
SE
ST
UD
Y
Tables 30, 31 and 32 show the financial implications of an agricultural input price increase and the effect of a change in the cane recovery factor on the per unit raw material cost. We have done the sensitivity analysis to capture the impact of raw material price rise for FY08 and FY09.
TABLE 30. Financial Implications of an Increase/Decrease in Agricultural Input Price (FY08, 09)
Heads FY08 reported FY08 adjusted* FY09 reported FY09 adjusted*
Sales 14,909 14,909 17,471 17,471
Raw material 10,483 10,587 7,822 7,900
EBITDA 3,141 3,036 4,472 4,393
PAT 783 704 2,095 2,024
Change -10% -3%
Source: HSBC Note: *Adjusted figures show a 1% increase in raw material prices. Sugarcane makes up a majority of the raw material.
In FY08 the sugar production of the country was ~26m tonnes. The company had an opening inventory of ~240m kgs valued at ~INR14.4/kg. The average sugar sale price for the year was INR15.1/kg while the cost of production was ~INR14.9/kg. During this year, which was a part of the sugar down cycle, the sensitivity of 1% higher raw material price on the net prof-its was 10%. (See calculation below in Table 31).
During FY09, the production for the country declined by ~45% year-over-year to 14.7m tonnes. The company had an opening inventory of ~316m kgs valued at INR14.9kg. The average sale price was INR22/kg while the cost of production was INR21.2/kg. However dur-ing this year, which was a part of the sugar upcycle, the sensitivity of 1% higher raw mate-rial cost on the net profits was 3%, due to benefit from sale of low cost inventory.
The average recovery factor for cane is ~10% in India. (Recovery is the % of sugar extracted from cane). A 1% (100bp) lower recovery from this average would increase or decrease the raw material cost by 11%.
TABLE 31. Sensitivity Analysis of Raw Material Price and Profits (FY08, 09)
Year Sugar cycle Price change of raw material Profitability change
FY08 Down cycle (high sugar pro-duction and low sugar prices)
+/- 1% -/+10%
FY09 Up cycle (low sugar produc-tion and high sugar prices)
+/-1% -/+3%
Source: HSBC
TABLE 32. Financial Implications of an Increase/Decrease in Cane Recovery Factor (FYO8): Sensitivity Analysis
RECOVERY OF CANE
Cane recovery factor Raw material cost
+/– 1% – /+ 11%
Source: HSBC
V I . F I N A N C I A L A P P L I C A T I O N : S U B S E C T O R C A S E S T U D Y
55World Resources Institute
HS
BC
CA
SE
ST
UD
Y
Scenario 2
Opportunity: Agricultural Input Prices and Alternative SuppliersIn general, there are two options a company can pursue to reduce the impact of future raw material price rises:
Search for an alternative supplier by building relationships;
Vertical (or backward) integration.
Due to regulatory restrictions, Indian sugar companies follow a command area concept; farmers may choose their customers, but sugar manufacturing companies may not choose their suppliers.
Vertical IntegrationUnlike Brazilian sugar companies which have backward integrated their manufacturing pro-cess by purchasing cane farms, Indian sugar companies have not followed this practice. This poses a high risk for BCML’s operations as its raw material sourcing is not fixed.
We conclude that positive impacts of vertical integration on the company would be two-fold:
Raw material sourcing: Ideal raw material sourcing at the statutory minimum price (set by the government).
Optimum irrigation: The ability to install better (i.e. drip) irrigation facilities in the source farms, thus ensuring better control of water supply to crops and a good crop yield with high recovery.
While vertical integration may be beneficial, however, procuring land and farmers may be difficult due to the small, fragmented nature of fields and to political obstacles. Vertical integration could also pose risks if sourcing is not diversified geographically, since negative yield impacts would not be absorbed by third party suppliers.
Likely scenario over short term: We believe that cane availability over the short term i.e. FY10 (September 2009–October 2010) would remain constrained, as in the previous year. Lower availability of raw material is therefore a likely scenario for the very near future And hence we believe that cane costs would be higher in FY10. However, actual feedstock prices may prove to be even higher than our estimates, if the supply constraints exceed our expec-tations or producers of competitive products are willing to pay higher prices to cane farmers, leading to pressure on the earnings.
CORPORATE SUSTAINABILITY OUTLOOK
Over the years BCML has diversified its business segmentation from sugar to distillery (eth-anol, alcohol) to co-generation (for captive consumption and external sales). These latter two business segments are more profitable and less volatile vis-à-vis the sugar business, promoting the company’s sustainability. We believe the following measures would help the
W E E D I N G R I S K
56 World Resources Institute
HS
BC
CA
SE
ST
UD
Y
company further reduce some of the business risks it faces in relation to environmental trends:
Establish sugar refining capacities: India is the second largest sugar producer in the world and has the advantage of being located in the vicinity of sugar importing coun-tries. During periods of surplus domestic production, the company can cater to the needs of Asian sugar importing countries.
BCML can expand operations using the leasing model (generally non-integrated sugar plants) thereby reducing its capital investments.
The company can diversify operations outside the state of Uttar Pradesh, where it is cur-rently based, into states like Maharashtra, where cane prices are better linked with sugar prices. This would also spread the risks faced by the company due to environmental fac-tors.
V I I . N E X T S T E P S
57World Resources Institute
VII: Next Steps
The potential financial impacts of climate change and water scarcity on the food and bever-age sector are significant. Analysts and investors should examine how the companies they cover and invest in are positioned to manage risks and take advantage of opportunities arising from these two environmental trends.
Fully incorporating climate change and water scarcity concerns into the investment decision-making process remains a challenge.
Obstacles to understanding the full financial impact of climate change and water scarcity trends include:
Lack of data: Obtaining reliable information on local climate change trends and projec-tions, soil fertility levels and water table levels is difficult in many areas.
Uncertain nature of issues: Climate change and water scarcity impacts are difficult to predict, even with good data. Especially challenging is the inability to predicting the tim-ing of potential impacts, making it very difficult to incorporate them into a discounted cash flow (DCF) model or other longer-term analysis in order to determine the financial magnitude of impacts.
Communicating with companies: Climate change and water scarcity issues are unlike many of the compliance-based environmental regulations that companies are used to dealing with. As a result, it may be difficult to engage companies to obtain relevant information. For example, obtaining data on local water availability requires mapping with geographical information systems (GIS) technology, which many companies are not actively using at present.
Investors and analysts can engage with companies to publicly disclose relevant environ-mental data.
Although companies around the globe are beginning to disclose information on environmen-tal performance, some of it quite detailed and sophisticated, the information disclosed rare-ly reveals the risks companies are truly facing. In order to make an accurate assessment of a company’s risk exposure to environmental issues, investors and analysts will have to engage companies to begin measuring and reporting with more depth and context on envi-ronmental risks than is currently common practice.
Although this report focused on two key environmental trends, the food and beverage sector in South and Southeast Asia also faces other environmental challenges.
Additional environmental issues with the potential for financial impacts on the F&B sector, of which investors need to be aware, include:
Energy: The sector’s agricultural practices, processing, packaging and distribution (espe-cially to overseas markets) are fossil fuel-intensive. Companies’ dependence on fossil fuel derived energy sources is problematic as governments scale back energy subsidies
W E E D I N G R I S K
58 World Resources Institute
amid volatility in global prices (as evidenced in India, Indonesia and Malaysia). The sec-tor’s dependence on fossil fuels, coupled with the common practice of turning forests into agricultural land, make it a significant emitter of GHGs. In a carbon constrained global economy, the industry will be forced to redesign its processes and practices. A shift towards cleaner sources of energy, especially on-site, could help mitigate these risks.
Land and water management: Cultivation techniques in both agriculture and aquaculture have made plant and animal yields vulnerable. In agriculture, the over-reliance on fertil-izer and pesticides contaminates local water supplies and degrades soil. In addition, mono cropping - growing the same one variety of crop every year on the same land - makes the crop more susceptible to disease. In aquaculture, the overuse of antibiotics pollutes the water while over harvesting decreases the fish stock. If agricultural and aquaculture yields are to increase to feed the growing world population, the food system is unlikely to be able to meet that demand with current practices.
Waste and pollution: Waste (especially from packaging), and pollution (of air, water and land) from the food and beverage sector is significant. Land and water pollution in par-ticular threatens the yields of suppliers as they degrade the local soil and water quality on which yields are dependent.
Corporate responses to environmental issues serve as a good proxy for overall manage-ment quality.
Leading companies will find ways to build corporate and supply chain resilience to potential risks. Climate change and water scarcity have the potential to impact the F&B sector’s core value drivers. Companies with good leadership should develop and implement risk mitiga-tion and hedging strategies that protect core value drivers from long-term threats. Such actions might include strategic and operational changes to protect against physical impacts like flooding; policy responses such as water rationing; and consumer responses such as favoring responsibly produced goods. Companies that understand the risks they are facing, and are actively building their resilience to the impacts, are better long-term investments.
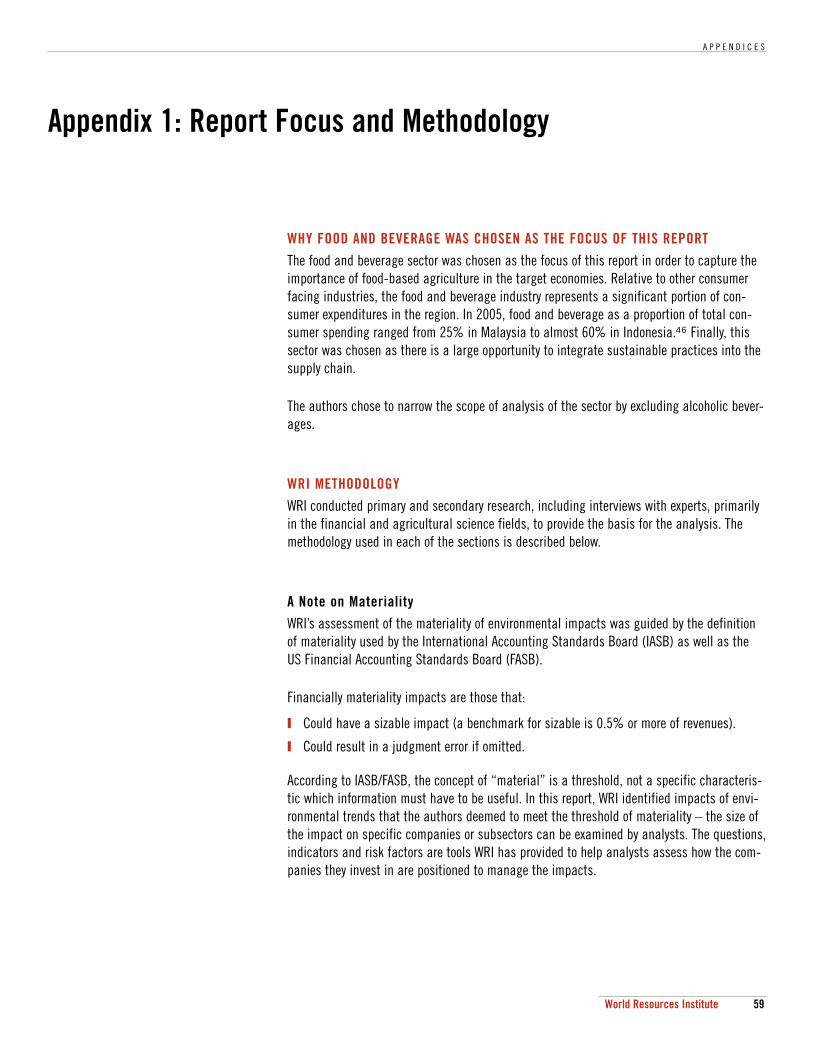
A P P E N D I C E S
59World Resources Institute
Appendix 1: Report Focus and Methodology
WHY FOOD AND BEVERAGE WAS CHOSEN AS THE FOCUS OF THIS REPORT
The food and beverage sector was chosen as the focus of this report in order to capture the importance of food-based agriculture in the target economies. Relative to other consumer facing industries, the food and beverage industry represents a significant portion of con-sumer expenditures in the region. In 2005, food and beverage as a proportion of total con-sumer spending ranged from 25% in Malaysia to almost 60% in Indonesia.46 Finally, this sector was chosen as there is a large opportunity to integrate sustainable practices into the supply chain.
The authors chose to narrow the scope of analysis of the sector by excluding alcoholic bever-ages.
WRI METHODOLOGY
WRI conducted primary and secondary research, including interviews with experts, primarily in the financial and agricultural science fields, to provide the basis for the analysis. The methodology used in each of the sections is described below.
A Note on Materiality
WRI’s assessment of the materiality of environmental impacts was guided by the definition of materiality used by the International Accounting Standards Board (IASB) as well as the US Financial Accounting Standards Board (FASB).
Financially materiality impacts are those that:
Could have a sizable impact (a benchmark for sizable is 0.5% or more of revenues).
Could result in a judgment error if omitted.
According to IASB/FASB, the concept of “material” is a threshold, not a specific characteris-tic which information must have to be useful. In this report, WRI identified impacts of envi-ronmental trends that the authors deemed to meet the threshold of materiality – the size of the impact on specific companies or subsectors can be examined by analysts. The questions, indicators and risk factors are tools WRI has provided to help analysts assess how the com-panies they invest in are positioned to manage the impacts.
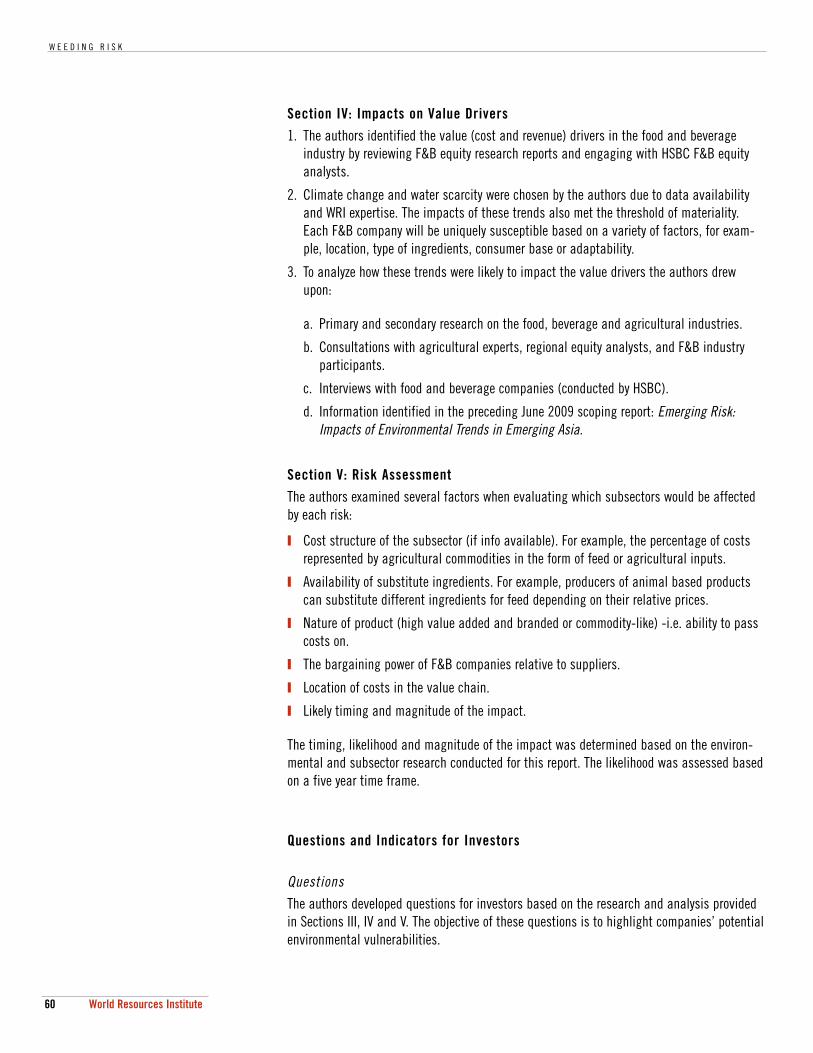
W E E D I N G R I S K
60 World Resources Institute
Section IV: Impacts on Value Drivers
1. The authors identified the value (cost and revenue) drivers in the food and beverage industry by reviewing F&B equity research reports and engaging with HSBC F&B equity analysts.
2. Climate change and water scarcity were chosen by the authors due to data availability and WRI expertise. The impacts of these trends also met the threshold of materiality. Each F&B company will be uniquely susceptible based on a variety of factors, for exam-ple, location, type of ingredients, consumer base or adaptability.
3. To analyze how these trends were likely to impact the value drivers the authors drew upon:
a. Primary and secondary research on the food, beverage and agricultural industries.
b. Consultations with agricultural experts, regional equity analysts, and F&B industry participants.
c. Interviews with food and beverage companies (conducted by HSBC).
d. Information identified in the preceding June 2009 scoping report: Emerging Risk: Impacts of Environmental Trends in Emerging Asia.
Section V: Risk Assessment
The authors examined several factors when evaluating which subsectors would be affected by each risk:
Cost structure of the subsector (if info available). For example, the percentage of costs represented by agricultural commodities in the form of feed or agricultural inputs.
Availability of substitute ingredients. For example, producers of animal based products can substitute different ingredients for feed depending on their relative prices.
Nature of product (high value added and branded or commodity-like) -i.e. ability to pass costs on.
The bargaining power of F&B companies relative to suppliers.
Location of costs in the value chain.
Likely timing and magnitude of the impact.
The timing, likelihood and magnitude of the impact was determined based on the environ-mental and subsector research conducted for this report. The likelihood was assessed based on a five year time frame.
Questions and Indicators for Investors
QuestionsThe authors developed questions for investors based on the research and analysis provided in Sections III, IV and V. The objective of these questions is to highlight companies’ potential environmental vulnerabilities.
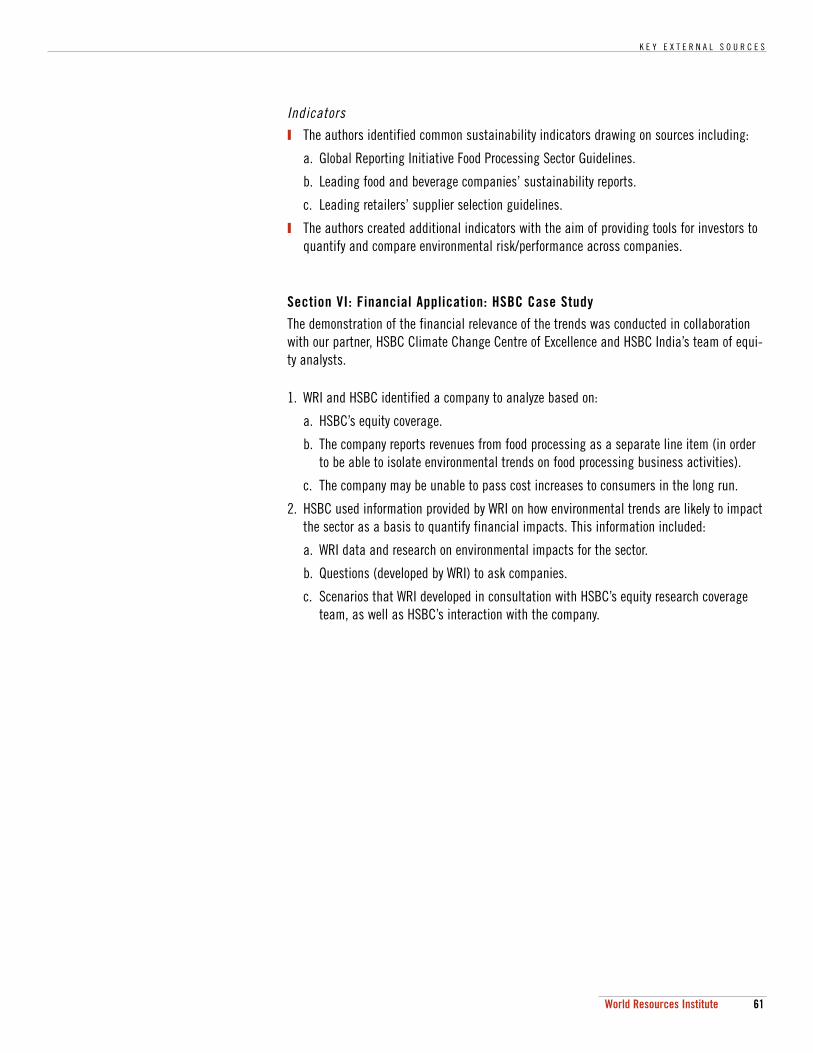
K E Y E X T E R N A L S O U R C E S
61World Resources Institute
Indicators The authors identified common sustainability indicators drawing on sources including:
a. Global Reporting Initiative Food Processing Sector Guidelines.
b. Leading food and beverage companies’ sustainability reports.
c. Leading retailers’ supplier selection guidelines.
The authors created additional indicators with the aim of providing tools for investors to quantify and compare environmental risk/performance across companies.
Section VI: Financial Application: HSBC Case Study
The demonstration of the financial relevance of the trends was conducted in collaboration with our partner, HSBC Climate Change Centre of Excellence and HSBC India’s team of equi-ty analysts.
1. WRI and HSBC identified a company to analyze based on:
a. HSBC’s equity coverage.
b. The company reports revenues from food processing as a separate line item (in order to be able to isolate environmental trends on food processing business activities).
c. The company may be unable to pass cost increases to consumers in the long run.
2. HSBC used information provided by WRI on how environmental trends are likely to impact the sector as a basis to quantify financial impacts. This information included:
a. WRI data and research on environmental impacts for the sector.
b. Questions (developed by WRI) to ask companies.
c. Scenarios that WRI developed in consultation with HSBC’s equity research coverage team, as well as HSBC’s interaction with the company.
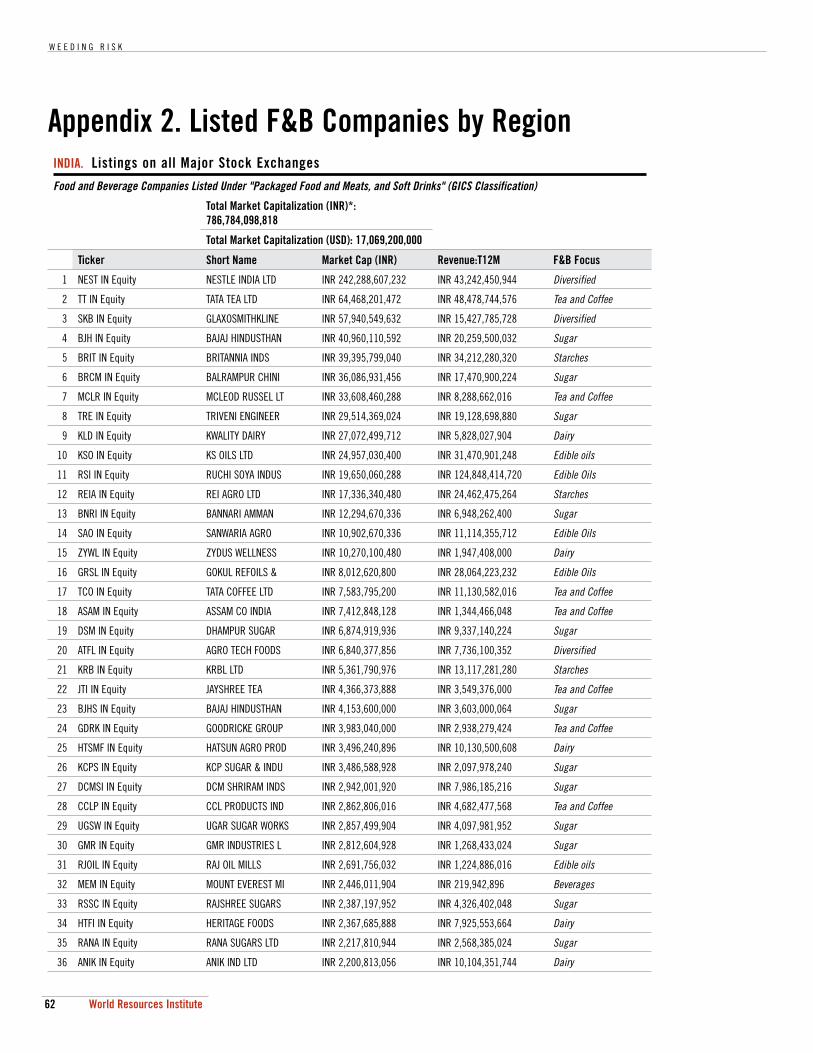
W E E D I N G R I S K
62 World Resources Institute
INDIA. Listings on all Major Stock Exchanges
Food and Beverage Companies Listed Under "Packaged Food and Meats, and Soft Drinks" (GICS Classification)
Total Market Capitalization (INR)*: 786,784,098,818
Total Market Capitalization (USD): 17,069,200,000
Ticker Short Name Market Cap (INR) Revenue:T12M F&B Focus
1 NEST IN Equity NESTLE INDIA LTD INR 242,288,607,232 INR 43,242,450,944 Diversified
2 TT IN Equity TATA TEA LTD INR 64,468,201,472 INR 48,478,744,576 Tea and Coffee
3 SKB IN Equity GLAXOSMITHKLINE INR 57,940,549,632 INR 15,427,785,728 Diversified
4 BJH IN Equity BAJAJ HINDUSTHAN INR 40,960,110,592 INR 20,259,500,032 Sugar
5 BRIT IN Equity BRITANNIA INDS INR 39,395,799,040 INR 34,212,280,320 Starches
6 BRCM IN Equity BALRAMPUR CHINI INR 36,086,931,456 INR 17,470,900,224 Sugar
7 MCLR IN Equity MCLEOD RUSSEL LT INR 33,608,460,288 INR 8,288,662,016 Tea and Coffee
8 TRE IN Equity TRIVENI ENGINEER INR 29,514,369,024 INR 19,128,698,880 Sugar
9 KLD IN Equity KWALITY DAIRY INR 27,072,499,712 INR 5,828,027,904 Dairy
10 KSO IN Equity KS OILS LTD INR 24,957,030,400 INR 31,470,901,248 Edible oils
11 RSI IN Equity RUCHI SOYA INDUS INR 19,650,060,288 INR 124,848,414,720 Edible Oils
12 REIA IN Equity REI AGRO LTD INR 17,336,340,480 INR 24,462,475,264 Starches
13 BNRI IN Equity BANNARI AMMAN INR 12,294,670,336 INR 6,948,262,400 Sugar
14 SAO IN Equity SANWARIA AGRO INR 10,902,670,336 INR 11,114,355,712 Edible Oils
15 ZYWL IN Equity ZYDUS WELLNESS INR 10,270,100,480 INR 1,947,408,000 Dairy
16 GRSL IN Equity GOKUL REFOILS & INR 8,012,620,800 INR 28,064,223,232 Edible Oils
17 TCO IN Equity TATA COFFEE LTD INR 7,583,795,200 INR 11,130,582,016 Tea and Coffee
18 ASAM IN Equity ASSAM CO INDIA INR 7,412,848,128 INR 1,344,466,048 Tea and Coffee
19 DSM IN Equity DHAMPUR SUGAR INR 6,874,919,936 INR 9,337,140,224 Sugar
20 ATFL IN Equity AGRO TECH FOODS INR 6,840,377,856 INR 7,736,100,352 Diversified
21 KRB IN Equity KRBL LTD INR 5,361,790,976 INR 13,117,281,280 Starches
22 JTI IN Equity JAYSHREE TEA INR 4,366,373,888 INR 3,549,376,000 Tea and Coffee
23 BJHS IN Equity BAJAJ HINDUSTHAN INR 4,153,600,000 INR 3,603,000,064 Sugar
24 GDRK IN Equity GOODRICKE GROUP INR 3,983,040,000 INR 2,938,279,424 Tea and Coffee
25 HTSMF IN Equity HATSUN AGRO PROD INR 3,496,240,896 INR 10,130,500,608 Dairy
26 KCPS IN Equity KCP SUGAR & INDU INR 3,486,588,928 INR 2,097,978,240 Sugar
27 DCMSI IN Equity DCM SHRIRAM INDS INR 2,942,001,920 INR 7,986,185,216 Sugar
28 CCLP IN Equity CCL PRODUCTS IND INR 2,862,806,016 INR 4,682,477,568 Tea and Coffee
29 UGSW IN Equity UGAR SUGAR WORKS INR 2,857,499,904 INR 4,097,981,952 Sugar
30 GMR IN Equity GMR INDUSTRIES L INR 2,812,604,928 INR 1,268,433,024 Sugar
31 RJOIL IN Equity RAJ OIL MILLS INR 2,691,756,032 INR 1,224,886,016 Edible oils
32 MEM IN Equity MOUNT EVEREST MI INR 2,446,011,904 INR 219,942,896 Beverages
33 RSSC IN Equity RAJSHREE SUGARS INR 2,387,197,952 INR 4,326,402,048 Sugar
34 HTFI IN Equity HERITAGE FOODS INR 2,367,685,888 INR 7,925,553,664 Dairy
35 RANA IN Equity RANA SUGARS LTD INR 2,217,810,944 INR 2,568,385,024 Sugar
36 ANIK IN Equity ANIK IND LTD INR 2,200,813,056 INR 10,104,351,744 Dairy
Appendix 2. Listed F&B Companies by Region
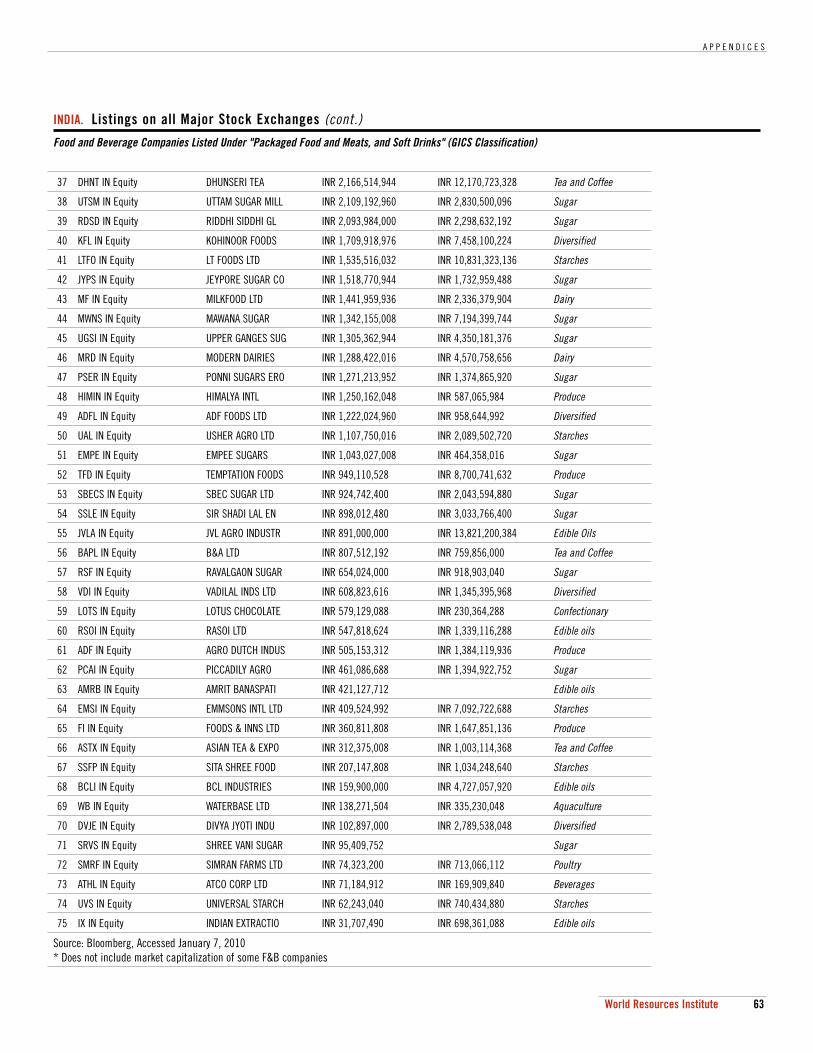
A P P E N D I C E S
63World Resources Institute
37 DHNT IN Equity DHUNSERI TEA INR 2,166,514,944 INR 12,170,723,328 Tea and Coffee
38 UTSM IN Equity UTTAM SUGAR MILL INR 2,109,192,960 INR 2,830,500,096 Sugar
39 RDSD IN Equity RIDDHI SIDDHI GL INR 2,093,984,000 INR 2,298,632,192 Sugar
40 KFL IN Equity KOHINOOR FOODS INR 1,709,918,976 INR 7,458,100,224 Diversified
41 LTFO IN Equity LT FOODS LTD INR 1,535,516,032 INR 10,831,323,136 Starches
42 JYPS IN Equity JEYPORE SUGAR CO INR 1,518,770,944 INR 1,732,959,488 Sugar
43 MF IN Equity MILKFOOD LTD INR 1,441,959,936 INR 2,336,379,904 Dairy
44 MWNS IN Equity MAWANA SUGAR INR 1,342,155,008 INR 7,194,399,744 Sugar
45 UGSI IN Equity UPPER GANGES SUG INR 1,305,362,944 INR 4,350,181,376 Sugar
46 MRD IN Equity MODERN DAIRIES INR 1,288,422,016 INR 4,570,758,656 Dairy
47 PSER IN Equity PONNI SUGARS ERO INR 1,271,213,952 INR 1,374,865,920 Sugar
48 HIMIN IN Equity HIMALYA INTL INR 1,250,162,048 INR 587,065,984 Produce
49 ADFL IN Equity ADF FOODS LTD INR 1,222,024,960 INR 958,644,992 Diversified
50 UAL IN Equity USHER AGRO LTD INR 1,107,750,016 INR 2,089,502,720 Starches
51 EMPE IN Equity EMPEE SUGARS INR 1,043,027,008 INR 464,358,016 Sugar
52 TFD IN Equity TEMPTATION FOODS INR 949,110,528 INR 8,700,741,632 Produce
53 SBECS IN Equity SBEC SUGAR LTD INR 924,742,400 INR 2,043,594,880 Sugar
54 SSLE IN Equity SIR SHADI LAL EN INR 898,012,480 INR 3,033,766,400 Sugar
55 JVLA IN Equity JVL AGRO INDUSTR INR 891,000,000 INR 13,821,200,384 Edible Oils
56 BAPL IN Equity B&A LTD INR 807,512,192 INR 759,856,000 Tea and Coffee
57 RSF IN Equity RAVALGAON SUGAR INR 654,024,000 INR 918,903,040 Sugar
58 VDI IN Equity VADILAL INDS LTD INR 608,823,616 INR 1,345,395,968 Diversified
59 LOTS IN Equity LOTUS CHOCOLATE INR 579,129,088 INR 230,364,288 Confectionary
60 RSOI IN Equity RASOI LTD INR 547,818,624 INR 1,339,116,288 Edible oils
61 ADF IN Equity AGRO DUTCH INDUS INR 505,153,312 INR 1,384,119,936 Produce
62 PCAI IN Equity PICCADILY AGRO INR 461,086,688 INR 1,394,922,752 Sugar
63 AMRB IN Equity AMRIT BANASPATI INR 421,127,712 Edible oils
64 EMSI IN Equity EMMSONS INTL LTD INR 409,524,992 INR 7,092,722,688 Starches
65 FI IN Equity FOODS & INNS LTD INR 360,811,808 INR 1,647,851,136 Produce
66 ASTX IN Equity ASIAN TEA & EXPO INR 312,375,008 INR 1,003,114,368 Tea and Coffee
67 SSFP IN Equity SITA SHREE FOOD INR 207,147,808 INR 1,034,248,640 Starches
68 BCLI IN Equity BCL INDUSTRIES INR 159,900,000 INR 4,727,057,920 Edible oils
69 WB IN Equity WATERBASE LTD INR 138,271,504 INR 335,230,048 Aquaculture
70 DVJE IN Equity DIVYA JYOTI INDU INR 102,897,000 INR 2,789,538,048 Diversified
71 SRVS IN Equity SHREE VANI SUGAR INR 95,409,752 Sugar
72 SMRF IN Equity SIMRAN FARMS LTD INR 74,323,200 INR 713,066,112 Poultry
73 ATHL IN Equity ATCO CORP LTD INR 71,184,912 INR 169,909,840 Beverages
74 UVS IN Equity UNIVERSAL STARCH INR 62,243,040 INR 740,434,880 Starches
75 IX IN Equity INDIAN EXTRACTIO INR 31,707,490 INR 698,361,088 Edible oils
Source: Bloomberg, Accessed January 7, 2010* Does not include market capitalization of some F&B companies
INDIA. Listings on all Major Stock Exchanges (cont.)
Food and Beverage Companies Listed Under "Packaged Food and Meats, and Soft Drinks" (GICS Classification)
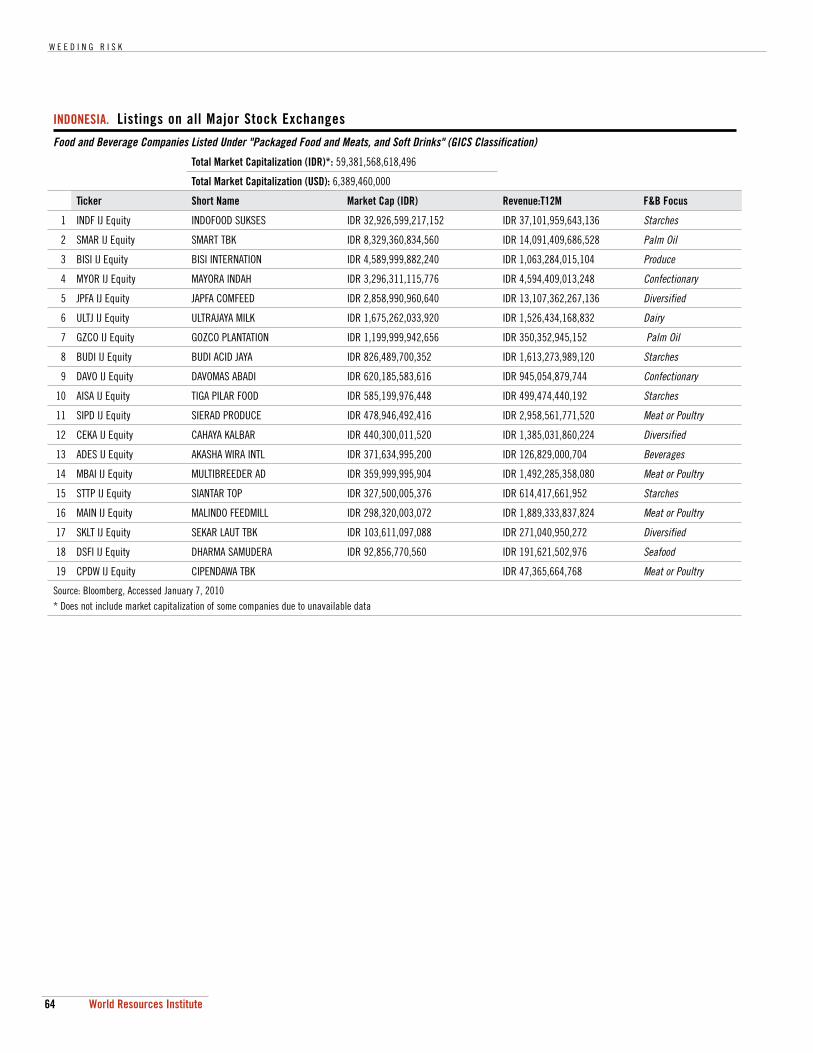
W E E D I N G R I S K
64 World Resources Institute
INDONESIA. Listings on all Major Stock Exchanges
Food and Beverage Companies Listed Under "Packaged Food and Meats, and Soft Drinks" (GICS Classification)
Total Market Capitalization (IDR)*: 59,381,568,618,496
Total Market Capitalization (USD): 6,389,460,000
Ticker Short Name Market Cap (IDR) Revenue:T12M F&B Focus
1 INDF IJ Equity INDOFOOD SUKSES IDR 32,926,599,217,152 IDR 37,101,959,643,136 Starches
2 SMAR IJ Equity SMART TBK IDR 8,329,360,834,560 IDR 14,091,409,686,528 Palm Oil
3 BISI IJ Equity BISI INTERNATION IDR 4,589,999,882,240 IDR 1,063,284,015,104 Produce
4 MYOR IJ Equity MAYORA INDAH IDR 3,296,311,115,776 IDR 4,594,409,013,248 Confectionary
5 JPFA IJ Equity JAPFA COMFEED IDR 2,858,990,960,640 IDR 13,107,362,267,136 Diversified
6 ULTJ IJ Equity ULTRAJAYA MILK IDR 1,675,262,033,920 IDR 1,526,434,168,832 Dairy
7 GZCO IJ Equity GOZCO PLANTATION IDR 1,199,999,942,656 IDR 350,352,945,152 Palm Oil
8 BUDI IJ Equity BUDI ACID JAYA IDR 826,489,700,352 IDR 1,613,273,989,120 Starches
9 DAVO IJ Equity DAVOMAS ABADI IDR 620,185,583,616 IDR 945,054,879,744 Confectionary
10 AISA IJ Equity TIGA PILAR FOOD IDR 585,199,976,448 IDR 499,474,440,192 Starches
11 SIPD IJ Equity SIERAD PRODUCE IDR 478,946,492,416 IDR 2,958,561,771,520 Meat or Poultry
12 CEKA IJ Equity CAHAYA KALBAR IDR 440,300,011,520 IDR 1,385,031,860,224 Diversified
13 ADES IJ Equity AKASHA WIRA INTL IDR 371,634,995,200 IDR 126,829,000,704 Beverages
14 MBAI IJ Equity MULTIBREEDER AD IDR 359,999,995,904 IDR 1,492,285,358,080 Meat or Poultry
15 STTP IJ Equity SIANTAR TOP IDR 327,500,005,376 IDR 614,417,661,952 Starches
16 MAIN IJ Equity MALINDO FEEDMILL IDR 298,320,003,072 IDR 1,889,333,837,824 Meat or Poultry
17 SKLT IJ Equity SEKAR LAUT TBK IDR 103,611,097,088 IDR 271,040,950,272 Diversified
18 DSFI IJ Equity DHARMA SAMUDERA IDR 92,856,770,560 IDR 191,621,502,976 Seafood
19 CPDW IJ Equity CIPENDAWA TBK IDR 47,365,664,768 Meat or Poultry
Source: Bloomberg, Accessed January 7, 2010* Does not include market capitalization of some companies due to unavailable data
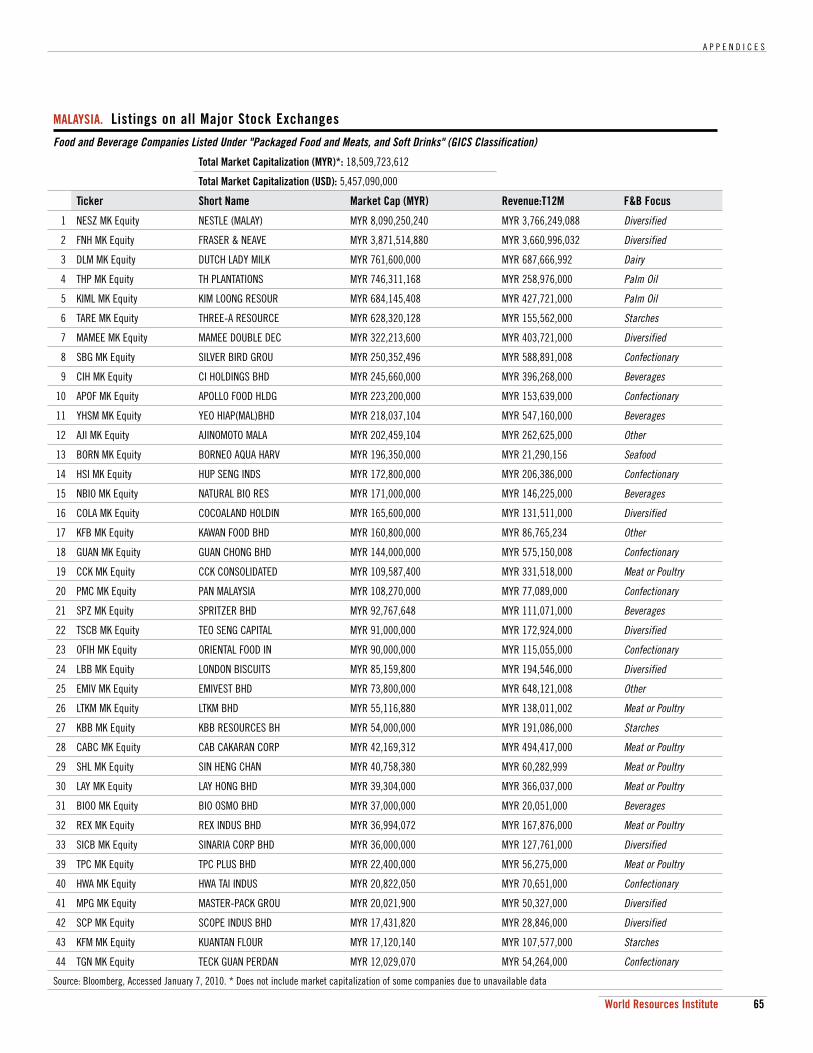
A P P E N D I C E S
65World Resources Institute
MALAYSIA. Listings on all Major Stock Exchanges
Food and Beverage Companies Listed Under "Packaged Food and Meats, and Soft Drinks" (GICS Classification)
Total Market Capitalization (MYR)*: 18,509,723,612
Total Market Capitalization (USD): 5,457,090,000
Ticker Short Name Market Cap (MYR) Revenue:T12M F&B Focus
1 NESZ MK Equity NESTLE (MALAY) MYR 8,090,250,240 MYR 3,766,249,088 Diversified
2 FNH MK Equity FRASER & NEAVE MYR 3,871,514,880 MYR 3,660,996,032 Diversified
3 DLM MK Equity DUTCH LADY MILK MYR 761,600,000 MYR 687,666,992 Dairy
4 THP MK Equity TH PLANTATIONS MYR 746,311,168 MYR 258,976,000 Palm Oil
5 KIML MK Equity KIM LOONG RESOUR MYR 684,145,408 MYR 427,721,000 Palm Oil
6 TARE MK Equity THREE-A RESOURCE MYR 628,320,128 MYR 155,562,000 Starches
7 MAMEE MK Equity MAMEE DOUBLE DEC MYR 322,213,600 MYR 403,721,000 Diversified
8 SBG MK Equity SILVER BIRD GROU MYR 250,352,496 MYR 588,891,008 Confectionary
9 CIH MK Equity CI HOLDINGS BHD MYR 245,660,000 MYR 396,268,000 Beverages
10 APOF MK Equity APOLLO FOOD HLDG MYR 223,200,000 MYR 153,639,000 Confectionary
11 YHSM MK Equity YEO HIAP(MAL)BHD MYR 218,037,104 MYR 547,160,000 Beverages
12 AJI MK Equity AJINOMOTO MALA MYR 202,459,104 MYR 262,625,000 Other
13 BORN MK Equity BORNEO AQUA HARV MYR 196,350,000 MYR 21,290,156 Seafood
14 HSI MK Equity HUP SENG INDS MYR 172,800,000 MYR 206,386,000 Confectionary
15 NBIO MK Equity NATURAL BIO RES MYR 171,000,000 MYR 146,225,000 Beverages
16 COLA MK Equity COCOALAND HOLDIN MYR 165,600,000 MYR 131,511,000 Diversified
17 KFB MK Equity KAWAN FOOD BHD MYR 160,800,000 MYR 86,765,234 Other
18 GUAN MK Equity GUAN CHONG BHD MYR 144,000,000 MYR 575,150,008 Confectionary
19 CCK MK Equity CCK CONSOLIDATED MYR 109,587,400 MYR 331,518,000 Meat or Poultry
20 PMC MK Equity PAN MALAYSIA MYR 108,270,000 MYR 77,089,000 Confectionary
21 SPZ MK Equity SPRITZER BHD MYR 92,767,648 MYR 111,071,000 Beverages
22 TSCB MK Equity TEO SENG CAPITAL MYR 91,000,000 MYR 172,924,000 Diversified
23 OFIH MK Equity ORIENTAL FOOD IN MYR 90,000,000 MYR 115,055,000 Confectionary
24 LBB MK Equity LONDON BISCUITS MYR 85,159,800 MYR 194,546,000 Diversified
25 EMIV MK Equity EMIVEST BHD MYR 73,800,000 MYR 648,121,008 Other
26 LTKM MK Equity LTKM BHD MYR 55,116,880 MYR 138,011,002 Meat or Poultry
27 KBB MK Equity KBB RESOURCES BH MYR 54,000,000 MYR 191,086,000 Starches
28 CABC MK Equity CAB CAKARAN CORP MYR 42,169,312 MYR 494,417,000 Meat or Poultry
29 SHL MK Equity SIN HENG CHAN MYR 40,758,380 MYR 60,282,999 Meat or Poultry
30 LAY MK Equity LAY HONG BHD MYR 39,304,000 MYR 366,037,000 Meat or Poultry
31 BIOO MK Equity BIO OSMO BHD MYR 37,000,000 MYR 20,051,000 Beverages
32 REX MK Equity REX INDUS BHD MYR 36,994,072 MYR 167,876,000 Meat or Poultry
33 SICB MK Equity SINARIA CORP BHD MYR 36,000,000 MYR 127,761,000 Diversified
39 TPC MK Equity TPC PLUS BHD MYR 22,400,000 MYR 56,275,000 Meat or Poultry
40 HWA MK Equity HWA TAI INDUS MYR 20,822,050 MYR 70,651,000 Confectionary
41 MPG MK Equity MASTER-PACK GROU MYR 20,021,900 MYR 50,327,000 Diversified
42 SCP MK Equity SCOPE INDUS BHD MYR 17,431,820 MYR 28,846,000 Diversified
43 KFM MK Equity KUANTAN FLOUR MYR 17,120,140 MYR 107,577,000 Starches
44 TGN MK Equity TECK GUAN PERDAN MYR 12,029,070 MYR 54,264,000 Confectionary
Source: Bloomberg, Accessed January 7, 2010. * Does not include market capitalization of some companies due to unavailable data
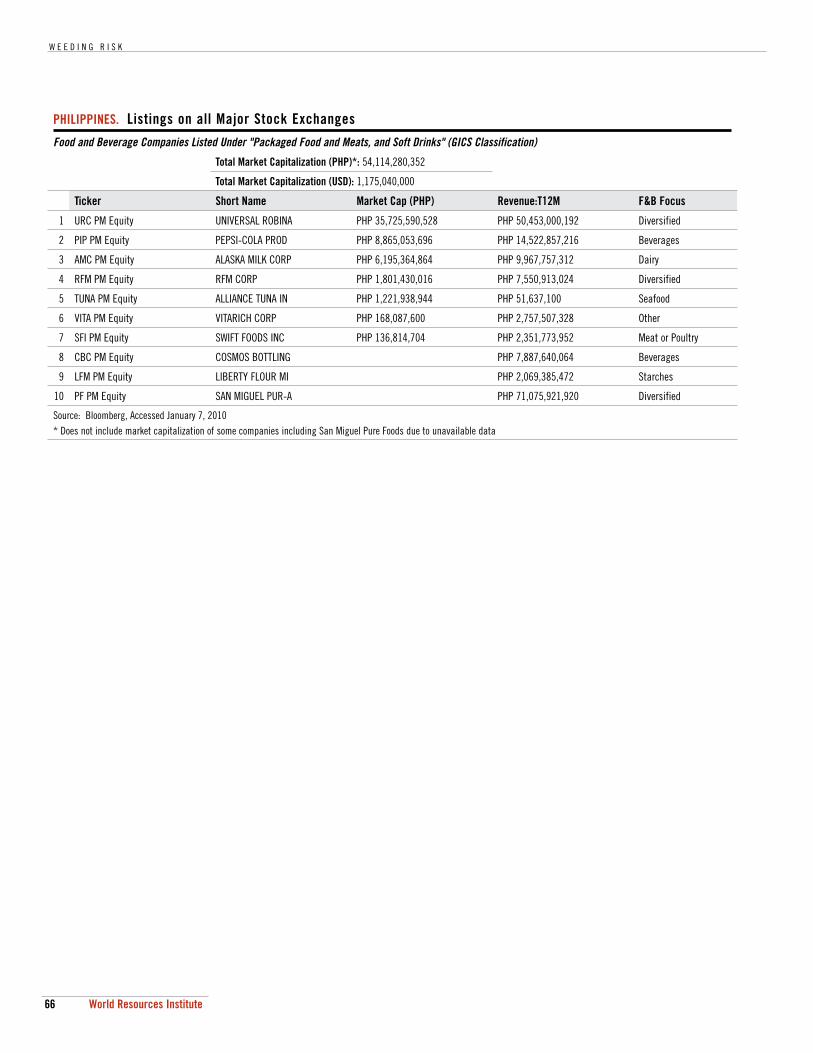
W E E D I N G R I S K
66 World Resources Institute
PHILIPPINES. Listings on all Major Stock Exchanges
Food and Beverage Companies Listed Under "Packaged Food and Meats, and Soft Drinks" (GICS Classification)
Total Market Capitalization (PHP)*: 54,114,280,352
Total Market Capitalization (USD): 1,175,040,000
Ticker Short Name Market Cap (PHP) Revenue:T12M F&B Focus
1 URC PM Equity UNIVERSAL ROBINA PHP 35,725,590,528 PHP 50,453,000,192 Diversified
2 PIP PM Equity PEPSI-COLA PROD PHP 8,865,053,696 PHP 14,522,857,216 Beverages
3 AMC PM Equity ALASKA MILK CORP PHP 6,195,364,864 PHP 9,967,757,312 Dairy
4 RFM PM Equity RFM CORP PHP 1,801,430,016 PHP 7,550,913,024 Diversified
5 TUNA PM Equity ALLIANCE TUNA IN PHP 1,221,938,944 PHP 51,637,100 Seafood
6 VITA PM Equity VITARICH CORP PHP 168,087,600 PHP 2,757,507,328 Other
7 SFI PM Equity SWIFT FOODS INC PHP 136,814,704 PHP 2,351,773,952 Meat or Poultry
8 CBC PM Equity COSMOS BOTTLING PHP 7,887,640,064 Beverages
9 LFM PM Equity LIBERTY FLOUR MI PHP 2,069,385,472 Starches
10 PF PM Equity SAN MIGUEL PUR-A PHP 71,075,921,920 Diversified
Source: Bloomberg, Accessed January 7, 2010* Does not include market capitalization of some companies including San Miguel Pure Foods due to unavailable data
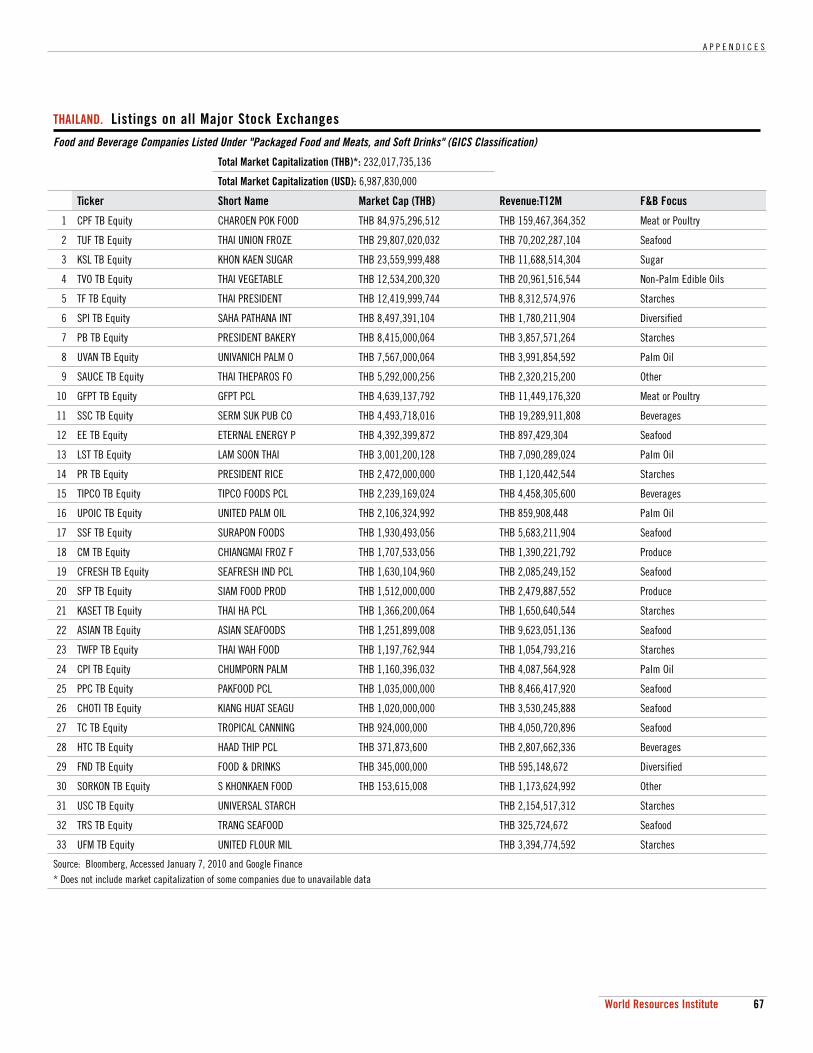
A P P E N D I C E S
67World Resources Institute
THAILAND. Listings on all Major Stock Exchanges
Food and Beverage Companies Listed Under "Packaged Food and Meats, and Soft Drinks" (GICS Classification)
Total Market Capitalization (THB)*: 232,017,735,136
Total Market Capitalization (USD): 6,987,830,000
Ticker Short Name Market Cap (THB) Revenue:T12M F&B Focus
1 CPF TB Equity CHAROEN POK FOOD THB 84,975,296,512 THB 159,467,364,352 Meat or Poultry
2 TUF TB Equity THAI UNION FROZE THB 29,807,020,032 THB 70,202,287,104 Seafood
3 KSL TB Equity KHON KAEN SUGAR THB 23,559,999,488 THB 11,688,514,304 Sugar
4 TVO TB Equity THAI VEGETABLE THB 12,534,200,320 THB 20,961,516,544 Non-Palm Edible Oils
5 TF TB Equity THAI PRESIDENT THB 12,419,999,744 THB 8,312,574,976 Starches
6 SPI TB Equity SAHA PATHANA INT THB 8,497,391,104 THB 1,780,211,904 Diversified
7 PB TB Equity PRESIDENT BAKERY THB 8,415,000,064 THB 3,857,571,264 Starches
8 UVAN TB Equity UNIVANICH PALM O THB 7,567,000,064 THB 3,991,854,592 Palm Oil
9 SAUCE TB Equity THAI THEPAROS FO THB 5,292,000,256 THB 2,320,215,200 Other
10 GFPT TB Equity GFPT PCL THB 4,639,137,792 THB 11,449,176,320 Meat or Poultry
11 SSC TB Equity SERM SUK PUB CO THB 4,493,718,016 THB 19,289,911,808 Beverages
12 EE TB Equity ETERNAL ENERGY P THB 4,392,399,872 THB 897,429,304 Seafood
13 LST TB Equity LAM SOON THAI THB 3,001,200,128 THB 7,090,289,024 Palm Oil
14 PR TB Equity PRESIDENT RICE THB 2,472,000,000 THB 1,120,442,544 Starches
15 TIPCO TB Equity TIPCO FOODS PCL THB 2,239,169,024 THB 4,458,305,600 Beverages
16 UPOIC TB Equity UNITED PALM OIL THB 2,106,324,992 THB 859,908,448 Palm Oil
17 SSF TB Equity SURAPON FOODS THB 1,930,493,056 THB 5,683,211,904 Seafood
18 CM TB Equity CHIANGMAI FROZ F THB 1,707,533,056 THB 1,390,221,792 Produce
19 CFRESH TB Equity SEAFRESH IND PCL THB 1,630,104,960 THB 2,085,249,152 Seafood
20 SFP TB Equity SIAM FOOD PROD THB 1,512,000,000 THB 2,479,887,552 Produce
21 KASET TB Equity THAI HA PCL THB 1,366,200,064 THB 1,650,640,544 Starches
22 ASIAN TB Equity ASIAN SEAFOODS THB 1,251,899,008 THB 9,623,051,136 Seafood
23 TWFP TB Equity THAI WAH FOOD THB 1,197,762,944 THB 1,054,793,216 Starches
24 CPI TB Equity CHUMPORN PALM THB 1,160,396,032 THB 4,087,564,928 Palm Oil
25 PPC TB Equity PAKFOOD PCL THB 1,035,000,000 THB 8,466,417,920 Seafood
26 CHOTI TB Equity KIANG HUAT SEAGU THB 1,020,000,000 THB 3,530,245,888 Seafood
27 TC TB Equity TROPICAL CANNING THB 924,000,000 THB 4,050,720,896 Seafood
28 HTC TB Equity HAAD THIP PCL THB 371,873,600 THB 2,807,662,336 Beverages
29 FND TB Equity FOOD & DRINKS THB 345,000,000 THB 595,148,672 Diversified
30 SORKON TB Equity S KHONKAEN FOOD THB 153,615,008 THB 1,173,624,992 Other
31 USC TB Equity UNIVERSAL STARCH THB 2,154,517,312 Starches
32 TRS TB Equity TRANG SEAFOOD THB 325,724,672 Seafood
33 UFM TB Equity UNITED FLOUR MIL THB 3,394,774,592 Starches
Source: Bloomberg, Accessed January 7, 2010 and Google Finance* Does not include market capitalization of some companies due to unavailable data
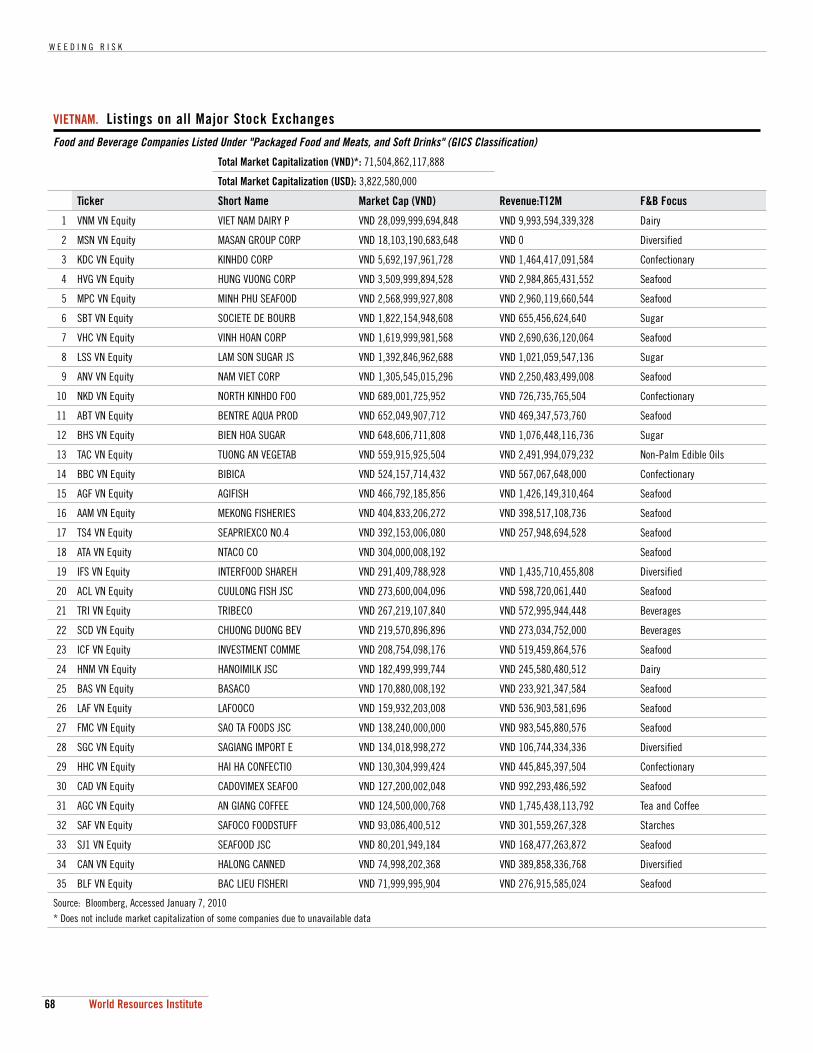
W E E D I N G R I S K
68 World Resources Institute
VIETNAM. Listings on all Major Stock Exchanges
Food and Beverage Companies Listed Under "Packaged Food and Meats, and Soft Drinks" (GICS Classification)
Total Market Capitalization (VND)*: 71,504,862,117,888
Total Market Capitalization (USD): 3,822,580,000
Ticker Short Name Market Cap (VND) Revenue:T12M F&B Focus
1 VNM VN Equity VIET NAM DAIRY P VND 28,099,999,694,848 VND 9,993,594,339,328 Dairy
2 MSN VN Equity MASAN GROUP CORP VND 18,103,190,683,648 VND 0 Diversified
3 KDC VN Equity KINHDO CORP VND 5,692,197,961,728 VND 1,464,417,091,584 Confectionary
4 HVG VN Equity HUNG VUONG CORP VND 3,509,999,894,528 VND 2,984,865,431,552 Seafood
5 MPC VN Equity MINH PHU SEAFOOD VND 2,568,999,927,808 VND 2,960,119,660,544 Seafood
6 SBT VN Equity SOCIETE DE BOURB VND 1,822,154,948,608 VND 655,456,624,640 Sugar
7 VHC VN Equity VINH HOAN CORP VND 1,619,999,981,568 VND 2,690,636,120,064 Seafood
8 LSS VN Equity LAM SON SUGAR JS VND 1,392,846,962,688 VND 1,021,059,547,136 Sugar
9 ANV VN Equity NAM VIET CORP VND 1,305,545,015,296 VND 2,250,483,499,008 Seafood
10 NKD VN Equity NORTH KINHDO FOO VND 689,001,725,952 VND 726,735,765,504 Confectionary
11 ABT VN Equity BENTRE AQUA PROD VND 652,049,907,712 VND 469,347,573,760 Seafood
12 BHS VN Equity BIEN HOA SUGAR VND 648,606,711,808 VND 1,076,448,116,736 Sugar
13 TAC VN Equity TUONG AN VEGETAB VND 559,915,925,504 VND 2,491,994,079,232 Non-Palm Edible Oils
14 BBC VN Equity BIBICA VND 524,157,714,432 VND 567,067,648,000 Confectionary
15 AGF VN Equity AGIFISH VND 466,792,185,856 VND 1,426,149,310,464 Seafood
16 AAM VN Equity MEKONG FISHERIES VND 404,833,206,272 VND 398,517,108,736 Seafood
17 TS4 VN Equity SEAPRIEXCO NO.4 VND 392,153,006,080 VND 257,948,694,528 Seafood
18 ATA VN Equity NTACO CO VND 304,000,008,192 Seafood
19 IFS VN Equity INTERFOOD SHAREH VND 291,409,788,928 VND 1,435,710,455,808 Diversified
20 ACL VN Equity CUULONG FISH JSC VND 273,600,004,096 VND 598,720,061,440 Seafood
21 TRI VN Equity TRIBECO VND 267,219,107,840 VND 572,995,944,448 Beverages
22 SCD VN Equity CHUONG DUONG BEV VND 219,570,896,896 VND 273,034,752,000 Beverages
23 ICF VN Equity INVESTMENT COMME VND 208,754,098,176 VND 519,459,864,576 Seafood
24 HNM VN Equity HANOIMILK JSC VND 182,499,999,744 VND 245,580,480,512 Dairy
25 BAS VN Equity BASACO VND 170,880,008,192 VND 233,921,347,584 Seafood
26 LAF VN Equity LAFOOCO VND 159,932,203,008 VND 536,903,581,696 Seafood
27 FMC VN Equity SAO TA FOODS JSC VND 138,240,000,000 VND 983,545,880,576 Seafood
28 SGC VN Equity SAGIANG IMPORT E VND 134,018,998,272 VND 106,744,334,336 Diversified
29 HHC VN Equity HAI HA CONFECTIO VND 130,304,999,424 VND 445,845,397,504 Confectionary
30 CAD VN Equity CADOVIMEX SEAFOO VND 127,200,002,048 VND 992,293,486,592 Seafood
31 AGC VN Equity AN GIANG COFFEE VND 124,500,000,768 VND 1,745,438,113,792 Tea and Coffee
32 SAF VN Equity SAFOCO FOODSTUFF VND 93,086,400,512 VND 301,559,267,328 Starches
33 SJ1 VN Equity SEAFOOD JSC VND 80,201,949,184 VND 168,477,263,872 Seafood
34 CAN VN Equity HALONG CANNED VND 74,998,202,368 VND 389,858,336,768 Diversified
35 BLF VN Equity BAC LIEU FISHERI VND 71,999,995,904 VND 276,915,585,024 Seafood
Source: Bloomberg, Accessed January 7, 2010* Does not include market capitalization of some companies due to unavailable data
K E Y E X T E R N A L S O U R C E S
69World Resources Institute
Key External Sources
LITERATURE
Asian Development Bank. April 2009. “The Economics of Climate Change in Southeast Asia: A Regional Review.”
Asian Development Bank. 2009. “ Building Climate Resilience in the Agriculture Sector of Asia and the Pacific.”
Jason Clay. 2004. “World Agriculture and the environment: A Commodity-by-Commodity Guide to Impacts and Practices”.
William R. Cline. 2007. “Global Warming and Agriculture: Impact Estimates by Country”.
IPCC. 2007. Contribution of Working Group II to the Fourth Assessment Report. “Climate Change 2007, Impacts, Adaptation and Vulnerability”.
Kirby et al. July 2002. “Water in Food Production and Processing: quantity and quality con-cerns”. Elsevier Science Ltd.
JPMorgan Global Equity Research. 2008. “Watching Water: A guide to evaluating corporate risks in a thirsty world”.
Rabobank. 2008. “Water Scarcity: Private Investment Opportunities in Agricultural Water Use Efficiency”.
DATA
Asian Development BankBloombergBombay Stock Exchange Bursa MalaysiaEuromonitorGoogle FinanceHo Chi Minh Stock Exchange Indonesia Stock ExchangeInternational Monetary FundNational Stock Exchange of IndiaPhilippine Stock ExchangeStock Exchange of Thailand Food and Agriculture Organization of the United NationsUnited Nations Population DivisionWorld Bank
W E E D I N G R I S K
70 World Resources Institute
INTERVIEWS
Dr. Jason Clay, Senior Vice President Market Transformation, World Wildlife Fund, USA.
Maaike Fleur, Sector Supplement Manager, Global Reporting Initiative, Netherlands.
Ralf Frank, Managing Director, Society of German Investment Professionals (DVFA), Germany.
Dr. Allan Goss, Assistant Finance Professor, Ryerson University, Canada.
Dr. Axel Hesse, Senior Consultant, SD-M Sustainable Development Management, Germany.
Maurice Landes, Senior Economist, Economic Research Service, United States Department of Agriculture (USDA), USA.
Tom Parris, Vice President, iSciences LLC, USA.
Kavita Prakash-Mani, former Vice President, Client Services, Sustainability, UK.
Simla Tokgoz, International Grain and Ethanol Analyst, Food and Agricultural Policy Research Institute (FAPRI), USA.
Ron Yachnin, Principal, Yachnin and Associates, Canada.
N O T E S
71World Resources Institute
Notes
1. USD is used throughout the report as the common currency.2. Bloomberg. Data accessed January 7, 2010.3. Regmi, Anita and Gehlhar, Mark. United States Department of Agriculture. Economic Research Service.
February 2005. “Processed Food Trade Pressured by Evolving Global Supply Chains.” 4. United States Department of Agriculture. Economic Research Service. December 2002.”Globalization of the
Soft Drink Industry.” Page 25.5. Maurice Landes. 2008. United States Department of Agriculture. Economic Research Service. “The
Environment for Agricultural and Agribusiness Investment in India.” Economic Information Bulletin Number 37.
6. Interview with Maurice Landes. Senior Economist, United States Department of Agriculture, Economic Research Service.
7. Maurice Landes. 2008. United States Department of Agriculture. Economic Research Service. “The Environment for Agricultural and Agribusiness Investment in India.” Economic Information Bulletin Number 37.
8. Anita Regmi, Hiroyuki Takeshima and Laurian Unnevehr. March 2008. “Convergence in global food demand and delivery.” United States Department of Agriculture. Economic Research Service. Page iii.
9. Regmi, Anita and Gehlhar, Mark. United States Department of Agriculture. Economic Research Service. February 2005. “Processed Food Trade Pressured by Evolving Global Supply Chains.” Page 14.
10. Pingali, Prabhu, 2004, “Westernization of Asian Diets and the transformation of food systems: Implications for research and policy.” Agricultural and Development Economics Division, The Food and Agriculture Organization of the United Nations.
11. Larry Mays. 2006. "Water resources sustainability.” McGraw-Hill USA. Page 65. 12. Asian Development Bank. April 2009. “The Economics of Climate Change in Southeast Asia: A Regional
Review.” Page 23.13. Asian Development Bank. April 2009 “The Economics of Climate Change in Southeast Asia: A Regional
Review.” Page 27.14. Contribution of Working Group II to the Fourth Assessment Report, Climate Change 2007, Impacts,
Adaptation and Vulnerability. Page 476.15. Contribution of Working Group II to the Fourth Assessment Report, Climate Change 2007, Impacts,
Adaptation and Vulnerability. Page 476.16. Intergovernmental Panel on Climate Change. 2007. “Climate Change 2007: Synthesis Report.” Page 37.17. William R. Cline. July 2007. “Global Warming and Agriculture: Impact Estimates by Country.” Page 24.18. Though the metric used in this figure tends to overstate the extent of water scarcity in urban areas and
understate it in rural areas, it is a reasonable indicator of the dependency on limited water resources in a given area.
19. Kirby et al, Water in Food Production and Processing: quantity and quality concerns, July 2002, Elsevier Science Ltd.
20. Asian Development Bank. April 2009. “The Economics of Climate Change in Southeast Asia: A Regional Review.” Page 27.
21. Contribution of Working Group II to the Fourth Assessment Report, Climate Change 2007, Impacts, Adaptation and Vulnerability. Page 475.
22. Martin Parry, Cynthia Rosenzweig and Matthew Livermore. 2005. “Climate change, global food supply and risk of hunger.” Phil. Trans. R. Soc. B 360. Page 2125.
23. William R. Cline. July 2007. “Global Warming and Agriculture: Impact Estimates by Country.” Page 26.24. Contribution of Working Group II to the Fourth Assessment Report, Climate Change 2007, Impacts,
Adaptation and Vulnerability. Page 483.
W E E D I N G R I S K
72 World Resources Institute
25. Rabobank. 2008. “Water Scarcity: Private Investment Opportunities in Agricultural Water Use Efficiency.” Page 2.
26. Contribution of Working Group II to the Fourth Assessment Report, Climate Change 2007, Impacts, Adaptation and Vulnerability. Page 471.
27. Asian Development Bank. 2009. “Building Climate Resilience in the Agriculture Sector of Asia and the Pacific.” Page 5.
28. Contribution of Working Group II to the Fourth Assessment Report, Climate Change 2007, Impacts, Adaptation and Vulnerability. Page 482.
29. Josef Schmidhuber and Francesco Tubiello. December 11, 2007. "Global food security under climate change." PNAS. Volume 104. Number 50. Page 19706.
30. JPMorgan Global Equity Research. 2008. “Watching Water: A guide to evaluating corporate risks in a thirsty world.” Page 12.
31. For more information on how water scarcity presents risks for the Power sector, see the WRI report "Over Heating: Financial Risks from Water Constraints on Power Generation".
32. Kirby et al, Water in Food Production and Processing: quantity and quality concerns. July 2002. Elsevier Science Ltd.
33. Viruses in Food: Scientific Advice to Support Risk Management Activities, World Health Organization, Microbiological Risk Assessment Series (http://www.who.int/foodsafety/publications/micro/Viruses_in_food_MRA.pdf).
34. Ibid. http://www.who.int/foodsafety/publications/micro/Viruses_in_food_MRA.pdf35. “Toxic effect: Coke sales fall by a sharp 30–40%.” The Economic Times. 8/13/03. Page 1.36. S Forman et al, “Climate change impacts and risks for animal health in Asia.” Rev Sci Tech. 2008
Aug;27(2):581-9737. S Forman et al, “Climate change impacts and risks for animal health in Asia.” Rev Sci Tech. 2008
Aug;27(2):581-9738. World Wildlife Fund. 2008. “The Palm Oil Financing Handbook: Practical guidance on responsible financing
and investing in the palm oil sector.” Page 10.39. World Resources Institute. 2009. “Climate Analysis Indicators Tool.” 40. Thomas Fairhurst and David McLaughlin. March 2009. "Sustainable Oil Palm Development on Degraded
Land in Kalimantan.” WWF, United States of America. 41. For more information about diverting palm oil plantations onto degraded land in Indonesia, see WRI’s
“Project POTICO: Palm Oil, Timber & Carbon Offsets in Indonesia” at www.wri.org/project/potico.42. Kelly Day Rubenstein, Paul Heisey, Robbin Shoemaker, John Sullivan and George Frisvold. May 2005. “Crop
Genetic Resources: An Economic Appraisal”. United States Department of Agriculture: Economic Research Service. Page iii.
43. Kelly Day Rubenstein, Paul Heisey, Robbin Shoemaker, John Sullivan and George Frisvold. May 2005. “Crop Genetic Resources: An Economic Appraisal”. United States Department of Agriculture: Economic Research Service. Page iii.
44. Jason Clay. 2004. “World Agriculture and the environment: A Commodity-by-Commodity Guide to Impacts and Practices.” Page 164.
45. Kelly Day Rubenstein, Paul Heisey, Robbin Shoemaker, John Sullivan and George Frisvold. May 2005. “Crop Genetic Resources: An Economic Appraisal.” United States Department of Agriculture: Economic Research Service. Page iii.
46. Euromonitor.

Each World Resources Institute (WRI) report represents a timely and scholarly treatment of a subject of public concern. WRI takes responsibility for choosing the study topics and guaranteeing its authors and researchers freedom of inquiry. It also solicits and responds to the guidance of advisory panels and expert reviewers. Unless otherwise stated, however, all the interpretations and findings set forth in WRI publications are those of the authors.
ISBN: 978-1-56973-741-5
Copyright 2010 World Resources Institute ©
WEEDING RISKFinancial Impacts of Climate Change and Water Scarcity on Asia’s Food and Beverage SectorIndia, Indonesia, Malaysia, Philippines, Thailand, Vietnam
WRI
Dana Krechowicz
Shally Venugopal
Amanda Sauer
HSBC
Sandeep Somani
Shipra Pandey
ISBN: 978-1-56973-741-5
ABOUT WRI
The World Resources Institute (WRI) is an environmental think tank that goes beyond research to create practical ways to protect the Earth and improve people’s lives. Our mission is to move human society to live in ways that protect the Earth’s environment for current and future generations.
Our programs meet global challenges by using knowledge to catalyze public and private action.
• To reverse damage to ecosystems. We protect the capacity of ecosystems to sustain life and prosperity.
• To expand participation in environmental decisions. We collaborate with partners worldwide to increase people’s access to information and influence over decisions about natural resources.
• To avert dangerous climate change. We promote public and private action to ensure a safe climate and a sound world economy.
• To increase prosperity while improving the environment. We challenge the private sector to grow by improving environmental and community well-being.
In all its policy research, and work with institutions, WRI tries to build bridges between ideas and actions, meshing the insights of scientifi c research, economic and institutional analyses, and practical experience with the need for open and participatory decision making.
ABOUT HSBC CLIMATE CHANGE CENTRE OF EXCELLENCEThe HSBC Climate Change Centre of Excellence was created in 2007, to help advise HSBC and its clients on the evolution and impacts of climate change. The team performs macro research on climate change science, policies and markets.
The Centre also publishes joint research pieces in collaboration with fundamental analysts, helping highlight valuation impacts of climate change. Global and country-specifi c reports highlight investment potential related to policy and market changes.
10 G Street, NESuite 800Washington, DC 20002www.wri.org