Webcast 3Q13
18
Operational and Financial Results 3rd Quarter of 2013 Conference Call / Webcast October 28 th , 2013
-
Upload
petrobras -
Category
Investor Relations
-
view
2.840 -
download
0
Transcript of Webcast 3Q13

Operational and
Financial Results
3rd Quarter of 2013
Conference Call / Webcast
October 28th, 2013
2
FORWARD-LOOKING STATEMENTS:
DISCLAIMER
The presentation may contain forward-looking statements about future
events within the meaning of Section 27A of the Securities Act of 1933, as
amended, and Section 21E of the Securities Exchange Act of 1934, as
amended, that are not based on historical facts and are not assurances of
future results. Such forward-looking statements merely reflect the
Company’s current views and estimates of future economic
circumstances, industry conditions, company performance and financial
results. Such terms as "anticipate", "believe", "expect", "forecast", "intend",
"plan", "project", "seek", "should", along with similar or analogous
expressions, are used to identify such forward-looking statements.
Readers are cautioned that these statements are only projections and may
differ materially from actual future results or events. Readers are referred
to the documents filed by the Company with the SEC, specifically the
Company’s most recent Annual Report on Form 20-F, which identify
important risk factors that could cause actual results to differ from those
contained in the forward-looking statements, including, among other
things, risks relating to general economic and business conditions,
including crude oil and other commodity prices, refining margins and
prevailing exchange rates, uncertainties inherent in making estimates of
our oil and gas reserves including recently discovered oil and gas
reserves, international and Brazilian political, economic and social
developments, receipt of governmental approvals and licenses and our
ability to obtain financing.
We undertake no obligation to publicly update or revise any
forward-looking statements, whether as a result of new
information or future events or for any other reason. Figures for
2013 on are estimates or targets.
All forward-looking statements are expressly qualified in their
entirety by this cautionary statement, and you should not place
reliance on any forward-looking statement contained in this
presentation.
NON-SEC COMPLIANT OIL AND GAS RESERVES:
CAUTIONARY STATEMENT FOR US INVESTORS
We present certain data in this presentation, such as oil and gas
resources, that we are not permitted to present in documents filed
with the United States Securities and Exchange Commission
(SEC) under new Subpart 1200 to Regulation S-K because such
terms do not qualify as proved, probable or possible reserves
under Rule 4-10(a) of Regulation S-X.
DISCLAIMER
3
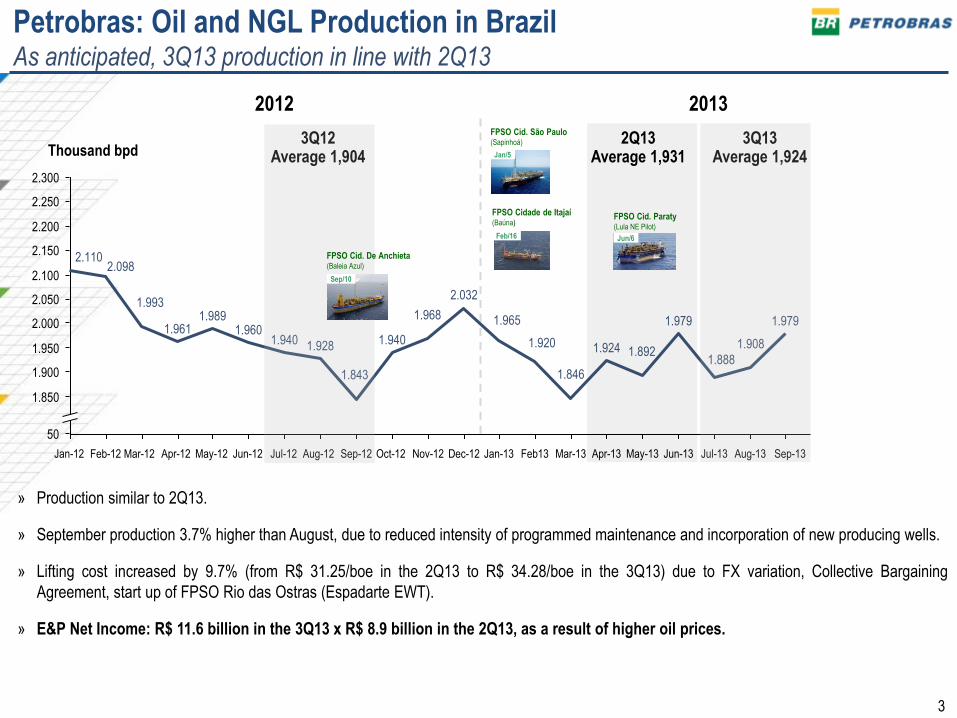
Petrobras: Oil and NGL Production in Brazil As anticipated, 3Q13 production in line with 2Q13
» Production similar to 2Q13.
» September production 3.7% higher than August, due to reduced intensity of programmed maintenance and incorporation of new producing wells.
» Lifting cost increased by 9.7% (from R$ 31.25/boe in the 2Q13 to R$ 34.28/boe in the 3Q13) due to FX variation, Collective Bargaining
Agreement, start up of FPSO Rio das Ostras (Espadarte EWT).
» E&P Net Income: R$ 11.6 billion in the 3Q13 x R$ 8.9 billion in the 2Q13, as a result of higher oil prices.
2.300
2.250
2.200
2.150
2.100
2.050
2.000
1.950
1.900
1.850
50
1.924
Mar-13
1.846
1.920
Jan-13
1.965
Dec-12
2.032
Feb13 Nov-12
1.928
Jun-12
1.940 1.940
1.843
Aug-12 Sep-12 Jul-12 May-12
1.968
Oct-12
1.960
Aug-13
1.908
Jul-13
1.888
Sep-13
1.979
Jun-13
1.979
May-13
1.892
Apr-13
1.989
Apr-12
1.961
Mar-12
1.993
Feb-12
2.098
Jan-12
2.110
Thousand bpd 3Q12
Average 1,904 2Q13
Average 1,931 3Q13
Average 1,924
FPSO Cidade de Itajaí (Baúna)
FPSO Cid. São Paulo (Sapinhoá)
FPSO Cid. De Anchieta (Baleia Azul)
2012
2013
Jan/5
Feb/16
FPSO Cid. Paraty (Lula NE Pilot)
Jun/6
Sep/10
4
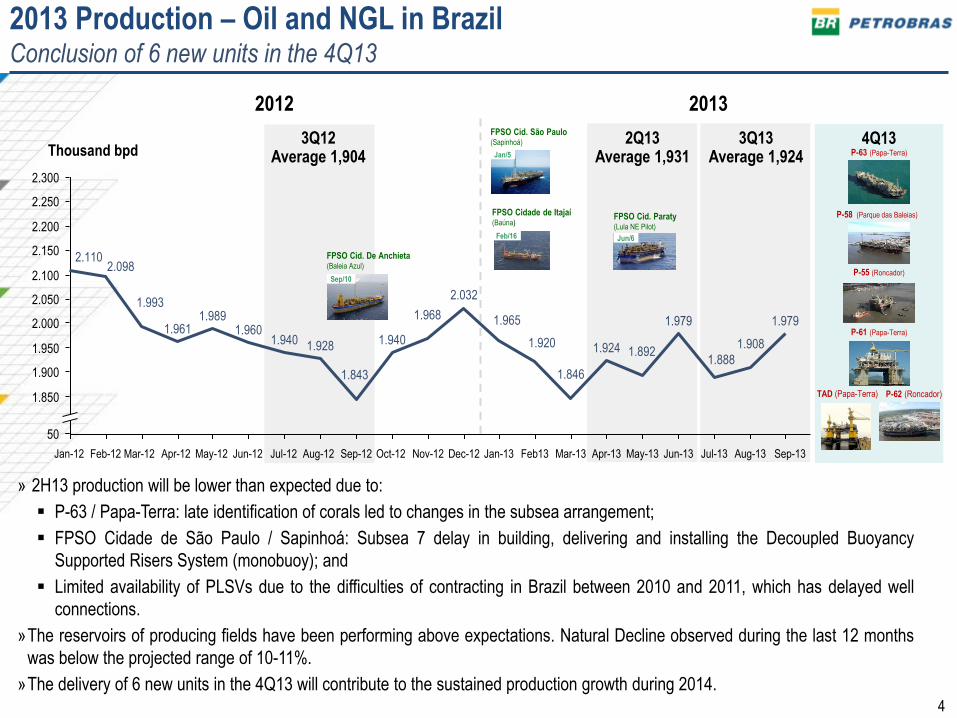
2013 Production – Oil and NGL in Brazil Conclusion of 6 new units in the 4Q13
» 2H13 production will be lower than expected due to:
P-63 / Papa-Terra: late identification of corals led to changes in the subsea arrangement;
FPSO Cidade de São Paulo / Sapinhoá: Subsea 7 delay in building, delivering and installing the Decoupled Buoyancy
Supported Risers System (monobuoy); and
Limited availability of PLSVs due to the difficulties of contracting in Brazil between 2010 and 2011, which has delayed well
connections.
»The reservoirs of producing fields have been performing above expectations. Natural Decline observed during the last 12 months
was below the projected range of 10-11%.
»The delivery of 6 new units in the 4Q13 will contribute to the sustained production growth during 2014.
2.050
2.250
2.300
2.200
2.150
2.100
2.000
1.950
1.900
1.850
50
1.979
1.908
1.888
1.979
1.892 1.924
1.846
1.920
1.965
2.032
1.968
1.940
1.843
1.928 1.940 1.960
1.989 1.961
1.993
2.098 2.110
Thousand bpd 3Q12
Average 1,904 2Q13
Average 1,931 3Q13
Average 1,924 Jan/5
FPSO Cidade de Itajaí (Baúna)
Feb/16
FPSO Cid. São Paulo (Sapinhoá)
FPSO Cid. Paraty (Lula NE Pilot)
Jun/6
4Q13
2012
FPSO Cid. De Anchieta (Baleia Azul)
Sep/10
2013
TAD (Papa-Terra)
P-63 (Papa-Terra)
P-58 (Parque das Baleias)
P-55 (Roncador)
P-61 (Papa-Terra)
P-62 (Roncador)
Mar-13 Jan-13 Dec-12 Feb13 Nov-12 Jun-12 Aug-12 Sep-12 Jul-12 May-12 Oct-12 Aug-13 Jul-13 Sep-13 Jun-13 May-13 Apr-13 Apr-12 Mar-12 Feb-12 Jan-12
5
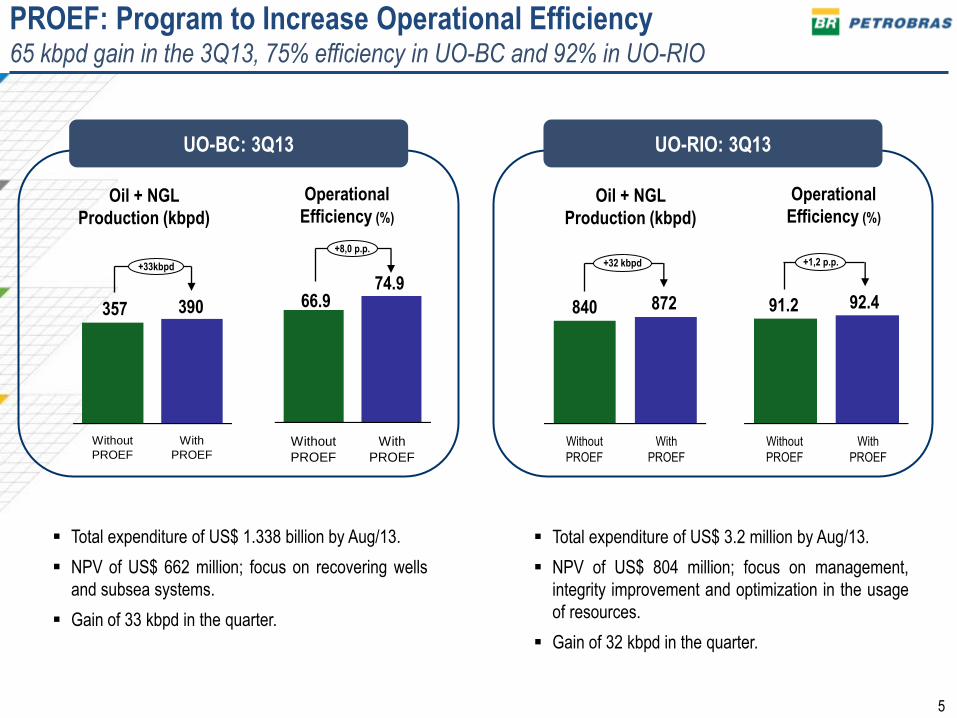
PROEF: Program to Increase Operational Efficiency 65 kbpd gain in the 3Q13, 75% efficiency in UO-BC and 92% in UO-RIO
UO-BC: 3Q13 UO-RIO: 3Q13
840
+32 kbpd
872
+1,2 p.p.
92.4 91.2
+33kbpd
390 357
74.9 66.9
+8,0 p.p.
Total expenditure of US$ 1.338 billion by Aug/13.
NPV of US$ 662 million; focus on recovering wells
and subsea systems.
Gain of 33 kbpd in the quarter.
Operational
Efficiency (%)
Oil + NGL
Production (kbpd)
Operational
Efficiency (%)
Oil + NGL
Production (kbpd)
Total expenditure of US$ 3.2 million by Aug/13.
NPV of US$ 804 million; focus on management,
integrity improvement and optimization in the usage
of resources.
Gain of 32 kbpd in the quarter.
With
PROEF
Without
PROEF
With
PROEF
Without
PROEF
With
PROEF
Without
PROEF With
PROEF
Without
PROEF
6
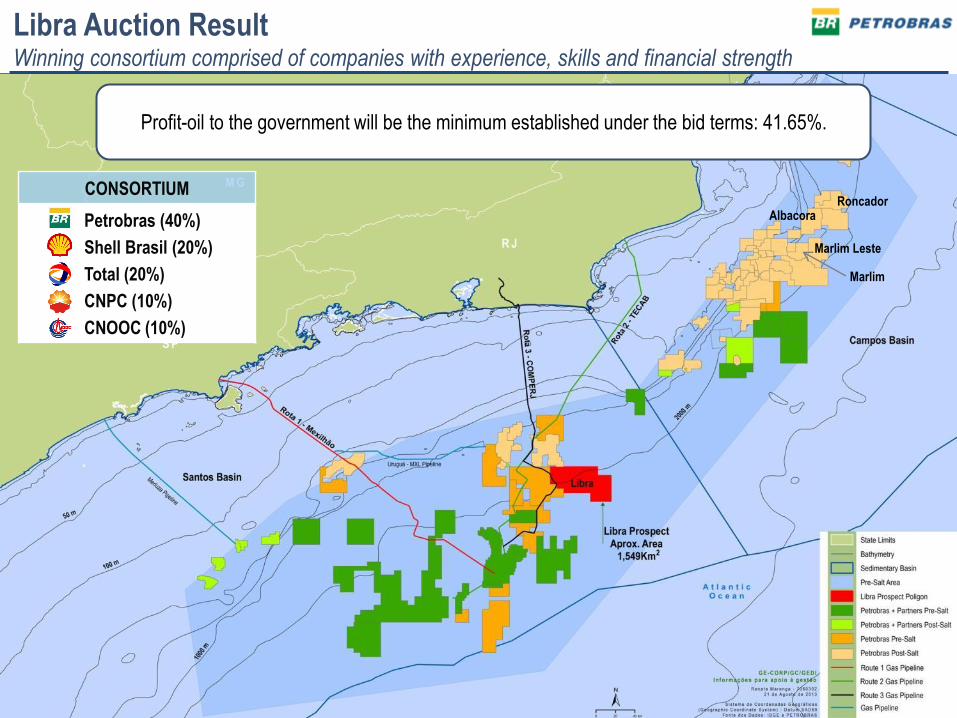
Profit-oil to the government will be the minimum established under the bid terms: 41.65%.
CONSORTIUM
Petrobras (40%)
Shell Brasil (20%)
Total (20%)
CNPC (10%)
CNOOC (10%)
Roncador Albacora
Marlim Leste
Marlim
Libra Auction Result Winning consortium comprised of companies with experience, skills and financial strength

7
Oil Products Output
Oil Products Production in Brazil Monthly records in throughput (Jul/13) and in diesel and gasoline production (Aug/13)
(kbpd) (R$/bbll) (kbpd)
» Stable total output in 3Q13 vs 2Q13, with higher diesel and gasoline production.
» Higher volume of domestic oil throughput, despite lower total throughput resulting from scheduled maintenance in REDUC,
REVAP and REGAP in 3Q13.
» Higher refining cost in reais primarily due to the increase in personnel costs related to the Collective Bargaining Agreement.
+5%
802 855 864
439501 512
7488108
9410092
2,128
0%
3Q13
134
239
211
2Q13
2,138
146
245
203
3Q12
2,026
144
228
213
+2,1%
+1,1%
Fuel Oil
Jet Fuel Others LPG
Naphtha Gasoline
Diesel
Refining Cost Throughput and Utilization (%)
3Q13
+17%
2Q13 3Q12
+5%
382436364
96%99%97%
3Q13
2,072 2,102 1,974
1.666
3Q12
1.690
2Q13
1.611
Imported Oil Utilization (%) Domestic Oil
8
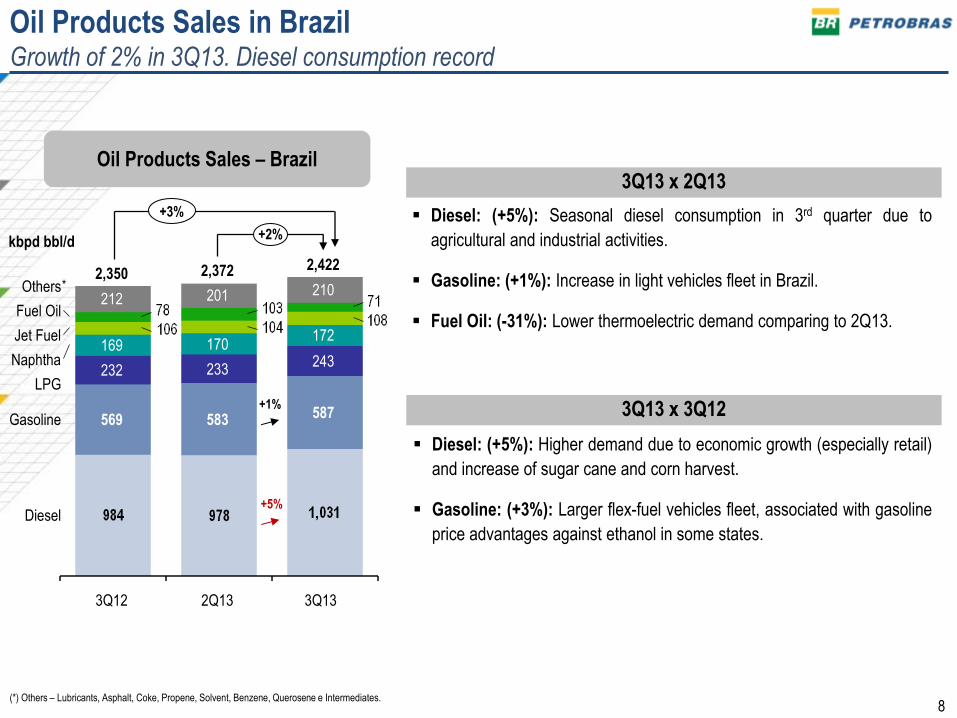
3Q13 x 2Q13
3Q13 x 3Q12
Diesel: (+5%): Higher demand due to economic growth (especially retail)
and increase of sugar cane and corn harvest.
Gasoline: (+3%): Larger flex-fuel vehicles fleet, associated with gasoline
price advantages against ethanol in some states.
Diesel: (+5%): Seasonal diesel consumption in 3rd quarter due to
agricultural and industrial activities.
Gasoline: (+1%): Increase in light vehicles fleet in Brazil.
Fuel Oil: (-31%): Lower thermoelectric demand comparing to 2Q13.
Oil Products Sales in Brazil Growth of 2% in 3Q13. Diesel consumption record
Oil Products Sales – Brazil
2,372
2Q13
583
233
170
201
3Q12
2,350
569
232
169
212 Fuel Oil
587
172
210
243
Others
Gasoline
3Q13
2,422
Jet Fuel
Naphtha
Diesel
+2%
LPG
kbpd bbl/d
*
+3%
+5%
+1%
(*) Others – Lubricants, Asphalt, Coke, Propene, Solvent, Benzene, Querosene e Intermediates.

9
Trade Balance of Oil and Oil Products Higher diesel imports reduced the net balance
3Q13 x 2Q13
» Higher diesel imports to supply seasonal demand growth from agricultural and industrial activities.
» Oil export increase due to a larger availability of inventories built in 2Q13 to offset refinery maintenance in 3Q13.
» Downstream Net Income: -R$ 5.5 billion in 3Q13 x -2.5 billion in 2Q13, primarily due to higher differential with international
price, increased import volumes of oil products, particularly diesel, and higher oil acquisition price.
Exports Imports Balance
kbpd
2813
84
23868
190
293828
359
159
162
551
148
447
3T12 2T13 3T13
+17%
+12%
827
227
334
708
180
822
163
375
385
402
166
206
-27%
+0%
+55%
-9
-297-64
-262-127
2Q13
-349
-284
3Q12
-271
+22%
3Q13
-425 Diesel Gasoline Others Oil Products Fuel Oil Oil
2Q13 3Q12 3Q13 2Q13 3Q12 3Q13
10
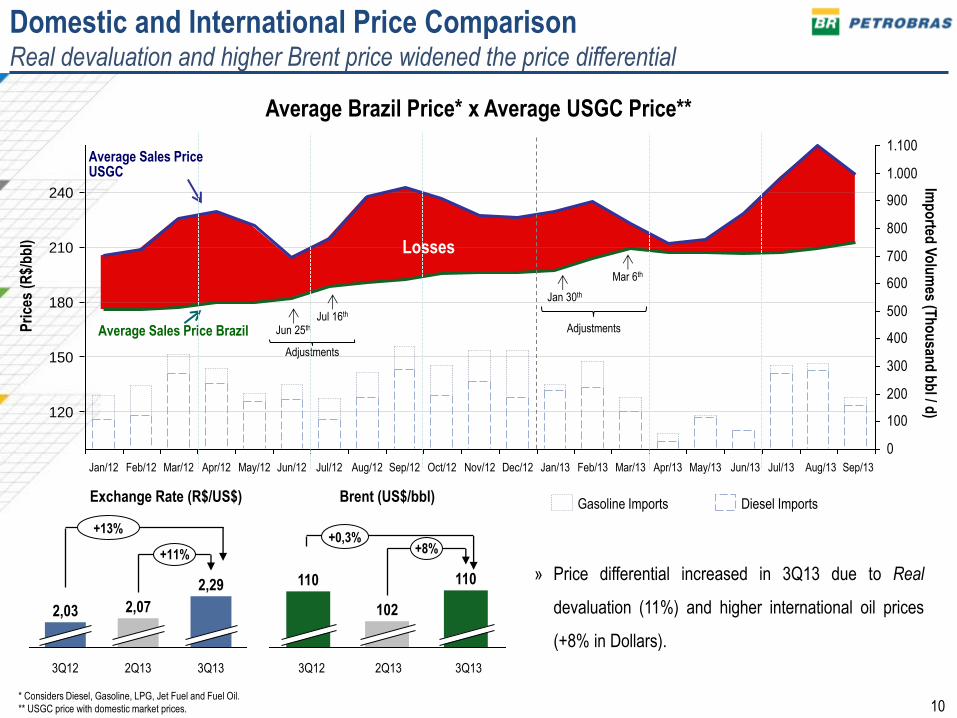
Domestic and International Price Comparison Real devaluation and higher Brent price widened the price differential
» Price differential increased in 3Q13 due to Real
devaluation (11%) and higher international oil prices
(+8% in Dollars).
Average Brazil Price* x Average USGC Price**
0
100
200
300
400
500
600
700
800
900
1.000
1.100
240
210
180
150
120
Pri
ces
(R$/
bb
l)
Average Sales Price Brazil Jun 25th
Adjustments
Diesel Imports Gasoline Imports
Losses
Adjustments
Jan 30th
Mar 6th
Imp
orted
Vo
lum
es (Th
ou
sand
bb
l / d)
Jul 16th
+11%
3Q13
2,29
2Q13
2,07
3Q12
2,03
+13%
Exchange Rate (R$/US$)
+8%
110
102
110
+0,3%
Brent (US$/bbl)
* Considers Diesel, Gasoline, LPG, Jet Fuel and Fuel Oil.
** USGC price with domestic market prices.
Average Sales Price USGC
Sep/13 Aug/13 Jul/13 Jun/13 Apr/13 Mar/13 Feb/13 Jan/13 Dec/12 Nov/12 Oct/12 Sep/12 May/13 Aug/12 Jul/12 Jun/12 May/12 Apr/12 Mar/12 Feb/12 Jan/12
3Q13 2Q13 3Q12
11
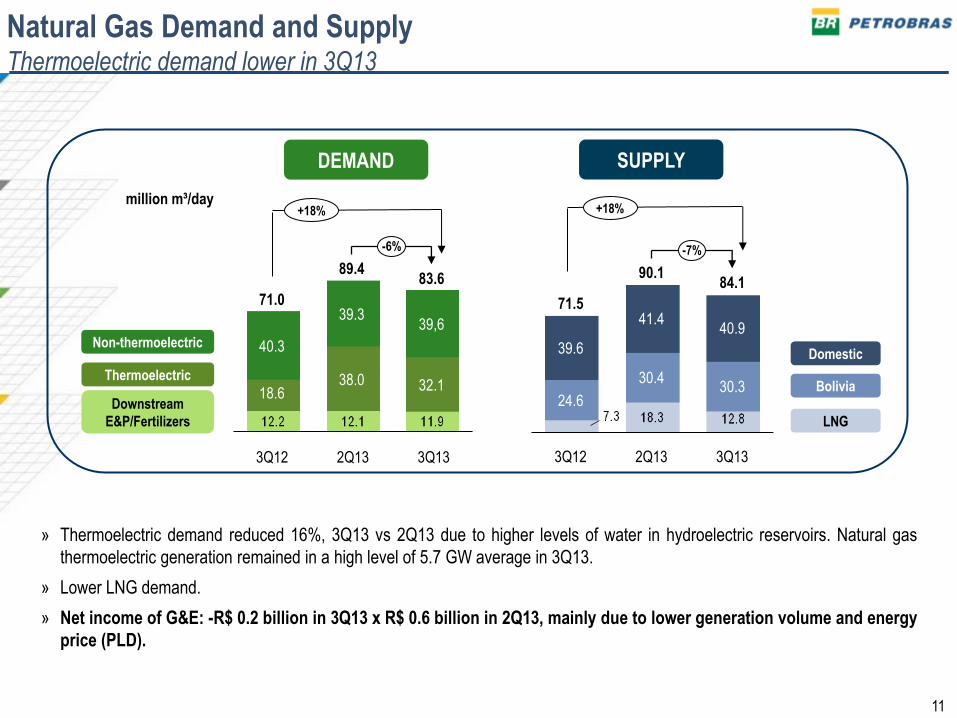
Natural Gas Demand and Supply Thermoelectric demand lower in 3Q13
» Thermoelectric demand reduced 16%, 3Q13 vs 2Q13 due to higher levels of water in hydroelectric reservoirs. Natural gas
thermoelectric generation remained in a high level of 5.7 GW average in 3Q13.
» Lower LNG demand.
» Net income of G&E: -R$ 0.2 billion in 3Q13 x R$ 0.6 billion in 2Q13, mainly due to lower generation volume and energy
price (PLD).
39,9
million m³/day
Domestic
Bolivia
LNG
Non-thermoelectric
Thermoelectric
Downstream
E&P/Fertilizers
SUPPLY DEMAND
40,2
37,0
38,6 11,7
39,3
+18% +18%
-7%
3Q13
84.1
30.3
40.9
2Q13
90.1
30.4
41.4
3Q12
71.5
24.6
39.6
71.0
18.6
40.3
-6%
83.6
32.1
39,6
89.4
38.0
39.3
3Q13 2Q13 3Q12

80%
60%
40%
20%
0%
260%
280%
240%
220%
200%
180%
160%
140%
120%
100%
140%
120%
160%
100%
280%
260%
240%
220%
200%
60%
40%
0%
80%
20%
180%
Exploration & Production Downstream
Engineering,
Technology
& Materials
Corporate
& Services
Transpetro
Gas & Energy
Onshore
Production Administration
And Support Building Mngt,
Travels and
Lodging
Offshore
Production
Support
Services
Wells
Intervention
Refining Oil and Oil Products
Logistics
Commercialization
Supplies
And Stocks
ITC HSE
Mngt
Plannec Accomplished as planned or higher High risk of not achieving the annual target
Attention points that can put the achievement of the annual target at risk
Cenpes
100%
BR, PBio
And Liquigás
BR
Liquigás
PBio
NG
Logistics
Fertilizers
PROCOP: Monitoring of Outcomes – Jan to Sep/13 Accomplishment of R$ 4.8 billion, 122% of annual target of operating cost optimization
Jan-Sep/13
Cost Savings Expected : R$ 2.8 billion (70%)
Cost Savings Accomplished : R$ 4.8 billion (122%)
2013 Target: R$ 3.9 billion
Op
erat
ion
al E
xecu
tio
n (
%)
12
13
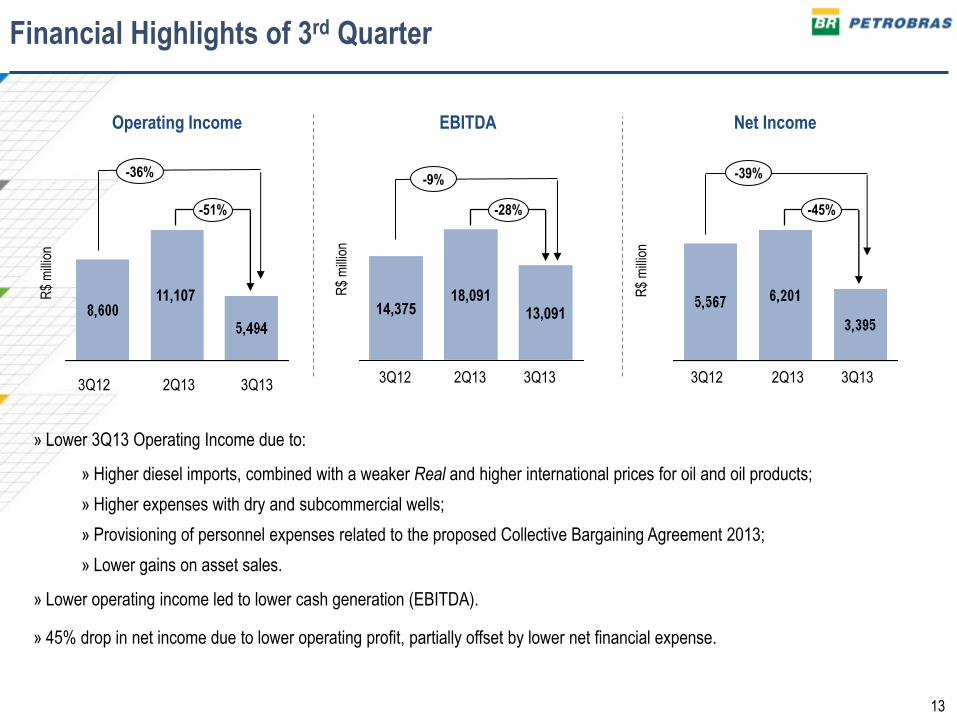
Financial Highlights of 3rd Quarter
» Lower 3Q13 Operating Income due to:
» Higher diesel imports, combined with a weaker Real and higher international prices for oil and oil products;
» Higher expenses with dry and subcommercial wells;
» Provisioning of personnel expenses related to the proposed Collective Bargaining Agreement 2013;
» Lower gains on asset sales.
» Lower operating income led to lower cash generation (EBITDA).
» 45% drop in net income due to lower operating profit, partially offset by lower net financial expense.
Net Income Operating Income EBITDA
R$
mill
ion
-51%
2Q13
11,107
3Q12 3Q13
-36%
3Q13 2Q13
18,091 13,091
-28%
3Q12
14,375
-9%
3Q13 2Q13
-45%
3Q12
-39%
R$
mill
ion
R$
mill
ion
14
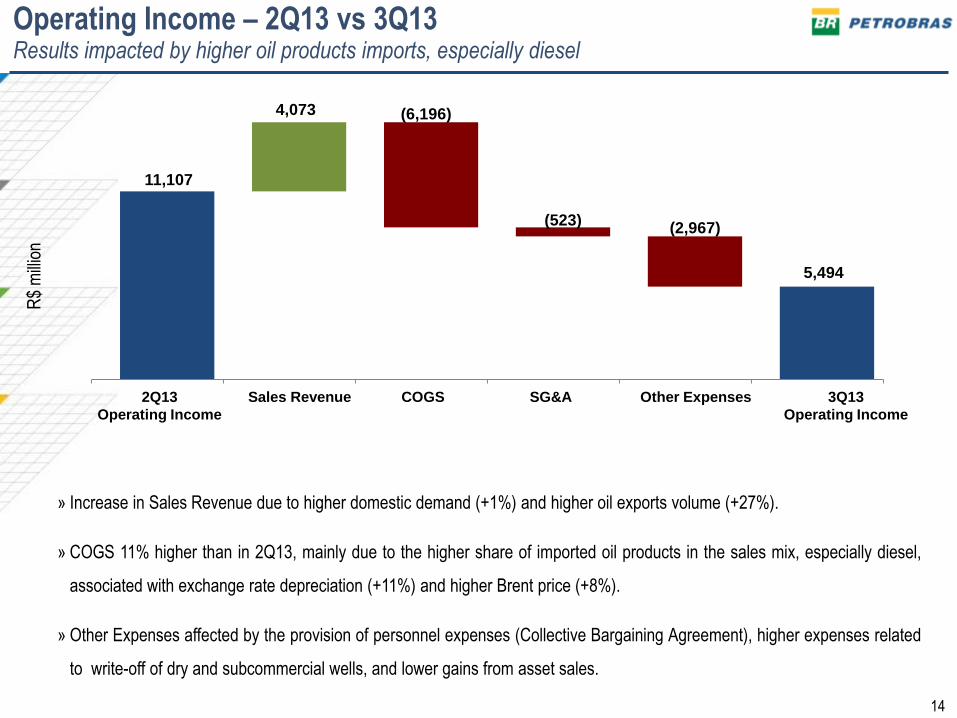
Operating Income – 2Q13 vs 3Q13 Results impacted by higher oil products imports, especially diesel
R$
mill
ion
» Increase in Sales Revenue due to higher domestic demand (+1%) and higher oil exports volume (+27%).
» COGS 11% higher than in 2Q13, mainly due to the higher share of imported oil products in the sales mix, especially diesel,
associated with exchange rate depreciation (+11%) and higher Brent price (+8%).
» Other Expenses affected by the provision of personnel expenses (Collective Bargaining Agreement), higher expenses related
to write-off of dry and subcommercial wells, and lower gains from asset sales.
11,107
4,073 (6,196)
(523) (2,967)
5,494
2Q13
Operating Income
Sales Revenue COGS SG&A Other Expenses 3Q13
Operating Income
15
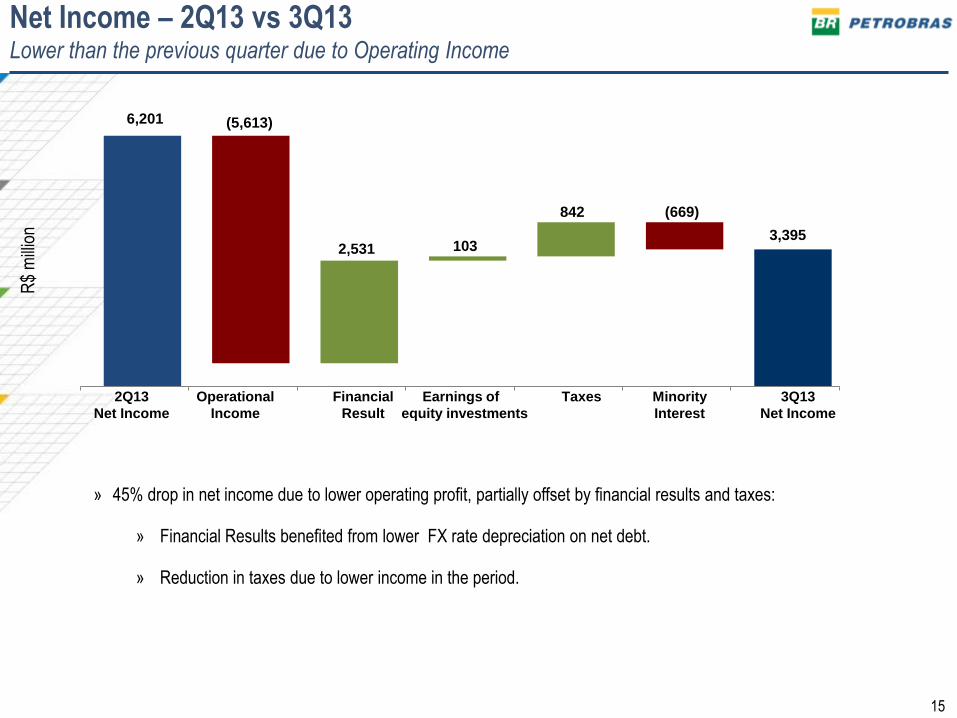
Net Income – 2Q13 vs 3Q13 Lower than the previous quarter due to Operating Income
R$
mill
ion
» 45% drop in net income due to lower operating profit, partially offset by financial results and taxes:
» Financial Results benefited from lower FX rate depreciation on net debt.
» Reduction in taxes due to lower income in the period.
6,201 (5,613)
2,531 103
842 (669)
3,395
2Q13
Net Income
Operational
Income
Financial
Result
Earnings of
equity investments
Taxes 3Q13
Net Income
Minority
Interest

16
R$ 69.3 billion in investments during the 9M13, 16% up on 9M12.
When calculated in dollars, investments grew 5%.
Investments and Tracking Physical and Financial Progress R$ 25.1 bi in 3Q13 and R$ 69.3 bi in 9M13
Tracking of physical and financial progress of 165 individual projects (S-curves):
97.7% of projected physical progress and 97.8% of projected financial progress completed.
R$
Bill
ion
9M13 investments by business segment
+16%
9M13
69.3
9M12
54%
R$ 10,7 bi 35%
R$ 6,9 bi 55%
32%
1% 1%
6% 5%
G&P
International
Distribution
Biofuel
Corporate
Downstream
E&P
17
1) Net Debt / (adjusted EBITDA 9M13/3 x 4). Adjusted EBITDA= EBITDA excluding earnings of equity-accounted investments and impairments
2) Net debt / (Net Debt + Shareholders Equity)
3) Includes tradable securities maturing in more than 90 days
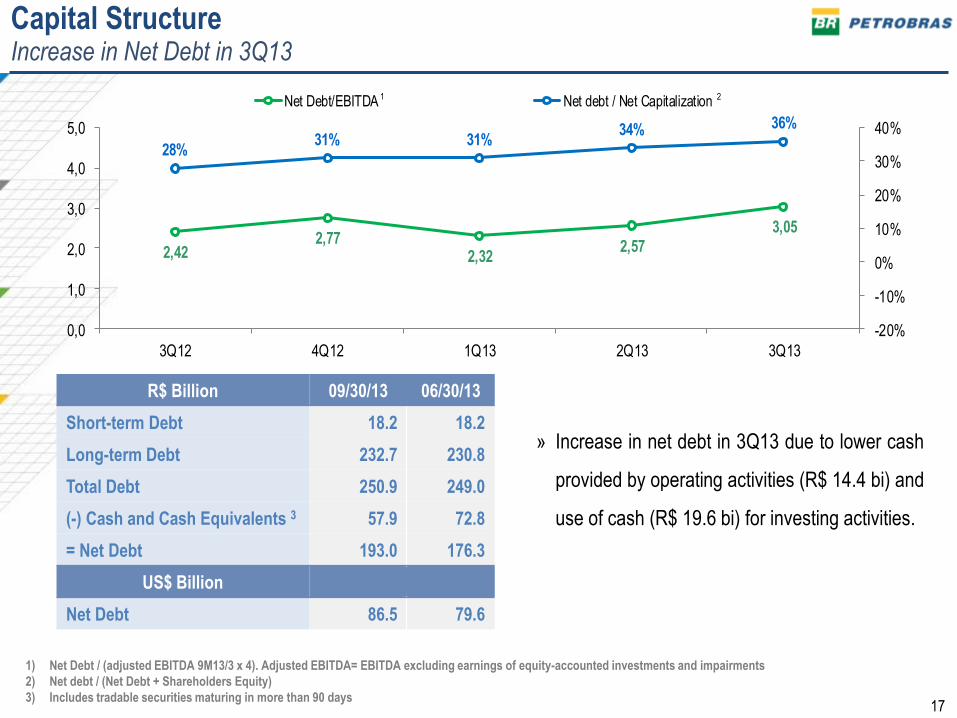
Capital Structure Increase in Net Debt in 3Q13
R$ Billion 09/30/13 06/30/13
Short-term Debt 18.2 18.2
Long-term Debt 232.7 230.8
Total Debt 250.9 249.0
(-) Cash and Cash Equivalents 3 57.9 72.8
= Net Debt 193.0 176.3
US$ Billion
Net Debt 86.5 79.6
2,422,77
2,322,57
3,05
28%31% 31%
34% 36%
-20%
-10%
0%
10%
20%
30%
40%
0,0
1,0
2,0
3,0
4,0
5,0
3Q12 4Q12 1Q13 2Q13 3Q13
Net Debt/EBITDA Net debt / Net Capitalization 2
» Increase in net debt in 3Q13 due to lower cash
provided by operating activities (R$ 14.4 bi) and
use of cash (R$ 19.6 bi) for investing activities.
1
Operational and
Financial Results
Information:
Investor Relations
+55 21 3224-1510