familynews.rofamilynews.ro/wp-content/uploads/2016/03/comunicat-M… · Web viewRomania and The...
40
Romania and The Republic of Moldova’s March for Life 2016 March 26th, 2016 The Pro-Life Month 2016 March 2016 Pro-Life, Pro-Woman, Pro-Family Press Release Addenda 1. International statistics 2. Romanian statistics 3. Underreporting of abortion numbers in Romanian statistics
Transcript of familynews.rofamilynews.ro/wp-content/uploads/2016/03/comunicat-M… · Web viewRomania and The...
Romania and The Republic of Moldova’s
March for Life 2016March 26th, 2016
The Pro-Life Month 2016March 2016
Pro-Life, Pro-Woman, Pro-Family
Press Release
Addenda1. International statistics2. Romanian statistics3. Underreporting of abortion numbers in Romanian
statistics 4. Main legal provisions regulating abortion in Romania5. Statistics for the Republic of Moldova6. Short history of Romania and The Republic of
Moldova’s March for Life

February 29th, 2016
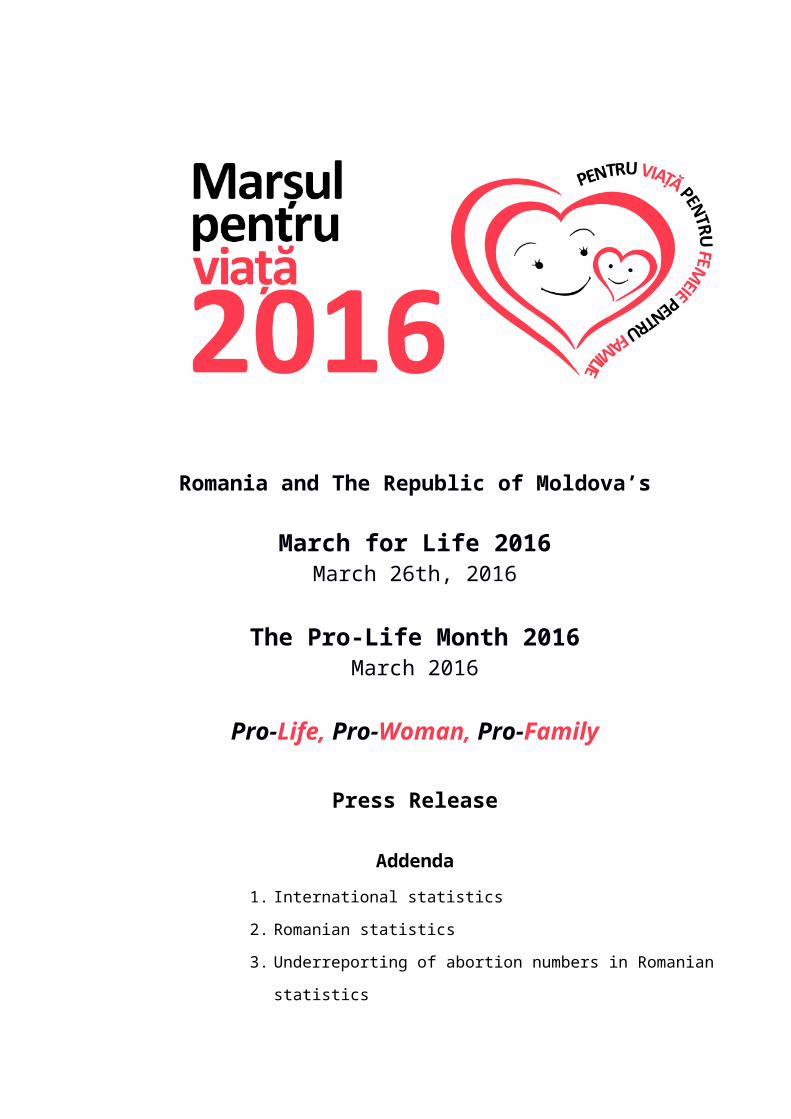
Press ReleaseRomania and The Republic of Moldova’s
March for Life 2016 – “Pro-Life, Pro-Woman, Pro-Family”
March 2016 has been declared as The Pro-Life Month 2016 – “Pro-Life, Pro-Woman, Pro-Family” in Romania and The Republic of Moldova. This series of events will culminate with The March for Life 2016 – “Pro-Life, Pro-Woman, Pro-Family”, organized Saturday, on March 26th.
The message we wish to send by our choice of this year’s theme – “Pro-Life, Pro-Woman, Pro-Family” – is that the welfare of the pregnant woman is not opposed to the welfare of the baby she is carrying: actually, these two build one upon the other. Also, family, as well as society, have a lot to gain from supporting all women during pregnancy and especially those women who go through a pregnancy crisis.
For six decades such support has badly missed nationwide.Neither through the Decree 463/1957, which liberalized abortion on
demand, nor through the Decree 770/01.10.1966, which restricted abortion, did the Romanian communist regime act for the welfare of the woman or that of the child. Both laws only enforced communist pro-abortion ideology. The 1966 law was only designed to stop the downward trend of natality, which meant less work force. In 1965, the year before abortion restrictions came in force, 1,115,000 children had been aborted and only 278,362 born alive; it was the year when Romania had the highest abortion rate for every thousand women ever registered in the history of the world: 252 abortions/1,000 women.
The model of communist Romania was the former USSR (The Union of the Soviet Socialist Republics), the first state in the world which made abortion on demand legal – in 1920 –, then restricted it – in 1936 –, because population decreased, then lifted again the restrictions – in 1955. Romania and other neighbouring Communist states (Poland and Bulgaria in 1956 and Checkoslovakia in 1957) followed this example and made abortion on demand legal immediately afterwards. That is why Western scholars have talked about an “abortion culture” in the communist states.
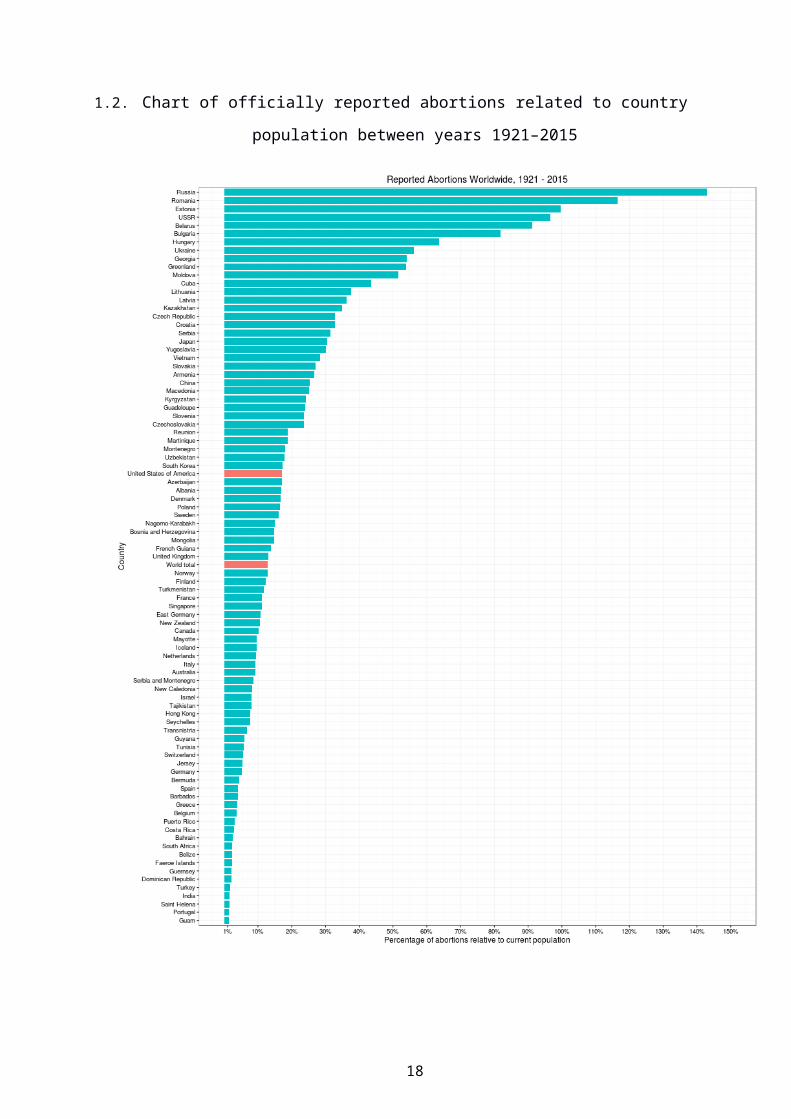
This abortion culture has determined 23 of them to rank among the top 25 countries by percentage of abortions relative to their current population, while the corresponding world abortion percentage related to total world population ranks on the 46th place in these statistics.
In 2008, 18 years after the fall of the communist regime in Eastern Europe, 4 years after joining NATO and one year after accessing the EU:
this region is still on the first place among all the regions of the world, with an abortion rate of 43/1,000 women, much higher than that registered in other Euro-Atlantic regions: 12/1,000 in Western Europe, 17/1,000 in Northern Europe, 18/1,000 in Southern Europe and 19/1,000 in Northern America1;
1 Gilda Sedgh, Susheela Singh, Iqbal Shaw, Elizabeth Åhman, Stanley K. Henshaw, Akin Bankole, „Induced abortion: Incidence and trends worldwide from 1995
1
in Romania, the percentage of abortions relative to births is the highest in Europe: 578 abortions for 1,000 births, while the EU avergae rate is of 228.Freedom regained after the December 1989 Revolution has never
been used to support the most vulnerable, but it was turned into irresponsibility towards the most vulnerable. Proof of the Romanian state and society’s failure to protect their citizens after 1989 has been the Romanians’ massive migration outside the country in search of conditions they weren’t provided inside. Irresponsiblity towards children, which led to their massive institutionalization in inhuman conditions before 1989 has continued after 1989 by refusing to assume responsiblity towards our unborn children: in 1990 Romanians aborted 992,265 children.
Since 1958, when abortion was liberalized, and up to present, its incidence has been higher here than in Western countries, regardless of political regime – and even regardless of the legal regime of abortion itself! That explains why:
at global level, after Russia, Romania has the second highest percentage of abortions relative to current population (116,5%);
the national average in Romania is of three abortions for each woman, while in Western countries there is at most one abortion for each woman.
Thus, in Romania, whose actual population numbers approximately 19,908,574 inhabitants2, 22,638,755 abortions have been registered only in public hospitals between 1958 and 2014 (the last year with available data):
7,521,100 abortions during the liberalization period 1958–1966 (9 years);
7,298,402 abortions during the restriction period 1967–1989 (24 years);
7,819,253 abortions during the liberalization period 1990–2014 (25 years).
At present there are 220 abortions daily only in public hospitals. To these data one should add abortions made in private clinics,
which are not reported, and abortions had by young and mature persons working abroad, who represent a big part of Romania’s population of fertile age; if we could add these data, which we don’t have, the statistics of abortions for Romania’s population may look double the actual numbers.
Practically, during the latest six decades, millions of women who faced pregnancy crisis did not have any real chances to solve the problems that generated it and millions of men involved in pregnancy crises have preferred to give up their manly duty to support the woman and the child.
In the Republic of Moldova, whose actual population is of approximately 3,600,000, statistics show that 2,098,099 abortions
to 2008”, The Lancet 379.9816 (2012), pp. 625–632.
2 (Stable) Residing Population on July 1st, 2014. Institutul National de Statistica, „Anuarul Demografic al Romaniei editia 2015” (National Institute of Statistics, „Demographic Yearbook of Romania, 2015”). Note: Data to be updated.
2

have been made between 1960 and 2014. For this country, too, the real statistics should be updated with the abortions had by young and mature persons working abroad.
The theme “Pro-Life, Pro-Woman, Pro-Family”If Romanians see themselves and are also seen by others like people
who help each other in need, why this support, this solidarity cannot also be seen when it comes to the woman in pregnancy crisis?
The main reasons why society doesn’t support the woman in pregnancy crisis is the preconception that being pro-life is being anti-woman; also, the preconception that those who favour chosing life for the child are actually waging war against women, while abortions supporters are those who protect the women. The abortion approach during communism is to blame for these preconceptions. Legal restrictions on abortion during communism were not meant to be pro-life, they only provided for the state’s political interest: they were meant neither to support the woman in crisis, nor to protect the unborn; they were only meant to increase demographic indicators in order to cater for the economic needs of the state. A very serious consequence of this kind of law were the abandoned children.
The huge number of abandoned and institutionalized children during the communist regime was a direct consequence of the communist dictatorship. Before the communist regime in Romania, the community felt responsible towards the children who weren’t cared for by their natural family. Adopted children were named “soul children” and did not suffer any stygma.
The theme “Pro-Life, Pro-Woman, Pro-Family” has been inspired by the theme of the Washington, DC March for Life 2016: “Pro-life and pro-woman go hand in hand”. Pro-life organizations from România and The Republic of Moldova felt like adding a third term, “Pro-Family”, in order to emphasize that family is the only natural environment nurturing both the welfare of the child and the welfare of the woman and also that a child born outside a family does not prevent a family being set up – on the contrary, it is always the first step towards it.
This theme clearly states that whoever says the pro-life movement doesn’t care about the woman and that abortion solves women’s problems is wrong. In fact, the pro-life movement focuses on both woman and child, while abortion, in most cases is an exploitation of the woman for the sake of personal comfort, because of a double irresponsibility: the man’s and society’s. That is why abortion has been named “the ultimate exploitation of women” by Alice Paul, famous activist for women’s rights3.
This theme’s choice also states what experience has shown in many real cases: the child’s birth is in the best interest of the woman, while abortion on demand only aggravates and perpetuates different problems, to which it adds newer ones. Chosing life for her baby will actually empower the woman and grant her a more accomplished future – at least
3 Alice Paul (1885–1977) was a member of the Suffragette Movement, a feminist and an activist for women’s rights in the US. She was the main coordinator of the campaign which in 1919 led to the adopting the Nineteenth Amendament to the US Constitution, which granted women the right to vote.
3
through her child’s love; abortion hurts both the woman and her long-term future.
Experience has shown indeed that an unexpected and unwanted pregnancy can turn into a great chance for the woman, for her family or future family and for society if the woman is supported instead of being abandoned and stygmatized.
It was not by accident that Norma McCorvey and Sandra Cano, the two women used to serve the purpose of the lawsuits that led in 1973 to the liberalization of abortion in the US have subsequently become pro-life. Long-term experience confirms that whoever is pro-woman is also pro-life and whoever is pro-life is also pro-woman.
A woman in pregnancy crisis is faced with hardships difficult to imagine if you have never been through anything like that or have never carefully studied that situation. The turmoil and drama a woman lives before chosing abortion are very well described by American pro-life author Frederica Mathewes-Green: “No one wants an abortion as she wants an ice-cream cone or a Porsche. She wants an abortion as an animal, caught in a trap, wants to gnaw off its own leg”.
For example, especially in rural areas – although not exclusively –, children conceived out of wedlock are most often aborted, the main reason being the mother’s fear of stygma. Of course, ideally, a child needs to be conceived and born in the loving and secure atmosphere of a family, but lack of a family does not justify abortion by any means. Abortion does not cancel, but multiplies the negative consequences of the situation which has generated the pregnancy crisis.
That is why we believe this year’s March for Life theme also emphasizes that it is only natural for men, family and society to support pregnant women by all means.
To illustrate these truths, we shall publish testimony books about the pregnancy crisis: 101 Happy Women Who Have Chosen Life for Their Children and 101 Regretted Abortions.
We need to publish these books for women who will be faced with pregnancy crisis in the future and also for all who ever find themselves in the proximity of such a woman and more often than not have no idea what her crisis really means. We hope these testimonies can help people understand that pregnancy crisis is one of the toughest trials a woman can go through and that we can support her – all the more if we consider ourselves as her family or her friends, if we say that she means something to us.
GoalsOur objective is not to propose a legal ban on abortion. Our goal is
not to pass a law forbidding abortion on demand. What we actually aim for is to raise awareness about:
the existence, uniqueness, dignity and value of each human being starting from the moment of conception;
different challenging situations (like unexpected and unwanted pregnancy, marital status, economical challenges, detecting a possible health problem of the child) which can all lead to a
4
pregnancy crisis, which is a period of intense turmoil and difficulty for the woman;
the fact that not abortion, but support for the woman is the answer to the pregnancy crisis;
it is only natural that the child’s father, the extended family, civil society and the whole society support women during pregnancy crisis, before and after they give birth;
the fact that a society which supports the mother and her child will also support adopted children, adoptive parents, parents who for reasonable reasons cannot raise their children and want to put them up for adoption, lonely perons, single-parent families, disabled persons, persons who need care, and generally all the vulnerable.
We reiterate this year the proposals communicated by the previous editions of Romania and The Republic of Moldova’s March for Life:
to create legal grounds – based on the example of good practice offered by similar laws in the USA, UK, Australia – for the pregnant woman to sign the adoption papers while still pregnant and thus give the child for adoption as soon as she gives birth, with a reasonable change-of-heart moratorium after that4;
granting a state subsidy to the pregnant woman (after 14 weeks of pregnancy, the time limit for an abortion by Romanian law) in order to cover for her special needs at the time of pregnancy.
The March for Life, The Pro-Life Month, a pro-life attitude and pro-life deeds do not mean condemning those who have had an abortion. They mean stretching out a helping, loving and sorrowful hand. They don’t mean condemning the fathers and mothers who, scared by insecurity, chose to move ahead without the child which they saw as an encumberment in their lives because they felt they could not ensure it the optimum conditions. Instead, being pro-life means offering these people support to keep walking through life.
How many women in pregnancy crisis can resist alone faced with their partner’s violence, with social exclusion, with poverty or the risk of being forced to give up education and career? The answer is self-evident. Therefore, no effort made by us personally, by our family, by our group of friends, by our church, by our state, by today’s world is too much compared to the unique, unrepeatable and priceless stake that each and every human life represents.
This year’s March for Life theme also helps us raise awareness about the need for an institutional form of counseling and support for women in pregnancy crisis, and emphasize the necessity to set up Pregnant Women Support Centers to offer specialized services of counseling and support in pregnancy crisis.
4 Romanian law does not provide for this possibility, because Romania, through the Law no. 138/2011, has ratified the European Convention on the Adoption of Children (Revised), adopted in Strasbourg on November 27th, 2008, which mentions at Art. 5 Para. (5) that the mother can only consent to adoption six weeks after birth at the earliest time.
5
To protect the life of the unborn, their parents’ lives and the future of society, we need not only a pro-life attitude, but a pro-life practice. Being against abortion without offering the whole support a woman needs in order to give birth to her baby is hypocritical and inefficient. Whoever cares about the baby, also cares about the mother and will do everything to help her.
Examples of good practice on a large organizational scale can be found in the United States. Understanding that “no woman should ever feel so alone, coerced, or so hopeless that she ends her child’s life through abortion”5 and that “the answer to a crisis pregnancy is to eliminate the crisis, not the child”6, the US supporters of Life have tried to help women in pregnancy crisis solve the problems that generated it.
The consequence is that in the US there are over 2,800 pregnancy help centers – almost four times the total number of clinics offering surgical and chemical abortion (approximately 730). Women resorting to these counseling and support services will freely receive everything they need in order to surmount the crisis: psychological, religious, legal counseling, food, a job, a home etc In 2015 alone, the pregnancy help centers in the US have helped more than 300,000 women to chose life for their children!
The March for Life is apolitical and non-confessional, but it welcomes participation from all religions and Christian denominations and from all political parties. In the cities where it cannot be held, people can organize small pro-life events under the umbrella of the Pro-Life Month. Romanians living and working abroad can also join our pro-life effort through such events. The website marsulpentruviata.ro shall soon be updated with information about the local marches.
We kindly ask you to spread word through your websites and social media channels about The Pro-Life Month 2016 and The March for Life 2016 – “Pro-Life, Pro-Woman, Pro-Family”, thus helping our children and women and the whole society.
Alexandra Nadane,
President of Romania’s Studenți pentru viață (“Students for Life”) Association
Ioana Picoș,
Spokesperson Romania and The Republic of Moldova’s
5 Jor-El Godsey, actual President of the Heartbeat International network of pregnancy help centers (with over 1,800 affiliated centers in 50 countries)
6 Jeannie W. French, fonder of the National Women’s Coalition for Life
6

March for Life 2016
7

Romania and The Republic of Moldova’s
March for Life 2016March 26th, 2016
The Pro-Life Month 2016March 2016
Pro-Life, Pro-Woman, Pro-Family
Addenda
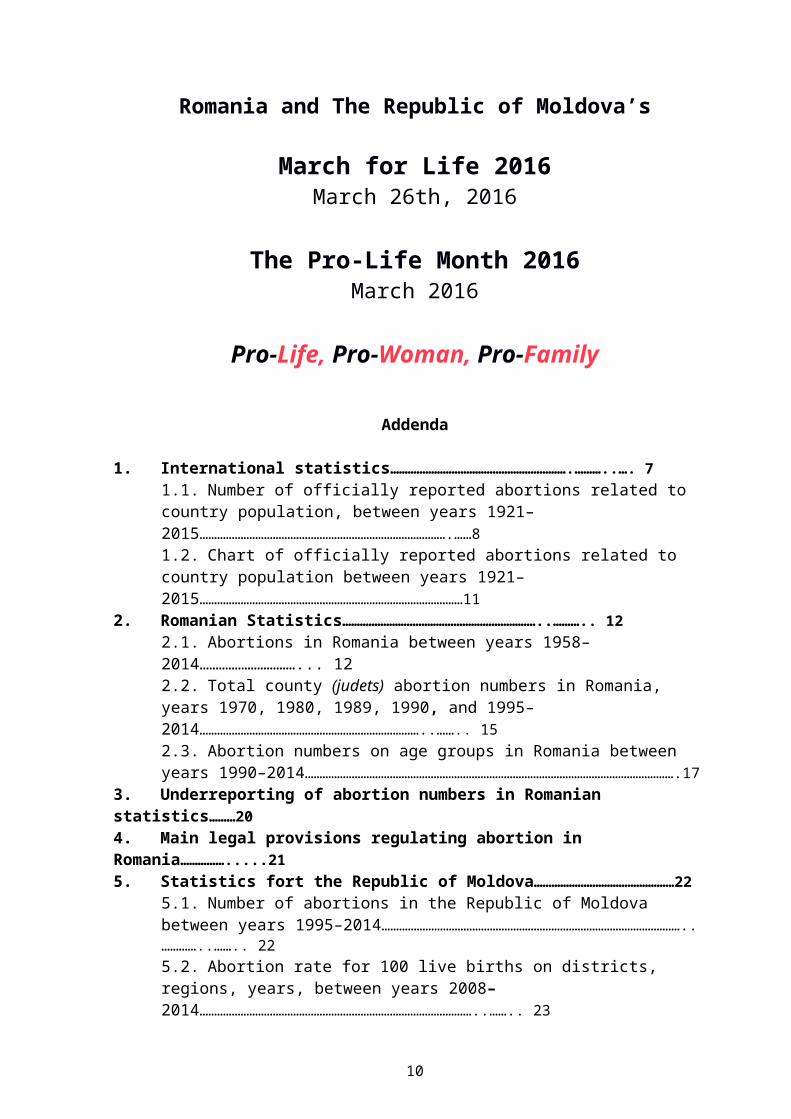
1. International statistics…………………………………………………….………..…. 7
1.1. Number of officially reported abortions related to country population, between years 1921–2015………………………………………………………………………….……81.2. Chart of officially reported abortions related to country population between years 1921–2015………………………………………………………………………………11
2. Romanian Statistics…………………………………………………………..……….. 12
2.1. Abortions in Romania between years 1958–2014…………………………... 122.2. Total county (judets) abortion numbers in Romania, years 1970, 1980, 1989, 1990, and 1995–2014…………………………………………………………………..…….. 152.3. Abortion numbers on age groups in Romania between years 1990–2014……………………………………………………………………………………………………………….17
3. Underreporting of abortion numbers in Romanian statistics………204. Main legal provisions regulating abortion in Romania…………….....215. Statistics fort the Republic of Moldova…………………………………………22
5.1. Number of abortions in the Republic of Moldova between years 1995–2014…………………………………………………………………………………………..…………..…….. 225.2. Abortion rate for 100 live births on districts, regions, years, between years 2008–2014…………………………………………………………………………………..…….. 23
8

6. Short history of Romania and The Republic of Moldova’s March for Life…………………………………………………………………………………………………………24
9
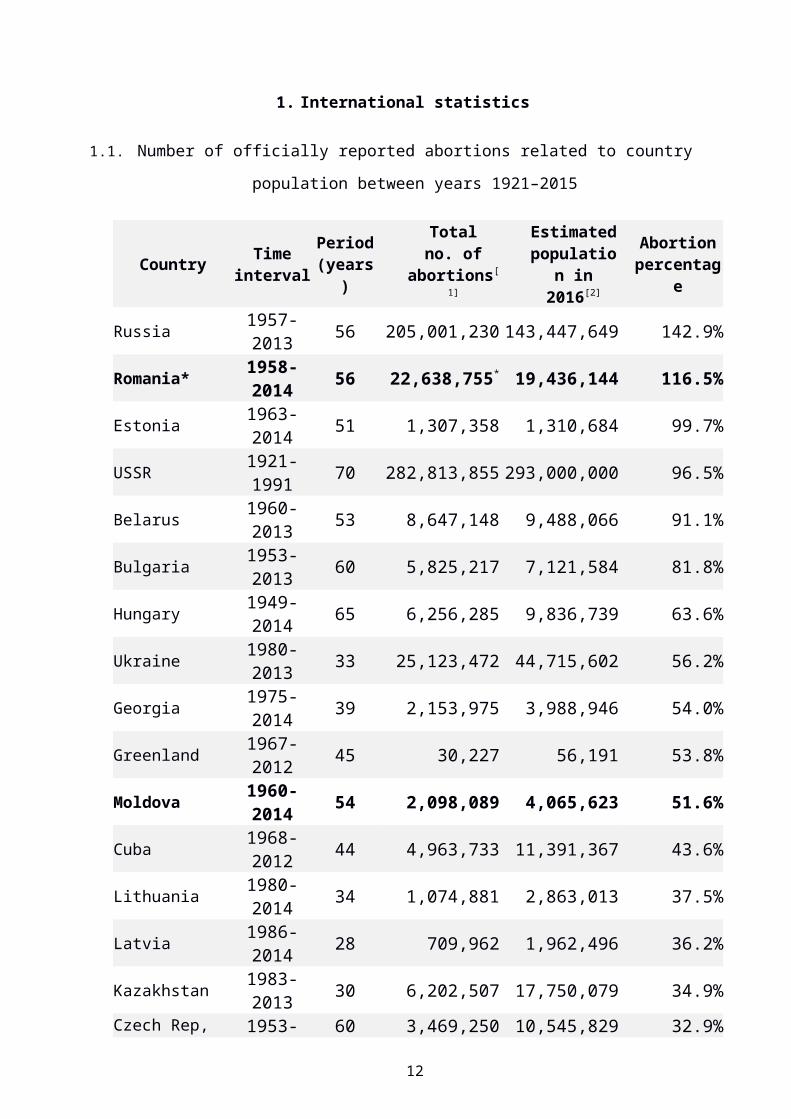
1. International statistics
1.1. Number of officially reported abortions related to country population between years 1921–2015
Country Timeinterval
Period (years)
Totalno. of
abortions[1]
Estimated
population in
2016[2]
Abortion percentag
e
Russia 1957-2013 56 205,001,230 143,447,649 142.9%Romania* 1958-2014 56 22,638,755* 19,436,144 116.5%Estonia 1963-2014 51 1,307,358 1,310,684 99.7%USSR 1921-1991 70 282,813,855 293,000,000 96.5%Belarus 1960-2013 53 8,647,148 9,488,066 91.1%Bulgaria 1953-2013 60 5,825,217 7,121,584 81.8%Hungary 1949-2014 65 6,256,285 9,836,739 63.6%Ukraine 1980-2013 33 25,123,472 44,715,602 56.2%Georgia 1975-2014 39 2,153,975 3,988,946 54.0%Greenland 1967-2012 45 30,227 56,191 53.8%Moldova 1960-2014 54 2,098,089 4,065,623 51.6%Cuba 1968-2012 44 4,963,733 11,391,367 43.6%Lithuania 1980-2014 34 1,074,881 2,863,013 37.5%Latvia 1986-2014 28 709,962 1,962,496 36.2%Kazakhstan 1983-2013 30 6,202,507 17,750,079 34.9%Czech Rep, 1953-2013 60 3,469,250 10,545,829 32.9%Croatia 1965-2013 48 1,384,811 4,232,009 32.7%Serbia 1985-2013 28 2,783,482 8,830,215 31.5%Japan 1949-2013 64 38,602,345 126,437,991 30.5%Yugoslavia 1955-1991 36 7,155,535 23,720,000 30.2%Vietnam 1976-2012 36 26,734,408 93,988,222 28.4%Slovakia 1958-2013 55 1,469,821 5,427,972 27.1%Armenia 1980-2014 34 804,622 3,022,234 26.6%China 1963-2012 49 350,046,418 1,379,452,584 25.4%Macedonia 1980-2012 32 521,249 2,079,841 25.1%Kyrgyzstan 1980-2013 33 1,446,511 5,990,849 24.1%Guadelupe 1976-2013 37 112,282 469,588 23.9%Slovenia 1955-2012 57 488,482 2,068,522 23.6%Czechoslovakia 1953-1992 39 3,676,501 15,600,000 23.6%
Reunion 1976-2013 37 163,589 864,441 18.9%Martinique 1976-2013 37 74,754 396,392 18.9%Montenegro 1985-2012 27 112,823 625,955 18.0%Uzbekistan 1971-2013 42 5,363,743 30,114,249 17.8%South Korea 1961-2010 49 8,680,733 50,427,232 17.2%
10

Country Timeinterval
Period (years)
Totalno. of
abortions[1]
Estimated
population in
2016[2]
Abortion percentag
e
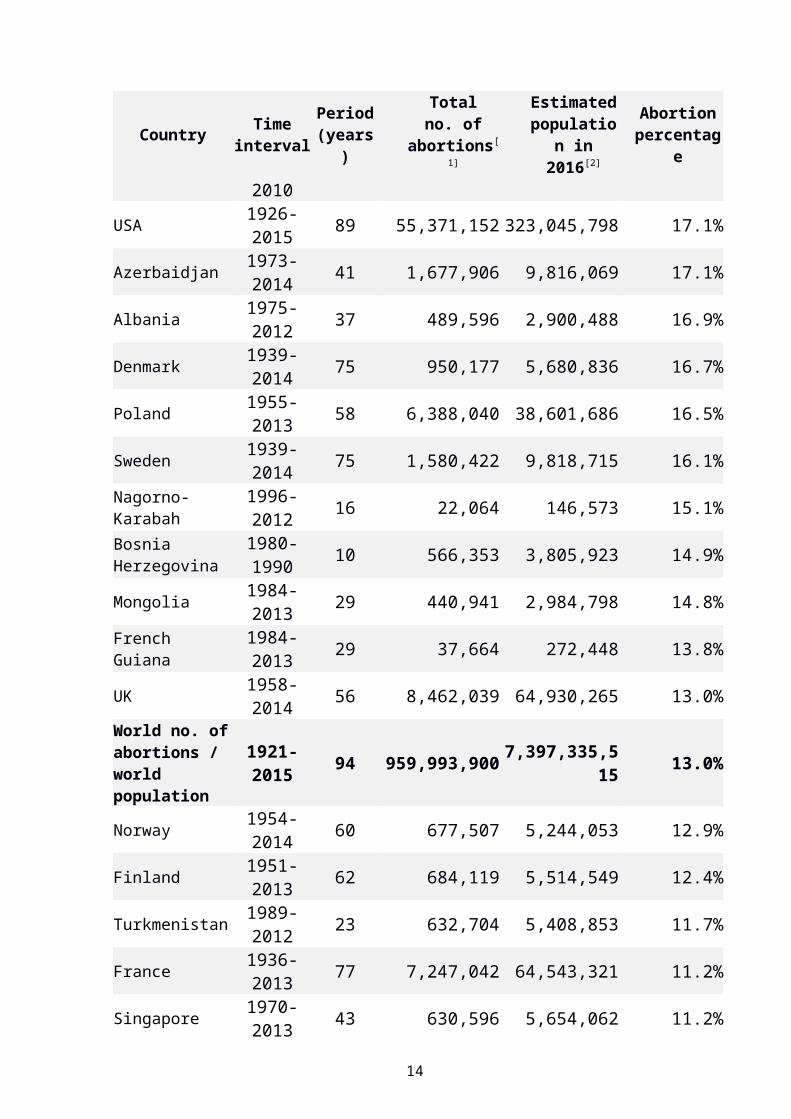
USA 1926-2015 89 55,371,152 323,045,798 17.1%Azerbaidjan 1973-2014 41 1,677,906 9,816,069 17.1%Albania 1975-2012 37 489,596 2,900,488 16.9%Denmark 1939-2014 75 950,177 5,680,836 16.7%Poland 1955-2013 58 6,388,040 38,601,686 16.5%Sweden 1939-2014 75 1,580,422 9,818,715 16.1%Nagorno-Karabah 1996-2012 16 22,064 146,573 15.1%Bosnia Herzegovina 1980-1990 10 566,353 3,805,923 14.9%
Mongolia 1984-2013 29 440,941 2,984,798 14.8%French Guiana 1984-2013 29 37,664 272,448 13.8%
UK 1958-2014 56 8,462,039 64,930,265 13.0%World no. of abortions / world population
1921-2015 94 959,993,900 7,397,335,515 13.0%
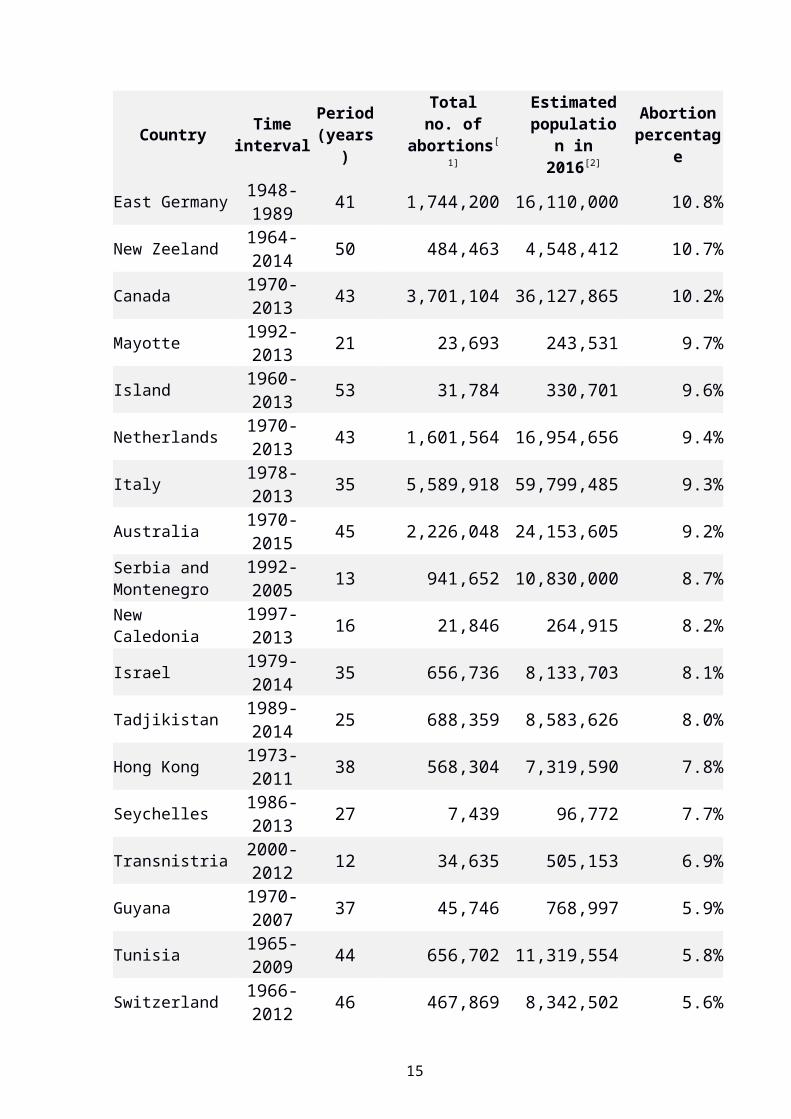
Norway 1954-2014 60 677,507 5,244,053 12.9%Finland 1951-2013 62 684,119 5,514,549 12.4%Turkmenistan 1989-2012 23 632,704 5,408,853 11.7%France 1936-2013 77 7,247,042 64,543,321 11.2%Singapore 1970-2013 43 630,596 5,654,062 11.2%East Germany 1948-1989 41 1,744,200 16,110,000 10.8%New Zeeland 1964-2014 50 484,463 4,548,412 10.7%Canada 1970-2013 43 3,701,104 36,127,865 10.2%Mayotte 1992-2013 21 23,693 243,531 9.7%Island 1960-2013 53 31,784 330,701 9.6%Netherlands 1970-2013 43 1,601,564 16,954,656 9.4%Italy 1978-2013 35 5,589,918 59,799,485 9.3%Australia 1970-2015 45 2,226,048 24,153,605 9.2%Serbia and Montenegro 1992-2005 13 941,652 10,830,000 8.7%New Caledonia 1997-2013 16 21,846 264,915 8.2%
Israel 1979-2014 35 656,736 8,133,703 8.1%Tadjikistan 1989-2014 25 688,359 8,583,626 8.0%Hong Kong 1973-2011 38 568,304 7,319,590 7.8%Seychelles 1986-2013 27 7,439 96,772 7.7%Transnistria 2000-2012 12 34,635 505,153 6.9%Guyana 1970-2007 37 45,746 768,997 5.9%Tunisia 1965-2009 44 656,702 11,319,554 5.8%
11
Country Timeinterval
Period (years)
Totalno. of
abortions[1]
Estimated
population in
2016[2]
Abortion percentag
e
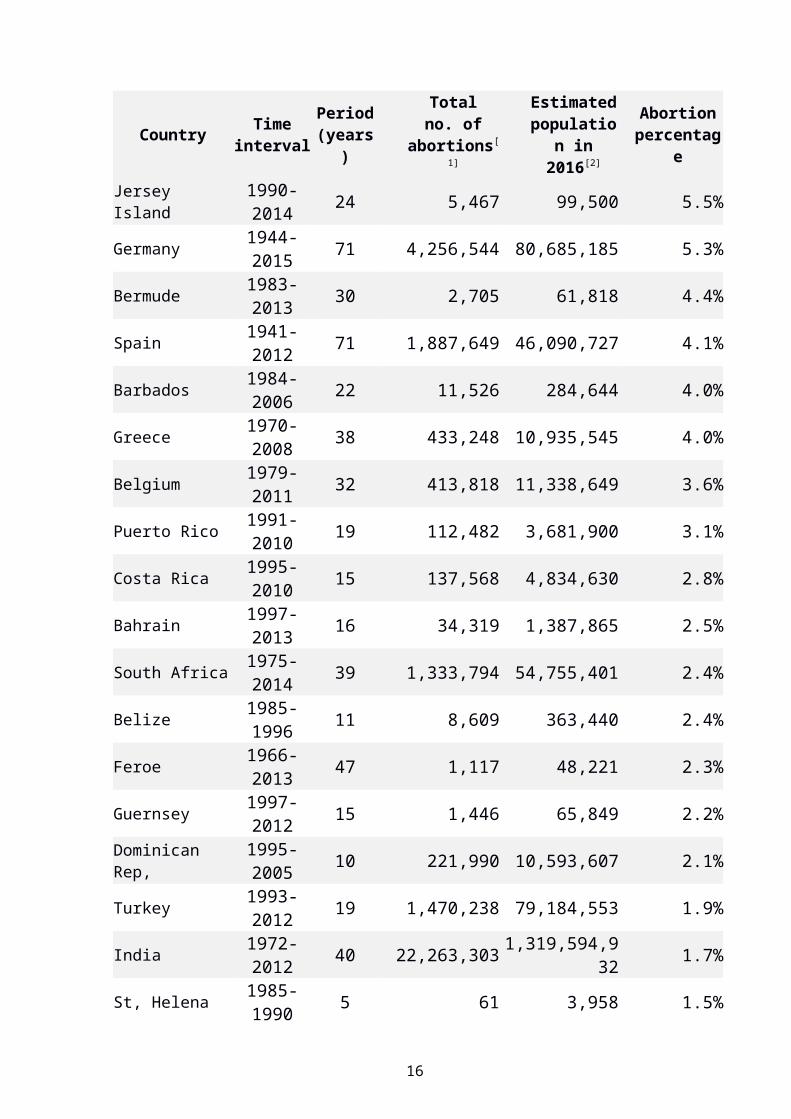
Switzerland 1966-2012 46 467,869 8,342,502 5.6%Jersey Island 1990-2014 24 5,467 99,500 5.5%Germany 1944-2015 71 4,256,544 80,685,185 5.3%Bermude 1983-2013 30 2,705 61,818 4.4%Spain 1941-2012 71 1,887,649 46,090,727 4.1%Barbados 1984-2006 22 11,526 284,644 4.0%Greece 1970-2008 38 433,248 10,935,545 4.0%Belgium 1979-2011 32 413,818 11,338,649 3.6%Puerto Rico 1991-2010 19 112,482 3,681,900 3.1%Costa Rica 1995-2010 15 137,568 4,834,630 2.8%Bahrain 1997-2013 16 34,319 1,387,865 2.5%South Africa 1975-2014 39 1,333,794 54,755,401 2.4%Belize 1985-1996 11 8,609 363,440 2.4%Feroe 1966-2013 47 1,117 48,221 2.3%Guernsey 1997-2012 15 1,446 65,849 2.2%Dominican Rep, 1995-2005 10 221,990 10,593,607 2.1%
Turkey 1993-2012 19 1,470,238 79,184,553 1.9%India 1972-2012 40 22,263,303 1,319,594,932 1.7%St, Helena 1985-1990 5 61 3,958 1.5%Portugal 1984-2014 30 148,166 10,325,192 1.4%Guam 2000-2014 14 2,281 171,083 1.3%
Data sources: [1] Summary of Reported Abortions Worldwide, through August 2015, compiled by Wm. Robert Johnston, online at
12

http://www.johnstonsarchive.net/policy/abortion/wrjp3314.html.[2] Current world population, 2016 estimates based on “United Nations, Department of Economic and Social Affairs, Population Division (2015). World Population Prospects: The 2015 Revision.”, online at http://www.geohive.com/earth/population_now.aspx.
Note: These numbers are only estimated; the result obtained by multiplying estimates must be understood only as an indicator of what could be, not as something that actually is.
* This number has been obtained based on data from Table 2.1.
13
1.2. Chart of officially reported abortions related to country population between years 1921–2015
14
2. Romanian statistics
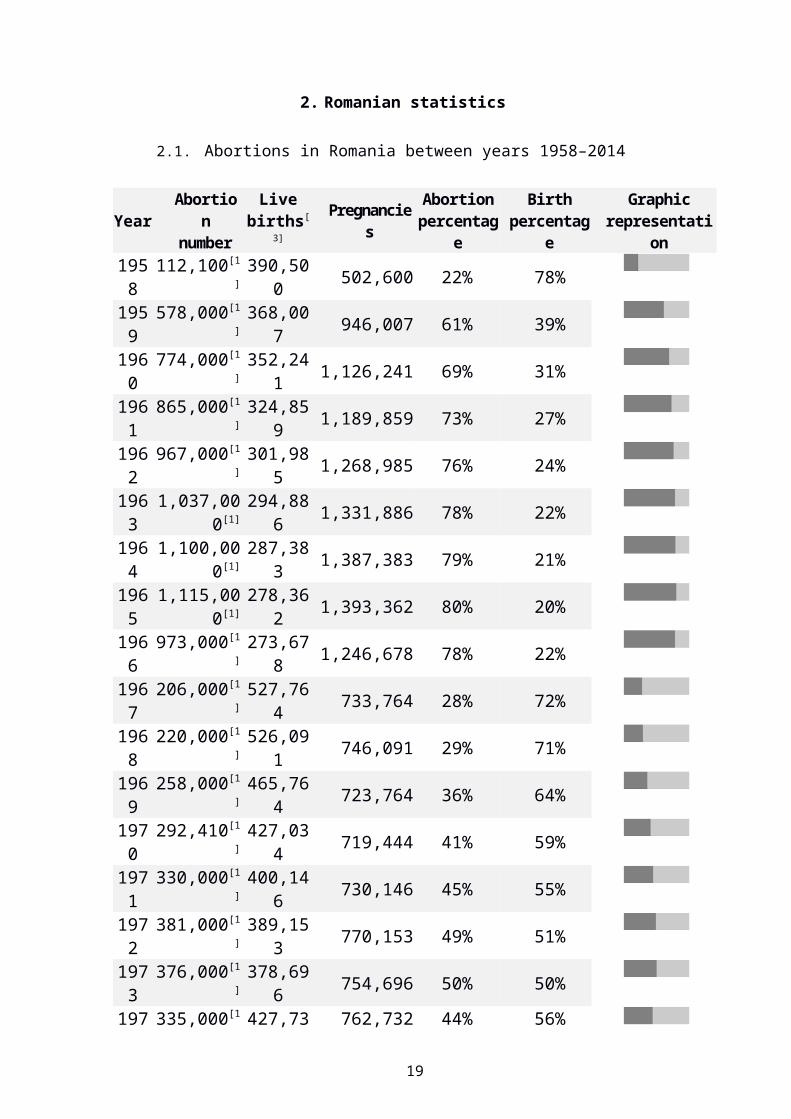
2.1. Abortions in Romania between years 1958–2014
Year
Abortion
number
Live birth
s[3]
Pregnancies
Abortion percenta
ge
Birth percenta
ge
Graphic representatio
n1958 112,100[1] 390,500 502,600 22% 78%1959 578,000[1] 368,007 946,007 61% 39%1960 774,000[1] 352,241 1,126,241 69% 31%1961 865,000[1] 324,859 1,189,859 73% 27%1962 967,000[1] 301,985 1,268,985 76% 24%1963 1,037,000[1] 294,886 1,331,886 78% 22%1964 1,100,000[1] 287,383 1,387,383 79% 21%1965 1,115,000[1] 278,362 1,393,362 80% 20%1966 973,000[1] 273,678 1,246,678 78% 22%1967 206,000[1] 527,764 733,764 28% 72%1968 220,000[1] 526,091 746,091 29% 71%1969 258,000[1] 465,764 723,764 36% 64%1970 292,410[1] 427,034 719,444 41% 59%1971 330,000[1] 400,146 730,146 45% 55%1972 381,000[1] 389,153 770,153 49% 51%1973 376,000[1] 378,696 754,696 50% 50%1974 335,000[1] 427,732 762,732 44% 56%1975 359,417[1] 418,185 777,602 46% 54%1976 383,000[1] 417,353 800,353 48% 52%1977 379,000[1] 423,958 802,958 47% 53%1978 394,000[1] 416,598 810,598 49% 51%1979 404,000[1] 410,603 814,603 50% 50%1980 413,093[1] 398,904 811,997 51% 49%1981 427,081[1] 381,101 808,182 53% 47%1982 468,041[1] 344,369 812,410 58% 42%1983 421,306[1] 321,498 742,804 57% 43%1984 303,123[1] 350,741 653,864 46% 54%1985 302,838[1] 358,797 661,635 46% 54%1986 183,959[1] 376,896 560,855 33% 67%1987 182,442[1] 383,199 565,641 32% 68%1988 185,416[1] 380,043 565,459 33% 67%1989 193,084[1] 369,544 562,628 34% 66%1990 992,265[2] 314,746 1,307,011 76% 24%1991 866,934[2] 275,275 1,142,209 76% 24%1992 691,863[2] 260,393 952,256 73% 27%1993 585,761[2] 390,500 835,755 70% 30%1994 530,191[2] 368,007 776,927 68% 32%1995 502,840[2] 352,241 739,480 68% 32%
15
Year
Abortion
number
Live birth
s[3]
Pregnancies
Abortion percenta
ge
Birth percenta
ge
Graphic representatio
n1996 455,340[2] 324,859 686,688 66% 34%
16

Year
Abortion
number
Live birth
s[3]
Pregnancies
Abortion percenta
ge
Birth percenta
ge
Graphic representatio
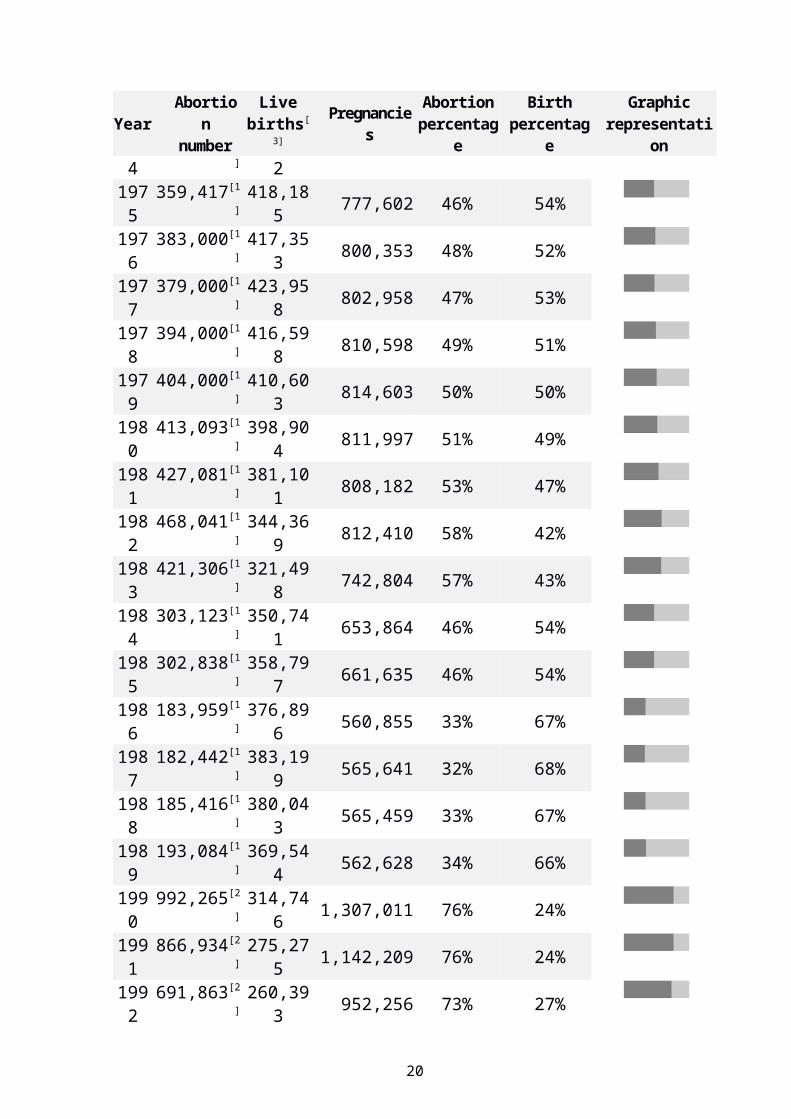
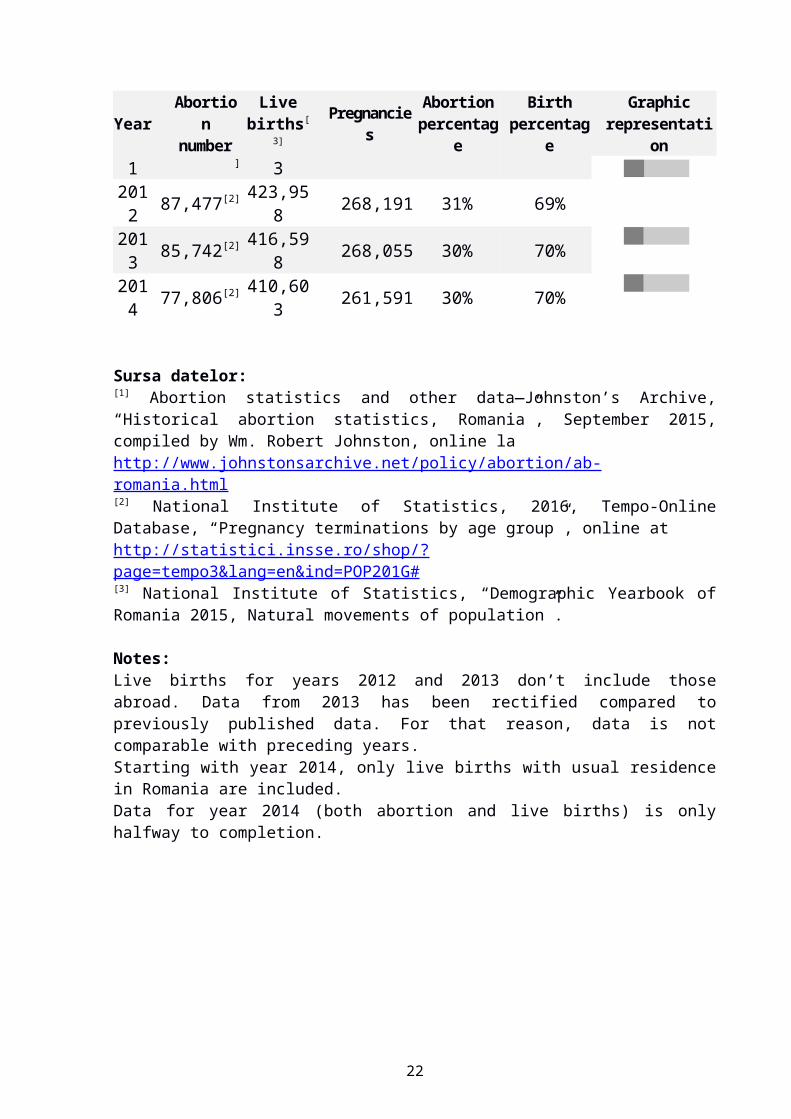
n1997 346,468[2] 301,985 583,359 59% 41%1998 270,930[2] 294,886 508,227 53% 47%1999 259,266[2] 287,383 493,866 53% 47%2000 257,267[2] 278,362 491,788 52% 48%2001 253,426[2] 273,678 473,794 54% 46%2002 246,714[2] 527,764 457,243 54% 46%2003 223,914[2] 526,091 436,373 51% 49%2004 189,683[2] 465,764 405,944 47% 53%2005 162,087[2] 427,034 383,107 43% 57%2006 149,598[2] 400,146 369,081 41% 59%2007 136,647[2] 389,153 351,375 39% 61%2008 127,410[2] 378,696 349,310 37% 63%2009 115,457[2] 427,732 337,845 34% 66%2010 101,271[2] 418,185 313,470 32% 68%2011 102,896[2] 417,353 299,138 34% 66%2012 87,477[2] 423,958 268,191 31% 69%2013 85,742[2] 416,598 268,055 30% 70%2014 77,806[2] 410,603 261,591 30% 70%
Sursa datelor:[1] Abortion statistics and other data—Johnston’s Archive, “Historical abortion statistics, Romania”, September 2015, compiled by Wm. Robert Johnston, online la http://www.johnstonsarchive.net/policy/abortion/ab-romania.html[2] National Institute of Statistics, 2016, Tempo-Online Database, “Pregnancy terminations by age group”, online at http://statistici.insse.ro/shop/?page=tempo3&lang=en&ind=POP201G#[3] National Institute of Statistics, “Demographic Yearbook of Romania 2015, Natural movements of population”.
Notes: Live births for years 2012 and 2013 don’t include those abroad. Data from 2013 has been rectified compared to previously published data. For that reason, data is not comparable with preceding years.Starting with year 2014, only live births with usual residence in Romania are included. Data for year 2014 (both abortion and live births) is only halfway to completion.
17
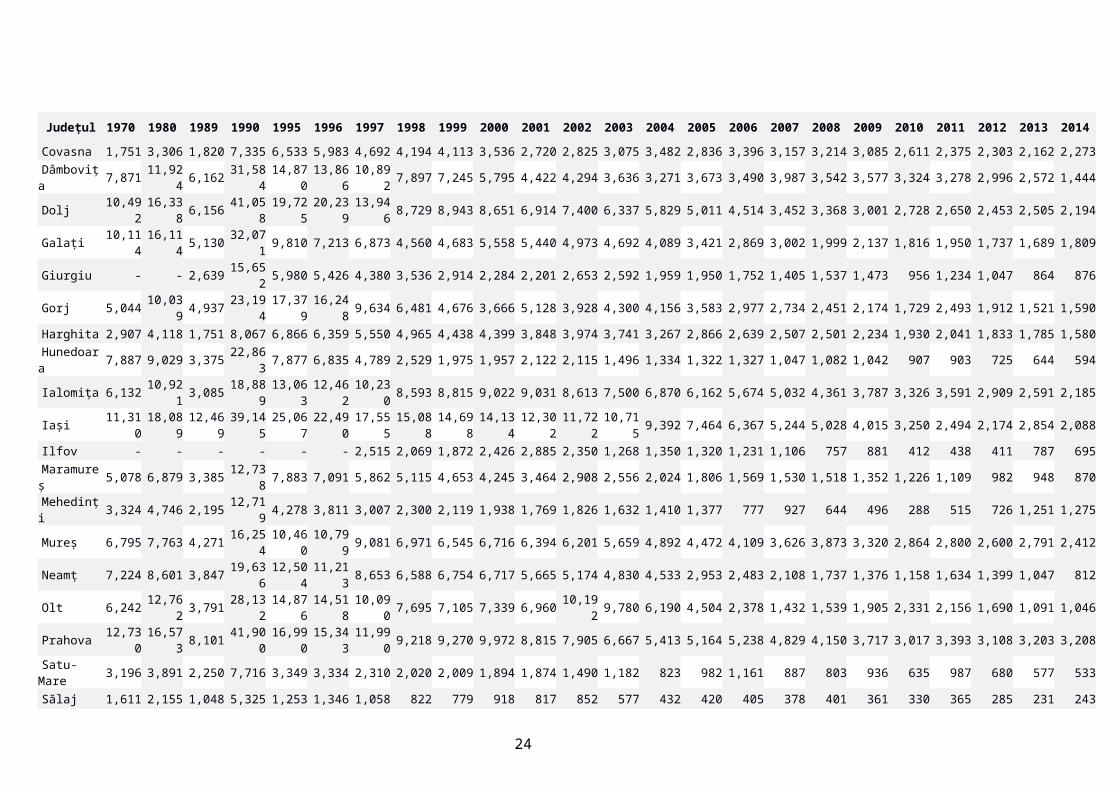
2.2. Total county (judets) abortion numbers in Romania, years 1970, 1980, 1989, 1990, and 1995–2014[4]
Județul 1970 1980 1989 1990 1995 1996 1997 1998 1999 2000 2001 2002 2003 2004 2005 2006 2007 2008 2009 2010 2011 2012 2013 2014
TOTAL 292,409 413,093 193,084 992,265 502,840 456,221 347,126 271,496 259,888 257,865 254,855 247,610 224,807 191,038 163,359 150,246 137,226 127,907 116,219 101,915 103,383 88,135 86,432 78,371
Alba 3,360 4,524 2,588 11,651 5,517 4,980 3,855 2,928 2,767 3,182 3,951 3,562 3,068 2,580 2,664 2,367 2,334 1,935 1,394 1,223 1,146 1,060 1,049 892
Arad 4,263 6,398 2,965 14,783 6,700 5,892 4,075 2,839 2,926 2,635 2,658 2,524 1,880 1,893 1,586 1,487 1,415 1,414 1,481 1,058 1,064 1,275 1,125 1,314
Argeș 10,867 17,360 4,227 34,284 13,287 12,219 11,276 8,085 8,026 9,179 10,882 10,519 10,784 7,578 5,742 5,640 5,955 6,400 4,054 3,673 2,981 2,502 2,481 2,331
Bacău 10,153 11,608 5,410 27,725 14,195 12,548 9,939 8,012 8,146 8,173 11,808 11,579 10,560 10,090 8,354 7,409 5,889 4,683 3,599 2,767 3,091 2,532 2,555 2,395
Bihor 5,586 6,460 2,773 15,959 8,616 8,160 6,765 5,901 6,055 5,662 5,565 4,636 4,802 3,476 3,074 2,927 2,982 2,775 2,593 2,550 2,009 1,849 1,733 1,509
Bistrița-N, 2,526 3,736 2,146 9,364 2,801 2,520 1,981 1,583 1,368 1,275 1,863 1,437 1,264 979 938 873 1,215 909 702 774 677 594 525 563
Botoșani 4,584 7,024 3,626 12,791 11,240 10,802 9,380 8,200 8,341 8,469 7,080 5,737 4,896 4,742 3,419 3,201 2,651 1,861 2,258 2,155 1,812 851 837 768
Brașov 7,789 10,914 4,604 29,545 11,518 10,861 7,632 6,032 5,952 6,391 9,018 11,010 8,236 7,439 6,554 6,209 5,715 5,437 4,187 3,606 3,574 2,862 2,299 2,541
Brăila 7,026 8,724 3,890 20,628 15,896 14,052 11,045 9,064 9,167 9,399 8,472 7,793 6,589 5,622 4,530 4,103 3,247 3,571 3,128 2,578 4,127 3,381 2,704 2,207
Buzău 6,299 10,409 3,658 21,608 7,673 6,783 4,957 4,032 3,399 2,987 5,626 5,370 5,922 4,609 2,624 2,650 2,550 2,191 2,051 1,623 1,528 1,255 1,314 1,209
Caraș-Sev, 4,371 6,683 3,199 15,680 8,590 8,200 6,035 4,258 3,895 4,120 3,677 3,160 2,717 2,252 2,028 1,844 1,715 1,794 1,730 1,452 1,794 1,535 1,390 1,255
Călărași - - 3,157 18,250 10,952 9,324 6,419 4,803 4,197 4,711 5,265 4,449 3,679 2,996 2,948 2,325 2,505 2,394 1,885 1,941 1,345 1,538 1,375 1,423
Cluj 7,965 9,785 4,419 20,600 11,292 10,721 8,652 6,789 6,767 5,992 6,269 6,165 5,512 4,451 4,188 4,061 4,251 4,275 4,148 3,785 3,398 3,109 2,902 2,703
Constanța 13,477 17,407 8,412 41,685 14,214 10,943 6,853 6,171 5,874 5,474 4,541 7,705 11,178 7,105 3,863 3,584 3,521 3,363 3,196 4,513 3,892 2,927 3,654 2,700
Covasna 1,751 3,306 1,820 7,335 6,533 5,983 4,692 4,194 4,113 3,536 2,720 2,825 3,075 3,482 2,836 3,396 3,157 3,214 3,085 2,611 2,375 2,303 2,162 2,273
Dâmbovița 7,871 11,924 6,162 31,584 14,870 13,866 10,892 7,897 7,245 5,795 4,422 4,294 3,636 3,271 3,673 3,490 3,987 3,542 3,577 3,324 3,278 2,996 2,572 1,444
Dolj 10,492 16,338 6,156 41,058 19,725 20,239 13,946 8,729 8,943 8,651 6,914 7,400 6,337 5,829 5,011 4,514 3,452 3,368 3,001 2,728 2,650 2,453 2,505 2,194
Galați 10,114 16,114 5,130 32,071 9,810 7,213 6,873 4,560 4,683 5,558 5,440 4,973 4,692 4,089 3,421 2,869 3,002 1,999 2,137 1,816 1,950 1,737 1,689 1,809
Giurgiu - - 2,639 15,652 5,980 5,426 4,380 3,536 2,914 2,284 2,201 2,653 2,592 1,959 1,950 1,752 1,405 1,537 1,473 956 1,234 1,047 864 876
Gorj 5,044 10,039 4,937 23,194 17,379 16,248 9,634 6,481 4,676 3,666 5,128 3,928 4,300 4,156 3,583 2,977 2,734 2,451 2,174 1,729 2,493 1,912 1,521 1,590
Harghita 2,907 4,118 1,751 8,067 6,866 6,359 5,550 4,965 4,438 4,399 3,848 3,974 3,741 3,267 2,866 2,639 2,507 2,501 2,234 1,930 2,041 1,833 1,785 1,580
Hunedoara 7,887 9,029 3,375 22,863 7,877 6,835 4,789 2,529 1,975 1,957 2,122 2,115 1,496 1,334 1,322 1,327 1,047 1,082 1,042 907 903 725 644 594
Ialomița 6,132 10,921 3,085 18,889 13,063 12,462 10,230 8,593 8,815 9,022 9,031 8,613 7,500 6,870 6,162 5,674 5,032 4,361 3,787 3,326 3,591 2,909 2,591 2,185
Iași 11,310 18,089 12,469 39,145 25,067 22,490 17,555 15,088 14,698 14,134 12,302 11,722 10,715 9,392 7,464 6,367 5,244 5,028 4,015 3,250 2,494 2,174 2,854 2,088
Ilfov - - - - - - 2,515 2,069 1,872 2,426 2,885 2,350 1,268 1,350 1,320 1,231 1,106 757 881 412 438 411 787 695
Maramureș 5,078 6,879 3,385 12,738 7,883 7,091 5,862 5,115 4,653 4,245 3,464 2,908 2,556 2,024 1,806 1,569 1,530 1,518 1,352 1,226 1,109 982 948 870
18
Județul 1970 1980 1989 1990 1995 1996 1997 1998 1999 2000 2001 2002 2003 2004 2005 2006 2007 2008 2009 2010 2011 2012 2013 2014
Mehedinți 3,324 4,746 2,195 12,719 4,278 3,811 3,007 2,300 2,119 1,938 1,769 1,826 1,632 1,410 1,377 777 927 644 496 288 515 726 1,251 1,275
Mureș 6,795 7,763 4,271 16,254 10,460 10,799 9,081 6,971 6,545 6,716 6,394 6,201 5,659 4,892 4,472 4,109 3,626 3,873 3,320 2,864 2,800 2,600 2,791 2,412
Neamț 7,224 8,601 3,847 19,636 12,504 11,213 8,653 6,588 6,754 6,717 5,665 5,174 4,830 4,533 2,953 2,483 2,108 1,737 1,376 1,158 1,634 1,399 1,047 812
Olt 6,242 12,762 3,791 28,132 14,876 14,518 10,090 7,695 7,105 7,339 6,960 10,192 9,780 6,190 4,504 2,378 1,432 1,539 1,905 2,331 2,156 1,690 1,091 1,046
Prahova 12,730 16,573 8,101 41,900 16,990 15,343 11,990 9,218 9,270 9,972 8,815 7,905 6,667 5,413 5,164 5,238 4,829 4,150 3,717 3,017 3,393 3,108 3,203 3,208
Satu-Mare 3,196 3,891 2,250 7,716 3,349 3,334 2,310 2,020 2,009 1,894 1,874 1,490 1,182 823 982 1,161 887 803 936 635 987 680 577 533
Sălaj 1,611 2,155 1,048 5,325 1,253 1,346 1,058 822 779 918 817 852 577 432 420 405 378 401 361 330 365 285 231 243
Sibiu 5,042 7,442 3,025 16,877 4,931 4,746 3,488 2,568 2,602 2,596 2,635 2,396 2,127 1,663 1,423 1,205 1,462 1,387 1,465 1,636 2,527 1,477 1,418 1,445
Suceava 7,616 9,541 4,233 19,711 9,133 7,675 6,304 4,677 4,955 4,645 4,506 3,664 3,250 2,632 2,503 2,228 1,733 1,670 1,364 1,103 1,741 1,832 1,799 1,587
Teleorman 6,093 7,373 2,033 18,392 11,114 10,344 8,426 7,082 7,737 7,508 6,551 4,292 3,837 2,223 2,177 2,091 1,981 2,176 2,001 1,664 2,159 2,415 1,957 2,100
Timiș 8,636 10,954 4,295 30,344 14,541 13,754 9,916 6,886 6,723 7,327 7,649 7,853 6,993 6,556 5,500 4,842 4,228 3,595 3,500 2,922 5,014 3,961 3,810 2,998
Tulcea 3,023 3,806 2,253 11,837 5,647 4,441 2,993 1,685 1,244 863 656 699 493 417 379 405 499 486 534 498 674 698 667 643
Vaslui 7,236 10,495 5,797 18,291 10,715 8,626 7,505 6,135 5,161 4,681 5,536 4,641 3,547 3,634 2,845 2,870 2,426 2,117 1,819 1,577 1,484 1,083 1,186 1,637
Vâlcea 6,334 11,512 4,348 21,352 17,558 15,197 9,034 6,855 6,529 6,793 5,851 5,361 4,758 4,214 4,260 3,723 3,297 3,244 3,096 2,946 2,838 1,846 1,923 1,679
Vrancea 5,148 7,216 3,635 17,266 5,311 4,342 2,744 2,090 2,017 1,930 3,083 2,618 2,380 2,348 1,827 1,650 1,652 2,187 2,267 1,980 1,834 1,569 1,773 1,492
București 37,261 46,866 31,979 159,364 82,636 74,515 54,745 45,451 42,434 42,706 38,942 39,045 34,100 30,823 28,647 28,196 25,613 23,538 22,898 19,053 16,268 14,014 14,843 13,253
Data source:[4] The National Center of Statistics and Informatics in Public Health – National Institute of Public Health (CNSISP-INSP), Natality - Fertility - Pregnancies - Abortions, 2015, online at http://data.gov.ro/dataset/demografie-populatiemedii2012/resource/5a446780-5144-4fdd-b3c8-ec9e05205f6a
19
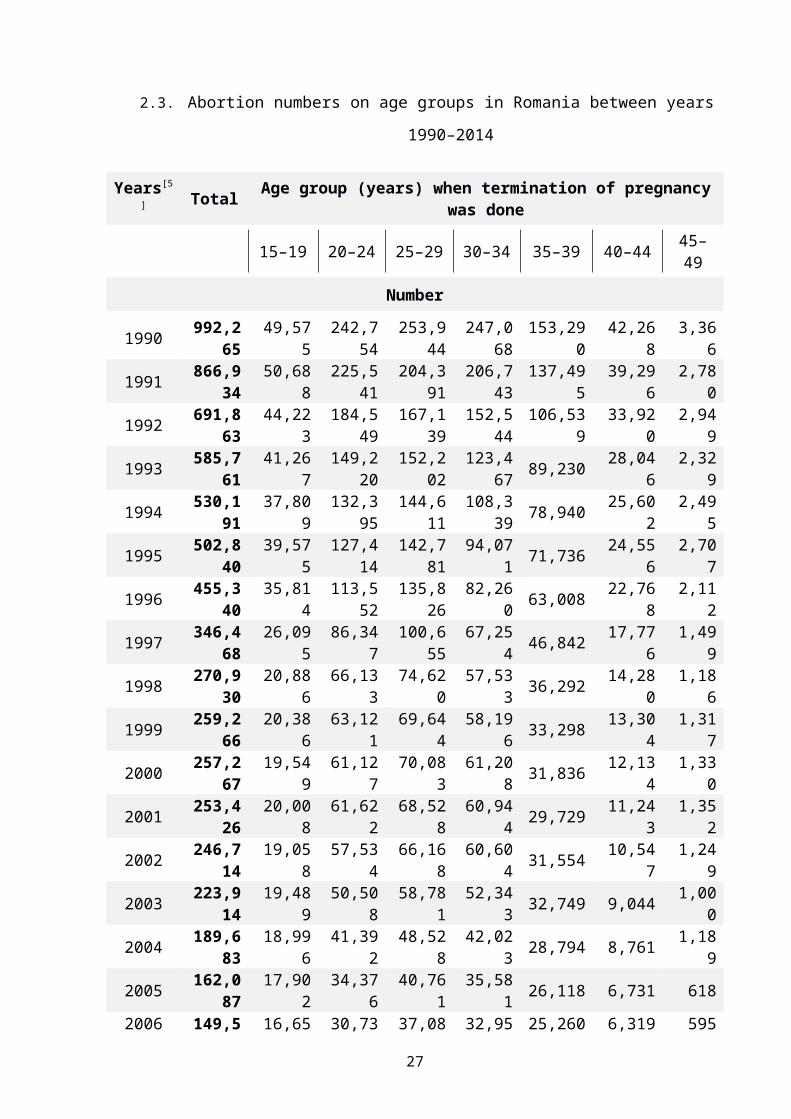
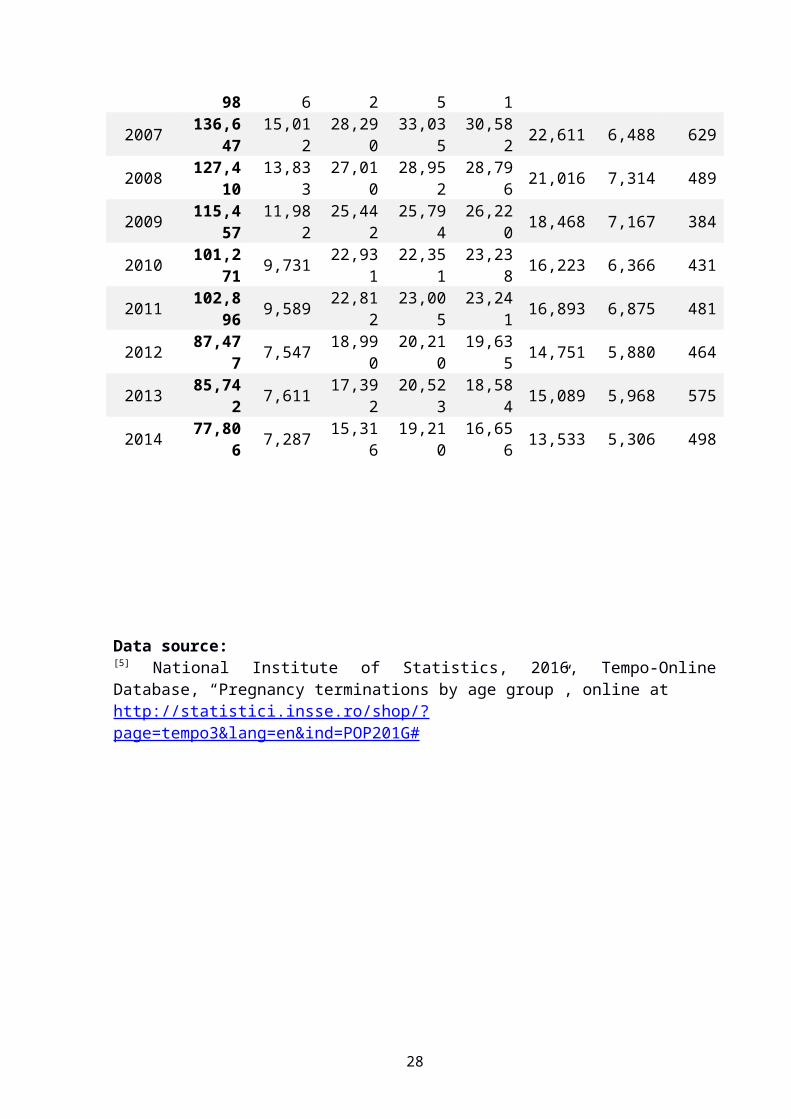
2.3. Abortion numbers on age groups in Romania between years 1990–2014
Years[5] Total Age group (years) when termination of pregnancy
was done
15–19 20–24 25–29 30–34 35–39 40–44 45–49
Number
1990 992,265 49,575 242,754 253,944 247,068 153,290 42,268 3,3661991 866,934 50,688 225,541 204,391 206,743 137,495 39,296 2,7801992 691,863 44,223 184,549 167,139 152,544 106,539 33,920 2,9491993 585,761 41,267 149,220 152,202 123,467 89,230 28,046 2,3291994 530,191 37,809 132,395 144,611 108,339 78,940 25,602 2,4951995 502,840 39,575 127,414 142,781 94,071 71,736 24,556 2,7071996 455,340 35,814 113,552 135,826 82,260 63,008 22,768 2,1121997 346,468 26,095 86,347 100,655 67,254 46,842 17,776 1,4991998 270,930 20,886 66,133 74,620 57,533 36,292 14,280 1,1861999 259,266 20,386 63,121 69,644 58,196 33,298 13,304 1,3172000 257,267 19,549 61,127 70,083 61,208 31,836 12,134 1,3302001 253,426 20,008 61,622 68,528 60,944 29,729 11,243 1,3522002 246,714 19,058 57,534 66,168 60,604 31,554 10,547 1,2492003 223,914 19,489 50,508 58,781 52,343 32,749 9,044 1,0002004 189,683 18,996 41,392 48,528 42,023 28,794 8,761 1,1892005 162,087 17,902 34,376 40,761 35,581 26,118 6,731 6182006 149,598 16,656 30,732 37,085 32,951 25,260 6,319 5952007 136,647 15,012 28,290 33,035 30,582 22,611 6,488 6292008 127,410 13,833 27,010 28,952 28,796 21,016 7,314 4892009 115,457 11,982 25,442 25,794 26,220 18,468 7,167 3842010 101,271 9,731 22,931 22,351 23,238 16,223 6,366 4312011 102,896 9,589 22,812 23,005 23,241 16,893 6,875 4812012 87,477 7,547 18,990 20,210 19,635 14,751 5,880 4642013 85,742 7,611 17,392 20,523 18,584 15,089 5,968 5752014 77,806 7,287 15,316 19,210 16,656 13,533 5,306 498
Data source:
20

[5] National Institute of Statistics, 2016, Tempo-Online Database, “Pregnancy terminations by age group”, online at http://statistici.insse.ro/shop/?page=tempo3&lang=en&ind=POP201G#
21
Years Total Age group (years) when termination of pregnancy was done
15–19 20–24 25–29 30–34 35–39 40–44 45–49
Rate for 1.000 women1990[6] 177.6 53.9 250.8 373.0 293.9 179.8 58.9 5.51991[6] 153.8 55.0 220.1 311.3 256.4 159.3 51.9 4.61992[6] 124.2 47.0 181.3 265.2 204.1 124.5 43.5 4.91993[6] 104.0 42.8 161.8 199.1 175.4 104.4 34.5 3.81994[6] 93.2 39.0 148.1 170.7 161.4 92.9 31.6 3.91995[6] 87.5 41.2 142.3 156.0 145.8 88.3 29.8 3.91996[6] 78.6 37.9 124.7 139.8 132.9 81.1 27.3 2.91997[6] 59.5 28.5 92.3 100.2 108.2 63.5 21.1 2.01998[6] 46.5 23.9 68.9 81.9 76.3 52.2 17.0 1.51999[6] 44.6 24.4 65.3 78.7 69.6 50.2 15.9 1.72000[6] 44.3 24.0 63.9 78.9 67.7 49.9 15.1 1.62001[6] 43.6 25.1 65.3 75.7 63.3 48.4 14.6 1.62002[6] 44.0 23.7 67.2 78.2 62.9 52.2 14.7 1.52003[6] 39.9 23.5 61.2 68.1 60.2 44.7 13.4 1.22004[6] 33.8 22.5 51.8 55.6 50.4 35.6 13.6 1.52005[6] 29.0 21.2 43.5 46.8 43.2 30.0 10.9 0.82006[6] 27.0 20.6 39.4 42.7 39.9 27.3 10.6 0.82007[6] 24.8 19.9 35.3 38.9 36.5 23.7 10.9 0.92008[6] 23.5 19.8 32.7 35.3 33.7 24.4 10.1 0.72009[7][8] 20.2 17.8 29.2 30.8 27.8 20.8 8.4 0.62010[7][8] 17.8 15.9 26.3 27.2 24.8 18.4 6.9 0.72011[7][8] 18.2 16.1 27.2 28.6 25.0 19.0 7.0 0.82012[7][9] 18.6 14.1 30.0 31.4 26.9 19.4 7.0 0.82013[7][9] 18.3 14.3 29.3 31.1 26.7 19.5 7.6 0.92014[7][10] 16.7 13.8 27.7 28.7 25.0 17.5 7.1 0.7
Data source:[6] National Institute of Statistics, 2016, Tempo-Online Database, “Pregnancy terminations by age group”, online at http://statistici.insse.ro/shop/?page=tempo3&lang=en&ind=POP201G#[7] National Institute of Statistics, “Demographic Yearbook of Romania 2015, Pregnancy terminations by age group”
Notes:[8] For years 2009-2011, rates have been recalculated following the dissemination of the indicator “Population by address on July 1st”.[9] For years 2012-2014, rates for 1,000 inhabitants have been calculated by resident population on July 1st of every year, estimated in conditions of comparability with the final results of the Population and Homes Census – 2011.
22

[10] Intermediary data.
23
Years Total Age group (years) when termination of pregnancy was done
15–19 20–24 25–29 30–34 35–39 40–44 45–49
Rate for 1.000 live births
1990[11] 3,158.4 1,047.5 1,726.93,812.
0 6,338.3 9,289.7 10,695.3 15,511.5
1991[11] 3,156.6 1,104.4 1,678.93,962.
5 7,488.8 11,457.9 12,960.4 14,709.0
1992[11] 2,663.0 991.2 1,426.63,439.
2 6,572.1 9,669.5 11,876.8 20,337.9
1993[11] 2,348.4 909.5 1,298.72,683.
1 6,196.3 9,118.1 10,938.4 14,929.5
1994[11] 2,153.5 865.2 1,241.62,252.
4 5,620.7 8,205.0 9,768.0 16,414.5
1995[11] 2,129.4 981.1 1,299.12,126.
2 4,965.0 8,053.9 9,573.5 16,709.9
1996[11] 1,971.9 946.7 1,220.61,930.
9 4,415.0 7,408.3 9,419.9 13,452.2
1997[11] 1,465.6 698.8 916.51,379.
9 3,195.1 5,688.9 7,229.0 9,140.2
1998[11] 1,144.0 593.7 711.61,055.
5 2,100.7 4,471.7 6,027.9 7,651.6
1999[11] 1,107.5 611.0 700.11,014.
4 1,864.7 4,061.7 5,594.6 8,607.8
2000[11] 1,099.5 615.4 708.41,004.
8 1,747.2 3,710.9 4,948.6 10,152.7
2001[11] 1,153.3 702.0 794.91,026.
0 1,689.9 3,541.3 4,831.5 9,726.6
2002[11] 1,174.9 726.1 823.81,008.
1 1,642.8 3,471.7 4,935.4 7,757.82003[11] 1,056.5 703.4 768.1 862.1 1,442.2 2,781.9 4,335.6 7,246.42004[11] 879.5 665.1 671.4 689.0 1,092.5 2,021.5 4,011.4 9,666.72005[11] 735.1 631.3 593.6 558.4 835.1 1,602.5 3,052.6 4,790.72006[11] 683.5 587.9 563.5 517.1 739.1 1,440.4 3,003.3 4,685.02007[11] 638.1 564.2 531.3 479.8 672.0 1,294.1 2,766.7 5,241.72008[11] 578.3 513.3 481.3 425.0 586.9 1,194.1 2,282.8 3,704.52009[12] 520.9 470.7 446.5 392.7 510.4 1,011.3 1,913.2 3,047.62010[12] 478.9 446.9 435.5 355.7 455.0 851.6 1,605.5 3,882.92011[12] 526.4 475.9 473.6 408.3 487.1 881.2 1,807.8 3,589.62012[12][13] 486.1 414.6 451.0 384.3 446.2 772.2 1,539.3 3,411.82013[12][13] 472.1 424.2 439.6 365.7 426.1 737.0 1,612.5 2,889.42014[12][14] 424.9 407.4 411.4 329.2 377.1 633.8 1,352.2 2,338.0
24

Data sources:[11] National Institute of Statistics, 2016, Tempo-Online Database, “Pregnancy terminations by age group”, online at http://statistici.insse.ro/shop/?page=tempo3&lang=en&ind=POP201G#[12] National Institute of Statistics, “Demographic Yearbook of Romania 2015, Pregnancy terminations by age group”
Notă:[13] Rates have been calculated for the number of live births from Romania. For that reason, data is not comparable with preceding years.[14] Starting with year 2014, only live births with usual residence in Romania are taken into account.
3. Underreporting of abortion numbers in Romanian statistics
The authors of the study „Sănătatea Reproducerii România 1999” (“Reproductive Health in Romania 1999”)7 say that their abortion estimated numbers, based on data gathered through their own investigations in 1998, were 27% higher than official statistics.
The most obvious reason for abortion underreporting in Romania is the fact that the private clinics don’t report their abortion numbers.
Dr. Mihai Horga, former Head of the Family and Social Assistance Deprtment of Romania’s Health and Family Ministry between 2000–2003, has written the following in his paper “Contraception and Abortion in Romania. Background paper for the strategic assessment of policy, programme and research issues related to pregnancy in Romania”:
„The high rate of abortion points to a considerable number of unwanted pregnancies. The total abortion rate, which is the number of abortions that a typical woman would have in her lifetime given the current age-specific abortion rate, is 70% higher than the total fertility rate (2.2 compared to 1.3). According to current estimates, for the period 1996 to 1999, the elective abortion to live birth ratio was 1.6.
(…)This estimate is roughly twice that registered in official statistics,
indicating serious underreporting in the health-care system, probably due to the private sector. According to a limited survey conducted in 2001 through Public Health Directorates, approximately 80,000 elective abortions performed in private clinics in 2000 were not reported in official government medical statistics (ed. note - approx. 30% of the total number of abortions reported by public hospitals in 2000). The real number of abortions performed in the private sector may be even higher because not all judets (ed. note - counties) have reported the number of abortions in the private sector and among judets that have reported there may be considerable underreporting from private facilities. The lack of clear regulations concerning reporting requirements for private health-care units and the scarce interest of local health authorities in
7 Șerbănescu, Florina, Leo Morris, Jay Friedman, „Studiul Sănătății Reproducerii România, 1999. Raport Final”, CDC, ARSPMS, 2001.
25

supervising the reporting system may explain this situation.”8
Also, data from the National Institute of Statistics don’t take into account chemically / hormonally-induced abortions. Prof. Virgil Ancar, Head of the Obstetrics-Gynaecology Clinic of “St. Panteleimon” Hospital in Bucharest, has estimated that such procedures could amount to 30% of the total abortion number. In conclusion, statistics could be 30% higher if we take into account this abortion method.
4. Main legal provisions regulating abortion in Romania
1936: Romania’s Penal Code forbids abortion, except for medical recommendations authorized by doctors and the General Attorney;
1957: adoption of the Decree no. 463/1957 which liberalized abortion on demand in Romania for the first time;
1966: adoption of the Decree no. 770/01.10.1966, restricting elective abortions. Abortions were permitted only by authorization of a medical commitee established through decision of the Executive Committee of the Regional People’s Council and if:
◦ the pregnancy endangered the mother’s life;◦ one of the parents suffered of a serious hereditary disease
which could end up with grave congenital malformations for the child;
◦ the woman was severely physically, psychologically or sensorially disabled;
◦ the woman was over 45 years of age; ◦ the woman had given birth to four children and cared for
them;◦ the pregnancy was the result of rape or incest.
1989: adoption of the Decree no. 1/26.12.1989 which invalidated Decree no. 770/1966;
8 Mihai Horga, MD, PhD a.o, Abortion and contraception in Romania. A strategic assessment of policy, programme and research issues, World Health Organization, Geneva, 2004, pp. 6, 15-16. See also Johnson, BR, Horga, M, Andronache, L, Contraception and abortion in Romania, Lancet, 1993; 341:875–878.
26
5. Statistics for the Republic of Moldova
5.1. Number of abortions in the Republic of Moldova between years 1995–2014[1]
YEAR Number of abortions
1995 57,1811996 46,0101997 38,2581998 33,2291999 27,9082000 26,0352001 16,0282002 15,7392003 17,5512004 17,9652005 16,6422006 15,7422007 15,8432008 15,9002009 14,6342010 14,7852011 15,7102012 14,8382013 14,5112014 13,930
Data source:[1] National Bureau of Statistics of the Republic of Moldova, 2016, “StatBank” data bank, online at
27
http://statbank.statistica.md/pxweb/Database/RO/08%20SAN/SAN04/SAN04.asp
28

5.2. Abortion rate for 100 live births on districts, regions, years, between years 2008–2014[2]
2008 2009 2010 2011 2012 2013 2014
TOTAL 41.2 36.2 36.6 40.2 37 36.8 33.8Kishinev Municipality 55 48.1 46.3 52.4 55.5 52.8 47.9
NORTH 31.6 28.4 29.8 34.9 29.7 31 31Bălți Municipality 35.1 29.1 37.4 46.5 38.8 44.8 46.3Briceni 27.6 32.3 25.3 54.9 17.8 18.6 22.4Dondușeni 29.5 29.2 31.3 24.1 24.4 22.8 16.7Drochia 36.9 41.3 36.5 32 26.5 14.4 35.3Edineț 12.8 16.4 9.5 11.9 9.2 11.4 7.9Fălești 40.2 31.7 27.6 35.5 38 22.9 17.7Florești 15.1 13.9 15.4 18.1 15.2 11.5 12Glodeni 47.3 40.8 29.1 38.1 35 44 36.2Ocnița 38.2 37 35.8 27 38.8 31.8 26.6Rîșcani 32.7 32.7 33.3 29.5 33.5 38.2 36.5Sîngerei 49.6 37.3 48 38.7 29.3 37.7 37.2Soroca 13.7 11.6 11.5 12.5 11.6 14.1 11.6
CENTER 23.3 23.1 21.5 22.3 21.6 21.5 23.5Anenii Noi 14.6 12.9 16.4 15.2 14.5 15.5 14.4Călărași 17.9 15.7 20 22.1 13.9 14.6 31.2Criuleni 21.4 24.1 25.9 29.8 34 29.3 24.2Dubăsari - - - - - - -Hincești 10 10.5 8.4 9.9 11.6 10.2 11.7Ialoveni 20.7 18.3 22.3 21.4 21 19.8 19.8Nisporeni 46.4 45.4 28.9 36.8 32.7 31.2 22.6Orhei 37 40.1 39.2 33.7 33.9 34.2 54.4Rezina 32.3 32.5 30.1 21.5 18 21 17.3Strășeni 34.5 36.1 28.5 26 21.2 22.8 22.6Șoldănești 32.7 31.5 32.5 34.9 33.8 32.5 27Telenești 9.6 6.6 6.3 7.1 6.5 7.8 7.2Ungheni 10.1 10.5 7.4 16.1 16.6 17.9 11.6
SOUTH 47.1 46.9 45.4 46.7 39.4 35.8 33.2Basarabeasca 31.6 39.6 31 21.6 15.1 23.3 17.5Cahul 93.4 98.4 80.4 83.4 65 61.5 61.2Cantemir 22 22 26.4 37.1 27.9 24.6 22.3Căușeni 39.9 26.7 31.8 24.7 29.7 26.1 27.2Cimislia 25.3 23 25.1 26 19.2 26.7 7.3Leova 22.1 17.8 26.3 38.3 32.8 33.1 36.8Ștefan Vodă 12.6 13.4 12.7 13.6 11.8 14 13.6Taraclia 75.8 177.7 128.5 132.6 118.6 29.2 15.3U.T.A Găgăuzia 16.9 15.8 16.5 18 13.8 14.7 9.6
Data source:[2] National Bureau of Statistics of the Republic of Moldova, 2016, “StatBank” data bank, online at
29

http://statbank.statistica.md/pxweb/Database/RO/08%20SAN/SAN04/SAN04.asp
6. Short history of Romania and the Republic of Moldova’s March for Life
The March for Life is a civic movement to support the life of unborn children and women in pregnancy crisis. It was first organized in the United States prima oară of America in 1974.
In 2008, the first Romanian March for Life was organized in Timișoara city.
2011 saw the first national edition of the March for Life, with the theme “Say YES to Life”, in 4 cities, on March 26th.
In 2012, Romania’s March for Life had the theme “Every Child Has a Right to Life” and was held in 21 cities across the country on March 24th.
In 2013, the Romanian March had the theme “Love Them Both” and was organized in 23 cities on March 23rd.
In 2014, Romania’s March for Life had the theme “Adoption, The Noble Choice” and was held in 40 Romanian cities on March 23rd.
In 2015, Romania’s March for Life became Romania and the Republic of Moldova’s March for Life 2015 and had the theme “Every Life Is a Gift”. It was organized on March 21st in 77 cities from Romania and 2 cities from the Republic of Moldova.
UPDATE, March 15th: 104 the cities from Romania and 16 cities from the Republic of Moldova have already confirmed participation in the 2016 edition of Romania and the Republic of Moldova’s March for Life, which has the theme “Pro-Life, Pro-Woman, pro-Family”.
30