Web-Based Load Planning & Optimization - Evos Logistics
18
Web-Based Load Planning & Optimization Computer Aided Transportation Planning for the Real World By Tom Livernash, President, and Jim Heuer, Chief Technology Updated November 2012
Transcript of Web-Based Load Planning & Optimization - Evos Logistics

Web-Based Load Planning & Optimization
Computer Aided Transportation Planning for the Real World
By
Tom Livernash, President,
and
Jim Heuer, Chief Technology
Updated November 2012
Page 2
PlanToolstrstatdeamkfaeSto,tI.ost©faedTools2t0n1yt
gtu-pptO:tI.ost©faedTools2t0n1ytt)llter?xdstekske.kmyt
Table of Contents
Overview ........................................................................ 3I
Shipment Consolidation: a Deceptively Simple Concept .... 4I
Figure 1 – One Origin, Many Destinations ...................................................... 4tFigure 2 – Multiple Origins, Many Destinations ............................................... 4tFigure 3 – Multiple Origins, Many Destinations, Pool Distribution Potential ......... 5t
Real-World Challenges .................................................... 5I
Required Delivery Dates and Times.................................................................. 6tTable 1 – On-Time Delivery Standards by Customer ........................................ 6t
Feasible Shipment Dates and Times ................................................................. 6tFreight Rates by Mode and Lane ...................................................................... 7tFigure 4 – Farther can be Cheaper when Rates are Considered ......................... 8t
Carrier Transit Times and Service Areas ........................................................... 8tLTL Carriers ............................................................................................... 8tTL Carriers ................................................................................................. 8tPool Distributors ......................................................................................... 9t
Shipping Dock Hours of Service ....................................................................... 9tShipment Characteristics vs. Trailer Type and Size ............................................ 9t
Advanced Routing Scenarios and Modes ........................ 10I
0ndkefomalt©ke.r1ktanmt3 4ldr5©doztqzkeadrons’ ............................................................ 11t
Estimating the Benefits ................................................. 12I
Table 2 – Estimated Savings from Implementing Optimized Consolidation ....... 12t
Achieving the Benefits ................................................... 12I
Web-Based Solution Engines ......................................................................... 12tDirect Web Access ....................................................................................... 13tThe Internet Enabled TMS ............................................................................ 13tContinuous Optimization .............................................................................. 14tHandling Shipment Changes during the Load Planning Cycle .......................... 14tPre-Notification to Carriers for Un-Dispatched and Locked Loads .................... 14tAppointments and Load Dispatch ................................................................ 15t
Real-world Examples ..................................................... 15I
Analysis Process .......................................................................................... 15tKey Modeling Parameters ............................................................................. 16tResults ....................................................................................................... 16tFigure 5 – Inbound Consolidation Program Example Map ............................... 17tTable 3 – Actual Cost Savings from Inbound Freight Consolidation .................. 17t
Conclusion .................................................................... 18I
About the Authors ......................................................... 18I
08/01/11

Page 3
PlanToolstrstatdeamkfaeSto,tI.ost©faedTools2t0n1yt
gtu-pptO:tI.ost©faedTools2t0n1ytt)llter?xdstekske.kmyt
Overview
The global pursuit of more responsive supply chains and lower inventories has driven a search for more effective ways to transport smaller sized shipments – while maintaining exacting standard for on-time delivery. The simple solution – ship more freight by Less-than-Truck-load (LTL) carriers – has serious cost consequences. To
deal with these cost consequences, transportation managers have exploited a variety of techniques such as shipment consolidation and pool distribution – techniques which have been enabled by acquisition of Transportation Management Systems (TMS) that have sophisticated Shipment Consolidation Optimization and planning modules. Yet the cost and complexity of implementing such systems internally have deterred many companies from their implementation.
While recognizing the transportation cost saving potential of between 10% and 40%
that such systems might bring, many companies have chosen to allocate their scarce IT resources to supporting higher priority sales or manufacturing processes. Unfortunately, it’s only with creative use of transportation resources, enabled by such tools as computer optimization in a TMS, that the twin goals of lower costs and increased supply chain flexibility can be fully attained.
New computerized logistics planning technology, delivered via the Internet, can help shippers achieve their supply chain goals far more effectively than by older, manual
planning methods and at lower cost than with traditional TMS installations on in-house computers. For example, computerized optimization tools, once irritatingly rigid and mechanical in their operation, now have the capability to handle the richly
complex challenges of grouping orders into lower cost shipments and of selecting the best transportation modes for each – and Internet delivery avoids the high cost of locally installing advanced computing technology, while bringing the results to any
desktop.
But optimization technology is only part of the solution to achieve real-world cost reduction in transportation. Equally important is the ability of the solution to fit your processes and to handle the fast-paced world of your sales and service team. Your planners need the ability to review optimization results quickly, modify them easily and re-optimize periodically – all the while releasing loads ready for dispatch to carriers. This dynamic process is referred to as “Continuous Optimization”, and has become the key to making automated load planning practical in actual transportation operations, not just in consultant’s studies. Continuous Optimization is promised by many vendors but delivered only by a few.
The purpose of this paper is to examine what advantages the Internet has brought to
traditional load optimization and TMS software and to suggest to you the capabilities you should be looking for from potential TMS and optimization vendors when you are considering implementing this new technology. We will also examine how new
innovations in Web-based load optimization in the areas of modeling capabilities, customer service standards, , user interface design and continuous load planning combine to make results more useful and realistic. Next we examine how to gain
maximal value from such solutions by accessing them from the new generation of Web-based TMS tools. Finally we will briefly explore some of the new business opportunities that this technology may allow your company to exploit.

Page 4
PlanToolstrstatdeamkfaeSto,tI.ost©faedTools2t0n1yt
gtu-pptO:tI.ost©faedTools2t0n1ytt)llter?xdstekske.kmyt
Shipment Consolidation: a Dec eptively Simple Conc ept
In the simplest case, a single plant ships to multiple points around the country via LTL. In the illustration in Figure 1 on the next page, shipments from the plant in Los Angeles can be combined into one Truck Load shipment, with one shipment to Brownsville, TX, that is still most economically sent via LTL.
Figure 1 – One Orig in, Many Destinations
When a second West Coast plant is added, the problem becomes more complex. Should shipments be combined across the plants? What is the cost implication of the extra stop to pick up product at the second plant? Still, there is the potential for further economies of scale:
Figure 2 – Multip le Orig ins, Many Destinations
In situations where you have multiple small shipments into one concentrated area, it may be more economical to drop a group of such shipments at a local pool
distribution company, which will provide local delivery using its smaller, more cost-effective delivery trucks. In this case, there are still more options for reducing cost,
LTL to Omaha LTL to Chicago
LTL to Columbus
LTL to Brownsv il le
Plantin Los Angeles
The High Cost way
Sto p in Omah a Sto p in Chicago
Final Stop in Columbus
LTL to Bro wnsv il le
Your Plantin Los Angeles
The Optimized way
LTL to Omaha LTL t o Chicago (2)
LTL t o Columbus
LTL to Bro wnsvil le
Plantin Los Angeles
Plantin San Diego
LTL t o Hou sto n
The High Cost way
Stop in Omaha Stops in Chicago (2)
Final Stop in Columbus
Stop in Brownsville
Plantin Los Angeles
Plantin San Diego
Final Stop in Houston
The Optimized way

Page 5
PlanToolstrstatdeamkfaeSto,tI.ost©faedTools2t0n1yt
gtu-pptO:tI.ost©faedTools2t0n1ytt)llter?xdstekske.kmyt
but the problem expands dramatically in complexity as illustrated in Figure 3 on the next page.
Figure 3 – Multip le Orig ins, Many Destinations, Pool Distribution Potential
Real-World Challenges
Many traffic managers attempt to achieve the savings described above. Their planners spread paper copies of their current shipments on the table, and group together those having the same or similar origins and destinations. However, even when there are relatively few shipments to be handled, human planners rarely can find a “best” solution to the grouping problem. And as the number of shipments increases into the hundreds, the number of possible combinations soars into the billions, leaving the planner to use “rules of thumb” to achieve their cost reductions, and typically missing thousands of dollars in savings opportunities.
At first glance, the problem is seen as static one: just put the right shipments
together to make good truckloads with efficient routes to the destination. Result, save thousands of dollars. In actual practice, a solution must be found across many
critical dimensions, including:
� Required delivery dates and times
� Feasible shipment dates and times
� Shipping dock hours and loading/unloading times
� Freight rates by mode and lane
� Carrier service areas and times
� Shipment characteristics vs. trailer type and size
LTL to OmahaLTL to Chicago (2)
LTL to Columbus
LTL to Brownsv ille
Plantin Los Angeles
Plantin San Diego
LTL to Houston
LTL t o scatteredSoutheast points
LTL toscatteredNewEnglandpoints
The High Cost way The Optimized way
Sto p in Omah aSto ps in Chicago (2)
Stop in Columb us
Sto p in Brownsville
Plantin Los Angeles
Plantin San Diego
Sto p in Houston
Local Pool Delivery toSoutheast points
Local PoolDelivery toNewEnglandpoints
Final TL Stop atPoolDistributor inScranton
Final TL Stop atPool
Dis tributor inBirmingh am

Page 6
PlanToolstrstatdeamkfaeSto,tI.ost©faedTools2t0n1yt
gtu-pptO:tI.ost©faedTools2t0n1ytt)llter?xdstekske.kmyt
The mass of information required to consider each of these factors in arriving at a lowest cost solution to the consolidation problem effectively dictates a computer-assisted solution. But before exploring optimization techniques, a bit of explanation
in each area is required, since the realities of each can greatly complicate problem solution.
Required Delivery Dates and Times
On-time delivery has become a mantra among logistics professionals. But what happens when delivery dates requested on purchase orders or sales orders come into conflict with the physical realities of the transportation system. LTL freight is quite reliable, but often requires a longer transit time than direct TL freight. However, in building multi-stop loads, the delays resulting from enroute stops must be recognized in determining whether final deliveries will meet delivery requirements, and may extend delivery times beyond expected LTL transit times.
In the real world, shippers prioritize shipments based on both the urgency of the delivery dates and the importance of the customers. Some customers can tolerate
more “lateness” or “earliness” than others. Experienced transportation planners come to understand where these differences can be exploited to make workable
shipping plans which keep customers “reasonably” happy, when “on paper” they fail to satisfy delivery requirements.
Automated transportation optimization tools must have this kind of sophistication as well if they are to produce results which do not have to be endlessly “tweaked” by human planners. Older optimizers tended to reject shipment sets that had too many required due-date conflicts… or simply to suggest that all shipments be sent via LTL. Instead, newer technology optimizers implement “fuzzy logic”, a recent development in the Artificial Intelligence arena, which allows customer tolerance for lateness and earliness to be specified across different classes of customers in terms that humans can understand.
For example, you might have the delivery service standards for two customers specified by the following table:
Table 1 – On-Time Delivery Standards by Customer
On-Time
Delivery
Std
Days Early Days Late
5 4 3 2 1 1 2 3 4 5
Customer “A”
Never Rarely Some-times
Some-times
OK Some-times
Rarely Very Rarely
Never Never
Customer “B”
Rarely OK OK OK OK Never Never Never Never Never
Feasib le Shipment Dates and Times
As a general rule, the greater the number of shipments to be optimized at one time, the greater the cost savings: more shipments mean a greater likelihood that suitable load mates will be found. This is an incentive to shippers to look into the future to

Page 7
PlanToolstrstatdeamkfaeSto,tI.ost©faedTools2t0n1yt
gtu-pptO:tI.ost©faedTools2t0n1ytt)llter?xdstekske.kmyt
build loads based on production or sales order schedules. But such future scheduling can present significant challenges, which differ depending on whether the company has a make-to-order or ship-from-stock business model.
Shipping schedules of the make-to-order company are driven by product availability:
either actual or scheduled. Companies that enjoy a high rate of manufacturing reliability can pre-plan shipment consolidation by loading production schedules into the optimizer. In an ideal world, the optimizer will determine the best day of the week for each consolidated load to maximize customer service and minimize carrier delays, enabling final product finishing schedules to be set based on detailed shipping schedule requirements. In effect, the shipment optimizer in such cases becomes both a planning tool and an execution tool.
In ship-from-stock companies, an optimizer which determines the best date and time for each consolidated load provides a powerful planning tool for picking and packing schedule requirements. For example, if the optimizer is run on Monday of “this
week” for orders due to arrive “next week”, the shipment plan from possibly Thursday of this week through the end of next week might be provided for. Orders which drop into the schedule at the last minute can be added to the set of shipments
not already dispatched, and the optimization re-run to find the new best shipment consolidations.
Freight Rates by Mode and Lane
For most effective optimization, LTL rates for every shipment and TL rates to every possible destination are required. Also, if a shipment might possibly be sent through a pool distribution carrier, the pool rates need to be provided. This is a major reason why load optimization is most commonly implemented as a component of a Transportation Management System or TMS. The TMS can determine the rate information for each shipment and send it to the optimizer.
Some optimizers are also equipped for stand-alone operations, in which they have their own rating engine, which can determine approximate LTL rates and look up Truck Load rates from locally stored freight rate tables at a state-to-state level.
Similarly, optimizers which can handle pool distribution options may have their own pool distribution rate engines to calculate pool costs as needed.
Why is this important? The latest optimizers don’t simply determine the shortest
distance for each Truck Load. Instead, they determine the lowest cost for each Truck Load. Since it is usually the final stop on a Truck Load delivery that determines the freight rate to be applied, both the composition of each load and the
sequence of deliveries are important in determining the lowest cost.
Take for example a load originating in Seattle with shipments bound for Los Angeles, CA, and Phoenix, AZ. A distance-based optimizer would route this shipment from Seattle to Los Angeles and a final delivery in Phoenix. On the other hand, a rate-
based optimizer will route this load to Phoenix, with a final delivery in Los Angeles, since the Seattle to Los Angeles rates per mile are normally lower than the rates from Seattle to Phoenix, and the rate differential more than makes up the cost of
270 extra miles incurred by looping back to Los Angeles.

Page 8
PlanToolstrstatdeamkfaeSto,tI.ost©faedTools2t0n1yt
gtu-pptO:tI.ost©faedTools2t0n1ytt)llter?xdstekske.kmyt
Figure 4 – Farther c an be Cheaper when Rates are Considered
Few human planners can possibly keep track of all the possible freight rates as they attempt to build a lowest cost load plan. This is yet another reason why a computer solution is virtually mandatory.
Carrier Transit Times and Servic e Areas
LTL carriers, TL carriers and pool distribution services each have unique characteristics which must be recognized if the consolidation plan is to meet the delivery requirements of customers optimally:
LTL Carriers
The expected transit time of the LTL carrier must be considered for every shipment in the solution set. Transit time standards are published by most LTL carriers, and there are services which compile this information. LTL transit times are not easily estimated simply by distance, since the number of terminals encountered en-route is a major determinant of transit time. If reliable transit time information is not available in your own computer systems or your TMS, the optimizer will need to have a way to estimate transit times, either using a generic estimation tool or by accessing one of the services.
TL Carriers
Truck load transit times are partially a matter of distance, but are heavily influenced
by the Federal hours of service regulations. In addition, transit times will be affected by the time required to stop and unload product en-route. In determining the optimum consolidations, either the human planner or the computer optimizer will
have to make transit time estimates for each proposed consolidated load. This requires information on mileage, dock schedules at each stop, loading and unloading times per unit. The computational requirements of this are substantial, and easily
beyond the abilities of a human planner in the time typically available. Sources of this information must be provided to the computer solver, which must have a means to handle it. Modern computer optimizers have these capabilities with details down
to the individual customer dock level.
Ship fromSeatt le
Drop in LosAngeles
Final inPhoenix
1500 Miles
Ship fromSeatt le
Final in LosAngeles
Drop inPhoenix
1770 Miles

Page 9
PlanToolstrstatdeamkfaeSto,tI.ost©faedTools2t0n1yt
gtu-pptO:tI.ost©faedTools2t0n1ytt)llter?xdstekske.kmyt
Pool Distributors
Load consolidation plans can include either freight consolidation services, which pick up many small LTL shipments from a region or pool distribution services, which take deliveries of multiple small LTL shipments from a line-haul Truck Load carrier and
redistribute them to their individual consignees. We refer to these in this article as “Pool Distributors”, but include both concepts in the term. Either way, the possibility of using these services adds considerably to the information requirements of the planning process and the burden on the optimizer.
Pool Distributors publish their own rates and service areas similar to the way LTL carriers do with one significant difference: pool distributors often do not offer delivery or pickup services every day of the week. For lighter volume areas, they
publish a schedule of days of the week for deliveries.
In many instances, more than one pool distribution service may be applicable to a given shipment. For example, a shipment to Columbus, OH, might be routed through either a distributor in Indianapolis or Cincinnati. In such cases, the optimization process must have access to all possible pool locations, their rates, and their schedules of delivery to determine the best routing. The number of possible solutions escalates rapidly with an increase in the number of pool distribution points. Modern computer optimizers provide either inputs for multiple pool options and costs for each shipment or a pool rating engine which allows the optimizer to determine which pool operators can handle the shipments handed to it. This feature is sometimes referred to as dynamic pool routing.
Shipping Doc k Hours of Servic e
One of the critical factors in scheduling multi-stop loads is the dock hours of each facility visited. Computerized optimizers have long had the capability of taking dock hours as input for each shipment. The challenge is storing and maintaining this
information about each customer or vendor. The modern TMS provides the database tools for this – a capability generally lacking in even the most modern sales order entry or purchase ordering systems. Alternatively, some optimizer products provide
location tables that provide a way to organize information about dock hours and other shipping and receiving dock characteristics.
A related problem is knowing how long a stop en-route will take. Historic information on average load or unload times for the product being handled is generally the basis for load/unload times in some convenient metric like “minutes per 1000 pounds”. Typically, modern computer-based optimizers provide a number of input parameters which allow the calculation of stop times as part of the
determination of whether a potential load configuration can meet customer delivery time expectations.
Shipment Charac teristic s vs. Trailer Type and Size
What are the trailer weight and cube limits? Trucks have finite limits on the weight they can carry and the cubic space they have to fill. For example, an order of lightweight goods, like pillows, won’t exceed the weight limit, but could very easily exceed the trailer’s volume capacity if cubic dimensions are not considered. Conversely, an order of very heavy materials, such as lead ingots, could quickly exceed a truck’s weight maximum before the trailer’s space is filled.

Page 10
PlanToolstrstatdeamkfaeSto,tI.ost©faedTools2t0n1yt
gtu-pptO:tI.ost©faedTools2t0n1ytt)llter?xdstekske.kmyt
It is vital, therefore, that weight and volume be calculated and included in the
optimization criteria, to ensure that the trailer is optimally utilized. The loading dock is no place for surprises, and a traffic manager’s worst nightmare is discovering at the last minute that the assigned load won’t fit on the designated truck.
Many producers ship a mix of products which both do and do not require
temperature protective services. Often, it will be economical and practical to load “dry” freight with “reefer” freight when by so doing a trailer is fully utilized. In such cases the optimization must have access to the reefer rates as well.
In even more complex cases, shipments are being consolidated where each shipment
may have its own allowable range of temperatures or hazardous material requirements. Modern freight consolidation optimizers can accept as input shipment temperature and hazardous commodity characteristics so as to be able to determine
which shipments are allowed to be loaded onto the same trailer. Ideally this commodity information is provided from the company’s order entry system or possibly the TMS; however, some computerized optimizers also provide a commodity
lookup table where temperature, volume, pallet requirements, and hazardous material specifications can be stored for lookup during shipment import.
Advanc ed Routing Sc enarios and Modes
In the real world of transportation planning, many companies confront problems much more complex than the delivery of product from one location by truckload or LTL service to multiple customers. In the last few years, optimization technology has improved to be able to handle these more complex real-world problems, enabling both shippers and specialty motor carriers and 3PL service providers to ramp up the efficiency of their operations.
Multiple Origins to Multiple Destinations: The modern manufacturer or distributor typically has multiple shipping points serving the same sets of customers.
The difficulty of solving the “many-to-many” consolidation problem prevented first generation optimization products from tackling this problem. Now, however, it is a
standard feature of many optimizers, which can handle an unlimited number of origins and destinations in the same shipment dataset. Taking this complexity one step further, modern optimizers can consider pool consolidation at the origin AND
pool distribution at the destinations for all shipments in the batch. This capability has proved extremely valuable to 3PL service providers and refrigerated transport carriers where LTL service may be extremely expensive or not available at all.
Continuous Movements: The ability for an optimization system to match up outbound customer shipments with compatible inbound shipment of materials has been a capability long sought by manufacturers. Additionally, shippers with widely diverse shipping and delivery locations have sought the ability to route trucks to perform both pick-ups and deliveries on one trip; interleaving multiple picks and drops among plants and consignees. While this scenario sounds simple enough, the optimization process must now consider several new factors such as:

Page 11
PlanToolstrstatdeamkfaeSto,tI.ost©faedTools2t0n1yt
gtu-pptO:tI.ost©faedTools2t0n1ytt)llter?xdstekske.kmyt
p( Lokstdxktde41Stxa.ktdotOktkfzd:tOk,oektrdtzr1Ss54ztatnk) tsxrzfknd*t
u( +o) t,aet1antdxktmklr.kern?tde41Stdea.kltkfzd:tdotzr1St4ztdxktnk,dtloam*t
-( +o) tlon?t1antdxkt1aeerket) ardtdotzr1St4ztdxktnk,dtloam*t
.( / rlltdxkt1aeerketo,,ketatmrs1o4ndtr,tf4ldrzlktlk?sto,tdxktloamtaektmrszad1xkmtadtdxktsafkt
drfkyt
0( 0stdxkektat1osdtdotek5oemkern?tdxktzeom41dtontdxktdearlketknteo4dk*t
Optimizers that handle these questions effectively provide the user with flexible parameters that take the user’s needs in these areas into account. Key among these parameters are those that allow the optimizer to make intelligent decisions trading off the cost of empty miles versus the cost savings from round trip operations. It also needs to have the ability to handle specialized freight rates offered by some carriers for continuous or round-trip type operations.
Dedicated Fleet vs. Common Carrier: Many shippers have dedicated fleets of trucks for inbound and/or outbound freight. Frequently these companies do not have
the option of using only their own fleet to make deliveries but must supplement their fleet’s capacity by using either Truckload or LTL service. The questions then become:
p( / xadtrstdxktozdrfalt4skto,tdxktmkmr1adkt,lkkd*t
u( / xr1xtsxrzfkndstsxo4lmtOktsxrzzkmtont1offont1aeerke*t
t
qzdrfr1adrontso,d) aektans) kestdxkskt24ksdronstO:t1onsrmkern?talltdxkt1osdt,a1doesto,tozkeadrn?tat
mkmr1adkmt,lkkdtdo?kdxket) rdxt,lkkdtsr1ktanmtzx:sr1alt4nrdt1aza1rd:ytt+a.rn?t?oomtozkeadronalt,lkkdt
1osdtrn,oefadrontrstantrfzoedandtzaedto,tskddrn?t4ztozdrfr1adronstOkd) kkntdxkt,lkkdtanmt1offont
1aeerketske.r1ksytt3 an:t,lkkdtozkeadronsteolltallto,tdxkret,lkkdt1osdstrndotatsrn?lkt1osdtzketfrlktoet
1osdtzketxo4eyttTxadtfa:tfaSktsknskt,oetzer1rn?2tO4dtrdtmoksn3dtallo) t,oetso4nmtdeamko,,st
Okd) kkntmkmr1adkmt,lkkdtanmt1offont1aeerketozkeadronsyttTotfaSktat.alrmt1ofzaerson2tdxkt
ozdrfr1adrontso,d) aektnkkmstdotSno) tOodxtdxkt,r,kmt4zketzlannrn?tzkerom(tanmt.aeraOlkt4zket
frlk2tzketxo4e(t1osdto,tdxkt,lkkdyttTxrstkns4ekstdxadtdxadtdxktekaltozzoed4nrd:t1osdstasso1radkmt
) rdxt4srn?toetnodt4srn?t,lkkdtekso4e1kst) rlltOkt1onsrmkekmytt0ntk,dekfkt1askstrdtfa:ta1d4all:tOkt
foekt1osdtk,,r1rkndtdotlka.ktsofktmkmr1adkmt,lkkdt.kxr1lkstrmlkt) xknt.ke:tlo) t1osdtT5toet5T5t
ozdronstaekta.arlaOlkyttt
t
)tsk1onmae:t4skto,tozdrfr1adrontso,d) aektdxadtozdrfr1kst4skto,tdxkt,lkkdt.kes4st1offont1aeerket
ske.r1kst1antOktastatzlannrn?tdoolt,oeter?xd5sr1rn?tmkmr1adkmt,lkkdsyttTxrst1antOkta11ofzlrsxkmtO:t
dksdrn?t.aero4stfr,ksto,t,r,kmtanmt.aeraOlkt1osdtanmtmr,,kekndt,lkkdtsr1ksta?arnsdtatmadaOaskto,t
a1d4altek1kndtsxrzfkndstanmt1offont1aeerketeadksytt
t
ntermodalSIurm-pOrIltaIs :Sep�ued�I��rmlepdt��I
Intermodal service may not seem like a useful option for LTL consolidation planning. Typically, drayage companies want to pick up full trailers or containers from a
shipping point and deliver them to the railroad ramp in a single move. At the other end, the dray company prefers to pick up the container or trailer from the ramp and
take it directly to the consignee. While this may be an economical alternative for a full TL load, it doesn’t provide a multi-stop option. But it actually CAN, if the origin or destination point for the trailer or container is actually a pool consolidation or pool
distribution facility. It is this latter case that modern optimization software will

Page 12
PlanToolstrstatdeamkfaeSto,tI.ost©faedTools2t0n1yt
gtu-pptO:tI.ost©faedTools2t0n1ytt)llter?xdstekske.kmyt
exploit to build highly efficient loads with Intermodal line haul (while still considering Intermodal as a replacement for point-to-point TL loads).
Estimating the Benefits
With all the issues of data availability and computational crunching detailed above, the question arises: “Is Shipment Consolidation optimization really worth the effort?” The answer we have found repeatedly to be “Emphatically, yes!” The table below
shows the incremental benefit from implementing computerized shipment consolidation optimization under several starting conditions – based on our own experience with clients over the last several years.
Table 2 – Estimated Savings from Implementing Optimized Consolidation
Starting from… Typical Percent Cost Savings Range
All LTL shipping by LTL carriers
20% 45%
Some LTL sent via
truckload based on simple, rigid rules
10% 25%
Systematic manual shipment consolidation
5% 12%
Ac hieving the Benefits
With these sizeable savings, why isn’t everyone implementing optimized shipment consolidation? Three major practical obstacles have hampered adoption of this technology:
py 6r?rmtanmtrfzea1dr1altozdrfr1kestdxadtek24rekmtk,dknsr.ktx4fant1oeek1dronta,dketdxkt
ozdrfr1adront
uy 0namk24adktrndkenalts:sdkfstanmtmadats4zzoedtdotzeo.rmktek24rekmt,ekr?xdteadktanmtoemket
mkdarltrn,oefadront
-y ©dadr1tonk5drfktozdrfr1adront1:1lkstdxadt1o4lmn3dtSkkzt4zt) rdxtatm:nafr1tsalkstzeo1ksst
All three of these obstacles have now been effectively cleared away by modern technology. Internet based TMS (Transportation Management Systems) and web-based optimization engines make high performance software available to shippers of almost any size. Equally important, modern technology now works with your order
planning cycle, responding to changes in customer requirements continuously, as they occur.
Web-Based Solution Engines
With the ubiquitous accessibility of the Internet, it is now possible for optimization vendors to put high performance optimizer engines on-line, freeing customers of the costs and implementation headaches of setting up such high-end computers in their own computer facilities. Vendors such as Evos Logistics Inc.., offer products that are delivered via the web and billed for on an as-needed basis. Typically, these tools are

Page 13
PlanToolstrstatdeamkfaeSto,tI.ost©faedTools2t0n1yt
gtu-pptO:tI.ost©faedTools2t0n1ytt)llter?xdstekske.kmyt
built on latest generation solution tools which can handle the complex constraints and logical interactions of Shipment Consolidation problems more effectively than older, more rigid approaches.
For example, PlanTools™ by Evos Logistics, Inc., provides its exclusive Tailored
Service approach to defining on-time delivery expectations of customers. This allows the information such as found in Table 1 above to be directly input for each customer or group of customers. The problem of the optimizer simply saying “no solution within delivery time windows” is a thing of the past.
But how, exactly can a Web-based optimizer be put to work for your company? There are two basic strategies for implementing access to these solvers.
Direc t Web Ac c ess
The quickest way to get started with optimization is to access the solver directly from a PC in your office over the Internet. Products like PlanTools™ and others allow you to navigate to a special website, upload a file of shipment information – possibly in Excel or “comma delimited” format, wait a short while for the optimizer to run, and then download a file in one of several formats that can be sent to an internal system or used to print out a shipping plan for the Shipping Department.
Under such a scenario, better solutions will result if actual truckload freight rates can
be loaded into the optimizer’s internal rating engine. Also, information on your current LTL class and discount agreements can be used to derive LTL costs for each
shipment, if that information is not available from your systems to be sent to the solver. These data setups are largely a one-time thing, with periodic update.
But, not every Traffic Manager wants to handle this kind of a process on a daily or weekly basis. Moreover, there are opportunities for mistakes and delays when human intervention in processes like these is the routine. And… it may well be time for the entire Transportation Management process to be supported by a real computer system: a Transportation Management System or “TMS”.
The Internet Enabled TMS
TMS systems have been around for a number of years, but only in the last few years have well-designed TMS products been available on a SaaS model (Software as a Service) delivered over the Internet. The advantage of the SaaS approach, accessible by any Internet browser, is evident to any Transportation Manager who
has had to fight for IS Department priority against Sales, Accounting or Manufacturing requirements.

Page 14
PlanToolstrstatdeamkfaeSto,tI.ost©faedTools2t0n1yt
gtu-pptO:tI.ost©faedTools2t0n1ytt)llter?xdstekske.kmyt
Continuous Optimization
t
The most recent breakthrough in optimization technology is, in fact, not related to the optimization itself, but in how it is integrated with your order entry and
management processes. Until recently, optimization was a one-time function in the order flow. Once an order had gone through the optimization process, any subsequent changes to customer requirements had to be handled manually. The
result was often drastic changes to the optimized plan and loss of much of the hoped for cost savings – or the planning process was stopped completely, all orders were
put on hold and the optimization was repeated. Basically, the optimization software hindered the order management flow, rather than working with it.
The solution is sometimes referred to as “Continuous Optimization”, by which is meant that in the planning cycle orders remain accessible to the optimization process very nearly to the point of carrier dispatch. Optimizations are re-run repeatedly, as necessary, to handle customer- or production-driven changes to quantities, schedules, added orders, deleted orders and the like. When a load is ready for dispatch to the carriers, it is released from the Continuous Optimization process and made available for carrier dispatch. Other loads, that may not be as full as desired, may be held (consistent with customer service requirements) in the Continuous Optimization pool awaiting new orders and further optimization runs.
While this sounds perfectly logical – and actually the way human planners typically
work during a manual planning order cycle – the optimization software has to be designed to handle the many ramifications of this type of planning:
Handling Shipment Changes during the Load Planning Cyc le
At any one point in time, a Continuous Optimization process will typically have a
number of partial loads built in prior optimizations – and waiting for more orders to possibly fill them out in subsequent optimization runs. The optimization software managing these loads needs to be able to respond to changes to shipments that may
already be in loads and alert the planner to situations where capacity or delivery requirements may make a load infeasible. Since the system is designed to accept new orders from the order management system continuously during the day, the
tracking of order changes and their impact on pre-built loads must also be dynamic and easily accessible by the planner.
Pre-Notific ation to Carriers for Un-Dispatc hed and Loc ked Loads
Often the planner will decide to hold an under-capacity load for a few hours or days in hopes more customer orders will become available to fill the capacity. Or the planner may know that a customer order change is pending and wants to wait until it is received before actually sending the load out for dispatch to the carrier. Still, carriers want as much notice as possible to plan their equipment positioning, and the planner may wish to get capacity commitments from the carrier for some of these loads. A pre-notification function which sends information about the loads to the carriers fills this need. But… wait, there’s a problem. What if a subsequent optimization run breaks apart this load or, just as bad potentially, adds a shipment to a more distant point to the load resulting in the load terminating well outside the planned carrier’s service area.

Page 15
PlanToolstrstatdeamkfaeSto,tI.ost©faedTools2t0n1yt
gtu-pptO:tI.ost©faedTools2t0n1ytt)llter?xdstekske.kmyt
That problem is addressed in Continuous Optimization by “Load Locking”. This allows the planner to “Lock” the load such that the optimizer will keep the load intact in subsequent optimizations, even though it may add more shipments as vehicle
capacity permits. Optionally the planner can lock the “final stop” so that commitments to the carrier about the final destination can be met. In such a case, the optimizer will consider adding shipments to the load, but only if it can continue to terminate at the locked “final stop”.
Appointments and Load Dispatc h
With loads spending more time in the optimization planning pool during a Continuous Optimization process, the need increases for being able to manage pickup or delivery appointments during the process. Appointments need to be made and recorded in the shipment records. And, just as important, the optimizer needs to recognize those appointments as fixed schedules and respect those schedules during subsequent optimizations.
Modern optimization systems that support Continuous Optimization processes provide a mechanism for storing appointment contact information and standing appointment schedules and making this information available to the planners in the
same screens they use for managing loads and shipments. For example, the PlanTools™ system provides the ActivePlan™ screens, where loads can be managed, appointments recorded, and other functions can be performed in a single interactive
screen.
When the load planner wants to take no further action on a load and is ready for it to be released to the carrier for Dispatch, the load can be moved to “Finalized” status. Typically, that removes it from the Continuous Optimization shipment pool and sends data about the load to the TMS or the order management system for shipment execution. Some optimization software may even be able to generate bills of lading and carrier dispatch documents for customers that do not have a full fledged TMS.
Real-world Examples
The following pages depict an example of actual an Evos Logistics’ client data, including actual costs incurred using the client’s previous inbound freight
management process and the improvement achieved by the use of Web-based Shipment Consolidation optimization and TMS systems.
The company is a retailer located in the Pacific Northwest. They managed their own inbound freight doing some manually planned consolidation of large mark LTL but moving most freight either by truckload or using a major LTL carriers.
An analysis was first performed to determine the best transportation strategy given
the company’s shipping patterns and service requirements. This analysis included determining the number, location and service areas for inbound consolidation points or “pool points”.
Analysis Proc ess
1. Collected inbound shipping data for freight currently serviced by truckload and LTL carriers.
Page 16
PlanToolstrstatdeamkfaeSto,tI.ost©faedTools2t0n1yt
gtu-pptO:tI.ost©faedTools2t0n1ytt)llter?xdstekske.kmyt
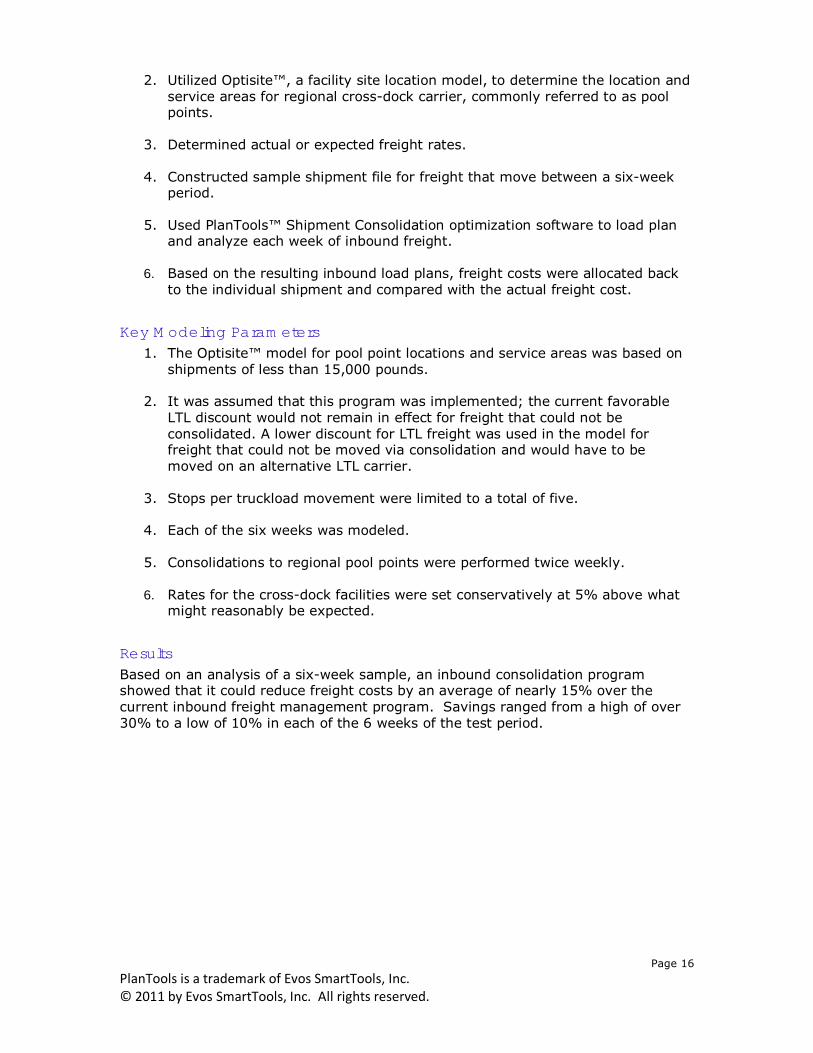
2. Utilized Optisite™, a facility site location model, to determine the location and service areas for regional cross-dock carrier, commonly referred to as pool points.
3. Determined actual or expected freight rates.
4. Constructed sample shipment file for freight that move between a six-week period.
5. Used PlanTools™ Shipment Consolidation optimization software to load plan and analyze each week of inbound freight.
6. Based on the resulting inbound load plans, freight costs were allocated back
to the individual shipment and compared with the actual freight cost.
Key Modeling Parameters 1. The Optisite™ model for pool point locations and service areas was based on
shipments of less than 15,000 pounds.
2. It was assumed that this program was implemented; the current favorable LTL discount would not remain in effect for freight that could not be
consolidated. A lower discount for LTL freight was used in the model for freight that could not be moved via consolidation and would have to be moved on an alternative LTL carrier.
3. Stops per truckload movement were limited to a total of five.
4. Each of the six weeks was modeled.
5. Consolidations to regional pool points were performed twice weekly.
6. Rates for the cross-dock facilities were set conservatively at 5% above what might reasonably be expected.
Results Based on an analysis of a six-week sample, an inbound consolidation program showed that it could reduce freight costs by an average of nearly 15% over the current inbound freight management program. Savings ranged from a high of over 30% to a low of 10% in each of the 6 weeks of the test period.

Page 17
PlanToolstrstatdeamkfaeSto,tI.ost©faedTools2t0n1yt
gtu-pptO:tI.ost©faedTools2t0n1ytt)llter?xdstekske.kmyt
Figure 5 – Inbound Consolidation Program Example Map
The table below and on the next page shows a summary of the client’s shipments for the six-week period. The un-optimized charges indicate what the company paid using its current planning methods. The next column shows what the charges would be; using load optimization plan created specifically for the client’s shipping patterns and business rules.
Table 3 – Ac tual Cost Savings from Inbound Freight Consolidation
Week Number of Shipments
Un-optimized Charges
Optimized Charges Savings
Perc ent Saved
1 445 $158,568 $138,451 $20,117 14.53%
2 418 $147,019 $130,328 $16,691 12.81%
3 411 $141,057 $128,052 $13,005 10.16%
4 391 $158,873 $121,721 $37,152 30.52%
5 455 $165,873 $141,695 $24,207 17.08%
6 445 $165,102 $138,474 $26,628 19.23%
$936,521 $798,721 $137,800 14.71% Avg. for the 6 weeks

Page 18
PlanToolstrstatdeamkfaeSto,tI.ost©faedTools2t0n1yt
gtu-pptO:tI.ost©faedTools2t0n1ytt)llter?xdstekske.kmyt
Conc lusion
The Internet revolution is alive and well, transforming the way traffic managers drive down the costs of LTL transportation. Aggressive companies are already beginning to exploit the powerful opportunities presented by new optimization technology and second generation TMS software delivered via the Internet.
About the Authors
Tom Livernash is President and co-founder of Evos SmartTools, Inc., He has over 30 years experience in Logistics Management, including positions with Schneider
National, Ryder Dedicated Logistics and John Labatt Foods. From 1993 until 2011, he directed the logistics consulting and management activities of Flow Logistics, LLC. In 2011, Flow Logistics merged with M-P System Services, Inc., the producer of the
PlanTools™ optimization system to form Evos SmartTools, Inc. Tom can be reached at 1-541-330-0222 or [email protected].
Jim Heuer is Chief Technology Officer for Evos SmartTools, Inc. His 30 years in Logistic Management have included consultation with A. T. Kearney, Inc., and logistics management at several major shippers. He is the designer of the PlanTools™ Shipment Consolidation optimizer. For more information see www.smarttools.com. Contact Jim at 1-503-335-8380 or [email protected].