WEB-APPLICATION FOR GATHERING, ANALYZING, AND PROCESSING HEALTH
52
i WEB-APPLICATION FOR GATHERING, ANALYZING, AND PROCESSING HEALTH INFORMATION ABOUT ALLERGY DATA. Case study: the province of Castellón, Spain Agafia Ochneva
Transcript of WEB-APPLICATION FOR GATHERING, ANALYZING, AND PROCESSING HEALTH

i
WEB-APPLICATION FOR GATHERING, ANALYZING, AND
PROCESSING HEALTH INFORMATION ABOUT ALLERGY DATA.
Case study: the province of Castellón, Spain
Agafia Ochneva

ii
Web-application for gathering, analyzing, and processing
health information about allergy data.
Dissertation supervised by
PhD. Oscar Belmonte Fernández
Dissertation co-supervised by
PhD. Roberto Henriques (ISEGI)
PhD. Jorge Mateu Mahiques (UJI)
March 2013

iii
ACKNOWLEDGMENTS
This thesis would not have been possible without the support of many people. First, I
would like to thank to my supervisor of this research professor Oscar Belmonte
Fernández, who inspired me greatly to work on this project and who was abundantly
helpful and offered invaluable assistance, support and guidance. I wish to express
my sincere gratitude to my co-supervisor prof. Jorge Mateu Mahiques for his
encouragement and his useful suggestions, which helped me to improve the thesis. I
would also like to thank my co-supervisor in the Universidade NOVA de Lisboa
prof. Roberto Henriques for his able guidance and valuable assistance. I am
especially thankful for the support of all professors through the whole master
program. I would like to show my greatest appreciation to professors of the
Universitat Jaume I, especially prof. Joaquín Huerta Guijarro and prof. Ismael Sanz,
without whose knowledge and assistance this study would not have been successful.
I thank professors from the University of Münster, especially prof. Edzer Pebesma
for valuable knowledge in scientific thesis writing and paper presentation and prof.
Christian Kray, who sparked my interest in the web technologies and LBS. Also, I
take this opportunity to express my gratitude to Dolores Catherine Apanewicz. I can't
say thank you enough for her tremendous support and help. In addition, I would like
to thank the Hospital de Sagunto and my special thanks to Dr. Ernesto Enrique
Miranda, Unidad de Alergia, who devoted his time and provide data for this research
and other valuable information as the guidance of the project.

iv
Web-application for gathering, analyzing, and processing
health information about allergy data.
ABSTRACT
Geoinformation technologies (GIS) are becoming increasingly popular and can be
valuable in a large numbers of disciplines, both in the scientific and the commercial
sector. Particularly, GIS technologies have a big potential in the health sector. One of
the research challenges in the field of health is how pollen allergy variation depends
on the geographic location of the patient. In this work we are motivated to show
capabilities of geoinformation technologies in studies of pollen allergy. An analysis
of the phenomenon of pollen allergy based on the project Alergologia-2005 and the
example of allergy monitoring in the Hospital De Sagunto in Spain, allows to
formulate requirements to the technologies used. The client application and server
system, integrated in a web service, help scientists explore pollen allergy and attempt
to handle it, as well as help patients to be able to control the disease. The designed
client interface provides a platform for collecting volunteered geographic
information (VGI) from people suffering from allergies and supply them with
information about pollen counts. At the same time, the server side of the application
provides secure storage of geoinformation and opportunities for its retrieval for
analysis, including visualization on a map. Health practitioners can display
information from patients and compare it with other characteristics of the place, such
as weather conditions. The thesis contributes to the field of geospatial technologies,
offering unique solutions for studies of pollen allergy in the province of Castellón,
Spain.

v
KEYWORDS
GIS Applications
Pollen allergy
RESTful web application
Volunteered geographic information
Public health data
Climate data

vi
ACRONYMS
AJAX - Asynchronous Javascript and XML;
API - Application programming interface;
CSS - Cascading Style Sheets;
HTML - HyperText Markup Language;
HTTP - HyperText Transfer Protocol;
JPA - Java Persistence API;
JQPL - Java Persistence Query Language;
JSON - JavaScript Object Notation;
REST - REpresentational State Transfer;
RSS - Rich Site Summary;
UML - Unified Modeling Language;
URI - Uniform Resource Identifier;
URL - Uniform Resource Locator;
VGI - Volunteered geographic information;
XML - eXtensible Markup Language.

vii
INDEX OF THE TEXT
ACKNOWLEDGMENTS ............................................................................................................. iii
ABSTRACT .................................................................................................................................iv
KEYWORDS ............................................................................................................................... v
ACRONYMS ...............................................................................................................................vi
INDEX OF THE TEXT ................................................................................................................. vii
INDEX OF TABLES ................................................................................................................... viii
INDEX OF FIGURES ................................................................................................................. viii
1. INTRODUCTION .................................................................................................................... 1
1.1 Theoretical framework ................................................................................................... 1
1.2. Objectives of the study ................................................................................................. 1
2. BACKGROUND ...................................................................................................................... 4
2.1. Pollen allergy and its characteristics ............................................................................. 4
2.2. Existing Internet projects of pollen allergy ................................................................... 5
2.3. Pollen allergy studies in Spain ....................................................................................... 6
2.3.1. Alergológica 2005 ................................................................................................... 6
2.3.2. Pollen data ............................................................................................................. 7
2.3.2. Patients data .......................................................................................................... 7
2.4. Conclusion ..................................................................................................................... 8
3. IMPLEMENTATION ............................................................................................................. 10
3.1. Distributed systems and its architecture .................................................................... 10
3.2. Client side .................................................................................................................... 13
3.2.1. Client side functions ............................................................................................. 13
3.2.2. Design of the user interface. ................................................................................ 16
3.2.3. The client side implementation. .......................................................................... 17
3.3. Server side ................................................................................................................... 27
3.3.1. Server architecture ............................................................................................... 27
3.3.2. JAX-RS services ..................................................................................................... 30
3.3.3. Java Persistence API ............................................................................................. 33
3.4. Deployment ................................................................................................................. 35
4. CONCLUSIONS AND FUTURE WORK ................................................................................... 37
4.1. Conclusions ................................................................................................................. 37
4.2. Future work ................................................................................................................. 39
REFERENCES ........................................................................................................................... 41
ANNEX 1: Asthma Control Questionnaire .............................................................................. 44

viii
INDEX OF TABLES
Table 1. The characteristics of the login process. .................................................................. 18
Table 2. The characteristics of the registration process. ....................................................... 19
Table 3. The characteristics of the reporting process. ........................................................... 23
Table 4. The characteristics of the pollen counts retrieving process. ................................... 24
Table 5. The characteristics of the patients and meteorological data retrieving process. .... 25
INDEX OF FIGURES
Figure 1. Interaction of web application components. .......................................................... 11
Figure 2. The representation of the server as a "black box".................................................. 14
Figure 3. The use case diagram of the client side processes. ................................................ 15
Figure 4. The index page of the web application. .................................................................. 17
Figure 5. Registration inline form. ......................................................................................... 19
Figure 6. The realization of hints in the registration form ..................................................... 20
Figure 7. The realization of error messages in the registration form. ................................... 20
Figure 8. A map with the option of automatic geolocation. .................................................. 21
Figure 9. The questionnaires on the report.html page. ......................................................... 22
Figure 10. The interval date picker in the report form. ......................................................... 22
Figure 11. Mapping the nearest station. ................................................................................ 23
Figure 12. Chart of pollen counts in 2012. ............................................................................. 24
Figure 13. Date picker. ........................................................................................................... 25
Figure 14. Visualization of patients data with meteorological information. ......................... 25
Figure 15. Displaying of maps of two different meteorological variables. ............................ 27
Figure 16. Dataflow according the server side representation. ............................................ 28
Figure 17. Class diagram ........................................................................................................ 30
Figure 18. Entity manager. ..................................................................................................... 34
Figure 19. The AllergySpain.com web application scheme .................................................... 35
1
1. INTRODUCTION
1.1 Theoretical framework
One of the key moments in modern science is a multidisciplinary approach to
research, understanding some phenomena and solving practical problems. An
example of multidisciplinary interoperability is a study of the role of "place" in
shaping health and health inequalities (Cummins S., 2007). The dependence between
geographic location of the patient and variation of symptoms of allergy arouses the
particular interest in healthcare sphere. In this study, we consider such dependencies
for grass pollen allergy or pollinosis.
Pollen allergy is a disease that is growing in developed and developing countries,
especially in urban areas. It was quite rare at the beginning of the last century but has
now risen to true epidemic proportions (Mingomataj E., 2007). Its growth is related
with the increase of the pollution in the air, water, food and so on.
Scientists are working on the solution to the “allergy epidemic” with the intent to
determine causing factors of the increasing allergy and how this disease could be
reduced (D'Amato, 2002). When we need to analyze the phenomenon, according to
its geographical position, the use of geographic information (geoinformation)
technology is a solution. Thus, the motivation and main purpose of this study is to
find out the answer to the following research question : How GIS technologies can
be useful in the study of grass pollen allergy?
1.2. Objectives of the study
In order to answer the research question the objectives, tasks and expected result
should be formulated.
Having up to date data becomes extremely important in any scientific research. Data
provided by citizens (volunteered geographic information) could be especially
2
valuable in the public health area. The idea of volunteered geographic information
(VGI) as defined by Michael Goodchild in 2007, centers on humans as sensors that
voluntarily create, assemble and disseminate geographic data (Goodchild M., 2007).
People suffering from allergies can provide information on how they feel today
together with their geographical location. This enables scientists to analyze the
manifestation of allergy symptoms based on "place" factor. Then we are faced with
the question of how to organize the processing of data acquisition from citizens.
Thereby, the first goal is to have an input platform to gather daily health information
about the manifestation of symptoms caused by pollen allergy from citizens with
geographic location of each person.
A key issue is to develop useful and easy to use tools for citizens to provide their
data. But an equally important challenge is to motivate people suffering from
allergies to submit information regularly. There are number of motivational tools,
such as payment for information or the use of gaming techniques. Both of these
methods are not suitable for the collection of pollen allergy data. Firstly, gathering
should have non-profit basis and, secondly, most of the potential audience of people
who may be suffering from allergies (senior citizens, businessmen) would not be
interested in games. But there is a better mechanism to encourage citizens to provide
information: to give useful feedback. For example, to give people useful information
about the concentration of pollen in the air or individual advice from doctors. This
information allows a person to take medication in advance or to know about the
period when it is better to stay away from natural areas. So, the second objective is
to create a tool to give users feedback with information about the diffusion of pollen
grains.
Once data is successfully collected, it is necessary to be sure that data is securely
stored with convenient access. Thus, another purpose of this study is to provide a
tool for safe storage and retrieval of the data.
The task is not only to give scientists the coordinates of the place where certain
symptoms were recorded, but to supply them with all the characteristics of the place,
which can be useful for research purposes. Considering features of pollen allergy it is
worth examining the data on the weather or air pollution. The next objective is to

3
provide data for researchers to track changes in the environment. The last goal is to
make it possible to compare changes in the environment and the manifestation of
allergy among citizens.
Thereby, the formulated goals help to form a full picture of the work ahead and the
expected outcome. Summing up, it is a solution for collecting and storing data from
people suffering from allergies, with the ability to retrieve and visualize it together
with related data for this area, such as weather conditions. At the same time, it is a
tool to provide citizens with information about the concentration of pollen grains in
different locations. For interoperability and information sharing between these
features, they should be integrated into a single distributed system.

4
2. BACKGROUND
This chapter examines the background for the thesis. Before starting to apply any
technologies, the important issue is to understand the needs of potential users. It is
necessary to accumulate knowledge about the phenomenon of allergy, its studies, and
to explore the experience of researches in health institutions in various countries and
regions. The analysis of web pollen allergy projects helps to learn what has been
done in this field, while paper-based projects can provide insight into new areas of
implementation of geoinformation technologies. All this information helps to
understand what needs to be developed to help health practitioners in their
researches.
2.1. Pollen allergy and its characteristics
Pollen allergy or pollinosis is an allergy caused by allergenic pollens from trees or
plants that pollinate through the air (Subiza Garrido-Lestache, J., 2004). The
allergenic content of the atmosphere varies according to climate, geography and
vegetation.
Grass pollen allergy disease becomes more and more ubiquitous. The prevalence in
the general population is estimated to be between 10% and 25% and marked
increases have been noted in recent decades, especially in developed countries,
although the exact figures vary depending on the age of the patients in the sample or
their geographic distribution (Bousquet J., 2001).
The most popular manifestation of pollinosis is allergic rhinitis. It is usually
associated with ocular symptoms, as a result of which it is common to use the term
rhinoconjunctivitis. According the Spanish epidemiologic study Alergológica-2005
the 55.5% of patients has rhinoconjunctivitis and 37% of patients suffered from
asthma (Navarro Pulido A., 2009).
One of the methods used for monitoring grass pollen allergies is pollen counts.
Pollen counts helps to determine the months in which the highest concentrations of
allergenic pollens occur and enable identification of the pollen types causing
pollinosis in a particular geographical area. This data also make it possible to design
pollen calendars with the approximate flowering period of the plants in the sampling

5
area (D'Amato, G. 2007). Even though pollen production and dispersal are different
from year to year, it could be possible to make a forecast of the allergenic pollen
concentrations.
This knowledge is essential to reduce the exposure of allergic patients to pollen
during the days of higher pollen concentration and to take preventive measures when
planning outdoor activities. (Pérez-Badia R., 2010).
To provide data about pollen counts is not a difficult task. This information is usually
available in open access on web sites or by personal request in hospitals. However,
providing forecasts for citizens is a complex process that involves different aspects.
Firstly, it is important to have clear knowledge about the relationships between
pollen allergy and meteorological changes, environmental pollution and other
factors. And also, the reaction to pollen grains varies for different people, depending
on the state of their health. So, the ability to analyze the level of pollen concentration
at different time periods, with reference to the weather conditions is a significant
factor in pollen allergy studies, as well as having the data about the health status of
the patient in the same periods of time.
Several scientific institutions around the world use information technologies to
interact with citizens: provide information for them about pollen counts, forecasts
etc, and organize citizens health data acquisition.
2.2. Existing Internet projects of pollen allergy
Many citizen-science projects are now taking advantage of mobile phones and other
consumer electronic devices with recording capabilities for easy data collection. The
internet has also been a way to collect information from citizens. With these
technologies it is also possible to send some feedback to users. Currently, there are a
number of project running in the allergy sphere in different countries:
1. The Austrian pollen warning service (The Austrian Polleninformation, 2013)
developed by the Medical University of Vienna. The project was created to
inform citizens about the current pollen count. The Austrian pollen warning
service is through the voluntary association and voluntary cooperation of all

6
colleagues from the provinces which came to create cross-country situation
reports and forecasts.
This project also has a subproject "Pollen Diary" (Pollen Diary, 2013). It is
intended to collect data on people who suffer from grass pollen allergy.
2. PollenUK (PollenUK, 2013) was developed with the cooperation of the
British Aerobiology Federation (BAF) and the National Pollen and
Aerobiology Unit at the University of Worcester. PollenUK gives users
information on pollen, fungal spores, allergies and pollen forecasts, based on
the UK pollen monitoring network.
3. Pollen.com. (Pollen.com, 2013) Web application was developed in the USA.
It daily provides allergy information and allergy forecasts for the allergy
sufferers.
However, there is still a problem with cooperation between researches and people
who are allergic in many countries. Spain is one of them.
2.3. Pollen allergy studies in Spain
2.3.1. Alergológica 2005
There is currently no functioning generally known internet project in Spain to collect
data from citizens or for its analysis. But there are a number of studies.
In 1992, the Spanish Society of Allergology and Clinical Immunology (la Sociedad
Española de Alergia e Inmunología Clínica (SEAIC)) launched and coordinated a
clinical and epidemiologic project Alergológica, a nation-wide study, with the
objective of obtaining information on allergy patients treated in Allergology services
(Caballero Martínez, F., 2009). The purpose of the project is the acquisition of data
from patients suffering from allergies in order to track the seasonal variability and
the regional distribution of disease.
The project made it possible to obtain valuable information about pollen allergies,
but it also has some disadvantages:
1. It is not periodical. There were projects in 2005 and 1992 (Alergológica-92) years.

7
2. Each patient who participated in Alergológica-2005 had to fill in a paper
questionnaire during a personal appointment with a doctor in a hospital. It caused a
lot of work for the doctors and coordinators of the project, as well as for patients.
There are some independent projects in some of regions in Spain, such as in Toledo
and Granada. Both of those regions have a continental dry climate. In Spain we can
differentiate three different climatological areas (Green Spain, Mediterranean Coast
of Dry Spain and Continental Dry Spain) that each show different concentrations and
different types of pollens caused allergies (Subiza Garrido-Lestache, J., 2004).
In this study we research the Castellon province, part of the Valencian community,
which is situated on the Mediterranean coast and has a Mediterranean climate. The
climatic conditions of the Mediterranean area result in vegetation and pollen very
different from that of the other parts of Europe and Spain (Bousquet J, 1984). This
fact does not allow us to extend the results from one area to another. Furthermore, it
makes studies of Castellon area unique and essential.
2.3.2. Pollen data
There are constant pollen counts in Spain, which is under the patronage of the
Aerobiology Committee. The Aerobiology Committee is one of the many
committees which form part of the Spanish Society of Clinical Allergology and
Immunology (SEAIC). It has a network of collectors over more than 23 stations,
monitored by members who are working in capturing and recognition of the most
important types of pollens. The committee has been recording counts since 1973 and
uninterrupted, year-round counts have been made since 1978. These counts are
provided unrestricted and totally free of charge on this site for all interested persons
(SEAIC, 2013).
There is one station in Castellon in General hospital of Castellon (Hospital General
de Castelló). Data, obtained from this station, is used in this research.
2.3.2. Patients data
One of the hospitals involved in research in the field of pollen allergy in the
Castellón province is the Hospital De Sagunto. Doctors from allergy department
keep statistics on allergic patients. These statistics include information about the

8
patient's condition during the week, the way of treatment and its results, general
health and personal information. For gathering this data, doctors give patients paper
questionnaires to fill. These questionnaires can be obtained in a doctor's office.
There are two types of questionnaires, depending on the type of reaction to pollen
grains. One is to examine the asthma symptoms and another for rhinoconjunctivitis.
The copy of the Asthma Control Questionnaire (ACQ) can be found in Annex 1. The
questionnaire is developed by Merck Sharp & Dohme (MSD) company (MSD,
2013). It consists of five questions and each question has seven possible answers.
The rhinoconjunctivitis questionnaire has eight question and four possible answers.
Based on this information, doctors calculate the coefficient of pollen allergy. The
mechanism of its calculation includes the following steps:
Adding the punctuation of each question;
Divide the result by number of questions.
The coefficient indicates the level of control of the manifestations of allergy to
pollen. It is interpreted as follows:
1. Less than or equal to 0.75 = adequate control;
2. From 0.75 to 1.50 = partly controlled;
3. Greater than 1.50 = inadequate control.
These questionnaires are used in this study as a guide in health information that
needs to be collected from allergic people.
2.4. Conclusion
Information presented in this chapter provides insights to the principles and
requirements in pollen allergy studies. We analyzed the international experience
using examples of web projects in Austria, the UK, the USA, as well as paper-based
projects such as Alergológica-2005 in Spain. This observation helps to mark the
advantages of internet-based services over the paperwork in the process of data
collection and distribution of medical information among users. The cooperation of
the local hospital plays a key role in determining the needs of health practitioners,

9
including requirements to visualization capabilities and the questions, which should
be asked during data acquisition.
Having all this knowledge and the support of the Hospital de Sagunto in medical
questions allows us to move to the next part of work: an implementation.

10
3. IMPLEMENTATION
Once we decided on the functionality we need, it is time to define technologies for its
implementation. This includes decisions about organizing a dataflow, a
communication components, an interface, a storage mechanisms and a system
architecture.
3.1. Distributed systems and its architecture
The implementation can be divided into two parts in accordance with the objectives
mentioned above. The server is an essential element for realization data storage and
retrieval. In addition, it is a way of making a feedback to users, collecting and storing
weather data and so on. The client application allows to collect data, give users
feedback, query data and visualize data etc.
The client part should be accessible from various places, so we need to have a
distributed system. A communication channel which allows sharing of resources and
information between client and server parts is based on a computer network. Users
from various places can interact with the content available on the server over the
Internet using a web browser.
An application that uses a web browser or a specialized user agent as a client is
called a web-application (Nations D., 2013).
Web applications are computer programs allowing website visitors to submit and
retrieve data to/from a database over the Internet using their preferred web browser
(Acunetix, 2013).
The browser creates HTTP requests for specific URLs that map to resources on a
Web server. The server renders and returns HTML pages to the client, which the
browser can display (MSDN, 2013).
When one of the purposes of a computer system information gathering, in the
foreground there is a need to provide access to a large number of users. And the web
application is the best solution, because of the following characteristics:
1. web applications perform their function irrespective of the operating system and
browsers running client side;

11
2. web applications are quickly deployed anywhere at no cost and without any
installation requirements at the user’s end (Acunetix, 2013).
The typical web application model consist of 3 parts (Ecommerce, 2003):
1. The user interface (a web browser).
It is responsible for the presentation of data, receiving user events and controlling the
user interface. The programming languages used are the combination of HTML, CSS
and JavaScript.
2. Web server.
This layer implements the business logic of the applications.
3. Data base server.
This is the layer that manages the persistence of application information. It is usually
powered by a relational database server (Figure 1).
Figure 1. Interaction of web application components.
All design decisions at the architectural level should be made within the context of
the functional, behavioral, and social requirements of the system being designed.
The key to successful web application is detailed assessment how best to partition a
system, how components identify and communicate with each other, how
information is communicated, how elements of a system can evolve independently,

12
and how all of the above can be described using formal and informal notations, in
other words, to determine the system architecture (Fielding R.T., 2000).
As documented by the World Wide Web Consortium (W3C) in its “Architecture of
the World Wide Web,” the anarchic architecture of today’s Web is the culmination
of thousands of simple, small-scale interactions between agents and resources that
use the founding technologies of HTTP and the URI (Jacobs, I., 2005).
As part of his doctoral work, Roy Fielding generalized the Web’s architectural
principles to govern the proper behavior of system components and presented them
as an new architectural style (Fielding, R.T., 2000). This style was named
REpresentational State Transfer or REST. REST describes the Web as a distributed
hypermedia application whose linked resources communicate by exchanging
representations of resource state (Webber J, 2010).
The main principles of REST architectural style are:
1. Addressable resources.
The key abstraction of information and data in REST is a resource, and each resource
must be addressable via a URI (Uniform Resource Identifier).
2. A uniform, constrained interface.
Use a small set of well-defined methods to manipulate your resources.
3. Representation-oriented
You interact with services using representations of that service. A resource
referenced by one URI can have different formats. Different platforms need different
formats. For example, browsers need HTML, JavaScript needs JSON (JavaScript
Object Notation), and a Java application may need XML.
4. Communicate statelessly.
5. Hypermedia As The Engine Of Application State (HATEOAS). Let data formats
drive state transitions in the applications.
An important concept in REST is the existence of resources (sources of specific
information). In order to manipulate these resources, components of the network
(user agents and origin servers) communicate via a standardized interface (e.g.,

13
HTTP) and exchange the actual documents conveying the information (Wikipedia,
2003) . In this work we take advantages of REST architectural style to build web-
application.
A RESTful web service or RESTful web API is a web service implemented using
HTTP and the principles of REST. It is a collection of resources, with three defined
aspects:
1. the base URI for the web service, such as http://example.com/resources/
2. the Internet media type of the data supported by the web service.
3. the set of operations supported by the web service using HTTP methods: GET,
PUT, POST, or DELETE (Fielding, R.T., 2000).
Once we have modeled the general architecture of the web-application, we can start
an implementation process using a top-down design strategy. The top-down approach
of the system development (or stepwise design) is a process of splitting the main task
into smaller pieces or whole system to subsystems.
REST-style architectures consist of clients and servers. Clients initiate requests to
servers and servers process requests and return appropriate responses. First level
decomposition of the web application is a decomposition to the processes which are
performed by user and the processes happen on the server side.
The main idea is to consider server side as a black box, while develop the client side
and vice versa. The implementation of the both sides can be found in the next two
sections.
3.2. Client side
3.2.1. Client side functions
Processes on the client side include interaction between the user interface and the
server, with no interest in the behavior of the server. While the development is on the
client side, the server is represented as a "black box" (Figure 2).

14
Figure 2. The representation of the server as a "black box".
To follow the top-down approach, we have to divide processes on the client side to
subprocesses. We need to analyze which of the goals we have identified in the
introduction can be achieved in the implementation of the client side. These aims are:
1. to have an input platform to gather health information about allergy from
citizens.
2. to make users be able to have feedback.
3. to make it possible to visualize the changes in the environment and the
manifestation of allergy among citizens.
With these objectives, we can identify the processes that need to run on the client
side:
1. Login;
2. Create a profile;
3. Submit data;
4. Receive a feedback;
5. Visualize the patient data with meteorological data.
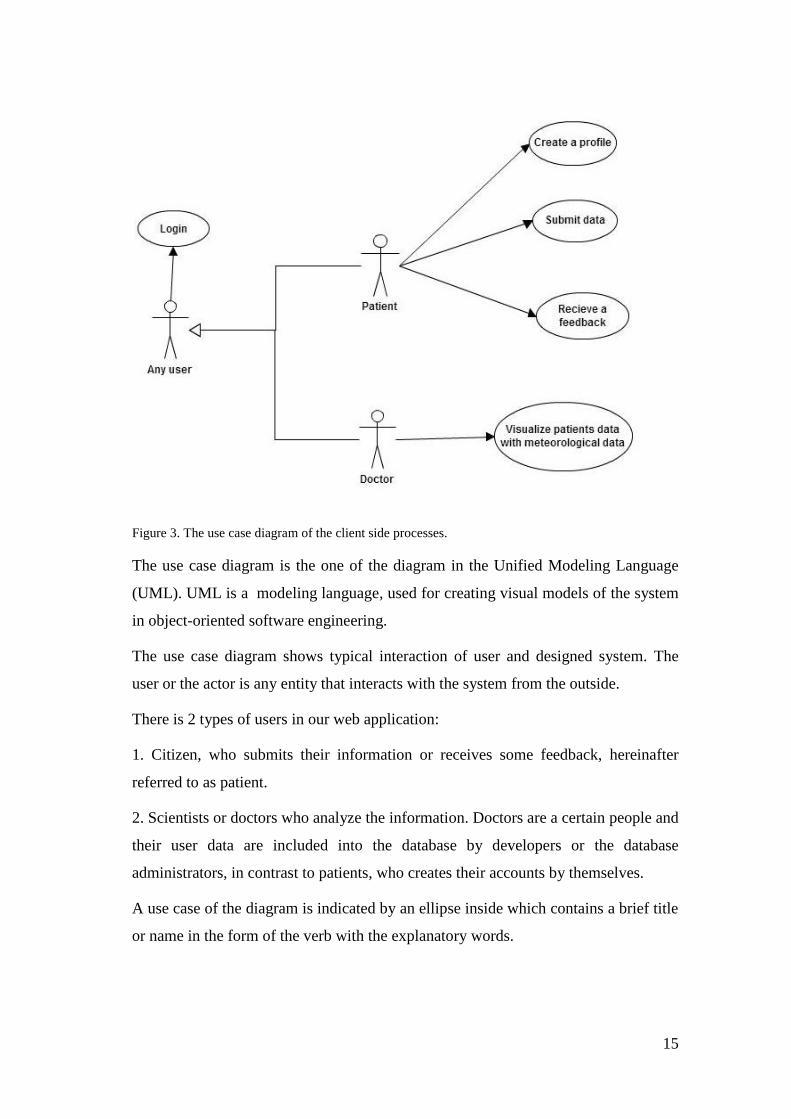
These processes are easily described by use case diagram (Figure 3).
15
Figure 3. The use case diagram of the client side processes.
The use case diagram is the one of the diagram in the Unified Modeling Language
(UML). UML is a modeling language, used for creating visual models of the system
in object-oriented software engineering.
The use case diagram shows typical interaction of user and designed system. The
user or the actor is any entity that interacts with the system from the outside.
There is 2 types of users in our web application:
1. Citizen, who submits their information or receives some feedback, hereinafter
referred to as patient.
2. Scientists or doctors who analyze the information. Doctors are a certain people and
their user data are included into the database by developers or the database
administrators, in contrast to patients, who creates their accounts by themselves.
A use case of the diagram is indicated by an ellipse inside which contains a brief title
or name in the form of the verb with the explanatory words.

16
Before starting the implementation of each of these processes we need to define
general aspects of graphical interface.
3.2.2. Design of the user interface.
Functions of the web application are available to users through a web browser.
Technologies, used for designing web pages, are:
1. HTML5,
2. CSS3,
3. JavaScript.
To design interface of web API it is necessary to understand groups of users and their
possible requirements, needs and limitations. There is a chance to gather more VGI if
the reporting process will be easy for citizens.
As was mentioned before we have 2 types of users: patients (people who suffers
from allergies) and doctors (who works in hospital).
Patients, the same as a doctors, can be of various ages. So, we have to consider that
interface should be easy to use and easy to navigate for people in age who is not very
familiar with Internet technologies. And in the same time interface should look good
on the mobile devices, which are a lot in use among young people. These
requirements can be achieved using powerful front-end framework called "Tweeter
Bootstrap". It is a framework which helps to create sleek and intuitive web pages
interface and in the same time allows automatic implementation of the responsive
web design.
Welcome page of the website is a first thing user sees and it is kind of a template of
all other web pages (Figure 4).

17
Figure 4. The index page of the web application.
This page contains a welcome information such as the name of the project, the
purpose of the project, participants, etc. The working title of project is
"AllergySpain.com"1.
3.2.3. The client side implementation.
For each of use cases, along with the definition of sub processes, we perform the
following actions:
1. To satisfy the addressability requirements of REST, we have to define a set of
URIs that represent the entry points into the system;
2. Since RESTful systems are representation-oriented, we next define the data format
that we use to exchange information between our services and clients.
There are few ways to transmit information to server and backward: inside a file
which has one of the MIME types, as a form parameter or as a part of URI (Path
parameter, Query parameter etc.).
3. Decide which HTTP methods (GET, POST etc.) are allowed by each exposed URI
and what kind of response we expect.
The implementation of each process is presented below:
1. Login.
1 http://www.allergyspain.com is an example of the web address of the application "AllergySpain.com". This
address is used in this research for describing capabilities of the web application. Development and testing of the
web application were done on the local host.

18
The first thing the user needs to do to use the functionality of a Web application is to
identify himself. Technically, this process is a sending the data to the server and
receiving a response from the server. Exchange of information between the server
and the client is organized by sending URI containing request's information. The
user's email and password are essential information for registration. This data are
sent as a path parameter of URI.
The client send a request : www.allergyspain.com/services/user/ with parameters.
So, the full URI looks the following way:
www.allergyspain.com/services/user/parameter1-parameter2.
Then it is necessary to define HTTP method in this request. Basically, we want to
find a particular user among others. So, we expect a response from the server if a
user is found or not. If the client requests some data from the server, we should use
the GET method.
We should remember an important issue about RESTful API. REST web services
must be stateless. It means the server shouldn't remember if user is registered or not.
So, the server sends an identification parameter to the client and does not remember
it. Later, if client needs to request data on this user, it must send the identification
number to the server as an input parameter.
The full characteristics of the login process can be found in the table 1:
Login
URI www.allergyspain.com/services/user/parameter1-parameter2
Content-Type n/a
HTTP method GET
Response code 200
Response Content-Type JSON file
Table 1. The characteristics of the login process.
User logs in by entering an email and a password in the form. These forms are
available on the several web pages:
1. From the welcome page "/index.html" (Figure 5).

19
Figure 5. Registration inline form.
2. From page "/sign_in.html".
To read information from server we use technique called AJAX (Asynchronous
JavaScript and XML). This approach allows client-side to interact with server in the
background, without affecting the behavior of the existing page. Data can be
retrieved using the XMLHttpRequest object.
To perform the login process the patient need to be registered.
2. Registration.
Technically the registration of user on the client side includes:
the validation of input information;
sending data to the server.
The process of sending data to the server is also implemented using AJAX technique
and the XMLHttpRequest object. The characteristics of the registration process can
be found in the table 2.
Registration
URI /services/user/
Content-Type Form parameters
HTTP method POST
Response code 200
Response Content-Type n/a
Table 2. The characteristics of the registration process.
The registration process is available on the registration.html page. Information
requested from users to fill in, is determined by analyzing the subject area and paper
questionnaires in hospitals. This information includes an email address, a password,
a gender, date of birth, geographical location and an allergen or allergens.

20
Before submitting data to the server, the client has to verify if it has received all
necessary information for registration and the correctness of this data. For example,
the user has to provide his name, date of birth etc. Some input data has to be in
particular format. Information of this format is provided as a light gray hints inside
input fields (Figure 6).
Figure 6. The realization of hints in the registration form.
To check input information we use validation mechanism. It is implemented using
JavaScript programming language and jQuery. jQuery is a JavaScript Library which
simplifies JavaScript programming.
If user enters wrong information he gets a error message. (Figure 7)
Figure 7. The realization of error messages in the registration form.
In the registration process a user can specify his or her location. For this purpose we
implement a map using Google Maps JavaScript API v3. The Google Maps
Javascript API allows to embed Google Maps into web pages. Version 3 of this API
is especially designed to be faster and more applicable to mobile devices, as well as
traditional desktop browser applications. The JavaScript Maps API V3 is a free
service, available for any web site that is free to consumers (Google developers,
2013).
To facilitate the task of finding the location, we use features of HTML5 Geolocation
API. With this API, location of the user can be found automatically by clicking a
button (Figure 8).

21
Figure 8. A map with the option of automatic geolocation.
3. Report
Reporting process is a direct implementation of the objective of creating a tool for
collecting user data. To make a report, the user needs to fill in a report form. He can
do it on the report.html page.
The patient has to fill in some general fields in the form, such as date of the report,
location etc., and answers the questions which describes his state of health and
symptoms (Figure 9). The questionnaire is provided by the Hospital de Sagunto
(Annex 1).

22
Figure 9. The questionnaires on the report.html page.
Date can be a particular day or a time period. Date range picker, which is used in the
report form, relies on Twitter Bootstrap, the Date.js library and jQuery (Figure 10).
Figure 10. The interval date picker in the report form.
Another essential element for the report is a geographic location. The user has 3
options: to use his default location (specified during the registration), be geolocated
automatically or manually select a location.
After the user click the "submit" button, the client application sends request to the
server with the parameters presented below in table 3.
Report
URI "/services/user/report/user_id"
Content-Type Form parameters

23
HTTP method POST
Response code 200
Response Content-Type n/a
Table 3. The characteristics of the reporting process.
4. Get information about pollen counts.
This process implements another objective of the study providing user a feedback
with information on a concentration of pollen grains. Data is available for 11
different types of plants: Artemisia, Brassicaceae, Casuarina, Chenopodiaceae etc.
The data about pollen counts is periodically obtained by Aerobiology Committee of
Spain, and for this research it is provided by the Hospital de Sagunto.
On the pollenInfo.html web page, the patient should select the allergen and the
station that he wants to examine. The user doesn't need to look for the station and
guess which one is the closest to him. He only need to specify his location or any
location he want to learn about and the closest station appears automatically (Figure
11). The user can manually select a geographic place or use the automatic
geolocation tool.
Figure 11. Mapping the nearest station.

24
The client then sends a request to the server to retrieve data about pollen counts for a
specific pollen allergen (Table 4). A question mark separates the query parameter
from the rest of the URI.
Pollen counts retrieving
URI /services/user/pollen/"+allergen.value+"?"+station.value
Content-Type n/a
HTTP method GET
Response code 200
Response Content-Type JSON
Table 4. The characteristics of the pollen counts retrieving process.
Retrieved JSON file is parsed and received data is visualized in two ways.
First of all, on the same map by clicking on the station icon, the user sees a pop-up
window with information about the concentration of pollen in the air for the same
period of the previous year or the last available measurements. In the same time,
below on the same page, the user sees a chart about the season of the high
concentration of pollen and examine its duration (Figure 12).
Figure 12. Chart of pollen counts in 2012.
So, as a feedback the user has pollen counts information for the last year and the
latest measured data.
5. Visualization of patients data with meteorological information.

25
To implement this function we need to request 2 types of data: meteorological and
patients data. Nevertheless, client sends only 1 request to the server (Table 5).
Visualization of patients data with meteorological information
URI /services/user/pollen?+date.value
Content-Type n/a
HTTP method GET
Response code 200
Response Content-Type JSON
Table 5. The characteristics of the patients and meteorological data retrieving process.
Request contains information on the date that the user is interested in. He can choose
year, month and day (Figure 13).
Figure 13. Date picker.
The result of the request is present in Figure 14.
Figure 14. Visualization of patients data with meteorological information.

26
The meteorological data are shown on the map by google.maps.visualization library
which are part of the Google Maps JavaScript API. This library adds the Heatmap
layer on the map.
Different colors gradients are used to distinguish types of data and data variety.
There are 2 different Heatmap layers: temperature and humidity. Thus, to display
humidity we use a gradient from light lilac to dark purple, accordingly to increase of
the humidity level. For the temperature, we use a gradient from yellow to red.
Our aim is to visualize data, such as meteorological information, with information
about the presence of allergy symptoms. But it is important to remember that the
reason of this visualization is the ability to see the dependency between the change in
weather conditions and allergy manifestation among the patients. To do this, we need
to highlight not only the variation in weather but also the differences between data
reported by users.
For each report submitted by the user an allergy coefficient is calculated. The method
of its calculation and interpretation are presented in Chapter 2.
Markers on the map show users data. According to the rating of the coefficient
markers have different colors:
1. allergy coefficient is less than or equal to 0.75.
2. allergy coefficient is from 0.75 to 1.50.
3. allergy coefficient is > 1.50.
Hints with the meaning of different colors are presented on the web page as a legend
to the map.
The user has an option to display temperature map, humidity map or both map in the
same time (Figure 15).

27
Figure 15. Displaying of maps of two different meteorological variables.
Source of meteorological data is a Spanish agency "Meteoclimatic" (Meteoclimatic,
2013).
3.3. Server side
3.3.1. Server architecture
The implementation of the server side begins by defining which of the objectives
presented in the first chapter should be realized by server capabilities. They provide a
tool for safe storage and retrieval, as well as provide data for researchers to track
changes in the environment. In other words, the server should be capable to receive
data from a client application, parse it, store it in a database and retrieve it by the user
request. Also the server should be able to get data from external sources, parse it,
store it and retrieve. This data flow can be represented as shown in Figure 16.

28
Figure 16. Dataflow according the server side representation.
The REST architectural style of the web application allows to implement this scheme
of data flow and interact with different external components without any changes to
the other server functionality.
Referring to the top-down approach, the client part now is represented as a "black
box" and we model the functionality of the server. While designing the server side,
we are interested in requests coming from the client and how the server handles
them.
On the client side we define entry points to the web server. On the server side we
need to analyze endpoints. In a RESTful system, endpoints are usually referred to as
resources and are identified using a URI.
Considering the entry points we distinguish on the client side, we define a list of
URIs that will be exposed in our system:
/services/user
/services/user/{email}-{pass}
/services/user/report/{id}
/services/user/pollen/{allergen}
/services/weather.

29
URIs are defined on the server is not the ones as that on the client side. These URIs
have a path and pattern. In the second URI, we use a curly braces to specify a
resource identification with a parameter. If there are two parameters, we have to use
a hyphen between them.
Writing RESTful services in Java can be achieved using Servlet API. Servlets make
it possible to move information to and from an HTTP request, but sometimes require
a lot of code. The specification, called JAX-RS, was defined to simplify RESTful
service implementation. JAX-RS is a framework that focuses on applying Java
annotations to plain Java objects. For example, it has annotations to bind specific
URI patterns and HTTP operations to individual methods of Java class (Burke B.,
2009).
We start the implementation with creating Java classes. There are classes that
represent actual object and classes that represent JAX-RS services. Class model,
made in accordance to Unified Modeling Language (UML), is present in Figure 17.

30
Figure 17. Class diagram.
In this model, AllergyREST and WeatherREST are JAX-RS services. The JAX-RS
service is a Java class that uses JAX-RS annotations to bind and map specific
incoming HTTP requests to Java methods that can service these requests.
Classes "User", "Weather", "Pollen", "Report" are Java Persistence (JPA) Entity
beans and are used to interact with a relational database.
3.3.2. JAX-RS services

31
To designate AllergyREST and WeatherREST classes as a JAX-RS services the
@javax.ws.rs.Path annotation placed on the classes.
For AllergyREST the @Path annotation has the value of "/user". This value
represents the relative root URI of this service. Since we took the base address (URI)
of the server as http://allergyspain.com and the package with services is called
"services", methods exposed by AllergyREST class are available under the
http://allergyspain.com/services/user address. For class WeatherREST the path is
http://allergyspain.com/services/weather.
Each client request corresponds to a unique method.
The request to create a new user matches the method createUser(). This method:
1. receives the HTTP POST request,
2. extracts input information (form parameters),
3. creates a User object,
4. persists it to the database,
5. returns a response code of 201 “Created” along with a Location header
pointing to the absolute URI of the customer who was just created.
To bind HTTP POST requests to the createUser() method, we annotate it with the
@javax.ws.rs.POST annotation. The @Path annotation, combined with this @POST
annotation, binds all POST requests with URI services/user to the Java method
createUser().
Another important issue is to specify which media type the method is expecting in
the message body of the HTTP input request. The @javax.ws.rs.Consumes
annotation applied to the method specifies it. Expected media type for createUser()
method is APPLICATION_FORM_URLENCODED media type.
The same annotations and logic is applied for all other methods.
The request to find a user in the database (the login process) binds with the getJson()
method. This method:
1. receives the HTTP GET request,

32
2. extracts path parameters,
3. makes a query to the database
4. returns a response code of 200 “OK” along with a JSON file.
The @Path annotation of the method getJson() contains extra value "{email}-
{pass}". This annotation with @GET annotation, binds all GET requests with URI
services/user/{email}-{pass} to the Java method getJson(). The javax.ws.rs.Produces
annotation allows to specify the file type which is produced by this method. The
getJson() method has annotation @Produces ("application/json").
The method createReport() binds with request to add a new report. This method:
1. receives the HTTP POST request,
2. extracts path parameter and form parameters,
3. finds a user by its identification number,
4. creates a Report object,
5. persists it to the database,
6. returns a response code of 200 “Created”.
The method has the @Path annotation with value "report/{id}". So, the method
matches to the URI services/user/report/{id} and consumes
APPLICATION_FORM_URLENCODED media type.
When a client request information about pollen counts for some particular period
system executes the method getPollen(), which:
1. receives the HTTP GET request,
2. extracts path parameters and query parameters,
3. makes a query to the database,
4. returns a response code of 200 “OK” along with a JSON file.
The @Path annotation has value "pollen/{allergen}", where allergen is a path
parameter. The method produces a Json file.

33
So, the class AllergyREST has 4 methods, in contrast to the class WeatherREST,
which has only one method getWeather(). This method is the server response to a
client request for meteorological and patients data on a specific date.
This method:
1. receives the HTTP GET request,
2. extracts the query parameters,
3. makes a query to the database,
4. returns a response code of 200 “OK” along with a JSON file.
The WeatherREST class has @Path annotation with value "/weather", so this
annotation, combined with @GET annotation, binds all GET requests with URI
services/weather to the Java method getWeather().
3.3.3. Java Persistence API
Several times the creation of entity beans, the persistence to the database and the
database queries have been mentioned. All these functions are implemented using
JPA technology.
The classes "User", "Weather", "Pollen", "Report" are entities beans classes. Entities
are objects that live shortly in memory and persistently in a database. They have the
ability to be mapped to a database and they support inheritance, relationships, and so
on. These entities, once mapped, can be managed by JPA. They can be persisted in
the database, be removed it, and be queried using a query language (Java Persistence
Query Language, or JQPL) (Goncalves A, 2009).
To be recognized as an entity, the classes must be annotated with
@javax.persistence. The @javax.persistence.Id annotation is used to denote the
primary key, and the value of this identifier is automatically generated by the
persistence provider (@GeneratedValue). The persistence provider will then be able
to map, for example, the User entity to a USER table (which is a default mapping
rule), generate a primary key, and synchronize the values of the attributes to the table
columns.

34
The class User and class Report has a relationship, because the User class represents
a patient who creates reports. This relationship is an association with a cardinality
one-to-many. To map this association we add the annotation
javax.persistence.OneToMany to the User class and specify foreign key with the
annotation javax.persistence.JoinColumn.
Mapping, persistence and queries with these entities are allowed by the entity
manager. Its role is to manage entities, read from and write to a given database, and
allow simple and complex queries using JPQL (Figure 18).
Figure 18. Entity manager.
JPQL is the language defined in JPA to query entities stored in a relational database.
The getJson() method receives a request to find a user by an e-mail and a password.
To implement it in the User class we create a query "findWithParam" with
annotation javax.persistence.NamedQuery:
@NamedQuery(name = "findWithParam", query = "select c from User c where c.userEmail = :email and c.userPass = :password ")
There is another method to retrieve data from the database. In createReport() method,
before built a new report, we need to retrieve the book by its identifier. Using the
interface EntityManager method EntityManager.find(), we can perform the following
operation: User user = em.find(User.class, userId);
All the entity classes persist to the database by request from the client, except of the
Pollen and Weather classes. The Pollen class represents pollen counts which were
collected from the measurement stations and added to database from Excel files.

35
The Weather class represents a meteorological data about temperature and humidity.
This data is taken through RSS channels from Spanish independent meteorological
agency "Meteoclimatic". Data is extracting every day automatically from RSS files
by parsing it using ROME Utilities for Java.
3.4. Deployment
While implementing the server and the client components, we should think how
these components are going to interact to each other. The schema how JAX-RS
integrates with JPA and other component models are present in Figure 19.
Figure 19. The AllergySpain.com web application scheme.
JAX-RS and JPA applications are deployed within a servlet container. A servlet
container is as a web server, it understands the HTTP protocol and provides a low-
level component model (the servlet API) for receiving HTTP requests.
In this project we will use Java Servlet container Jetty. Jetty provides an HTTP
server, HTTP client, and javax.servletcontainer. These components are open source
and available for commercial use and distribution. Database is implemented using
MySQL. MySQL is the world's most popular open source database which permit us
to realize all needed functionality of web application.
Servlet-based applications are organized in deployment units called Web ARchives
(WAR). A WAR is a JAR-based packaging format that contains the Java classes and
libraries used by the deployment as well as static content like images and HTML
files that the web server will publish. Here’s what the structure of a WAR file looks
like:

36
<any static content>
WEB-INF/
web.xml
classes/
lib/
The web.xml file is a deployment descriptor file. This file defines the configuration
of the WAR and how the servlet container should initialize it. We define a web.xml
file for JAX-RS in our project.
To built web application and all its components into single project, Apache Maven is
used. Maven is a build automation tool. It uses an XML file to describe the software
project being built, its dependencies on other external modules and components, the
build order, directories, and required plug-ins.
Using all of the above technologies, it becomes possible to ensure the functioning of
the web application as a single interconnected system.

37
4. CONCLUSIONS AND FUTURE WORK
4.1. Conclusions
In this research, we examine geoinformation technologies as a solution to meet the
needs of studies of pollen allergy.
During this work, the following steps have been completed:
1. The analysis of domain and relevant literature, and current projects in the field of
pollen allergy.
2. The analysis of the existing geoinformation technologies. Determination of the
technologies that may be useful in the study of pollen allergy.
3. The implementation of these technologies on the client side with a web-interface.
4. The implementation of these technologies on the server side with the database and
the connection to the meteorological data sources.
As a result of this work, we have a distributed geoinformation system: a web-
application with the working title "AllergySpain.com." The application has a
RESTful architectural style and consists of two parts: a client side and a server side.
The technologies used for application development are the answer to the research
question.
To have a complete answer to the research question, the necessary functionality of
the client part were built according to two perspectives: people who suffer from
pollen allergy and health practitioners. The server side responds to the user requests,
saves data to the database and downloads external meteorological data.
Together the client and server parts' functionality completely fulfill all defined
objectives, so the developed web application is able to:
1. Collect VGI from people suffering from allergies;
2. Secure storing and retrieving of this information;
3. Provide information about pollen high seasons;
4. Provide data for researchers to track changes in the environment;

38
5. Visualize on a map user data with meteorological information for analysis.
The web application, AllergySpain.com, has characteristics which benefit in
comparison with other projects and has a number of unique features. Thus, we can
say about the significance of the thesis and unique impact on the scientific
community. The main contribution to science of the developed web application is
that it gives an opportunity to analyze the role of "place" factor in the manifestation
of pollen allergy. Another valuable cooperation to the scientific domain is:
1. It allows a collection of allergy data in an area where there is lack of this
information.
2. It simplifies future research in this area.
For example, in project Alergológica, it reduces a paper work, eliminates the
need for a personal meeting of a doctor and a patient, etc. Also, the
application reduces the cost of subsequent Alergológica projects that allows
to do them on a regular basis.
3. It enables the increase of the number of participants in research, due to the
following characteristics of the application:
web-based; It allows patients to submit data their data even from
remote regions.
simple interface; Web client interface is simple and laconic, so do not
require any special skill neither from patients or from doctors.
4. It provides a tool for gathering data with a geographic reference which is
unique to the area. Because of the digital format, the data can be easily
visualized on different maps. Not only is the user data is collected with the
location information, but also the pollen data and the environmental data.
5. It renders various types of data on a single map that makes it possible to
analyze dependencies between them.

39
4.2. Future work
The created web application has many prerequisites for further development. There
are different directions for the elaboration of the system:
1. Cover a larger territory.
Now the application has full functionality for the Castellon province. The
next goal is to cover the Valencian community. It includes the involvement of
more hospitals and medical institutions in the project, expanding the number
of meteorological stations whose data are collected for analysis and the
addition of data about pollen counts from more stations.
2. Include other sources of data related with allergy analysis (air quality, water
pollution, etc.). This extension depends on the needs of people who does the
research. Due to the architectural style of the web application, it is very easy
to add a new external source.
3. Implement the pollen allergy warning service which will provide the
individual allergy forecast for patients. It can be implemented as soon as
corresponding medical information is available at hospitals.
4. Enhance the user interface. Besides the new functionality, some future work
can be dedicated to the user interface design.
5. Add an option to display several maps on one page to show the trend of
changes in meteorological data and user reports of symptoms. Each map
corresponds to a particular day of the week, so the seven of them can
visualize patterns of changes within one week.
6. Use of statistical prediction based on geostatistical kriging for interpolation of
environmental variables while rendering a map with meteorological data.
7. Client application for mobile platforms can be developed, for example,
Android OS or iOS.
The way which will be chosen for further development of the project strictly depends
on the operating results, as well as on the progress of pollen allergy studies, which
can require new functionality and use of new geoinformation technologies. The

40
advantage of this web-application that it can be easily extended with new
components and new capabilities. It guarantees the potential growth of the
AllergySpain.com application.

41
REFERENCES
ACUNETIX., 2013. Web Applications: What are They? What of Them? (URL:
http://www.acunetix.com/websitesecurity/web-applications/, Retrieved 08-01-2013)
AUSTRIAN POLLENINFORMATION, 2013. The Austrian Pollen Information
System, (URL: http://www.pollenwarndienst.at/en/current-data.html, Retrieved 31-
01-2013).
BOUSQUET, J., COUR, P., GUERIN, B. and MICHEL, F.B., 1984. Allergy in the
Mediterranean area. I. Pollen counts and pollinosis of Montpellier. Clinical
allergy, 14(3), pp. 249-258.
BOUSQUET, J., VAN CAUWENBERGE, P. and KHALTAEV, N., 2001. Allergic
rhinitis and its impact on asthma: ARIA workshop report. Journal of Allergy and
Clinical Immunology, 108(5 SUPPL.), pp. 1A-14A+S147-S333.
BURKE B., 2009. RESTful Java with JAX-RS (1st ed.), (Sebastopol, CA: O’Reilly
Media, Inc.).
CABALLERO MARTÍNEZ, F., 2009. Alergológica 2005. Methodological aspects
and sample characteristics of the study. Journal of Investigational Allergology and
Clinical Immunology, 19(SUPPL. 2), pp. 2-6.
CUMMINS, S., CURTIS, S., DIEZ-ROUX, A.V. and MACINTYRE, S., 2007.
Understanding and representing 'place' in health research: A relational approach.
Social Science and Medicine, 65(9), pp. 1825-1838.
D'AMATO, G., 2002. Environmental urban factors (air pollution and allergens) and
the rising trends in allergic respiratory diseases. Allergy: European Journal of
Allergy and Clinical Immunology, Supplement, 57(72), pp. 30-33.
D'AMATO, G., CECCHI, L., BONINI, S., NUNES, C., ANNESI-MAESANO, I.,
BEHRENDT, H., LICCARDI, G., POPOV, T. and VAN CAUWENBERGE, P.,
2007. Allergenic pollen and pollen allergy in Europe. Allergy: European Journal of
Allergy and Clinical Immunology, 62(9), pp. 976-990.

42
ECOMMERCE, 2003. 3 Tier Architecture, (URL:
http://ecommerce.insightin.com/architecture/technical_architecture.html, Retrieved
08-01-2013).
FIELDING, R.T., 2000. Architectural Styles and the Design of Network-based
Software Architectures. Ph.D. Thesis, University of California, Irvine, CA.
GONCALVES, A., 2009. Beginning Java™ EE 6 Platform with GlassFish™ 3:
From Novice to Professional, (Berkeley, CA: Apress).
GOODCHILD, M.F., 2007. Citizens as sensors: The world of volunteered
geography. GeoJournal, 69(4), pp. 211-221.
GOOGLE DEVELOPERS, 2013. Google Maps JavaScript API v3, (URL:
https://developers.google.com/maps/documentation/javascript/, Retrieved 20-02-
2013).
JACOBS, I., 2005. Architecture of the World Wide Web, Volume One, (URL:
http://www.w3.org/TR/webarch/, Retrieved 07-01-2013).
METEOCLIMATIC, 2013. El tiempo actual, (URL: http://www.meteoclimatic.com/,
Retrieved 19-02-2013).
MINGOMATAJ E., 2007. Changing World As Principal Reason For Atopy Rising
Trend. The Internet Journal of Asthma, Allergy and Immunology, 5, Number 2.
MSD, 2013, Sobre nosotros, (URL: http://www.msd.es/about/home.html, Retrieved
16-02-2013).
MSDN, 2013. Chapter 21: Designing Web Applications, (URL:
http://msdn.microsoft.com/ru-ru/library/ee658099.aspx, Retrieved 08-01-2013).
NATIONS, D., 2013. What is a Web Application? (URI:
http://webtrends.about.com/od/webapplications/a/web_application.htm, Retrieved
07-01-2013).
NAVARRO PULIDO, A., COLÁ S, C., ANTÓN, E., CONDE, J., DÁ VILA, I.,
DORDAL, M.T., FERNÁ NDEZ-PARRA, B., IBÁ ÑEZ, M.D., LLUCH-BERNAL,
M., MATHEU, V., MONTORO, J., RONDÓN, C., SÁ NCHEZ, M.C. and VALERO,
A., 2009. Epidemiology of allergic rhinitis in allergy consultations in Spain:

43
Alergológica-2005. Journal of Investigational Allergology and Clinical Immunology,
19(SUPPL. 2), pp. 7-13.
PÉREZ-BADIA, R., RAPP, A., MORALES, C., SARDINERO, S., GALÁ N, C. and
GARCÍA-MOZO, H., 2010. Pollen spectrum and risk of pollen allergy in central
Spain. Annals of Agricultural and Environmental Medicine, 17(1), pp. 139-151.
POLLEN DIARY, 2013. The Pollen Diary, (URL:
https://www.pollendiary.com/Phd/, Retrieved 31-01-2013).
POLLEN.COM, 2013. The official website of Pollen.com, (URL:
http://pollen.com/allergy-weather-forecast.asp, Retrieved 31-01-2013).
POLLENUK, 2013. The official website of PollenUK, (URL:
http://www.pollenuk.info/, Retrieved 31-01-2013).
SEAIC, 2013. Comité De Aerobiología, (URI: http://www.polenes.com/, Retrieved
31-01-2013).
SUBIZA GARRIDO-LESTACHE, J., 2004. Allergenic pollens in Spain.
Allergologia et Immunopathologia, 32(3), pp. 121-124.
WEBBER, J., PARASTATIDIS, S., ROBINSON, I., 2010. REST in Practice (1st
ed.), (Sebastopol, CA: O’Reilly Media, Inc.).
WIKIPEDIA, 2003. Representational state transfer, (URL:
http://en.wikipedia.org/wiki/Representational_state_transfer, Retrieved 08-01-2013).

44
ANNEX 1: ASTHMA CONTROL QUESTIONNAIRE