Web 2.0 Final
25
Volume 2 (16) Number 3 2016 Poznań University of Economics and Business Press ISSN 2392-1641 Economics and Business Review CONTENTS A word from the Editor ARTICLES From duration analysis to GARCH models – An approach to systematization of quan- titative methods in risk measurement Krzysztof Jajuga Credit markets and bubbles: is the benign credit cycle over? Edward I. Altman, Brenda J. Kuehne Bipolar growth model with investment flows Katarzyna Filipowicz, Tomasz Misiak, Tomasz Tokarski Twitter and the US stock market: e influence of micro-bloggers on share prices Karl Shutes, Karen McGrath, Piotr Lis, Robert Riegler Can we invest on the basis of equity risk premia and risk factors from multi-factor models? Pawel Sakowski, Robert Ślepaczuk, Mateusz Wywial Quantifying wage effects of offshoring: import- versus export-based measures of pro- duction fragmentation Joanna Wolszczak-Derlacz, Aleksandra Parteka Simple four-step procedure of parabolic B curve determination for OECD countries in 1990Q1–2015Q4 Dariusz J. Blaszczuk BOOK REVIEW Jerzy Witold Wiśniewski, Microeconometrics in Business Management, John Wiley & Sons, United Kingdom 2016 (Dorota Appenzeller)
-
Upload
karen-mcgrath -
Category
Documents
-
view
22 -
download
0
Transcript of Web 2.0 Final
Volume 2 (16) Number 3 2016
Volume 2 (16)
Num
ber 3 2016
Poznań University of Economics and Business Press
ISSN 2392-1641
Economicsand Business
Economics and B
usiness Review
Review
Subscription
Economics and Business Review (E&BR) is published quarterly and is the successor to the Poznań University of Economics Review. � e E&BR is published by the Poznań University of Economics and Business Press.
E&BR is listed in ProQuest, EBSCO, and BazEkon.
Subscription rates for the print version of the E&BR: institutions: 1 year – €50.00; individuals: 1 year – €25.00. Single copies: institutions – €15.00; individuals – €10.00. � e E&BR on-line edition is free of charge.
Correspondence with regard to subscriptions should be addressed to: Księgarnia Uniwersytetu Ekonomicznego w Poznaniu, ul. Powstańców Wielkopolskich 16, 61-895 Poznań, Poland, fax: +48 61 8543147; e-mail: [email protected].
Payments for subscriptions or single copies should be made in Euros to Księgarnia Uniwersytetu Ekonomicznego w Poznaniu by bank transfer to account No.: 96 1090 1476 0000 0000 4703 1245.
CONTENTS
A word from the Editor
ARTICLES
From duration analysis to GARCH models – An approach to systematization of quan-titative methods in risk measurementKrzysztof Jajuga
Credit markets and bubbles: is the benign credit cycle over?Edward I. Altman, Brenda J. Kuehne
Bipolar growth model with investment � owsKatarzyna Filipowicz, Tomasz Misiak, Tomasz Tokarski
Twitter and the US stock market: � e in� uence of micro-bloggers on share pricesKarl Shutes, Karen McGrath, Piotr Lis, Robert Riegler
Can we invest on the basis of equity risk premia and risk factors from multi-factor models?Paweł Sakowski, Robert Ślepaczuk, Mateusz Wywiał
Quantifying wage e� ects of o� shoring: import- versus export-based measures of pro-duction fragmentationJoanna Wolszczak-Derlacz, Aleksandra Parteka
Simple four-step procedure of parabolic B curve determination for OECD countries in 1990Q1–2015Q4Dariusz J. Błaszczuk
BOOK REVIEW
Jerzy Witold Wiśniewski, Microeconometrics in Business Management, John Wiley & Sons, United Kingdom 2016 (Dorota Appenzeller)
Editorial BoardRyszard BarczykWitold JurekCezary KochalskiTadeusz Kowalski (Editor-in-Chief)Henryk MrukIda MusiałkowskaJerzy SchroederJacek WalluschMaciej Żukowski
International Editorial Advisory BoardEdward I. Altman – NYU Stern School of BusinessUdo Broll – School of International Studies (ZIS), Technische Universität, DresdenWojciech Florkowski – University of Georgia, Gri� nBinam Ghimire – Northumbria University, Newcastle upon TyneChristopher J. Green – Loughborough UniversityJohn Hogan – Georgia State University, AtlantaMark J. Holmes – University of Waikato, HamiltonBruce E. Kaufman – Georgia State University, AtlantaSteve Letza – Corporate Governance Business School Bournemouth UniversityVictor Murinde – University of BirminghamHugh Scullion – National University of Ireland, GalwayYochanan Shachmurove – � e City College, City University of New YorkRichard Sweeney – � e McDonough School of Business, Georgetown University, Washington D.C.� omas Taylor – School of Business and Accountancy, Wake Forest University, Winston-SalemClas Wihlborg – Argyros School of Business and Economics, Chapman University, OrangeHabte G. Woldu – School of Management, � e University of Texas at Dallas
� ematic EditorsEconomics: Ryszard Barczyk, Tadeusz Kowalski, Ida Musiałkowska, Jacek Wallusch, Maciej Żukowski • Econometrics: Witold Jurek, Jacek Wallusch • Finance: Witold Jurek, Cezary Kochalski • Management and Marketing: Henryk Mruk, Cezary Kochalski, Ida Musiałkowska, Jerzy Schroeder • Statistics: Elżbieta Gołata, Krzysztof SzwarcLanguage Editor: Owen Easteal • IT Editor: Marcin Reguła
© Copyright by Poznań University of Economics and Business, Poznań 2016
Paper based publication
ISSN 2392-1641
POZNAŃ UNIVERSITY OF ECONOMICS AND BUSINESS PRESSul. Powstańców Wielkopolskich 16, 61-895 Poznań, Polandphone +48 61 854 31 54, +48 61 854 31 55, fax +48 61 854 31 59www.wydawnictwo-ue.pl, e-mail: [email protected] address: al. Niepodległości 10, 61-875 Poznań, Poland
Printed and bound in Poland by:Poznań University of Economics and Business Print Shop
Circulation: 230 copies
Aims and Scope
Economics and Business Review is the successor to the Poznań University of Economics Review which was published by the Poznań University of Economics and Business Press in 2001–2014. � e Economics and Business Review is a quarterly journal focusing on theoretical and applied research work in the � elds of economics, management and � nance. � e Review welcomes the submission of articles for publication dealing with micro, mezzo and macro issues. All texts are double-blind assessed by independent review-ers prior to acceptance.
Notes for Contributors
1. Articles submitted for publication in the Economics and Business Review should contain original, unpublished work not submitted for publication elsewhere.
2. Manuscripts intended for publication should be written in English and edited in Word and sent to: [email protected]. Authors should upload two versions of their manuscript. One should be a com-plete text, while in the second all document information identifying the author(s) should be removed from � les to allow them to be sent to anonymous referees.
3. � e manuscripts are to be typewritten in 12’ font in A4 paper format and be le� -aligned. Pages should be numbered.
4. � e papers submitted should have an abstract of not more than 100 words, keywords and the Journal of Economic Literature classi� cation code.
5. Acknowledgements and references to grants, a� liation, postal and e-mail addresses, etc. should appear as a separate footnote to the author’s namea, b, etc and should not be included in the main list of footnotes.
6. Footnotes should be listed consecutively throughout the text in Arabic numerals. Cross-references should refer to particular section numbers: e.g.: See Section 1.4.
7. Quoted texts of more than 40 words should be separated from the main body by a four-spaced inden-tation of the margin as a block.
8. Mathematical notations should meet the following guidelines: – symbols representing variables should be italicized, – avoid symbols above letters and use acceptable alternatives (Y*) where possible, – where mathematical formulae are set out and numbered these numbers should be placed against the right margin as... (1),
– before submitting the � nal manuscript, check the layout of all mathematical formulae carefully ( including alignments, centring length of fraction lines and type, size and closure of brackets, etc.),
– where it would assist referees authors should provide supplementary mathematical notes on the derivation of equations.
9. References in the text should be indicated by the author’s name, date of publication and the page num-ber where appropriate, e.g. Acemoglu and Robinson [2012], Hicks [1965a, 1965b]. References should be listed at the end of the article in the style of the following examples:Acemoglu, D., Robinson, J.A., 2012, Why Nations Fail. � e Origins of Power, Prosperity and Poverty,
Pro� le Books, London.Kalecki, M., 1943, Political Aspects of Full Employment, � e Political Quarterly, vol. XIV, no. 4: 322–331.Simon, H.A., 1976, From Substantive to Procedural Rationality, in: Latsis, S.J. (ed.), Method and Appraisal
in Economics, Cambridge University Press, Cambridge: 15–30.10. Copyrights will be established in the name of the E&BR publisher, namely the Poznań University of
Economics and Business Press.
More information and advice on the suitability and formats of manuscripts can be obtained from:Economics and Business Reviewal. Niepodległości 1061-875 PoznańPolande-mail: [email protected]
Twitter and the US stock market: The influence of micro‑bloggers on share prices1
Karl Shutes2, Karen McGrath3, Piotr Lis2, Robert Riegler2
Abstract : With the increased interest in social media over recent years, the role of information disseminated through avenues such as Twitter has become more widely perceived. This paper examines the mention of stocks on the US markets (NYSE and NASDAQ) by a number of financial micro-bloggers to establish whether their posts are reflected in price movements. The Twitter feeds are selected from syndicated and non-syndicated authors. A substantial number of tweets were linked to the price movements of the mentioned assets and an event study methodology was used to ascertain wheth-er these mentions carry any significant information or whether they are merely noise.
Keywords : Twitter, social network, social media, financial markets, event studies, in-formation.
JEL code : G14.
Introduction
In contrast to traditional, static websites, whereby users are limited to passive viewing of content, the term Web 2.0 refers to those sites that allow interaction between users. Indeed the most well-known examples of the Web 2.0 genera-tion include social media websites such as Twitter and Facebook. These so-cial media sites act as platforms through which individuals can create, discuss and modify shared user content typically centred around a common interest or individual, such as investing or Justin Bieber. This field of research is still in its infancy; however, unlike more traditional lab-based methodologies studies utilizing data from Web 2.0 platforms are more likely to reflect the real-time, real-life behaviour of individuals and groups. Though to date there have been a few studies that concentrate on the effect of social media on political, finan-
1 Article received 26 April 2016, accepted 5 August 2016. This work was funded in part by a Coventry University BES faculty scheme.
2 School of Economics, Finance & Accounting, Coventry University, Priory Street, Coventry, CV1 5FB, UK; corresponding author: [email protected].
3 Mays Business School, Texas A&M University, College Station, 4218 TAMU, Texas, USA.
Economics and Business Review, Vol. 2 (16), No. 3, 2016: 57–77DOI: 10.18559/ebr.2016.3.5

58 Economics and Business Review, Vol. 2 (16), No. 3, 2016
cial and commercial issues such work predominantly focuses on the more static weblogs or message boards rather than dynamic ‘microblogs’ generated by individuals through sites such as Twitter. Indeed we believe that this is the first study to provide empirical evidence relating to the impact of Twitter use by financial micro-bloggers on corporate share prices.
Twitter was launched in July 2006 and quickly attracted millions of users who share information with a network of followers on a wide range of topics through the use of microblogs or tweets. As described in Milstein and Lorica [2008] tweets are short comments of up to 140 characters, which is approxi-mately the same length as a newspaper headline and sub-heading. Twitter users range from ordinary individuals and celebrities to businesses and news agen-cies with use being divided into three categories: information sharing, infor-mation seeking and friendship-like relationships [Java et al. 2007]. By the end of 2015 Twitter had over 320 million monthly active users worldwide with ap-proximately 67 million users in the United States alone (about.twitter.com).
By default tweets are public which means that users can follow others and read their posts without mutual permission. The substantial flexibility of Twitter’s application program interface (API) makes it easy to integrate it with other online services and applications. This, combined with a large base audi-ence, means that Twitter is increasingly used by news organizations such as CNN, BBC World and The Wall Street Journal to distribute updates on current events as well as financial commentators as a means to disseminate information to investors. Indeed Twitter feeds are embedded in traders’ Bloomberg termi-nals and NASDAQ’s mobile application and incorporate posts from StockTwits, a communications platform for investors and the wider financial community. From the investor’s point of view micro-blogging addresses the need for a real-time means of communication. Since tweets can be posted from nearly anywhere and at any time they are likely to contain an immediate reaction to events or information. As such Twitter constitutes a rich source of data for quantitative and qualitative analysis with a longitudinal character which allows for analysis of the dynamic processes. This, coupled with its high frequency, makes for in-formation that is potentially highly responsive to dynamic stock market devel-opments. The rate at which posts are retweeted can be considered to be a simple measure of whether information is perceived interesting and the overall im-pact on share prices can measure the perceived usefulness of the information.
We use the existence of a tweet as an indicator of some (potentially new) in-formation rather than attempting to evaluate its causality on stock prices. The tweet is seen as a signal of information appearing in the market. We employ an event study approach to identify the impact of selected tweets on the share prices of companies listed on the NYSE and NASDAQ. Tweets associated with abnormal returns are identified and then analyzed with respect to their popu-larity, content and company size, i.e. how many tweets are linked to earnings. Finally we consider whether Twitter is used as a tool for trading suggestions.

59K. Shutes, K. McGrath, P. Lis, R. Riegler, Twitter and the US stock market
Our results show that nearly a third of the tweets considered is associated with abnormal price movements as evidenced by our event-study approach. Although the ‘chatter’ is dominated by Google and Apple our research shows that it is not only high-tech firms that are seen as tweet-worthy. In fact the ac-tivity is widespread across stocks and markets. The discussion is not limited to traditional financial information and there is a distinct lack of concrete trad-ing recommendations. For example, tweets related to earnings constitute less than 10% of all relevant tweets. This suggests that Twitter is not a replacement for traditional sources which tend to be based on the fundamental informa-tion availability.
The remainder of this paper is organized as follows: after reviewing the litera-ture (Section 1), the data collection and methodology are discussed (Section 2 and 3). Subsequently we present our results in Section 4 and conclude in the final section.
1. Literature review
Although stock markets have received a considerable amount of attention, for example Będowska-Sójka [2014] and Folfas [2016], the research on the links between financial markets and digital media is still in its infancy. To date there have been few studies which use Twitter to investigate public opinion most of which are published in conference proceedings rather than academic journals. Typically they attempt to apply analysis of the public mood to either political or economic developments rather than the impact of tweets as news events on markets. Studies to date have largely concentrated on various social issues. For example, Tumasjan et al. [2010] and Wang et al. [2012] perform political sentiment analysis of Twitter posts and attempt to predict results of elections in Germany and the United States, respectively. In a related study O’Connor et al. [2010] compare surveys on consumer confidence and presidential job ap-proval to the mood on Twitter.
Another broad area of research of Web 2.0 is related to the commercial and business sector. Here researchers have been using mostly information con-tained in weblogs (online blogs). In a relatively early study Gruhl et al. [2005] use blog posts to predict sales of books on Amazon. Although they manage to show reasonable correlation between posts and sales their prediction exercise should be read with caution as the method of analysis is somewhat simplistic. In a similar study Mishne and Glance [2006] show that a positive weblog sen-timent is highly correlated with film success. Mei et al. [2007] and Liu et al. [2007] construct more advanced models of sentiment analysis which are quite flexible and can be used for monitoring public opinion, predicting behaviour and making business decisions. Liu et al. [2007] claim that their autoregressive

60 Economics and Business Review, Vol. 2 (16), No. 3, 2016
sentiment-aware model (ARSA) predicts box office sales at American cinemas. They show that the sentiment contained in blogs has more predictive power than just a simple number of mentions. Choi and Varian [2012] demonstrate that Google queries can be used as indicators of subsequent consumer purchas-es and in effect can predict, amongst others, car sales, unemployment claims, travel destinations and consumer confidence. They call it “contemporaneous forecasting” or “nowcasting” [Choi and Varian 2012].
1.1. Web 2.0 and the financial marketsPrevious studies that have examined the relationship between online content and stock markets have used information obtained from several sources includ-ing news articles, weblogs, message boards (Internet forums) and microblogs. Nardo et al. [2015] offer a concise review of studies analysing the usefulness of online media in predicting movements in financial markets. However these studies have traditionally focused on individual and social sentiment or pre-dictive behaviour, for example Ranco et al. [2015] and Santos, Laender, and Pereira [2015], with only few being published in academic journals.
One of the first sources of information that attracted attention of research-ers is message boards. An early study by Wysocki [1998] showed that over-night posting volume on Yahoo message boards could predict changes in the following day’s trading volume and returns. Tumarkin and Whitelaw [2001] looked at the Internet service sector and concluded that changes in investor sentiment expressed in message boards correlated with abnormal industry-adjusted returns only on days with unusually high forum activity. Such days were also associated with abnormally high trading volumes which persisted on a following day. Das and Chen [2007] proposed a small investor sentiment index based on Amazon’s and Yahoo’s message boards and investigated its re-lationship to the values of 24 tech-sector stocks listed in the Morgan Stanley High-Tech Index. They did not find strong links between sentiment and pric-es of average stocks but did note a weak relationship between their sentiment index and aggregated tech-stock index.
Preis, Moat, and Stanley [2013] turned to Google searches for terms related to finance in order to find patterns that could be considered as early warnings of stock market moves. They record closing prices of the Dow Jones Industrial Average (DJIA) on the first day of a week then determine how many queries for a specific term were run in a preceding week and by employing a hypo-thetical investment strategy evaluate whether variation in online queries can capture later changes in stock prices. Their results are promising and show that information gathering behaviour may offer indications of future trends in the behaviour of market participants. They also point out that when predicting movements of the U.S. market models using worldwide search data perform worse than those based only on the U.S. data.

61K. Shutes, K. McGrath, P. Lis, R. Riegler, Twitter and the US stock market
1.2. TwitterThere have been few studies that examine the relationship between Twitter posts and stock market changes and they tend to focus on measuring collective mood. Bollen, Mao, and Zeng [2011] performed a text content analysis of tweets to construct a mood metric. The predictive strength of public mood on the Dow Jones Industrial Average (DJIA) was analyzed through Granger causality (lin-ear approach) and Self-Organizing Fuzzy Neural Network (SOFNN, non-linear approach) methods. They studied nearly ten million tweets posted by 2.7 mil-lion users between February and December 2008. Although they showed that changes in public mood matched changes in DJIA closing values three to four days later with up to 87.6% accuracy their results may be difficult to general-ize as the analyzed period was marked by a major credit crunch and recession. In another study Zhang, Fuehres, and Gloor [2011] used a randomized sam-ple of tweets covering a period of six months to predict changes in Dow Jones, NASDAQ and S&P500 indices. They found significant and negative correla-tion between the stock market indices and sentiments of both hope and fear on a daily basis. They proposed three measures of the collective mood: (1) num-ber of tweets that contain either positive or negative mood words, (2) number of followers of such tweets and (3) number of retweets of emotional posts; all of them expressed as a percentage of all tweets in a day. They used only seven mood words: hope, happy, fear, worry, nervous, anxious and upset. Such an ap-proach is unlikely to perform well in mood analysis as inevitably it disregards a large number of posts expressing the same sentiments but using different words. Furthermore it is particularly badly suited to detect irony or sarcasm.
More recently Ranco et al. [2015], Porshnev, Redkin, and Shevchenko [2013], Si et al. [2013] and Sprenger et al. [2013], have agreed that sentiment contained in Twitter posts carries information useful in improving the accuracy of stock predictions. Sprenger, et al. [2013] show that sentiment is associated with ab-normal stock returns whilst the volume of tweets predicts the next day trad-ing volume. They also look at the quality of advice given by bloggers and con-clude that those whose investment advice is above average tend to have more followers and be retweeted more frequently.
Sul, Dennis, and Yuan [2014] performed a sentiment analysis of tweets on firms traded on the S&P500. Their results show that both positive and nega-tive sentiment expressed through the micro-blogging website is significantly related to firms’ stock returns. In particular, tweets by users with a large fol-lower base have a stronger impact on same day returns because the informa-tion spreads quickly. On the other hand the information contained in tweets by users with fewer followers takes longer to be disseminated and has a stronger impact on 10-day returns.
In contrast to those studies, whose primary objective is the measurement of sentiment, our study looks at posts by financial commentators and tweets
62 Economics and Business Review, Vol. 2 (16), No. 3, 2016
that specifically mention listed companies. Such an approach appears particu-larly important because, as Yang, Mo, and Lin [2015] show, a community has formed on Twitter which uses the platform primarily to exchange information about financial markets. Consequently our sample is likely to contain less noise compared to studies based on tweets by a wider blogger population and more information for predicting stock movements.
2. Data collection
The data were downloaded using the API available from Twitter for the period September 2011 through June 2013 for fourteen authors, though not all the authors were recorded over the entire period.4 The authors are a combination of syndicated and non-syndicated financial commentators.
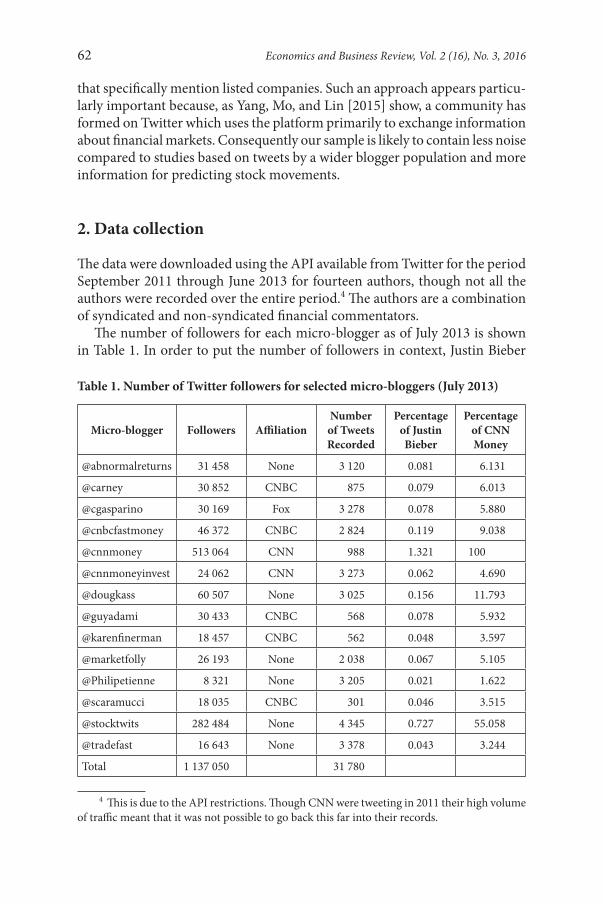
The number of followers for each micro-blogger as of July 2013 is shown in Table 1. In order to put the number of followers in context, Justin Bieber
4 This is due to the API restrictions. Though CNN were tweeting in 2011 their high volume of traffic meant that it was not possible to go back this far into their records.
Table 1. Number of Twitter followers for selected micro‑bloggers (July 2013)
Micro‑blogger Followers AffiliationNumber
of Tweets Recorded
Percentage of Justin Bieber
Percentage of CNN Money
@abnormalreturns 31 458 None 3 120 0.081 6.131
@carney 30 852 CNBC 875 0.079 6.013
@cgasparino 30 169 Fox 3 278 0.078 5.880
@cnbcfastmoney 46 372 CNBC 2 824 0.119 9.038
@cnnmoney 513 064 CNN 988 1.321 100
@cnnmoneyinvest 24 062 CNN 3 273 0.062 4.690
@dougkass 60 507 None 3 025 0.156 11.793
@guyadami 30 433 CNBC 568 0.078 5.932
@karenfinerman 18 457 CNBC 562 0.048 3.597
@marketfolly 26 193 None 2 038 0.067 5.105
@Philipetienne 8 321 None 3 205 0.021 1.622
@scaramucci 18 035 CNBC 301 0.046 3.515
@stocktwits 282 484 None 4 345 0.727 55.058
@tradefast 16 643 None 3 378 0.043 3.244
Total 1 137 050 31 780

63K. Shutes, K. McGrath, P. Lis, R. Riegler, Twitter and the US stock market
has 38.8 million followers and was considered the most followed person at the time. As one can see the number of financial Twitter followers is small rela-tive to the more / most popular Twitter users. Many of the followings are also small relative to CNNMoney, the largest of the sample considered here. This is shown in Figure 1.
Over the majority of the period there were less than 50 picks, or comments, on a stock per day as shown in Figure 2. However it is noticeable that the num-ber of posts by StockTwits is considerably higher than by other commentators (see Figure 1). Table 1 shows that a total of 31,780 distinct tweets were down-loaded using the Twitter API and they had a potential to be considered by over 1.1 million followers. Each tweet was scanned for a stock symbol, i.e. a num-ber of characters following $, and there were approximately 9,600 tweets con-taining these symbols. These were then split by stock so that each stock pick was associated with an author and date as well as the text. This implies that if a source named more than one stock in a tweet this would be counted as one pick for each asset. This generated approximately 17,000 raw picks from the tweets. The individual picks were filtered to include only business days and to remove tweets that occurred before the stock’s IPO etc. Tweets from the indi-vidual sources were grouped by date to give event points to use.
In total Figure 2 shows 8,549 individual events each identified by a stock pick and the date upon which the tweet was written. Though the relatively large loss levels appear to be concerning it is inevitable with such a medium
Figure 1. Followers as a proportion of CNN Money

64 Economics and Business Review, Vol. 2 (16), No. 3, 2016
where there is considerable noise, albeit news or other information. It suggests that about 1 in 4 tweets has some sort of stock information in it. This might be higher than one might have expected from the twittersphere. The returns data for the stock and relevant indices were acquired from Yahoo Finance with the underlying index being determined by the exchange on which that the stock was traded. This gave a number of possible indices, the NASDAQ composite, NASDAQ 100 and the S&P 500.
3. Method
Before the data was used for analysis the following data cleaning procedure was implemented:1. Observations with incorrect share codes, commodities, stock market indi-
ces and currencies were removed.2. Only shares traded on NYSE or NASDAQ (e.g. BRK-B and not BRK-A)
were used.53. Tweets on public holidays and weekends or before their IPO were removed.
To analyze the relationship between a tweet about a company and its share price an event study, as outlined by Campbell, Lo, and Mackinlay [1997], based
5 The Stata ado-file “Stockquote” by Nikos Askitas was used to download stock data from Yahoo Finance.
Figure 2. Number of picks in Tweets for 2012–2013

65K. Shutes, K. McGrath, P. Lis, R. Riegler, Twitter and the US stock market
on daily data was conducted. A similar approached was used by Rani, Yadav, and Jain [2015], Yang, Zheng, and Zaheer [2015] and Aizenman et al. [2016].
The event window consists of a single day upon which the tweet appeared. The pre-event window is the time period twenty days before and the post-event window is the time period twenty days after the event. Our final sample is presented in Table 2.
Table 2. Sample of NYSE and NASDAQ listed shares
Unit NYSE NASDAQ
Unique Shares 742 378
Unique Events 3758 2587
Most Popular Shares GS, JPM, C APPL, GOOG, AMZN
As Table 2 shows there are clear bloggers’ favourites in each market. In par-ticular Apple and Google dominate the NASDAQ market with over 200 and 100 tweets respectively.
The event study contains three stages: estimating normal returns, calculat-ing the abnormal returns and testing if the accumulated abnormal returns are statistically significantly different from zero. Normal returns, defined as the price change that would be expected if the event (i.e. the tweet) did not take place, are derived by regressing each log share price change on the change of the relevant market indices of the pre-event window (see Equation 1). The mar-ket index S&P500 is used for the share listed on the NYSE and the Nasdaq-100 for shares listed on NASDAQ. Before the event t is less than 0, at the event t is equal to zero, and t greater than 0 is after the event.
= + +Δ Δit i i mt itp α β p ε for t < 0, i.e. before the event, (1)
where ∆pit represents the change of the logarithmic share price of share i at time t and ∆pmt the change of the logarithmic index value of market m, i.e. the returns on the asset.
In Equation 2 we use the estimated coefficients to predict the normal re-turns of the shares based on the market index for the post-event window (t > 0):
= + ˆˆ ˆΔ Δit mtp α β p for t > 0. (2)
Secondly, abnormal returns are calculated by taking the difference between the actual and predicted return. Finally, the cumulative abnormal returns are calculated and a t-test at a 5% significance level conducted to test whether the abnormal returns are statistically significantly different from zero.

66 Economics and Business Review, Vol. 2 (16), No. 3, 2016
4. Results
This section considers the results of the event study and specifically the sig-nificant tweets, i.e. those which were found to be associated with significantly abnormal returns following a relevant tweet. Using the methodology above, 1,885 tweets, or 29.7%, were seen to be significant. Examining the results it is clear that the financial twittersphere, as represented by the sample of blog-gers, is dominated by discussion of a number of firms, Apple, Google and, to a lesser extent, Facebook. This is somewhat inevitable given the iconic nature of these firms. We can see in Figure 3 that both Apple and Google outstrip the raw number of significant quotes discussed. For clarity Figure 4 removes the visual distortion caused by Apple and Google.
The dominance of the two technology companies in Figure 3 means that it is difficult to put the results into context. Removing these gives a clearer pic-ture of the results which are presented in Figure 4. For the clarity of presenta-tion we also remove stocks with two or fewer significant tweet events (these firms are included in Appendix). Even after removing Google and Apple the most popular companies are still part of NASDAQ (Amazon, Dell, Facebook and Tesla). There is a significant gap between these four and the rest of the companies listed on NASDAQ. The tweet popularity of companies listed on the NYSE is less dispersed with only one company having more than 40 sig-nificant tweets (Hewlett Packard).
Table 3 provides a good illustration of this disparity between the two stock exchanges. The table splits stocks into three categories: firms with 50 or more tweets are considered as of high popularity, those with three to 49 tweets as medium and those with two or fewer as of low popularity.
Table 3. Distribution of significant tweets by exchange
ExchangeFirm Tweet Popularity
TotalHigh (≥ 50) Medium Low (≤ 2)
NASDAQ 3 52 123 178
NYSE 0 79 251 330
Total 3 131 374 508
According to Table 3 the most tweet-popular stocks are listed on NASDAQ whilst the least tweeted assets dominate on the NYSE. At the same time it ap-pears that the medium level targets are split more evenly across the exchang-es. This suggests that rather than being based solely on their status as popular firms, such as Apple, Google or Facebook, these significant tweets are based on information or expectations about a firm or group of firms.

Figu
re 3
. Sig
nific
ant t
wee
ts b
y fir
m

Figu
re 4
. Sig
nific
ant t
wee
ts w
ith A
pple
and
Goo
gle
rem
oved
69K. Shutes, K. McGrath, P. Lis, R. Riegler, Twitter and the US stock market
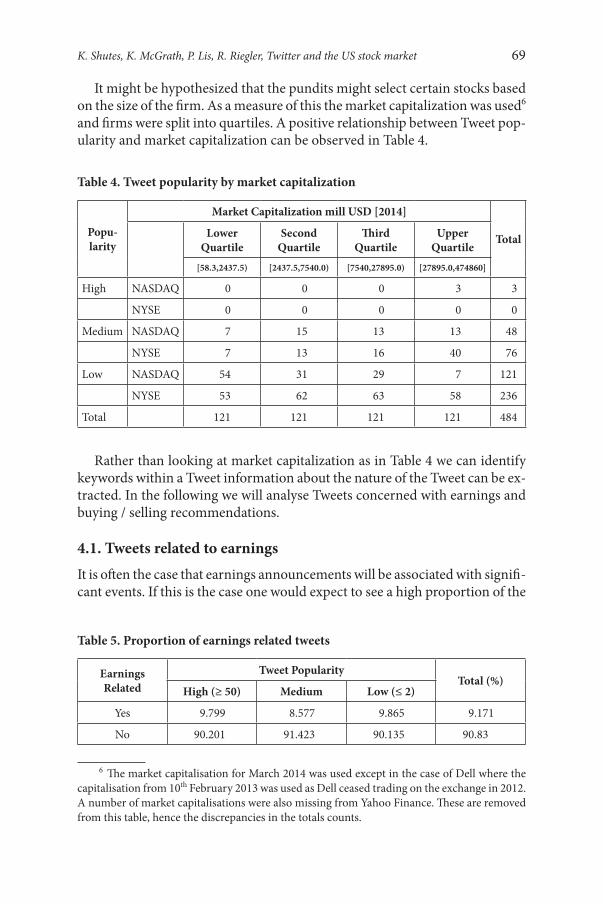
It might be hypothesized that the pundits might select certain stocks based on the size of the firm. As a measure of this the market capitalization was used6 and firms were split into quartiles. A positive relationship between Tweet pop-ularity and market capitalization can be observed in Table 4.
Table 4. Tweet popularity by market capitalization
Popu‑larity
Market Capitalization mill USD [2014]
TotalLower Quartile
Second Quartile
Third Quartile
Upper Quartile
[58.3,2437.5) [2437.5,7540.0) [7540,27895.0) [27895.0,474860]
High NASDAQ 0 0 0 3 3
NYSE 0 0 0 0 0
Medium NASDAQ 7 15 13 13 48
NYSE 7 13 16 40 76
Low NASDAQ 54 31 29 7 121
NYSE 53 62 63 58 236
Total 121 121 121 121 484
Rather than looking at market capitalization as in Table 4 we can identify keywords within a Tweet information about the nature of the Tweet can be ex-tracted. In the following we will analyse Tweets concerned with earnings and buying / selling recommendations.
4.1. Tweets related to earningsIt is often the case that earnings announcements will be associated with signifi-cant events. If this is the case one would expect to see a high proportion of the
6 The market capitalisation for March 2014 was used except in the case of Dell where the capitalisation from 10th February 2013 was used as Dell ceased trading on the exchange in 2012. A number of market capitalisations were also missing from Yahoo Finance. These are removed from this table, hence the discrepancies in the totals counts.
Table 5. Proportion of earnings related tweets
Earnings Related
Tweet PopularityTotal (%)
High (≥ 50) Medium Low (≤ 2)
Yes 9.799 8.577 9.865 9.171
No 90.201 91.423 90.135 90.83

Figu
re 5
. Ear
ning
s bas
ed tw
eets
by
wee
k si
nce
Janu
ary
2012

71K. Shutes, K. McGrath, P. Lis, R. Riegler, Twitter and the US stock market
significant tweets to contain the root ‘earn’ or ‘EPS’. This was sought in the text of the tweets and the proportion of the tweets referring to earnings considered. If these were high then one would suggest that Twitter was acting as another avenue to relay information about the company’s official results to the market. The earnings related tweets are reported below. As is seen in Table 5 only ap-proximately 9% of the tweets are earnings or EPS related and these events are clustered at reporting events as seen in Figure 5.
Table 5 suggests that it is not traditional information that is being dissemi-nated across the twittersphere but other news and opinion. These results are rather clustered around the main quarterly result periods as can be seen in Figure 5. The period of the middle of April (weeks 16–18) saw Apple, Coca-Cola, Ebay, Facebook and Google have earnings based tweets hence the large spike. Even taking this into account these three weeks saw 88 tweets about the companies’ earnings compared with 297 in total. Thus a higher proportion than usual occurs in this reporting period but these tweets still constitute less than 30% of the traffic about the relevant companies.
4.2. Buy – sell recommendationsIt is also possible to consider the buy-sell recommendations by the tweeters. Running a search for either the root ‘buy’ or ‘sell’ we notice that the buy recom-mendations are twice as likely as the sell ones, though both are dwarfed by the ‘no signal’ chatter. This information, presented in Table 6, combined with the data on dividends and earnings suggest that very little actual concrete trading suggestions are given. Furthermore a more ambiguous signal of bullish or bear-ish nature is also very limited in their use. This would suggest that the content for these tweets is more amorphous and general rather than an explicit set of suggestions for positions.
Table 6. Bullish / bearish and buy/ sell signals
Trade Buy Sell Both No Signal
Total 86 40 5 1,754
NASDAQ 33 21 3 905
NYSE 53 19 2 849
Bullish/ Bearish Bull Bear Both No Signal
Total 16 11 4 1,854
NASDAQ 9 8 1 944
NYSE 7 3 3 910

72 Economics and Business Review, Vol. 2 (16), No. 3, 2016
Using the information in Table 6 buy and sell information is approximate-ly 7% overall. The NASDAQ proportion is lower than that of the NYSE (5.9% compared to 8% respectively) suggesting a buy/ sell focus on the NYSE. Less than 2% of the tweets contain a bullish or bearish signal and these are evenly distributed between exchanges (1.4% and 1.9% respectively).
A simple hypothesis is that pundits will tend to focus on one exchange or another. There is some truth in this as can be seen below in Table 7. It is clear that the most tweeted about firms dominate in posts by a number of authors. This is particularly the case for the non-affiliated authors where much of the traffic is based on the high popularity stocks (Apple, Google and Facebook).
Table 7 reinforces the expectation that the NASDAQ is more frequently mentioned than the firms on the NYSE, with the most active micro-bloggers being abnormalreturns, StockTwits and tradefast. Further it is noticeable that these authors are not affiliated with major media outlets.
The results show that there is a great deal of information bouncing around the twittersphere much of which contains little price information. There are, however, kernels of useful information that do appear and much like the tra-ditional media, have to be extracted from the sources. The useful information is not simple to classify- not being a simple buy-sell type signal, but is more ambiguous than that. The twittersphere appears to cluster around the ‘popular’
Table 7. Counts by author by exchange
NASDAQ NYSE
Abnormalreturnsa 171 (62) 73
Carney 0 1
Cnbcfastmoney 55 (31) 43
CNNMoney 11 (2) 7
CNNMoneyInvest 2 (1) 15
DougKassa 18 (5) 15
GuyAdami 0 2
Marketfollya 35 (14) 27
PhilipEtiennea 8 (2) 25
StockTwitsa 181 (92) 106
Tradefasta 136 (10) 24
Numbers in parentheses represent the stocks with fewer than 50 Tweets.a Non-affiliated authors.

73K. Shutes, K. McGrath, P. Lis, R. Riegler, Twitter and the US stock market
firms with 3 stocks accounting for nearly 40% of the significant tweets. These might be considered as the easy wins by pundits whereas the remaining stocks are more evenly spread between the exchanges.
Conclusions
This study has examined whether mentions of listed firms by financial micro-bloggers have any significant impact on the prices and whether this is related to particular periods or phrases, specifically those with links to earnings or profits. There is a substantial number of tweets that are associated with price movements as evidenced by our event-study method. The research shows that it is not only the NASDAQ stocks that are seen as tweet-worthy, the NYSE is also tweeted about, although these appear to be focused on more specific ad-vice rather than being a consistent and persistent chatter about the most pop-ular firms such as Apple and Google. The traffic seems to be widespread and not limited to traditional financial discussions on the concepts related to the art of fundamental stock valuation. This proportion is quite stable across the popularity of the firms amongst the financial bloggers.
In contrast to the fundamental information that can be acquired from more traditional sources there is a distinct lack of concrete trading recommendations on Twitter. This would suggest that Twitter is not a replacement for the tradi-tional sources which tend to be based on the fundamental information avail-ability; instead, tweets are based on the less concrete information.
The tweeters, especially the non-affiliated ones, cluster around a number of stocks; the obvious tech stocks are very popular but neither exchange is domi-nant once Google and Apple are removed from the analysis. The tweets tend to contain a number of firms’ names rather than just one. This in addition to a 140 character maximum tweet length suggests that posts are unlikely to carry significant firm specific information or trading information but rather present a ‘scatter gun’ approach.
These findings suggest that Twitter is much like the coffee houses of Georgian London or a school playground; places where gossip is batted around, some of which has merit, but where much is merely the passing of time. The talk is often focused in a couple of areas and rarely based on actual fundamentals or news of note. This is in spite of the study’s focus purely on micro-bloggers with a large following within the online financial community.
Future research is required to fully understand the value and nature of mar-ket related information on Twitter. Using intra-day data and textual analysis would allow researchers to analyze real time responses of commentators and investors to relevant events. Specifically the focus ought to be on the impact of the content of tweets on financial market indicators.

[74]
App
endi
x
Firm
s with
Les
s tha
n Th
ree
Sign
ifica
nt T
wee
ts
Nam
eEx
chan
geN
ame
Exch
ange
Nam
eEx
chan
geN
ame
Exch
ange
Nam
eEx
chan
geN
ame
Exch
ange
Nam
eEx
chan
geN
ame
Exch
ange
Nam
eEx
chan
ge
ABC
NYS
EBO
NT
NA
SDA
QC
XWN
YSE
FEN
YSE
INV
NN
YSE
MD
AS
NA
SDA
QPA
CD
NYS
ESO
DA
NA
SDA
QW
AG
NYS
E
AC
AS
NA
SDA
QBP
OP
NA
SDA
QC
YHN
YSE
FEIC
NA
SDA
QIP
HS
NA
SDA
QM
DLZ
NA
SDA
QPB
RN
YSE
SPLS
NA
SDA
QW
CRX
NA
SDA
Q
AC
IN
YSE
BTU
NYS
EC
ZRN
ASD
AQ
FIG
NYS
EIS
ISN
ASD
AQ
MD
TN
YSE
PCL
NYS
ESP
RTN
ASD
AQ
WD
CN
ASD
AQ
AC
MN
YSE
BUD
NYS
ED
EN
YSE
FIV
EN
ASD
AQ
ITC
NYS
EM
ELI
NA
SDA
QPC
PN
YSE
SPW
RN
ASD
AQ
WER
NN
ASD
AQ
AC
TN
YSE
BWLD
NA
SDA
QD
FSN
YSE
FST
NYS
EIT
TN
YSE
MG
MN
YSE
PCS
NYS
ESQ
NM
NA
SDA
QW
EXN
YSE
AC
TGN
ASD
AQ
CA
BN
YSE
DIS
HN
ASD
AQ
FXC
MN
YSE
ITW
NYS
EM
ICN
YSE
PETM
NA
SDA
QST
NYS
EW
HR
NYS
E
AEG
RN
ASD
AQ
CA
CI
NYS
ED
MD
NYS
EG
ILD
NA
SDA
QJA
CK
NA
SDA
QM
JNN
YSE
PLC
MN
ASD
AQ
STI
NYS
EW
PON
YSE
AET
NYS
EC
BGN
YSE
DO
WN
YSE
GIS
NYS
EJA
SON
ASD
AQ
MK
LN
YSE
PNRA
NA
SDA
QST
MP
NA
SDA
QW
WD
NA
SDA
Q
AG
NC
NA
SDA
QC
BIN
YSE
DPZ
NYS
EG
LON
YSE
JBH
TN
ASD
AQ
MLN
XN
ASD
AQ
PRU
NYS
EST
TN
YSE
WY
NYS
E
AK
AM
NA
SDA
QC
BKN
YSE
DRI
VN
ASD
AQ
GLQ
NYS
EJB
LUN
ASD
AQ
MM
NYS
EPT
NR
NA
SDA
QSV
UN
YSE
XN
YSE
AK
SN
YSE
CBR
LN
ASD
AQ
DSX
NYS
EG
LWN
YSE
JKS
NYS
EM
NST
NA
SDA
QPX
DN
YSE
SWFT
NYS
EX
XIA
NA
SDA
Q
ALE
XN
YSE
CBS
NYS
ED
UF
NYS
EG
NC
NYS
EJO
EN
YSE
MO
NYS
EQ
CO
RN
ASD
AQ
SWY
NYS
EYN
DX
NA
SDA
Q
ALO
GN
ASD
AQ
CFI
NYS
ED
UK
NYS
EG
NRC
NYS
EJO
SBN
ASD
AQ
MO
RNN
ASD
AQ
QIH
UN
YSE
SYY
NYS
EYU
MN
YSE
ALU
NYS
EC
FNN
YSE
DX
LGN
ASD
AQ
GO
LDN
ASD
AQ
KK
RN
YSE
MO
SN
YSE
QLI
KN
ASD
AQ
TAN
YSE
ZLC
NYS
E
AM
TDN
YSE
CG
NA
SDA
QEC
BEN
YSE
GRM
NN
ASD
AQ
KLA
CN
ASD
AQ
MO
VN
YSE
RN
YSE
TCK
NYS
EZN
GA
NA
SDA
Q
AN
RN
YSE
CH
KP
NA
SDA
QEC
HO
NA
SDA
QG
SIT
NA
SDA
QK
MB
NYS
EM
PEL
NA
SDA
QRA
TEN
YSE
TEF
NYS
EZT
SN
YSE

[75]
APP
NYS
EC
HRW
NA
SDA
QED
UN
YSE
GSK
NYS
EK
MP
NYS
EM
SCI
NYS
ERE
GN
NA
SDA
QTK
NYS
E
ARM
HN
ASD
AQ
CH
TRN
ASD
AQ
EGN
NYS
EH
AIN
NA
SDA
QLA
ZN
YSE
MSN
NYS
ERE
XN
YSE
TMN
YSE
ARN
AN
ASD
AQ
CI
NYS
EEG
OV
NA
SDA
QH
AL
NYS
ELG
FN
YSE
MTG
NYS
ERF
NYS
ETO
LN
YSE
ARO
NYS
EC
LFN
YSE
ELLI
NYS
EH
AR
NYS
ELL
LN
YSE
MW
NYS
ERH
PN
YSE
TPX
NYS
E
ASA
NYS
EC
LGX
NYS
EEM
CN
YSE
HBA
NN
ASD
AQ
LMN
YSE
NEE
NYS
ERI
ON
YSE
TRN
YSE
ASH
NYS
EC
NC
NYS
EEM
NN
YSE
HC
NN
YSE
LNC
ON
ASD
AQ
NO
KN
YSE
RLN
YSE
TRG
TN
ASD
AQ
BAX
NYS
EC
NW
NYS
EEM
RN
YSE
HD
NYS
ELO
NYS
EN
SCN
YSE
RTN
NYS
ETR
OX
NYS
E
BBVA
NYS
EC
OH
NYS
EEQ
IXN
ASD
AQ
HG
GN
YSE
LOW
NYS
EN
VO
NYS
ERY
NN
YSE
TSN
NYS
E
BCN
YSE
CO
NN
NA
SDA
QER
JN
YSE
HO
GN
YSE
LPS
NYS
EN
WLI
NA
SDA
QS
NYS
ETS
ON
YSE
BDBD
NA
SDA
QC
OP
NYS
EET
FCN
ASD
AQ
HO
VN
YSE
LTD
NYS
EN
YXN
YSE
SAFM
NA
SDA
QTW
IN
YSE
BEA
MN
YSE
CO
STN
ASD
AQ
EVR
NYS
EH
RBN
YSE
LVLT
NYS
EO
CLR
NA
SDA
QSB
AC
NA
SDA
QU
PSN
YSE
BEN
NYS
EC
OT
NYS
EEX
LPN
ASD
AQ
HRS
NYS
EM
NYS
EO
DP
NYS
ESB
HN
YSE
VALE
NYS
E
BID
NYS
EC
RKN
YSE
EZPW
NA
SDA
QIB
KR
NA
SDA
QM
AN
UN
YSE
OII
NYS
ESE
NYS
EV
MC
NYS
E
BID
UN
ASD
AQ
CRU
SN
ASD
AQ
FBN
NYS
EIC
EN
YSE
MA
RN
YSE
OIS
NYS
ESI
GN
YSE
VM
WN
YSE
BIG
NYS
EC
VG
WN
ASD
AQ
FBR
NYS
EIF
TN
YSE
MAT
XN
YSE
OW
WN
YSE
SIM
GN
ASD
AQ
VRT
XN
ASD
AQ
BKI
NYS
EC
VS
NYS
EFC
XN
YSE
IMM
RN
ASD
AQ
MBI
NYS
EO
XYN
YSE
SIM
ON
ASD
AQ
VRX
NYS
E
BKW
NYS
EC
VX
NYS
EFD
ON
YSE
INFA
NA
SDA
QM
BTN
YSE
OZM
NYS
ESI
NA
NA
SDA
QV
VU
SN
ASD
AQ
BLO
XN
YSE
CW
HN
YSE
FDS
NYS
EIN
INN
ASD
AQ
MC
FN
YSE
PN
YSE
SNH
NYS
EW
AB
NYS
E

76 Economics and Business Review, Vol. 2 (16), No. 3, 2016
References
Aizenman, J., Jinjarak, Y., Lee, M., Park, D., 2016, Developing Countries’ Financial Vulnerability to the Eurozone Crisis: an Event Study of Equity and Bond Markets, Journal of Economic Policy Reform, vol. 19, no. 1: 1–19.
Będowska-Sójka, B., 2014, Intraday Stealth Trading: Evidence from the Warsaw Stock Exchange, Poznań University of Economics Review, vol. 14, no. 1: 5–19.
Bollen, J., Mao, H., Zeng, X., 2011, Twitter Mood Predicts the Stock Market, Journal of Computational Science, vol. 2, no. 1: 1–8.
Campbell, J.Y., Lo, A.W., Mackinlay, A.C., 1997, The Econometrics of Financial Markets, Princeton University Press.
Choi, H., Varian, H., 2012, Predicting the Present with Google Trends, Economic Record, vol. 88, no. 1: 2–9.
Das, S.R., Chen, M.Y., 2007, Yahoo! for Amazon: Sentiment Extraction from Small Talk on the Web, Management Science, vol. 53, no. 9: 1375–1388.
Folfas, P., 2016, Co-movements of NAFTA Stock Markets: Granger-causality Analysis, Economics and Business Review, vol. 2(16) no. 1: 53–65.
Gruhl, D., Guha, R., Kumar, R., Novak, J., Tomkins, A. (eds.), 2005, The Predictive Power of Online Chatter, Proceedings of the Eleventh ACM SIGKDD International Conference on Knowledge Discovery in Data Mining: ACM.
Java, A., Song, X., Finin, T., Tseng, B., 2007, Why We Twitter: Understanding Microblogging Usage and Communities, Joint 9th WEBKDD & 1st SNA-KDD Workshop ’07.
Liu, Y., Huang, X., An, A., Yu, X. (eds.), 2007, A Sentiment-aware Model for Predicting Sales Performance Using Blogs, Proceedings of the 30th Annual International ACM SIGIR Conference on Research and Development in Information Retrieval, ARSA.
Mei, Q., Ling, X., Wondra, M., Su, H., Zhai, C. (eds.), 2007, Topic Sentiment Mixture: Modeling Facets and Opinions in Weblogs, Proceedings of the 16th International Conference on World Wide Web: ACM.
Milstein, S., Lorica, B., 2008, Twitter and the Micro Messaging Revolution, Communication, Connections and Immediacy – 140 Characters at a Time, O’Reilly Media, United States.
Mishne, G., Glance, N. (eds.), 2006, Predicting Movie Sales from Blogger Sentiment, AAAI 2006 Spring Symposium on Computational Approaches to Analysing Weblogs.
Nardo, M., Petracco‐Giudici, M., Naltsidis, M., 2015, Walking Down Wall Street with a Tablet: A Survey of Stock Market Predictions Using The Web, Journal of Economic Surveys, vol. 30, no. 2: 356–369.
O’Connor, B., Balasubramanyan, R., Routledge, B.R., Smith, N.A. (eds.), 2010, From Tweets to Polls: Linking Text Sentiment to Public Opinion Time Series, Proceedings of the International AAAI Conference on Weblogs and Social Media.
Porshnev, A., Redkin, I., Shevchenko, A., 2013, Improving Prediction of Stock Market Indices by Analyzing the Psychological States of Twitter Users, National Research University Higher School of Economics, WP BRP 22/FE/2013.
Preis, T., Moat, H.S., Stanley, H.E., 2013, Quantifying Trading Behavior in Financial Markets Using Google Trends, Scientific Reports 3.
Ranco, G., Aleksovski, D., Caldarelli, G., Grčar, M., Mozetič, I., 2015, The Effects of Twitter Sentiment on Stock Price Returns, PloS one, vol. 10, no. 9.

77K. Shutes, K. McGrath, P. Lis, R. Riegler, Twitter and the US stock market
Rani, N., Yadav, N.I.I., Jain, P.K., 2015, Impact of Cross-border Acquisitions’ Announcements on Shareholders’ Wealth: Evidence from India, Global Business and Economics Review, vol. 17, no. 4: 360–382.
Santos, H.S., Laender, A.H., Pereira, A.C., 2015, A Twitter View of the Brazilian Stock Exchange Market, E-Commerce and Web Technologies, vol. 239: 112–123.
Si, J., Mukherjee, A., Liu, B., Li, Q., Li, H., Deng, X., 2013, Exploiting Topic Based Twitter Sentiment for Stock Prediction, Proceedings of the 51st Annual Meeting of the Association for Computational Linguistics.
Sprenger, T.O., Tumasjan, A., Sandner, P.G., Welpe, I.M., 2013, Tweets and Trades: The Information Content of Stock Microblogs, European Financial Management, vol. 20, no. 5.
Sul, H.K., Dennis, A.R., Yuan, L.I., 2014, Trading on Twitter: The Financial Information Content of Emotion in Social Media, System Sciences (HICSS), 2014 47th Hawaii International Conference: IEEE.
Tumarkin, R., Whitelaw, R.F., 2001, News or Noise? Internet Postings and Stock Prices, Financial Analysts Journal, vol. 57, no. 3: 41–51.
Tumasjan, A., Sprenger, T.O., Sandner, P.G., Welpe, I.M., 2010, Predicting Elections with Twitter: What 140 Characters Reveal about Political Sentiment, ICWSM 10: 178–185.
Wang, H., Can, D., Kazemzadeh, A., Bar, F., Narayanan, S. (eds.), 2012, A System for Real-time Twitter Sentiment Analysis of 2012 US Presidential Election Cycle, Proceedings of the 50th Annual Meeting of the Association for Computational Linguistics, Jeju, Korea.
Wysocki, P., 1998, Cheap Talk on the Web: The Determinants of Postings on Stock Message Boards, University of Michigan Business School Working Paper, 98025.
Yang, H., Zheng, Y., Zaheer, A., 2015a, Asymmetric Learning Capabilities and Stock Market Returns, Academy of Management Journal, vol. 58, no. 2: 356–374.
Yang, S.Y., Mo, S.Y.K., Liu, A., 2015b, Twitter Financial Community Sentiment and Its Predictive Relationship to Stock Market Movement, Quantitative Finance, vol. 15, no. 10:1637–1656.
Zhang, X., Fuehres, H., Gloor, P.A., 2011, Predicting Stock Market Indicators through Twitter “I Hope it is Not as Bad as I Fear”, Procedia-Social and Behavioral Sciences, vol. 26: 55–62.
Editorial BoardRyszard BarczykWitold JurekCezary KochalskiTadeusz Kowalski (Editor-in-Chief)Henryk MrukIda MusiałkowskaJerzy SchroederJacek WalluschMaciej Żukowski
International Editorial Advisory BoardEdward I. Altman – NYU Stern School of BusinessUdo Broll – School of International Studies (ZIS), Technische Universität, DresdenWojciech Florkowski – University of Georgia, Gri� nBinam Ghimire – Northumbria University, Newcastle upon TyneChristopher J. Green – Loughborough UniversityJohn Hogan – Georgia State University, AtlantaMark J. Holmes – University of Waikato, HamiltonBruce E. Kaufman – Georgia State University, AtlantaSteve Letza – Corporate Governance Business School Bournemouth UniversityVictor Murinde – University of BirminghamHugh Scullion – National University of Ireland, GalwayYochanan Shachmurove – � e City College, City University of New YorkRichard Sweeney – � e McDonough School of Business, Georgetown University, Washington D.C.� omas Taylor – School of Business and Accountancy, Wake Forest University, Winston-SalemClas Wihlborg – Argyros School of Business and Economics, Chapman University, OrangeHabte G. Woldu – School of Management, � e University of Texas at Dallas
� ematic EditorsEconomics: Ryszard Barczyk, Tadeusz Kowalski, Ida Musiałkowska, Jacek Wallusch, Maciej Żukowski • Econometrics: Witold Jurek, Jacek Wallusch • Finance: Witold Jurek, Cezary Kochalski • Management and Marketing: Henryk Mruk, Cezary Kochalski, Ida Musiałkowska, Jerzy Schroeder • Statistics: Elżbieta Gołata, Krzysztof SzwarcLanguage Editor: Owen Easteal • IT Editor: Marcin Reguła
© Copyright by Poznań University of Economics and Business, Poznań 2016
Paper based publication
ISSN 2392-1641
POZNAŃ UNIVERSITY OF ECONOMICS AND BUSINESS PRESSul. Powstańców Wielkopolskich 16, 61-895 Poznań, Polandphone +48 61 854 31 54, +48 61 854 31 55, fax +48 61 854 31 59www.wydawnictwo-ue.pl, e-mail: [email protected] address: al. Niepodległości 10, 61-875 Poznań, Poland
Printed and bound in Poland by:Poznań University of Economics and Business Print Shop
Circulation: 230 copies
Aims and Scope
Economics and Business Review is the successor to the Poznań University of Economics Review which was published by the Poznań University of Economics and Business Press in 2001–2014. � e Economics and Business Review is a quarterly journal focusing on theoretical and applied research work in the � elds of economics, management and � nance. � e Review welcomes the submission of articles for publication dealing with micro, mezzo and macro issues. All texts are double-blind assessed by independent review-ers prior to acceptance.
Notes for Contributors
1. Articles submitted for publication in the Economics and Business Review should contain original, unpublished work not submitted for publication elsewhere.
2. Manuscripts intended for publication should be written in English and edited in Word and sent to: [email protected]. Authors should upload two versions of their manuscript. One should be a com-plete text, while in the second all document information identifying the author(s) should be removed from � les to allow them to be sent to anonymous referees.
3. � e manuscripts are to be typewritten in 12’ font in A4 paper format and be le� -aligned. Pages should be numbered.
4. � e papers submitted should have an abstract of not more than 100 words, keywords and the Journal of Economic Literature classi� cation code.
5. Acknowledgements and references to grants, a� liation, postal and e-mail addresses, etc. should appear as a separate footnote to the author’s namea, b, etc and should not be included in the main list of footnotes.
6. Footnotes should be listed consecutively throughout the text in Arabic numerals. Cross-references should refer to particular section numbers: e.g.: See Section 1.4.
7. Quoted texts of more than 40 words should be separated from the main body by a four-spaced inden-tation of the margin as a block.
8. Mathematical notations should meet the following guidelines: – symbols representing variables should be italicized, – avoid symbols above letters and use acceptable alternatives (Y*) where possible, – where mathematical formulae are set out and numbered these numbers should be placed against the right margin as... (1),
– before submitting the � nal manuscript, check the layout of all mathematical formulae carefully ( including alignments, centring length of fraction lines and type, size and closure of brackets, etc.),
– where it would assist referees authors should provide supplementary mathematical notes on the derivation of equations.
9. References in the text should be indicated by the author’s name, date of publication and the page num-ber where appropriate, e.g. Acemoglu and Robinson [2012], Hicks [1965a, 1965b]. References should be listed at the end of the article in the style of the following examples:Acemoglu, D., Robinson, J.A., 2012, Why Nations Fail. � e Origins of Power, Prosperity and Poverty,
Pro� le Books, London.Kalecki, M., 1943, Political Aspects of Full Employment, � e Political Quarterly, vol. XIV, no. 4: 322–331.Simon, H.A., 1976, From Substantive to Procedural Rationality, in: Latsis, S.J. (ed.), Method and Appraisal
in Economics, Cambridge University Press, Cambridge: 15–30.10. Copyrights will be established in the name of the E&BR publisher, namely the Poznań University of
Economics and Business Press.
More information and advice on the suitability and formats of manuscripts can be obtained from:Economics and Business Reviewal. Niepodległości 1061-875 PoznańPolande-mail: [email protected]

Volume 2 (16) Number 3 2016
Volume 2 (16)
Num
ber 3 2016
Poznań University of Economics and Business Press
ISSN 2392-1641
Economicsand Business
Economics and B
usiness Review
Review
Subscription
Economics and Business Review (E&BR) is published quarterly and is the successor to the Poznań University of Economics Review. � e E&BR is published by the Poznań University of Economics and Business Press.
E&BR is listed in ProQuest, EBSCO, and BazEkon.
Subscription rates for the print version of the E&BR: institutions: 1 year – €50.00; individuals: 1 year – €25.00. Single copies: institutions – €15.00; individuals – €10.00. � e E&BR on-line edition is free of charge.
Correspondence with regard to subscriptions should be addressed to: Księgarnia Uniwersytetu Ekonomicznego w Poznaniu, ul. Powstańców Wielkopolskich 16, 61-895 Poznań, Poland, fax: +48 61 8543147; e-mail: [email protected].
Payments for subscriptions or single copies should be made in Euros to Księgarnia Uniwersytetu Ekonomicznego w Poznaniu by bank transfer to account No.: 96 1090 1476 0000 0000 4703 1245.
CONTENTS
A word from the Editor
ARTICLES
From duration analysis to GARCH models – An approach to systematization of quan-titative methods in risk measurementKrzysztof Jajuga
Credit markets and bubbles: is the benign credit cycle over?Edward I. Altman, Brenda J. Kuehne
Bipolar growth model with investment � owsKatarzyna Filipowicz, Tomasz Misiak, Tomasz Tokarski
Twitter and the US stock market: � e in� uence of micro-bloggers on share pricesKarl Shutes, Karen McGrath, Piotr Lis, Robert Riegler
Can we invest on the basis of equity risk premia and risk factors from multi-factor models?Paweł Sakowski, Robert Ślepaczuk, Mateusz Wywiał
Quantifying wage e� ects of o� shoring: import- versus export-based measures of pro-duction fragmentationJoanna Wolszczak-Derlacz, Aleksandra Parteka
Simple four-step procedure of parabolic B curve determination for OECD countries in 1990Q1–2015Q4Dariusz J. Błaszczuk
BOOK REVIEW
Jerzy Witold Wiśniewski, Microeconometrics in Business Management, John Wiley & Sons, United Kingdom 2016 (Dorota Appenzeller)