
Weather Sensitive Crop Models: Applicationsjhansen/jones15july-b.pdf · Climate Variability & Food...
74
Climate Variability & Food Security IRI Advanced Training Institute July 15, 2002 Weather Sensitive Crop Models: Applications James W. Jones Agricultural & Biological Engineering University of Florida
Transcript of Weather Sensitive Crop Models: Applicationsjhansen/jones15july-b.pdf · Climate Variability & Food...

Climate Variability & Food SecurityIRI Advanced Training InstituteJuly 15, 2002
Weather Sensitive Crop Models:Applications
James W. JonesAgricultural & Biological Engineering
University of Florida

Climate Variability & Food SecurityIRI Advanced Training InstituteJuly 15, 2002
Applications• Diagnose Problems (Yield Gap Analysis)• Precision Agriculture
– Diagnose Factors Causing Yield Variations– Prescribe Spatially Variable Management
• Adaptive Management using Climate Forecasts• Soil Carbon Sequestration• Land Use Change Analysis• Targeting Aid
– Early Warning of Food Shortages– Fertilizer vs. Food Aid Decision
• Climate Change

Climate Variability & Food SecurityIRI Advanced Training InstituteJuly 15, 2002
Example Applications in EUROPEType of Application References
Crop management Hunkár, 1994; Pfeil et al., 1992a, b; Ruiz-Nogueria et al., 2001; Sau et al. 1999; Zalud et al., 2000
Fertilizer management Gabrielle and Kengni, 1996; Gabrielle et al., 1998; Zalud et al., 2001
Irrigation management Ben Nouna et al., 2000; Castrignano et al., 1998; Gerdes et al., 1994
Tillage management Castrignano et al., 1997
Variety evaluation Brisson et al., 1989, Colson et al., 1995
Precision farming Booltink and Verhagen, 1997; Booltink et al., 2001
Environmental Pollution Kovács and Németh, 1995
Climate change Alexandrov and Hoogenboom, 2001; Iglesis et al., 2000; Semenov et al., 1996; Wolf et al., 1996
Yield forecasting Landau et al., 1998; Saarikko, 2000
Sustainability Hoffmann and Ritchie, 1993
Citations of applications of DSSAT cropping system models. Jones et al. 2002.

Climate Variability & Food SecurityIRI Advanced Training InstituteJuly 15, 2002
NORTH AMERICAType of ApplicationType of Application ReferencesReferencesCrop management Egli. and Bruening, 1992; Jame and Cuutforth, 1996; Sexton et al., 1998
Fertilizer management Beckie et al., 1995; Hodges, 1998
Irrigation mgt. Epperson et al., 1993; Hook, 1994; McClendon et al., 1996; Steele et al., 2000; Swaneyet al., 1983
Pest management Barbour et al., 1994; Barbour and Bridges, 1995; Batchelor et al., 1993; Boote et al., 1993; Lacey et al., 1989; Mishoe et al., 1984
Tillage management Andales et al., 2000
Variety evaluation Irmak et al., 1999; Manrique et al., 1990; Mavromatis et al., 2001; Piper et al., 1996, 98
Genomics Boote and Tollenaar, 1994; Boote et al., 2001; Hoogenboom et al., 1997; White andHoogenboom, 1996
Precision agriculture Han et al., 1995; Sadler et al., 2000; Paz et al., 1998, 1999; Irmak et al., 2001; Paz et al., 2001a, 2001b, Seidl et al. 2001
Environment Gerakis and Ritchie, 1998; Pang et al., 1998
Climate change Hatch et al., 1999; Mearns et al., 2001; Rosenzweig and Tubiello, 1995; Southworth et al., 2000; Tubiello et al., 1995, 2001; Boote et al., 1997
Climate variability Hansen and Jones, 2000; Jones et al., 2000; Mearns et al., 1996
Yield forecasting Carbone, 1993; Carbone et al., 1996; Chipansi et al., 1997,1999; Duchon, 1986;Georgiev and Hoogenboom, 1999; Moulin and Beckie, 1993
Sustainability Bowen et al., 1992, Hasegawa et al., 1999, 2000; Quemada and Cabrera, 1995; Wagner-Riddle et al., 1997
Space technology Fleisher et al., 2000
Education Cabrera, 1994; Meisner et al., 1991

Climate Variability & Food SecurityIRI Advanced Training InstituteJuly 15, 2002
Example Applications in AFRICA
Type of ApplicationType of Application ReferencesReferencesCrop management Fechter et al., 1991; Mbabaliye and Wojtkowski, 1994; Vos and
Mallett, 1987; Wafula, 1995Fertilizer management Jagtap et al., 1999; Singh et al., 1993; Thornton et al., 1995;
Keating et al., 1991Irrigation management Kamel et al., 1995; MacRobert and Savage, 1998
Precision management Booltink et al., 2001
Climate change Muchena and Iglesias, 1995
Climate variability Phillips et al., 1998
Food security Pisani, 1987; Thornton et al., 1997
Citations of applications of DSSAT cropping system models. Jones et al. 2002.

Climate Variability & Food SecurityIRI Advanced Training InstituteJuly 15, 2002
Example Applications in LATIN AMERICA
Crop management Savin et al., 1995; Travasso and Magrin, 1998
Irrigation management Heinemann et al., 2000
Precision management Booltink et al., 2001
Variety evaluation Castelan Ortega et al., 2000; Ferreyra et al., 2000; White et al. 1995
Climate change Baethgen, 1997, Conde et al., 1997; Diaz et al.,1997; Magrin et al., 1997; Maytin et al., 1995
Climate variability Messina et al., 1999; Podesta et al., 2002; Ferreyra et al., 2001; Royce et al., 2002
Yield forecasting Meira and Guevara, 1997; Travasso et al., 1996
Sustainability Giraldo et al., 1998
Education Ortiz, 1998
Type of ApplicationType of Application ReferencesReferences
Citations of applications of DSSAT cropping system models. Jones et al. 2002.

Climate Variability & Food SecurityIRI Advanced Training InstituteJuly 15, 2002
Example Applications in ASIA
Type of ApplicationType of Application ReferencesReferences
Crop management Alagarswamy et al., 2000; Jintrawet, 1995; Singh et al., 1994a, b; Salam et al., 2001
Fertilizer management Godwin et al., 1994
Irrigation management Hundal and Prabhjyot-Kaur, 1997
Pest management Luo et al., 1997; Pinnschmidt et al., 1995
Climate change Jinghua and Erda. 1996; Lal et al., 1998, 1999; Luo et al., 1995; 1998; Singh and Godwin, 1990
Climate variability Alocilja and Ritchie, 1990; Gadgil et al., 1999
Yield forecasting Kaur and Hundal, 1999; Singh et al., 1999
Sustainability Singh et al., 1999a, b
Citations of applications of DSSAT cropping system models. Jones et al. 2002.

Climate Variability & Food SecurityIRI Advanced Training InstituteJuly 15, 2002
Outline• Example Applications1
– Agronomic Research– Determine Best Management for Site, Situation– Precision Agriculture– Climate Change– Land Use Management– Climate Forecast Use
• DSSAT Overview• DSSAT Demo
•• 11Think about what is needed for each application!Think about what is needed for each application!

Climate Variability & Food SecurityIRI Advanced Training InstituteJuly 15, 2002
Tool: Synthesize and Interpret Research
• Test published relationships between crop growth processes and light, temperature, water, N.
• Hypothesize causes of yield gaps, whether fertility, weather, or pest effects
• Hypothesize Genetic Improvement in Yield

Climate Variability & Food SecurityIRI Advanced Training InstituteJuly 15, 2002
Diagnose Yield Gaps
• In developing countries (and US), production may be less than the climatic potential.
• Use model as a “What if” tool, to postulate causes associated with water, soil fertility, diseases, pests, & poor management.
Climate Variability & Food SecurityIRI Advanced Training InstituteJuly 15, 2002
Peanut Cropping Systems Analysis in Benin and Ghana
• Low peanut yield and inefficient use of natural resources
• Objective is to identify yield gaps a n d i mprove production efficiency
• Fun ded by Peanut-CRSP• Collaborative research and training progra m between the Institute Nationale des Recherches Agrono mic du Benin; the Savan n a h Agricultural Research Institute in Nyankpala, Gha n a; and the University of

Climate Variability & Food SecurityIRI Advanced Training InstituteJuly 15, 2002
Observed and Simulated BiomassYield Gap Analysis
Peanut - Benin
0 10 20 30 40 50 60 70 80 90 1000
1,000
2,000
3,000
4,000
5,000
6,000
Days after Planting
Biomass (kg/ha)
Planted Density
Actual Density (AD)
AD + Fertility (F)
AD + F + Disease
Observed

Climate Variability & Food SecurityIRI Advanced Training InstituteJuly 15, 2002
������������������������
������
������
�����
�����
������
��������������������������������������������������������
���������
������
������
����
��������������������
������
������
�����������
�����
������
�����������
������
���������
�����
������������
����
�����
����
������
�����
��������������
������
�����
������
������
������
������������������������
������
������
������
���������������������������������������������������
����
����������������
������
���������������
�����������������
����������������
���������������
������
�������
0
200
400
600
800
1000
1200
1400
150 200 250 300 350
�������������������
D1, DEF (Sim.)D3, DEF (Sim.)D1 (Sim.)D3 (Sim.)D1 (Obs.)D3 (Obs.)
�����������������������������������������������
�����������������
����������
����
�����
������
�����
�����
������
�������������������������������
������
������
������
����������������
�������
������
���������
�����
�����
����������
������
���������������
�����
���������
�����
�����������
������
������
��������
���������������
������
���������������������
������
������
����������������
������
������
�����
����
����
����
�����
�������������������������
�����
����
�����
������
������
��������������������������������
������
������
��������������������������
������
������
������������������������
������
���������������������������
�������
����
0
400
800
1200
1600
2000
2400
150 200 250 300 350
JULIAN DAY
a) Chinese, 1997 season
b) F-Mix, 1997 season
LEA
F W
EIG
HT,
kg/
J. Naab – Ghana,
Two peanut cult.
Simulated with no disease effect
Simulated with input defoliation to match observed.
Crop had no fungicide applied

Climate Variability & Food SecurityIRI Advanced Training InstituteJuly 15, 2002
JULIAN DAY
TOTA
L B
IOM
AS
S, k
g/ha
a) Chinese, 1998 season
b) F-Mix, 1998 season
��������������������������������������������������������������������������������������������������������������������������
�����
�����
�������������������������������
�����
�����
������
������
������
������������������������
������
����������������
�����
����
����������������������
�����
�����������������������
������
������
������
������������������
�����
�����
����������������������
����
������
�����������������������������
���������
������
���������������������������������
����������
������
����
����
������
������
���������������������������������������������
0
2000
4000
6000
8000
150 200 250 300 350
�����������������D1, DEF (Sim.)D3, DEF (Sim.)D1 (Sim.)D3 (Sim.)D1 (Obs.)D3 (Obs.)
�������������������������������������������������������������������������������������������������������������������
����������
������
�����
�����������������������
����
�����
�������������������
�����
����������������
�����
������
�����
�����������
�������������
����
������
����
����������������
������
�������������������
������
����
�������������
��������
��������������������������������
�����������
������
������
����
������
����
����
������
����
����
������
����
������
������
0
1000
2000
3000
4000
5000
6000
150 200 250 300 350
a) Chinese, 1997 season
b) F-Mix, 1997 season
J. Naab – Ghana,
Two peanut cult.
Simulated with no disease effect
Simulated with input defoliation and leafspot injury
Crop had no fungicide applied

Climate Variability & Food SecurityIRI Advanced Training InstituteJuly 15, 2002
Yield gap (kg/ha) of peanut due to water deficit
and biotic stress during 1997 in Ghana.
-2978631632866295229 May
1473169314212894458724 July189639120293925431626 June76544131243889433029 May
F-MixCultivar22011077402941304824 July148810414842972307626 June
ChineseCultivar
Yield Gap (biotic stress)(2)-(3)
Yield Gap (water deficit)(1)-(2)
Observed Pod Yield
kg/ha(3)
Water limiting (Sim)
(2)
Water non-limiting (Sim)
(1)
SowingDate

Climate Variability & Food SecurityIRI Advanced Training InstituteJuly 15, 2002
Yield and risk of freeze damage for two soybean MG vs. sowing date in Iowa.
Tool: For Optimizing Crop Management for Production vs. Weather Risk.

Climate Variability & Food SecurityIRI Advanced Training InstituteJuly 15, 2002
Climate Variability & Food SecurityIRI Advanced Training InstituteJuly 15, 2002
Optimize Management
• Variety• Planting Date• Sowing Density• Nitrogen Fertilization• Irrigation• Residue Management• Pest Management

Climate Variability & Food SecurityIRI Advanced Training InstituteJuly 15, 2002
Tool: To Optimize and Analyze N Management
• Optimum N rate, optimum N timing,• Yield response to N in specific year or over long-term,• Impact of cover crops, fallow periods, • N uptake versus contribution from N-fixation by
legumes• NO3 leaching in specific years or over long-term.

Climate Variability & Food SecurityIRI Advanced Training InstituteJuly 15, 2002
Model Testing: Comparison to Observed Data and Model Improvement
• Conduct time-series comparison of processes: Dry matter, N accumulation, NO3 leaching, tissue N conc. If dynamics are not right, look at processes and mechanisms.
• Compare final harvest values (yield, dry matter, N uptake, etc.) versus N applied.
• Conclude whether model accurately predicts N balance processes and response to N fert.

0
5000
10000
15000
20000
25000
0 20 40 60 80 100 120 140
Days after Sowing
Cro
p or
Gra
in M
ass,
kg/
ha
Crop-Low NCrop-High NGrain-Low NGrain-High NCrop-Obs-LCrop-Obs-HGrain-Obs-LGrain-Obs-H
Simulated Crop and Grain Growth of Maize at low or high N (116 vs. 401 kg/ha) on sandy soil in Florida in 1982

0
50
100
150
200
250
300
0 20 40 60 80 100 120 140
Days after Sowing
Tota
l Cro
p N,
kg/
ha
N uptake-Sim-LN uptake-Sim-HN uptake-Obs-LN uptake-Obs-H
Simulated and Observed Crop N Uptake by Maize Grown at Low and High N (116 and 401 kg/ha) on Sandy Soil in Florida in 1982
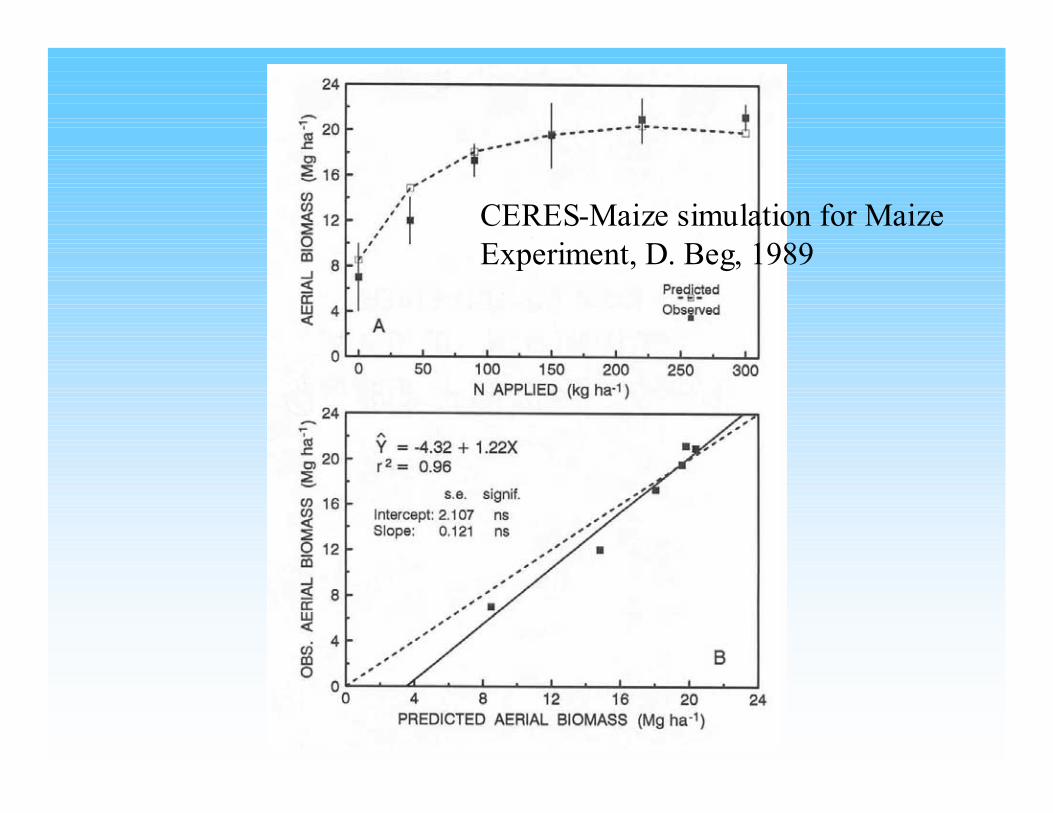
CERES-Maize simulation for Maize Experiment, D. Beg, 1989

Climate Variability & Food SecurityIRI Advanced Training InstituteJuly 15, 2002

Climate Variability & Food SecurityIRI Advanced Training InstituteJuly 15, 2002
Optimizing Planting Date and Nitrogen Fertilizer Maize Grown in Camilla, GA
45 Years of Weather (1951-95)
From F. S. Royce
Climate Variability & Food SecurityIRI Advanced Training InstituteJuly 15, 2002
Precision AgricultureThe Problem:• Yield varies considerably within fields• Spatially varying inputs and management may
increase profits and reduce environmental risksHowever:• Understanding what caused yield variability in a
specific field • Determining how to vary management across a field
to optimize profit and meet other goals

Climate Variability & Food SecurityIRI Advanced Training InstituteJuly 15, 2002
• Yield• Soil type• Images• Pests• Elevation• Drainage• Fertility
Genetics Weather
• Causes of Yield Variability• Develop Prescriptions• Risk Assessment• Economics
Crop Models & Precision FarmingCrop Models & Precision Farming

Climate Variability & Food SecurityIRI Advanced Training InstituteJuly 15, 2002
6000
8000
10000
12000
14000
6000 8000 10000 12000 14000
9798
Simulated versus observed maize grain yield, two years, using field-measuredspatially varying soil parameters in Michigan. R. Braga (2000).
With accurate inputs, crop models can accurately predict yield

Climate Variability & Food SecurityIRI Advanced Training InstituteJuly 15, 2002
1000
1500
2000
2500
3000
3500
4000
0 2 4 6 8 10 12 14 16 18 20 22 24 26 28Position
Yiel
d (k
g/ha
)
MeasuredPredicted
Baker Farm (1994) Transect 1
Soybean
W. D. Batchelor et al., 1999Iowa State University
Climate Variability & Food SecurityIRI Advanced Training InstituteJuly 15, 2002
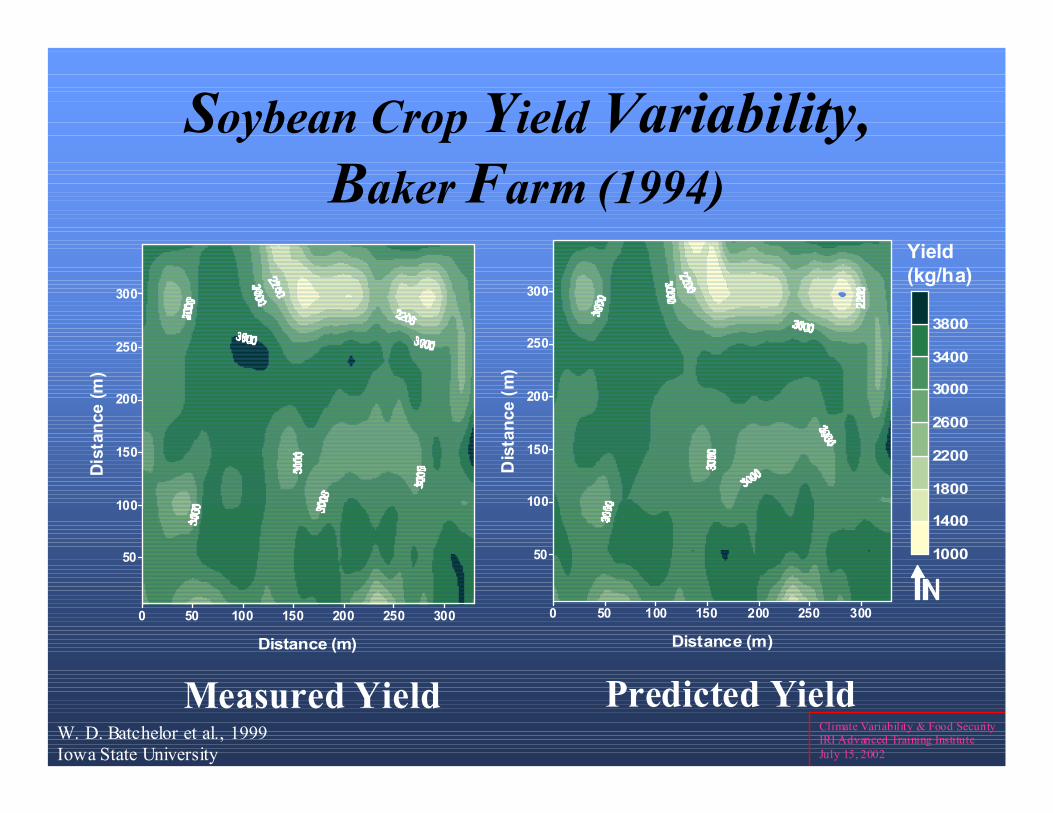
Soybean Crop Yield Variability,Baker Farm (1994)
0 50 100 150 200 250 300
Distance (m)
50
100
150
200
250
300
Dis
tanc
e (m
)
0 50 100 150 200 250 300
Distance (m)
50
100
150
200
250
300
Dist
ance
(m)
1000
1400
1800
2200
2600
3000
3400
3800
Yield (kg/ha)
Measured Yield Predicted YieldW. D. Batchelor et al., 1999Iowa State University

Climate Variability & Food SecurityIRI Advanced Training InstituteJuly 15, 2002
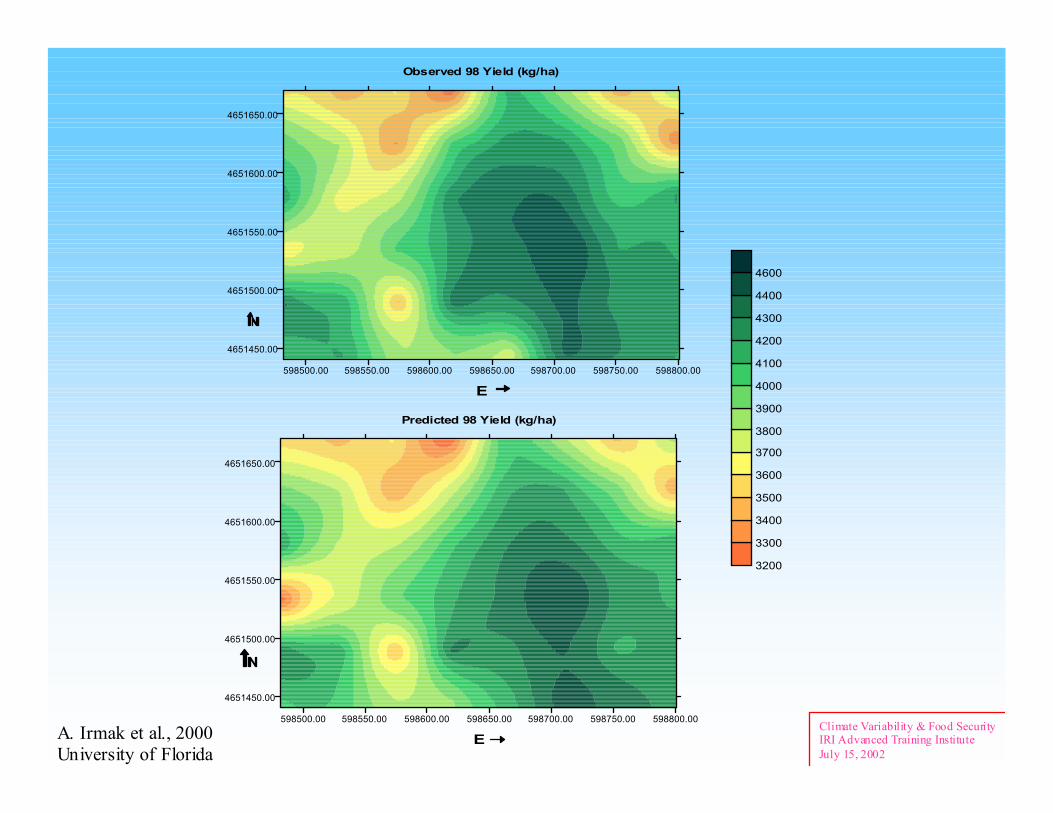
Measured vs Predicted Soybean Yield for 1996 & 1998Optimization + revised initial conditions
2500
3000
3500
4000
4500
5000
2500 3000 3500 4000 4500 5000
Measure d (kg/ha)
Pred
icted
(kg/h
a)
1996 1998
Y = 0.969x + 113.79r2 = 0.9312
RMSE = 74.35 kg/ha
A. Irmak et al., 2000University of Florida
1996 Season Rain = 418 mm
1998 Season Rain = 700 mm
Simulated Yields After Estimating Soil Properties

Climate Variability & Food SecurityIRI Advanced Training InstituteJuly 15, 2002
598500 .00 598550 .00 598600 .00 598650 .00 598700 .00 598750 .00 598800 .00
E
Measured 96 Yield (kg/ha)
465145 0.00
465150 0.00
465155 0.00
465160 0.00
465165 0.00
5 98500.00 5 98550.00 5 98600.00 5 98650.00 5 98700.00 5 98750.00 5 98800.00
E
Predicted 96 Yield (kg/ha)
4 651450.00
4 651500.00
4 651550.00
4 651600.00
4 651650.00
2600
2700
2800
29003000
3100
3200
3300
3400
3500
3600
37003800
3900
4000
4100
4200
A. Irmak et al., 2000University of Florida
Climate Variability & Food SecurityIRI Advanced Training InstituteJuly 15, 2002
598500.00 598550.00 598600.00 598650.00 598700.00 598750.00 598800.00
E
Observed 98 Yield (kg/ha)
4651450.00
4651500.00
4651550.00
4651600.00
4651650.00
598500.00 598550.00 598600.00 598650.00 598700.00 598750.00 598800.00
E
Predicted 98 Yield (kg/ha)
4651450.00
4651500.00
4651550.00
4651600.00
4651650.00
3200
3300
3400
3500
3600
3700
3800
3900
4000
4100
4200
4300
4400
4600
A. Irmak et al., 2000University of Florida

Climate Variability & Food SecurityIRI Advanced Training InstituteJuly 15, 2002
Climate Change
• Increases in Atmospheric CO2 Levels, ~ 1% per year (Currently about 360 vpm)
• Affects energy balance of the Earth’s surface, hydrologic cycle and global circulation patterns
• Likely increase temperature, change rainfall, melt glacial ice and raise sea levels
• How would such changes affect agriculture?

Climate Variability & Food SecurityIRI Advanced Training InstituteJuly 15, 2002
Climate Change• Recent General Circulation Model results
suggest: – Temperature increases across the USA
• from 0.5 to 1.5 C by the year 2035• from 2.0 to 4.0 C by the end of the 21st Century
– Precipitation increases across the USA• -4 to +12 cm/year by 2035• +8 to +30 cm/year by the end of the 21st Century
• Uncertainty exists in magnitude, but evidence is accumulating that changes are indeed occurring

Climate Variability & Food SecurityIRI Advanced Training InstituteJuly 15, 2002
Soybean Production under Climate Change
Purposes
• Understand how soybean yields might change under different climate change situations
• Investigate how changes in management might improve yields under climate change situations

Climate Variability & Food SecurityIRI Advanced Training InstituteJuly 15, 2002
Soybean Study
• Selected 15 locations across the USA soybean growing region
• 20 years of historical weather data (to define “current” weather conditions, including year to year variability
• Systematically changed temperature (-1 C to +5 C) and rainfall (-40% to +40%) by equal increments to produce a range of possible responses

Climate Variability & Food SecurityIRI Advanced Training InstituteJuly 15, 2002
#
#
#
#
#
#
#
#
##
#
##
#
#
Area (ha) : 1995Not Estimated<40004000-10,00010,000 to 20,00020,000 to 40,00040,000 to 60,00060,000 +
Soybean Production

Climate Variability & Food SecurityIRI Advanced Training InstituteJuly 15, 2002
#
#
#
#
#
#
#
#
##
#
##
#
#
A a (h ) : 995Not Est m t
Location of Study Sites

Climate Variability & Food SecurityIRI Advanced Training InstituteJuly 15, 2002
Table 1. Summary information for the locations used in the study.
Weather StationLocation
Latitude Variety,MG
Planting Date(DOY)
Soil WaterHoldingCapacity,
mm
GrowingSeasonAverage
Temperature,oC
GrowingSeasonRainfall,
mm
Northern StatesFergus Falls, MN 46.28 0 May 17 (137) 267 19.37 296Madison, WI 43.08 1 May 16 (136) 240 19.70 385E Lansing, MI 42.71 2 May 18 (138) 195 19.21 319Ames, IA 42.02 2 May 15 (135) 272 21.02 449Lincoln, NB 40.82 3 May 19 (139) 264 22.77 386Lafayette, IN 40.41 3 May 16 (136) 267 21.20 447Urbana, IL 40.11 3 May 16 (136) 281 21.64 440Manhattan, KS 39.19 4 May 25 (145) 202 23.07 433Average 249 21.00 394
Southern StatesLouisville, KY 38.22 4 Jun 5 (156) 184.2 22.76 410.7Richmond, VA 37.53 4 May 20 (140) 184.2 23.04 446.2Raleigh, NC 35.82 6 Jun 1 (152) 189.0 23.63 445.8Jackson, TN 35.63 5 May 31 (151) 244.3 24.08 437.6Columbia, SC 34.04 7 May 29 (149) 188.0 23.4 513.8Starkville, MS 32.32 5 May 16 (136) 266.6 25.92 431.6Tifton, GA 31.47 7 Jun 9 (160) 184.2 25.28 459.7Average 205.8 24.02 449.3

Climate Variability & Food SecurityIRI Advanced Training InstituteJuly 15, 2002
CROPGRO-Soybean Model• Based on understanding of weather, plant, soil,
management interactionso Vegetative and reproductive developmento photosynthesis, respiration, growtho Root water uptake, stress effects on growth processes
• Predict growth, yield, timing (Outputs)• Require information (Inputs)
o Field, Soil characteristicso Weather (daily)o Cultivar characteristicso Management
• Can be used to perform “what-if” experiments

Climate Variability & Food SecurityIRI Advanced Training InstituteJuly 15, 2002
Simulated Results
• Current Management Practices• All combinations of climate, with and
without considering increases in CO2 levels• Example results for
– Ames, Iowa– Tifton, Georgia

Climate Variability & Food SecurityIRI Advanced Training InstituteJuly 15, 2002
0
1000
2000
3000
4000
5000
6000
-2 -1 0 1 2 3 4 5
Temperature Change, oC
0
1000
2000
3000
4000
5000
6000
-2 -1 0 1 2 3 4 5
Temperature Change, oC
403020100-10-20-30-40
Ames, Iowa
Current CO2 Levels“Double” CO2 Levels
% Change in Rainfall
Kg/ha
Climate Variability & Food SecurityIRI Advanced Training InstituteJuly 15, 2002
0
1000
2000
3000
4000
5000
6000
-2 -1 0 1 2 3 4 5Temperature Change, oC
403020100-10-20-30-40
0
1000
2000
3000
4000
5000
6000
-2 -1 0 1 2 3 4 5Temperature Change, oC
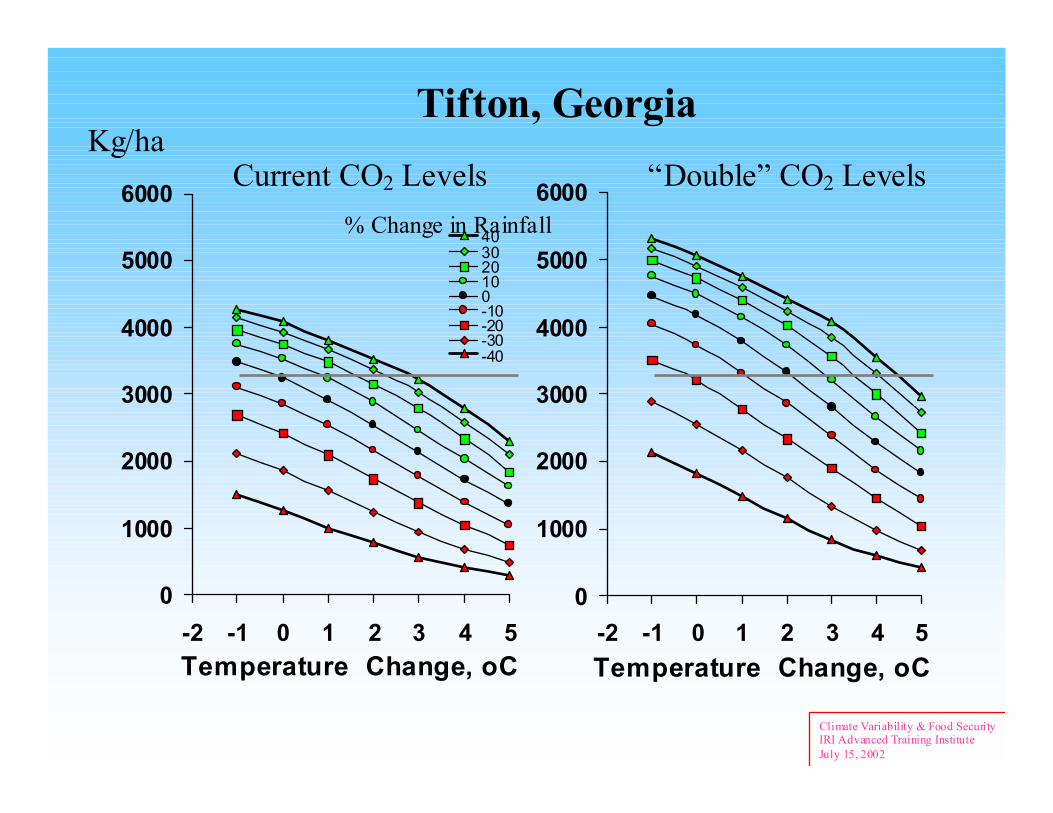
Tifton, GeorgiaCurrent CO2 Levels “Double” CO2 Levels
% Change in Rainfall
Kg/ha

Climate Variability & Food SecurityIRI Advanced Training InstituteJuly 15, 2002
Generally• Yield in southern states were reduced under
any increases in temperature at current CO2levels and rainfall; yields in more northern states were affected very little
• Decreases in rainfall affected yields more in southern states
• Increases in CO2 mostly compensated for up to 2 C increase in temperature in southern states and resulted in increases in yield in northern states

Climate Variability & Food SecurityIRI Advanced Training InstituteJuly 15, 2002
-60
-40
-20
0
20
40
60
30 35 40 45 50Latitude
Yiel
d C
hang
e, %
+2C, Normal Precip, +CO2+2C, -20% Precip, +CO2+2C, -30% Precip, +CO2
Simulated Yield Change vs. Latitude of Sites

Climate Variability & Food SecurityIRI Advanced Training InstituteJuly 15, 2002
-60
-40
-20
0
20
40
60
15 20 25 30Temperature, oC
Yiel
d C
hang
e, %
+2C, Normal Precip, +CO2+2C, -30 % Precip, +CO2
Simulated Yield Change vs. Current Growing Season Temperatures

Climate Variability & Food SecurityIRI Advanced Training InstituteJuly 15, 2002
Would Changes in Management be Warranted under Climate
Change?• Simulated combinations of
– Planting dates– Varieties
• For several southern and northern locations• Determined management practice that
maximized yield

Climate Variability & Food SecurityIRI Advanced Training InstituteJuly 15, 2002
Iowa, Non-Irrigated Current Cliamte
0
1000
2000
3000
4000
5000
50 150 250DOY Planted
MG 0MG 1MG 2MG 3MG 4
Iowa, Non-Irrigated+2C, -30% Precip,+ CO2
0
1000
2000
3000
4000
5000
50 150 250DOY Planted

Climate Variability & Food SecurityIRI Advanced Training InstituteJuly 15, 2002
Georgia, Non-Irrigated Current Climate
0
1000
2000
3000
4000
5000
50 150 250DOY Planted
MG 5MG 6MG 7MG 8MG 9
Georgia, Non-Irrigated+2C, -30% Precip,+ CO 2
0
1000
2000
3000
4000
5000
50 150 250DOY Planted

Climate Variability & Food SecurityIRI Advanced Training InstituteJuly 15, 2002
Implications• Northern vs. Southern latitude responses• Most detrimental effects:higher temperature
and lower rainfall• Compensating effects of CO2 for some
temperature increases and rainfall decreases• Potential benefits of switching cultivars and
planting dates under climate change• Need for heat tolerant cultivars, especially
for lower latitudes

Climate Variability & Food SecurityIRI Advanced Training InstituteJuly 15, 2002
International Climate Change Impact Assessment
• Global war ming arising fro m increasing at mospheric carbon dioxide and other trace gases
• I mpacts on global agriculture m ay be substantial -- temperatures, rainfall regi mes
• International study using the DSSAT crop m o dels linked to global climate models, providing yield estimates under different clim ate change scenarios
• Predicted yields fed to a world food trade m o del to investigate econo mic consequences, shifts in trade and food security resulting fro m scenarios
• A co m m o n methodology used by scientists in over 20 ountries study funded by

Climate Variability & Food SecurityIRI Advanced Training InstituteJuly 15, 2002
Model Sites for the International Climate Change

Climate Variability & Food SecurityIRI Advanced Training InstituteJuly 15, 2002
T+2 T+4
16
12
8
4
0
-4
-8
Yield Change, %
Wheat Rice Soybean Maize
Aggregated DSSAT Crop Model Yield Changes for +2 oCand +4 oC Temperature Increase

Climate Variability & Food SecurityIRI Advanced Training InstituteJuly 15, 2002
International Climate Change Study -- Results Summary
• Crop yields in mid- and high-latitude regions are less adversely affected than yields in low-latitude regions
• Si mple far m-level adaptations in the te mperate regions can generally offset the detrimental effects of climate change
• Appropriate adaptations for tropical regions need to be developed and tested further, with particular e mphasis on genetic resour es and infor m ation
Climate Variability & Food SecurityIRI Advanced Training InstituteJuly 15, 2002
Economic and Environmental Impacts of Land Use Changes, South Coast of Puerto Rico
• Sugarcane no longer econo mically viable
• Intensive develop ment of alternative crops could provide important econo mic benefits
• Potential nitrate, pesticide pollution of aquifers and coastal areas
• Applied AEGIS/WIN in DSSAT to evaluate impacts of alternative agricultural practices

Climate Variability & Food SecurityIRI Advanced Training InstituteJuly 15, 2002
Land typebeachsalinewetlandwaterdevelopedagricultural
1 0 1 2 3 4 5 K ilo m e t e rs
Soil seriesSan Anton†
Cortada †
Constancia†
Fraternidad‡
Paso Seco‡
Fe‡
Cintrona †
Jacaguas†
Yauco†
non-agricultural† M olli sols‡ Verti sols
JACAGUASSTUDY AREA
Caribbean Sea
San Juan
Mayagüez
Ponce
N
PUERTO RICO
Isabela
Land and soil types in the RioJacaguas floodplain, Puerto Rico

Climate Variability & Food SecurityIRI Advanced Training InstituteJuly 15, 2002
1 0 1 2 3 4 5 K ilo m e t e r s
Nitrate leached(kg N ha- 1)
54 - 6767 - 8080 - 9393 - 106106 - 119non-agricultural
Irrigation (mm) 96 - 127127 - 156156 - 185185 - 214214 - 243non-agricultural
Fruit yield(Mg ha-1 d.w.b.)
2.8 - 3.73.7 - 4.64.6 - 5.45.4 - 6.36.3 - 7.2non-agricultural
Simulated tomato yields, irrigation requirements and nitrate leached
Climate Variability & Food SecurityIRI Advanced Training InstituteJuly 15, 2002
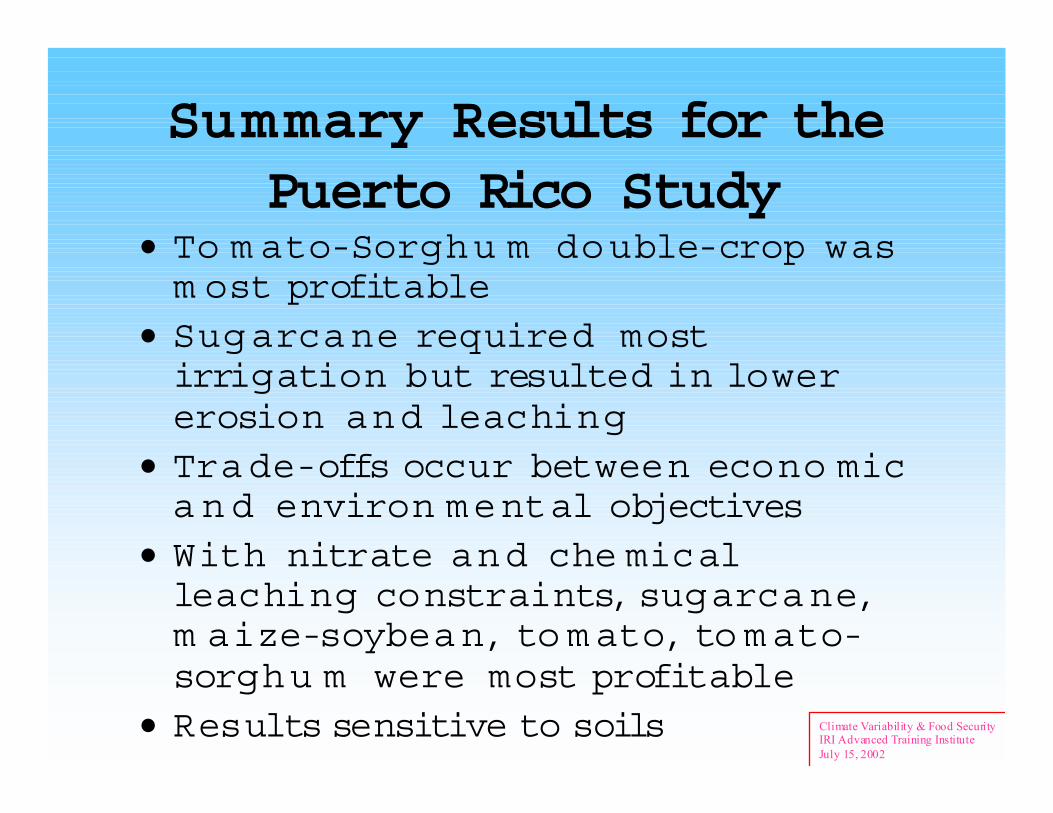
Summary Results for the Puerto Rico Study
• To m ato-Sorghu m double-crop was m ost profitable
• Sugarcane required most irrigation but resulted in lower erosion and leaching
• Trade-offs occur between econo mic a n d environ mental objectives
• With nitrate and che mical leaching constraints, sugarcane, m aize-soybean, to m ato, to m ato-sorghu m were most profitable
• Results sensitive to soils

Climate Variability & Food SecurityIRI Advanced Training InstituteJuly 15, 2002
Crop Models Used in Climate Forecast Applications for:
• Field scale optimal management• Farm scale, crop mix optimization, considering
risk attitude• Estimate value of climate forecast• Accuracy of climate forecast analysis • Link with climate models at regional scale

Climate Variability & Food SecurityIRI Advanced Training InstituteJuly 15, 2002
0
24
68
101214
16
0 2 4 6 8 10 12 14 16
Observed yield (t/ha)
Pred
icte
d yi
eld
(t/ha
) MaizeSoybean
0
1
2
3
4
5
6
0 1 2 3 4 5 6
Observed yield (t/ha)
Pre
dict
ed y
ield
(t/h
a)
Wheat
Crop Models are Essential Tools
Evaluating models for use in Argentina.On farm tests in Pampas Region. Magrin et al.
Climate Variability & Food SecurityIRI Advanced Training InstituteJuly 15, 2002
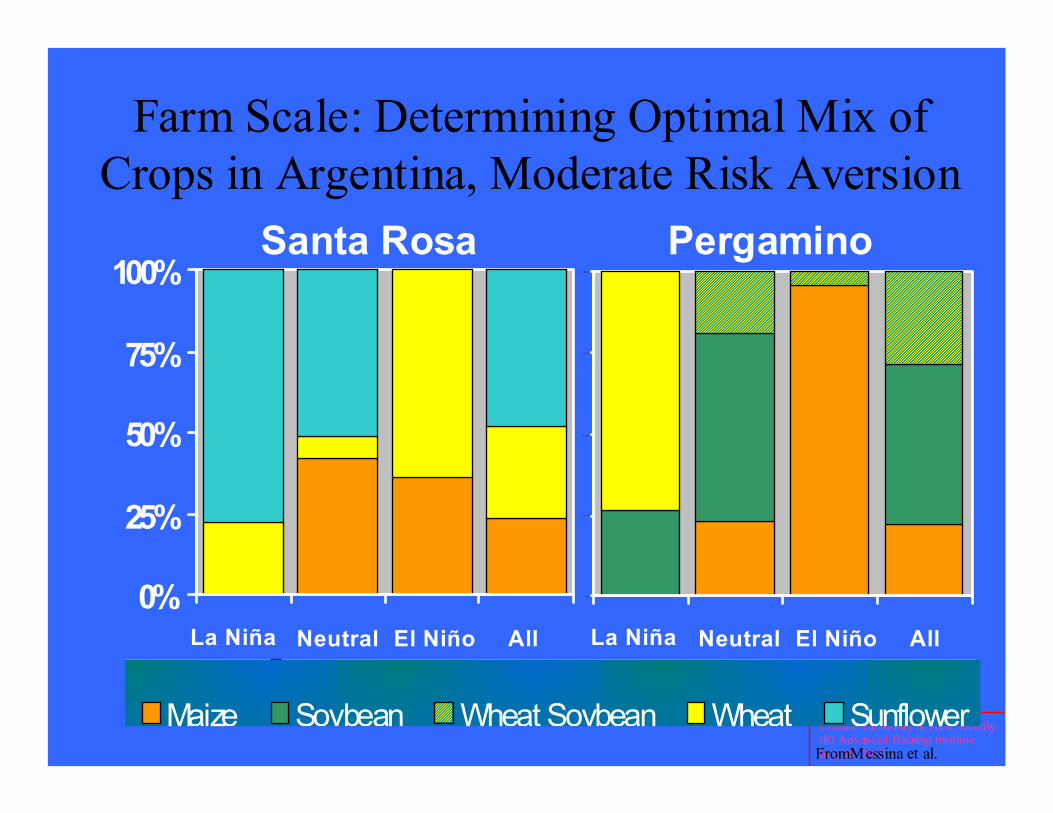
Farm Scale: Determining Optimal Mix of Crops in Argentina, Moderate Risk Aversion
�������������������������������
�������������������������������
�������������������������������
������������������������������������������������������������� ������������������������������
������������������������������
������������������������������
������������������������������
������������������������������
������������������������������
0%
2 5 %
5 0%
7 5 %
1 00%
0%
25%
50%
75%
100%
�������������������������������������������������������������������������������������������������������������������������������������������������������������������������������������������������������������������������������������������������������������������������������������������������������������������������������������
����������������������������������������������������������������������������������������������������������������������������������������������������������������������������������������������������������������������������������������������������������������������������������������������������������������������������������
����������������������������������������������������������������������������������������������������������������������������������������������������������������������������������������������������������������������������������������������������������������������������������������������������������������������������������
����������������������������������������������������������������������������������������������������������������������������������������������������������������������������������������������������������������������������������������������������������������������������������������������������������������������������������
����������������������������������������������������������������������������������������������������������������������������������������������������������������������������������������������������������������������������������������������������������������������������������������������������������������������������������Maize Soybean
���������������� Wheat Soybean Wheat Sunflower
Neutral El Niño AllLa NiñaNeutral El Niño AllLa Niña
Santa Rosa Pergamino
FromMessina et al.
Climate Variability & Food SecurityIRI Advanced Training InstituteJuly 15, 2002
Credibility of Applications
• One must evaluate crop model results relative to real data – don’t trust results otherwise!
• Some adaptation may be required for a particular region (i.e., soil, management, genetic inputs, or even new model components for some purposes)
• First, convince yourself that results are credible, then be able to provide evidence in discussions, advice, publications, etc.

What is DSSAT?
• Research Tool for Crop Production Analyses• Incorporates
– Crop-Soil-Weather Models– Analysis Tools (Uncertainty, Economics)– Support Software (Graphics, Data Management)– GIS Linkages, Spatial Variability Analysis
• Developed by International Network of Researchers (IBSNAT + ICASA)

What is DSSAT?• Designed to:
– Allow Users to Adapt and Evaluate Models for Their Own Conditions
– Incorporate Their Own Data in Standard Formats. Exchangeability important!!
– Provide Insight into “What-if” Questions About Production, Profitability, and Stability

Climate Variability & Food SecurityIRI Advanced Training InstituteJuly 15, 2002
What are DSSAT Functions?
• Input, organize, store data on crop, soil, weather, and experiments.
• Conduct computer “what if?” experiments• Evaluate crop/soil/weather models• Estimate parameters for models (calibrate)• Conduct economic, risk analyses• Link to spatial data bases, GIS

DSSAT v3.5- Models of 16 Crops -
• Grain Legumes (CROPGRO)– Soybean, Peanut, Dry Bean, Chickpea
• Cereals (CERES)– Corn, Wheat, Rice, Barley, Sorghum, Millet
• Root Crops– Potato, Cassava
• Other Crops– Tomato, Sunflower, Sugar Cane, Pasture

Climate Variability & Food SecurityIRI Advanced Training InstituteJuly 15, 2002
DSSAT v3.5Minimum Data Set
• Level 1 - Operate crop simulation models• Level 2 - Evaluation of model performance• Level 3 - Calibration, parameter estimation• Level 4 - Model development (Maximum)
➜Standard files, formats designed, documented, and implemented in DSSAT and its crop models

DSSAT v3.5- Data Management Tools -
• XCREATE - Input crop management information in standard format.
• WeatherMan - Assist users in cleaning, formating, converting weather data.
• Soil SDB3 - Create soil files for particular fields.
• Genotype - Estimate characteristics for new varieties.
DSSAT v3.5- Analysis Tools -
• Sensitivity Analysis - Vary soil, weather, management, or variety characteristics for insight in model behavior and crop physiology.
• Seasonal Analysis - Multiple year simulations to evaluate uncertainty in biophysical and economic responses.
• Spatial Analysis - Define spatially variable soil, weather, management characteristics across a field or region for analysis.

DSSAT v3.5What is it used for?
• Research– Crop Management Options– Land Use Planning – Global Climate Change– Sustainability
• Teaching– Training Programs– Classroom
• Technology Transfer

Climate Variability & Food SecurityIRI Advanced Training InstituteJuly 15, 2002
Organization of experimentaldata in DSSAT
DSSAT
Crop 1
Crop 2
Crop 3
Crop 16
Treatment 1
Treatment 2
Treatment 3
Treatment x
Experiment 1
Experiment 2
Experiment 3
Experiment m
Subdirectories Sections of a FILEX.
Experimentfiles (FILEX)
:::: ::

Climate Variability & Food SecurityIRI Advanced Training InstituteJuly 15, 2002
DSSAT demonstration

Climate Variability & Food SecurityIRI Advanced Training InstituteJuly 15, 2002
Thank You


