Weather Forecasting Models, Methods and …...weather data, forecasting methods and applications....
12
Weather Forecasting Models, Methods and Applications Iseh. A. J. 1 * Woma. T. Y. 1,2 1. Department of Pure & Applied Physics, Federal University Wukari, Taraba State. P. M. B. 1020 Wukari, Taraba State. 2. Department of Pure & Applied Physics, Federal University Wukari, Taraba State. P. M. B. 1020 Wukari, Taraba State. ABSTRACT Weather forecasting modelling is a computer program that provides meteorological information for future times at given locations. In modern forecasting models, Numerical Weather Prediction is mostly applied and this means, “a set of simplified equations used to calculate changes in atmospheric conditions”. The act of writing these equations, imposing the boundary conditions and solving them using super computers, is known as numerical modelling. An example of such equations is the Hypsometric equation given as P I = P O exp–gz/RT. Computerized numerical models are designed for different intervals which are known as global models under which we have long range forecast and medium range forecast, and regional models under which we have the short range forecast. The methods include persistence, climatologic, looking at the sky, use of barometer, nowcasting, use of forecasting models, analogue and ensemble forecasting. Forecasting could be applied in air traffic, severe weather alerts, marine, agriculture, utility companies, private sector and military application. Weather forecasting is a complex and challenging science that depends on the efficient interplay of weather observation, data analysis by meteorologist and computers, and rapid communication system. Key words: Weather, weather prediction, forecast, forecasting models, weather data, forecasting methods and applications. 1.0 INTRODUCTION Modern society’s ever-increasing demand for more accurate weather forecasts is evident to most people. The spectrum of needs for weather predictions ranges from the general public’s desire to know if for instance, the weekend will permit an outing at the beach, or an organization’s rally, or an outdoor wedding reception. Such diverse industries as airlines and fruit growers depend heavily on accurate weather forecasts to have an idea of what their next schedule of flight would appear to be or if the weather will be suitable for harvesting. In addition, in developed countries, the designs of buildings, and many industrial facilities rely heavily on a sound knowledge of the atmosphere. Weather forecasting can be defined as the act of predicting future weather conditions or an attempt to indicate the weather conditions which are likely to occur. Weather forecasting is the application of Science and Technology to predict the state of the atmosphere for a future time and a given location. Human beings have attempted to predict the weather informally for millennia, and formally since at least the nineteenth century. Weather forecasts are made by collecting qualitative data about the current state of the atmosphere and using scientific understanding of atmospheric processes to 1945 International Journal of Engineering Research & Technology (IJERT) Vol. 2 Issue 12, December - 2013 ISSN: 2278-0181 www.ijert.org IJERTV2IS120198
Transcript of Weather Forecasting Models, Methods and …...weather data, forecasting methods and applications....
Weather Forecasting Models, Methods and Applications AA
Iseh. A. J.1* Woma. T. Y.
1,2
1. Department of Pure & Applied Physics, Federal University Wukari, Taraba State.
P. M. B. 1020 Wukari, Taraba State.
2. Department of Pure & Applied Physics, Federal University Wukari, Taraba State.
P. M. B. 1020 Wukari, Taraba State.
ABSTRACT
Weather forecasting modelling is a
computer program that provides
meteorological information for future
times at given locations. In modern
forecasting models, Numerical Weather
Prediction is mostly applied and this
means, “a set of simplified equations used
to calculate changes in atmospheric
conditions”. The act of writing these
equations, imposing the boundary
conditions and solving them using super
computers, is known as numerical
modelling. An example of such equations
is the Hypsometric equation given as PI =
POexp–gz/RT. Computerized numerical
models are designed for different intervals
which are known as global models under
which we have long range forecast and
medium range forecast, and regional
models under which we have the short
range forecast. The methods include
persistence, climatologic, looking at the
sky, use of barometer, nowcasting, use of
forecasting models, analogue and
ensemble forecasting. Forecasting could be
applied in air traffic, severe weather alerts,
marine, agriculture, utility companies,
private sector and military application.
Weather forecasting is a complex and
challenging science that depends on the
efficient interplay of weather observation,
data analysis by meteorologist and
computers, and rapid communication
system.
Key words: Weather, weather
prediction, forecast, forecasting models,
weather data, forecasting methods and
applications.
1.0 INTRODUCTION
Modern society’s ever-increasing demand
for more accurate weather forecasts is
evident to most people. The spectrum of
needs for weather predictions ranges from
the general public’s desire to know if for
instance, the weekend will permit an
outing at the beach, or an organization’s
rally, or an outdoor wedding reception.
Such diverse industries as airlines and fruit
growers depend heavily on accurate
weather forecasts to have an idea of what
their next schedule of flight would appear
to be or if the weather will be suitable for
harvesting. In addition, in developed
countries, the designs of buildings, and
many industrial facilities rely heavily on a
sound knowledge of the atmosphere.
Weather forecasting can be defined as the
act of predicting future weather conditions
or an attempt to indicate the weather
conditions which are likely to occur.
Weather forecasting is the application of
Science and Technology to predict the
state of the atmosphere for a future time
and a given location. Human beings have
attempted to predict the weather
informally for millennia, and formally
since at least the nineteenth century.
Weather forecasts are made by collecting
qualitative data about the current state of
the atmosphere and using scientific
understanding of atmospheric processes to
1945
International Journal of Engineering Research & Technology (IJERT)
Vol. 2 Issue 12, December - 2013
IJERT
IJERT
ISSN: 2278-0181
www.ijert.orgIJERTV2IS120198
project how the atmosphere will evolve
within the next few hours.
Once, an all-human endeavour based
mainly upon changes in barometric
pressure, current weather conditions and
sky conditions, forecast models are now
used to determine future conditions. A
model, in this context, is a computer
program that produces meteorological
information for future times at given
positions and altitudes. The horizontal
domain of a model is either global,
covering the entire earth, or regional,
covering only part of the earth. Regional
models also are known as limited area
models. Human input is still required to
pick the best possible forecast model to
base the forecast upon, which involves
pattern recognition skills, knowledge of
model performance and knowledge of
model biases. The chaotic nature of the
atmosphere, error involved in measuring
the initial conditions, an incomplete
understanding of atmospheric processes
mean that forecast become less accurate as
the difference in current time and the time
for which the forecast is being made
increases.
There are a variety of end users to weather
forecasts. Weather warnings are important
forecasts because they are used to protect
life and property. Forecasts based on
temperature and precipitation are
important to agriculture, and therefore to
commodity traders within stock markets.
Temperature forecasts are also used by
utility companies to estimate demand over
coming days. On an everyday basis people
use weather forecasts to determine what to
wear on a given day. Since in recent time
in Uyo – Nigeria for example, outdoor
activities are severely curtailed by heavy
rains, forecasts can be used to plan
activities around these events, and to plan
ahead and survive them.
2.0 HOW MODELS CREATE
FORECASTS
2.1 Data collection
Since invention of the first weather
instruments in the seventeenth century
weather observation has undergone
considerable refinement. Denser
monitoring networks, more sophisticated
instruments and communication systems,
and better-trained weather observers, have
produced an increasingly detailed, reliable
and representative record of weather and
climate. In weather forecasting, data
collection has been divided into two
categories namely:
i. Surface weather observations
ii. Upper-air weather observations.
Surface Weather Observations
Surface weather observations are the
fundamental data used for safety as well as
climatological reasons to forecast weather
and issue warnings worldwide. They can
be taken manually by a weather observer,
by computer through observers to augment
the otherwise automated weather station.
Referring to Lutgens and TarBuck (1989),
a vast network of weather stations required
to produce a weather chart will encompass
enough to be useful for short-range
forecasts. On a global scale, the World
meteorological organization, which
consists of over 130 nations, is responsible
for gathering the needed data and
producing some general prognostic charts.
Surface weather observations of
atmospheric pressure, temperature, wind
speed and direction, humidity,
precipitations are made near the earth’s
surface by trained observers or automatic
weather stations. The World
meteorological Organization acts to
standardize the instrumentation, observing
practices and timing of those observations
worldwide. By international agreement,
the regular synoptic observations are made
every six hours beginning at midnight
1946
International Journal of Engineering Research & Technology (IJERT)
Vol. 2 Issue 12, December - 2013
IJERT
IJERT
ISSN: 2278-0181
www.ijert.orgIJERTV2IS120198

Greenwish Mean Time (0000GMT,
0600GMT, 1200GMT and 1800GMT)
each day. In addition, observations for
aviation purposes are made at many
airports every hour, or more often if the
weather is changing rapidly. Specialized
observations may also be made under
certain conditions for agricultural,
industrial, research, or other purposes
(Miller and Thompson, 1975).
Upper-air weather observations
Measurements of temperature, humidity
and wind above the surface are found by
launching radiosondes on weather
balloons. Radiosonde is a unit for use in
weather balloons that measures various
atmospheric parameters and transits them
to a fixed receiver. Radiosondes may
operate at a radio frequency of 403MHz or
1680MHz and both types may be adjusted
slightly higher or lower as required.
Mohan and Morgan (1991) states that, the
instrument transmits to the ground station
vertical profiles of air temperature,
pressure, and relative humidity up to an
altitude of about 30km. In addition, winds
at various levels are computed by tracking
the balloons with a radio direction finding
antenna.
Upper-air weather data are also obtained
by aircraft, dropwind sondes, radar, and
satellites. Increasingly, data from weather
satellites are being used because of their
almost global coverage. Although their
visible light images are very useful for
forecasters to see development of clouds,
little of this information can be used by
numerical weather prediction models. The
infrared data however, can be used as it
gives information on the temperature at
the surface and cloud tops. Individual
clouds can also be tracked from one time
to the next to provide information on wind
direction and strength at the clouds
steering level.
Miller and Thompson (1975) agrees that,
the observations are collected at a number
of points where there are processed by a
Central weather analysis organization.
Three locations have been designated by
the World Meteorological Organization as
World Meteorological Centers, these are
located in Melbourne, Australia; Moscow,
Russia; and Washington, D.C. U.S.A. In
addition, most countries maintain national
centers, where the basic weather needs of
the domestic economy are met. In Nigeria,
the National Meteorological Center is
located in Abuja.
2.1.1 Data assimilation and
analysis
In order to do their work, most numerical
models look at the atmosphere as a series
of boxes. In the middle of each box is a
point for which the model actually
calculates weather variables and makes
forecasts. The result of this three
dimensional boxing up of the atmosphere
is known as the grid; the point in the
middle is the grid point, and the distance
between one point and another is called the
grid spacing (Ackerman and Knox, 2003).
Grid point models of the atmosphere can
get fussy when the data in the initial
conditions is not obtained at exactly the
location of the grid point. Also, the process
of creating an evenly spaced data set from
irregularly spaced observations is called
interpolation.
Ackerman and Knox (2003) then say that,
the multiple jobs of interpolating and
smoothing the data for use in numerical
models are collectively called data
assimilation.
During the data assimilation process,
information gained from the observations
is used in conjunction with a numerical
model’s most recent forecast for the time
that observations were made, since this
contains information from previous
observations. This is used to produce a
three-dimensional representation of the
temperature, moisture and wind called a
meteorological analysis. This is the models
estimate of the current state of the
1947
International Journal of Engineering Research & Technology (IJERT)
Vol. 2 Issue 12, December - 2013
IJERT
IJERT
ISSN: 2278-0181
www.ijert.orgIJERTV2IS120198
atmosphere. Data assimilation proceeds by
analysis cycles. In each analysis cycle,
observations of the current (and possibly,
past) state of a system are combined with
the result from and mathematical model
(the forecast) to produce an analysis,
which is considered as “the best” estimate
of the current state of the system. This is
called the analysis step. Essentially, the
analysis step tries to balance the
uncertainty in the data and in the forecast.
The model is then advanced in time and its
result becomes the forecast in the next
analysis cycle.
2.1.2 Numerical weather prediction
Linacre and Geerts (1997) define
Numerical Weather prediction (NWP) as a
simplified set of equations called the
primitive equation used to calculate
changes of conditions. Modern weather
forecasting relies heavily on numerical
weather prediction.
According to Lutgens and TarBuck (1989),
the word “numerical” is misleading, for all
types of weather forecasting are based on
some quantitative data and therefore could
fit under this heading. Numerical weather
prediction is based on the fact that the
gases of the atmosphere obey a number of
known physical principles. Ideally, these
physical laws can be used to predict the
future state of the atmosphere, given the
current conditions. This situation is
analogues to predicting future position of
the moon based on physical laws and the
knowledge of its current position. Still, the
large number of variables that must be
included when considering the dynamic
atmosphere makes this task extremely
difficult.
Manipulating the huge data sets and
performing the complex calculations
necessary to do this (weather prediction)
on resolution fine enough to make the
result useful requires the use of some of
the most powerful supercomputers.
Referring to the work of Houghton (1986),
the task of writing the equations and the
boundary conditions in a suitable form and
then of solving them with high speed
digital computers is known as numerical
modeling. By comparing the behaviour of
the model with that of the real atmosphere,
the validity of the procedures employed by
the model is tested. The most important
application of numerical modeling is the
development of methods sufficiently
reliable and sufficiently fast to be used in
routine weather forecasting.
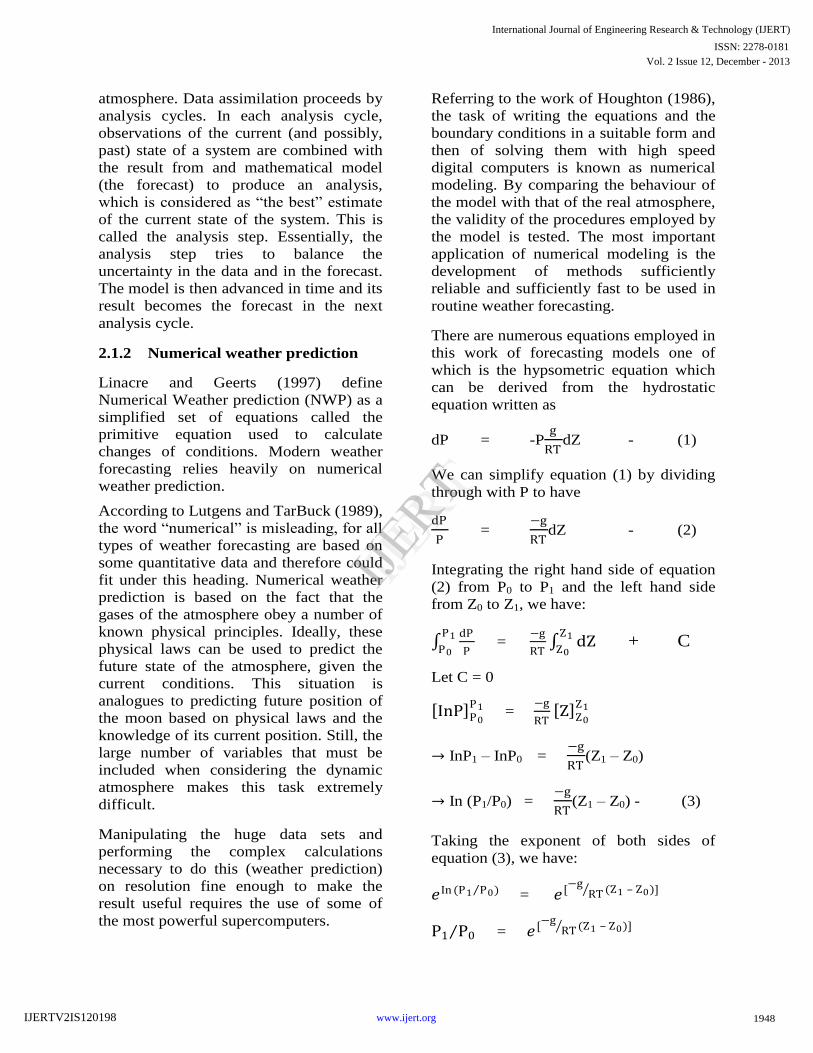
There are numerous equations employed in
this work of forecasting models one of
which is the hypsometric equation which
can be derived from the hydrostatic
equation written as
dP = -Pg
RTdZ - (1)
We can simplify equation (1) by dividing
through with P to have
dP
P =
−g
RTdZ - (2)
Integrating the right hand side of equation
(2) from P0 to P1 and the left hand side
from Z0 to Z1, we have:
dP
P
P1
P0 =
−g
RT dZ
Z1
Z0 + C
Let C = 0
InP P0
P1 = −g
RT Z
Z0
Z1
→ InP1 – InP0 = −g
RT(Z1 – Z0)
→ In (P1/P0) = −g
RT(Z1 – Z0) - (3)
Taking the exponent of both sides of
equation (3), we have:
𝑒In (P1 P0 ) = 𝑒[−g
RT (Z1 – Z0)]
P1 P0 = 𝑒[−g
RT (Z1 – Z0)]
1948
International Journal of Engineering Research & Technology (IJERT)
Vol. 2 Issue 12, December - 2013
IJERT
IJERT
ISSN: 2278-0181
www.ijert.orgIJERTV2IS120198
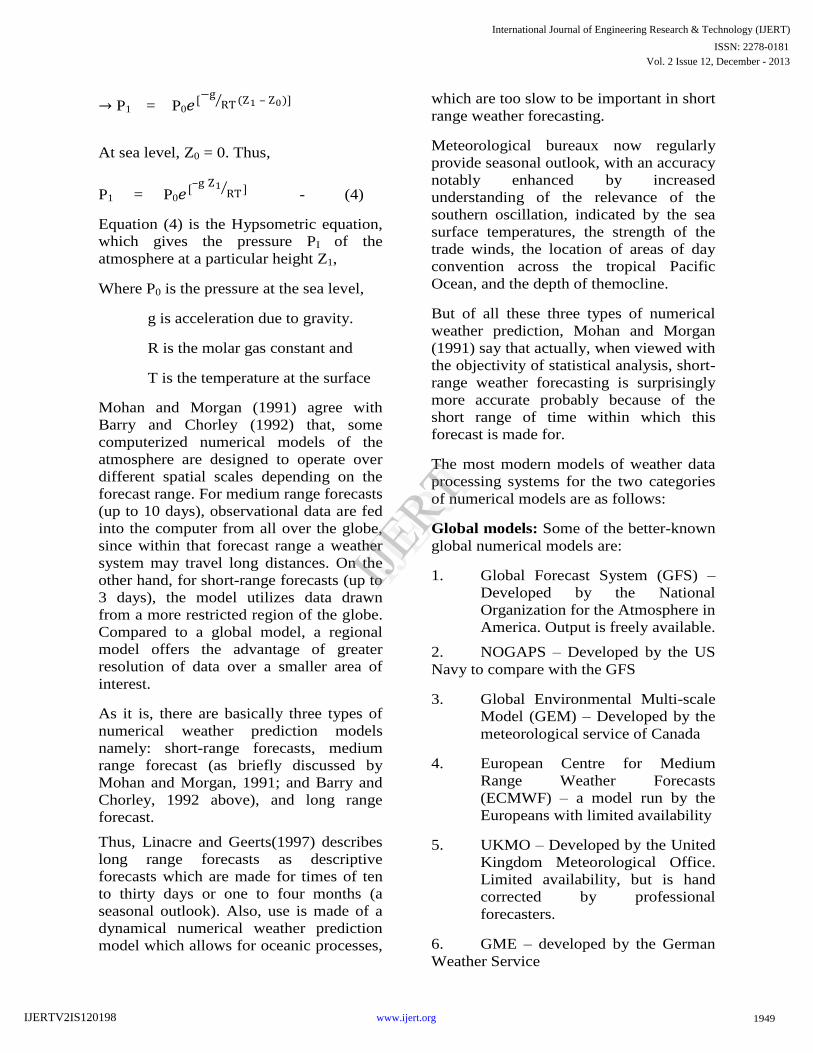
→ P1 = P0𝑒[−g
RT (Z1 – Z0)]
At sea level, Z0 = 0. Thus,
P1 = P0𝑒[–g Z1
RT ] - (4)
Equation (4) is the Hypsometric equation,
which gives the pressure PI of the
atmosphere at a particular height Z1,
Where P0 is the pressure at the sea level,
g is acceleration due to gravity.
R is the molar gas constant and
T is the temperature at the surface
Mohan and Morgan (1991) agree with
Barry and Chorley (1992) that, some
computerized numerical models of the
atmosphere are designed to operate over
different spatial scales depending on the
forecast range. For medium range forecasts
(up to 10 days), observational data are fed
into the computer from all over the globe,
since within that forecast range a weather
system may travel long distances. On the
other hand, for short-range forecasts (up to
3 days), the model utilizes data drawn
from a more restricted region of the globe.
Compared to a global model, a regional
model offers the advantage of greater
resolution of data over a smaller area of
interest.
As it is, there are basically three types of
numerical weather prediction models
namely: short-range forecasts, medium
range forecast (as briefly discussed by
Mohan and Morgan, 1991; and Barry and
Chorley, 1992 above), and long range
forecast.
Thus, Linacre and Geerts(1997) describes
long range forecasts as descriptive
forecasts which are made for times of ten
to thirty days or one to four months (a
seasonal outlook). Also, use is made of a
dynamical numerical weather prediction
model which allows for oceanic processes,
which are too slow to be important in short
range weather forecasting.
Meteorological bureaux now regularly
provide seasonal outlook, with an accuracy
notably enhanced by increased
understanding of the relevance of the
southern oscillation, indicated by the sea
surface temperatures, the strength of the
trade winds, the location of areas of day
convention across the tropical Pacific
Ocean, and the depth of themocline.
But of all these three types of numerical
weather prediction, Mohan and Morgan
(1991) say that actually, when viewed with
the objectivity of statistical analysis, short-
range weather forecasting is surprisingly
more accurate probably because of the
short range of time within which this
forecast is made for.
The most modern models of weather data
processing systems for the two categories
of numerical models are as follows:
Global models: Some of the better-known
global numerical models are:
1. Global Forecast System (GFS) –
Developed by the National
Organization for the Atmosphere in
America. Output is freely available.
2. NOGAPS – Developed by the US
Navy to compare with the GFS
3. Global Environmental Multi-scale
Model (GEM) – Developed by the
meteorological service of Canada
4. European Centre for Medium
Range Weather Forecasts
(ECMWF) – a model run by the
Europeans with limited availability
5. UKMO – Developed by the United
Kingdom Meteorological Office.
Limited availability, but is hand
corrected by professional
forecasters.
6. GME – developed by the German
Weather Service
1949
International Journal of Engineering Research & Technology (IJERT)
Vol. 2 Issue 12, December - 2013
IJERT
IJERT
ISSN: 2278-0181
www.ijert.orgIJERTV2IS120198
7. ARPEGE – developed by the
French Weather Service, Meteo
France.
8. Intermediate General Circulation
model (IGCM) – developed by
members of the Department of
Meteorology at the University of
Reading.
Regional models: Some of the better-
known regional numerical models are:
1. The Weather Research and
Forecasting (WRF) Model was
developed co-operatively by NCEP
and the meteorological research
community. WRF has several
configurations including:
a. WRF – NMM: The ERF
Non-hydrostatic Mesoscale
Model is the primary short-
term weather forecast
model for the United State,
b. AR-WRF: Advanced
Research WRF developed
primarily at the United State
National Center for
Atmospheric Research
(NCAR)
2. The North American Mesocale
Model (NAM)
3. Colorado State University for
numerical simulations of
atmospheric meteorology and other
environmental phenomena on
scales from metres to hundreds of
kilometres
4. MMS – The fifth Generation
mesoscale model
5. The Advanced Region Prediction
System (ARPS) – developed at the
University of Oklahoma. It is a
comprehensive multi-scale non-
hydrostatic simulation and
prediction system that can be used
for regional scale weather
prediction up to the tornadscale
simulation and prediction.
6. High Resolution Limited Area
Model (HIRLAM)
7. GEM – LAM – Global
Environmental Multi-scale Limited
Area Model
8. Aladin: The high resolution limited
area hydrostatic and non-
hydrostatic model developed
operated by several European and
North African countries under the
leadership of Meteo-France.
9. COSMO: The COSMO Model,
formerly known as LM, aLMD or
LAMI, is a limited area non-
hydrostatic model developed
within the framework of the
consortium for small scale
modelling (Germany, Switzerland,
Italy, Poland and Greece).
www.wikipedia.com.
According to Linacre and Geerts (1997),
the advantage of numerical weather
prediction is that it avoids errors of human
judgment in deriving the prognosis, and
can be steadily improved by enlarging the
amount and reliability of input data, by
new understanding of the Physics of
atmospheric change, and by faster, larger
computers.
2.1.3 Model Output Post Processing
The raw output is often modified before
being presented as the forecast. This can
be in the form of statistical techniques to
remove known biases (a term used to
describe a tendency or preference towards
a particular perspective, ideology or result)
in the model, or its adjustment to take into
account consensus among other numerical
weather forecast. MOS or Model Output
Statistics is a technique used to interpret
numerical model output and produce site-
specific guidance. This guidance is
presented in coded numerical form, and
can be obtained for nearly all National
Weather Service reporting stations.
1950
International Journal of Engineering Research & Technology (IJERT)
Vol. 2 Issue 12, December - 2013
IJERT
IJERT
ISSN: 2278-0181
www.ijert.orgIJERTV2IS120198
3.0 FORECASTING PROBLEMS
An important goal of all scientific
endeavour is to make accurate predictions.
The physicist or chemist who conducts an
experiment in the laboratory does so in the
hope of discovering certain fundamental
principles that can be used to predict the
outcome of other experiments based on
those principles. In fact, most of the laws
of science are merely very accurate
predictions concerning the outcome of
certain kinds of experiments. But few
physical scientists are faced with more
complex or challenging prediction
problems than the meteorologist.
In the first place, the meteorological
laboratory covers the entire globe, so that
even the problem of measuring the present
state of the atmosphere is tremendous.
Furthermore, the surface of the earth is an
irregular combination of land and water,
each responding in a different way to the
energy source – the sun. Then, too, the
atmosphere itself is a mixture of gaseous,
liquid, and solid constituents, many of
which affect the energy balance of the
earth, one of them, water, is continually
changing its state. Also, the circulations of
the atmosphere range in size from
extremely large ones, which may persist
for weeks or months, to minute whirls,
with life spans of only a few seconds.
According to Miller and Thompson (1975)
and Ayado and Burt (2001) the problem of
forecasting then, involves an attempt to
observe, analyze and predict the many
interrelationships between the solar energy
source, the physical feature of the earth,
and the properties and motions of the
atmosphere. This is the basis on which
weather forecasts still go wrong today.
Ackerman and Knox (2003) points out
reasons why forecasts still go wrong today
by stating that the limitations which
directly relates to today’s numerical
forecast models are as follows:
i. Imperfect data: The data of
today’s numerical models still
includes a large helping of
radiosonde observations. However,
the number of radiosonde sites in
the World over has actually
declined over the past few decades.
Developed countries in the world
today, spend more money in
launching weather satellites than
for boring weather balloons.
Satellite data are global in average,
but researchers in data assimilation
are still trying to figure out how
this data can be “digested” properly
by the models. In addition,
important meteorological features
still evade detection, especially
over the oceans. The model results
are only as good as the data in its
initial conditions.
ii. Faulty “vision” and “fudges”: Today’s forecasts also involve an
inevitable trade-off between
horizontal resolution and the length
of the forecast. This is because fine
resolution means lots of point at
which to make calculations. This
requires a lot of computer time. A
forecast well into the future also
requires millions or billions more
calculations. If fine resolution is
combined with a long range
forecast, the task would choke the
fastest supercomputers today. One
would not get forecasts for weeks.
Future improvement in computing
will help speed things up.
In the meantime, however, some
models are still not able to pick or
“see” small-scale phenomena such
a clouds, raindrops, and
snowflakes. To compensate for this
fuzzy “vision” of models, the
computer code includes crude
approximations of what is not
being seen. These are called
parameterizations. Even though
much science goes into them, these
approximations are nowhere close
to capturing the complicated reality
1951
International Journal of Engineering Research & Technology (IJERT)
Vol. 2 Issue 12, December - 2013
IJERT
IJERT
ISSN: 2278-0181
www.ijert.orgIJERTV2IS120198
of the phenomena. This is because;
the smallest scale phenomena are
often the most daunting to
understand. Therefore, it is not an
insult to meteorologists’ abilities to
say that parameterizations are
“fudges” of the actual phenomena.
iii. Chaos: It will be surprising to note
that, even if a supercomputer which
could do quadrillions of
calculations each second were to be
invented, no better forecasting
result would still be gotten. Brute
force numerical weather
forecasting with extremely fine
resolution has its limits.
The reason for these limits is a
curious property of complex,
evolving systems like the
atmosphere. It is called “Sensitive
dependence on initial conditions”,
and is a hallmark of what is
popularly known as chaos theory.
Chaos in the atmosphere does not
mean that everything is a mess;
instead, it means that the
atmosphere both in real life and in
a computer model may read very
differently to initial conditions that
are only slightly different.
Because we do not know the
atmospheric conditions perfectly at
any time, chaos means that the
resemblance between a model’s
forecast and reality will be less and
less with each passing day.
4.0 METHODS OF WEATHER
FORECASTING
Of course for weather forecast to exist
there must be methods on which it is done.
These methods are as follows:
4.1 Persistence forecasting
Persistence forecasting is the easiest
method of forecasting which assumes a
continuation of the present. It relies upon
today’s conditions to forecast the weather
when it is steady state, such as during the
summer season in the tropics. This method
of forecasting strongly depends upon the
presence of a stagnant weather pattern. It
can be useful in both short-range forecasts
and long-range forecasts.
Persistence forecasts are used by local
forecasters in determining such events as
the time of the arrival of a thunderstorm
that is moving toward their region.
Persistence forecasts do not account for
changes that might occur in the intensity or
in the path of a weather system, and they
do not predict the formation. Because of
these limitations and the rapidity with
which weather system change in most
geographical regions, persistence forecasts
break down after twelve hours, or a day at
most.
4.2 Climatology forecasting
Whereas persistence forecasting is most
accurate over short periods (before factors
for change have had time to operate), the
best estimate of the weather a long time
ahead is the average value of past
measurements there at that time of day and
year.
Climatology forecast relies on the
observation that weather for a particular
day at a location does not change much
from one year to the next. As a result, a
long term average of weather on a certain
day or month should be a good guess as
the weather for that day or month. The
most obvious climatology forecast in this
part of the world (Nigeria) is, “Cold in
December, warm in July (the popular July
break)”. One does not need to be a
meteorologist to make that forecast.
Today’s numerical forecast methods still
use climatological statistics as a “reality
check”. There make sure that the computer
models are not going off the deep end,
climatologically speaking.
1952
International Journal of Engineering Research & Technology (IJERT)
Vol. 2 Issue 12, December - 2013
IJERT
IJERT
ISSN: 2278-0181
www.ijert.orgIJERTV2IS120198
4.3 Looking at the sky
Along with pressure tendency, use of the
sky condition is one of more important
weather parameters that can be used to
forecast weather in mountainous areas.
Thickening of cloud cover or the invasion
of a higher cloud deck is indicative of rain
in the near future. Morning fog portends
fair conditions, as rainy conditions are
preceded by wind or clouds, which prevent
fog formation. The approach of a line of
thunderstorm could indicate the approach
of a cold front. Cloud free skies are
indicative of fair weather for the near
future. The use of sky cover in weather
prediction has led to various weather lore
over the centuries.
4.4 Use of a barometer
Using barometric pressure and the pressure
tendency (xthe change of pressure over
time) has been used in forecasting since
the late 19th
century. The larger the change
in pressure, especially, if more than
2.54mmHg, the larger the change in
weather can be expected. If the pressure
drop is rapid, a low-pressure system is
approaching, and there is a greater chance
of rain. Rapid pressure rises are associated
with improving weather conditions, such
as clearing skies.
4.5 Nowcasting
The forecasting of the weather within the
next six hours is often referred to as
nowcasting. In this time range, it is
possible to forecast smaller features such
as individual showers and thunderstorms
with reasonable accuracy, as well as other
features too small to be resolved by a
computer model. A human given the latest
radar, satellite and observational data will
be able to make a better analysis of the
small scale features present and so will be
able to make a more accurate forecast for
the following few hours.
Severe weather is typically short-lived
(less than two hours) and, due to its
mesoscale character (less than one hundred
kilometers), it affects local/regional areas
necessitating site-specific forecasts.
Included in this category are
thunderstorms, gust fronts, tornadoes, high
winds especially along coasts, over lakes
and mountains, heavy snow and freezing
precipitation. The development of radar
networks, new instruments and high speed
communication links has provided a means
of issuing warnings of such phenomena.
Several countries including Nigeria have
recently developed integrated satellite and
radar systems to provide information on
the horizontal and vertical extent of
thunderstorms, for example. Such data are,
supplemented by networks of automatic
weather stations that measure wind,
temperature and humidity.
Nowcasting methods use highly automated
computers and image analysis systems to
integrate data from a variety of sources
rapidly. Interpretation of the data displays
requires skilled personnel and or extensive
software to provide appropriate
information. The prompt forecasting of
wind shear and downburst hazards at
airports is one example of the importance
of nowcasting procedures.
4.6 Use of Forecasting Models
In the past, the human forecasters were
responsible for generating the entire
weather forecast based upon available
observation. Today, human input is
generally confined to choosing a model
based on various parameters, such as
model biases and performance. Using a
consensus of forecast models, as well as
ensemble members of the various models,
can help reduce forecast error. However,
regardless how small the average error
becomes with any individual system, large
errors within any particular piece of
guidance are still possible on any given
model run. Humans can use knowledge of
local effects, which may be too small in
size to be resolved by the model to add
information to the forecast.
1953
International Journal of Engineering Research & Technology (IJERT)
Vol. 2 Issue 12, December - 2013
IJERT
IJERT
ISSN: 2278-0181
www.ijert.orgIJERTV2IS120198
4.7 Analogue Forecasting
The analogue method is a complex way of
making a forecast, requiring the forecaster
to remember a previous weather event
which is expected to be mimicked by an
upcoming event. The analogue forecaster’s
task is to locate the date in history when
the weather is a perfect match, or
analogue, to today’s weather. Then the
forecast for tomorrow is simple – whatever
happened in the day after the analogue will
be the weather for tomorrow. The forecast
for the day after tomorrow is whatever
happened in the second day after the
analogue, and so forth.
What makes it a difficult method to use is
that, there is rarely a perfect analogue for
an event in the future. In fact, no two
patterns or sequences of weather are ever
identical. There may, for example, be five
reasonable analogues for a particular
month, but examination of the succeeding
weather sequences might show mild, rainy
weather in two cases and cold spells in the
other three. In the preparation of the
forecast therefore, many factors, which can
affect the weather trends, such as sea
temperature and the extent or amount of
rainfall, have to be taken into
consideration.
Some call this type of forecasting pattern
recognition. It remains a useful method of
observing rainfall over data voids such as
oceans, as well as the forecasting of
precipitation amounts and distribution in
the future. A similar method is used in
medium range forecasting, which is known
as teleconnections – when systems in other
locations are used to help pin down the
location of another system within the
surrounding regime. Teleconnections are
used by forecasters today to make general
forecasts months into the future. While in
short term forecasting, the pattern
recognition is still used by weather
forecasters to supplement today’s
computerized methods. But in the end the
complexities of weather, like human
personalities, defy simple categorization.
The main problem with this method may
well be the lack of complete enough
information, which also of course, limits
the usefulness of numerical weather
predictions.
4.8 Ensemble Forecasting
Although a forecast model will predict
weather features evolving realistically into
the distant future, the errors in a forecast
will inevitably grow with time due to the
chaotic nature of the atmosphere and the
inexactness of the initial observations. The
detail that can be given in a forecast
therefore decreases with time as these
errors increase. These become a point
when the errors are so large that the
forecast has no correlation with the actual
state of the atmosphere.
However, looking at a single forecast gives
no indication of how likely that forecast is
to be correct. Ensemble forecasting entails
the production of many forecasts in order
to reflect the uncertainty into the initial
state of the atmosphere (due to the errors
in the observations and insufficient
sampling). The uncertainty in the forecast
can then be assessed by the range of
different forecasts produced. However, the
simple logic behind ensemble forecasting
is that two runs of a model are not enough
to base a forecast upon.
Ensemble forecasts are increasingly being
used for operational weather forecasting.
Ensemble forecasting requires a
sophisticated understanding of the
atmosphere and computer models.
5.0 APPLICATIONS OF
WEATHER FORECAST
The importance of accurate weather
forecasts cannot be over emphasized as the
needs for them are always craved for in
virtually every aspect of life. These
forecasts can be applied in the following
areas:
1954
International Journal of Engineering Research & Technology (IJERT)
Vol. 2 Issue 12, December - 2013
IJERT
IJERT
ISSN: 2278-0181
www.ijert.orgIJERTV2IS120198
5.1 Severe weather alerts and
advisories
A major part of modern weather
forecasting is the severe weather alerts and
advisories, which the national weather
services issue in the case that severe or
hazardous weather is expected. This is
done to protect life and property. Some of
the most commonly known severe weather
advisories are the severe thunderstorm and
tornado warnings, as well as the recent
warnings about areas that are prone to
flood in some part of Nigeria by the
National Meteorological Agency. Other
forms of these advisories include winter
weather, high wind, flood, tropical
cyclone, and fog. Severe weather
advisories and alerts are broadcast through
the media, including radio, using
emergency systems as the Emergency
Alert System, which break into regular
programming.
5.2 Air Traffic
Because the aviation industry is especially
sensitive to the weather, accurate weather
forecasting is essential considering the fact
that a greater number of plane crashes
recorded the world over have weather
related causes. Just as turbulence and icing
are significant in flight hazards,
thunderstorms are a major problem for all
aircrafts because of severe turbulence due
to their updrafts and outflow boundaries,
icing due to the heavy precipitation, as
well as large hail, strong winds, and
lightening, all of which can cause severe
damage to an aircrafts in-flight. Volcanic
ash is also a significant problem for
aviation, as aircrafts can lose engine power
with ash clouds. On a day-to-day basis,
airliners are routed to take advantage of
the jet stream tailwind to improve fuel
efficiency. Aircrews are briefed prior to
takeoff on the conditions to expect enroute
and at their destination. Additionally,
airports often change which runway is
being used to take advantage of a
headwind. This reduces the distance
required for takeoff, and to eliminate
potential crosswinds.
5.3 Marine
Commercial and recreational use of
waterways can be limited significantly by
wind direction and speed, wave periodicity
and heights, tides, and precipitation. These
factors can each influence the safety of
marine transit. Consequently, a variety of
codes have been established to efficiently
transmit detailed marine weather forecasts
to vessel pilots through radio, for example
the MAFOR (Marine forecast).
5.4 Agriculture
Farmers rely on weather forecasts to
decide what work to do on any particular
day. For example, drying hay is only
feasible in dry weather. Prolonged periods
of dryness can ruin cotton, wheat, and corn
crops. While crops can be ruined by
drought, their dried remains can be used as
a cattle feed substitute in the form of
silage. Frosts and freezes play havoc with
crops both during the spring and fall. For
example, peach tree in full bloom can have
their potential peach crop decimated by a
spring freeze. Orange groves can suffer
significant damage during frosts and
freezes, regardless of their timing.
5.5 Utility companies
Electricity and gas companies rely on
weather forecasts to anticipate demand,
which can be strongly affected by the
weather. They use the quantity termed the
degree-day to determine how strong of a
use there will be for heating (heating
degree day) or cooling (cooling degree
day). These quantities are based on a daily
average temperature of 650F (18
0C).
Cooler temperatures force heating degree-
days (one per degree Fahrenheit), while
warmer temperatures force cooling degree-
days. In winter, severe cold weather can
cause a surge in demand as people turn up
their heating. Similarly, in summer or dry
season a surge in demand can be linked
with the increased use of air conditioning
1955
International Journal of Engineering Research & Technology (IJERT)
Vol. 2 Issue 12, December - 2013
IJERT
IJERT
ISSN: 2278-0181
www.ijert.orgIJERTV2IS120198
systems in hot weather. By anticipating a
surge in demand, utility companies can
produce additional supplies of power or
natural gas before the price increases, or in
some circumstances, supplies are restricted
through the use of brown outs and
blackouts.
5.6 Private Sector
Increasingly, private companies pay for
weather forecasts tailored to their needs so
that they can increase their profits or avoid
large losses. For example, supermarket
chains may change the stocks on their
shelves in anticipation of different,
consumer spending habits in different
weather conditions. Weather forecasts can
be used to invest in the commodity market,
such as futures in oranges, corn, soybeans
and oil. Also, members of the public use
knowledge of future weather conditions to
determine what to put on, on a daily basis.
5.7 Military applications
Similarly to the private sector, military
weather forecasters present weather
conditions to the war fighters, community.
Military weather forecasters provide pre-
flight weather briefs to pilots and provide
real time resource protection services for
military installations.
6.0 CONCLUSION
Weather forecasting is a complex and
challenging science that depends on the
efficient interplay of weather observation,
data analysis by meteorologists and
computers, and rapid communication
systems. Meteorologists have achieved a
very respectable level of skill for short-
range weather forecasting. Further
improvement is expected with denser
surface and upper air observational
networks, more precise numerical models
of the atmosphere, larger and faster
computers and more are to be realized.
However, continued international co-
operation is essential, for the atmosphere is
a continuous fluid that knows no political
boundaries.
So far, the accuracy of long range
forecasting has been minimal, but the short
range forecasting has been of immense
help and advantage to the world at large
today.
REFERENCES
Ackerman, S. A. and Knox, J. A. (2003).
Meteorology: Understanding the
Atmosphere. Brooks/Cole USA, pp
362 – 379
Aguado, E and Burt, J. E. (2001)
Understanding Weather and
Climate, Second Edition. Prentice
Hall, New Jersey, pp. 348 – 355.
Barry, R. G. and Chorley, R. J. (1992).
Atmosphere, Weather and Climate,
Sixth edition, Routledge, New
York, pp. 175 – 184
Houghton, J. T. (1986). The Physics Of
Atmosphere, Second Edition
Published by the Press Syndicate of
the University of Cambridge, New
York, pp. 165 – 188.
Linacre, E and Geerts, B. (1997). Climates
and Weather Explained Routledge
London, pp. 321 – 345
Lutgens, F. K. and TarBuck, E. J. (1989).
The Atmosphere: An Introduction
to Meteorology, Fourth edition.
Prentice Hall, New Jersey, pp. 299
– 331.
Miller, A. and Thompson, J. C. (1975).
Elements of Meteorology, Second
Edition. A Bell and Howell,
Columbus, Ohio pp. 205 – 233.
Mohan, J. M. and Morgan, M. D. (1991).
Meteorology: The Atmosphere and
Science of Weather, Fourth edition.
Macmillan Ontario, pp. 356 – 381.
http://www.wikipedia.com/weatherforecast
ingmodels&applications
1956
International Journal of Engineering Research & Technology (IJERT)
Vol. 2 Issue 12, December - 2013
IJERT
IJERT
ISSN: 2278-0181
www.ijert.orgIJERTV2IS120198