WEATHER ESSENTIALS FOR PESTICIDE APPLICATION · Weather Essentials for Pesticide Application aims...
28
WEATHER ESSENTIALS FOR PESTICIDE APPLICATION BY GRAEME TEPPER MicroMeteorology Research and Educational Services REVISED 2014 EDITION
Transcript of WEATHER ESSENTIALS FOR PESTICIDE APPLICATION · Weather Essentials for Pesticide Application aims...
WEATHER ESSENTIALS FOR PESTICIDE APPLICATIONBy Graeme Teppermicrometeorology research and educational Services
reviSed 2014 ediTion
2
We
aTH
er
eS
Se
nT
iaLS
Fo
r p
eS
TiC
ide
ap
pLiC
aTio
n
Title: Weather Essentials for Pesticide Application Revised edition January 2014
GRDC Project Code: TEP00001 – General meteorology for pesticide application booklet
Author: Graeme TepperMicroMeteorological Research and Educational Services (MRES) email: [email protected]
© 2012 Graeme Tepper, MicroMeteorological Research and Educational Services (MRES). All rights reserved.
First published February 2012 Revised January 2014ISBN: 978-1-921779-20-6
In submitting this report, the researcher has agreed to the GRDC publishing this material in its edited form.
Cover photo by: Bill Gordon, Bill Gordon Consulting
For free copies please contact: Ground Cover DirectFree phone: 1800 11 00 44Email: [email protected]
or
Ms Maureen CribbGRDC Publications ManagerPO Box 5367KINGSTON ACT 2604Phone: 02 6166 4500Email: [email protected]
Editing: Emma Leonard, AgriKnowHow
Design and production: Coretext, www.coretext.com.au
Disclaimer
Any recommendations, suggestions or opinions contained in this publication do not necessarily represent the policy or views of the Grains Research and Development Corporation (GRDC) or its agents. No person should act on the basis of the contents of this publication without first obtaining specific, independent professional advice. The GRDC or its agents will not be liable for any loss, damage, cost or expense incurred or arising by reason of any person using or relying on the information in this publication.
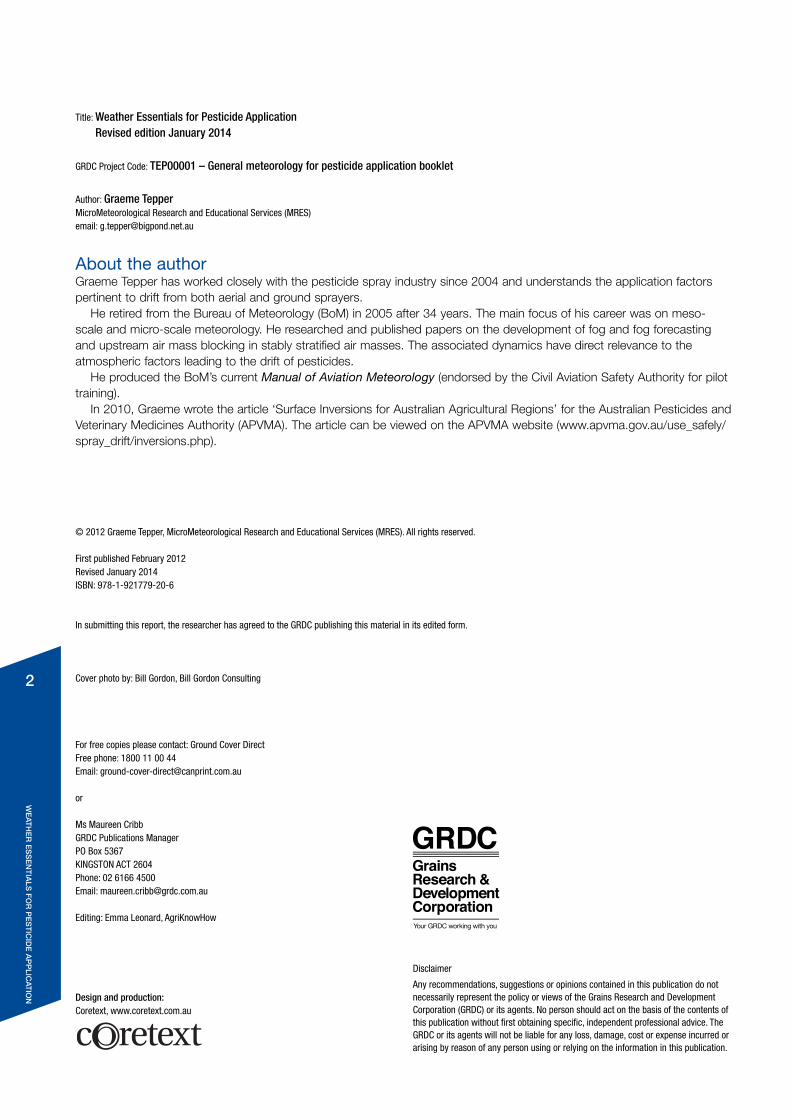
About the authorGraeme Tepper has worked closely with the pesticide spray industry since 2004 and understands the application factors pertinent to drift from both aerial and ground sprayers.
He retired from the Bureau of Meteorology (BoM) in 2005 after 34 years. The main focus of his career was on meso-scale and micro-scale meteorology. He researched and published papers on the development of fog and fog forecasting and upstream air mass blocking in stably stratified air masses. The associated dynamics have direct relevance to the atmospheric factors leading to the drift of pesticides.
He produced the BoM’s current Manual of Aviation Meteorology (endorsed by the Civil Aviation Safety Authority for pilot training).
In 2010, Graeme wrote the article ‘Surface Inversions for Australian Agricultural Regions’ for the Australian Pesticides and Veterinary Medicines Authority (APVMA). The article can be viewed on the APVMA website (www.apvma.gov.au/use_safely/spray_drift/inversions.php).
3
We
aTH
er
eS
Se
nT
iaLS
Fo
r p
eS
TiC
ide
ap
pLiC
aTio
n
ConTenTS
Introduction .................................................................................................................................................................................................................................................................4
Off-target movement of pesticides ...............................................................................................................................................................................................5What is likely to drift? ....................................................................................................................................................................................................................................... 5Common weather guidelines for pesticide application ......................................................................................................................................................... 6
Spray when wind is steady and ideally more than 3km/h and up to 15km/h ..............................................................................................6Avoid spraying in temperatures above 30ºC (see page 16) .........................................................................................................................................6Aim to spray when Delta T is between 2 and 8 and not greater than 10 ..........................................................................................................6Do not spray when inversion conditions exist ........................................................................................................................................................................6
10 steps to minimise spray drift ............................................................................................................................................................................................................... 7
1. Atmospheric stability ...............................................................................................................................................................................................................................8Stability ratio ............................................................................................................................................................................................................................................................ 8
2. Wind ..........................................................................................................................................................................................................................................................................10Common spray guidelines ......................................................................................................................................................................................................................... 10Turbulence .............................................................................................................................................................................................................................................................. 10Synoptic winds ................................................................................................................................................................................................................................................... 11Local winds ........................................................................................................................................................................................................................................................... 11 Measuring local winds .................................................................................................................................................................................................................................. 11Wind shear ............................................................................................................................................................................................................................................................. 12Diurnal variation of wind .............................................................................................................................................................................................................................. 13
Evening and overnight decrease of wind speed and gustiness ............................................................................................................................14Early morning increase in wind speed and gustiness ...................................................................................................................................................15
3.Temperature ......................................................................................................................................................................................................................................................16Temperature and pesticide application ............................................................................................................................................................................................ 16Surface to air temperature variations ................................................................................................................................................................................................ 16Diurnal temperature variations ............................................................................................................................................................................................................... 17 Volatilisation – be aware of surface temperature ..................................................................................................................................................................... 17
4. Evaporation ......................................................................................................................................................................................................................................................18Relative humidity ............................................................................................................................................................................................................................................... 18
Delta T ................................................................................................................................................................................................................................................................18Relevance for spraying ................................................................................................................................................................................................................................. 18
5. Surface temperature inversions .............................................................................................................................................................................................20What is a surface temperature inversion? ..................................................................................................................................................................................... 20Inversion weather.............................................................................................................................................................................................................................................. 20The hazards of a surface temperature inversion ...................................................................................................................................................................... 21When and why does a surface temperature inversion occur? ...................................................................................................................................... 21
1. Radiation inversion – created by radiation cooling ....................................................................................................................................................212. Advection inversion – created by cool or warm air movement ........................................................................................................................22
Transport of airborne pesticides within a surface temperature inversion ............................................................................................................. 22 Lifecycle of a surface temperature inversion .............................................................................................................................................................................. 22Accumulation of pesticide residues in the atmosphere ..................................................................................................................................................... 23Recognising a surface temperature inversion ............................................................................................................................................................................ 23
Visual clues .....................................................................................................................................................................................................................................................23Other clues ......................................................................................................................................................................................................................................................24
Precautions for night spraying ................................................................................................................................................................................................................ 24
6. Recording meteorological conditions .............................................................................................................................................................................25Recording ............................................................................................................................................................................................................................................................... 25
Wind .....................................................................................................................................................................................................................................................................25 Temperature and humidity ..................................................................................................................................................................................................................25
Monitoring meteorological conditions .............................................................................................................................................................................................. 25
Useful resources ...............................................................................................................................................................................................................................................27
References ...............................................................................................................................................................................................................................................................27
4
We
aTH
er
eS
Se
nT
iaLS
Fo
r p
eS
TiC
ide
ap
pLiC
aTio
n
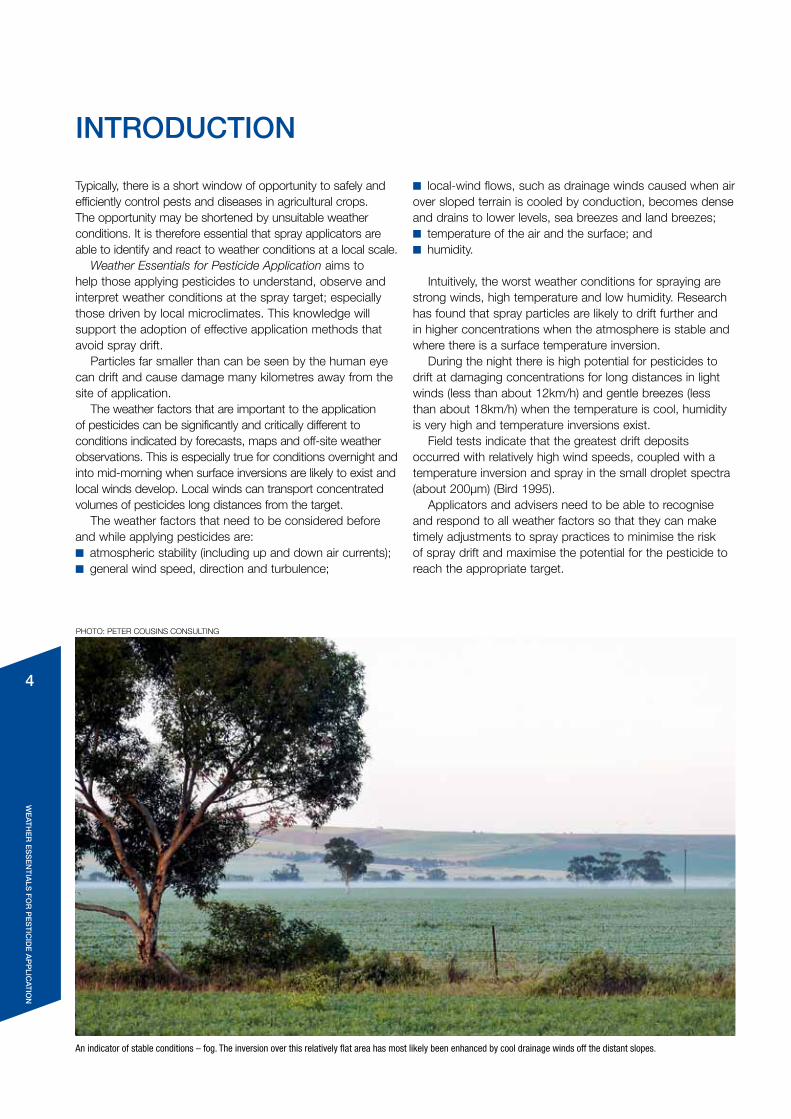
Typically, there is a short window of opportunity to safely and efficiently control pests and diseases in agricultural crops. The opportunity may be shortened by unsuitable weather conditions. It is therefore essential that spray applicators are able to identify and react to weather conditions at a local scale.
Weather Essentials for Pesticide Application aims to help those applying pesticides to understand, observe and interpret weather conditions at the spray target; especially those driven by local microclimates. This knowledge will support the adoption of effective application methods that avoid spray drift.
Particles far smaller than can be seen by the human eye can drift and cause damage many kilometres away from the site of application.
The weather factors that are important to the application of pesticides can be significantly and critically different to conditions indicated by forecasts, maps and off-site weather observations. This is especially true for conditions overnight and into mid-morning when surface inversions are likely to exist and local winds develop. Local winds can transport concentrated volumes of pesticides long distances from the target.
The weather factors that need to be considered before and while applying pesticides are:n atmospheric stability (including up and down air currents);n general wind speed, direction and turbulence;
inTroduCTion
n local-wind flows, such as drainage winds caused when air over sloped terrain is cooled by conduction, becomes dense and drains to lower levels, sea breezes and land breezes;n temperature of the air and the surface; andn humidity.
Intuitively, the worst weather conditions for spraying are strong winds, high temperature and low humidity. Research has found that spray particles are likely to drift further and in higher concentrations when the atmosphere is stable and where there is a surface temperature inversion.
During the night there is high potential for pesticides to drift at damaging concentrations for long distances in light winds (less than about 12km/h) and gentle breezes (less than about 18km/h) when the temperature is cool, humidity is very high and temperature inversions exist.
Field tests indicate that the greatest drift deposits occurred with relatively high wind speeds, coupled with a temperature inversion and spray in the small droplet spectra (about 200µm) (Bird 1995).
Applicators and advisers need to be able to recognise and respond to all weather factors so that they can make timely adjustments to spray practices to minimise the risk of spray drift and maximise the potential for the pesticide to reach the appropriate target.
An indicator of stable conditions – fog. The inversion over this relatively flat area has most likely been enhanced by cool drainage winds off the distant slopes.
PHoTo: PeTeR CouSInS ConSuLTInG
5
We
aTH
er
eS
Se
nT
iaLS
Fo
r p
eS
TiC
ide
ap
pLiC
aTio
n
Synoptic weather forecasts provide an overview of temperature, precipitation and wind but they do not provide details of what is occurring at the spray target.
Consequently, it is important for the spray applicator to understand how current weather conditions interplay with topography and the field environment to influence off-target movement of pesticides.
It is also important for them to measure and record their own weather data in the paddock (see page 25).
What is likely to drift?
1 Droplets smaller than about 200µm tend to be the most drift-prone. These small droplets fall more slowly because they do not have enough weight to overcome air resistance and thermal currents. even small changes in droplet diameter make a big difference to drift potential. Increasing the size from 150 to 300µm increases weight and volume by eight times. Heavier droplets fall more rapidly and are less affected by air currents, wind and evaporation effects.
2 Products of evaporation – small concentrated droplets, vapour and microscopic particles of the active ingredient (usually salts).
3 Vapours from volatilisation of pesticides from the surface after application.
4 Aerosols with droplets, vapour and particles attached to or absorbed into them. Typical aerosols are tiny haze particles, fog droplets, smoke particles, pollens, dust and salts.
Therefore, off-target droplet movement is influenced by:n the variation of droplet size, determined by
nozzles,pressure and formulation; n application factors, including boom height, boom stability,
forward speed compared to wind speed, boom tip speed and even the mass of the machine and aerodynamic uplift; and
n weather conditions.
oFF-TarGeT movemenT oF peSTiCideS
Spray applicators must consider synoptic and local weather patterns/conditions and the influence of topography on how pesticides may move in the landscape.
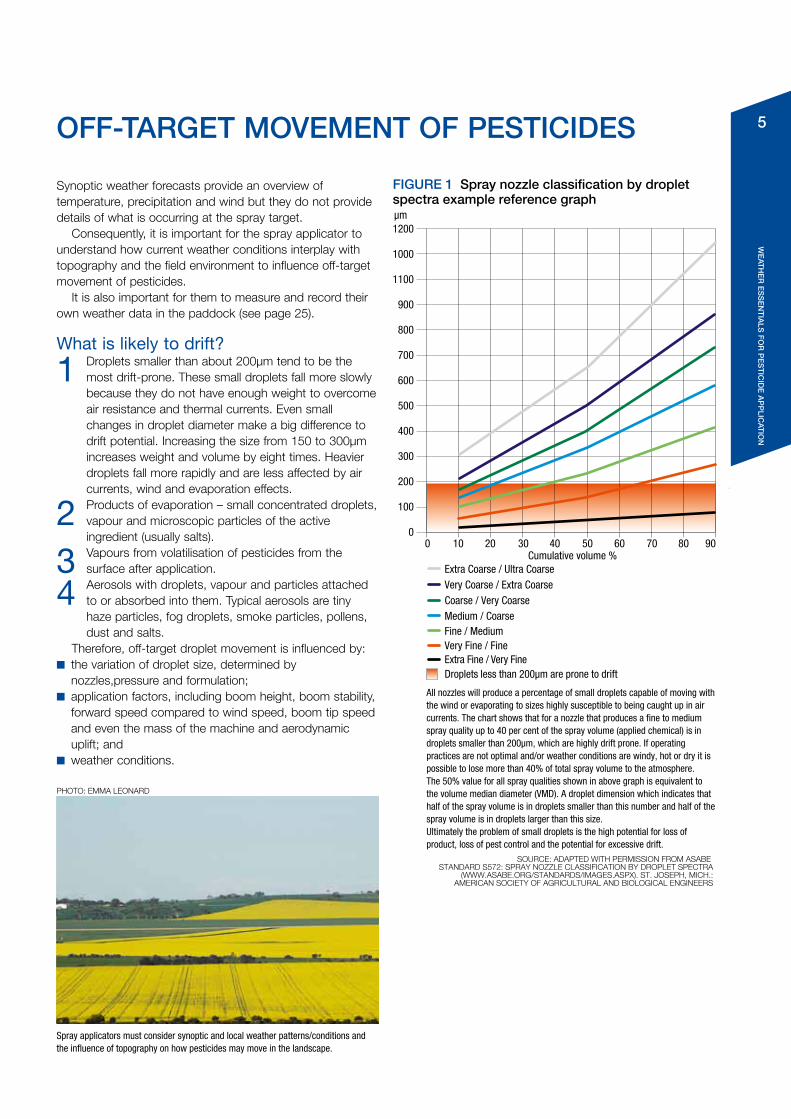
SOURCE: ADAPTED WITH PERMISSION FROM ASABE STANDARD S572: SPRAY NOZZLE CLASSIFICATION BY DROPLET SPECTRA
(WWW.ASABE.ORG/STANDARDS/IMAGES.ASPX). ST. JOSEPH, MICH.:AMERICAN SOCIETY OF AGRICULTURAL AND BIOLOGICAL ENGINEERS
FIGURE 1 Spray nozzle classification by droplet spectra example reference graph
Extra Coarse / Ultra Coarse
1200
1000
1100
900
800
700
600
500
400
300
200
100
0
Very Coarse / Extra CoarseCoarse / Very CoarseMedium / CoarseFine / MediumVery Fine / FineExtra Fine / Very FineDroplets less than 200µm are prone to drift
100 20 30 40 50 60 70Cumulative volume %
80 90
µm
All nozzles will produce a percentage of small droplets capable of moving with the wind or evaporating to sizes highly susceptible to being caught up in air currents. The chart shows that for a nozzle that produces a fine to medium spray quality up to 40 per cent of the spray volume (applied chemical) is in droplets smaller than 200µm, which are highly drift prone. If operating practices are not optimal and/or weather conditions are windy, hot or dry it is possible to lose more than 40% of total spray volume to the atmosphere.The 50% value for all spray qualities shown in above graph is equivalent to the volume median diameter (VMD). A droplet dimension which indicates that half of the spray volume is in droplets smaller than this number and half of the spray volume is in droplets larger than this size. Ultimately the problem of small droplets is the high potential for loss of product, loss of pest control and the potential for excessive drift.
PHoTo: eMMA LeonARD
6
We
aTH
er
eS
Se
nT
iaLS
Fo
r p
eS
TiC
ide
ap
pLiC
aTio
n
Common weather guidelines for pesticide application
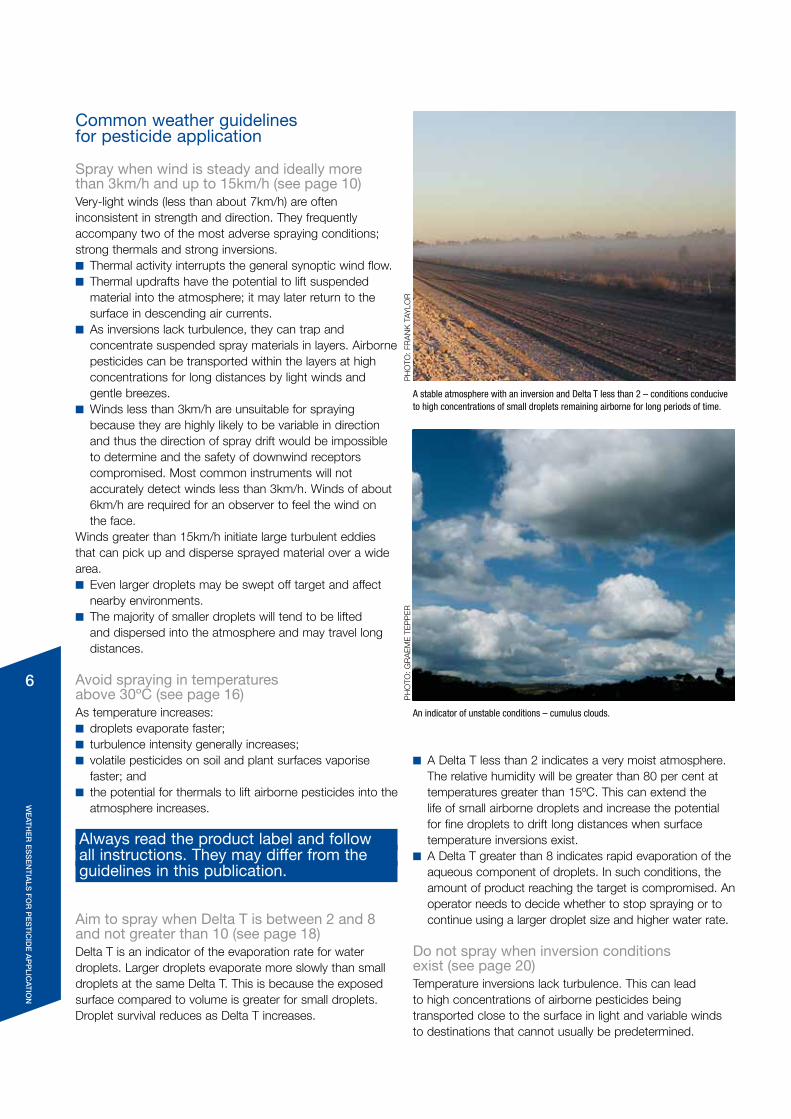
Spray when wind is steady and ideally more than 3km/h and up to 15km/h (see page 10)Very-light winds (less than about 7km/h) are often inconsistent in strength and direction. They frequently accompany two of the most adverse spraying conditions; strong thermals and strong inversions.n Thermal activity interrupts the general synoptic wind flow.n Thermal updrafts have the potential to lift suspended
material into the atmosphere; it may later return to the surface in descending air currents.
n As inversions lack turbulence, they can trap and concentrate suspended spray materials in layers. Airborne pesticides can be transported within the layers at high concentrations for long distances by light winds and gentle breezes.
n Winds less than 3km/h are unsuitable for spraying because they are highly likely to be variable in direction and thus the direction of spray drift would be impossible to determine and the safety of downwind receptors compromised. Most common instruments will not accurately detect winds less than 3km/h. Winds of about 6km/h are required for an observer to feel the wind on the face.
Winds greater than 15km/h initiate large turbulent eddies that can pick up and disperse sprayed material over a wide area.n even larger droplets may be swept off target and affect
nearby environments. n The majority of smaller droplets will tend to be lifted
and dispersed into the atmosphere and may travel long distances.
Avoid spraying in temperatures above 30ºC (see page 16)As temperature increases:n droplets evaporate faster;n turbulence intensity generally increases;n volatile pesticides on soil and plant surfaces vaporise
faster; andn the potential for thermals to lift airborne pesticides into the
atmosphere increases.
Always read the product label and followall instructions. They may differ from theguidelines in this publication.
Aim to spray when Delta T is between 2 and 8 and not greater than 10 (see page 18)Delta T is an indicator of the evaporation rate for water droplets. Larger droplets evaporate more slowly than small droplets at the same Delta T. This is because the exposed surface compared to volume is greater for small droplets. Droplet survival reduces as Delta T increases.
A stable atmosphere with an inversion and Delta T less than 2 – conditions conducive to high concentrations of small droplets remaining airborne for long periods of time.
An indicator of unstable conditions – cumulus clouds.
PH
oTo
: FR
An
k T
AyLo
RP
Ho
To: G
RA
eM
e T
eP
Pe
R
n A Delta T less than 2 indicates a very moist atmosphere. The relative humidity will be greater than 80 per cent at temperatures greater than 15ºC. This can extend the life of small airborne droplets and increase the potential for fine droplets to drift long distances when surface temperature inversions exist.
n A Delta T greater than 8 indicates rapid evaporation of the aqueous component of droplets. In such conditions, the amount of product reaching the target is compromised. An operator needs to decide whether to stop spraying or to continue using a larger droplet size and higher water rate.
Do not spray when inversion conditions exist (see page 20)Temperature inversions lack turbulence. This can lead to high concentrations of airborne pesticides being transported close to the surface in light and variable winds to destinations that cannot usually be predetermined.
7
We
aTH
er
eS
Se
nT
iaLS
Fo
r p
eS
TiC
ide
ap
pLiC
aTio
n
10 steps to minimise spray driftoperate within the weather guidelines and adopt the following practices to reduce spray drift risk.
1 ensure that the spray droplet spectrum is optimised to maximise efficacy and minimise the opportunity for droplets to evaporate down to drift-prone size before reaching the target. use the coarsest droplets possible and avoid wetters that increase drift potential.
2 operate machinery at optimum speed to maximise the boom’s stability and minimise the machine’s aerodynamic effect on airflow behind the machine and boom.
3 keep the boom height as low as possible to reduce the time that droplets are in the air and to take advantage of lower wind speed normally experienced near the surface.
4 Plan ahead and be prepared to adjust operations to combat weather variations.
5 Be sure to take into account the local microclimatic conditions, especially at night.
6 Continually monitor conditions at the site and at a height representative of the spray zone and adjust operating practices for current conditions.
7 use on-board weather stations, smoke devices or ribbons attached to booms and fence lines to assist in the detection of variations in wind direction and speed. If using smoke devices, be mindful that the initial smoke rise will be due to the inherent heat of the source.
8 Take extra care when applying pesticides over partially bare ground, which is hot and conducive to rapid evaporation and thermals.
9 Avoid spraying an hour before sunset if an inversion is likely and for an hour-and-a-half after sunrise if an inversion occurred overnight (variations of wind speed and direction are likely to be unpredictable).
10 ensure that adequate buffers are maintained to protect sensitive areas.
8
We
aTH
er
eS
Se
nT
iaLS
Fo
r p
eS
TiC
ide
ap
pLiC
aTio
n
Atmospheric stability describes the atmosphere’s tendency to resist or assist the vertical movement of air in the atmosphere.
Stability has a major influence on the movement and concentration of airborne pesticides.
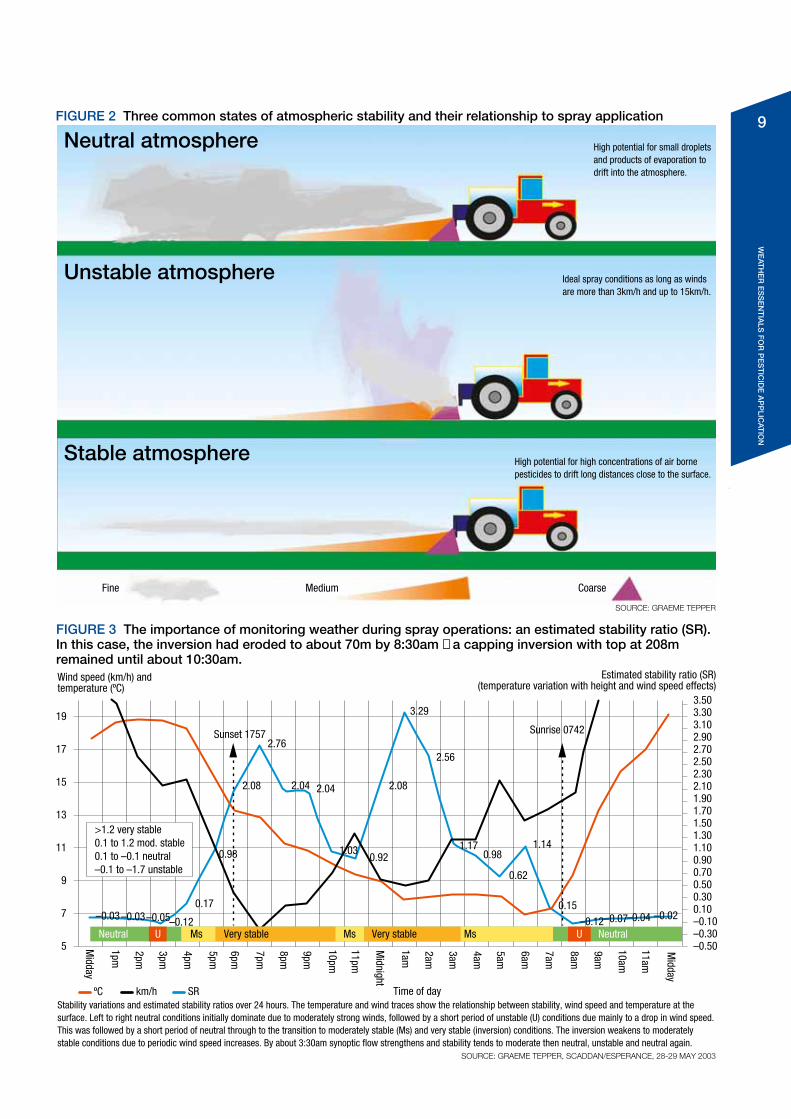
There are three common states of atmospheric stability: neutral, unstable and stable (Figure 2, page 9).
It is crucial that spray applicators understand and can recognise the three states of stability.
Atmospheric stability varies near the surface because the temperature of the air in contact with the surface changes more rapidly than the temperature of the air immediately above.
Neutral: Conditions are neutral when there is little difference between the temperature of the air at the surface and that above.
Unstable: Conditions are unstable when surface air is considerably warmer than the air above.
Stable: They are stable when surface air is considerably cooler than the air above. Generally, stability tends to be neutral in higher wind speeds.
However, very stable and very unstable conditions can tolerate considerable wind. In agricultural areas, speeds of 11km/h and higher are not unusual when the atmosphere is stable and surface temperature inversions exist.
unstable conditions tend to be turbulent. Stable conditions are rarely turbulent. Turbulence is the major factor that determines airborne pesticide concentrations.
Turbulence refers to the rolling eddies of airflow across the surface and thermals. It is usually suppressed at night and enhanced during the day.
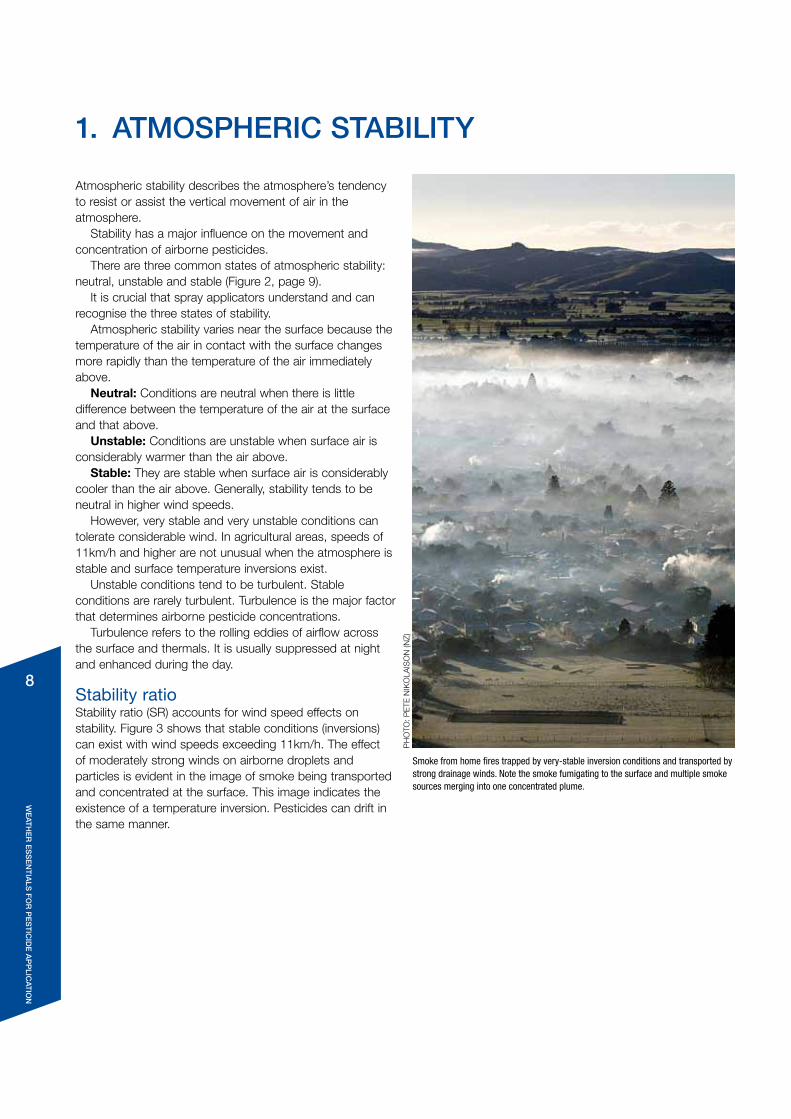
Stability ratioStability ratio (SR) accounts for wind speed effects on stability. Figure 3 shows that stable conditions (inversions) can exist with wind speeds exceeding 11km/h. The effect of moderately strong winds on airborne droplets and particles is evident in the image of smoke being transported and concentrated at the surface. This image indicates the existence of a temperature inversion. Pesticides can drift in the same manner.
1. aTmoSpHeriC STaBiLiTy
Smoke from home fires trapped by very-stable inversion conditions and transported by strong drainage winds. Note the smoke fumigating to the surface and multiple smoke sources merging into one concentrated plume.
PH
oTo
: Pe
Te n
Iko
LAIS
on
(nZ)
9
We
aTH
er
eS
Se
nT
iaLS
Fo
r p
eS
TiC
ide
ap
pLiC
aTio
n
SOURCE: GRAEME TEPPER, SCADDAN/ESPERANCE, 28-29 MAY 2003
>1.2 very stable0.1 to 1.2 mod. stable0.1 to –0.1 neutral–0.1 to –1.7 unstable
FIGURE 3 The importance of monitoring weather during spray operations: an estimated stability ratio (SR). In this case, the inversion had eroded to about 70m by 8:30am – a capping inversion with top at 208m remained until about 10:30am.Wind speed (km/h) and temperature (ºC)
Time of day
3.503.303.102.902.702.502.302.101.901.701.501.301.100.900.700.500.300.10–0.10–0.30–0.50
Neutral U Ms Very stable Very stableMs Ms U Neutral
ºC
Midday
1am
2am
3am
4am
5am
6am
7am
8am
9am
10am
11am
Midday
1pm
–0.03–0.03–0.05–0.12
0.17
0.98
2.08
Sunset 17572.76
2.56
1.17 1.14
0.62
–0.12–0.07–0.04 –0.020.15
0.98
3.29
Sunrise 0742
2.08
1.030.92
2.04 2.04
2pm
3pm
4pm
5pm
6pm
7pm
8pm
9pm
10pm
11pm
Midnight
Estimated stability ratio (SR)(temperature variation with height and wind speed effects)
19
17
15
13
11
9
7
5
km/h SRStability variations and estimated stability ratios over 24 hours. The temperature and wind traces show the relationship between stability, wind speed and temperature at the surface. Left to right neutral conditions initially dominate due to moderately strong winds, followed by a short period of unstable (U) conditions due mainly to a drop in wind speed. This was followed by a short period of neutral through to the transition to moderately stable (Ms) and very stable (inversion) conditions. The inversion weakens to moderately stable conditions due to periodic wind speed increases. By about 3:30am synoptic flow strengthens and stability tends to moderate then neutral, unstable and neutral again.
FIGURE 2 Three common states of atmospheric stability and their relationship to spray application
Fine Medium Coarse
Neutral atmosphere
Unstable atmosphere
Stable atmosphere
Ideal spray conditions as long as windsare more than 3km/h and up to 15km/h.
High potential for small dropletsand products of evaporation todrift into the atmosphere.
High potential for high concentrations of air bornepesticides to drift long distances close to the surface.
SOURCE: GRAEME TEPPER
10
We
aTH
er
eS
Se
nT
iaLS
Fo
r p
eS
TiC
ide
ap
pLiC
aTio
n
Wind is simply air in three-dimensional motion.Many factors lead to spray drift but ultimately it is caused
by horizontal and vertical winds that promote the transfer of pesticides into the atmosphere. For most purposes, horizontal wind can be adequately described as an average of the speed and direction of air flowing parallel to the earth’s surface. Bureau of Meteorology forecasts and observations refer to horizontal wind speed and direction averaged over 10 minutes at 10 metres above the ground (Figure 4).
When considering pesticide application the most important vertical winds are those associated with thermals. Vertical winds can significantly impact the volume of pesticides swept off site.
Three-dimensional motion determines: n airborne pesticide concentrations;n the vertical distribution of airborne pesticides;n direction and distance of pesticide transport; andn pesticide deposition.
Air primarily flows in response to adjacent pressure differences (highs to lows), heating (thermals) and cooling (drainage winds). As air flows over the surface it is deflected by obstacles and slowed by friction. Consequently, near the surface it breaks down into a series of turbulent eddies that lead to rapid fluctuations in wind speed and direction.
Winds relevant to pesticide application are:n synoptic winds – horizontal surface winds, initiated by air
flow from high to low pressure. Isobar spacing illustrated on weather maps can be used as a general guide to determine wind speed and direction; and
n local winds – up, down or horizontal winds that flow over short distances, initiated by unequal heating and cooling of the ground and by the shape and features of the paddock and the regional. Gravity has a major impact on the destination of air being cooled on slopes. Surface heating has a major influence on the strength of rising-air currents. Local winds cannot be determined from isobar spacing.
Common spray guidelinesn Spray only when wind direction is away from sensitive
areas (buffers may vary this requirement).n During the day, aim to spray when wind speed is more
than 3km/h and up to 15km/h.n Do not spray if wind is calm or less than 3km/h or at any
wind speed where constancy in direction is not assured.High wind speed (above 15 km/h) can lead to high volumes of downwind drift with highest concentrations close to the target and lowest concentrations further downwind. High wind speeds are the primary cause of loss and waste of product from the target site.
Winds and breezes between about 7km/h and 18km/h, having consistent direction, are generally best for spraying as they promote optimal-droplet deposition and least drift
2. Wind
potential.Low wind speed (less than 5km/h) tends to be associated with unpredictable wind direction and very little turbulence unless thermals exist.
Also refer to page 24 – Precautions for night spraying.
TurbulenceTurbulence is the specific feature of wind flow, both horizontal and vertical, that determines the concentration and dilution of airborne pesticides. It consists of rolling
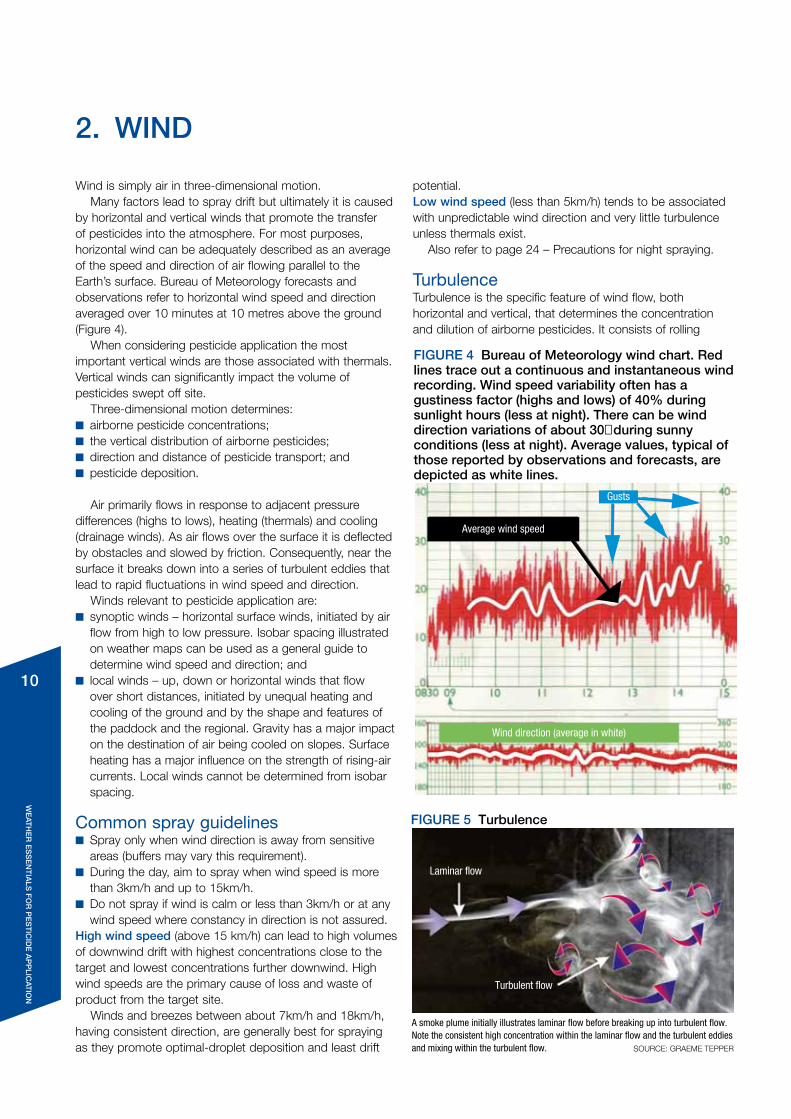
FIGURE 4 Bureau of Meteorology wind chart. Red lines trace out a continuous and instantaneous wind recording. Wind speed variability often has a gustiness factor (highs and lows) of 40% during sunlight hours (less at night). There can be wind direction variations of about 30° during sunny conditions (less at night). Average values, typical of those reported by observations and forecasts, are depicted as white lines.
Gusts
Average wind speed
Wind direction (average in white)
SOURCE: GRAEME TEPPER
FIGURE 5 Turbulence
A smoke plume initially illustrates laminar flow before breaking up into turbulent flow. Note the consistent high concentration within the laminar flow and the turbulent eddies and mixing within the turbulent flow.
Laminar flow
Turbulent flow
11
We
aTH
er
eS
Se
nT
iaLS
Fo
r p
eS
TiC
ide
ap
pLiC
aTio
n
motions (eddies) in the airflow; larger rolls generate greater turbulence and greatest dispersion of airborne pesticides.
Turbulence intensity is regulated by atmospheric stability and is usually suppressed at night and enhanced during the day (see Atmospheric Stability, page 8).
A lack of turbulence leads to airborne pesticides floating at high concentrations near the surface and high risk of adverse drift effects. This is the situation during a surface temperature inversion.
Intense turbulence leads to rapid dispersion of airborne pesticides both horizontally and vertically, taking larger particles down to the surface and lifting smaller particles high into the atmosphere (Figure 5). Spray drift will occur but particles will be dispersed, diluting the pesticide concentration and reducing but not eliminating the risk of off-target damage.
It is important to note that as turbulence intensity increases it not only acts to rapidly disperse pesticides it also acts to keep airborne pesticides in suspension for long periods.
Synoptic windsSynoptic winds are the winds usually referred to in weather forecasts (sea breezes being an exception for coastal regions).
Synoptic winds are those resulting from air flowing in response to pressure-gradient forces that build up between areas of high and low pressure over several hundreds or thousands of kilometres. The greater the pressure difference, the greater is the pressure-gradient force and hence the stronger are the winds.
It might be expected that synoptic winds should flow directly-across isobars from high to low pressure but this is rarely the case. Instead, the observed behaviour is that the synoptic winds flow slightly-across isobars and exhibit anti-clockwise spiralling of wind out of high-pressure systems and clockwise spiralling of wind into low-pressure systems (this is in the Southern Hemisphere, in the northern Hemisphere winds spiral clockwise out of high-pressure systems and anticlockwise into low-pressure systems).
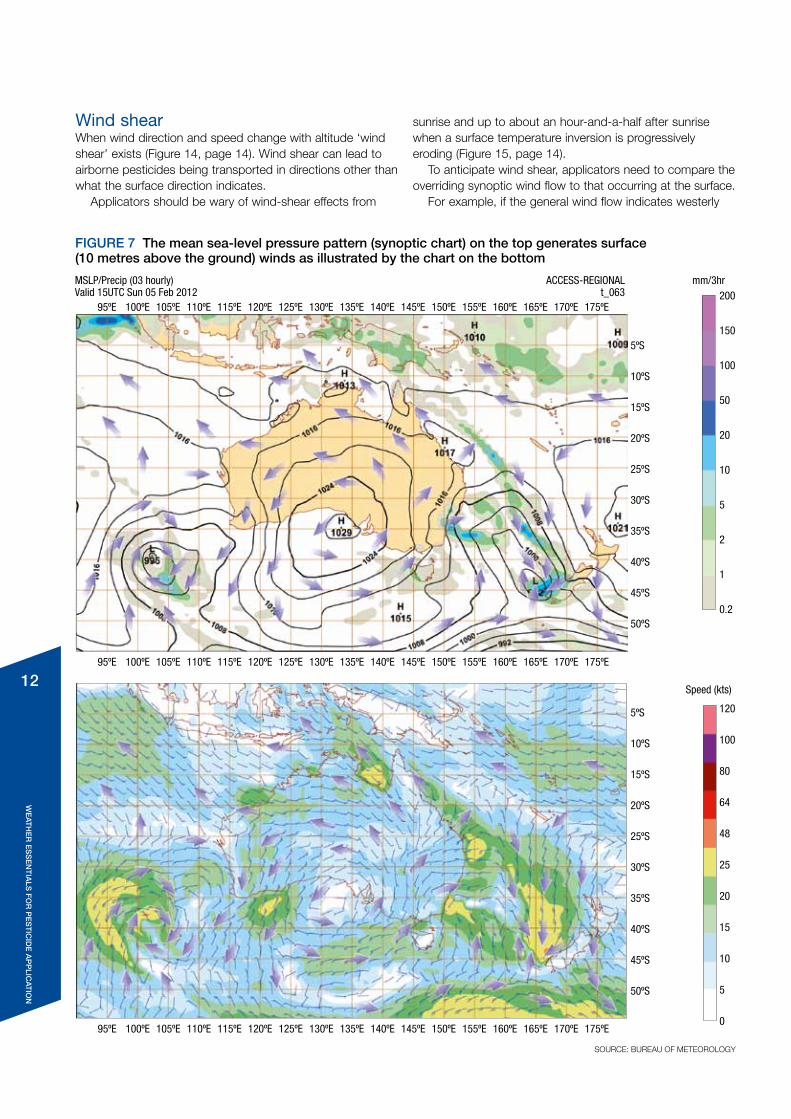
The pressure/wind relationship can be seen by comparing isobar configuration to winds (Figure 7). These charts (minus the arrows) are available from the Bureau of Meteorology.
Local windsLocal winds frequently flow completely independently of the synoptic flow, with different direction and speed.
onset and cessation of local winds can be rapid. Therefore, local winds need to be carefully monitored to ensure operating practices remain tailored to prevent pesticides drifting toward sensitive areas.
Local winds are usually on a small scale, more pronounced after sunset and decline in influence after sunrise.
Local wind flows are caused by:n on-slope cooling (drainage winds – Figure 6);n on-slope heating (anabatic winds – Figure 8);n terrain blocking (blocked winds – Figure 9);n differential heating (sea and land breezes – Figures 10 and
11);n cool air falling downslope (downslope winds – Figure 12);n excessive heating (thermals – Figure 13); andn density currents (far-inland sea breezes).
Measuring local windsBecause local winds are short-lived and variable, frequent in-paddock observations are required to track variations.
While sophisticated instruments can be used to track variations, simple methods are often useful. Ribbons attached to the end of the boom or on fencelines, smoke pots or a smoking device fitted to the tractor’s exhaust can all help indicate wind strength and direction. In turn, such observations indicate if the atmosphere has become stable (see Atmospheric Stability, page 8) and the wind has become less turbulent. Handheld wind meters should be held at the height of the boomspray for wind measurement.
SOURCE: GRAEME TEPPER
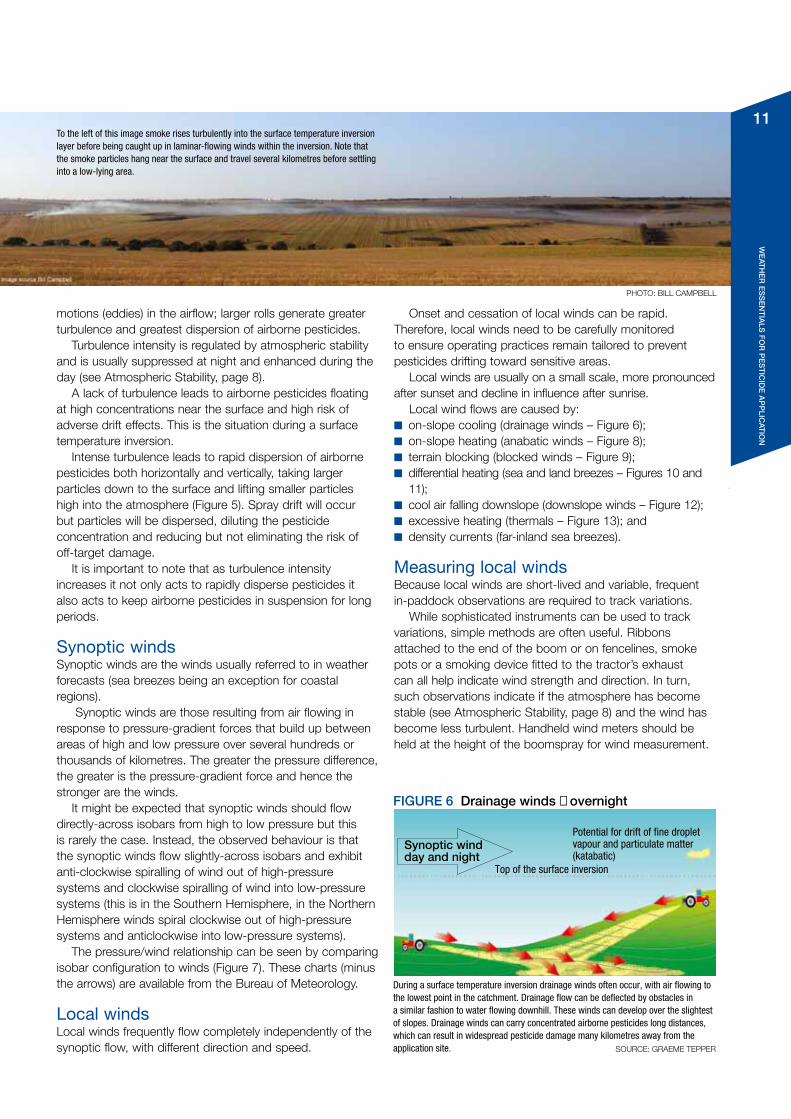
FIGURE 6 Drainage winds – overnight
Potential for drift of fine dropletvapour and particulate matter (katabatic)
Top of the surface inversion
Synoptic windday and night
During a surface temperature inversion drainage winds often occur, with air flowing to the lowest point in the catchment. Drainage flow can be deflected by obstacles in a similar fashion to water flowing downhill. These winds can develop over the slightest of slopes. Drainage winds can carry concentrated airborne pesticides long distances, which can result in widespread pesticide damage many kilometres away from the application site.
To the left of this image smoke rises turbulently into the surface temperature inversion layer before being caught up in laminar-flowing winds within the inversion. Note that the smoke particles hang near the surface and travel several kilometres before settling into a low-lying area.
PHoTo: BILL CAMPBeLL
12
We
aTH
er
eS
Se
nT
iaLS
Fo
r p
eS
TiC
ide
ap
pLiC
aTio
n
Wind shear When wind direction and speed change with altitude ‘wind shear’ exists (Figure 14, page 14). Wind shear can lead to airborne pesticides being transported in directions other than what the surface direction indicates.
Applicators should be wary of wind-shear effects from
sunrise and up to about an hour-and-a-half after sunrise when a surface temperature inversion is progressively eroding (Figure 15, page 14).
To anticipate wind shear, applicators need to compare the overriding synoptic wind flow to that occurring at the surface.
For example, if the general wind flow indicates westerly
SOURCE: BUREAU OF METEOROLOGY
FIGURE 7 The mean sea-level pressure pattern (synoptic chart) on the top generates surface(10 metres above the ground) winds as illustrated by the chart on the bottomMSLP/Precip (03 hourly)Valid 15UTC Sun 05 Feb 2012
mm/3hr
Speed (kts)
95ºE 100ºE 105ºE 110ºE 115ºE 120ºE 125ºE 130ºE 135ºE 140ºE 145ºE 150ºE 155ºE 160ºE 165ºE 170ºE 175ºE
95ºE 100ºE 105ºE 110ºE 115ºE 120ºE 125ºE 130ºE 135ºE 140ºE 145ºE 150ºE 155ºE 160ºE 165ºE 170ºE 175ºE
95ºE 100ºE 105ºE 110ºE 115ºE 120ºE 125ºE 130ºE 135ºE 140ºE 145ºE 150ºE 155ºE 160ºE 165ºE 170ºE 175ºE
5ºS
10ºS
15ºS
20ºS
25ºS
30ºS
35ºS
40ºS
45ºS
50ºS
5ºS
10ºS
15ºS
20ºS
25ºS
30ºS
35ºS
40ºS
45ºS
50ºS
200
150
100
50
20
10
5
2
1
0.2
120
100
80
64
48
25
20
15
10
5
0
ACCESS-REGIONALt_063
13
We
aTH
er
eS
Se
nT
iaLS
Fo
r p
eS
TiC
ide
ap
pLiC
aTio
n
winds but the actual surface winds are easterly then there is significant wind shear. If overnight winds have a similar direction to the general wind flow, wind shear will be minimal (Figure 14, page 14).
The wind shear most relevant to spray applicators is likely to occur when surface temperature inversions and drainage
winds dominate local surface wind flow, while winds above the surface are dominated by the synoptic flow.
Diurnal variation of windDiurnal variations in wind speed and gustiness are related to temperature and atmospheric stability (Figures 16 and 17).
SOURCE: GRAEME TEPPER
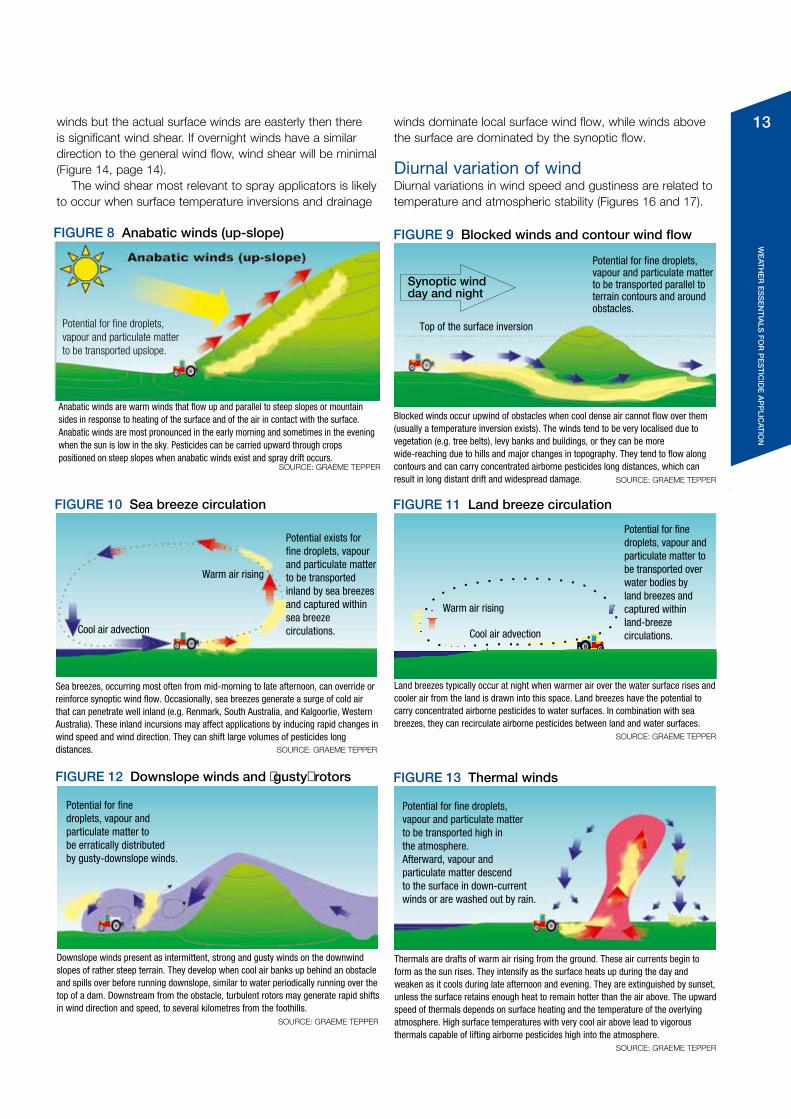
FIGURE 10 Sea breeze circulation
Sea breezes, occurring most often from mid-morning to late afternoon, can override or reinforce synoptic wind flow. Occasionally, sea breezes generate a surge of cold air that can penetrate well inland (e.g. Renmark, South Australia, and Kalgoorlie, Western Australia). These inland incursions may affect applications by inducing rapid changes in wind speed and wind direction. They can shift large volumes of pesticides long distances.
Warm air rising
Cool air advection
Potential exists forfine droplets, vapour and particulate matter to be transported inland by sea breezes and captured withinsea breeze circulations.
SOURCE: GRAEME TEPPER
Release point
Land breezes typically occur at night when warmer air over the water surface rises and cooler air from the land is drawn into this space. Land breezes have the potential to carry concentrated airborne pesticides to water surfaces. In combination with sea breezes, they can recirculate airborne pesticides between land and water surfaces.
Warm air rising
Cool air advection
FIGURE 11 Land breeze circulation
Potential for finedroplets, vapour andparticulate matter tobe transported overwater bodies byland breezes andcaptured withinland-breeze circulations.
SOURCE: GRAEME TEPPER
FIGURE 12 Downslope winds and ‘gusty’ rotors
Downslope winds present as intermittent, strong and gusty winds on the downwind slopes of rather steep terrain. They develop when cool air banks up behind an obstacle and spills over before running downslope, similar to water periodically running over the top of a dam. Downstream from the obstacle, turbulent rotors may generate rapid shifts in wind direction and speed, to several kilometres from the foothills.
Potential for finedroplets, vapour andparticulate matter to be erratically distributedby gusty-downslope winds.
SOURCE: GRAEME TEPPER
FIGURE 13 Thermal winds
Thermals are drafts of warm air rising from the ground. These air currents begin to form as the sun rises. They intensify as the surface heats up during the day and weaken as it cools during late afternoon and evening. They are extinguished by sunset, unless the surface retains enough heat to remain hotter than the air above. The upward speed of thermals depends on surface heating and the temperature of the overlying atmosphere. High surface temperatures with very cool air above lead to vigorous thermals capable of lifting airborne pesticides high into the atmosphere.
Potential for fine droplets,vapour and particulate matterto be transported high inthe atmosphere.Afterward, vapour andparticulate matter descendto the surface in down-currentwinds or are washed out by rain.
SOURCE: GRAEME TEPPER
FIGURE 9 Blocked winds and contour wind flow
Blocked winds occur upwind of obstacles when cool dense air cannot flow over them (usually a temperature inversion exists). The winds tend to be very localised due to vegetation (e.g. tree belts), levy banks and buildings, or they can be more wide-reaching due to hills and major changes in topography. They tend to flow along contours and can carry concentrated airborne pesticides long distances, which can result in long distant drift and widespread damage.
Synoptic windday and night
Potential for fine droplets,vapour and particulate matterto be transported parallel toterrain contours and aroundobstacles.
Top of the surface inversion
SOURCE: GRAEME TEPPER
FIGURE 8 Anabatic winds (up-slope)
Anabatic winds are warm winds that flow up and parallel to steep slopes or mountain sides in response to heating of the surface and of the air in contact with the surface. Anabatic winds are most pronounced in the early morning and sometimes in the evening when the sun is low in the sky. Pesticides can be carried upward through crops positioned on steep slopes when anabatic winds exist and spray drift occurs.
Potential for fine droplets,vapour and particulate matterto be transported upslope.
14
We
aTH
er
eS
Se
nT
iaLS
Fo
r p
eS
TiC
ide
ap
pLiC
aTio
n
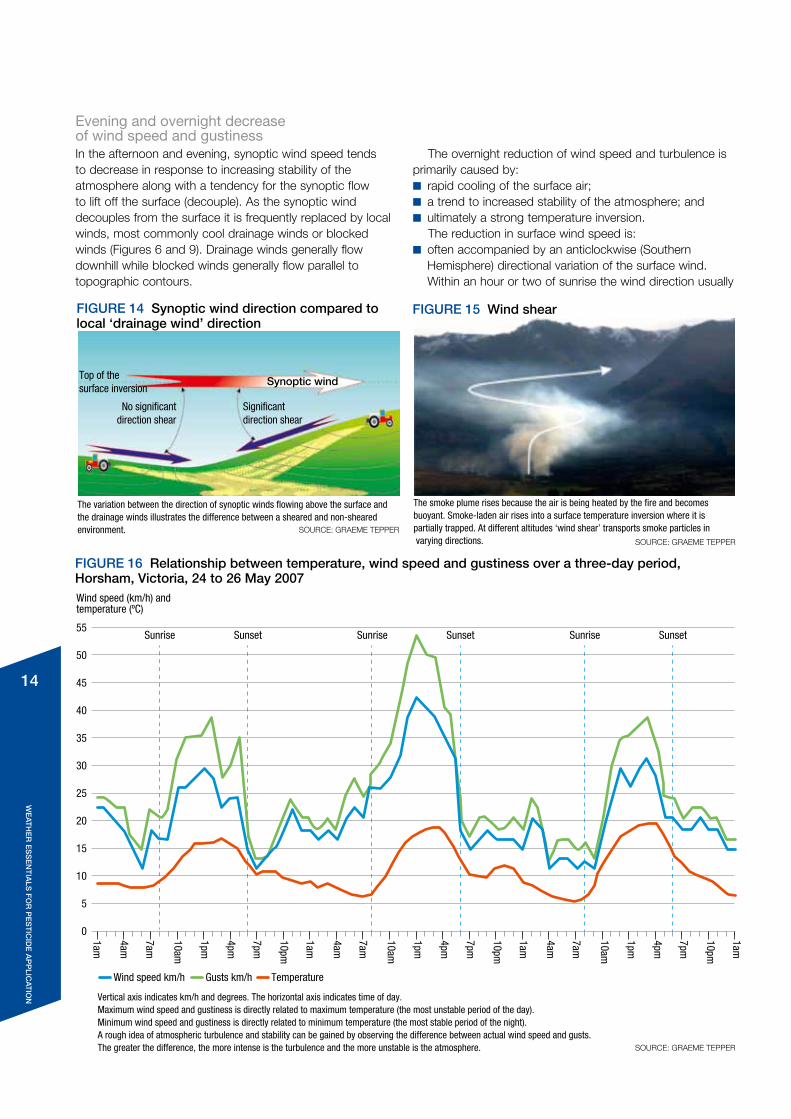
Evening and overnight decrease of wind speed and gustinessIn the afternoon and evening, synoptic wind speed tends to decrease in response to increasing stability of the atmosphere along with a tendency for the synoptic flow to lift off the surface (decouple). As the synoptic wind decouples from the surface it is frequently replaced by local winds, most commonly cool drainage winds or blocked winds (Figures 6 and 9). Drainage winds generally flow downhill while blocked winds generally flow parallel to topographic contours.
The overnight reduction of wind speed and turbulence is primarily caused by:n rapid cooling of the surface air;n a trend to increased stability of the atmosphere; andn ultimately a strong temperature inversion.
The reduction in surface wind speed is:n often accompanied by an anticlockwise (Southern
Hemisphere) directional variation of the surface wind. Within an hour or two of sunrise the wind direction usually
SOURCE: GRAEME TEPPER
Vertical axis indicates km/h and degrees. The horizontal axis indicates time of day.Maximum wind speed and gustiness is directly related to maximum temperature (the most unstable period of the day).Minimum wind speed and gustiness is directly related to minimum temperature (the most stable period of the night).A rough idea of atmospheric turbulence and stability can be gained by observing the difference between actual wind speed and gusts.The greater the difference, the more intense is the turbulence and the more unstable is the atmosphere.
FIGURE 16 Relationship between temperature, wind speed and gustiness over a three-day period,Horsham, Victoria, 24 to 26 May 2007
Km/h & ºC
Wind speed km/h
55
50
45
40
35
30
25
20
15
10
5
0
Gusts km/h Temperature
Sunrise Sunset Sunrise Sunset Sunrise Sunset
1am
1am
10am
10pm
4am
4pm
1pm
7am
7pm
1am
10am
10pm
4am
4pm
1pm
7am
7pm
1am
10am
10pm
4am
4pm
1pm
7am
7pm
Wind speed (km/h) and temperature (ºC)
FIGURE 15 Wind shear
The smoke plume rises because the air is being heated by the fire and becomes buoyant. Smoke-laden air rises into a surface temperature inversion where it is partially trapped. At different altitudes ‘wind shear’ transports smoke particles in varying directions. SOURCE: GRAEME TEPPER
SOURCE: GRAEME TEPPER
FIGURE 14 Synoptic wind direction compared to local ‘drainage wind’ direction
Top of thesurface inversion
Significantdirection shear
No significantdirection shear
Synoptic wind
The variation between the direction of synoptic winds flowing above the surface and the drainage winds illustrates the difference between a sheared and non-sheared environment.
15
We
aTH
er
eS
Se
nT
iaLS
Fo
r p
eS
TiC
ide
ap
pLiC
aTio
n
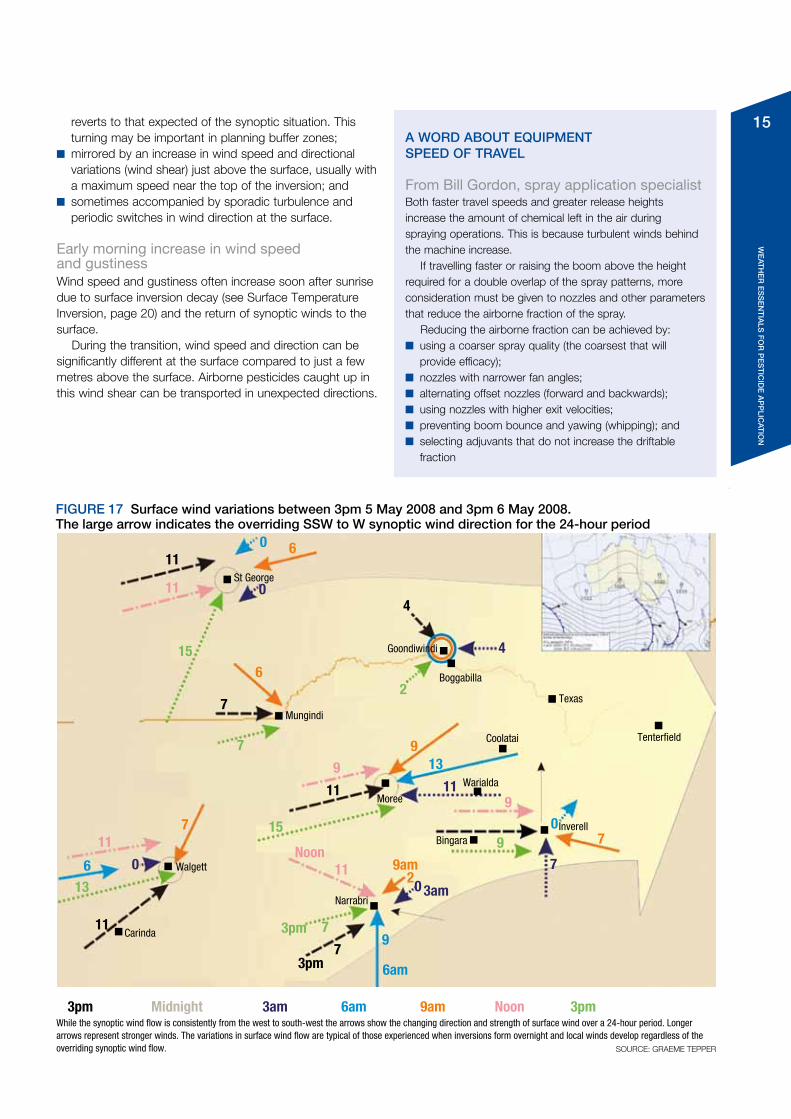
FIGURE 17 Surface wind variations between 3pm 5 May 2008 and 3pm 6 May 2008.The large arrow indicates the overriding SSW to W synoptic wind direction for the 24-hour period
Goondiwindi
Boggabilla
Texas
11
3pm 3amMidnight
11
7
11
3pm
7
411
9
11
11Noon
Noon
9
15
7
15
13
73pm
3pm
9
2
0
13
0
9
6
6am
6am
0
11
0
0
3am
7
4
6
9
9am
9am
7
2
7
6
Tenterfield
St George
Mungindi
Moree
Narrabri
Walgett
Carinda
Coolatai
Warialda
InverellBingara
While the synoptic wind flow is consistently from the west to south-west the arrows show the changing direction and strength of surface wind over a 24-hour period. Longer arrows represent stronger winds. The variations in surface wind flow are typical of those experienced when inversions form overnight and local winds develop regardless of the overriding synoptic wind flow. SOURCE: GRAEME TEPPER
a Word aBouT eQuipmenT Speed oF TraveL
From Bill Gordon, spray application specialist Both faster travel speeds and greater release heights increase the amount of chemical left in the air during spraying operations. This is because turbulent winds behind the machine increase.
If travelling faster or raising the boom above the height required for a double overlap of the spray patterns, more consideration must be given to nozzles and other parameters that reduce the airborne fraction of the spray.
Reducing the airborne fraction can be achieved by:n using a coarser spray quality (the coarsest that will
provide efficacy);n nozzles with narrower fan angles;n alternating offset nozzles (forward and backwards);n using nozzles with higher exit velocities;n preventing boom bounce and yawing (whipping); andn selecting adjuvants that do not increase the driftable
fraction
reverts to that expected of the synoptic situation. This turning may be important in planning buffer zones;
n mirrored by an increase in wind speed and directional variations (wind shear) just above the surface, usually with a maximum speed near the top of the inversion; and
n sometimes accompanied by sporadic turbulence and periodic switches in wind direction at the surface.
Early morning increase in wind speed and gustinessWind speed and gustiness often increase soon after sunrise due to surface inversion decay (see Surface Temperature Inversion, page 20) and the return of synoptic winds to the surface.
During the transition, wind speed and direction can be significantly different at the surface compared to just a few metres above the surface. Airborne pesticides caught up in this wind shear can be transported in unexpected directions.
16
We
aTH
er
eS
Se
nT
iaLS
Fo
r p
eS
TiC
ide
ap
pLiC
aTio
n
3. TemperaTure
For a spray applicator, the temperature of the air into which pesticides are sprayed and the temperature of the surface over which they are applied are important.
Air and surface temperature have direct influence on the deposition of pesticides and on the rate at which pesticides volatilise from soil and plant surfaces (see Volatilisation – be aware of surface temperature, page 17). Increasing temperature usually decreases the relative humidity of the air and thus increases the evaporation rate of the aqueous component of pesticide droplets.
The difference between the surface temperature and that of the air immediately above the surface is also very import. This is because it dictates the stability of the atmosphere and in turn, affects the potential for airborne pesticides to rise and dilute or remain concentrated near the surface.
Temperature and pesticide applicationAs temperature increases:n droplets evaporate faster because warm air can hold
more moisture than cool air;n turbulence intensity generally increases because the
atmosphere becomes more unstable;n volatile pesticides on soil and plant surfaces vaporise
faster because vapour pressure increases as temperature increases; and
n the potential for thermals to lift airborne pesticides into the atmosphere increases because increasing the temperature ordinarily increases the height to which thermals rise.
Surface to air temperature variations Surface temperature variations compared to the air just above the surface can be extreme. With strong sunlight, the surface temperature of bare ground can be more than 20ºC higher than the air temperature 1.25m above the ground, the standard height of temperature measurement by the Bureau of Meteorology.
Heat loss to clear night skies can lead to surface temperature being several degrees cooler than minimum temperatures quoted by the Bureau of Meteorology.
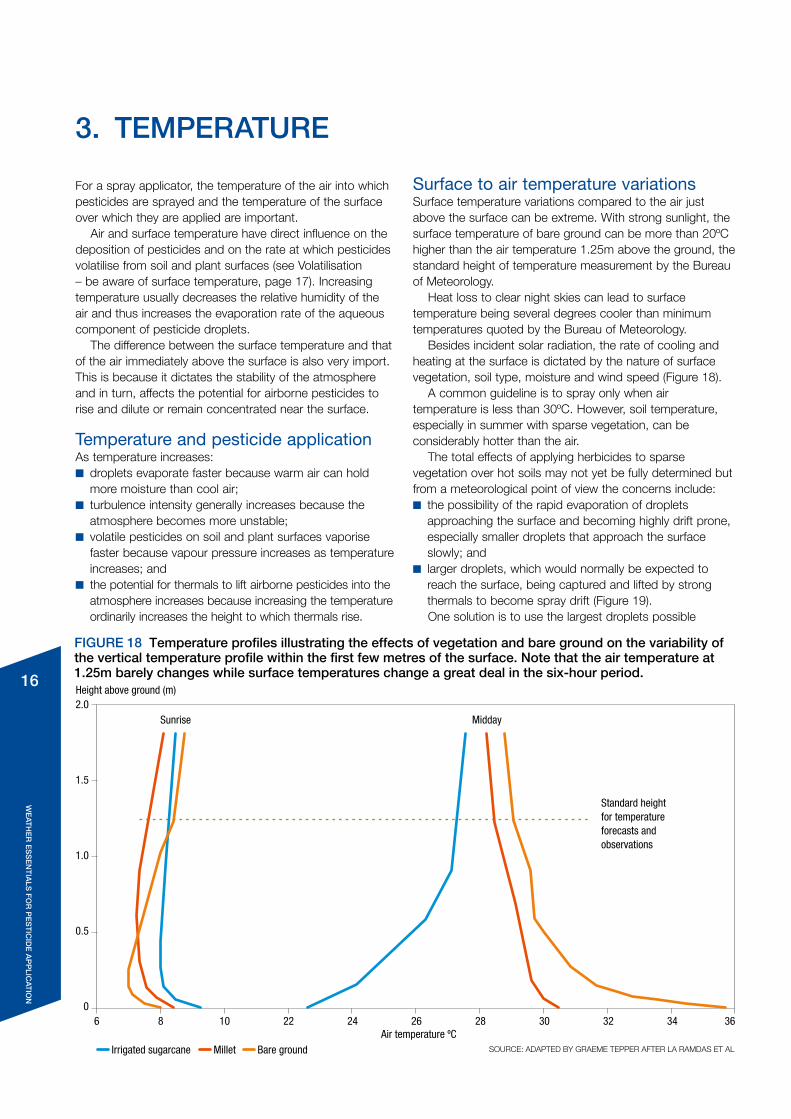
Besides incident solar radiation, the rate of cooling and heating at the surface is dictated by the nature of surface vegetation, soil type, moisture and wind speed (Figure 18).
A common guideline is to spray only when air temperature is less than 30ºC. However, soil temperature, especially in summer with sparse vegetation, can be considerably hotter than the air.
The total effects of applying herbicides to sparse vegetation over hot soils may not yet be fully determined but from a meteorological point of view the concerns include:n the possibility of the rapid evaporation of droplets
approaching the surface and becoming highly drift prone, especially smaller droplets that approach the surface slowly; and
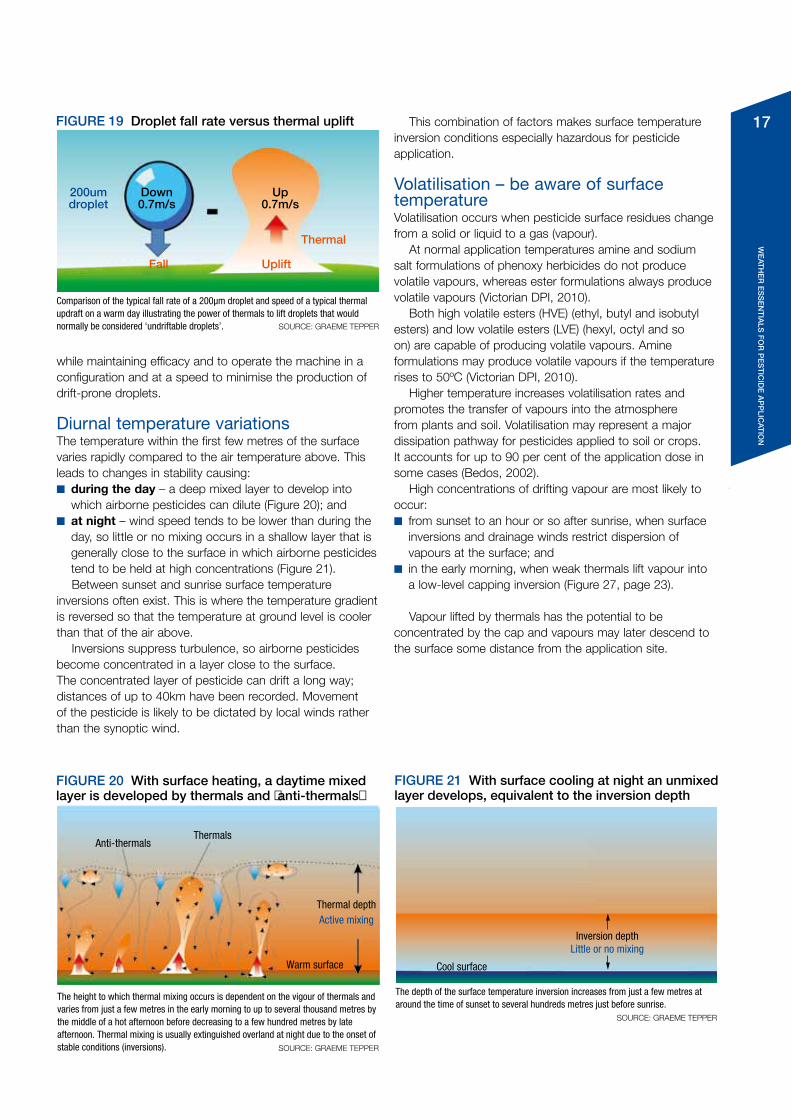
n larger droplets, which would normally be expected to reach the surface, being captured and lifted by strong thermals to become spray drift (Figure 19).one solution is to use the largest droplets possible
SOURCE: ADAPTED BY GRAEME TEPPER AFTER LA RAMDAS ET AL
FIGURE 18 Temperature profiles illustrating the effects of vegetation and bare ground on the variability of the vertical temperature profile within the first few metres of the surface. Note that the air temperature at 1.25m barely changes while surface temperatures change a great deal in the six-hour period. Height above ground (m)
Irrigated sugarcane
2.0
1.5
1.0
0.5
0
Millet Bare ground
Standard heightfor temperatureforecasts andobservations
Sunrise Midday
6 8 10 22 24 26Air temperature ºC
28 30 32 34 36
17
We
aTH
er
eS
Se
nT
iaLS
Fo
r p
eS
TiC
ide
ap
pLiC
aTio
n
while maintaining efficacy and to operate the machine in a configuration and at a speed to minimise the production of drift-prone droplets.
Diurnal temperature variationsThe temperature within the first few metres of the surface varies rapidly compared to the air temperature above. This leads to changes in stability causing:n during the day – a deep mixed layer to develop into
which airborne pesticides can dilute (Figure 20); andn at night – wind speed tends to be lower than during the
day, so little or no mixing occurs in a shallow layer that is generally close to the surface in which airborne pesticides tend to be held at high concentrations (Figure 21). Between sunset and sunrise surface temperature
inversions often exist. This is where the temperature gradient is reversed so that the temperature at ground level is cooler than that of the air above.
Inversions suppress turbulence, so airborne pesticides become concentrated in a layer close to the surface. The concentrated layer of pesticide can drift a long way; distances of up to 40km have been recorded. Movement of the pesticide is likely to be dictated by local winds rather than the synoptic wind.
This combination of factors makes surface temperature inversion conditions especially hazardous for pesticide application.
Volatilisation – be aware of surface temperatureVolatilisation occurs when pesticide surface residues change from a solid or liquid to a gas (vapour).
At normal application temperatures amine and sodium salt formulations of phenoxy herbicides do not produce volatile vapours, whereas ester formulations always produce volatile vapours (Victorian DPI, 2010).
Both high volatile esters (HVe) (ethyl, butyl and isobutyl esters) and low volatile esters (LVe) (hexyl, octyl and so on) are capable of producing volatile vapours. Amine formulations may produce volatile vapours if the temperature rises to 50ºC (Victorian DPI, 2010).
Higher temperature increases volatilisation rates and promotes the transfer of vapours into the atmosphere from plants and soil. Volatilisation may represent a major dissipation pathway for pesticides applied to soil or crops. It accounts for up to 90 per cent of the application dose in some cases (Bedos, 2002).
High concentrations of drifting vapour are most likely to occur:n from sunset to an hour or so after sunrise, when surface
inversions and drainage winds restrict dispersion of vapours at the surface; and
n in the early morning, when weak thermals lift vapour into a low-level capping inversion (Figure 27, page 23).
Vapour lifted by thermals has the potential to be concentrated by the cap and vapours may later descend to the surface some distance from the application site.
SOURCE: GRAEME TEPPER
FIGURE 19 Droplet fall rate versus thermal uplift
Comparison of the typical fall rate of a 200µm droplet and speed of a typical thermal updraft on a warm day illustrating the power of thermals to lift droplets that would normally be considered ‘undriftable droplets’.
200umdroplet
Fall Uplift
Thermal
Down0.7m/s
Up0.7m/s
FIGURE 20 With surface heating, a daytime mixed layer is developed by thermals and ‘anti-thermals’
Anti-thermalsThermals
Thermal depth
Warm surface
Active mixing
SOURCE: GRAEME TEPPER
The height to which thermal mixing occurs is dependent on the vigour of thermals and varies from just a few metres in the early morning to up to several thousand metres by the middle of a hot afternoon before decreasing to a few hundred metres by late afternoon. Thermal mixing is usually extinguished overland at night due to the onset of stable conditions (inversions).
FIGURE 21 With surface cooling at night an unmixed layer develops, equivalent to the inversion depth
SOURCE: GRAEME TEPPER
Inversion depthLittle or no mixing
Cool surface
The depth of the surface temperature inversion increases from just a few metres at around the time of sunset to several hundreds metres just before sunrise.
18
We
aTH
er
eS
Se
nT
iaLS
Fo
r p
eS
TiC
ide
ap
pLiC
aTio
n
The rate at which spray droplets evaporate is mainly determined by the amount of water vapour that the air can absorb, the droplet volume compared to its exposed surface, chemical formulation and the nature of the airflow over the droplet.
Relative humidityRelative humidity (RH) is the ratio of the actual amount of water vapour in the air to the amount it can hold when saturated. The air’s capacity to hold water vapour increases as air temperature rises. At 30ºC, the capacity is more than three times that at 10ºC; consequently, while the amount of water vapour in the air may be static, the relative humidity decreases as temperature increases (Figure 22).
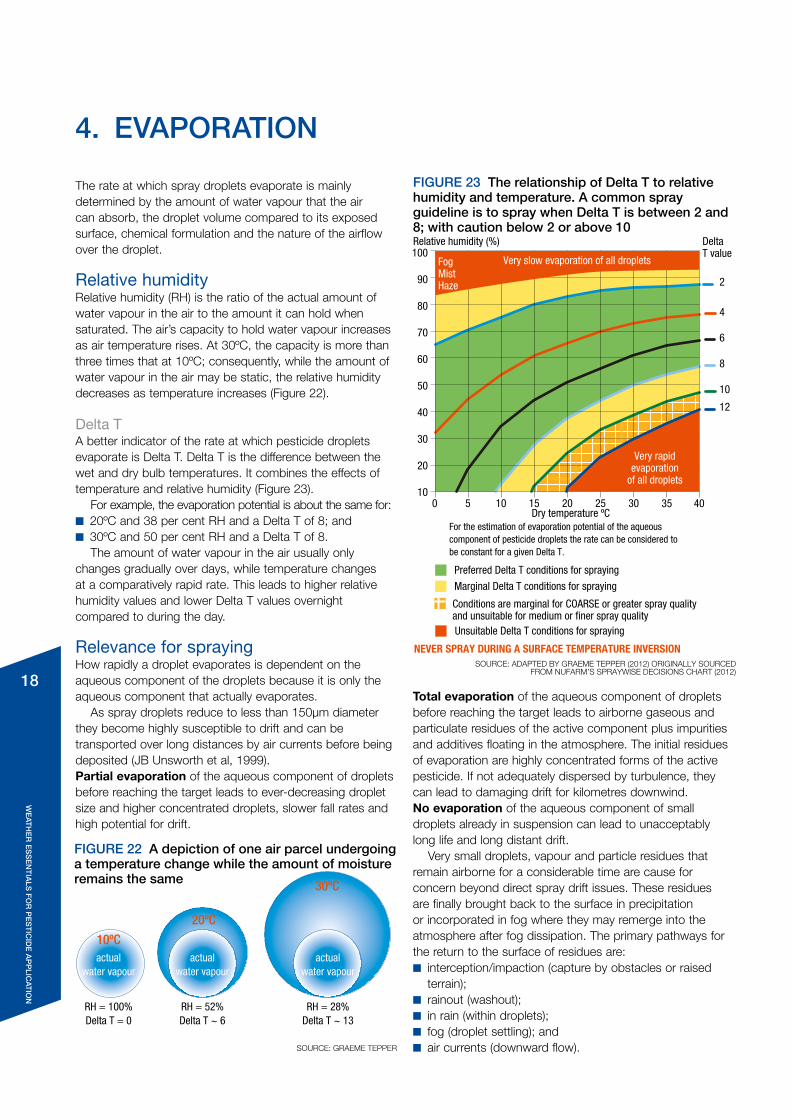
Delta TA better indicator of the rate at which pesticide droplets evaporate is Delta T. Delta T is the difference between the wet and dry bulb temperatures. It combines the effects of temperature and relative humidity (Figure 23).
For example, the evaporation potential is about the same for:n 20ºC and 38 per cent RH and a Delta T of 8; andn 30ºC and 50 per cent RH and a Delta T of 8.
The amount of water vapour in the air usually only changes gradually over days, while temperature changes at a comparatively rapid rate. This leads to higher relative humidity values and lower Delta T values overnight compared to during the day.
Relevance for sprayingHow rapidly a droplet evaporates is dependent on the aqueous component of the droplets because it is only the aqueous component that actually evaporates.
As spray droplets reduce to less than 150µm diameter they become highly susceptible to drift and can be transported over long distances by air currents before being deposited (JB unsworth et al, 1999).Partial evaporation of the aqueous component of droplets before reaching the target leads to ever-decreasing droplet size and higher concentrated droplets, slower fall rates and high potential for drift.
4. evaporaTion
Total evaporation of the aqueous component of droplets before reaching the target leads to airborne gaseous and particulate residues of the active component plus impurities and additives floating in the atmosphere. The initial residues of evaporation are highly concentrated forms of the active pesticide. If not adequately dispersed by turbulence, they can lead to damaging drift for kilometres downwind.No evaporation of the aqueous component of small droplets already in suspension can lead to unacceptably long life and long distant drift.
Very small droplets, vapour and particle residues that remain airborne for a considerable time are cause for concern beyond direct spray drift issues. These residues are finally brought back to the surface in precipitation or incorporated in fog where they may remerge into the atmosphere after fog dissipation. The primary pathways for the return to the surface of residues are:n interception/impaction (capture by obstacles or raised
terrain);n rainout (washout);n in rain (within droplets);n fog (droplet settling); andn air currents (downward flow).SOURCE: GRAEME TEPPER
FIGURE 22 A depiction of one air parcel undergoing a temperature change while the amount of moisture remains the same
actualwater vapour
actualwater vapour
actualwater vapour
RH = 100%Delta T = 0
RH = 52%Delta T ~ 6
RH = 28%Delta T ~ 13
30ºC
20ºC
10ºC
SOURCE: ADAPTED BY GRAEME TEPPER (2012) ORIGINALLY SOURCEDFROM NUFARM’S SPRAYWISE DECISIONS CHART (2012)
FIGURE 23 The relationship of Delta T to relative humidity and temperature. A common spray guideline is to spray when Delta T is between 2 and 8; with caution below 2 or above 10Relative humidity (%)
2
Delta T value
Preferred Delta T conditions for spraying
100
90
80
70
60
50
40
30
20
10
4
6
8
10
12
0 5 10 15 20 25Dry temperature ºC
For the estimation of evaporation potential of the aqueous component of pesticide droplets the rate can be considered to be constant for a given Delta T.
30 35 40
Marginal Delta T conditions for spraying
Unsuitable Delta T conditions for spraying
NEVER SPRAY DURING A SURFACE TEMPERATURE INVERSION
Conditions are marginal for COARSE or greater spray quality and unsuitable for medium or finer spray quality
FogMistHaze
Very slow evaporation of all droplets
Very rapidevaporation
of all droplets
19
We
aTH
er
eS
Se
nT
iaLS
Fo
r p
eS
TiC
ide
ap
pLiC
aTio
n
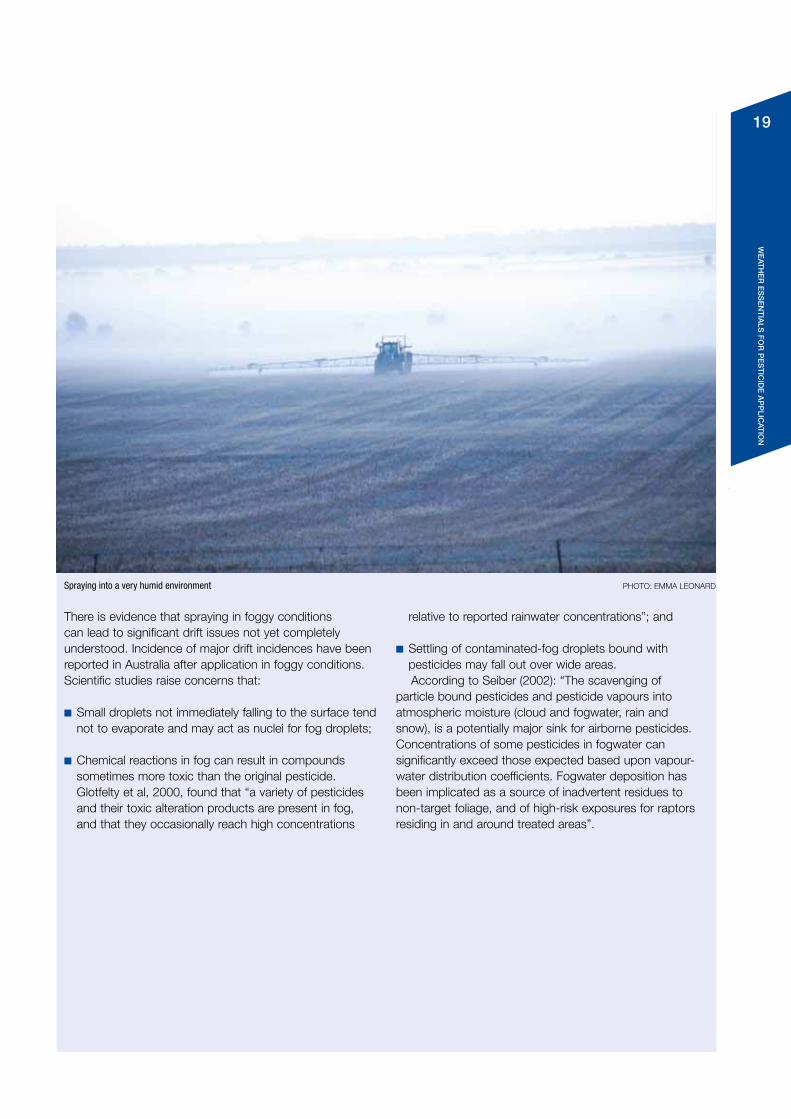
There is evidence that spraying in foggy conditions can lead to significant drift issues not yet completely understood. Incidence of major drift incidences have been reported in Australia after application in foggy conditions. Scientific studies raise concerns that:
n Small droplets not immediately falling to the surface tend not to evaporate and may act as nuclei for fog droplets;
n Chemical reactions in fog can result in compounds sometimes more toxic than the original pesticide. Glotfelty et al, 2000, found that “a variety of pesticides and their toxic alteration products are present in fog, and that they occasionally reach high concentrations
relative to reported rainwater concentrations”; and
n Settling of contaminated-fog droplets bound with pesticides may fall out over wide areas.According to Seiber (2002): “The scavenging of
particle bound pesticides and pesticide vapours into atmospheric moisture (cloud and fogwater, rain and snow), is a potentially major sink for airborne pesticides. Concentrations of some pesticides in fogwater can significantly exceed those expected based upon vapour-water distribution coefficients. Fogwater deposition has been implicated as a source of inadvertent residues to non-target foliage, and of high-risk exposures for raptors residing in and around treated areas”.
Spraying into a very humid environment PHoTo: eMMA LeonARD
20
We
aTH
er
eS
Se
nT
iaLS
Fo
r p
eS
TiC
ide
ap
pLiC
aTio
n
Australian agricultural regions often experience adverse daytime spraying conditions. To avoid them, many applicators resort to evening, overnight and early morning applications because temperature, humidity and winds are often most favourable at such times. However, the very
5. SurFaCe TemperaTure inverSionS
fact that temperature, humidity and wind conditions ease to acceptable levels in the evening and overnight often indicates the onset of a surface temperature inversion.
Many new product labels specifically forbid spraying during surface inversions.
What is a surface temperature inversion?A surface temperature inversion consists of layers of the atmosphere near the earth’s surface in which temperature increases with height. This is the inverse of the normal, temperature decreasing with height (Figure 24).
When the surface temperature inversion first forms, it is just a few metres deep. With progressive overnight cooling, the depth of the surface temperature inversion rapidly increases reaching a maximum at about sunrise. At this time, the inversion depth may be from a few tens of metres up to several hundreds of metres.
Inversion weatherA surface temperature inversion can be compared to a dome of colder air over the ground, which is cut off and largely insulated from the surrounding atmosphere.
Being isolated, the surface temperature inversion develops a microclimate in which weather can be significantly different from the broader weather patterns. A surface temperature inversion causes the synoptic winds to decouple from the surface and to flow over the top of the inversion at accelerated speeds.
Calm or very light wind conditions often accompany inversion conditions but winds can be quite strong especially if drainage or blocked flow develops. For example, in Australia winds in excess of 20km/h have been recorded when a surface inversion existed. SOURCE: GRAEME TEPPER
Day
Warm surface
Night
From the surface,temperature
increasesto the top ofthe inversion
Cool surface
Inversion depth
FIGURE 24 Typical vertical temperature profiles for a point in time during the night and day. The day profile typically cools with height and the night profile typically warms with height to a depth which constitutes the surface temperature inversion layer. The point where the temperature stops increasing is the top of the surface temperature inversion layer.
From the surface,temperaturedecreaseswith height
Under a surface temperature inversion air can separate into very stable layers (laminates) that can concentrate and transport airborne pesticides away from the target.
PH
oTo
: BILL G
oR
Do
n
21
We
aTH
er
eS
Se
nT
iaLS
Fo
r p
eS
TiC
ide
ap
pLiC
aTio
n
key elements of weather associated with a surface temperature inversion are:n the onset of an inversion often leads to a significant drop
in wind speed as sunset approaches, which signals the decoupling of the general winds from the surface;
n drainage winds can flow down slope and/or around obstacles with directions dictated by topographic features rather than the overriding general weather pattern;
n during the night, winds within the inversion turn to flow anticlockwise (in the Southern Hemisphere);
n a surface temperature inversion is a prerequisite to fog and frost development; and
n the decay of an inversion can be accompanied by winds stronger and gustier than the winds experienced throughout the day.
The hazards of a surface temperature inversionSurface temperature inversion conditions are unsafe for spraying as the potential for spray drift is high.
under a surface temperature inversion:n air movement tends to be laminar (not turbulent), so the
air does not mix in the same way as it does during the day;
n airborne droplets, vapours and particulates can remain concentrated in the inversion layer for long periods of time;
n the direction and distance pesticides movement is very hard to predict;
n the movement of airborne droplets will vary depending on the landscape; and
n droplets or their remnants can move next to the surface and concentrate in low-lying areas or float just above the surface (Figure 25).
Research supported by the GRDC is further investigating the development of temperature inversions and their implications in relation to spray application.
When and why does a surface temperature inversion occur?Surface inversions can result from a number of processes that cause the air closest to the ground to become cooler than the air above. The main reasons experienced in broadacre agriculture are as follows.
1. Radiation surface inversion – created by radiation cooling
While calm winds and clear skies are optimal conditions for the formation of radiation inversions they can occur anytime during the late afternoon or evening when wind speed is less than about 11km/h* and cloud cover does not severely restrict surface cooling.
Light winds and clear sky conditions certainly lead to early and rapid onset of inversion conditions which may form before sunset.
A surface temperature inversion formed by radiation cooling is often accompanied by a significant drop in wind speed in the evening. The drop is caused by the synoptic wind decoupling from the surface.
*Radiation-surface inversions may couple with cool-air advection inversions and withstand wind speeds in excess of 11km/h.
FIGURE 25 Possible movement of airborne droplets in surface temperature inversion conditions
SOURCE: GRAEME TEPPER
Wind directionBlocked windsflow along hills
Drainage winds
A
B
C
Legend
Thermals
Fine droplets, particles and vapour
Medium droplets Coarse droplets
A: High concentrations of airborne pesticides can float just above the surface and be carried away by light winds where they may impact on surfaces above the level of application.
B: Drainage winds can carry high airborne pesticides downslope into lower lying regions where they may concentrate.
C: When winds are light and a surface inversion is in decay airborne pesticides can be caught up in a complex thermal and wind shear situation causing them to be transported in different directions than indicated by surface winds.
Base of eroding capping inversion
22
We
aTH
er
eS
Se
nT
iaLS
Fo
r p
eS
TiC
ide
ap
pLiC
aTio
n
After sunset, heat radiates back into space, causing the ground to cool. In turn, the air in contact with the ground becomes cooler than the air above. This generates the surface temperature inversion.
Some soils retain heat after sunset and only cool slowly. The retention of heat, especially over sparsely vegetated ground, can delay inversion formation.
An inversion can occur within 20cm of the soil surface but not actually reach the surface due to very small-scale thermals driven by the warm earth. This situation is most likely in the early evening in calm conditions. While not well documented or understood, pesticides could become concentrated and drift in this low-level inversion, especially if vegetation cover is sparse.
Radiation inversions are the most dangerous for spraying operations as they cause airborne droplets, vapours and particles to remain concentrated at a low level for long periods. Winds within the inversion can carry airborne pesticides long distances.
2. Advection inversion – created by cool or warm air movement
Cooler, denser air can move into an area and slide under layers of less dense, warm air. This can happen when a cold front moves into an area or a sea breeze pushes cooler air inland. It can also happen when denser cool air moves down a slope and slides underneath layers of warm air in lower parts of the catchment. If this occurs, the intensity of a radiation inversion increases.
Warm air can move over cool surfaces; some of the air closest to the ground becomes cooler while the higher air stays warmer.
Transport of airborne pesticides within a surface temperature inversionTo understand the transport of airborne pesticides within a surface temperature inversion, a distinction needs to be made between surface temperature inversions forming over flat terrain and those occurring over slopes.
over flat terrain a surface temperature inversion forms when air in contact with the ground is cooled by terrestrial radiation. The inversion gradually intensifies and deepens as the surface cools. Air within the radiation inversion does not
tend to flow out of the region, but remains in place. Thus, airborne pesticides tend to float over the immediate area of application unless local winds develop to carry them away.
over gentle-sloping terrain a surface temperature inversion also forms when air in contact with the ground is cooled by terrestrial radiation. The cooled layer remains quite shallow over the slope and is typically only 2 to 10m deep because gravity continually pulls it downward, causing drainage winds.
Drainage winds occur when temperature inversions exist on slopes. Drainage winds moving cool air off-slope and into low-lying regions may initiate a surface inversion or intensify an existing one over flat terrain beyond the slope. Thus, drainage winds can transport airborne pesticides at high concentrations for long distances, downhill and also into low lying regions and valleys (Figure 25, B).
Lifecycle of a surface temperature inversionA surface temperature inversion typically begins to form just before sunset and is strongest and deepest at the time of minimum temperature, which is often just after sunrise.
Decay typically begins just after sunrise (Figure 27) as the earth begins to warm and thermals begin to erode the inversion from the surface upward, while the higher levels of the inversion remain intact as a ‘capping inversion’. In remnant capping inversion conditions, the potential for a blanket of concentrated pesticide to drift many kilometres is extremely high. If conditions at the end of the decay are unstable, pesticide may rise and diffuse into the atmosphere; if they are neutral, the pesticide will settle.
note: Figure 27 depicts a typical lifecycle, exceptions occur when transient cloud and fluctuations of wind speed vary the surface-cooling rate. For example, inversions may begin or cease anytime in the night especially if the synoptic winds are increasing or decreasing as cold fronts approach or leave an area.
Variations in the life of a surface temperature inversion requires spray applicators to continuously monitor conditions while spraying particularly at night to ensure that a surface temperature inversion has not established.
FIGURE 26 Idealised air flow during the day typically increases in speed with height and flows up and over raised terrain with stronger winds at hilltop (left). When a surface temperature inversion exists, surface winds decouple from the surface and flow over the inversion with winds accelerating (low-level jet) over the top of the inversion. Within the inversion, winds are typically light and often drain down slope, regardless of the overlying wind direction (right).
SOURCE: GRAEME TEPPER
Synoptic winds
Yellow representsan inversion layer
Low-level jet
Drainage winds
Decoupled synoptic winds
Synoptic winds
Typical wind flow during the day Typical wind flow at night with an inversion
23
We
aTH
er
eS
Se
nT
iaLS
Fo
r p
eS
TiC
ide
ap
pLiC
aTio
n
Accumulation of pesticide residues in the atmosphereIf conditions are considered appropriate for spraying, the likelihood is that many applicators will be working in a region. Consequently, spray droplets from multiple sources could be carried into the atmosphere (Figure 28).
The result is occasional excessive overloading of pesticide residues in the environment. This can be the cumulative effect of the suspension of pesticides from both day and night spraying events over a few days. This situation is especially pertinent to sustained periods of summer spraying when thermals are strong and inversions frequent.
Studies in pollution transport support the theory that pesticide residues could accumulate in the overhead air before being bought back to the surface.
Recognising a surface temperature inversionWhile it is reasonable to expect surface temperature inversions on most nights between sunset and up to an hour or so after sunrise, forecasting the exact onset and cessation times is not simple. The difficulty arises because of a number of factors, including land/water-surface variations and periodic influence of transient cloud, synoptic and local wind flow and intermittent turbulence on the variation between surface temperature and that of the air above the surface. These variations may cause the inversions to form many hours after sunset. Cessation may be many hours before sunrise. overnight the occurrence of the inversion may be sporadic.
The most common scientific method for detecting a surface temperature inversion requires the accurate
FIGURE 27 An idealised development and decay of a surface temperature inversion with no wind and clear skies. The vertical temperature profile is depicted by the red/blue line.
Mid afternoonThermals lift
airbornepesticides
SunsetAirborne pesticides
remainsuspended
Just after sunriseairborne pesticides
within theinversion
begin to rise
1 to 2 hours after sunrise
Airborne pesticidesbegin to mix
Mid morningAirborne pesticides
either begin todisperse ordescend tothe surface
SOURCE: GRAEME TEPPER
SOURCE: GRAEME TEPPER
Mid afternoonThermals at
maximum strength
Mid afternoonThermals at
maximum strength
Mid morningInversion fully eroded
Thermals wellestablished
Early morningInversion top
still in place butbase is wellabove thesurface
Near sunriseInversion at
maximum depth.Surface erosion
commences.
SunsetThermals
extinguishedby
inversion onset
Mid afternoonThermals at
maximum strength
FIGURE 28 Pesticide particles can accumulate in the atmosphere for several days before being deposited on the surface.
Figure 28 depicts a summer time fine weather situation where thermals have lofted particles into suspension well above the surface. Spraying at night when an inversion exists caused particles to be suspended near the surface. The period of transition between the night time inversion and the next day’s thermal activity can herald the mixing of both suspensions, after which they may fumigate to the surface at sufficient concentrations to cause adverse effects.

24
We
aTH
er
eS
Se
nT
iaLS
Fo
r p
eS
TiC
ide
ap
pLiC
aTio
n
measurement of the vertical temperature profile. on-farm, this is usually not practical, so most spray applicators must rely on visual and other clues.
Visual cluesSurface inversions may exist without visual indicators but some visual indicators are:n mist, fog, dew or a frost;n smoke or dust hanging in the air near to the surface; and n cumulus clouds that have built up during the that day
collapse towards evening.
Other cluesA surface temperature inversion is likely to be present if:n wind speed is constantly less than 11km/h in the evening
and overnight (be mindful that depending on local terrain and the development of local winds there may be times when an inversion exists when winds are well in excess of 11km/h);
n cool, off-slope or contour flow breezes develop; n distant sounds become clearer and easier to hear; andn aromas become more distinct in the evening.
A radiation-surface inversion is unlikely to exist if:n there is continuous overcast weather, with low and heavy
cloud;n there is continuous drizzle or rain;n wind speed is greater than 11km/h between sunset and
sunrise; n after a clear night, cumulus clouds begin to form; andn temperature rises from the minimum by at least 6oC.
Precautions for night sprayingIt is not always mandatory to stop spraying when a surface temperature inversion exists. However, operators must always aim to avoid spray drift and follow label requirements.
Guidelines for night spraying1. CRITICAL – select spray quality and spray practices to
eliminate all droplets less than 100µm.2. Avoid spraying when winds are less than 11km/h
between sunset and up to 1.5 hours* after sunrise.3. Select operating speeds not conducive to the lifting of
spray particles behind the machine.4. keep boom height low to limit atmospheric exposure and
influence on droplets.
5. Do not spray when mist or fog are evident and/or Delta T is less than 2 (Figure 23, page 18).
6. use wind meters, flags or smoke devices for wind flow and stability reference.
*1.5 hours is suggested as a precaution to limit the possibility of pesticides being lifted by thermals into the eroding and overhead inversion where they may concentrate and be transported in unpredictable directions due to wind shear.
Demons of night sprayingn Small droplets.n Vapours and particulates.n Inversion trapping and concentration.n Drainage and other local winds.n Variable wind speed and direction.
A smoke plume rises to the capping inversion before drifting in various directions far into the distance. It remains relatively concentrated even in the distance.
PH
oTo
: TeR
Re
SA
AB
eR
kA
ne
(nZ)
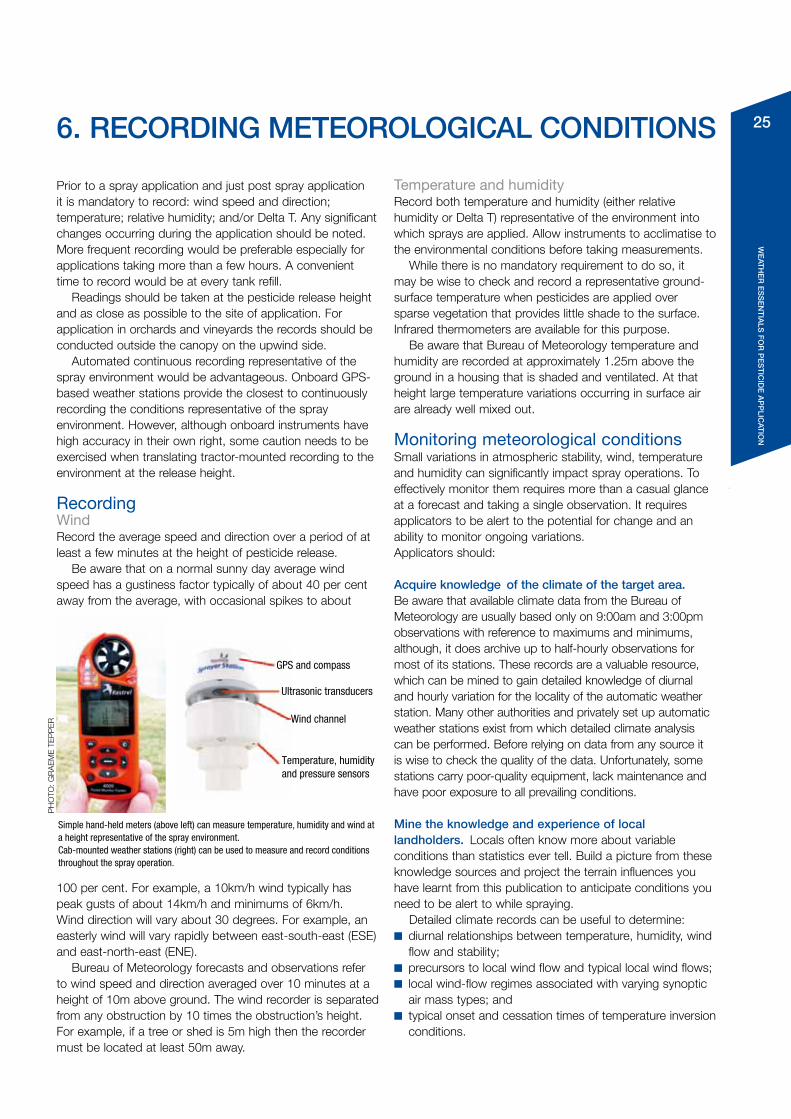
25
We
aTH
er
eS
Se
nT
iaLS
Fo
r p
eS
TiC
ide
ap
pLiC
aTio
n
Prior to a spray application and just post spray application it is mandatory to record: wind speed and direction; temperature; relative humidity; and/or Delta T. Any significant changes occurring during the application should be noted. More frequent recording would be preferable especially for applications taking more than a few hours. A convenient time to record would be at every tank refill.
Readings should be taken at the pesticide release height and as close as possible to the site of application. For application in orchards and vineyards the records should be conducted outside the canopy on the upwind side.
Automated continuous recording representative of the spray environment would be advantageous. onboard GPS-based weather stations provide the closest to continuously recording the conditions representative of the spray environment. However, although onboard instruments have high accuracy in their own right, some caution needs to be exercised when translating tractor-mounted recording to the environment at the release height.
RecordingWindRecord the average speed and direction over a period of at least a few minutes at the height of pesticide release.
Be aware that on a normal sunny day average wind speed has a gustiness factor typically of about 40 per cent away from the average, with occasional spikes to about
Temperature and humidityRecord both temperature and humidity (either relative humidity or Delta T) representative of the environment into which sprays are applied. Allow instruments to acclimatise to the environmental conditions before taking measurements.
While there is no mandatory requirement to do so, it may be wise to check and record a representative ground-surface temperature when pesticides are applied over sparse vegetation that provides little shade to the surface. Infrared thermometers are available for this purpose.
Be aware that Bureau of Meteorology temperature and humidity are recorded at approximately 1.25m above the ground in a housing that is shaded and ventilated. At that height large temperature variations occurring in surface air are already well mixed out.
Monitoring meteorological conditionsSmall variations in atmospheric stability, wind, temperature and humidity can significantly impact spray operations. To effectively monitor them requires more than a casual glance at a forecast and taking a single observation. It requires applicators to be alert to the potential for change and an ability to monitor ongoing variations. Applicators should:
acquire knowledge of the climate of the target area. Be aware that available climate data from the Bureau of Meteorology are usually based only on 9:00am and 3:00pm observations with reference to maximums and minimums, although, it does archive up to half-hourly observations for most of its stations. These records are a valuable resource, which can be mined to gain detailed knowledge of diurnal and hourly variation for the locality of the automatic weather station. Many other authorities and privately set up automatic weather stations exist from which detailed climate analysis can be performed. Before relying on data from any source it is wise to check the quality of the data. unfortunately, some stations carry poor-quality equipment, lack maintenance and have poor exposure to all prevailing conditions.
mine the knowledge and experience of local landholders. Locals often know more about variable conditions than statistics ever tell. Build a picture from these knowledge sources and project the terrain influences you have learnt from this publication to anticipate conditions you need to be alert to while spraying.
Detailed climate records can be useful to determine:n diurnal relationships between temperature, humidity, wind
flow and stability;n precursors to local wind flow and typical local wind flows;n local wind-flow regimes associated with varying synoptic
air mass types; andn typical onset and cessation times of temperature inversion
conditions.
6. reCordinG meTeoroLoGiCaL CondiTionS
GPS and compass
Ultrasonic transducers
Wind channel
Temperature, humidityand pressure sensors
Simple hand-held meters (above left) can measure temperature, humidity and wind at a height representative of the spray environment. Cab-mounted weather stations (right) can be used to measure and record conditions throughout the spray operation.
PH
oTo
: GR
Ae
Me
Te
PP
eR
100 per cent. For example, a 10km/h wind typically has peak gusts of about 14km/h and minimums of 6km/h. Wind direction will vary about 30 degrees. For example, an easterly wind will vary rapidly between east-south-east (eSe) and east-north-east (ene).
Bureau of Meteorology forecasts and observations refer to wind speed and direction averaged over 10 minutes at a height of 10m above ground. The wind recorder is separated from any obstruction by 10 times the obstruction’s height. For example, if a tree or shed is 5m high then the recorder must be located at least 50m away.

26
We
aTH
er
eS
Se
nT
iaLS
Fo
r p
eS
TiC
ide
ap
pLiC
aTio
n
Be familiar with the target field conditions and those of the surrounding area. Consider what weather variations may occur between dryland farming and irrigated areas or cotton crops adjacent to fallow paddocks. Subtle variations can alter wind-flow pattern, vary the stability of the air and subsequently the destination of drift.
acquire the latest weather forecasts and observations for as near as possible to the target. If you have access to a number of automatic weather stations around the target area then all the better because you will be able to interpret between these to hone in on a specific area of interest.

27
We
aTH
er
eS
Se
nT
iaLS
Fo
r p
eS
TiC
ide
ap
pLiC
aTio
n
Bureau of Meteorology interactive maps (www.bom.gov.au/australia/charts/viewer) – these display numerous elements of interest to spray applicators down to regional level. These numerical Weather Prediction (nWP) maps are used to guide the Bureau of Meteorology (BoM) official forecasts. The maps are produced from computer models. As they contain no input from weather forecasters, they do not include any symbols, such as cold fronts.
Four-day forecast maps (www.bom.gov.au/australia/charts/4day_col.shtml) – these may differ from interactive maps as they are manipulated by forecasters after consideration of additional data. For weather maps generated by forecasters, view the BoM official weather maps for the next four days.
Water and the Land (www.bom.gov.au/watl) – the BoM’s Water and the Land website aims to provide an integrated suite of information for people involved in primary production, natural resource management, industry, trade and commerce.
aviation Weather Services (www.bom.gov.au/aviation) – although designed for aviators this site has extremely detailed wind information.
SprayWise decisions (www.spraywisedecisions.com.au) – an initiative of nufarm, this innovative online service helps rural landholders and contractors to better plan and match the timing of agrochemical sprays to prevailing local weather conditions.
Willyweather (www.willyweather.com.au) – one of the many weather websites, this one is quite popular with growers.
agricast (www.syngenta.com.au) – a tailored weather forecast that includes spray recommendations.
Cropmate (http://cropmate.agriculture.nsw.gov.au) – a weather companion for farmers, this website helps growers analyse climate and weather information for their location. It is designed to provide timely and accurate information to help growers make informed planning and management decisions during the crop cycle.
uSeFuL reSourCeS
Bedos, C. (2002). Mass transfer of pesticides into the atmosphere by volatilization from soils and plants: review. Agronomie 22, InRA, eDP sciences, pp21-23.
Bird, S. L. (1995). A compilation of aerial spray drift field study data for low-flight agricultural application of pesticides. In environmental Fate Studies: State of the Art, 195-207. M. L. Leng, e. M. k Loevey, and P. L. Zubkoff. eds. Chelsea, Mich.: Lewis Publishers.
Glotfelty D. e. et al. (1987). Pesticides in fog. Nature. 1987 February 12-18;325(6105) pp602-5.
Gordon, B. (2011). need to re-visit the Delta T rules, Grains Research update Southern Region, April 2011.
Gordon, B. (2011). Achieving good pre-emergent spray results, GRDC, February 2011 (www.grdc.com.au/director/events/researchupdates?item_id=7A44A04eB930A310ABA21B057F32F13F).
Ramdas, L.A. and Athmanathan, S. (1932). Vertical distribution of air temperature near the ground during night. Gerland Beitrago Zur Geophsick, Vol. 37,116.
Seiber, J. B. (2002) Pesticides in Agriculture and the Environment. CRC Press.
unsworth, J. B. et al. (1999). Significance of the long-range transport of pesticides in the atmosphere. Pure Appl. Chem., Vol. 71, no. 7, pp1359–1383.
Victorian Department of Primary Industries (2010). Volatile Vapour Drift Risk. Ag note AG1217. Published: october 2005. updated: April 2010.
reFerenCeS

GRDC, PO Box 5367, Kingston ACT 2604 T 02 6166 4500 F 02 6166 4599