
Weather, climate and health Simon Lloyd London School of Hygiene and Tropical Medicine.
42
Weather, climate and health Simon Lloyd London School of Hygiene and Tropical Medicine
-
date post
18-Dec-2015 -
Category
Documents
-
view
216 -
download
2
Transcript of Weather, climate and health Simon Lloyd London School of Hygiene and Tropical Medicine.
Weather, climate and health
Simon LloydLondon School of Hygiene
and Tropical Medicine
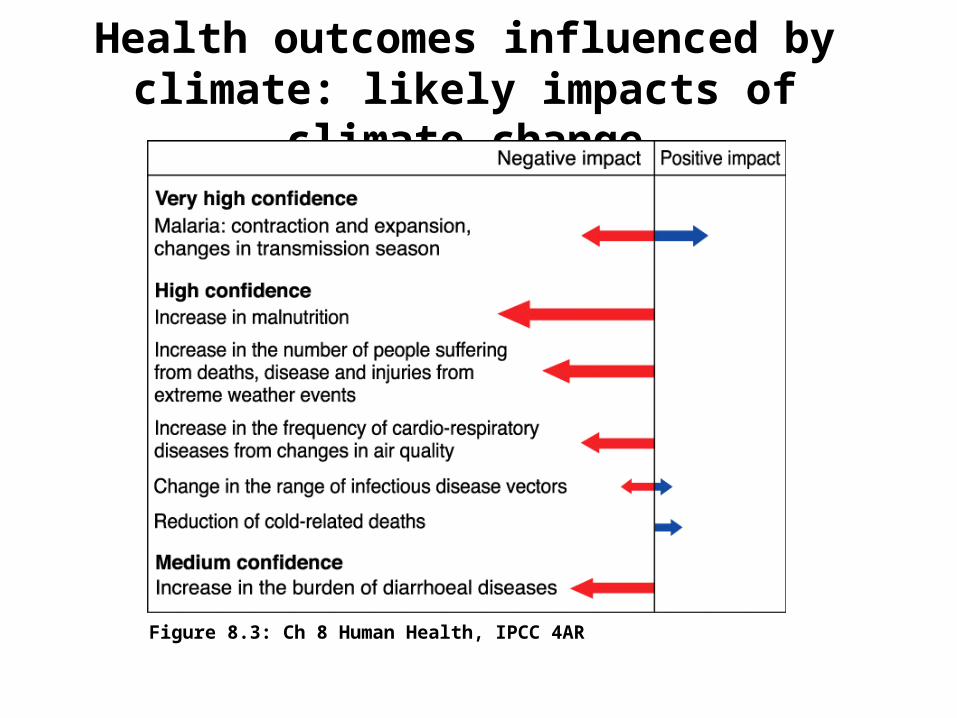
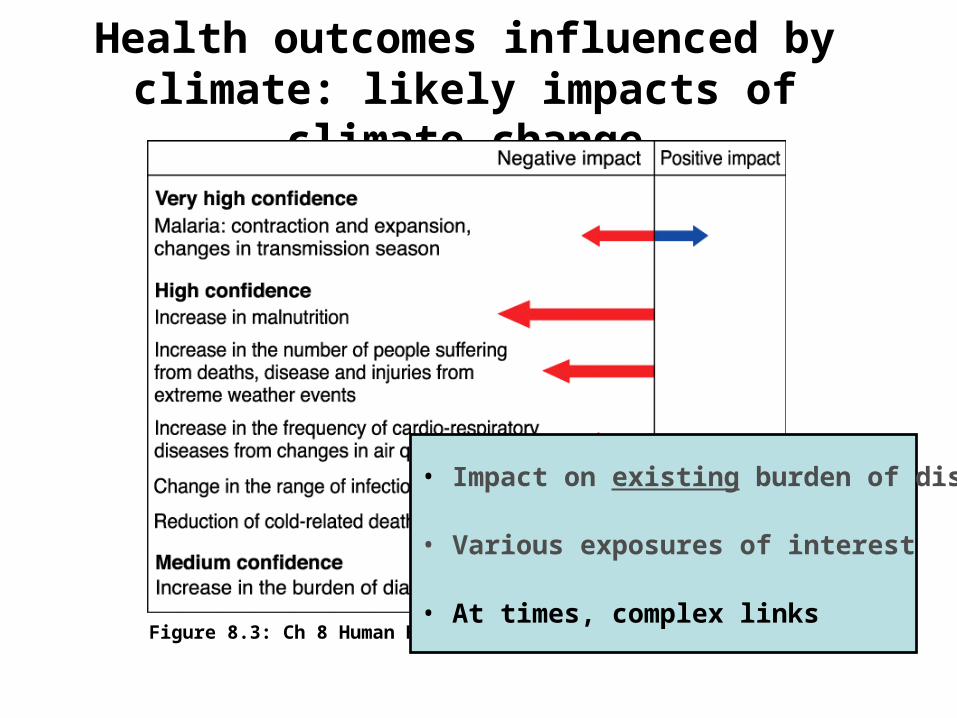
Health outcomes influenced by climate: likely impacts of climate change
Figure 8.3: Ch 8 Human Health, IPCC 4AR
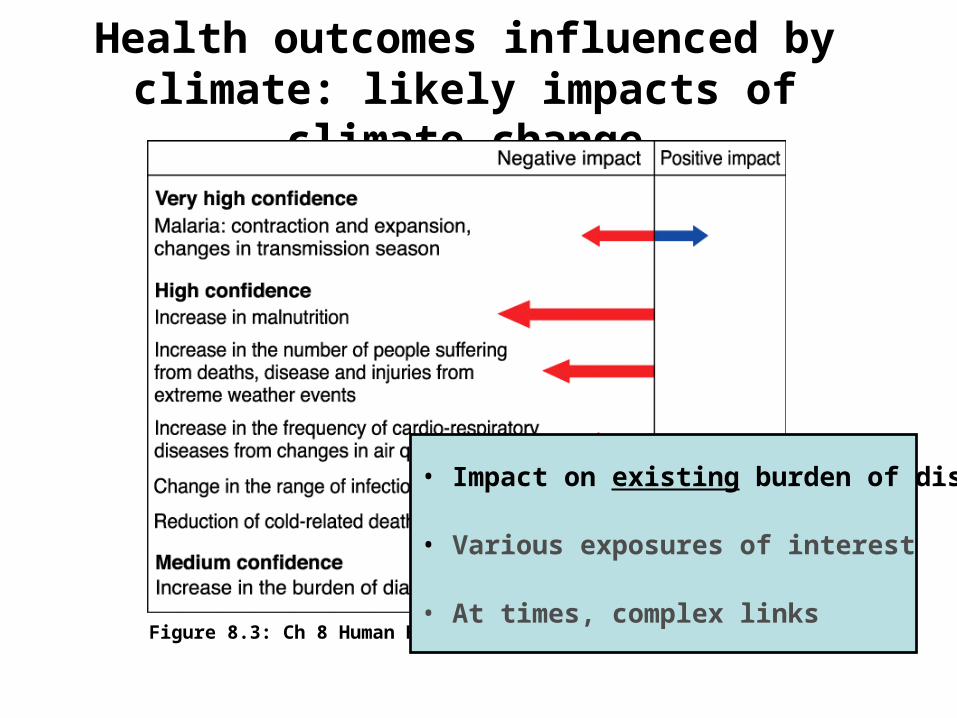
Health outcomes influenced by climate: likely impacts of climate change
Figure 8.3: Ch 8 Human Health, IPPC 4AR
• Impact on existing burden of disease
• Various exposures of interest
• At times, complex links
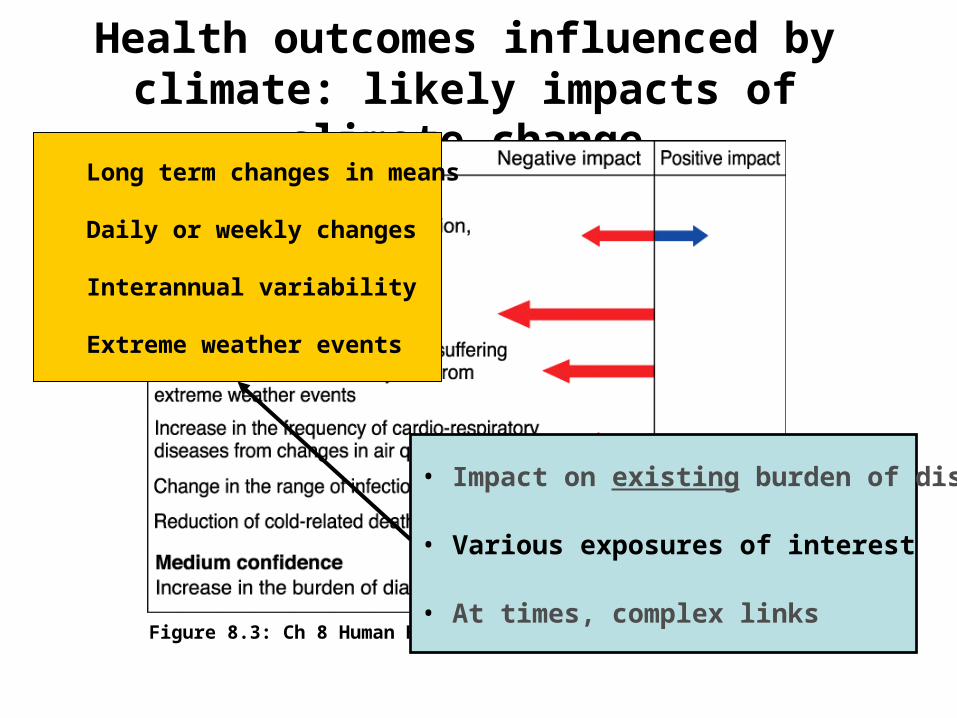
Health outcomes influenced by climate: likely impacts of climate change
Figure 8.3: Ch 8 Human Health, IPPC 4AR
• Impact on existing burden of disease
• Various exposures of interest
• At times, complex links
Long term changes in means
Daily or weekly changes
Interannual variability
Extreme weather events
Health outcomes influenced by climate: likely impacts of climate change
Figure 8.3: Ch 8 Human Health, IPPC 4AR
• Impact on existing burden of disease
• Various exposures of interest
• At times, complex links
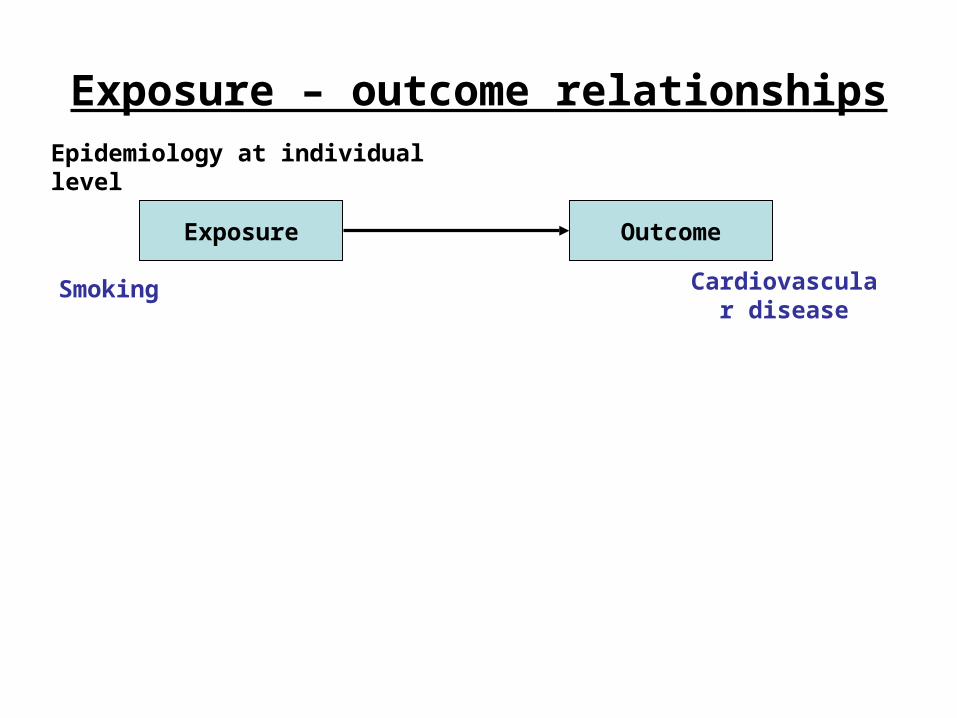
Exposure – outcome relationships
Exposure
Epidemiology at individual level
Outcome
Smoking Cardiovascular disease

Exposure – outcome relationships
Exposure
Epidemiology at individual level
Outcome
Smoking Cardiovascular disease
Weather/climate and health:
• Exposure at population level
• Pathway (often) indirect and complex
• Impact moderated by vulnerability
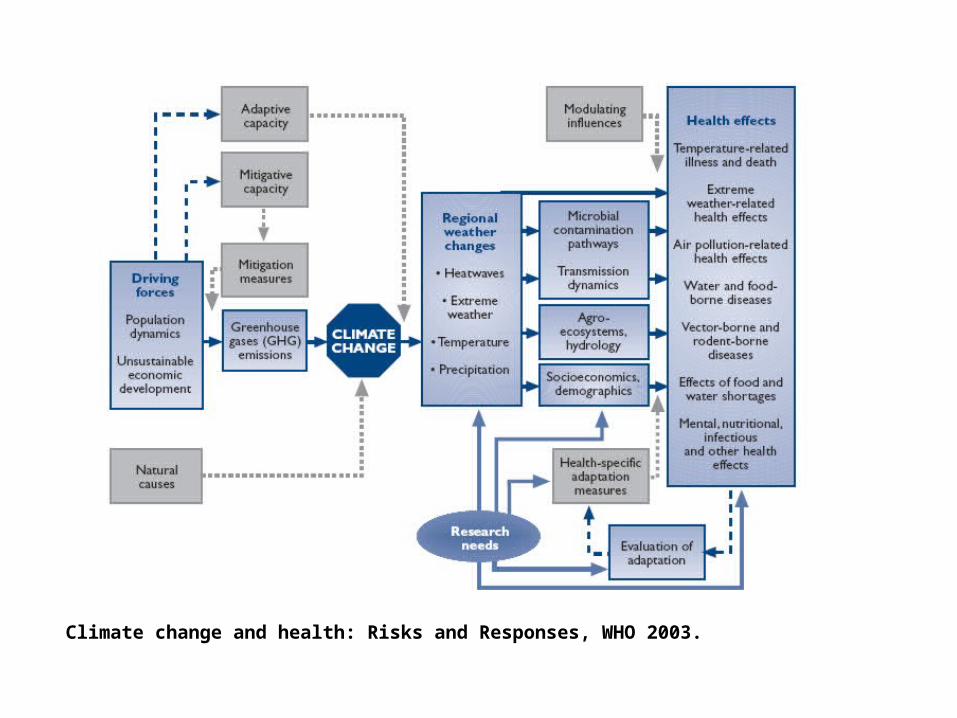
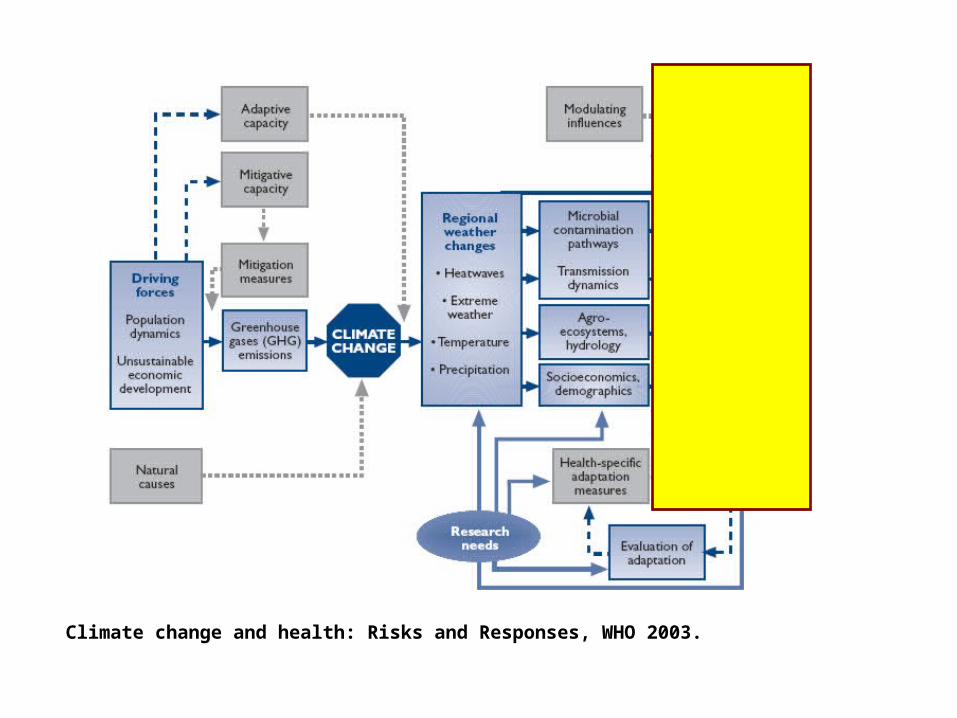
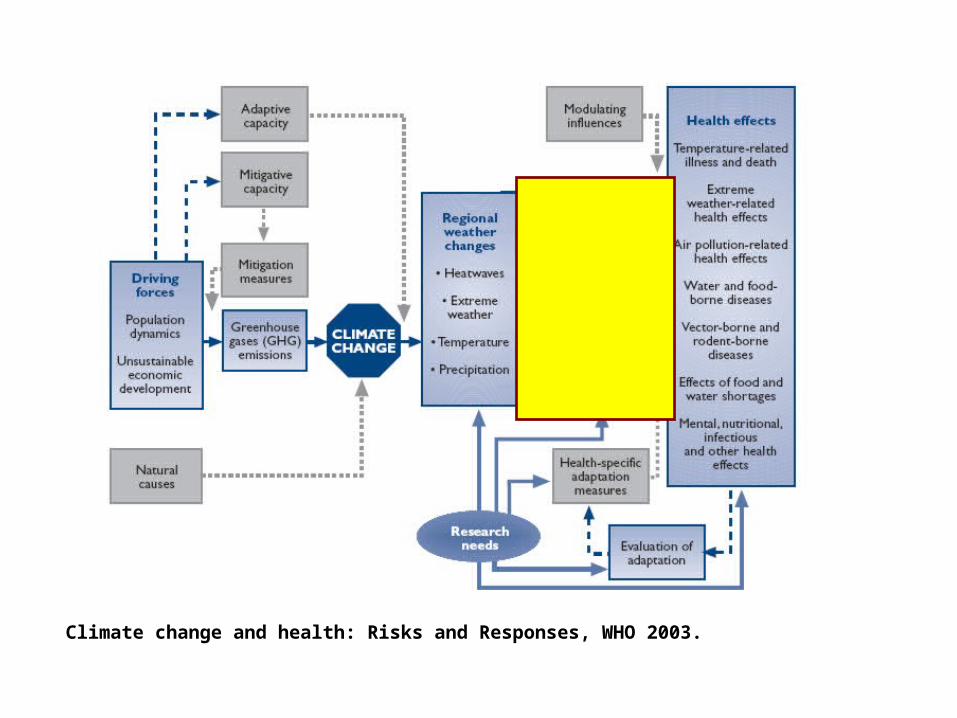
Climate change and health: Risks and Responses, WHO 2003.
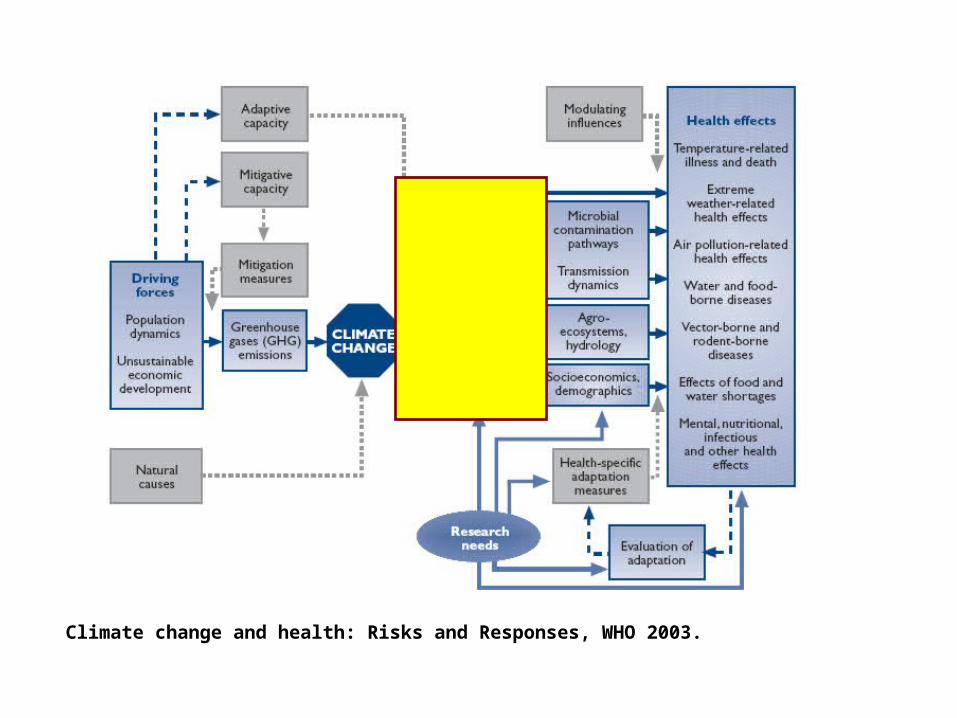
Climate change and health: Risks and Responses, WHO 2003.
Climate change and health: Risks and Responses, WHO 2003.
Climate change and health: Risks and Responses, WHO 2003.
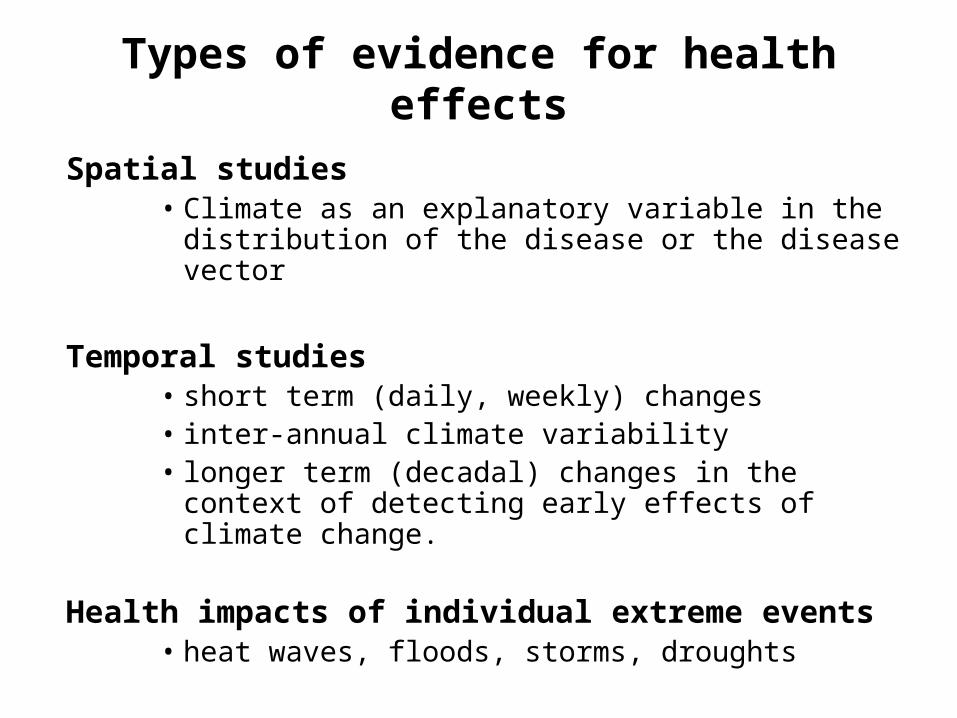
Types of evidence for health effects
Spatial studies• Climate as an explanatory variable in the distribution of
the disease or the disease vector
Temporal studies• short term (daily, weekly) changes • inter-annual climate variability • longer term (decadal) changes in the context of
detecting early effects of climate change.
Health impacts of individual extreme events• heat waves, floods, storms, droughts
Diarrhoea and average weather
Diarrhoea and average weather
Diarrhoea rates
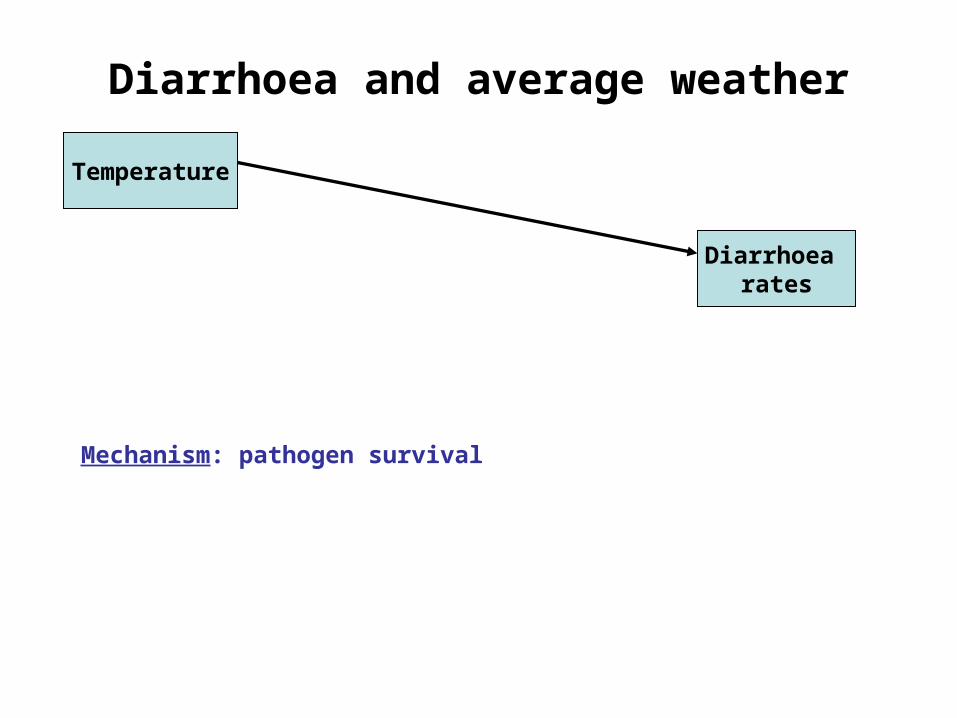
Diarrhoea and average weather
Temperature
Diarrhoea rates
Mechanism: pathogen survival
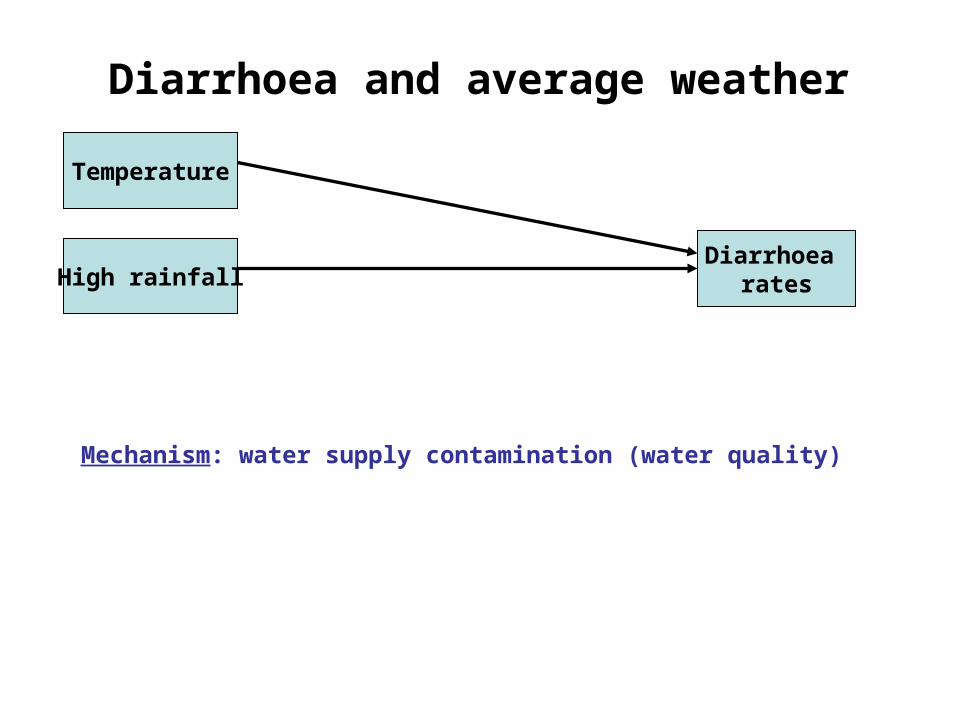
Diarrhoea and average weather
Temperature
Diarrhoea ratesHigh rainfall
Mechanism: water supply contamination (water quality)
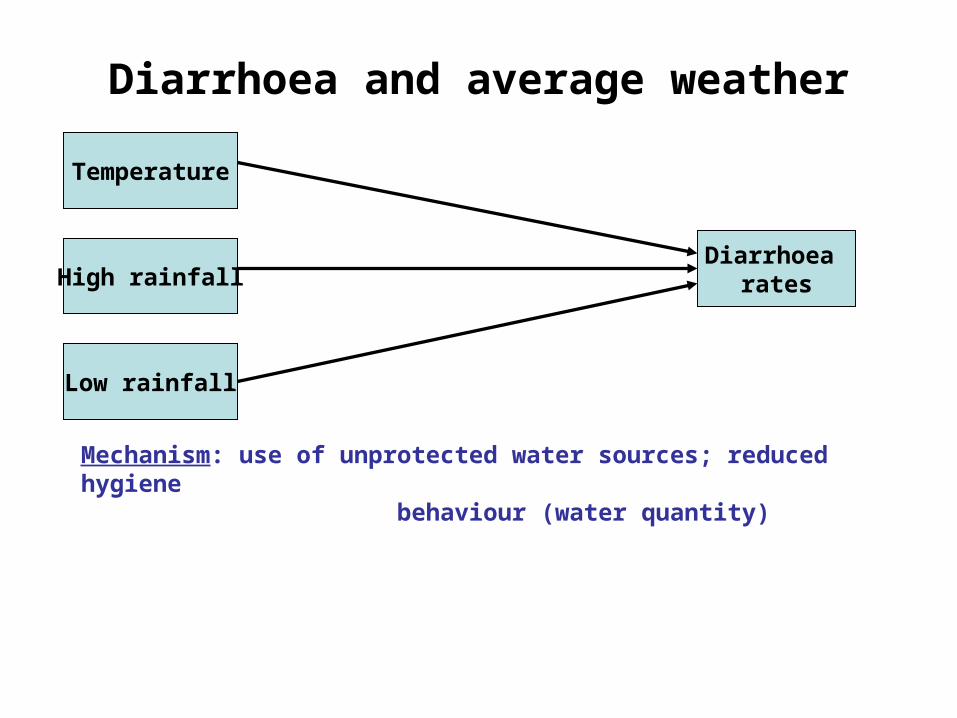
Diarrhoea and average weather
Temperature
Diarrhoea ratesHigh rainfall
Low rainfall
Mechanism: use of unprotected water sources; reduced hygiene behaviour (water quantity)
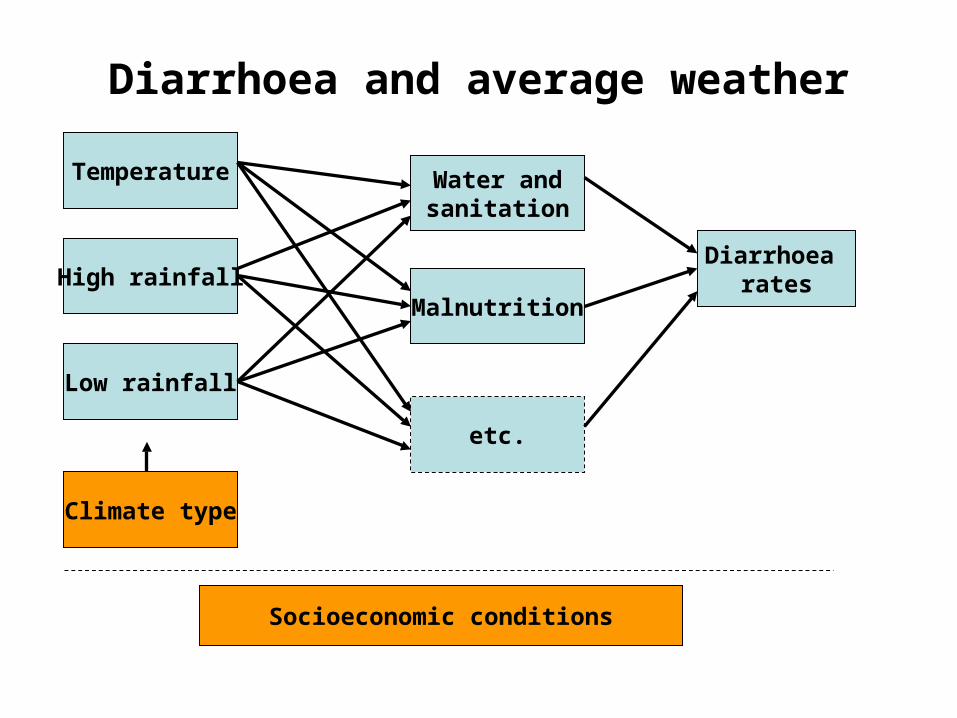
Diarrhoea and average weather
Temperature
Diarrhoea ratesHigh rainfall
Low rainfall
Water andsanitation
Malnutrition
etc.
Climate type
Socioeconomic conditions

Data
Outcome
Exposure
Co-variates
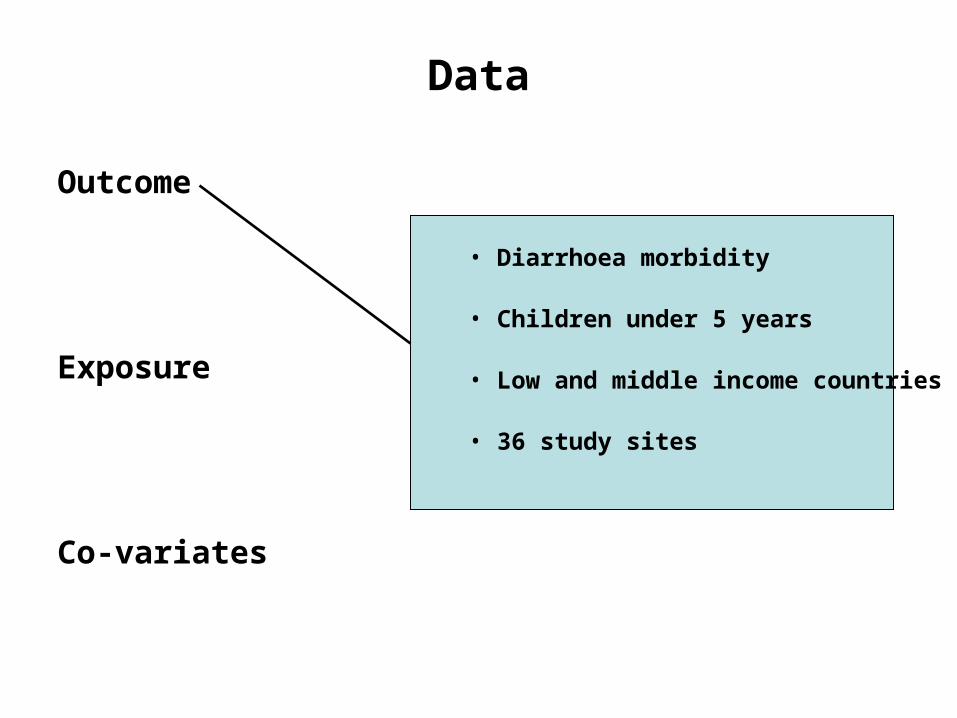
Data
Outcome
Exposure
Co-variates
• Diarrhoea morbidity
• Children under 5 years
• Low and middle income countries
• 36 study sites
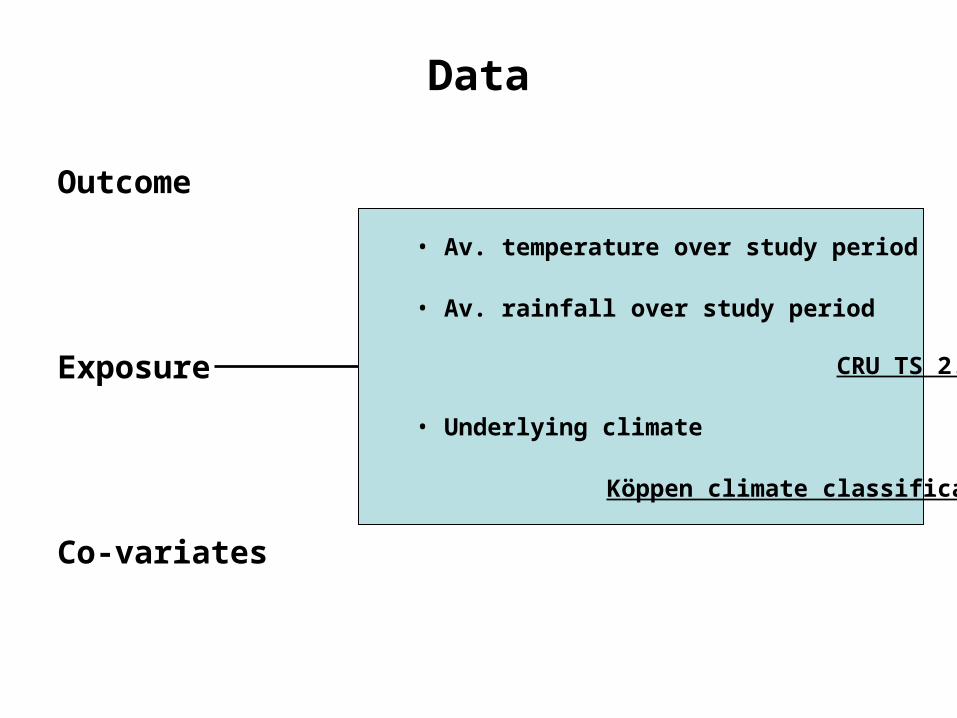
Data
Outcome
Exposure
Co-variates
• Av. temperature over study period
• Av. rainfall over study period
CRU TS 2.1 dataset
• Underlying climate
Köppen climate classification
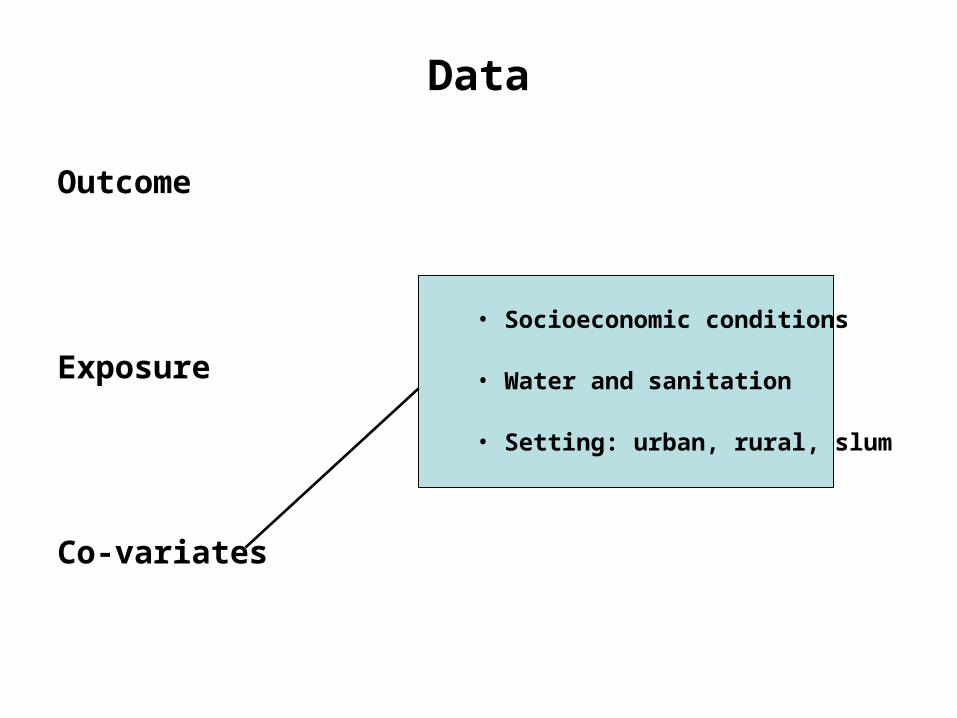
Data
Outcome
Exposure
Co-variates
• Socioeconomic conditions
• Water and sanitation
• Setting: urban, rural, slum
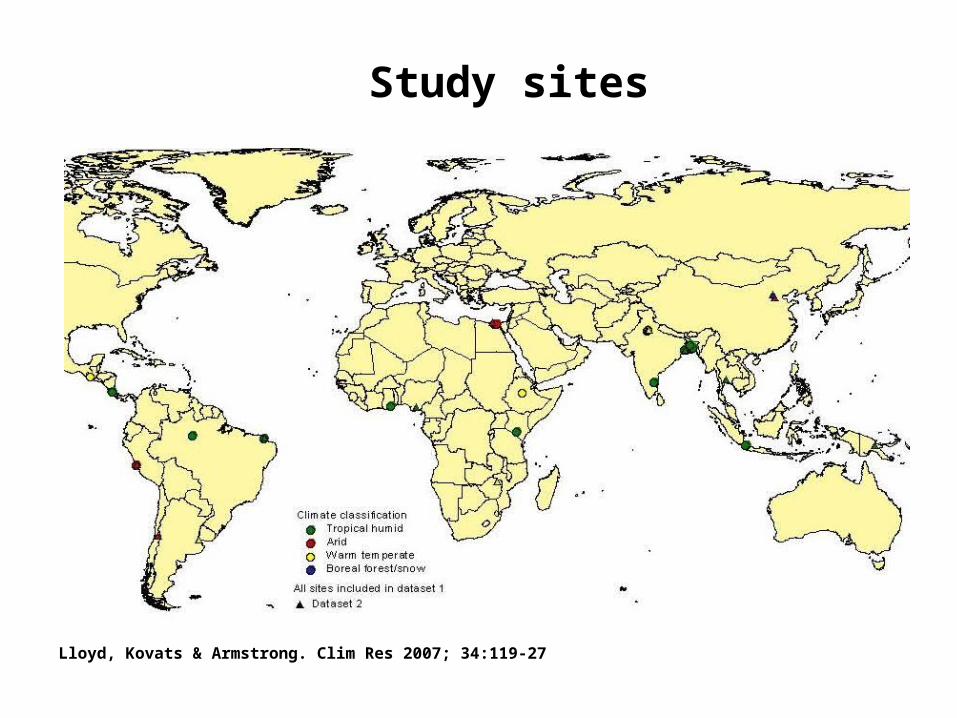
Study sites
Lloyd, Kovats & Armstrong. Clim Res 2007; 34:119-27
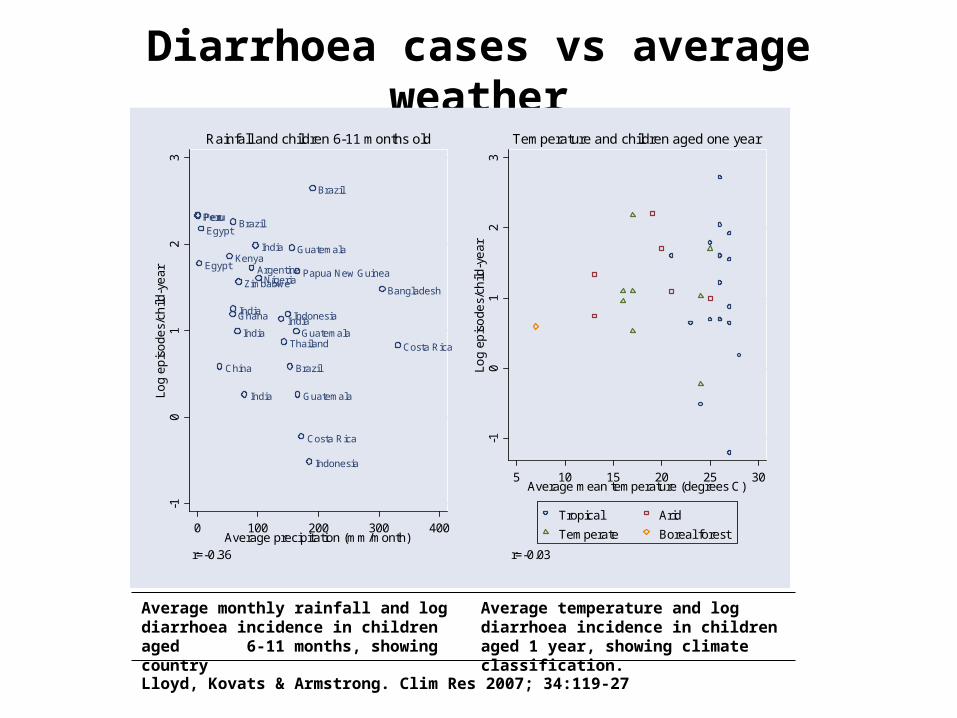
Diarrhoea cases vs average weather
Guatemala
Costa Rica
Indonesia
Guatemala
India
India
India Guatemala
Indonesia
Kenya
Brazil
Brazil
Egypt
Ghana
Bangladesh
Peru
Costa Rica
Nigeria
India
Brazil
Argentina
Peru
Zimbabwe
Thailand
Papua New Guinea
China
India
Egypt
-10
12
3Lo
g ep
iso
des/
child
-ye
ar
0 100 200 300 400Average precipitation (mm/month)
r=-0.36
Rainfall and children 6-11 months old
-10
12
3Lo
g ep
iso
des/
child
-ye
ar5 10 15 20 25 30
Average mean temperature (degrees C)
Tropical Arid
Temperate Boreal forest
r=-0.03
Temperature and children aged one year
Average monthly rainfall and log diarrhoea incidence in children aged 6-11 months, showing country
Average temperature and log diarrhoea incidence in children aged 1 year, showing climate classification.
Lloyd, Kovats & Armstrong. Clim Res 2007; 34:119-27
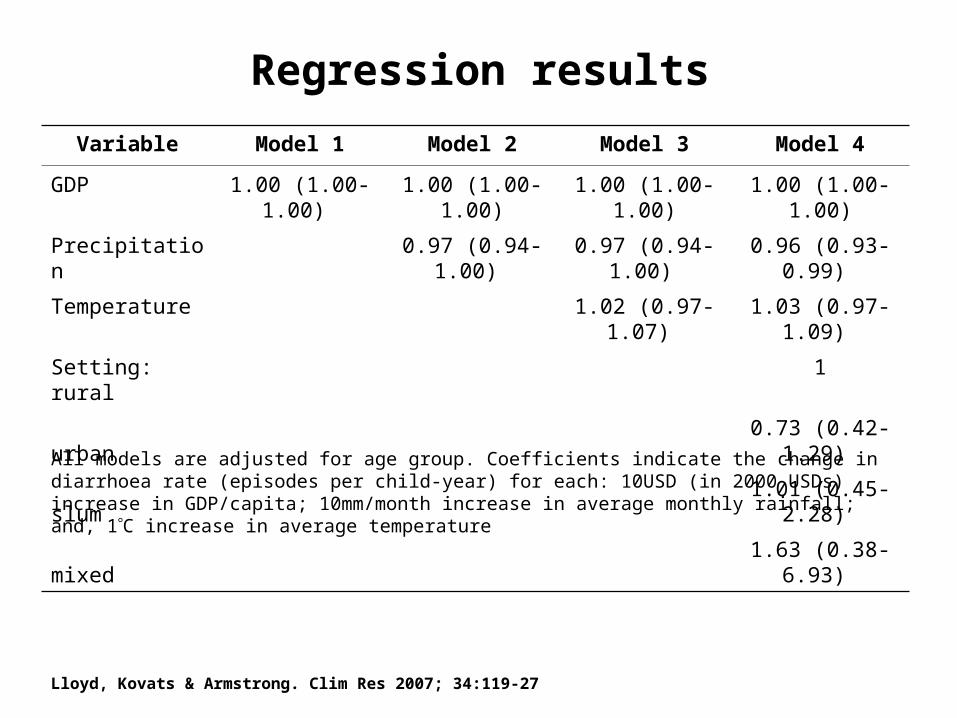
Regression results
Variable Model 1 Model 2 Model 3 Model 4
GDP 1.00 (1.00-1.00) 1.00 (1.00-1.00) 1.00 (1.00-1.00) 1.00 (1.00-1.00)
Precipitation 0.97 (0.94-1.00) 0.97 (0.94-1.00) 0.96 (0.93-0.99)
Temperature 1.02 (0.97-1.07) 1.03 (0.97-1.09)
Setting: rural 1
urban 0.73 (0.42-1.29)
slum 1.01 (0.45-2.28)
mixed 1.63 (0.38-6.93)
All models are adjusted for age group. Coefficients indicate the change in diarrhoea rate (episodes per child-year) for each: 10USD (in 2000 USDs) increase in GDP/capita; 10mm/month increase in average monthly rainfall; and, 1C increase in average temperature
Lloyd, Kovats & Armstrong. Clim Res 2007; 34:119-27
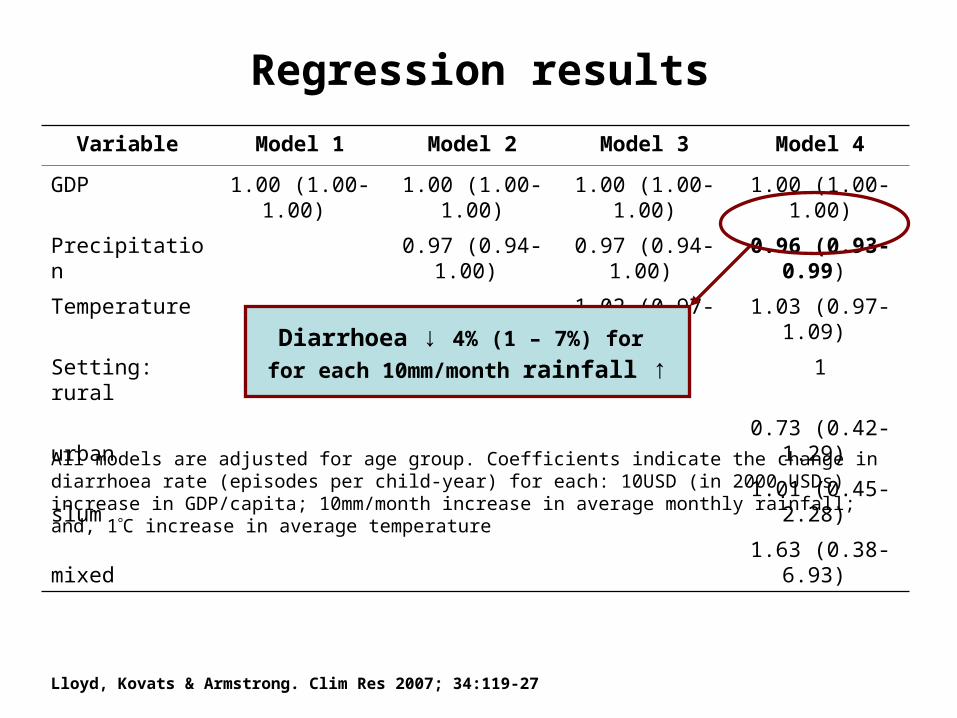
Regression results
Variable Model 1 Model 2 Model 3 Model 4
GDP 1.00 (1.00-1.00) 1.00 (1.00-1.00) 1.00 (1.00-1.00) 1.00 (1.00-1.00)
Precipitation 0.97 (0.94-1.00) 0.97 (0.94-1.00) 0.96 (0.93-0.99)
Temperature 1.02 (0.97-1.07) 1.03 (0.97-1.09)
Setting: rural 1
urban 0.73 (0.42-1.29)
slum 1.01 (0.45-2.28)
mixed 1.63 (0.38-6.93)
All models are adjusted for age group. Coefficients indicate the change in diarrhoea rate (episodes per child-year) for each: 10USD (in 2000 USDs) increase in GDP/capita; 10mm/month increase in average monthly rainfall; and, 1C increase in average temperature
Diarrhoea ↓ 4% (1 – 7%) for
for each 10mm/month rainfall ↑
Lloyd, Kovats & Armstrong. Clim Res 2007; 34:119-27
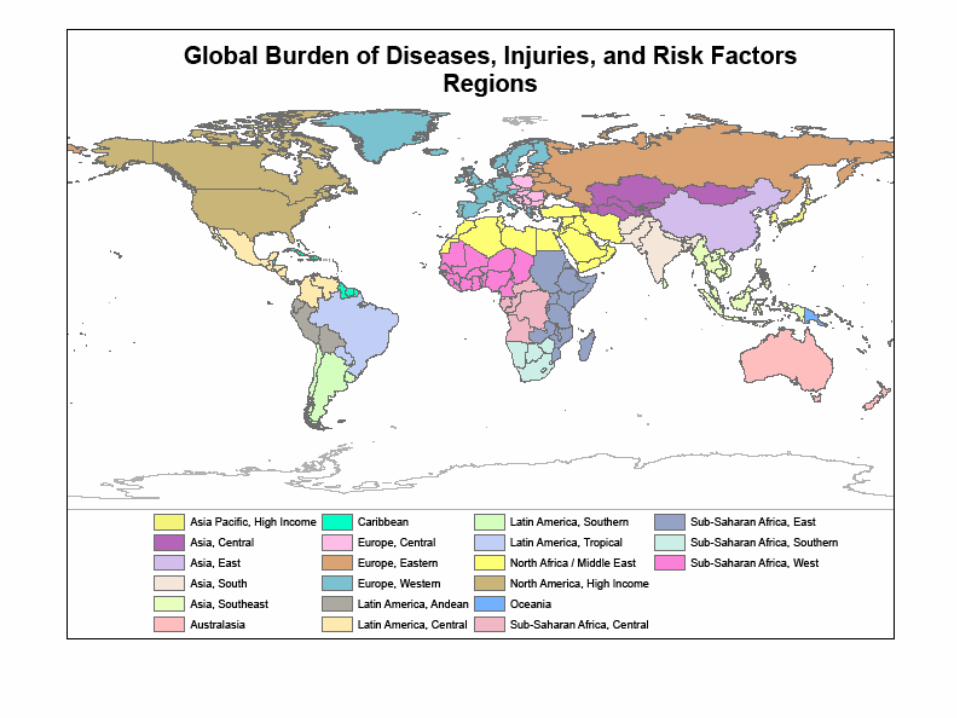
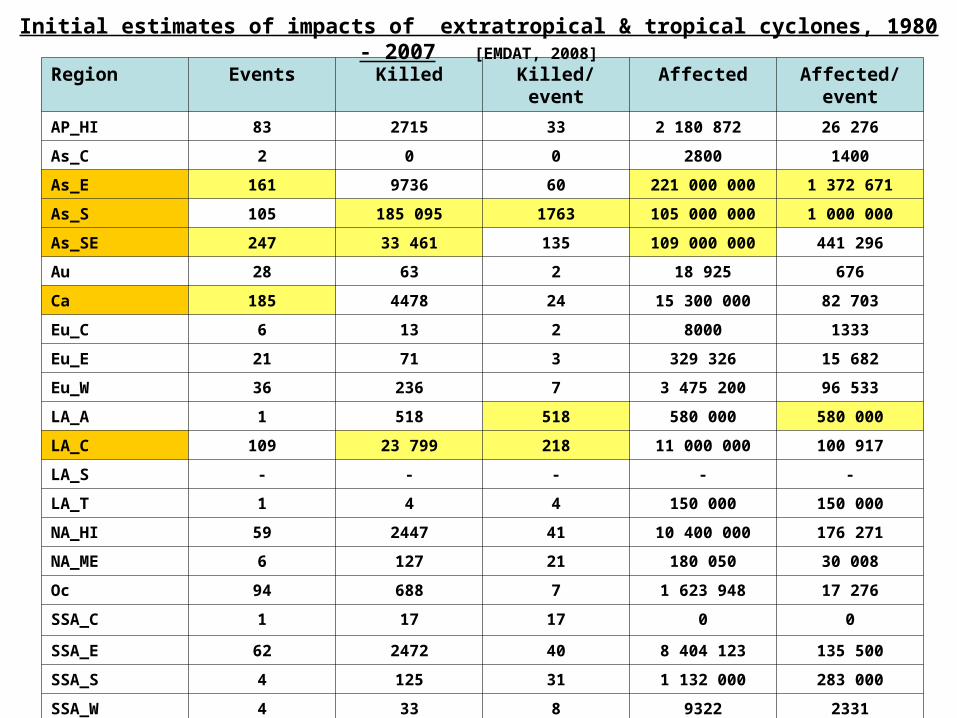
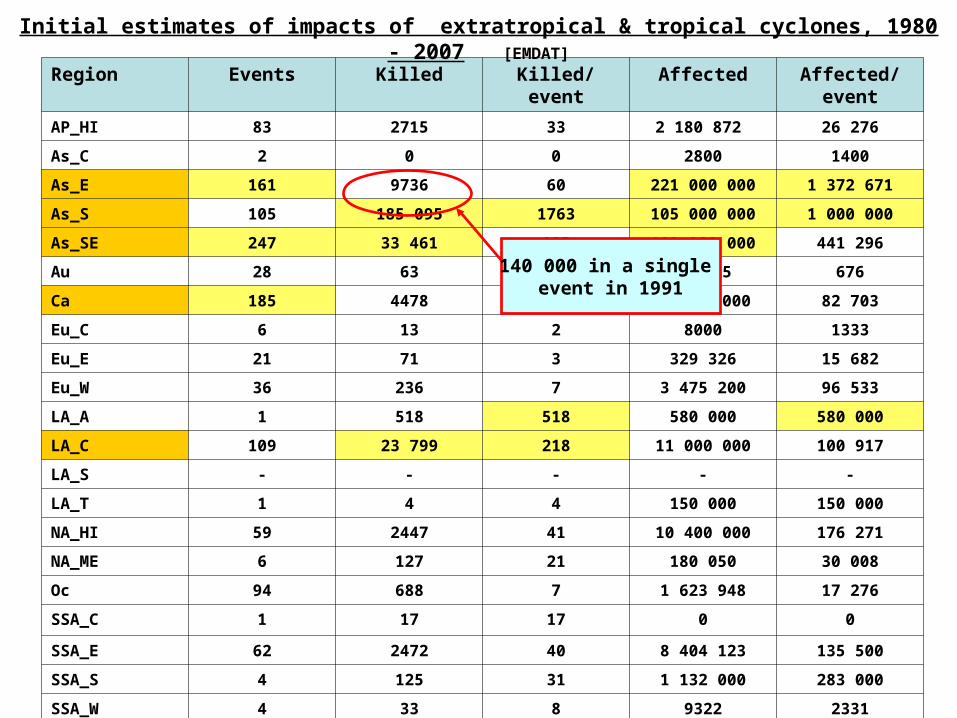
Extreme events: coastal flooding
• Spatial scale– WHO GBD regions
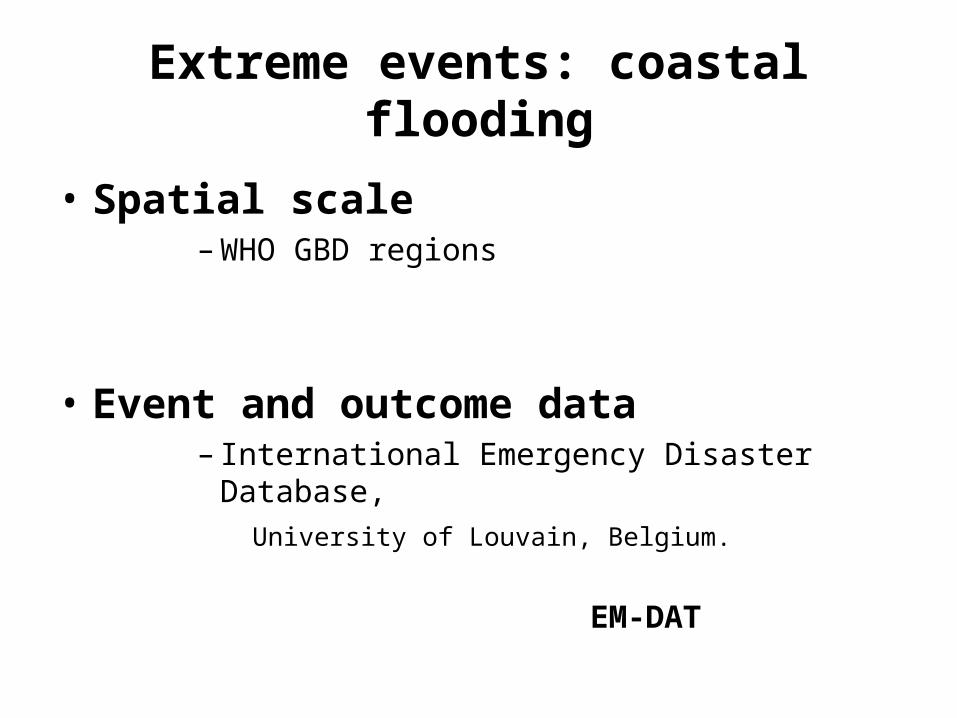
Extreme events: coastal flooding
• Spatial scale– WHO GBD regions
• Event and outcome data– International Emergency Disaster Database,
University of Louvain, Belgium.
EM-DAT
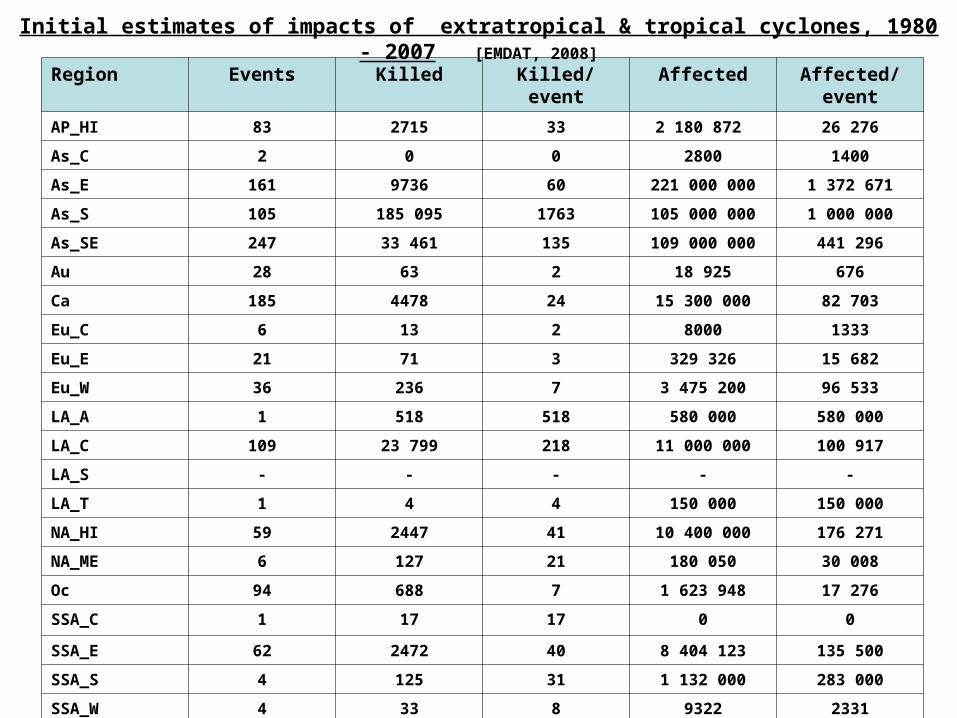
Region Events Killed Killed/event Affected Affected/event
AP_HI 83 2715 33 2 180 872 26 276
As_C 2 0 0 2800 1400
As_E 161 9736 60 221 000 000 1 372 671
As_S 105 185 095 1763 105 000 000 1 000 000
As_SE 247 33 461 135 109 000 000 441 296
Au 28 63 2 18 925 676
Ca 185 4478 24 15 300 000 82 703
Eu_C 6 13 2 8000 1333
Eu_E 21 71 3 329 326 15 682
Eu_W 36 236 7 3 475 200 96 533
LA_A 1 518 518 580 000 580 000
LA_C 109 23 799 218 11 000 000 100 917
LA_S - - - - -
LA_T 1 4 4 150 000 150 000
NA_HI 59 2447 41 10 400 000 176 271
NA_ME 6 127 21 180 050 30 008
Oc 94 688 7 1 623 948 17 276
SSA_C 1 17 17 0 0
SSA_E 62 2472 40 8 404 123 135 500
SSA_S 4 125 31 1 132 000 283 000
SSA_W 4 33 8 9322 2331
Initial estimates of impacts of extratropical & tropical cyclones, 1980 - 2007 [EMDAT, 2008]
Region Events Killed Killed/event Affected Affected/event
AP_HI 83 2715 33 2 180 872 26 276
As_C 2 0 0 2800 1400
As_E 161 9736 60 221 000 000 1 372 671
As_S 105 185 095 1763 105 000 000 1 000 000
As_SE 247 33 461 135 109 000 000 441 296
Au 28 63 2 18 925 676
Ca 185 4478 24 15 300 000 82 703
Eu_C 6 13 2 8000 1333
Eu_E 21 71 3 329 326 15 682
Eu_W 36 236 7 3 475 200 96 533
LA_A 1 518 518 580 000 580 000
LA_C 109 23 799 218 11 000 000 100 917
LA_S - - - - -
LA_T 1 4 4 150 000 150 000
NA_HI 59 2447 41 10 400 000 176 271
NA_ME 6 127 21 180 050 30 008
Oc 94 688 7 1 623 948 17 276
SSA_C 1 17 17 0 0
SSA_E 62 2472 40 8 404 123 135 500
SSA_S 4 125 31 1 132 000 283 000
SSA_W 4 33 8 9322 2331
Initial estimates of impacts of extratropical & tropical cyclones, 1980 - 2007 [EMDAT]
140 000 in a single event in 1991
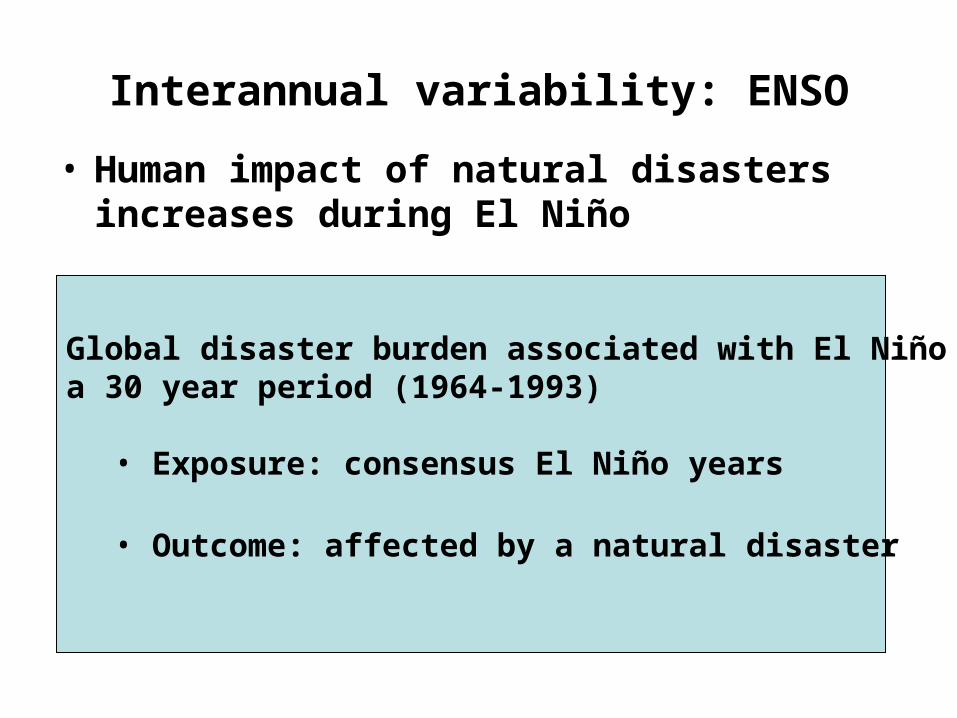
Interannual variability: ENSO
• Human impact of natural disasters increases during El Niño
• ENSO associated with infectious diseases in some areas, esp cholera risk and malaria epidemics
• ENSO and seasonal climate forecasts may have public health use
Interannual variability: ENSO
• Human impact of natural disasters increases during El Niño
• ENSO associated with infectious diseases in some areas, esp cholera risk and malaria epidemics
• ENSO and seasonal climate forecasts may have public health use
Global disaster burden associated with El Niño over a 30 year period (1964-1993)
• Exposure: consensus El Niño years
• Outcome: affected by a natural disaster
0
10
20
30
40
50
60
70
8019
64
1966
1968
1970
1972
1974
1976
1978
1980
1982
1984
1986
1988
1990
1992
Inci
denc
e pe
r 10
00
El Niño years
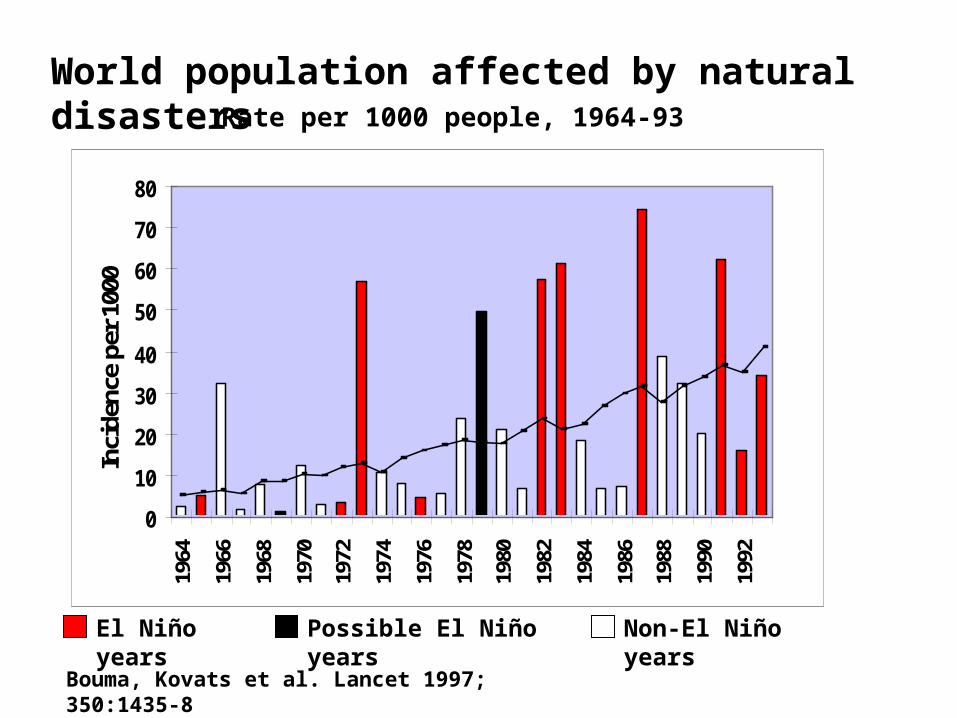
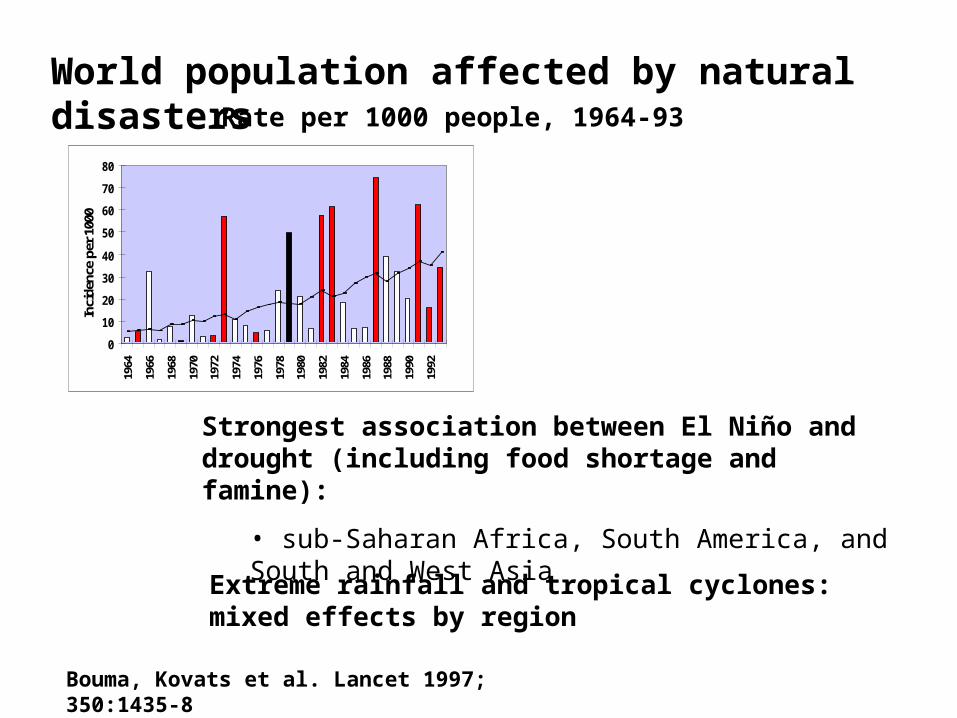
World population affected by natural disasters
Possible El Niño years Non-El Niño years
Rate per 1000 people, 1964-93
Bouma, Kovats et al. Lancet 1997; 350:1435-8
0
10
20
30
40
50
60
70
80
1964
1966
1968
1970
1972
1974
1976
1978
1980
1982
1984
1986
1988
1990
1992
Inci
denc
e pe
r 10
00World population affected by natural disasters
Rate per 1000 people, 1964-93
Bouma, Kovats et al. Lancet 1997; 350:1435-8
Strongest association between El Niño and drought (including food shortage and famine):
• sub-Saharan Africa, South America, and South and West Asia
Extreme rainfall and tropical cyclones: mixed effects by region
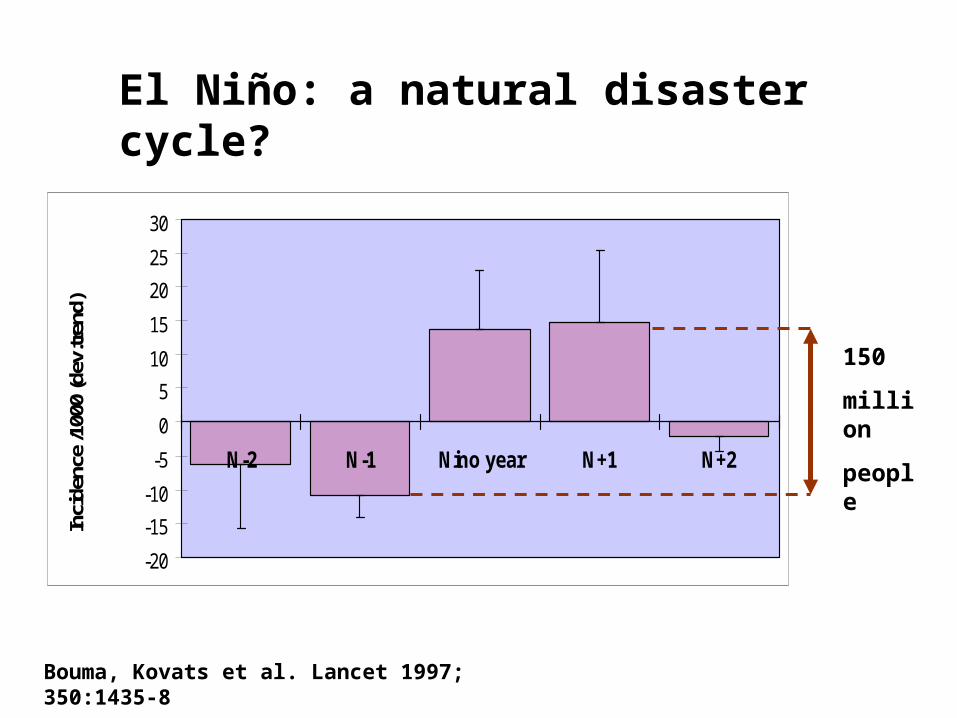
-20
-15
-10
-5
0
5
10
15
20
25
30
N-2 N-1 Nino year N+1 N+2
Inci
denc
e /1
000
(dev
.tren
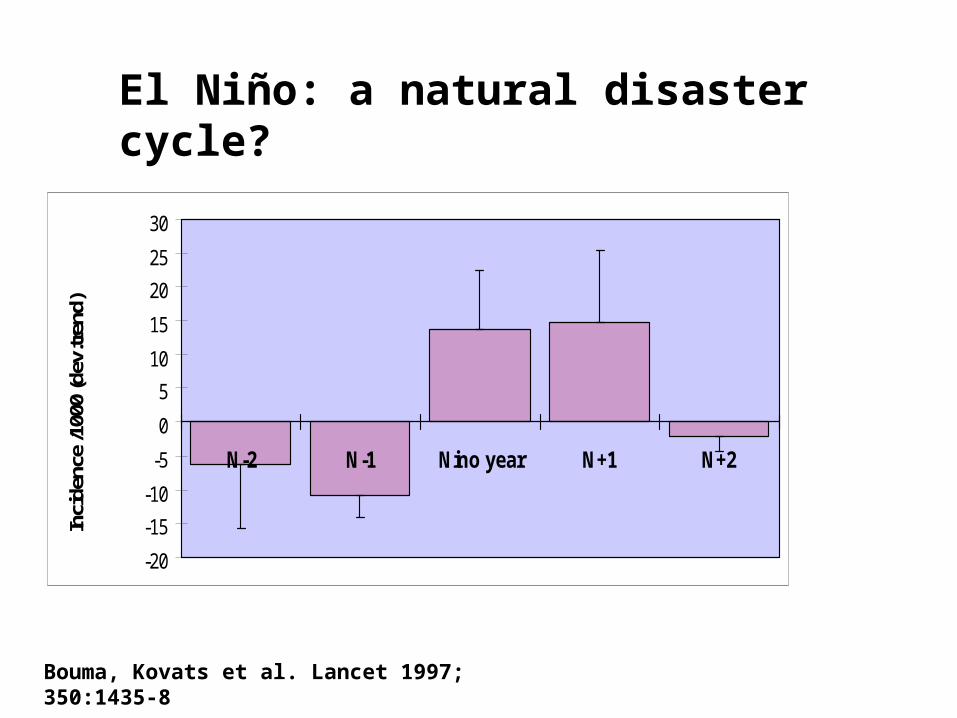
d)El Niño: a natural disaster cycle?
Bouma, Kovats et al. Lancet 1997; 350:1435-8
-20
-15
-10
-5
0
5
10
15
20
25
30
N-2 N-1 Nino year N+1 N+2
Inci
denc
e /1
000
(dev
.tren
d)
150
million
people
El Niño: a natural disaster cycle?
Bouma, Kovats et al. Lancet 1997; 350:1435-8
Climate and respiratory health in children
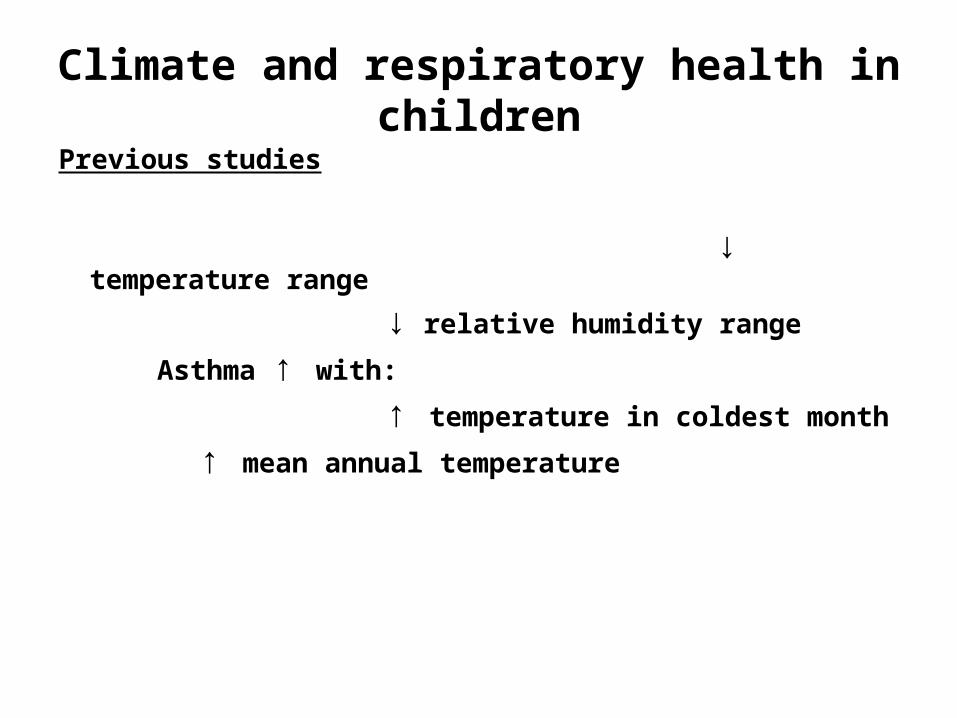
Climate and respiratory health in children
Previous studies
↓ temperature range
↓ relative humidity range
Asthma ↑ with:
↑ temperature in coldest month
↑ mean annual temperature
Data needs and queries
• How well does data represent climate at particular study sites?
• Are there areas that are not well represented?
• Can data be used to quantify elements of events?• E.g. rainfall in floods; extent, intensity & duration of drought.
• How well are ENSO events and their associated impacts on climate events represented?


