Weakened Anomalous Western North Pacific Anticyclone ...
18
Weakened Anomalous Western North Pacific Anticyclone during an El Niño–Decaying Summer under a Warmer Climate: Dominant Role of the Weakened Impact of the Tropical Indian Ocean on the Atmosphere CHAO HE Institute for Environmental and Climate Research, Jinan University, Guangzhou, China TIANJUN ZHOU State Key Laboratory of Numerical Modeling for Atmospheric Sciences and Geophysical Fluid Dynamics (LASG), Institute of Atmospheric Physics, Chinese Academy of Sciences, Beijing, China TIM LI Key Laboratory of Meteorological Disaster of Ministry of Education, Nanjing University of Information Science and Technology, Nanjing, China (Manuscript received 19 January 2018, in final form 7 August 2018) ABSTRACT The western North Pacific subtropical anticyclone (WNPAC) is the most prominent atmospheric circula- tion anomaly over the subtropical Northern Hemisphere during the decaying summer of an El Niño event. Based on a comparison between the RCP8.5 and the historical experiments of 30 coupled models from the CMIP5, we show evidence that the anomalous WNPAC during the El Niño–decaying summer is weaker in a warmer climate although the amplitude of the El Niño remains generally unchanged. The weakened impact of the sea surface temperature anomaly (SSTA) over the tropical Indian Ocean (TIO) on the atmosphere is essential for the weakened anomalous WNPAC. In a warmer climate, the warm tropospheric temperature (TT) anomaly in the tropical free troposphere stimulated by the El Niño–related SSTA is enhanced through stronger moist adiabatic adjustment in a warmer mean state, even if the SSTA of El Niño is unchanged. But the amplitude of the warm SSTA over TIO remains generally unchanged in an El Niño–decaying summer, the static stability of the boundary layer over TIO is increased, and the positive rainfall anomaly over TIO is weakened. As a result, the warm Kelvin wave emanating from TIO is weakened because of a weaker latent heating anomaly over TIO, which is responsible for the weakened WNPAC anomaly. Numerical experiments support the weakened sensitivity of precipitation anomaly over TIO to local SSTA under an increase of mean- state SST and its essential role in the weakened anomalous WNPAC, independent of any change in the SSTA. 1. Introduction In the decaying summer of an El Niño event (i.e., half a year after the peak phase of El Niño in boreal winter), the subtropical western North Pacific (WNP) is usually controlled by a large-scale anticyclone anomaly (e.g., Zhang et al. 1999; Li et al. 2017; Zhang et al. 2017). This anomalous anticyclone is called the western North Pacific anticyclone (WNPAC), and it forms in the winter of the peak phase of El Niño and persists into the de- caying summer after El Niño(Wang et al. 2000; Stuecker et al. 2015; Wu et al. 2017). In summer, the anomalous WNPAC modulates water vapor transport into East Asia and brings excessive rainfall along the Yangtze River valley, but deficient rainfall in both South China and North China (Chang et al. 2000; Li et al. 2014; Zhang et al. 2016; Zhang et al. 2017). El Niño usually peaks in winter and decays in spring, and most El Niño events disappear in the summer of its decaying year. Because the atmosphere responds quickly to underlying SST anomalies, and the memory of the atmosphere is shorter than 1 month, how does the Supplemental information related to this paper is available at the Journals Online website: https://doi.org/10.1175/JCLI- D-18-0033.s1. Corresponding author: Dr. Chao He, [email protected] 1JANUARY 2019 HE ET AL. 213 DOI: 10.1175/JCLI-D-18-0033.1 Ó 2018 American Meteorological Society. For information regarding reuse of this content and general copyright information, consult the AMS Copyright Policy (www.ametsoc.org/PUBSReuseLicenses).
Transcript of Weakened Anomalous Western North Pacific Anticyclone ...

Weakened Anomalous Western North Pacific Anticyclone during an ElNiño–Decaying Summer under a Warmer Climate: Dominant Role of the Weakened
Impact of the Tropical Indian Ocean on the Atmosphere
CHAO HE
Institute for Environmental and Climate Research, Jinan University, Guangzhou, China
TIANJUN ZHOU
State Key Laboratory of Numerical Modeling for Atmospheric Sciences and Geophysical Fluid Dynamics (LASG),
Institute of Atmospheric Physics, Chinese Academy of Sciences, Beijing, China
TIM LI
Key Laboratory of Meteorological Disaster of Ministry of Education, Nanjing University of
Information Science and Technology, Nanjing, China
(Manuscript received 19 January 2018, in final form 7 August 2018)
ABSTRACT
The western North Pacific subtropical anticyclone (WNPAC) is the most prominent atmospheric circula-
tion anomaly over the subtropical Northern Hemisphere during the decaying summer of an El Niño event.
Based on a comparison between the RCP8.5 and the historical experiments of 30 coupled models from the
CMIP5, we show evidence that the anomalous WNPAC during the El Niño–decaying summer is weaker in a
warmer climate although the amplitude of the ElNiño remains generally unchanged. Theweakened impact of
the sea surface temperature anomaly (SSTA) over the tropical Indian Ocean (TIO) on the atmosphere is
essential for the weakened anomalous WNPAC. In a warmer climate, the warm tropospheric temperature
(TT) anomaly in the tropical free troposphere stimulated by the El Niño–related SSTA is enhanced through
stronger moist adiabatic adjustment in a warmer mean state, even if the SSTA of El Niño is unchanged. But
the amplitude of the warm SSTAover TIO remains generally unchanged in anEl Niño–decaying summer, the
static stability of the boundary layer over TIO is increased, and the positive rainfall anomaly over TIO is
weakened. As a result, the warm Kelvin wave emanating from TIO is weakened because of a weaker latent
heating anomaly over TIO, which is responsible for the weakenedWNPAC anomaly. Numerical experiments
support the weakened sensitivity of precipitation anomaly over TIO to local SSTAunder an increase ofmean-
state SST and its essential role in the weakened anomalousWNPAC, independent of any change in the SSTA.
1. Introduction
In the decaying summer of an El Niño event (i.e.,
half a year after the peak phase of El Niño in boreal
winter), the subtropical western North Pacific (WNP) is
usually controlled by a large-scale anticyclone anomaly
(e.g., Zhang et al. 1999; Li et al. 2017; Zhang et al. 2017).
This anomalous anticyclone is called the western North
Pacific anticyclone (WNPAC), and it forms in the winter
of the peak phase of El Niño and persists into the de-
caying summer after El Niño (Wang et al. 2000; Stuecker
et al. 2015; Wu et al. 2017). In summer, the anomalous
WNPAC modulates water vapor transport into East
Asia and brings excessive rainfall along the Yangtze
River valley, but deficient rainfall in both South China
andNorth China (Chang et al. 2000; Li et al. 2014; Zhang
et al. 2016; Zhang et al. 2017).
El Niño usually peaks in winter and decays in spring,
and most El Niño events disappear in the summer of
its decaying year. Because the atmosphere responds
quickly to underlying SST anomalies, and the memory
of the atmosphere is shorter than 1 month, how does the
Supplemental information related to this paper is available
at the Journals Online website: https://doi.org/10.1175/JCLI-
D-18-0033.s1.
Corresponding author: Dr. Chao He, [email protected]
1 JANUARY 2019 HE ET AL . 213
DOI: 10.1175/JCLI-D-18-0033.1
� 2018 American Meteorological Society. For information regarding reuse of this content and general copyright information, consult the AMS CopyrightPolicy (www.ametsoc.org/PUBSReuseLicenses).

anomalousWNPACmaintain from the peak phase of El
Niño in winter to its decaying summer? Great efforts
have been devoted to the investigation of the mainte-
nance mechanism of the WNPAC in the past decade in
the context of both data diagnosis and model simula-
tions, and the tropical Indian Ocean (TIO) has been
found to play an essential role (e.g., Sui et al. 2007; Yang
et al. 2007; Li et al. 2008; Xie et al. 2009; Wu et al. 2009a;
Song and Zhou 2014a,b; Wu et al. 2017). Passively
forced by El Niño, the SST anomaly (SSTA) over TIO
become warmer from boreal winter to spring during the
El Niño–decaying phase, resembling the recharge pro-
cess of a capacitor. In the following summer, when El
Niño has already dissipated, warm SSTA in the TIO
plays an important role in forcing the anomalous
WNPAC, similar to the discharge process of a capacitor
(Li et al. 2008; Wu et al. 2009a; Xie et al. 2009, 2016).
In summer, warm SSTAs in the TIO stimulate a warm
Kelvin wave, with easterly wind anomalies in the deep
tropics from the Indian Ocean to the western Pacific and
anticyclonic wind shear on its northern and southern
flanks. The anticyclonic relative vorticity anomaly in the
free troposphere of theWNP further induces divergence
in the Ekman layer (i.e., wave-induced Ekman di-
vergence), which suppresses local precipitation and la-
tent heating and further enhances the anomalous
WNPAC (Terao and Kubota 2005; Li et al. 2008; Wu
et al. 2009a; Xie et al. 2009, 2016). Tropospheric tem-
perature (TT) anomalies have been widely used to
measure the Kelvin waves emanating from the TIO
(e.g., Xie et al. 2009; Chowdary et al. 2012; Hu et al.
2014). In addition to the TIO, SST anomalies over sev-
eral other tropical oceans have also been thought to
contribute to the maintenance of the WNPAC in sum-
mer, such as the equatorial Pacific (Chen et al. 2012;
Wang et al. 2013; Z. Chen et al. 2016), theWNP (Sui et al.
2007; Wu et al. 2010), and the tropical Atlantic Ocean
(Rong et al. 2010; Hong et al. 2014). Key oceanic regions
responsible for the summertime WNPAC anomaly and
their mechanisms are reviewed in several recent papers
(He et al. 2015; Li et al. 2017; Zhang et al. 2017).
The interannual relationship between the WNPAC
and ENSO can be affected by both internal decadal
variability and anthropogenic greenhouse gas forcing.
The response of the TIO SST anomaly to El Niño and
the impact of TIO SST anomalies on the WNPAC have
experienced significant decadal changes in the late 1970s
(Huang et al. 2010; Xie et al. 2010; Chakravorty et al.
2014) and early 1990s (He andZhou 2015;Gu et al. 2017;
Chen et al. 2017). Internal decadal variability has been
demonstrated to play an active role in modulating the
decadal change of interannual WNPAC variability
(Chowdary et al. 2012; Song and Zhou 2015). The
impact from strong internal variability and the associ-
ated uncertainty should be accounted for when in-
vestigating the response of the anomalous WNPAC to
global warming under anthropogenic greenhouse gas
(GHG) forcing.
Ensemble simulation of fully coupled climate system
models is an effective way to separate the forced re-
sponse from the decadal oscillation induced by internal
variability. Analysis based on multimodel experiments
from phase 5 of the Coupled Model Intercomparison
Project (CMIP5; Taylor et al. 2012) show that positive
TT anomalies during El Niño will be amplified, because
of enhanced moist adiabatic adjustment of the atmo-
sphere under a moister mean state (Hu et al. 2014; Tao
et al. 2015). Despite the great importance of the anom-
alous WNPAC to the abnormal climate over East Asia–
west Pacific in summer, the possible response of the
anomalous WNPAC during the El Niño–decayingsummer to global warming remains inconclusive (Zheng
et al. 2011; W. Chen et al. 2016; Jiang et al. 2018). We aim
to answer the following questions in this study: How does
the anomalous WNPAC during the El Niño–decayingsummer change in a warmer climate? Which physical
processes are responsible for its change?
The remainder of this paper is organized as follows.
The model, data, and analysis methods are introduced
in section 2. The projected changes in the anomalous
WNPAC during the El Niño–decaying summer and the
sensitivity of the WNPAC to SST anomalies in the TIO
are addressed in section 3. The underlying physical pro-
cess for the change in the sensitivity of the WNPAC to
SST anomalies is addressed in section 4. Finally, the
conclusions are summarized in section 5with a discussion.
2. Model, data, and methods
In total, 30 models from CMIP5 are adopted for an-
alyses in this study (see Table S1 in the online supple-
mental material). The historical experiments of the
CMIP5 models are forced by observed historical exter-
nal forcing (e.g., GHGand aerosols) (Taylor et al. 2012),
and the 1950–99 period in the historical experiment is
used to represent the baseline climate, referred to as
‘‘20C.’’ The representative concentration pathway 8.5
(RCP8.5) experiment from CMIP5 is forced by a high
emission pathway, which is equivalent to a radiative
forcing of 8.5Wm22 in the year 2100 (van Vuuren et al.
2011). The 2050–99 period in the RCP8.5 experiment
(referred to as 21C) is adopted to represent a warmer
climate in the future. The 21C in RCP8.5 experiment is
compared with the 20C in the historical experiment. For
each model, only one realization is used to give equal
weight to each model. In addition to the model data, the
214 JOURNAL OF CL IMATE VOLUME 32

following observational and reanalysis datasets span-
ning from 1948 to 2017 are also used in our analysis: 1)
monthly wind, geopotential height, and vertical velocity
from the National Centers for Environmental Prediction–
National Center for Atmospheric Research (NCEP–
NCAR) (Kalnay et al. 1996) and 2) monthly SST from
the NOAA Extended Reconstructed SST dataset
(ERSST), version 5 (B. Huang et al. 2017).
A high concentration pathway of RCP8.5 is analyzed
in this study since internal climate variability has a
profound impact on decadal climate change (Deser et al.
2012; Chowdary et al. 2012; Song and Zhou 2015; Chen
and Zhou 2018) and theGHG-forced circulation change
can be easily extracted from internal variability in
RCP8.5. We have also analyzed the RCP4.5 experiment
and the results are similar to those in RCP8.5 if the
projected change is scaled by the magnitude of mean-
state warming. For simplicity, the symbols D and d are
used to denote the absolute and relative changes in
variableX per 1K of tropical averaged surface warming,
that is, DX 5 (X21C 2 X20C)/(T21C 2 T20C) and dX 5DX/X20C, respectively. Here, T20C and T21C denotes the
annual mean of the tropical (308S–308N)-averaged sur-
face temperature for 20C in the historical experiment
and 21C in the RCP8.5 experiment, respectively. The
multimodel median of T21C 2 T20C is 2.83K.
Since we focus on interannual variability, all data are
subject to an 8-yr high-pass Fourier filter in this study,
which allows the low-frequency variability to be re-
moved, and only the interannual variability is retained.
Regression slopes of atmospheric circulation anomalies
onto SST indices (e.g., the Niño-3.4 index or the TIO–SST
index) are adopted to measure the sensitivity of the cir-
culation anomalies to SST anomalies. The regression slope
is calculated for each model, and the multimodel me-
dian (MMM) is obtained. We adopt the median value
instead of the mean value because the median is more
robust and less affected by outliers (Gleckler et al.
2008). The intermodel consistency (or uncertainty) is
evaluated in terms of the percentage of individual
models that agree in sign with the MMM-projected
change. According to Power et al. (2012), a 95% con-
fidence level based on the t test is equivalent to an in-
termodel consistency of 68% under the assumption of
independency among the models. Therefore, an inter-
model consistency greater (less) than 70% is regarded
as robust (uncertain) among the models in this study.
The linear baroclinic model (LBM) and the Commu-
nity Atmosphere Model, version 5 (CAM5), are adopted
in this study to investigate the mechanism. The LBM is a
primary equation model developed by Watanabe and
Kimoto (2000), which is used to test the response of
the anomalous atmospheric circulation to the diabatic
heating anomaly. In this study, the LBM is run at a res-
olution of triangular truncation of T42, with 20 sigma
levels in the vertical. CAM5 (Neale et al. 2012) is the
atmospheric component of the Community Earth System
Model (CESM), and is adopted here to test the TT and
precipitation anomalies forced by prescribed SST bound-
ary conditions. A finite-volume dynamic core with a hor-
izontal resolution of about 1.98 in latitude and 2.58 in
longitude is adopted for CAM5, with 30 levels in the hy-
brid sigma–pressure coordinate in the vertical.
3. Projected changes of the anomalous WNPACduring an El Niño–decaying summer and itsuncertainty
An anomalous WNPAC is forced by the suppressed
latent heating as a direct or indirect response to SST
anomalies in the tropics. Therefore, the intensity of the
anomalous WNPAC is modulated by two factors. The
first factor is the amplitude of the SST anomaly itself. If
the SST anomaly of El Niño is enhanced or if the SST
anomaly over some key regions associated with El Niño(such as the warm SSTA over the TIO or the cold SSTA
over WNP forced by El Niño) is enhanced in a warmer
climate, a stronger WNPAC anomaly during an El
Niño–decaying summer is expected, and vice versa. The
second factor is the sensitivity of a WNPAC to a one-
unit SST anomaly. Under a warmer climate, it may be
possible that the SST anomalies associated with El Niñogenerally remain unchanged, but a one-unit SST
anomaly could generate a much stronger or weaker di-
abatic heating anomaly and WNPAC anomaly (i.e., the
WNPAC may become more or less sensitive to the SST
anomaly). We examine the above two hypotheses in
sections 3a and 3b.
a. Projected changes in interannual SST variability
The multimodel mean (MMM)-projected fractional
change in the amplitude of interannual SST variability is
shown in Fig. 1 for boreal winter (DJF), spring (MAM),
and summer (JJA), where the amplitude of the in-
terannual SST variability is measured by the standard
deviation of the 8-yr high-pass-filtered time series. The
interannual variability of the seasonal-mean SST is
amplified over a large fraction of subtropical oceans, but
the change is weak over the equatorial Pacific. Based on
the MMM, the amplitude of the interannual variability
of the Niño-3.4 index changes slightly by 20.53% in
winter, 10.54% in spring, and 11.69% in summer per
1K of tropical warming, but a large intermodel un-
certainty is evident; thus, the change is not in agreement
with more than 70% of the individual models (Fig. 2).
Given the small amplitude of change in the interannual
1 JANUARY 2019 HE ET AL . 215

variability of the Niño-3.4 index and its large inter-
model uncertainty, the SST variability of ENSO itself
can be considered as generally unchanged. This result
is consistent with previous studies (e.g., Stevenson et al.
2012; Zheng et al. 2016), and the IPCC AR5 report
states that the magnitude of SST variability in ENSO is
likely to remain unchanged in the twenty-first century
(IPCC 2013).
Despite the generally unchanged interannual SST
variability over the equatorial Pacific, interannual SST
variability over the other parts of the tropical and sub-
tropical oceans outside the equatorial Pacific is ampli-
fied significantly (Fig. 1). The enhanced interannual SST
variability may partly be explained by the teleconnec-
tion associated with ENSO. During El Niño, tropo-
spheric temperature (TT) in the tropics warms because
of a moist adiabatic adjustment. The underlying SST
responds to the TT anomaly through surface heat fluxes,
and most of the sea surface in the tropics is covered by
warm SST anomalies (Chiang and Sobel 2002; Chiang
and Lintner 2005). In a warmer climate, the warm TT
anomalies forced by El Niño are enhanced because of
strongermoist adiabatic adjustment in amoister atmosphere,
and the warm SST anomalies over remote oceans are en-
hanced under the forcing of the stronger warm TT anomaly
(Hu et al. 2014; Tao et al. 2015).
b. Projected changes in the sensitivity of WNPAC toSST anomalies
To evaluate anomalous atmospheric circulation over the
WNP during a decaying El Niño and its response to global
warming, the anomalies of geopotential heightH, wind, and
relative vorticity z at 850hPa in summer are regressed onto
the DJF Niño-3.4 index for each model. The MMM of the
regression slopes for 20C and 21C, and their changes scaled
by the tropical-mean warming, are shown in Fig. 3. For
brevity, only the positive phase of the regression (i.e., the El
Niño condition) is discussed; the negative phase (i.e., the LaNiña condition) is vice versa and not discussed here.
The geopotential height anomaly at 850 hPa (H850)
during anElNiño–decaying summer is characterized by a
positive anomaly center over the WNP south of 308N,
which is associated with an anticyclonic wind anomaly,
and a negative anomaly center over the midlatitudes in
the North Pacific (approximately 358–508N) is associated
with cyclonic wind anomalies. This meridional wave train
pattern is named the Pacific–Japan (PJ) teleconnection pat-
tern or the EastAsian–Pacific (EAP) teleconnection pattern
(Nitta 1987;HuangandSun1992). Inaddition to thePJ/EAP
pattern and the anomalous WNPAC over the WNP, a
notable feature is that the H850 over the entire tropics
is characterized by positive anomalies with a spatially
uniform pattern (Fig. 3a). This spatially uniform
positive geopotential height anomaly results from
positive temperature anomaly below it, because the
difference of the geopotential height between a pressure
level and the surface is proportional to temperature be-
low it and the surface is fixed (Huang et al. 2015; Hu et al.
2018; He et al. 2018).
FIG. 2. Percentage changes (%) in the interannual standard de-
viations of theNiño-3.4 index inDJF,MAM, and JJA. The blue bar
indicates the MMM, and the thin black bar denotes the range be-
tween the 30th and 70th percentiles of the individual models.
FIG. 1. The MMM-projected percentage of change in the in-
terannual standard deviation (%) of SST per 1 K of tropical surface
warming. (a) Boreal winter (DJF), (b) boreal spring (MAM), and
(c) boreal summer (JJA). The stippling indicates agreement by at
least 70% of the individual models. The box is the region for the
Niño-3.4 index.
216 JOURNAL OF CL IMATE VOLUME 32

The regressed anomalies in 21C from the RCP8.5
experiment share a similar spatial pattern with those in
the 20C (Fig. 3b). Compared with the regression map in
20C (Fig. 3a), the locations of theWNPAC and PJ/EAP
pattern anomaly centers remain generally unchanged in
21C (Fig. 3b). The difference between 21C and 20C
(Fig. 3c, scaled by tropical-mean warming) is charac-
terized by an increase in H850 anomaly over the tropics
within 208S–208N, a decrease in H850 anomaly over the
WNP within 208–308N, and a substantial increase in
H850 anomaly at midlatitudes over the North Pacific
within approximately 358–508N. The increase in H850
over the deep tropics features a spatially uniform pat-
tern, indicating that it is caused by an enhanced response
of tropical TT to El Niño, which has little impact on
changes in atmospheric circulation because circulation is
determined by the horizontal gradient rather than the
absolute magnitude of the geopotential height. Over the
subtropical WNP (within 208–308N), the negative H850
and the cyclonic anomalies in Fig. 3c suggest a weakened
anomalousWNPACduring an El Niño–decaying summer.
The cyclonic anomaly over the midlatitude North Pacific
is also substantially weakened, indicating a weakened
PJ/EAP teleconnection.
The change in H850 anomalies is contributed by two
components: the horizontally uniform increase in H850
induced by enhanced TT anomalies and the horizontally
nonuniform component associated with wind (Hu et al.
2018; He et al. 2018), and the change in the WNPAC
anomaly is related to the latter component. To measure
the anomalous WNPAC more objectively, we use rela-
tive vorticity at 850 hPa (z850), which is a direct measure
of the strength of a cyclone or an anticyclone. Relative
vorticity has also been widely used to measure sub-
tropical anticyclones (Terao and Kubota 2005; He and
Zhou 2014; Huang et al. 2015; Wu and Zhou 2016).
Figures 3d–f show the regressed summertime z850
anomaly onto the DJF Niño-3.4 index for 20C, 21C, andthe change. Consistent with the wind anomalies, the
decaying summer of an El Niño event is usually asso-
ciated with negative z850 values over the WNP (within
108–308N) and positive z850 values over the midlatitude
FIG. 3. Regressed anomalies in JJA onto the DJF Niño-3.4 index for (top) 20C and (middle) 21C, and (bottom) their differences scaled
by tropical-mean warming. The regressed anomalies in JJA are (a)–(c) geopotential height and wind at 850 hPa (gpmK21 and m s21 K21,
respectively), (d)–(f) relative vorticity at 850 hPa (1026 s21 K21), and (g)–(l) SST (KK21). In the bottom row, the stippling indicates
agreement by at least 70% of the individual models.
1 JANUARY 2019 HE ET AL . 217

North Pacific (within 358–508N) (Fig. 3d). In 21C,
anomalously negative z850 values over the subtropical
WNP and anomalously positive z850 values over mid-
latitudes in the North Pacific are both weaker than
those in 20C (Fig. 3e), and the sign of change in the z850
anomalies (Fig. 3f) is generally opposite to the z850
anomalies in 20C (Fig. 3d); this also indicates a weaker
WNPAC anomaly during an El Niño–decaying sum-
mer in a warmer climate. In summary, multiple vari-
able changes consistently indicate a weakenedWNPAC
anomaly during anEl Niño–decaying summer in a warmer
climate.
Wintertime SST anomalies over the equatorial Pacific
cannot exert direct forcing on the summertime
WNPAC. Since SST anomalies in summer forced by
ENSO are considered to have a direct forcing on the
WNPAC, regressed summertime SST anomalies onto
the DJF Niño-3.4 index for the 20C and 21C epochs are
examined in Figs. 3g,h, and their differences scaled by
tropical-mean surface warming are shown in Fig. 3i. In
the decaying summer of an El Niño event, warm SST
anomalies over the TIO are reproduced by the MMM
(Fig. 3g), which is consistent with the SST anomalies
from the observations (Xie et al. 2009). There is a weak
warm SSTA over the subtropical WNP in JJA for both
20C and 21C (Figs. 3g,h), consistent with previous
studies based on observations [Fig. 4 in Xie et al. (2009)]
and the CMIP5 models [Figs. 2 and 4 of Jiang et al.
(2018)], accompanied by local anticyclone anomaly.
Although the cold SSTA over the subtropical WNP in
early summer (June) of the El Niño–decaying phase
contributes to the anomalous WNPAC by forcing a
negative precipitation and latent heating anomaly over
WNP (Wu et al. 2010), the seasonal-mean SSTA over
WNP in JJA is forced by the atmosphere during the El
Niño–decaying summer rather than forcing the atmo-
sphere (Wu et al. 2009b). The cold SST anomaly over
the midlatitude North Pacific is also a passive response
to the local cyclone anomaly associated with the PJ/EAP
wave train. Although there is warm SST anomaly over
the tropical Pacific (Fig. 3g), it is not helpful for the
maintenance of the WNPAC anomaly in an El Niño–decaying summer (Chen et al. 2012;Wang et al. 2013). In
all, the tropical SST anomalies during the El Niño–decaying phase are well reproduced by the MMM of the
models, and TIO SST anomalies play an essential role in
the maintenance of the WNPAC anomaly.
In 21C, summertime SST anomalies regressed onto
the DJF Niño-3.4 index are generally featured by
weakened negative SST anomalies over the mid-
latitudes in the North Pacific and enhanced positive
SST anomalies in the other parts of the Indo-Pacific
(Figs. 3h and 3i). This robust feature results from
enhanced warm TT anomaly caused by enhanced moist
adiabatic adjustment (Chiang and Lintner 2005; Hu
et al. 2014; Tao et al. 2015). Over the subtropical Pacific
south of 208N the enhancement of the warm SST
anomaly is generally uniform in the zonal direction
(Fig. 3i), but the negative SST anomaly center over the
midlatitude North Pacific is substantially weakened,
suggesting the additional role of the reduced intensity
of the local anomalous cyclone associated with the
PJ/EAP wave train. The positive SST anomaly over the
TIO is slightly enhanced (Fig. 3i) but insignificant in
terms of the intermodel uncertainty.
Although the above analysis and previous studies
have shown the crucial role of the TIO SST anomaly to
the anomalous WNPAC, it is still not clear how the
sensitivity of the WNPAC to TIO SST anomaly will
change. To investigate the atmospheric circulation
anomaly over the WNP associated with a one-unit SST
anomaly over the TIO, regressed anomalies of H850,
z850, and vertical velocities at 500 hPa (v500) in JJA
onto the TIO–SST index in JJA are shown in Fig. 4,
where the TIO–SST index is defined as the regional-
averaged SST anomaly over 158S–158N, 508–1108E. Theanomaly patterns in Fig. 4 are generally the same as
those in Fig. 3, with an anomalous anticyclone over the
WNP and an anomalous cyclone over midlatitudes in
the North Pacific associated with warm SSTA over
TIO, demonstrating that TIO SSTAs in summer may
explain a substantial fraction of a WNPAC anomaly in
response to ENSO. An anomalousWNPAC is featured
by positive H850 anomalies, negative z850 anomalies
and positive v500 anomalies (Figs. 4a,d,g). In 21C, lo-
cations of the anomalous WNPAC and the anomalous
cyclone over midlatitudes in the North Pacific remain
generally unchanged (Figs. 4b,e,h). The difference in the
regression coefficient over the WNP between 21C and
20C (Figs. 4c,f,i) is generally opposite to those in 20C
for every variable (i.e., H850, z850, v500, and wind at
850hPa), suggesting a weakened sensitivity of theWNPAC
to TIO SST anomaly. Over the TIO, positive SST anom-
alies are associated with local ascending motion anomalies
in both 20C and 21C, suggesting the active forcing of the
SST anomaly on the atmosphere. But the sensitivity of the
anomalousv500 values over TIO to local SST anomalies is
much weaker in 21C than that in 20C (Fig. 4i), consistent
with P. Huang et al. (2017).
To quantitatively evaluate the sensitivity of the
WNPAC to tropical SST anomalies and intermodel
uncertainties, we define a WNPAC index as regional-
averaged z850 over 108–308N, 1108–1608E (i.e., the box
in Fig. 3d) multiplied by 21, as in a previous study (He
and Zhou 2014). The anomalies in the WNPAC index
regressed onto the DJF Niño-3.4 index and the JJA
218 JOURNAL OF CL IMATE VOLUME 32

TIO–SST index for the 20C in the historical experiment
are shown in Fig. 5a. The positive regression slopes of
theWNPAC index onto the DJF Niño-3.4 index and the
JJA TIO–SST index are evident in most of the individ-
ual models and the MMM, suggesting an anomalous
anticyclone (cyclone) in the decaying summer of an El
Niño (La Niña) event that is accompanied by warm
(cold) SST anomalies over the TIO. Based on the
MMM, the sensitivity of the WNPAC index in summer
to the DJF Niño-3.4 index in the 20C is 0.39 31026 s21K21, and the sensitivity of theWNPAC index to
the TIO–SST index is 1.49 3 1026 s21K21 in the 20C.
A few models show very weak or reversed relations in
the WNPAC with ENSO or TIO SSTAs, and there are
two possible causes. First, there are biases in these
models (Hu et al. 2014; Song and Zhou 2014b; Wu and
Zhou 2016). Second, the historical experiment is not
designed to capture the observed phase of the internal
variability, but the time scope selected for the analysis
coincides with a period when the WNPAC–ENSO re-
lationship is weak because of the internal climate variability
of the model (Song and Zhou 2015). Observational
studies showed that the WNPAC is strongly correlated
with ENSO and TIO SSTAs in several decades, but
these correlations are near zero or with reversed sign in
other decades (Huang et al. 2010; Chowdary et al. 2012;
He and Zhou 2015; Song and Zhou 2015; Gu et al.
2017). Given the observational uncertainty, we divide
the observational data spanning 1948–2017 (a total of
70 years) into 30 segments, each with a length of 40
years (i.e., 1948–87, 1949–88, and 1978–2017). The re-
gressedWNPAC index onto the Niño-3.4 index and theTIO–SST index is obtained for each segment, and a
total of 30 pairs of regression coefficients are obtained
to estimate the uncertainty range in the observation. In
the observation, the regression coefficients of the
WNPAC index onto the Niño-3.4 index range from
0.33 3 1026 to 0.61 3 1026 s21K21, and the regression
coefficients of the WNPAC index onto the TIO–SST
index range from 1.21 3 1026 to 3.06 3 1026 s21K21
(shown as the red box in Fig. 5a). The MMM and four
individual models fall within the range of observational
FIG. 4. As in Fig. 3, but for the regressed anomalies of (a)–(c) geopotential height and wind at 850 hPa (gpmK21 and m s21 K21,
respectively), (d)–(f) relative vorticity at 850 hPa (1026 s21 K21), and (g)–(l) vertical velocity at 500 hPa (1024 Pa s21 K21) onto the JJA
TIO–SST index.
1 JANUARY 2019 HE ET AL . 219

uncertainty (i.e., within the box in Fig. 5a). These four
models are CESM1-CAM5, FGOALS-g2, GISS-E2-R,
and MIROC-ESM-CHEM, and they are used as ‘‘high
skill’’ models. The selection of these four models is
consistent with an independent study that measured
model skills with other metrics regarding the East
Asian summer monsoon (Song and Zhou 2014b).
Changes in the sensitivity of WNPAC index to Niño-3.4 index and TIO–SST index for individual models are
shown in Fig. 5b. The weakened sensitivity of the sum-
mertime WNPAC to the Niño-3.4 index in the previous
winter is evidenced by 17 models, while the other 13
models project enhanced sensitivity. Although there
are substantial intermodel uncertainties regarding the
weakened sensitivity of the WNPAC to the DJF Niño-3.4 index, the weakened sensitivity of the WNPAC to
the TIO SSTs is agreed upon in 21 of the 30 models (i.e.,
70% intermodel consistency) (Fig. 5b). According to the
MMM, the anomalous WNPAC index regressed onto
the TIO–SST index is weakened by 15.9% per 1K of
warming. For the four high-skill models (the red dots in
Fig. 5b), only one of them shows an enhanced sensitivity
of the WNPAC to the Niño-3.4 index and the TIO–SST
index; the other three models agree in sign with the
MMM. Therefore, it is a robust phenomenon that one-
unit SSTA in TIO could stimulate a weaker anomalous
WNPAC under a warmer climate. The intermodel cor-
relation between the changes in regression slope of the
WNPAC on the Niño-3.4 index and the changes in re-
gression slope of the WNPAC on the TIO–SST index in
Fig. 5b is 0.78, suggesting that the weakened sensitivity
of the WNPAC to the TIO SSTA forcing plays an es-
sential role in the weakening of the WNPAC anomaly
during an El Niño–decaying summer.
The WNPAC–SSTA relationship from the observa-
tions is also subject to uncertainty because of the quality
of the reanalysis data (e.g., Kumar and Hu 2012) or the
sampling variability (Cash et al. 2017). If we divide the
70 years of observation into 40 segments, with each of
them containing 30 consecutive years, the regression
slope of the WNPAC index onto the Niño-3.4 index
ranges from 0.153 1026 to 0.743 1026 s21K21, and the
regression slope of the WNPAC index onto the TIO–
SST index ranges from 20.30 3 1026 to 3.55 31026 s21K21 in the observation. Previous studies have
also suggested that there are great decadal oscillations
in the relationship between the WNPAC and ENSO or
TIO SSTs (Huang et al. 2010; Chowdary et al. 2012; He
and Zhou 2015; Song and Zhou 2015; Gu et al. 2017),
and the correlation coefficients are slightly negative
around the 1960s from the observations (Huang et al.
2010; Song and Zhou 2015), which is similar to some of
the results from the ‘‘low skill’’ models. Therefore, it
may not be reasonable to exclude models that have a
weak WNPAC–ENSO relationship, and the results ob-
tained from a small group of models may be more
strongly biased because of internal variability (Deser
et al. 2012). Since the ensemble median is not sensitive
to the outlier models (Gleckler et al. 2008), and it is
qualitatively consistent with the high-skill models, the
FIG. 5. The regressed anomalies of the WNPAC index for the individual models
(1026 s21 K21). (a) The regressed anomaly of theWNPAC index onto theDJFNiño-3.4 index(y axis) as a function of the regressed anomaly of the WNPAC index onto the JJA TIO–SST
index (x axis) for 20C. The black dot indicates the MMM, and the blue dots indicate the
individual models. The red box shows the uncertainty range of the regression coefficient from
the observation data. (b) The projected changes of the regressed anomalies as the difference
between 21C and 20C scaled by tropical-mean warming. The black dot indicates the MMM,
the red dots indicate the high-skill models, and the blue dots indicate the other models.
220 JOURNAL OF CL IMATE VOLUME 32

ensemblemedian of the 30models is reasonable and will
be further used in the following discussion.
Internal variability also explains the discrepancy be-
tween our results and Zheng et al. (2011). Zheng et al.
(2011) suggested a strengthened sensitivity of WNPAC
to TIO SSTA, based on the outputs of GFDL_CM2.1.
The projected change by a single model may not be
caused by the GHG-forced climate response, as the
impact of internal variability may overwhelm the GHG-
forced response. Our result about the weakened
WNPAC anomaly is consistent with Jiang et al. (2018),
which used a large ensemble of models. Although Jiang
et al. (2018) attributed the weakened anomalous
WNPAC to the weakened SSTA gradient between TIO
and WNP, it is obvious from Fig. 6 of Jiang et al. (2018)
that the decreased TIO–WNP SSTA gradient is domi-
nated by the SSTA overWNP, whereas the contribution
from TIO is negligible. However, our results and Fig. 4c
of Jiang et al. (2018) consistently show that there is a
positive SSTA over WNP during the El Niño–decayingsummer in the models. According to previous studies
(e.g., Sui et al. 2007; Wu et al. 2010), the warm SSTA
over WNP in summer, if it forces the atmosphere,
stimulates an anomalous cyclone over WNP. Indeed,
the JJA mean SSTA over WNP during the El Niño–decaying summer is forced by the atmosphere rather
than forcing the atmosphere at the interannual time
scale (Wu et al. 2009b), and the projected changes of the
WNPAC anomaly interacts with the SSTA over WNP
under global warming (Jiang et al. 2018), which makes it
difficult to distinguish the cause and effect between the
changes of anomalous WNPAC and the SSTA over
WNP. Because the above evidence has shown that TIO
plays an essential role in the weakened WNPAC anom-
aly, the mechanism for the weakened impact of TIO
SSTA on the WNPAC will be investigated in detail.
4. Mechanism for the weakened WNPAC anomaly
Because atmospheric circulation anomalies in the
tropics are driven by diabatic heating, with a dominant
contribution deriving from latent heating associated
with precipitation, the regressed precipitation anomalies
onto the TIO–SST index and its changes are shown in
Figs. 6a–c. It is clear that warm SSTAs over the TIO
are indeed associated with local positive precipitation
anomalies, with a positive precipitation anomaly over the
equatorial Pacific and negative precipitation anomalies
over its northern and southern flanks off the equator.
However, the positive precipitation anomaly over the
equatorial Pacific does not favor an anomalous anticy-
clone over the WNP because it stimulates a cyclonic
Rossbywave response to the northwest (Wang et al. 2013;
Z. Chen et al. 2016). The positive rainfall and associated
latent heating anomaly over the TIO are essential ex-
ternal forcing for the formation of a WNPAC, whereas
the negative precipitation anomaly over the WNP is
coupled with anomalous WNPAC (Xie et al. 2009; Jin
et al. 2013; Xiang et al. 2013). For both the 20C and 21C
epochs, positive SST anomalies over the TIO are associ-
ated with positive precipitation anomalies over the TIO
basin, but the positive precipitation anomaly over the
TIO is weaker in 21C than in 20C (Fig. 6b). The positive
precipitation anomaly averaged within 158S–158N, 508–1108E is weakened by 14.8% per 1K of warming. The
weakened sensitivity of TIO precipitation to local SSTA
forcing is a robust phenomenon evidenced by more than
70%of themodels over a large fraction of TIO, especially
over the western TIO (Fig. 6c).
Following Yanai and Tomita (1998), the three-
dimensional diabatic heating field is calculated, and
the diabatic heating anomaly regressed onto the TIO–
SST index and its change are shown in Figs. 6d–i at
500 hPa and in terms of the latitude–height profile av-
eraged over 508–1108E. The diabatic heating anomaly
becomes less sensitive to the underlying SST anomaly
over the TIO in a warmer climate (Figs. 6d–i), as evi-
denced by the weaker magnitude of the anomalies in
21C than in 20C. The spatial patterns for the diabatic
heating anomaly and its change resemble those for
precipitation, and the vertical profiles for the diabatic
heating anomalies are characterized by a maximum
in the midtroposphere at approximately 500 hPa (Figs.
6g–i), suggesting a dominant contribution from latent
heating associated with precipitation to the total dia-
batic heating. In summary, the diabatic heating asso-
ciated with the precipitation anomaly over the TIO
forced by local SSTA over TIO is weaker in a warmer
climate. The effect of the change in the diabatic
heating anomaly over TIO during the El Niño–decaying summer on the anomalous WNPAC will be
investigated in section 4a, and the possible mechanism
for the weakened impact of SSTA over TIO on the
local precipitation anomaly will be investigated in
section 4b.
a. Effect of the weakened TIO heating anomaly on theWNPAC anomaly
To investigate whether the weakened diabatic heating
anomaly over the TIO is responsible for the weakened
WNPAC anomaly, idealized numerical experiments are
performed with a linear baroclinic model (LBM) de-
veloped by Watanabe and Kimoto (2000). The LBM is
linearized at the JJA mean state derived from the
NCEP–NCAR reanalysis, and two experiments are
performed.One is forced by the regressed three-dimensional
1 JANUARY 2019 HE ET AL . 221

positive diabatic heating anomaly over the TIO (158S–158N, 508–1108E) for 20C, and the other is forced by the
regressed positive diabatic heating anomaly in 21C (see
Fig. 6). For each experiment, the LBM is consecutively
integrated for 50 days and the average for the last
20 days is examined. The responses of the relative
vorticity and the wind at 850 hPa to the diabatic heating
anomaly are shown in Fig. 7.
Forced by the positive heating anomaly over the TIO,
the LBM has reproduced the anomalous anticyclone
over the WNP in terms of meridional wind shear and
negative z850 (Figs. 7a,b). The magnitude of the z850
anomaly over the WNP within 108–308N in the LBM
is comparable with those in the coupled model sim-
ulations, although the anomalous easterly wind along
308N over the WNP is weaker because of the absence
of local convection–circulation feedback over theWNP
(Xie et al. 2009). Based on the LBM simulation, the
WNPAC anomaly forced by the TIO heating anomaly
in 21C is substantially weaker than that in 20C. If the
WNPAC intensity is measured by averaging the z850
within 108–308N, 1108–1608E, the LBM-simulated in-
tensity of the anomalous WNPAC is weakened by
19.2% per 1K of warming, which is comparable to the
coupled model projection. The substantially weakened
meridional PJ/EAP pattern in the CMIP5 models is
not captured by the LBM, because of the lack of the
feedback of circulation on local convection over WNP
(Xie et al. 2009). But the LBM experiments confirm that
the weakened heating anomaly over the TIO is the pri-
mary external forcing that is responsible for the weakened
WNPAC anomaly.
The weakened effect of the heating anomaly over TIO
on the atmosphere can also be identified in the CMIP5
FIG. 6. Regressed precipitation and diabatic heating anomalies onto the TIO–SST index and their changes. (a)–(c) Precipitation
anomalies regressed onto the JJA TIO–SST index (mmday21 K21) for (a) 20C, (b) 21C, and (c) the difference between 21C and 20C
scaled by tropical-mean warming. (d)–(f) As in (a)–(c), but for the regressed anomalies of diabatic heating at 500 hPa (K day21K21). (g)–(i)
As in (a)–(c), but for the vertical profile of diabatic heating over TIO (averaged within 508–1108E).
222 JOURNAL OF CL IMATE VOLUME 32

models. The TT (850–200-hPa-averaged tropospheric
temperature) anomaly is usually adopted tomeasure the
intensity of the warm Kelvin wave stimulated by TIO
heating (e.g., Xie et al. 2009; Chowdary et al. 2012; Hu
et al. 2014). But the warm TT anomaly over the entire
tropics during El Niño is enhanced in a warmer climate,
as implied by previous studies (Hu et al. 2014; Tao et al.
2015) and will be shown in section 4b. By removing the
contemporary tropical-mean TT, the residual compo-
nent (TT*) can be used to measure the Kelvin wave
associated with TIO forcing, and the TT* anomaly
regressed onto the TIO–SST index in the CMIP5models
is shown in Fig. 8. The regressed TT* anomaly captures
the wedgelike warm Kelvin wave emanating from the
TIO caused by a positive heating anomaly over TIO,
and a pair of cold anomalies over the subtropical WNP
and around Australia caused by the suppressed diabatic
heating (Figs. 8a,b). The warm Kelvin wave emanating
from the TIO, as measured by the TT* over the TIO, is
substantially weaker in 21C than in 20C (Figs. 8b,c). The
weakened latent heating anomaly over TIO as shown
in Fig. 6 is responsible for the weakened warm TT*
anomaly over TIO, and the weakened negative latent
heating anomalies over WNP and its counterpart in the
Southern Hemisphere are responsible for the weakened
local cold TT* anomalies. In all, the warm Kelvin wave
emanating from TIO is weakened as a result of the
weakened positive heating anomaly over TIO, which
explains the weakened sensitivity of WNPAC to TIO
forcing in a warmer climate (Wu et al. 2009a; Xie
et al. 2009).
b. Causes for the weakened sensitivity of TIOprecipitation anomaly to local SSTA
Based on the regressed TT anomaly onto the DJF
Niño-3.4 index, the free troposphere of the tropics is
warmer than normal during the El Niño–decayingphase, for both 20C and 21C (Fig. 9). In summer, the
warm TT anomaly is rather uniform through the tropics.
In a warmer climate, the warm TT anomaly is enhanced
from spring to summer during the El Niño–decayingphase (Figs. 9c,f). Previous studies suggested that the
enhanced warm TT anomaly results from the enhanced
moist adiabatic adjustment in a moister atmosphere (Hu
et al. 2014; Tao et al. 2015). The MMM of the tropical-
averaged TT anomaly in JJA averaged between 258Sand 258N regressed onto the DJF Niño-3.4 index is
0.55KK21 for 20C and 0.67KK21 for 21C (Fig. 10a).
The magnitude of its increase is 0.06K per 1K of
tropical-mean surface warming, which is robust among
the models (Fig. 10b).
In contrast to the increased warm TT anomaly during
the El Niño–decaying summer, the increase of TIO
SSTA in the El Niño–decaying summer is weak and
uncertain among the models (Figs. 9, 10), although the
total amplitude of interannual SST variability measured
by the standard deviation is increased over TIO (Fig. 1).
The magnitude of the increase in TIO SSTA in the El
Niño–decaying summer is less than 0.01K per 1K of
tropical-mean surface warming, and is not agreed by
more than 70% of the individual models (Fig. 10b). In
contrast, the tropical-mean warm SSTA is significantly
enhanced (Fig. 10), because of the adjustment of SSTA
to the enhanced TT anomaly (Hu et al. 2014; Tao et al.
FIG. 7. The responses of relative vorticity (1026 s21 K21) and
wind at 850 hPa in the LBM to the prescribed diabatic heating
anomalies. The prescribed heating anomalies are based on the
regressed anomalies of three-dimensional diabatic heating over the
TIO (158S–158N, 508–1108E) onto the TIO–SST index, which are
shown in Fig. 6, for (a) 20C and (b) 21C. (c) The difference in the
LBM responses between the 21C and 20C, which is scaled by
tropical-mean warming.
1 JANUARY 2019 HE ET AL . 223

2015; Jiang et al. 2018). The deviation of positive SSTA
over TIO from the tropical mean (denoted as TIO–
SST*) becomes slightly weaker in a warmer climate
(Fig. 10), but is still not agreed upon by 70% of the
models. In a warming climate, the tropical convection
follows relative distribution of tropical SST instead of
the absolute magnitude of SST, and tropical convection
tends to occur where the SST is warmer than the
tropical-mean SST (Johnson and Xie 2010). Since the
change in TIO SSTA during the El Niño–decayingsummer is weak and uncertain regardless of whether
the tropical-mean SST is removed but the increase of
warm TT anomaly in the free troposphere is robust
(Fig. 10b), the boundary layer over TIO becomes more
stable and is unfavorable for the positive convective
rainfall anomaly over TIO. This acts to weaken the
impact of TIO SSTA on the local precipitation anomaly
in a warmer climate, and will further stimulate a weak-
ened atmospheric circulation anomaly.
The enhanced tropical TT anomaly in a moister at-
mosphere favors enhanced warm SSTA throughout the
tropics including TIO (Hu et al. 2014; Tao et al. 2015),
and the weak and insignificant change of TIO SSTAmay
possibly result from the opposing effect of other pro-
cesses. During the El Niño–decaying summer, the wind
anomaly over TIO opposes the mean-state summer
monsoon circulation and helps to maintain the warm
SSTA via wind–evaporation–SST feedback within TIO
(Du et al. 2009). As the wind anomaly over TIO is
weakened associated with the weakened WNPAC
anomaly in a warmer climate, its cooling effect on the
TIO SSTA offsets the effect of the enhanced warm TT
anomaly (Jiang et al. 2018).
To verify the above mechanism for weakened impact
of TIO SSTA on local precipitation in a warmer climate,
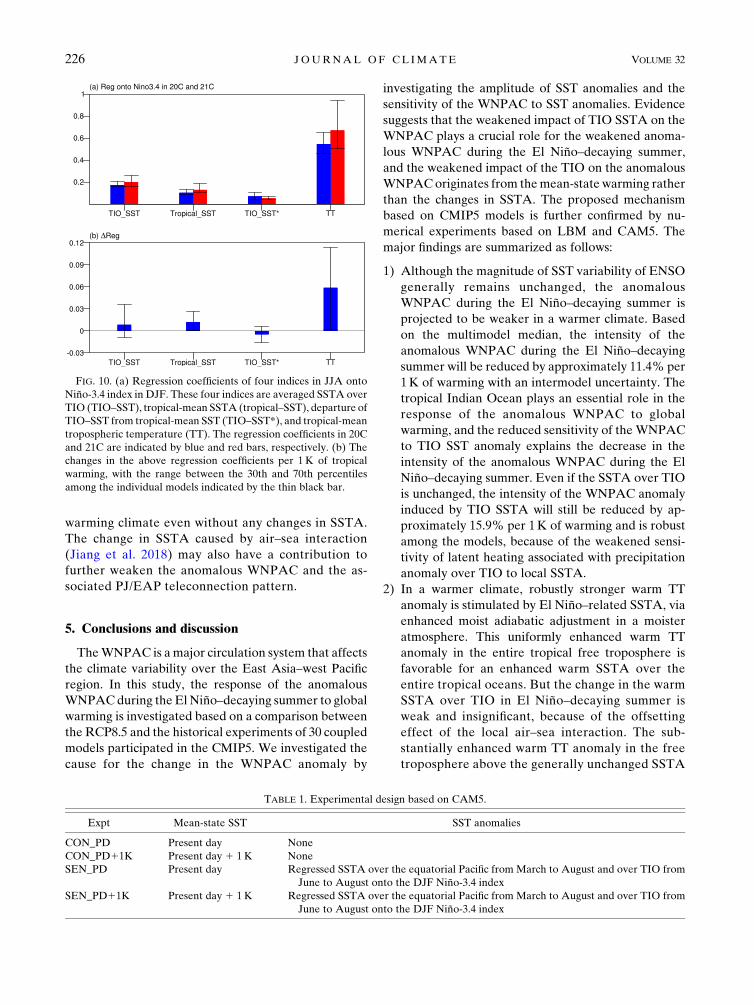
numerical experiments are performed by using CAM5.
Two control experiments are performed under different
mean-state SSTs. One control experiment named as
CTL_PD is forced by the climatological annual cycle of
present-day SST released by Hurrell et al. (2008), and
the other control experiment named as CTL_PD11K is
performed by uniformly adding 1K to the global SST as
used in the CTL_PD experiment. To examine the im-
pact of TIO SSTA in the El Niño–decaying summer, the
warm SSTA over TIO (158S–158N, 508–1108E) from
June to August and the warm SSTA over equatorial
Pacific (108S–108N, 1608E–808W) fromMarch to August
are added to the SSTs in CTL_PD and CTL_PD11K
experiments, respectively, to perform two sensitivity
experiments named as SEN_PD and SEN_PD11K. The
SSTAs over TIO and equatorial Pacific are obtained
from the MMM of SSTA regressed onto DJF Niño-3.4index in 20C (see Fig. S1 in the online supplemental
material for the prescribed SSTA in each month), and a
comparison among the prescribed SST for the four ex-
periments are listed in Table 1. All of these four ex-
periments are consecutively run for 20 years, and the last
18 years are adopted as 18 samples.
The difference between SEN_PD and CTL_PD ex-
periments represents the atmospheric anomalies asso-
ciated with warm TIO SSTA during decaying El Niño in
present-day mean state (PD condition), whereas the
difference between SEN_PD11K and CTL_PD11K
experiments represents those in an idealized global
warming condition with a uniform warming of mean-
state SST by 1K (PD11K condition). In both PD and
PD11K conditions, the tropical atmosphere is governed
by warm TT anomaly in JJA (Figs. 11a,b), but the
FIG. 8. Regressed anomaly of TT* in JJA onto the TIO–SST
index and its change, where TT* is the departure of TT from
tropical-mean TT. (a) 20C and (b) 21C, and (c) is the change in the
regression coefficients per 1 K of tropical-mean surface warming.
224 JOURNAL OF CL IMATE VOLUME 32

tropical-mean TT anomaly rises from 0.21K in the PD
condition to 0.30K in the PD11K condition (Fig. 12a).
This enhancement is possibly due to the enhanced moist
adiabatic adjustment caused by the increase of mean-
state SST (Hu et al. 2014; Tao et al. 2015), since the
SSTA forcing is the same for PD and PD11K condi-
tions. Over the TIO, the positive precipitation anomaly
is seen in both the PD and PD11K conditions (Fig. 11c,d),
but the regional-averaged precipitation anomaly over
TIO drops from 0.29mmday21 in the PD condition to
0.11mm day21 in the PD11K condition (Fig. 12b). The
reduction in the TIO precipitation anomaly possibly re-
sults from the enhanced static stability of the atmospheric
boundary layer associated with the enhanced warm TT
anomaly above the unchanged TIO SSTA. As the positive
precipitation over TIO is weakened, the anticyclone
wind anomaly over WNP is also weakened in the
PD11K condition (Figs. 11c,d). The above experi-
ments support the mechanism for the weakened sen-
sitivity of TIO precipitation anomaly to local SSTA in a
warmer mean state, although the anomalies in CAM5
are not exactly the same in quantity as in the MMM of
CMIP5 models.
Based on the above analyses and model experiments,
the weakened sensitivity of TIO precipitation to local
SSTA is crucial for the weakened anomalous WNPAC
during the El Niño–decaying summer. In a warmer cli-
mate, the warm TT anomaly in the free troposphere of
the tropics during the El Niño–decaying phase is ro-
bustly enhanced because of enhanced moist adiabatic
adjustment of the troposphere to the El Niño–relatedSSTA, even if the strength of El Niño is unchanged.
The substantially enhanced warm TT anomaly in the
free troposphere and the generally unchanged TIO
SSTA results in a more stable boundary layer over
TIO, which is unfavorable for the formation of the
positive rainfall anomaly over TIO. As the pre-
cipitation anomaly over TIO is weakened, the asso-
ciated latent heating anomaly is also weakened and a
weaker Kelvin wave is stimulated from the TIO,
which is crucial for the weakened WNPAC anomaly.
Although Jiang et al. (2018) emphasized the impact
from the projected change of SSTA (especially the
SSTA over WNP), our results show that the anoma-
lous WNPAC is substantially weakened because of
mean-state warming even if the SSTA remains un-
changed. Based on the evidence shown in our work,
the weakened impact of TIO SSTA on the atmosphere
results in a substantially weakened WNPAC anom-
aly during the El Niño–decaying summer under the
FIG. 9. The regressed anomalies of tropospheric temperature (KK21) in (a)–(c) MAM and
(b)–(d) JJA onto Niño-3.4 index in DJF and their changes. The regressed anomalies in (top)
20C and (middle) 21C, and (bottom) the difference between 21C and 20C scaled by tropical-
mean warming.
1 JANUARY 2019 HE ET AL . 225
warming climate even without any changes in SSTA.
The change in SSTA caused by air–sea interaction
(Jiang et al. 2018) may also have a contribution to
further weaken the anomalous WNPAC and the as-
sociated PJ/EAP teleconnection pattern.
5. Conclusions and discussion
TheWNPAC is amajor circulation system that affects
the climate variability over the East Asia–west Pacific
region. In this study, the response of the anomalous
WNPACduring the El Niño–decaying summer to global
warming is investigated based on a comparison between
the RCP8.5 and the historical experiments of 30 coupled
models participated in the CMIP5. We investigated the
cause for the change in the WNPAC anomaly by
investigating the amplitude of SST anomalies and the
sensitivity of the WNPAC to SST anomalies. Evidence
suggests that the weakened impact of TIO SSTA on the
WNPAC plays a crucial role for the weakened anoma-
lous WNPAC during the El Niño–decaying summer,
and the weakened impact of the TIO on the anomalous
WNPACoriginates from themean-state warming rather
than the changes in SSTA. The proposed mechanism
based on CMIP5 models is further confirmed by nu-
merical experiments based on LBM and CAM5. The
major findings are summarized as follows:
1) Although the magnitude of SST variability of ENSO
generally remains unchanged, the anomalous
WNPAC during the El Niño–decaying summer is
projected to be weaker in a warmer climate. Based
on the multimodel median, the intensity of the
anomalous WNPAC during the El Niño–decayingsummer will be reduced by approximately 11.4% per
1K of warming with an intermodel uncertainty. The
tropical Indian Ocean plays an essential role in the
response of the anomalous WNPAC to global
warming, and the reduced sensitivity of the WNPAC
to TIO SST anomaly explains the decrease in the
intensity of the anomalous WNPAC during the El
Niño–decaying summer. Even if the SSTA over TIO
is unchanged, the intensity of the WNPAC anomaly
induced by TIO SSTA will still be reduced by ap-
proximately 15.9% per 1K of warming and is robust
among the models, because of the weakened sensi-
tivity of latent heating associated with precipitation
anomaly over TIO to local SSTA.
2) In a warmer climate, robustly stronger warm TT
anomaly is stimulated by El Niño–related SSTA, via
enhanced moist adiabatic adjustment in a moister
atmosphere. This uniformly enhanced warm TT
anomaly in the entire tropical free troposphere is
favorable for an enhanced warm SSTA over the
entire tropical oceans. But the change in the warm
SSTA over TIO in El Niño–decaying summer is
weak and insignificant, because of the offsetting
effect of the local air–sea interaction. The sub-
stantially enhanced warm TT anomaly in the free
troposphere above the generally unchanged SSTA
FIG. 10. (a) Regression coefficients of four indices in JJA onto
Niño-3.4 index in DJF. These four indices are averaged SSTA over
TIO (TIO–SST), tropical-mean SSTA (tropical–SST), departure of
TIO–SST from tropical-mean SST (TIO–SST*), and tropical-mean
tropospheric temperature (TT). The regression coefficients in 20C
and 21C are indicated by blue and red bars, respectively. (b) The
changes in the above regression coefficients per 1K of tropical
warming, with the range between the 30th and 70th percentiles
among the individual models indicated by the thin black bar.
TABLE 1. Experimental design based on CAM5.
Expt Mean-state SST SST anomalies
CON_PD Present day None
CON_PD11K Present day 1 1K None
SEN_PD Present day Regressed SSTA over the equatorial Pacific from March to August and over TIO from
June to August onto the DJF Niño-3.4 index
SEN_PD11K Present day 1 1K Regressed SSTA over the equatorial Pacific from March to August and over TIO from
June to August onto the DJF Niño-3.4 index
226 JOURNAL OF CL IMATE VOLUME 32

over TIO results in a more stable boundary layer,
which is unfavorable for the development of con-
vection over TIO during the El Niño–decayingsummer. Therefore, the positive precipitation
anomaly over TIO during the El Niño–decayingsummer is weakened in the warmer climate, and
the positive latent heating anomaly over TIO is
weakened accordingly. The weakened heating
anomaly over the TIO stimulates a weakened
Kelvin wave emanating from TIO, which explains
the weakened anomalous WNPAC.
The above analyses are based on the MMM of the
climate models, and the mechanism is confirmed by
the numerical experiments by CAM5 and LBM. In the
observation and reanalysis data, the 40-yr running-
regression coefficients of WNPAC index onto DJF
Niño-3.4 index and JJA TIO–SST index have
experienced a slight rise after the late 1970s (black lines
in Fig. 13), and seem to decrease after the late 1990s.
Previous studies also showed that the capacitor effect of
the TIO is subject to substantial decadal oscillation, and
suggested that its decadal change in the observational
record originates from the internal variability of the
climate system rather than global warming (Chowdary
et al. 2012). As the phase of the internal variability is
random among the models, the internal variability is
suppressed in the MMM, and the signal associated with
GHG-forced global warming is extracted in the MMM.
How strong is the internal variability in the indi-
vidual models? By concatenating the time series of
1900–2005 in the historical experiment and 2006–99 in
the RCP8.5 experiment into time series with a length
of 200 years for the four ‘‘high skill’’ models, 40-yr
running regression of theWNPAC index onto the DJF
Niño-3.4 index and the JJA TIO–SST index are per-
formed for eachmodel. It is obvious that the anomalous
FIG. 11. (a) The difference of tropical TT in JJA between SEN_PD andCTL_PD experiments. (c) The difference
of precipitation (shading) and 850-hPa wind anomalies (vectors) in JJA between SEN_PD and CTL_PD experi-
ments. (b),(d) As in (a) and (c), but for the difference between SEN_PD11K and CTL_PD11K experiments. The
differences significant at the 95% confidence level are stippled.
FIG. 12. (a) The difference of tropical (258S–258N)-mean TT
between SEN_PD (SEN_PD11K) and CTL_PD (CTL_PD11K)
experiments. (b) As in (a), but for the precipitation averaged over
TIO (158S–158N, 508–1108E).
1 JANUARY 2019 HE ET AL . 227

WNPAC during the El Niño–decaying summer is also
subject to strong decadal oscillation instead of mono-
tonic weakening trend in every individual model (col-
ored lines in Fig. 13). The decadal oscillation of the
regressed WNPAC anomaly onto the DJF Niño-3.4 in-
dex ranges from about 0 to 0.83 1026 s21K21 (Fig. 13a),
which is much stronger than the projected change per
1K of warming by theMMM (20.033 1026 s21K21, see
Fig. 5b). The regressed anomaly of the anomalous
WNPAC to the JJA TIO–SST index is generally in
phase with those regressed onto the DJF Niño-3.4 in-
dex, suggesting themajor contribution of theTIO capacitor
effect to WNPAC during the El Niño–decaying summer.
Given that the internal variability can easily over-
whelm the GHG-forced response, it is not surprising that
the GHG-forced response is inconsistent with recent
decadal change in the reanalysis data, which may be
dominated by internal variability. As the internal vari-
ability is so strong but its phase is stochastic in coupled
climate systems, the climate change in a single model
(e.g., Zheng et al. 2011) may be dominated by internal
variability rather than GHG-forced global warming. Our
results based on 30 models are consistent with Jiang et al.
(2018), which are based on 18 selectedmodels, suggesting
that the ensemble of 18 models is sufficient to remove the
internal variability. But the proposed mechanism in this
study is completely different from Jiang et al. (2018) who
emphasized the contribution from the changes of SSTA
over WNP and the weakened SSTA gradient between
TIO and WNP. Our mechanism does not rely on the
change in SSTA but highlights that the weakened im-
pact of TIO SSTA on the atmosphere can result in a
substantially weakened anomalous WNPAC under a
warmer climate. It is possible that bothmechanisms are
at work, and quantitative assessment is needed in the
future to assess the relative contributions from these
two mechanisms.
Acknowledgments. The authors wish to acknowledge
the three anonymous reviewers for their constructive
comments, which helped to improve the quality of
the current research. This work was supported by Na-
tional Natural Science Foundation of China (41875081
and 41505067) and National Key Research and De-
velopment Program of China (2017YFA0604601 and
2017YFA0603802). Chao He wishes to thank Prof.
Masahiro Watanabe for offering the LBM code.
REFERENCES
Cash,B.A., andCoauthors, 2017: Sampling variability and the changing
ENSO–monsoon relationship. Climate Dyn., 48, 4071–4079,
https://doi.org/10.1007/s00382-016-3320-3.
Chakravorty, S., J. S. Chowdary, and C. Gnanaseelan, 2014: Ep-
ochal changes in the seasonal evolution of tropical Indian
Ocean warming associated with El Niño. Climate Dyn., 42,
805–822, https://doi.org/10.1007/s00382-013-1666-3.
Chang, C. P., Y. S. Zhang, and T. Li, 2000: Interannual and in-
terdecadal variations of the East Asian summer monsoon
and tropical Pacific SSTs. Part I: Roles of the subtropical
ridge. J. Climate, 13, 4310–4325, https://doi.org/10.1175/
1520-0442(2000)013,4310:IAIVOT.2.0.CO;2.
Chen, J.,X.Wang,W.Zhou, andZ.Wen, 2018: Interdecadal change in
the summer SST–precipitation relationship around the late 1990s
over the South China Sea. Climate Dyn., 51, 2229–2246, https://doi.org/10.1007/s00382-017-4009-y.
Chen, W., J. K. Park, B. W. Dong, R. Y. Lu, and W. S. Jung, 2012:
The relationship betweenElNiño and thewesternNorth Pacific
summer climate in a coupled GCM: Role of the transition of El
Niño decaying phases. J. Geophys. Res., 117, D12111, https://
doi.org/10.1029/2011JD017385.
——, J.-Y. Lee, K.-J. Ha, K.-S. Yun, and R. Lu, 2016: Intensification
of the western North Pacific anticyclone response to the short
decaying El Niño event due to greenhouse warming. J. Climate,
29, 3607–3627, https://doi.org/10.1175/JCLI-D-15-0195.1.
Chen, X., and T. Zhou, 2018: Relative contributions of external SST
forcing and internal atmospheric variability to July–August heat
waves over theYangtzeRiver valley.ClimateDyn., 51, 4403–4419,
https://doi.org/10.1007/s00382-017-3871-y.
Chen, Z., Z. Wen, R. Wu, X. Lin, and J. Wang, 2016: Relative im-
portance of tropical SST anomalies in maintaining the western
North Pacific anomalous anticyclone during El Niño to La Niñatransition years. Climate Dyn., 46, 1027–1041, https://doi.org/
10.1007/s00382-015-2630-1.
Chiang, J. C. H., and A. H. Sobel, 2002: Tropical tropospheric tem-
perature variations caused by ENSO and their influence on the
remote tropical climate. J. Climate, 15, 2616–2631, https://
doi.org/10.1175/1520-0442(2002)015,2616:TTTVCB.2.0.CO;2.
FIG. 13. The 40-yr running-regression coefficients of WNPAC
index in JJA (a) onto DJF Niño-3.4 index and (b) onto JJA TIO–
SST index. The thick black line is based on the 1948–2017 period of
reanalysis data, and the colored lines are based on the four high-
skill models including CESM1-CAM5 (blue), FGOALS-g2 (red),
GISS-E2-R (orange), and MIROC-ESM-CHEM (purple).
228 JOURNAL OF CL IMATE VOLUME 32

——, and B. R. Lintner, 2005: Mechanisms of remote tropical surface
warming during El Niño. J. Climate, 18, 4130–4149, https://doi.org/
10.1175/JCLI3529.1.
Chowdary, J. S., S. P. Xie, H. Tokinaga, Y. M. Okumura,
H. Kubota, N. Johnson, and X. T. Zheng, 2012: Interdecadal
variations in ENSO teleconnection to the Indo-Western Pa-
cific for 1870–2007. J. Climate, 25, 1722–1744, https://doi.org/
10.1175/JCLI-D-11-00070.1.
Deser, C., A. Phillips, V. Bourdette, and H. Teng, 2012: Un-
certainty in climate change projections: The role of internal
variability. Climate Dyn., 38, 527–546, https://doi.org/10.1007/
s00382-010-0977-x.
Du, Y., S. Xie, G. Huang, and K. Hu, 2009: Role of air–sea in-
teraction in the long persistence of El Niño–induced North In-
dian Ocean warming. J. Climate, 22, 2023–2038, https://doi.org/
10.1175/2008JCLI2590.1.
Gleckler, P. J., K. E. Taylor, and C. Doutriaux, 2008: Performance
metrics for climatemodels. J. Geophys. Res., 113, D06104, https://
doi.org/10.1029/2007JD008972.
Gu, B., Z. Zheng, G. Feng, and X.Wang, 2017: Interdecadal transition
in the relationship between the western Pacific subtropical high
and sea surface temperature. Int. J. Climatol., 37, 2667–2678,
https://doi.org/10.1002/joc.4872.
He, C., and T. Zhou, 2014: The two interannual variability modes
of the western North Pacific subtropical high simulated by 28
CMIP5–AMIP models. Climate Dyn., 43, 2455–2469, https://
doi.org/10.1007/s00382-014-2068-x.
——, and ——, 2015: Decadal change of the connection between
summer western North Pacific subtropical high and tropical
SST in the early 1990s. Atmos. Sci. Lett., 16, 253–259, https://
doi.org/10.1002/asl2.550.
——, ——, and B. Wu, 2015: The key oceanic regions responsible for
the interannual variability of thewesternNorth Pacific subtropical
high and associated mechanisms. J. Meteor. Res., 29, 562–575,
https://doi.org/10.1007/s13351-015-5037-3.
——,A. Lin, D.Gu, C. Li, B. Zheng, B.Wu, and T. Zhou, 2018: Using
eddy geopotential height to measure the western North Pacific
subtropical high in a warming climate. Theor. Appl. Climatol.,
131, 681–691, https://doi.org/10.1007/s00704-016-2001-9.Hong, C.-C., T.-C. Chang, and H.-H. Hsu, 2014: Enhanced re-
lationship between the tropical Atlantic SST and the summer-
time western North Pacific subtropical high after the early
1980s. J. Geophys. Res. Atmos., 119, 3715–3722, https://doi.org/
10.1002/2013JD021394.
Hu, K., G. Huang, X.-T. Zheng, S.-P. Xie, X. Qu, Y. Du, and L. Liu,
2014: Interdecadal variations in ENSO influences on Northwest
Pacific–East Asian early summertime climate simulated in
CMIP5 models. J. Climate, 27, 5982–5998, https://doi.org/
10.1175/JCLI-D-13-00268.1.
Hu, X., M. Cai, S. Yang, and Z. Wu, 2018: Delineation of ther-
modynamic and dynamic responses to sea surface temperature
forcing associated with El Niño. Climate Dyn., 51, 4329–4344,
https://doi.org/10.1007/s00382-017-3711-0.
Huang, B., and Coauthors, 2017: Extended Reconstructed Sea
Surface Temperature, Version 5 (ERSSTv5): Upgrades,
validations, and intercomparisons. J. Climate, 30, 8179–8205,
https://doi.org/10.1175/JCLI-D-16-0836.1.
Huang, G., K. M. Hu, and S. P. Xie, 2010: Strengthening of tropical
Indian Ocean teleconnection to the Northwest Pacific since
the mid-1970s: An atmospheric GCM study. J. Climate, 23,
5294–5304, https://doi.org/10.1175/2010JCLI3577.1.
Huang, P., D. Chen, and J. Ying, 2017: Weakening of the tropical at-
mospheric circulation response to local sea surface temperature
anomalies under global warming. J. Climate, 30, 8149–8158,
https://doi.org/10.1175/JCLI-D-17-0171.1.
Huang, R. H., and F. Y. Sun, 1992: Impacts of the tropical western
Pacific on the East Asian Summer Monsoon. J. Meteor. Soc.
Japan, 70, 243–256, https://doi.org/10.2151/jmsj1965.70.1B_243.
Huang, Y., H. Wang, K. Fan, and Y. Gao, 2015: The western Pacific
subtropical high after the 1970s: Westward or eastward shift? Cli-
mateDyn., 44, 2035–2047, https://doi.org/10.1007/s00382-014-2194-5.
Hurrell, J. W., J. J. Hack, D. Shea, J. M. Caron, and J. Rosinski,
2008: A new sea surface temperature and sea ice boundary
dataset for the CommunityAtmosphereModel. J. Climate, 21,
5145–5153, https://doi.org/10.1175/2008JCLI2292.1.
IPCC, 2013: Climate Change 2013: The Physical Science Basis.
Cambridge University Press, 1535 pp., https://doi.org/10.1017/
CBO9781107415324.
Jiang, W., G. Huang, P. Huang, and K. Hu, 2018: Weakening of
northwest Pacific anticyclone anomalies during post–El Niñosummers under global warming. J. Climate, 31, 3539–3555,
https://doi.org/10.1175/JCLI-D-17-0613.1.
Jin, Q., X.-Q. Yang, X.-G. Sun, and J.-B. Fang, 2013: East Asian
summermonsoon circulation structure controlled by feedback
of condensational heating. Climate Dyn., 41, 1885–1897,
https://doi.org/10.1007/s00382-012-1620-9.
Johnson, N. C., and S.-P. Xie, 2010: Changes in the sea surface
temperature threshold for tropical convection.Nat. Geosci., 3,
842–845, https://doi.org/10.1038/ngeo1008.
Kalnay, E., and Coauthors, 1996: The NCEP/NCAR 40-Year Re-
analysis Project. Bull. Amer. Meteor. Soc., 77, 437–471, https://
doi.org/10.1175/1520-0477(1996)077,0437:TNYRP.2.0.CO;2.
Kumar, A., and Z.-Z. Hu, 2012: Uncertainty in the ocean–
atmosphere feedbacks associated with ENSO in the re-
analysis products. Climate Dyn., 39, 575–588, https://doi.org/
10.1007/s00382-011-1104-3.
Li, S. L., J. Lu,G.Huang, andK.M.Hu, 2008: Tropical IndianOcean
basin warming and East Asian summer monsoon: A multiple
AGCM study. J. Climate, 21, 6080–6088, https://doi.org/10.1175/
2008JCLI2433.1.
Li, T., B.Wang, B.Wu, and T. Zhou, 2017: Theories on formation of
an anomalous anticyclone in western North Pacific during El
Niño: A review. J. Meteor. Res., 31, 987–1006, https://doi.org/
10.1007/s13351-017-7147-6.
Li, X., W. Zhou, D. Chen, C. Li, and J. Song, 2014: Water vapor
transport and moisture budget over eastern China: Remote
forcing from the two types of El Niño. J. Climate, 27, 8778–
8792, https://doi.org/10.1175/JCLI-D-14-00049.1.
Neale, R. B., and Coauthors, 2012: Description of the NCAR
Community Atmosphere Model (CAM 5.0). NCAR Tech.
Note NCAR/TN-4861STR, 274 pp., www.cesm.ucar.edu/
models/cesm1.0/cam/docs/description/cam5_desc.pdf.
Nitta, T., 1987: Convective activities in the tropical western Pacific
and their impact on the Northern Hemisphere summer cir-
culation. J. Meteor. Soc. Japan, 65, 373–390, https://doi.org/
10.2151/jmsj1965.65.3_373.
Power, S. B., F. Delage, R. Colman, andA.Moise, 2012: Consensus on
twenty-first-century rainfall projections in climate models more
widespread than previously thought. J. Climate, 25, 3792–3809,
https://doi.org/10.1175/JCLI-D-11-00354.1.
Rong, X., R. Zhang, and T. Li, 2010: Impacts of Atlantic sea surface
temperature anomalies on Indo-East Asian summer monsoon–
ENSO relationship. Chin. Sci. Bull., 55, 2458–2468, https://doi.
org/10.1007/s11434-010-3098-3.
Song, F., and T. Zhou, 2014a: Interannual variability of East Asian
summermonsoon simulatedbyCMIP3andCMIP5AGCMs: Skill
1 JANUARY 2019 HE ET AL . 229

dependence on Indian Ocean–western Pacific anticyclone tele-
connection. J. Climate, 27, 1679–1697, https://doi.org/10.1175/
JCLI-D-13-00248.1.
——, and ——, 2014b: The climatology and interannual var-
iability of East Asian summer monsoon in CMIP5 cou-
pled models: Does air–sea coupling improve the simulations?
J.Climate,27, 8761–8777, https://doi.org/10.1175/JCLI-D-14-00396.1.
——, and ——, 2015: The crucial role of internal variability in modu-
lating the decadal variation of the East Asian summer monsoon–
ENSO relationship during the twentieth century. J. Climate, 28,
7093–7107, https://doi.org/10.1175/JCLI-D-14-00783.1.
Stevenson, S., B. Fox-Kemper, M. Jochum, R. Neale, C. Deser, and
G. Meehl, 2012: Will there be a significant change to El Niño in
the twenty-first century? J. Climate, 25, 2129–2145, https://doi.org/
10.1175/JCLI-D-11-00252.1.
Stuecker,M. F., F.-F. Jin, A. Timmermann, and S.McGregor, 2015:
Combination mode dynamics of the anomalous northwest
Pacific anticyclone. J. Climate, 28, 1093–1111, https://doi.org/
10.1175/JCLI-D-14-00225.1.
Sui, C.H., P.H.Chung, andT.Li, 2007: Interannual and interdecadal
variability of the summertime western North Pacific subtropical
high. Geophys. Res. Lett., 34, L11701, https://doi.org/10.1029/
2006GL029204.
Tao, W., G. Huang, K. Hu, X. Qu, G. Wen, and H. Gong, 2015:
Interdecadal modulation of ENSO teleconnections to the In-
dian Ocean Basin Mode and their relationship under global
warming in CMIP5 models. Int. J. Climatol., 35, 391–407,
https://doi.org/10.1002/joc.3987.
Taylor, K. E., R. J. Stouffer, andG.A.Meehl, 2012: An overview of
CMIP5 and the experiment design. Bull. Amer. Meteor. Soc.,
93, 485–498, https://doi.org/10.1175/BAMS-D-11-00094.1.
Terao,T., andT.Kubota, 2005:East-west SSTcontrast over the tropical
oceans and the post El Niño western North Pacific summer
monsoon.Geophys. Res. Lett., 32, L15706, https://doi.org/10.1029/
2005GL023010.
van Vuuren, D., and Coauthors, 2011: The representative con-
centration pathways: An overview. Climatic Change, 109, 5–
31, https://doi.org/10.1007/s10584-011-0148-z.
Wang, B., R. G. Wu, and X. H. Fu, 2000: Pacific–East Asian telecon-
nection: How does ENSO affect East Asian climate? J. Climate,
13, 1517–1536, https://doi.org/10.1175/1520-0442(2000)013,1517:
PEATHD.2.0.CO;2.
——, B. Xiang, and J.-Y. Lee, 2013: Subtropical high predictability
establishes a promising way for monsoon and tropical storm
predictions. Proc. Natl. Acad. Sci. USA, 110, 2718–2722, https://
doi.org/10.1073/pnas.1214626110.
Watanabe, M., and M. Kimoto, 2000: Atmosphere-ocean thermal
coupling in the North Atlantic: A positive feedback. Quart.
J. Roy. Meteor. Soc., 126, 3343–3369, https://doi.org/10.1002/
qj.49712657017.
Wu, B., and T. Zhou, 2016: Relationships between ENSO and the
East Asian–western North Pacific monsoon: Observations
versus 18 CMIP5 models. Climate Dyn., 46, 729–743, https://
doi.org/10.1007/s00382-015-2609-y.
——, T. J. Zhou, and T. Li, 2009a: Seasonally evolving dominant
interannual variability modes of East Asian climate. J. Climate,
22, 2992–3005, https://doi.org/10.1175/2008JCLI2710.1.
——,——, and——, 2009b: Contrast of rainfall–SST relationships
in the western North Pacific between the ENSO-developing
and ENSO-decaying summers. J. Climate, 22, 4398–4405,
https://doi.org/10.1175/2009JCLI2648.1.
——, T. Li, and T. J. Zhou, 2010: Relative contributions of the
Indian Ocean and local SST anomalies to the maintenance of
the westernNorth Pacific anomalous anticyclone during theEl
Niño decaying summer. J. Climate, 23, 2974–2986, https://doi.org/10.1175/2010JCLI3300.1.
——, T. Zhou, and T. Li, 2017: Atmospheric dynamic and ther-
modynamic processes driving the western North Pacific
anomalous anticyclone during El Niño. Part I: Maintenance
mechanisms. J. Climate, 30, 9621–9635, https://doi.org/10.1175/
JCLI-D-16-0489.1.
Xiang, B., B. Wang, W. Yu, and S. Xu, 2013: How can anomalous
western North Pacific subtropical high intensify in late sum-
mer? Geophys. Res. Lett., 40, 2349–2354, https://doi.org/
10.1002/grl.50431.
Xie, S.-P., K. M. Hu, J. Hafner, H. Tokinaga, Y. Du, G. Huang, and
T. Sampe, 2009: Indian Ocean capacitor effect on Indo-western
Pacific climate during the summer followingElNiño. J. Climate,
22, 730–747, https://doi.org/10.1175/2008JCLI2544.1.
——, Y. Du, G. Huang, X. T. Zheng, H. Tokinaga, K. M. Hu,
and Q. Y. Liu, 2010: Decadal shift in El Niño influences
on Indo-western Pacific and East Asian climate in the
1970s. J. Climate, 23, 3352–3368, https://doi.org/10.1175/2010JCLI3429.1.
——,Y.Kosaka, Y.Du, K.Hu, J. S. Chowdary, andG. Huang, 2016:
Indo-western Pacific Ocean capacitor and coherent climate
anomalies in post-ENSO summer: A review. Adv. Atmos. Sci.,
33, 411–432, https://doi.org/10.1007/s00376-015-5192-6.
Yanai,M., andT.Tomita, 1998: Seasonal and interannual variability of
atmospheric heat sources and moisture sinks as determined from
NCEP–NCAR reanalysis. J. Climate, 11, 463–482, https://doi.org/10.1175/1520-0442(1998)011,0463:SAIVOA.2.0.CO;2.
Yang, J. L., Q. Y. Liu, S. P. Xie, Z. Y. Liu, and L. X. Wu, 2007:
Impact of the Indian Ocean SST basin mode on the Asian
summer monsoon. Geophys. Res. Lett., 34, L02708, https://
doi.org/10.1029/2006GL028571.
Zhang, R. H., A. Sumi, andM. Kimoto, 1999: A diagnostic study of
the impact of El Niño on the precipitation in China. Adv.
Atmos. Sci., 16, 229–241, https://doi.org/10.1007/BF02973084.
——, Q. Min, and J. Su, 2017: Impact of El Niño on atmospheric
circulations over East Asia and rainfall in China: Role of the
anomalouswesternNorth Pacific anticyclone. Sci. ChinaEarth
Sci., 60, 1124, https://doi.org/10.1007/s11430-016-9026-x.
Zhang, W., and Coauthors, 2016: Unraveling El Niño’s impact on
the East AsianMonsoon and Yangtze River summer flooding.
Geophys. Res. Lett., 43, 11375–11382, https://doi.org/10.1002/2016GL071190.
Zheng, X. T., S. P. Xie, and Q. Y. Liu, 2011: Response of the
Indian Ocean basin mode and its capacitor effect to global
warming. J. Climate, 24, 6146–6164, https://doi.org/10.1175/
2011JCLI4169.1.
——,——,L.-H. Lv, andZ.-Q. Zhou, 2016: Intermodel uncertainty
in ENSO amplitude change tied to Pacific Ocean warming
pattern. J. Climate, 29, 7265–7279, https://doi.org/10.1175/
JCLI-D-16-0039.1.
230 JOURNAL OF CL IMATE VOLUME 32