Weak influences of climate and mineral supply rates on...
21
Weak influences of climate and mineral supply rates on chemical erosion rates: Measurements along two altitudinal transects in the Idaho Batholith Ken L. Ferrier, 1 James W. Kirchner, 2,3,4 and Robert C. Finkel 3,5 Received 23 September 2011; revised 13 March 2012; accepted 26 March 2012; published 22 May 2012. [1] Chemical weathering promotes regolith production, physical erosion, nutrient supply, and drawdown of atmospheric CO 2 . Although mineral dissolution rates show dependences on temperature and moisture in theoretical models and laboratory experiments, effects of climate on chemical erosion rates in nature remain uncertain, in part because variations in physical erosion rates and lithology can obscure climatic signals in chemical erosion rate measurements. Here we present new estimates of millennial-scale chemical and physical erosion rates along two altitudinal transects in the Idaho Batholith. Our measurements suggest that chemical erosion rates and the extent of regolith chemical alteration are insensitive to mean annual regolith temperature, even though the study sites span a wide range in temperatures (4.8 C–10.9 C). These data also suggest that rates of chemical erosion and the extent of regolith chemical alteration are weakly correlated with the annual duration of high regolith moisture conditions. Lastly, our measurements show that the sampled regoliths tend to grow more chemically weathered with increasing regolith residence time, implying that weathering at these sites is primarily limited by mineral dissolution kinetics rather than mineral supply rates to the regolith. The lack of strong control by mineral supply means that chemical erosion rates at these sites could potentially vary in response to climatic factors. Such climatically driven variation in chemical erosion rates is not obvious in our data, however. Instead, our measurements suggest that chemical erosion rates at these sites are insensitive to mean annual regolith temperature and only weakly dependent on the length of the wet season. Citation: Ferrier, K. L., J. W. Kirchner, and R. C. Finkel (2012), Weak influences of climate and mineral supply rates on chemical erosion rates: Measurements along two altitudinal transects in the Idaho Batholith, J. Geophys. Res., 117, F02026, doi:10.1029/2011JF002231. 1. Introduction [2] Consider a fly fisherman standing in a mountain stream. Many aspects of his surroundings have been affected by chemical weathering. The soils on the adjacent hillslopes developed in part through chemical weathering of the parent rock, and the trees growing in those soils derive many of their nutrients from solutes liberated by mineral dissolution. The river running down the valley axis contains weathering- derived solutes that nourish the fish he is trying to catch, and the shapes of the ridges and valleys above him have been influenced by chemical weathering through its weakening of bedrock and its acceleration of physical erosion. The temper- ature of the air around him has also been affected by chemical weathering. Over long timescales (>10 5 years), chemical weathering of silicate minerals is Earth’s primary sink for atmospheric CO 2 , and so modulates Earth’s temperature via the greenhouse effect [Walker et al., 1981; Berner et al., 1983]. As such, chemical weathering is the primary cause of Earth’s long-term climatic stability [Kump et al., 2000], and therefore one of the reasons that a mountain stream is a com- fortable place to fish at all. [3] Because chemical weathering is central to many important components of the Earth system—regolith devel- opment, landscape evolution, nutrient supply, and climate— quantifying the controls on rates of chemical weathering is of wide interest. Although there has been considerable prog- ress in understanding how climatic variables affect mineral 1 Department of Earth, Atmospheric, and Planetary Sciences, Massachusetts Institute of Technology, Cambridge, Massachusetts, USA. 2 Swiss Federal Institute for Forest, Snow, and Landscape Research, Birmensdorf, Switzerland. 3 Department of Earth and Planetary Science, University of California Berkeley, Berkeley, California, USA. 4 Department of Environmental Sciences, Swiss Federal Institute of Technology, Zürich, Switzerland. 5 Center for Accelerator Mass Spectrometry, Lawrence Livermore National Laboratory, Livermore, California, USA. Corresponding author: K. L. Ferrier, Department of Earth, Atmospheric, and Planetary Sciences, Massachusetts Institute of Technology, 77 Massachusetts Ave., Cambridge, MA 02139, USA. ([email protected]) Copyright 2012 by the American Geophysical Union. 0148-0227/12/2011JF002231 JOURNAL OF GEOPHYSICAL RESEARCH, VOL. 117, F02026, doi:10.1029/2011JF002231, 2012 F02026 1 of 21
Transcript of Weak influences of climate and mineral supply rates on...
Weak influences of climate and mineral supply rates on chemicalerosion rates: Measurements along two altitudinal transectsin the Idaho Batholith
Ken L. Ferrier,1 James W. Kirchner,2,3,4 and Robert C. Finkel3,5
Received 23 September 2011; revised 13 March 2012; accepted 26 March 2012; published 22 May 2012.
[1] Chemical weathering promotes regolith production, physical erosion, nutrient supply,and drawdown of atmospheric CO2. Although mineral dissolution rates show dependenceson temperature and moisture in theoretical models and laboratory experiments, effectsof climate on chemical erosion rates in nature remain uncertain, in part because variationsin physical erosion rates and lithology can obscure climatic signals in chemical erosion ratemeasurements. Here we present new estimates of millennial-scale chemical and physicalerosion rates along two altitudinal transects in the Idaho Batholith. Our measurementssuggest that chemical erosion rates and the extent of regolith chemical alteration areinsensitive to mean annual regolith temperature, even though the study sites span a widerange in temperatures (4.8�C–10.9�C). These data also suggest that rates of chemicalerosion and the extent of regolith chemical alteration are weakly correlated with the annualduration of high regolith moisture conditions. Lastly, our measurements show that thesampled regoliths tend to grow more chemically weathered with increasing regolithresidence time, implying that weathering at these sites is primarily limited by mineraldissolution kinetics rather than mineral supply rates to the regolith. The lack of strongcontrol by mineral supply means that chemical erosion rates at these sites could potentiallyvary in response to climatic factors. Such climatically driven variation in chemical erosionrates is not obvious in our data, however. Instead, our measurements suggest that chemicalerosion rates at these sites are insensitive to mean annual regolith temperature and onlyweakly dependent on the length of the wet season.
Citation: Ferrier, K. L., J. W. Kirchner, and R. C. Finkel (2012), Weak influences of climate and mineral supply rates onchemical erosion rates: Measurements along two altitudinal transects in the Idaho Batholith, J. Geophys. Res., 117, F02026,doi:10.1029/2011JF002231.
1. Introduction
[2] Consider a fly fisherman standing in a mountain stream.Many aspects of his surroundings have been affected bychemical weathering. The soils on the adjacent hillslopesdeveloped in part through chemical weathering of the parent
rock, and the trees growing in those soils derive many of theirnutrients from solutes liberated by mineral dissolution. Theriver running down the valley axis contains weathering-derived solutes that nourish the fish he is trying to catch, andthe shapes of the ridges and valleys above him have beeninfluenced by chemical weathering through its weakening ofbedrock and its acceleration of physical erosion. The temper-ature of the air around him has also been affected by chemicalweathering. Over long timescales (>105 years), chemicalweathering of silicate minerals is Earth’s primary sink foratmospheric CO2, and so modulates Earth’s temperature viathe greenhouse effect [Walker et al., 1981; Berner et al.,1983]. As such, chemical weathering is the primary cause ofEarth’s long-term climatic stability [Kump et al., 2000], andtherefore one of the reasons that a mountain stream is a com-fortable place to fish at all.[3] Because chemical weathering is central to many
important components of the Earth system—regolith devel-opment, landscape evolution, nutrient supply, and climate—quantifying the controls on rates of chemical weathering isof wide interest. Although there has been considerable prog-ress in understanding how climatic variables affect mineral
1Department of Earth, Atmospheric, and Planetary Sciences, MassachusettsInstitute of Technology, Cambridge, Massachusetts, USA.
2Swiss Federal Institute for Forest, Snow, and Landscape Research,Birmensdorf, Switzerland.
3Department of Earth and Planetary Science, University of CaliforniaBerkeley, Berkeley, California, USA.
4Department of Environmental Sciences, Swiss Federal Institute ofTechnology, Zürich, Switzerland.
5Center for Accelerator Mass Spectrometry, Lawrence LivermoreNational Laboratory, Livermore, California, USA.
Corresponding author: K. L. Ferrier, Department of Earth, Atmospheric,and Planetary Sciences, Massachusetts Institute of Technology, 77Massachusetts Ave., Cambridge, MA 02139, USA. ([email protected])
Copyright 2012 by the American Geophysical Union.0148-0227/12/2011JF002231
JOURNAL OF GEOPHYSICAL RESEARCH, VOL. 117, F02026, doi:10.1029/2011JF002231, 2012
F02026 1 of 21
dissolution rates in theory and in the laboratory [e.g., Bradyand Carroll, 1994; Blum and Stillings, 1995; Chen andBrantley, 1997; White et al., 1999; White and Brantley,2003], conclusions differ about the extent to which climateaffects chemical weathering rates in nature. Many studies havequantified the effects of temperature on chemical weatheringrates by fitting observational data to an Arrhenius function inwhich weathering rates are proportional to eEa /RT, where Ea isan apparent activation energy for the weathering reaction, R isthe universal gas constant, and T is temperature. Using mea-surements of chemical weathering rates across a range oftemperatures, it is possible to estimate a best-fit value for Ea,which reflects how strongly mineral dissolution rates dependon temperature. Values for Ea vary from one mineral to thenext [Kump et al., 2000], but there is considerable disagree-ment in field-derived estimates of Ea even for individualmineral phases. For plagioclase alone, field-derived estimatesofEa vary bymore than a factor of five from 14 to 77 kJmol�1
[Velbel, 1993; White and Blum, 1995; Riebe et al., 2004a],making it difficult to assess how strongly chemical weatheringrates should depend on temperature. Recent modeling by[Lebedeva et al., 2010] suggests that accounting for reactionenthalpy in addition to Eamay resolve some of the differencesamong field studies in the temperature sensitivity of mineraldissolution, but this remains to be widely tested against fieldmeasurements of mineral dissolution rates.[4] Climate also influences chemical erosion rates through
precipitation, which promotes mineral dissolution by supply-ing moisture to mineral surfaces in the regolith. Precipitationalso promotes fluxes of water through the regolith, whichreduce the concentrations of mineral dissolution products inregolith pore water and thereby drive net dissolution reactionsforward. All else being equal, chemical erosion rates shouldincrease with increasing moisture. This is broadly supportedby compilations of measured chemical erosion rates that gen-erally increase with mean annual precipitation, runoff, orwater availability, albeit with considerable scatter [e.g., Bluthand Kump, 1994; Millot et al., 2002; Dupre et al., 2003;Riebe et al., 2004a;West et al., 2005; Rasmussen et al., 2011].These compilations have been made over a series of climati-cally diverse sites around the globe, an approach that has theadvantage of being able to exploit the widest possible range ofclimates. However, this approach is vulnerable to site-to-sitevariations in other factors that may also affect chemical ero-sion rates, such as lithology, physical erosion rates, vegetation,and human activity, which can confound interpretation of cli-mate’s effects on chemical erosion rates, and which may beresponsible for much of the scatter in these compilations. Analternative approach is to measure chemical erosion rates at aseries of sites along an altitudinal transect. Because climatechanges continuously with altitude, and because altitudinaltransects can lie along a single mountainside and thus within asmall area, this approach is able to minimize variations inconfounding variables like lithology and rock uplift rateswhile maximizing climatic variations. That is the approach wehave taken in this study.[5] Some prior studies along altitudinal transects have
found that chemical erosion rates decrease with altitude (andhence with mean annual temperature), although the rate atwhich chemical erosion rates decline with altitude varies
considerably among studies. [Drever and Zobrist, 1992]measured net alkalinity and silica concentrations in streamwater along an altitudinal gradient extending from 220 m to2400 m above sea level in the Swiss Alps, and found that bothof these proxies for chemical weathering fluxes decreasedapproximately exponentially with altitude. They suggestedthat some of this decrease could be a consequence of thedecrease in temperature with altitude, but that most of it isrelated to the corresponding decrease in soil thickness withaltitude at these field sites. Thus they did not attribute differ-ences in chemical weathering fluxes along this transect strictlyto differences in climate, but rather to a combination of factorsrelated to climate and mineral supply. In the Applachian BlueRidge province, [Velbel, 1993] inferred plagioclase weather-ing rates from Na stream solute fluxes in two neighboringcatchments with mean elevations of 849 m and 1019 m,respectively, and found that plagioclase weathering rates were13% faster in the lower (and hence warmer) catchment. Velbelsuggested that this field setting was ideally suited for isolatingthe effect of temperature on chemical weathering fluxes,because the relatively small difference in altitude betweenthese two catchments produced few differences in factorsbesides temperature. In an altitudinal transect extending from2090 m to 2750 m above sea level in the Santa Rosa Moun-tains of Nevada, [Riebe et al., 2004b] found that the enrich-ment of chemically immobile Zr in soil relative to its parentrock decreased sharply with elevation, such that the extent ofregolith chemical alteration became indistinguishable fromzero at the summit. They combined these Zr-based chemicalweathering intensities with denudation rates inferred fromcosmogenic 10Be in regolith-borne quartz to show that chem-ical erosion rates decreased rapidly with elevation, suggestingthat changes in climate and the associated changes in vegeta-tion can greatly affect chemical erosion rates. In contrast tothese continuous declines in chemical erosion rates with ele-vation, a recent study along an elevation transect spanningnearly 3 km in altitude in California’s Sierra Nevada con-cluded that total chemical erosion rates—calculated as thesum of chemical erosion rates in the saprolite and the overly-ing soil—were fastest at intermediate elevations [Dixon et al.,2009a]. Because mean annual temperature drops with eleva-tion and mean annual precipitation increases with elevationalong this transect,Dixon et al. [2009a] interpreted this patternas a reflection of temperature-limited weathering at high alti-tudes and moisture-limited weathering at low altitudes.[6] These chemical erosion rate studies are complemented
by studies that have measured the extent, rather than the rate,of chemical alteration in regoliths along altitudinal transects.[Grieve et al., 1990] measured soil properties along a altitu-dinal transect extending from 100 m to 2600 m in altitude inCosta Rica, and found that the degree of soil chemical alter-ation, as inferred from soil clay content and the ratio of free tototal iron, decreased systematically with elevation. [Dahlgrenet al., 1997], in a study of soil development along an eleva-tion transect extending from 198 m to 2865 m above sea levelin the Sierra Nevada of California, found that two proxies forthe degree of soil chemical alteration (total Fe oxide and claycontents in the soil column), were both greatest at intermediatealtitudes and dropped off at higher and lower altitudes. Theauthors interpreted this pattern as a reflection of optimal
FERRIER ET AL.: CLIMATE AND CHEMICAL EROSION RATES F02026F02026
2 of 21

weathering conditions at intermediate altitudes, with weath-ering at high altitudes limited by cold temperatures andweathering at low altitudes limited by a lack of moisture. Theyalso suggested this pattern might reflect site-to-site differencesin the phase of precipitation, because precipitation at the lowaltitude sites is dominated by rain (which may easily infil-trate into soil and thus promote chemical weathering),whereas precipitation at the high altitude sites is dominatedby snow (which may lose more of its water to runoff andsublimation and thus lead to slower chemical weathering).[Bockheim et al., 2000] examined a number of stable pedonsalong an altitudinal transect extending from 2700 m to 3850 min the Uinta Mountains of Utah, and found that a number ofproxies for chemical weathering intensity (clay content,exchangeable cations, extractable Al, and solum thickness)were highest at the highest elevation sites. Rather thanascribing this pattern to differences in climate, however, theysuggested that this may merely reflect the older age of thehigh-elevation soils. [Egli et al., 2003, 2004, 2006] investi-gated soil properties along two altitudinal gradients extendingfrom 950 m to 2440 m above sea level in the Italian Alps.Using the enrichment of chemically immobile Ti in upper soilhorizons relative to a parent C horizon, they found thatchemical losses of base cations were highest at intermediateelevations, although they found no altitudinal trends in totalchemical losses. They also found that smectite concentrationswere highest at intermediate elevations, and concluded that thedegree of soil chemical alteration was primarily driven by theflux and availability of water. Thus some of these studies havefound that the highest altitude soils are the least weathered,while others have found that the highest altitude soils are themost weathered, and yet others have concluded that the mostintensely weathered soils are at intermediate altitudes.[7] In summary, altitudinal patterns in both chemical ero-
sion rates and the degree of soil chemical alteration differmarkedly between studies, and this clouds interpretationsabout how climate should affect chemical erosion rates andsoil development elsewhere. In this contribution, we documentchemical and physical erosion rates along two altitudinal (andhence climatic) transects in the canyon of the South Fork of theSalmon River in central Idaho (Figure 1). We measured theserates using a solid-phase mass balance technique that yieldsco-located estimates of long-term chemical and physical ero-sion rates [Stallard, 1985; Riebe et al., 2001], which permits usto directly account for the potentially confounding effects ofphysical erosion rates and dust on chemical erosion rates.Before discussing the study sites, we first present the con-ceptual framework we use to estimate long-term chemical andphysical erosion rates.
2. Measuring Chemical and Physical ErosionRates With Cosmogenic Nuclides and ElementalAbundances in Regolith, Rock, and Dust
[8] An increasingly popular method for estimating chemicalerosion rates in eroding terrain is the solid-phase mass balancemethod, which combines regolith production rates with rock-to-regolith enrichments of chemically immobile elementswithin a mass balance framework. As in [Ferrier et al., 2011],here and elsewhere in this paper we use the term regolith as it
is conventionally applied in the geomorphic literature, that is,as the layer of physically mobile material that overliesunweathered bedrock and saprolite. This usage is equivalent tothe definition of soil in some studies [e.g., Heimsath et al.,1997] and the definition of the physically disturbed zone in[Yoo and Mudd, 2008], and it diverges from the conventionalgeochemical definition of regolith as all of the materialbetween unweathered bedrock and the land surface, includ-ing layers of weathered rock and saprolite that are notphysically mobile [e.g., Brantley et al., 2011]. This geo-chemical mass balance method, as conventionally applied,assumes that regolith thickness and composition are steadyin time and that the regolith is strictly a weathering productof the local bedrock (i.e., that contributions to the regolithfrom atmospheric deposition are negligible) [Riebe et al.,2001, 2003, 2004b; Green et al., 2006; Yoo et al., 2007;Burke et al., 2007, 2009; Dixon et al., 2009b, 2009a]. Herewe use the same method but add atmospheric dust deposi-tion to the regolith mass balance, using the approach devel-oped in [Ferrier et al., 2011].[9] At its core, this is a steady state mass balance method.
That is, its central assumption is that the regolith is in steadystate over the regolith residence time, both in terms of itsmass per unit area of hillslope and in terms of its composi-tion. This assumption demands that the total rate of massaddition to the regolith, P, must be balanced by the regolithdenudation rate D. Similarly, it demands that the influx ofeach element X to the regolith must be balanced by physicaland chemical denudation of X from the regolith. This can bemade more concrete by considering a hillslope regolith suchas the one pictured in Figure 2. Here mass is incorporatedinto the regolith through two pathways: first, by regolithproduction from below at a rate Pr, and second, by dustdeposition from above at a rate Pd. The regolith denudationrate D is the sum of the mass loss rates by physical processes(e.g., biotic and aboitic creep) at a physical erosion rate E,and by chemical processes (e.g., mineral dissolution anddownslope solute transport) at a chemical erosion rate W.Assuming that downslope gradients in regolith chemistry arenegligible—a good approximation at hilltops and ridgelines[Mudd and Furbish, 2006; Yoo et al., 2007]—the steadystate mass balance equations for the bulk regolith and for anelement X may be written as follows.
P ¼ Pr þ Pd ¼ D ¼ E þW ð1Þ
PX ¼ PrXr þ PdXd ¼ DX ¼ EXs þWX ð2Þ
Here Pr is the regolith production rate from bedrock (M L�2
T�1), Pd is the dust incorporation rate into regolith (M L�2
T�1), P is the total mass flux into the regolith from bedrockand dust (M L�2 T�1), PX is the total supply rate of elementX to the regolith (M L�2 T�1), E is the physical erosion rate(M L�2 T�1), WX is the chemical erosion rate of X (M L�2
T�1), and Xr, Xs, and Xd are the concentrations (M/M) of X inthe rock, regolith, and dust, respectively.[10] In the case of a chemically immobile element (e.g.,
Zr), WZr = 0 and equation (2) may be solved for the physicalerosion rate E (equation (3)). This expression for E may besubstituted into equations (1) and (2) to yield expressions for
FERRIER ET AL.: CLIMATE AND CHEMICAL EROSION RATES F02026F02026
3 of 21

the bulk chemical erosion rate W and the elemental chemicalerosion rate WX.
E ¼ PrZrrZrs
þ PdZrdZrs
ð3Þ
W ¼ Pr 1� ZrrZrs
� �þ Pd 1� Zrd
Zrs
� �ð4Þ
WX ¼ Pr Xr � XsZrrZrs
� �þ Pd Xd � Xs
ZrdZrs
� �ð5Þ
Application of this framework for estimating long-termchemical and physical erosion rates has become more com-mon over the past decade thanks to advances in cosmogenicnuclide geochemistry, which now permit regolith productionrates to be inferred from concentrations of cosmogenicnuclides within minerals in the regolith or its parent rock.Regolith production rates inferred from cosmogenic 10Be inquartz, for example, have now been used in several studiesto estimate long-term chemical and physical erosion ratesunder the assumption that dust deposition is an insignificantcomponent of the mass balance (i.e., that Pd → 0) [Riebe
Figure 1. Field sites at Pilot Peak and Tailholt Mountain, on a shaded relief map generated from a 10-meterUSGS DEM. Site identifiers (e.g., P1264N) indicate the mountain (“P” = Pilot Peak, “T” = Tailholt Moun-tain), altitude in meters, and, where paired samples were collected on opposite sides of a ridgeline at the samealtitude, slope aspect (“N” = north, “S” = south). The black square in the inset map shows the location of thestudy area in Idaho.
Figure 2. Conceptual mass balance model for estimatingphysical and chemical erosion rates on a regolith-mantledhillslope. In steady state, mass fluxes into the regolith (i.e.,the sum of the regolith production rate Pr and the dust incor-poration rate Pd) are balanced by the denudation flux out ofthe regolith, D. If the magnitudes of Pr and Pd are known,concentrations of an immobile element (e.g., Zr) in the bed-rock, regolith, and dust can reveal the magnitudes of thephysical erosion rate E and chemical erosion rate W.
FERRIER ET AL.: CLIMATE AND CHEMICAL EROSION RATES F02026F02026
4 of 21

et al., 2001, 2003, 2004b, 2004a; Green et al., 2006; Yooet al., 2007; Burke et al., 2007, 2009; Dixon et al., 2009b,2009a]. In places where dust fluxes are significant,equations (3)–(5) show that chemical and physical erosionrate estimates require measurements of the magnitude andthe composition of the dust flux, as well as the composi-tions of the regolith and its parent rock. From a practicalstandpoint, at some field sites measurements of Pd maynot be available, and it may be difficult to estimate Pd
over the long regolith residence times relevant to thesemass balance equations. Even if no measurements of dustincorporation rates are available at a given field site,however, it may be possible to use geologic considerationsto pinpoint the dust source and constrain the probable dustcomposition. [Ferrier et al., 2011] showed that if one canconstrain the dust composition, this mass balance frame-work may be used to estimate the magnitude of the long-term steady dust incorporation rate, provided that there aremultiple immobile elements (e.g., Zr and Ti) in the rock,regolith, and dust.[11] Equations (4) and (5) suggest that chemical erosion
rates may be closely coupled to denudation rates, a sugges-tion supported by many co-located measurements of physi-cal and chemical erosion rates in the field [e.g., Stallard andEdmond, 1983; Gaillardet et al., 1999; Anderson et al.,2002; Millot et al., 2002; Riebe et al., 2004a; West et al.,2005]. Because this coupling between chemical erosionrates and denudation rates can make it difficult to discern theeffects of other factors like climate on chemical erosionrates, it can be useful to normalize W and WX by the rates atwhich fresh material is supplied to the regolith, to moresharply illustrate the susceptibility of the bulk regolith andindividual elements to chemical losses. The fraction of theregolith denudation rate that is accounted for by chemicallosses may be expressed in steady state as the ratio ofW to P,and is commonly termed the chemical depletion fraction, orCDF for short [Riebe et al., 2001].
CDF ¼ Pr
Pr þ Pd1� Zrr
Zrs
� �þ Pd
Pr þ Pd1� Zrd
Zrs
� �ð6Þ
The fraction of the elemental denudation rate that occurs bychemical processes may similarly be expressed as the ratioof the elemental chemical erosion rate WX to the elementalsupply rate PX, and is commonly termed CDFX [Riebe et al.,2001].
CDFX ¼ Pr
Pr Xr þ Pd XdXr � Xs
ZrrZrs
� �þ Pd
Pr Xr þ PdXd
� Xd � XsZrdZrs
� �ð7Þ
In cases where dust fluxes are negligible (i.e., where Pd→ 0),these expressions for CDF and CDFX converge to theexpressions for CDF and CDFX as defined in [Riebe et al.,2001], as they should. For comparison with the t notationthat is commonly used for describing elemental depletionrelative to an immobile element [Brimhall and Dietrich,1987; Chadwick et al., 1990], we note that in cases wheredust deposition is negligible, CDFX and tX are simply relatedby a negative sign: CDFX = �tX.
[12] There are two timescales inherent in this solid-phasemass balance method. The first is the timescale associatedwith the accumulation of cosmogenic 10Be from which reg-olith production rates are inferred. Because the intensity ofcosmogenic radiation (and therefore the rate of 10Be pro-duction) drops off rapidly below the Earth’s surface, thistimescale is the time the sampled quartz has spent in the shortzone below the Earth’s surface where it acquired the bulk ofits 10Be. In practice, this timescale is typically calculated asthe so-called cosmogenic attenuation length (L) divided bythe regolith production rate, where L is an exponential scal-ing constant (L = 160 g cm�2 [Gosse and Phillips, 2001])that describes how quickly the intensity of cosmogenicradiation decreases as it passes through matter. For example,on a typical hillslope with a regolith production rate of0.027 g cm�2 yr�1 (i.e., with a lowering rate of 0.1 mmyr�1
in rock with a density of 2.7 g cm�3), the 10Be accumulationtimescale is 160 g cm�2/0.027 g cm�2 yr�1 = 5900 years.[13] The second timescale inherent in this solid-phase mass
balance method is the time it takes regoliths to weather totheir sampled composition, which in a steady state system isthe regolith residence time. This may be estimated as theregolith thickness times the regolith density divided by therate at which mass is added to the regolith P. For example, ina typical hillslope regolith one meter thick, of density 1.5 gcm�3, and with P = 150 t km�2 yr�1, the regolith residencetime is 10,000 years. Thus the two timescales inherent in thissolid-phase mass balance approach are often similar but notidentical, and in calculating E, W, and WX it is implicitlyassumed that the estimated value of the regolith productionrate (which is an estimate over the timescale of cosmogenicnuclide accumulation) is also the value of the regolith pro-duction rate over the regolith residence time. Because E, WandWX are estimated using the chemical differences betweenthe regolith and its parent rock—a property that evolved overthe regolith residence time rather than over the cosmogenicnuclide accumulation time—we suggest the appropriatetimescale to apply to estimates of E,W, andWX is the regolithresidence time. A full investigation of the consequences ofdifferences between these two timescales is beyond the scopeof this paper, but we note that such differences are onlyimportant to the extent that denudation rates over the cos-mogenic accumulation time differ from those over the rego-lith residence time.
3. Study Area: Pilot Peak and Tailholt Mountainin the Idaho Batholith
[14] Pilot Peak and Tailholt Mountain, two mountainsflanking the canyon of the South Fork of the SalmonRiver in the granitic Idaho Batholith (Figure 1), are thenatural laboratory in which we have applied the approach insection 2 to study the effects of climate on chemical erosionrates. We selected Pilot Peak and Tailholt Mountain becausethey span a wide range of altitudes over short horizontaldistances—1500 m and 1300 m over 5.1 and 5.7 horizontalkm, respectively—and thus span a wide range in climateswhile maintaining minimal variation in other factors likerock uplift rates, lithology, and land use that could confoundinterpretations of measured chemical erosion rates. Thesemountains lie within 87–78 Ma plutons of biotite-muscovite
FERRIER ET AL.: CLIMATE AND CHEMICAL EROSION RATES F02026F02026
5 of 21

granite and granite-granodiorite in the Idaho Batholith[Lund, 2004], and do not have mapped faults passing throughthem [Lund, 2004] or obvious field evidence of faulting, sug-gesting that neither should be subject to sharp discontinuitiesin rock uplift rates that could influence physical and chemicalerosion rates. Vegetation is dominated by ponderosa pine andIdaho bluebunch grass at most elevations. Anthropogenic dis-turbance on these mountains has been minimal, with no roadsor trails along the ridgelines where we established our fieldsites (section 4; Figure 1). Both mountains are covered withthin layers of regolith (10–90 cm) through which large graniticboulders (>1 m) crop out with a spatially variable frequency.For example, a randomly selected 10 m by 10 m patch ofhillslope on Pilot Peak or Tailholt Mountain would be likely tocontain no outcrops at most locations, but there are also lessfrequent places on the mountains where such a 10 m by 10 mpatch of hillslope would consist almost entirely of outcrops.Climate records near Pilot Peak and Tailholt Mountain(Yellow Pine: http://www.wrcc.dri.edu/cgi-bin/cliMAIN.pl?id9951; Big Creek: http://www.wrcc.dri.edu/cgi-bin/cliMAIN.pl?id0835; Warren: http://www.wrcc.dri.edu/cgi-bin/cliMAIN.pl?id9560; and McCall: http://www.wrcc.dri.edu/cgi-bin/cliMAIN.pl?id5708; Western Regional ClimateCenter, accessed March 2011) show that the region receives63–68 cm of precipitation in an average year, with 57%–66%of it falling between October and March. The dominant formof precipitation is snow from December through February orMarch and rain during the remainder of the year. Midwintermonths are especially wet and midsummer months areespecially dry: 2.4–4.9 times more precipitation falls inDecember and January than in July and August. An expectedmoist atmospheric lapse rate of 5�C–6�C/km implies thatmean annual air temperature at the summits of Pilot Peak andTailholt Mountain should be 8�C–9�C cooler than at thebases of these mountains—a difference in temperature nearlyas large as the glacial-interglacial temperature shift inferredfrom Antarctic ice cores [Petit et al., 1999].[15] The present-day topography of central Idaho is dom-
inated by the drainage network of the Salmon River and its
tributaries, which have incised canyons >1 km deep into theIdaho Batholith. In contrast to the steep topography and highrelief, the present pace of erosion in the Idaho Batholith ismoderate, and has been for the past 50Myr. The measurementsstretching farthest back in time are those by [Lund et al., 1986],who used 40Ar/39Ar dating to measure mineral cooling agesapproximately 50 km north of Tailholt Mountain. When com-bined with an assumed geothermal gradient of 25�C/km[Sweetkind and Blackwell, 1989], these cooling rates imply thatexhumation rates were fast (2.4–5.6 mm/yr) shortly afteremplacement of the batholith 81–78 Ma, and dropped to anaverage of 0.14 mm/yr by 54 Ma (Table 1). Complementingthese 40Ar/39Ar measurements, [Sweetkind and Blackwell,1989] interpreted fission track measurements in Idaho Batho-lith apatites and zircons as a reflection of slow exhumation rates(0.03–0.1 mm/yr) from 63 Ma to 11.4 Ma and faster canyonincision rates (0.32� 0.10 mm/yr) since 11.4� 1.4 Ma. Morerecently, denudation rates averaged over the past thousands totens of thousands of years have been inferred from 10Be con-centrations in stream sediment elsewhere in the Idaho Batholith[Kirchner et al., 2001]. These rates range from 55 � 8 to327� 42 t km�2 yr�1 (which, when divided by the parent rockdensity, yield lowering rates of 0.02 � 0.003 mm/yr to0.12 � 0.02 mm/yr), and are, on average, 17 times faster thanshort-term fluvial sediment fluxes measured in the same riversover the previous 10–84 years.[16] As a group, these studies suggest that erosion in the
Idaho Batholith is highly episodic on short timescales, withvery slow erosion for centuries to millennia punctuated bylarge, infrequent erosional events. When averaged over mil-lennial or longer timescales, the Idaho Batholith has beeneroding at 0.02–0.32 mm/yr—comparable to the modern-dayglobally averaged denudation rate of approximately 0.05 mm/yr [Wilkinson and McElroy, 2007]—for the past 50 Myr(Table 1). The long-term rates reported in these studies providea context for our measurements of regolith production rates(section 5.1), which are averaged over the past thousands totens of thousands of years.
4. Methods
4.1. Field Sampling of Rocks and Regoliths
[17] In September 2005 we established a series of fieldsites on Pilot Peak and Tailholt Mountain to measurechemical erosion rates along two altitudinal (and hence cli-matic) ridgeline transects (Figure 1; Table 2). With theexception of site P2283S, which is located in a grove ofponderosa pine, the dominant vegetation at all of the studysites is Idaho bluebunch grass. The trees at site P2283S havea mean spacing of 4–5 meters and provide significant shadeto the underlying regolith. By contrast, the regoliths at theother study sites are broadly exposed to solar radiation; thebunch grasses that dominate the vegetation at these sites are20–40 cm tall and provide minimal shade.[18] Because practical application of the mass balance
approach requires estimates of the mean compositions ofregolith and its parent rock, we collected groups of regolithand rock samples at each field site to constrain their meancompositions and their compositional uncertainties. At eachsite we collected two sets of regolith samples, the first ofwhich consisted of 16 regolith samples collected from a
Table 1. Rates of Exhumation and Denudation in the IdahoBatholith, Inferred by Diverse Methods Over Diverse Timescales
TimePeriod
Rate(mm/yr)
MeasurementType Source
81–78 Ma 3.8 (+1.8/�1.4) 40Ar/39Ar Lund et al.[1986]
74–67 Ma 1.0 (+0.4/�0.3) 40Ar/39Ar Lund et al.[1986]
67–54 Ma 0.14 (+0.4/�0.05) 40Ar/39Ar Lund et al.[1986]
54 Ma–present 0.07 40Ar/39Ar Lund et al.[1986]
50–10 Ma 0.03 � 0.1 Fission track Sweetkind andBlackwell [1989]
10 Ma–present 0.32 � 0.10 Fission track Sweetkind andBlackwell [1989]
4–26ka–present
0.02 � 0.12 Cosmogenic10Be
This study
5–26ka–present
0.02 � 0.12 Cosmogenic10Be
Kirchneret al. [2001]
10–84ya–present
0.001 � 0.011 Sediment yield Kirchneret al. [2001]
FERRIER ET AL.: CLIMATE AND CHEMICAL EROSION RATES F02026F02026
6 of 21

small rectangular plot (�10 m � 10 m). This small hori-zontal spread in regolith sample locations was intended toquantify horizontal variability in regolith composition andaccurately constrain mean regolith composition. For con-sistency’s sake, each of these 16 regolith samples was col-lected 10–15 cm below the surface, which roughlycorresponded to the base of the roots of the bunch grasses.These are the samples from which mean regolith composi-tion at each site was calculated (section 5.2). Regolith sam-pling plots were sited close to ridgelines to minimizevariations in regolith chemistry that can occur during down-slope regolith transport [e.g., Green et al., 2006; Yoo et al.,2007]. With the exception of site T1084, which lies at thebase of a roughly planar hillslope 400 m below the nearestridgeline, all field sites were 0–60 m from the ridgeline inthe direction of steepest ascent (Table 2). Within the regolithsampling plot at each field site, one pit was dug down to orclose to the parent material to install temperature and mois-ture probes. In each regolith pit, we collected a second set ofregolith samples from a range of depths to quantify verticalvariability in composition. Where possible, these includedsamples of the parent material below the regolith. In sub-sequent field trips, we dug numerous pits down to parentmaterial within the regolith sampling areas to estimate reg-olith thickness, which among sites averaged 40 cm andranged from 16 cm to >75 cm (Table 2).[19] At most field sites, the parent material was a contin-
uous layer of weathered rock, although at a few sites theparent material consisted of a layer of contiguous angularrock fragments >30 cm in diameter with narrow subparallelgaps (<1 cm) between them, suggestive of a layer of frac-tured rock. In addition to the regolith samples, 40 rock
samples were chipped from the outer 5–10 cm of extant rockoutcrops to characterize the parent material of the regolith.This approach implicitly assumes that the composition of therock outcrops is representative of the composition of theparent rock underlying the regolith [e.g., Riebe et al.,2004a]. At each field site, we collected 40 rock outcropsamples to characterize the parent material of the regolith.Most rock samples were collected within 10 m up-slope of theregolith plots. At some sites, there were few outcrops imme-diately next to the regolith plots, and at these sites outcropswere sampled on the ridge as much as�50m from the regolithplots. At four elevations on Pilot Peak, we collected regolithsamples from both sides of the ridge to examine the effects ofslope aspect on regolith climate and chemical erosion rates.These paired sites are sites P2283S and P2281N, P1471S andP1485N, P1277S and P1264N, and P1062S and P1062N(Table 2). In this naming convention, the site ID indicates themountain (P for Pilot Peak, T for Tailholt Mountain), thealtitude in meters, and, where regoliths were sampled on bothsides of the ridgeline, the slope aspect. Thus site P1062S, forexample, is a south-facing site on Pilot Peak at 1062 m. Weconsider rock samples collected from the ridgeline betweenthese paired sites to be representative of the parent rockunderlying the regoliths on both sides of the ridge.
4.2. Installation of Moisture and Temperature Probes
[20] In September 2005 we installed soil moisture probesand temperature probes in the uphill face of the regolith pit ateach field site. Each site was instrumented with three DecagonECH2O-10 soil moisture probes and two Decagon tempera-ture probes, which were connected to a single Decagon Em-5datalogger housed in an airtight metal canister. At sites where
Table 2. Field Site Characteristics
SiteLatitude(�N)
Longitude(�W)
Altitude(m)
Regolith H(cm) (n)a
Distance to Ridge(m)b
Slope(�)
MART(�C)c
MoistureIndexd Aspect
Pilot PeakP2283S 45�10.263′ 115�31.869′ 2283 50 � 4 (11) 43–48 20–25 4.8 0.74 SP2281N 45�10.270′ 115�31.895′ 2281 16 � 6 (7) 30–40 20–30 5.0 0.73 WP2090S 45�10.156′ 115�32.234′ 2090 57 � 5 (7) 40–46 15–20 7.1 0.69 SWP1850N 45�09.867′ 115�32.882′ 1850 29 � 5 (13) 2–9 25 5.1 0.79 WP1706N 45�09.675′ 115�33.620′ 1706 38 � 3 (14) 10–16 20–26 7.6 0.57 WP1485N 45�09.438′ 115�33.960′ 1485 31 � 2 (16) 21–27 23–26 7.6 0.60 WP1471S 45�09.419′ 115�33.960′ 1471 32 � 3 (15) 24–30 26 10.9 0.58 SWP1277S 45�09.259′ 115�34.403′ 1277 44 � 2 (21) 17–26 25–35 9.8 0.56 SWP1264N 45�09.276′ 115�34.406′ 1264 43 � 3 (20) 9–18 33 7.4 0.52 NWP1062S 45�09.228′ 115�34.924′ 1062 >75 (1) 2–7 10–20 9.0 0.59 SWP1062N 45�09.238′ 115�34.949′ 1062 33 � 2 (19) 2–6 23–30 7.9 0.63 N
Tailholt Mt.T2364 45�04.867′ 115�41.654′ 2364 28 � 2 (10) 27–36 11–16 6.1 0.77 SET2073 45�04.657′ 115�40.896′ 2073 25 � 3 (7) 0–5 9 6.9 0.72 ET1755 45�03.688′ 115�39.095′ 1755 37 � 4 (13) 5–11 22–27 8.2 0.53 NET1508 45�03.632′ 115�38.651′ 1508 32 � 4 (16) 1–8 30 7.7 0.51 NT1294 45�03.674′ 115�38.226′ 1294 57 � 4 (15) 55–60 24–39 7.7e no data ET1084 45�03.682′ 115�38.016′ 1084 56 � 4 (12) 400 35–40 9.1 0.52 E
aRegolith thickness H (mean � standard error (SE)), from n measurements) is the vertical distance between the parent material and the hillslope surface.bDistances are along the hillslope from the regolith sampling plot to the ridge in the direction of steepest ascent.cMean annual regolith temperatures (MART) are averages over 8/1/2006–7/31/2008 on Pilot Peak and over 10/1/2005–9/30/2006 on Tailholt Mountain.
These ranges were chosen to include as many complete climate records as possible. Some MART values were calculated with the help of interpolations tofill gaps in time series; see section S6 in the auxiliary materials.
dWe define the moisture index as the fraction of the year the regolith is “wet,” a state we define as wetter than an arbitrary moisture threshold (Figure 4).eBecause the instruments at site T1294 did not record good data during the first year of monitoring, T1294’s MART is reported here as 1.45�C cooler
than the nearest site, T1084, as was the case from 11/1/2006–10/31/2007 when instruments at both T1294 and T1084 recorded good data.
FERRIER ET AL.: CLIMATE AND CHEMICAL EROSION RATES F02026F02026
7 of 21

the regolith pits were deep enough to reach parent material (allsites except P1062S, T1084, and T1508), one temperatureprobe and one soil moisture probe were placed at the bound-ary between regolith and its parent material. A second soilmoisture probe was inserted into the regolith at a depthof 5 cm, and the third soil moisture probe was placed atan intermediate depth between the upper and lower probes.The second temperature probe was originally placed suchthat its tip emerged just above the regolith surface, andwas covered with an opaque perforated plastic box 6 cm �10 cm � 7 cm in size to shield it from direct sunlight. Thiswas done with the intention of measuring air temperature.These upper temperature probes did not produce gooddata during the first year of monitoring—some probes failedduring hot temperature excursions, and some were bittenoff by wildlife—so during our return to these sites in 2006,these upper temperature probes were buried at a depth of 5 cm.All instruments recorded one reading every four hours,providing a coarse picture of diurnal variations in regolithclimates and a detailed picture of longer-period variations inregolith climates.
4.3. Sample Preparation for Chemical Analysis of Rockand Regolith
[21] All rock and regolith samples were prepared forchemical analysis by X-ray fluorescence by standard proce-dures [Riebe, 2000]. Each sample was split, and about 30 g of
one of the splits was powdered in a tungsten carbide Spexshatterbox. As demanded by the geochemical mass balance,we measured the composition of the bulk regolith includingrock fragments, not merely the fine fraction. Powderedsamples were then baked at 500�C for 12 hours to eliminateorganic material. At this point, two sets of samples wereprepared, one for major element chemistry and one for traceelement chemistry. Major element samples were preparedby mixing 3.5000 � 0.0001 g of lithium tetraborate with0.5000 � 0.0001 g of powdered sample, homogenizing thispowder in a shaker for 15 minutes, melting the mixedpowders in a platinum crucible above a bunsen burnerflame for 10 minutes, and pouring the melted mixture into aplatinum tray. This yielded glass disks roughly 33 mm indiameter and 2 mm thick. Trace element samples wereprepared by mixing 3.3 � 0.1 g of powdered sample withfive drops of polyvinyl alcohol and pressing the mixedpowder into a pellet with a boric acid backing. Both traceelement pellets and major element disks were then analyzedfor elemental abundances on a Phillips 2400R X-ray fluo-rescence spectrometer.
4.4. Sample Preparation for Analysis of Cosmogenic10Be
[22] Regolith production rates were inferred from con-centrations of 10Be in quartz extracted from amalgamatedregolith samples at each site. From each of the sixteen near-surface regolith samples (i.e., those collected at a depth of10–15 cm) at each site, we split approximately 150 g ofregolith, and mixed these splits together. These amalgamatedregolith samples were themselves split, and from one of thesesplits 39–55 g of quartz was isolated from the >250 micronsize fraction by standard magnetic and chemical separations[Kohl and Nishiizumi, 1992; Riebe, 2000]. These quartzsamples were spiked with known amounts of 9Be in solution,after which they were dissolved in a mixture of hydrofluoricand nitric acids, dried down in platinum crucibles, redis-solved in sulfuric acid, dried down a second time, andredissolved in hydrochloric acid. Beryllium was then iso-lated from other elements in cation exchange columns andprecipitated as beryllium hydroxide by raising the pH ofthe solution to 8 with ammonium hydroxide. Berylliumhydroxide was isolated from solution by centrifugation,placed in quartz crucibles, and baked at 750�C to oxidize thematerial to BeO. Each BeO sample was then mixed withniobium powder and packed into stainless steel sampleholders. Concentrations of 10Be in these BeO samples weremeasured at the Center for Accelerator Mass Spectrometry atLawrence Livermore National Laboratory on July 15, 2007and referenced to isotopic standard 07KNSTD3110. We usedthese 10Be concentrations to calculate each site’s denudationrate (which under the steady state regolith assumption isequivalent to the regolith production rate) with the CRONUScalculator [Balco et al., 2008], a tool designed to standardizecalculation of cosmogenically-inferred denudation rates.Reported regolith production rates in Table 3 were calculatedwith CRONUS-Earth version 2.2 and the Lal/Stone produc-tion rate scaling. Inputs to CRONUS for sample latitude,longitude, and elevation are listed in Table 2, and all otherinputs are listed in Table 3. Shielding factors were calculatedin CRONUS using eight horizon angles measured at each
Table 3. Cosmogenic 10Be Concentrations and CRONUS-InferredRegolith Production Rates (Mean � SE)a
SiteName
TopographicShieldingb
[10Be](104 atoms /g)
Regolith ProductionRate (t km�2 yr�1)
Pilot PeakP2283S 0.989 28.7 � 0.7 167 � 14P2281N 0.996 26.3 � 0.7 183 � 15P2090S 0.996 28.3 � 0.6 150 � 12P1850N 0.988 18.8 � 0.4 194 � 15P1706N 0.991 20.0 � 0.5 166 � 13P1485N 0.989 31.0 � 0.6 91 � 7P1471S 0.987 29.8 � 0.7 94 � 7P1277S 0.967 14.4 � 0.3 171 � 13P1264N 0.977 15.5 � 0.4 159 � 12P1062S 0.992 29.8 � 0.7 71 � 5P1062N 0.975 37.6 � 1.0 55 � 4
Tailholt MountainT2364 0.999 34.9 � 1.2 145 � 12T2073 0.998 19.6 � 0.5 217 � 17T1755 0.985 10.8 � 0.2 320 � 24T1508 0.978 11.8 � 0.2 248 � 19T1294 0.952 9.1 � 0.2 275 � 21T1084 0.935 8.8 � 0.2 243 � 18
aRegolith production rates were calculated with the Lal/Stone productionrate scaling scheme in version 2.2 of the CRONUS-Earth online denudationrate calculator [Balco et al., 2008], under the steady state assumption thatregolith production rates equal denudation rates. Inputs to the CRONUScalculator for latitude, longitude, and altitude were taken from Table 2,and other inputs were assumed to be: sample thickness 0 cm, parentmaterial density 2.7 g cm�3, and the standard atmospheric scaling. 10Beconcentrations were measured at LLNL-CAMS on 15 July 2007 andreferenced to isotopic standard 07KNSTD3110.
bTopographic shielding factors were calculated with the CRONUScalculator using eight horizon shielding angles measured in the field atazimuths of 0, 45, 90, 135, 180, 225, 270, and 315 degrees.
FERRIER ET AL.: CLIMATE AND CHEMICAL EROSION RATES F02026F02026
8 of 21

field site with a Brunton compass at azimuths of 0, 45, 90,135, 180, 225, 270, and 315 degrees (Table 3).
5. Data
5.1. Regolith Production Rates Inferred FromCosmogenic 10Be
[23] CRONUS-calculated regolith production rates at ourfield sites range from 55 to 320 t km�2 yr�1, which can bedivided by the parent rock density (assumed to be 2.7 gcm�3) to yield lowering rates of 0.02 to 0.12 mm yr�1
(Table 3). Regolith production rates on Tailholt Mountaintend to be faster than those on Pilot Peak (Figure 5). On PilotPeak regolith production rates range from 55 to 194 t km�2
yr�1, while on Tailholt Mountain regolith production ratesrange from 217 to 320 t km�2 yr�1 except at the summit (siteT2364), where the regolith production rate is 145 t km�2
yr�1 (Table 3). These regolith production rates are compa-rable to other regolith production rates inferred from cos-mogenic 10Be in the Idaho Batholith [Kirchner et al., 2001],approximately an order of magnitude faster than physicalerosion rates inferred from short-term sediment yields overthe past 10–84 years [Kirchner et al., 2001], and over anorder of magnitude slower than exhumation rates in theperiod following emplacement of the batholith approxi-mately 80 Ma [Lund et al., 1986].
5.2. Chemical Composition of Rock and Regolith
[24] Tables S1–S6 in the auxiliary materials list thechemical composition of the 916 rock and regolith samplesfrom our field sites on Pilot Peak and Tailholt Mountain andthe average rock and regolith compositions at each site.1 Theaverage regolith compositions include only the sixteen hor-izontally distributed regolith samples collected 10–15 cmbelow the surface and do not include the regolith samplescollected from the vertical regolith profile at each site,
because regolith samples at depth may be below the zone ofthorough regolith mixing and thus may not have a compo-sition that is representative of the regolith that is activelyeroding, which is what the mass balance framework inequations (1)–(7) requires.[25] At 15 of the 17 field sites on Pilot Peak and Tailholt
Mountain, the sets of rock and regolith samples are wellapproximated by multivariate normal compositional dis-tributions, and we assume that the mean compositions ofthese sample sets are accurate representations of the chem-istry of the regolith and the regolith’s parent granite. At sitesT2364 and T1755, however, a subset of the rock samples ateach site has a quartz-rich composition that deviates stronglyfrom the composition of the other rock samples at these sitesand from the composition of rock samples at the other siteson Tailholt Mountain. Relative to typical rock samples onTailholt Mountain, these anomalous rock samples have muchlower concentrations of Ca, Sr, and Na, among other ele-ments (Figures S18–S19). In contrast to the bimodal rocksamples at T2364 and T1755, the regolith samples at thesesites fall into single unimodal distributions and have com-positions similar to those in regoliths at the other TailholtMountain sites, suggesting they are derived from parentrocks similar to the parent rocks elsewhere on TailholtMountain. If we were to consider the average compositionof all sampled rocks at sites T2364 and T1755—includingthe subsets of rock samples with anomalous compositions—to be representative of the parent material of the sampledregoliths, we would be forced into the geochemically unrea-sonable conclusion that highly soluble Ca and Na are muchless chemically mobile than Zr at these sites. We thereforeexclude the subsets of anomalous rock samples from all cal-culations of average rock composition at T2364 and T1755and thus from calculations of chemical and physical erosionrates at these sites. A full list of the anomalous rock samplesthat were excluded as outliers at sites T2364 and T1755 ispresented in the auxiliary materials.
5.3. Chemical Composition in Regolith Profiles
[26] In addition to the sixteen horizontally distributedregolith samples from 10–15 cm depths, we also measuredthe composition of regolith and underlying parent rocksamples in a vertical profile at each site to assess verticalvariability in composition. The site-averaged regolith thick-ness averages 40 cm and ranges from 16 cm to >75 cmamong sites. The absence of systematic vertical gradients inZr or Ti concentrations within our sampled regolith profilessuggests either that negligible chemical weathering occurswithin the regolith, or that the regolith is vertically mixedover the regolith residence time (Figure 3). The clear com-positional difference between the regolith and the parentgranite suggests that some chemical weathering indeedoccurs in the regolith, and the presence of abundant rodentburrows in the regolith suggests that the regolith is indeedbeing mixed. Thus we infer that the sampled regoliths aregenerally well mixed.[27] Not all 17 sites lack vertical trends in regolith
immobile element concentrations; the regolith at site P1062Sis an exception in this regard. For instance, concentrations ofTi at P1062S decrease systematically toward the surfacefrom 0.56% at 60 cm depth to 0.37% at 5 cm depth. It isunclear why this site exhibits systematic vertical gradients in
1Auxiliary materials are available in the HTML. doi:10.1029/2011JF002231.
Figure 3. Concentrations of Zr and Ti in a vertical regolithprofile at site T1084. Solid circles represent regolith sam-ples; the vertical gray box represents the average rock out-crop composition (mean and SE); and the open squarerepresents the average composition of the 16 regolith sam-ples collected at 10–15 cm depth elsewhere at this site.The absence of systematic vertical trends in Zr and Ti at thissite and others (Figures S1–S17) suggests that the sampledregoliths have been vertically mixed over the regolith resi-dence time.
FERRIER ET AL.: CLIMATE AND CHEMICAL EROSION RATES F02026F02026
9 of 21

regolith chemistry while the other sites do not, but our fieldobservations suggest that the regolith at site P1062S wasdenser, less easily disaggregated, and had fewer animalburrows than the regoliths at the other study sites. Theseobservations are consistent with little vertical mixingthrough most of the regolith at site P1062S, unlike the gen-erally well-mixed regoliths observed at the other sites. Wenote that the upper two samples in the regolith profile atP1062S have compositions that are consistent with oneanother; for example, Ti concentrations are 0.38% at 12 cmdepth and 0.37% at 5 cm depth. This suggests that this site’smean regolith composition—i.e., the average composition ofthe 16 horizontally distributed regolith samples at 10–15 cmdepths—is indeed representative of the eroding regolith,which is what the geochemical mass balance requires.
5.4. Regolith Climate Records
[28] Instruments installed in the regolith at each site recor-ded temperature and a proxy for regolith moisture once everyfour hours from September 2005 to August 2008. These datawere used to calculate mean annual regolith temperatures(MART) and regolith moisture indices (Table 2; Figure 5).These time series measurements show that at any given site,temperature and moisture in the regolith tend to be closely andinversely related to one another: regoliths are warm and dryduring summers and cold and wet during winters (Figure 4).These measurements also show that regoliths at high altitudesare colder and have longer wet seasons than regoliths at lowaltitudes. Here we discuss the details of these measurements.5.4.1. Regolith Temperature[29] Figure 5 shows that MART broadly decreases with
elevation on both Pilot Peak and Tailholt Mountain, as
expected. The altitudinal gradients in MART, however, areonly 2.2�C/km on Tailholt Mountain and 3.1�C/km on PilotPeak, shallower than the altitudinal gradient in mean annualair temperature (MAAT) of 5�C–6�C/km that would beexpected from a standard moist atmospheric lapse rate.These low altitudinal gradients in MART are a result of abuffering of regolith temperatures near freezing during thewinter months (e.g., Figure 4). We do not have time seriesmeasurements of snow depths at the study sites, but wespeculate that the observed winter buffering of regolithtemperatures may be a consequence of winter snow cover,which would insulate the regolith against cold excursions inair temperature. This temperature buffering is especiallynoticeable at the higher elevation sites (e.g., sites P2283S,P2281N, and T2364), where the temperature drops to 2�C–3�C in November and steadily decreases to 0 � 1�C over thecourse of the winter. At a few sites (P1485N, T1755,T1294), this winter-long temperature buffering occurs atsomewhat lower temperatures (–3�C to –7�C). During thistime period, diurnal variations in regolith temperature aresmall (<0.1�C). The net result of this winter temperaturebuffering is to make the annual regolith temperature cyclelook roughly like a sinusoid with the wintertime troughstruncated at a warmer temperature than they would other-wise descend to. Because this winter temperature bufferingprevents regoliths from getting as cold as the air during thewinter, every regolith that experiences this temperaturebuffering has a MART that is warmer than the local MAAT.And, because this winter temperature buffering lasts longestat the highest altitudes—as long as seven months at thehighest Tailholt Mountain site (T2364), and as short astwo months at the lowest Pilot Peak site (P1062S)—the
Figure 4. Daily average regolith temperature at the base of the regolith (70 cm depth) and regolith mois-ture at depths of 39 cm (dashed line) and 70 cm (solid line) from a representative site (P2090S). In themiddle panel are the raw measurements from the soil moisture probes. In the lower panel the same rawmoisture probe time series have each been normalized to a 0–100 scale, where 0 corresponds to the min-imum (driest) reading and 100 to the maximum (wettest) reading over each time series. This scaling,although qualitative, greatly reduces offsets between regolith moisture records from different instrumentsin the same regolith profile, and permits simpler comparisons between regolith moisture records. Underthis rescaling, the regolith in this figure spent on average 64% of each year in “wet” conditions, whichwe define as anything higher than an arbitrary threshold value of 30 in the rescaled regolith moisture data.The regolith climate time series for the other study sites are presented in the auxiliary materials.
FERRIER ET AL.: CLIMATE AND CHEMICAL EROSION RATES F02026F02026
10 of 21

difference between MART and MAAT is bigger at higheraltitudes than at lower altitudes. This results in altitudinalgradients in MART that are shallower than the expectedaltitudinal gradient in MAAT of 5�C–6�C/km.[30] As well as being a function of altitude, regolith tem-
peratures at these field sites also depend on slope aspect andvegetation. South-facing slopes are systematically hotter by1�C–3�C MART than north-facing slopes at the same alti-tude (compare sites P1471S and P1485N, P1277S andP1264N, and P1062S and P1062N in Table 2). The excep-tion to this pattern is at the highest elevation sites on PilotPeak, where the south facing site P2283S has regoliths thatare slightly cooler than those at site P2281N on the northside of the ridgeline. This is likely a consequence of differ-ences in vegetation between P2283S and P2281N. Uniquelyamong all of our field sites on both mountains, site P2283Slies under a thick grove of conifers and is well shaded fromthe sun. By contrast, site P2281N is vegetated only withbunch grasses and is exposed directly to the sun. Thus weattribute the cooler regolith temperatures at P2283S relativeto those at P2281N to vegetative shading at P2283S.5.4.2. Regolith Moisture[31] We found it impossible to accurately calibrate the raw
capacitance measurements from the soil moisture probes.Raw measurements from multiple moisture probes in asingle regolith profile often show similar temporal patterns—that is, they show spikes and troughs in the measured voltageat similar times—but they also show significant offsetsfrom one another (Figure 4), which precluded the use of asingle calibration curve for all moisture probes. Insteadof attempting to determine absolute regolith moisture con-tents from each moisture probe, we used the probes’ rawcapacitance measurements to quantify the duration of thewet season at each site, reasoning that relative changes incapacitance measured by a single probe should still reflectthe relative changes in regolith moisture around that probeover time. To make more direct (albeit more qualitative)comparisons between records from different soil moistureprobes, we rescaled the time series of voltages measured byeach moisture probe on a 0–100 scale, such that the mini-mum (i.e., driest) voltage recorded by each instrument overits entire time series is rescaled to 0, and the maximum (i.e.,wettest) voltage over its time series is rescaled to 100.Rescaling each record in this manner resolves much of theoffset between records.[32] When rescaled in this manner, regolith moisture
records reveal that the wet season tends to last longer athigher elevations than at low elevations. This can be crudelyquantified as follows. Consider a regolith moisture timeseries that has been rescaled to a 0–100 scale (e.g., Figure 4).The transitions between the wet and dry seasons are shortrelative to the duration of the wet and dry seasons them-selves, and thus to first order regolith moisture is either highor low at any given moment during this time series. In eachof the rescaled regolith moisture records we defined anymeasurement above an arbitrary threshold of 30 as “wet”and any measurement below this threshold as “dry”, athreshold that effectively separates dry summer conditionsfrom wet winter conditions in regolith at each of thestudy sites. We then characterized each site in terms of theannual duration of wet conditions (expressed as a fraction ofthe year), and called this fraction the Moisture Index. The
Figure 5. Upper panel: mean annual regolith temperatures(MART) on Pilot Peak (8/1/2006–7/31/2008; whitemarkers) and Tailholt Mountain (10/1/2005–9/30/2006;black markers). On Pilot Peak, white diamonds refer to siteson the north side of the ridgeline, and white squares refer tosites on the south side. For the purposes of calculatingannual means, some records include interpolations to fillgaps in temperature time series; see section S6 in theauxiliary materials for details. Middle panel: regolith mois-ture indices represent the fraction of the year the regolithspends in the “wet” condition (defined in Figure 4), andshow that regoliths at higher elevations tend to spend agreater proportion of each year under high regolith moistureconditions. Figures S21–S37 in the auxiliary materialsshow the full time series from which MART and moistureindices were calculated. Lower panel: Regolith productionrates Pr inferred from cosmogenic 10Be in regolith-bornequartz (mean � SE). Aside from site T2364, regolith pro-duction rates are faster on Tailholt Mountain than on PilotPeak. On Pilot Peak, regolith production rates on oppositesides of the ridgeline at the same elevation are identicalwithin uncertainty, implying that climatic factors relatedto slope aspect are not affecting bedrock lowering rates atthese sites.
FERRIER ET AL.: CLIMATE AND CHEMICAL EROSION RATES F02026F02026
11 of 21

regolith in Figure 4, for example, spent on average 64% ofthe year in the “wet” state, and thus had a Moisture Index of0.64. When the same analysis is repeated on all regolithmoisture records, it shows that the lowest elevation sitesspent about half the year in the “wet” state and the highestelevation sites spent about three-quarters of the year in the“wet” state (Figure 5). Although this is an unsophisticatedanalysis of uncalibrated data, it nonetheless illustrates afundamental aspect of this mountain system: high altituderegoliths tend to spend a higher proportion of the time “wet”than low altitude sites do. We speculate that this may be aconsequence of the winter snow cover, which lasts longer athigher altitudes and which we expect to promote high reg-olith moisture levels while it lasts.
5.5. Dust Incorporation Into Regolith
[33] As discussed in [Ferrier et al., 2011], two character-istics of rock-to-regolith elemental enrichments across thestudy sites suggest that regolith compositions have beenaffected by incorporation of mafic dust. First, at all of thestudy sites except one (P1277S), rock-to-regolith enrich-ments of Ti are considerably higher than those of Zr. In theabsence of Ti-rich dust incorporation into the soil, such asystematic discrepancy would be inconsistent with theprobable chemical immobility of both Zr and Ti. Second,rock-to-regolith enrichments of other elements that are usu-ally considered to be mobile—especially Mn and Fe, and toa lesser extent Mg—are higher than those for presumablyimmobile Zr at many sites. In the absence of direct mea-surements of dust incorporation rate and dust composition inthe South Fork of the Salmon River canyon, Ferrier et al.[2011] estimated the long-term average dust incorporationrate at each site using the local regolith production rate;concentrations of Zr and Ti in regolith, rock, and dust; and
the composition of a probable dust source (the glacialmegaflood sediments that produced the nearby Palouseloess) [Sweeney et al., 2007; this study, Table S6]. Here weuse those estimates of dust composition and dust incorpo-ration rates to help estimate chemical and physical erosionrates with equations (3)–(5) at the study sites on Pilot Peakand Tailholt Mountain.
6. Chemical Erosion Rates, Regolith ChemicalDepletion, and Climate
6.1. Bulk Chemical Erosion Rates and ChemicalDepletion Fractions
[34] Using our measurements of regolith production rates(Table 3), the compositions of regolith, rock, and dust(Tables S3–S6), and our estimates of dust incorporation rates(Table 4) [Ferrier et al., 2011], we calculate the bulk chemicalerosion rate (W) and the chemical depletion fraction (CDF)at each site with equations (4) and (6). Reported uncertaintieson values of W and CDF are one standard error of the mean,calculated by propagating uncertainties on all parametersin equations (4) and (6)—i.e., uncertainties in Pr, Pd, and thecompositions of rock, dust, and regolith.[35] We note that the calculated rates pertain to mass
fluxes out of the regolith, and do not include chemical massfluxes that may be occurring at depths greater than a fewmeters below the surface. That is, if some mass were lostbelow the depth of cosmogenic 10Be accumulation (e.g., bychemical weathering at depths greater than a few meters),then our measurements would not be able to detect thosedeep mass losses, and the calculated values of E and Wwould reflect the mass fluxes in the regolith but not those atdepth [Dixon et al., 2009a]. Therefore we interpret the cal-culated chemical and physical erosion rates as mass fluxes
Table 4. Results of the Dust-Granite Mixing Model Mass Balancea
Site Name fd (%)b CDFc Pd (t km�2 yr�1)d E (t km�2 yr�1)e W (t km�2 yr�1)e
Pilot PeakP2283S 2.7 � 1.0 0.15 � 0.02 5 � 2 145 � 13 26 � 4P2281N 6.1 � 1.4 0.14 � 0.02 12 � 3 167 � 15 28 � 5P2090S 7.7 � 1.5 0.14 � 0.03 13 � 3 141 � 13 22 � 5P1850N 4.7 � 1.5 �0.04 � 0.04 8 � 3 210 � 19 �9 � 8P1850Nsubf 4.0 � 1.2 0.04 � 0.03 9 � 3 194 � 17 9 � 7P1706N 5.4 � 1.3 0.07 � 0.03 10 � 3 163 � 14 12 � 5P1485N 7.0 � 1.2 0.13 � 0.02 7 � 1 85 � 7 13 � 2P1471S 2.8 � 0.7 0.08 � 0.02 3 � 1 89 � 7 8 � 2P1277S �2.7 � 0.8 0.10 � 0.03 �5 � 1 149 � 12 17 � 6P1264N 3.1 � 1.0 0.05 � 0.03 5 � 2 155 � 13 9 � 6P1062S 6.5 � 1.3 0.15 � 0.02 5 � 1 64 � 5 12 � 2P1062N 13.9 � 2.2 0.16 � 0.01 9 � 2 53 � 4 10 � 1
Tailholt MountainT2364 5.1 � 1.1 0.15 � 0.03 8 � 2 130 � 14 22 � 5T2073 2.9 � 0.7 0.04 � 0.02 7 � 2 215 � 18 8 � 4T1755 3.6 � 0.7 �0.02 � 0.02 12 � 3 338 � 27 �6 � 8T1508 3.6 � 0.8 0.02 � 0.03 9 � 2 252 � 21 5 � 7T1294 1.5 � 0.7 0.13 � 0.03 4 � 2 242 � 21 37 � 9T1084 3.1 � 0.7 0.11 � 0.02 8 � 2 224 � 17 27 � 5
aAll uncertainties listed in this table are standard errors.bThe fraction of the regolith’s parent material derived from dust, fd, was estimated in [Ferrier et al., 2011], under the assumption that the regolith
composition is a mixture of the sampled granite and mafic dust from Columbia Plateau paleoflood sediments [Sweeney et al., 2007].cEstimates of CDF are calculated as the fraction of the total regolith denudation rate that is attributable to chemical processes (equation (6)).dEstimates of dust incorporation rate Pd from [Ferrier et al., 2011].ePhysical and chemical erosion rates E and W are calculated with equations (3) and (4), respectively.fP1850Nsub results are calculated using a subset of regolith samples at site P1850N (see section 6.3).
FERRIER ET AL.: CLIMATE AND CHEMICAL EROSION RATES F02026F02026
12 of 21

from the regolith, and note that if significant chemical ero-sion were occurring at depths greater than a few meters, totalchemical erosion rates from the weathering profile would behigher than the calculated W values. This interpretation dif-fers from studies that have taken rock outcrops to be chem-ical proxies for pristine bedrock, and which have interpretedchemical erosion rates calculated with equation (4) as areflection of total chemical mass fluxes, including fluxes thatmay be occurring below the regolith [e.g., Riebe et al.,2004a]. Future measurements of Zr concentrations in deepbedrock profiles will be required to determine whether deepchemical weathering fluxes are in fact significant at thestudy sites.[36] As noted in section 2, these calculations implicitly
assume that Zr is immobile in the sampled regoliths, whichwe suggest is appropriate at the study sites because Zr ingranites is found predominantly in zircons, which are highlyresistant to dissolution [e.g., Hodson, 2002]. If Zr weremobile within the regolith (e.g., due to density differencesbetween zircons and the bulk regolith) [Taboada et al.,2006], then the inferred chemical erosion rates and CDFswould be lower than their true values to the extent thatregolith Zr concentrations were lower than what they wouldbe if Zr were perfectly immobile. Under the assumption ofZr immobility, our calculations show that physical erosion isresponsible for 84%–100%of the mass flux out of the sam-pled regoliths and that chemical erosion accounts for theremaining 0%–16%.
[37] These calculations reveal that chemical erosion rateson Pilot Peak are fastest at the highest altitudes, whereregoliths are coldest and where regolith moisture levelsremain high for the longest portion of the year. Chemicalerosion rates on Tailholt Mountain, by contrast, reach aminimum at an intermediate altitude and are of comparablemagnitude at the top and bottom of the altitudinal transect.Plotting these rates against climatic variables permits us tomake several observations about the influence of climate onchemical erosion rates and the extent of chemical alterationin these regoliths.[38] First, chemical erosion rates do not increase with
mean annual regolith temperature (MART) (see Figure 6).Because chemical erosion rates are expected to increase withtemperature, all else being equal [e.g., White and Blum,1995], this suggests that the regoliths at our field sites areonly weakly sensitive to MART, if at all. To the extent thattemperature influences chemical erosion rates along thesetransects, its influence is overwhelmed by the influences ofother factors.[39] Second, our measurements are suggestive of a weak
correlation between chemical erosion rates and moistureindex (Figure 6). That is, chemical erosion rates tend to behigher at higher moisture indices, although the correlationbetween chemical erosion rates and moisture index is notstatistically significant at a high level (p = 0.11). For exam-ple, the mean W at sites with moisture indices >0.65 is 19 tkm�2 yr�1, while the mean W at sites with moisture indices
Figure 6. Chemical erosion rates (W) and chemical depletion fractions (CDF) plotted against meanannual regolith temperature (MART), moisture index (defined in Figure 4), mineral supply rates P, andregolith residence times. White symbols = Pilot Peak; black symbols = Tailholt Mountain; r = correlationcoefficient; p = p-value for r. The white diamond and the � symbol represent site P1850N excluding andincluding anomalous regolith samples, respectively (section 6.3). Estimates of W do not increase withMART, suggesting that mean annual regolith temperature exerts little influence on bulk chemical erosionrates at these field sites. Estimates of W generally increase with moisture index, particularly on Pilot Peak,suggesting that the annual duration of high regolith moisture conditions promotes chemical erosion. Esti-mates of W do not increase linearly with the rate of mineral supply P and show little dependence on reg-olith residence times, implying that chemical erosion rates at these sites are not supply-limited. Estimatesof CDF—i.e., the degree of chemical alteration in the regolith—show no trend with MART, and broadlyincrease with the moisture index. Estimates of CDF decrease with mineral supply rate and increase withregolith residence time on both Pilot Peak and Tailholt Mountain, consistent with chemical erosion thatis limited by the kinetics of mineral dissolution rather than the rate of fresh mineral supply to the regoliths.All values are means � one standard error.
FERRIER ET AL.: CLIMATE AND CHEMICAL EROSION RATES F02026F02026
13 of 21

<0.65 is 11 t km�2 yr�1. Thus these data do not support astrong dependence of W on moisture index, but they aresuggestive of a weak link between the length of the annualwet season and millennial-scale chemical erosion rates.[40] Two further observations can be made by normalizing
the chemical erosion rates by the rate of material supply tothe regolith. This reveals that the degree of regolith chemicalalteration (i.e., the CDF) is insensitive to MART, just aschemical erosion rates in regolith are insensitive to MART(Figure 6). By contrast, the extent of chemical weatheringappears to be more sensitive to variations in soil moisture;the most weathered regoliths at our field sites tend to be atthe sites with the longest wet seasons (Figure 6). This is theclearest climatic signal in our measurements.
6.2. Elemental Chemical Erosion Rates and ChemicalDepletion Fractions
[41] The same estimates of regolith production rates, dustincorporation rates, and rock, regolith, and dust composition(Tables 3–4; Tables S3–S6 in the auxiliary materials) permitcalculation of elemental chemical erosion rates WX withequation (5). As expected, chemical erosion rates for SiO2
are by far the largest among any oxide, reflecting the dom-inance of Si in the parent material contributing to the rego-liths (Figure 7). Chemical erosion rates for Al2O3 are thenext largest elemental chemical weathering flux, followed insize by the chemical erosion rates of the major cations K,Na, and Ca. The chemical erosion of Al from regolith at our
Figure 7. Elemental chemical erosion rates WX plotted against mean annual regolith temperature(MART), moisture index (defined in Figure 4), elemental supply rates PX, and regolith residence times.White symbols = Pilot Peak; black symbols = Tailholt Mountain; r = correlation coefficient; p = p-valuefor r. The white diamond and the � symbol represent site P1850N excluding and including anomalousregolith samples, respectively (section 6.3). All values are means � one standard error.
FERRIER ET AL.: CLIMATE AND CHEMICAL EROSION RATES F02026F02026
14 of 21
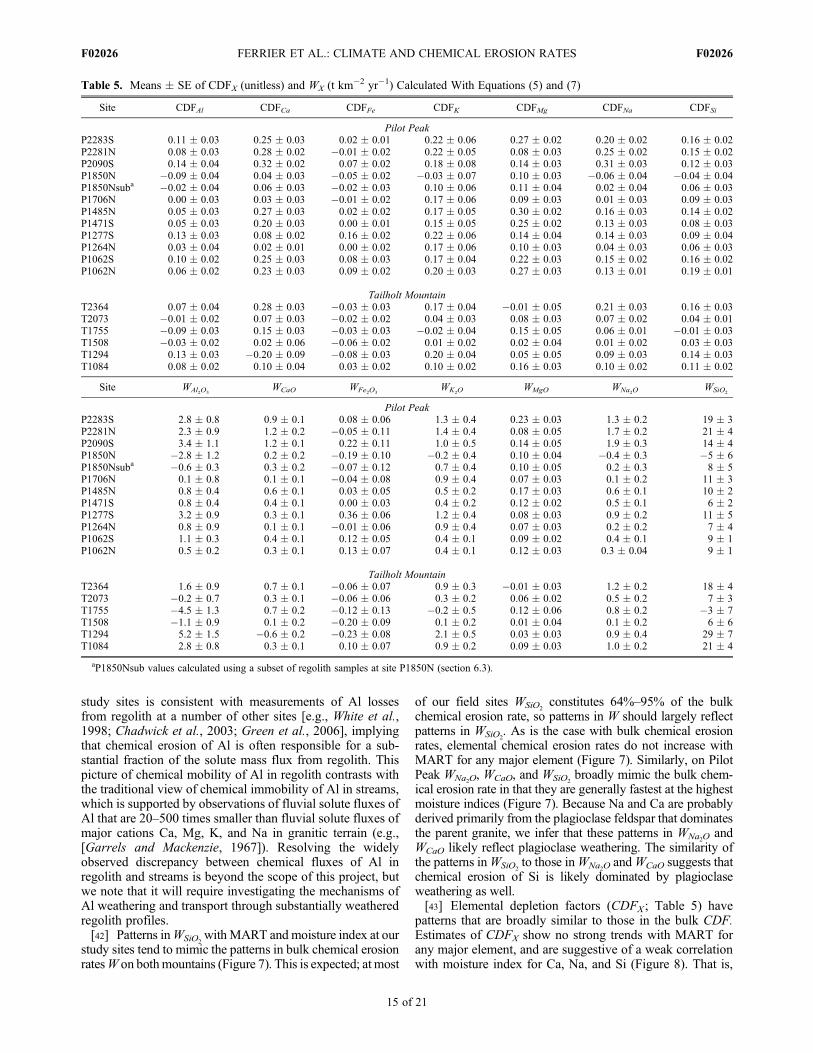
study sites is consistent with measurements of Al lossesfrom regolith at a number of other sites [e.g., White et al.,1998; Chadwick et al., 2003; Green et al., 2006], implyingthat chemical erosion of Al is often responsible for a sub-stantial fraction of the solute mass flux from regolith. Thispicture of chemical mobility of Al in regolith contrasts withthe traditional view of chemical immobility of Al in streams,which is supported by observations of fluvial solute fluxes ofAl that are 20–500 times smaller than fluvial solute fluxes ofmajor cations Ca, Mg, K, and Na in granitic terrain (e.g.,[Garrels and Mackenzie, 1967]). Resolving the widelyobserved discrepancy between chemical fluxes of Al inregolith and streams is beyond the scope of this project, butwe note that it will require investigating the mechanisms ofAl weathering and transport through substantially weatheredregolith profiles.[42] Patterns inWSiO2
withMART and moisture index at ourstudy sites tend to mimic the patterns in bulk chemical erosionratesW on bothmountains (Figure 7). This is expected; at most
of our field sites WSiO2constitutes 64%–95% of the bulk
chemical erosion rate, so patterns in W should largely reflectpatterns in WSiO2
. As is the case with bulk chemical erosionrates, elemental chemical erosion rates do not increase withMART for any major element (Figure 7). Similarly, on PilotPeak WNa2O, WCaO, and WSiO2
broadly mimic the bulk chem-ical erosion rate in that they are generally fastest at the highestmoisture indices (Figure 7). Because Na and Ca are probablyderived primarily from the plagioclase feldspar that dominatesthe parent granite, we infer that these patterns in WNa2O andWCaO likely reflect plagioclase weathering. The similarity ofthe patterns inWSiO2
to those inWNa2O andWCaO suggests thatchemical erosion of Si is likely dominated by plagioclaseweathering as well.[43] Elemental depletion factors (CDFX ; Table 5) have
patterns that are broadly similar to those in the bulk CDF.Estimates of CDFX show no strong trends with MART forany major element, and are suggestive of a weak correlationwith moisture index for Ca, Na, and Si (Figure 8). That is,
Table 5. Means � SE of CDFX (unitless) and WX (t km�2 yr�1) Calculated With Equations (5) and (7)
Site CDFAl CDFCa CDFFe CDFK CDFMg CDFNa CDFSi
Pilot PeakP2283S 0.11 � 0.03 0.25 � 0.03 0.02 � 0.01 0.22 � 0.06 0.27 � 0.02 0.20 � 0.02 0.16 � 0.02P2281N 0.08 � 0.03 0.28 � 0.02 �0.01 � 0.02 0.22 � 0.05 0.08 � 0.03 0.25 � 0.02 0.15 � 0.02P2090S 0.14 � 0.04 0.32 � 0.02 0.07 � 0.02 0.18 � 0.08 0.14 � 0.03 0.31 � 0.03 0.12 � 0.03P1850N �0.09 � 0.04 0.04 � 0.03 �0.05 � 0.02 �0.03 � 0.07 0.10 � 0.03 �0.06 � 0.04 �0.04 � 0.04P1850Nsuba �0.02 � 0.04 0.06 � 0.03 �0.02 � 0.03 0.10 � 0.06 0.11 � 0.04 0.02 � 0.04 0.06 � 0.03P1706N 0.00 � 0.03 0.03 � 0.03 �0.01 � 0.02 0.17 � 0.06 0.09 � 0.03 0.01 � 0.03 0.09 � 0.03P1485N 0.05 � 0.03 0.27 � 0.03 0.02 � 0.02 0.17 � 0.05 0.30 � 0.02 0.16 � 0.03 0.14 � 0.02P1471S 0.05 � 0.03 0.20 � 0.03 0.00 � 0.01 0.15 � 0.05 0.25 � 0.02 0.13 � 0.03 0.08 � 0.03P1277S 0.13 � 0.03 0.08 � 0.02 0.16 � 0.02 0.22 � 0.06 0.14 � 0.04 0.14 � 0.03 0.09 � 0.04P1264N 0.03 � 0.04 0.02 � 0.01 0.00 � 0.02 0.17 � 0.06 0.10 � 0.03 0.04 � 0.03 0.06 � 0.03P1062S 0.10 � 0.02 0.25 � 0.03 0.08 � 0.03 0.17 � 0.04 0.22 � 0.03 0.15 � 0.02 0.16 � 0.02P1062N 0.06 � 0.02 0.23 � 0.03 0.09 � 0.02 0.20 � 0.03 0.27 � 0.03 0.13 � 0.01 0.19 � 0.01
Tailholt MountainT2364 0.07 � 0.04 0.28 � 0.03 �0.03 � 0.03 0.17 � 0.04 �0.01 � 0.05 0.21 � 0.03 0.16 � 0.03T2073 �0.01 � 0.02 0.07 � 0.03 �0.02 � 0.02 0.04 � 0.03 0.08 � 0.03 0.07 � 0.02 0.04 � 0.01T1755 �0.09 � 0.03 0.15 � 0.03 �0.03 � 0.03 �0.02 � 0.04 0.15 � 0.05 0.06 � 0.01 �0.01 � 0.03T1508 �0.03 � 0.02 0.02 � 0.06 �0.06 � 0.02 0.01 � 0.02 0.02 � 0.04 0.01 � 0.02 0.03 � 0.03T1294 0.13 � 0.03 �0.20 � 0.09 �0.08 � 0.03 0.20 � 0.04 0.05 � 0.05 0.09 � 0.03 0.14 � 0.03T1084 0.08 � 0.02 0.10 � 0.04 0.03 � 0.02 0.10 � 0.02 0.16 � 0.03 0.10 � 0.02 0.11 � 0.02
Site WAl2O3WCaO WFe2O3
WK2O WMgO WNa2O WSiO2
Pilot PeakP2283S 2.8 � 0.8 0.9 � 0.1 0.08 � 0.06 1.3 � 0.4 0.23 � 0.03 1.3 � 0.2 19 � 3P2281N 2.3 � 0.9 1.2 � 0.2 �0.05 � 0.11 1.4 � 0.4 0.08 � 0.05 1.7 � 0.2 21 � 4P2090S 3.4 � 1.1 1.2 � 0.1 0.22 � 0.11 1.0 � 0.5 0.14 � 0.05 1.9 � 0.3 14 � 4P1850N �2.8 � 1.2 0.2 � 0.2 �0.19 � 0.10 �0.2 � 0.4 0.10 � 0.04 �0.4 � 0.3 �5 � 6P1850Nsuba �0.6 � 0.3 0.3 � 0.2 �0.07 � 0.12 0.7 � 0.4 0.10 � 0.05 0.2 � 0.3 8 � 5P1706N 0.1 � 0.8 0.1 � 0.1 �0.04 � 0.08 0.9 � 0.4 0.07 � 0.03 0.1 � 0.2 11 � 3P1485N 0.8 � 0.4 0.6 � 0.1 0.03 � 0.05 0.5 � 0.2 0.17 � 0.03 0.6 � 0.1 10 � 2P1471S 0.8 � 0.4 0.4 � 0.1 0.00 � 0.03 0.4 � 0.2 0.12 � 0.02 0.5 � 0.1 6 � 2P1277S 3.2 � 0.9 0.3 � 0.1 0.36 � 0.06 1.2 � 0.4 0.08 � 0.03 0.9 � 0.2 11 � 5P1264N 0.8 � 0.9 0.1 � 0.1 �0.01 � 0.06 0.9 � 0.4 0.07 � 0.03 0.2 � 0.2 7 � 4P1062S 1.1 � 0.3 0.4 � 0.1 0.12 � 0.05 0.4 � 0.1 0.09 � 0.02 0.4 � 0.1 9 � 1P1062N 0.5 � 0.2 0.3 � 0.1 0.13 � 0.07 0.4 � 0.1 0.12 � 0.03 0.3 � 0.04 9 � 1
Tailholt MountainT2364 1.6 � 0.9 0.7 � 0.1 �0.06 � 0.07 0.9 � 0.3 �0.01 � 0.03 1.2 � 0.2 18 � 4T2073 �0.2 � 0.7 0.3 � 0.1 �0.06 � 0.06 0.3 � 0.2 0.06 � 0.02 0.5 � 0.2 7 � 3T1755 �4.5 � 1.3 0.7 � 0.2 �0.12 � 0.13 �0.2 � 0.5 0.12 � 0.06 0.8 � 0.2 �3 � 7T1508 �1.1 � 0.9 0.1 � 0.2 �0.20 � 0.09 0.1 � 0.2 0.01 � 0.04 0.1 � 0.2 6 � 6T1294 5.2 � 1.5 �0.6 � 0.2 �0.23 � 0.08 2.1 � 0.5 0.03 � 0.03 0.9 � 0.4 29 � 7T1084 2.8 � 0.8 0.3 � 0.1 0.10 � 0.07 0.9 � 0.2 0.09 � 0.03 1.0 � 0.2 21 � 4
aP1850Nsub values calculated using a subset of regolith samples at site P1850N (section 6.3).
FERRIER ET AL.: CLIMATE AND CHEMICAL EROSION RATES F02026F02026
15 of 21

CDFCa, CDFNa, and CDFSi are not strongly correlated withmoisture index at a high significance level, but each tends tobe higher at higher moisture indices. For instance, the cor-relation between CDFNa and moisture index has a p-value of0.08, but the study sites with moisture indices >0.65 have amean CDFNa of 0.18, while the sites with moisture indices<0.65 have a mean CDFNa of 0.11. This is consistent withweathering of plagioclase feldspar that has progressed far-thest in regoliths with the longest wet seasons.[44] In summary, at these field sites chemical erosion rates
and the degree of chemical depletion in the regolith showlittle to no dependence on mean annual regolith temperature,both for the bulk regolith and for individual elements. Bycontrast, rates of chemical erosion and the degree of chem-ical depletion are positively correlated with the length of the
wet season, particularly for Ca and Na, and to a lesser extentfor Si. We note, however, that any effects of temperature onW, WX, CDF, and CDFX may be masked by the covarianceof moisture index and temperature across the study sites.That is, because MART and moisture index are inverselycorrelated across the study sites (Figure 5), the influence ofMART on chemical erosion rates and CDFs may be coun-teracted by the influences of moisture index on chemicalerosion rates and CDFs, to the extent that higher MART andhigher moisture indices both promote faster chemical ero-sion and higher CDFs.
6.3. Anomalous Regolith Compositions at Two Sites
[45] Two field sites on Pilot Peak do not fit the assump-tions underlying the solid-phase mass balance method for
Figure 8. Elemental chemical depletion fractions CDFX plotted against mean annual regolith temperature(MART), moisture index (defined in Figure 4), elemental supply rates PX, and regolith residence times.White symbols = Pilot Peak; black symbols = Tailholt Mountain; r = correlation coefficient; p = p-valuefor r. The white diamond and the � symbol represent site P1850N excluding and including anomalousregolith samples, respectively (section 6.3). All values are means � one standard error.
FERRIER ET AL.: CLIMATE AND CHEMICAL EROSION RATES F02026F02026
16 of 21

estimating chemical erosion rates, as Table 4 shows. The firstis site P1277S. As noted in [Ferrier et al., 2011], this is theonly site on either Pilot Peak or Tailholt Mountain where therock-to-regolith enrichment of Ti is smaller than that of Zr.As a result, the addition of dust with a higher Ti/Zr ratio thanthe parent granite cannot resolve the differences betweenrock-to-regolith enrichments of Zr and Ti at P1277S, as it canat the other sixteen sites. It is not immediately clear whyP1277S differs from the other sites in this regard. However,we note that although the rock sample composition atP1277S is not unusual for rocks from Pilot Peak, the P1277Sregolith samples have more Si and less Al, Fe, Ti, Mg, Nb,and Rb than the other Pilot Peak regoliths. We suggest thatthe rock samples collected from the ridgeline between sitesP1277S and P1264N may be a poor reflection of the parentgranite that produced the regolith at site P1277S.[46] Site P1850N is the other site that yields an anomalous
result, although for a different reason than at P1277S. AtP1850N the rock and regolith compositions are consistent withthe addition of mafic-rich dust, but the estimated bulk CDF isbelow zero, which in turn results in a negative chemical ero-sion rate, which is an impossibility. This odd result occurs atP1850N because some of the P1850N regolith samples have amuch different composition than the others. The rectangularplot from which regoliths were sampled at P1850N lies just afew meters off the north-facing side of the ridgeline, and ten ofthe sixteen regolith samples—all in the western half of theregolith plot, and at the same elevation as the remaining sixregolith samples in the eastern half of the regolith plot—aremuch rockier than the other regolith samples, and have lowerZr concentrations than the other P1850N regoliths and the bulkof the P1850N rock samples. Meanwhile, in the eastern half ofthe regolith plot just a few meters away, the other P1850Nregolith samples have a composition much closer to that of thesampled P1850N rocks. To show how much excluding theregolith samples in the western half of the sampling plotaffects the calculated regolith composition at P1850N, inFigures 6–8 we present two sets of values forW,WX, CDF, andCDFX at P1850N: one set calculated from the average com-position of all regolith samples, and a second set calculatedfrom the average composition of the subset of regolith samplesfrom the eastern half of the regolith plot (i.e., samplesP1850N-B5, B6, B9, B10, B13, B14). Figures 6–8 reveal thatexcluding the anomalously rocky regolith samples in thewestern half of the sampling plot yields values for chemicalerosion rates that are no longer negative. These data demon-strate that large variations in regolith composition can existparallel to topographic contours—i.e., variations unrelated tochemical erosion that may progress during downslope regolithtransport—and can strongly influence calculated values forWand CDF. As such these measurements highlight the impor-tance of collecting multiple regolith samples along topo-graphic contours when quantifying mean hillslope regolithcomposition.[47] We also note that although using the proposed dust
source within the dust-granite mixing model helps resolvemost of the unexpected granite-to-regolith elemental enrich-ments, it does not resolve all of them. In particular, afterincluding dust influxes from the proposed dust source, sev-eral CDFFe on Tailholt Mountain are still negative (althoughthey are much less negative than they would have been if dusthad been neglected; Table 5). This may indicate that the dust
falling on these sites had a higher Fe concentration than theproposed dust source. Elevated concentrations of Fe in dustrelative to the dust source can result from compositionalsorting during transport, as Fe may be preferentially sited insmall secondary Fe-oxide mineral grains that are more likelyto be transported long distances [e.g., Jickells et al., 2005].Future measurements of dust composition in the South Forkof the Salmon River canyon will be needed to test thishypothesis.
6.4. Climate in Central Idaho Over Annualand Millennial Timescales
[48] There is a large difference in timescale between theannual-scale regolith climate measurements and the millen-nial-scale chemical erosion rate measurements, as there is inany study that attempts to link modern climatic time series tolong-term processes of regolith development. Central Idaho’sclimate has not been invariant over the course of regolithdevelopment at the study sites, so here we frame the modernregolith climate measurements in a longer-term context.Before doing so, however, we point out that a fundamentalstrength of altitudinal transect studies (including this one) istheir robustness against changes in regional climate, becausethey rely on the climatic differences between the study sites,and these will not be substantially altered by regional climateshifts. That is, changes in regional climate will have littleeffect on how temperature and precipitation vary with alti-tude (i.e., the lapse rates), or on how insolation varies withaspect; these are the factors that create the climate differencesamong the study sites. Thus climate changes would notsubstantially alter the site-to-site climatic differences onwhich our analysis is based.[49] Longer-term contexts for our regolith climate mea-
surements can be found in 20th century weather station dataand Holocene pollen records. The closest weather station tothe study sites is 15 km northwest of Pilot Peak in Warren,Idaho (http://www.wrcc.dri.edu/cgi-bin/cliMAIN.pl?id9560,accessed March 2011). Relative to its 35-year mean, meanannual air temperature at Warren was 0.87�C warmer during10/1/2005–9/30/2006 (the year for which we have completeregolith monitoring records at all sites on Tailholt Mountain)and 0.65�C warmer during 8/1/2006–7/31/2008 (the twoyears for which we have complete regolith monitoringrecords at all sites on Pilot Peak). Mean annual precipitationat Warren was 63 cm during 10/1/2005–9/30/2006 and 53 cmduring 8/1/2006–7/31/2008, both drier than the 32-year meanof 69 cm.[50] Regolith residence times at the study sites range from
1.4 kyr to 13.9 kyr, which are, of course, much longer than theclimate records at nearby monitoring stations. We are unawareof quantitative constraints on temperature and moisture overmillennial timescales in central Idaho, but qualitative con-straints on millennial-scale changes in climate can be foundfrom nearby paleoecology studies. The closest study of thistype is from McCall Fen, 35 km west-southwest of TailholtMountain [Doerner and Carrara, 2001]. Radiocarbon datingand analysis of pollen grains in a sediment core imply a cli-mate that was, relative to present conditions, cold and dryfrom 19.6 ka until 14.0 ka; cool and moist from 14.0 ka to11.2 ka; warm and dry from 11.2 to 3.4 ka; and cool andmoist from 3.4 ka to the present (all ages are calibratedyears BP). This is broadly similar to paleoclimate histories
FERRIER ET AL.: CLIMATE AND CHEMICAL EROSION RATES F02026F02026
17 of 21

inferred from other pollen records in the region. [Doernerand Carrara, 1999] interpreted pollen in sediment cores55–70 km southwest of Tailholt Mountain as implying con-ditions that were, relative to the present climate, warm and dryfrom 11.2 ka to 3.4 ka and cool and moist after 3.4 ka.[Whitlock et al., 2011] interpreted pollen in a sediment core125 km south-southeast of Tailholt Mountain as a reflection ofconditions that were, relative to present conditions, warmerand drier from 8.24 ka to 2.65 ka, with a transition to a climatesupporting the modern forest composition by 2.65 ka.[Brunelle et al., 2005] interpreted pollen records from sedi-ment cores 75–150 km northeast of Pilot Peak as reflectingmid-Holocene conditions that were warmer and/or drier thanthe present, followed by a shift to a cooler and wetter climateby 3 ka.[51] Although the changes in climate inferred from these
pollen records are not perfectly synchronous with oneanother, they are consistent with a mid-Holocene warmperiod that was preceded and followed by cooler and wetterclimates. Thus, if the pollen records in central Idaho arerepresentative of regolith climate at the study sites, thenduring the monitoring period the sampled regoliths mayhave been warmer and drier than they were over the past�3 kyr and cooler and wetter than they were before �3 ka.As we suggest above, however, such fluctuations in regionalclimate over the Holocene should have had little effect onclimatic differences among the study sites, which is the rel-evant factor for our analysis. Furthermore, regoliths at fiveof the 17 sample sites have residence times <3 kyr, whichimplies those regoliths developed under climatic conditionssimilar to the present. Of the regoliths at the other twelvesites, only two have residence times >5.8 kyr, which impliesall but two of the sampled regoliths developed mainly underthe present climate regime.
7. Evidence for Kinetically-Limited Weathering
[52] Chemical erosion of the bulk regolith and of elementswithin the regolith is often described as occurring in one of twoend-member regimes: supply-limited or kinetically-limited[e.g., Stallard, 1983; West, 2005]. In supply-limited weath-ering, chemical erosion rates are limited by the rate at whichfresh material is supplied to the regolith. For the bulk rego-lith, this supply rate is the total mass flux into the regolith P,and in the case of an element X, this supply rate is PX
(equations (1)–(2)). In the supply-limited weathering regime,chemical erosion rates are linearly proportional to supply rates,and the degree of chemical depletion in the regolith—i.e., theCDF—is constant across a range of regolith production ratesand is independent of the regolith residence time. In its sim-plest and most extreme form, supply-limited weathering of agiven element occurs where 100% of that element is lost bychemical processes because it is present only in highly solubleminerals which themselves undergo complete weathering.This has been observed, for example, in tropical weatheringprofiles where 100% of the Na in the parent rock is lost bycomplete weathering of plagioclase feldspar, which is the solehost of Na in the parent rock [e.g.,White et al., 1998]. In such ascenario WNa = PNa and CDFNa = 1. Direct proportionalitiesbetween chemical erosion rates and supply rates can also arisein settings where weathering is less extreme (i.e., where theCDF < 1). Consider, for example, a rock in which element X is
hosted by several different mineral phases, some of which arehighly soluble and some of which are insoluble. If, duringweathering of this rock, element X were completely lost fromthe soluble minerals and completely retained by the insolubleminerals, regardless of supply rate, this would yield a CDFXwith a value less than 1 that is constant across all supply rates.Close correlations between chemical erosion rates and supplyrates have been observed over a wide range of field sites wheremeasured CDFs are much lower than 1 [Riebe et al., 2004a;Dixon et al., 2009a]. These studies suggest that supply-limitedweathering appears to be a useful descriptor of chemical ero-sion at these sites, in that it can account for a great deal of themeasured variance in chemical erosion rates between sites. Incontrast to supply-limited weathering, kinetically-limitedweathering is characterized by chemical erosion rates that arelimited not by the rate of fresh mineral supply but by howslowly the minerals themselves weather. In this regime,chemical erosion rates are less than linearly proportional toregolith production rates, and regoliths grow more chemicallydepleted (i.e., the CDF increases) with regolith residence time.[53] At our field sites on Pilot Peak and Tailholt Mountain
it appears that the bulk regolith and most of the elements areexperiencing kinetically-limited weathering. Estimates ofthe bulk CDF in regolith systematically decrease with supplyrate and increase with regolith residence time, consistent withchemical erosion that is limited by the kinetics of mineraldissolution rather than the rate of fresh mineral supply(Figure 6). (Here regolith residence time is calculated asthe regolith thickness times regolith density divided by themass influx rate P, where regolith density is assumed to be1640 kg m�3 at each site based on the dry density of regolithcollected on Pilot Peak and measured in the lab.) This patternis especially clear on Tailholt Mountain, which has onecluster of CDFs near zero at short regolith residence times(<2500 years) and a second cluster of CDFs at 0.11–0.15 atlonger regolith residence times (>2500 years). On Pilot Peak,by contrast, many but not all of the data are consistent with arising trend in CDF with regolith residence time. The PilotPeak sites with the smallest CDFs tend to cluster at theshortest regolith residence times, but CDFs do not increasecontinuously with regolith residence time over all Pilot Peaksites. The sites with the two longest regolith residence times(P1062S and P1062N) have CDFs of 0.15 � 0.02 and0.16 � 0.01, respectively, identical within uncertainty toCDFs at other sites on Pilot Peak with considerably shorterresidence times.[54] Although most of the elemental CDFX measurements
are broadly similar to the bulk CDF measurements—i.e., thesmallest values of CDFX for each element tend to cluster atthe shortest regolith residence times, consistent with kineti-cally-limited weathering—there is one notable exception tothis general pattern, and that is CDFK at Pilot Peak. Asidefrom the unusual site P1850N (see section 6.3), all valuesof CDFK on Pilot Peak are the same within uncertainty,and imply that roughly 20% of the K supplied to the rego-lith leaves in solution across a wide range of regolith resi-dence times (Figure 8). As a result, WK on Pilot Peakis linearly proportional to the rate at which K is supplied tothe regolith, consistent with supply-limited chemical erosionof K on Pilot Peak (Figure 7). It may be that 20% of theK in the parent material is in easily weatherable minerals(e.g., biotite) and the other 80% is in less soluble minerals
FERRIER ET AL.: CLIMATE AND CHEMICAL EROSION RATES F02026F02026
18 of 21

(e.g., K-feldspar), and that to first order all of the K ineasily weatherable minerals and none of the K in otherminerals is lost during a single regolith residence time.Future work on the quantitative mineralogy of the parentmaterial and the elemental distributions within the parentminerals will be needed to shed light on the pathways ofelemental weathering in this system, and will be needed totest hypotheses for the cause of supply-limited weatheringbehavior displayed by K on Pilot Peak and the cause ofkinetically-limited weathering behavior displayed by otherelements and the bulk regolith.[55] In summary, our data broadly support the notion that
chemical erosion of the bulk regolith and of most elementsin the regolith is proceeding at rates that are limited by thekinetics of mineral dissolution, rather than the supply ratesof minerals to the regolith.
8. Conclusions
[56] In this paper we have presented new measurements ofregolith production rates, regolith and rock chemistry, andregolith climate along two altitudinal transects in the IdahoBatholith. Several observations about the dependence ofchemical erosion rates on climate and supply rates can begleaned from these data. First, chemical erosion rates atthese field sites do not increase with mean annual regolithtemperature, contrary to the relationship predicted by theoryand laboratory experiments. Second, chemical erosion ratesshow a weak tendency to be faster in regoliths with highermoisture indices (i.e., in regoliths with longer wet seasons).Third, chemical erosion rates do not increase proportionallywith the rate of fresh mineral supply. Fourth, the degree ofchemical alteration (i.e., the CDF) is positively correlatedwith the moisture index: regoliths that spend more time eachyear under high regolith moisture conditions are moreweathered. Fifth, estimates of CDF decrease with the min-eral supply rate and increase with the regolith residencetime: regoliths that spend more time on the hillslope aremore weathered.[57] We draw two main conclusions from these observa-
tions. First, the data suggest that chemical erosion rates inthe study regoliths are largely insensitive to temperature,although we cannot rule out the possibility that chemicalerosion rates may have a temperature dependence that ismasked by a dependence on the length of the wet season,which covaries inversely with temperature across the studysites. The lack of a positive correlation between chemicalerosion rates and temperature in the study regoliths is con-sistent with a number of studies that have also shown weakclimatic controls on chemical erosion rates over decadal andmillennial timescales [Dupre et al., 2003; Riebe et al.,2004a; West et al., 2005], and they differ from studies thathave inferred strong climatic signals in chemical erosionrates along altitudinal transects in Nevada [Riebe et al.,2004b] and the Sierra Nevada [Dixon et al., 2009a].Second, we conclude that chemical erosion in the studyregoliths is generally proceeding in a kinetically-limitedregime—i.e., a regime in which the rate of chemical erosionis limited by how slowly mineral dissolution reactions pro-ceed—rather than in a supply-limited regime. In this regardour measurements differ from those of [Riebe et al., 2004a],which displayed a close proportionality between chemical
erosion rates and mineral supply rates across a wide array offield sites, and are similar to those of [Norton and vonBlanckenburg, 2010], who interpreted measurements ofdenudation rates and CDFs in the Swiss Alps as evidence forkinetic control on chemical erosion rates.[58] One possible interpretation for the absence of strong
correlations between climate and chemical erosion rates atPilot Peak and Tailholt Mountain is that temperature andmoisture exert no more than weak influences on chemicalerosion rates at these sites. Such a conclusion would besurprising, given that chemical erosion rates in the studyregoliths are not strongly dependent on mineral supply ratesand thus should be sensitive to factors like temperature andmoisture that influence mineral dissolution kinetics. Anotherpossible interpretation is that although Pilot Peak and Tail-holt Mountain span considerable ranges in altitude (1.5 kmand 1.3 km, respectively), such ranges are not large enoughto generate large climatic effects on chemical erosion rates.For instance, large variations in chemical erosion rates alonga 2.8 km altitudinal transect in the Sierra Nevada have beeninterpreted as a reflection of a lack of moisture at low alti-tudes and a lack of warmth at high altitudes [Dahlgren et al.,1997; Dixon et al., 2009b]. The altitudinal patterns in thesestudies, however, would have been less apparent if thosestudies had been conducted over an altitudinal range of only1.2–1.3 km, similar to the altitude range of our transects. Athird possible explanation is that the study transects do notcross thresholds across which chemical erosion rates areespecially sensitive to climate. For instance, Riebe et al.[2004b] found that chemical erosion rates dropped sharplyabove the tree line in an altitudinal transect in Nevada’s SantaRosa Mountains. The observations in [Riebe et al., 2004b]are consistent with the notion that biota are an importantdriver of mineral weathering, and thus that chemical erosionrates may be especially sensitive to climate in places wherebiotic species distributions change sharply with small chan-ges in climate (e.g., the tree line). If true, this would suggestthat altitudinal transects that lie entirely below the tree line(like Pilot Peak and Tailholt Mountain) may be less likely toexhibit strong covariations of chemical erosion rates withclimate than altitudinal transects that straddle the tree line(like the Santa Rosa Mountains).[59] Finally, the possibility remains that both temperature
and moisture exert positive controls on chemical erosionrates at the study sites, but that their effects are masked byone another because temperature and moisture covaryinversely among the study sites. The difficulty in decon-volving the effects of temperature and moisture suggests thatthere could be value in measuring chemical erosion rates atsites across which temperature varies widely while precipi-tation rates remain invariant (or vice versa). If chemicalerosion rates in such a study were limited by mineral dis-solution kinetics rather than mineral supply rates, such astudy would be particularly well-suited to isolate the effectsof a single climatic variable on chemical erosion rates, andthus could help untangle the general effects of climate onchemical erosion rates.
[60] Acknowledgments. This work was supported by NSF grantEAR-0643129, and K.L.F. was supported by a Lawrence Scholar GraduateFellowship at Lawrence Livermore National Laboratory during this study.We thank Editor Alex Densmore, Associate Editor Simon Mudd, JeanDixon, and two anonymous reviewers for feedback that substantially
FERRIER ET AL.: CLIMATE AND CHEMICAL EROSION RATES F02026F02026
19 of 21
improved this manuscript, and Cliff Riebe for many insightful discussions.We are also grateful to the U.S. Forest Service for assistance with fieldaccess; Michael Ferrier, Marisa Palucis, and Leslie Hsu for field assistance;and Tim Teague, Ajay Limaye, Shreya Ramesh, Greg Nishimura, and EvanKha for laboratory assistance.
ReferencesAnderson, S. P., W. E. Dietrich, and G. H. Brimhall (2002), Weathering pro-files, mass-balance analysis, and rates of solute loss: Linkages betweenweathering and erosion in a small, steep catchment, Geol. Soc. Am. Bull.,114(9), 1143–1158.
Balco, G., J. O. Stone, N. A. Lifton, and T. J. Dunai (2008), A complete andeasily accessible means of calculating surface exposure ages or erosion ratesfrom 10Be and 26Al measurements, Quat. Geochronol., 3, 174–195,doi:10.1016/j.quageo.2007.12.001.
Berner, R. A., A. C. Lasaga, and R. M. Garrels (1983), The carbonate-silicate geochemical cycle and its effect on atmospheric carbon dioxideover the past 100 million years, Am. J. Sci., 283(7), 641–683.
Blum, A. E., and L. L. Stillings (1995), Feldspar dissolution kinetics, Rev.Mineral., 31, 291–352.
Bluth, G. S., and L. R. Kump (1994), Lithologic and climatic controls ofriver chemistry, Geochim. Cosmochim. Acta, 58(10), 2341–2359.
Bockheim, J. G., J. S. Munroe, D. Douglass, and D. Koerner (2000), Soildevelopment along an elevational gradient in the southeastern UintaMountains, Utah, USA, Catena, 39, 169–185.
Brady, P. V., and S. A. Carroll (1994), Direct effects of CO2 and tempera-ture on silicate weathering: Possible implications for climate control,Geochim. Cosmochim. Acta, 58(8), 1853–1856.
Brantley, S. L., H. Buss, M. Lebedeva, R. C. Fletcher, and L. Ma (2011),Investigating the complex interface where bedrock transforms to regolith,Appl. Geochem., 26, S12–S15, doi:10.1016/j.apgeochem.2011.03.017.
Brimhall, G. H., and W. E. Dietrich (1987), Constitutive mass balance rela-tions between chemical composition, volume, density, porosity, and strainin metasomatic hydrochemical systems: Results on weathering and pedo-genesis, Geochim. Cosmochim. Acta, 51(3), 567–587.
Brunelle, A., C.Whitlock, P. Bartlein, and K. Kipfmueller (2005), Holocene fireand vegetation along environmental gradients in the northern rocky moun-tains, Quat. Sci. Rev., 24, 2281–2300, doi:10.1016/j.quascirev.2004.11.010.
Burke, B. C., A. M. Heimsath, and A. F. White (2007), Coupling chemicalweathering with soil production across soil-mantled landscapes, EarthSurf. Processes Landforms, 32(6), 853–873, doi:10.1002/esp.1443.
Burke, B. C., A. M. Heimsath, J. L. Dixon, J. Chappell, and K. Yoo (2009),Weathering the escarpment: Chemical and physical rates and processes,south-eastern Australia, Earth Surf. Processes Landforms, 34, 768–785,doi:10.1002/esp.1764.
Chadwick, O. A., G. H. Brimhall, and D. M. Hendricks (1990), From ablack to a gray box—A mass balance interpretation of pedogenesis,Geomorphology, 3, 369–390.
Chadwick, O. A., R. T. Gavenda, E. F. Kelly, K. Ziegler, C. G. Olson, W. C.Elliott, and D. M. Hendricks (2003), The impact of climate on the biogeo-chemical functioning of volcanic soils, Chem. Geol., 202, 195–223.
Chen, Y., and S. L. Brantley (1997), Temperature- and pH-dependence ofalbite dissolution rate at acid pH, Chem. Geol., 135, 275–290.
Dahlgren, R. A., J. L. Boettinger, G. L. Huntington, and R. G. Amundson(1997), Soil development along an elevational transect in the westernSierra Nevada, California, Geoderma, 78, 207–236.
Dixon, J. L., A. M. Heimsath, and R. Amundson (2009a), The critical roleof climate and saprolite weathering in landscape evolution, Earth Surf.Processes Landforms, 34, 1507–1521, doi:10.1002/esp.1836.
Dixon, J. L., A. M. Heimsath, and R. Amundson (2009b), Climate-drivenprocesses of hillslope weathering, Geology, 37, 975–978, doi:10.1130/G30045A.1.
Doerner, J. P., and P. E. Carrara (1999), Deglaciation and postglacial veg-etation history of the West Mountains, west-central Idaho, U.S.A., Arct.Antarct. Alp. Res., 31, 303–311.
Doerner, J. P., and P. E. Carrara (2001), Late quaternary vegetation and cli-matic history of the Long Valley area, west-central Idaho, U.S.A., Quat.Res., 56, 103–111, doi:10.1006/qres.2001.2247.
Drever, J. I., and J. Zobrist (1992), Chemical weathering of silicate rocks asa function of elevation in the southern Swiss Alps, Geochim. Cosmochim.Acta, 56(8), 3209–3216.
Dupre, B., C. Dessert, P. Oliva, Y. Godderis, J. Viers, L. Francois, R. Millot,and J. Gaillardet (2003), Rivers, chemical weathering and Earth’s climate,C. R. Geosci., 335, 1141–1160, doi:10.1016/j.crte.2003.09.015.
Egli, M., A. Mirabella, G. Sartori, and P. Fitze (2003), Weathering rates as afunction of climate: Results from a climosequence of the Val Genova(Trentino, Italian Alps), Geoderma, 111, 99–121.
Egli, M., A. Mirabella, A. Mancabelli, and G. Sartori (2004), Weathering ofsoils in alpine areas as influenced by climate and parent material, ClaysClay Miner., 52(3), 287–303, doi:10.1346/CCMN.2004.0520304.
Egli, M., A. Mirabella, G. Sartori, R. Zanelli, and S. Bischof (2006), Effect ofnorth and south exposure on weathering rates and clay mineral formation inAlpine soils, Catena, 67, 155–174, doi:10.1016/j.catena.2006.02.010.
Ferrier, K. L., J. W. Kirchner, and R. C. Finkel (2011), Estimating millennial-scale rates of dust incorporation into eroding hillslope regolith using cos-mogenic nuclides and immobile weathering tracers, J. Geophys. Res.,116, F03022, doi:10.1029/2011JF001991.
Gaillardet, J., B. Dupre, P. Louvat, and C. J. Allegre (1999), Global silicateweathering and CO2 consumption rates from the chemistry of large rivers,Chem. Geol., 159, 3–30.
Garrels, R. M., and F. T. Mackenzie (1967), Origin of the chemical compo-sitions of some springs and lakes, Adv. Chem. Ser., 67, 222–242.
Gosse, J. C., and F. M. Phillips (2001), Terrestrial in situ cosmogenicnuclides: Theory and application, Quat. Sci. Rev., 20, 1475–1560.
Green, E. G., W. E. Dietrich, and J. F. Banfield (2006), Quantification ofchemical weathering rates across an actively eroding hillslope, EarthPlanet. Sci. Lett., 242, 155–169, doi:10.1016/j.epsl.2005.11.039.
Grieve, I. C., J. Proctor, and S. A. Cousins (1990), Soil variations with alti-tude on Volcan Barva, Costa Rica, Catena, 17, 525–534.
Heimsath, A. M., W. E. Dietrich, K. Nishiizumi, and R. C. Finkel(1997), The soil production function and landscape equilibrium, Nature,388(6640), 358–361.
Hodson, M. E. (2002), Experimental evidence for mobility of Zr and othertrace elements in soils, Geochim. Cosmochim. Acta, 66(5), 819–828.
Jickells, T. D., et al. (2005), Global iron connections between desert dust,ocean biogeochemistry, and climate, Science, 308, 67–71, doi:10.1126/science.1105959.
Kirchner, J. W., R. C. Finkel, C. S. Riebe, D. E. Granger, J. L. Clayton,J. G. King, and W. F. Megahan (2001), Mountain erosion over 10 yr,10 k.y., and 10 m.y. time scales, Geology, 29(7), 591–594.
Kohl, C. P., and K. Nishiizumi (1992), Chemical isolation of quartz formeasurement of in situ-produced cosmogenic nuclides, Geochim. Cosmo-chim. Acta, 56(9), 3583–3587.
Kump, L. R., S. L. Brantley, and M. A. Arthur (2000), Chemical weather-ing, atmospheric CO2, and climate, Annu. Rev. Earth Planet. Sci., 28,611–667.
Lebedeva, M. I., R. C. Fletcher, and S. L. Brantley (2010), A mathematicalmodel for steady-state regolith production at constant erosion rate, EarthSurf. Processes Landforms, 35, 508–524, doi:10.1002/esp.1954.
Lund, K. (2004), Geology of the Payette National Forest and vicinity, west-central Idaho, U.S. Geol. Surv. Prof. Pap., 1666-A-B, 97 pp., U.S. Geol.Surv., Reston, Va.
Lund, K., L. W. Snee, and K. V. Evans (1986), Age and genesis of precious-metals deposits, Buffalo Hump district, central Idaho: Implications fordepth of emplacement of quartz veins, Econ. Geol., 81, 990–996,doi:10.2113/gsecongeo.81.4.990.
Millot, R., J. Gaillardet, B. Dupre, and C. J. Allegre (2002), The global con-trol of silicate weathering rates and the coupling with physical erosion:New insights from rivers of the Canadian Shield, Earth Planet. Sci. Lett.,196(1–2), 83–98.
Mudd, S. M., and D. J. Furbish (2006), Using chemical tracers in hillslopesoils to estimate the importance of chemical denudation under conditionsof downslope sediment transport, J. Geophys. Res., 111, F02021,doi:10.1029/2005JF000343.
Norton, K. P., and F. von Blanckenburg (2010), Silicate weathering of soil-mantled slopes in an active alpine landscape, Geochim. Cosmochim.Acta, 74(18), 5243–5258, doi:10.1016/j.gca.2010.06.019.
Petit, J. R., et al. (1999), Climate and atmospheric history of the past420,000 years from the Vostok ice core, Antarctica, Nature, 399, 429–436.
Rasmussen, C., S. Brantley, D. D. Richter, A. Blum, J. Dixon, and A. F.White (2011), Strong climate and tectonic control on plagioclase weath-ering in granitic terrain, Earth Planet. Sci. Lett., 301, 521–530,doi:10.1016/j.epsl.2010.11.037.
Riebe, C. S. (2000), Tectonic and climatic control of physical erosion ratesand chemical weathering rates in the Sierra Nevada, California, inferredfrom cosmogenic nuclides and geochemical mass balance, Ph.D. thesis,Dep. of Earth and Planet. Sci., Univ. of Calif. Berkeley, Berkeley, Calif.
Riebe, C. S., J. W. Kirchner, D. E. Granger, and R. C. Finkel (2001), Strongtectonic and weak climatic control of long-term chemical weatheringrates, Geology, 29(6), 511–514.
Riebe, C. S., J. W. Kirchner, and R. C. Finkel (2003), Long-term rates ofchemical weathering and physical erosion from cosmogenic nuclidesand geochemical mass balance, Geochim. Cosmochim. Acta, 67(22),4411–4427.
Riebe, C. S., J. W. Kirchner, and R. C. Finkel (2004a), Erosional and cli-matic effects on long-term chemical weathering rates in granitic
FERRIER ET AL.: CLIMATE AND CHEMICAL EROSION RATES F02026F02026
20 of 21

landscapes spanning diverse climate regimes, Earth Planet. Sci. Lett.,224(3–4), 547–562, doi:10.1016/j.epsl.2004.05.019.
Riebe, C. S., J. W. Kirchner, and R. C. Finkel (2004b), Sharp decrease inlong-term chemical weathering rates along an altitudinal transect, EarthPlanet. Sci. Lett., 218(3–4), 421–434, doi:10.1016/S0012-821X(03)00673-3.
Stallard, R. F. (1985), River chemistry, geology, geomorphology, and soilsin the Amazon and Orinoco basins, in The Chemistry of Weathering, edi-ted by J. I. Drever, pp. 293–316, D. Reidel, Dordrecht, Netherlands.
Stallard, R. F., and J. M. Edmond (1983), Geochemistry of the Amazon 2.The influence of geology and weathering environment on the dissolved load,J. Geophys. Res., 88(C14), 9671–9688, doi:10.1029/JC088iC14p09671.
Sweeney, M. R., D. R. Gaylord, and A. J. Busacca (2007), Evolution ofEureka Flat: A dust-producing engine of the Palouse loess, USA, Quat.Int., 162–163, 76–96, doi:10.1016/j.quaint.2006.10.034.
Sweetkind, D. S., and D. D. Blackwell (1989), Fission-track evidence of theCenozoic thermal history of the Idaho batholith, Tectonophysics, 157,241–250.
Taboada, T., A. M. Cortizas, C. García, and E. García-Rodeja (2006), Par-ticle-size fractionation of titanium and zirconium during weathering andpedogenesis of granitic rocks in NW Spain, Geoderma, 131, 218–236,doi:10.1016/j.geoderma.2005.03.025.
Velbel, M. A. (1993), Temperature dependence of silicate weathering innature: How strong a negative feedback on long-term accumulation ofatmospheric CO2 and global greenhouse warming?, Geology, 21,1059–1062.
Walker, J. C. G., P. B. Hays, and J. F. Kasting (1981), A negative feedbackmechanism for the long-term stabilization of Earth’s surface temperature,J. Geophys. Res., 86(C10), 9776–9782, doi:10.1029/JC086iC10p09776.
West, A. J., A. Galy, and M. Bickle (2005), Tectonic and climatic controls onsilicate weathering, Earth Planet. Sci. Lett., 235, 211–228, doi:10.1016/j.epsl.2005.03.020.
White, A. F., and A. E. Blum (1995), Effects of climate on chemical weath-ering in watersheds, Geochim. Cosmochim. Acta, 59(9), 1729–1747.
White, A. F., and S. L. Brantley (2003), The effect of time on the weathering ofsilicate minerals: Why doweathering rates differ in the laboratory and field?,Chem. Geol., 202(3–4), 479–506, doi:10.1016/j.chemgeo.2003.03.001.
White, A. F., A. E. Blum, M. S. Schulz, D. V. Vivit, D. A. Stonestrom,M. Larsen, S. F. Murphy, and D. Eberl (1998), Chemical weathering in atropical watershed, Luquillo Mountains, Puerto Rico: I. Long-term versusshort-term weathering fluxes, Geochim. Cosmochim. Acta, 62(2), 209–226.
White, A. F., A. E. Blum, T. D. Bullen, D. V. Vivit, M. Schulz, andJ. Fitzpatrick (1999), The effect of temperature on experimental and natu-ral chemical weathering rates of granitoid rocks, Geochim. Cosmochim.Acta, 63(19–20), 3277–3291.
Whitlock, C., C. E. Briles, M. C. Fernandez, and J. Gage (2011), Holocenevegetation, fire and climate history of the sawtooth range, central Idaho,USA, Quat. Res., 75, 114–124, doi:10.1006/j.yqres.2010.08.013.
Wilkinson, B. H., and B. J. McElroy (2007), The impact of humans on conti-nental erosion and sedimentation, Geol. Soc. Am. Bull., 119(1/2), 140–156,doi:10.1130/B25899.
Yoo, K., and S. M. Mudd (2008), Discrepancy between mineral residencetime and soil age: Implications for the interpretation of chemical weather-ing rates, Geology, 36(1), 35–38, doi:10.1130/G24285A.1.
Yoo, K., R. Amundson, A. M. Heimsath, W. E. Dietrich, and G. H.Brimhall (2007), Integration of geochemical mass balance with sedimenttransport to calculate rates of soil chemical weathering and transport onhillslopes, J. Geophys. Res., 112, F02013, doi:10.1029/2005JF000402.
FERRIER ET AL.: CLIMATE AND CHEMICAL EROSION RATES F02026F02026
21 of 21