We evaluate the impact of a program aiming at improving ...
75
econstor Make Your Publications Visible. A Service of zbw Leibniz-Informationszentrum Wirtschaft Leibniz Information Centre for Economics Alan, Sule; Corekcioglu, Gozde; Sutter, Matthias Working Paper Improving Workplace Climate in Large Corporations: A Clustered Randomized Intervention CESifo Working Paper, No. 9304 Provided in Cooperation with: Ifo Institute – Leibniz Institute for Economic Research at the University of Munich Suggested Citation: Alan, Sule; Corekcioglu, Gozde; Sutter, Matthias (2021) : Improving Workplace Climate in Large Corporations: A Clustered Randomized Intervention, CESifo Working Paper, No. 9304, Center for Economic Studies and ifo Institute (CESifo), Munich This Version is available at: http://hdl.handle.net/10419/245485 Standard-Nutzungsbedingungen: Die Dokumente auf EconStor dürfen zu eigenen wissenschaftlichen Zwecken und zum Privatgebrauch gespeichert und kopiert werden. Sie dürfen die Dokumente nicht für öffentliche oder kommerzielle Zwecke vervielfältigen, öffentlich ausstellen, öffentlich zugänglich machen, vertreiben oder anderweitig nutzen. Sofern die Verfasser die Dokumente unter Open-Content-Lizenzen (insbesondere CC-Lizenzen) zur Verfügung gestellt haben sollten, gelten abweichend von diesen Nutzungsbedingungen die in der dort genannten Lizenz gewährten Nutzungsrechte. Terms of use: Documents in EconStor may be saved and copied for your personal and scholarly purposes. You are not to copy documents for public or commercial purposes, to exhibit the documents publicly, to make them publicly available on the internet, or to distribute or otherwise use the documents in public. If the documents have been made available under an Open Content Licence (especially Creative Commons Licences), you may exercise further usage rights as specified in the indicated licence. www.econstor.eu
Transcript of We evaluate the impact of a program aiming at improving ...

econstorMake Your Publications Visible.
A Service of
zbwLeibniz-InformationszentrumWirtschaftLeibniz Information Centrefor Economics
Alan, Sule; Corekcioglu, Gozde; Sutter, Matthias
Working Paper
Improving Workplace Climate in Large Corporations:A Clustered Randomized Intervention
CESifo Working Paper, No. 9304
Provided in Cooperation with:Ifo Institute – Leibniz Institute for Economic Research at the University of Munich
Suggested Citation: Alan, Sule; Corekcioglu, Gozde; Sutter, Matthias (2021) : ImprovingWorkplace Climate in Large Corporations: A Clustered Randomized Intervention, CESifoWorking Paper, No. 9304, Center for Economic Studies and ifo Institute (CESifo), Munich
This Version is available at:http://hdl.handle.net/10419/245485
Standard-Nutzungsbedingungen:
Die Dokumente auf EconStor dürfen zu eigenen wissenschaftlichenZwecken und zum Privatgebrauch gespeichert und kopiert werden.
Sie dürfen die Dokumente nicht für öffentliche oder kommerzielleZwecke vervielfältigen, öffentlich ausstellen, öffentlich zugänglichmachen, vertreiben oder anderweitig nutzen.
Sofern die Verfasser die Dokumente unter Open-Content-Lizenzen(insbesondere CC-Lizenzen) zur Verfügung gestellt haben sollten,gelten abweichend von diesen Nutzungsbedingungen die in der dortgenannten Lizenz gewährten Nutzungsrechte.
Terms of use:
Documents in EconStor may be saved and copied for yourpersonal and scholarly purposes.
You are not to copy documents for public or commercialpurposes, to exhibit the documents publicly, to make thempublicly available on the internet, or to distribute or otherwiseuse the documents in public.
If the documents have been made available under an OpenContent Licence (especially Creative Commons Licences), youmay exercise further usage rights as specified in the indicatedlicence.
www.econstor.eu

9304 2021
September 2021
Improving Workplace Climate in Large Corporations: A Clustered Randomized Intervention Sule Alan, Gozde Corekcioglu, Matthias Sutter

Impressum:
CESifo Working Papers ISSN 2364-1428 (electronic version) Publisher and distributor: Munich Society for the Promotion of Economic Research - CESifo GmbH The international platform of Ludwigs-Maximilians University’s Center for Economic Studies and the ifo Institute Poschingerstr. 5, 81679 Munich, Germany Telephone +49 (0)89 2180-2740, Telefax +49 (0)89 2180-17845, email [email protected] Editor: Clemens Fuest https://www.cesifo.org/en/wp An electronic version of the paper may be downloaded · from the SSRN website: www.SSRN.com · from the RePEc website: www.RePEc.org · from the CESifo website: https://www.cesifo.org/en/wp

CESifo Working Paper No. 9304
Improving Workplace Climate in Large Corporations:
A Clustered Randomized Intervention
Abstract We evaluate the impact of a program aiming at improving the workplace climate in corporations. The program is implemented via a clustered randomized design and evaluated with respect to the prevalence of support networks, antisocial behavior, perceived relational atmosphere, and turnover rate. We find that professionals in treated corporations are less inclined to engage in toxic competition, exhibit higher reciprocity toward each other, report higher workplace satisfaction and a more collegial atmosphere. Treated firms have fewer socially isolated individuals and a lower employee turnover. The program's success in improving leader-subordinate relationships emerges as a likely mechanism to explain these results. JEL-Codes: C930, M140, M530. Keywords: workplace climate, relational dynamics, leadership quality, RCT.
Sule Alan European University Institute
San Domenico di Fiesole / Italy [email protected]
Gozde Corekcioglu
Kadir Has University Istanbul / Turkey
Matthias Sutter
Max Planck Institute for Research on Collective Goods, Bonn / Germany
September 2021 We are grateful to the Max Planck Institute for Research on Collective Goods for fully funding this study. We thank Marcella Alsan, Michela Carlana, David Deming, Guido Friebel, Johannes Haushofer, Nathan Maddix, seminar participants at Australian Health Human Capital Seminar, Goethe University Frankfurt, Harvard Kennedy School, and London School of Economics Workshop on Political Economy of Turkey for comments. We are extremely grateful to Yusuf Agus, Brian Cooper, Mert Gumren, Enes Isik, and Mustafa Kaba for research assistance. The study has ethics approval from Kadir Has University Institutional Review Board. Con_dentiality agreements are signed by each participating corporation and Kadir Has University. The trial has been registered at the AEA Registry:AEARCTR-0007532.
1 Introduction
Workplace climate, referring to the quality of the workplace and the relational atmosphere
perceived by employees, is key to the long-term success of corporations (Barney, 1986; Boyce
et al., 2015; Guiso, Sapienza and Zingales, 2015; Martinez et al., 2015; Gartenberg, Prat and
Serafeim, 2019). The benefits of a positive workplace climate are many. At the individual
level, these benefits span psychological well-being, employee engagement, and motivation,
which ultimately reflect on performance (Ostroff, 1992; Judge et al., 2001; Srivastava et al.,
2018; Guadalupe, Kinias and Schloderer, 2020). At the firm level, a positive relational at-
mosphere implies employee retention, productivity, profitability, and innovation (Edmans,
2011; Boyce et al., 2015; Guiso, Sapienza and Zingales, 2015; Graham et al., 2016, 2017).
Despite these large benefits, dysfunctional workplace climates characterized by toxic rela-
tional dynamics and low employee satisfaction are prevalent and impose tremendous costs
on firms worldwide. According to a 2019 report from the Society for Human Resource Man-
agement (SHRM), 20% of U.S. employees quit their jobs in the last five years due to the
toxicity in the workplace relationships. Toxicity in relational dynamics in the workplace
is typically characterized as antisocial and sometimes unethical behavior such as bullying,
mobbing, gossiping, and slandering. These undesirable behaviors tend to emerge more easily
in competitive work environments where communication is poor and individual performance
is difficult to quantify (Akella and Lewis, 2019).
Leaders have a vital role in shaping the relational atmosphere in large corporations
(Van den Steen, 2010; Inceoglu et al., 2018; Hoffman and Tadelis, 2021). This is, for instance,
clearly indicated in the 2019 report of to SHRM, which states that 58 percent of employees
who quit because of a poor workplace culture blame their managers for it.1 Leaders are in a
prime position to create an environment where interactions are prosocial, language is profes-
sional, and teamwork is championed; or an environment where the communication is poor,
the language is toxic, and interactions resemble zero-sum games (Bloom and Van Reenen,
2007; Bruhn, Karlan and Schoar, 2010; Bloom et al., 2013; Sharma and Tarp, 2018; Bandiera
et al., 2020).2 Employees’ perceptions of workplace quality and their interactions with their
colleagues are likely to be shaped by the relational culture their leaders establish. Employees
1See https://pmq.shrm.org/wp-content/uploads/2020/07/SHRM-Culture-Report_2019-1.pdf
2There is an established literature on the importance of teamwork in corporations (Lindbeck and Snower,2000; Hamilton, Nickerson and Owan, 2003; Lazear and Shaw, 2007), and some recent work showing thatteamwork skills are highly valuable in corporations (Weidmann and Deming, 2020).
2

who work in environments where they face regular mistreatment, disrespectful and conde-
scending language likely adopt such behaviors as norms, pushing the firm’s relational climate
further into a dysfunctional state. In such circumstances, taking transformative actions may
become a policy imperative.
This paper evaluates one such action, a unique workplace improvement program, offered
to white-collar professionals in large corporations in Turkey. The program aims to improve
workplace climate and relational atmosphere by encouraging prosociality in professional re-
lationships, focusing primarily on improving leader-subordinate relations. The training com-
prises several modules implemented as a series of online workshops, followed by an 8-week
project development work monitored by a professional implementing partner. The imple-
menting partner is a consulting firm established by burned-out professionals who recently
launched a movement to change the toxic relational environment in large corporations. The
main concepts covered in the program are effective communication by eliminating hostile and
condescending language, enhancing prosociality in professional interactions, and increasing
professional support among colleagues. Leveraging its extensive first-hand experience about
highly destructive relationships in competitive corporations, the partner uses unconventional
methods to deliver their program, including creative drama, active role-playing, vulnerabil-
ity exercises, and imagery. An essential component of the program is a closely monitored
8-week follow-up where participants develop projects focusing on prosocial interactions and
propose them to their top executives.
We evaluate this unique program using a sample of 20 large corporations operating in
the energy, chemistry, defense, finance, construction, and textile sectors. Some of our par-
ticipating corporations are multinationals operating in Turkey, all 20 of them are major
players in their respective sectors, and 9 of them are publicly held3. Except for finance
firms, these corporations employ a large body of blue-collar workforce. Our study concerns
the white-collar professionals who work in company headquarters. After securing the firms’
cooperation for our study, we collected rich baseline data from their employees of all ranks
by visiting company headquarters in person in Fall 2019. The program was offered to ran-
domly selected 10 corporations after baseline. Our initial plan to implement the program
in person between Fall 2019 and Spring 2020 was interrupted by the COVID-19 pandemic.
After deliberations with the treatment firms, we decided to implement the program using
online tools throughout the fall of 2020 and the spring of 2021. We conducted our endline
3The relative market shares of the participating companies within their sectors range from 2.5% to 51%.
3

in Summer 2021. The total number of professionals involved in the evaluation is over 2,300,
about 18% of whom hold a leadership (managerial) position.
The program is evaluated with respect to a wide range of outcomes that characterize
the relational atmosphere and perceived workplace quality in a firm. Our toolkit contains
incentivized games, social network elicitation templates, a detailed survey inventory, and
administrative records of turnover and promotions. We use incentivized games to elicit
prosocial and antisocial behaviors. Specifically, we measure the degree of toxic competition
among colleagues using a performance sabotage game, trust and reciprocity using a trust
game, and a sense of fairness using the ultimatum game. We then elicited social networks
to measure social isolation and social connectedness at the department level. For this, we
asked all employees to nominate colleagues from whom they receive (i) professional (work-
related) help and (ii) help in personal matters. Using survey items, we construct indices to
capture workplace satisfaction, perceptions of meritocracy in the firm, collegiality amongst
employees, and descriptive and prescriptive behavioral norms. Because the program im-
plementation and endline unintentionally coincided with the COVID-19 pandemic where
many firms switched to working from home or made hybrid arrangements, we also measured
pandemic-induced social isolation feelings at endline.
We find that the program significantly increases prosociality and lessens antisocial ten-
dencies in the workplace. Treated professionals are significantly less inclined to sabotage
their colleagues’ performance for their own gain in a competitive game. Specifically, treated
professionals used 12% less sabotage endowment to destroy their opponents’ performance
than the control. While we estimate no significant improvement in interpersonal trust, we
find that treated professionals reciprocate their colleagues’ trust more generously (by about
8%) than the professionals in the control firms. The program’s effect on prosocial behavior
is similar for subordinates and those in leadership positions.
We then show that the program is highly successful in improving perceived workplace
quality and relational atmosphere within departments. We find that the program improved
workplace satisfaction by 0.28 standard deviations and perceived meritocratic values by 0.25
standard deviations for the full sample. These improvements become stronger (0.35 and 0.31
standard deviations) when we restrict our sample to subordinates. We also estimate a large
and statistically significant improvement in the perceived collegiality in treated departments
(0.25 standard deviations). While positive, the estimated effects on descriptive and pre-
scriptive behavioral norms do not reach statistical significance. We estimate null effects on
4

perceived workplace quality and relational dynamics for the leader sample, indicating that
improvements in these outcomes are driven by the subordinates.
At the departmental level, we find that the program lowers the proportion of socially iso-
lated employees by about 50%. The program has a remarkable impact on within-department
network density, almost doubling the network density index. We find that the program is
also effective in easing the COVID-19 related social isolation feelings. We find that treated
employees are 6 percentage points less likely to report losing connection with their leaders
during the pandemic, representing a 16% decline relative to the control group. The program
also has a substantial impact on the firms’ turnover rate with no impact on promotions.
The proportion of employees who quit their jobs within the implementation period is quite
low due to the firing ban imposed by the Turkish government during the pandemic. Only
5% of employees in control firms left their firms within this period, and we find that the
intervention almost entirely eliminated these voluntary quits.
We show that the program’s positive effects likely stem from its success in improving
leader-subordinate relationships. We find that the treated subordinates report 0.25 stan-
dard deviations higher professionalism and 0.28 standard deviations higher empathy of their
leaders. Consistent with these results, treated employees are also 10 percentage points more
likely to nominate their leader as their primary professional help provider, representing a
16% increase relative to the control group. Overall, our results suggest that a targeted inten-
sive training program that focuses on prosociality in professional interactions can improve
the relational atmosphere in large and highly competitive corporations. Our results also
suggest that changing the behavior of leaders of all ranks is key to improving subordinates’
perceived workplace quality and departmental collegiality.
Our paper offers two main contributions. First, we conduct the first clustered random-
ized controlled trial targeting relational culture in large corporations. We provide rigorous
evidence on the effectiveness of an innovative training program, focusing exclusively on im-
proving the quality of professional interactions in highly competitive corporations.4 The
second contribution pertains to the toolkit we use to evaluate this program. We designed a
rich inventory to measure outcomes that characterize the workplace climate in a firm. We
4Bruhn, Karlan and Schoar (2018) evaluate a management consulting intervention using a large numberof small and medium enterprises in Mexico. Their focus is on firm performance. Azulai et al. (2020) evaluatethe effectiveness of a motivational work process improvement program targeting bureaucrats in Ghana’s CivilService. Our paper focuses exclusively on improving the relational dynamics in competitive corporations viaa clustered randomized design, and using outcomes measured in previously unavailable details.
5

collect previously unavailable data from a large number of corporate professionals across
different firms and sectors and use them as outcomes to evaluate a unique training program.
Furthermore, our results can be generalized to other contexts. Competitive workplaces with
a toxic relational atmosphere are ubiquitous not only in the corporate world, but also in
the public sector and even in academia (Shallcross, Sheehan and Ramsay, 2008; Wu, 2018;
Dupas et al., 2021). The results of this study imply that innovative and highly focused in-
terventions can go a long way to build a more positive relational environment in workplaces
and eliminate antisocial interactions.
Our paper contributes to several different strands of literature. In the last decade, there
has been an increasing interest in field experiments in firms to understand the effect of dif-
ferent policies and interventions on firm productivity.5 One branch of this literature looks
at managerial capital and leadership styles as well as manager personality, in predicting firm
performance (Bertrand and Schoar, 2003; Bloom and Van Reenen, 2007; Bruhn, Karlan and
Schoar, 2010; Bloom et al., 2013; Lazear, Shaw and Stanton, 2015; Sharma and Tarp, 2018;
Bandiera et al., 2020). There are a number of field experiments on the effects of management
practices on employee productivity (Blader, Gartenberg and Prat, 2020; Gosnell, List and
Metcalfe, 2020). Another branch deals with building human capital, using either worker
training or the training of managers (Bruhn, Karlan and Schoar, 2018). Few studies investi-
gate the effect of non-traditional employee training such as soft-skills training on firm-level
productivity (Campos et al., 2017; Ubfal et al., 2019; Azulai et al., 2020). Our study con-
tributes to this literature by providing results from a clustered randomized trial focusing on
the relational environment in large corporations from a large set of different industry sectors.
Our paper also contributes to the literature on the importance of social skills in the labor
market (Kosse and Tincani, 2020). Deming (2017) shows that the premium on these skills
has been rising in the last few decades and Weidmann and Deming (2020) demonstrates in
addition that social skills improve team performance. We complement this new and growing
literature by showing how social skills can be fostered at the intensive margin via innovative
training programs and how they affect workplace climate, social networks and turnover rates
in large corporations. We also contribute to an extensive literature that shows the impor-
tance of leadership quality and leadership styles in large corporations (Bolton, Brunnermeier
and Veldkamp, 2013; Bandiera et al., 2020; Dessein and Santos, 2021; Hoffman and Tadelis,
2021). This literature often emphasizes the relationship between strong leadership and firm
5See Quinn and Woodruff (2019) for a review of the experiments in firms.
6

performance (Bertrand and Schoar, 2003; Bennedsen et al., 2007; Kaplan, Klebanov and
Sorensen, 2012; Lazear, Shaw and Stanton, 2015; Bandiera et al., 2020) or worker produc-
tivity (Heinz et al., 2020).6 An emerging literature highlights the role of leaders in shaping
corporate culture measured as beliefs and norms (d’Adda et al., 2017; Gachter and Renner,
2018), employee motivation (Kajackaite and Sliwka, 2020), creativity (Amabile et al., 2004),
and well-being (Inceoglu et al., 2018). By showing the importance of leadership and, in par-
ticular, leader-subordinate relationships in shaping the relational culture of firms causally,
we complement this large and important literature.
The rest of the paper is organized as follows. Section 2 provides information on the con-
text, intervention content and evaluation design. Section 3 describes our primary outcomes
and how we collected them. Our data and results are presented and discussed in Section 4.
In Section 5, we explore potential mechanisms. We conclude in Section 6.
2 Background
2.1 Context for the Evaluation
The idea of this study was conceived during informal conversations with corporate profes-
sionals in Turkey in Spring 2019. These professionals repeatedly highlighted relational issues
as primary reasons for early retirement, burnout, deteriorating mental well-being, or contin-
uously looking for another job. We followed this up and conducted a more formal qualitative
study to gain a deeper understanding of these relational issues and how they affect these
highly-educated professionals. For this, using a professional network, we sent an online sur-
vey to a total of 80 professionals of different ranks and years of experience and asked them to
state the most challenging problems a corporate professional faces when working in large and
competitive corporations. Sixty-eight professionals responded to our short survey. Among
these, 38 were in full-time employment in large firms, and 30 had left corporate life to do
something else or retired. Exactly 50% of these professionals placed “toxic relationships and
antisocial behavior” in the top 3 problems they face (faced). About 47% placed “difficult
leaders”, 43% the lack of meritocratic values, 32% long hours, and 31% low pay in the top
3. We provide the exact wording of these questions and the detailed graphical results in the
6Friebel, Heinz and Zubanov (2021) and Hoffman and Tadelis (2021) show that managers are instrumentalin reducing personnel turnover rate.
7

Online Appendix E; See Figure E.1.
Motivated by these results, we reached out to 30 large corporations operating in defense,
chemistry, energy, finance, construction, and textile sectors in Turkey. We enlisted 20 of
them to implement a workplace improvement program.7 Recruitment of these corporations
involved multiple meetings with their CEOs, HR officials, compliance departments, and, on
some occasions, their foreign headquarters. Upon agreement, each recruited firm signed a
data confidentiality agreement and a research collaboration protocol with Kadir Has Uni-
versity8. In recruiting these firms, we made sure that the participating firm is a significant
player in its sector in terms of market share and has centralized and transparent HR prac-
tices. Second, we ensured that we had at least two firms in a given sector. Finally, we
made sure that participating firms had understood and accepted the condition that, while
we promised to offer the training program to all participating firms, we could not say when,
within a given one-year window, a given firm would have access to the program. The latter
criterion was to ensure that, after collecting our baseline data, we could randomize the firms
into treatment and control and offer the program to the former immediately, while holding
the latter until after endline. The program was offered only to the employees working in
company headquarters. The participation in the study was voluntary and about 71% of
white-collar employees in company headquarters signed up for the study, with 69% and 73%
in treatment and control firms, respectively. The non-participation in the study was gener-
ally at the departmental level. Some departments could not participate in the study due to
the nature of their tasks, for example, having to be at the desk during stock market sessions
for finance firms. Moreover, some small departments were considered low priority for this
study by the firms themselves and excluded at the outset.
2.2 Evaluation Design
We collected rich baseline data by visiting all companies in person in the fall of 2019. For
this, we visited each firm (often several times), gathered employees, department by depart-
ment, in meeting rooms, and collected our data. An average baseline data collection session
lasted about 3 hours. Each session started with a brief introduction and signing individ-
7Three firms allowed us to collect baseline data, but did not want to be part of the program. Therefore,while collecting baseline data from 23 firms, we conducted our randomization, after baseline data collection,with the remaining 20 corporations.
8Each formal document was signed by the relevant company’s CEO and the president of Kadir HasUniversity.
8

ual consents.9 We first played incentivized games to elicit social and economic preferences
(lab-in-the-field experiments). Then, we conducted three major cognition tests, followed by
a detailed social network elicitation. Finally, participants were directed to a detailed sur-
vey. Preventing participants’ communication with other departments for the incentivized
games was the most important logistical challenge we faced in large firms. To overcome
this, we conducted our incentivized experiments in parallel, using different meeting rooms.
Participants used their smartphones to enter into our data collection platforms, following
our instructions step by step.
After baseline data collection, we randomly assigned 10 corporations to treatment and 10
to control by stratifying on sector. Our initial plan was to implement the intervention right
after the baseline (in Fall 2019). This plan was disrupted by the COVID-19 pandemic. After
waiting until Fall 2020, in hope that business would go back to normal, we realized that this
expectation was too optimistic and decided to implement the program by designing an online
training platform. Our switch to the online platform was welcomed by our implementing
partner and all our participating companies. We then implemented the program in late
Fall 2020 through Spring 2021. We collected endline data from 20 companies in Summer
2021, using the online tools we developed. Our online tools allowed us to bring together
departments using Zoom rooms, and enabled us to mimic our on-site data collection sys-
tem. Because many new professionals joined the firms between our initial baseline and Fall
2020, we had to re-do the baseline for newcomers (demographics and cognition tests) before
implementing the program. Figure 1 provides the timeline of the trial. In what follows, we
provide information on the content of the program.
2.3 Intervention: Transforming the Relational Atmosphere in Large Corpora-
tions
Our implementing partner is a highly specialized consulting firm. The firm was founded in
2007 by several ex-corporate professionals who had first-hand experience of the highly toxic
relational atmosphere in large corporations. As part of their movement coined as “Does not
have to be this way”, they developed unique training methods to improve the workplace
environment. They use unconventional tools, including creative drama, role-playing, and
9Designated HR coordinators informed all white-collar workers prior to our visit, and only the ones whowanted to participate in the study did come to the meeting rooms. We made sure that companies informedtheir workers that the participation was voluntary, and not joining would not have any consequences forthem.
9

imagery techniques. In addition, they employ real actors and scenario writers who blend in
with the trainees and conduct theatrical plays on topics relevant to their target concepts.
We partnered with them to evaluate their training module called “Transforming the Rela-
tional Atmosphere in Firms”, aimed at improving workplace relations, eliminating employee
burnout, and lowering employee turnover. The partner agreed to conduct a randomized
evaluation of their training program and agreed to provide training to all 20 firms within a
schedule that we determined.
The training program focuses on the following themes: 1) Effective communication with
colleagues, subordinates, and leaders, by exerting deliberate effort to eliminate toxic and
condescending language. 2) Teamwork and cooperation. 3) Understanding the others’ points
of view and tolerating the differences in opinions. 4) Learning to rely on colleagues and
leaders by accepting vulnerability. We targeted employees of all ranks in all these themes,
but particular attention was given to leaders. We define the term “leader” broadly in this
study. In our study, anybody who is responsible for leading a group of professionals is
considered a leader. Since most corporations have a hierarchical management structure, our
leaders have leaders, too.
The training module comprises two components. The first component is a series of online
workshops involving several interactive group activities.10 In these activities, participants
are randomly allocated to groups mixed in terms of departments and rank. In one session,
group activities include time travel to the company’s future, imagining an aspired workplace
environment, sharing their vision, and openly discussing the obstacles in achieving these ends.
In another session, participants engaged in several role-playing exercises (assuming the roles
of executives, regular employees, and families of employees). In these exercises, employees
expressed what they expected from their leaders and colleagues, stating their definitions of
a good leader, peaceful and professional language, and good leadership practices. In another
session, participants experimented on proactive and reactive behavior in relationships. These
involve some group activities that implicitly require reliance on colleagues and leaders11. The
module includes numerous other activities along these lines, all encouraging professional and
humane treatment of one another.
10During these training sessions, the trainers were always online, while the employees were generallyphysically present in their workplaces.
11In one of these activities, each participant let themselves fall backward, hoping that their colleague wouldhold their back.
10

The second component of the module was a monitored 8-week follow-up. For this, all
participating departments in each firm were given a task that involved developing a “proso-
ciality” project. The core theme of these projects was “teamwork and cooperation using
professional and peaceful language.” In each department, participants formed groups to
develop their own projects by either embedding this theme in their existing work-related
project or creating a stand-alone project. They first prepared a detailed outline of a project
idea that would touch upon the given theme, often adapted to their company’s needs. For
example, a group of professionals developed prosocial codes of conduct in everyday interac-
tions for their department by collecting feedback from their colleagues. The implementing
partner regularly interacted with the participants throughout the process, gave feedback
to project proposals, helped participants fine-tune details, and discussed feasibility issues.
Note also that the team leaders were also heavily involved in this process, often as project
team members. All groups, in the end, presented their projects to each other and to their
higher executives (CEOs, CFOs and COOs) in the presence of the implementing partner.
See Appendix B for more information on the module’s content and some snapshots of actual
training sessions. There, we also provide some exemplary projects developed by some par-
ticipants. About 38% of the professionals in treated headquarters took part in the training
program, 53% of the leaders, and 35% of subordinates. Figure 2 presents the evaluation
design and how we estimate intention to treat effects in visual clarity.
Given the targeted concepts and how activities were structured, we expect this training
program to improve social and professional relationships amongst colleagues. As elaborated
in our pre-analysis plan, our main conjecture is that the program, given its high emphasis
on leader-subordinate relations, will improve social skills, workplace climate, and relational
dynamics through improving leadership quality from the perspective of subordinates. We
also expect a decline in the employee turnover rate. It is important to note that the control
firms did not implement training programs for their headquarter professionals during the
implementation period. However, they did have business as usual in terms of their informal
get-togethers for coffee and lunch in person and organizing regular zoom drinks with their
employees. This fact allows us to rule out the possibility that the program might improve
workplace climate simply by getting people together regardless of its content. We provide a
depiction of the theory of change in Figure 3. In the next section, we will explain in detail
how we measure these indicators using a comprehensive toolkit.
11

3 Outcomes
We used four measurement tools to evaluate the program. The first of these was a set of
incentivized games to measure social skills. The second comprised standard item-response
survey questions to construct measures of perceived workplace quality and relational at-
mosphere. Our third tool was a template to elicit social (support) networks within firms.
Finally, we had access to administrative data on turnover and promotions covering the pro-
gram’s implementation period. In what follows, we will explain each of these tools and how
we used them to construct our outcomes.
3.1 Experimental Outcomes: Prosocial and Antisocial Behavior
We played several incentivized games to measure individual and social skills. At baseline,
we elicited risk aversion, competitiveness, and cooperation between department colleagues.
We explain these games in the Online Appendix C. At endline, we gave the participants
three new incentivized games to measure prosocial and antisocial behavior. Specifically, we
programmed a performance sabotage game, a trust game, and an ultimatum game, using
online tools. The participants were given instructions for each game via a pre-programmed
voice. First, they were informed that they would play 3 games, each offering monetary
rewards. Second, they were told that the amount of money each participant earned would
depend on their own decisions and the decisions of their department colleagues. Third, they
were also informed that rewards from the games would not accumulate; they would receive
the payment of one randomly chosen game at the end of the session. Rewards were given as a
gift card from a major supermarket chain in Turkey, mailed to the participants one week after
the session. We exercised utmost care in making sure that the participants’ anonymity was
preserved and companies could not learn about employees’ choices, behavior, and outcomes.
3.1.1 Sabotage in Competition
Competitive behavior is considered essential to personal success as it generally inspires hard
work and leads to high productivity (Backus, 2020). However, there are forms of intra-group
competition propelled by envy that reflects antisocial behavior. In an environment where the
assigned task requires teamwork, but promotions depend on individual performance, which
is usually hard to quantify, competition may take a hostile form with teammates blocking
12

or outright sabotaging each other’s performance to improve their status. The prevalence of
this antisocial behavior is one of the indicators of the health status of a workplace.
To assess the prevalence of this behavior in an incentive-compatible way, we played a
game that involved randomly matching two colleagues within a department. Each partici-
pant, remaining anonymous to their opponent, was asked to perform a task with no ability
requirement. Specifically, they were asked to type a meaningless jumble of four letters (lower
and upper case mixed) that appeared in the middle of their screen. The participants were
given 2 minutes to type as many words as possible. A participant could earn 150TL (about
20 US dollars) if and only if their performance exceeded that of their anonymous opponent.
After completing the task, without knowing the result of the competition, participants were
given the option to sabotage their opponent’s performance by incurring a monetary cost.
For this, we endowed all participants with an extra 50TL and asked them to decide which
amount of this endowment they would like to use to destroy their opponent’s performance.
The cost of destroying one correct answer was set to 10TL, so that the maximum number of
answers one could destroy was capped at 5. The outcome of interest in this game is the cost
incurred (sabotage endowment used) to sabotage the opponent. We expect the treatment to
lower this antisocial behavior, i.e., to decrease the amount of sabotage endowment used.12
3.1.2 Trust and Reciprocity
Interpersonal trust and reciprocity are essential social skills for making groups cohesive and
collegial. To assess the degree of interpersonal trust and reciprocity, we played a version of
the standard trust game (Berg, 1995). For this, we endowed all participants with 100TL and
informed them that they were randomly (and anonymously) paired with a colleague within
their department. They were told that there were two roles one could assume in this game;
a sender and a receiver. They were to be randomly assigned to one of these roles, but before
that, they were asked to make decisions assuming each role sequentially. In the role of a
sender, participants needed to decide how much of the 100TL they wanted to send to their
anonymous colleague (receiver), including the option of sending nothing. The participants
were informed that the amount they sent would be tripled by the experimenters before being
sent to the receiver. In the role of a receiver, the participant needed to decide what fraction
12Similar settings have been used in lab and lab-in-the-field experiments, see Harbring et al. (2007), Abbinkand Sadrieh (2009), Harbring and Irlenbusch (2011), Charness, Masclet and Villeval (2014), Jauernig, Uhland Luetge (2016), Bauer et al. (2021).
13
of the money they had received they wanted to send back to their anonymous colleague.
Because the receiver’s decision was based on the sender’s decision, we elicited the decisions
of the receiver with the strategy method by letting participants react to hypothetical discrete
options. Specifically, we began with the case where the sender sent 10TL, tripled to 30TL.
The receiver then decided how much of this 30TL to send back to the sender. Then, we
elicited the case where the sender sent 20TL, tripled to 60TL in a similar fashion, and this
hypothetical elicitation continued until the case of the full amount (100TL, tripled to 300TL).
The amount of money sent as a sender is our measure of trust, and the amount sent
back as a receiver is our measure of reciprocity. For the latter, we use the average fraction
across all options sent back to the sender. At the beginning of the game, the participants
were informed that, after all the decisions had been made, our system would assign the roles
randomly and determine their earnings. Overall, we expected the treatment to increase trust
and reciprocity among department colleagues.
3.1.3 Sense of Fairness and Generosity
Our final game is a version of the ultimatum game. The game also involves pairing two
colleagues within a department anonymously. There are two roles in this game, a proposer
and a responder, and participants play again both roles. As proposers, they offer a two-
way split of 200TL, and as responders, they decide on a minimum acceptable offer. If
the latter is below or equal to a matched proposer’s offer, the money is split according to
the proposer’s offer; otherwise, the offer is rejected and neither receives any money. Our
outcomes of interest are the proposed offer and the minimum acceptable offer. We expect
a fairer split and perhaps some generosity (in the form of offering more than 50% of the
proposer’s endowment) in the treatment group.13. If treatment lowers the feeling of spite,
we expect that treated individuals tend to accept lower offers implied as a decline in minimum
acceptable offers.
13Contrary to the dictator game (in the baseline), which measures generosity (by the amount of moneysent to an anonymous recipient), the ultimatum game has a strategic component (which is absent in thedictator game), for which reason a proposer’s offer cannot be simply interpreted as a measure for generosity.Rather, it can be interpreted as a measure of what subjects interpret as a fair offer in such a strategicsituation where the responder (the second mover) has the power to destroy both parties’ endowments (seeGuth and Kocher (2014)).
14

3.2 Workplace Climate: Perceived Workplace Quality and Relational Atmo-
sphere
We measured workplace climate using a detailed item-response questionnaire. We con-
structed two indices that characterize the perceived workplace quality and three indices
for relational atmosphere. The first of the former is the index “workplace satisfaction”, con-
structed using questions such as “I am very glad that I chose to work in this company”, with
five response options. Our second measure of workplace climate relates to the perceptions
of the firm’s “meritocratic values” (or lack thereof). We constructed the related index using
questions such as “I believe my chances of advancing in my profession and career are very
high in this firm”. We constructed three indices to capture the relational atmosphere within
departments. The first of these is “collegial department”, constructed using questions such
as “My colleagues attack each other disrespectfully during department meetings.” Second,
we construct descriptive behavioral norms using questions such as ”How often do you observe
your department colleagues: Helping someone” and prescriptive norms using questions such
as “What percentage of your department colleagues think: Gossiping is bad.” The latter
comes with response items of “almost no one, around 25%, around 50%, around 75%, almost
everyone”.
Because the program has a heavy emphasis on leader behavior and, in particular, leader-
subordinate relationships, we conjecture that any positive impact may come mainly through
improving leader behavior. Therefore, an important component of our inventory involves
eliciting in detail the leadership quality from the perspective of subordinates. In addition
to utilizing our network measures, which we explain in the next subsection, we constructed
two measures of leadership quality. The first one is “leader’s professionalism”, constructed
using item-response questions such as “My team leader claims achievements, but blames
mistakes on others” and “I receive regular and motivating feedback from my team leader.”
The second one relates to the leader’s ability to take actions in an empathetic way, “leader’s
empathy.” Again, we constructed this measure using item-response questions such as “My
team leader listens to disagreements carefully and considers all angles” and “my team leader
makes sudden emotional decisions.”
We construct all indices mentioned above by extracting the common factor for each,
normalizing the factor to have a mean zero and standard deviation of one. We provide our
full survey inventory in the Online Appendix D.
15

3.3 Professional and Personal Support Networks
Another way to assess the health status of the workplace climate is to measure the prevalence
of support networks. We are particularly interested in professional support that flows from
leaders to subordinates and from more experienced employees to the less experienced ones.
To elicit networks, we asked each participant to list up to three of their colleagues in the
firm, not necessarily in their department, from whom they received regular professional help
in work-related matters. Then, we asked them to list up to three colleagues from whom
they received regular help in personal matters. The participants were informed that the
ranking in this elicitation mattered, so that the colleague they thought was the most helpful
should be listed first. We prepared our template by first obtaining the list of all employees
in the firm and offered the names in a drop-down menu to ease the nomination process. The
participants were also given an option to select “I receive no help” in the menu. They could
also nominate fewer than 3 colleagues in each of the two categories, but not more than 3.
From these nominations, we constructed three department-level outcomes that we ex-
pected the treatment to influence: (i) the proportion of isolated individuals in the depart-
ment, (ii) department network density, and (iii) cohort segregation. We constructed each of
these outcomes for professional and personal support categories separately. The proportion
of isolated individuals refers to those who had chosen “I receive no help” in the menu. The
department network density is an index that gives the ratio of actual connections to all
potential connections that could be made in a department. Therefore, its range is between
zero and 1, with higher numbers indicating a denser network. The cohort segregation index
is constructed following Schelling (1969). Consider two groups in a department. We first
calculated the expected proportion of inter-group links based on the theoretical probability
of randomly formed inter-group ties. Then we took the difference between these and the
observed proportion of inter-group links. If all links were formed randomly, the number of
links between group 1 and group 2 members would follow a hypergeometric distribution.
Specifically, for a group 1 member who nominated x ∈ {1, 2, 3} colleagues, the probability
of forming y ≤ x links with group 2 members equals:
pg1(x, y) =
(ng2
y
)(ng1−1x−y
)(ng1+ng2−1
x
) ,where ng1 is the number of group 1 colleagues, and ng2 is the number of group 2 colleagues
in a given department. The expression for pg2(x, y) is analogous to pg1(x, y).
16

Then, the probability of forming inter-group ties for department d under the assumption
that links were formed at random can be expressed as:
ρd =
∑3x=1
∑xy=1
[ng1(x)pg1(x, y)y + ng2(x)pg2(x, y)y
]∑3x=1 x
[ng1(x) + ng2(x)
] ,
where ng1(x) and ng2(x) denote, respectively, the number of group 1 and group 2 colleagues
who nominated x colleagues. Then, the observed frequency of inter-group ties based on the
actual nominations in department d is:
ρd =eg1g2 + eg2g1
eg2g1 + eg1g2 + eg2g2 + eg1g1,
where eij denotes the number of edges from group members i to j. Our measure of group
segregation GSd in department d is:
GSd = ρd − ρd.
In this study, we are interested in cohort segregation. We define the groups as millennial
and younger cohort (below 40) vs. older cohorts (40 and older), based on the year of birth.
The choice of this particular cutoff is based on our qualitative interviews with out-of-sample
professionals, who suggest that communication and social disconnect between these two
groups are prevalent. We expect the treatment to lower the proportion of isolated individuals
and cohort segregation and to increase department network density.14
3.4 Psychological Well-being and COVID-19-related Stress
As we mentioned before, the intended timing of program implementation was disrupted
by the COVID-19 pandemic. The COVID-19 pandemic has had a tremendous impact on
working people, and it is plausible that these effects were felt differently across firms and
possibly across employees within firms. About 15% of our companies imposed a “work
at home” mandate, and 40% adopted a hybrid mode where they diluted the number of
employees in workspaces based on a rotating schedule. These corporate-level choices were
made before the program implementation. Therefore, they are independent of the firms’
treatment status (joint p-value for pandemic working mode is 0.58). Overall, the experiences
14In our pre-analysis plan (PAP), we specified department-level network closeness as another outcome.However, this measure is ill-defined in the presence of isolated nodes; therefore, we did not use it (Rochat,2009; Brandes, Borgatti and Freeman, 2016).
17
of pandemic-related changes are likely to diminish working people’s morale and increase the
feelings of isolation.
Given that the pandemic changed the context in which we executed this study, we decided
that it would be informative to assess the effect of our training program on the psycholog-
ical well-being of the employees. Because the program was highly interactive, including a
monitored follow-up that enforces teamwork, we conjectured that it would help employees
to feel less disconnected from their colleagues. To test this conjecture, we added several
COVID-19-related social isolation questions to our survey inventory at endline by making
explicit reference to the pandemic. In particular, we asked respondents whether they (i)
think working at home is more enjoyable than working in the office, (ii) feel lonely lately,
(iii) feel disconnected from their colleagues, (iv) feel disconnected from their leaders, and (v)
have increased the use of alcohol and cigarettes. Thus, we conjectured that, by connecting
colleagues and leaders in these difficult times via an interactive training platform, the pro-
gram would help employees to cope with social isolation imposed by the pandemic response
measures.
3.5 Employee Turnover and Promotion
We requested and were granted access to administrative records of quits and promotions
within the implementation period (November 2020) up until 1 July 2021. The reason for
this end date is that the government of Turkey imposed a nationwide ban on dismissing
employees at the beginning of the pandemic. This ban has been lifted on 1 July 2021.
Therefore, throughout our implementation and endline period, employee turnover refers to
voluntary job separations and retirement decisions, which we believe is of primary relevance
to our study. While we do not have a priori conjecture regarding the program’s effect on
promotions, we expect the program to lower the propensity to quit.
4 Results
4.1 Internal Validity
We collected our baseline data in Fall 2019 by visiting the headquarters of all firms in
person. Within the course of a single year, many changes took place in the firms, and
18

when we decided to implement the program in Fall 2020, we found that a large number
of new employees had joined the firms and expressed their willingness to participate in the
program, both in treatment and control firms. We conducted swift baseline data collection
for these new employees, a shorter version of our initial baseline, before the implementation.
These new employees comprise 41% of our evaluation sample and their distribution across
treatment status is balanced (p-value=0.61). Our attrition rate, calculated based on those
who were at baseline, but not at endline, is about 22%, and this attrition is balanced across
treatment status (p-value=0.87). Note that we measured this attrition before the program
implementation, so it is entirely unrelated to the treatment. Table 1 presents all variables
in our data. Columns indicate whether they were collected at baseline in Fall 2019, baseline
in Fall 2020, and endline.
We collected data on individual characteristics, including demographics, education, and
tenure. At baseline, we implemented two cognitive tests, as we believe they are predictive of
the outcomes concerned in this study. These are (i) Raven’s progressive matrices to measure
fluid IQ (Raven, Raven and Court, 1962) and (ii) Reading the Mind in the Eyes Test to
measure emotional intelligence (Baron-Cohen et al., 2001). We show our initial baseline
balance, first using Fall 2019 data, then restricting Fall 2019 data to those present both at
baseline and endline. We also provide the balance checks of baseline 2020. Table 2 presents
the balance of the unrestricted baseline sample. All test scores and workplace climate indices
are normalized to have mean zero and variance of 1 for the control group. Our rich baseline
data allow us to test over 30 variables to check our randomization balance and, as can be
seen in the table, we observe no imbalance in individual-level outcomes. However, we observe
some imbalance in department-level outcomes. These are (i) the department-level isolation
measure for professional networks and (ii) department density, all significant at the 10% level.
The variable turnover refers to the department level turnover rate between 1 January and 1
November 2019. The presented firm sizes give the number of white-collar employees in the
firm and that of white collar-employees in the headquarters, both in logs. The participation
rate refers to the proportion of invited employees who signed up for the study within the
chosen location. Note that this participation figure is slightly higher (78%) than reported in
Figure 2, which is 71%, because Table 2 considers participants at baseline only.
Tables A.1 and A.2 in the Online Appendix A present the balance for the restricted Fall
2019 sample, and the Fall 2020 sample (short baseline), respectively. Because we conducted
our analyses separately for subordinates and leaders as well, we provide balance within these
subgroups in the Online Appendix A, Table A.3.
19
4.2 Empirical Specification
To test the null hypothesis that the program had no impact on the outcome y, we estimate
the average treatment effect conditioning on baseline covariates that are predictive of the
outcome of interest:
yidf = α0 + α1Tf +X′
idfγ + δs + εidf
where yidf is the outcome of employee i, in department d, firm f . Tf is a dummy variable
which equals 1 if firm f is in the treatment group, and zero otherwise, and X ′idf is a vector
of observables for worker i in department d, firm f that are potentially predictive of the
outcome y. These include age, gender, marital status, number of children, and baseline
cognitive and sociocognitive skills (Raven’s score and Eyes test score). We also control for
department and firm size. δs indicates strata (sector) fixed effects. We also provide all our
main results without covariates in the Online Appendix A.
Recall that 38% of all participating professionals took part in the training program, 53%
of the leaders, and 35% of subordinates. Therefore, the estimated α1 should be considered as
the intent-to-treat effect (ITT); see Figure 2. Because the sample contains a small number
of clusters (20 corporations), in addition to clustered-robust standard errors, we also present
wild bootstrap p-values adjusted for small sample. Finally, because we test several hypothe-
ses using multiple outcomes, we also provide our inference results (p-values) adjusted for the
multiple hypotheses testing. Most of our results survive these adjustments; see Table A.7 in
the Online Appendix A.
4.3 Treatment Effect on Prosocial and Antisocial Behavior
Table 3 presents the estimated treatment effects on experimentally elicited social skills. Panel
I presents the effects on the full sample, panel II the effects on the subordinates, and panel
III the effects on the leaders. Note first that about 23TL of 50TL sabotage endowment was
used on average to destroy an opponent’s performance in the control group. Employees in
the treatment firms spent on average 2.70TL less for sabotage activity, and this 12% effect is
statistically significant at the 1% level. The effects for subordinates and leaders are similar:
11% for subordinates and 18% for leaders. We do not detect any statistically different effect
in this outcome across the two groups (p-value=0.39).
We find that, of the 100TL endowment in the trust game, the control employees sent
20

about 52TL to their anonymous department colleague. We do not estimate a statistically
significant treatment effect for this outcome, neither for the full sample nor for the sub-
groups. However, we find a statistically significant effect on reciprocity. About 37% of the
money received was sent back to the sender in the control group. This value is 3 percentage
points (about 8%) higher in the treatment group for the full sample, and this difference is
statistically significant at the 1% level. The effect on reciprocity is strong for the subordinate
group, but does not reach statistical significance for the leaders, although we cannot reject
the equality of coefficient estimates across the two groups (p-value=0.54).
Finally, we find that a little more than half of the endowment in the ultimatum game
was offered in the control group. Even though we estimate a positive treatment effect on
the size of the offer, this effect is statistically insignificant for the full and the subordinate
sample. However, it is larger and statistically significant for the leader sample, indicating
more generosity on the part of leaders, an we reject the equality across the two groups (p-
value=0.08). We find no effect on the minimum acceptable offer, neither for the full sample
nor for the subgroups.
4.4 Treatment Effect on Workplace Climate
Table 4 presents the estimated program effects on our workplace climate measures. Again,
we present the effects on the full sample and the subordinates and leaders separately. Re-
call that we normalized these measures to have a mean zero and a standard deviation of
1 for the full sample, so that estimates can be interpreted as standard deviation effects.
We observe that the program was highly effective in improving perceived workplace quality
and relational atmosphere within departments. We estimate large and significant effects
on workplace satisfaction and perceived meritocratic values. Treated employees report 0.28
standard deviations higher workplace satisfaction and 0.25 standard deviations higher mer-
itocratic values. In terms of the relational atmosphere, treated professionals report 0.25
standard deviations higher collegial behavior in their department, 0.12 and 0.18 standard
deviations better behavioral and prescriptive norms, although the last two effects do not
reach statistical significance. The results on the subordinates are even stronger. Here, we
estimate 0.35 standard deviations higher workplace satisfaction and 0.31 standard deviation
higher meritocratic values in the treatment group, both significant at the 1% level. We also
estimate 0.28 standard deviations higher collegial behavior, and again, despite being positive,
the effects on behavioral and prescriptive norms do not reach statistical significance based
21

on wild bootstrapped p-values. Interestingly, we estimate null effects for the leaders and
reject decisively the equality of estimates between subordinates and leaders for workplace
satisfaction, meritocratic values, and collegial department measures.
4.5 Treatment Effect on Department Network Structure
As mentioned in Section 3, we constructed several department-level indicators that character-
ize the relational atmosphere of departments using social networks. These are the proportion
of isolated individuals (those who participated in the study and did not nominate a colleague
in a given category), department network density, and cohort segregation indices. We con-
structed these department-level measures for the full sample and the subordinate sample,
as such measures for only leaders do not make much sense at the departmental level.15
Table 5 presents the treatment effects on our three department-level network measures for
professional support and personal support categories. Note that, because these outcomes
are at department level, our number of observations reflects the number of departments in
this analysis. In some departments, segregation measures are not defined because of the
insufficient number of members in a group, reflected in the large decline in the number of
departments used in the respective analyses.
Looking at Panel I, first, we note that, on average, 10% (20%) of employees report that
they do not receive professional (personal) help from anyone in their firm. While we estimate
a 3 (5) percentage points decline in professional and personal isolation in treated depart-
ments, these effects are statistically weak. However, looking only at the subordinates, we see
large and statistically significant treatment effects on the proportion of isolated employees.
The effect sizes are large. We estimate a 57% reduction for professional isolation and a 50%
reduction for personal isolation. Consistent with isolation results, we estimate a significant
increase in departmental network density measures for professional and personal networks.
These effects are also substantial, with treatment essentially doubling the network density
index in both cases. We do not estimate a treatment effect on cohort segregation, neither
for the full sample nor for the subordinate sample.
15This is because most departments have only one or two leaders. However, we do estimate the effect ofthe intervention on isolation, using the leader sample, and find no significant effect.
22

4.6 Treatment Effect on COVID-19-induced Feelings of Isolation
Figure 4 presents the estimated treatment effects on our five COVID-19 related outcomes for
the entire sample as well as for the subgroups. Employees in treated firms are 6 percentage
points less likely to desire to work at home and this difference is statistically significant.
This result is fully consistent with our workplace climate results. What is striking here is
that employees in treated firms are 6 percentage points less likely to report losing connection
with their leaders during the pandemic. The point estimate is the same for subordinates and
leaders, although it is only significant for the former, but does not reach statistical significance
for the latter, perhaps for power reasons. We find no evidence of loss of connection to
colleagues, neither for subordinates nor leaders. We also estimate null effects on feeling
lonely and on the probability of increasing alcohol and cigarette consumption.
4.7 Treatment Effect on Turnover and Promotion
In Summer 2021, we received information on whether an employee had quit their job at
the firm. We also received information on whether an employee had got promoted within
the firm. It is important to note that we conducted our study when employee turnover was
unusually low due to the government-imposed firing ban, which was lifted on 1 July 2021.
Therefore, our data on turnover reflects quits and possibly retirements only. Table 6 presents
the treatment effect on the probability of quitting between the start of the program imple-
mentation (November 2020) and July 1, 2021. Not surprisingly, the proportion of employees
who quit their jobs within this period is quite low in the control group (about 5%), relative
to the 2019 baseline turnover rate of 13.8% presented in Table 2. We estimate a substan-
tial decline in this important outcome. Employees in treated firms are about 5 percentage
points less likely to quit their jobs in this period, meaning that the intervention virtually
eliminated voluntary resignations during this period. Our estimates are similar for subordi-
nates and leaders. We do not estimate any effect on employees’ promotion probabilities for
subordinates or leaders.
Because we have turnover and promotion data on all headquarter employees, we can also
investigate whether the treatment effects on quits and promotions spilled over to nonpartic-
ipants. As can be seen in Panel IV of Table 6, we find no evidence of spillover effects of the
treatment on nonparticipants. One reason for this could be that the most non-participation
was at the departmental level. Recall that some departments could not participate due to
23

the nature of their tasks and some small departments were considered low priority and ex-
cluded by the firms. Given that all training activities targeted departmental relationships
and were implemented at the department level, the likelihood of spillovers from participants
to nonparticipants was expected to be low by design.
4.8 Heterogeneity in Treatment Effects
All in all, it appears that the program was remarkably successful in improving the social skills
of both subordinates and their leaders. It also significantly improved perceived workplace
climate and relational indicators for the subordinates. The program also had a strong positive
effect on the network structure within departments, particularly on social isolation and,
relatedly, on network density, consistent with the workplace climate and relational dynamics
results. The program also significantly lowered employee turnover.
Besides the subgroups we examine above, we explored several other subgroups to assess
treatment effect heterogeneity. First, we checked whether the effects exhibited any differ-
ential pattern based on leader gender. Tables 7 and 8 present our full sample results for
employees with immediate male leader and female leader. While we estimate no signifi-
cant heterogeneity in this dimension (expect for the reciprocity effect being stronger under
female leaders), we estimate significant heterogeneity of the climate and relationships indica-
tors. As can be seen in Table 8, the effects on workplace satisfaction and meritocratic values
are much larger for employees with female leaders. Interestingly, however, while treated em-
ployees under male leaders are less likely to prefer to work at home and feel more connected
to their leaders, these effects are null for those under female leaders; see Figure 5. In terms
of turnover and promotions, we detect no difference in treatment effects between male and
female leaders (see Table 9). We also explored whether the effects are different for male and
female employees, and we did not find any noteworthy systematic differences; see Tables 10,
11, 12 and Figure 6. We provide further results in the Online Appendix A.
5 Potential Mechanisms
The training program was intensive compared to standard corporate training programs.
Moreover, while it was open to all white-collar workers, leaders of all ranks were particu-
larly encouraged to participate in training sessions and the follow-up project development
24

activities. The idea, motivated by our earlier qualitative interviews, was that improving
leaders’ attitudes toward subordinates might reset the tone of communications, encourage
more prosociality in everyday interactions, and lead to a more collegial atmosphere in the
workplace. We hypothesize, therefore, that the program’s effects work mainly through im-
proving leader-subordinate relationships. Before testing this hypothesis, we provide evidence
that the subordinates’ perceptions of workplace quality and the relational atmosphere are
highly correlated with their perceived leadership quality.
Figures 7 and 8 show the association of leaders’ professionalism and leaders’ empathy
(both from the perspective of subordinates) and subordinates’ perceived workplace quality
and relational atmosphere in their departments for the control group. These associations
are estimated non-parametrically, controlling linearly for the covariates we use in all our
treatment effect estimations. In both figures, the relationships are unambiguously positive.
The higher the leader professionalism (empathy), the better the perceived workplace quality
and relational dynamics in the department. While only representing correlations, these
positive associations set the stage for our mechanism explorations. If the program’s positive
effects on prosocial behaviors and workplace climate indicators stem from improving leader-
subordinate relationships, we must see significant treatment effects in reported leader quality
by the employees.
To test this, we estimate the effect of the program on several leadership quality indicators.
The first two are leader professionalism and leader empathy, which we constructed using
survey items. In addition, we have network data with which we can generate binary indicators
of whether a participant nominated her leader as a professional and personal help provider.
We consider nominating one’s leader as a professional and personal support provider to
indicate high-quality leadership.
Figure 9 plots the estimated treatment effects on leader professionalism, leader empathy,
whether the employee nominated their leader as a professional and personal help provider
for the full sample, as well as subordinates and leaders separately. We observe striking
treatment effects on reported leadership quality, especially for the subordinate sample. It
appears that the program increased perceived leader professionalism and empathy by 0.23
and 0.25 standard deviations, respectively, for the full sample. The point estimates are
similar for the subordinate sample and positive, but not significant, for the leader sample.
Consistent with this, we estimate that treated professionals are about 5 percentage points
more likely to nominate their leaders as a professional help provider, and this value is 10
25

percentage points for the subordinate sample. We find no statistically significant effect on
the probability of nominating leaders as personal help providers.
Interestingly, we estimate negative treatment effects on nominations for the leader sam-
ple. The treated leaders are 16 (14) percentage points less likely to nominate their leaders as
professional (personal) help providers. We explore possible explanations for this unexpected
result. The first thing that comes to mind is that by being part of an interactive program to-
gether with subordinates, leaders may have turned to their subordinates for professional and
personal help. This substitution may be exacerbated by the fact that the program partici-
pation amongst higher management was low. Supporting this explanation, we find that the
treatment increased the probability of a leader nominating a subordinate as a professional
and personal help provider by 16 and 7 percentage points, respectively. These effects are sta-
tistically significant at 5 and 10 percent levels, respectively. We also find suggestive evidence
that the negative treatment effects we report in Figure 9 are much stronger for leaders whose
leaders did not participate in the study. We find that the probability of a treated leader
nominating her own leader as a professional help provider is 36 percentage points lower than
the same probability in the control if the upper-level leaders did not participate in the pro-
gram. We find no difference between treatment and control in this respect if the upper-level
leaders did participate in the program. All these findings further support our claim that
the program generated its positive effects by significantly strengthening leader-subordinate
bonds16.
While we conjecture that the main mechanism may be through changes in leader-subordinate
relationships, there may be other mechanisms at play. For example, the program may also
have increased the empathy of employees towards each other and towards their leaders. This
is likely since one of the core messages of the program was to teach employees to exchange
roles to understand where the other person was coming from in any social situation. However,
as can be seen in Figure 9, we estimate null effects on employee empathy. In summary, while
we cannot rule out all possible channels through which the program led to these positive
impacts, the evidence on the improved leader-subordinate relationships is compelling.
16The participation rate of the leaders of leaders is about 57% and balanced across treatment status(p-value=0.87)
26

6 Conclusion
While ubiquitous, relational toxicity in the workplace is a vastly overlooked issue in large
and highly competitive workplaces. Yet, it imposes high costs on firms through employee
dissatisfaction, inner resignation, or outright quits. Thus, innovative training programs that
aim to improve the relational environment in workplaces, with a particular focus on leader-
subordinate relationships, may be a cost-effective way to address this problem. This paper
tests the effectiveness of one such program.
The program, implemented as a clustered randomized design, is evaluated with regard to
a wide range of outcomes measured using incentivized games, social networks, survey instru-
ments, and administrative records. We find that the program improves perceived workplace
quality and relational climate, reduces toxic competition amongst colleagues, lessens social
isolation, and lowers employee turnover. We show that the program’s success in improv-
ing workplace climate stems mainly from improved leader-subordinate relationships. Our
findings provide evidence that innovative interventions focusing on improving the relational
atmosphere in these work environments may go a long way in increasing employee engage-
ment, satisfaction with leaders, lowering turnover, and ultimately transforming the relational
culture.
We note two external validity concerns. First, our study covers a particular country.
While there is overwhelming evidence that relational issues are ubiquitous, the Turkish
corporate sector does not represent the corporate sector around the world. However, besides
enabling us to execute a clustered randomized controlled trial on large corporations and to
collect detailed data from a large number of professionals, Turkey offers an ideal setting to
study relational atmosphere in workplace settings. It is a large OECD country hosting many
multinational and holding companies in all sectors. Given that we reached out to prominent
corporations across different sectors that employ highly-educated professionals, our study
is likely to be relevant for corporations in other OECD countries, as well as many similar
middle-income countries.
Second, our study was conducted in a context created by a global health shock, the
COVID-19 pandemic. Therefore, it is not clear how effective the program we evaluated would
be in normal circumstances (even though COVID-19 might prevent a full return to global
normality for some more years to come). Nevertheless, it is entirely plausible that a program
that shows such promise in such difficult times might be at least as effective in normal
27

times. Moreover, recent evidence has shown that exposure to COVID-19 has a negative
effect on prosociality in high-school students close to entering the job market (Terrier, Chen
and Sutter, 2021). Given the importance of prosociality for labor market success (Kosse and
Tincani, 2020), a reduction in prosociality of future labor market cohorts might pose threats
to a good workplace climate. Against this background, it seems necessary and timely to
implement interventions such as ours that show promising effects on the workplace climate
in large corporations.
28

References
Abbink, Klaus, and Abdolkarim Sadrieh. 2009. “The Pleasure of Being Nasty.” Eco-
nomics Letters, 105(3): 306–308.
Akella, Devi, and Vance Johnson Lewis. 2019. “The Modern Face of Workplace Inci-
vility.” Organization Management Journal, 16(2): 55–60.
Amabile, Teresa M., Elizabeth A. Schatzel, Giovanni B. Moneta, and Steven J.
Kramer. 2004. “Leader Behaviors and the Work Environment for Creativity: Perceived
Leader Support.” The Leadership Quarterly, 15(1): 5–32.
Azulai, Michel, Imran Rasul, Daniel Rogger, and M. J. Williams. 2020. “Can
Training Improve Organizational Culture? Experimental Evidence from Ghana’s Civil
Service.” Tech. rep., University College London: 7.
Backus, Matthew. 2020. “Why is Productivity Correlated with Competition?” Econo-
metrica, 88(6): 2415–2444.
Bandiera, Oriana, Andrea Prat, Stephen Hansen, and Raffaella Sadun. 2020.
“CEO Behavior and Firm Performance.” Journal of Political Economy, 128(4): 000–000.
Barney, Jay B. 1986. “Organizational Culture: Can It be a Source of Sustained Competi-
tive Advantage?” Academy of Management Review, 11(3): 656–665.
Baron-Cohen, Simon, Sally Wheelwright, Jacqueline Hill, Yogini Raste, and Ian
Plumb. 2001. “The Reading the Mind in the Eyes Test Revised Version: A Study with
Normal Adults, and Adults with Asperger Syndrome or High-functioning Autism.” The
Journal of Child Psychology and Psychiatry and Allied Disciplines, 42(2): 241–251.
Bauer, Michal, Jana Cahlıkova, Chytilova Julie Zingl Lubomir Katreniak, Dag-
mara Celik, and Tomas Zelinsky. 2021. “Nastiness in Groups.” CERGE-EI Working
Paper Series.
Bennedsen, Morten, Kasper Meisner Nielsen, Francisco Perez-Gonzalez, and
Daniel Wolfenzon. 2007. “Inside the Family Firm: The Role of Families in Succession
Decisions and Performance.” The Quarterly Journal of Economics, 122(2): 647–691.
Berg, Joyce. 1995. “Trust, Reciprocity, and Social History.” Games and Economic Behav-
ior, 10(1): 122–142.
29

Bertrand, Marianne, and Antoinette Schoar. 2003. “Managing with Style: The Effect
of Managers on Firm Policies.” The Quarterly Journal of Economics, 118(4): 1169–1208.
Blader, Steven, Claudine Gartenberg, and Andrea Prat. 2020. “The Contingent
Effect of Management Practices.” The Review of Economic Studies, 87(2): 721–749.
Bloom, Nicholas, and John Van Reenen. 2007. “Measuring and Explaining Man-
agement Practices across Firms and Countries.” The Quarterly Journal of Economics,
122(4): 1351–1408.
Bloom, Nicholas, Benn Eifert, Aprajit Mahajan, David McKenzie, and John
Roberts. 2013. “Does Management Matter? Evidence from India.” The Quarterly Jour-
nal of Economics, 128(1): 1–51.
Bolton, Patrick, Markus K Brunnermeier, and Laura Veldkamp. 2013. “Leadership,
Coordination, and Corporate Culture.” Review of Economic Studies, 80(2): 512–537.
Boyce, Anthony S, Levi RG Nieminen, Michael A Gillespie, Ann Marie Ryan,
and Daniel R Denison. 2015. “Which Comes First, Organizational Culture or Perfor-
mance? A Longitudinal Study of Causal Priority with Automobile Dealerships.” Journal
of Organizational Behavior, 36(3): 339–359.
Brandes, Ulrik, Stephen P Borgatti, and Linton C Freeman. 2016. “Maintaining
the Duality of Closeness and Betweenness Centrality.” Social Networks, 44: 153–159.
Bruhn, Miriam, Dean Karlan, and Antoinette Schoar. 2010. “What Capital is Miss-
ing in Developing Countries?” American Economic Review, 100(2): 629–33.
Bruhn, Miriam, Dean Karlan, and Antoinette Schoar. 2018. “The Impact of Con-
sulting Services on Small and Medium Enterprises: Evidence from a Randomized Trial in
Mexico.” Journal of Political Economy, 126(2): 635–687.
Campos, Francisco, Michael Frese, Markus Goldstein, Leonardo Iacovone,
Hillary C Johnson, David McKenzie, and Mona Mensmann. 2017. “Teaching
Personal Initiative Beats Traditional Training in Boosting Small Business in West Africa.”
Science, 357(6357): 1287–1290.
Charness, Gary, David Masclet, and Marie Claire Villeval. 2014. “The Dark Side of
Competition for Status.” Management Science, 60(1): 38–55.
30

d’Adda, Giovanna, Donja Darai, Nicola Pavanini, and Roberto A Weber. 2017.
“Do Leaders Affect Ethical Conduct?” Journal of the European Economic Association,
15(6): 1177–1213.
Deming, David J. 2017. “The Growing Importance of Social Skills in the Labor Market.”
The Quarterly Journal of Economics, 132(4): 1593–1640.
Dessein, Wouter, and Tano Santos. 2021. “Managerial Style and Attention.” American
Economic Journal: Microeconomics, forthcoming.
Dupas, Pascaline, Alicia Sasser Modestino, Muriel Niederle, Justin Wolfers, et al.
2021. “Gender and the Dynamics of Economics Seminars.” National Bureau of Economic
Research.
Edmans, Alex. 2011. “Does the Stock Market Fully Value Intangibles? Employee Satis-
faction and Equity Prices.” Journal of Financial Economics, 101(3): 621–640.
Friebel, Guido, Matthias Heinz, and Nikolay Zubanov. 2021. “Middle Managers,
Personnel Turnover, and Performance: A Long-Term Field Experiment in a Retail Chain.”
Management Science.
Gachter, Simon, and Elke Renner. 2018. “Leaders as Role Models and Belief Managers
in Social Dilemmas.” Journal of Economic Behavior & Organization, 154: 321–334.
Gartenberg, Claudine, Andrea Prat, and George Serafeim. 2019. “Corporate Pur-
pose and Financial Performance.” Organization Science, 30(1): 1–18.
Gosnell, Greer K, John A List, and Robert D Metcalfe. 2020. “The Impact of Man-
agement Practices on Employee Productivity: A Field Experiment with Airline Captains.”
Journal of Political Economy, 128(4): 1195–1233.
Graham, John R, Campbell R Harvey, Jillian Popadak, and Shivaram Rajgopal.
2017. “Corporate Culture: Evidence from the Field.” National Bureau of Economic Re-
search.
Graham, John R, Jillian Grennan, Campbell R Harvey, and Shivaram Rajgopal.
2016. “Corporate Culture: The Interview Evidence.” Duke I&E Research Paper, , (2016-
42): 16–70.
31

Guadalupe, Maria, Zoe Kinias, and Florian Schloderer. 2020. “Individual Identity
and Organizational Identification: Evidence from a Field Experiment.” American Eco-
nomic Review Papers and Proceedings, 110: 193–98.
Guiso, Luigi, Paola Sapienza, and Luigi Zingales. 2015. “The Value of Corporate
Culture.” Journal of Financial Economics, 117(1): 60–76.
Guth, Werner, and Martin G Kocher. 2014. “More than Thirty Years of Ultimatum
Bargaining Experiments: Motives, Variations, and a Survey of the Recent Literature.”
Journal of Economic Behavior & Organization, 108: 396–409.
Hamilton, Barton H, Jack A Nickerson, and Hideo Owan. 2003. “Team Incentives
and Worker Heterogeneity: An Empirical Analysis of the Impact of Teams on Productivity
and Participation.” Journal of Political Economy, 111(3): 465–497.
Harbring, Christine, and Bernd Irlenbusch. 2011. “Sabotage in Tournaments: Evi-
dence from a Laboratory Experiment.” Management Science, 57(4): 611–627.
Harbring, Christine, Bernd Irlenbusch, Matthias Krakel, and Reinhard Selten.
2007. “Sabotage in Corporate Contests – An Experimental Analysis.” International Jour-
nal of the Economics of Business, 14(3): 367–392.
Heinz, Matthias, Sabrina Jeworrek, Vanessa Mertins, Heiner Schumacher, and
Matthias Sutter. 2020. “Measuring the Indirect Effects of Adverse Employer Behaviour
on Worker Productivity: A Field Experiment.” The Economic Journal, 130(632): 2546–
2568.
Hoffman, Mitchell, and Steven Tadelis. 2021. “People Management Skills, Employee
Attrition, and Manager Rewards: An Empirical Analysis.” Journal of Political Economy,
129(1): 243–285.
Inceoglu, Ilke, Geoff Thomas, Chris Chu, David Plans, and Alexandra Gerbasi.
2018. “Leadership Behavior and Employee Well-being: An Integrated Review and a Future
Research Agenda.” The Leadership Quarterly, 29(1): 179–202.
Jauernig, Johanna, Matthias Uhl, and Christoph Luetge. 2016. “Competition-
induced Punishment of Winners and Losers: Who is the Target?” Journal of Economic
Psychology, 57: 13–25.
32

Judge, Timothy A, Carl J Thoresen, Joyce E Bono, and Gregory K Patton. 2001.
“The Job Satisfaction–Job Performance Relationship: A Qualitative and Quantitative
Review.” Psychological Bulletin, 127(3): 376.
Kajackaite, Agne, and Dirk Sliwka. 2020. “Prosocial Managers, Employee Motivation,
and the Creation of Shareholder Value.” Journal of Economic Behavior & Organization,
172: 217–235.
Kaplan, Steven N, Mark M Klebanov, and Morten Sorensen. 2012. “Which CEO
Characteristics and Abilities Matter?” The Journal of Finance, 67(3): 973–1007.
Kosse, Fabian, and Michela M Tincani. 2020. “Prosociality Predicts Labor Market
Success around the World.” Nature Communications, 11(1): 1–6.
Lazear, Edward P, and Kathryn L Shaw. 2007. “Personnel Economics: The Economist’s
View of Human Resources.” Journal of Economic Perspectives, 21(4): 91–114.
Lazear, Edward P, Kathryn L Shaw, and Christopher T Stanton. 2015. “The Value
of Bosses.” Journal of Labor Economics, 33(4): 823–861.
Lindbeck, Assar, and Dennis J Snower. 2000. “Multitask Learning and the Reorgani-
zation of Work: From Tayloristic to Holistic Organization.” Journal of Labor Economics,
18(3): 353–376.
Martinez, Elizabeth A, Nancy Beaulieu, Robert Gibbons, Peter Pronovost, and
Thomas Wang. 2015. “Organizational Culture and Performance.” American Economic
Review, 105(5): 331–35.
Ostroff, Cheri. 1992. “The Relationship between Satisfaction, Attitudes, and Performance:
An Organizational Level Analysis.” Journal of Applied Psychology, 77(6): 963.
Quinn, Simon, and Christopher Woodruff. 2019. “Experiments and Entrepreneurship
in Developing Countries.” Annual Review of Economics, 11: 225–248.
Raven, John C, John C Raven, and John Hugh Court. 1962. Advanced Progressive
Matrices. HK Lewis London.
Rochat, Yannick. 2009. “Closeness Centrality Extended to Unconnected Graphs: The
Harmonic Centrality Index.”
33

Romano, Joseph P, and Michael Wolf. 2005. “Exact and Approximate Stepdown Meth-
ods for Multiple Hypothesis Testing.” Journal of the American Statistical Association,
100(469): 94–108.
Schelling, Thomas C. 1969. “Models of Segregation.” The American Economic Review,
59(2): 488–493.
Shallcross, Linda, Michael Sheehan, and Sheryl Ramsay. 2008. “Workplace Mobbing:
Experiences in the Public Sector.” International Journal of Organisational Behaviour,
13(2): 56–70.
Sharma, Smriti, and Finn Tarp. 2018. “Does Managerial Personality Matter? Evidence
from Firms in Vietnam.” Journal of Economic Behavior & Organization, 150: 432–445.
Srivastava, Sameer B, Amir Goldberg, V Govind Manian, and Christopher Potts.
2018. “Enculturation Trajectories: Language, Cultural Adaptation, and Individual Out-
comes in Organizations.” Management Science, 64(3): 1348–1364.
Terrier, Camille, Daniel L Chen, and Matthias Sutter. 2021. “COVID-19 within
Families Amplifies the Prosociality Gap between Adolescents of High and Low Socioeco-
nomic Status.”
Ubfal, Diego, Irani Arraiz, Diether W Beuermann, Michael Frese, Alessandro
Maffioli, and Daniel Verch. 2019. “The Impact of Soft-skills Training for Entrepreneurs
in Jamaica.” Available at SSRN 3374406.
Van den Steen, Eric. 2010. “On the Origin of Shared Beliefs (and Corporate Culture).”
The RAND Journal of Economics, 41(4): 617–648.
Weidmann, Ben, and David J Deming. 2020. “Team Players: How Social Skills Improve
Group Performance.” National Bureau of Economic Research.
Wu, Alice H. 2018. “Gendered Language on the Economics Job Market Rumors Forum.”
Vol. 108, 175–79.
34

7 Tables
Table 1: Surveys, Tests, and Incentivized Games at Baseline and Endline
Measure Baseline, Fall 2019 Baseline, Fall 2020 Endline, Summer 2021Demographics X X 7
Raven Test X X 7
Eyes Test X X 7
Risk Tolerance X 7 7
Competitiveness X 7 7
Cooperation (Public Good) X 7 7
Sabotage (Sabotage Game) 7 7 XTrust and Reciprocity 7 7 XFairness (Ultimatum Game) 7 7 XWorkplace Satisfaction X 7 XMeritocratic Values X 7 XCollegial Department X 7 XBehavioral Norms 7 7 XPrescriptive Norms 7 7 XLeader Quality X 7 XSocial Networks X 7 XCOVID-19-related Social Isolation 7 7 XTurnover 7 7 XPromotion 7 7 X
The table indicates whether the respective variable or variables used for constructing therespective index were collected at (i) baseline (Fall 2019), (ii) baseline (Fall 2020), and (iii)endline (Summer 2021).
35

Table 2: Balance (Full Baseline Sample)
Panel I: Individual CharacteristicsControl Mean Treatment Mean P-value of Difference
Male 0.63 0.58 0.23Age 36.15 35.97 0.56Married 0.69 0.63 0.15Tenure (yearly) 7.56 7.89 0.59Leader Age 42.51 42.42 0.89Under Male Leader 0.75 0.72 0.35Holding Leadership Position 0.18 0.19 0.12Raven Score 0.00 0.07 0.87Eyes Score -0.00 -0.22 0.29Risk 0.00 -0.02 0.15Choice of Tournament over Piece Rate 0.50 0.49 0.75Contribution in Public Goods -0.00 0.07 0.45Workplace Satisfaction -0.00 0.14 0.17Collegial Department -0.00 -0.10 0.38Meritocratic Values 0.00 0.09 0.11Behavioral Norms -0.00 0.00 0.54Prescriptive Norms -0.00 0.02 0.52Leader Quality -0.00 -0.00 0.54Nominated Leader as Professional Help 0.52 0.59 0.27Nominated Leader as Personal Help 0.41 0.43 0.43
Panel II: Department Characteristics
Log Department Size 3.13 2.67 0.12Male Share 0.70 0.63 0.31Proportion of Isolated Nodes (Professional Network) 0.13 0.18 0.08*Proportion of Isolated Nodes (Personal Network) 0.08 0.14 0.11Cohort Segregation Coefficient (Professional Network) 0.01 -0.02 0.12Cohort Segregation Coefficient (Personal Network) 0.05 0.02 0.11Density of the Department (Personal Network) 0.04 0.06 0.07*Density of the Department (Professional Network) 0.03 0.05 0.08*Turnover 13.81 15.18 0.73
Panel III: Firm Characteristics
Log of Firm Size 6.60 6.27 0.78Log of Firm Size (Headquarters) 5.28 5.05 0.54Participation Rate 0.77 0.77 0.85
Reported statistics use the Fall 2019 baseline sample. Panel I presents the balance of individual-levelvariables. Panel II presents the balance of department level characteristics and panel III firm level char-acteristics. Cognitive tests and survey measures are standardized. P-values are obtained by controllingfor randomization strata (sector). In Panels I and II, standard errors are clustered at the firm level (unitof randomization). Panel III uses robust standard errors.
36
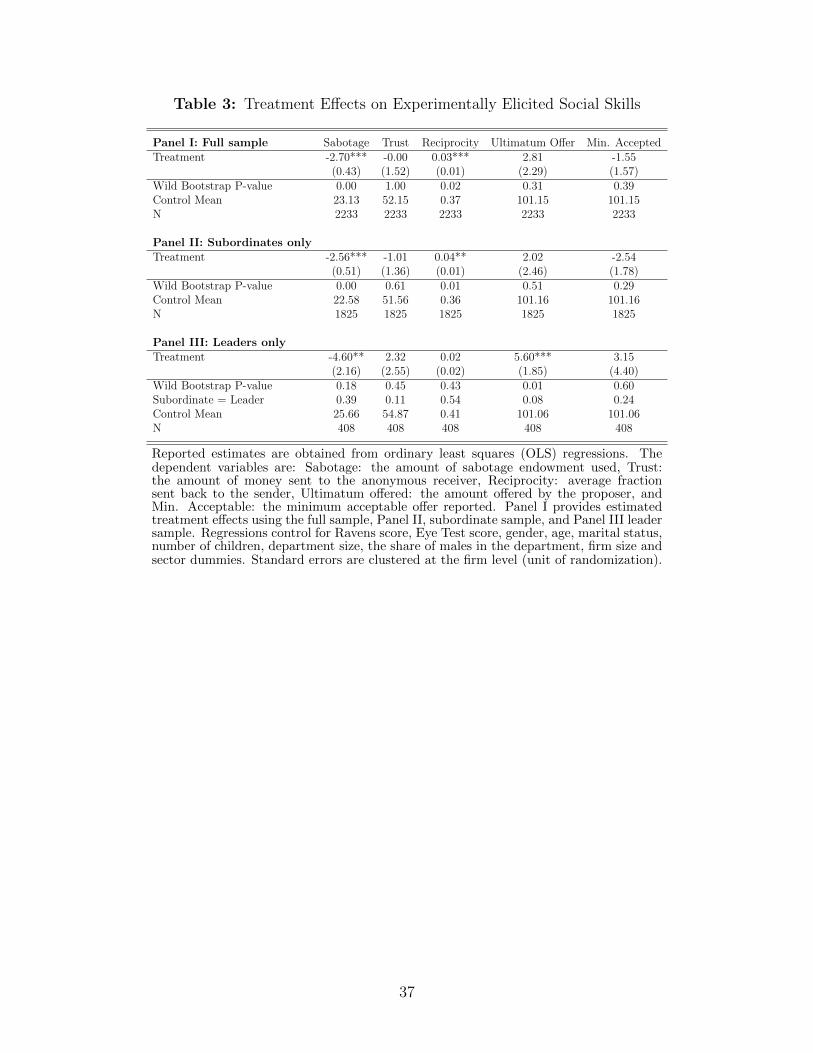
Table 3: Treatment Effects on Experimentally Elicited Social Skills
Panel I: Full sample Sabotage Trust Reciprocity Ultimatum Offer Min. AcceptedTreatment -2.70*** -0.00 0.03*** 2.81 -1.55
(0.43) (1.52) (0.01) (2.29) (1.57)Wild Bootstrap P-value 0.00 1.00 0.02 0.31 0.39Control Mean 23.13 52.15 0.37 101.15 101.15N 2233 2233 2233 2233 2233
Panel II: Subordinates onlyTreatment -2.56*** -1.01 0.04** 2.02 -2.54
(0.51) (1.36) (0.01) (2.46) (1.78)Wild Bootstrap P-value 0.00 0.61 0.01 0.51 0.29Control Mean 22.58 51.56 0.36 101.16 101.16N 1825 1825 1825 1825 1825
Panel III: Leaders onlyTreatment -4.60** 2.32 0.02 5.60*** 3.15
(2.16) (2.55) (0.02) (1.85) (4.40)Wild Bootstrap P-value 0.18 0.45 0.43 0.01 0.60Subordinate = Leader 0.39 0.11 0.54 0.08 0.24Control Mean 25.66 54.87 0.41 101.06 101.06N 408 408 408 408 408
Reported estimates are obtained from ordinary least squares (OLS) regressions. Thedependent variables are: Sabotage: the amount of sabotage endowment used, Trust:the amount of money sent to the anonymous receiver, Reciprocity: average fractionsent back to the sender, Ultimatum offered: the amount offered by the proposer, andMin. Acceptable: the minimum acceptable offer reported. Panel I provides estimatedtreatment effects using the full sample, Panel II, subordinate sample, and Panel III leadersample. Regressions control for Ravens score, Eye Test score, gender, age, marital status,number of children, department size, the share of males in the department, firm size andsector dummies. Standard errors are clustered at the firm level (unit of randomization).
37
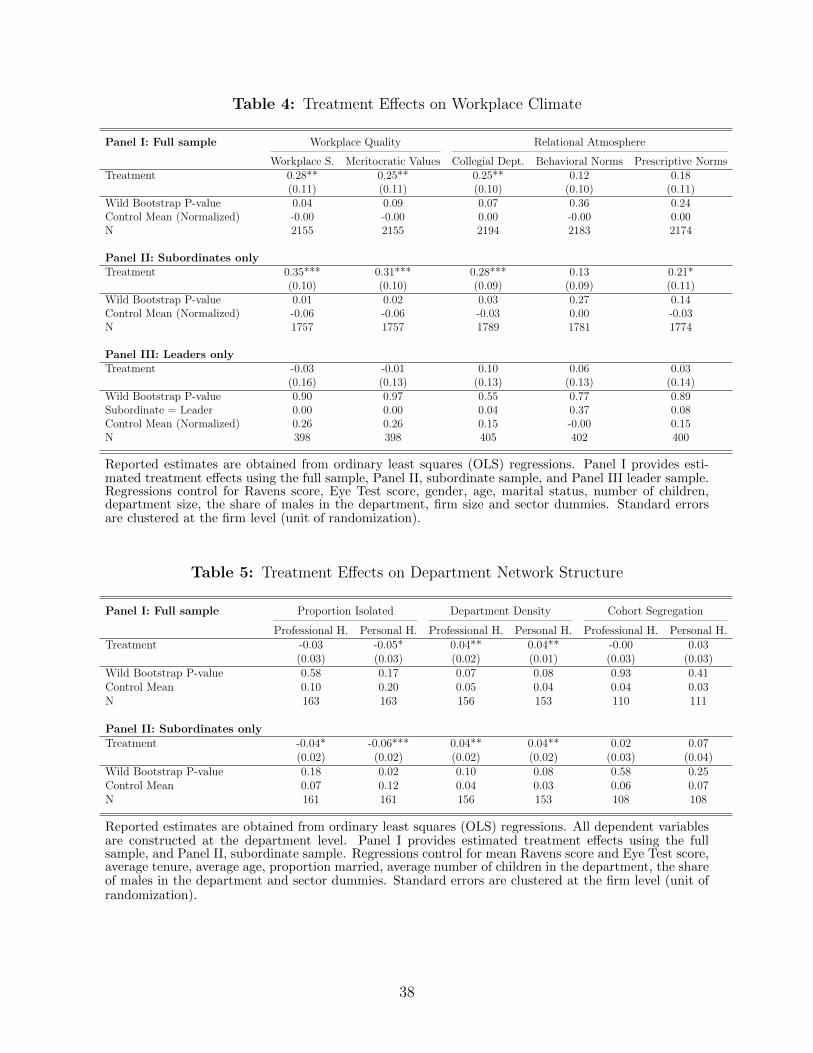
Table 4: Treatment Effects on Workplace Climate
Panel I: Full sample Workplace Quality Relational Atmosphere
Workplace S. Meritocratic Values Collegial Dept. Behavioral Norms Prescriptive NormsTreatment 0.28** 0.25** 0.25** 0.12 0.18
(0.11) (0.11) (0.10) (0.10) (0.11)Wild Bootstrap P-value 0.04 0.09 0.07 0.36 0.24Control Mean (Normalized) -0.00 -0.00 0.00 -0.00 0.00N 2155 2155 2194 2183 2174
Panel II: Subordinates onlyTreatment 0.35*** 0.31*** 0.28*** 0.13 0.21*
(0.10) (0.10) (0.09) (0.09) (0.11)Wild Bootstrap P-value 0.01 0.02 0.03 0.27 0.14Control Mean (Normalized) -0.06 -0.06 -0.03 0.00 -0.03N 1757 1757 1789 1781 1774
Panel III: Leaders onlyTreatment -0.03 -0.01 0.10 0.06 0.03
(0.16) (0.13) (0.13) (0.13) (0.14)Wild Bootstrap P-value 0.90 0.97 0.55 0.77 0.89Subordinate = Leader 0.00 0.00 0.04 0.37 0.08Control Mean (Normalized) 0.26 0.26 0.15 -0.00 0.15N 398 398 405 402 400
Reported estimates are obtained from ordinary least squares (OLS) regressions. Panel I provides esti-mated treatment effects using the full sample, Panel II, subordinate sample, and Panel III leader sample.Regressions control for Ravens score, Eye Test score, gender, age, marital status, number of children,department size, the share of males in the department, firm size and sector dummies. Standard errorsare clustered at the firm level (unit of randomization).
Table 5: Treatment Effects on Department Network Structure
Panel I: Full sample Proportion Isolated Department Density Cohort Segregation
Professional H. Personal H. Professional H. Personal H. Professional H. Personal H.Treatment -0.03 -0.05* 0.04** 0.04** -0.00 0.03
(0.03) (0.03) (0.02) (0.01) (0.03) (0.03)Wild Bootstrap P-value 0.58 0.17 0.07 0.08 0.93 0.41Control Mean 0.10 0.20 0.05 0.04 0.04 0.03N 163 163 156 153 110 111
Panel II: Subordinates onlyTreatment -0.04* -0.06*** 0.04** 0.04** 0.02 0.07
(0.02) (0.02) (0.02) (0.02) (0.03) (0.04)Wild Bootstrap P-value 0.18 0.02 0.10 0.08 0.58 0.25Control Mean 0.07 0.12 0.04 0.03 0.06 0.07N 161 161 156 153 108 108
Reported estimates are obtained from ordinary least squares (OLS) regressions. All dependent variablesare constructed at the department level. Panel I provides estimated treatment effects using the fullsample, and Panel II, subordinate sample. Regressions control for mean Ravens score and Eye Test score,average tenure, average age, proportion married, average number of children in the department, the shareof males in the department and sector dummies. Standard errors are clustered at the firm level (unit ofrandomization).
38

Table 6: Treatment Effects on the Probability of Quitting and Promotion
Panel I: Full sample Probability of Quitting Probability of PromotionTreatment -0.05*** -0.00
(0.01) (0.02)Wild Bootstrap P-value 0.01 0.97Control Mean 0.05 0.07N 2326 2326
Panel II: Subordinates onlyTreatment -0.05*** -0.01
(0.01) (0.03)Wild Bootstrap P-value 0.02 0.84Control Mean 0.06 0.07N 1901 1901
Panel III: Leaders onlyTreatment -0.05* 0.03
(0.03) (0.03)Wild Bootstrap P-value 0.05 0.42Subordinate = Leader 0.86 0.39Control Mean 0.05 0.07N 425 425
Panel IV: Non-participant sampleTreatment -0.01 0.04*
(0.02) (0.02)Wild Bootstrap P-value 0.75 0.33Control Mean 0.07 0.03N 1173 1173
Reported estimates are obtained from ordinary least squares (OLS) regressions.Panel I provides estimated treatment effects using the full sample, Panel II, sub-ordinate sample, Panel III leader sample, and Panel IV non-participant sample.Regressions control for Ravens score, Eye Test score, gender, age, marital status,number of children, department size, the share of males in the department, firmsize and sector dummies. Non-participant sample regressions control for gender,firm size and sector dummies. Standard errors are clustered at the firm level (unitof randomization).
39

Table 7: Heterogeneous Treatment Effects on Social Skills: Leader Gender
Panel I: Have Male Leader Sabotage Trust Reciprocity Ultimatum Offer Min. AcceptedTreatment -3.24*** -0.62 0.03** 3.58 -0.87
(0.49) (1.60) (0.01) (2.53) (2.15)Wild Bootstrap P-value 0.00 0.75 0.04 0.28 0.72Control Mean 23.65 53.05 0.38 101.04 101.04N 1689 1689 1689 1689 1689
Panel II: Have Female LeaderTreatment -2.98* -0.83 0.09*** -1.39 -4.89
(1.61) (2.08) (0.01) (3.05) (4.30)Wild Bootstrap P-value 0.10 0.70 0.00 0.69 0.35Male leader = Female leader 0.88 0.92 0.00 0.17 0.48Control Mean 21.85 50.67 0.33 105.16 105.16N 421 421 421 421 421
Reported estimates are obtained from ordinary least squares (OLS) regressions. Thedependent variables are: Sabotage: the amount of sabotage endowment used, Trust: theamount of money sent to the anonymous receiver, Reciprocity: average fraction sentback to the sender, Ultimatum offered: the amount offered by the proposer, and Min.Acceptable: the minimum acceptable offer reported. Panel I provides estimated treat-ment effects for participants whose immediate team leader is a male, Panel II, providesestimated treatment effects for participants whose immediate team leader is a female.Regressions control for Ravens score, Eye Test score, gender, age, marital status, numberof children, department size, the share of males in the department, firm size and sectordummies. Standard errors are clustered at the firm level (unit of randomization).
Table 8: Heterogeneous Treatment Effects on Workplace Climate: Leader Gender
Panel I: Have Male Leader Workplace Quality Relational Atmosphere
Workplace S. Meritocratic Values Collegial Dept. Behavioral Norms Prescriptive NormsTreatment 0.22* 0.19* 0.21** 0.11 0.16
(0.11) (0.10) (0.10) (0.10) (0.10)Wild Bootstrap P-value 0.12 0.14 0.13 0.41 0.23Control Mean (Normalized) 0.04 0.02 0.04 0.00 0.01N 1729 1729 1761 1753 1744
Panel II: Have Female LeaderTreatment 0.59*** 0.53** 0.46** 0.13 0.27
(0.21) (0.19) (0.21) (0.14) (0.19)Wild Bootstrap P-value 0.12 0.14 0.14 0.41 0.32Male leader = Female leader 0.02 0.03 0.17 0.89 0.43Control Mean (Normalized) -0.20 -0.11 -0.20 -0.00 -0.06N 426 426 433 430 430
Reported estimates are obtained from ordinary least squares (OLS) regressions. Panel I providesestimated treatment effects for participants whose immediate team leader is a male, Panel II, providesestimated treatment effects for participants whose immediate team leader is a female. Regressionscontrol for Ravens score, Eye Test score, gender, age, marital status, number of children, departmentsize, the share of males in the department, firm size and sector dummies. Standard errors are clusteredat the firm level (unit of randomization).
40

Table 9: Heterogeneous Treatment Effects on Probability of Quitting and Promotion:Leader Gender
Panel I: Have Male Leader Probability of Quitting Probability of PromotionTreatment -0.04** 0.01
(0.02) (0.02)Wild Bootstrap P-value 0.06 0.61Control Mean 0.05 0.07N 1766 1766
Panel II: Have Female LeaderTreatment -0.04** 0.04*
(0.01) (0.02)Wild Bootstrap P-value 0.05 0.22Male leader = Female leader 0.90 0.21Control Mean 0.08 0.07N 436 436
Reported estimates are obtained from ordinary least squares (OLS) regressions.Panel I provides estimated treatment effects for participants whose immediate teamleader is a male, Panel II, provides estimated treatment effects for participantswhose immediate team leader is a female. Regressions control for Ravens score, EyeTest score, gender, age, marital status, number of children, department size, theshare of males in the department, firm size and sector dummies. Standard errorsare clustered at the firm level (unit of randomization).
Table 10: Heterogeneous Treatment Effects on Social Skills: Gender
Panel I: Male only Sabotage Trust Reciprocity Ultimatum Offer Min. AcceptedTreatment -3.79*** 1.53 0.03** 5.86** 0.97
(0.68) (1.26) (0.01) (2.26) (2.20)Wild Bootstrap P-value 0.00 0.39 0.05 0.05 0.74Control Mean 23.95 53.90 0.39 100.00 100.00N 1564 1564 1564 1564 1564
Panel II: Female onlyTreatment -1.36 -3.21 0.05* -4.00 -6.50*
(1.22) (3.48) (0.02) (4.41) (3.68)Wild Bootstrap P-value 0.36 0.55 0.09 0.56 0.16Male = Female 0.14 0.14 0.35 0.05 0.07Control Mean 20.95 47.51 0.33 104.16 104.16N 669 669 669 669 669
Reported estimates are obtained from ordinary least squares (OLS) regressions.The dependent variables are: Sabotage: the amount of sabotage endowmentused, Trust: the amount of money sent to the anonymous receiver, Reciprocity:average fraction sent back to the sender, Ultimatum offered: the amount offeredby the proposer, and Min. Acceptable: the minimum acceptable offer reported.Panel I provides estimated treatment effects for male participants, Panel II,female participants. Regressions control for Ravens score, Eye Test score, age,marital status, number of children, department size, the share of males in thedepartment, firm size and sector dummies. Standard errors are clustered at thefirm level (unit of randomization).
41

Table 11: Heterogeneous Treatment Effects on Workplace Climate: Gender
Panel I: Male Only Workplace Quality Relational Atmosphere
Workplace S. Meritocratic Values Collegial Dept. Behavioral Norms Prescriptive NormsTreatment 0.24** 0.21* 0.21** 0.09 0.11
(0.11) (0.10) (0.09) (0.09) (0.08)Wild Bootstrap P-value 0.10 0.12 0.10 0.42 0.29Control Mean (Normalized) 0.05 0.03 0.05 -0.00 0.08N 1516 1516 1547 1538 1530
Panel II: Female OnlyTreatment 0.31* 0.26 0.30 0.17 0.27
(0.17) (0.17) (0.21) (0.21) (0.23)Wild Bootstrap P-value 0.19 0.27 0.31 0.56 0.42Male = Female 0.59 0.76 0.64 0.68 0.39Control Mean (Normalized) -0.13 -0.09 -0.13 0.01 -0.21N 639 639 647 645 644
Reported estimates are obtained from ordinary least squares (OLS) regressions. Panel I providesestimated treatment effects for male participants, Panel II, female participants. Regressions controlfor Ravens score, Eye Test score, age, marital status, number of children, department size, the shareof males in the department, firm size and sector dummies. Standard errors are clustered at the firmlevel (unit of randomization).
Table 12: Heterogeneous Treatment Effects on Probability of Quitting and Promotion:Gender
Panel I: Male Only Probability of Quitting Probability of PromotionTreatment -0.05*** 0.01
(0.01) (0.02)Wild Bootstrap P-value 0.01 0.70Control Mean 0.05 0.06N 1646 1646
Panel II: Female OnlyTreatment -0.05*** -0.03
(0.02) (0.02)Wild Bootstrap P-value 0.02 0.39Male = Female 0.66 0.09Control Mean 0.07 0.07N 680 680
Reported estimates are obtained from ordinary least squares (OLS) regressions.Panel I provides estimated treatment effects for male participants, Panel II,female participants. Regressions control for Ravens score, Eye Test score, age,marital status, number of children, department size, the share of males in thedepartment, firm size and sector dummies. Standard errors are clustered at thefirm level (unit of randomization).
42

8 Figures
Figure 1: Timeline of the Trial
.
Figure 2: Evaluation Design: ITT
Participation refers to those who stated their willingness to participate in the study and signedthe consent form. Percentage treated refers to the percentage who took part in the trainingprogram amongst those who participated.
43

Figure 3: Depicted Theory of Change
.
44

Figure 4: COVID-19 Related Well-Being
The figure depicts the estimated treatment effects on COVID-19 related feelings of socialisolation indicators (binary). All regressions use a linear probability model and control forRavens score, Eye Test score, gender, age, marital status, number of children, departmentsize, the share of males in the department, firm size and sector dummies. 95% confidenceintervals are based on standard errors clustered at the firm level. The vertical line indicatesan effect of zero.
45

Figure 5: COVID-19 Related Well-Being: Leader Gender
The figure depicts the estimated treatment effects on COVID-19 related feelings of socialisolation indicators (binary). All regressions use a linear probability model and control forRavens score, Eye Test score, gender, age, marital status, number of children, departmentsize, the share of males in the department, firm size and sector dummies. 95% confidenceintervals are based on standard errors clustered at the firm level. The vertical line indicatesan effect of zero.
46

Figure 6: COVID-19 Related Well-Being: Gender
The figure depicts the estimated treatment effects on COVID-19 related feelings of socialisolation indicators (binary). All regressions use a linear probability model and control forRavens score, Eye Test score, gender, age, marital status, number of children, departmentsize, the share of males in the department, firm size and sector dummies. 95% confidenceintervals are based on standard errors clustered at the firm level. The vertical line indicatesan effect of zero.
47

Figure 7: Associations between Leader Professionalism and Workplace Climate/RelationalDynamics at Baseline
Figures plot the non-parametric estimates (and 95% confidence bands) of the associations between leaderprofessionalism reported by subordinates and workplace satisfaction, perceived meritocratic values, collegial-ity of the department, descriptive and prescriptive behavioral norms. Ravens score, Eye Test score, gender,age, marital status, number of children, department size, the share of males in the department, firm size andsector dummies enter the model linearly. Shaded areas represent 95% confidence intervals.
48

Figure 8: Associations between Leader Empathy and Workplace Climate/Relational Dy-namics at Baseline
Figures plot the non-parametric estimates (and 95% confidence bands) of the associations between leaderempathy reported by subordinates and workplace satisfaction, perceived meritocratic values, collegiality ofthe department, descriptive and prescriptive behavioral norms. Ravens score, Eye Test score, gender, age,marital status, number of children, department size, the share of males in the department, firm size andsector dummies enter the model linearly. Shaded areas represent 95% confidence intervals.
49

Figure 9: Potential Mechanisms
The figure depicts the estimated treatment effects on leader professionalism, leader empathy(reported by subordinates), whether the respondent nominated her leader as a professional(personal) help provider, and respondent’s own empathy level. All regressions use OLS andcontrol for Ravens score, Eye Test score, gender, age, marital status, number of children,department size, the share of males in the department, firm size and sector dummies. 95%confidence intervals are based on standard errors clustered at the firm level. The vertical lineindicates an effect of zero..
50

Online Appendix
A Extra Tables and Figures
Table A.1: Balance (Restricted Baseline Sample)
Control Mean Treatment Mean P-value of DifferenceMale 0.68 0.63 0.16Age 35.49 35.95 0.39Married 0.66 0.66 0.72Tenure (yearly) 6.47 8.30 0.11Leader Age 42.29 42.21 0.89Under Male Leader 0.71 0.74 0.77Holding Leadership Position 0.16 0.18 0.17Raven Score 0.07 0.08 0.59Eyes Score 0.05 -0.27 0.24Risk 0.05 -0.03 0.11Choice of Tournament over Piece Rate 0.52 0.49 0.23Contribution in Public Goods 0.02 0.11 0.47Workplace Satisfaction -0.00 0.14 0.17Collegial Department -0.00 -0.10 0.38Meritocratic Values 0.00 0.09 0.11Behavioral Norms -0.02 -0.07 0.93Prescriptive Norms -0.02 -0.01 0.77Leader Quality -0.00 -0.00 0.54Nominated Leader as Professional Help 0.53 0.56 0.92Nominated Leader as Personal Help 0.44 0.39 0.51
Reported statistics use the restricted Fall 2019 baseline sample. This table presents the balance ofindividual-level variables. Cognitive tests and survey measures are standardized. P-values are obtainedby controlling for randomization strata (sector). Standard errors are clustered at the firm level (unit ofrandomization).
51

Table A.2: Balance (Short Baseline Sample)
Control Mean Treatment mean P-value of differenceMale 0.73 0.67 0.14Age 36.52 35.49 0.44Married 0.69 0.65 0.07*Tenure (yearly) 7.72 7.42 0.57Raven Score 0.03 0.09 0.41Eyes Score 0.03 -0.00 0.76Leader Age 42.29 42.21 0.89Under Male Leader 0.71 0.74 0.77Holding Leadership Position 0.18 0.19 0.17
Reported statistics use the Fall 2020 short baseline sample. This table presents thebalance of individual-level variables. Cognitive tests and survey measures are standard-ized. P-values are obtained by controlling for randomization strata (sector). Standarderrors are clustered at the firm level (unit of randomization).
52

Table A.3: Balance table (unrestricted sample): Subordinates and Leaders
Panel I: Subordinates onlyControl Mean Treatment mean P-value of difference
Male 0.61 0.56 0.20Age 34.91 34.66 0.73Married 0.66 0.59 0.13Tenure (yearly) 6.78 7.18 0.48Leader Age 42.30 41.77 0.89Under Male Leader 0.75 0.73 0.59Raven Score -0.05 0.03 0.69Eyes Score 0.04 -0.22 0.16Risk -0.02 -0.03 0.20Choice of Tournament over Piece Rate 0.49 0.46 0.41Contribution in Public Goods -0.03 0.04 0.54Workplace Satisfaction -0.09 0.09 0.11Collegial Department -0.05 -0.14 0.64Meritocratic Values -0.15 0.03 0.03**Behavioral Norms -0.02 -0.01 0.45Prescriptive Norms -0.06 -0.02 0.40Leader Quality -0.03 0.01 0.35Nominated Leader as Professional Help 0.55 0.61 0.32Nominated Leader as Personal Help 0.42 0.45 0.27
Panel II: Leaders only
Male 0.71 0.66 0.50Age 41.60 41.52 0.96Married 0.83 0.81 0.57Tenure (yearly) 11.03 11.09 0.84Leader Age 43.53 46.46 0.08*Under Male Leader 0.78 0.69 0.23Raven Score 0.24 0.19 0.46Eyes Score -0.19 -0.23 0.92Risk 0.10 0.05 0.66Choice of Tournament over Piece Rate 0.56 0.61 0.64Contribution in Public Goods 0.14 0.17 0.94Workplace Satisfaction 0.35 0.36 0.88Collegial Department 0.21 0.04 0.04**Meritocratic Values 0.61 0.33 0.11Behavioral Norms 0.09 0.07 0.73Prescriptive Norms 0.21 0.18 0.73Leader Quality 0.12 -0.03 0.27Nominated Leader as Professional Help 0.39 0.47 0.24Nominated Leader as Personal Help 0.38 0.35 0.84
Reported statistics use the Fall 2019 baseline sample. Panel I presents the balance of individual-levelvariables for the subordinates, and Panel II for the leaders. Cognitive tests and survey measures arestandardized. P-values are obtained by controlling for randomization strata (sector). Standard errorsare clustered at the firm level (unit of randomization).
53

Table A.4: Treatment Effects on Experimentally Elicited Social Skills (without covariates)
Panel I: Full sample Sabotage Trust Reciprocity Ultimatum Offer Min. AcceptedTreatment -3.26*** 0.79 0.03*** 3.41 -2.07
(0.56) (1.64) (0.01) (2.07) (1.43)Wild Bootstrap P-value 0.00 0.71 0.01 0.17 0.20Control Mean 23.13 52.15 0.37 101.15 97.97N 2233 2233 2233 2233 2233
Panel II: Subordinates onlyTreatment -3.14*** -0.00 0.03*** 3.01 -2.77
(0.69) (1.58) (0.01) (2.25) (1.69)Wild Bootstrap P-value 0.00 1.00 0.02 0.28 0.15Control Mean 22.58 51.56 0.36 101.16 98.54N 1825 1825 1825 1825 1825
Panel III: Leaders onlyTreatment -4.63** 2.80 0.01 4.27 0.80
(1.63) (2.11) (0.03) (2.88) (4.25)Wild Bootstrap P-value 0.02 0.26 0.65 0.24 0.87Subordinate = Leader 0.45 0.08 0.59 0.69 0.46Control Mean 25.66 54.87 0.41 101.06 95.33N 408 408 408 408 408
Reported estimates are obtained from ordinary least squares (OLS) regressions. Thedependent variables are: Sabotage: the amount of sabotage endowment used, Trust:the amount of money sent to the anonymous receiver, Reciprocity: average fractionsent back to the sender, Ultimatum offered: the amount offered by the proposer, andMin. Acceptable: the minimum acceptable offer reported. Panel I provides estimatedtreatment effects using the full sample, Panel II, subordinate sample, and Panel III leadersample. Regressions only control for sector dummies. Standard errors are clustered atthe firm level (unit of randomization).
54

Table A.5: Treatment Effects on Perceived Workplace Climate (without covariates)
Panel I: Male Only Workplace Climate Relational Dynamics
Workplace S. Meritocratic Values Collegial Dept. Behavioral Norms Prescriptive NormsTreatment 0.22** 0.21* 0.20** 0.12 0.16*
(0.11) (0.10) (0.09) (0.08) (0.09)Wild Bootstrap P-value 0.10 0.13 0.07 0.24 0.11Control Mean (Normalized) -0.00 -0.00 0.00 -0.00 0.00N 2155 2155 2194 2183 2174
Panel II: Subordinates onlyTreatment 0.29** 0.27** 0.23** 0.13 0.18**
(0.10) (0.10) (0.09) (0.08) (0.09)Wild Bootstrap P-value 0.02 0.06 0.04 0.21 0.08Control Mean (Normalized) -0.06 -0.06 -0.03 0.00 -0.03N 1757 1757 1789 1781 1774
Panel III: Leaders onlyTreatment -0.07 -0.03 0.08 0.06 0.05
(0.14) (0.13) (0.11) (0.10) (0.11)Wild Bootstrap P-value 0.66 0.87 0.53 0.64 0.71Subordinate = Leader 0.00 0.00 0.03 0.35 0.16Control Mean (Normalized) 0.26 0.26 0.15 -0.00 0.15N 398 398 405 402 400
Reported estimates are obtained from ordinary least squares (OLS) regressions. Panel I provides esti-mated treatment effects using the full sample, Panel II, subordinate sample, and Panel III leader sample.Regressions only control for sector dummies. Standard errors are clustered at the firm level (unit ofrandomization).
55

Table A.6: Treatment Effects on Quitting and Promotion (without covariates)
Panel I: Full sample Probability of Quitting Probability of PromotionTreatment -0.04** 0.01
(0.01) (0.02)Wild Bootstrap P-value 0.03 0.54Control Mean 0.05 0.07N 2326 2326
Panel II: Subordinates onlyTreatment -0.03** 0.01
(0.01) (0.02)Wild Bootstrap P-value 0.06 0.69Control Mean 0.06 0.07N 1901 1901
Panel III: Leaders onlyTreatment -0.04* 0.03
(0.02) (0.03)Wild Bootstrap P-value 0.05 0.51Subordinate = Leader 0.66 0.71Control Mean 0.05 0.07N 425 425
Reported estimates are obtained from ordinary least squares (OLS) regressions.Panel I provides estimated treatment effects using the full sample, Panel II, sub-ordinate sample, and Panel III leader sample. Regressions only control for sectordummies. Non-participant sample regressions control for gender, firm size andsector dummies. Standard errors are clustered at the firm level (unit of random-ization).
56

Table A.7: Correction for Multiple Hypothesis Testing: Original and Romano-Wolf p-values
Panel I: Incentivized OutcomesFull Sample Subordinates Only Leaders Only
Original Romano-Wolf Original Romano-Wolf Original Romano-WolfSabotage 0.00 0.05 0.00 0.04 0.05 0.13
Trust 1.00 1.00 0.47 0.73 0.37 0.75
Reciprocity 0.01 0.05 0.01 0.03 0.32 0.75
Ultimatum Offer 0.23 0.63 0.42 0.73 0.01 0.53
Min. Accepted 0.34 0.82 0.17 0.70 0.48 0.75
Panel II: Survey OutcomesFull Sample Subordinates Only Leaders Only
Original Romano-Wolf Original Romano-Wolf Original Romano-WolfWorkplace S. 0.02 0.07 0.00 0.02 0.83 0.99
Meritocratic Values 0.03 0.11 0.00 0.03 0.93 0.99
Collegial Dept. 0.02 0.11 0.01 0.06 0.44 0.95
Behavioral Norms 0.24 0.39 0.16 0.30 0.65 0.98
Prescriptive Norms 0.11 0.26 0.06 0.15 0.86 0.99
Leader Professionalism 0.02 0.13 0.01 0.08 0.18 0.70
Leader Empathy 0.01 0.11 0.01 0.06 0.29 0.78
Panel III: NetworkFull Sample Subordinates Only Leaders Only
Original Romano-Wolf Original Romano-Wolf Original Romano-WolfProfessional Help from Leader 0.07 0.40 0.00 0.04 0.00 0.08
Personal Help from Leader 0.91 0.91 0.42 0.49 0.05 0.12
Panel IV: Covid-19 Related Well-BeingFull Sample Subordinates Only Leaders Only
Original Romano-Wolf Original Romano-Wolf Original Romano-WolfPrefer to Work at Home 0.02 0.12 0.05 0.20 0.08 0.58
I Feel Lonely 0.69 0.95 0.48 0.92 0.83 0.97
Not Connected to My Colleagues 1.00 1.00 0.66 0.92 0.15 0.68
Not Connected to My Leader 0.00 0.12 0.01 0.20 0.40 0.81
Increased Vice Consumption 0.29 0.86 0.48 0.92 0.87 0.97
Reported p-values are obtained from ordinary least squares (OLS) regressions, originaland adjusted for multiple hypothesis testing using the Romano and Wolf (2005) pro-cedure. Panel I presents treatment effects on incentivized outcomes, Panel II, surveyoutcomes, Panel III, leader’s network position, and Panel IV Covid-19 related well-being.Columns 1-2 provide estimated treatment effects using the full sample, columns 3-4, sub-ordinate sample, and columns 5-6 leader sample. Regressions control for Ravens score,Eye Test score, gender, age, marital status, number of children, department size, theshare of males in the department, firm size and sector dummies. Standard errors areclustered at the firm level (unit of randomization).
57
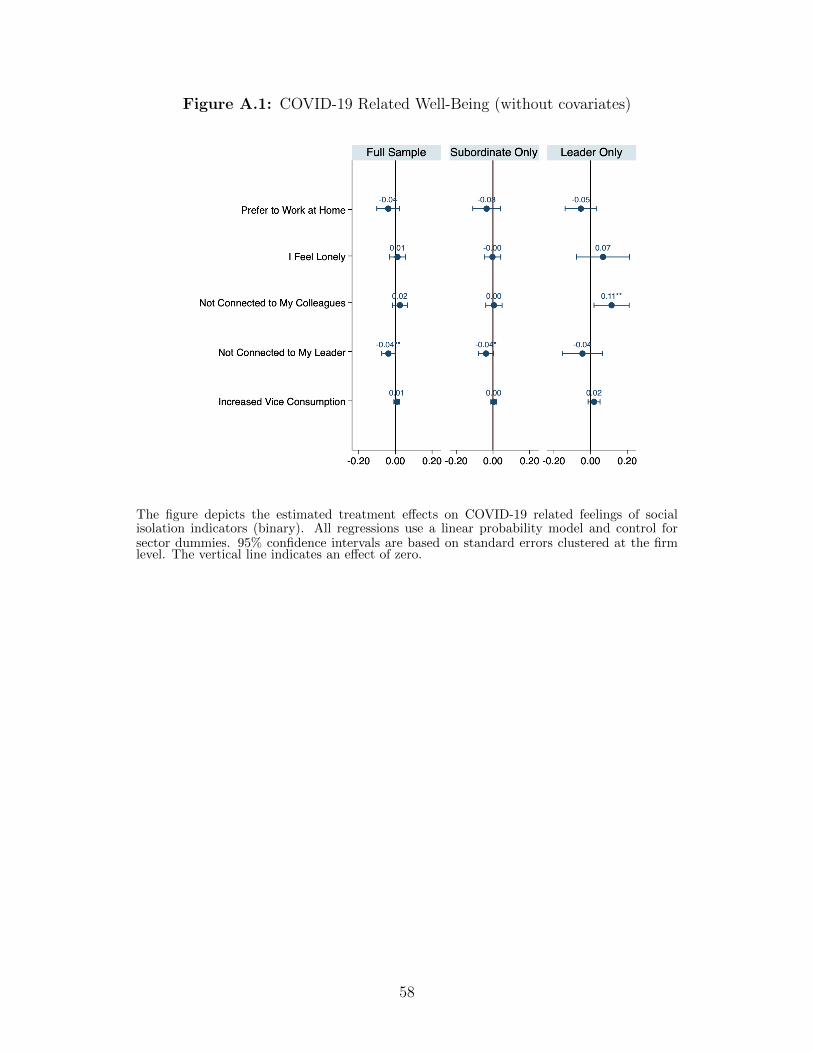
Figure A.1: COVID-19 Related Well-Being (without covariates)
The figure depicts the estimated treatment effects on COVID-19 related feelings of socialisolation indicators (binary). All regressions use a linear probability model and control forsector dummies. 95% confidence intervals are based on standard errors clustered at the firmlevel. The vertical line indicates an effect of zero.
58

B Intervention Content and Example Activities
B.1 Module 1: Online Workshops
Figure B.1: Time-travel to the company’s future
In randomly formed groups, participants described their imagined future workplace and listobstacles in achieving this ideal environment. Exact translations from Turkish.
Figure B.2: Role-playing exercises
In groups, participants assumed different roles (of executives, regular employees, customers, femaleemplyoees, etc..) and stated their complaints and expectations. Exact translations from Turkish.
59

Figure B.3: Good leadership practices
In an interactive survey, participants ranked qualities that a good leader must possess. The bars representthe number of participants that voted for a given option. Exact translations from Turkish.
60
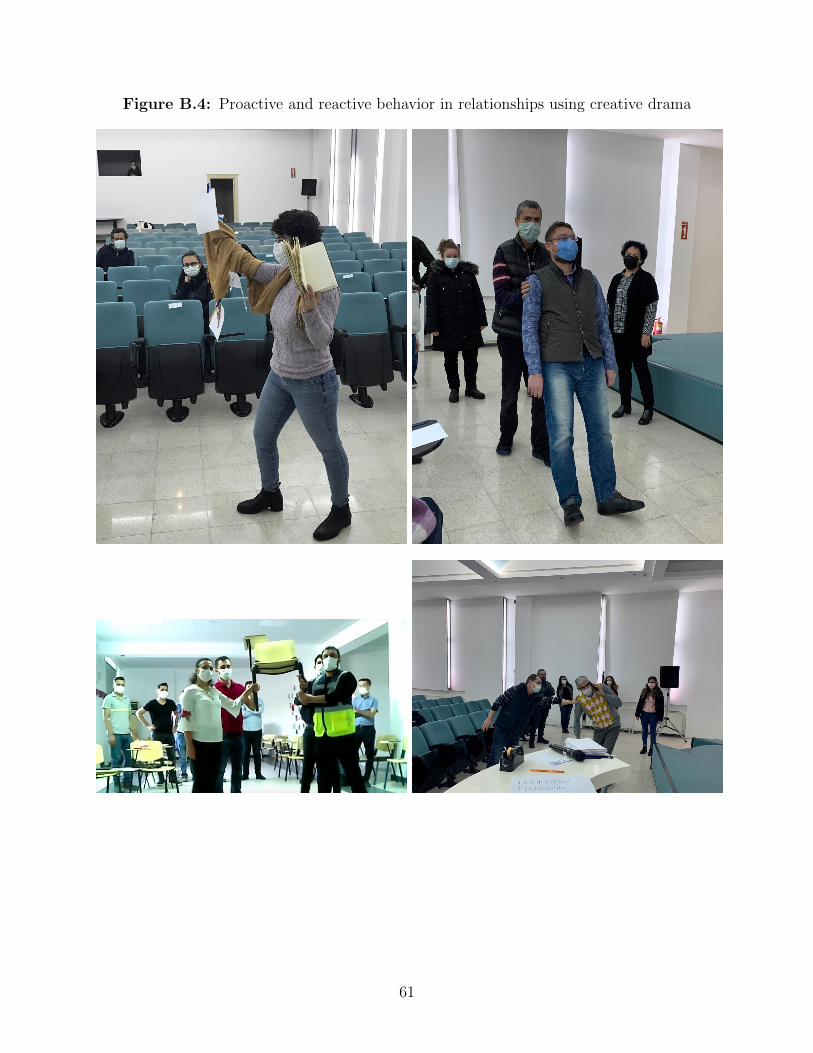
Figure B.4: Proactive and reactive behavior in relationships using creative drama
61

B.2 Module 2: Follow-up Projects
Figure B.5: Screenshots of follow-up project slides presented by different teams
The top panel shows a slide explaining a project titled “We Are One”. The team proposesa practice where a selected member of each department pays a daily visit to another depart-ment to foster teamwork, better communication and coordination. The bottom panel showsa SWAT analysis of communication and motivation within the company. Exact translationsfrom Turkish.
62

Figure B.6: Presentations of follow-up projects by team representatives
C Experimental Instructions and Implementation of Games
C.1 Endline Games
You are going to play three games today. You will be able to earn a monetary reward in
each game, which will be determined by your decision, luck, and, in some cases the decisions
of your department colleagues. One of the games will be selected randomly at the end of the
session, and you will be paid the monetary reward in that selected game. Therefore, it is
63

important that you pay equal attention to each game. We will send your monetary rewards
in a week in the form of grocery cards.
During the event, please make your own decisions without communicating with your
colleagues. Your personal information and decisions in these games will be anonymous. You
will log in with your unique ID number that was sent to you personally.
If your screen freezes or crashes, please refresh the page. If you cannot refresh the page,
please log in again from the main website. You will continue where you left off. If you are
ready, please press the Proceed button.
C.1.1 Ultimatum Game
Game 1
At the beginning of this game, groups of two will be randomly formed within your
department, and you will not know who your partner is. One of you will randomly become
the Sender ; the other, the Receiver. You will not know what role you have been assigned to.
The Sender will have 200 Turkish Liras (TL), and he/she will choose how much of the
200 TL he/she wants to offer to his/her match, i.e., the Receiver. The Receiver, on the other
hand, will evaluate the offer he received from the Sender, and decide whether to accept or
reject the offer. If the Receiver accepts the offer, he/she will receive the offered amount. The
Sender will receive the rest of 200 TL. If the Receiver does not accept the offer, both of you
will receive 0 TL.
At the beginning of the game, everyone will decide how much of the 200 TL they want to
offer if they are the Sender, and which offers they would accept if they are the Receiver. Then,
the computer will randomly assign one person as the Sender and the other as the Receiver.
The amount of the offer will be determined according to the decision of the Sender. We
will consider the Receiver ’s decision to see if they would be willing to accept this offer. The
payoffs will be determined by the decisions of the two matched persons in the same group.
Please indicate the amounts you would offer and accept for both the Sender and Receiver
roles. Remember that, in this game, it is possible for you to be selected as a Sender or a
Receiver. In addition, the amounts mentioned are actual monetary rewards. At the end of
the games, if this game is selected, you will receive your payoff from this game. Please note
that the amount you win from these games will be paid to you. Now, if you have understood
64

clearly, please press the Proceed button and indicate your decisions.
C.1.2 Sabotage game
Game 2
In this game, we will first ask you to carry out a task that lasts two minutes, for which
you will have a chance to earn money. You will be shown letter-number combinations of four
characters. Please try to type the same combination in the space provided below, paying
attention to capitalization. The more correct answers you give in two minutes, the higher
your chances are of winning money.
At the end of two minutes, you will be randomly matched with a co-worker from within
your department. You will not know who your match is, but you will see a representative
picture. (They were shown a representative avatar, indicating the gender of the randomly
matched partner.) If you can give more correct answers than your matched colleague, you
will earn 150 TL; and 0 TL otherwise. At the end of the games, if this game is drawn, you
will get your payoff from this particular game.
Now, we will ask you an additional question. At this stage, either you or your matched
colleague will have the right to reduce the performance of the other person. This person will
be determined randomly. You need to pay 10 TL in order to reduce the performance of your
match by 1 correct answer. You will have 50 TL, which we will endow you with additionally,
to be used only for this decision. We will then ask you how much of the 50 TL you would
like to use to reduce your partner’s performance. We will translate this amount to correct
answers and deduct it from your partner’s total correct answers. The amount you do not
use for this decision (rest of the 50 TL) will remain in your pocket and will be paid to you
at the end of the game. Your decision can change your performance ranking and therefore
your earnings from the first stage. Please enter a number between 0 and 50 in the text box
provided.
Finally, you will try to guess how much your partner spent to reduce your correct answers.
If your guess is within 10 TL more or less, or equal to your partner’s true decision, you will
earn an extra 10 TL for your correct guess. Please enter a number between 0 and 50 in the
text box provided.
65

C.1.3 Trust game
Game 3
In this game, groups of two within departments will be randomly formed, but you will
be re-matched. As before, you will not know who your partner is. (A randomly selected half
of the participants were shown the following sentence, the others were shown nothing of the
sort.) It is also possible that you are matched with your department leader!
One of you will be the Sender and one of you the Receiver. The roles will be randomly
determined by the computer. Each of you is initially endowed with 100 TL. The Sender will
decide how much of his 100 TL he/she wants to send to the Receiver. He/she may choose to
send nothing at all, all of his/her endowment, or some portion of it. The amount determined
by the Sender will be tripled and sent to the Receiver. The Receiver will decide how much of
this amount he/she wants to send back to the Sender. He/she may choose not to return at
all, return all of the amount, or a portion of it. The exact amount returned by the Receiver
will be forwarded to the Sender.
Payoffs will be computed in the following fashion. When computing the Sender ’s payoff,
we will deduct the amount he/she sent from the initial endowment 100 TL, and add the
amount the Receiver sent back. The Receiver, on the other hand, will receive three times
the amount sent by the Sender, in addition to the initial endowment of 100 TL, minus the
amount he/she sends back to the Sender. In this game, you might be assigned to the role of
the Sender or the Receiver, but you will not know your role.
First, we would like you to make the following decision: If you become the Sender in
this game, how much of your 100 TL would you send to the Receiver? If you are randomly
assigned to the role of Sender by the computer, this decision will be valid and your earnings
will be determined with respect to this decision. Remember that, in this game, you might
be selected as the Sender or the Receiver.
We now ask you to indicate your decision if you are chosen as a Receiver. For each
possible indicated amount the Sender may send you, you will choose how much you want
to send back to him/her. If you are randomly selected to be a Receiver, your decisions will
apply, and your earnings will be determined based on your decisions. Remember that, in
this game, you might be selected as the Sender or the Receiver.
66

C.2 Baseline Games
You are going to play three games today. You will able to earn a monetary reward in each
game, which will be determined by your decision, luck, and, in some cases, the decisions of
your department colleagues. One of the games will be selected randomly at the end of the
session, and you will be paid the monetary reward in that selected game. Therefore, it is
important that you pay equal attention to each game. We will send your monetary rewards
in a week in the form of grocery cards.
During the event, please make your own decisions without communicating with your
colleagues. Your personal information and decisions in these games will be anonymous. You
will log in with your unique ID number that was sent to you personally.
C.2.1 Competition Game
Game 1
This game consists of three periods. You will earn different amounts of monetary rewards
in each period. If this game is randomly selected for payment at the end, one of the three
periods will be selected randomly and you will receive your earnings from the selected period.
Each period will last 2 minutes.
Period 1
In this period, you will be asked to calculate the sum of three two-digit numbers in 2
minutes. You will earn 3 TL for every correct answer you give. The more correct answers
you give, the more you earn. You are not allowed to use pen and paper, nor a calculator. A
new question will appear after you have submitted your answer. You will see the number of
correct answers you have given on the screen. Please hit the Start button when ready.
26 + 36 + 53 =
.
Period 2
In this period, you will again be asked to sum 3 two-digit numbers. Groups of three will
be randomly formed within your department. You will not know who your opponents are.
Your payoffs in this period will be determined as follows:
67

• If you give more correct answers than your two department colleagues you are matched
with, you will earn 9 TL for every correct answer.
• Otherwise (if you cannot give more correct answers than your opponents), you will
earn 0 TL.
At the end of this period, you will be asked to guess your rank in your group. If your guess
is correct, you will earn an extra 3 TL. Please hit the Start button when ready.
Period 3
You will perform the same summation task once again for two minutes. In this period,
you will decide how your payoff is calculated: piece-rate (as in period 1) or tournament (as
in period 2). If you pick tournament, your performance will be compared to your opponents’
second-period performance. Please indicate your choice when ready.
C.2.2 Public Goods Game
Game 2
In this game, new groups of three will be randomly formed within your department.
As before, you will not know who else is in your group. Each participant will be endowed
with 30 TL. Using this endowment, you will have the chance to enter a project as a group.
Each participant in the group will decide for himself/herself how much to contribute to the
common pool (project), and each participant’s decision will be confidential. Decisions will
be made simultaneously.
You can contribute any amount between 0 and 30 to the common pool. Payoffs will be
computed as follows:
• We will add up the total amount contributed by the three group members and double
it. This will be your group’s total income from the project.
• This amount will be shared equally between the three group members.
• Your payoff will equal to sum of the amount you get from the project and the remaining
from your initial endowment 30 TL that you did not invest into the project. (Display
an example on the screen.)
68

Please indicate how much of your 30 TL you would like to contribute to the project.
Finally, we will ask you to make a guess on the average contribution of the two other
group members. If your guess is within 5 TL of the true average, you will earn an extra 10
TL. Please write down your guess.
C.2.3 Investment Game
Game 3
In this game, you will be asked to make an investment decision. You will be endowed
with 30 TL from the start. You will decide how to allocate this 30 TL between a risky and
a risk-free option. The money invested in the risky option has a 50% probability of either
increasing by a multiple of 2.5, or being lost. The money invested in the risk-free option
is always retained. Please indicate how much of the 30 TL you would invest in the risky
option.
69

D Survey Items
Instrument ItemsWorkplace Satisfaction To what extent do the following statements describe your thoughts about your company?
(Definitely not True-Not True-Somewhat True-True-Definitely True)I am not able to practice my own profession at this workplace.I am very pleased to have chosen to work at this company.Working in this company inspires me.I think my ideas are valued and my achievements are acknowledged here.Employees get unhappy here due to competition and individualization.I think I am not given enough initiative and decision-making authority here.
Meritocratic Values To what extent do the following statements describe your thoughts about your company?(Definitely not True-Not True-Somewhat True-True-Definitely True)My chances of advancing in my profession and career are very high here.I believe if I work hard and perform well here, I will be promoted very quickly.I don’t believe I’ll be promoted unless I’ve enough connections with executives.Objective and transparent performance criteria are applied in this workplace.
Collegial Department The following statements are related to your department colleagues. Please use the following scale to state your opinion.(Never-Rarely-Sometimes-Often-Always)My department colleagues protect each other against an outside criticism.Those working in this department only think of and work for themselves.Different ideas are discussed extensively within the department.Everyone’s ideas are listened to and taken into consideration in our department.People attack others verbally and with disrespect during departmental meetings.Disputes within the department are resolved in a way that protects the interests of the company.
Behavioral Norms How often do you observe your department colleagues in the following situations?(Never-Rarely-Sometimes-Often-Always)GossipingCriticizing someoneHelping someoneProtecting someone else’s rightsViolating someone’s rightsSpending time on social media (during working hours on matters unrelated to work)Staying silent in situations of injustice
Prescriptive Norms In your opinion, what fraction of your department colleagues think in the following way?(Almost nobody-Around 25% -Around 50%-Around 75% -Almost everybody)It is important to be friendly and treat others nicely.It is crucial to stay out of disputes and quarrels.It is normal to comment on others’ appearance and clothing.It is normal to take credit for a department members success as a group.It is important to speak for our departments demands when needed.Gossiping is bad.We should claim collective responsibility for a group member’s mistakes.It is crucial to trust and to be honest with each other within the department.It is normal and expected to compete with our department colleagues.It is quite normal to help each other with work.
Leader Quality The following statements are related to your your team leader. Please use the following scale to state your opinion.(Never-Rarely-Sometimes-Often-Always)Our department leaders are good listeners.Our department leaders have favorites and they are given favorable treatment.Our department leader is modest and accepts her mistakes.I completely trust our department leader’s professionalism.I receive regular and motivating feedback from my department leader.
COVID-19 Related Social Isolation The following questions have been prepared to determine the effects of the current pandemic on us. Please pick the answer that suits you best.(Strongly Disagree-Disagree-Somewhat Agree-Agree-Strongly Agree)I think working from home is more productive.Lately I feel lonelier than usual.I think I haven’t been communicating well enough with my colleagues lately.I think I haven’t been communicating well enough with my team leader lately.(Yes-No-Do not Drink/Smoke)Do you feel like you have increased your cigarette consumption lately?Do you feel like you have increased your alcohol consumption lately?
70

E Qualitative Analysis
After some informal conversations with a number of currently working and retired profes-
sionals about the difficulties of corporate life, we decided to run a simple survey using a
professional network. We sent out a short survey to 80 professionals. We received responses
from 68 of them, 30 of whom no longer work in the corporate sector. The question was
worded in the following way:
We would like to know the most important challenges one faces when working in corporate
sector as a white-collar professional. Please rank the following options from 1 to 9, with the
most commonly observed challenge taking the value 1, and the least taking the value 9.
1. Long working hours, heavy workload
2. Low pay
3. Fear of not being promoted, not being able to progress
4. Hypercompetition
5. Gossip, poor quality in human relations
6. Feeling unappreciated
7. Language used by leaders
8. Unappreciative leaders
9. Bullying and mobbing by leaders
We then grouped items 4-6 as “toxic relations”, 7-9 as “difficult leaders”. We then
calculated the proportion of people who stated these as top 3 challenges faced in the corporate
life. Figure E.1 presents the results for the full sample (68 professionals), currently working
professionals (38) and retired professionals (30).
71
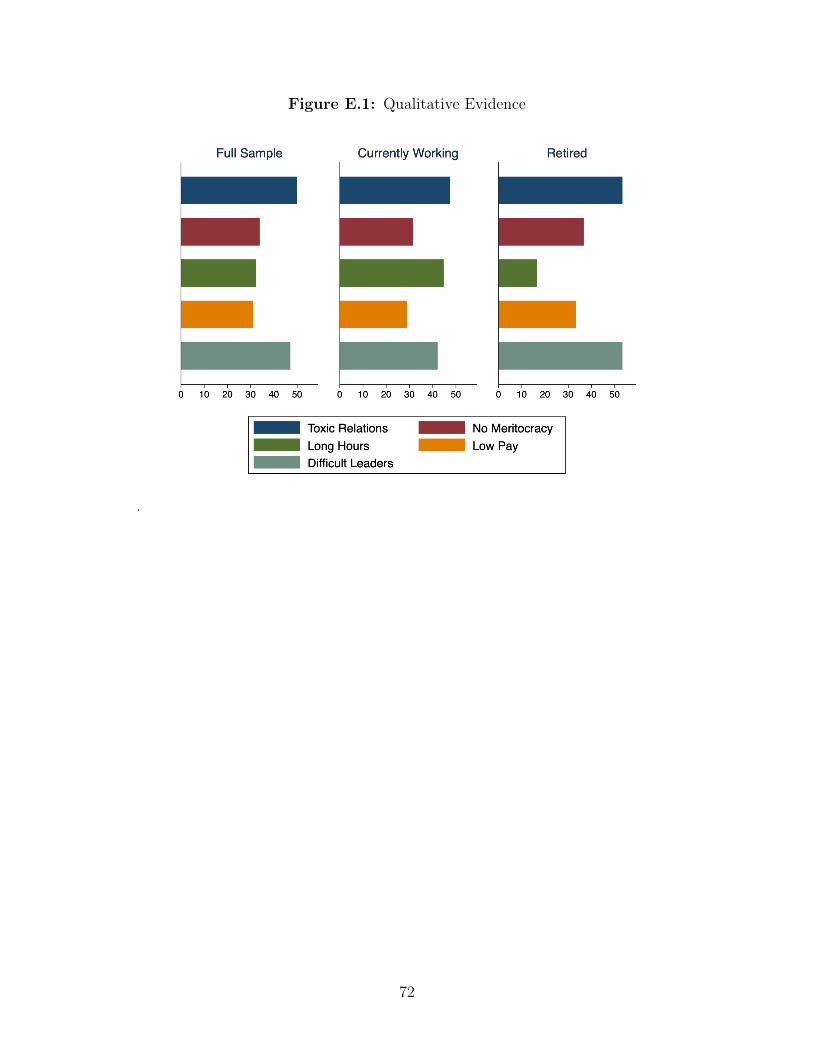
Figure E.1: Qualitative Evidence
.
72