WE ARE REIMAGINING THE FUTURE Bojonegoro Jambi Jember Karawang Kendari Kupang Lampung Lombok Island...
304
CAPITALAND LIMITED Annual Report 2018 REIMAGINING WE ARE THE FUTURE
Transcript of WE ARE REIMAGINING THE FUTURE Bojonegoro Jambi Jember Karawang Kendari Kupang Lampung Lombok Island...

CAPITALAND LIMITEDAnnual Report 2018
REIMAGININGWE ARE
THE FUTURE

Artist‘s impression of Raffles City Chongqing in China
Disclaimer:The image on the cover is for aesthetic purpose only. Cyclists are discouraged from using virtual reality headsets while cycling on the roads and other areas which may pose dangers to themselves and other users.
REAL ESTATE REIMAGINEDAt CapitaLand, we view the world with childlike awe, excited by the wonderful things we see. New opportunities are everywhere, waiting to be developed.
CapitaLand is reimagining the future of realestate—creating unique environments that enrich people’s lives. We have the passion, innovation and vision to turn promising possibilities into long-term growth. For us. Our customers. And our shareholders.
Any discrepancies in the tables and charts between the listed figures and totals thereof are due to rounding. Where applicable, figures and percentages are rounded to one decimal place.
CONTENTSOVERVIEW06 Global Presence 08 2018 Highlights 09 Significant Scale Achieved 10 5-Year Financial Summary 11 Group Business Structure 12 Message to Shareholders 20 2018 Year in Brief
CORPORATE GOVERNANCE & TRANSPARENCY22 Board of Directors 30 Senior Management 37 Corporate Governance 70 Enterprise Risk Management74 Investor & Media Relations 78 Awards & Accolades
SUSTAINABILITY82 Sustainability Management
BUSINESS REVIEW90 Performance Overview 97 CapitaLand Singapore, Malaysia & Indonesia 99 CapitaLand China 101 CapitaLand Vietnam102 CapitaLand International103 Retail105 Commercial106 Lodging 107 Investment Management
PORTFOLIO DETAILS108 Integrated Developments111 Shopping Malls 113 Lodging - Serviced Residences118 Lodging - Multifamily119 Commercial 120 Self Storage 121 Residential
FINANCIALS & ADDITIONAL INFORMATION125 Financial Statements 289 Economic Value Added Statement 290 Value Added Statement 291 Supplemental Information 298 Shareholding Statistics Corporate Information
CORPORATE PROFILECapitaLand Limited (CapitaLand) is one of Asia’s largest real estate companies. Headquartered and listed in Singapore, it is an owner and manager of a global portfolio worth over S$100 billion as at 31 December 2018, comprising integrated developments, shopping malls, lodging, offices, homes, real estate investment trusts (REITs) and funds. CapitaLand’s market capitalisation is approximately S$13 billion as at 31 December 2018. Present across more than 180 cities in over 30 countries, the Group focuses on Singapore and China as core markets, while it continues to expand in markets such as Vietnam, Europe and the U.S..
CapitaLand’s competitive advantage is its significant asset base and extensive market network. Coupled with strong design, development and operational capabilities, the Group develops and manages high-quality real estate products and services. It also has one of the largest investment management businesses in Asia and a stable of five REITs listed in Singapore and Malaysia – CapitaLand Mall Trust, CapitaLand Commercial Trust, Ascott Residence Trust, CapitaLand Retail China Trust and CapitaLand Malaysia Mall Trust.
Cap
itaL
and
Lim
ited
Ann
ual R
epor
t 20
18
1

OUR VISIONTo be a leading global enterprise that enriches people and communities through high-quality real estate products and services.
OUR MISSIONCustomers: We create great customer value and experiences through high-quality products and services.
People: We develop high-performing people and teams through rewarding opportunities.
Investors: We deliver sustainable shareholder returns and build a strong global network of capital partners.
Communities: We care for and contribute to the economic, environmental and social development of communities.
OUR CORE VALUESRespect: We believe in mutual trust and respect at all levels. This is fundamental to a high-performance culture that embraces diversity and teamwork as One CapitaLand.
Integrity: We embrace the highest standards of integrity. We have the courage to do what is right, and earn the trust of all our stakeholders.
Creativity: We constantly innovate to enhance value and stay ahead.
Excellence: We pursue excellence and persevere in everything we do.
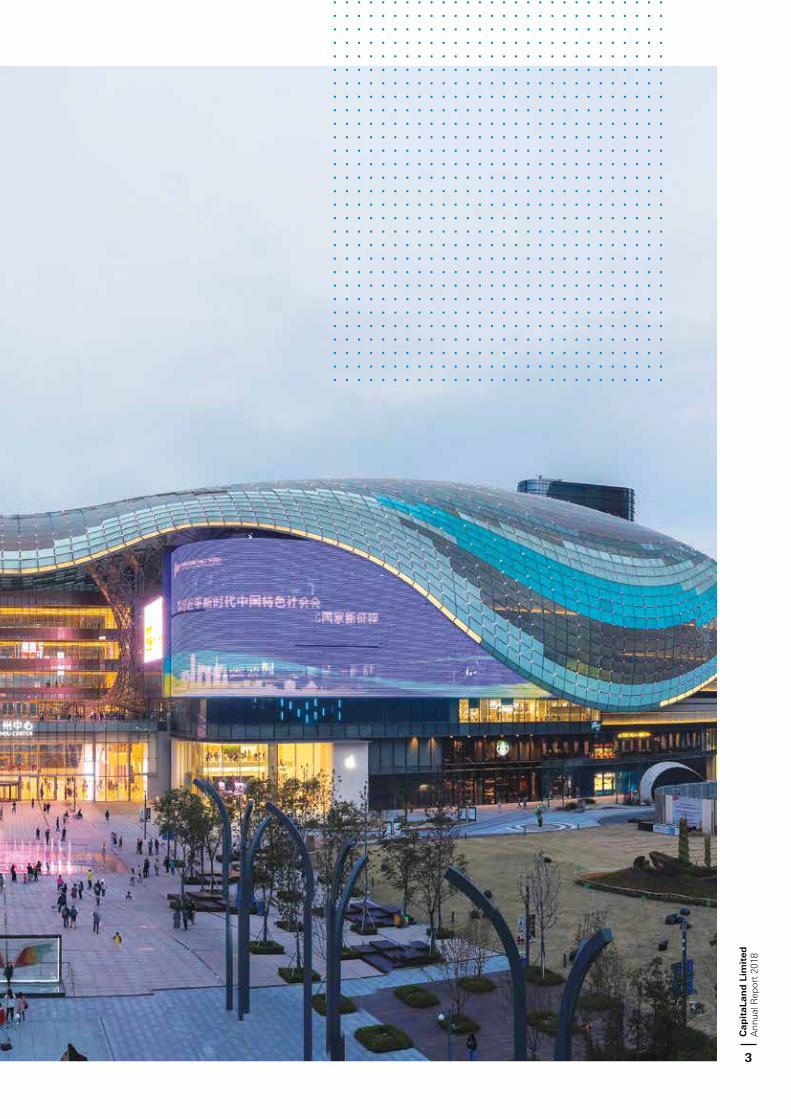
Suzhou Center Mall, China
Cap
itaL
and
Lim
ited
Ann
ual R
epor
t 20
18
2
Cap
itaL
and
Lim
ited
Ann
ual R
epor
t 20
18
3

VISIONGUIDES OUR FUTURE.In 2018, CapitaLand continued to build its global
presence, guided by its vision of becoming a
leading global enterprise in real estate products
and services. Acquisitions helped fill our
development pipeline beyond Singapore and
China. And we expanded into the deep, scalable
U.S. multifamily asset class—extending our
global investment portfolio and creating value
for our stakeholders.
Group ManagedReal Estate Assets1
S$100.1billion
Return onEquity
9.3%
1 Refers to value of all real estate managed by CapitaLand Group entities stated at 100% of the property carrying value.


United States of America
GLOBALPRESENCEAs at 31 December 2018
NORTH AMERICAUnited States of America Aurora Corona Denver Everett Kirkland Lacey Lakewood Milwaukie New York Portland Sunnyvale
ASIA PACIFIC Australia Adelaide Brisbane Canberra Darwin Hobart Melbourne Perth Sydney
Cambodia Phnom Penh
Wuhan Wuhu Wuxi Xiamen Xi’an Xuzhou Yichang Yinchuan Zhengzhou Zhongxiang Zhuhai Zibo Zigong
FijiSuva
India Bangalore Chennai Gurgaon Hyderabad Jalandhar Mumbai Nagpur Sri City
Indonesia Ambon Bali Balikpapan Bandung Bangka Island Banjarmasin Banyuwangi Batam Bogor Bojonegoro Cikarang Cilacap Jakarta Jambi Jember Karawang Kendari Kupang Lampung Lombok Island
China Beijing Changsha Chengdu Chifeng Chongqing Dalian Dongguan Duolun Foshan Guangyuan Guangzhou Haikou Handan Hangzhou Harbin Hefei Hohhot Honghezhou Hong Kong Hotan Huanggang Huizhou Huzhou Kunming Kunshan Lechang Leshan Lishui Macau Macheng Maoming Mianyang Mianzhu Nanjing Nantong Ningbo Pu'er Qingdao Qingyuan Rizhao Shanghai Shangluo Shaoxing Shenyang Shenzhen Suzhou Tianjin
Madiun Makassar Malang Manado Medan Padang Palangkaraya Palembang Pekanbaru Pontianak Samarinda Semarang Solo Sukabumi Surabaya Tanjung Pandan Tanjung Pinang Ungaran Yogyakarta
Japan Fukuoka Funabashi Hiroshima Kobe Kyoto Nagoya Osaka Saitama Sapporo Tokyo
INDICATORS
Integrated Developments
Shopping Malls
Lodging
Offices
Homes
Investment Management
Raffles City Developments
CapitaLand Hope Schools
31Countries
210Cities including 21 cities with
CapitaLand Hope Schools
Cap
itaL
and
Lim
ited
Ann
ual R
epor
t 20
18
6
OVERVIEW

JapanSouth Korea
ThailandIndia
China
Saudi Arabia
Qatar
Bahrain
Spain
United Kingdom
Ghana
New Zealand
Ireland
France Germany
Belgium
Turkey
Georgia
Oman
United Arab Emirates
Myanmar
Laos
Cambodia
Vietnam Philippines
Malaysia
Singapore
Indonesia
Australia
Fiji
Singapore Singapore
South Korea Busan Jeju Seoul
Thailand Bangkok Pattaya Sri Racha
Vietnam Binh Duong Danang Hai Phong Halong City Hanoi Ho Chi Minh City Hung Yen Nha Trang Tan An Viet Tri
AFRICA Ghana Accra
EUROPE Belgium Brussels
Laos Vientiane
Malaysia Cyberjaya Iskandar Puteri Kota Kinabalu Kuala Lumpur Kuantan Kuching Melaka Miri Penang Petaling Jaya Putrajaya Shah Alam
Myanmar Yangon
New ZealandAuckland Christchurch Wellington
Philippines Bacolod Cebu Davao Iloilo Manila Quezon City
France Cannes Grenoble Lille Lyon Marseille Montpellier Nantes Paris Strasbourg Toulouse
Georgia Tbilisi
Germany Berlin Frankfurt Hamburg Munich
Ireland Dublin
Spain Barcelona
United Kingdom Liverpool London
GULF COOPERATION COUNCIL COUNTRIES AND OTHERS Bahrain Manama
Oman Muscat
Qatar Doha
Saudi Arabia Abha Al Khobar Jeddah Makkah Riyadh
Turkey Istanbul
United Arab Emirates Abu Dhabi Dubai
Cap
itaL
and
Lim
ited
Ann
ual R
epor
t 20
18
7
OVERVIEW

2018HIGHLIGHTS
GROUP MANAGEDREAL ESTATE ASSETS
S$100.1billion
S$88.8 billion in 2017
PROFIT ATTRIBUTABLE TO SHAREHOLDERS
S$1,762.5million
Increased 12% YoY
OPERATING PATMI
S$872.2million
Decreased 6% YoY
NET TANGIBLE ASSETSPER SHARE
S$4.40 S$4.20 in 2017
DIVIDEND PER SHARE
12 cents 12 cents in 2017
NET DEBT TO EQUITY
0.56 times Up from 0.49 times
in 2017
RETURN ON EQUITY
9.3% Up from 8.6% in 2017
EARNINGS BEFORE INTEREST & TAX
S$4,145.0million
Increased 26% YoY
Cap
itaL
and
Lim
ited
Ann
ual R
epor
t 20
18
8
OVERVIEW

SIGNIFICANTSCALE ACHIEVED
REVENUE UNDER MANAGEMENT
S$8.9billion
of which Rental RUM is S$5.2 billion
TOTAL HOME UNITS CONSTRUCTED (SINCE 2000)
~98,000
OFFICE TENANTS
~1,700
GROSS TURNOVER SALES OF RETAILERS
S$11.4billion
SHOPPER TRAFFIC IN OUR MALLS
~1.2 billion
RETAIL LEASES
>15,000
UNIQUE SERVICED RESIDENCE CUSTOMERS
>1.3 million
Cap
itaL
and
Lim
ited
Ann
ual R
epor
t 20
18
9
OVERVIEW

5-YEAR FINANCIALSUMMARY
2018 20171 2016 2015 2014
(A) INCOME STATEMENT (S$ million)
Revenue 5,602.4 4,618.2 5,252.3 4,761.9 3,924.6
Earnings before interest and tax (EBIT) 4,145.0 3,302.2 2,359.5 2,316.0 2,436.9
Profit attributable to shareholders (PATMI) 1,762.5 1,569.6 1,190.3 1,065.7 1,160.8
Operating PATMI 872.2 927.2 865.3 823.6 705.3
(B) BALANCE SHEET (S$ million)
Investment properties 39,446.0 36,479.4 18,998.4 19,427.5 17,149.2
Development properties for sale and stocks 5,128.6 3,977.0 4,837.1 6,936.3 7,673.7
Associates and joint ventures 10,179.6 10,205.4 12,617.3 12,858.1 12,780.9
Cash and cash equivalents 5,059.8 6,105.3 4,792.6 4,173.3 2,749.4
Other assets 4,833.6 4,772.1 4,495.4 3,657.4 3,760.3
Total assets 64,647.6 61,539.2 45,740.8 47,052.6 44,113.5
Equity attributable to owners of the Company 18,952.7 18,412.9 17,604.8 17,905.3 16,758.0
Total borrowings 23,633.9 21,694.9 14,852.4 16,058.5 15,985.8
Non-controlling interests and other liabilities 22,061.0 21,431.4 13,283.6 13,088.8 11,369.7
Total equities & liabilities 64,647.6 61,539.2 45,740.8 47,052.6 44,113.5
(C) FINANCIAL RATIOS
Earnings per share (cents) 42.1 37.0 28.0 25.0 27.3
Net tangible assets per share (S$) 4.40 4.20 4.05 4.11 3.83
Net asset value per share (S$) 4.55 4.34 4.15 4.21 3.94
Return on equity (%) 9.3 8.6 6.6 6.1 7.1
Return on total assets (%) 5.6 5.4 4.4 4.4 5.1
Debt equity ratio (net of cash) (times) 0.56 0.49 0.41 0.48 0.57
Net debt/Total assets (net of cash) (times) 0.31 0.28 0.25 0.28 0.32
Interest cover (times) 8.3 8.6 6.5 6.1 7.2
Interest service (times) 4.4 6.7 10.3 6.7 4.6
Dividend
Ordinary dividend per share (cents) 12.0 12.0 10.0 9.0 9.0
Dividend cover (times) 3.5 3.1 2.8 2.8 3.0
1 Comparatives for 2017 have been restated to take into account the retrospective adjustments relating to SFRS(I) 15 Revenue for Contracts with Customers.
Cap
itaL
and
Lim
ited
Ann
ual R
epor
t 20
18
10
OVERVIEW

GROUP BUSINESSSTRUCTURE
COUNTRY OFFICES (INVESTOR & DEVELOPER) & REITS# (INVESTOR)
ROLES Asset owner Development work (including
residential & integrated developments) New investments
+ Singapore, Malaysia & Indonesia (SMI) – comprises CapitaLand Singapore, CapitaLand Malaysia & CapitaLand Indonesia
* International – includes CapitaLand Europe, CapitaLand USA, CapitaLand Japan, CapitaLand Australia, CapitaLand India & CapitaLand South Korea
# REITs - CapitaLand Mall Trust (CMT), CapitaLand Commercial Trust (CCT), Ascott Residence Trust (Ascott Reit), CapitaLand Retail China Trust (CRCT) & CapitaLand Malaysia Mall Trust (CMMT)
OPERATINGPLATFORMS
ROLES Property manager/operator Develop strategy to future-proof
products Grow management platform business Support investment on feasibility
studies
FUNDMANAGEMENT
ROLES Fund management Fund origination Investment in new markets
CapitaLand China
CapitaLand Vietnam
CapitaLand International*
CapitaLand Retail
CapitaLand Commercial
The Ascott Limited
CapitaLand Investment
Management
CapitaLand Singapore, Malaysia & Indonesia+
Cap
itaL
and
Lim
ited
Ann
ual R
epor
t 20
18
11
OVERVIEW
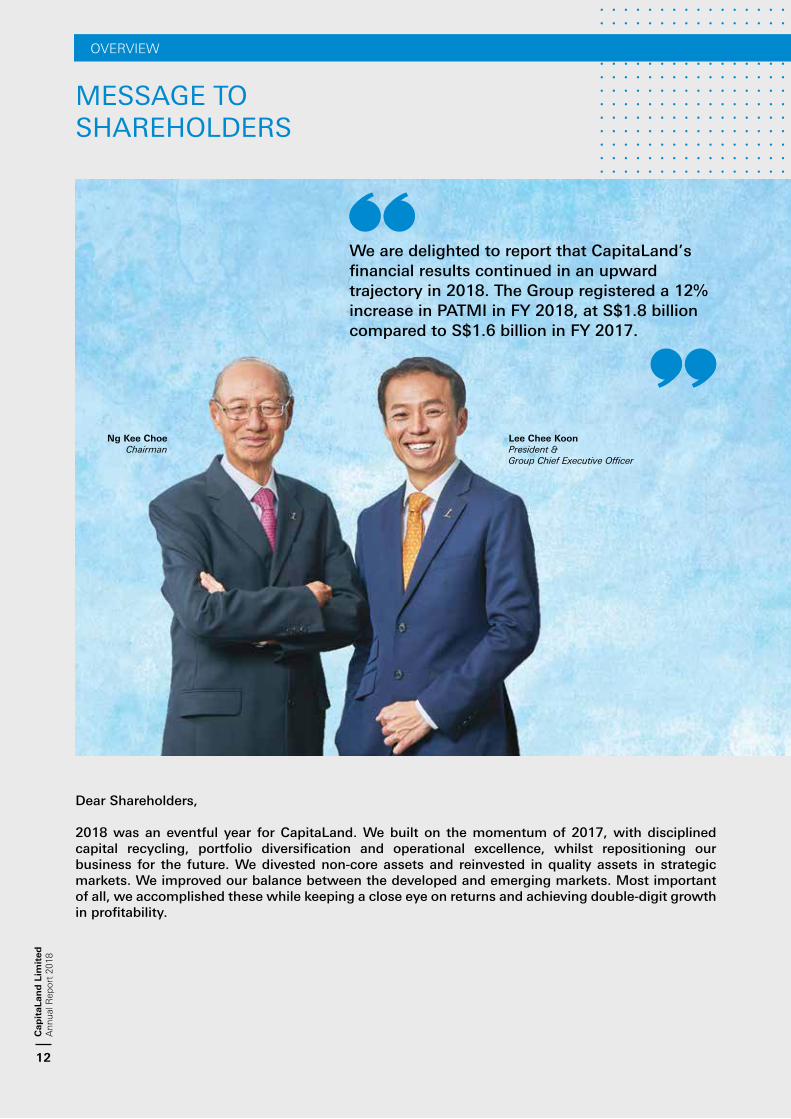
MESSAGE TO SHAREHOLDERS
Dear Shareholders,
2018 was an eventful year for CapitaLand. We built on the momentum of 2017, with disciplined capital recycling, portfolio diversification and operational excellence, whilst repositioning our business for the future. We divested non-core assets and reinvested in quality assets in strategic markets. We improved our balance between the developed and emerging markets. Most important of all, we accomplished these while keeping a close eye on returns and achieving double-digit growth in profitability.
We are delighted to report that CapitaLand’s financial results continued in an upward trajectory in 2018. The Group registered a 12% increase in PATMI in FY 2018, at S$1.8 billion compared to S$1.6 billion in FY 2017.
Ng Kee ChoeChairman
Lee Chee KoonPresident &Group Chief Executive Officer
Cap
itaL
and
Lim
ited
Ann
ual R
epor
t 20
18
12
OVERVIEW

FINANCIAL SCORECARD FOR 2018We are delighted to report that CapitaLand’s financial results continued in an upward trajectory in 2018. The Group registered a 12% increase in PATMI in Financial Year (FY) 2018, at S$1.8 billion compared to S$1.6 billion in FY 20171. The Group’s higher profits were underpinned by broad based improvements across our businesses. This was mainly attributed to higher contributions from residential projects in China and Vietnam, higher recurring income from our investment properties, and gains from asset recycling and revaluation of investment properties.
Our cash PATMI2 of S$1.2 billion makes up approximately 69% of the total PATMI for FY 2018, reflecting the high quality of our income. For FY 2018, the Board is proposing a final ordinary dividend of 12 Singapore cents a share, with a cash payout of S$499.5 million on which translates to approximately 40% of our cash PATMI for FY 2018. Finally, we also delivered an improved ROE of 9.3%, which is above our cost of equity for the financial year. This is 0.7 percentage point higher than the ROE for FY 2017 and 2.7 percentage point higher than for FY 2016.
FINANCIAL PRUDENCE AND SOUNDNESSThe Group proactively manages its balance sheet and capital requirements, to achieve financial prudence and soundness, and to support growth.
As at 31 December 2018, our consolidated cash balance stood at S$5.1 billion, backed by a further S$2.9 billion of available undrawn bank facilities. In addition, we:
prudently staggered our debt maturity profile which stretches from 2019 to 2027 and beyond, and avoided debt towers. For 2019, the on balance sheet debt due is at a manageable 13.5%;
extended our debt maturity to 3.6 years in 2018 from 3.4 years in 2017;
maintained a high proportion of fixed rate debt to mitigate against potential interest rate hikes. Fixed rate debt accounted for 74% of our total borrowings at year end;
kept our average cost of borrowings low at 3.2% per annum; and
ensured that our debt servicing remains comfortable and prudent, with interest service and interest coverage ratio3 at 4.4 times and 8.3 times respectively.
The Group continued to look into new ways to improve its financial flexibility and resilience. In October 2018, the Group secured a general purpose S$300.0 million sustainability-linked five-year multi-currency facility. The interest rate on this facility may be adjusted downwards, pegged to the Group’s performance against Environment, Sustainability and Governance (ESG) indicators.
The Group continued with its share buyback exercise in 2018, expending a total of S$341.8 million to buy back 95.7 million shares.
A ROADMAP TO SUSTAINABLE RETURNS ABOVE THE COST OF EQUITY Our ROE has improved to 9.3% in FY 2018 from 8.6% in FY 2017 and 6.6% in FY 2016. CapitaLand is committed to delivering returns higher than the cost of equity across cycles. Towards this end, we focus on four key components as follows:
Achieving Resilient Operating Income Through A 20:80 Asset Allocation Between Trading And Investment PropertiesThe Group derives its income from two main sources: trading income from the sale of residential properties, and rental income from investment properties. We plan to have a 20:80 asset allocation between trading and investment properties. The latter will underpin a recurring and stable income for the Group while the former, though more cyclical and lumpier, provides higher returns generally.
1 FY 2017 results restated to take into account the retrospective adjustments relating to SFRS(I) 15 Revenue from Contracts with Customers.
2 The sum of Operating PATMI, portfolio gains and realised revaluation gains. 3 Interest coverage ratio refers to EBITDA / Net Interest Expenses and interest service ratio refers to Operating Cashflow /
Net Interest Paid.
Cap
itaL
and
Lim
ited
Ann
ual R
epor
t 20
18
13
OVERVIEW

MESSAGE TO SHAREHOLDERS
In FY 2018, operating PATMI from residential projects and investment properties was S$872.2 million, accounting for approximately half of the Group’s total PATMI. Recurring income from investment properties which made up approximately 60% of operating PATMI in 2018, has strengthened as more shopping malls and commercial properties came on stream in the second half of 2017 and in 2018 as well.
During the year, the Group replenished and expanded its residential land bank in Singapore, China and Vietnam. In Singapore, we acquired Pearl Bank Apartments which is located near the central business district (CBD) and a government land site at Sengkang. We also acquired sites in Chongqing and Guangzhou in China, and Hanoi and Ho Chi Minh City in Vietnam. As at end 2018, residential properties including land banks made up 21% of total assets on effective share basis, in line with our 20:80 asset allocation.
Active and Disciplined Asset RecyclingActive and disciplined asset recycling is an important part of process to enhance returns and to rejuvenate and rebalance our portfolio. During the year, we divested S$4.0 billion of assets, exceeding our target of S$3.0 billion, and invested S$6.1 billion in residential and investment properties across different countries and asset classes.
Of note, was our divestment of 20 shopping malls in China in the early part of 2018 for S$1.7 billion. The divestment enabled us to rebalance our shopping mall portfolio and to focus on locating our malls in selected city clusters4. The divested malls were located across 19 cities, 14 of which were outside our focus areas. The sale also generated net proceeds of S$660.0 million, and a gain of close to S$78.8 million, for reinvestment.
The new investments include the acquisition of Shanghai’s tallest twin towers in the North Bund area, through a fund managed by us, as well as an operational office building, the Pufa Tower, in Shanghai’s Lujiazui CBD.
Expanding Assets Under Management Expanding Assets Under Management (AUM)5 is an important and integral part of our growth strategy. We will grow our AUM by managing assets jointly owned by us and third parties in joint ventures (JV) or through funds which we have a stake. This capital-efficient and ROE accretive way of owning assets also leverages on our unique operational expertise and platforms, for example, in shopping malls, commercial properties and lodging assets.
Amongst the assets that were acquired in 2018 were:
Gallileo, a Grade A office building in Frankfurt, Germany owned 95% by CCT and 5% by CapitaLand;
The twin towers in North Bund, Shanghai acquired on a 50:50 basis by the Government of Singapore Investment Corporation (GIC) and Raffles City China Investment Partners III (RCCIP III), a fund established and managed by CapitaLand; and
Sale of 70% of Westgate shopping mall to CMT which already owns 30% of the property.
As at end 2018, we managed an AUM of S$100.1 billion, a 13% increase from the S$88.8 billion at end 2017 and surpassing the target of S$100 billion by year 2020.
Achieving Balance across Developed and Emerging MarketsApart from diversification through asset classes and geographies, we aim to achieve a 50:50 balance in developed and emerging markets to better insulate us against volatility through real estate cycles.
Presently, the bulk of the Group’s assets are in the core markets of Singapore and China which together accounted for 80% of total assets. Whilst capturing growth opportunities in China and Vietnam, the Group sought out investments in the developed markets as well. Towards this end, the Group invested S$1.1 billion in the U.S., in a portfolio of 16 multifamily properties which is an attractive and resilient emerging global asset class, complementing our long-stay lodging business.
As a measure of balance, as at end 2018, CapitaLand’s consolidated total assets was split 58:42 in developed versus emerging markets.
4 CapitaLand’s core city clusters in China refers to Tier One and Two locations surrounding Shanghai in the East, Beijing and Tianjin in the North, Chongqing and Chengdu in the West, Guangdong and Shenzhen in the South, and Wuhan in the centre.
5 Refers to CapitaLand’s Group managed real estate assets.
Cap
itaL
and
Lim
ited
Ann
ual R
epor
t 20
18
14
OVERVIEW

OPERATIONAL PERFORMANCE BY ASSET CLASSES Operational excellence is the backbone of our ability to deliver strong recurring income from our investment and managed properties. As at 31 December 2018, we reported solid operational performance across all our asset classes: RETAILApproximately 40% of CapitaLand’s consolidated total assets are in the retail sector. As at 31 December 2018, our core retail markets of China and Singapore reported 23.2% and 1.6% growth in tenant sales respectively compared to 2017, despite the ongoing challenges posed by e-commerce and a muted global retail sentiment. On a same-mall basis, net property income was up by 5.3% and 1.7% year-on-year for China and Singapore respectively. At CapitaLand, we believe in creating spaces and experiences that engage our shoppers beyond the conveniences offered through the strategic locations of our malls. We work hard to ensure that our malls remain relevant to shoppers. This is manifested through high occupancy rates, 99.1% in Singapore, 97.7% in China, 94.0% in Malaysia and 99.3% in Japan, with stable shopper traffic growth year-on-year. In 2018, we opened three shopping malls in China i.e. Shanghai, Beijing and Changsha – locations consistent with our core city strategy in China. In 2019, we will be opening another
seven shopping malls, which includes Jewel Changi Airport and Funan in Singapore as well as Raffles City Chongqing in China. We continue to invest in technology to improve the operational efficiency of our malls and the experience of our customers. Our CapitaStar programme, together with our CapitaVouchers and CapitaCard, have enabled us to engage and understand our customer better. By the end of 2018, our CapitaStar membership crossed the 7.5 million mark.
COMMERCIAL In 2018, we launched the “Office of the Future” strategy aimed at engendering a culture of innovation, promoting talent attraction and retention and optimising cost efficiency for tenants of our office properties. Our strategy integrates conventional and flexible office space which saw us acquiring a 50% stake in The Work Project, an operator known for its design and operational capability. During the year, we also launched CapitaStar@Work, an app which we have developed for our commercial tenants that allow them easier access into our building, allow them to book office facilities and us to alert tenants about engagement activities planned for them. Our intelligent building platform, Deep Blue makes use of equipment and video analytics to save operating costs on chiller plants, as well as to improve surveillance security and optimise the operations of our offices.
Raffles City integrated development in North Bund, Shanghai, China
Cap
itaL
and
Lim
ited
Ann
ual R
epor
t 20
18
15
OVERVIEW

As at 31 December 2018, our primary commercial presence remains in Singapore and China, where occupancy was 99.3% and 92.0% respectively, well above the average occupancy rates in both markets. LODGINGAs at 2018, CapitaLand’s lodging platform has secured over 100,000 units across 170 cities and over 30 countries, against the Year 2020 target of 80,000 units. In the lodging business, scale is a key competitive advantage as it is crucial to “follow” your customers to global destinations as they travel for work and for play. During the year, the Group expanded its global lodging network through selective acquisitions and strategic tie-ups. These include the acquisition of 70% of TAUZIA, a hotel operator in Indonesia, a JV with Huazhu Hotels Group in China to further develop the Citadines brand in China, as well as other partnerships in China, Japan, Indonesia, Thailand and the Philippines.
We are well on track to meeting the revised target of 160,000 units by Year 2023. DIGITALISING CAPITALANDIn 2018, substantial efforts were put into building a robust and agile information technology (IT) infrastructure which has allowed us to digitalise our processes and scale up.
At the corporate level, a group-wide enterprise resource planning (ERP) system was implemented in 2018. This created an integrated platform to allow us to scale up our businesses across geographies and asset classes more efficiently.
As we strengthen our digital capabilities, equally important, we have sharpened our focus on cyber resilience. During the year, we have increased efforts to strengthen our internal cyber security ecosystem. This is an area which we have invested significantly over the years to safeguard the interests of our customers, partners and shareholders.
CONTINUED COMMITMENT TO ESG AND PEOPLE DEVELOPMENTCapitaLand recognises that the long-term success of our business is closely intertwined with the environments and communities we operate in, our adherence to standards of corporate governance, as well as the people that make up CapitaLand. We are a signatory to the United Nations Global Compact (UNGC) and supports its 10 Principles relating to human rights, labour, environment and anti-corruption. Guided by our credo ‘Building People. Building Communities.’, we aspire to be at the forefront of ESG best practices.
MESSAGE TO SHAREHOLDERS
Mr Stephen Lee, Non-Executive Independent Director, receives the Silver Award for Best Managed Board at Singapore Corporate Awards 2018
Cap
itaL
and
Lim
ited
Ann
ual R
epor
t 20
18
16
BUSINESS REVIEW

We are dedicated to attracting talent and developing our employees by inculcating a lifelong learning mindset. We continue to upskill our employees and equip them with future-ready knowledge and skillsets. Our people and desire for continued high performance form the basis to how we drive our ESG efforts. In 2018, the Group won the SkillsFuture Employer Award for championing employee skills development in the real estate sector.
The Nominating Committee’s remit includes recommending code of conduct and board composition, which includes diversity, board and management expertise and forms the bedrock of our business. As a testament to our commitment to corporate governance best practices, we were awarded Silver for the Best Managed Board (for listed companies with S$1 billion and above in market capitalization) at the Singapore Corporate Awards in 2018. We also won the Best Corporate Governance (Singapore) at World Finance‘s Corporate Governance Awards 2018 and the Most Transparent Company Award (Properties) at Securities Investors Association (Singapore)’s (SIAS) 19th Investors‘ Choice Awards.
In 2018, we remained the only company in Singapore which was awarded the Silver Medal by RobecoSAM Sustainability Yearbook 2018. We are also a constituent on recognised sustainability indices such Global 100 Most Sustainable Corporations, Dow Jones Sustainability World Index and Asia Pacific Index, Global Real Estate Sustainability Benchmark (5 Star), FTSE4Good Index Series and MSCI Global Sustainability Indexes.
LEADERSHIP TRANSITIONAs part of succession planning and reflective of our deep bench strength, the Group appointed a new leadership team, led by Mr Lee Chee Koon as President & Group Chief Executive Officer (GCEO) on 15 September 2018 to succeed Mr Lim Ming Yan following his retirement. Mr Lee is supported by an experienced management team that have been instrumental in developing and executing the Group’s growth strategy over the years. The team’s combined competencies and experiences will chart the Group’s next phase of growth.
A HEARTFELT THANK YOUMr Lim Ming Yan retired on 31 December 2018. He served CapitaLand with dedication and distinction for 22 years, including as the Group’s President & GCEO from 2012. The Group has benefitted much from Mr Lim’s many years of service and leadership. We thank Mr Lim for ensuring a smooth transition to the new leadership team. As we bid him farewell, we wish him all the very best in his new endeavours.
Ms Euleen Goh, an independent non-executive board director, will not be seeking re-election at the upcoming Annual General Meeting. Ms Goh has served with distinction on our Board for more than seven years and we have always benefitted from her active engagement, insights and perspectives. The Board and management would like to place on record its appreciation to Ms Goh for her wise counsel and invaluable contributions to CapitaLand. BUILDING A SUSTAINABLE FUTURECapitaLand remains steadfastly committed to be a leading global real estate business based in Singapore. Towards this end, to take us forward into a new era of growth, we have identified a high-quality complementary business in Ascendas-Singbridge, which we have proposed to acquire for a total purchase consideration of S$6.0 billion. You will be receiving a separate circular with the information on our proposed acquisition. Here is a summary of the key benefits of this proposed addition.
This acquisition is transformational for CapitaLand, creating one of Asia’s leading diversified real estate groups.
The portfolio includes new economy asset classes such as logistics / business parks and industrial, which will allow the Group to diversify our product offerings with complementary asset classes.
It will deepen the Group’s presence in our core markets of Singapore and China, as well as add India to the Group’s growth markets of Vietnam, the U.S. and Europe.
CapitaLand will become top ten real estate investment manager globally, as well as the manager of the three largest REITs listed on the Singapore Exchange, namely Ascendas Real Estate Investment Trust, CMT and CCT, allowing us to grow an asset-light, ROE accretive fee business.
We look forward to your continued support as well as the support of our business partners, customers, financiers and other stakeholders for CapitaLand as we look to expand our business. Last but not least, we wish to express our appreciation to our Board members for their active participation in board deliberations and for their guidance, counsel and advice, and to our staff for their dedicated service, efforts and commitment.
Ng Kee ChoeChairman
Lee Chee KoonPresident & GCEO
Cap
itaL
and
Lim
ited
Ann
ual R
epor
t 20
18
17
BUSINESS REVIEW

PASSIONENERGISES OUR BRAND.CapitaLand built its reputation and brand by
developing high-quality real estate products
and services. Driven by a passion to enrich
people and communities, we are always
seeking ways to be better. Whether it is in
the quality of our residential properties or
how we manage our shopping malls, offices
and lodging assets, investors and customers
alike can count on this passion to deliver
consistently improving results.
“Never settle,” we say.

Dividend Per Share
12cents
Profit Attributableto Shareholders
S$1,762.5million

2018 YEAR IN BRIEF
JANUARY The Ascott Limited (Ascott), CapitaLand’s lodging
unit, announced a target to double our global portfolio to 160,000 units by 2023.
Divestment of 20 shopping malls in China, at an agreed value of RMB8,365.0 million (~S$1,705.9 million).
Signed a strategic cooperation memorandum of understanding (MoU) with Wuhan’s Wuchang district government to explore the development of a prime mixed-use site in Wuhan, China.
FEBRUARY Groundbreaking ceremony for CapitaSpring, a
51-storey future-ready integrated development in Singapore.
Acquisition of centrally located Pearl Bank Apartments in Singapore through a private treaty collective sale for S$728.0 million.
MARCH Acquisition of a prime site in Tay Ho district, Hanoi to
build our first integrated development. Second commercial fund in Vietnam, CapitaLand
Vietnam Commercial Value-Added Fund (CVCVF), closed at US$130.0 million (~S$171.0 million).
Signed agreement to manage our first shopping mall in Phnom Penh, Cambodia.
Citadines Bacolod City in Bacolod, the Philippines, slated for opening in 2021
APRIL Launch of StarPay, CapitaStar’s in-app ePayment
service to generate new business opportunities for retailers and enhance convenience for shoppers.
Ascott forged strategic partnerships with leading developers, Riverside Group in China, NTT Urban Development Corporation in Japan and Ananda Development in Thailand to boost our pipeline.
CMT divested Sembawang Shopping Centre in Singapore for S$248.0 million.
Signed two MoUs to explore developing and managing large-scale business park and township projects in Zhejiang Province, China.
Launched D2eight in Ho Chi Minh City, Vietnam, our first landed property project in Vietnam.
MAY Ascott formed a JV with Huazhu Hotels Group and
CJIA Apartments Group, with a target to sign 16,000 units under the Citadines brand in China by 2025.
Codeveloped our first kindergarten – CapitaLand Le Xa Hope Kindergarten in Vietnam, with the local community through participatory design.
Joint acquisition of Gallileo, a freehold Grade A office building in Frankfurt, Germany, valued at €356.0 million (~S$569.6 million) with CCT.
JUNE Clinched two contracts to manage a mall each in
Guangzhou and Chengdu, China. Acquisition of a 32-hectare prime mixed-use site in
Chongqing, China, for RMB5.7 billion (~S$1.2 billion). CCT divested Twenty Anson in Singapore for
S$516.0 million.
D2eight in Ho Chi Minh City, Vietnam
OVERVIEWC
apit
aLan
d L
imit
edA
nnua
l Rep
ort
2018
20

JULY Ascott entered into a strategic alliance with one of
the Philippines’ top real estate developers, Cebu Landmasters Inc., to manage 1,600 units in the country by 2022.
Through our philanthropic arm, CapitaLand Hope Foundation (CHF), we established a $2.0 million CapitaLand Silver Empowerment Fund to assist and empower the vulnerable elderly in Singapore.
AUGUST Acquired two prime residential sites in Guangzhou,
China, for ~RMB2.1 billion (~S$409.3 million). Acquisition of Sengkang Central, a mixed-use
residential and commercial site in Singapore, for S$777.8 million with City Developments Limited.
Divested 70% stake in Westgate, Singapore for S$789.6 million to CMT.
Acquisition of a prime site in Ho Chi Minh City for VND1,380.0 billion (~S$81.4 million) to develop more than 100 landed residential units.
SEPTEMBER Ascott invested US$25.9 million for a 70% stake in
TAUZIA Hotel Management, one of Indonesia’s leading hotel operators, advancing into the middle-class business hotel segment.
Acquisition of a portfolio of 16 multifamily properties (3,787 units) in the U.S. for US$835.0 million (~S$1.1 billion), marking our first foray into the U.S. multifamily sector.
Ascott Reit acquired a prime site at Nepal Hill in Singapore for S$62.4 million to build its first coliving property lyf one-north Singapore.
Opening day of CapitaMall LuOne in Shanghai, China attracted more than 200,000 shoppers.
Topping out ceremony of Funan. The ceremony was graced by Mr Heng Swee Keat, Singapore’s Minister for Finance.
Sengkang Central, a mixed-use residential and commercial site in Singapore
OCTOBER Launch of the ‘Office of the Future’ initiative to
create an ecosystem of workplace solutions that are flexible, innovative, enabled by technology and driven by community needs. This was augmented by our investment of S$27.0 million for a 50% stake in coworking operator, The Work Project.
Secured our first and largest S$300.0 million sustainability-linked loan in Asia’s real estate sector from DBS Bank. The loan is also the largest sustainability-linked bilateral loan in Singapore.
Contributed RMB200,000 (~S$40,000) to CapitaLand Zhongxiang Hope School in Wuhan, Central China during our 26th International Volunteer Expedition through CHF.
NOVEMBER Launched NomadX, Singapore’s first ‘phygital’ multi-
label concept store, at Plaza Singapura. Awarded a 4.7-hectare prime mixed-use site in
Guangzhou, China, for RMB882.0 million (~S$175.2 million) through a government land bid.
Acquired the tallest twin towers in Shanghai, China, for RMB12.8 billion (~S$2.5 billion) through RCCIP III in a 50:50 JV with GIC.
Ascott formed a strategic alliance with Ciputra Development Group (Ciputra), one of Indonesia’s top property developers, to manage serviced residences to be developed by Ciputra in Indonesia and China within the next five years.
DECEMBER Opened two shopping malls in China:
- CapitaMall Tiangongyuan, our eighth and largest mall in Beijing, and
- CapitaMall ONE in Changsha, our first managed mall in Central China.
CapitaMall Tiangongyuan, our eighth and largest shopping mall in Beijing, China
OVERVIEW
Cap
itaL
and
Lim
ited
Ann
ual R
epor
t 20
18
21

BOARD OFDIRECTORS
NG KEE CHOEChairmanNon-Executive Independent Director
LIM MING YANPresident & Group Chief Executive Officer(Until 15 September 2018)Non-Independent Director(Until 31 December 2018)
LEE CHEE KOONPresident & Group Chief Executive Officer(From 15 September 2018)Executive Non-Independent Director(From 1 January 2019)
EULEEN GOH YIU KIANG Non-Executive Independent Director
TAN SRI AMIRSHAM BIN A AZIZNon-Executive Independent Director
STEPHEN LEE CHING YENNon-Executive Independent Director
DR PHILIP NALLIAH PILLAINon-Executive Independent Director
KEE TECK KOONNon-Executive Independent Director
CHALY MAH CHEE KHEONGNon-Executive Independent Director
ANTHONY LIM WENG KINNon-Executive Independent Director
GABRIEL LIM MENG LIANGNon-Executive Independent Director
GOH SWEE CHENNon-Executive Independent Director
Cap
itaL
and
Lim
ited
Ann
ual R
epor
t 20
18
22
CORPORATE GOVERNANCE & TRANSPARENCY

NG KEE CHOE, 74ChairmanNon-Executive Independent Director Bachelor of Science (Honours), University of
Singapore
Date of first appointment as a Director16 April 2010Date of appointment as Chairman1 May 2012Date of last re-appointment as a Director 18 April 2016Length of service as a Director (as at 31 December 2018)8 years 8 months
Board committees served on Executive Resource and Compensation Committee
(Chairman) Strategy, Investment and Finance Committee
(Chairman) Nominating Committee (Member)
Present directorship in other listed company PT Bank Danamon Indonesia, Tbk
(President-Commissioner)
Present principal commitments (other than directorship in other listed company) China Development Bank (Member of the
International Advisory Council) Corporate Governance Advisory Committee
(Member) Fullerton Financial Holdings Pte Ltd (Director) Tanah Merah Country Club (Chairman) Temasek Trustees Pte. Ltd. (Director)
Past directorship in other listed company held over the preceding three years AusNet Services (Chairman)
Background and working experience Vice-Chairman of DBS Group Holdings Ltd (DBS),
retired from his executive position in DBS in July 2003 after 33 years of service
Awards The Distinguished Service Award by the Singapore
National Trades Union Congress in 2013 The Meritorious Service Medal at the Singapore
National Day Awards 2012 The Public Service Star at the Singapore National
Day Awards 2001
LIM MING YAN, 56President & Group Chief Executive Officer (Until 15 September 2018)Non-Independent Director (Until 31 December 2018) Bachelor of Engineering (Mechanical) and Economics
(First Class Honours), University of Birmingham, UK
Date of first appointment as a Director1 January 2013Date of last re-election as a Director18 April 2016Length of service as a Director (as at 31 December 2018)6 years
Present principal commitments Business China (Director) Future Economy Council (Member) Singapore Tourism Board (Member of the Board) Workforce Singapore Agency (Chairman)
Past directorships in other listed companies held over the preceding three years Ascott Residence Trust Management Limited
(Manager of Ascott Residence Trust) (Deputy Chairman) CapitaLand Commercial Trust Management Limited
(Manager of CapitaLand Commercial Trust) (Deputy Chairman) CapitaLand Mall Trust Management Limited
(Manager of CapitaLand Mall Trust) (Deputy Chairman) CapitaLand Retail China Trust Management Limited
(Manager of CapitaLand Retail China Trust) (Deputy Chairman)
Background and working experience President & Group CEO of CapitaLand Limited
(From January 2013 to September 2018) Chief Operating Officer of CapitaLand Limited
(From May 2011 to December 2012) CEO of The Ascott Limited
(From July 2009 to February 2012) CEO of CapitaLand China Holdings Pte Ltd
(From July 2000 to June 2009)
Awards Outstanding Chief Executive (Overseas) at the
Singapore Business Awards 2006 Magnolia Award by the Shanghai Municipal
Government in 2003 and 2005
Cap
itaL
and
Lim
ited
Ann
ual R
epor
t 20
18
23
CORPORATE GOVERNANCE & TRANSPARENCY

BOARD OFDIRECTORS
LEE CHEE KOON, 44President & Group Chief Executive Officer (From 15 September 2018)Executive Non-Independent Director(From 1 January 2019) Bachelor of Science in Mechanical Engineering
(First Class Honours), National University of Singapore Master of Science in Advanced Mechanical
Engineering (Distinction), Imperial College London, UK
Date of first appointment as a Director1 January 2019
Present directorships in other listed companies Ascott Residence Trust Management Limited
(Manager of Ascott Residence Trust) CapitaLand Commercial Trust Management Limited
(Manager of CapitaLand Commercial Trust) CapitaLand Retail China Trust Management Limited
(Manager of CapitaLand Retail China Trust)
Present principal commitments (other than directorships in other listed companies) EDBI Pte Ltd (Director) Lifelong Learning Endowment Fund Advisory
Council (Member) SkillsFuture Singapore Agency (Director) Temasek Foundation Nurtures CLG Limited (Director)
Background and working experience Group Chief Investment Officer of CapitaLand Limited
(From 1 January 2018 to 14 September 2018) CEO of The Ascott Limited
(From June 2013 to December 2017) Deputy CEO of The Ascott Limited
(From February 2012 to May 2013) Managing Director, North Asia of The Ascott Limited
(From July 2009 to May 2013) Vice President, Office of the President of
CapitaLand Limited (From February 2007 to June 2009) Head, International Relations &
Economic Strategy of Ministry of Finance (From November 2003 to January 2007) Senior Assistant Director, Trade Directorate of
Ministry of Trade and Industry (From November 2001 to November 2003)
Awards Business China Young Achiever Award in 2017 National Order of Merit (Chevalier de l’Ordre National
du Mérite) in 2016
EULEEN GOH YIU KIANG, 64 Non-Executive Independent Director Fellow, Institute of Singapore Chartered Accountants Associate, Institute of Chartered Accountants
in England and Wales Associate, London Institute of Banking and Finance Member, Chartered Institute of Taxation, UK Fellow, Singapore Institute of Directors
Date of first appointment as a Director1 October 2011Date of last re-election as a Director 24 April 2017Length of service as a Director (as at 31 December 2018)7 years 3 months
Board committees served on Strategy, Investment and Finance Committee
(Member) Risk Committee (Member)
Present directorships in other listed companies DBS Group Holdings Ltd Royal Dutch Shell plc SATS Ltd (Chairman)
Present principal commitments (other than directorships in other listed companies) DBS Bank Ltd (Director) DBS Foundation Ltd (Chairman) Singapore Health Services Pte Ltd (Director) Singapore Institute of Management
(Chairman of Governing Council) Temasek Trustees Pte Ltd (Director)1
Background and working experience CEO of Standard Chartered Bank, Singapore
(From 2001 to March 2006) Various senior management positions in Standard
Chartered Bank, retired in March 2006 after some 21 years with the bank
Awards The Public Service Star at the Singapore National
Day Awards 2012 Her World Woman of the Year 2005 The Public Service Medal at the Singapore National
Day Awards 2005
1 Stepping down on 1 April 2019
Cap
itaL
and
Lim
ited
Ann
ual R
epor
t 20
18
24
CORPORATE GOVERNANCE & TRANSPARENCY

TAN SRI AMIRSHAM BIN A AZIZ, 68Non-Executive Independent Director Bachelor of Economics (Honours),
University of Malaya, Malaysia Certified Public Accountant
Date of first appointment as a Director30 July 2012Date of last re-election as a Director30 April 2018Length of service as a Director (as at 31 December 2018)6 years 5 months
Board committees served on Audit Committee (Member) Risk Committee (Chairman)
Present principal commitments Financial Services Talent Council (Chairman) Glenealy Plantations Sdn Bhd (Director) Petroliam Nasional Berhad (Director) RAM Holdings Berhad (Chairman) Themed Attractions Resorts & Hotels Sdn Bhd
(Chairman) Wearnes-StarChase Limited (Director)
Past directorship in other listed company held over the preceding three years Bursa Malaysia Berhad (Chairman)
Background and working experience President & CEO of Malayan Banking Berhad
(From 1994 to 2008) Minister in the Malaysian Prime Minister’s
Department heading the Economic Planning Unit and Department of Statistics, Malaysia (From March 2008 to April 2009)
Chairman of the Malaysian National Economic Advisory Council (From June 2009 to May 2011)
Awards Global Hall of Fame by the International Association
of Outsourcing Professionals 2009 Asian Bankers Lifetime Achievement Award 2008
DR PHILIP NALLIAH PILLAI, 71Non-Executive Independent Director Bachelor of Laws (First Class Honours),
University of Singapore LLM (Master of Laws) & SJD
(Doctor of Juridical Sciences), Harvard Law School, USA Advocate & Solicitor, Singapore Solicitor, England & Wales
Date of first appointment as a Director25 April 2014Date of last re-election as a Director 24 April 2017Length of service as a Director (as at 31 December 2018)4 year 8 months
Board committees served on Audit Committee (Member) Nominating Committee (Member)
Present directorship in other listed company Hotung Investment Holdings Limited
Present principal commitments (other than directorship in other listed company) Inland Revenue Authority of Singapore (Director) SMRT Corporation Ltd (Director) SMRT Trains Ltd. (Director)
Background and working experience Judge of the Supreme Court of Singapore
(From June 2010 to December 2012) Judicial Commissioner
(From October 2009 to June 2010) Member of the Legal Service Commission
(From 2007 to 2013) Joint Managing Partner, Allen & Overy,
Shook Lin & Bok JLV (From 2000 to 2008) Partner and Managing Partner,
Shook Lin & Bok, Singapore (From 1986 to 2009) Over 23 years experience in legal practice specialised
in corporate, corporate finance and securities law
Award The Public Service Medal at the Singapore National
Day Awards 2003
Cap
itaL
and
Lim
ited
Ann
ual R
epor
t 20
18
25
CORPORATE GOVERNANCE & TRANSPARENCY

BOARD OFDIRECTORS
STEPHEN LEE CHING YEN, 72Non-Executive Independent Director Master of Business Administration,
Northwestern University, USA
Date of first appointment as a Director1 January 2013Date of last re-election as a Director18 April 2016Length of service as a Director (as at 31 December 2018)6 years
Board committees served on Executive Resource and Compensation Committee
(Member) Nominating Committee (Chairman)
Present principal commitments Council of Presidential Advisers (Member) Dr Goh Keng Swee Scholarship Fund
(Board Member) G2000 Apparel (S) Private Limited (Director) Great Malaysia Textile Investments Pte Ltd
(Managing Director) Kidney Dialysis Foundation (Director) M+S Pte. Ltd. (Deputy Chairman) Marina South Investments Pte. Ltd. (Director) MS Property Management Pte. Ltd. (Director) NTUC Enterprise Co-Operative Limited (Director) NTUC-ARU (Administration & Research Unit)
(Member of the Board of Trustees) Ophir-Rochor Investments Pte. Ltd. (Director) Shanghai Commercial Bank Ltd (Chairman) Shanghai Commercial & Savings Bank Limited
(Managing Director) Singapore Labour Foundation (Director) Singapore University of Social Sciences (Chancellor) Temasek Holdings (Private) Limited (Director) Tripartite Alliance Limited (Chairman)
Past directorships in other listed companies held over the preceding three years Singapore Airlines Limited (Chairman) SIA Engineering Company Limited (Chairman)
Background and working experience Chairman of NTUC Income Insurance Co-operative
Limited (From 2014 to 2018) Chairman of SIA Engineering Company Limited
(From 2005 to 2018) Chairman of Singapore Airlines Limited
(From 2006 to 2016) Chairman of International Enterprise Singapore
(From 1995 to 2002) Chairman/Advisor of PSA International Pte Ltd
(From 2002 to 2005) Chairman of Singapore Business Federation
(From 2002 to 2008) President of Singapore National Employers
Federation (From 1988 to 2014)
Awards The Order of Nila Utama (First Class) at the
Singapore National Day Awards 2015 The Distinguished Comrade of Labour Award by the
Singapore National Trade Union Congress in 2015 The Distinguished Service Order at the Singapore
National Day Awards 2006 The Public Service Star at the Singapore National
Day Awards 1998
Cap
itaL
and
Lim
ited
Ann
ual R
epor
t 20
18
26
CORPORATE GOVERNANCE & TRANSPARENCY

KEE TECK KOON, 62Non-Executive Independent Director Bachelor of Arts, University of Oxford, UK Master of Arts, University of Oxford, UK
Date of first appointment as a Director22 September 2014Date of last re-election as a Director 30 April 2018Length of service as a Director (as at 31 December 2018)4 year 3 months
Board committees served on Executive Resource and Compensation Committee
(Member) Strategy, Investment and Finance Committee
(Member)
Present directorship in other listed company Raffles Medical Group Ltd
Present principal commitments (other than directorship in other listed company) Changi Airports International Pte Ltd (Chairman) Fullerton Fund Management Company Ltd (Director) FFMC Holdings Pte. Ltd. (Director) Lien Foundation (Director) Mandai Park Holdings Pte. Ltd. (Director) NTUC Enterprise Co-operative Limited
(Executive Director) NTUC Income Insurance Co-operative Limited
(Deputy Chairman)
Background and working experience Retired from his executive positions in CapitaLand
Group in July 2009 after 13 years of service
CHALY MAH CHEE KHEONG, 63Non-Executive Independent Director Bachelor of Commerce,
University of Melbourne, Australia Associate, Institute of Chartered Accountants, Australia Fellow, Certified Practising Accountants, Australia Fellow, Institute of Singapore Chartered Accountants
Date of first appointment as a Director1 February 2017Date of last re-election as a Director24 April 2017Length of service as a Director (as at 31 December 2018)1 year 11 months
Board committees served on Audit Committee (Chairman) Risk Committee (Member)
Present directorship in other listed company Netlink NBN Management Pte Ltd
(Manager of Netlink NBN Trust) (Chairman)
Present principal commitments (other than directorship in other listed company) Asian Infrastructure Investment Bank
(External Member of Audit Committee) Flipkart Private Limited (Director) Monetary Authority of Singapore (Director) National University of Singapore
(Member of the Board of Trustees) National University of Singapore Business School
Accounting Advisory Board (Chairman) Singapore Accountancy Commission (Chairman) Singapore Economic Development Board (Director) Singapore Tourism Board (Chairman)
Background and working experience CEO of Deloitte Asia Pacific, Chairman of Deloitte
Singapore, Member of the Deloitte Global Executive, and Deloitte Global Board (Vice Chairman), retired in May 2016 after some 38 years with Deloitte
Award The Public Service Medal at the Singapore National
Day Awards 2014
Cap
itaL
and
Lim
ited
Ann
ual R
epor
t 20
18
27
CORPORATE GOVERNANCE & TRANSPARENCY

BOARD OFDIRECTORS
GABRIEL LIM MENG LIANG, 43Non-Executive Independent Director Bachelor of Arts in Economics,
University of Cambridge, UK Master of Science in Economics,
London School of Economics, UK Master of Science in Management,
University of Stanford, USA
Date of first appointment as a Director11 August 2017Date of last re-election as a Director 30 April 2018Length of service as a Director (as at 31 December 2018)1 year 5 months
Board committees served on Audit Committee (Member) Risk Committee (Member)
Present principal commitments Civil Service College (Director) Ministry of Trade and Industry
(Permanent Secretary)1
National Healthcare Group Pte Ltd (Director) National Research Foundation (Director) Singapore Innovate Pte. Ltd. (Director) St. Joseph’s Institution International Ltd
(Member of the Board of Governors) St. Joseph’s Institution International Elementary
School Ltd (Member of the Board of Governors)
Background and working experience Permanent Secretary, Ministry of Trade and Industry1
Served in the Ministry of Communications and Information, Infocomm Development Authority of Singapore, Media Development Authority of Singapore, the Prime Minister’s Office, Ministry of Defence and Ministry of Health
1 Effective from 1 April 2019
ANTHONY LIM WENG KIN, 60Non-Executive Independent Director Bachelor of Science, National University of Singapore Advanced Management Program,
Harvard Business School, USA
Date of first appointment as a Director11 August 2017Date of last re-election as a Director 30 April 2018Length of service as a Director (as at 31 December 2018)1 year 5 months
Board committee served on Strategy, Investment and Finance Committee
(Member)
Present principal commitments Institute of International Education, Scholar Rescue
Fund Selection Committee (Member) Teach For All Global Advisory Council (Member)
Past directorship in other listed company held over the preceding three years Vista Oil & Gas S.A.B. de C.V.
Background and working experience President (Americas) of GIC Pte Ltd (GIC), retired
from GIC in 2017 after 19 years of service
Cap
itaL
and
Lim
ited
Ann
ual R
epor
t 20
18
28
CORPORATE GOVERNANCE & TRANSPARENCY

GOH SWEE CHEN, 58Non-Executive Independent Director Bachelor of Science in Information Science,
Victoria University of Wellington, NZ Master of Business Administration,
University of Chicago, USA
Date of first appointment as a Director1 September 2017Date of last re-election as a Director 30 April 2018Length of service as a Director (as at 31 December 2018)1 year 4 months
Board committee served on Executive Resource and Compensation Committee
(Member)
Present directorship in other listed company Singapore Airlines Limited
Present principal commitments (other than directorship in other listed company) Global Compact Network Singapore (President) Human Capital Leadership Institute Pte. Ltd.
(Director) Institute of Human Resource Professionals Limited
(Chairman) Legal Service Commission (Member) National Arts Council (Council Member) Singapore University of Technology and Design
(Director) The Centre for Liveable Cities
(Advisory Board member)
Background and working experience Chairman, Shell Singapore, retired in January 2019
after 16 years of service Chairman/Deputy Chairman of Shell Downstream
Joint Ventures in China, Saudi Arabia and Korea (From 2011 to 2017)
Headed Shell’s IT Services globally (From 2004 to 2009)
Award Distinguished Alumni Award, Chicago Booth,
University of Chicago, USA 2018
Cap
itaL
and
Lim
ited
Ann
ual R
epor
t 20
18
29
CORPORATE GOVERNANCE & TRANSPARENCY

SENIORMANAGEMENT
1st row - seated, left to right: Mr Lee Chee Koon, Mr Jason Leow, Mr Lucas Loh, Mr Andrew Lim, Mr Tan Seng Chai2nd row - standing, left to right: Ms Lynette Leong, Mr Gerald Yong, Mr Wilson Tan, Mr Ronald Tay, Mr Kevin Goh, Mr James Lim, Mr Chen Lian Pang, Mr Wen Khai Meng
Cap
itaL
and
Lim
ited
Ann
ual R
epor
t 20
18
30
CORPORATE GOVERNANCE & TRANSPARENCY

Cap
itaL
and
Lim
ited
Ann
ual R
epor
t 20
18
31
CORPORATE GOVERNANCE & TRANSPARENCY

LEE CHEE KOONPresident & Group Chief Executive OfficerCapitaLand Group
Mr Lee Chee Koon is the President & GCEO of CapitaLand Group. He joined the company in 2007 as Vice President in the Office of the President at CapitaLand, having previously served in the Singapore Ministry of Trade and Industry, Ministry of Finance, and the Monetary Authority of Singapore.
Mr Lee has held several appointments within the group. In 2009, he was appointed the Managing Director (MD) for China for Ascott, one of the leading international lodging owner-operators. He later became the Chief Executive Officer (CEO) of Ascott in 2013. He took on the role of Group Chief Investment Officer (GCIO) of CapitaLand Group in January 2018, before his appointment as President & GCEO in September 2018.
Mr Lee is a Board Director of CapitaLand Commercial Trust Management Limited (CCTML), Ascott Residence Trust Management Limited (ARTML), CapitaLand Retail China Trust Management Limited (CRCTML) and CHF. He also serves on the boards of Temasek Foundation Nurtures, EDB Investments, SkillsFuture Singapore and National University of Singapore’s Institute of Real Estate Studies. Mr Lee was presented with the Business China Young Achiever Award for Ascott’s contributions to Singapore-China relations by Singapore’s Prime Minister Lee Hsien Loong in 2017. In recognition of Ascott’s contributions to France, he was conferred the prestigious National Order of Merit (Chevalier de l’Ordre National du Mérite) by the President of the French Republic in 2016.
Mr Lee holds a First Class Honours degree in Mechanical Engineering from the National University of Singapore. He also holds a M.Sc degree in Mechanical Engineering from Imperial College London, United Kingdom.
JASON LEOWPresident (Asia* & Retail)CapitaLand Group
Mr Jason Leow is the President (Asia* & Retail) of CapitaLand Group and reports to the President & GCEO. He oversees the Singapore, Malaysia, Indonesia and Vietnam markets. Mr Leow is also responsible for the retail business of the Group. He is a Director of CapitaLand Mall Trust Management Limited (CMTML).
Mr Leow was previously Group Chief Operating Officer of CapitaLand Group, responsible for efficient and cost-effective support services for business operations across geographies and asset classes globally.
Prior to that, Mr Leow was the CEO and Executive Director of CapitaLand Mall Asia, a role he held on 15 September 2014. From 2009 to 2014, Mr Leow was the CEO of CapitaLand China and led the China team in streamlining as well as growing the residential and integrated development businesses, including the development and operations of the eight Raffles City projects in China. Mr Leow started his career with the CapitaLand Group in 1994 and was based in China from 2001 to 2014.
Mr Leow is a Chartered Accountant of Singapore and a member of the Institute of Singapore Chartered Accountants. He obtained an Executive Master in Business Administration from Fudan University and in 2007, attended the Advanced Management Program at Harvard Business School.
* Asia (ex-China)
SENIORMANAGEMENT
Cap
itaL
and
Lim
ited
Ann
ual R
epor
t 20
18
32
CORPORATE GOVERNANCE & TRANSPARENCY

LUCAS LOHPresident (China & Investment Management)CapitaLand Group
Mr Lucas Loh is the President (China & Investment Management) of CapitaLand Group, reporting to the President & GCEO. He oversees the business and growth of China as a core geographical market for the Group, as well as the expansion of the Group’s investment management business and commercial portfolio.
Mr Loh is concurrently the CEO of CapitaLand China, a position he held since 2014. As the CEO of CapitaLand China, Mr Loh led the team in doubling China’s return contributions to the Group, as well as achieving record residential sales and the highest handover value in 2016. He also successfully completed and opened three Raffles City integrated developments spanning across more than 680,000 square metre (sqm) in gross floor area (GFA) in 2017.
Prior to his appointment as CEO of CapitaLand China, he was the Deputy CEO cum CIO, as well as Regional General Manager for South China, CapitaLand China. During then, Mr Loh was instrumental in growing CapitaLand’s integrated developments and residential businesses in South China. He was also responsible for the company’s real estate financial business, including the Raffles City China Income Ventures (formerly known as Raffles City China Fund) and establishment of the US$1.5 billion RCCIP III.
Mr Loh joined CapitaLand in September 2001 and has been based in China since August 2004. He also held several appointments within the Group, including MD for China of Ascott. Mr Loh also has extensive experience in the real estate sector where he started his career in 1991. Prior to joining CapitaLand, Mr Loh was the Associate Director for Private Equity Investment at Temasek Holdings.
Mr Loh obtained a Bachelor of Science in Estate Management from the National University of Singapore. He also holds a Master of Business Administration from Oklahoma City University and attended the Advanced Management Program at Harvard Business School in 2013.
ANDREW LIMGroup Chief Financial OfficerCapitaLand Group
Mr Andrew Lim is the Group Chief Financial Officer (GCFO) of CapitaLand Group. In his role, he has direct oversight of the functions of treasury, financial reporting and controls, risk management, tax, investor relations, compliance, and looks after the administrative matters of the internal audit department of CapitaLand. Mr Lim also has oversight responsibilities for the managers of CapitaLand’s REITs. He is a Director of CMTML, a Director of CCTML, a Director of ARTML, a Director of CRCTML and a Director of CapitaLand Malaysia Mall REIT Management Sdn. Bhd.
Mr Lim is the President of the Real Estate Investment Trust Association of Singapore. He is a member of the Institute of Singapore Chartered Accountants’ CFO Committee, a member of the Accounting Standards Council, and represents CapitaLand as a founding member of the first Accounting for Sustainability Circle of Practice in Asia.
Prior to joining CapitaLand, he was at HSBC where he served as MD and Head of South East Asia Advisory Coverage, Real Estate and Hospitality.
Mr Lim has a Master of Business Administration and a Bachelor of Commerce degree from the Rotman School of Business at the University of Toronto, and is a Chartered Financial Analyst charterholder.
Cap
itaL
and
Lim
ited
Ann
ual R
epor
t 20
18
33
CORPORATE GOVERNANCE & TRANSPARENCY

TAN SENG CHAIGroup Chief People OfficerCapitaLand Group
Mr Tan Seng Chai is the Group Chief People Officer of CapitaLand Group. He is responsible for human capital management and development, building a leadership and talent pipeline to support the organisation and businesses. For synergy across the Group, Mr Tan oversees the Group’s corporate functions including Group Human Resource and Administration, Group Communications, Group Legal, Company Secretariat, Corporate Sustainability, Corporate Social Responsibility, Group Procurement, Group Safety & Security and Global Shared Services. He is also the Executive Director of CHF, the philanthropic arm of CapitaLand. Mr Tan was previously Group Chief Corporate Officer (CCO) of CapitaLand. Prior to this, he was Deputy CCO and Chief Human Resource Officer of CapitaLand. Before joining CapitaLand in February 2008, Mr Tan was with Chartered Semiconductor Manufacturing Ltd, Singapore (Chartered) for 12 years. He held key positions in the company which includes heading its worldwide human resource organisation as well as overseeing key project implementation and strategic investment activities. An engineer by training, Mr Tan started his career with National Semiconductor Manufacturer Singapore Pte Ltd as a Process Engineer and subsequently became the company’s Human Resource Manager. He continued his career progression to head the human resource function at Creative Technology Ltd, Singapore, before joining Chartered. Mr Tan holds an honours degree in Civil & Structural Engineering and a Master of Science in Industrial & System Engineering from the National University of Singapore.
RONALD TAYChief Executive OfficerCapitaLand Singapore, Malaysia & Indonesia
Mr Ronald Tay is the CEO of CapitaLand Singapore, Malaysia & Indonesia. He is responsible for the growth and business in Singapore as a core market for the Group, as well as in Malaysia and Indonesia.
Prior to this, Mr Tay was CEO of ARTML, a role he assumed on 27 February 2012. Before that, he was also both CIO of Ascott and Head of Business Development and Asset Management of ARTML until February 2012.
Mr Tay began his career in the banking industry, where he spent nine years in various senior positions in corporate and investment banking.
Mr Tay holds a Bachelor of Business (Honours) from the Nanyang Technological University
CHEN LIAN PANGChief Executive OfficerCapitaLand Vietnam
Mr Chen Lian Pang is the CEO of CapitaLand Vietnam. He is responsible for the growth and business in Vietnam, the third largest market for CapitaLand in Southeast Asia.
Prior to this, he was CEO of CapitaValue Homes Limited. He has held several appointments in the Group including CEO (Southeast Asia) of CapitaLand Commercial Limited and CEO & MD of TCC Capital Land, where he spearheaded the Group’s business in the new markets including Vietnam and Thailand.
Mr Chen has over 30 years of international experience in construction and real estate. He started his career with the Housing and Development Board of Singapore. Prior to joining CapitaLand, he held senior positions at L&M International and Torie Construction Pte Ltd.
Mr Chen holds a Master of Science in Civil Engineering from the National University of Singapore and a Bachelor of Science in Civil Engineering (First Class Honours) from the University of Cardiff, United Kingdom. He completed the General Management Program at Harvard Business School and an International Business Fellowship Executive Programme with Tsinghua University in 2000 and 2011 respectively. Mr Chen is a registered professional engineer.
SENIORMANAGEMENT
Cap
itaL
and
Lim
ited
Ann
ual R
epor
t 20
18
34
CORPORATE GOVERNANCE & TRANSPARENCY

GERALD YONGChief Executive OfficerCapitaLand International
Mr Gerald Yong is the CEO of CapitaLand International. He is responsible for spearheading the growth of CapitaLand Group’s real estate investment portfolio in international markets.
Prior to this appointment, Mr Yong was Deputy CIO of CapitaLand, supporting the Group’s strategic investments and portfolio management. He was also concurrently Head, CapitaLand International. He assumed these roles from January 2018 to 15 September 2018.
Mr Yong was CIO of Ascott from October 2012 to December 2017. Ascott is a wholly owned business unit of CapitaLand and one of the leading international serviced residence owner-operators. He was Ascott’s Senior Vice President, Business Development and Asset Management for North Asia based in Shanghai from March 2008 to September 2012.
Mr Yong played an instrumental role in the initial public offering of Ascott Reit in 2006 when he was the Head of Investment and Asset Management of ARTML. He spearheaded the acquisitions of properties across various countries including Australia, China, Japan, the Philippines and Vietnam. Prior to this, Mr Yong was Ascott’s Vice President, Business Development and Asset Management. Before joining Ascott in February 2005, he was Vice President, Business Development and Strategic Planning at Sembcorp Industries.
Mr Yong holds a Master of Business Administration (Distinction) from Imperial College Business School, United Kingdom, on the Raffles–Chevening Scholarship. He also obtained a Second-Class Upper Honours degree in Mechanical Engineering from the National University of Singapore on the SembCorp Industries scholarship.
WILSON TANChief Executive OfficerCapitaLand Retail
Mr Wilson Tan is the CEO of CapitaLand Retail. He is responsible for managing a retail operating platform leveraging innovations and technology to enrich the retail experience in CapitaLand’s properties. Prior to this appointment, he was the CEO of CMTML.
Before joining CMTML, Mr Tan has over 26 years of experience in senior appointments in the telecommunication and information technology industries. He was GCEO of Singapore Post Limited from October 2007 to April 2010. His other experiences include
advisory and senior leadership roles in companies with regional businesses such as NEC Solutions Asia Pacific, Mercury Interactive, Software AG, Informix, Apple Singapore and Xerox Singapore.
Mr Tan is currently the Chairman of EZ Link Pte Limited and he has also served in various boards and advisory committees in private, education and government related organisations. He is currently a member of the National Arts Council – Council Member, The Republic Polytechnic - Board of Governors and Chairman of the Admin Committee; and Singapore Polytechnic School of Business - Chairman, Advisory Committee.
Mr Tan holds a Bachelor of Arts (Economics) from the National University of Singapore and attended the Advanced Management Programme at INSEAD.
LYNETTE LEONGChief Executive OfficerCapitaLand Commercial
Ms Lynette Leong is the CEO of CapitaLand Commercial. She is responsible for growing a global office operating platform leveraging innovations relating to the future of work. She concurrently serves on the boards of Singapore’s National Environment Agency, the Singapore International Chamber of Commerce and the advisory board of Singapore Management University’s Lee Kong Chian School of Business.
Ms Leong has a proven track record of growing new businesses to reach unprecedented levels. Prior to her current appointment at CapitaLand, she was the CEO and Executive Director of CCTML for 10 years. CCTML is the manager of CCT, the first and largest commercial REIT listed on the Singapore Exchange Securities Trading Limited. Under her leadership, CCT grew to become the largest office landlord in Singapore with a prestigious commercial portfolio; its assets under management increased from approximately S$4 billion in 2007 to more than S$10 billion in 2017 excluding a development project worth S$2 billion. Over the same period, CCT achieved a total return in excess of 120% notwithstanding the global financial crisis, in addition to winning multiple awards for corporate governance, investor relations and environmental sustainability.
Prior to joining CCTML, Ms Leong was CEO of Ascendas’ South Korea office for four years. She started Ascendas’ real estate operations resulting in a firm foothold in the country. Some of the achievements included the acquisition of office and logistics properties and the establishment of its first office development project and first real estate fund that were invested by several large Korean institutions.
Cap
itaL
and
Lim
ited
Ann
ual R
epor
t 20
18
35
CORPORATE GOVERNANCE & TRANSPARENCY
Ms Leong has more than 25 years of international experience, including banking and finance with Standard Chartered Bank and United Malayan Banking Corporation Berhad in Singapore and Malaysia. She also acquired extensive experience in real estate acquisitions, asset management and fund management having been stationed in the London, New York, Chicago and Asian offices of LaSalle Investment Management for eight years.
Ms Leong holds a Master of Science in Real Estate and a Bachelor of Science degree in Estate Management from the National University of Singapore.
KEVIN GOHChief Executive OfficerAscott
Mr Kevin Goh is the CEO of Ascott. He is responsible for growing and managing the global serviced residences portfolio. He was previously the Chief Operating Officer where he oversaw all operational aspects of the serviced residence business and new growth opportunities. Prior to this, Mr Goh was Ascott’s MD for North Asia, responsible for Ascott’s investments and operations in China, Japan and Korea.
Mr Goh joined Ascott China in 2007 and he was based in China for over 10 years. During his stay in China, Mr Goh took on various leadership positions such as Regional General Manager for South & East China, Vice President for Asset Management and Vice President for Corporate Services.
Prior to joining Ascott, Mr Goh was with Accenture, one of Fortune 500’s largest global management consulting, technology services and outsourcing companies. Throughout his seven-year career with Accenture, he worked on various systems implementation projects in the telecommunications and high-technology industries in both Singapore and Australia.
Mr Goh graduated from the National University of Singapore with a Bachelor of Mechanical Engineering (Honours) degree and is a Chartered Financial Analyst (CFA) charterholder.
JAMES LIMChief Executive OfficerCapitaLand Investment Management
Mr James Lim is the CEO of CapitaLand Investment Management and is responsible for managing all aspects of the global real estate private equity funds business of the Group. Prior to his current role, Mr Lim was a MD and Asia Pacific head of HSBC’s real estate finance group where he was responsible for managing and driving all aspects of one of the largest commercial real estate financing businesses across the region. He was also a member of HSBC’s Global Asset Finance Management Committee.
Prior to joining HSBC, Mr Lim was a MD and Asia Pacific head of real estate finance at BNP Paribas. He established from ground-up and managed a market leading Asia Pacific commercial real estate lending platform. Mr Lim was also a member of the bank’s Asia Pacific Structured Finance Management Committee.
Prior to BNP Paribas, Mr Lim held senior executive roles at various global financial institutions including Morgan Stanley and ANZ in Hong Kong and Lehman Brothers in Tokyo, Japan.
Mr Lim received his Bachelor of Arts from University of California Irvine and his Juris Doctorate from University of California Davis. He currently serves on the Board of Trustees at University of California Davis and serves on the University of California Davis Foundation’s Global Campaign Leadership Council representing the international regions. Mr Lim is also an executive board member of the Asian Association for Investors in Non-listed Real Estate Vehicles.
WEN KHAI MENGGroup Strategy of CapitaLand Group
Mr Wen Khai Meng is Senior Advisor, Group Strategy of CapitaLand Group. Prior to this, Mr Wen held several senior appointments with the Group including CIO of CapitaLand Limited, CEO of CapitaLand Singapore Limited, CEO of CapitaLand Commercial Limited and CEO of CapitaLand Financial Limited.
SENIORMANAGEMENT
Cap
itaL
and
Lim
ited
Ann
ual R
epor
t 20
18
36
CORPORATE GOVERNANCE & TRANSPARENCY
CORPORATEGOVERNANCE
CapitaLand (the Company and, together with its subsidiaries, the Group) embraces the tenets of good corporate governance including accountability, transparency and sustainability. It is committed to enhancing long-term shareholder value and has appropriate people, processes and structure to direct and manage the business and affairs of the Company. The policies and practices it has developed to meet the specific business needs of the Group provide a firm foundation for a trusted and respected business enterprise. The Company remains focused on complying with the substance and spirit of the principles of the Code of Corporate Governance 2012 (Code) while achieving operational excellence and delivering the Group’s long-term strategic objectives. The Board of Directors (Board) is responsible for the Company’s corporate governance standards and policies, underscoring their importance to the Group.
The Company has received accolades from the investment community for excellence in corporate governance. More details can be found in the Awards & Accolades section on pages 78 to 81 of this Annual Report.
This corporate governance report (Report) sets out the corporate governance practices for FY 2018 with reference to the principles of the Code. The Company has complied in all material aspects with the principles, guidelines and recommendations in the Code. Where there are deviations from any of the guidelines of the Code, an explanation has been provided within this Report. Answers to the questions in the Disclosure Guide provided by the Singapore Exchange Securities Trading Limited (SGX-ST) are furnished on pages 63 to 69 of this Annual Report.
(A) BOARD MATTERS
The Board’s Conduct of Affairs
Principle 1:Every company should be headed by an effective Board to lead and control the company. The Board is collectively responsible for the long-term success of the company. The Board works with Management to achieve this objective and Management remains accountable to the Board.
The Board comprises 11 Directors, 10 of whom are non-executive independent Directors. The President & GCEO, who is an executive Director, is the only non-independent Director.
Board’s Duties and ResponsibilitiesThe Board oversees the strategic direction, performance and affairs of the Group and provides overall guidance to Management. The Board has the primary responsibility to foster the success of the Company so as to deliver sustainable value over the long-term to shareholders.
The Board appoints the President & GCEO who is responsible for developing and implementing the Group’s strategic plans approved by the Board and managing the Group’s business.
The Board Charter sets out the Board’s role, responsibilities, duties and powers. The duties and powers of the Board include:
(a) approving the strategies and objectives for the Company, and monitoring the progress in achieving them;(b) approving the financial plan (including annual budgets and capital management plans) and monitoring the
financial performance of the Company; (c) approving share issuances, dividends and other returns to shareholders;(d) approving corporate and financial restructuring, mergers, major acquisitions and divestments; (e) approving the risk appetite of the Company, and reviewing the adequacy and effectiveness of the risk
management and internal control systems;(f) considering sustainability issues as part of its strategic formulation; (g) approving the overall remuneration policy and compensation framework, and the compensation package for
the President & GCEO and other key management positions; and(h) reviewing matters which involve a conflict of interest for a substantial shareholder or a Director.
Cap
itaL
and
Lim
ited
Ann
ual R
epor
t 20
18
37
CORPORATE GOVERNANCE & TRANSPARENCY

CORPORATEGOVERNANCE
The Directors as fiduciaries are collectively and individually obliged at all times to act honestly and with diligence, and in the best interests of the Company. The Board has a standing policy which requires each Director to not allow himself/herself to get into a situation where there is a conflict between his/her duty to the Company and his/her own interests. Where a Director has a conflict of interest in a particular matter, he or she will be required to recuse himself/herself from the deliberations and abstain from voting on the matter. Every Director has complied with this policy. Directors are also required to act with due diligence in the discharge of their duties and they are responsible for ensuring that they have the relevant knowledge (including understanding the business of the Company and the environment in which it operates) to carry out and discharge their duties as directors. They are also required to dedicate the necessary effort, commitment and time to their work, and are expected to attend all meetings of the Board, except if unusual circumstances make attendance impractical.
Sustainability Management The Board’s role includes considering sustainability issues as part of its strategic formulation. It adopts an inclusive approach by considering and balancing the needs and interests of material stakeholders, as part of its overall strategy to ensure that the best interests of the Company are served. The Company is committed to sustainability and incorporates the key principles of environmental and social responsibility, and corporate governance in setting its business strategies and operations. Its sustainability strategy is aligned with its credo of “Building People. Building Communities”. It has arrangements in place to identify and engage with material stakeholder groups and to manage its relationships with such groups. The Company has received recognition for its efforts; it is listed in the Sustainability Yearbook, Dow Jones Sustainability World Index and FTSE4Good Index Series, among others. More information on the Company’s efforts on sustainability management can be found on pages 82 to 87 of this Annual Report and in the CapitaLand Global Sustainability Report, which will be published by end May 2019.
Board CommitteesThe Board has established various Board Committees to assist it in the discharge of its functions. These Board Committees are the Audit Committee (AC), the Executive Resource and Compensation Committee (ERCC), the Nominating Committee (NC), the Risk Committee (RC) and the Strategy, Investment and Finance Committee (SIFC).
The SIFC was formerly known as the Finance and Investment Committee. The SIFC assists the Board in its review of investment, credit and funding proposals, as well as the long-term strategy of the Company. As a complete review of the strategic plans of the Company would include strategic talent pipeline review, the SIFC’s remit was expanded in FY 2018 to include the review of the strategic talent pipieline of the Company. The SIFC carries out this responsibility within the authorities/limits approved by the Board. All members of the SIFC, including its chairman, are non-executive independent Directors.
Each of these Board Committees operates under delegated authority from the Board with the Board retaining overall oversight and has its own terms of reference. The chairpersons of these Board Committees report on the decisions and significant matters discussed at the respective Board Committees to the Board on a quarterly basis. The composition of the various Board Committees is set out on the inside back cover of this Annual Report. The duties and responsibilities of the above committees are set out in this Report.
The Board may form other Board Committees from time to time. The Board regularly undertakes a review of its Board Committees including their membership and terms of reference. The composition of the Board Committees is also reviewed as and when there are changes to Board membership. The composition of the Board Committees is such that there is appropriate diversity of skills and experience, it fosters active participation and contributions from Board members and there is an equitable distribution of responsibilities among Board members.
China Advisory Panel and CapitaLand Technology CouncilIn addition to Board Committees, the Company has also established the China Advisory Panel (CAP) in 2014 and CapitaLand Technology Council (CTC) in 2015. The CAP shares strategic insights on general, economic and real estate industry developments and trends in China. The CTC advises the Board on technology developments and initiatives to support the Company’s efforts to harness technology to develop real estate of the future.
Cap
itaL
and
Lim
ited
Ann
ual R
epor
t 20
18
38
CORPORATE GOVERNANCE & TRANSPARENCY

Delegation of AuthorityThe Board has adopted a set of internal controls which establishes approval limits for capital expenditure, investments, divestments, bank borrowings and issuance of shares as well as debt and equity-linked instruments. Apart from matters that specifically require the Board’s approval, the Board delegates authority for transactions below those limits to Board Committees and Management.
Meetings of Board and Board CommitteesThe Board meets at least once every quarter, and as required by business imperatives. Board and Board Committee meetings are scheduled prior to the start of each financial year. The Constitution of the Company (Constitution) also permits Directors to participate via audio or video conference. The Board and Board Committees may also make decisions by way of resolutions in writing.
In line with the Company’s ongoing commitment to limit paper waste and reduce its carbon footprint, the Company does not provide printed copies of Board papers. Instead, Directors are provided with tablet devices to enable them to access and read Board and Board Committee papers prior to and during meetings. This initiative also enhances information security as the papers are downloaded to the tablet devices through an encrypted channel. Directors are also able to electronically sign and approve written resolutions through the tablet devices.
Prior to the start of each Board meeting, where required, the non-executive Directors meet without the presence of Management. The Board also meets annually to review and discuss the Group’s strategies with Senior Management. At Board and Board Committee meetings, non-executive Directors review the performance of the business, the progress made by Management in achieving agreed goals and objectives and monitor the reporting of such performance. The non-executive Directors actively participate in Board and Board Committee meetings.
The Company adopts and practises the principle of collective decisions and therefore, no individual Director influences or dominates the decision-making process.
A total of seven Board meetings were held in FY 2018. A record of the Directors’ attendance at Board and Board Committee meetings in FY 2018 is set out on page 60 of this Annual Report. President & GCEO who is also a Director attends all Board meetings. He also attends all Board Committee meetings on an ex officio basis. Other senior executives attend Board and Board Committee meetings as required to brief the Board on specific business matters.
Directors’ DevelopmentUnder the Listing Manual of the SGX-ST (Listing Manual), the Company has a continuing obligation to ensure that its Directors and executive officers should have appropriate experience and expertise to manage the Group’s business. In view of the increasingly demanding, complex and multi-dimensional role of a Director, the Board recognises the importance of continual training and development for its Directors so as to equip them to discharge the duties and responsibilities of their office as Directors of the Company to the best of their abilities. The Company has in place a training framework to guide and support the Company towards meeting the objective of having a Board which comprises individuals who are competent and possess up-to-date knowledge and skills necessary to discharge their duties and responsibilities. The costs of training are borne by the Company. Upon appointment, each Director is provided with a formal letter of appointment and a copy of the Director’s Manual (which includes information on a broad range of matters relating to the role, duties and responsibilities of a Director). All Directors upon appointment also undergo an induction programme which focuses on orientating the Director to the Company’s business, operations, strategies, organisation structure, responsibilities of key management personnel, and financial and governance practices. The induction programme also includes site visits. Following their appointment, Directors are provided with opportunities for continuing education in areas such as directors’ duties and responsibilities, changes to regulations and accounting standards, and industry-related matters, so as to be updated on matters that affect or may enhance their performance as Directors or Board Committee members. Directors may also propose training and development in relevant areas of interest to the Board. In FY 2018, the training and professional development programmes for Directors included forums and dialogues with experts and senior business leaders on issues facing boards and board practices. They also received on a regular basis reading materials on topical matters or subjects and regulatory updates and their implications. The Directors also participated in sessions with members of CTC and CAP.
Cap
itaL
and
Lim
ited
Ann
ual R
epor
t 20
18
39
CORPORATE GOVERNANCE & TRANSPARENCY
CORPORATEGOVERNANCE
Board Composition and Guidance
Principle 2:There should be a strong and independent element on the Board, which is able to exercise objective judgement on corporate affairs independently, in particular, from Management and 10% shareholders. No individual or small group of individuals should be allowed to dominate the Board’s decision-making.
The Board, through the NC, reviews from time to time the size and composition of the Board, with a view to ensuring that the size of the Board is appropriate in facilitating effective decision-making and that the Board has a strong independent element and diversity of thought and background in its composition. The review takes into account the scope and nature of the Group’s operations.
The Board has adopted the policy that at least one-third of the Board shall comprise independent Directors. Additionally, in the event that the Chairman is not an independent Director, the Company will appoint a lead independent Director and ensure that the Board comprises a majority of independent Directors. The Board has a strong independent element - 10 out of 11 Directors, including the Chairman, are non-executive independent Directors. Non-executive Directors also make up more than a majority of the Board. Profiles of the Directors, their respective designations and roles are set out on pages 22 to 29 of this Annual Report.
The Board, taking into account the views of the NC, assesses the independence of each Director in accordance with the guidance in the Code. An independent Director is one who is independent in conduct, character and judgement and has no relationship with the Company, its related corporations, its shareholders who hold 10% or more of the voting shares of the Company, or its officers that could interfere, or be reasonably perceived to interfere with the exercise of his or her independent business judgement in the best interests of the Company.
The Board has established a process for assessing the independence of its Directors. As part of the process:
(a) each non-executive Director provides information of his or her business interests and confirms, on an annual basis, that there are no relationships which interfere with the exercise of his or her independent business judgement with a view to the best interests of the Company; such information is then reviewed by the NC; and
(b) the NC also reflects on the respective Directors’ conduct and contributions at Board and Board Committee meetings, in particular, if each of them has exercised independent judgement in discharging his or her duties and responsibilities.
Thereafter, the NC’s recommendation is presented to the Board for its determination. Each Director is required to recuse himself or herself from the NC’s and the Board’s deliberations respectively on his or her own independence.
The Board has carried out the assessment of each of its Directors for FY 2018 and the paragraphs below set out the outcome of the assessment. In particular, the Board noted that none of the Directors was, or had any immediate family member who was, employed by the Company or its related corporations in FY 2018 and the three financial years before that.
Mr Ng Kee ChoeMr Ng serves as a member on the Board of Temasek Trustees Pte Ltd (Temasek Trustees). Temasek Trustees is the philanthropic arm of Temasek Holdings (Private) Limited (Temasek), which is the controlling shareholder of the Company as defined by the Listing Manual. Temasek Trustees is a not-for-profit organisation which independently oversees the management and disbursement of Temasek’s endowments and gifts. Mr Ng’s role as a member of the Board of Temasek Trustees is non-executive in nature and he is not involved in the day-to-day conduct of the business of Temasek Trustees.
The Board also considered the conduct of Mr Ng in the discharge of his duties and responsibilities as a Director, and is of the view that the relationship set out above did not impair his ability to act with independent judgement in the discharge of his duties and responsibilities as a Director. The Board is therefore of the view that Mr Ng has exercised independent judgement in the discharge of his duties and responsibilities. Based on the above, the Board arrived at the determination that Mr Ng is an independent Director. Mr Ng had recused himself from the NC’s and the Board’s deliberations, respectively, on his independence.
Cap
itaL
and
Lim
ited
Ann
ual R
epor
t 20
18
40
CORPORATE GOVERNANCE & TRANSPARENCY

Ms Euleen GohMs Goh serves as a member on the Board of Temasek Trustees. She is stepping down from that role on 1 April 2019. Ms Goh’s role as a member of the Board of Temasek Trustees is non-executive in nature and she is not involved in the day-to-day conduct of the business of Temasek Trustees.
Ms Goh is also a non-executive director of DBS Bank Ltd (DBS Bank) which provides banking services to the Group. Ms Goh’s role in DBS Bank is non-executive in nature and she is not involved in the business operations of the bank. The decision to engage DBS Bank was made by Management in the ordinary course of business and on normal commercial terms, based on merit and competitive terms negotiated by Management. Ms Goh was not involved in the process for or approval of the engagement. The magnitude of the fees and payments made to DBS Bank was also considered. Although the aggregate amount in FY 2018 exceeded the threshold amount of S$200,000 (which is provided as a general guide in the Code), it was not material when compared to DBS Bank’s total income and the Company’s total expenses, respectively.
The Board also considered the conduct of Ms Goh in the discharge of her duties and responsibilities as a Director, and is of the view that the relationships set out above did not impair her ability to act with independent judgement in the discharge of her duties and responsibilities as a Director. The Board is therefore of the view that Ms Goh has exercised independent judgement in the discharge of her duties and responsibilities. Based on the above, the Board arrived at the determination that Ms Goh is an independent Director. In the year under review, Ms Goh had also recused herself from participating in any Board deliberation on any transactions involving DBS Bank. Ms Goh had also recused herself from the Board’s deliberations on her independence.
Mr Stephen LeeMr Lee is a non-executive director of Temasek. Mr Lee’s role on the Temasek board is non-executive in nature and he is not involved in the day-to-day conduct of the business of Temasek. He had also provided confirmation that he was not under any obligation, whether formal or informal, to act in accordance with the directions, instructions or wishes of Temasek.
The Board also considered the conduct of Mr Lee in the discharge of his duties and responsibilities as a Director, and is of the view that the relationship set out above did not impair his ability to act with independent judgement in the discharge of his duties and responsibilities as a Director. The Board is therefore of the view that Mr Lee has exercised independent judgement in the discharge of his duties and responsibilities. Based on the above, the Board arrived at the determination that Mr Lee is an independent Director. In the year under review, Mr Lee had also recused himself from participating in any Board deliberation on any transactions involving Temasek. Mr Lee had recused himself from the NC’s and the Board’s deliberations, respectively, on his independence, in relation to the corporate affairs of the Company.
Mr Kee Teck KoonMr Kee was a corporate advisor of Temasek International Advisors Pte Ltd (TIA), a wholly owned subsidiary of Temasek in FY 2018. He has since 1 January 2019 stepped down from that role. While in that role, Mr Kee provided corporate advisory services to TIA in relation to proposed investments or projects of Temasek which are non-real estate in nature. Mr Kee’s role in TIA was non-executive and advisory in nature, and he was not involved in the day-to-day conduct of the business of TIA.
Mr Kee is also a non-executive director of Raffles Medical Group Ltd (RMG) which provides healthcare insurance and medical services as part of the welfare and benefits scheme for CapitaLand Group employees. Mr Kee’s role in RMG is non-executive in nature and he is not involved in the business operations of RMG. The decision to engage RMG was made by Management in the ordinary course of business and on normal commercial terms, based on merit and competitive terms negotiated by Management. Mr Kee was not involved in the process for or approval of the engagement. The magnitude of the fees and payments made to RMG was also considered. Although the aggregate amount in FY 2018 exceeded the threshold amount of S$200,000 (which is provided as a general guide in the Code), it was not material when compared to RMG’s total income and the Company’s total expenses, respectively.
The Board also considered the conduct of Mr Kee in the discharge of his duties and responsibilities as a Director, and is of the view that the relationships set out above did not impair his ability to act with independent judgement in the discharge of his duties and responsibilities as a Director. The Board is therefore of the view that Mr Kee has exercised independent judgement in the discharge of his duties and responsibilities. Based on the above, the Board arrived at the determination that Mr Kee is an independent Director. Mr Kee had recused himself from the Board’s deliberations on his independence. C
apit
aLan
d L
imit
edA
nnua
l Rep
ort
2018
41
CORPORATE GOVERNANCE & TRANSPARENCY

CORPORATEGOVERNANCE
Ms Goh Swee ChenMs Goh was appointed as a non-executive director of Singapore Airlines Limited (SIA) on 1 January 2019. SIA provides flight services to the Group. The decision to engage SIA was made by Management in the ordinary course of business and on normal commercial terms, based on merit and competitive terms negotiated by Management. Ms Goh’s role in SIA is non-executive in nature and she is not involved in the business operations of SIA. The engagement of SIA pre-dates Ms Goh’s appointment to the SIA board. The Board considered the conduct of Ms Goh in the discharge of her duties and responsibilities as a Director, and is of the view that the relationship set out above did not impair her ability to act with independent judgement in the discharge of her duties and responsibilities as a Director. The Board is therefore of the view that Ms Goh has exercised independent judgement in the discharge of her duties and responsibilities. Based on the above, the Board arrived at the determination that Ms Goh is an independent Director. Ms Goh had recused herself from the Board’s deliberations on her independence. Dr Philip Pillai, Mr Chaly Mah and Mr Gabriel LimDr Pillai, Mr Mah and Mr Lim do not have any relationships and are not faced with any of the circumstances identified in the Code, or any other relationships which may affect their independent judgement. The Board noted that:
(a) Dr Pillai is also a non-executive board member of the Inland Revenue Authority of Singapore, a statutory board which functions as the tax collecting agency of Singapore. This role does not require him to take or subject him to any obligation to follow any instructions from any government authorities in relation to the corporate affairs of the Company. This role also generates no conflict of interest in respect of his role as a Director of the Company.
(b) Mr Mah is also a non-executive board member of (i) the Monetary Authority of Singapore, which is Singapore’s central bank and financial regulatory authority; and (ii) the Economic Development Board of Singapore, a statutory board which plans and executes strategies for business and investment. These roles do not require him to take or subject him to any obligation to follow any instructions from any government authorities in relation to the corporate affairs of the Company. These roles also generate no conflict of interest in respect of his role as a Director of the Company.
(c) Mr Lim is presently Permanent Secretary of the Ministry of Communications and Information. He will relinquish this appointment and assume a new appointment as Permanent Secretary of the Ministry of Trade and Industry with effect from 1 April 2019. His public office duties do not require him to take or subject him to any obligation to follow any instructions from any government authorities in relation to the corporate affairs of the Company. This role also generates no conflict of interest in respect of his role as a Director of the Company.
The Board also considered the conduct of Dr Pillai, Mr Mah and Mr Lim, respectively, in the discharge of their duties and responsibilities as Directors, and is of the view that each of them had acted with independent judgement in the discharge of their duties and responsibilities as Directors. The Board is therefore of the view that each of Dr Pillai, Mr Mah and Mr Lim has exercised independent judgement in the discharge of his duties and responsibilities. Based on the above, the Board arrived at the determination that Dr Pillai, Mr Mah and Mr Lim are independent Directors. They had recused themselves from the Board’s deliberations on their independence. Dr Pillai who is also an NC member had also recused himself from the NC’s deliberations on his independence.
Tan Sri Amirsham A Aziz and Mr Anthony Lim Tan Sri Amirsham and Mr Lim do not have any relationships and are not faced with any of the circumstances identified in the Code, or any other relationships which may affect their independent judgement. The Board considered the conduct of each of them in the discharge of their duties and responsibilities as Directors and is of the view that each of them had acted with independent judgement in the discharge of his duties and responsibilities. The Board is therefore of the view that each of Tan Sri Amirsham and Mr Lim has exercised independent judgement in the discharge of his duties and responsibilities. Based on the above, the Board arrived at the determination that Tan Sri Amirsham and Mr Lim are independent Directors. They had recused themselves from the Board’s deliberations on their independence.
Mr Lim Ming Yan, the Company’s President & GCEO until 15 September 2018, was the only non-independent Director in FY 2018. During FY 2018, other than Mr Lim Ming Yan who served as the Company’s President & GCEO, all members of the Board were independent Directors as defined under the Code. The Board has a strong independent element in that the President & GCEO is the only non-independent Director.
Cap
itaL
and
Lim
ited
Ann
ual R
epor
t 20
18
42
CORPORATE GOVERNANCE & TRANSPARENCY

Chairman and Chief Executive Officer
Principle 3:There should be a clear division of responsibilities between the leadership of the Board and the executives responsible for managing the company’s business. No one individual should represent a considerable concentration of power.
The roles and responsibilities of the Chairman and the President & GCEO are held by separate individuals, in keeping with the principles that there be a clear division of responsibilities between the leadership of the Board and Management and that no one individual has unfettered powers of decision-making. The non-executive independent Chairman is Mr Ng Kee Choe, whereas the President & GCEO is Mr Lee Chee Koon who was appointed on 15 September 2018. They do not share any family ties.
The Chairman provides leadership to the Board and facilitates the conditions for the overall effectiveness of the Board, Board Committees and individual Directors. This includes setting the agenda of Board meetings, ensuring that there is sufficient information and time at meetings to address all agenda items, and promoting open and constructive engagement among the Directors as well as between the Board and the President & GCEO on strategic issues. The Chairman plays a significant leadership role by providing clear oversight, direction, advice and guidance to the President & GCEO on strategies. He also maintains open lines of communication and engages with other members of the senior leadership regularly, and acts as a sounding board on strategic and operational matters.
The President & GCEO has full executive responsibilities to manage the Group’s business and to develop and implement Board approved policies.
The separation of the roles of the Chairman and the President & GCEO and the resulting clarity of roles provide a healthy professional relationship between the Board and Management, facilitate robust deliberations on the Group’s business activities and the exchange of ideas and views to help shape the strategic process, and ensure an appropriate balance of power, increased accountability and greater capacity of the Board for independent decision-making.
As the roles of the Chairman and President & GCEO are held by separate individuals who are not related to each other, and the Chairman is an independent Director, no lead independent director is appointed.
Board Membership
Principle 4: There should be a formal and transparent process for the appointment and reappointment of Directors to the Board.
The Board has established the NC, which makes recommendations to the Board on all appointments to the Board and Board Committees. All Board appointments are approved by the Board.
All NC members, including the Chairman of the NC, are non-executive independent Directors. The NC met three times in the year under review. The NC also reviewed and approved various matters within its remit via circulating papers.
Under its terms of reference, the NC’s scope of duties and responsibilities is as follows:
(a) reviewing and making recommendations to the Board on the size and composition of the Board, the succession plans for Directors, and the structure and membership of the Board Committees;
(b) reviewing and recommending the process and criteria for the evaluation of the performance of the Board, Board Committees and Directors;
(c) identifying and developing training and professional development programmes for the Board; (d) considering annually and, as and when circumstances require, if a Director is independent and providing its
views to the Board for consideration; and(e) reviewing whether a Director has been adequately carrying out his or her duties as a director.
Cap
itaL
and
Lim
ited
Ann
ual R
epor
t 20
18
43
CORPORATE GOVERNANCE & TRANSPARENCY

CORPORATEGOVERNANCE
In undertaking its duty of reviewing and making board appointment recommendations to the Board, the NC evaluates the Board’s competencies on a long-term basis and identifies competencies which may be further strengthened in the long-term. Board succession planning takes into account the need to maintain flexibility to effectively address succession planning and to ensure that the Company continues to attract and retain highly qualified individuals to serve on the Board.
The Board supports the principle that Board renewal is a necessary and continual process, for good governance and ensuring that the Board has the skills, expertise and experience which are relevant to the evolving needs of the Group’s business. The Board seeks to refresh its membership progressively and in an orderly manner. In this regard, Board succession planning is carried out through the annual review by the NC of the Board’s composition as well as when a Director gives notice of his or her intention to retire or resign. The outcome of that assessment is reported to the Board.
The NC also identifies suitable candidates for appointment to the Board. In this regard, external consultants may be retained from time to time to assist the NC in identifying candidates. Candidates are identified based on the needs of the Company and the relevant skills required. All Board appointments are made based on merit and those considered will be assessed against a range of criteria including the candidates’ demonstrated business sense and judgement, skills and expertise, and market and industry knowledge (and may include elements such as financial, sustainability or other specific competency, geographical representation and business background). The NC uses a skills matrix to determine the skills gaps of the Board and if the expertise and experience of a candidate would complement those of the existing Board members. The NC also considers the personal qualities and integrity of the candidate while also assessing the candidate’s ability to commit time to the affairs of the Company, taking into consideration the candidate’s other current appointments.
The Board believes in diversity and values the benefits diversity can bring to the Board in its deliberations. Diversity enhances the Board’s decision-making capability and ensures that the Company has the opportunity to benefit from all available talent and perspectives. The Board considers diversity factors such as age, educational, business and professional background of its members in determining the optimal composition of the Board in its Board renewal process. Female representation is also considered an important aspect of diversity. The current Board comprises 11 members who are corporate and business leaders, and are professionals with varied background, expertise and experience including in finance, banking, real estate, legal, accounting, general management and technology. The current Board has two female members.
In the year under review, no alternate Directors were appointed. In keeping with the principle that a Director must be able to commit time to the affairs of the Company, the NC has adopted the principle that it will generally not approve the appointment of alternate Directors. Election of Board members is the prerogative and right of shareholders. The Constitution requires one-third of its Directors (prioritised by length of service since the previous reelection or appointment and who are not otherwise required to retire) to retire and subject themselves to reelection by shareholders (one-third rotation rule) at every annual general meeting (AGM). Effectively, this results in all Directors having to retire and stand for reelection at least once every three years. In addition, any newly appointed Director (whether as an additional Director or to fill a casual vacancy) will submit himself or herself for reelection at the AGM immediately following his or her appointment. Thereafter, he or she is subject to the one-third rotation rule.
With regard to the reelection of existing Directors each year, the NC advises the Board of those Directors who are retiring or due for consideration to retire in accordance with the articles of the Constitution. The NC makes recommendations to the Board as to whether the Board should support the reelection of a Director who is retiring and, for the purpose, undertakes a review of the retiring non-executive Director’s performance during the period in which the non-executive Director has been a member of the Board. Each member of the NC is required to and recuses himself or herself from deliberations on his or her own reelection. Shareholders elect the Directors or candidates put up for election and reelection at the AGM individually and are provided with relevant information in the Annual Report on the Directors or candidates who are seeking election or reelection.
The President & GCEO, as a Board member, is also subject to the one-third rotation rule. His role as President & GCEO is separate from his position as a Board member, and does not affect the ability of shareholders to exercise their right to select all Board members.
During FY 2018, Mr John Powell Morschel and Mr Lim Ming Yan retired from the Board. On 1 January 2019, Mr Lee Chee Koon, the new President & GCEO, joined the Board as an executive Director.
Cap
itaL
and
Lim
ited
Ann
ual R
epor
t 20
18
44
CORPORATE GOVERNANCE & TRANSPARENCY

The NC also conducts a review of the commitments of each Director on an annual basis and as and when there is a change of circumstances involving a Director. Guideline 4.4 of the Code recommends that the Board determines the maximum number of listed company board appointments which any Director may hold, and discloses this in the Annual Report. In view of the responsibilities of a Director, the Board is cognisant of the need for Directors to be able to devote sufficient time and attention to adequately perform their roles. However, the Board has not imposed any limit as it has taken the view that the limit on the number of listed company directorships that an individual may hold should be considered on a case-by-case basis, as a person’s available time and attention may be affected by many different factors, such as whether he or she is in full-time employment and the nature of his or her other responsibilities. A Director with multiple directorships is expected to ensure that he or she can devote sufficient time and attention to the affairs of the Company. Directors are also required to consult the Chairman before accepting new appointments as directors or full time executives.
All Directors are required to confirm on an annual basis, and for FY 2018, had confirmed that they were able to devote sufficient time and attention to the affairs of the Company. The NC assessed each Director’s ability to commit time to the affairs of the Company, taking into consideration their confirmation, their commitments, their attendance record at meetings of the Board and Board Committees, as well as their conduct and contributions (including preparedness, participation and candour) at Board and Board Committee meetings. The Directors’ listed company directorships and other principal commitments are disclosed on pages 22 to 29 of this Annual Report and their attendance record for FY 2018 is set out on page 60 of this Annual Report. For FY 2018, the Directors achieved high attendance rates and they have contributed positively to Board discussions at Board and Board Committee meetings, based on which the NC has determined that each Director has been adequately carrying out his or her duties as a Director of the Company.
The Board, taking into consideration the NC’s assessment, has noted that each Director has been adequately carrying out his or her duties and responsibilities as a Director of the Company.
Board Performance
Principle 5:There should be a formal annual assessment of the effectiveness of the Board as a whole and its Board Committees and the contribution by each Director to the effectiveness of the Board.
The Company believes that oversight from a strong and effective Board goes a long way toward guiding a business enterprise to achieving success.
The Board, through the NC, strives to ensure that there is an optimal blend in the Board of backgrounds, experience and knowledge in business and general management, expertise relevant to the Group’s business and track record, and that each Director can bring to the Board an independent and objective perspective to enable balanced and well-considered decisions to be made in the interests of the Group.
Whilst Board performance is ultimately reflected in the long-term performance of the Group, the Board believes that engaging in a regular process of self-assessment and evaluation of Board performance in order to identify key strengths and areas for improvement is essential to effective stewardship and to attaining success for the Company.
The NC undertakes a process to evaluate the effectiveness of the Board as a whole and the Board Committees for every financial year. An external consultant is engaged to facilitate the evaluation process. The consultant is independent of and is not related to the Company or any of its Directors. As part of the process, questionnaires are sent by the consultant to the Directors and Management and interviews are conducted where required. The objective of the interviews is to seek clarifications to the feedback obtained from the responses in the questionnaires, during which broader questions might also be raised to help validate certain survey findings. The findings are then evaluated by the consultant and reported, together with the recommendations of the consultant, to the Board. The evaluation categories covered in the questionnaire included Board composition, information management, Board processes, corporate integrity and social responsibility, managing company performance, strategy review, Board Committee effectiveness, President & GCEO performance and succession planning, Director development and management, and managing risk and adversity. The findings and the recommendations of the consultant which include benchmarking information and best practices of other boards, are considered by the Board and follow up action is taken, where necessary.
Cap
itaL
and
Lim
ited
Ann
ual R
epor
t 20
18
45
CORPORATE GOVERNANCE & TRANSPARENCY

CORPORATEGOVERNANCE
In respect of individual Directors, formal evaluation is carried out by the NC as and when a Director is due for retirement by rotation and is seeking reelection. The Board also recognises that contributions by an individual Board member can take different forms including providing objective perspectives on issues, facilitating business opportunities and strategic relationships, and accessibility to Management outside of the formal environment of Board and/or Board Committee meetings.
The Board further believes that the collective Board performance and the contributions of individual Board members are also reflected in, and evidenced by, the synergistic performance of the Board in discharging its responsibilities as a whole by providing proper guidance, diligent oversight and able leadership, and lending support to Management in steering the Company in the appropriate direction, as well as the long-term performance of the Company whether under favourable or challenging market conditions.
Access to Information
Principle 6:In order to fulfill their responsibilities, Directors should be provided with complete, adequate and timely information prior to Board meetings and on an ongoing basis so as to enable them to make informed decisions to discharge their duties and responsibilities.
The Company recognises the importance of providing the Board with relevant information on a timely basis prior to Board and Board Committee meetings and on an ongoing basis, to enable Directors to make informed decisions to discharge their duties and responsibilities.
In addition to providing complete, adequate and timely information to the Board on Board affairs and issues requiring the Board’s decision, Management also provides ongoing reports relating to the operational and financial performance of the Company, such as monthly management reports.
As a general rule, Board papers are sent to Board or Board Committee members at least five working days prior to each Board or Board Committee meeting, to allow them to prepare for the meetings and to enable discussions to focus on any questions that they may have. Where appropriate, informal meetings are also held for Management to brief Directors on prospective transactions and potential developments in the early stages before formal Board approval is sought.
The Board meets at least quarterly and Board meetings, in general, last up to a full day. At each Board meeting:
(a) the chairperson of each Board Committee provides an update on the significant matters discussed at the Board Committee meetings which are typically scheduled before the quarterly Board meetings;
(b) the President & GCEO provides updates on the Group’s business and operations; (c) the GCFO presents the financial performance; and (d) presentations in relation to specific business areas are also made by senior executives, external consultants or
experts.
This allows the Board to develop a good understanding of the progress of the Group’s business as well as the issues and challenges facing the Group, and also promotes active engagement with the key executives of the Group.
To keep the senior management and the Board abreast of market perceptions and concerns, the Investor Relations team provides regular updates on analyst consensus estimates and views. On a quarterly basis, the Investor Relations team provides comprehensive updates to the Board. This includes updates and analyses of the shareholder register, highlights of key shareholder engagements as well as market feedback.
The Board has unfettered access to any Management staff for any information that it may require at all times. It also has separate and independent access to the Company Secretary at all times. The Company Secretary attends to corporate secretarial administration matters and is the corporate governance advisor on corporate matters to the Board and Management. The Company Secretary attends all Board meetings and assists the Chairman in ensuring that Board procedures are followed. The appointment and the removal of the Company Secretary is subject to the Board’s approval. The Board, whether as individual Directors or as a group, is also entitled to have access to independent professional advice where required, at the Company’s expense.
The Board sets aside time at each scheduled meeting to meet without the presence of Management. There were no separate meetings of the independent Directors in FY 2018 as all the non-executive Directors are independent Directors.
Cap
itaL
and
Lim
ited
Ann
ual R
epor
t 20
18
46
CORPORATE GOVERNANCE & TRANSPARENCY

(B) REMUNERATION MATTERS
Procedures for Developing Remuneration Policies
Principle 7:There should be a formal and transparent procedure for developing policy on executive remuneration and for fixing the remuneration packages of individual Directors. No Director should be involved in deciding his own remuneration.
Level and Mix of Remuneration
Principle 8:The level and structure of remuneration should be aligned with the long-term interest and risk policies of the company, and should be appropriate to attract, retain and motivate (a) the Directors to provide good stewardship of the company, and (b) key management personnel to successfully manage the company. However, companies should avoid paying more than is necessary for this purpose.
Disclosure on Remuneration
Principle 9:Every company should provide clear disclosure of its remuneration policies, level and mix of remuneration, and the procedure for setting remuneration, in the company’s Annual Report. It should provide disclosure in relation to its remuneration policies to enable investors to understand the link between remuneration paid to Directors and key management personnel, and performance.
The Board has established the ERCC to oversee executive compensation and development. In carrying out this role, the ERCC also aims to build capable and committed management teams through competitive compensation and progressive policies which are aligned to the long-term interests and risk policies of the Group. The ERCC thus plays a crucial role in helping to ensure that the Company is able to attract, motivate and retain the best talents to drive the Group’s business forward.
All ERCC members, including the Chairman of the ERCC, are non-executive independent Directors. The ERCC met five times in the year under review.
The ERCC is guided by its terms of reference. In particular, the ERCC recommends to the Board for approval a general framework of remuneration for the non-executive Directors and key management personnel of the Group, and the specific remuneration package for each key management personnel. The ERCC also recommends to the Board for endorsement the specific remuneration package for each Director.
The ERCC conducts, on an annual basis, the evaluation of the President & GCEO’s performance and a succession planning review of the President & GCEO and key management positions in the Group, and presents its findings and recommendations to the Board. Potential candidates for leadership succession are reviewed for their readiness in the immediate, medium and longer term.
Cap
itaL
and
Lim
ited
Ann
ual R
epor
t 20
18
47
CORPORATE GOVERNANCE & TRANSPARENCY

CORPORATEGOVERNANCE
Remuneration policy for key management personnel
The principles governing the Company’s key management personnel remuneration policy are as follows:
The Board sets the remuneration policies in line with the Company’s business strategy and approves the executive compensation framework based on the key principle of linking pay to performance. The Board has access to independent remuneration consultants to advise as required.
Consistent with its practice in previous years, the ERCC appointed an independent remuneration consultant, Willis Towers Watson, to provide professional advice on Board and executive remuneration in FY 2018. The consultant is not related to the Company or any of its Directors. In its deliberations, the ERCC also took into consideration industry practices and norms in compensation.
Remuneration for Key Management Personnel
Remuneration for key management personnel comprises fixed components, variable cash components, share-based components and employee benefits:
A. Fixed Components:The fixed components comprise the base salary, fixed allowances and compulsory employer contribution to an employee’s Central Provident Fund.
Business Alignment
Build sustainable value creation and drive dollar returns above the risk-adjusted cost of capital to align with longer term shareholder interests
Provide sound and structured funding to ensure affordability and cost-effectiveness in line with performance goals
Enhance retention of key talents to build strong organisational capabilities
Motivate Right Behaviour
Pay for performance – align, differentiate and balance rewards according to multiple dimensions of performance Strengthen line-of-sight linking rewards and performance Foster group-wide interests to recognise the interdependence of the various businesses of the Group and
drive superior outcomes
Fair & Appropriate
Ensure competitive remuneration relative to the appropriate external talent markets Manage internal equity such that remuneration systems are viewed as fair across the Group Significant and appropriate portion of pay-at-risk, taking into account risk policies of the Group, symmetrical
with risk outcomes and sensitive to the risk time horizon
Effective Implementation
Maintain rigorous corporate governance standards Exercise appropriate flexibility to meet strategic business needs and practical implementation considerations Facilitate employee understanding to maximise the value of the remuneration programmes
Cap
itaL
and
Lim
ited
Ann
ual R
epor
t 20
18
48
CORPORATE GOVERNANCE & TRANSPARENCY

B. Variable Cash Components:The variable cash components comprise the Balanced Scorecard Bonus Plan (BSBP) and Economic Value-Added (EVA)-based Incentive Plan (EBIP).
Balanced Scorecard Bonus Plan The BSBP is linked to the achievement of annual performance targets for each key management personnel as agreed at the beginning of the financial year with the Board and/or the President & GCEO, as the case may be.
Under the Balanced Scorecard framework, the Group’s strategy and goals are translated to performance outcomes comprising both quantitative and qualitative targets in the dimensions of Financial, Execution, Future Growth and Sustainability; these are cascaded down throughout the organisation, thereby creating alignment across the Group.
After the close of each year, the ERCC reviews the Group’s achievements against the targets set in the Balanced Scorecard, determines the overall performance taking into consideration qualitative factors such as the quality of earnings, business environment, regulatory landscape and industry trends, and approves a bonus pool that corresponds to the performance achieved.
In determining the payout quantum for each key management personnel under the plan, the ERCC considers the overall business performance and individual performance as well as the affordability of the payout for the Company.
Economic Value-Added-based Incentive Plan The EBIP is based on sharing with employees a portion of the EVA, which varies according to the actual achievement of residual economic profit.
The EBIP rewards sustainable shareholder value creation over the medium term achieved by growing profits, deploying capital efficiently and managing the risk profile and risk time horizon of a real estate business.
Under this plan, the bonus declared to each EBIP participant for the current year is added to the participant’s balance carried forward from the previous year, upon which one-third of the resulting total amount is paid out in cash, with the remaining two-thirds to be carried forward to the following year. The balance in each participant’s EBIP account is at risk because a significant reduction in EVA in any year may result in retraction (performance clawback) of the EBIP bonus declared in preceding years. The EBIP encourages key management personnel to work for sustained EVA generation and to take actions that are aligned with the longer term interests of shareholders.
In determining the EBIP bonus declared to each participant, the ERCC considers the overall business performance, individual job responsibilities, performance and contribution, as well as the relevant market remuneration benchmarks.
C. Share-based Components:Share awards were granted in FY 2018 pursuant to the CapitaLand Performance Share Plan 2010 (PSP) and the CapitaLand Restricted Share Plan 2010 (RSP) (together, the Share Plans), approved and adopted by the shareholders of the Company at the Extraordinary General Meeting held on 16 April 2010.
For FY 2018, the total number of shares in the awards granted under the Share Plans did not exceed the yearly limit of 1% of the total number of issued shares (excluding treasury shares). The obligation to deliver the shares is expected to be satisfied out of treasury shares.
Details of the Share Plans as well as awards granted under the Share Plans are given in the Share Plans section of the Directors’ Statement on pages 129 to 131 and the Equity Compensation Benefits section of the Notes to the FY 2018 Financial Statements on pages 212 to 217.
CapitaLand Performance Share Plan 2010In FY 2018, the ERCC granted awards which are conditional on targets set for a three-year performance period. A specified number of shares will only be released to recipients at the end of the qualifying performance period, provided that minimally the threshold targets are achieved.
Cap
itaL
and
Lim
ited
Ann
ual R
epor
t 20
18
49
CORPORATE GOVERNANCE & TRANSPARENCY

CORPORATEGOVERNANCE
Under the PSP, an initial number of shares (baseline award) is allocated according to the following performance conditions:
(a) Absolute Total Shareholder Return (TSR) of the Group measured as a multiple of Cost of Equity; (b) Relative TSR of the Group measured by the percentile ranking of the Group’s TSR against those of a peer
group comprising public-listed companies of comparable scale, scope and business mix in Singapore, Hong Kong and China; and
(c) Average ROE of the Group over the three years of the performance period.
The above performance measures have been selected as key measurements of wealth creation for shareholders. The final number of shares to be released will depend on the achievement of pre-determined targets over the three-year qualifying performance period. No share will be released if the threshold targets are not met at the end of the qualifying performance period. On the other hand, if superior targets are met, more shares than the baseline award can be delivered up to a maximum of 200% of the baseline award. Recipients will receive fully paid shares at no cost.
For the year under review, the relevant award for assessment of the performance achieved by the Group is the award granted in FY 2016 where the qualifying performance period was FY 2016 to FY 2018. Based on the ERCC’s assessment that the performance achieved by the Group has partially met the pre-determined performance targets for such performance period, the resulting number of shares released has been adjusted accordingly to reflect the performance level. In respect of the share awards granted in FY 2017 and FY 2018, the respective qualifying performance periods have not ended as at the date of this Report.
CapitaLand Restricted Share Plan 2010In FY 2018, the ERCC granted awards which are conditional on targets set for a one-year performance period. A specified number of shares will only be released to recipients at the end of the qualifying performance period, provided that minimally the threshold targets are achieved.
Under the RSP, an initial number of shares (baseline award) is allocated according to the following performance conditions:
(a) Operating EBIT of the Group; and(b) Operating ROE of the Group.
The above performance measures have been selected as they are the key drivers of business performance and are aligned to shareholder value. The final number of shares to be released will depend on the achievement of pre-determined targets at the end of the one-year qualifying performance period. The shares will be released over a vesting period of three years. No share will be released if the threshold targets are not met at the end of the qualifying performance period. On the other hand, if superior targets are met, more shares than the baseline award can be delivered up to a maximum of 150% of the baseline award. Recipients can receive fully paid shares, their equivalent cash value or combinations thereof, at no cost.
In respect of the award granted in FY 2018, based on the ERCC’s assessment that the performance achieved by the Group has met the pre-determined performance targets for FY 2018, the resulting number of shares released has been adjusted accordingly to reflect the performance level.
To further promote the alignment of Management’s interests with that of shareholders, the ERCC has approved share ownership guidelines for Senior Management to instill stronger identification by senior executives with the longer term performance and growth of the Group. Under these guidelines, Senior Management participants are required to retain a prescribed proportion of the Company’s shares received under the Share Plans.
D. Employee Benefits:The benefits provided are comparable with local market practices.
The Code requires an issuer to disclose the names and remuneration of at least the top five key management personnel (who are not also Directors or the President & GCEO) of the Company.
The details of the remuneration for the President & GCEO are provided in the Directors’ and President & GCEO’s Remuneration section on page 61 of this Annual Report. The details of the other top five key management personnel’s remuneration in bands of S$250,000 and a breakdown in percentage terms are provided in the Key Management Personnel’s Remuneration section on page 62 of this Annual Report.
Cap
itaL
and
Lim
ited
Ann
ual R
epor
t 20
18
50
CORPORATE GOVERNANCE & TRANSPARENCY

The ERCC seeks to ensure that the remuneration paid to the President & GCEO and key management personnel are strongly linked to the achievement of business and individual performance targets. The performance targets endorsed by the ERCC and approved by the Board are set at realistic yet stretched levels each year to motivate a high degree of business performance with emphasis on both short and longer term quantifiable objectives. A pay-for-performance alignment study was conducted by the appointed independent remuneration consultant and reviewed by the ERCC; the findings indicate that there has been adequate pay-for-performance alignment for the Group in both absolute and relative terms against a peer group of large listed companies in Singapore and the region over a multi-year period.
In FY 2018, there were no termination, retirement or post-employment benefits granted to Directors, the President & GCEO and key management personnel. There was also no special retirement plan, ‘golden parachute’ or special severance package for any of the key management personnel.
There were no employees of the Group who were substantial shareholders or immediate family members of a substantial shareholder, Director or the President & GCEO in FY 2018. “Immediate family member” refers to the spouse, child, adopted child, step-child, sibling or parent of the individual.
Non-Executive Director RemunerationThe compensation policy for Directors is based on a scale of fees divided into basic retainer fees for serving as Director and additional fees for attendance and serving on Board Committees. The compensation package is market benchmarked, taking into account the demanding responsibilities on the part of the Directors in light of the scale, complexity and the international nature of the business.
A review of the remuneration framework for the non-executive Directors for FY 2018 was conducted. The review resulted in an increase in the appointment fees for the NC Chairman, from S$28,000 to S$35,000 and for each NC member, from S$20,000 to S$22,000. This would align the appointment fees of the NC with those of the ERCC and RC. Apart from these changes, the fee structure remains the same as that for the previous financial year. The fee structure for non-executive Directors for FY 2018 is as follows:
Basic Retainer Fee S$
Board Chairman 750,0001
Director 78,000
Fee for appointment to Audit Committee and Strategy, Investment & Finance Committee
Committee Chairman 60,000
Committee member 30,000
Fee for appointment to any other Board Committees
Committee Chairman 35,000
Committee member 22,000
Attendance fee for Board/Board Committee meetings (per meeting)
(a) Attendance in person
Board meetingLocalOverseas
4,0007,000
Board Committee meetingLocalOverseas
2,2007,000
(b) Attendance via conference telephone or similar communication equipment
Local and Overseas 1,700
Attendance fee in person or otherwise for project committee meetings/verificationmeetings/other meetings where attendance of Directors is required (per meeting)
Local and Overseas 1,000
1 The fee is all-inclusive and there will be no separate board retainer fee, committee fee or attendance fee for the Chairman.
Cap
itaL
and
Lim
ited
Ann
ual R
epor
t 20
18
51
CORPORATE GOVERNANCE & TRANSPARENCY

CORPORATEGOVERNANCE
Directors’ fees of the non-executive Directors (including the Chairman) will be paid as to about 70% in cash and about 30% in the form of share awards under the RSP, save in the case of (i) a Director who is retiring from the Board at the conclusion of the AGM, and a Director who retired from the Board at the conclusion of the last AGM, both of whom will receive their Directors’ fees wholly in cash; and (ii) a Director whose Director’s fees will be paid fully in cash to a government agency, the Directorship & Consultancy Appointments Council. The awards consist of the grant of fully paid shares, with no performance conditions attached and no vesting periods imposed. In order to encourage the alignment of the interests of the non-executive Directors with the interests of shareholders, a non-executive Director is required to hold shares in the Company worth at least one year of his or her basic retainer fee or the total number of shares awarded under the above policy, whichever is lower, at all times during his or her Board tenure. For the Chairman, the shares are required to be held for at least two years from the date of award, and the two-year moratorium shall continue to apply in the event of retirement. Details of the Directors’ remuneration are provided in the Directors’ and President & GCEO’s Remuneration section on page 61 of this Annual Report. The President & GCEO who is also a Director is remunerated as part of key management personnel and therefore does not receive any Director’s fees. No individual Director by himself or herself could decide his or her own remuneration. The Directors’ fees will only be paid upon approval by the shareholders at the AGM. These measures serve to assure that the independence of the non-executive Directors is not compromised by their compensation.
Compensation Risk Assessment
Under the Code, the compensation system shall take into account the risk policies of the Group, and be symmetrical with risk outcomes and sensitive to the time horizon of risks. The ERCC has conducted a Compensation Risk Assessment to review the various compensation risks that may arise as well as the mitigating policies to better manage risk exposures identified. The ERCC is satisfied that there are adequate risk mitigation features in the Group’s compensation system, such as the use of malus, deferral and performance clawback features in the Share Plans and EBIP. The ERCC will continue to undertake periodic reviews of compensation-related risks.
(C) ACCOUNTABILITY AND AUDIT
Accountability
Principle 10:The Board should present a balanced and understandable assessment of the company’s performance, position and prospects.
The Company provides shareholders with quarterly and annual financial statements within the relevant periods prescribed by the Listing Manual. These quarterly and annual financial statements are reviewed and approved by the Board prior to release to shareholders by announcement on the SGXNet. The releases of quarterly and annual financial statements are accompanied by news releases issued to the media and which are also posted on the SGXNet. In presenting the quarterly and annual financial statements to shareholders, the Board aims to provide shareholders with a balanced, clear and understandable assessment of the Company and the Group’s performance, position and prospects. In order to achieve this, Management provides the Board with management accounts on a monthly basis and such explanation and information as any Director may require, to enable the Directors to keep abreast, and make a balanced and informed assessment, of the Group’s financial performance, position and prospects.
In addition to quarterly and annual financial statements, the Company also keeps its shareholders, stakeholders and analysts informed of the performance and changes in the Group or its business which would likely materially affect the price or value of the Company’s securities on a timely and consistent basis, so as to assist shareholders and investors in their investment decisions. The Group has a formal policy on corporate disclosure controls and procedures to ensure that the Company complies with its disclosure obligations under the Listing Manual. These controls and procedures incorporate decision-making procedures and an obligation on internal reporting of decisions made.
The Company believes in conducting itself in ways that seek to deliver maximum sustainable value to its shareholders. Best practices are promoted as a means to build an excellent business for its shareholders and the Company is accountable to shareholders for its performance. Prompt fulfilment of statutory reporting requirements is but one way to maintain shareholders’ confidence and trust in the capability and integrity of the Company.
Cap
itaL
and
Lim
ited
Ann
ual R
epor
t 20
18
52
CORPORATE GOVERNANCE & TRANSPARENCY

Risk Management and Internal Controls
Principle 11:The Board is responsible for the governance of risk. The Board should ensure that Management maintains a sound system of risk management and internal controls to safeguard shareholders’ interests and the company’s assets, and should determine the nature and extent of the significant risks which the Board is willing to take in achieving its strategic objectives.
The Company maintains an adequate and effective system of risk management and internal controls addressing material financial, operational, compliance and IT risks to safeguard shareholders’ interests and the Group’s assets.
The Board has overall responsibility for the governance of risk, including determining the risk strategy, risk appetite and risk limits, as well as risk policies. The RC assists the Board in carrying out the Board’s responsibility of overseeing the Company’s risk management framework and policies for the Group.
Under its terms of reference, the RC’s scope of duties and responsibilities is as follows:
(a) making recommendations to the Board on risk strategy, risk appetite and risk limits; (b) reviewing the risk management framework, including the processes and resources to identify and manage
material risks; (c) overseeing the design, implementation and monitoring of the risk management and internal controls systems;(d) reviewing the material risks facing the Group and the management of risks thereof; (e) reviewing the adequacy and effectiveness of the risk management and internal controls systems covering
material risks and the assurance given by Management, as well as the disclosures in the Annual Report; and (f) considering and advising on risk matters referred to it by the Board or Management.
All RC members, including the Chairman of the RC, are non-executive independent Directors. To facilitate sharing of information and knowledge, three members of the RC are also members of the AC (Tan Sri Amirsham A Aziz, Mr Chaly Mah and Mr Gabriel Lim). The RC met twice in FY 2018.
The Group adopts an Enterprise Risk Management (ERM) Framework which sets out the required environmental and organisational components for managing risk in an integrated, systematic and consistent manner. The ERM Framework and related policies are reviewed annually. A team comprising the President & GCEO and other key management personnel is responsible for directing and monitoring the development, implementation and practice of ERM across the Group.
As part of the ERM Framework, Management, among other things, undertakes and performs a Group-wide Risk and Control Self-Assessment (RCSA) annually to identify material risks along with their mitigating measures.
The systems of risk management and internal controls are reviewed at least annually by Management, the RC, the AC and the Board, taking into account the best practices and guidance in the Risk Governance Guidance for Listed Boards issued by the Corporate Governance Council and the Listing Manual.
The Group Risk Appetite Statement (RAS), incorporating the Group’s risk limits, addresses the management of material risks faced by the Group. Alignment of the Group’s risk profile to the Group RAS is achieved through various communication and monitoring mechanisms (including key performance indicators set for Management) put in place across the Group.
More information on the Group’s ERM Framework can be found in the Enterprise Risk Management section on pages 70 to 73 of this Annual Report.
The internal and external auditors conduct reviews of the adequacy and effectiveness of the material internal controls (including financial, operational, compliance and IT controls) and risk management systems. This includes testing, where practicable, material internal controls in areas managed by external service providers. Any material non-compliance or lapses in internal controls together with corrective measures recommended by the internal and external auditors are reported to and reviewed by the AC. The AC also reviews the adequacy and effectiveness of the measures taken by Management on the recommendations made by the internal and external auditors in this respect.
Cap
itaL
and
Lim
ited
Ann
ual R
epor
t 20
18
53
CORPORATE GOVERNANCE & TRANSPARENCY

CORPORATEGOVERNANCE
The Board has received assurance from the President & GCEO and the GCFO that:
(a) the financial records of the Group have been properly maintained and the financial statements for FY 2018 give a true and fair view of the Group’s operations and finances; and
(b) the systems of risk management and internal controls within the Group are adequate and effective to address the risks (including financial, operational, compliance and IT risks) which the Company considers relevant and material to its current business environment.
The President & GCEO and the GCFO have obtained similar assurances from the respective business and corporate executive heads in the Group.
In addition, in FY 2018, the Board received quarterly certification by Management on the integrity of financial reporting and the Board provided a negative assurance confirmation to shareholders as required by the Listing Manual.
Based on the ERM Framework established and the reviews conducted by Management and both the internal and external auditors, as well as the assurance from the President & GCEO and the GCFO, the Board is of the opinion that the systems of risk management and internal controls within the Group are adequate and effective to address the risks (including financial, operational, compliance and IT risks) which the Company considers relevant and material to its current business environment as at 31 December 2018. The AC and RC concur with the Board in its opinion. No material weaknesses in the systems of risk management and internal controls were identified by the Board, the AC or the RC in the review for FY 2018.
The Board notes that the systems of risk management and internal controls established by Management provide reasonable assurance that the Group, as it strives to achieve its business objectives, will not be significantly affected by any event that can be reasonably foreseen or anticipated. However, the Board also notes that no system of risk management and internal controls can provide absolute assurance in this regard, or absolute assurance against poor judgement in decision-making, human error, losses, fraud or other irregularities.
Audit Committee
Principle 12:The Board should establish an Audit Committee with written terms of reference which clearly set out its authority and duties.
All members of the AC, including the Chairman of the AC, are non-executive independent Directors. The members bring with them invaluable recent and relevant managerial and professional expertise in accounting and related financial management domains; in particular the Chairman of the AC is a Fellow of the Institute of Singapore Chartered Accountants, among other professional affiliations, and Tan Sri Amirsham A Aziz, another AC member, is a Certified Public Accountant of Malaysia. The AC does not comprise members who were partners or directors of the incumbent external auditors, KPMG LLP within the period of 12 months commencing on the date of their ceasing to be a partner or director of KPMG LLP. The AC also does not comprise any member who has any financial interest in KPMG LLP.
The AC has explicit authority to investigate any matter within its terms of reference. Management provides the fullest co-operation in providing information and resources, and in implementing or carrying out all requests made by the AC. The AC has direct access to the internal and external auditors and full discretion to invite any Director or executive officer to attend its meetings. Similarly, both the internal and external auditors have unrestricted access to the AC.
Cap
itaL
and
Lim
ited
Ann
ual R
epor
t 20
18
54
CORPORATE GOVERNANCE & TRANSPARENCY

Under its terms of reference, the AC’s scope of duties and responsibilities is as follows:
(a) reviewing the significant financial reporting issues and judgements so as to ensure the integrity of the financial statements of the Company and any announcements relating to the Company’s financial performance;
(b) in conjunction with the assessment by the RC, reviewing the adequacy and effectiveness of the internal controls (including material financial, operational, compliance and IT controls) and risk management system;
(c) reviewing the adequacy, effectiveness, independence, scope and results of the Company’s internal audit function;
(d) reviewing the adequacy, effectiveness, independence, objectivity, scope and results of the external audit; (e) making recommendations to the Board on the proposals to the shareholders on the appointment, reappointment
and removal of the external auditors, and approving the remuneration of the external auditors; (f) reviewing the assurances from the President & GCEO and GCFO on the financial records and financial
statements of the Company;(g) reviewing and approving processes to regulate interested person transactions and to ensure compliance with
the applicable regulations, in particular, the requirement that the transactions are on normal commercial terms and are not prejudicial to the interests of the Company and its minority shareholders; and
(h) reviewing the whistle-blowing policy and arrangements by which employees of the Company and any other persons may, in confidence, report suspected fraud or irregularity or suspected infringement of any laws or regulations or rules, or raise concerns about possible improprieties in matters of financial reporting or other matters with a view to ensuring that arrangements are in place for such concerns to be raised and independently investigated, and for appropriate follow-up action to be taken.
In order to maintain the independence of the external auditors, the Company has developed policies regarding the types of non-audit services that the external auditors can provide to the Group and the related approval processes. The AC has reviewed the nature and extent of non-audit services provided by the external auditors in FY 2018 and the fees paid for such services. The AC is satisfied that the independence of the external auditors is not impaired by the provision of those services. The external auditors have also provided confirmation of their independence to the AC. The total audit and non-audit fees for FY 2018 were S$8,831,000 and S$1,447,000, respectively.
The AC met four times in FY 2018. The AC also met with the internal and external auditors, separately and without Management’s presence, to discuss the reasonableness of the financial reporting process, the system of internal controls, and the significant comments and recommendations by the auditors. Where relevant, the AC makes reference to best practices and guidance for Audit Committees in Singapore including practice directions issued from time to time in relation to the Financial Reporting Surveillance Programme administered by the Accounting and Corporate Regulatory Authority of Singapore.
In its review of the financial statements of the Group and the Company for FY 2018, the AC had discussed with Management the accounting principles that were applied and their judgement of items that could affect the integrity of the financial statements and also considered the clarity of key disclosures in the financial statements. The AC reviewed, amongst other matters, the following key audit matters as reported by the external auditors for FY 2018. C
apit
aLan
d L
imit
edA
nnua
l Rep
ort
2018
55
CORPORATE GOVERNANCE & TRANSPARENCY

CORPORATEGOVERNANCE
Key audit matters How these issues were addressed by the AC
Valuation of investment properties
The AC reviewed the outcomes of the half-yearly valuation process and discussed the details of the valuation with Management, focusing on properties which registered higher fair value gains/losses during the period under review and key drivers for the changes.
The AC considered the findings of the external auditors, including their assessment of the appropriateness of valuation methodologies and the underlying key assumptions applied in the valuation of investment properties.
The AC was satisfied with the valuation process, the methodologies used and the valuation for investment properties as adopted and disclosed in the financial statements.
Implementation of new IT system in China
Management updated the AC and the Board on the progress of new IT system implementation, focusing on project governance, change management activities, risks and mitigation actions.
The AC considered the findings of the external auditors, including their assessment of the adequacy of the processes and controls in place for the implementation of new IT system, as well as the results of their independent validation of the account balances being migrated and review of the reconciliation and mitigating controls. The AC also considered updates by Management and Management’s responses to the external auditors’ findings.
The AC was satisfied with the Group’s processes and project governance over the implementation of the new IT system.
Changes to the accounting standards and accounting issues which have a direct impact on the financial statements are reported to and discussed with the AC at its meetings. Directors are also invited to attend relevant seminars on changes to accounting standards and issues by leading accounting firms.
The Company confirms that it complies with Rules 712, 715 and 716 of the Listing Manual.
Internal Audit
Principle 13:The company should establish an effective internal audit function that is adequately resourced and independent of the activities it audits.
The Company has an Internal Audit Department (CL IA). The primary reporting line of CL IA is to the AC. The appointment, termination, remuneration and performance evaluation of the head of CL IA is carried out by the AC with inputs from the GCFO.
The AC has carried out a review and is of the view that the internal audit function performed by CL IA is adequately resourced, effective and independent.
CL IA plans its internal audit schedules in consultation with, but independently of, Management and its plan is submitted to the AC for approval prior to the beginning of each year.
The AC also meets with CL IA at least once a year without the presence of Management. CL IA has unfettered access to the Group’s documents, records, properties and employees, including access to the AC, and has appropriate standing within the Company.
CL IA is adequately resourced and staffed with persons with the relevant qualifications and experience. CL IA is a corporate member of the Singapore branch of the Institute of Internal Auditors Inc. (IIA), which has its headquarters in the United States of America U.S.. CL IA subscribes to, and is guided by, the International Standards for the Professional Practice of Internal Auditing (Standards) developed by the IIA, and has incorporated these Standards into its audit practices.
Cap
itaL
and
Lim
ited
Ann
ual R
epor
t 20
18
56
CORPORATE GOVERNANCE & TRANSPARENCY

To ensure that internal audits are performed by competent professionals, CL IA recruits and employs suitably qualified professional staff with the requisite skill sets and experience. For instance, CL IA staff who are involved in IT audits are Certified Information System Auditors and members of the Information System Audit and Control Association (ISACA) in the U.S.. The ISACA Information System Auditing Standards provide guidance on the standards and procedures to be applied in IT audits. CL IA identifies and provides training and development opportunities for its staff to ensure their technical knowledge and skill sets remain current and relevant. (D) SHAREHOLDER RIGHTS AND RESPONSIBILITIES
Shareholder Rights
Principle 14:Companies should treat all shareholders fairly and equitably, recognise, protect and facilitate the exercise of shareholders’ rights, and continually review and update such governance arrangements.
The Company is committed to treating all its shareholders fairly and equitably. All shareholders enjoy specific rights under the Constitution and the relevant laws and regulations. These rights include, among other things, the right to participate in profit distributions. They are also entitled to attend general meetings and are accorded the opportunity to participate effectively and vote at general meetings (including through the appointment of up to two proxies, if they are unable to attend in person or in the case of a corporate shareholder, through its appointed representative). Shareholders such as nominee companies which provide custodial services for securities are not constrained by the two proxy limitation, and are able to appoint more than two proxies to attend, speak and vote at general meetings of the Company.
Communication with Shareholders
Principle 15:Companies should actively engage their shareholders and put in place an investor relations policy to promote regular, effective and fair communication with shareholders.
The Company is committed to keeping all its shareholders, other stakeholders, analysts and the media informed of its performance and any changes in the Group or its business which would likely materially affect the price or value of the Company’s securities. This is performed on a timely and consistent basis to assist shareholders and investors in their investment decisions.
The Company has in place an Investor Relations department and a Group Communications department, both of which facilitate effective communication with the Company’s shareholders, analysts, fund managers and the media.
The Company actively engages with its shareholders and has put in place an Investor Relations Policy (Policy) to promote regular, effective and fair communications with its shareholders. The Policy is available on the Group’s website at www.capitaland.com.
The Group has a formal policy on corporate disclosure controls and procedures to ensure that the Company complies with its disclosure obligations under the Listing Manual.
More information on the Company’s investor and media relations efforts can be found in the Investor & Media Relations section on pages 74 to 77 of this Annual Report.
The Company has a policy on the payment of dividends. Barring unforeseen circumstances, the Company’s policy is to declare a dividend of at least 30% of the annual profit after tax and non-controlling interests excluding unrealised revaluation gains or losses as well as impairment charges or write backs. Upon approval by shareholders at the general meeting, dividends are paid within 15 market days of the record date.
Cap
itaL
and
Lim
ited
Ann
ual R
epor
t 20
18
57
CORPORATE GOVERNANCE & TRANSPARENCY
CORPORATEGOVERNANCE
Conduct of Shareholder Meetings Principle 16:Companies should encourage greater shareholder participation at general meetings of shareholders, and allow shareholders the opportunity to communicate their views on various matters affecting the company.
The Company supports the principle of encouraging shareholder participation and voting at general meetings. Shareholders may download the Annual Report (printed copies are available upon request) and notice of the general meeting from the Company’s website at www.capitaland.com. The notice of general meeting is also advertised in the press and issued on SGXNet. More than the requisite notice period for general meetings is generally provided. The rationale and explanation for each agenda item which requires shareholders’ approval are provided in the notice of general meeting. All shareholders are given the opportunity to participate effectively in and vote at general meetings.
At AGMs, the President & GCEO makes a presentation to shareholders to update them on the Company’s performance, position and prospects. The presentation materials are made available to shareholders on the Company’s website and SGXNet. Shareholders are given the opportunity to communicate their views and discuss with the Board and Management matters affecting the Company. All Directors (including the chairpersons of the respective Board Committees), Management and the external auditors, are present for the entire duration of general meetings to address any queries that the shareholders may have. Directors and Management also interact with shareholders after the general meetings. All Directors attended the last general meeting with the exception of Mr John Powell Morschel who was unwell. A record of the Directors’ attendance of the last general meeting held on 30 April 2018 can be found in the record of their attendance of Shareholders, Board and Board Committee meetings set out on page 60 of this Annual Report.
To safeguard shareholder interests and rights, a separate resolution is proposed for each substantially separate issue at general meetings. To ensure transparency in the voting process and better reflect shareholders’ interests, the Company conducts electronic poll voting for all the resolutions proposed at the general meetings. One ordinary share is entitled to one vote. Voting procedures are explained and vote tabulations are disclosed at the general meetings. An independent scrutineer is also appointed to validate the vote tabulation procedures. Votes cast, for or against and the respective percentages, on each resolution are tallied and displayed ‘live’ on-screen to shareholders immediately at the general meetings. The total number of votes cast for or against the resolutions and the respective percentages are also announced on SGXNet after the general meetings. Voting in absentia and by email, which are currently not permitted, may only be possible following careful study to ensure that the integrity of information and authentication of the identity of shareholders through the web are not compromised, and legislative changes are effected to recognise remote voting.
Minutes of the general meetings, recording the substantial and relevant comments made and questions raised, are prepared and are available to shareholders for their inspection upon request. Minutes of general meetings are also uploaded to the Company’s website at www.capitaland.com.
(E) ADDITIONAL INFORMATION
Board Code of Business Conduct & Ethics, and Board Diversity Policy
In addition to the corporate goverance practices set out above, the Board has also adopted the following policies:
(a) Board Code of Business Conduct & Ethics: Ethics and integrity of action are core values of the Company. In keeping with these core values, the Board has adopted a Board Code of Business Conduct & Ethics which provides for every Director to, among other things, adhere to the highest standards of ethical conduct, which includes not allowing himself/herself to get into a situation where there is a conflict between his/her duty to the Company and his/her own interests.
(b) Board Diversity Policy: The Board Diversity Policy provides for the Board to comprise talented and dedicated Directors with a diverse mix of expertise, experience, perspectives, skills and backgrounds, with due consideration to diversity, including but not limited to, diversity in business or professional experience, age and gender.
Cap
itaL
and
Lim
ited
Ann
ual R
epor
t 20
18
58
CORPORATE GOVERNANCE & TRANSPARENCY

Dealings in SecuritiesThe Company has devised and adopted a securities dealing policy for the Group’s officers and employees which applies the best practice recommendations in the Listing Manual. Under the policy, Directors and employees in the Group are required to refrain from dealing in the Company’s securities (i) while in possession of material unpublished price-sensitive information, (ii) during the two weeks immediately preceding, and up to the time of the announcement of the Company’s financial statements for each of the first three quarters of its financial year and, (iii) during the one month immediately preceding, and up to the time of the announcement of the Company’s financial statements for the full financial year. Prior to the commencement of each relevant period, an email would be sent out to all Directors and employees of the Group to inform them of the duration of the period.
Directors and employees of the Group are also required to refrain from dealing in securities of the Company and/or other relevant listed entities in the Group if they are in possession of unpublished price-sensitive information of the Company and/or these other listed entities arising from their appointment as Directors and/or in the course of performing their duties. As and when appropriate, they would be issued an advisory to refrain from dealing in the relevant securities.
Under the policy, Directors and employees are also discouraged from trading on short-term or speculative considerations. They are also prohibited from using any information with respect to other companies or entities obtained in the course of their employment in connection with securities transactions of such companies or entities.
Any dealings by the Directors in securities of the Company are disclosed, in accordance with the requirements in the Securities and Futures Act, Chapter 289.
Code of Business ConductThe Company adheres to an ethics and code of business conduct policy which deals with issues such as confidentiality, conduct and work discipline, corporate gifts and concessionary offers. Clear policies and guidelines on how to handle workplace harassment and grievances are also in place.
The policies and guidelines are published on the Company’s Intranet, which is accessible by all employees.
The policies the Company has implemented aim to help to detect and prevent occupational fraud in mainly three ways.
First, the Company offers fair compensation packages, based on practices of pay-for-performance and promotion based on merit to its employees. The Company also provides various healthcare subsidies and financial assistance schemes to alleviate the common financial pressures its employees face.
Second, clearly documented policies and work procedures incorporate internal controls which ensure that adequate checks and balances are in place. Periodic audits are also conducted to evaluate the efficacy of these internal controls.
Finally, the Company seeks to build and maintain the right organisational culture through its core values, educating its employees on good business conduct and ethical values.
Fraud, Bribery and Corruption Risk Management PolicyIn line with CapitaLand’s core values, the Company is committed to doing business with integrity. This is reflected in its longstanding zero tolerance stance against fraud, bribery and corruption. Consistent with this commitment, various policies and guidelines are in place to guide all employees to maintain the highest standards of integrity in their work and business dealings. This includes clear guidelines and procedures for the giving and receipt of corporate gifts and concessionary offers, and an annual pledge by all employees of the Group to uphold the Company’s core values and to not engage in any corrupt or unethical practices. The Company’s zero tolerance policy on bribery and corruption extends to its business dealings with third parties. Pursuant to this policy, the Company requires that certain agreements of the Group incorporate anti-bribery and anti-corruption provisions.
In FY 2018, the Company carried out a comprehensive review which resulted in the Company consolidating, streamlining and adopting a Fraud, Bribery and Corruption Risk Management Policy (“FBC Risk Management Policy”) which was approved by the Audit Committee and endorsed by the Board. The FBC Risk Management Policy reiterates the Company’s strong stance against fraud, bribery and corruption, and sets the overarching approach and standards in managing fraud, bribery and corruption risks in an integrated, systematic and consistent manner. The Company’s stance against bribery and corruption is also reiterated by Management during its regular staff communication sessions.
Cap
itaL
and
Lim
ited
Ann
ual R
epor
t 20
18
59
CORPORATE GOVERNANCE & TRANSPARENCY

CORPORATEGOVERNANCE
Whistle-Blowing PolicyA whistle-blowing policy and other procedures are put in place to provide the Group’s employees and parties who have dealings with the Group with well defined, accessible and trusted channels to report suspected fraud, corruption, dishonest practices or other improprieties in the workplace, and for the independent investigation of any reported incidents and appropriate follow up action. The objective of the whistle-blowing policy is to encourage the reporting of such matters – that employees or external parties making any reports in good faith will be able to do so with the confidence that they will be treated fairly and, to the extent possible, be protected from reprisal.
Composition Of Board Committees In 2018
Board MembersAudit
Committee
Executive Resource
and Compensation
Committee
Strategy, Investment and Finance Committee
Nominating Committee
Risk Committee
Ng Kee Choe C C MJohn Powell Morschel1 M MEuleen Goh Yiu Kiang M MTan Sri Amirsham A Aziz M CStephen Lee Ching Yen M CDr Philip Nalliah Pillai2 M M MKee Teck Koon M MChaly Mah Chee Kheong C MAnthony Lim Weng Kin MGabriel Lim Meng Liang M MGoh Swee Chen M
Denotes: C – Chairman M – Member
Notes:1 Stepped down as a Director, and a Member of the SIFC and the NC at the conclusion of the AGM held on 30 April 2018.2 Stepped down as a Member of the RC on 30 April 2018 and appointed as a Member of the NC on 1 May 2018.
Attendance Record Of Meetings Of Shareholders, Board And Board Committees In 2018
BoardAh-Hoc Board
AuditCommittee
Executive Resource and Compensation
Committee
Strategy, Investment and Finance Committee
NominatingCommittee
RiskCommittee AGM
No. of Meetings Held 6 1 4 5 13 3 2 1
Board MembersNg Kee Choe 6 out of 6 1 out of 1 - 5 out of 5 13 out of 13 3 out of 3 - 1 out of 1
Lim Ming Yan1 6 out of 6 -2 - - - - - 1 out of 1
John Powell Morschel3 1 out of 1 - - - 4 out of 4 2 out of 2 - -4
Euleen Goh Yiu Kiang 6 out of 6 0 out of 1 - - 13 out of 13 - 2 out of 2 1 out of 1
Tan Sri Amirsham Bin A Aziz 6 out of 6 1 out of 1 4 out of 4 - - - 2 out of 2 1 out of 1
Stephen Lee Ching Yen 6 out of 6 1 out of 1 - 5 out of 5 - 3 out of 3 - 1 out of 1
Dr Philip Nalliah Pillai5 6 out of 6 1 out of 1 4 out of 4 - - 1 out of 1 1 out of 1 1 out of 1
Kee Teck Koon 6 out of 6 1 out of 1 - 5 out of 5 13 out of 13 - - 1 out of 1
Chaly Mah Chee Kheong 6 out of 6 1 out of 1 4 out of 4 - - - 2 out of 2 1 out of 1
Anthony Lim Weng Kin 5 out of 6 1 out of 1 - - 12 out of 13 - - 1 out of 1
Gabriel Lim Meng Liang 5 out of 6 1 out of 1 4 out of 4 - - - 2 out of 2 1 out of 1
Goh Swee Chen 6 out of 6 1 out of 1 - 5 out of 5 - - - 1 out of 1
Notes:1 Attended all Board committee meetings on an ex officio basis and stepped down as President & GCEO on 15 September 2018 and a Director on
31 December 2018.2 Recused due to conflicts of interest.3 Stepped down as a Director, and a Member of the SIFC and the NC at the conclusion of the AGM held on 30 April 2018.4 Absent as he was unwell.5 Stepped down as a Member of the RC on 30 April 2018 and appointed as a Member of the NC on 1 May 2018.
Cap
itaL
and
Lim
ited
Ann
ual R
epor
t 20
18
60
CORPORATE GOVERNANCE & TRANSPARENCY

Directors’ and President & GCEO’s Remuneration Table For The Financial Year Ended 31 December 2018
Directors and President & GCEO of the Company
Salary inclusive
of AWS and employer’s
CPF$
Bonus and other benefits
inclusive of employer’s
CPF1
$
Awards of shares2
$
Directors’ fees3
Total$
Cash component
$
Shares component
$
Director and President & GCEOLim Ming Yan4 1,151,730 1,174,391 1,096,537 - - 3,422,658
President & GCEOLee Chee Koon5 813,840 2,536,656 860,462 - - 4,210,958
Sub-Total 1 1,965,570 3,711,047 1,956,999 - - 7,633,616
Non-Executive DirectorsNg Kee Choe - - - 525,000 225,000 750,000John Powell Morschel3 - - - 65,241 - 65,241Euleen Goh Yiu Kiang3 - - - 187,000 - 187,000Tan Sri Amirsham A Aziz - - - 160,090 68,610 228,700Stephen Lee Ching Yen - - - 126,070 54,030 180,100Dr Philip Nalliah Pillai - - - 118,230 50,671 168,901Kee Teck Koon - - - 136,360 58,440 194,800Chaly Mah Chee Kheong - - - 137,620 58,980 196,600Anthony Lim Weng Kin - - - 113,890 48,810 162,700Gabriel Lim Meng Liang3 - - - 161,100 - 161,100Goh Swee Chen - - - 96,950 41,550 138,500Sub-Total 2 - - - 1,827,551 606,091 2,433,642Total for Directors and President & GCEO of the Company
1,965,570 3,711,047 1,956,999 2,433,642 10,067,258
Notes:1 The amounts disclosed include bonuses earned under the EBIP and the other incentive plans which have been accrued for in FY 2018. Under the
EBIP, EVA bonus declared during the year is added to the bonus account and one-third of the accumulated balance in the bonus account will be paid out in cash annually with the remaining two-thirds to be carried forward to the following year; any negative EVA bonus declared will result in an offset against the current EVA bonus balance.
2 For FY 2018, contingent awards of shares under the Share Plans were granted to Mr Lim Ming Yan and Mr Lee Chee Koon. The final number of shares to be released under these awards will depend on the achievement of pre-determined targets over the respective performance periods and vesting periods under the Share Plans. The share awards disclosed are based on the fair value of the shares comprised in the contingent awards at the time of grant. There was no contingent award of RSP or PSP to the other Directors.
3 If approved, the aggregate amount of Directors’ fees of S$2,433,642 will be paid as to S$1,827,551 in cash, and S$606,091 in the form of share awards under the RSP with any residual balance to be paid in cash. Directors’ fees of the non-executive Directors (including the Chairman) will be paid as to about 70% in cash and about 30% in the form of share awards under the RSP, save in the case of (i) Ms Euleen Goh Yiu Kiang (who is retiring from the Board at the conclusion of the AGM) and Mr John Powell Morschel (who retired from the Board at the conclusion of the last AGM), both of whom will receive their Directors’ fees wholly in cash; and (ii) Mr Gabriel Lim Meng Liang whose Director’s fees will be paid fully in cash to a government agency, the Directorship & Consultancy Appointments Council. The actual number of shares to be awarded will be based on the volume-weighted average price of a share of the Company on the SGX-ST over the 14 trading days from (and including) the ex-dividend date following the AGM. The actual number of shares to be awarded will be rounded down to the nearest share, and any residual balance settled in cash. The awards will consist of the grant of fully paid shares, with no performance conditions attached and no vesting periods imposed, although a share retention policy applies. The Directors’ fees will only be paid upon approval by shareholders at the AGM.
4 Mr Lim Ming Yan relinquished his position as President & GCEO on 15 September 2018 and retired from the Board of the Company on 31 December 2018.
5 Mr Lee Chee Koon was appointed President & GCEO on 15 September 2018 and to the Board on 1 January 2019. The amount disclosed is in respect of his remuneration for the entire year in 2018 (i.e. including his remuneration for his role as Group Chief Investment Officer from 1 January 2018 to 14 September 2018).
Cap
itaL
and
Lim
ited
Ann
ual R
epor
t 20
18
61
CORPORATE GOVERNANCE & TRANSPARENCY

CORPORATEGOVERNANCE
KEY MANAGEMENT PERSONNEL’S REMUNERATION
Key Management Personnel’s Remuneration Table for the Financial Year Ended 31 December 2018:
Total Remuneration Bands
Salary inclusive of AWS and
employer’s CPF
Bonus and other benefits
inclusive of employer’s
CPF1
Award of Shares2 Total
Above S$4,000,000 to S$4,250,000Lee Chee Koon 20% 60% 20% 100% Above S$3,750,000 to S$4,000,000Jason Leow Juan Thong 22% 55% 23% 100%Lucas Ignatius Loh Jen Yuh3 21% 56% 23% 100% Above S$2,500,000 to S$2,750,000Andrew Geoffrey Lim Cho Pin 23% 53% 24% 100%Tan Seng Chai 25% 50% 25% 100% Above S$500,000 to S$750,000Ng Kok Siong4 26% 3% 71% 100% Total S$17,668,981
Notes:1 The amounts disclosed include the bonuses earned under the EBIP and the other incentive plans which have been accrued for in FY 2018. Under
the EBIP, EVA bonus declared during the year is added to the bonus account and one-third of the accumulated balance in the bonus account will be paid out in cash annually with the remaining two-thirds to be carried forward to the following year; any negative EVA bonus declared will result in an offset against the current EVA bonus account balance.
2 The share awards are based on the fair value of the shares comprised in the contingent awards under the Share Plans at the time of grant. The final number of shares released under the contingent awards of shares for RSP and PSP will depend on the achievement of pre-determined targets and subject to the respective vesting period under RSP and PSP.
3 The amount disclosed excludes overseas posting allowances and benefits of approximately S$203,000.4 Mr Ng Kok Siong resigned from CapitaLand Limited on 3 May 2018.
Cap
itaL
and
Lim
ited
Ann
ual R
epor
t 20
18
62
CORPORATE GOVERNANCE & TRANSPARENCY

CODE OF CORPORATE GOVERNANCE 2012
Guidelines for Disclosure
Guideline Questions How has the Company complied?
General (a) Has the Company complied with all the principles and guidelines of the Code? If not, please state the specific deviations and the alternative corporate governance practices adopted by the Company in lieu of the recommendations in the Code.
Yes. Where there are deviations from any of the guidelines of the Code, an explanation has been provided within the Annual Report.
(b) In what respect do these alternative corporate governance practices achieve the objectives of the principles and conform to the guidelines in the Code?
Board Responsibility
Guideline 1.5 What are the types of material transactions which require approval from the Board?
The specific matters which are reserved for the Board’s approval include:
(a) strategies and objectives; (b) financial plan;(c) share issuances, dividends and other returns to
shareholders;(d) corporate and financial restructuring, mergers,
major acquisitions and divestments;(e) risk appetite, the adequacy and effectiveness of the
risk management and internal control systems;(f) sustainability issues;(g) the overall remuneration policy and compensation
framework, compensation package for the President & GCEO and other key management positions; and
(h) matters which involve a conflict of interest for a substantial shareholder or a Director.
Members of the Board
Guideline 2.6 (a) What is the Board’s policy with regard to diversity in identifying director nominees?
The current Board comprises 11 members who are corporate and business leaders, and are professionals with varied background, expertise and experience including in finance, banking, real estate, legal, accounting, general management and technology. The current Board has two female members.
The Board has established the NC, which makes recommendations to the Board on all appointments to the Board and Board Committees. The NC evaluates the Board’s competencies on a long-term basis and identifies competencies which may be further strengthened in the long-term. Board succession planning takes into account the need to maintain flexibility to effectively address succession planning and to ensure that the Company continues to attract and retain highly qualified individuals to serve on the Board.
(b)
(c)
Please state whether the current composition of the Board provides diversity on each of the following – skills, experience, gender and knowledge of the Company, and elaborate with numerical data where appropriate.
What steps has the Board taken to achieve the balance and diversity necessary to maximise its effectiveness? C
apit
aLan
d L
imit
edA
nnua
l Rep
ort
2018
63
CORPORATE GOVERNANCE & TRANSPARENCY

CORPORATEGOVERNANCE
Guideline Questions How has the Company complied?
All Board appointments are made based on merit and those considered will be assessed against a range of criteria including the candidates’ demonstrated business sense and judgement, skills and expertise, and market and industry knowledge (and may include elements such as financial, sustainability or other specific competency, geographical representation and business background).
The Board believes in diversity and values the benefits diversity can bring to the Board in its deliberations. Diversity enhances the Board’s decision-making capability and ensures that the Company has the opportunity to benefit from all available talent and perspectives.
Guideline 4.6 Please describe the board nomination process for the Company in the last financial year for (i) selecting and appointing new directors and (ii) re-electing incumbent directors.
With regard to the reelection of existing Directors each year, the NC advises the Board of those Directors who are retiring or due for consideration to retire in accordance with the provisions of the Constitution. The NC makes recommendations to the Board as to whether the Board should support the reelection of a Director who is retiring and, for this purposes, undertakes a process of review of the retiring non-executive Director’s performance during the period in which the non-executive Director has been a member of the Board.
Guideline 1.6 (a) Are new directors given formal training? If not, please explain why.
Yes. Upon appointment, each Director is provided with a formal letter of appointment and a copy of the Director’s Manual (which includes information on a broad range of matters relating to the role and responsibilities of a Director). All Directors upon appointment also undergo an induction programme which focuses on orientating the Director to the Company’s business, operations, strategies, organisation structure, responsibilities of key management personnel, and financial and governance practices. The induction programme also includes site visits.
Following their appointment, Directors are provided with opportunities for continuing education in areas such as directors’ duties and responsibilities, changes to regulations and accounting standards, and industry-related matters, so as to be updated on matters that affect or may enhance their performance as Directors or Board Committee members.
(b) What are the types of information and training provided to (i) new directors and (ii) existing directors to keep them up-to-date?
Cap
itaL
and
Lim
ited
Ann
ual R
epor
t 20
18
64
CORPORATE GOVERNANCE & TRANSPARENCY

Guideline Questions How has the Company complied?
Guideline 4.4 (a) What is the maximum number of listed company board representations that the Company has prescribed for its directors? What are the reasons for this number?
The Board does not prescribe any maximum number of listed company board representations.
In view of the responsibilities of a Director, the Board is cognisant of the need for Directors to be able to devote sufficient time and attention to adequately perform their roles. However, the Board has not imposed any limit as it has taken the view that the limit on the number of listed company directorships that an individual may hold should be considered on a case-by-case basis, as a person’s available time and attention may be affected by many different factors, such as whether he or she is in full-time employment and the nature of his or her other responsibilities. A Director with multiple directorships is expected to ensure that he or she can devote sufficient time and attention to the affairs of the Company.
All Directors are required to confirm on an annual basis, and for FY 2018, have confirmed that they were able to devote sufficient time and attention to the affairs of the Company. The NC assessed each Director’s ability to commit time to the affairs of the Company, taking into consideration their confirmation, their commitments and their attendance record at meetings of the Board and Board Committees, as well as their conduct and contributions (including preparedness, participation and candour) at Board and Board Committee meetings, and has determined that each Director has been adequately carrying out his or her duties as a Director of the Company.
The Board, taking into consideration the NC’s assessment, has noted that each Director has been adequately carrying out his or her duties and responsibilities as a Director of the Company.
(b) If a maximum number has not been determined, what are the reasons?
(c) What are the specific considerations in deciding on the capacity of directors?
Board Evaluation
Guideline 5.1 (a) What was the process upon which the Board reached the conclusion on its performance for the financial year?
The NC undertakes a process to evaluate the effectiveness of the Board as a whole and the Board Committees for every financial year. An external consultant is engaged to facilitate the evaluation process. As part of the process, questionnaires are sent by the consultant to the Directors and Management and interviews are conducted where required. The objective of the interviews is to seek clarifications to the feedback obtained from the responses in the questionnaires, during which broader questions might also be raised to help validate certain survey findings.
The findings are then evaluated by the consultant and reported, together with the recommendations of the consultant, to the Board. The findings and the recommendations of the consultant which include benchmarking information and best practices of other boards, are considered by the Board and follow up action is taken, where necessary.
(b) Has the Board met its performance objectives?
Cap
itaL
and
Lim
ited
Ann
ual R
epor
t 20
18
65
CORPORATE GOVERNANCE & TRANSPARENCY

CORPORATEGOVERNANCE
Guideline Questions How has the Company complied?
Independence of Directors
Guideline 2.1 Does the Company comply with the guideline on the proportion of independent directors on the Board? If not, please state the reasons for the deviation and the remedial action taken by the Company.
Yes. The Board comprises 11 Directors, 10 of whom are non-executive independent Directors.
Guideline 2.3 (a) Is there any director who is deemed to be independent by the Board, notwithstanding the existence of a relationship as stated in the Code that would otherwise deem him not to be independent? If so, please identify the director and specify the nature of such relationship.
Yes, please refer to pages 40 to 42 for details and information on the Board’s determination process for considering those Directors as being independent.
(b) What are the Board’s reasons for considering him independent? Please provide a detailed explanation.
Guideline 2.4 Has any independent director served on the Board for more than nine years from the date of his first appointment? If so, please identify the director and set out the Board’s reasons for considering him independent.
No.
Disclosure on Remuneration
Guideline 9.2 Has the Company disclosed each director’s and the CEO’s remuneration as well as a breakdown (in percentage or dollar terms) into base/fixed salary, variable or performance-related income/bonuses, benefits in kind, stock options granted, share-based incentives and awards, and other long-term incentives? If not, what are the reasons for not disclosing so?
Yes.
Guideline 9.3 (a) Has the Company disclosed each key management personnel’s remuneration, in bands of S$250,000 or in more detail, as well as a breakdown (in percentage or dollar terms) into base/fixed salary, variable or performance-related income/bonuses, benefits in kind, stock options granted, share-based incentives and awards, and other long-term incentives? If not, what are the reasons for not disclosing so?
Yes. The aggregate remuneration paid to the aforesaid key management personnel (excluding the President & GCEO) is S$13,458,023.
(b) Please disclose the aggregate remuneration paid to the top five key management personnel (who are not directors or the CEO).
Cap
itaL
and
Lim
ited
Ann
ual R
epor
t 20
18
66
CORPORATE GOVERNANCE & TRANSPARENCY

Guideline Questions How has the Company complied?
Guideline 9.4 Is there any employee who is an immediate family member of a director or the CEO, and whose remuneration exceeds S$50,000 during the year? If so, please identify the employee and specify the relationship with the relevant director or the CEO.
No.
Guideline 9.6 (a) Please describe how the remuneration received by executive directors and key management personnel has been determined by the performance criteria.
The remuneration paid to the President & GCEO and key management personnel is strongly linked to the achievement of business and individual performance targets.
Remuneration for key management personnel comprises fixed components, variable cash components, share-based components and employee benefits.
The variable cash components are short-term incentives which are based on a balanced set of financial and non-financial performance targets in the dimensions of Financial, Execution, Future Growth and Sustainability.
The share-based components are long-term incentives which are the grant of share awards under the Share Plans. Shares will only be released on the achievement of financial and shareholder return targets.
Overall, the performance targets were met, with the exception of shareholder return targets which were affected by adverse share price movements.
(b) What were the performance conditions used to determine their entitlement under the short-term and long-term incentive schemes?
(c) Were all of these performance conditions met? If not, what were the reasons?
Risk Management and Internal Controls
Guideline 6.1 What types of information does the Company provide to independent directors to enable them to understand its business, the business and financial environment as well as the risks faced by the Company? How frequently is the information provided?
The Board meets at least quarterly and Board meetings, in general, last up to a full day. At each Board meeting:
(a) the chairperson of each Board Committee provides an update on the significant matters discussed at the Board Committee meetings which are typically scheduled before the quarterly Board meetings;
(b) the President & GCEO provides updates on the Group’s business and operations;
(c) the GCFO presents the financial performance; and (d) presentations in relation to specific business
areas are also made by senior executives, external consultants or experts.
This allows the Board to develop a good understanding of the progress of the Group’s business as well as the issues and challenges facing the Group, and also promotes active engagement with the key executives of the Group.
As a general rule, Board papers are sent to Board or Board Committee members at least five working days prior to each Board or Board Committee meeting, to allow them to prepare for the meetings and to enable discussions to focus on any questions that they may have.
Cap
itaL
and
Lim
ited
Ann
ual R
epor
t 20
18
67
CORPORATE GOVERNANCE & TRANSPARENCY

Guideline Questions How has the Company complied?
The Board has unfettered access to any Management staff for any information that it may require at all times. It also has separate and independent access to the Company Secretary at all times. The Board, whether as individual Directors or as a group, is also entitled to have access to independent professional advice where required, at the Company’s expense.
Through the training framework adopted for the professional development of the Directors, Directors also received on a regular basis reading materials on topical matters or subjects and regulatory updates and implications.
Guideline 13.1 Does the Company have an internal audit function? If not, please explain why.
Yes.
Guideline 11.3 (a)
(b)
In relation to the major risks faced by the Company, including financial, operational, compliance, information technology and sustainability, please state the bases for the Board’s view on the adequacy and effectiveness of the Company’s internal controls and risk management system.
In respect of the past 12 months, has the Board received assurance from the CEO and the CFO as well as the internal auditor that: (i) the financial records have been properly maintained and the financial statements give true and fair view of the Company’s operations and finances; and (ii) the Company’s risk management and internal control systems are effective? If not, how does the Board assure itself of points (i) and (ii) above?
The Company maintains an adequate and effective system of risk management and internal controls addressing material financial, operational, compliance and IT risks to safeguard shareholders’ interests and the Group’s assets.
The Group adopts an ERM Framework which sets out the required environmental and organisational components for managing risk in an integrated, systematic and consistent manner. The ERM Framework and related policies are reviewed annually. A team comprising the President & GCEO and other key management personnel is responsible for directing and monitoring the development, implementation and practice of ERM across the Group.
As part of the ERM Framework, Management, among other things, undertakes and performs a Group-wide RCSA annually to identify material risks along with their mitigating measures.
More information on the Company’s ERM Framework can be found in the Enterprise Risk Management section on pages 70 to 73 of this Annual Report.
The internal and external auditors conduct reviews of the adequacy and effectiveness of the material internal controls (including financial, operational, compliance and IT controls) and risk management systems. This includes testing, where practicable, material internal controls in areas managed by external service providers. Any material non-compliance or lapses in internal controls together with corrective measures recommended by the internal and external auditors are reported to and reviewed by the AC. The AC also reviews the adequacy and effectiveness of the measures taken by Management on the recommendations made by the internal and external auditors in this respect.
The Board has received the requisite assurance from the President & GCEO and the GCFO.
CORPORATEGOVERNANCE
Cap
itaL
and
Lim
ited
Ann
ual R
epor
t 20
18
68

Guideline Questions How has the Company complied?
Guideline 12.6 (a) Please provide a breakdown of the fees paid in total to the external auditors for audit and non-audit services for the financial year.
Total audit fees for FY 2018 – S$8,831,000Total non-audit fees for FY 2018 – S$1,447,000
Please refer to page 226 of this Annual Report for more details.
In order to maintain the independence of the external auditors, the Company has developed policies regarding the types of non-audit services that the external auditors can provide to the Group and the related approval processes. The AC has reviewed the nature and extent of non-audit services provided by the external auditors in FY 2018 and the fees paid for such services. The AC is satisfied that the independence of the external auditors has not been impaired by the provision of those services. The external auditors have also provided confirmation of their independence to the AC.
(b) If the external auditors have supplied a substantial volume of non-audit services to the Company, please state the bases for the Audit Committee’s view on the independence of the external auditors.
Communication with Shareholders
Guideline 15.4 (a)
(b)
(c)
Does the Company regularly communicate with shareholders and attend to their questions? How often does the Company meet with institutional and retail investors?
Is this done by a dedicated investor relations team (or equivalent)? If not, who performs this role?
How does the Company keep shareholders informed of corporate developments, apart from SGXNet announcements and the annual report?
Yes, the Company is committed to keeping all its shareholders and other stakeholders and analysts informed of its performance and any changes in the Group or its business which would be likely to materially affect the price or value of the Company’s securities, on a timely and consistent basis, so as to assist shareholders and investors in their investment decisions.
The Company has in place an Investor Relations department and a Group Communications department which facilitate effective communication with the Company’s shareholders, analysts, fund managers and the media.
More information on the Company’s investor and media relations with shareholders can be found in the Investor & Media Relations section on pages 74 to 77 of this Annual Report.
Guideline 15.5 If the Company is not paying any dividends for the financial year, please explain why.
N.A.
Cap
itaL
and
Lim
ited
Ann
ual R
epor
t 20
18
69

ENTERPRISE RISKMANAGEMENT
GOVERNANCEThe Board is responsible for the governance of risk across the Group. It falls to them to determine the Group’s risk appetite; oversee the Group’s ERM Framework; regularly review the Group’s risk profile, material risks and mitigation strategies; and ensure the adequacy and effectiveness of the risk management framework and policies. For these purposes, it is assisted by the RC, established in 2002, which provides dedicated oversight of risk management at the Board level, including adhoc risk matters referred to it by the Board such as the implementation of Enterprise Resource Planning system.
The RC, made up of four independent Board members, meets on a regular basis. The meetings are attended by the President & GCEO as well as other key management staff. The RC is assisted by the Risk Assessment Group (RAG), a dedicated, independent in-house unit made up of highly specialised and professional members with vast and diverse experiences in financial and operational risk management.
The Board approves the Group’s risk appetite, which determines the nature and extent of material risks that the Group is willing to take to achieve its strategic and business objectives. The Group’s RAS is expressed via formal, high-level and overarching statements and accompanying risk limits which determine specific risk boundaries established at an operational level. Taking the interests of key stakeholders into consideration, the RAS sets out explicit and forward-looking views of the Group’s desired risk profile and ensures it is aligned with the Group’s strategy and business plans.
The President & GCEO, together with a team of other key management personnel, is responsible for directing and monitoring the development, implementation and practice of ERM across the Group. Operationally, risk champions from the different business units and corporate functions, as well as various specialist support functions, are tasked to develop, implement and monitor risk management policies, methodologies and procedures in their respective areas.
CapitaLand takes a proactive approach to risk management, making it an integral part of our business—both strategically and operationally. Our objective is not risk minimisation, but rather the optimisation of opportunities within the known and agreed risk appetite levels set by our Board of Directors (Board). In short, we take measured risks in a prudent manner for justifiable business reasons.
Cap
itaL
and
Lim
ited
Ann
ual R
epor
t 20
18
70
CORPORATE GOVERNANCE & TRANSPARENCY

The Group’s ERM Framework is adapted from the International Organization for Standardization (ISO) 31000 International Risk Management Standards. It is also guided by the Committee of Sponsoring Organizations of the Treadway Commission (COSO) Internal Control-Integrated Framework and other relevant best practices and guidelines. It specifies the required environmental and organisational components needed to manage risks in an integrated, systematic and consistent manner. The ERM Framework and related risk management policies are reviewed annually.
A robust internal control system and an effective, independent review and audit process underpin the Group’s ERM Framework. While the line management is responsible for the design and implementation of effective internal controls using a risk-based approach, the Internal Audit function reviews such design and implementation to provide reasonable assurance to the AC on the adequacy and effectiveness of the risk management and internal control systems.
ERM Framework
ERM FRAMEWORK
Risk Strategy
Board Oversight & Senior Management Involvement
Inte
rnal
Con
trol S
yste
m In
dep
end
ent R
eview an
d A
ud
it
Risk-Aware Culture
Risk Appetite Risk & Control
Self-Assessment Investment Risk
Evaluation Quantitative Analysis Scenario Analysis Whistle-blowing
1RISK
IDENTIFICATION & ASSESSMENT
Accept Avoid Mitigate e.g. Business
Continuity Management Transfer e.g. Contractual
Risk Management, Insurance
2RISK
RESPONSE
Key Risk Indicators Quarterly Risk Reporting Portfolio Monitoring of
Financial Risks e.g. Country Concentration, FX
3RISK
MONITORING & REPORTING
Cap
itaL
and
Lim
ited
Ann
ual R
epor
t 20
18
71
CORPORATE GOVERNANCE & TRANSPARENCY

ENTERPRISE RISKMANAGEMENT
CapitaLand’s successful ERM program is based on fostering the right risk culture. The RAG conducts regular workshops to enhance risk management knowledge and promote a Group culture of risk awareness. Risk management principles are embedded in all our decision-making and business processes. Once a year, the RAG coordinates a Group-wide Risk and Control Self-Assessment (RCSA) exercise. This requires business units and corporate functions to identify, assess and document material risks along with their key controls and mitigating measures. Material risks and their associated controls are consolidated and reviewed at the Group level before they are presented to the RC, AC and the Board.
MANAGING MATERIAL RISKSCapitaLand takes a comprehensive, iterative approach to identifying, managing, monitoring and reporting material risks across the Group. These material risks include:
Competition RiskFacing keen industry competition from established players and new market entrants, the Group strengthens its competitive position by delivering exceptional products and services and differentiating ourselves in the marketplace through ongoing branding. A constant stream of customer-centric initiatives and shopper loyalty programmes also helps set us apart. Our in-house team of analysts keeps us on top of latest market trends. And, regularly scheduled innovation workshops help us brainstorm ideas to ensure we stay ahead of our competitors.
Economic RiskCapitaLand is exposed to event risks in major economies as well as in key financial and property markets. These event risks may reduce revenue, increase costs and result in downward revaluation of our assets. Market illiquidity during a financial crisis makes asset investment and/or divestment challenging and can affect CapitaLand’s investment and strategic objectives. The Group manages these economic risks through a disciplined approach to financial management. Our portfolio is diversified across geographies and concentration risks addressed by Board-approved country concentration limits. We focus on cities where the Group has operational scale and where underlying economic fundamentals are more robust. A team of in-house experts monitors macroeconomic trends, advising senior management on the potential impact they may have on property markets. Scenario analysis is performed to calculate potential value deteriorations by applying an in-house developed Value-at-Risk (VaR) model.
Climate Change RisksManaging risk associated with climate change is critical to our development projects and operations. Included are physical risks such as rising sea levels, flash floods, fresh water depletion, violent storms, long intense heat waves, as well as changes in government regulations and other climate-related developments. The recent 5th Intergovernmental Panel on Climate Change (IPCC) report highlighted climate change impacts which could be avoided by limiting global warming to 1.5ºC. Coupled with the Paris Climate Change Agreement, more stringent global regulations are expected. CapitaLand is positioned to face such challenges. It is regularly reviewing its mitigation and adaption efforts which include a target to achieve green certification of its existing properties by FY 2030. CapitaLand is also ISO 14001 certified for its environmental management system in 15 countries and sets energy, water and carbon emission intensity targets for its operational properties.
Safety, Health & Well-being RisksManaging and mitigating risks relating to safety, health and well-being in our development projects and operations is a key priority at CapitaLand. The Group believes safe, healthy buildings and workplace can have a positive impact on tenants, residents, shoppers, internal staff and the public at large. Our environmental, health and safety (EHS) Management System has received Occupational Health and Safety Assessment Series (OHSAS) 18001 certification across 15 countries.
Financial RiskGiven the Group’s diversified global business, CapitaLand is exposed to financial risks involving liquidity, foreign currency and interest rates. The Group measures and evaluates these financial risks using established statistical risk management models (e.g. VaR, stress testing and scenario analysis). We continue to focus on instilling financial discipline, deploying capital to earn optimal risk-adjusted returns and maintaining a strong balance sheet to invest in suitable opportunities. For more information on the Group’s Financial Risk Management, please refer to the Financial Risk Management section on Pg 234 of this annual report.
Fraud & Corruption RiskIntegrity is one of CapitaLand’s core values. The Group has adopted a zero tolerance stance against any fraud, bribery and corruption in the conduct of its business activities. Consistent with this commitment, the Group has established policies and guidelines, which include a series of Ethics and Code of Business Conduct Policies, Fraud, Bribery & Corruption (FBC) Risk Management
Cap
itaL
and
Lim
ited
Ann
ual R
epor
t 20
18
72
CORPORATE GOVERNANCE & TRANSPARENCY

Policy, and a Whistle-blowing Policy. The FBC Risk Management Policy echoes the tone at the top and sets appropriate standards in managing risks arising from fraud, bribery and corruption. CapitaLand also has a whistle-blowing policy to encourage the reporting of suspected misconduct by establishing a clearly defined process through which reports can be made in confidence and in good faith, without fear of reprisal. Annually, all employees sign the CapitaLand Pledge to renew their commitment to uphold the Group’s core values.
Information Technology RiskWith increased reliance on IT as a business enabler, CapitaLand has in place Group-wide policies and procedures which set out the governance and controls of IT risks, including cyber-risks. Appropriate measures are in place to ensure the confidentiality, integrity, and availability of CapitaLand’s information assets. This includes implementing access controls, enhancing data security and raising employees’ IT security awareness through phishing campaigns and other activities. In addition, we conduct an IT disaster recovery exercise annually to ensure business recovery objectives are met.
Investment & Divestment RiskAt the project level, RAG conducts an independent risk evaluation for projects above a stipulated investment value threshold. This ensures all material risks are identified and quantified. The risks of each proposal are highlighted and all parameters are benchmarked against objective market indicators and historical projects undertaken by the Group. If necessary, risk mitigating measures are proposed. To ensure the potential returns of new investments commensurate with the risks undertaken, the weighted average cost of capital and hurdle rates for various countries and business units are computed and adopted as investment benchmarks. These are reviewed annually and, where necessary, adjusted to reflect corresponding changes in business risks and capital costs of investments. This seeks to
ensure that CapitaLand’s investment portfolios create value for its stakeholders on a risk-adjusted basis. Projects under development are tracked for progress update and monitored for investment performance.
Political & Policy RiskGiven the geographical diversity of our business, CapitaLand is exposed to various levels of political and policy risks such as political leadership uncertainty, inconsistent public policies, social unrest, change in property-related regulations and other events. Such risks may threaten the economic and sociopolitical environment, which may, in turn, affect the financial viability of the Group’s investments. To mitigate these risks, overseas operations are managed by experienced managers and teams familiar with local conditions and cultures. Annual risk analysis of political climate changes helps us establish respective country investment limits.
Project Management RiskThe Group adopts a rigorous project management process to ensure that project cost, quality and time objectives are met. There are stringent pre-qualification procedures to appoint well-qualified vendors. Key criteria such as vendors’ track records and financial performances are assessed. Regular site visits are conducted to closely monitor the progress of projects and manage potential risks of delays, poor workmanship and cost overruns. In-house teams of experienced technical staff provide guidance and independent audit checks on safety, quality of architectural design and mechanical and electrical engineering detailing.
Regulatory & Compliance RiskCapitaLand’s global operations are subject to the applicable laws and regulations in the markets in which we operate, such as data privacy and anti-corruption laws and regulations. The Group has in place a framework that proactively identifies applicable laws and regulatory obligations, and embeds compliance into the day-to-day operations.
Risk management supports the achievement of the Group’s business objectives and corporate strategy of CapitaLand, hence creating and preserving value.
Cap
itaL
and
Lim
ited
Ann
ual R
epor
t 20
18
73
CORPORATE GOVERNANCE & TRANSPARENCY

INVESTOR & MEDIA RELATIONS
At CapitaLand, we are committed to providing our shareholders, business partners, analysts and the media with the information they need to make sound judgements about our company, which include our corporate strategy and operational and financial drivers. We take a two-pronged approach. Our Investor Relations (IR) team focuses on the investment community, which includes existing and potential shareholders as well as research analysts. Our Group Communications team works closely with the media and oversees CapitaLand’s external communications efforts.
PROVIDING A TWO-WAY COMMUNICATION CHANNELWe held CapitaLand’s first earnings call in November 2018. This new initiative allowed analysts and the media additional opportunities to speak with CapitaLand’s senior management after the announcement of the first and third quarter financial results. Going forward, these teleconferences will be recorded and made available to the public via our corporate website. We also invited analysts and the media to meet with CapitaLand’s senior management twice this year at our headquarters to discuss our half and full year financial results. These large group briefings are typically accompanied by ‘live’
webcasts so that investors and shareholders can also tune in and raise questions online. CapitaLand’s senior management and the IR team also conducted quarterly briefings for institutional investors based in Singapore on our quarterly financial results.
CapitaLand’s institutional shareholder base is geographically well-diversified. To keep them updated on our progress, the IR team regularly participates in investor conferences and conducts non-deal roadshows in global financial hubs across North America, Europe as well as in Asia. In 2018, we met with 227 investors through 181 one-on-one and group meetings, mostly at the nine investor conferences and six non-deal roadshows which took place in cities such as Amsterdam, Bangkok, Beijing, Frankfurt, Hong Kong, Japan, Kuala Lumpur, London, New York, Singapore, Sydney, and Toronto.
CapitaLand’s 2018 Investor Day was held successfully, attracting 70 participants, mainly from Singapore and Hong Kong. This is our annual initiative where the Group’s full senior management bench would share insights on CapitaLand’s strategy, key growth areas and market focus.
(From left) Mr Andrew Lim (GCFO), Mr Lee Chee Koon (President & GCEO), Mr Jason Leow (President, Asia & Retail) and Mr Lucas Loh (President, China & Investment Management) during the Questions and Answers (Q&A) session at CapitaLand Investor Day 2018
Cap
itaL
and
Lim
ited
Ann
ual R
epor
t 20
18
74
CORPORATE GOVERNANCE & TRANSPARENCY

For retail shareholders in Singapore, the AGM remains the key forum for them to raise any questions directly to CapitaLand’s Board and senior management. More than 1,700 retail shareholders and proxies attended the 2018 CapitaLand AGM in April, a 14% increase over the previous year. Prior to the AGM, CapitaLand hosted a luncheon for a smaller group of retail shareholders who were members of the SIAS. Attendees were encouraged to share their key concerns about CapitaLand. The findings from this luncheon enabled us to prepare our Board and senior management for a more fruitful and efficient Q&A session during the AGM.
SHARING CAPITALAND’S BUSINESS STRATEGIES AND PERFORMANCE CapitaLand’s announcements and news releases are filed timely on the SGXNet, updated on our corporate website, and sent to analysts and the media. These also include IR announcements, policies and materials such as CapitaLand’s financial results and annual reports. There is also a dedicated IR webpage where investors can sign up for email alerts and announcements from CapitaLand. Investors can also reach our IR team through the “Contact Us” page or email us at [email protected]. The Group Communications team works closely with the
media to profile CapitaLand’s senior management and latest developments of the Group through print, broadcast and digital media outlets. We also post our announcements and news on social media platforms such as Facebook, Instagram, Twitter, LinkedIn, YouTube and CapitaLand’s weekly lifestyle blog, INSIDE.
We proactively engage stakeholders on major transactions and decisions within the Group. For example, we held a briefing for analysts and the media in Singapore on CapitaLand’s acquisition of the S$1.1 billion portfolio of multifamily assets in the U.S. We broadcast the briefing ‘live’ on our corporate website, enabling the audience to ask questions online in real time.
When we announced the retirement of our former President & GCEO Mr Lim Ming Yan on 1 June 2018, we promptly responded to questions from investors, analysts and the media on the leadership transition. Mr Lim made himself available to answer questions from key institutional investors and reassured them of a smooth transition. When our new President & GCEO Mr Lee Chee Koon took office on 15 September 2018, the IR team promptly organised a “Meet-the-CEO” session for key institutional investors in Singapore and Hong Kong to get to know Mr Lee.
(%)
Singapore 49.3North America 13.6Europe (ex UK) 5.1Asia (ex Singapore) 4.9UK 4.6Rest of World/Unidentified holdings 22.5
Shareholder Base by Geographical DistributionAs at 08 Feb 2019
Shareholder Base by Investor TypeAs at 08 Feb 2019
(%)
Strategic (Temasek) 41.5Institutions 37.2Retail* 21.3
Note: Shareholder base excludes treasury shares Note: Shareholder base excludes treasury shares * Including shares held by brokers and undisclosed holdings
Cap
itaL
and
Lim
ited
Ann
ual R
epor
t 20
18
75
CORPORATE GOVERNANCE & TRANSPARENCY

INVESTOR & MEDIA RELATIONS
ADOPTING INDUSTRY BEST PRACTICES CapitaLand’s IR team, together with our Legal and Secretariat team, work closely with corporate governance specialists to keep up-to-date with the latest developments and adopt the best practices in key areas such as board structure, remuneration and disclosures. The team regularly engages proxy providers such as Institutional Shareholder Services and Glass Lewis & Co to ensure they understand our viewpoint.
In 2018, CapitaLand was recognised for its excellence in corporate governance, corporate transparency and shareholder communications.
At the Singapore Corporate Awards, we earned a silver award in the category “Best Managed Board for listed companies with market capitalisation of above S$1 billion”.
For the fourth year in a row, World Finance voted us “Best Corporate Governance in Singapore”.
The Singapore Governance and Transparency Index for 2018 ranked CapitaLand third out of 589 publicly listed companies.
The 2018 Southeast Asia Awards, sponsored by IR Magazine, voted us “Best in Singapore”.
In 2018, CapitaLand Group received the most number of honours at the SIAS 19th Investors’ Choice Awards for the second consecutive year, including- Winner of Most Transparent Company Award in
the properties category- Runner-up for Singapore Corporate Governance
Award in the diversity category- Runner-up for Shareholder Communication
Excellence Award in the big capitalisation category.
MEDIA CONTACT:Ms Tan Bee Leng
Head, Group CommunicationsEmail: [email protected]
INVESTOR RELATIONS CONTACT:Ms Grace Chen
Head, Investor Relations and Capital Markets ComplianceEmail: [email protected]
For more information about CapitaLand, please contact:
1 Total return of a share to an investor (i.e. change in share price between beginning and end of year plus dividend).2 Barring unforseen circumstances, the Company’s policy is to declare a dividend of at least 30.0% of the annual profit after tax and non-controlling
interests excluding unrealised revaluation gains or losses as well as impairment charges or write backs.
TOTAL SHAREHOLDER RETURNCapitaLand’s 2018 ending share price was S$3.11, with a market capitalisation of S$13.0 billion as at 31 December 2018. The average share price in 2018 was S$3.40, with the lowest share price at S$2.98 in June and highest at S$3.88 in January. The average daily turnover was 9.2 million shares.
Due to global stock market volatility in 2018, CapitaLand registered lower total shareholder return1 at -8.5% as at 31 December 2018, compared to 20.2% in 2017.
CapitaLand remains committed to paying sustainable dividends to our shareholders. For FY 2018, the Board has proposed a final ordinary dividend of 12 Singapore cents a share to be paid out to shareholders in May 2019. The proposed dividend is approximately 40% of our cash PATMI FY 20182.
Tel: +65 6713 2888 Fax: +65 6713 2999
Cap
itaL
and
Lim
ited
Ann
ual R
epor
t 20
18
76
CORPORATE GOVERNANCE & TRANSPARENCY

Events Location
Quarter 1
FY 2017 Financial Results Briefing to analysts and media (with ‘live’ webcast) SingaporePost FY 2017 results investors meeting hosted by Deutsche Bank Nomura Global Real Estate Forum 2018 JapanHong Kong Non-Deal Roadshow hosted by J.P. Morgan Securities Hong KongCiti 23rd Annual Global Property CEO Conference U.S.
Quarter 2
SIAS-CapitaLand Lunch Meeting
SingaporePost 1Q 2018 results investors meeting hosted by Macquarie Capital Securities9th Annual dbAccess Asia Conference Singapore 2018 Nomura Investment Forum Asia 2018J.P. Morgan Global China Summit 2018 ChinaKuala Lumpur Non-Deal Roadshow hosted by CIMB Malaysia
Quarter 3
1H 2018 Financial Results Briefing to analysts and media (with ‘live’ webcast)
SingaporePost 1H 2018 results investors meeting hosted by J.P. Morgan SecuritiesMacquarie ASEAN Conference 2018U.S. Multifamily Portfolio Acquisition Briefing to analysts and media (with ‘live’ webcast)CapitaLand & REITs Corporate Day hosted by DBS Vickers ThailandHong Kong Non-Deal Roadshow hosted by CLSA Singapore Hong KongEurope Non-Deal Roadshow hosted by Macquarie Capital Securities United Kingdom,
Netherlands and Germany
Toronto Non-Deal Roadshow hosted by J.P. Morgan Securities CanadaBank of America Merrill Lynch Global Real Estate Conference 2018 U.S.
Quarter 4
3Q 2018 Financial Results Earnings Call with analysts and media
SingaporeMeet the new President & GCEO session hosted by Deutsche BankBNP Paribas Sustainable Future Forum 2018CapitaLand Investor DayAustralia Non-Deal Roadshow hosted by Deutsche Bank Australia
Announcement of First Quarter Results 30 April 2018Announcement of Second Quarter Results 8 August 2018Announcement of Third Quarter Results 14 November 2018Announcement of Full Year Results 20 February 2019Annual General Meeting 12 April 2019Books Closing (Record Date) 5.00 p.m. on 24 April 2019Books Closure 25 April 2019Proposed Payment of 2018 First and Final Dividend 7 May 2019
2018 INVESTOR RELATIONS CALENDAR
FINANCIAL CALENDAR
Financial Year Ended 31 December 2018
Proposed Announcement of First Quarter Results May 2019Proposed Announcement of Second Quarter Results August 2019Proposed Announcement of Third Quarter Results November 2019Proposed Announcement of Full Year Results February 2020
Financial Year Ending 31 December 2019
Cap
itaL
and
Lim
ited
Ann
ual R
epor
t 20
18
77
CORPORATE GOVERNANCE & TRANSPARENCY
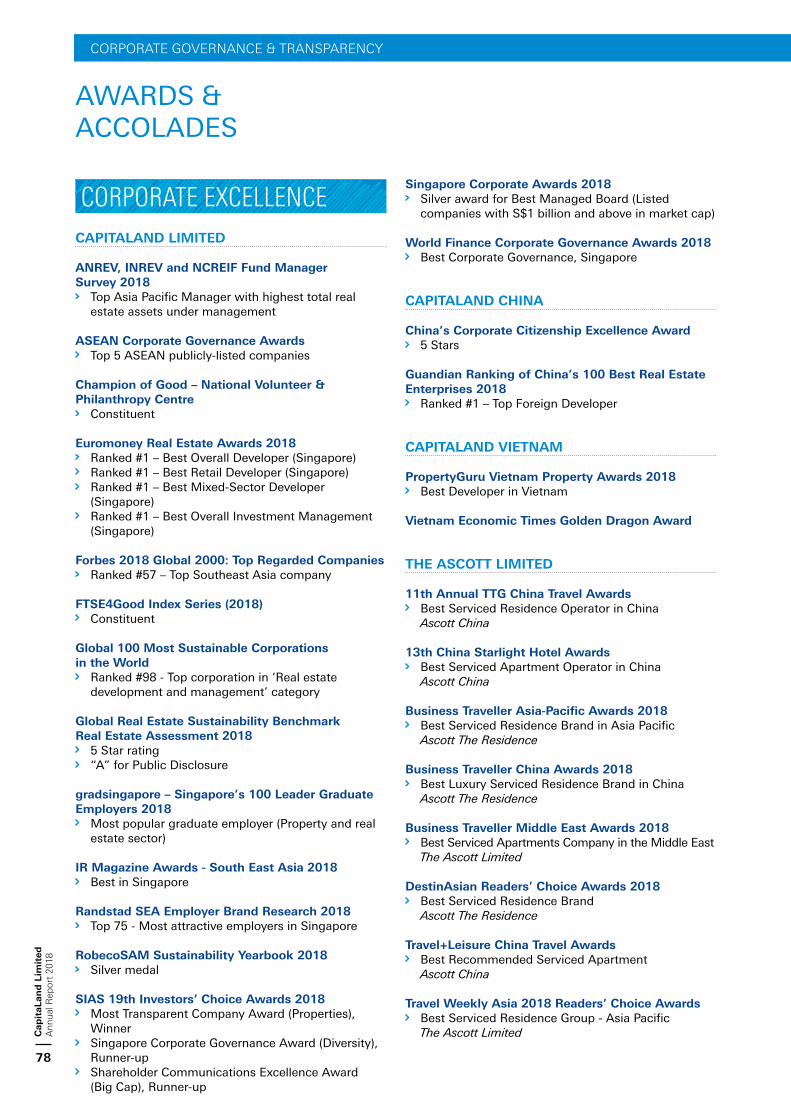
AWARDS & ACCOLADES
CORPORATE EXCELLENCECAPITALAND LIMITED
ANREV, INREV and NCREIF Fund Manager Survey 2018 Top Asia Pacific Manager with highest total real
estate assets under management
ASEAN Corporate Governance Awards Top 5 ASEAN publicly-listed companies
Champion of Good – National Volunteer & Philanthropy Centre Constituent
Euromoney Real Estate Awards 2018 Ranked #1 – Best Overall Developer (Singapore) Ranked #1 – Best Retail Developer (Singapore) Ranked #1 – Best Mixed-Sector Developer
(Singapore) Ranked #1 – Best Overall Investment Management
(Singapore)
Forbes 2018 Global 2000: Top Regarded Companies Ranked #57 – Top Southeast Asia company
FTSE4Good Index Series (2018) Constituent
Global 100 Most Sustainable Corporations in the World Ranked #98 - Top corporation in ‘Real estate
development and management’ category
Global Real Estate Sustainability Benchmark Real Estate Assessment 2018 5 Star rating “A” for Public Disclosure
gradsingapore – Singapore’s 100 Leader Graduate Employers 2018 Most popular graduate employer (Property and real
estate sector)
IR Magazine Awards - South East Asia 2018 Best in Singapore
Randstad SEA Employer Brand Research 2018 Top 75 - Most attractive employers in Singapore
RobecoSAM Sustainability Yearbook 2018 Silver medal
SIAS 19th Investors’ Choice Awards 2018 Most Transparent Company Award (Properties),
Winner Singapore Corporate Governance Award (Diversity),
Runner-up Shareholder Communications Excellence Award
(Big Cap), Runner-up
Singapore Corporate Awards 2018 Silver award for Best Managed Board (Listed
companies with S$1 billion and above in market cap)
World Finance Corporate Governance Awards 2018 Best Corporate Governance, Singapore
CAPITALAND CHINA
China’s Corporate Citizenship Excellence Award 5 Stars
Guandian Ranking of China’s 100 Best Real Estate Enterprises 2018 Ranked #1 – Top Foreign Developer
CAPITALAND VIETNAM
PropertyGuru Vietnam Property Awards 2018 Best Developer in Vietnam
Vietnam Economic Times Golden Dragon Award
THE ASCOTT LIMITED
11th Annual TTG China Travel Awards Best Serviced Residence Operator in China
Ascott China
13th China Starlight Hotel Awards Best Serviced Apartment Operator in China
Ascott China
Business Traveller Asia-Pacific Awards 2018 Best Serviced Residence Brand in Asia Pacific
Ascott The Residence
Business Traveller China Awards 2018 Best Luxury Serviced Residence Brand in China
Ascott The Residence
Business Traveller Middle East Awards 2018 Best Serviced Apartments Company in the Middle East
The Ascott Limited
DestinAsian Readers’ Choice Awards 2018 Best Serviced Residence Brand
Ascott The Residence
Travel+Leisure China Travel Awards Best Recommended Serviced Apartment
Ascott China
Travel Weekly Asia 2018 Readers’ Choice Awards Best Serviced Residence Group - Asia Pacific
The Ascott LimitedCap
itaL
and
Lim
ited
Ann
ual R
epor
t 20
18
78
CORPORATE GOVERNANCE & TRANSPARENCY

World Travel Awards 2018 Asia’s Leading Serviced Apartment Brand China’s Leading Serviced Apartment Brand Hong Kong’s Leading Serviced Apartment Brand Singapore’s Leading Serviced Apartment Brand Middle East’s Leading Serviced Apartment Brand Saudi Arabia’s Leading Serviced Apartment Brand
The Ascott Limited
Philippines’ Leading Serviced Apartment Brand Ascott The Residence
Europe’s Leading Serviced Apartment Brand Germany’s Leading Serviced Apartment Brand Japan’s Leading Serviced Apartment Brand
Citadines Apart’hotel
PRODUCT EXCELLENCEINTEGRATED DEVELOPMENTS
Singapore CapitaSpring Universal Design Mark GoldPLUS (Design) Green Mark Platinum
Building and Construction Authority, Singapore
Funan Mixed-use Architecture (Singapore) Award
Asia-Pacific Property Awards 2018-2019 Universal Design Mark GoldPLUS (Design) Green Mark GoldPLUS
Building and Construction Authority, Singapore
Jewel Changi Airport Universal Design Mark GoldPLUS (Design)
Building and Construction Authority, Singapore
China Innov Center LEED Platinum Certified
U.S. Green Building Council
One iPark in Shenzhen Green Mark Certified (Provisional)
Building and Construction Authority, Singapore
Raffles City Hangzhou MEP Engineering Award
CTBUH Awards World’s Best Buildings
SHOPPING MALLS
Singapore Bedok Mall Green Mark Platinum
Building and Construction Authority, Singapore
Bugis Junction Green Mark Platinum
Building and Construction Authority, Singapore
ION Orchard Best Efforts in Corporate Social Responsibility
Singapore Retailers Association Retail Awards 2018 Best Luxury Shopping Experience
Singapore Tatler - Best of Singapore 2018
Junction 8 Green Mark Platinum
Building and Construction Authority, Singapore
Tampines Mall Best Shopping Centre in Advertising & Promotions
Singapore Retailers Association Retail Awards 2018
Westgate Green Mark Platinum
Building and Construction Authority, Singapore
ChinaCapitaMall Xinduxin Green Mark Gold
Building and Construction Authority, Singapore
Suzhou Center Mall International Shopping Centre
Global Retail & Leisure International Awards 2018 Best New Shopping Centre
MAPIC Awards 2018
VietnamFaifo Lane Best Retail Architectural Design
Best Retail Development – Highly Commended PropertyGuru Vietnam Property Awards 2018
MalaysiaGurney Plaza Silver Award (Above 10 Years Retail Category)
EdgeProp Malaysia’s Best Managed Property Awards 2018
Queensbay Mall Silver Award (Above 10 Years Retail Category)
EdgeProp Malaysia’s Best Managed Property Awards 2018 Silver Winner (Vogue for Virtue)
International Council of Shopping Centers - Asia Pacific Awards 2018
Cap
itaL
and
Lim
ited
Ann
ual R
epor
t 20
18
79
CORPORATE GOVERNANCE & TRANSPARENCY
LODGING
Singapore Ascott Orchard Singapore Construction Excellence Award
Building and Construction Authority, Singapore
BelgiumCitadines Sainte-Catherine Brussels Belgium’s Leading Serviced Apartments
World Travel Awards 2018
ChinaAscott Raffles City Beijing Best Serviced Residence in China
Business Traveller China Awards 2018 Best Serviced Apartment in China
13th China Starlight Hotel Awards
Ascott Raffles City Chengdu Asia’s Leading Serviced Apartments
World Travel Awards 2018
Ascott Riverside Garden Beijing Best Newly Opened Serviced Apartment in China
13th China Starlight Hotel Awards
Somerset Harmony City Wuxi Best Newly Opened Serviced Apartment in China
13th China Starlight Hotel Awards
Somerset Victoria Park Hong Kong Hong Kong’s Leading Serviced Apartments
World Travel Awards 2018
FranceLa Clef Tour Eiffel Paris Europe’s Leading Serviced Apartments
World Travel Awards 2018
GermanyCitadines Arnulfpark Munich Germany’s Leading Serviced Apartments
World Travel Awards 2018
IndonesiaAscott Kuningan Jakarta Indonesia’s Leading Serviced Apartments
World Travel Awards 2018
JapanCitadines Shinjuku Tokyo Japan’s Leading Serviced Apartments
World Travel Awards 2018
PhilippinesAscott Bonifacio Global City Philippines’ Leading Serviced Apartments
World Travel Awards 2018
Ascott Makati Excellence in Design for Greater Efficiencies (EDGE)
Certification International Finance Corporation
Saudi ArabiaAscott Sari Jeddah Saudi Arabia’s Leading Serviced Apartments
World Travel Awards 2018
SpainCitadines Ramblas Barcelona Spain’s Leading Serviced Apartments
World Travel Awards 2018
AWARDS & ACCOLADES
Cap
itaL
and
Lim
ited
Ann
ual R
epor
t 20
18
80
CORPORATE GOVERNANCE & TRANSPARENCY

United Arab EmiratesAscott Park Place Dubai Dubai’s Leading Serviced Apartments
World Travel Awards 2018
VietnamSomerset Ho Chi Minh City Green Mark GoldPLUS
Building and Construction Authority, Singapore
OFFICES
SingaporeCapital Tower Green Mark Pearl Award
Building and Construction Authority, Singapore
Capital Tower Tenant Service Centre Green Mark Office Interior Platinum
Building and Construction Authority, Singapore
One George Street Tenant Service Centre Green Mark Office Interior GoldPLUS
Building and Construction Authority, Singapore
HOMES
SingaporeCairnhill Nine Construction Excellence Award
Building and Construction Authority, Singapore
Sky Vue Construction Excellence Award (Merit)
Building and Construction Authority, Singapore
ChinaDolce Vita (Zone B) Green Mark Certified
Building and Construction Authority, Singapore
Riverfront Hangzhou Green Mark Certified
Building and Construction Authority, Singapore
Vietnamd’Edge Thao Dien Best Condo Development (Vietnam) Best Luxury Condo Development (Ho Chi Minh City) Best Green Development – Highly Commended
PropertyGuru Vietnam Property Awards 2018
D2eight Best Housing Architectural Design
(Ho Chi Minh City) Best Luxury Housing Development
(Ho Chi Minh City) – Highly Commended PropertyGuru Vietnam Property Awards 2018
De La Sol Best Green Development Best Condo Interior Design Best High End Condo Landscape Architectural
Design Best High End Condo Development
(Ho Chi Minh City) PropertyGuru Vietnam Property Awards 2018 Best High End Condo Architectural Design –
Highly Commended
For the full list of accolades, please visit: www.capitaland.com/awards
Cap
itaL
and
Lim
ited
Ann
ual R
epor
t 20
18
81
CORPORATE GOVERNANCE & TRANSPARENCY

MANAGINGSUSTAINABILITY
SUSTAINABILITY COMMITMENTCapitaLand’s sustainability strategy is aligned with our credo of ‘Building People. Building Communities.’. We are committed to improving the economic and social well-being of our stakeholders through the execution of development projects and management of our operations. In a rapidly changing business landscape, we actively embrace innovation to ensure commercial viability without compromising the environment for future generations.
CapitaLand upholds high standards of corporate governance and transparency to safeguard shareholders’ interests. We have in place an adequate and effective Enterprise Risk Management framework to enhance our business resilience and agility. Our proactive approach towards environmental, health and safety (EHS) management, which incorporates universal design into our developments, ensures that our properties are sustainable and future-proof. Policies and guidelines are put in place to ensure the efficient use of energy, water and other resources.
CapitaLand’s integrated human capital strategy aims to recruit, develop and motivate employees to drive growth for the Group. Community development is an important component of our commitment to sustainability. It focuses on providing support to enhance the lives of underprivileged children and vulnerable elderly, through corporate philanthropy and employee volunteerism.
CapitaLand was one of the first companies in Singapore to voluntarily publish an annual Global Sustainability Report and externally assure the entire report. Benchmarking against an international standard and framework that is externally validated helps us to overcome the challenges in sustainability reporting that arise from our diversified asset types and geographical presence. We are also a signatory to the United Nations (UN) Global Compact and our Global Sustainability Report serves as our Communication on Progress, which will be made available at www.unglobalcompact.org when published.
For our efforts, we are listed in the Sustainability Yearbook, Global 100 Most Sustainable Corporations, Dow Jones Sustainability World Index and Asia Pacific Index, Global Real Estate Sustainability Benchmark (5 Star), FTSE4Good Index Series, MSCI Global Sustainability Indexes, Euronext VigeoEiris Indices World 120, STOXX® Global ESG Leaders Indices.
CapitaLand Global Sustainability Report 2018 will be published by 31 May 2019 and will continue to be prepared in accordance with the Global Reporting Initiative (GRI) Standards: Core option. We will also continue to apply the Guiding Principles of the International Integrated Reporting Framework and ISO 26000:2010 Guidance on Social Responsibility and reference the UN Sustainable Development Goals and the Taskforce on Climate Related Financial Disclosure. It will cover the Group’s global portfolio and employees, including our listed REITs CapitaLand Mall Trust, CapitaLand Commercial Trust, Ascott Residence Trust, CapitaLand Retail China Trust and CapitaLand Malaysia Mall Trust, unless otherwise indicated. Lastly, the report will be externally assured to AA1000 Assurance Standard.
BOARD STATEMENT CapitaLand is committed to sustainability and incorporates the key principles of environment, social and governance (ESG) in setting our business strategies and operations.
The CapitaLand Board sets the Group’s risk appetite, which determines the nature and extent of material risks that the Group is willing to take to achieve our strategic and business objectives. The risk appetite incorporates ESG factors such as fraud, corruption and bribery, environment, health and safety.
The Board also approves the executive compensation framework based on the principle of linking pay to performance. The Group’s business plans are translated to both quantitative and qualitative performance targets, including sustainable corporate practices and are cascaded throughout the organisation.
CapitaDNA(Vision, Mission, Credo and Core Values)
Respect at all levels
Pu
rsu
e Exc
elle
nce
Integ
rity at all levels
Creativity to enhance value
People(Staff)
Investors(Including businesspartners)
Customers(Tenants, shoppers,home owners, residents)
Communities(Suppliers/contractorsgovernment agencies/NGOs, environment,community)
Contribute positivelyto the economic, environmental andsocial developmentof communities
Contribute positivelyto the economic, environmental andsocial developmentof communities
Deliver sustainableshareholder returns
Develop a highperformance culturethat embraces diversityand teamwork
Cap
itaL
and
Lim
ited
Ann
ual R
epor
t 20
18
82
SUSTAINABILITY

TOP MANAGEMENT COMMITMENT AND STAFF INVOLVEMENTCapitaLand’s sustainability management comes under the purview of our Sustainability Council, comprising CapitaLand’s top management. It is supported by a Sustainability Steering Committee which oversees various work teams to ensure our continued progress and improvement in the areas of ESG. The Sustainability Steering Committee comprises the CEOs of the business units and REITs, and the work teams comprise representatives from all business units. CapitaLand Board of Directors is updated regularly through the Risk Committee and Audit Committee on matters relating to sustainability risks and business malpractice incidents. The Board is also updated on the sustainability management performance of the Group, key material issues identified by stakeholders and the planned follow-up measures.
MATERIALITYCapitaLand has a regular review, assessment and feedback process in relation to ESG topics. Key to this is an annual Group-wide Risk and Control Self-Assessment exercise which entails the identification, assessment and documentation of material risks and corresponding internal controls. These material risks include fraud and corruption, environmental, health and safety, and human capital risks which are ESG-relevant. Other existing channels for feedback to ensure relevance of issues include:
Environment Regular dialogue/feedback sessions with government agencies (e.g. Building and Construction Authority, National Environment Agency)
Active participation in Singapore Green Building Council
Participate in engagement sessions with key sustainability indices
Social Regular dialogue with government agencies and unions
Active participation in Singapore Workplace Safety and Health Council
Regular employee engagement survey
Participate in engagement sessions with key sustainability indices
Governance Engagement with SIAS periodically and for our annual Corporate Governance Conference
Engagement where appropriate with Singapore Exchange and Monetary Authority of Singapore
Participate in engagement sessions with key sustainability indices
We identified and reviewed material issues that are most relevant and significant to us and our stakeholders. These are prioritised based on the likelihood and potential impact of issues affecting business continuity and development. For external stakeholders, priority is given to issues important to the society and applicable to CapitaLand. For more information on stakeholder engagement, please refer to the Social and Relationship Capital, Human Capital and Environmental Capital chapters in the upcoming CapitaLand Global Sustainability Report 2018. The report covers our international portfolio in over 20 countries unless otherwise indicated.
Sustainability Management Structure
SustainabilityCouncil
Board of Directors
Various sustainability work teams covering environment, health and safety, corporate governance, enterprise risk management,
human capital, investor relations, and corporate marketing and communications
All Staff
SustainabilitySteering
Committee
Cap
itaL
and
Lim
ited
Ann
ual R
epor
t 20
18
83
SUSTAINABILITY

MANAGINGSUSTAINABILITY
Prioritisation of ESG Material Issues
Environment Social/Labour Practices GovernanceCritical Energy efficiency Climate change and emissions
reduction Water management
Occupational health and safety Employment Stakeholder engagement Supply chain management
Compliance Business ethics Product and services*
Moderate and emerging Building materials Construction and operational
waste Biodiversity
Diversity Human rights
* This includes customer health and safety.
STAKEHOLDER ENGAGEMENT Stakeholders are groups that CapitaLand’s business has a significant impact on, and those with a vested interest in the Group’s operations. Key stakeholders include employees, customers, business associates, builders and suppliers, and the local community. Other groups include regulators and key government agencies, non-governmental organisations (NGOs), representatives of the capital market and the media. They are mapped into groups based on their impact on CapitaLand.
Through the various engagement channels, we seek to understand our stakeholders’ views, communicate effectively with them and respond to their concerns.
Stakeholder Engagement Channel Issues Sustainability Report*
Customers - home buyers and residents,tenants, shoppers
Homebuyers: welcome parties, welcome kits
Tenants: surveys, green fit-out guide, enrichment events such as Biz+ events
Workmanship, design
Facilities management
Customer experience
Social andRelationship Capital,Environmental Capital
Investors, analystsand media
Annual general meetings
Quarterly financial results announcements
Media releases and interviews
Annual reports and sustainability reports
Company website
Regular analyst and investor meetings
Responses to sustainability surveys
Operational efficiency, monetary savings, cost avoidance
Return on equity, earnings, business strategy, market outlook, ESG risks and opportunities
Financial Capital,Social andRelationship Capital
Employee Regular dialogue sessions with senior management
Regular employee engagement survey
Volunteer programmes
Recreation club activities
Work-life balance
Remuneration and benefits
Employee welfare
Human Capital,Social andRelationshipCapital
Cap
itaL
and
Lim
ited
Ann
ual R
epor
t 20
18
84
SUSTAINABILITY

Stakeholder Engagement Channel Issues Sustainability Report*
Supply Chain – maincontractors, vendors,suppliers
CapitaLand Supply Chain Code of Conduct
Environmental, Health and Safety (EHS)
Policy and quarterly EHS monitoring
Vendor evaluation, including events, meetings and trainings
Design and quality
Occupational health and safety practices
Workers welfare and well-being
Environmental compliance
Human Capital,Social and RelationshipCapital, EnvironmentalCapital
Government/nationalagencies/communityand non-governmentalorganisations (NGOs)
Senior management representation on boards of various industry bodies and sustainability related public discussions
Regulatory readiness to the Singapore Government’s commitment to manage carbon emissions
Longstanding partner of various national programmes
Public communications plan for residents within a 100 m radius of our new developments
Sustainability reports
Participation in external conferences/forums
Corporate advertisements
Consultation and sharing with academics, NGOs and business associations
Sustainable building developments
Stakeholder programmes to advocate sustainable tenant/resident/customer behaviours
Advocating best practices
Social and RelationshipCapital
* For more information on key stakeholders’ issues of interest, please refer to CapitaLand Global Sustainability Report 2018 – to be published by 31 May 2019.
CREATING VALUE AND ALIGNMENT TO UNITED NATIONS SUSTAINABLE DEVELOPMENT GOALS (UN SDGS1)CapitaLand referenced the Guiding Principles of the International Integrated Reporting Council (IIRC) Framework and grouped our material ESG issues into six Capitals – Financial, Organisational, Manufactured, Environmental, Human, and Social and Relationship. This is also mapped against some of CapitaLand’s key efforts and programmes in relation to the key UN SDGs. For more information, please refer to CapitaLand Global Sustainability Report 2018 which will be published by end May 2019.
Capitals What We Do (UN SDGs Supported) 2018 Value Created
Financial Earnings
Equity
Investments
Assets
Combination of operating income from investment properties and trading properties, disciplined capital recycling and growth of fee income.
Calibrated balance across product platforms and geographies.
Refer to Performance Overview, CapitaLand Annual Report 2018.
1 The UN SDGs call on companies everywhere to advance sustainable development through the investments they make, the solutions they develop, and the business practices they adopt. In doing so, the goals encourage companies to reduce their negative impacts while enhancing their positive contribution to the sustainable development agenda.
Cap
itaL
and
Lim
ited
Ann
ual R
epor
t 20
18
85
SUSTAINABILITY

MANAGINGSUSTAINABILITY
Capitals What We Do (UN SDGs Supported) 2018 Value Created
Organisational Leadership &
culture
Corporate governance
Risk management
CapitaLand adopts a strong stance against bribery and corruption.
All employees are required to make an annual declaration to uphold CapitaLand’s core values and to not engage in any corrupt or unethical practices.
Requires certain agreements with third-party service providers and vendors to incorporate anti-bribery and anti-corruption provisions.
Require main contractor to ensure no child labour and forced labour at CapitaLand project sites.
Supply Chain Code of Conduct to influence our supply chain to operate responsibly in the areas of anti-corruption, human rights, health and safety, as well as environmental management.
CapitaLand is a signatory to UN Global Compact. (SDG 16)
Refer to Corporate Governance, CapitaLand Annual Report 2018.
No reported incident relating to discrimination, child labour or forced labour in CapitaLand.
Manufactured Environmentally
sustainable, healthy, safe and accessible quality buildings
Innovative and sustainable construction methods and technologies
Environmental Carbon
emissions
Energy management
Water stewardship
Waste and resource management
CapitaLand is committed to:
Reduce energy consumption through energy efficiency and encourage renewable energy sources.
Reduce water consumption, reuse water and prevent water pollution, especially in countries where the availability of clean water and sanitation are of concern.
Green our operational portfolio by 2030.
Actively embrace innovation to ensure commercial viability without compromising the environment for future generations.
Future-proof our developments by addressing the risks of climate change right from the design stage.
Preserve the biodiversity of our sites as well as the wider area where possible.
Occupational health and safety is of utmost importance to CapitaLand, including all of our employees, tenants, contractors, suppliers and the communities who use our properties.
CapitaLand EHS Management System is externally audited to receive the International Organization for Standardization (ISO) 14001 and Occupational Health and Safety Assessment Series (OHSAS) 18001 certification across 15 countries.
CapitaLand continues to participate in the Carbon Disclosure Project (CDP). Our footprint is calculated in accordance with the Greenhouse Gas (GHG) Protocol2.
(SDG 3, 6, 7, 9, 11, 13, 15)
Green building ratings: In 2018, CapitaLand obtained 20 green building ratings.
Reduction in energy and water usage, and carbon intensity: For the first nine months of 2018, our reduction in energy usage in kWh/m2 was 16.6% and our reduction in water usage in m3/m2 was 21.1% from the 2008 baseline. Our reduction in carbon intensity (kg/m2) was 28.0% from the 2008 baseline. Using a ‘Business as Usual’3 approach, it is estimated that CapitaLand avoided costs of more than S$165 million for utilities since 2009. We will continue to implement energy and water conservation measures to ensure efficient operations and minimise resource wastage.
Universal Design: In 2018, we achieved two Universal Design Mark Awards for our projects in Singapore.
Certified contractors: In 2018, two main contractors appointed for new development projects were both ISO 14001 and OHSAS 18001 certified.
More than 280 CapitaLand properties across Asia and Europe participated in the World Wide Fund for Nature (WWF) Earth Hour initiative.
2 This was developed by the World Resources Institute and World Business Council for Sustainable Development, which sets the global standard on how to measure, manage and report greenhouse gas emissions.
3 The assumption is that energy and water consumption in subsequent years will continue at 2008 levels (base year) unless improvement measures are adopted.
Cap
itaL
and
Lim
ited
Ann
ual R
epor
t 20
18
86
SUSTAINABILITY

Capitals What We Do (UN SDGs Supported) 2018 Value Created
Human Health and
safety
Job creation and security
Learning and development
Benefits and remuneration
CapitaLand believes that regardless of ethnicity, age or gender, employees can make a significant contribution based on their talent, expertise and experience. We adopt consistent, equitable, and fair labour policies and practices in rewarding as well as developing employees under the direct hire of CapitaLand.
CapitaLand is a signatory to the UN Global Compact.
CapitaLand aims to provide a work environment that is safe and contributes to the general well-being of our employees.
(SDG 3, 8, 10)
Global workforce
- more than 80 nationalities working within the Group
- almost equal proportion of males and females, at a ratio of 47:53
- 67% of CapitaLand’s global workforce was aged between 30 and 50
About 31% of senior management were women
Over 50 training hours per staff (on average)
Zero Fatality/Permanent Disability: In 2018, there was no staff fatality or permanent disability reported
Social and relationship Stakeholder
relations
Social license to operate
Community development
CapitaLand Hope Foundation, CapitaLand’s philanthropic arm, believes in investing in the fundamental needs of education, healthcare and shelter of underprivileged children to relieve them of hardship and help them to eventually break the poverty cycle. The Foundation also strives to improve the quality of life for the vulnerable elderly in Singapore through healthcare, deeper social integration and better living conditions4.
(SDG 1, 2, 4)
Invested more than S$2.2 million through CHF to benefit underprivileged children and vulnerable elderly, and over S$0.5 million in other community development initiatives. To measure the impact of CapitaLand’s community development investments in sustained programmes, we referenced the London Benchmark Group (LBG)5 model for impact assessment. For case studies, please refer to CapitaLand Global Sustainability Report 2018 when published.
Launch of S$2 million CapitaLand Silver Empowerment Fund
4 SDG1 No Poverty includes targets such as ensuring equal rights to economic resources. SDG2 Zero Hunger includes targets such as ending all forms of malnutrition. Both targets are in line with CHF’s work to provide education, healthcare and shelter for underprivileged children.
5 The LBG model is an internationally-recognised framework that enables corporations to measure their overall contribution to the community, taking into account cash, time and in-kind donations, as well as management costs.
Cap
itaL
and
Lim
ited
Ann
ual R
epor
t 20
18
87
SUSTAINABILITY

INNOVATIONPOWERS OUR GROWTH.CapitaLand is enhancing the way people live, work
and play. From smart homes to tech-driven retail
hubs to futuristic, sustainable office spaces—
CapitaLand’s progressive ideas are reshaping
how the world looks at real estate.

OperatingPATMI
S$872.2million
Earnings before Interest & Tax
S$4,145.0million
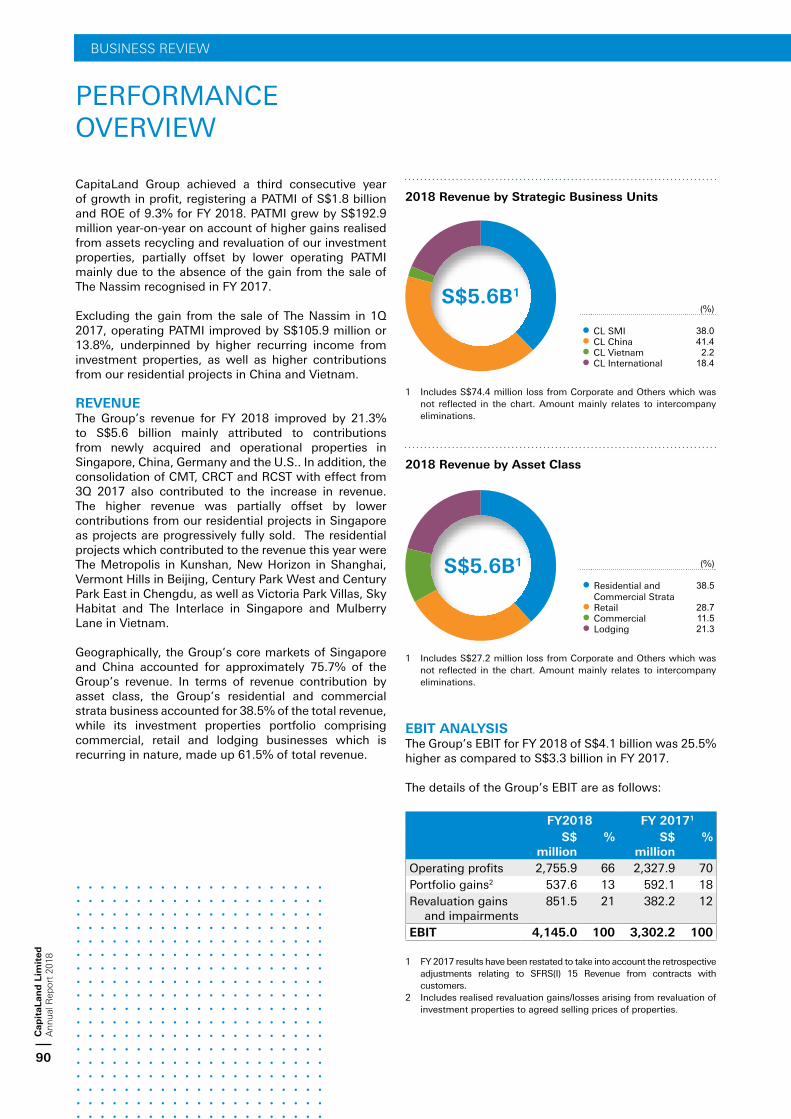
PERFORMANCEOVERVIEW
CapitaLand Group achieved a third consecutive year of growth in profit, registering a PATMI of S$1.8 billion and ROE of 9.3% for FY 2018. PATMI grew by S$192.9 million year-on-year on account of higher gains realised from assets recycling and revaluation of our investment properties, partially offset by lower operating PATMI mainly due to the absence of the gain from the sale of The Nassim recognised in FY 2017.
Excluding the gain from the sale of The Nassim in 1Q 2017, operating PATMI improved by S$105.9 million or 13.8%, underpinned by higher recurring income from investment properties, as well as higher contributions from our residential projects in China and Vietnam.
REVENUEThe Group’s revenue for FY 2018 improved by 21.3% to S$5.6 billion mainly attributed to contributions from newly acquired and operational properties in Singapore, China, Germany and the U.S.. In addition, the consolidation of CMT, CRCT and RCST with effect from 3Q 2017 also contributed to the increase in revenue. The higher revenue was partially offset by lower contributions from our residential projects in Singapore as projects are progressively fully sold. The residential projects which contributed to the revenue this year were The Metropolis in Kunshan, New Horizon in Shanghai, Vermont Hills in Beijing, Century Park West and Century Park East in Chengdu, as well as Victoria Park Villas, Sky Habitat and The Interlace in Singapore and Mulberry Lane in Vietnam.
Geographically, the Group’s core markets of Singapore and China accounted for approximately 75.7% of the Group’s revenue. In terms of revenue contribution by asset class, the Group’s residential and commercial strata business accounted for 38.5% of the total revenue, while its investment properties portfolio comprising commercial, retail and lodging businesses which is recurring in nature, made up 61.5% of total revenue.
(%)
CL SMI 38.0CL China 41.4CL Vietnam 2.2CL International 18.4
2018 Revenue by Strategic Business Units
(%)
Residential and Commercial Strata
38.5
Retail 28.7Commercial 11.5Lodging 21.3
2018 Revenue by Asset Class
S$5.6B1
S$5.6B1
1 Includes S$74.4 million loss from Corporate and Others which was not reflected in the chart. Amount mainly relates to intercompany eliminations.
EBIT ANALYSISThe Group’s EBIT for FY 2018 of S$4.1 billion was 25.5% higher as compared to S$3.3 billion in FY 2017.
The details of the Group’s EBIT are as follows:
FY2018 FY 20171
S$ million
% S$ million
%
Operating profits 2,755.9 66 2,327.9 70Portfolio gains2 537.6 13 592.1 18Revaluation gains
and impairments851.5 21 382.2 12
EBIT 4,145.0 100 3,302.2 100
1 Includes S$27.2 million loss from Corporate and Others which was not reflected in the chart. Amount mainly relates to intercompany eliminations.
1 FY 2017 results have been restated to take into account the retrospective adjustments relating to SFRS(I) 15 Revenue from contracts with customers.
2 Includes realised revaluation gains/losses arising from revaluation of investment properties to agreed selling prices of properties.
Cap
itaL
and
Lim
ited
Ann
ual R
epor
t 20
18
90
BUSINESS REVIEW

Operating profits for FY 2018 rose by 18.4% or S$428.0 million to S$2.8 billion on account of higher operating contributions from our retail, commercial and lodging businesses, as well as residential projects in China. The increase was offset by lower contributions from our residential projects in Singapore and the absence of the gain from the sale of The Nassim in Singapore recognised in FY 2017.
Portfolio gains realised from assets recycling for FY 2018 amounted to S$537.6 million and arose mainly from the divestments of Westgate, Twenty Anson, Sembawang Shopping Centre in Singapore, Somerset International Building, Tianjin and 20 retail malls in China, as well as Citadines Harbourview in Hong Kong. Portfolio gains in FY 2017 were mainly in respect of divestments of properties in China, Singapore, Japan and Germany, as well as investments in Vietnam.
In terms of revaluation of investment properties, the Group recorded a net fair value gain of S$832.6 million in FY 2018 (FY 2017: S$360.8 million). The increase in revaluation gains was mainly from our portfolio of investment properties in Singapore, China and Japan.
During the year, the Group assessed and wrote back a net impairment of S$18.9 million (FY 2017: S$21.4 million), comprising writeback of provision for foreseeable losses in respect of residential projects in Singapore upon sale of units, partially offset by impairments made for an investment in India and certain development projects in China. The net writeback of impairments in FY 2017 were mainly from development projects in China and Vietnam upon sale of units and accompanying price recovery.
Singapore and China markets remain the key contributors to the Group’s EBIT. Singapore accounted for 41.2% (FY 2017: 42.5%) while China accounted for 48.0% (FY 2017: 45.4%) of the Group’s EBIT respectively. Approximately 79.1% of the Group’s EBIT came from its investment properties portfolio which is recurring in nature. In addition, about 51.3% (FY 2017: 51.7%) of the Group’s earnings before interest, tax, depreciation and amortisation (EBITDA) were from developed markets in Singapore, Europe, U.S., Australia, New Zealand, Japan, Korea and Hong Kong.
1 Includes UK, France, Germany, Spain, Belgium and Ireland.2 Excludes Singapore, China, Japan, Korea and Hong Kong.
(%)
CL SMI 44.1CL China 47.4CL Vietnam 1.7CL International 6.8
2018 EBIT by Strategic Business Units
(%)
Residential and Commercial Strata
20.9
Retail 48.8Commercial 22.7Lodging 7.6
2018 EBIT by Asset Class
S$4.1B1
S$4.1B1
(%)
Singapore 41.1China 45.8Japan, Korea & Hong Kong
4.2
Europe developed market1, U.S., Australia and New Zealand
6.0
Other Asia2 2.9
2018 EBITDA by Geographical Location
S$4.2B
1 Includes S$45.8 million loss relating to Corporate and Others which was not reflected in the chart. Corporate and Others includes Corporate office and group eliminations.
1 Includes S$77.8 million loss relating to Corporate and Others which was not reflected in the chart. Corporate and Others includes Corporate office and group eliminations.
Cap
itaL
and
Lim
ited
Ann
ual R
epor
t 20
18
91
BUSINESS REVIEW

PERFORMANCEOVERVIEW
* Cash PATMI defined as sum of operating PATMI, portfolio gains/losses and realised revaluation gains.
49%
Portfolio andRealised FairValue Gains
RevaluationsGains and
Impairments
PATMIOperatingProfits
FY 2018 PATMI Analysis(S$ million)
872
179
170
542
1,763
31%
20%
Realised revaluation gains from divestments of 20 malls in China, Twenty Anson, Westgate and Bugis Village in Singapore
DIVIDENDSThe Board is pleased to propose a tax-exempt ordinary dividend of 12.0 cents per share in respect of the financial year ended 31 December 2018 (2017: 12.0 cents per share). This amounts to a payout of approximately S$499.5 million, which is approximately 40.0% of cash PATMI*, based on the number of issued shares (excluding 111,569,891 treasury shares) as at 31 December 2018. The dividends are subject to the shareholders’ approval at the forthcoming AGM of the Company.
For FY 2017, a first and final dividend of 12.0 cents per share was approved and paid. The said dividends of S$504.1 million were paid in May 2018.
ASSETSThe Group’s total assets as at 31 December 2018 were S$64.6 billion, with Singapore and China assets collectively accounted for approximately 80.9% of the Group’s total assets. The total assets increased by S$3.1 billion over the previous year on account of the acquisitions of 16 multifamily properties in U.S., a retail mall and 2 residential sites in China, a commercial property in Germany, the Pearl Bank Apartment site in Singapore, as well as fair value gains recognised for revaluation on our portfolio of investment properties. In terms of total assets by asset class, investment properties and trading properties accounted for 85.2% and 14.8% of the Group’s total assets respectively. On an effective share basis, the proportion of investment properties to trading properties was about 79% and 21% respectively. The Group’s diversified asset mix continues to generate stable recurring income from our investment properties portfolio, supplemented by a significant contribution from our trading properties.
PATMI Overall, the Group achieved a PATMI of S$1.8 billion in FY 2018, an improvement of 12.3% over FY 2017 PATMI of S$1.6 billion, driven by higher gains realised from assets recycling and revaluation of investment properties, offset by lower operating PATMI and writeback of impairments. Operating PATMI for the year was lower by 5.9% at S$872.2 million (FY 2017: S$927.2 million) mainly due to the absence of the gain from the sale of The Nassim recognised in FY 2017. Excluding this gain, operating PATMI would have increased by 13.8% or S$105.9 million on the back of higher recurring income from investment properties, as well as higher contributions from residential projects in China and Vietnam.
The analysis of the Group’s PATMI is shown below:
49%
12%
349
Cap
itaL
and
Lim
ited
Ann
ual R
epor
t 20
18
92
BUSINESS REVIEW

(%)
CL SMI 45.3CL China 36.2CL Vietnam 2.0CL International 13.4Corporate and Others
3.1
2018 Total Assets by Strategic Business Units
(%)
Residential and Commercial Strata
14.8
Retail 40.0Commercial 26.6Lodging 15.4Corporate and Others
3.2
2018 Total Assets by Asset Class
S$64.6B
S$64.6B
BORROWINGSAs at 31 December 2018, the Group’s gross debt stood at S$23.6 billion. With a cash balance of S$5.1 billion, the net debt as at 31 December 2018 was S$18.6 billion. The net debt position increased by S$3.0 billion mainly due to additional loans taken to fund the Group’s investments and ongoing development expenditure for projects under construction.
SHAREHOLDERS’ EQUITYAs at 31 December 2018, issued and paid-up ordinary share capital (excluding treasury shares) of the Company comprised 4.2 billion shares at S$6.3 billion. The Group’s total reserves increased to S$12.6 billion from S$12.1 billion in 2017. The increase was mainly due to S$1.8 billion net profit for the year, partially offset by purchase of treasury shares, exchange losses from the translation of foreign operations arising from the appreciation of SGD and USD against the RMB during the year, as well as the payment of the 2017 dividends.
As at 31 December 2018, the Group’s total shareholders’ funds was S$19.0 billion (FY 2017: S$18.4 billion) and net tangible assets per share was S$4.40 (FY 2017: S$4.20).
The Group continues to grow its real estate assets under management (RE AUM). As at 31 December 2018, the Group managed S$100.1 billion* of real estate assets, 13% higher than FY 2017 of S$88.8 billion, and this exceeded the Group’s managed RE AUM target of S$100 billion by 2020 ahead of time. This strengthens our position as one of Asia’s largest real estate companies.
* This refers to the value of all real estate managed by CapitaLand Group entities stated at 100% of the property carrying value.
Cap
itaL
and
Lim
ited
Ann
ual R
epor
t 20
18
93
BUSINESS REVIEW

PERFORMANCEOVERVIEW
1 Committed and uncommitted facilities in place.2 Includes outstanding bond issuances and capital market programmes established.3 Exclude share of taxes from associates and joint ventures.4 Comparatives have been restated to take into account the retrospective adjustments related to SFRS(I) 15 Revenue from Contracts with Customers.
TREASURY HIGHLIGHTS
2018 2017
BANK FACILITIES AND AVAILABLE FUNDS (S$ million)
Bank facilities available1 20,963 19,814
Amount utilised for loans 13,004 11,465
Available and unutilised 7,959 8,349
Cash and cash equivalents 5,060 6,105
Unutilised facilities and funds available for use 13,019 14,454
DEBT SECURITIES CAPACITY (S$ million)
Debt securities capacity2 28,898 29,313
Debt securities issued (net of debt securities purchased) 10,630 10,230
Unutilised debt securities capacity 18,268 19,083
LEVERAGE RATIOS (S$ million)
Gross debt 23,634 21,695
Cash and cash equivalents 5,060 6,105
Net debt 18,574 15,590
Equity4 33,307 32,118
Net debt equity ratio (times) 0.56 0.49
Total assets (net of cash)4 59,588 55,434
Net debt/Total assets (net of cash) (times) 0.31 0.28
SECURED DEBT RATIO (S$ million)
Secured debt 6,607 5,775
Percentage of secured debt 28% 27%
INTEREST COVER RATIO (S$ million)
Earnings before net interest, tax, depreciation and amortisation3,4 4,529 3,636
Net interest expense 548 425
Interest cover ratio (times) 8.3 8.6
INTEREST SERVICE RATIO (S$ million)
Operating cashflow before interest and tax 2,862 3,185
Net interest paid 649 475
Interest service ratio (times) 4.4 6.7
Cap
itaL
and
Lim
ited
Ann
ual R
epor
t 20
18
94
BUSINESS REVIEW

OVERVIEWThe Group maintains a prudent capital structure and actively reviews its cashflows, debt maturity profile and overall liquidity position on an ongoing basis. The main sources of the Group’s operating cashflows are derived from residential sales, fees and rental income from its commercial and integrated developments, shopping malls and serviced residence businesses. To support its funding requirements, investment needs and growth plans, the Group actively diversifies its funding sources by putting in place a combination of bank facilities and capital market issuances. The Group’s total gross debt of S$23.6 billion was higher compared to S$21.7 billion as at 31 December 2017. Net debt as at 31 December 2018 was S$18.6 billion compared to S$15.6 billion as at 31 December 2017. The higher net debt was mainly due to additional loans taken to fund the Group’s investments and ongoing development expenditure for projects under construction. As a result, the Group’s net gearing as at end 2018 was higher at 0.56 times as compared to 0.49 times as at end 2017.
Finance costs for the Group were S$636.5 million for the year ended 2018. This was about 31% higher compared to S$486.7 million in 2017. Finance costs were higher mainly due to the consolidation of the finance costs for CMT, CRCT and RCST with effect from August 2017 and the additional loans taken to fund the Group’s investments. Average cost of borrowings remained at 3.2% as in 2017.
SOURCES OF FUNDINGAs at year end, 55% of the Group’s total debt was funded by bank borrowings and the balance 45% was raised through capital market issuances. The Group continues to seek diversified and balanced sources of funding to ensure financial flexibility and mitigate concentration risk.
AVAILABLE LINES BY NATIONALITY OF BANKS The Group has built up an extensive and active relationship with a network of more than 30 banks of various nationalities. Diversity has allowed the Group to tap on the strength and support from financial institutions in pursuing its strategic growth and presence globally, thus enhancing its competitiveness in core markets and enabling the Group to develop other markets where appropriate.
As at end 2018, the Group was able to achieve 99.6% of its funding from committed facilities. The balance 0.4% was funded by flexible uncommitted short term facilities.
As part of its financial discipline, the Group constantly reviews its portfolio to ensure that a prudent portion of committed funding is put in place to match each investment’s respective planned holding period. Committed financing is secured whenever possible to ensure that the Group has sufficient financial capacity and certainty of funding to support its operations, investments and future growth plans.
Sources of Funding (S$ billion)
20152014 2016
$8.251%
$7.849%
Bank and Other Loans Debt Securities
2017 2018
$8.653%
$7.547%
$7.449%
$7.551%
$11.553%
$10.247%
$13.055%
$10.645%
$16.0 $16.1$14.9
$21.7$23.6
(%)
Singapore 46Japan 20China and Hong Kong 17Europe 9Others 8
Available Lines by Nationality of Banks
Cap
itaL
and
Lim
ited
Ann
ual R
epor
t 20
18
95
BUSINESS REVIEW

PERFORMANCEOVERVIEW
INTEREST COVER RATIO AND INTEREST SERVICE RATIOThe Interest Cover Ratio (ICR) and Interest Service Ratio (ISR) was 8.3 times and 4.4 times respectively. ICR was lower at 8.3 times compared to 8.6 times in 2017, mainly attributed to higher net interest expense due to the consolidation of the finance costs for CMT, CRCT and RCST with effect from August 2017 as well as higher borrowings. ISR was lower at 4.4 times compared to 6.7 times in 2017 due to lower cashflows generated from residential projects and operations.
DEBT MATURITY PROFILE The Group has proactively built up sufficient cash reserves and credit lines to meet its short term debt obligations, support its refinancing needs and pursue opportunistic investments. The Group maintains a healthy balance sheet and has unutilised bank facilities of about S$8.0 billion. To ensure financial discipline, the Group constantly reviews its loan profile so as to mitigate any refinancing risks, avoid concentration and extend its maturity profile where possible. In reviewing the maturity profile of its loan portfolio, the Group also takes into account any divestment or investment plans, interest rate outlook and the prevailing credit market conditions.
Debt Maturity Profile (S$ billion)
2years
Within1 year
3years
$3.2
4years
5years
More than 5 years
14%
$3.4
14%
$3.2
14%
$3.8
16%
$4.0
17%
$6.0
25%
Interest Rate Profile(S$ billion)
20152014 2016
$11.975%
$4.125%
Fixed Floating
2017 2018
$11.270%
$4.930%
$10.672%
$4.328%
$14.969%
$6.831%
$17.474%
$6.226%
$16.0 $16.1$14.9
$21.7$23.6
INTEREST RATE PROFILEThe Group manages its finance costs by maintaining a prudent mix of fixed and floating rate borrowings. As at 31 December 2018, the fixed rate borrowings constituted 74% of the portfolio and the balance of 26% were on floating rate basis. As finance costs constitute a major component of the Group’s operating costs, a higher percentage in fixed rate funding offers funding cost certainty. In managing the interest rate profile, the Group takes into account the interest rate outlook of its loan portfolio, holding periods of its investment portfolio, certainty of its planned divestments and operating cashflow generated from its various business units.
Interest Cover Ratio and Interest Service Ratio(Times)
20152014 2016
Interest Cover Ratio Interest Service Ratio
20171 2018
7.2
4.6
6.7
6.1
10.3
6.5
8.6
6.7
8.3
4.4
1 Comparatives for 2017 has been restated to take into account the retrospective adjustments related to SFRS(I) 15 Revenue from Contracts with Customers.
Note: Convertible bonds are reflected as held till final maturity
Cap
itaL
and
Lim
ited
Ann
ual R
epor
t 20
18
96
BUSINESS REVIEW

CAPITALAND SINGAPORE, MALAYSIA & INDONESIA
SINGAPORESingapore’s economy expanded 3.2%1 in 2018 and the Ministry of Trade and Industry of Singapore forecasts economic growth of 1.5% to 3.5% in 2019. Despite uncertainties in the global economy, moderate growth is expected for Singapore in the year ahead.
REPLENISHING OUR PIPELINEThe residential property sector got off to a positive start in 2018. Private property prices increased by 3.4% and 3.9% quarter-on-quarter in the first two quarters of the year. However, market sentiment was dampened by the government’s cooling measures on 6 July 2018 that raised additional buyer’s stamp duty rates and tightened loan-to-value limits on residential property purchases. As a result, property prices moderated by increasing 0.5% in 3Q 2018 and decreased marginally by 0.1% in 4Q 2018. For the whole of 2018, prices increased by 7.9% year-on-year compared to the 1.1% increase in 2017, and new home sales declined to 8,795 units compared to last year’s high of 10,566 units.
In 2018, we replenished our residential development pipeline by acquiring two choice sites. Through a private treaty collective sale, we acquired Pearl Bank Apartments for S$728.0 million in February and clinched a 3.7-hectare mixed-use Government Land Sales (GLS) site at Sengkang Central for S$777.8 million in August 2018, the largest commercial and residential site awarded since 2015.
The Pearl Bank Apartments site is a rare gem - situated at the confluence of Singapore’s business and cultural districts with excellent transport connectivity being minutes’ away from Outram Park MRT station (a triple-line interchange station) and the Central Expressway. The new development is scheduled to be launch-ready in 1H 2019, offering around 800 units with unblocked panoramic views.
With our 50% JV partner, we successfully secured the mixed-use commercial and residential site at Sengkang Central via the two-envelope Concept and Price Revenue tender system. Targeted for completion in 1H 2022, the site will be transformed into a one-stop community hub offering about 700 residential units with direct access to Buangkok MRT station, an upcoming bus interchange along with amenities such as a hawker centre, community club, childcare centre, retail shops, F&B and commercial schools.
In 2018, CapitaLand also sold 99 residential units (2017: 409 units) with a total sales value of S$371.0 million (2017: S$1.5 billion), substantially lowering our residential exposure in Singapore. As at 31 December 2018, d’Leedon, Bedok Residences and Victoria Park Villas were fully sold.
1 Source: Ministry of Trade and Industry of Singapore.
Artist’s impression of Funan, slated to open in 2019
Cap
itaL
and
Lim
ited
Ann
ual R
epor
t 20
18
97
BUSINESS REVIEW

CapitaLand will continue to evaluate and source for well-located sites to replenish our pipeline of homes as the long-term prospects of Singapore’s residential market remain attractive. We will remain selective, disciplined and strategic in our acquisitions.
RECONSTITUTION OF OFFICE PORTFOLIO FOR FUTURE GROWTHCapitaLand’s portfolio of commercial properties held through CCT reported a higher committed occupancy rate of 99.4% as at 31 December 2018 (2017: 97.3%). We achieved this through proactive leasing strategies, forward renewals of major tenants’ leases and stronger take-up of vacant space at Asia Square Tower 2, a premium Grade A office tower.
In 2018, CCT continued its value creation, divesting Twenty Anson for S$516.0 million. The sale consideration was 19.2% above the property’s 31 December 2017 valuation of S$433.0 million and 20.0% higher than the property price of S$430.0 million when CCT acquired it in 2012. The transaction allowed CCT to unlock value and deploy the divestment proceeds towards repayment of higher interest rate borrowings, which resulted in lower aggregate leverage and the enhancement of CCT’s financial flexibility.
CapitaSpring, a S$1.8 billion landmark integrated development at Raffles Place, developed with JV partners CCT and Mitsubishi Estate Co., Ltd (MEC), broke ground on 9 February 2018. Scheduled for completion in 1H 2021, CapitaSpring secured its first anchor tenant, J.P. Morgan in April 2018. The global banking and financial services provider will take up about a quarter of CapitaSpring’s 635,000 square feet (sq ft) net lettable area.
UNLOCKING VALUE AND BUILDING A STRONGER RETAIL PRESENCECapitaLand, as the largest mall owner and manager in Singapore, continues to achieve high stable committed occupancy rate of 97.9% as at 31 December 2018 (2017: 98.0%). Tenants’ sales have grown 1.6% year-on-year against 2017.
During the year, CMT divested Sembawang Shopping Centre to an unrelated party for S$248.0 million and CapitaLand divested its 70.0% interest in Westgate to CMT for S$789.6 million. Gains from these divestments totalled S$134.4 million and helped unlock the properties’ value and grow our AUM — enhancing our financial flexibility to deploy capital into other high yielding investments.
2019 continues to be exciting for the retail scene in Singapore with two upcoming malls – Jewel Changi Airport and Funan – due to open. Jewel Changi Airport will be Singapore’s first multi-dimensional lifestyle destination to integrate Nature, Play and Retail elements on a large scale. Funan will be Singapore’s first online-and-offline shopping mall. Integrating online, offline, data and logistics, we will empower our retailers’ omnichannel strategy and transform our customers’ experience.
OPPORTUNISTIC INVESTMENTS IN MALAYSIA AND INDONESIAIn Malaysia, genKL, a boutique freehold residential development in the mature neighbourhood in Kuchai Lama, Kuala Lumpur, is expected to be completed by 2019. Additionally, 505 new residential units in our master-planned township situated in Kuala Lumpur, secured through a 50% JV with a Malaysian third party, will be ready for launch in 2019. CMMT announced a RM54.5 million Asset Enhancement Initiative (AEI) plan for Sungei Wang2, a well-known shopping mall in the heart of Kuala Lumpur’s city centre. There will be a new annex, named Jumpa3, offering diversified retail, curated F&B, athleisure and family entertainment catering to young, active shoppers, office workers and tourists. The AEI works is expected to complete by 2Q 2019. Despite a challenging 2018, we expect new opportunities for investment and growth in Malaysia.
In Indonesia, The Stature Jakarta, CapitaLand’s first integrated development in Indonesia, has completed piling works and construction is expected to be finished by 1H 2021. With its strong macroeconomic outlook and favourable demographics, including a growing urban population, CapitaLand continues to explore opportunities within Indonesia.
2 CMMT’s interest in Sungei Wang comprises (i) 205 strata parcels within the mall which represents approximately 61.9% of the aggregate retail floor area of Sungei Wang, and (ii) 100.0% of the car park bays in Sungei Wang.
3 Jumpa means “to meet” in Bahasa Melayu.
CAPITALAND SINGAPORE, MALAYSIA & INDONESIA
Cap
itaL
and
Lim
ited
Ann
ual R
epor
t 20
18
98
BUSINESS REVIEW

CAPITALANDCHINA
Despite macroeconomic fluctuations in 2018 caused by supply-side structural reforms as well as trade disputes between the U.S. and China, China’s economy grew 6.6% in 2018, within reasonable range of the official target of 6.5%. While the more moderate pace of growth reflects a transition phase for China’s economy, it also shows that fundamentals have remained robust. During the year, CapitaLand continued its steady growth trajectory in China. We optimised our portfolio by selling non-core assets and investing in high-quality investment properties as well as landbank in our core city clusters to position CapitaLand for long-term growth in China.
PROACTIVE PORTFOLIO RECONSTITUTION At the start of 2018, CapitaLand entered into agreements to divest our share of interest in a group of companies that held 20 non-core retail assets in China at an agreed value of RMB8.4 billion (approximately S$1.7 billion). Proceeds from unlocking the value of these mature assets were redeployed to deepen our presence in core Chinese city clusters where we have a competitive advantage.
One of the opportunities which we saw to deploy this capital was in a 32-hectare mixed-use site in Chongqing’s Liangjiang New Area which we purchased for RMB5.7 billion (approximately S$1.2 billion). This site added over 2,100 units to our residential pipeline. This was followed by August’s acquisition of two prime residential sites
in Zengcheng District, Guangzhou, for RMB2.1 billion (approximately S$409.3 million), that will yield 1,300 homes when fully developed. In November, CapitaLand won a tender for a mixed-use site in Guangzhou Science City for RMB882.0 million (approximately S$175.2 million). This is the first successful bid in land auction for CapitaLand after two years. These acquisitions show that we are optimistic about China’s real estate market. CapitaLand’s comprehensive capability in development and expertise in operation, as well as flexible capital strategy and strong financial position gave us the competitive edge to seize the opportunities. These acquisitions will boost our landbank by 3,400 residential units and over 600,000 sqm of developable GFA.
The Group continues to deploy a disciplined strategy on a sustainable basis to achieve an optimal mix between trading and investment properties, which together with our ability, to unlock value through proactive asset management and to improve capital efficiency by working with like-minded capital partners constitutes our competitive edge in the deleveraging environment.
Also, in November, through RCCIP III, CapitaLand formed a 50:50 JV with GIC to acquire Shanghai’s tallest twin towers for RMB12.8 billion (approximately S$2.5 billion). This will be our third Raffles City development in Shanghai and 10th globally.
Artist’s impression of the newly awarded residential site in Guangzhou’s Zengcheng District
Cap
itaL
and
Lim
ited
Ann
ual R
epor
t 20
18
99
BUSINESS REVIEW

HEALTHY RESIDENTIAL SALESIn 2018, CapitaLand sold 4,938 residential units in China with a total sales value of RMB12.5 billion. Compared to 2017, the number of units sold had decreased by 44%, leading to a 21% reduction in sales value. This lower sales numbers were due to lower inventories available for sale (relative to previous year) as we elect to defer project launches in view of the price caps set by the Chinese government. Our continued discipline in building up land bank across our core city clusters also meant that we had greater optionality to time our sales during this period of heightened regulatory controls. We were able to launch higher value projects across locations at the right timing and sold units from a broad base of projects namely, La Botanica in Xi’an, Raffles City Residences in Chongqing, The Metropolis in Kunshan, La Riva (Datansha) in Guangzhou, Città di Mare in Guangzhou, Vermont Hills in Beijing and Century Park in Chengdu. Our projects enjoyed an overall healthy sales rate of 92% based on launched residential units as at December 2018. The projects launched in 4Q 2018 also achieved a high sell-through rate of close to 80% on average. This allowed us to meet our sales value target of RMB 10-12 billion a year in 2018 even as the number of units sold decreased from 2017.
DEEPENING COMMERCIAL MANAGEMENT CAPABILITIES We continue to deepen our commercial management capabilities in our five city clusters. In 2018, CapitaLand China acquired Shanghai’s tallest twin towers and the integrated development (consisting office and retail) along the Huangpu River in North Bund has been earmarked to be the third Raffles City project in Shanghai.
Another major project, the Raffles City Chongqing, is also on-track to open in phases from 3Q 2019. By the end of 2018, seven of the development’s eight towers had topped out. The structure of the skybridge connecting six of these towers was also completed before the end of the year, and leasing activities for the office and retail portion are in full swing.
In China, we currently have a total of 52 malls, of which eight are managed. In 2018, we opened CapitaMall Tiangongyuan in Beijing, CapitaMall LuOne in Shanghai and CapitaMall ONE in Changsha. Featuring smart technologies, these malls provide shoppers with seamless online-and-offline experiences, on top of introducing a variety of leading brands to their respective local markets. During the year, we also clinched two contracts to manage a mall each in Guangzhou and Chengdu.
EXPLORING NEW BUSINESS MODELSIn addition to speeding up the expansion of our traditional businesses, CapitaLand also explored new business terrains. In April, we signed two MoUs to explore developing and managing large-scale business park and township projects in Zhejiang Province. In May, we launched our own branded coworking space C3 at Innov Center in Shanghai.
During the year, we also saw Ascott accelerating the expansion of its Citadines brand in China through a JV with Nasdaq-listed Huazhu Hotels Group, one of China’s leading hotel operators and its subsidiary CJIA Apartments Group. The partnership marks a significant move in the asset-light “manachise” (managed and franchised) business and complements Ascott’s strong position in the long-stay business.
BUILDING A SMART ECOSYSTEMCapitaLand is riding the wave of digitalisation and partnering with leading players to future-proof our real estate business. CapitaLand’s digital platform CapitaStar is now available on WeChat and as a standalone mobile application, providing B2C and B2B services for over 7.0 million members and 8,000 tenants in China. A range of new functions have been introduced, including instant STAR$ reward through collaboration with UnionPay and Alipay, coworking services and facial recognition access at office towers.
LOOKING FORWARDIn line with our long-term belief in China, we will stay invested through market cycles to reap the compounding effects on our investments. We will actively optimise our portfolio in China and deepen our presence in the core city clusters. We will also continue to expand our digital strategy to strengthen customer engagement and enhance the customer experience.
CAPITALANDCHINA
Cap
itaL
and
Lim
ited
Ann
ual R
epor
t 20
18
100
BUSINESS REVIEW

CAPITALANDVIETNAM
Vietnam is one of CapitaLand’s key markets in Asia and one of the fastest growing countries in the region. CapitaLand’s current portfolio in Vietnam comprises two integrated developments, close to 8,600 quality homes across 15 residential developments, two retail malls and more than 6,400 lodging units in 25 properties.
Continuing our steady expansion in Vietnam, in March 2018, CapitaLand entered a JV to develop our first integrated development in Vietnam’s capital city, Hanoi. We also successfully set up our second commercial fund in the country, CapitaLand Vietnam Commercial Value-Added Fund (CVCVF). In August 2018, CapitaLand acquired a prime site in Ho Chi Minh City, where we will develop over 100 landed residential units targeted for completion by 2021. CapitaLand’s residential launches in 2018, D2eight and De La Sol, were met with strong demand. D2eight is CapitaLand’s first landed development in Vietnam, an exclusive community with only 28 units in Ho Chi Minh City’s District 2. It was sold out within a day of its launch in April. De La Sol, CapitaLand’s first project in Ho Chi Minh City’s District 4, introduced dual- and triple-key units to the Vietnamese market. The units are fully finished with fittings such as smart locks for convenient living and rental.
In 2018, CapitaLand sold 1,102 residential units with a sales value of S$346.0 million, mainly from De La Sol, Seasons Avenue and Vista Verde. CapitaLand also handed over 1,422 units valued at S$285.0 million, mainly from Seasons Avenue, Vista Verde and Mulberry Lane. Although we had lesser sales due to less units available for sale, we handed over more units which translated to higher handed over value compared to last year which saw 1,409 units of value S$460.0 million being sold and 1,404 units of value S$223.0 million being handed over. As a testament to our real estate expertise and the quality of our developments in Vietnam, CapitaLand was honoured with 18 awards including the prestigious ‘Best Developer in Vietnam’ award for the second consecutive year at the PropertyGuru Vietnam Property Awards 2018. We will continue to leverage our robust development capabilities, deep operating expertise and wide business network, and grow our project pipeline via suitable investments and management opportunities in Vietnam.
De La Sol in Ho Chi Minh City
Cap
itaL
and
Lim
ited
Ann
ual R
epor
t 20
18
101
BUSINESS REVIEW

CAPITALANDINTERNATIONAL
In 2018, we continued to expand our global investment footprint with acquisitions in key developed markets of the U.S. and Europe. Though the global economy ended the year on a softer note compared to 2017, advanced economies in the U.S., Europe, Japan, and Australia should post solid growth.
CapitaLand International remains on the lookout for acquisition opportunities in developed markets. This supports our overall Group strategy to build a resilient and diversified portfolio across emerging and developed markets. We will also actively explore opportunities across various asset classes in key gateway cities as well as growth locations and sectors.
EUROPEEconomic growth is driving increased demand for commercial real estate in Germany. Jones Lang Lasalle estimated that office vacancy rates in the top seven German cities was at 3.6% by the end of 2018. In May 2018, CCT and CapitaLand International acquired Gallileo, a freehold Grade A office building in Frankfurt, our second office asset acquisition in Germany. This has expanded our commercial portfolio in Europe to two freehold prime office properties with over one million sq ft of net lettable area, in addition to our existing serviced residence and hotel investment portfolio of over 4,000 units.
Investment demand in the region remains healthy, and we continue to evaluate opportunities to expand our network in the European commercial sector.
We also aim to strengthen our hospitality presence in Europe through our lodging platform, Ascott. According to the World Tourism Organisation, international tourist arrivals in Europe increased 6% in 2018, accounting for half of global international tourist arrivals.
U.S.We own five hospitality properties in the U.S. and are actively evaluating opportunities to expand our presence in the lodging segment. According to STR Inc, the U.S. hotel revenue per available room (RevPAR) increased in 21 of the top 25 markets in 2018. CBRE also expects demand will continue to exceed new supply, based on current forecasts of a positive economic outlook as the correlation between economic activity and performance in the lodging industry has been a long-established one.
In line with CapitaLand’s strategy to build new revenue streams, CapitaLand International forayed into the U.S. multifamily asset class in 2018, acquiring 16 freehold properties comprising 3,787 units in well-connected suburban communities on the West Coast and Mountain Region. This portfolio takes advantage of the growing demand for long-term rental housing while providing immediate scale in a deep and liquid sector.
For our multifamily portfolio, we are embarking on an extensive value-add programme through asset enhancement. Meanwhile, we remain on the lookout for more acquisition opportunities to bulk up the multifamily portfolio and to strengthen our expertise in this asset class.
JAPANThe hospitality sector in Japan remains healthy. Inbound tourism has grown exponentially at 25% p.a. on average, from 6.2 million in 2011 to over 30 million in 20181. Events like the 2019 Rugby World Cup and the 2020 Olympics are expected to drive demand and increase in room rates as we continue to grow our lodging platform in the serviced residence and rental housing sectors.
We are also looking for opportunities to increase our presence in the commercial sector, especially in the buoyant office market. Exceptionally strong demand has driven down vacancy rates in major cities. In Tokyo, the all-grade vacancy rate was 0.8% in 2018, a new low2. Despite a challenging retail climate caused by demographic shifts, increased ecommerce competition and low inflation, our retail properties are on the uptrend in terms of shopper traffic and tenant sales — buoyed by their densely populated locations and the positive effects of recent asset enhancement.
1 Source: Japan National Tourism Organisation2 Source: CBRE
Heronfield in Seattle is one of the 16 multifamily properties acquired by CapitaLand
Cap
itaL
and
Lim
ited
Ann
ual R
epor
t 20
18
102
BUSINESS REVIEW

RETAIL
As at 31 December 2018, CapitaLand’s retail network in Asia comprised 84 shopping malls with a total GFA of about 93.5 million sq ft. Of these, 73 malls are operational and 11 are under development. Our portfolio comprised over 15,000 leases with diverse local and international retailers. In 2018, CapitaLand’s malls continued to perform well in our core markets of Singapore and China, posting growth in net property income and tenants’ sales. In Singapore, our malls achieved 1.6% growth in tenants’ sales, outpacing the national retail sales index (excluding motor vehicles) of 1.1%. In China, our malls posted an increase of 23.2% in tenants’ sales, higher than the rise of 9.0% in China’s retail sales for 2018.
STRONG MALL OPENINGSDuring the year, we opened three malls in China with a combined retail GFA of 3.4 million sq ft. CapitaMall Tiangongyuan, our eighth and largest mall in Beijing, launched successfully with a committed occupancy of about 97.0%. CapitaMall LuOne, our seventh mall in Shanghai opened with a robust committed occupancy of
about 95.0%. In Changsha, we reached a new milestone with the opening of CapitaMall ONE, our first managed mall in the city.
Shoppers’ responses to the malls were positive. On their respective opening days, CapitaMall Tiangongyuan and CapitaMall LuOne received over 160,000 shoppers and 200,000 shoppers respectively, while CapitaMall ONE welcomed over 80,000 shoppers. These new shopping malls have started contributing to the Group’s operating income.
PROACTIVE ASSET MANAGEMENTTo enhance our malls’ competitive edge, we continued to launch AEI to rejuvenate their offerings and increase their attractiveness. For example, in Singapore, Tampines Mall added a new food and beverage duplex, while also refreshing its facade and external walkway. At Westgate, the mall enclosed selected alfresco dining outlets with air conditioning to increase shopper comfort, and added new escalators and entrance points to improve shopper accessibility to and within the mall.
Singapore’s first “phygital” multi-label concept store – NomadX by CapitaLand
Cap
itaL
and
Lim
ited
Ann
ual R
epor
t 20
18
103
BUSINESS REVIEW
In Kuantan, Malaysia, we created a new cluster of international fashion stores on level 1 of East Coast Mall to diversify the retail offerings. In Tokyo, Japan, Olinas Mall refreshed its tenant mix after reconfiguring the store layouts on levels 2 and 3.
GROWING FEE INCOME We secured three retail management contracts in 2018. These included two malls in China, one each in Guangzhou and Chengdu, bolstering our presence in our core cities where we have an established network. The third mall in Phnom Penh marks our first retail foray into Cambodia. This is to cater to partners in our retail network who are keen to tap the retail potential of this fast-growing Southeast Asia country.
Including these new contracts, CapitaLand has to-date signed 10 agreements with a total GFA of about 5.8 million sq ft since August 2016 when we announced our intent to grow our retail footprint through management contracts. The growth momentum attests to the scalability and the value of CapitaLand’s best-in-class retail operating platform.
INNOVATING THE FUTUREIn the age of digital disruption, we see digital technology as a key enabler to strengthen CapitaLand’s real estate offerings. By digitally transforming our business processes and interactions with our shoppers, we strive to enrich the customer experience while empowering our retailers to succeed in an omnichannel world where digital touchpoints with shoppers are growing in importance.
During the year, we made several enhancements to our CapitaStar programme in China and Singapore that included in-app redemption of promotions and car park fees. To support Singapore’s Smart Nation initiative, we launched StarPay, an in-app ePayment feature on CapitaStar. We also took CapitaVoucher digital, enabling shoppers to purchase and gift eCapitaVoucher on the CapitaStar app and automating the redemption process for our tenants. By the end of 2018, CapitaStar’s membership figure had crossed the 7.5 million mark.
In Singapore, we launched NomadX, our first multi-label concept store featuring digital sensors, ePayment systems and unmanned store technology. Strategically located at Plaza Singapura in Orchard Road, NomadX provided a platform for us to collaborate with both new and established retailers keen to adopt technology to enhance interaction with shoppers. In addition, NomadX extended our reach to pop-up retailers that only require transient space or space to complement their online presence. Integrating our physical retail space with digital technology has enabled our malls and tenants to engage and strengthen their interactions with more customers while allowing us to deepen our understanding of these shoppers.
LOOKING AHEADIn view of uncertainties in the global economy, as well as increased competition from online and offline players, the retail outlook for 2019 remains challenging. CapitaLand will remain vigilant and proactively explore new ways to differentiate our malls from the competition and increase customer engagement.
Our priorities in 2019 include opening three malls – Jewel Changi Airport and Funan in Singapore, and Raffles City Chongqing in China. In addition, we will continue to invest in AEI to refresh our malls, introduce innovative concepts to delight our shoppers and forge ahead with our omnichannel initiatives to empower our retailers, keeping in pace with changing consumer habits.
RETAIL
Cap
itaL
and
Lim
ited
Ann
ual R
epor
t 20
18
104
BUSINESS REVIEW

COMMERCIAL
As of 31 December 2018, CapitaLand’s commercial portfolio comprised around 2.0 million sqm of office buildings in Singapore, China, Germany, Japan and Vietnam. Besides standalone commercial buildings, about 67% of the portfolio are commercial assets that form part of our integrated developments.
CapitaLand continues to consider commercial buildings an attractive asset class, proactively managing our portfolio by divesting Twenty Anson in Singapore and commencing operations at Innov Center in Shanghai, China in 2018.
OFFICE OF THE FUTURE STRATEGYCapitaLand’s buildings worldwide provide high-quality work environments for more than 200,000 working professionals. New technology, the heightened need for flexible spaces and the emphasis on user experiences are changing the way tenants look at the build environment. CapitaLand Commercial launched “Office of the Future” strategy in 2018 — aimed at driving innovation, attracting and retaining talent as well as optimising cost efficiency for our tenants. This involves the integration of conventional office space (core) and flexible space (flex) – such as coworking and collaboration spaces – into an ecosystem of innovative workplace solutions that are community-driven and tech-enabled. Tenants will have the flexibility to structure any combination of core and / or flex spaces in their leases. CapitaLand Commercial will introduce these new offerings in phases in buildings such as Innov Center in Shanghai, China, Capital Tower and Asia Square Tower 2 in Singapore and suitable developments in the portfolio in the coming years.
BRINGING THE COMMUNITY TOGETHERCapitaLand aims to create an office environment ready for the future of work. Besides a high-quality, tech-enabled built environment, a vibrant community is also an important aspect. CapitaLand’s tenants can look forward to lunchtime workshops, evening work-out sessions and annual signature events such as Gifts of Joy, a philanthropic activity where CapitaLand staff and office tenants come together to help the underprivileged through gift donations and volunteerism.
TECHNOLOGY ENHANCEMENTSIn 2018, CapitaLand invested significantly in technology to help manage our commercial buildings more efficiently, strengthen tenant engagement and improve the digital workplace experience. Key technology platforms launched in 2018 included:
CapitaStar@Work: a mobile application that lets tenants book facilities and events, build their own community network within the building and access discounts and offers from vendors
Digital Tenancy System: a digital platform to facilitate physical handover of premises to tenants
Intelligent building platform – centralised equipment and video analytics capability
Facial recognition system – a secure, digital building access system that eliminates the need for access cards
Visitor management system – an online system that lets visitors pre-register for access to the building
LOOKING AHEADBesides adhering to the highest standards in operating our commercial portfolio, CapitaLand will continue to look for opportunities to innovate and provide the next wave of distinctive workplace enhancements to our tenants. The “Office of the Future” strategy will play a key role in ensuring that our buildings remain relevant and attractive to tenants as their business needs change.
Open Mind is a versatile open-concept space designed to facilitate open discussions and promote interactions
Cap
itaL
and
Lim
ited
Ann
ual R
epor
t 20
18
105
BUSINESS REVIEW

LODGING
CapitaLand’s lodging unit, Ascott, manages a quality portfolio of serviced residences and hotels with award-winning brands across more than 170 cities in over 30 countries in the Americas, Asia Pacific, Europe, the Middle East and Africa.
UNPRECEDENTED GROWTH2018 was another record year for Ascott, as we added more than 30,000 units to our portfolio and expanded our presence in 45 new cities across nine countries. This makes Ascott one of the fastest growing global players in the lodging industry. Also in 2018, Ascott crossed the 100,000-unit milestone, comprising approximately 57,000 operational units and 43,000 units under development.
We also opened a record number of 27 properties with more than 4,200 units, including our first property in Africa. Total operational units contributed S$186.9 million of fee income1 in 2018. Our revenue per available unit (RevPAU) improved 4.0% to S$121 on a same-store basis.
EXPANDING THROUGH STRATEGIC PARTNERSHIPS AND INVESTMENTSAscott invested in a 70.0% stake in TAUZIA Hotel Management for US$25.9 million, boosting our portfolio by close to 20,000 units spanning 122 hotels across Indonesia, Malaysia and Vietnam. The strategic partnership has expanded Ascott’s range of lodging offerings to include the fast-growing middle-class business hotels.
We also established a JV with one of China’s leading hotel operators Nasdaq-listed Huazhu Hotels Group and its apartment rental subsidiary CJIA Apartments Group to accelerate the growth of our Citadines brand in China. The JV has secured four Citadines properties in Beijing and Shanghai. With a target to sign 16,000 units under Citadines by 2025, Ascott is well positioned to more than triple our current Citadines portfolio in China.
In 2018, we entered into strategic alliances with top real estate developers across the region, including Ciputra Development Group in Indonesia, Cebu Landmasters Inc. in the Philippines, Ananda Development in Thailand, NTT Urban Development Corporation in Japan and Riverside Group in China. These partnerships will enable us to gain access to a pipeline of quality projects, strengthen our foothold in the respective markets and extend our partners’ reach overseas.
SETTING A NEW INTERNATIONAL GREEN BENCHMARKAs a world’s first, Ascott signed a MOU with International Finance Corporation (IFC), a member of the World Bank Group, to pioneer a green building certification for serviced residences, as part of IFC’s Excellence in Design for Greater Efficiencies (EDGE) system2. By tapping IFC’s international network and funding, we can also source additional business opportunities in emerging markets and contribute our strong expertise in hospitality management. Our newly renovated Ascott Makati is the first to be awarded IFC’s EDGE green building certification in the serviced residence category.
DELIVERING AWARD-WINNING HOSPITALITYAscott’s commitment to consistently deliver high-quality accommodation options and services was recognised with 140 accolades in 2018, the largest number of awards garnered in a single year.
LOOKING AHEADAscott is on track to meet our global target of 160,000 units by 2023. We will continue to expand through investments, strategic alliances, management contracts and franchises, across our serviced residence and hotel brands. As Ascott scales up, the management and franchise fee income will strengthen CapitaLand’s earnings profile, increasing the Group’s ROE. To position ourselves better for the future, we will continue to leverage technology to remain competitive, improve productivity and enhance customer experience.
1 Includes fee based and service fee income.2 EDGE is a green building certification that covers nearly 140 emerging countries. An innovation of IFC, a member of the World Bank Group, EDGE
is recognised by various World Green Building councils and the Global Real Estate Sustainability Benchmark.
YELLO Hotel Manggara in Jakarta, Indonesia caters to aspirational travellers who appreciate creative designs and technology
Cap
itaL
and
Lim
ited
Ann
ual R
epor
t 20
18
106
BUSINESS REVIEW

INVESTMENT MANAGEMENT
A LEADING REAL ESTATE INVESTMENT MANAGER IN ASIA CapitaLand has built a strong reputation as a leader in the Singapore REITs market and private fund management business. We manage 15 private equity vehicles and five listed REITs with an aggregate Fund AUM of S$54.2 billion. Most of the assets managed are located in Asia Pacific, with sizeable presence in Singapore (40%) and China (48%).
CapitaLand has a dedicated Investment Management business unit which explores opportunities to develop new CapitaLand discretionary real estate funds. As a real estate developer-owner-manager with multi-sectoral expertise and deep local knowledge of the various markets we invest in, CapitaLand provides our capital partners access to a variety of valuable investment opportunities. We use our operational expertise to enhance cash flow, optimise the value of underlying assets and produce long-term risk-adjusted returns for our capital partners.
Through our private equity vehicles and REITs, CapitaLand diversifies our funding sources while expanding our AUM. The Group has a respectable stable of international capital partners that include sovereign wealth funds, pension funds and insurance companies from Asia Pacific, North America, the Middle East and Europe. They invest in our private equity vehicles which range from private equity funds, club deals and JV to separate accounts.
The fee income generated from fund management allows CapitaLand to further extract value from our established real estate platform while enhancing the Group’s overall ROE. CapitaLand also demonstrates alignment of interests by investing alongside our investors.
Over the years, CapitaLand has originated a diverse array of investment vehicles to match the right capital pricing with the appropriate real estate exposure across a wide risk-reward spectrum. The private equity vehicles managed by CapitaLand typically invest in opportunistic and value-added plays that aim to generate higher risk-adjusted returns and capital appreciation while the listed REITs focus on stable yielding core assets.
In March 2018, we set up our second commercial fund in Vietnam, CVCVF, a US$130.0 million private equity vehicle investing in Grade A commercial real estate in Vietnam. With a fund life span of eight years, CapitaLand holds a 50% stake in CVCVF with the balance interest held by a major institutional investor. This brings our Fund AUM across our five listed REITs and 15 private vehicles to S$54.2 billion. We are on track to achieve the
target set in 2015 to grow another S$10.0 billion AUM in our private fund business by 2020.
Our fund management business provides an important source of recurring fee income to the Group and a capital efficient way to grow our AUM. We look to further grow our private fund management platform to leverage our core competencies alongside like-minded third-party capital providers. Post year-end, we launched our first discretionary real estate debt fund to invest in offshore US dollar-denominated subordinated instruments for real estate in China’s first- and second-tier cities. We also plan to launch our first value-add fund to invest in commercial real estate in key gateway cities in Asia in 2019.
ACCOLADESIn May 2018, CapitaLand topped the ranking of Asia Pacific managers with the highest total real estate AUM in a 2018 Fund Manager Survey jointly conducted by the Asian Association for Investors in Non-Listed Real Estate Vehicles Limited (ANREV), the European Association for Investors in Non-Listed Real Estate Vehicles (INREV) and the National Council of Real Estate Investment Fiduciaries (NCREIF) in the U.S.
1 Denotes total assets of REITs and private equity vehicles. 2 Includes private equity funds, club deals, joint ventures and separate accounts with capital partners.3 Others include Malaysia, Vietnam, other Asia, Europe and the U.S.
Total Fund AUM1 (S$ billion)
Fund AUM1 By Geography (S$ billion)
SingaporeChina Others3
3.6
22.6
21.7
0.2
5.5
0.6
REITs PE Funds2
46.042.4
47.9 51.2
2015 2016 2017 20182014
54.2
CAGR 7%
2013
39.2
Cap
itaL
and
Lim
ited
Ann
ual R
epor
t 20
18
107
BUSINESS REVIEW

CAPITALAND PROPERTY PORTFOLIOINTEGRATED DEVELOPMENTSAs at 31 December 2018
City Property Effective Stake (%)
GFA (sqm)
Tenure (Years)
Tenure Expiry
CHINA
Beijing Raffles City BeijingR: 36% O: 37% L: 27%
55.0 110,997 Leasehold 2046Retail
2056Integrated Use
Chengdu CapitaMall TianfuR: 72% O: 11% S: 17%
50.0 193,851 Leasehold 2048Commercial
2078Residential
Raffles City ChengduR: 36% O: 30% L: 22% S: 12%
55.0 237,310 Leasehold 2046
Chongqing Raffles City ChongqingR: 29% O: 10% L: 11% S: 50%
62.5A 814,770 Leasehold 2057Commercial
2087Residential
Guangzhou Guangzhou Science City 75.0B,1 142,107 Leasehold 2059Hangzhou Raffles City Hangzhou
R: 40% O: 12% L: 25% S: 23%55.0 296,886 Leasehold 2049
Ningbo Raffles City NingboR: 51% O: 30% S: 19%
55.0 101,405 Leasehold 2047
Y-TownO: 33% S: 67%
100.0A 23,662 Leasehold 2057
Shanghai Integrated Development in North BundR: 36% O: 64%
20.8A 317,604 Leasehold 2053Retail
2063Office
Capital SquareR: 33% O: 67%
70.0 75,117 Leasehold 2052Retail
2062Office
Capital Tower ShanghaiR: 2% O: 66% L: 32%
99.0B 66,160 Leasehold 2056
CapitaMall HongkouR: 72% O: 28%
72.5 205,119 Leasehold 2057
CapitaMall LuOneR: 65% O: 35%
33.0A 131,303 Leasehold 2056
CapitaMall MinhangR: 60% O: 40%
65.0 146,843 Leasehold 2053
Raffles City ChangningR: 48% O: 52%
42.8 268,646 Leasehold 2055
Raffles City ShanghaiR: 34% O: 66%
30.7 139,593 Leasehold 2045
LegendL - Lodging O - Office R - Retail S - Strata Sales
Cap
itaL
and
Lim
ited
Ann
ual R
epor
t 20
18
108
PORTFOLIO DETAILS

City Property Effective Stake (%)
GFA (sqm)
Tenure (Years)
Tenure Expiry
CHINA
Shenzhen ONE iParkS: 100%
73.0 74,593 Leasehold 2056
Raffles City ShenzhenR: 56% O: 27% L: 17%
30.4 121,814 Leasehold 2056
Suzhou Suzhou Center Mall & Suzhou Center OfficeR: 82% O: 18%
50.0A 329,217 Leasehold 2051
Tianjin Tianjin International Trade CentreR: 19% O: 23% S: 58%
100.0 195,089 Leasehold 2057
Wuhan CapitaMall WestgateR: 65% O: 24%, S:11%
100.0 246,435 Leasehold 2053Commercial
2063Integrated Use
CapitaMall WushengR: 71% L: 29%
45.0 112,769 Leasehold 2044
Xi'an CapitaMall XindichengR: 40% O: 22% L: 21% S: 17%
45.0 152,199 Leasehold 2043
China Total 4,503,489
INDONESIA
Jakarta The Stature, Jakarta R: 1% O: 32% L: 28% S: 38%
50.0A 55,436 20 to 30 2029 to 2037
Indonesia Total 55,436
MALAYSIA
Petaling Jaya 3 Damansara R: 83% O: 17%
36.72 71,452 Freehold -
Malaysia Total 71,452
SINGAPORE
Singapore CapitaSpringNLA: R: 1,084 sqm, O: 59,027 sqm, L: 299 rooms
58.5A,3,4 93,351 99 2081
Funan R: 56% O: 30% L: 14%
28.4A,5,6 82,405 99 2078
Raffles City SingaporeNLA: R: 39,713 sqm, O: 35,433 sqm, L: 2,030 rooms
29.43,5 320,490 99 2078
Site at Sengkang CentralR: 23% S: 77%
50.0B,7 65,621 99 2117
Singapore Total 561,867
LegendL - Lodging O - Office R - Retail S - Strata Sales
Cap
itaL
and
Lim
ited
Ann
ual R
epor
t 20
18
109
PORTFOLIO DETAILS

CAPITALAND PROPERTY PORTFOLIOINTEGRATED DEVELOPMENTSAs at 31 December 2018
City Property Effective Stake (%)
GFA (sqm)
Tenure (Years)
Tenure Expiry
VIETNAM
Hanoi Integrated Site in Tay Ho DistrictR: 5% L: 28% S: 67%
99.5B 95,267 Leasehold 2056Retail/Serviced
Residence
Ho Chi Minh City
D1MENSIONR: 4% L: 65% S: 31%
100.0A 37,843 Freehold* Residential/Serviced
Residence
The VistaR: 9% O: 5% L: 8% S: 78%
100.0 190,374 Leasehold
Freehold*
2056Retail/Office/
Serviced Residence
Residential
Vietnam Total 323,484
Grand Total 5,515,728
LegendL - Lodging O - Office R - Retail S - Strata Sales
Cap
itaL
and
Lim
ited
Ann
ual R
epor
t 20
18
110
PORTFOLIO DETAILS

CAPITALAND PROPERTY PORTFOLIOSHOPPING MALLSAs at 31 December 2018
City Property Effective Stake (%)
GFA (sqm)
Tenure (Years)
Tenure Expiry
CHINA
Beijing CapitaMall Crystal 45.0 72,422 Leasehold 2043Commercial
2053Underground
Car Park
CapitaMall Grand Canyon 28.58 69,967 Leasehold 2044Commercial
2054Underground
Car Park
CapitaMall Shuangjing 28.58 49,463 Leasehold 2042CapitaMall Taiyanggong 45.0 83,693 Leasehold 2044CapitaMall Tiangongyuan 100.0 137,832 Leasehold 2051CapitaMall Wangjing 28.58 68,010 Leasehold 2043
Commercial
2053Underground
Car Park
CapitaMall Xizhimen 28.58 83,075 Leasehold 2044Commercial
2054Integrated Use
Changsha CapitaMall Yuhuating 73.1 62,080 Leasehold 2044Chengdu CapitaMall Jinniu 45.0 151,969 Leasehold 2044
CapitaMall Meilicheng 50.0 61,182 Leasehold 2044
CapitaMall Xinnan 28.58 53,619 Leasehold 2047Dalian CapitaMall Peace Plaza 30.0 152,125 Leasehold 2035Guangzhou CapitaMall SKY+ 100.0 87,404 Leasehold 2051
Rock Square 63.54,8 83,591 Leasehold 2045Harbin CapitaMall Aidemengdun 45.0 43,851 Leasehold 2042
CapitaMall Xuefu 45.0 104,000 Leasehold 2045Huhhot CapitaMall Saihan 28.58,12 41,938 Leasehold 2041Mianyang CapitaMall Fucheng 45.0 90,245 Leasehold 2044/2047Qingdao CapitaMall Xinduxin 50.0 104,034 Leasehold 2050Rizhao CapitaMall Rizhao 30.0 70,898 Leasehold 2043Shanghai CapitaMall Qibao
(CapitaMall Qibao is indirectly held under a master lease which expires in Jan 2024, with the right to renew for a further term of 19 years and 2 months.)
28.58 72,729 Leasehold 2024Master Lease
Tianjin CapitaMall TianjinOne 30.0 59,305 Leasehold 2054Wuhan CapitaMall 1818 50.0 71,922 Leasehold 2052
CapitaMall Minzhongleyuan 28.58 37,472 Leasehold 2044Conserved
Building Master Lease
2045Annex Building
Wuhu CapitaMall Wuhu 36.64,8 45,634 Leasehold 2044Zhengzhou CapitaMall Erqi 28.58 92,356 Leasehold 2042
China Total 2,050,816 Cap
itaL
and
Lim
ited
Ann
ual R
epor
t 20
18
111
PORTFOLIO DETAILS

City Property Effective Stake (%)
GFA (sqm)
Tenure (Years)
Tenure Expiry
INDIA
Jalandhar Mall in Jalandhar 29.6B 57,043 Freehold -Nagpur Mall in Nagpur 29.6B 94,761 Freehold -
India Total 151,804
JAPAN
Chiba Vivit Minami-Funabashi 100.0 69,444 Freehold -Hyogo Coop Kobe Nishinomiya-Higashi 100.0 7,970 Freehold -Tokyo La Park Mizue 100.0 18,914 Freehold -
Olinas Mall 100.0 54,146 Freehold -Saitama Seiyu & Sundrug 100.0 24,895 Freehold -
Japan Total 175,369
MALAYSIA
Kuala Lumpur Sungei Wang (approximately 61.9% of aggregate retail floor area and 100% of car park bays)
36.72 47,483 Freehold -
Kuantan East Coast Mall 36.72 66,986 99 2106Penang Gurney Plaza 36.72 116,438 Freehold -
Queensbay Mall (approximately 91.8% of aggregate retail floor area and 100% of car park bays)
100.0 86,151 Freehold
Selangor Melawati Mall 50.0 87,706 Freehold -The Mines 36.72 106,913 99 2091
Malaysia Total 511,677
SINGAPORE
Singapore Bedok Mall 28.45 31,204 99 2110Bugis Junction 28.45 53,607 99 2089Bugis+ 28.45 29,697 60 2065Bukit Panjang Plaza 28.45 22,998 99 2093Clarke Quay 28.45 34,056 99 2089IMM Building 28.45 132,527 60 2049ION Orchard 50.0 88,165 99 2105JCube 28.45 29,426 99 2090Jewel Changi Airport 49.0A 135,676 60 2073Junction 8 28.45 34,935 99 2090Lot One Shoppers' Mall 28.45 30,301 99 2092Plaza Singapura 28.45 70,347 Freehold -Tampines Mall 28.45 47,132 99 2091The Atrium@Orchard 28.45 53,582 99 2107The Star Vista 100.0 24,000 60 2067Westgate 28.45 55,176 99 2110
Singapore Total 872,829
Grand Total 3,762,495
CAPITALAND PROPERTY PORTFOLIOSHOPPING MALLSAs at 31 December 2018
Cap
itaL
and
Lim
ited
Ann
ual R
epor
t 20
18
112
PORTFOLIO DETAILS

CAPITALAND PROPERTY PORTFOLIOLODGING - SERVICED RESIDENCESAs at 31 December 2018
City Property Effective Stake (%)
No. ofUnits
Tenure (Years)
Tenure Expiry
AUSTRALIA
Brisbane Quest Cannon Hill 100.0 100 Freehold -Melbourne Citadines on Bourke Melbourne 44.79 380 Freehold -
Quest NewQuay Docklands 50.0A 221 Freehold -Somerset on Elizabeth Melbourne 100.0 34 Freehold -
Perth Citadines St Georges Terrace Perth 44.79 85 Freehold -Sydney Quest Campbelltown 44.79 81 Freehold -
Quest Mascot 44.79 91 Freehold -Quest Sydney Olympic Park 44.79 140 99 2111
Australia Total 1,132
BELGIUM
Belgium Citadines Sainte-Catherine Brussels 44.79 169 Freehold -Citadines Toison d'Or Brussels 44.79 154 Freehold -
Belgium Total 323
CHINA
Chengdu Somerset Riverview Chengdu 100.0 200 50 2049Chongqing Somerset JieFangBei Chongqing 100.0 157 40 2037Dalian Somerset Grand Central Dalian 44.79 195 50 2056Guangzhou Ascott Guangzhou 44.79 207 70 2074Shanghai Ascott Heng Shan Shanghai 100.0 90 50 2054
Somerset Xu Hui Shanghai 44.79 168 70 2066The Paragon Towers 5 & 6 99.0 105 70 2072
Shenyang Somerset Heping Shenyang 44.79 270 40 2046Suzhou Citadines Xinghai Suzhou 44.79 167 70 2066Tianjin Somerset Olympic Tower Property Tianjin 44.79 185 70 2062Wuhan Citadines Zhuankou Wuhan 44.79 249 40 2043
China Total 1,993
CHINA - HONG KONG
Hong Kong Citadines Mercer Hong Kong 100.0 55 999 2851
China - Hong Kong Total 55
Cap
itaL
and
Lim
ited
Ann
ual R
epor
t 20
18
113
PORTFOLIO DETAILS

City Property Effective Stake (%)
No. ofUnits
Tenure (Years)
Tenure Expiry
FRANCE
Cannes Citadines Croisette Cannes 44.79 58 Freehold -Grenoble Citadines City Centre Grenoble 44.79 107 Freehold -Lille Citadines City Centre Lille 44.79 101 Freehold -Lyon Citadines Presqu'île Lyon 44.79 116 Freehold -Marseille Citadines Castellane Marseille 44.79 97 Freehold -
Citadines Prado Chanot Marseille 44.79 77 Freehold -Montpellier Citadines Antigone Montpellier 44.79 122 Freehold -Paris Citadines Austerlitz Paris 44.79 50 Freehold -
Citadines Didot Montparnasse Paris 44.79 80 Freehold -Citadines Les Halles Paris 44.79 189 Freehold -Citadines Maine Montparnasse Paris 44.79 67 Freehold -Citadines Montmartre Paris 44.79 111 Freehold -Citadines Place d’Italie Paris 44.79 169 Freehold -Citadines République Paris 44.79 76 Freehold -Citadines Tour Eiffel Paris 44.79 104 Freehold -Citadines Trocadéro Paris 44.79 97 Freehold -La Clef Champs-Élysées Paris 50.0A 70 Freehold -La Clef Louvre Paris 44.79 51 Freehold -La Clef Tour Eiffel Paris 100.0 112 Freehold -
France Total 1,854
GERMANY
Berlin Citadines Kurfürstendamm Berlin 44.79 117 Freehold -Frankfurt Citadines City Centre Frankfurt 47.64,9 165 Freehold -Hamburg Citadines Michel Hamburg 47.64,9 127 99 2111
Madison Hamburg 44.79 166 Freehold -Munich Citadines Arnulfpark Munich 44.39 146 Freehold -
Germany Total 721
CAPITALAND PROPERTY PORTFOLIOLODGING - SERVICED RESIDENCESAs at 31 December 2018
Cap
itaL
and
Lim
ited
Ann
ual R
epor
t 20
18
114
PORTFOLIO DETAILS

City Property Effective Stake (%)
No. ofUnits
Tenure (Years)
Tenure Expiry
INDIA
Chennai Citadines OMR Gateway Chennai 100.0 269 Freehold -Somerset Greenways Chennai 51.0 187 Freehold -
India Total 456
INDONESIA
Jakarta Ascott Jakarta 44.79 204 26 2024Ascott Kuningan Jakarta 100.0 185 30 2027Ascott Sudirman Jakarta 50.0 192 20 2036Somerset Grand Citra Jakarta 25.79 203 30 2024
Indonesia Total 784
IRELAND
Dublin Temple Bar Hotel 100.0 136 Freehold -
Ireland Total 136
JAPAN
Fukuoka Actus Hakata V-Tower 44.79 296 Freehold -Infini Garden 44.79 389 Freehold -
Hiroshima Gravis Court Kakomachi 44.79 63 Freehold -Gravis Court Kokutaiji 44.79 48 Freehold -Gravis Court Nishiharaekimae 44.79 29 Freehold -
Kobe S-Residence Shukugawa 88.9 33 Freehold -Kyoto Citadines Karasuma-Gojo Kyoto 44.79 124 Freehold -
House Saison Shijo-dori 88.9 190 Freehold -Nagoya Marunouchi Central Heights 88.9 30 Freehold -Osaka S-Residence Fukushima Luxe 44.79 178 Freehold -
S-Residence Gakuenzaka 88.9 58 Freehold -S-Residence Hommachi Marks 44.79 110 Freehold -S-Residence Midoribashi Serio 44.79 98 Freehold -S-Residence Namba Viale 88.9 116 Freehold -
S-Residence Tanimachi 9 chome 44.79 102 Freehold -Sapporo Big Palace Kita 14jo 44.79 140 Freehold -Tokyo Citadines Central Shinjuku Tokyo 44.79 206 Freehold -
Citadines Shinjuku Tokyo 44.79 160 Freehold -Roppongi Residences Tokyo 44.79 64 Freehold -Somerset Azabu East Tokyo 44.79 79 Freehold -Somerset Shinagawa Tokyo 50.0 55 Freehold -
Japan Total 2,568
Cap
itaL
and
Lim
ited
Ann
ual R
epor
t 20
18
115
PORTFOLIO DETAILS

City Property Effective Stake (%)
No. ofUnits
Tenure (Years)
Tenure Expiry
MALAYSIA
Kuala Lumpur Ascott Kuala Lumpur 50.0 221 Freehold -Somerset Ampang Kuala Lumpur 44.79 205 Freehold -
Malaysia Total 426
PHILIPPINES
Makati Ascott Makati 44.79 362 48 2044Somerset Millennium Makati 28.19 133 Freehold -
Philippines Total 495
SINGAPORE
Singapore Ascott Orchard Singapore 44.79 220 99 2113Ascott Raffles Place Singapore 44.79,12 146 999 2890 - 2892Citadines Mount Sophia Property Singapore 44.79 154 96 2105lyf Funan Singapore 50.0A 279 99 2078lyf one-north Singapore 44.7A,9,13 324 60 2078Somerset Liang Court Property Singapore 44.79 197 97 2077
Singapore Total 1,320
SPAIN
Barcelona Citadines Ramblas Barcelona 44.79 131 Freehold -
Spain Total 131
THAILAND
Bangkok Ascott Sathorn Bangkok 40.0 177 50 2054Citadines Sukhumvit 11 Bangkok 49.0 127 Freehold -Citadines Sukhumvit 16 Bangkok 49.0 79 Freehold -Citadines Sukhumvit 23 Bangkok 49.0 138 Freehold -Citadines Sukhumvit 8 Bangkok 49.0 130 Freehold -
Thailand Total 651
CAPITALAND PROPERTY PORTFOLIOLODGING - SERVICED RESIDENCESAs at 31 December 2018
Cap
itaL
and
Lim
ited
Ann
ual R
epor
t 20
18
116
PORTFOLIO DETAILS

City Property Effective Stake (%)
No. ofUnits
Tenure (Years)
Tenure Expiry
UNITED ARAB EMIRATES
Abu Dhabi Rihan Heights 49.0 307 Freehold -
United Arab Emirates Total 307
UNITED KINGDOM
London Citadines Barbican London 44.79 129 Freehold -Citadines Holborn-Covent Garden London 44.79 192 Freehold -Citadines Islington London 50.0A 108 999 3015Citadines South Kensington London 44.79 92 Freehold -Citadines Trafalgar Square London 44.79 187 Freehold -The Cavendish London 100.0 230 150 2158
United Kingdom Total 938
UNITED STATES OF AMERICA
New York City Citadines Connect Fifth Avenue New York 100.0 125 99 2113DoubleTree by Hilton Hotel New York - Times Square South
44.79 224 Freehold -
Element New York Times Square West 44.79 411 99 2112Sheraton Tribeca New York Hotel 44.79 369 99 2112
Sunnyvale The Domain Hotel 100.0 136 Freehold -
United States Of America Total 1,265
VIETNAM
Hai Phong City
Somerset Central TD Hai Phong City 90.0 132 65 2076
Hanoi Somerset Grand Hanoi 34.09 185 45 2038Somerset Hoa Binh Hanoi 40.29 206 36 2042Somerset West Lake Hanoi 31.39 90 49 2041
Ho Chi Minh City
Somerset Chancellor Court Ho Chi Minh City
30.09 172 48 2041
Somerset Ho Chi Minh City 28.29 198 45 2039
Vietnam Total 983
Grand Total 16,538
Cap
itaL
and
Lim
ited
Ann
ual R
epor
t 20
18
117
PORTFOLIO DETAILS
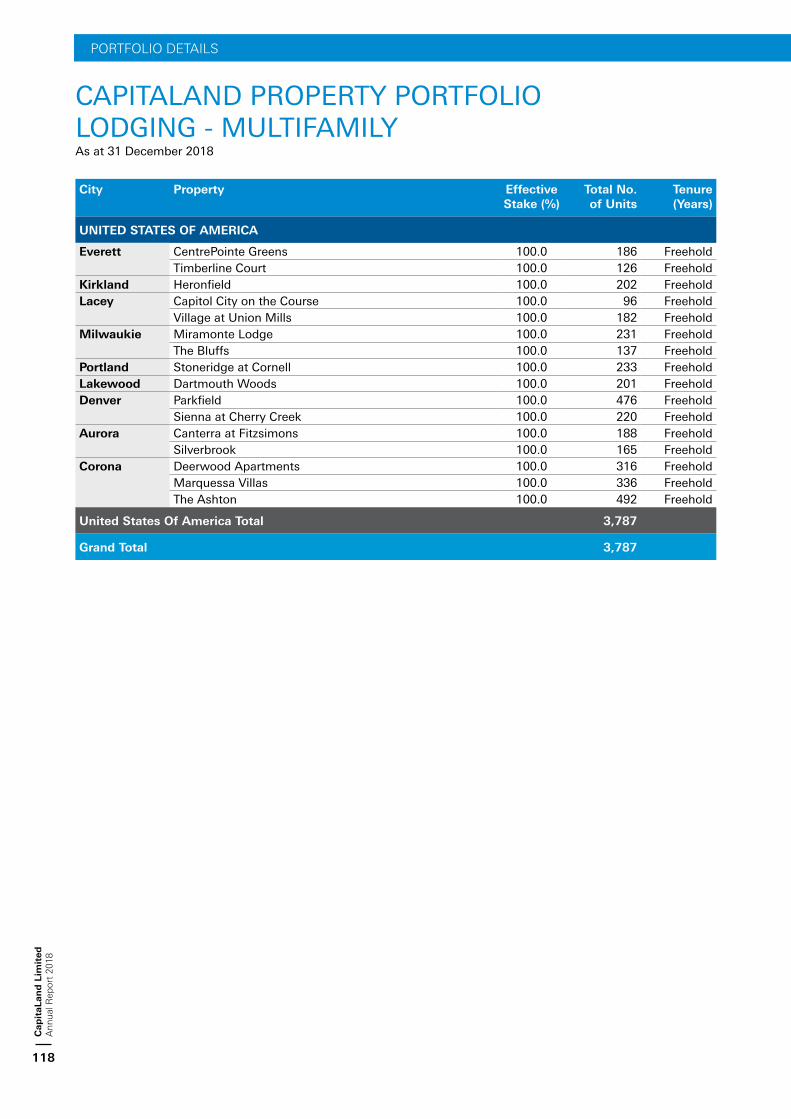
City Property Effective Stake (%)
Total No.of Units
Tenure (Years)
UNITED STATES OF AMERICA
Everett CentrePointe Greens 100.0 186 FreeholdTimberline Court 100.0 126 Freehold
Kirkland Heronfield 100.0 202 FreeholdLacey Capitol City on the Course 100.0 96 Freehold
Village at Union Mills 100.0 182 FreeholdMilwaukie Miramonte Lodge 100.0 231 Freehold
The Bluffs 100.0 137 FreeholdPortland Stoneridge at Cornell 100.0 233 FreeholdLakewood Dartmouth Woods 100.0 201 FreeholdDenver Parkfield 100.0 476 Freehold
Sienna at Cherry Creek 100.0 220 FreeholdAurora Canterra at Fitzsimons 100.0 188 Freehold
Silverbrook 100.0 165 FreeholdCorona Deerwood Apartments 100.0 316 Freehold
Marquessa Villas 100.0 336 FreeholdThe Ashton 100.0 492 Freehold
United States Of America Total 3,787
Grand Total 3,787
CAPITALAND PROPERTY PORTFOLIOLODGING - MULTIFAMILYAs at 31 December 2018
Cap
itaL
and
Lim
ited
Ann
ual R
epor
t 20
18
118
PORTFOLIO DETAILS

CAPITALAND PROPERTY PORTFOLIOCOMMERCIALAs at 31 December 2018
City Property Effective Stake (%)
NLA (sqm)
Tenure (Years)
Tenure Expiry
CHINA
Shanghai Innov Center 100.010 80,328 Leasehold 2059Innov Center Phase II 100.0B,10 37,765 Leasehold 2058
China Total 118,093
GERMANY
Frankfurt Gallileo 33.63,4 40,522 Freehold -Main Airport Center 94.9 60,231 Freehold -
Germany Total 100,753
JAPAN
Tokyo Kokugikan Front 100.0 6,059 Freehold -Shinjuku Front Tower 20.0 57,916 Freehold -
Yokohama Sun Hamada 100.0 8,374 Freehold -Yokohama Blue Avenue 100.0 34,677 Freehold -
Japan Total 107,026
SINGAPORE
Singapore 21 Collyer Quay ( HSBC Building ) 30.13 18,624 999 2849Asia Square Tower 2 30.13 72,334 99 2107Bugis Village 30.13,11 11,254 99 2088CapitaGreen 30.13 65,129 99 2073Capital Tower 30.13 68,362 99 2094One George Street 15.03 41,401 99 2102Six Battery Road 30.13 46,004 999 2825
Singapore Total 323,108
Grand Total 648,980C
apit
aLan
d L
imit
edA
nnua
l Rep
ort
2018
119
PORTFOLIO DETAILS

CAPITALAND PROPERTY PORTFOLIOSELF STORAGEAs at 31 December 2018
City Property Effective Stake (%)
GFA (sqm)
Tenure (Years)
Tenure Expiry
CHINA
Shanghai 1, Huang Xing Road 100.0 7,353 50 2043
China Total 7,353
SINGAPORE
Singapore 111 Defu Lane 10 100.0 7,388 30+30 205014 Woodlands Loop 100.0 13,037 30+30 205515 Changi South Street 1 100.0 6,250 30 202925A Changi South Street 1 100.0 5,267 30 203231 Admiralty Road 100.0 12,746 60 203737 Tampines Street 92 100.0 11,300 30+30 20545 Bukit Batok Street 22 100.0 7,088 30+30 2051615 Lorong 4 Toa Payoh 100.0 13,497 60 2029743 Lorong 5 Toa Payoh 100.0 10,269 60 2033
Singapore Total 86,842
Grand Total 94,195
Cap
itaL
and
Lim
ited
Ann
ual R
epor
t 20
18
120
PORTFOLIO DETAILS

CAPITALAND PROPERTY PORTFOLIORESIDENTIALAs at 31 December 2018
District Property Effective Stake (%)
GFA (sqm)
No. ofUnits
Tenure (Years)
Tenure Expiry
% of Completion
Expected Date of
Completion
CHINA
Beijing
Chaoyang BeaufortPhase 4
100.0 1,090 - 40 2044Commercial
Changping Vermont HillsPhase 1
100.0 2,396 - 40 2044Commercial
51,229 88 70 2074Residential
Phase 2 48,986 88 70 2074Residential
Phase 3 A 48,581 87 70 2074Residential
90% 2019
Phase 7 A 1,931 - 40 2044Commercial
97% 2019
Phase 4 to 7 B 287,738 659 70 2074Residential
2022
Chengdu
Hi-Tech Century Park - East Site
60.0A 13,039 - 40 2050Commercial
23% 2021
221,473 1,881 70 2080Residential
Century Park - West SitePhase 1 & 2
60.0 11,326 - 40 2050Commercial
Phase 2 56,436 588 70 2080Residential
Phase 3 3,327 - 40 2050Commercial
103,556 828 70 2080Residential
Longquanyi Parc BotanicaPhase 1
56.0 10,127 - 40 2052Commercial
Phase 2 A 10,732 - 40 2052Commercial
47% 2019
178,050 1,752 70 2082Residential
Qingyang The Loft 100.0 1,206 - 40 2047Commercial
Chongqing
Liangjiang SpringPhase 1
100.0 95,357 - 40 2051Commercial
Phase 2 29,319 203 50 2061Residential
Phase 3 B 265,719 1,954 50 2061Residential
Cap
itaL
and
Lim
ited
Ann
ual R
epor
t 20
18
121
PORTFOLIO DETAILS

District Property Effective Stake (%)
GFA (sqm)
No. ofUnits
Tenure (Years)
Tenure Expiry
% of Completion
Expected Date of
Completion
CHINA
Guangzhou
Panyu Città di MarePhase 1
45.0A 5,718 - 40 2035Commercial
99% 2019
151,336 1,067 70 2065Residential
LFIE (PYD) 45.0B 486,794 4,386 70 2065Residential
2025
Baiyun Dolce Vita 47.5 5,366 - 40 2048Commercial
Liwan La RivaPhase 1A
80.0A 95,532 922 70 2085Residential
52% 2020
Zengcheng Residential site at Zengcheng
100.0B,1 141,248 1,312 70 2088Residential
2022
Nansha Vista Garden 100.0 22,102 - 40 2052Commercial
Kunshan
Huaqiao The MetropolisPhase 1
100.0 166,232 1,542 70 2074Residential
Phase 2A 72,431 709 70 2074Residential
Phase 3 A 2,240 - 40 2044Commercial
52% 2019
120,531 1,111 70 2074Residential
Phase 4 A 51,041 460 70 2074Residential
17% 2020
Phase 6B B 69,050 - 40 2044Commercial
2020
Ningbo
Jiangbei Summit Era 100.0 2,647 - 40 2054Commercial
Shanghai
Jingan JinganOne (F.k.a. Hanzhonglu Residential (Plot 92))
70.0A 3,023 - 40 2044Commercial
55% 2020
27,072 138 70 2074Residential
Pudong New HorizonPhase 2
95.0 14,700 - 40 2053Commercial
Huangpu The Paragon 99.0 3,270 - 70 2072Commercial
CAPITALAND PROPERTY PORTFOLIORESIDENTIALAs at 31 December 2018
Cap
itaL
and
Lim
ited
Ann
ual R
epor
t 20
18
122
PORTFOLIO DETAILS

District Property Effective Stake (%)
GFA (sqm)
No. ofUnits
Tenure (Years)
Tenure Expiry
% of Completion
Expected Date of
Completion
CHINA
Shenyang
Yuhong Lake BotanicaPhase 4
60.0 137,842 1,472 50 2057Residential
Phase 2 to 4 7,924 - 40 2047Commercial
Phase 5 to 8 B 47,110 - 40 2047Commercial
2022
258,946 3,045 50 2057Residential
Wuhan
Caidian The LakesidePhase 1
100.0 3,680 - 40 2050Commercial
Phase 2 A 126,322 1,206 70 2080Residential
71% 2020
Xi’an
Baqiao La BotanicaPhase 8 - 3R2
38.0A 9,892 - 70 2077Commercial
65% 2019
185,371 1,703 70 2077Residential
Phase 9 - 2R5 A 13,410 - 70 2076Commercial
40% 2020
302,875 3,010 70 2076Residential
Phase 10 - 4M1 - 1 41,592 - 70 2077Commercial
Phase 10 - 4M1 - 2, 11 - 3R4, 15 - 4R2
B 122,196 - 70 2077Commercial
2025
Phase 1A - 2R1, 6 - 2R2, 7 - 2R4, 9-2R5C & 3A-3AC
21,026 - 70 2076Commercial
Phase 3A - 3R3, 4 - 4R1 9,382 - 70 2077Commercial
Phase 12 - 1R1, 16 - 2R3 B 10,996
- 70 2076Commercial
2022
415,588 4,341 70 2076Residential
Phase 11 - 3R4, 13 - 3R5, 14 - 3R1, 15 - 4R2
B 535,619 4,653 70 2077Residential
2024
China Total 39,205
MALAYSIA
Kuala Lumpur
Kuchai Lama
GenKL 50.0A 63,119 332 Freehold 85% 2019
Kuala Lumpur
Site at Kuala Lumpur 50.0B 134,709 505 Freehold 2022
Malaysia Total 837
Cap
itaL
and
Lim
ited
Ann
ual R
epor
t 20
18
123
PORTFOLIO DETAILS

District Property Effective Stake (%)
GFA (sqm)
No. ofUnits
Tenure (Years)
Tenure Expiry
% of Completion
Expected Date of
Completion
SINGAPORE
Singapore
Bishan Street 15
Sky Habitat 65.0 58,786 509 99 2110
Depot Road
The Interlace 60.0 169,600 1,040 99 2108
Marine Blue Road
Marine Blue 100.0 9,986 124 Freehold -
Orchard Road
The Orchard Residences
50.0 39,611 175 99 2105
Pearl Bank Site at Pearl Bank 100.0B 56,999 776 99 2118 2023Yio Chu Kang
Site at Yio Chu Kang Road
100.0B,14 19,330 80 Freehold -
Singapore Total 2,704
VIETNAM
Hanoi
Ha Dong Mulberry Lane 70.0 235,853 1,478 Freehold* 2014
Seasons Avenue 35.0 196,787 1,300 Freehold* 2018
Ho Chi Minh City
District 2 d'EdgePhase 2
90.0A 51,045 273 Freehold* 22% 2020
Feliz en Vista 80.0A 205,276 1,127 Freehold* 51% 2020
Residential Site in District 2
100.0B 70,990 169 Freehold* 2021
Vista VerdePhase A
50.0 196,916 1,152 Freehold*
Phase S and L 50.0A 49,339 116 Freehold* 2021
District 4 De La Sol (p.k.a Summer II)Phase 4
100.0A 97,553 870 Freehold* 12% 2020
Vietnam Total 6,485
Grand Total 49,231
StatusA Under DevelopmentB Future Development
NotesGeneral: For China integrated developments and malls, GFA excludes carpark area.
1 As at 31 December 2018, CapitaLand is in the process of obtaining the land titles.2 Held through CMMT.3 Held through CCT.4 Includes other stake not held through the REIT.5 Held through CMT.6 Funan’s GFA includes all components, including lyf Funan Singapore, whose details are shown under Serviced Residences. 7 GFA of Sengkang Central site excludes Community Club, Hawker Centre and Bus Interchange.8 Held through CRCT.9 Held through Ascott Reit.10 The floor area of Innov Center and Innov Center Phase II are stated using GFA.11 The State has exercised the right to terminate the State Lease on 1 April 2019. 12 CapitaLand Group has announced the divestment of the asset. The transaction is expected to be completed in 2019.13 Ascott Reit has taken possession of the land in January 2019.14 Area indicated for site at Yio Chu Kang Road refers to land area.* For Vietnam residential properties, a 50-year leasehold period is applicable to foreigners.
CAPITALAND PROPERTY PORTFOLIORESIDENTIALAs at 31 December 2018
Cap
itaL
and
Lim
ited
Ann
ual R
epor
t 20
18
124
PORTFOLIO DETAILS
FINANCIALSTATEMENTS126 Directors’ Statement134 Independent Auditors’ Report138 Balance Sheets139 Income Statements140 Statements of Comprehensive Income141 Statements of Changes in Equity144 Consolidated Statement of Cash Flows146 Notes to The Financial Statements

DIRECTORS’ STATEMENT
We are pleased to submit this annual report to the members of the Company, together with the audited financial statements for the financial year ended 31 December 2018.
In our opinion:
(a) the financial statements set out on pages 138 to 288 are drawn up so as to give a true and fair view of the financial position of the Group and of the Company as at 31 December 2018 and the financial performance, changes in equity of the Group and of the Company, and the cash flows of the Group for the year ended on that date in accordance with the provisions of the Singapore Companies Act, Chapter 50 and Singapore Financial Reporting Standards (International); and
(b) at the date of this statement, there are reasonable grounds to believe that the Company will be able to pay its debts as and when they fall due.
The Board of Directors has, on the date of this statement, authorised these financial statements for issue.
DIRECTORS
The directors in office at the date of this statement are as follows:
Ng Kee ChoeLee Chee Koon (Appointed on 1 January 2019)Euleen Goh Yiu KiangTan Sri Amirsham Bin A Aziz Stephen Lee Ching YenDr Philip Nalliah PillaiKee Teck KoonChaly Mah Chee Kheong Anthony Lim Weng Kin Gabriel Lim Meng Liang Goh Swee Chen
FINANCIALS & ADDITIONAL INFORMATIONC
apit
aLan
d L
imit
edA
nnua
l Rep
ort
2018
126

DIRECTORS’STATEMENTS
DIRECTORS’ INSTERESTS IN SHARES OR DEBENTURES
According to the register kept by the Company for the purposes of Section 164 of the Companies Act, Chapter 50 (the Act), particulars of interests of directors who held office at the end of the financial year (including those held by spouses and infant children) in shares, debentures, options and awards in the Company and its related corporations are as follows:
Holdings in the name of the director, spouse and/or
infant childrenAt beginning
of the yearAt end
of the year
The Company
Ordinary shares
Ng Kee Choe 283,958 346,578Lim Ming Yan 2,156,857 2,485,371Euleen Goh Yiu Kiang 97,518 113,185Tan Sri Amirsham Bin A Aziz 89,227 108,764Stephen Lee Ching Yen 59,046 72,587Dr Philip Nalliah Pillai 38,987 53,130Kee Teck Koon 33,115 47,659Chaly Mah Chee Kheong 50,000 63,387Anthony Lim Weng Kin 1,000 6,630Goh Swee Chen 5,000 8,388
Contingent award of Performance shares1 to be delivered after 2017Lim Ming Yan (323,873 shares) 0 to 647,7463 –
¶ During the year, 63,155 shares were released.
Contingent award of Performance shares1 to be delivered after 2018Lim Ming Yan (420,507 shares) 0 to 841,0143 0 to 841,0143
Contingent award of Performance shares1 to be delivered after 2019Lim Ming Yan (402,578 shares) 0 to 805,1563 0 to 805,1563
Contingent award of Performance shares1 to be delivered after 2020Lim Ming Yan (256,388 shares) – 0 to 512,7763
Unvested Restricted shares2 to be delivered after 2015Lim Ming Yan 61,5195,6 –^
^ During the year, 70,772 shares were released.
FINANCIALS & ADDITIONAL INFORMATION
Cap
itaL
and
Lim
ited
Ann
ual R
epor
t 20
18
127

DIRECTORS’ INSTERESTS IN SHARES OR DEBENTURES (continued)
Holdings in the name of the director, spouse and/or infant
childrenAt beginning
of the year At end
of the year
The Company (continued)
Unvested Restricted shares2 to be delivered after 2016Lim Ming Yan 188,2185,7 94,1105,6
Unvested Restricted shares2 to be delivered after 2017Lim Ming Yan 0 to 301,4374,5 200,9585,7
Contingent award of Restricted shares2 to be delivered after 2018Lim Ming Yan (256,388 shares) – 0 to 384,5824,5
Related Corporations
CapitaLand Treasury Limited
$350 million 4.30% Fixed Rate Notes due 2020Euleen Goh Yiu Kiang $250,000 $250,000
The Ascott Capital Pte Ltd
$300 million 3.78% Fixed Rate Notes due 2019Kee Teck Koon $250,000 $250,000
Footnotes:
1 Performance shares are shares under awards pursuant to the CapitaLand Performance Share Plan 2010.2 Restricted shares are shares under awards pursuant to the CapitaLand Restricted Share Plan 2010.3 The final number of shares to be released will depend on the achievement of pre-determined targets over a three-year performance period.
No share will be released if the threshold targets are not met at the end of the performance period. On the other hand, if superior targets are met, more shares than the baseline award could be delivered up to a maximum of 200% of the baseline award.
4 The final number of shares to be released will depend on the achievement of pre-determined targets at the end of a one-year performance period and the release will be over a vesting period of three years. No share will be released if the threshold targets are not met at the end of the performance period. On the other hand, if superior targets are met, more shares than the baseline award could be delivered up to a maximum of 150% of the baseline award.
5 An additional number of shares of a total value equal to the value of the accumulated dividends which are declared during each of the vesting periods and deemed forgone due to the vesting mechanism of the CapitaLand Restricted Share Plan 2010, will also be released on the final vesting.
6 Being the unvested one-third of the award.7 Being the unvested two-thirds of the award.
Mr Lim Ming Yan ceased to be a director of the Company with effect from 1 January 2019.
Except as disclosed in this statement, no director who held office at the end of the financial year had interests in shares, debentures or options of the Company or of related corporations either at the beginning of the financial year (or date of appointment, if later) or at the end of the financial year.
There was no change in any of the above-mentioned directors’ interests in the Company between the end of the financial year and 21 January 2019.
DIRECTORS’STATEMENTS
FINANCIALS & ADDITIONAL INFORMATIONC
apit
aLan
d L
imit
edA
nnua
l Rep
ort
2018
128

ARRANGEMENTS TO ENABLE DIRECTORS TO ACQUIRE SHARES AND DEBENTURES
Except as disclosed under the Directors’ Interests in Shares or Debentures and Share Plans sections of this statement, neither at the end of nor at any time during the financial year was the Company a party to any arrangement whose objects are, or one of whose objects is, to enable the directors of the Company to acquire benefits by means of the acquisition of shares in or debentures of the Company or any other body corporate.
SHARE PLANS - PERFORMANCE SHARE PLAN 2010 AND RESTRICTED SHARE PLAN 2010
The Executive Resource and Compensation Committee (ERCC) of the Company has been designated as the Committee responsible for the administration of the Share Plans. The ERCC members at the date of this statement are Mr Ng Kee Choe (Chairman), Mr Stephen Lee Ching Yen, Mr Kee Teck Koon and Ms Goh Swee Chen.
The CapitaLand Performance Share Plan 2010 (PSP 2010) and CapitaLand Restricted Share Plan 2010 (RSP 2010) were approved by the members of the Company at the Extraordinary General Meeting held on 16 April 2010. The duration of each share plan is 10 years commencing on 16 April 2010.
The ERCC has instituted a set of share ownership guidelines for members of senior management who receive shares under the PSP 2010 and the RSP 2010. Under these guidelines, members of senior management are required to retain a portion of the total number of CapitaLand shares received under the PSP 2010 and the RSP 2010, which varies according to their respective job grades and base salaries.
The total number of new shares which may be allotted, issued and/or delivered pursuant to awards granted under the PSP 2010 and the RSP 2010 on any date, when aggregated with existing shares (including treasury shares and cash equivalents) delivered and/or to be delivered, pursuant to the PSP 2010, the RSP 2010 and all shares, options or awards granted under any other share schemes of the Company then in force, shall not exceed 8% of the total number of issued shares (excluding treasury shares) from time to time.
Details of awards granted under each Share Plan are provided in the following sections.
(a) Awards under the CapitaLand Performance Share Plan 2010
Under the PSP 2010, the awards granted are conditional on performance targets set based on medium-term corporate objectives. Awards represent the right of a participant to receive fully paid shares, their equivalent cash value or combinations thereof, free of charge, upon the Company achieving prescribed performance target(s).
The ERCC grants an initial number of shares (baseline award) which are conditional on targets set for a performance period, currently prescribed to be a three-year performance period. A specified number of shares will only be released by the ERCC to the recipients at the end of the qualifying performance period, provided the threshold targets are achieved. The final number of shares to be released will depend on the achievement of pre-determined targets over a three-year performance period. No share will be released if the threshold targets are not met at the end of the performance period. Conversely, if superior targets are met, more shares than the baseline award could be released.
DIRECTORS’STATEMENT
FINANCIALS & ADDITIONAL INFORMATION
Cap
itaL
and
Lim
ited
Ann
ual R
epor
t 20
18
129

SHARE PLANS - PERFORMANCE SHARE PLAN 2010 AND RESTRICTED SHARE PLAN 2010 (continued)
(a) Awards under the CapitaLand Performance Share Plan 2010 (continued)
For grants made in 2015 to 2018, the performance conditions and number of shares to be released subject to the achievement of performance targets are as follows:
Performance conditions Final number of shares to be released
1. Group’s absolute total shareholder return measured as a multiple of cost of equity
2. Group’s relative total shareholder return ranking against a peer group of selected companies
3. Group’s return on equity to be achieved in 2017 and 2018 for grants made in 2015 and 2016 respectively; average of Group’s return on equity to be achieved in 2018 and 2019 for grant made in 2017; average of Group’s return on equity to be achieved in 2018 to 2020 for grant made in 2018
0% to 200% of baseline award
Details of the movement in the awards of the Company during the year were as follows:
<---- Movements during the year --->Balance as at
1 January 2018 Granted ReleasedLapsed/
CancelledBalance as at
31 December 2018Year ofaward
No. of holders
No. of shares
No. of shares
No. of shares
No. of shares
No. of holders
No. of shares
2015 67 2,881,549 – (559,291) (2,322,258) – –2016 69 3,790,948 – – (517,168) 57 3,273,7802017 69 3,920,944 – – (457,110) 58 3,463,8342018 – – 2,970,215 – (204,822) 63 2,765,393
10,593,441 2,970,215 (559,291) (3,501,358) 9,503,007
(b) Awards under the CapitaLand Restricted Share Plan 2010
Under the RSP 2010, awards granted to eligible participants vest only after the satisfactory completion of time-based service conditions or where the award is performance-related, after a further period of service beyond the performance target completion date (performance-based restricted awards). In addition, the RSP 2010 also enables grants of fully paid shares to be made to non-executive directors as part of their remuneration in respect of their office as such in lieu of cash.
The ERCC grants an initial number of shares (baseline award) which are conditional on targets set for a performance period, currently prescribed to be a one-year performance period. A specified number of shares will only be released by the ERCC to the recipients at the end of the qualifying performance period, provided the threshold targets are achieved. The final number of shares to be released will depend on the achievement of pre-determined targets at the end of a one-year performance period. No share will be released if the threshold targets are not met at the end of the performance period. On the other hand, if superior targets are met, more shares than the baseline award could be released. Once the final number of shares has been determined, it will be released over a vesting period of three years. Recipients can receive fully paid shares, their equivalent cash value or combinations thereof, at no cost.
DIRECTORS’STATEMENT
FINANCIALS & ADDITIONAL INFORMATIONC
apit
aLan
d L
imit
edA
nnua
l Rep
ort
2018
130

SHARE PLANS - PERFORMANCE SHARE PLAN 2010 AND RESTRICTED SHARE PLAN 2010 (continued)
(b) Awards under the CapitaLand Restricted Share Plan 2010 (continued)
For grants made in 2015 to 2018, the performance conditions and number of shares to be released subject to the achievement of performance targets are as follows:
Performance conditions Final number of shares to be released
1. Group’s operating earnings before interest and tax
2. Group’s operating return on equity
0% to 150% of baseline award
An additional number of shares of a total value equal to the value of the accumulated dividends declared during each of the vesting periods and deemed forgone due to the vesting mechanism, will also be released upon the final vesting
Details of the movement in the awards of the Company during the year were as follows:
<----- Movements during the year ----->Balance as at
1 January 2018 Granted Released+
Lapsed/ Cancelled
Balance as at31 December 2018
Year ofaward
No. of holders
No. of shares
No. of shares
No. of shares
No. of shares
No. of holders
No. of shares
2015 1,226 2,743,407 406,596 (3,114,177) (35,826) – –2016 1,391 8,969,917 – (4,399,298) (689,462) 1,203 3,881,1572017 1,592 10,718,463 5,233,022 (5,233,022) (1,444,966) 1,371 9,273,4972018 – – 11,037,284# (162,457) (1,058,331) 1,510 9,816,496
22,431,787 16,676,902 (12,908,954) (3,228,585) 22,971,150
+ The number of shares released during the year was 12,908,954, of which 2,269,948 were cash-settled.# Comprised RSP to employees 10,874,827 and to non-executive directors 162,457.
As at 31 December 2018, the number of shares in awards granted under the RSP 2010 was as follows:
Equity-settled Cash-settled Total
Final number of shares has not been determined (baseline award)# 7,839,472 1,977,024 9,816,496
Final number of shares determined but not released 10,385,324 2,769,330 13,154,654
18,224,796 4,746,354 22,971,150
# The final number of shares released could range from 0% to 150% of the baseline award.
DIRECTORS’STATEMENT
FINANCIALS & ADDITIONAL INFORMATION
Cap
itaL
and
Lim
ited
Ann
ual R
epor
t 20
18
131

AUDIT COMMITTEE
The Audit Committee members at the date of this statement are Mr Chaly Mah Chee Kheong (Chairman), Tan Sri Amirsham Bin A Aziz, Dr Philip Nalliah Pillai and Mr Gabriel Lim Meng Liang.
The Audit Committee shall discharge its duties in accordance with the Companies Act (Chapter 50) and the Listing Manual of the SGX-ST. The Audit Committee shall also be guided by the Code of Corporate Governance (2 May 2012) and the Guidebook for Audit Committee in Singapore (Second Edition), and any such codes or regulations as may be applicable from time to time.
The principal responsibility of the Audit Committee is to assist the Board of Directors in fulfilling its oversight responsibilities. Areas of review by the Audit Committee include:
• the reliability and integrity of the financial statements;• the impact of new, revised or proposed changes in accounting standards and policies or regulatory requirements
on the financial statements;• the compliance with laws and regulations, particularly those of the Act and the Listing Manual of the SGX-ST;• the appropriateness of quarterly and full year announcements and reports;• in conjunction with the assessment by the Risk Committee, assesses the adequacy and effectiveness of the
internal control (including financial, operational, compliance and information technology controls) and risk management systems established by management to manage risks;
• the adequacy and effectiveness of internal and external audits;• the appointment and re-appointment of external auditors and the level of auditors’ remuneration;• the nature and extent of non-audit services and their impact on independence and objectivity of the external
auditors;• interested person transactions;• the findings of internal investigation, if any;• the processes put in place to manage any material conflicts of interest within the Group; and • all conflicts of interest matters referred to it.
The Audit Committee also reviews the policy and arrangements by which employees of the Company and any other persons may, in confidence, report suspected fraud or irregularity or suspected infringement of any laws or regulations or rules or, raise concerns about possible improprieties in matters of financial reporting or other matters, with a view to ensuring that arrangements are in place for such concerns to be raised and independently investigated and for appropriate follow-up action to be taken. Where the Audit Committee becomes aware of any improprieties, the Audit Committee shall discuss such matter with the external auditors and, at an appropriate time, report the matter to the Board. Where appropriate, the Audit Committee shall also commission internal investigations into such matters. Pursuant to this, the Audit Committee has introduced a whistle blowing policy where employees or any person may raise improprieties to the Audit Committee Chairman in good faith, with the confidence that employees or any person making such reports will be treated fairly and be protected from reprisal.
The Audit Committee met 4 times in 2018. Specific functions performed during the year included reviewing the scope of work and strategies of both the internal and external auditors, and the results arising therefrom, including their evaluation of the system of internal controls. The Audit Committee also reviewed the assistance given by the Company’s officers to the auditors. The financial statements of the Group and the Company were reviewed by the Audit Committee prior to the submission to the Board of Directors of the Company for adoption. The Audit Committee also met with the internal and external auditors, without the presence of management, to discuss any issues of concern with them.
The Audit Committee has, in accordance with Chapter 9 of the Listing Manual of the SGX-ST, reviewed the requirements for approval and disclosure of interested person transactions, reviewed the procedures set by the Group and the Company to identify and report and where necessary, seek approval for interested person transactions and, with the assistance of the internal auditors, reviewed interested person transactions.
DIRECTORS’STATEMENT
FINANCIALS & ADDITIONAL INFORMATIONC
apit
aLan
d L
imit
edA
nnua
l Rep
ort
2018
132

AUDIT COMMITTEE (CONTINUED)
The Audit Committee also undertook half yearly reviews of all non-audit services provided by KPMG LLP and its member firms and was satisfied that they did not affect their independence as external auditors of the Company.
The Audit Committee has recommended to the Board of Directors that the auditors, KPMG LLP, be nominated for re-appointment as auditors at the forthcoming Annual General Meeting of the Company.
Auditors
The auditors, KPMG LLP, have indicated their willingness to accept re-appointment.
On behalf of the Board of Directors
___________________________Ng Kee ChoeDirector
___________________________Lee Chee Koon Director
Singapore28 February 2019
DIRECTORS’STATEMENT
FINANCIALS & ADDITIONAL INFORMATION
Cap
itaL
and
Lim
ited
Ann
ual R
epor
t 20
18
133
REPORT ON THE AUDIT OF THE FINANCIAL STATEMENTS
Opinion
We have audited the financial statements of CapitaLand Limited (the Company) and its subsidiaries (the Group), which comprise the balance sheets of the Group and the Company as at 31 December 2018, the income statements, statements of comprehensive income and statements of changes in equity of the Group and the Company and the statement of cash flows of the Group for the year then ended, and notes to the financial statements, including a summary of significant accounting policies and other explanatory information, as set out on pages 138 to 288.
In our opinion, the accompanying consolidated financial statements of the Group and the balance sheet, income statement, statement of comprehensive income and statement of changes in equity of the Company are properly drawn up in accordance with the provisions of the Companies Act, Chapter 50 (the Act), Singapore Financial Reporting Standards (International) (SFRS(I)) and International Financial Reporting Standards (IFRS) so as to give a true and fair view of the financial position of the Group and the Company as at 31 December 2018 and the financial performance and changes in equity of the Group and the Company, and the cash flows of the Group for the year ended on that date.
Basis for opinion
We conducted our audit in accordance with Singapore Standards on Auditing (SSAs). Our responsibilities under those standards are further described in the Auditors’ responsibilities for the audit of the financial statements section of our report. We are independent of the Group in accordance with the Accounting and Corporate Regulatory Authority Code of Professional Conduct and Ethics for Public Accountants and Accounting Entities (ACRA Code), together with the ethical requirements that are relevant to our audit of the financial statements in Singapore, and we have fulfilled our other ethical responsibilities in accordance with the ACRA Code. We believe that the audit evidence we have obtained is sufficient and appropriate to provide a basis for our opinion.
Key audit matters
Key audit matters are those matters that, in our professional judgement, were of most significance in our audit of the financial statements of the current period. These matters were addressed in the context of our audit of the financial statements as a whole, and in forming our opinion thereon, and we do not provide a separate opinion on these matters.
Valuation of investment properties (Refer to Note 5 and 34 to the financial statements)
Risk:
The Group owns a portfolio of investment properties comprising commercial properties, shopping malls, serviced residences and integrated development projects, located primarily in Singapore, China and Europe. Investment properties represent the single largest category of assets on the balance sheet, at $39 billion as at 31 December 2018.
These investment properties are stated at their fair values based on independent external valuations.
The valuation process involves significant judgement in determining the appropriate valuation methodology to be used, and in estimating the underlying assumptions to be applied. The valuations are highly sensitive to key assumptions applied and a small change in the assumptions can have a significant impact to the valuation.
INDEPENDENTAUDITORS’ REPORTTo the Members of CapitaLand Limited
FINANCIALS & ADDITIONAL INFORMATIONC
apit
aLan
d L
imit
edA
nnua
l Rep
ort
2018
134

Our response:
We assessed the Group’s processes for the selection of the external valuers, the determination of the scope of work of the valuers, and the review and acceptance of the valuations reported by the external valuers.
We evaluated the qualifications and competence of the external valuers. We also read the terms of engagement of the valuers with the Group to determine whether there were any matters that might have affected their objectivity or limited the scope of their work.
We considered the valuation methodologies used against those applied by other valuers for similar property types. We also considered other alternative valuation methods. We tested the integrity of inputs of the projected cash flows used in the valuations to supporting leases and other documents. We challenged the key assumptions used in the valuations, which included capitalisation, discount and terminal yield rates by comparing them against historical rates and available industry data, taking into consideration comparability and market factors. Where the rates were outside the expected range, we undertook further procedures to understand the effect of additional factors and, when necessary, held further discussions with the valuers.
We also considered the adequacy of the disclosures in the financial statements, in describing the inherent degree of subjectivity and key assumptions in the estimates. This includes the relationships between the key unobservable inputs and fair values, in conveying the uncertainties.
Our findings:
The Group has a structured process in appointing and instructing valuers, and in reviewing, challenging and accepting their valuations. The valuers are members of recognised professional bodies for valuers and have considered their own independence in carrying out their work. The valuation methodologies used are in line with generally accepted market practices and the key assumptions used are within the range of market data. The disclosures in the financial statements are appropriate.
Implementation of new information technology (“IT”) system in China
Risk:
During the year, the Group implemented a new IT system (SAP) in China where the Group has significant business operations. This follows the Group’s implementation of SAP across a number of countries, including Singapore, in the prior year.
The change of IT system entails new processes, controls and delegation of authority being set up as well as the migration of operational and financial data from the legacy systems to the new system. As such, the change presents inherent risks of breakdown of IT dependent controls and loss of integrity of financial data being migrated, which could lead to errors in financial reporting.
Our response:
We considered the Group’s processes and project governance over the new system implementation in China.
We involved IT specialists to test the controls over change management and the migration of key financial data from the legacy system to SAP. We also tested the general IT control environment in SAP, including access controls and segregation of duties as well as those automated controls and mitigating controls critical to financial accounting and reporting process.
In addition, we performed independent validation of the account balances being migrated and tested the reconciliation control in place.
INDEPENDENTAUDITORS’ REPORTTo the Members of CapitaLand Limited
FINANCIALS & ADDITIONAL INFORMATION
Cap
itaL
and
Lim
ited
Ann
ual R
epor
t 20
18
135

Our findings:
There are processes and controls in place to plan for and implement the change of IT system in China, with oversight by senior management and those charged with governance.
Other information
Management is responsible for the other information contained in the annual report. Other information is defined as all information in the annual report other than the financial statements and our auditors’ report thereon.
We have obtained all other information prior to the date of this auditors’ report.
Our opinion on the financial statements does not cover the other information and we do not and will not express any form of assurance conclusion thereon.
In connection with our audit of the financial statements, our responsibility is to read the other information and, in doing so, consider whether the other information is materially inconsistent with the financial statements or our knowledge obtained in the audit, or otherwise appears to be materially misstated. If, based on the work we have performed, we conclude that there is a material misstatement of this other information, we are required to report that fact. We have nothing to report in this regard.
Responsibilities of management and directors for the financial statements
Management is responsible for the preparation of financial statements that give a true and fair view in accordance with the provisions of the Act and SFRS(I) and IFRS, and for devising and maintaining a system of internal accounting controls sufficient to provide a reasonable assurance that assets are safeguarded against loss from unauthorised use or disposition; and transactions are properly authorised and that they are recorded as necessary to permit the preparation of true and fair financial statements and to maintain accountability of assets.
In preparing the financial statements, management is responsible for assessing the Group’s ability to continue as a going concern, disclosing, as applicable, matters related to going concern and using the going concern basis of accounting unless management either intends to liquidate the Group or to cease operations, or has no realistic alternative but to do so.
The directors’ responsibilities include overseeing the Group’s financial reporting process.
Auditors’ responsibilities for the audit of the financial statements
Our objectives are to obtain reasonable assurance about whether the financial statements as a whole are free from material misstatement, whether due to fraud or error, and to issue an auditors’ report that includes our opinion. Reasonable assurance is a high level of assurance, but is not a guarantee that an audit conducted in accordance with SSAs will always detect a material misstatement when it exists. Misstatements can arise from fraud or error and are considered material if, individually or in the aggregate, they could reasonably be expected to influence the economic decisions of users taken on the basis of these financial statements.
As part of an audit in accordance with SSAs, we exercise professional judgement and maintain professional scepticism throughout the audit. We also:
• Identify and assess the risks of material misstatement of the financial statements, whether due to fraud or error, design and perform audit procedures responsive to those risks, and obtain audit evidence that is sufficient and appropriate to provide a basis for our opinion. The risk of not detecting a material misstatement resulting from fraud is higher than for one resulting from error, as fraud may involve collusion, forgery, intentional omissions, misrepresentations, or the override of internal controls.
• Obtain an understanding of internal controls relevant to the audit in order to design audit procedures that are appropriate in the circumstances, but not for the purpose of expressing an opinion on the effectiveness of the Group’s internal controls.
INDEPENDENTAUDITORS’ REPORTTo the Members of CapitaLand Limited
FINANCIALS & ADDITIONAL INFORMATIONC
apit
aLan
d L
imit
edA
nnua
l Rep
ort
2018
136

• Evaluate the appropriateness of accounting policies used and the reasonableness of accounting estimates and related disclosures made by management.
• Conclude on the appropriateness of management’s use of the going concern basis of accounting and, based on the audit evidence obtained, whether a material uncertainty exists related to events or conditions that may cast significant doubt on the Group’s ability to continue as a going concern. If we conclude that a material uncertainty exists, we are required to draw attention in our auditors’ report to the related disclosures in the financial statements or, if such disclosures are inadequate, to modify our opinion. Our conclusions are based on the audit evidence obtained up to the date of our auditors’ report. However, future events or conditions may cause the Group to cease to continue as a going concern.
• Evaluate the overall presentation, structure and content of the financial statements, including the disclosures, and whether the financial statements represent the underlying transactions and events in a manner that achieves fair presentation.
• Obtain sufficient appropriate audit evidence regarding the financial information of the entities or business activities within the Group to express an opinion on the consolidated financial statements. We are responsible for the direction, supervision and performance of the group audit. We remain solely responsible for our audit opinion.
We communicate with the directors regarding, among other matters, the planned scope and timing of the audit and significant audit findings, including any significant deficiencies in internal controls that we identify during our audit.
We also provide the directors with a statement that we have complied with relevant ethical requirements regarding independence, and to communicate with them all relationships and other matters that may reasonably be thought to bear on our independence, and where applicable, related safeguards.
From the matters communicated with the directors, we determine those matters that were of most significance in the audit of the financial statements of the current period and are therefore the key audit matters. We describe these matters in our auditors’ report unless the law or regulations preclude public disclosure about the matter or when, in extremely rare circumstances, we determine that a matter should not be communicated in our report because the adverse consequences of doing so would reasonably be expected to outweigh the public interest benefits of such communication.
Report on other legal and regulatory requirements
In our opinion, the accounting and other records required by the Act to be kept by the Company and by those subsidiary corporations incorporated in Singapore of which we are the auditors have been properly kept in accordance with the provisions of the Act.
The engagement partner on the audit resulting in this independent auditors’ report is Lee Sze Yeng.
KPMG LLPPublic Accountants andChartered Accountants
Singapore28 February 2019
INDEPENDENTAUDITORS’ REPORTTo the Members of CapitaLand Limited
FINANCIALS & ADDITIONAL INFORMATION
Cap
itaL
and
Lim
ited
Ann
ual R
epor
t 20
18
137

The Group The Company
Note31 Dec
201831 Dec
20171 Jan 2017
31 Dec2018
31 Dec2017
1 Jan 2017
$’000 $’000 $’000 $’000 $’000 $’000
Non-current assetsProperty, plant and equipment 3 752,655 840,021 781,431 3,042 19,044 29,146Intangible assets 4 634,715 563,295 441,835 405 20,315 147Investment properties 5 39,445,960 36,479,434 18,998,389 – – –Subsidiaries 6 – – – 12,060,311 12,208,267 12,246,583Associates 7 6,207,264 6,191,922 8,053,482 – – –Joint ventures 8 3,972,354 4,013,527 4,566,387 – – –Deferred tax assets 9 285,490 226,300 227,815 423 423 397Other non-current assets 10(a) 902,847 912,551 908,789 – – –
52,201,285 49,227,050 33,978,128 12,064,181 12,248,049 12,276,273Current assetsDevelopment properties for
sale and stocks 11 5,128,551 3,977,006 4,830,882 – – –Contract assets 26(ii) 24,805 166,017 152,777 – – –Trade and other receivables 12 1,944,064 1,461,637 1,734,053 1,166,485 1,974,786 1,113,211Other current assets 10(b) 28,737 59,365 14,001 – – –Assets held for sale 15 260,276 542,786 274,602 – – –Cash and cash equivalents 16 5,059,839 6,105,318 4,792,629 15,156 7,247 7,791
12,446,272 12,312,129 11,798,944 1,181,641 1,982,033 1,121,002Less: current liabilitiesTrade and other payables 17 3,841,906 3,067,237 2,831,504 261,531 886,418 127,793Contract liabilities 26(iii) 908,487 1,680,597 1,249,273 – – –Short term bank borrowings 19 1,729,472 1,250,627 710,642 – – –Current portion of debt
securities 20 1,463,984 1,488,368 1,662,786 571,750 793,796 683,312Current tax payable 1,451,474 1,279,887 1,276,751 3,526 2,599 2,602Liabilities held for sale 15 – 94,625 19,263 – – –
9,395,323 8,861,341 7,750,219 836,807 1,682,813 813,707Net current assets 3,050,949 3,450,788 4,048,725 344,834 299,220 307,295
Less: non-current liabilitiesLong term bank borrowings 19 11,274,259 10,214,466 6,636,938 – – –Debt securities 20 9,166,230 8,741,468 5,842,010 1,479,690 1,841,863 2,045,746Deferred tax liabilities 9 961,013 901,228 725,214 3,329 6,143 9,692Other non-current liabilities 21 543,793 702,852 507,737 614,132 2,172 4,272
21,945,295 20,560,014 13,711,899 2,097,151 1,850,178 2,059,710
Net assets 33,306,939 32,117,824 24,314,954 10,311,864 10,697,091 10,523,858
Representing:Share capital 23 6,309,496 6,309,496 6,309,496 6,309,496 6,309,496 6,309,496Revenue reserve 13,460,921 12,178,999 11,041,081 4,257,059 4,310,421 4,159,919Other reserves 24 (817,705) (75,605) 266,265 (254,691) 77,174 54,443Equity attributable to
owners of the Company 18,952,712 18,412,890 17,616,842 10,311,864 10,697,091 10,523,858Non-controlling interests 6 14,354,227 13,704,934 6,698,112 – – –Total equity 33,306,939 32,117,824 24,314,954 10,311,864 10,697,091 10,523,858
BALANCESHEETSAs at 31 December 2018
The accompanying notes form an integral part of these financial statements.
FINANCIALS & ADDITIONAL INFORMATIONC
apit
aLan
d L
imit
edA
nnua
l Rep
ort
2018
138

The Group The CompanyNote 2018 2017 2018 2017
$’000 $’000 $’000 $’000
Revenue 26 5,602,423 4,618,200 532,405 534,646Cost of sales (2,912,981) (2,594,087) – –Gross profit 2,689,442 2,024,113 532,405 534,646Other operating income 27(a) 990,028 850,668 87,309 276,850Administrative expenses (450,692) (422,998) (103,771) (161,849)Other operating expenses (43,187) (31,872) (16,903) (5,083)Profit from operations 3,185,591 2,419,911 499,040 644,564Finance costs 27(d) (636,495) (486,669) (76,800) (85,366)Share of results (net of tax) of:- associates 625,021 553,659 – –- joint ventures 334,386 328,629 – –
959,407 882,288 – –Profit before tax 27 3,508,503 2,815,530 422,240 559,198Tax expense 28 (658,691) (468,950) 1,865 3,573Profit for the year 2,849,812 2,346,580 424,105 562,771
Attributable to:Owners of the Company 1,762,493 1,569,560 424,105 562,771Non-controlling interests 1,087,319 777,020 – –Profit for the year 2,849,812 2,346,580 424,105 562,771
Basic earnings per share (cents) 29 42.1 37.0Diluted earnings per share (cents) 29 39.0 34.4
INCOMESTATEMENTSYear ended 31 December 2018
The accompanying notes form an integral part of these financial statements.
FINANCIALS & ADDITIONAL INFORMATION
Cap
itaL
and
Lim
ited
Ann
ual R
epor
t 20
18
139

The Group The CompanyNote 2018 2017 2018 2017
$’000 $’000 $’000 $’000
Profit for the year 2,849,812 2,346,580 424,105 562,771
Other comprehensive income:Items that may be reclassified subsequently to
profit or lossExchange differences arising from translation
of foreign operations and foreign currency loans forming part of net investment in foreign operations (237,739) (419,291) – –
Change in fair value of available-for-sale investments – 3,456 – –Effective portion of change in fair value of cash flow
hedges 17,832 (93,218) – –Share of other comprehensive income of associates
and joint ventures (327,533) 99,309 – –
Item that will not be reclassified subsequently to profit or loss
Change in fair value of equity investments at fair value through other comprehensive income (4,047) – – –
Total other comprehensive income for the year, net of tax 25 (551,487) (409,744) – –
Total comprehensive income for the year 2,298,325 1,936,836 424,105 562,771
Attributable to:Owners of the Company 1,302,156 1,213,945 424,105 562,771Non-controlling interests 996,169 722,891 – –Total comprehensive income for the year 2,298,325 1,936,836 424,105 562,771
STATEMENTS OF COMPREHENSIVE INCOMEYear ended 31 December 2018
The accompanying notes form an integral part of these financial statements.
FINANCIALS & ADDITIONAL INFORMATIONC
apit
aLan
d L
imit
edA
nnua
l Rep
ort
2018
140
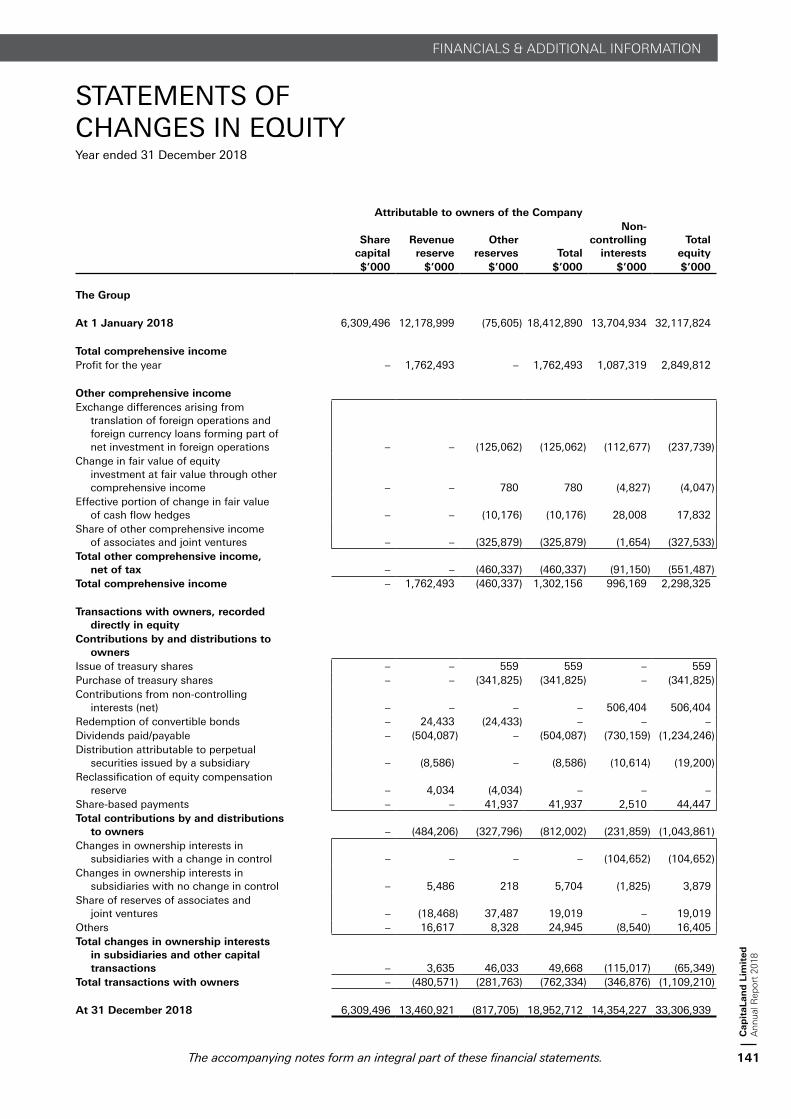
Attributable to owners of the Company
Sharecapital
Revenue reserve
Other reserves Total
Non-controlling
interestsTotal
equity$’000 $’000 $’000 $’000 $’000 $’000
The Group
At 1 January 2018 6,309,496 12,178,999 (75,605) 18,412,890 13,704,934 32,117,824
Total comprehensive incomeProfit for the year – 1,762,493 – 1,762,493 1,087,319 2,849,812
Other comprehensive incomeExchange differences arising from
translation of foreign operations and foreign currency loans forming part of net investment in foreign operations – – (125,062) (125,062) (112,677) (237,739)
Change in fair value of equity investment at fair value through other comprehensive income – – 780 780 (4,827) (4,047)
Effective portion of change in fair value of cash flow hedges – – (10,176) (10,176) 28,008 17,832
Share of other comprehensive income of associates and joint ventures – – (325,879) (325,879) (1,654) (327,533)
Total other comprehensive income, net of tax – – (460,337) (460,337) (91,150) (551,487)
Total comprehensive income – 1,762,493 (460,337) 1,302,156 996,169 2,298,325
Transactions with owners, recorded directly in equity
Contributions by and distributions to owners
Issue of treasury shares – – 559 559 – 559Purchase of treasury shares – – (341,825) (341,825) – (341,825)Contributions from non-controlling
interests (net) – – – – 506,404 506,404Redemption of convertible bonds – 24,433 (24,433) – – –Dividends paid/payable – (504,087) – (504,087) (730,159) (1,234,246)Distribution attributable to perpetual
securities issued by a subsidiary – (8,586) – (8,586) (10,614) (19,200)Reclassification of equity compensation
reserve – 4,034 (4,034) – – –Share-based payments – – 41,937 41,937 2,510 44,447Total contributions by and distributions
to owners – (484,206) (327,796) (812,002) (231,859) (1,043,861)Changes in ownership interests in
subsidiaries with a change in control – – – – (104,652) (104,652)Changes in ownership interests in
subsidiaries with no change in control – 5,486 218 5,704 (1,825) 3,879Share of reserves of associates and
joint ventures – (18,468) 37,487 19,019 – 19,019Others – 16,617 8,328 24,945 (8,540) 16,405Total changes in ownership interests
in subsidiaries and other capital transactions – 3,635 46,033 49,668 (115,017) (65,349)
Total transactions with owners – (480,571) (281,763) (762,334) (346,876) (1,109,210)
At 31 December 2018 6,309,496 13,460,921 (817,705) 18,952,712 14,354,227 33,306,939
STATEMENTS OF CHANGES IN EQUITYYear ended 31 December 2018
The accompanying notes form an integral part of these financial statements.
FINANCIALS & ADDITIONAL INFORMATION
Cap
itaL
and
Lim
ited
Ann
ual R
epor
t 20
18
141
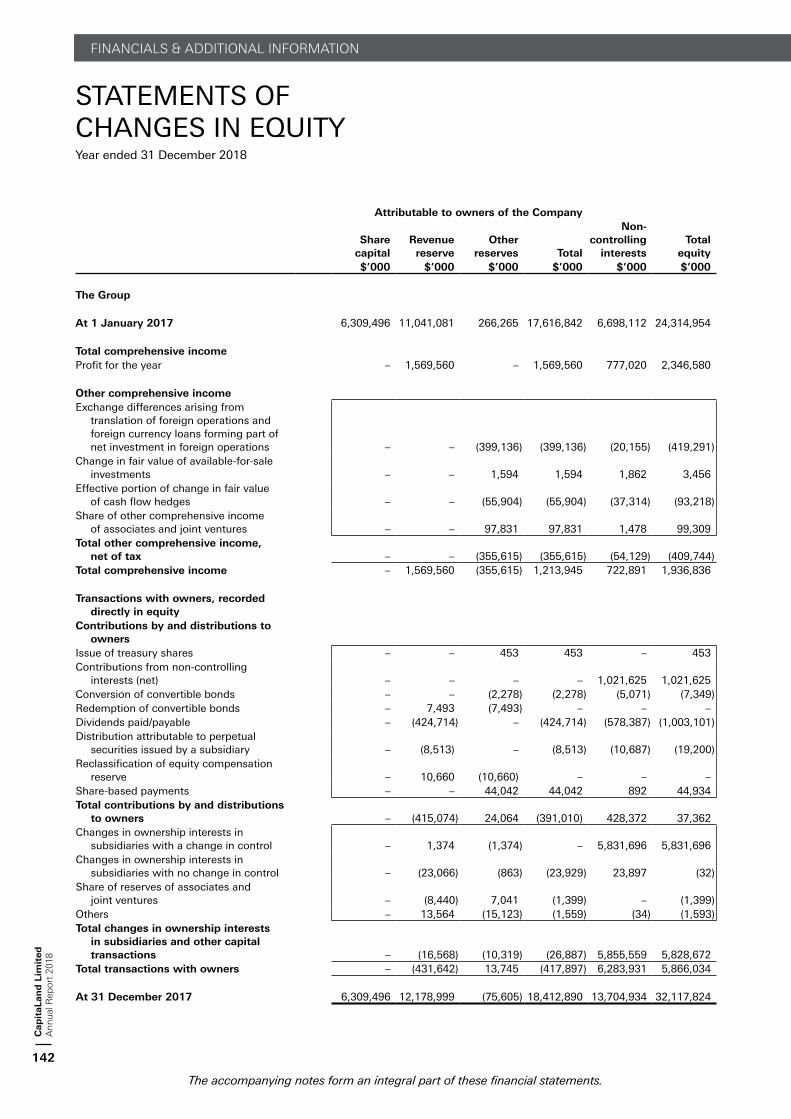
Attributable to owners of the Company
Sharecapital
Revenue reserve
Other reserves Total
Non-controlling
interestsTotal
equity$’000 $’000 $’000 $’000 $’000 $’000
The Group
At 1 January 2017 6,309,496 11,041,081 266,265 17,616,842 6,698,112 24,314,954
Total comprehensive incomeProfit for the year – 1,569,560 – 1,569,560 777,020 2,346,580
Other comprehensive incomeExchange differences arising from
translation of foreign operations and foreign currency loans forming part of net investment in foreign operations – – (399,136) (399,136) (20,155) (419,291)
Change in fair value of available-for-sale investments – – 1,594 1,594 1,862 3,456
Effective portion of change in fair value of cash flow hedges – – (55,904) (55,904) (37,314) (93,218)
Share of other comprehensive income of associates and joint ventures – – 97,831 97,831 1,478 99,309
Total other comprehensive income, net of tax – – (355,615) (355,615) (54,129) (409,744)
Total comprehensive income – 1,569,560 (355,615) 1,213,945 722,891 1,936,836
Transactions with owners, recorded directly in equity
Contributions by and distributions to owners
Issue of treasury shares – – 453 453 – 453Contributions from non-controlling
interests (net) – – – – 1,021,625 1,021,625Conversion of convertible bonds – – (2,278) (2,278) (5,071) (7,349)Redemption of convertible bonds – 7,493 (7,493) – – –Dividends paid/payable – (424,714) – (424,714) (578,387) (1,003,101)Distribution attributable to perpetual
securities issued by a subsidiary – (8,513) – (8,513) (10,687) (19,200)Reclassification of equity compensation
reserve – 10,660 (10,660) – – –Share-based payments – – 44,042 44,042 892 44,934Total contributions by and distributions
to owners – (415,074) 24,064 (391,010) 428,372 37,362Changes in ownership interests in
subsidiaries with a change in control – 1,374 (1,374) – 5,831,696 5,831,696Changes in ownership interests in
subsidiaries with no change in control – (23,066) (863) (23,929) 23,897 (32)Share of reserves of associates and
joint ventures – (8,440) 7,041 (1,399) – (1,399)Others – 13,564 (15,123) (1,559) (34) (1,593)Total changes in ownership interests
in subsidiaries and other capital transactions – (16,568) (10,319) (26,887) 5,855,559 5,828,672
Total transactions with owners – (431,642) 13,745 (417,897) 6,283,931 5,866,034
At 31 December 2017 6,309,496 12,178,999 (75,605) 18,412,890 13,704,934 32,117,824
STATEMENTS OF CHANGES IN EQUITYYear ended 31 December 2018
The accompanying notes form an integral part of these financial statements.
FINANCIALS & ADDITIONAL INFORMATIONC
apit
aLan
d L
imit
edA
nnua
l Rep
ort
2018
142

Attributable to owners of the Company
Sharecapital
Revenue reserve
Reserve for own shares
Capital reserves
Equity compensation
reserveTotal
equity$’000 $’000 $’000 $’000 $’000 $’000
The Company
At 1 January 2018 6,309,496 4,310,421 (78,514) 135,715 19,973 10,697,091
Total comprehensive incomeProfit for the year – 424,105 – – – 424,105
Transactions with owners, recorded directly in equity
Contributions by and distributions to owners
Purchase of treasury shares – – (341,825) – – (341,825)
Issue of treasury shares – – 35,261 – (8,904) 26,357
Dividends paid – (504,087) – – – (504,087)
Share-based payments – – – – 10,223 10,223
Reclassification of equity compensation reserve – 2,187 – – (2,187) –
Redemption of convertible bonds – 24,433 – (24,433) – –
Total transactions with owners – (477,467) (306,564) (24,433) (868) (809,332)
At 31 December 2018 6,309,496 4,257,059 (385,078) 111,282 19,105 10,311,864
At 1 January 2017 6,309,496 4,159,919 (107,220) 144,353 17,310 10,523,858
Total comprehensive incomeProfit for the year – 562,771 – – – 562,771
Transactions with owners, recorded directly in equity
Contributions by and distributions to owners
Issue of treasury shares – – 28,706 – (6,467) 22,239
Dividends paid – (424,714) – – – (424,714)
Share-based payments – – – – 12,937 12,937
Reclassification of equity compensation reserve – 3,807 – – (3,807) –
Repurchase/Redemption of convertible bonds – 8,638 – (8,638) – –
Total transactions with owners – (412,269) 28,706 (8,638) 2,663 (389,538)
At 31 December 2017 6,309,496 4,310,421 (78,514) 135,715 19,973 10,697,091
STATEMENTS OF CHANGES IN EQUITYYear ended 31 December 2018
The accompanying notes form an integral part of these financial statements.
FINANCIALS & ADDITIONAL INFORMATION
Cap
itaL
and
Lim
ited
Ann
ual R
epor
t 20
18
143

2018 2017$’000 $’000
Cash flows from operating activities
Profit after tax 2,849,812 2,346,580
Adjustments for:Allowance for/(Write-back of):- impairment loss on receivables 10,001 7,835- foreseeable losses (43,462) (27,676)- impairment on interests in associates and joint ventures 12,454 (53)- impairment of intangible assets – 3,226Amortisation of intangible assets 11,165 7,022Depreciation of property, plant and equipment 63,338 69,270Finance costs 636,495 486,669Gain from bargain purchase – (26,941)Loss on disposal and write off of property, plant and equipment 749 137Gain on disposal of investment properties (120,743) (95,842)Interest income (88,006) (62,047)Net change in fair value of investment properties and assets held for sale (677,018) (309,833)Net change in fair value of financial instruments 1,646 (121)Net gain from change of ownership interest in subsidiaries and
associates/disposal/redemption of available-for-sale financial assets (49,307) (325,466)Share of results of associates and joint ventures (959,407) (882,288)Share-based expenses 50,421 55,333Tax expense 658,691 468,950
(492,983) (631,825)Operating profit before working capital changes 2,356,829 1,714,755
Changes in working capital:Trade and other receivables (511,770) (101,056)Development properties for sale 95,465 752,595Trade and other payables (990,564) 188,592Restricted bank deposits (6,870) (9,802)
(1,413,739) 830,329Cash generated from operations 943,090 2,545,084Taxation paid (389,696) (378,751)Net cash generated from operating activities 553,394 2,166,333
CONSOLIDATED STATEMENT OF CASH FLOWSYear ended 31 December 2018
The accompanying notes form an integral part of these financial statements.
FINANCIALS & ADDITIONAL INFORMATIONC
apit
aLan
d L
imit
edA
nnua
l Rep
ort
2018
144
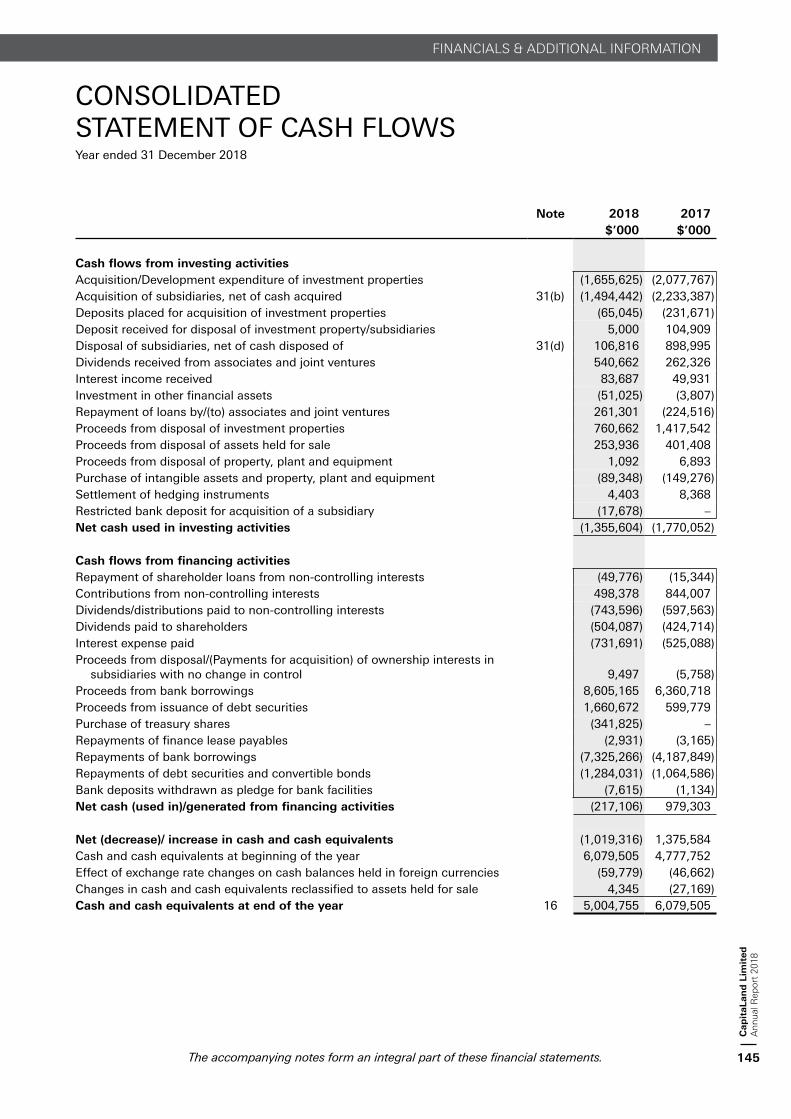
Note 2018 2017$’000 $’000
Cash flows from investing activitiesAcquisition/Development expenditure of investment properties (1,655,625) (2,077,767)Acquisition of subsidiaries, net of cash acquired 31(b) (1,494,442) (2,233,387)Deposits placed for acquisition of investment properties (65,045) (231,671)Deposit received for disposal of investment property/subsidiaries 5,000 104,909Disposal of subsidiaries, net of cash disposed of 31(d) 106,816 898,995Dividends received from associates and joint ventures 540,662 262,326Interest income received 83,687 49,931Investment in other financial assets (51,025) (3,807)Repayment of loans by/(to) associates and joint ventures 261,301 (224,516)Proceeds from disposal of investment properties 760,662 1,417,542Proceeds from disposal of assets held for sale 253,936 401,408Proceeds from disposal of property, plant and equipment 1,092 6,893Purchase of intangible assets and property, plant and equipment (89,348) (149,276)Settlement of hedging instruments 4,403 8,368Restricted bank deposit for acquisition of a subsidiary (17,678) –Net cash used in investing activities (1,355,604) (1,770,052)
Cash flows from financing activitiesRepayment of shareholder loans from non-controlling interests (49,776) (15,344)Contributions from non-controlling interests 498,378 844,007Dividends/distributions paid to non-controlling interests (743,596) (597,563)Dividends paid to shareholders (504,087) (424,714)Interest expense paid (731,691) (525,088)Proceeds from disposal/(Payments for acquisition) of ownership interests in
subsidiaries with no change in control 9,497 (5,758)Proceeds from bank borrowings 8,605,165 6,360,718Proceeds from issuance of debt securities 1,660,672 599,779Purchase of treasury shares (341,825) –Repayments of finance lease payables (2,931) (3,165)Repayments of bank borrowings (7,325,266) (4,187,849)Repayments of debt securities and convertible bonds (1,284,031) (1,064,586)Bank deposits withdrawn as pledge for bank facilities (7,615) (1,134)Net cash (used in)/generated from financing activities (217,106) 979,303
Net (decrease)/ increase in cash and cash equivalents (1,019,316) 1,375,584Cash and cash equivalents at beginning of the year 6,079,505 4,777,752Effect of exchange rate changes on cash balances held in foreign currencies (59,779) (46,662)Changes in cash and cash equivalents reclassified to assets held for sale 4,345 (27,169)Cash and cash equivalents at end of the year 16 5,004,755 6,079,505
CONSOLIDATED STATEMENT OF CASH FLOWSYear ended 31 December 2018
The accompanying notes form an integral part of these financial statements.
FINANCIALS & ADDITIONAL INFORMATION
Cap
itaL
and
Lim
ited
Ann
ual R
epor
t 20
18
145

These notes form an integral part of the financial statements.
The financial statements were authorised for issue by the Board of Directors on 28 February 2019.
1. DOMICILE AND ACTIVITIES
CapitaLand Limited (the Company) is incorporated in the Republic of Singapore and has its registered office at 168 Robinson Road, #30-01, Capital Tower, Singapore 068912.
The principal activities of the Company during the financial year are those relating to investment holding and consultancy services as well as the corporate headquarters which gives direction, provides management support services and integrates the activities of its subsidiaries.
The principal activities of the significant subsidiaries are those relating to investment holding, real estate development, investment in real estate financial products and real estate assets, investment advisory and management services as well as management of real estate assets.
The consolidated financial statements relate to the Company and its subsidiaries (the Group) and the Group’s interests in associates and joint ventures.
2. SUMMARY OF SIGNIFICANT ACCOUNTING POLICIES
2.1 Basis of preparation
The financial statements have been prepared in accordance with the Singapore Financial Reporting Standards (International) (SFRS(I)) and International Financial Reporting Standards (IFRS). SFRS(I) are issued by the Accounting Standards Council and comprise standards and interpretations that are equivalent to International Financial Reporting Standards (IFRS) as issued by the International Accounting Standard Board (IASB). All references to SFRS (I) and IFRS are subsequently referred to as SFRS(I) in these financial statements unless otherwise stated. These are the Group’s first financial statements prepared in accordance with SFRS(I) and SFRS(I) 1 First-time Adoption of Singapore Financial Reporting Standards (International) has been applied.
In the previous financial years, the financial statements were prepared in accordance with Financial Reporting Standards in Singapore (FRS). An explanation of how the transition to SFRS(I) and application of SFRS(I) 9 and SFRS(I) 15 have affected the reported financial position, financial performance and cash flows is provided in note 41.
The financial statements have been prepared on the historical cost basis except as disclosed in the accounting policies below.
These financial statements are presented in Singapore Dollars, which is the Company’s functional currency. All financial information presented in Singapore Dollars have been rounded to the nearest thousand, unless otherwise stated.
The preparation of the financial statements in conformity with SFRS(I) requires management to make judgements, estimates and assumptions that affect the application of accounting policies and the reported amounts of assets, liabilities, income and expenses. Actual results may differ from these estimates.
Estimates and underlying assumptions are reviewed on an ongoing basis. Revisions to accounting estimates are recognised in the period in which the estimates are revised and in any future periods affected.
NOTES TO THEFINANCIAL STATEMENTS
FINANCIALS & ADDITIONAL INFORMATIONC
apit
aLan
d L
imit
edA
nnua
l Rep
ort
2018
146

2. SUMMARY OF SIGNIFICANT ACCOUNTING POLICIES (continued)
2.1 Basis of preparation (continued)
Information about critical judgements in applying accounting policies that have the most significant effect on the amount recognised in the financial statements are described in the following notes:
Note 2.6, Note 3(a) classification of investment properties
Note 6 consolidation; whether the Group has control over an investee
Note 9 recognition of deferred tax assets
Note 2.15 revenue recognition: whether revenue from sale of residential units is recognised over time or at point in time
Note 2.2(a), Note 32 accounting for acquisitions as business combinations or asset acquisitions
Information about assumptions and estimation uncertainties that have a significant risk of resulting in a material adjustment within the next financial year are included in the following notes:
Note 4 measurement of recoverable amounts of goodwill
Note 5, Note 34 determination of fair value of investment properties
Note 11 estimation of the percentage of completion of the projects’ attributable profits for development properties for sale and allowance for foreseeable losses
Note 32 determination of fair value of assets, liabilities and contingent liabilities acquired in business combinations
Note 34 determination of fair value of financial instruments
The accounting policies set out below have been applied consistently to all periods presented in these financial statements and in preparing the opening SFRS(I) balance sheet at 1 January 2017 for purpose of the transition to SFRS(I), unless otherwise indicated.
The accounting policies have been applied consistently by Group entities.
2.2 Basis of consolidation
(a) Business combinations
Business combinations are accounted for using the acquisition method as at the acquisition date, which is the date on which control is transferred to the Group.
Goodwill arising from business combinations are measured as described in note 2.5(a).
The consideration transferred does not include amounts related to the settlement of pre-existing relationships. Such amounts are generally recognised in the profit or loss.
Any contingent consideration payable is recognised at fair value at the acquisition date and included in the consideration transferred. If the contingent consideration is classified as equity, it is not re-measured and settlement is accounted for within equity. Otherwise, other contingent consideration is re-measured at fair value at each reporting date and subsequent changes to the fair value of the contingent consideration are recognised in the profit or loss.
Costs related to the acquisition, other than those associated with the issue of debt or equity securities, that the Group incurs in connection with a business combination are expensed as incurred.
NOTES TO THEFINANCIAL STATEMENTS
FINANCIALS & ADDITIONAL INFORMATION
Cap
itaL
and
Lim
ited
Ann
ual R
epor
t 20
18
147

2. SUMMARY OF SIGNIFICANT ACCOUNTING POLICIES (continued)
2.2 Basis of consolidation (continued)
(a) Business combinations (continued)
Non-controlling interests that are present ownership interests and entitle their holders to a proportionate share of the acquiree’s net assets in the event of liquidation are measured either at fair value or at the non-controlling interests’ proportionate share of the recognised amounts of the acquiree’s identifiable net assets, at the acquisition date. The measurement basis taken is elected on a transaction-by-transaction basis. All other non-controlling interests are measured at acquisition-date fair value, unless another measurement basis is required by SFRS(I). If the business combination is achieved in stages, the Group’s previously held equity interest in the acquiree is re-measured to fair value at each acquisition date and any changes are taken to the profit or loss.
Acquisitions before 1 January 2017
As part of transition to SFRS(I), the Group elected not to restate those business combinations that occurred before the date of transition to SFRS(I), i.e. 1 January 2017. Goodwill arising from acquisitions before 1 January 2017 has been carried forward from the previous FRS framework as at the date of transition.
Business combinations and property acquisitions
Where a property is acquired, via corporate acquisitions or otherwise, management considers the substance of the assets and activities of the acquired entity in determining whether the acquisition represents the acquisition of a business.
The Group accounts for an acquisition as business combination where an integrated set of activities is acquired in addition to the property. More specifically, consideration is made of the extent to which significant processes are acquired (e.g. maintenance and serviced residence operations, etc.).
When acquisition of an asset or a group of assets does not constitute a business combination, it is treated as property acquisition. In such cases, the individual identifiable assets acquired and liabilities assumed are recognised. The acquisition cost shall be allocated to the individual identifiable assets and liabilities on the basis of their relative fair values at the date of acquisition. Such a transaction does not give rise to goodwill.
(b) Subsidiaries
Subsidiaries are entities controlled by the Group. The Group controls an entity when it is exposed to, or has rights to, variable returns from its involvement with the entity and has the ability to affect these returns through its power over the entity. The financial statements of subsidiaries are included in the consolidated financial statements from the date that control commences until the date that control ceases. The accounting policies of subsidiaries have been changed when necessary to align them with the policies adopted by the Group. Losses applicable to the non-controlling interests in a subsidiary are allocated to the non-controlling interests even if this results in the non-controlling interests having a deficit balance.
Changes in the Group’s interests in subsidiaries that do not result in a loss of control are accounted for as transactions with owners and therefore no adjustments are made to goodwill and no gain or loss is recognised in profit or loss. Adjustments to non-controlling interests arising from transactions that do not involve the loss of control are based on a proportionate amount of the net assets of the subsidiary.
Upon the loss of control of a subsidiary, the Group derecognises the assets and liabilities of the subsidiary, any non-controlling interests and the other components of equity related to the subsidiary. Any surplus or deficit arising from the loss of control is recognised in the profit or loss. If the Group retains any interest in the previous subsidiary, then such interest is measured at fair value at the date that control is lost. Subsequently, it is accounted for as an equity-accounted investee or as an available-for-sale financial asset depending on the level of influence retained.
NOTES TO THEFINANCIAL STATEMENTS
FINANCIALS & ADDITIONAL INFORMATIONC
apit
aLan
d L
imit
edA
nnua
l Rep
ort
2018
148

2. SUMMARY OF SIGNIFICANT ACCOUNTING POLICIES (continued)
2.2 Basis of consolidation (continued)
(c) Associates and joint ventures
Associates are those entities in which the Group has significant influence, but not control, over their financial and operating policies of these entities. Significant influence is presumed to exist when the Group holds 20% or more of the voting power of another entity. Joint ventures are entities over whose activities the Group has joint control, whereby the Group has rights to the net assets of the arrangement, rather than rights to its assets and obligations for its liabilities.
Associates and joint ventures are accounted for using the equity method (collectively referred to as equity-accounted investees) and are recognised initially at cost. The cost of the investments includes transaction costs. The Group’s investments in equity-accounted investees include goodwill identified on acquisition, net of any accumulated impairment losses. Subsequent to initial recognition, the consolidated financial statements include the Group’s share of the profit or loss and other comprehensive income of the equity-accounted investees, after adjustments to align the accounting policies of the equity-accounted investees with those of the Group, from the date that significant influence or joint control commences until the date that significant influence or joint control ceases.
When the Group’s share of losses exceeds its interest in an equity-accounted investee, the carrying amount of the investment, together with any long-term interests that form part thereof, is reduced to zero and the recognition of further losses is discontinued except to the extent that the Group has an obligation to fund the investee’s operation or has made payments on behalf of the investee.
An impairment loss in respect of an associate or joint venture is measured by comparing the recoverable amount of the investment with its carrying amount in accordance with note 2.11. An impairment loss is recognised in profit or loss. An impairment loss is reversed if there has been a favourable change in the estimates used to determine the recoverable amount.
(d) Joint operations
A joint operation is an arrangement in which the Group has joint control whereby the Group has rights to the assets, and obligations for the liabilities, relating to an arrangement. The Group accounts for each of its assets, liabilities and transactions, including its share of those held or incurred jointly, in relation to the joint operation.
(e) Transactions eliminated on consolidation
Intra-group balances and transactions, and any unrealised income and expenses arising from intra-group transactions, are eliminated in preparing the consolidated financial statements. Unrealised gains arising from transactions with equity-accounted investees are eliminated against the investment to the extent of the Group’s interest in the investee. Unrealised losses are eliminated in the same way as unrealised gains, but only to the extent that there is no evidence of impairment.
(f) Accounting for subsidiaries, associates and joint ventures by the Company
Investments in subsidiaries, associates and joint ventures are stated in the Company’s balance sheet at cost less accumulated impairment losses.
NOTES TO THEFINANCIAL STATEMENTS
FINANCIALS & ADDITIONAL INFORMATION
Cap
itaL
and
Lim
ited
Ann
ual R
epor
t 20
18
149

2. SUMMARY OF SIGNIFICANT ACCOUNTING POLICIES (continued)
2.3 Foreign currencies
Foreign currency transactions
Items included in the financial statements of each entity in the Group are measured using the currency that best reflects the economic substance of the underlying events and circumstances relevant to that entity (the functional currency).
Transactions in foreign currencies are translated to the respective functional currencies of the Group’s entities at the exchange rates at the dates of the transactions. Monetary assets and liabilities denominated in foreign currencies at the end of the reporting date are translated to the functional currency at the exchange rate prevailing at that date. Non-monetary assets and liabilities denominated in foreign currencies that are measured at fair value are translated to the functional currency at the exchange rate at the date on which the fair value was determined. Non-monetary items in a foreign currency that are measured in terms of historical cost are translated using the exchange rate at the date of the transaction.
Foreign currency differences arising from translation are recognised in the profit or loss, except for differences arising from the translation of monetary items that in substance form part of the Group’s net investment in a foreign operation, financial assets fair value through other comprehensive income and financial liabilities designated as hedges of net investment in a foreign operation (note 2.8) or qualifying cash flow hedges to the extent such hedges are effective, which are recognised in other comprehensive income.
Foreign operations
The assets and liabilities of foreign operations, excluding goodwill and fair value adjustments arising on acquisitions, are translated to Singapore Dollars at exchange rates prevailing at the end of the reporting period. The income and expenses of foreign operations are translated to Singapore Dollars at exchange rates prevailing at the dates of the transactions. Goodwill and fair value adjustments arising from the acquisition of a foreign operation are treated as assets and liabilities of the foreign operation and translated at the exchange rates at the reporting date.
Foreign currency differences are recognised in other comprehensive income, and presented in the foreign currency translation reserve (translation reserve) in equity. However, if the foreign operation is not a wholly-owned subsidiary, then the relevant proportionate share of the translation difference is allocated to the non-controlling interests. When a foreign operation is disposed of such that control, significant influence or joint control is lost, the cumulative amount in the translation reserve related to that foreign operation is transferred to the profit or loss as part of the gain or loss on disposal. When the Group disposes of only part of its interest in a subsidiary that includes a foreign operation while retaining control, the relevant proportion of the cumulative amount is reattributed to non-controlling interests. When the Group disposes of only part of its investment in an associate or a joint venture that includes a foreign operation while retaining significant influence or joint control, the relevant proportion of the cumulative amount is transferred to the profit or loss.
Net investment in a foreign operation
When the settlement of a monetary item receivable from or payable to a foreign operation is neither planned nor likely to occur in the foreseeable future, foreign exchange gains and losses arising from such a monetary item are considered to form part of a net investment in a foreign operation. These are recognised in other comprehensive income and are presented in the translation reserve in equity.
NOTES TO THEFINANCIAL STATEMENTS
FINANCIALS & ADDITIONAL INFORMATIONC
apit
aLan
d L
imit
edA
nnua
l Rep
ort
2018
150

2. SUMMARY OF SIGNIFICANT ACCOUNTING POLICIES (continued)
2.4 Property, plant and equipment
Property, plant and equipment are measured at cost less accumulated depreciation and accumulated impairment losses. Cost includes expenditure that is directly attributable to the acquisition of the asset. Certain of the Group’s property, plant and equipment acquired through interests in subsidiaries, are accounted for as acquisition of assets (note 2.2(a)).
Subsequent expenditure relating to property, plant and equipment that has already been recognised is added to the carrying amount of the asset if it is probable that future economic benefits, in excess of the originally assessed standard of performance of the existing asset, will flow to the Group and its cost can be measured reliably. All other subsequent expenditure is recognised as an expense in the period in which it is incurred.
Depreciation is recognised from the date that the property, plant and equipment are installed and are ready for use. Depreciation on property, plant and equipment is recognised in the profit or loss on a straight-line basis over the estimated useful lives of each component of an item of property, plant and equipment as follows:
Leasehold land and buildings (excluding Lease period ranging from serviced residence properties) 30 years to 50 years
Plant, machinery and improvements 1 to 10 years
Motor vehicles 5 years
Furniture, fittings and equipment 1 to 10 years
For serviced residence properties where the residual value at the end of the intended holding period is lower than the carrying amount, the difference in value is depreciated over the Group’s intended holding period. The intended holding period (the period from the date of commencement of serviced residence operations to the date of expected strategic divestment of the properties) ranges from three to five years. No depreciation is recognised where the residual value is higher than the carrying amount.
Assets under construction are stated at cost and are not depreciated. Expenditure relating to assets under construction (including borrowing costs) are capitalised when incurred. Depreciation will commence when the development is completed and ready to use.
The assets’ residual values, useful lives and depreciation methods are reviewed at each reporting date, and adjusted if appropriate.
2.5 Intangible assets
(a) Goodwill
Acquisition from 1 January 2017
For business combinations on or after 1 January 2017, the Group measures goodwill as at acquisition date based on the fair value of the consideration transferred (including the fair value of any pre-existing equity interest in the acquiree) and the recognised amount of any non-controlling interests in the acquiree, less the net recognised amount (generally fair value) of the identifiable assets acquired and liabilities assumed. When the amount is negative, a gain on bargain purchase is recognised in the profit or loss. Goodwill is subsequently measured at cost less accumulated impairment losses.
Goodwill arising from the acquisition of subsidiaries is included in intangible assets. Goodwill arising from the acquisition of associates and joint ventures is presented together with interests in associates and joint ventures.
Goodwill is tested annually for impairment as described in note 2.11.
NOTES TO THEFINANCIAL STATEMENTS
FINANCIALS & ADDITIONAL INFORMATION
Cap
itaL
and
Lim
ited
Ann
ual R
epor
t 20
18
151

2. SUMMARY OF SIGNIFICANT ACCOUNTING POLICIES (continued)
2.5 Intangible assets (continued)
(a) Goodwill (continued)
Acquisition before 1 January 2017
As part of the transition to SFRS(I), the Group elected not to restate those business combinations that occurred before the date of transition to SFRS(I), i.e. 1 January 2017. Goodwill arising from acquisitions before 1 January 2017 has been carried forward from previous FRS framework as at the date of transition.
(b) Other intangible assets
Other intangible assets with finite useful lives are measured at cost less accumulated amortisation and accumulated impairment losses. These are amortised in the profit or loss on a straight-line basis over their estimated useful lives of one to 10 years, from the date on which the assets are available for use.
Other intangible assets with indefinite useful lives are not amortised and are measured at cost less accumulated impairment losses.
2.6 Investment properties and investment properties under development
Investment properties are properties held either to earn rental or for capital appreciation or both. Investment properties under development are properties being constructed or developed for future use as investment properties. Certain of the Group’s investment properties acquired through interests in subsidiaries, are accounted for as acquisition of assets (note 2.2(a)).
Investment properties and investment properties under development are initially recognised at cost, including transaction costs, and subsequently at fair value with any change therein recognised in the profit or loss. Cost includes expenditure that is directly attributable to the acquisition of the investment property. The cost of self-constructed investment property includes the cost of materials and direct labour, any other costs directly attributable to bringing the investment property to a working condition for their intended use and capitalised borrowing costs. The fair value is determined based on internal valuation or independent professional valuation on semi-annual basis. Independent valuation is also carried out on occurrence of acquisition and on completion of construction of investment property.
When an investment property or investment property under development is disposed of, the resulting gain or loss recognised in the profit or loss is the difference between the net disposal proceed and the carrying amount of the property.
Transfers to, or from, investment properties are made where there is a change in intent and use, evidenced by:
• development with a view to sell, for a transfer from investment properties to development properties for sale;
• commencement of leasing activities for a transfer from development properties for sale to investment properties;
• commencement of owner-occupation, for a transfer from investment properties to property, plant and equipment; and
• end of owner-occupation, for a transfer from property, plant and equipment to investment properties.
NOTES TO THEFINANCIAL STATEMENTS
FINANCIALS & ADDITIONAL INFORMATIONC
apit
aLan
d L
imit
edA
nnua
l Rep
ort
2018
152

2. SUMMARY OF SIGNIFICANT ACCOUNTING POLICIES (continued)
2.7 Non-current assets and liabilities held for sale
Non-current assets and liabilities, that are highly probable to be recovered primarily through sale rather than through continuing use, are classified as held for sale. Immediately before classification as held for sale, the assets are remeasured in accordance with the applicable SFRS(I). Thereafter, the assets are generally measured at the lower of their carrying amount and fair value less costs to sell. Impairment losses on initial classification as held for sale and subsequent gains or losses on remeasurement are recognised in profit or loss. Gains are not recognised in excess of any cumulative impairment loss.
Intangible assets and property, plant and equipment classified as held for sale are not amortised or depreciated. In addition, equity accounting of associates and joint ventures ceases once the investments are classified as held for sale.
2.8 Financial instruments
(a) Non-derivative financial assets – Policy applicable from 1 January 2018
Classification and measurement
The Group classifies its financial assets in the following measurement categories:• Amortised costs;• Fair value through other comprehensive income (FVOCI); and • Fair value through profit or loss (FVTPL).
The classification depends on the Group’s business model for managing the financial assets as well as the contractual terms of the cash flows of the financial asset.
Financial assets with embedded derivatives are considered in their entirety when determining whether their cash flows are solely payment of principal and interest.
The Group reclassifies financial assets when and only when its business model for managing those assets changes.
At initial recognition
A financial asset is recognised if the Group becomes a party to the contractual provisions of the financial asset.
At initial recognition, the Group measures a financial asset at its fair value plus, in the case of a financial asset not at fair value through profit or loss, transaction costs that are directly attributable to the acquisition of the financial asset. Transaction costs of financial assets carried at fair value through profit or loss are expensed in profit or loss.
NOTES TO THEFINANCIAL STATEMENTS
FINANCIALS & ADDITIONAL INFORMATION
Cap
itaL
and
Lim
ited
Ann
ual R
epor
t 20
18
153
2. SUMMARY OF SIGNIFICANT ACCOUNTING POLICIES (continued)
2.8 Financial instruments (continued)
(a) Non-derivative financial assets – Policy applicable from 1 January 2018 (continued)
At subsequent measurement
(i) Financial assets at amortised cost
Financial assets that are held for collection of contractual cash flows where those cash flows represent solely payments of principal and interest are measured at amortised cost. Interest income from these financial assets is included in interest income using the effective interest rate method.
(ii) Financial assets at FVOCI
Debt instruments that are held for collection of contractual cash flows and for sale, and where the assets’ cash flows represent solely payments of principal and interest, are classified as FVOCI. Movements in fair values are recognised in OCI and accumulated in fair value reserve, except for the recognition of impairment, interest income and foreign exchange gains and losses, which are recognised in profit or loss. When the financial asset is derecognised, the cumulative gain or loss previously recognised in OCI is reclassified from equity to profit or loss and presented in “other operating income and expenses”. Interest income from these financial assets is recognised using the effective interest rate method and presented in “interest income”.
The Group has elected to recognise changes in fair value of equity securities not held for trading in OCI as these are strategic investments and the Group considers this to be more relevant. Movements in fair values of equity investments classified as FVOCI are presented as “fair value gains/losses” in OCI. Dividends from equity investments are recognised in profit or loss as dividend income. On disposal of an equity investment, any difference between the carrying amount and sales proceed amount would be recognised in other comprehensive income and transferred to retained profits along with the amount previously recognised in OCI relating to that asset.
(iii) Financial assets at FVTPL
Financial assets that are held for trading as well as those that do not meet the criteria for classification as amortised cost or FVOCI are classified as FVTPL. Movement in fair values and interest income is recognised in profit or loss in the period in which it arises and presented in “other operating income”.
(b) Non-derivative financial assets – Policy applicable before 1 January 2018
Non-derivative financial assets comprise investments in equity and debt securities, trade and other receivables and cash and cash equivalents.
A financial asset is recognised if the Group becomes a party to the contractual provisions of the financial asset.
Financial assets at fair value through profit or loss
A financial asset is classified as fair value through profit or loss if it is held for trading or is designated as such upon initial recognition. Financial assets are designated as fair value through profit or loss if the Group manages such investments and makes purchase and sale decisions based on their fair value. Upon initial recognition, attributable transaction costs are recognised in the profit or loss when incurred. Financial assets at fair value through profit or loss are measured at fair value, and changes therein, which takes into account any dividend income, are recognised in the profit or loss.
NOTES TO THEFINANCIAL STATEMENTS
FINANCIALS & ADDITIONAL INFORMATIONC
apit
aLan
d L
imit
edA
nnua
l Rep
ort
2018
154

2. SUMMARY OF SIGNIFICANT ACCOUNTING POLICIES (continued)
2.8 Financial instruments (continued)
(b) Non-derivative financial assets – Policy applicable before 1 January 2018 (continued)
Available-for-sale financial assets
Available-for-sale financial assets are recognised initially at fair value plus any directly attributable transaction costs. Subsequent to initial recognition, they are measured at fair value and changes therein, other than for impairment losses (note 2.8(e)) and foreign exchange gains and losses on available-for-sale monetary items (note 2.3), are recognised directly in other comprehensive income and presented in the available-for-sale reserve in equity. When an investment is derecognised, the cumulative gain or loss in equity is reclassified to the profit or loss.
Investments in equity securities whose fair value cannot be reliably measured are measured at cost less accumulated impairment loss.
Loans and receivables
Loans and receivables are financial assets with fixed or determinable payments that are not quoted in an active market. Such assets are recognised initially at fair value plus any directly attributable transaction costs. Subsequent to initial recognition, loans and receivables are measured at amortised cost using the effective interest method, less any impairment losses. Loans and receivables comprise cash and cash equivalents, and trade and other receivables (excluding prepayments).
(c) Cash and cash equivalents
Cash and cash equivalents comprise cash balances and bank deposits. For the purpose of the statement of cash flows, pledged deposits are excluded whilst bank overdrafts that are repayable on demand and form an integral part of the Group’s cash management are included as a component of cash and cash equivalents.
(d) Non-derivative financial liabilities
The Group initially recognises debt securities issued on the date that they are originated. Financial liabilities for contingent consideration payable in a business combination are recognised at the acquisition date. All other financial liabilities (including liabilities designated at fair value through profit or loss) are recognised initially on the trade date, which is the date that the Group becomes a party to the contractual provisions of the instrument.
A financial liability is classified as fair value through profit or loss if it is classified as held for trading or is designated as such on initial recognition. Directly attributable transaction costs are recognised in profit or loss as incurred. Financial liabilities at fair value through profit or loss are measured at fair value and changes therein, including any interest expense, are recognised in profit or loss.
The Group classifies non-derivative financial liabilities under the other financial liabilities category. Such financial liabilities are recognised initially at fair value plus any directly attributable transaction costs. Subsequent to initial recognition, these financial liabilities are measured at amortised cost using the effective interest rate method. Other financial liabilities comprise loans, borrowings, debt securities and trade and other payables.
(e) Derecognition
Financial assets are derecognised if the Group’s contractual rights to the cash flows from the financial assets expire or if the Group transfers the financial assets to another party without retaining control or transfers substantially all the risks and rewards of the assets. The Group derecognises a financial liability when its contractual obligations are discharged, cancelled or expired.
NOTES TO THEFINANCIAL STATEMENTS
FINANCIALS & ADDITIONAL INFORMATION
Cap
itaL
and
Lim
ited
Ann
ual R
epor
t 20
18
155

2. SUMMARY OF SIGNIFICANT ACCOUNTING POLICIES (continued)
2.8 Financial instruments (continued)
(f) Offsetting
Financial assets and liabilities are offset and the net amount presented in the balance sheet when, and only when, the Group has a legal right to offset the amounts and intends either to settle on a net basis or to realise the asset and settle the liability simultaneously.
(g) Derivative financial instruments and hedge accounting – Policy applicable from 1 January 2018
The Group holds derivative financial instruments to hedge its foreign currency and interest rate risk exposures. Embedded derivatives are separated from the host contract and accounted for separately if the host contract is not a financial asset and the economic characteristics and risks of the host contract and the embedded derivative are not closely related, a separate instrument with the same terms as the embedded derivative would meet the definition of a derivative, and the combined instrument is not measured at fair value through profit or loss. The method of recognising the resulting gain or loss depends on whether the derivative is designated as a hedging instrument, and if so, the nature of the item being hedged. The Group designates each hedge as either: (a) fair value hedge; (b) cash flow hedge; or (c) net investment hedge.
On initial designation of the derivative as the hedging instrument, the Group formally documents the economic relationship between the hedging instrument and hedged item, including the risk management objectives and strategy in undertaking the hedge transaction and the hedged risk, together with the methods that will be used to assess the effectiveness of the hedging relationship. The Group makes an assessment, both at the inception of the hedge relationship as well as on an ongoing basis, of whether the hedging instruments are expected to be highly effective in offsetting the changes in the fair value or cash flows of the respective hedged items attributable to the hedged risk. For a cash flow hedge of a forecast transaction, the transaction should be highly probable to occur and should present an exposure to variations in cash flows that could ultimately affect reported profit or loss.
Derivatives are recognised initially at fair value; attributable transaction costs are recognised in the profit or loss when incurred. Subsequent to initial recognition, derivatives are measured at fair value, and changes therein are accounted for as described below.
Hedging relationships designated under FRS 39 as at 31 December 2017 are treated as continuing hedges and hedge documentation are aligned with the requirements of SFRS(I) 9.
Cash flow hedges
The Group designates certain derivatives as hedging instruments to hedge the variability in cash flows associated with highly probable forecast transactions arising from changes in foreign exchange rates and interest rates.
When a derivative is designated as a cash flow hedging instrument, the effective portion of changes in the fair value of the derivative is recognised in OCI and accumulated in the hedging reserve. Any ineffective portion of changes in the fair value of the derivative is recognised immediately in profit or loss.
Where the hedged forecast transaction subsequently results in the recognition of a non-financial item, such as inventory, the amounts recognised as OCI is included in the initial cost of the non-financial item.
If the hedge no longer meets the criteria for hedge accounting or the hedging instrument is sold, expires, is terminated or is exercised, then hedge accounting is discontinued prospectively. When hedge accounting for cash flow hedges is discontinued, the amount that has been accumulated in the hedging reserve remains in equity until, for a hedge of a transaction resulting in recognition of a non-financial item, it is included in the non-financial item’s cost on its initial recognition or, for other cash flow hedges, it is reclassified to profit or loss in the same period or periods as the hedged expected future cash flows affect profit or loss.
NOTES TO THEFINANCIAL STATEMENTS
FINANCIALS & ADDITIONAL INFORMATIONC
apit
aLan
d L
imit
edA
nnua
l Rep
ort
2018
156

2. SUMMARY OF SIGNIFICANT ACCOUNTING POLICIES (continued)
2.8 Financial instruments (continued)
(g) Derivative financial instruments and hedge accounting – Policy applicable from 1 January 2018 (continued)
Fair value hedges
The firm commitment of contracts entered into with various customers denominated in foreign currencies are designated as the hedged item. The Group uses foreign currency forwards to hedge its exposure to foreign currency risk arising from these contracts. Under the Group’s policy, the critical terms of the forward exchange contracts must align with the hedged items. The Group designates the spot component of forward contracts as the hedging instrument. The fair value changes on the hedged item resulting from currency risk are recognised in profit or loss. The fair value changes on the spot of the currency forwards designated as fair value hedges are recognised in profit or loss within the same line item as the fair value changes from the hedged item. The fair value changes on the ineffective portion of currency forwards are recognised in profit or loss and presented separately in “other operating income or expenses”.
Net investment hedge
The Group designates certain derivatives and non-derivative financial liabilities as hedges of foreign exchange risk on a net investment in a foreign operation.
When a derivative instrument or a non-derivative financial liability is designated as the hedging instrument in a hedge of a net investment in a foreign operation, the effective portion of, for a derivative, changes in the fair value of the hedging instrument or, for a non-derivative, foreign exchange gains and losses is recognised in OCI and presented in the translation reserve within equity. Any ineffective portion of the changes in the fair value of the derivative or foreign exchange gains and losses on the non-derivative is recognised immediately in profit or loss. The amount recognised in OCI is reclassified to profit or loss on disposal of the foreign operation.
Separable embedded derivatives
Changes in the fair value of separated embedded derivatives are recognised immediately in the profit or loss.
Other non-trading derivatives
When a derivative financial instrument is not designated in a hedge relationship that qualifies for hedge accounting, all changes in its fair value are recognised immediately in the profit or loss.
Derivative financial instruments and hedge accounting – Policy applicable before 1 January 2018
The policy applied in the comparative information presented for 2017 is similar to that applied for 2018. However, embedded derivatives are not separated from host contracts that are financial assets in the scope of SFRS(I) 9. Instead, the hybrid financial instrument is assessed as a whole for classification of financial assets under SFRS(I) 9.
NOTES TO THEFINANCIAL STATEMENTS
FINANCIALS & ADDITIONAL INFORMATION
Cap
itaL
and
Lim
ited
Ann
ual R
epor
t 20
18
157

2. SUMMARY OF SIGNIFICANT ACCOUNTING POLICIES (continued)
2.8 Financial instruments (continued)
(h) Convertible bonds
Convertible bonds that can be converted into share capital where the number of shares issued does not vary with changes in the fair value of the bonds are accounted for as compound financial instruments. The gross proceeds of the convertible bonds issued (including any directly attributable transaction costs) are allocated to the equity and liability components, with the equity component being assigned the residual amount after deducting the fair value of the liability component from the fair value of the compound financial instrument.
Subsequent to initial recognition, the liability component of convertible bonds is measured at amortised cost using the effective interest method. The equity component of convertible bonds is not re-measured. When the conversion option is exercised, the carrying amount of the liability and equity components will be transferred to the share capital. When the conversion option lapses, the carrying amount of the equity component will be transferred to revenue reserve.
When a convertible bond is being repurchased before its maturity date, the purchase consideration (including directly attributable costs, net of tax effects) is allocated to the liability and equity components of the convertible bond at the date of transaction. Any resulting gain or loss relating to the liability component is recognised in the profit or loss. In an exchange of convertible bond, the difference between the net proceeds of new convertible bond and the carrying value of the existing convertible bond (including its equity component) is recognised in the profit or loss.
(i) Financial guarantees
Financial guarantee contracts are classified as financial liabilities unless the Group has previously asserted explicitly that it regards such contracts as insurance contracts and accounted for them as such.
Financial guarantees classified as financial liabilities
Such financial guarantees are recognised initially at fair value and are classified as financial liabilities. Subsequent to initial measurement, the financial guarantees are stated at the higher of the initial fair value less cumulative amortisation and the amount of loss allowance. When financial guarantees are terminated before their original expiry date, the carrying amount of the financial guarantees is transferred to the profit or loss.
Prior to 1 January 2018, for subsequent measurement, the financial guarantees were measured at the higher of the initial fair value less cumulative amortisation and the amount that would be recognised if they were accounted for as contingent liabilities.
Financial guarantees classified as insurance contracts
These financial guarantees are accounted for as insurance contracts. Provision is recognised based on the Group’s estimates of the ultimate cost of settling all claims incurred but unpaid at the end of the reporting period.
The provision is assessed by reviewing individual claims and tested for adequacy by comparing the amount recognised and the amount that would be required to settle the guarantee contract.
NOTES TO THEFINANCIAL STATEMENTS
FINANCIALS & ADDITIONAL INFORMATIONC
apit
aLan
d L
imit
edA
nnua
l Rep
ort
2018
158

2. SUMMARY OF SIGNIFICANT ACCOUNTING POLICIES (continued)
2.8 Financial instruments (continued)
(j) Impairment of financial assets
Policy applicable from 1 January 2018
The Group assesses on a forward looking basis the expected credit losses (ECL) associated with its financial assets carried at amortised cost and FVOCI, contract assets and financial guarantee contracts. For trade receivables, lease receivables and contract assets, the Group applies the simplified approach permitted by the SFRS(I) 9, which requires expected lifetime losses to be recognised from initial recognition of the receivables. The Group applies the general approach of 12-month ECL at initial recognition for all other financial assets and financial guarantee contracts.
At each reporting date, the Group assesses whether financial assets carried at amortised cost are credit-impaired. A financial asset is ‘credit-impaired’ when one or more events that have a detrimental impact on the estimated future cash flows of the financial asset have occurred.
Evidence that a financial asset is credit-impaired includes the following observable data:
• significant financial difficulty of the borrower or issuer; • a breach of contract such as a default or being more than 90 days past due; • the restructuring of a loan or advance by the Group on terms that the Group would not consider
otherwise; • it is probable that the borrower will enter bankruptcy or other financial reorganisation; or • the disappearance of an active market for a security because of financial difficulties.
Policy applicable before 1 January 2018
A financial asset not carried at fair value through profit or loss, including an interest in an associate and joint venture, is assessed at each reporting period to determine whether there is any objective evidence that it is impaired. A financial asset is impaired if objective evidence indicates that a loss event has been occurred after the initial recognition of the asset, and that the loss event had a negative effect on the estimated future cash flows of that asset that can be estimated reliably.
Objective evidence that financial assets (including equity securities) are impaired can include default or delinquency by a debtor, restructuring of an amount due to the Group on terms that the Group would not consider otherwise, indications that a debtor or issuer will enter bankruptcy, adverse changes in the payment status of borrowers or issuers in the Group, economic conditions that correlate with defaults or the disappearance of an active market for a security.
All individually significant financial assets are assessed for specific impairment on an individual basis. All individually significant financial assets found not to be specifically impaired are then collectively assessed for any impairment that has incurred but not yet identified. The remaining financial assets that are not individually significant are collectively assessed for impairment by grouping together such instruments with similar risk characteristics.
In assessing collective impairment, the Group uses historical trends of the probability of default, timing of recoveries and the amount of loss incurred, adjusted for management’s judgement as to whether current economic and credit conditions are such that the actual losses are likely to be greater or lesser than that suggested by historical trends.
An impairment loss in respect of a financial asset measured at amortised cost is calculated as the difference between its carrying amount, and the present value of the estimated future cash flows discounted at the original effective interest rate. Losses are recognised in the profit or loss and reflected as an allowance account against receivables. When the Group considers that there are no realistic prospects of recovery of the asset, the relevant amounts are written off. When a subsequent event causes the amount of impairment loss to decrease, the decrease in impairment loss is reversed through profit or loss.
NOTES TO THEFINANCIAL STATEMENTS
FINANCIALS & ADDITIONAL INFORMATION
Cap
itaL
and
Lim
ited
Ann
ual R
epor
t 20
18
159

2. SUMMARY OF SIGNIFICANT ACCOUNTING POLICIES (continued)
2.8 Financial instruments (continued)
(j) Impairment of financial assets (continued)
Impairment losses on available-for-sale financial assets are recognised by reclassifying the losses accumulated in the available-for-sale reserve in equity to profit or loss. The cumulative loss that is reclassified from equity to profit or loss is the difference between the acquisition cost, net of any principal repayment and amortisation, and the current fair value, less any impairment loss recognised previously in the profit or loss. Changes in impairment provision attributable to application of the effective interest method are reflected as a component of interest income.
If, in a subsequent period, the fair value of an impaired available-for-sale debt security increases and the increase can be related objectively to an event occurring after the impairment loss was recognised in the profit or loss, then the impairment loss is reversed, with the amount of the reversal recognised in the profit or loss. However, any subsequent recovery in the fair value of an impaired available-for-sale equity security is recognised in other comprehensive income.
2.9 Share capital
Ordinary shares are classified as equity.
Incremental costs directly attributable to the issue of ordinary shares and options are recognised as a deduction from equity.
Where share capital recognised as equity is repurchased, the amount of the consideration paid, including directly attributable costs, is recognised as a deduction from equity. Repurchased shares are classified as treasury shares and are presented in reserve for own shares account. Where treasury shares are subsequently reissued, sold or cancelled, the consideration received is recognised as an increase in equity, and the resulting surplus or deficit on the transaction is presented in non-distributable capital reserve.
2.10 Development properties for sale and stocks
Development properties are measured at the lower of cost and net realisable value. Net realisable value represents the estimated selling price less costs to be incurred in selling the property. The write-down to net realisable value is presented as allowance for foreseeable losses.
The cost of development properties comprises specifically identified costs, including acquisition costs, development expenditure, borrowing costs and other related expenditure.
When the development properties for sale are being transferred to investment property, any difference between the fair value of the property and its previous carrying amount at the date of transfer is recognised in profit or loss.
2.11 Impairment of non-financial assets
The carrying amounts of the Group’s non-financial assets, other than investment properties, development properties for sale and stocks and deferred tax assets, are reviewed at each reporting date to determine whether there is any indication of impairment. If any such indication exists, the assets’ recoverable amounts are estimated. For goodwill, the recoverable amount is estimated at each reporting date, and as and when indicators of impairment are identified, an impairment loss is recognised if the carrying amount of an asset or its related cash-generating unit (CGU) exceeds its estimated recoverable amount.
NOTES TO THEFINANCIAL STATEMENTS
FINANCIALS & ADDITIONAL INFORMATIONC
apit
aLan
d L
imit
edA
nnua
l Rep
ort
2018
160

2. SUMMARY OF SIGNIFICANT ACCOUNTING POLICIES (continued)
2.11 Impairment of non-financial assets (continued)
The recoverable amount of an asset or CGU is the greater of its value in use and its fair value less costs to sell. In assessing value in use, the estimated future cash flows are discounted to their present value using a pre-tax discount rate that reflects current market assessments of the time value of money and the risks specific to the asset or CGU. For the purpose of impairment testing, assets that cannot be tested individually are grouped together into the smallest group of assets that generate cash inflows from continuing use that are largely independent of the cash inflows of other assets or CGU. Subject to an operating segment ceiling test, for the purposes of goodwill impairment testing, CGUs to which goodwill has been allocated are aggregated so that the level at which impairment is tested reflects the lowest level at which goodwill is monitored for internal reporting purposes. Goodwill acquired in a business combination is allocated to groups of CGU that are expected to benefit from the synergies of the combination.
Impairment losses are recognised in profit or loss. Impairment losses recognised in respect of CGUs are allocated first to reduce the carrying amount of any goodwill allocated to the units and then to reduce the carrying amounts of the other assets in the CGU on a pro-rata basis.
An impairment loss in respect of goodwill is not reversed. In respect of other assets, impairment losses recognised in prior periods are assessed at each reporting date for any indication that the loss has decreased or no longer exists. An impairment loss is reversed if there has been a change in the estimates used to determine the recoverable amount. An impairment loss is reversed only to the extent that the asset’s carrying amount does not exceed the carrying amount that would have been determined, net of depreciation or amortisation, if no impairment loss had been recognised.
Goodwill that forms part of the carrying amount of an investment in an associate or a joint venture is not recognised separately, and therefore is not tested for impairment separately. Instead, the entire amount of the investment in an associate or a joint venture is tested for impairment as a single asset when there is objective evidence that the investment in an associate or a joint venture may be impaired.
2.12 Employee benefits
All short term employee benefits, including accumulated compensated absences, are measured on an undiscounted basis and are recognised in the period in which the employees render their services.
The Group’s obligation in respect of long-term employee benefits is the amount of future benefit that employees have earned in return for their service in the current and prior periods. That benefit is discounted to determine its present value.
A provision is recognised for the amount expected to be paid under cash bonus or profit-sharing plans if the Group has a present legal or constructive obligation to pay this amount as a result of past service provided by the employee and the obligation can be estimated reliably.
Defined contribution plans
Contributions to post-employment benefits under defined contribution plans are recognised as an expense in profit or loss in the period during which the related services are rendered by employees.
NOTES TO THEFINANCIAL STATEMENTS
FINANCIALS & ADDITIONAL INFORMATION
Cap
itaL
and
Lim
ited
Ann
ual R
epor
t 20
18
161

2. SUMMARY OF SIGNIFICANT ACCOUNTING POLICIES (continued)
2.12 Employee benefits (continued)
Share-based payments
For equity-settled share-based payment transactions, the fair value of the services received is recognised as an expense with a corresponding increase in equity over the vesting period during which the employees become unconditionally entitled to the equity instrument. The fair value of the services received is determined by reference to the fair value of the equity instrument granted at the grant date. At each reporting date, the number of equity instruments that are expected to be vested are estimated. The impact on the revision of original estimates is recognised as an expense and as a corresponding adjustment to equity over the remaining vesting period, unless the revision to original estimates is due to market conditions. No adjustment is made if the revision or actual outcome differs from the original estimate due to market conditions.
For cash-settled share-based payment transactions, the fair value of the goods or services received is recognised as an expense with a corresponding increase in liability. The fair value of the services received is determined by reference to the fair value of the liability. Until the liability is settled, the fair value of the liability is re-measured at each reporting date and at the date of settlement, with any changes in fair value recognised in profit or loss for the period.
2.13 Provision
A provision is recognised if, as a result of a past event, the Group has a present legal or constructive obligation that can be estimated reliably, and it is probable that an outflow of economic benefits will be required to settle the obligation.
A provision for onerous contract is recognised when the expected benefits to be derived by the Group from a contract are lower than the unavoidable cost of meeting its obligations under the contract. The provision is measured at the present value of the lower of the expected cost of terminating the contract and the expected net cost of continuing with the contract. Before a provision is established, the Group recognises any impairment loss on the assets associated with the contract.
2.14 Leases
At inception, an arrangement that contains a lease is accounted for as such based on the terms and conditions even though the arrangement is not in the legal form of a lease.
When entities within the Group are lessees of a finance lease
Leased assets in which the Group assumes substantially all the risks and rewards of ownership are classified as finance leases. Upon initial recognition, property, plant and equipment acquired through finance leases are capitalised at the lower of their fair value and the present value of the minimum lease payments. Subsequent to initial recognition, the asset is accounted for in accordance with the accounting policy applicable to that asset. Leased assets are depreciated over the shorter of the lease term and their useful lives. Lease payments are apportioned between finance expense and reduction of the lease liability. The finance expense is allocated to each period during the lease term so as to produce a constant periodic rate of interest over the remaining balance of the liability. Contingent lease payments are accounted for by revising the minimum lease payments over the remaining term of the lease when the lease adjustment is confirmed.
When entities within the Group are lessees of an operating lease
Where the Group has the use of assets under operating leases, payments made under the leases are recognised in profit or loss on a straight-line basis over the term of the lease. Lease incentives received are recognised as an integral part of the total lease payments made. Contingent rentals are charged to the profit or loss in the accounting period in which they are incurred.
NOTES TO THEFINANCIAL STATEMENTS
FINANCIALS & ADDITIONAL INFORMATIONC
apit
aLan
d L
imit
edA
nnua
l Rep
ort
2018
162
2. SUMMARY OF SIGNIFICANT ACCOUNTING POLICIES (continued)
2.14 Leases (continued)
When entities within the Group are lessors of an operating lease
Assets subject to operating leases are included in either property, plant and equipment (note 2.4) or investment properties (note 2.6).
2.15 Revenue recognition
Rental income
Rental income receivable under operating leases is recognised on a straight-line basis over the term of the lease, except where an alternative basis is more representative of the pattern of benefits to be derived from the leased asset. Lease incentives granted are recognised as an integral part of the total rental income to be received. Contingent rentals are recognised as income in the accounting period in which they are earned.
Development properties for sale
The Group develops and sells residential projects to customers through fixed-price contracts. Revenue is recognised when the control over the residential project has been transferred to the customer. At contract inception, the Group assesses whether the Group transfers control of the residential project over time or at a point in time by determining if (a) its performance does not create an asset with an alternative use to the Group; and (b) the Group has an enforceable right to payment for performance completed to date.
The residential projects have no alternative use for the Group due to contractual restriction, and the Group has enforceable rights to payment arising from the contractual terms. For these contracts, revenue is recognised over time by reference to the Group’s progress towards completing the construction of the residential project. The measure of progress is determined based on the proportion of contract costs incurred to date to the estimated total contract costs. Costs incurred that are not related to the contract or that do not contribute towards satisfying a performance obligation are excluded from the measure of progress and instead are expensed as incurred.
For certain contracts where the Group does not have enforceable right to payment, revenue is recognised only when the completed residential project is delivered to the customers and the customers have accepted it in accordance with the sales contract.
Under certain payment schemes, the time when payments are made by the buyer and the transfer of control of the property to the buyer do not coincide and where the difference between the timing of receipt of the payments and the satisfaction of a performance obligation is 12 months or more, the entity adjusts the transaction price with its customer and recognises a financing component. In adjusting for the financing component, the entity uses a discount rate that would reflect that of a separate financing transaction between the entity and its customer at contract inception. A finance income or finance expense will be recognised depending on the arrangement. The Group has elected to apply the practical expedient not to adjust the transaction price for the existence of significant financing component when the period between the transfer of control of good or service to a customer and the payment date is 12 months or less.
Revenue is measured at the transaction price agreed under the contract. Estimates of revenues, costs or extent of progress toward completion are revised if circumstances change. Any resulting increases or decreases in estimated revenues or costs are reflected in the profit or loss in the period in which the circumstances that give rise to the revision become known by management.
The customer is invoiced on a payment schedule and are typically triggered upon achievement of specified construction milestones. If the value of the goods transferred by the Group exceed the payments, a contract asset is recognised. If the payments exceed the value of the goods transferred, a contract liability is recognised.
NOTES TO THEFINANCIAL STATEMENTS
FINANCIALS & ADDITIONAL INFORMATION
Cap
itaL
and
Lim
ited
Ann
ual R
epor
t 20
18
163

2. SUMMARY OF SIGNIFICANT ACCOUNTING POLICIES (continued)
2.15 Revenue recognition (continued)
Development properties for sale (continued)
For costs incurred in fulfilling the contract, Group will capitalise these as contract costs assets only if (a) these cost relate directly to a contract or an anticipated contract which the Group can specifically identify; (b) these cost generate or enhance resources of the Group that will be used in satisfying (or in continuing to satisfy) performance obligations in the future; and (c) these costs are expected to be recovered. Otherwise, such costs are recognised as an expense immediately.
Capitalised contract costs are subsequently amortised on a systematic basis as the Group recognises the related revenue over time. An impairment loss is recognised in the profit or loss to the extent that the carrying amount of capitalised contract costs exceeds the expected remaining consideration less any directly related costs not yet recognised as expenses.
Financial advisory and management fee
Financial advisory and management fee is recognised as and when the service is rendered.
Dividends
Dividend income is recognised on the date that the Group’s right to receive payment is established.
Interest income
Interest income is recognised as it accrues, using the effective interest rate method.
2.16 Finance costs
Borrowing costs are recognised in the profit or loss using the effective interest rate method, except to the extent that they are capitalised as being directly attributable to the acquisition, construction or production of an asset which necessarily takes a substantial period of time to be prepared for its intended use or sale.
2.17 Tax
Income tax expense comprises current and deferred tax expense, as well as land appreciation tax in China. Income tax expense is recognised in the profit or loss except to the extent that it relates to a business combination, or items recognised directly in equity or in other comprehensive income.
Current tax is the expected tax payable or receivable on the taxable income or loss for the year, using tax rates enacted or substantively enacted at the reporting date, and any adjustment to tax payable in respect of previous years. The amount of current tax payable or receivable is the best estimate of the tax amount expected to be paid or received that reflects uncertainty related to income taxes, if any.
Deferred tax is recognised in respect of temporary differences between the carrying amounts of assets and liabilities for financial reporting purposes and the amounts used for taxation purposes. Deferred tax is not recognised for:
• temporary differences on the initial recognition of assets or liabilities in a transaction that is not a business combination and that affects neither accounting nor taxable profit or loss;
• temporary differences related to investments in subsidiaries, associates and joint ventures to the extent that the Group is able to control the timing of the reversal of the temporary difference and it is probable that they will not reverse in the foreseeable future; and
• taxable temporary differences arising on the initial recognition of goodwill.
NOTES TO THEFINANCIAL STATEMENTS
FINANCIALS & ADDITIONAL INFORMATIONC
apit
aLan
d L
imit
edA
nnua
l Rep
ort
2018
164

2. SUMMARY OF SIGNIFICANT ACCOUNTING POLICIES (continued)
2.17 Tax (continued)
The measurement of deferred taxes reflects the tax consequences that would follow the manner in which the Group expects, at the end of the reporting period, to recover or settle the carrying amount of its assets and liabilities. Deferred tax is measured at the tax rates that are expected to be applied to temporary differences when they reverse, based on the laws that have been enacted or substantively enacted by the reporting date.
Deferred tax assets and liabilities are offset if there is a legally enforceable right to offset current tax liabilities and assets, and they relate to income taxes levied by the same tax authority on the same taxable entity, or on different tax entities, but they intend to settle current tax liabilities and assets on a net basis or their tax assets and liabilities will be realised simultaneously.
A deferred tax asset is recognised to the extent that it is probable that future taxable profits will be available against which temporary differences can be utilised. Deferred tax assets are reviewed at each reporting date and are reduced to the extent that it is no longer probable that the related tax benefit will be realised.
In determining the amount of current and deferred tax, the Group takes into account the impact of uncertain tax positions and whether additional taxes and interest may be due. The Group believes that its accruals for tax liabilities are adequate for all open tax years based on its assessment of many factors, including interpretations of tax law and prior experience. This assessment relies on estimates and assumptions and may involve a series of judgements about future events. New information may become available that causes the Group to change its judgement regarding the adequacy of existing tax liabilities; such changes to tax liabilities will impact tax expense in the period that such a determination is made.
Land appreciation tax in China relates to the gains arising from the transfer of land use right and the buildings that are constructed on the land. Land appreciation tax is levied from 30% to 60% on gain on sale of landed properties with reference to the percentage of appreciated value over the deductible amount.
2.18 Earnings per share
The Group presents basic and diluted earnings per share (EPS) data for its ordinary shares. Basic EPS is calculated by dividing the profit or loss attributable to owners of the Company by the weighted average number of ordinary shares outstanding during the period, adjusted for own shares held. Diluted EPS is determined by adjusting the profit or loss attributable to owners of the Company and the weighted average number of ordinary shares outstanding, adjusted for own shares held, for the effects of all dilutive potential ordinary shares, which comprise issued convertible bonds and share plans granted to employees.
2.19 Operating segments
An operating segment is a component of the Group that engages in business activities from which it may earn revenues and incur expenses, including revenues and expenses that relate to transactions with any of the Group’s other components. Operating segments are reported in a manner consistent with the internal reporting provided to the chief operating decision-maker. The chief operating decision-maker has been identified as the CapitaLand Management Council that makes strategic resource allocation decisions. The Council comprises the President & Group Chief Executive Officer (CEO), all CEOs of business units and key management officers of the Corporate Office.
NOTES TO THEFINANCIAL STATEMENTS
FINANCIALS & ADDITIONAL INFORMATION
Cap
itaL
and
Lim
ited
Ann
ual R
epor
t 20
18
165

2. SUMMARY OF SIGNIFICANT ACCOUNTING POLICIES (continued)
2.20 Discontinued operation
A discontinued operation is a component of the Group’s business, the operations and cash flows of which can be clearly distinguished from the rest of the Group and which:
• represents a separate major line of business or geographical area of operations;• is part of a single co-ordinated plan to dispose of a separate major line of business or geographical area
of operations; or• is a subsidiary acquired exclusively with a view to resale.
Classification as a discontinued operation occurs upon disposal or when the operation meets the criteria to be classified as held for sale, if earlier. When an operation is classified as a discontinued operation, the comparative statement of profit or loss is re-presented as if operation had been discontinued from the start of the comparative year.
3. PROPERTY, PLANT AND EQUIPMENT
Serviced residence properties
Leasehold land and buildings
Plant, machinery
and improvements
Motor vehicles
Furniture, fittings and equipment
Assets under
construction Total$’000 $’000 $’000 $’000 $’000 $’000 $’000
The Group
CostAt 1 January 2018 339,411 322,666 52,420 12,353 473,290 26,296 1,226,436
Translation differences (6,780) (4,572) (4,554) (239) (2,676) (116) (18,937)
Additions 1,582 1,173 8,354 512 29,213 25,228 66,062
Acquisition of subsidiaries – – 905 49 639 – 1,593
Disposal of subsidiaries – – – – (490) – (490)
Disposals/Written off (453) – (2,496) (448) (17,951) (191) (21,539)
Reclassification to other categories of assets (53,624) (598) (4,330) – (4,122) (23,747) (86,421)
Reclassifications – 3,816 2,848 13 (529) (6,148) –
At 31 December 2018 280,136 322,485 53,147 12,240 477,374 21,322 1,166,704
NOTES TO THEFINANCIAL STATEMENTS
FINANCIALS & ADDITIONAL INFORMATIONC
apit
aLan
d L
imit
edA
nnua
l Rep
ort
2018
166

3. PROPERTY, PLANT AND EQUIPMENT (continued)
Note
Serviced residence properties
Leasehold land and buildings
Plant, machinery
and improvements
Motor vehicles
Furniture, fittings and equipment
Assets under
construction Total$’000 $’000 $’000 $’000 $’000 $’000 $’000
The Group
Accumulated depreciation and impairment loss
At 1 January 2018 5,672 37,894 33,732 10,405 298,712 – 386,415
Translation differences (69) (92) (789) (250) (6,756) – (7,956)
Depreciation for the year 27(c)(ii) 1,281 7,711 7,427 822 46,097 – 63,338
Disposal of subsidiaries – – – – (397) – (397)
Disposals/Written off (28) – (2,831) (444) (17,040) – (20,343)
Reclassification to other categories of assets (2,171) (531) (1) – (4,305) – (7,008)
Reclassifications – – (7) – 7 – –
At 31 December 2018 4,685 44,982 37,531 10,533 316,318 – 414,049
Carrying amountsAt 1 January 2018 333,739 284,772 18,688 1,948 174,578 26,296 840,021
At 31 December 2018 275,451 277,503 15,616 1,707 161,056 21,322 752,655
NOTES TO THEFINANCIAL STATEMENTS
FINANCIALS & ADDITIONAL INFORMATION
Cap
itaL
and
Lim
ited
Ann
ual R
epor
t 20
18
167

3. PROPERTY, PLANT AND EQUIPMENT (continued)
Serviced residence properties
Leasehold land and buildings
Plant, machinery
and improvements
Motor vehicles
Furniture, fittings and equipment
Assets under
construction Total$’000 $’000 $’000 $’000 $’000 $’000 $’000
The Group
CostAt 1 January 2017 284,035 302,394 66,524 3,018 461,895 37,036 1,154,902
Translation differences 1,891 1,238 1,708 (53) 2,736 130 7,650
Additions 53,485 14,964 11,314 684 41,992 28,336 150,775
Acquisition of subsidiaries – – 1,130 61 13,233 – 14,424
Disposal of subsidiaries – – (228) – (53) – (281)
Disposals/Written off – (502) (8,729) (1,308) (32,614) (70) (43,223)
Reclassification to other categories of assets – – (4,331) (38) (28,722) (24,720) (57,811)
Reclassifications – 4,572 (14,968) 9,989 14,823 (14,416) –
At 31 December 2017 339,411 322,666 52,420 12,353 473,290 26,296 1,226,436
NOTES TO THEFINANCIAL STATEMENTS
FINANCIALS & ADDITIONAL INFORMATIONC
apit
aLan
d L
imit
edA
nnua
l Rep
ort
2018
168

3. PROPERTY, PLANT AND EQUIPMENT (continued)
Note
Serviced residence properties
Leasehold land and buildings
Plant, machinery
and improvements
Motor vehicles
Furniture, fittings and equipment
Assets under
construction Total$’000 $’000 $’000 $’000 $’000 $’000 $’000
The Group
Accumulated depreciation and impairment loss
At 1 January 2017 4,787 30,400 42,411 2,166 293,707 – 373,471
Translation differences 8 55 853 (20) 4,928 – 5,824
Depreciation for the year 27(c)(ii) 877 7,506 8,128 1,004 51,755 – 69,270
Disposal of subsidiaries – – (228) – (39) – (267)
Disposals/Written off – (344) (2,916) (1,069) (30,640) – (34,969)
Reclassification to other categories of assets – – (3,925) (38) (22,951) – (26,914)
Reclassifications – 277 (10,591) 8,362 1,952 – –
At 31 December 2017 5,672 37,894 33,732 10,405 298,712 – 386,415
Carrying amountsAt 1 January 2017 279,248 271,994 24,113 852 168,188 37,036 781,431
At 31 December 2017 333,739 284,772 18,688 1,948 174,578 26,296 840,021
NOTES TO THEFINANCIAL STATEMENTS
FINANCIALS & ADDITIONAL INFORMATION
Cap
itaL
and
Lim
ited
Ann
ual R
epor
t 20
18
169

3. PROPERTY, PLANT AND EQUIPMENT (continued)
(a) The classification of serviced residence properties as property, plant and equipment or investment properties is based on the level of ancillary services, length of stay, amongst other factors. During the year, the Group evaluated and reclassified one serviced residence property to investment properties.
(b) As at 31 December 2018, certain property, plant and equipment with carrying value totalling approximately $158.6 million (2017: $337.0 million; 1 January 2017: $280.0 million) were mortgaged to banks to secure credit facilities for the Group (note 19).
(c) For serviced residence properties where the residual value at the end of the intended holding period is lower than the carrying amount, the difference in value is depreciated over the Group’s intended holding period. No depreciation is recognised where the residual value is higher than the carrying amount.
Residual values of serviced residence properties at the end of the intended holding period are determined based on annual independent professional valuations using discounted cashflow method. The fair value measurement is categorised as Level 3 on the fair value hierarchy. Residual value is the estimated amount that the Group would obtain from the disposal of a property if the property is already of the age and in the condition expected at the date when the Group has the intention to dispose that property. The key assumptions used to determine the residual values of serviced residence properties include market corroborated capitalisation rate, terminal yield rate, discount rate and revenue per available unit (RevPau). In relying on valuation reports, management is satisfied that the valuation methods and estimates are reflective of current market conditions.
Details of valuation techniques and significant unobservable inputs are set out in the table below.
TypeValuation method
Key unobservable inputs
Inter-relationship between key unobservable inputs and fair value measurement
Serviced residence property located in United Kingdom
Discounted cashflow approach
- Discount rate: 2018: 6.5% (2017: 6.5% to 8.0%; 1 Jan 2017: 6.5%)
- Terminal yield rate: 2018: 4.5% (2017: 4.5% to 6.0%; 1 Jan 2017: 4.5%)
- RevPau: 2018: $314 (2017: $324 to $349; 1 Jan 2017: $330)
Occupancy rate: 2018: 81.0% (2017: 82.2% to 96.0%; 1 Jan 2017: 84.0%)
The estimated fair value varies inversely against the discount rate and terminal yield rate and increases with higher RevPau and higher occupancy rates.
NOTES TO THEFINANCIAL STATEMENTS
FINANCIALS & ADDITIONAL INFORMATIONC
apit
aLan
d L
imit
edA
nnua
l Rep
ort
2018
170

3. PROPERTY, PLANT AND EQUIPMENT (continued)
Note
Renovations and
improvements
Furniture, fittings and equipment
Motor vehicles
Assets under
construction Total
$’000 $’000 $’000 $’000 $’000
The Company
CostAt 1 January 2018 2,358 22,731 354 14,499 39,942Additions 36 336 – – 372Disposals/Written off (a) (345) (13,485) (352) (14,499) (28,681)At 31 December 2018 2,049 9,582 2 – 11,633
Accumulated depreciation and impairment loss
At 1 January 2018 2,204 18,340 354 – 20,898Depreciation for the year 27(c)(ii) 115 833 – – 948Disposals/Written off (338) (12,565) (352) – (13,255)At 31 December 2018 1,981 6,608 2 – 8,591
Carrying amountsAt 1 January 2018 154 4,391 – 14,499 19,044At 31 December 2018 68 2,974 – – 3,042
CostAt 1 January 2017 2,374 45,892 354 17,863 66,483Additions – 627 – 21,880 22,507Disposals/Written off – (352) – (5,048) (5,400)Reclassification to other
categories of assets (16) (23,436) – (20,196) (43,648)At 31 December 2017 2,358 22,731 354 14,499 39,942
Accumulated depreciation and impairment loss
At 1 January 2017 1,691 35,314 332 – 37,337Depreciation for the year 27(c)(ii) 513 2,686 22 – 3,221Disposals/Written off – (346) – – (346)Reclassification to other
categories of assets – (19,314) – – (19,314)At 31 December 2017 2,204 18,340 354 – 20,898
Carrying amountsAt 1 January 2017 683 10,578 22 17,863 29,146At 31 December 2017 154 4,391 – 14,499 19,044
(a) During 2018, the Company disposed IT equipment and software under development at their carrying amount to a subsidiary.
NOTES TO THEFINANCIAL STATEMENTS
FINANCIALS & ADDITIONAL INFORMATION
Cap
itaL
and
Lim
ited
Ann
ual R
epor
t 20
18
171

4. INTANGIBLE ASSETS
Note Goodwill Others^ Total$’000 $’000 $’000
The Group
CostAt 1 January 2018 598,131 105,942 704,073Additions – 25,394 25,394Acquisition of subsidiaries 31(b) 19,086 27,756 46,842Reclassification from other categories of assets – 14,611 14,611Disposals/Written off (4,385) (441) (4,826)Translation differences (76) 117 41At 31 December 2018 612,756 173,379 786,135
Accumulated amortisation and impairment lossAt 1 January 2018 78,542 62,236 140,778Amortisation for the year 27(c)(ii) – 11,165 11,165Acquisition of subsidiaries 31(b) – 84 84Reclassification from other categories of assets – 13 13Disposals/Written off – (72) (72)Translation differences (410) (138) (548)At 31 December 2018 78,132 73,288 151,420
Carrying amountsAt 1 January 2018 519,589 43,706 563,295At 31 December 2018 534,624 100,091 634,715
CostAt 1 January 2017 510,726 42,633 553,359Additions – 727 727Acquisition of subsidiaries 31(b) 87,638 15,806 103,444Reclassification from other categories of assets – 46,759 46,759Disposals – (90) (90)Translation differences (233) 107 (126)At 31 December 2017 598,131 105,942 704,073
Accumulated amortisation and impairment lossAt 1 January 2017 78,878 32,646 111,524Amortisation for the year 27(c)(ii) – 7,022 7,022Impairment for the year 27(c)(iii) – 3,226 3,226Reclassification from other categories of assets – 19,344 19,344Disposals – (64) (64)Translation differences (336) 62 (274)At 31 December 2017 78,542 62,236 140,778
Carrying amountsAt 1 January 2017 431,848 9,987 441,835At 31 December 2017 519,589 43,706 563,295
^ Others comprise trademarks, software and licences and club memberships.
NOTES TO THEFINANCIAL STATEMENTS
FINANCIALS & ADDITIONAL INFORMATIONC
apit
aLan
d L
imit
edA
nnua
l Rep
ort
2018
172

4. INTANGIBLE ASSETS (continued)
Note SoftwareClub
memberships Total$’000 $’000 $’000
The Company
CostAt 1 January 2018 43,648 147 43,795Additions 13 – 13Disposals (a) (43,296) – (43,296)At 31 December 2018 365 147 512
Accumulated amortisation At 1 January 2018 23,480 – 23,480Amortisation for the year 27(c)(ii) 72 – 72Disposals (23,445) – (23,445)At 31 December 2018 107 – 107
Carrying amountsAt 1 January 2018 20,168 147 20,315At 31 December 2018 258 147 405
CostAt 1 January 2017 – 147 147Reclassification from property, plant and equipment 43,648 – 43,648At 31 December 2017 43,648 147 43,795
Accumulated amortisation At 1 January 2017 – – –Amortisation for the year 27(c)(ii) 4,165 – 4,165Reclassification from property, plant and equipment 19,315 – 19,315At 31 December 2017 23,480 – 23,480
Carrying amountsAt 1 January 2017 – 147 147At 31 December 2017 20,168 147 20,315
(a) During 2018, the Company disposed software at their carrying amount to a subsidiary.
NOTES TO THEFINANCIAL STATEMENTS
FINANCIALS & ADDITIONAL INFORMATION
Cap
itaL
and
Lim
ited
Ann
ual R
epor
t 20
18
173

4. INTANGIBLE ASSETS (continued)
Impairment test for goodwill
The key assumptions used in the estimation of the recoverable amount are set below:
<---------- Key assumptions --------->Terminal
growth rates Discount rates Carrying value2018 2017 2018 2017 2018 2017
% % % % $’000 $’000
The Ascott Limited (Ascott) 1.4 1.5 5.5 5.9 416,706 416,706A serviced residence in
London 2.0 2.0 6.5 6.5 14,906 15,245Synergy Global Housing 4.0 5.5 8.6 8.6 27,493 31,308TAUZIA Hotel Management
(TAUZIA) 6.0 – 14.3 – 19,189 –CapitaLand Mall Trust 56,330 56,330At 31 December 534,624 519,589
Ascott, a serviced residence in London, Synergy Global Housing and TAUZIA
The recoverable amounts of the CGUs are determined based on value in use calculations. The value in use calculation is a discounted cash flow model using cash flow projections based on the most recent forecasts approved by management covering three to five years. Cash flows beyond these periods are extrapolated using the estimated terminal growth rates stated in the table above. The discount rates applied are the weighted average cost of capital from the relevant business segments. The key assumptions are those relating to expected changes in average rental and occupancy rates and direct costs. The terminal growth rates used for each CGU are within management’s expectation of the long term average growth rates of the respective industry and countries in which the CGUs operate.
CapitaLand Mall Trust
The recoverable amount of the CGU is determined based on the higher of its value in use and its quoted market price. As at 31 December 2018, the recoverable amount based on quoted market price is higher than its carrying amount.
NOTES TO THEFINANCIAL STATEMENTS
FINANCIALS & ADDITIONAL INFORMATIONC
apit
aLan
d L
imit
edA
nnua
l Rep
ort
2018
174

5. INVESTMENT PROPERTIES
The Group
Note 2018 20171 Jan 2017
$’000 $’000 $’000
At 1 January 36,479,434 18,998,389 19,427,532Acquisition of subsidiaries 31(b) 1,409,988 17,565,394 54,446Disposal of subsidiaries 31(d) (78,650) (235,804) (966,635)Additions 2,093,188 2,174,208 726,653Disposals (648,262) (1,787,933) (79,318)Reclassification to assets held for sale 15 (254,080) (438,368) –Reclassifications from/(to) development properties for sale 19,775 49,078 (95,263)Reclassification from property, plant and equipment 58,619 – –Changes in fair value 677,018 234,978 290,707Translation differences (311,070) (80,508) (359,733)At 31 December 39,445,960 36,479,434 18,998,389
(a) Investment properties, which include those in the course of development, are stated at fair value based on independent professional valuations or internal valuations. The fair values are based on open market values, being the estimated amount for which a property could be exchanged on the date of the valuation between a willing buyer and a willing seller in an arm’s length transaction wherein the parties had each acted knowledgeably and without compulsion. In determining the fair value, the valuers have used valuation techniques which involve certain estimates. The key assumptions used to determine the fair value of investment properties include market-corroborated capitalisation rate, terminal yield rate, discount rate, comparable market price and occupancy rate. In relying on the valuation reports, management has exercised its judgement and is satisfied that the valuation methods and estimates are reflective of current market conditions.
The valuers have considered valuation techniques including the direct comparison method, capitalisation approach, discounted cash flows and residual method in arriving at the open market value as at the balance sheet date. The direct comparison method involves the analysis of comparable sales of similar properties and adjusting the sale prices to that reflective of the investment properties. The capitalisation approach capitalises an income stream into a present value using revenue multipliers or single-year capitalisation rates. The discounted cash flow method involves the estimation and projection of an income stream over a period and discounting the income stream with an internal rate of return to arrive at the market value. In the residual method of valuation, the total gross development costs and developer’s profit are deducted from the gross development value to arrive at the residual value of land. The gross development value is the estimated value of the property assuming satisfactory completion of the development as at the date of valuation. Details of valuation methods and key assumptions used to estimate the fair values of investment properties are set out in note 34.
NOTES TO THEFINANCIAL STATEMENTS
FINANCIALS & ADDITIONAL INFORMATION
Cap
itaL
and
Lim
ited
Ann
ual R
epor
t 20
18
175

5. INVESTMENT PROPERTIES (continued)
(b) The Group’s investment properties which are classified under Level 3 are analysed as below:
Shopping malls Commercial
Integrated developments
Serviced residences Total
$’000 $’000 $’000 $’000 $’000
The Group
31 December 2018Singapore 9,673,000 3,141,300 8,968,000 739,195 22,521,495China (includes Hong Kong) 4,292,108 575,652 1,529,794 1,389,301 7,786,855Others* 2,148,940 1,493,352 312,547 5,182,771 9,137,610
16,114,048 5,210,304 10,810,341 7,311,267 39,445,960
31 December 2017Singapore 9,538,000 3,581,969 8,539,857 950,156 22,609,982China (includes Hong Kong) 3,134,608 37,821 1,920,077 1,499,798 6,592,304Others* 2,080,936 941,143 235,587 4,019,482 7,277,148
14,753,544 4,560,933 10,695,521 6,469,436 36,479,434
1 January 2017Singapore 1,340,000 4,739,387 1,744,000 958,002 8,781,389China (includes Hong Kong) 1,018,175 52,685 1,531,000 1,580,214 4,182,074Others* 1,962,990 16,556 188,000 3,867,380 6,034,926
4,321,165 4,808,628 3,463,000 6,405,596 18,998,389
* Others include countries in Asia (excluding Singapore, China and Hong Kong), Europe, United States of America and Australia.
(c) As at 31 December 2018, investment properties valued at $2,123.1 million (2017: $1,693.8 million; 1 January 2017: $1,075.5 million) were under development.
(d) As at 31 December 2018, certain investment properties with carrying value of approximately $12,793.4 million (2017: $10,088.9 million; 1 January 2017: $10,196.3 million) were mortgaged to banks to secure credit facilities (notes 19 and 20) and under finance lease arrangements for the Group.
(e) During the financial year ended 31 December 2018, interest capitalised as cost of investment properties amounted to approximately $36.4 million (2017: $29.0 million; 1 January 2017: $21.0 million) (note 27(d)).
(f) Investment properties of the Group are held mainly for use by tenants under operating leases. Minimum lease payments receivable under non-cancellable operating leases of investment properties and not recognised in the financial statements are as follows:
The Group
2018 20171 Jan 2017
$’000 $’000 $’000
Lease rentals receivable: Not later than 1 year 1,744,784 1,601,121 616,212 Between 1 and 5 years 2,738,364 2,452,180 993,188
After 5 years 1,159,125 1,259,362 98,5375,642,273 5,312,663 1,707,937
NOTES TO THEFINANCIAL STATEMENTS
FINANCIALS & ADDITIONAL INFORMATIONC
apit
aLan
d L
imit
edA
nnua
l Rep
ort
2018
176

5. INVESTMENT PROPERTIES (continued)
(g) Contingent rents, representing income based on sales turnover achieved by tenants, amounted to $84.0 million for the year (2017: $78.7 million; 1 January 2017: $16.7 million).
6. SUBSIDIARIES
The Company
Note 2018 20171 Jan 2017
$’000 $’000 $’000
(a) Unquoted shares, at cost 6,393,908 6,383,008 6,391,796Less:Allowance for impairment loss (151,105) (169,118) (179,118)
6,242,803 6,213,890 6,212,678Add:Amounts due from subsidiaries, at amortised cost:Loan accounts (unsecured)- interest bearing 1,499,250 1,871,750 2,100,000- interest free 4,401,860 4,197,601 4,213,419Less:Allowance for impairment loss on receivables 33 (83,602) (74,974) (279,514)
5,817,508 5,994,377 6,033,90512,060,311 12,208,267 12,246,583
(i) These loans are unsecured and not expected to be repaid within the next twelve months from 31 December 2018.
(ii) As at 31 December 2018, the effective interest rates for amounts due from subsidiaries ranged from 1.85% to 2.80% (2017: 1.85% to 2.95%; 1 January 2017: 1.85% to 2.80%) per annum.
(iii) Movements in allowance for impairment loss were as follows:
The CompanyNote 2018 2017
$’000 $’000
At 1 January (169,118) (179,118)Allowance utilised upon disposal of a subsidiary – 10,000Allowance during the year (9) –Reversal of allowance during the year 27(a) 18,022 –At 31 December (151,105) (169,118)
(iv) The Company’s exposure to credit risk on the amounts due from subsidiaries is disclosed in note 33.
NOTES TO THEFINANCIAL STATEMENTS
FINANCIALS & ADDITIONAL INFORMATION
Cap
itaL
and
Lim
ited
Ann
ual R
epor
t 20
18
177

6. SUBSIDIARIES (continued)
(b) The significant subsidiaries directly and indirectly held by the Company, which are incorporated and conducting business in the Republic of Singapore, are as set out below:
Effective interest
2018 20171 Jan 2017
Name of Company % % %
CapitaLand China Holdings Pte Ltd1 100 100 100
CapitaLand VN Limited 100 100 100
CapitaLand China Investments Limited 100 100 100
CapitaLand Singapore Limited 100 100 100
CapitaLand Treasury Limited 100 100 100
CapitaLand Mall Asia Limited 1002 1002 1002
CapitaLand Business Services Pte Ltd 100 100 100
The Ascott Limited 100 100 100
CapitaLand Financial Limited 100 100 100
CapitaLand International Pte Ltd 100 100 –
All the above subsidiaries are audited by KPMG LLP Singapore.
1 Indirectly held through CapitaLand China Investments Limited.2 Includes 15.2% (2017: 34.7%) interest indirectly held through CapitaLand Business Services Pte Ltd.
NOTES TO THEFINANCIAL STATEMENTS
FINANCIALS & ADDITIONAL INFORMATIONC
apit
aLan
d L
imit
edA
nnua
l Rep
ort
2018
178

6. SUBSIDIARIES (continued)
(c) Determining whether the Group has control over the REITs it manages requires management judgement. In exercising its judgement, management considers the proportion of its ownership interest and voting rights, the REIT managers’ decision making authority over the REITs as well as the Group’s overall exposure to variable returns, both from the REIT managers’ remuneration and their interests in the REITs.
The Group assesses that it controls CapitaLand Commercial Trust (CCT), CapitaLand Malaysia Mall Trust (CMMT), Ascott Residence Trust (ART), CapitaLand Mall Trust (CMT) and CapitaLand Retail China Trust (CRCT) (collectively referred to as REITs), although the Group owns less than half of the ownership interest and voting power of the REITs. The activities of the REITs are managed by the Group’s wholly-owned subsidiaries, namely CapitaLand Commercial Trust Management Limited, CapitaLand Malaysia Mall REIT Management Sdn Bhd, Ascott Residence Trust Management Limited, CapitaLand Mall Trust Management Limited and CapitaLand Retail China Trust Management Limited (collectively referred to as REIT Managers). REIT Managers have decision-making authority over the REITs, subject to oversight by the trustee of the respective REITs. The Group’s overall exposure to variable returns, both from the REIT Managers’ remuneration and the interests in the REITs, is significant and any decisions made by the REIT Managers affect the Group’s overall exposure.
(d) The following subsidiaries of the Group have material non-controlling interests (NCI):
Effective interestheld by NCI
Name of Company Principal place of business 2018 20171 Jan 2017
% % %
Ascott Residence Trust1
Asia Pacific, Europeand United States of America 55.3 55.7 56.1
CapitaLand Commercial Trust2 Singapore 69.9 69.0 67.9
CapitaLand Mall Trust3 Singapore 71.6 70.6 #
All the above subsidiaries are audited by KPMG LLP Singapore.
1 Indirectly held through The Ascott Limited.2 Indirectly held through CapitaLand Singapore Limited.3 Indirectly held through CapitaLand Mall Asia Limited.# Management assessed that the Group has control over CMT and CMT has been reclassified as a subsidiary in August 2017.
NOTES TO THEFINANCIAL STATEMENTS
FINANCIALS & ADDITIONAL INFORMATION
Cap
itaL
and
Lim
ited
Ann
ual R
epor
t 20
18
179

6. SUBSIDIARIES (continued)
The following table summarises the financial information of each of the Group’s subsidiaries with material NCI, based on their respective consolidated financial statements prepared in accordance with SFRS(I), modified for fair value adjustments on acquisition and differences in the Group’s accounting policies. The information is before inter-company eliminations with other entities in the Group.
ARTGroup
CCTGroup
CMTGroup
Other subsidiaries
with individually immaterial
NCI Total$’000 $’000 $’000 $’000 $’000
31 December 2018Revenue 514,273 393,259 695,089Profit after tax 151,841 522,858 676,745Other comprehensive income (38,523) 25,010 (7,347)Total comprehensive income 113,318 547,868 669,398
Attributable to NCI:- Profit 85,837 367,781 484,211 149,490 1,087,319- Total comprehensive
income 64,168 384,486 480,213 67,302 996,169
Current assets 500,094 265,014 376,021Non-current assets 4,809,037 9,425,493 11,125,649Current liabilities (218,191) (224,769) (827,700)Non-current liabilities (1,960,031) (2,557,859) (3,244,670)Net assets 3,130,909 6,907,879 7,429,300Net assets attributable
to NCI 1,948,489 4,839,295 5,315,665 2,250,778 14,354,227
Cash flows from:- Operating activities 226,667 282,034 455,912- Investing activities (672) 58,667 (234,978)- Financing activities1 (253,865) (288,369) (395,176)Net (decrease)/increase in cash
and cash equivalents (27,870) 52,332 (174,242)
1 Includes dividends paid to NCI and perpetual securities holders (105,491) (212,327) (325,965)
NOTES TO THEFINANCIAL STATEMENTS
FINANCIALS & ADDITIONAL INFORMATIONC
apit
aLan
d L
imit
edA
nnua
l Rep
ort
2018
180

6. SUBSIDIARIES (continued)
ARTGroup
CCTGroup
CMTGroup
Other subsidiaries
with individually immaterial
NCI Total$’000 $’000 $’000 $’000 $’000
31 December 2017Revenue 496,288 337,147 284,397Profit after tax 222,500 578,827 219,069Other comprehensive income (24,259) (54,160) (10,241)Total comprehensive income 198,241 524,667 208,828
Attributable to NCI:- Profit 127,503 399,390 154,666 95,461 777,020- Total comprehensive
income 112,269 374,336 147,436 88,850 722,891
Current assets 518,952 165,327 593,479Non-current assets 4,974,099 9,188,675 9,919,880Current liabilities (505,091) (97,563) (757,118)Non-current liabilities (1,816,277) (2,839,516) (2,828,196)Net assets 3,171,683 6,416,923 6,928,045Net assets attributable
to NCI 1,981,097 4,427,677 4,891,330 2,404,830 13,704,934
Cash flows from:- Operating activities 181,339 250,790 198,057- Investing activities (390,175) (901,997) 81,843- Financing activities1 327,808 613,826 (304,336)Net increase/(decrease) in cash
and cash equivalents 118,972 (37,381) (24,436)
1 Includes dividends paid to NCI and perpetual securities holders (103,009) (192,978) (278,799)
NOTES TO THEFINANCIAL STATEMENTS
FINANCIALS & ADDITIONAL INFORMATION
Cap
itaL
and
Lim
ited
Ann
ual R
epor
t 20
18
181

6. SUBSIDIARIES (continued)
ARTGroup
CCTGroup
Other subsidiaries
with individually immaterial
NCI Total$’000 $’000 $’000 $’000
1 January 2017Current assets 218,536 201,855Non-current assets 4,572,745 7,849,276Current liabilities (281,536) (236,155)Non-current liabilities (1,827,482) (2,536,434)Net assets 2,682,263 5,278,542Net assets attributable to NCI 1,715,969 3,583,074 1,399,069 6,698,112
(e) ART, CCT, CMT and CRCT are regulated by the Monetary Authority of Singapore and are supervised by the Singapore Exchange Securities Trading Limited for compliance with the Singapore Listing Rules. Under the regulatory framework, transactions with the REITs are either subject to review by the REITs’ trustees or significant transaction must be approved by a majority of votes by the remaining holders of units in the REITs at a meeting of unitholders.
7. ASSOCIATES
The Group
2018 20171 Jan 2017
$’000 $’000 $’000
(a) Investment in associates 5,875,990 5,838,615 7,721,010Less:Allowance for impairment (12,463) (9) –
5,863,527 5,838,606 7,721,010Add:Amounts due from associates, at amortised cost:Loan accounts- interest free 181,988 234,701 243,747- interest bearing 161,749 118,615 88,725
343,737 353,316 332,4726,207,264 6,191,922 8,053,482
NOTES TO THEFINANCIAL STATEMENTS
FINANCIALS & ADDITIONAL INFORMATIONC
apit
aLan
d L
imit
edA
nnua
l Rep
ort
2018
182

7. ASSOCIATES (continued)
(a) Investment in associates (continued)
(i) Movements in allowance for impairment loss were as follows:
The Group
Note 2018 2017
$’000 $’000
At 1 January (9) –
Allowance during the year 27(c)(iii) (12,454) (9)
At 31 December (12,463) (9)
(ii) Loans due from associates are unsecured and not expected to be repaid within the next twelve months from 31 December 2018.
(iii) As at 31 December 2018, the effective interest rate for the interest-bearing loan to an associate is 1.50% (2017: 1.50%; 1 January 2017: 1.50%) per annum.
(iv) Loan accounts include an amount of approximately $322.2 million (2017: $266.4 million; 1 January 2017: $236.5 million), the repayment of which is subordinated to that of the external borrowings of certain associates.
The Group
Note 2018 20171 Jan 2017
$’000 $’000 $’000
(b) Amounts due from associates:Current accounts (unsecured)- interest free (trade) 23,423 20,500 19,673- interest free (non-trade) 14,296 102,738 456,122- interest bearing (non-trade) – – 27,798
37,719 123,238 503,593
Less:Allowance for impairment loss on receivables 33 (102) (3,172) (113)Presented in trade and other receivables 12 37,617 120,066 503,480
Non-current loans (unsecured)- interest free 9 1,111 6- interest bearing 157,333 84,983 88,812Presented in other non-current assets 10 157,342 86,094 88,818
(i) The effective interest rates for amounts due from associates ranged from 1.50% to 5.15% (2017: 2.47% to 4.57%; 1 January 2017: 2.27% to 5.66%) per annum.
(ii) The Group and the Company’s exposure to credit and currency risks, and impairment losses for trade and other receivables, are disclosed in note 33.
NOTES TO THEFINANCIAL STATEMENTS
FINANCIALS & ADDITIONAL INFORMATION
Cap
itaL
and
Lim
ited
Ann
ual R
epor
t 20
18
183

7. ASSOCIATES (continued)
The Group
Note 2018 20171 Jan 2017
$’000 $’000 $’000
(c) Amounts due to associates:Current accounts (mainly non-trade and unsecured)- interest free (480,238) (287,241) (257,516)- interest bearing – – (825)Presented in trade and other payables 17 (480,238) (287,241) (258,341)
Non-current loans (unsecured)- interest bearing, presented as other non-current
liabilities 21 – – (153,976)
(i) The effective interest rates as at 1 January 2017 for non-current amounts due to associates ranged from 0.75% to 3.22% per annum.
(d) The following are the material associates:
Effective interest
Name of Company
Nature of relationshipwith the Group
Principal place of business 2018 2017
1 Jan 2017
% % %
CapitaLand Mall Trust1 (CMT)
Singapore-based REIT which invests in shopping malls in Singapore
Singapore – # 29.3
CapitaLand Retail China Trust1 (CRCT)
Singapore-based REIT which invests in shopping malls in China
China – # 28.7
Raffles City China Income Ventures Limited 2,3 (RCCIV) (formerly known as Raffles City China Fund Ltd)
Private equity fund which invests in five Raffles City integrated developments in China
China 55.0 55.0 55.0
CapitaLand Mall China Funds1, 3, 4
Private equity funds which invest in shopping malls in China
China 30% to 50% 30% to 50% 30% to 50%
All the above associates are audited by KPMG LLP Singapore.
1 Indirectly held through CapitaLand Mall Asia Limited.2 Indirectly held through CapitaLand Mall Asia Limited and CapitaLand China Holdings Pte Ltd.3 Considered to be an associate as key decisions are made by an independent board which the Group does not have majority control.4 CapitaLand Mall China Funds comprised four private property funds investing in China held indirectly through the Group’s subsidiary,
CapitaLand Mall Asia Limited, namely, CapitaLand Mall China Income Fund I, CapitaLand Mall China Income Fund II, CapitaLand Mall China Income Fund III and CapitaLand Mall China Development Fund III.
# In 2017, management assessed that the Group has control over CMT and CRCT and both trusts have been reclassified as subsidiaries.
NOTES TO THEFINANCIAL STATEMENTS
FINANCIALS & ADDITIONAL INFORMATIONC
apit
aLan
d L
imit
edA
nnua
l Rep
ort
2018
184

7. ASSOCIATES (continued)
The following summarises the financial information of the Group’s material associates based on their respective consolidated financial statements prepared in accordance with SFRS(I), modified for fair value adjustments on acquisition and differences in the Group’s accounting policies. The table also includes summarised aggregate financial information for the Group’s interest in other individually immaterial associates, based on the amounts reported in the Group’s consolidated financial statements.
RCCIV Group
CapitaLand Mall China
Funds
Other individuallyimmaterial associates Total
$’000 $’000 $’000 $’000
31 December 2018Revenue 509,542 556,374Profit after tax 587,642 593,639Other comprehensive income (251,687) (226,242)Total comprehensive income 335,955 367,397Attributable to:- NCI 136,128 7,880- Associate’s shareholders 199,827 359,517
Current assets 1,531,215 701,900Non-current assets 6,087,252 6,767,612Current liabilities (542,158) (665,648)Non-current liabilities (2,938,144) (2,418,570)Net assets 4,138,165 4,385,294Attributable to:- NCI 822,603 197,405- Associate’s shareholders 3,315,562 4,187,889
Carrying amount of interest in associate at beginning of the year 1,673,393 2,197,275
Group’s share of:- Profit 224,658 249,851 150,512 625,021- Other comprehensive income (108,812) (98,821) (35,743) (243,376)- Total comprehensive income 115,846 151,030 114,769 381,645Dividends received during the year – (240,829)Capital returned during the year – (326,727)Translation and other adjustments 34,320 54,894Carrying amount of interest in associate at
end of the year 1,823,559 1,835,643 2,204,325 5,863,527
NOTES TO THEFINANCIAL STATEMENTS
FINANCIALS & ADDITIONAL INFORMATION
Cap
itaL
and
Lim
ited
Ann
ual R
epor
t 20
18
185

7. ASSOCIATES (continued)
RCCIV Group
CapitaLand Mall China
Funds
Other individuallyimmaterial associates Total
$’000 $’000 $’000 $’000
31 December 2017Revenue 704,238 571,095Profit after tax 529,084 220,854Other comprehensive income 164,297 108,483Total comprehensive income 693,381 329,337Attributable to:- NCI 198,988 8,055- Associate’s shareholders 494,393 321,282
Current assets 1,065,268 1,955,426Non-current assets 5,597,001 6,421,714Current liabilities (1,062,732) (1,300,558)Non-current liabilities (1,882,253) (1,854,254)Net assets 3,717,284 5,222,328Attributable to:- NCI 674,752 186,000- Associate’s shareholders 3,042,532 5,036,328
Carrying amount of interest in associate at beginning of the year 1,489,850 2,156,344
Additions during the year – 4,583Group’s share of:- Profit 197,316 102,713 253,630 553,659- Other comprehensive income 74,471 46,847 (29,034) 92,284- Total comprehensive income 271,787 149,560 224,596 645,943Dividends received during the year – (20,817)Translation and other adjustments (88,244) (92,395)Carrying amount of interest in associate at
end of the year 1,673,393 2,197,275 1,967,938 5,838,606
NOTES TO THEFINANCIAL STATEMENTS
FINANCIALS & ADDITIONAL INFORMATIONC
apit
aLan
d L
imit
edA
nnua
l Rep
ort
2018
186

7. ASSOCIATES (continued)
CMTGroup
CRCT Group
RCCIV Group
Other individuallyimmaterial associates Total
$’000 $’000 $’000 $’000 $’000
1 January 2017Current assets 517,179 151,080 1,205,800Non-current assets 9,809,553 2,632,387 5,012,334Current liabilities (466,228) (533,314) (390,174)Non-current liabilities (3,168,282) (798,463) (2,606,746)Net assets 6,692,222 1,451,690 3,221,214Attributable to:- NCI – 19,879 512,396- Associate’s shareholders 6,692,222 1,431,811 2,708,818
Carrying amount of interest in associate at beginning of the year 1,931,840 413,493 1,535,639
Additions during the year 3,808 22,733 –Group’s share of:- Profit 133,563 30,171 58,392 215,332 437,458- Other comprehensive
income (18,020) (34,093) (118,524) (241,598) (412,235)- Total comprehensive income 115,543 (3,922) (60,132) (26,266) 25,223Dividends received during the
year (115,562) (21,325) –Translation and other
adjustments – – 14,343Carrying amount of interest in
associate at end of the year 1,935,629 410,979 1,489,850 3,884,552 7,721,010
Fair value of effective ownership interest (if listed)^ 1,959,130 341,865 N/A
^ Based on the quoted market price at 31 December 2016 (Level 1 in the fair value heirarchy)
(e) As at 31 December 2018, the Group’s share of the contingent liabilities of the associates is $1,411.7 million (2017: $1,084.6 million; 1 January 2017: $1,057.1 million).
(f) The Group carried out impairment assessment for an investment in an associate where the carrying value of the listed investment of $534.9 million exceeded the market value of the shares held by the Group. The Group took into account the value of the underlying investment properties held by the associate which was based on independent valuation conducted by professional valuers and the financial performance of the associate and concluded that there was no impairment on the investment.
NOTES TO THEFINANCIAL STATEMENTS
FINANCIALS & ADDITIONAL INFORMATION
Cap
itaL
and
Lim
ited
Ann
ual R
epor
t 20
18
187

8. JOINT VENTURES
The Group
Note 2018 20171 Jan 2017
$’000 $’000 $’000
(a) Investment in joint ventures 3,327,567 3,409,806 3,862,449
Less:
Allowance for impairment loss (11,866) (11,935) (17,266)
3,315,701 3,397,871 3,845,183Add:Amounts due from joint ventures, at amortised cost:Loan accounts- interest free 646,716 612,468 717,983- interest bearing 23,715 16,827 16,326Less:Allowance for impairment loss on receivables 33 (13,778) (13,639) (13,105)
656,653 615,656 721,2043,972,354 4,013,527 4,566,387
(i) Loans due from joint ventures are unsecured and not expected to be repaid within the next twelve months from 31 December 2018.
(ii) Movements in allowance for impairment loss were as follows:
The Group
Note 2018 2017
$’000 $’000
At 1 January (11,935) (17,266)
Allowance during the year 27(c)(iii) – (1,737)
Reversal of allowance during the year 27(a) – 1,800
Allowance utilised during the year 69 5,268
At 31 December (11,866) (11,935)
(iii) As at 31 December 2018, the effective interest rates for the interest-bearing loans to joint ventures ranged from 3.00% to 6.50% (2017: 5.03% to 6.50%; 1 January 2017: 5.28% to 6.50%) per annum.
(iv) Loan accounts include an amount of approximately $535.3 million (2017: $350.1 million; 1 January 2017: $445.7 million), the repayment of which is subordinated to that of the external borrowings of certain joint ventures.
NOTES TO THEFINANCIAL STATEMENTS
FINANCIALS & ADDITIONAL INFORMATIONC
apit
aLan
d L
imit
edA
nnua
l Rep
ort
2018
188

8. JOINT VENTURES (continued)
The Group
Note 2018 20171 Jan 2017
$’000 $’000 $’000
(b) Amounts due from joint ventures:
Current accounts (unsecured)- interest free (trade) 29,558 28,127 28,418- interest free (non-trade) 17,288 6,261 40,708- interest bearing (mainly non-trade) 31,744 29,960 30,538
78,590 64,348 99,664Less:Allowance for impairment loss on receivables 33 (14,938) (13,389) (12,322)Presented in trade and other receivables 12 63,652 50,959 87,342
Non-current loans (unsecured)- interest free 598 – –- interest bearing 176,112 – –
Presented in other non-current assets 10 176,710 – –
(i) The effective interest rates for amounts due from joint ventures ranged from 1.00% to 3.80% (2017: 1.80% to 3.53%; 1 January 2017: 1.80% to 3.40%) per annum.
(ii) The Group and the Company’s exposure to credit and currency risks, and impairment losses for trade and other receivables, are disclosed in note 33.
The Group
Note 2018 20171 Jan 2017
$’000 $’000 $’000
(c) Amounts due to joint ventures:Current accounts (unsecured)- interest free (mainly non-trade) (13,783) (9,301) (6,754)- interest bearing (non-trade) (265,079) (200,097) (206,355)Presented in trade and other payables 17 (278,862) (209,398) (213,109)
Non-current loans (unsecured)- interest bearing, presented as other non-current
liabilities 21 – (87,180) (88,416)
(i) The effective interest rates for amounts due to joint ventures ranged from 2.85% to 4.35% (2017: 2.85% to 4.35%; 1 January 2017: 3.05% to 4.35%) per annum.
NOTES TO THEFINANCIAL STATEMENTS
FINANCIALS & ADDITIONAL INFORMATION
Cap
itaL
and
Lim
ited
Ann
ual R
epor
t 20
18
189

8. JOINT VENTURES (continued)
(d) The following are the material joint ventures:
Name of Company
Nature of relationship with the Group
Principal place of business
Effective interest
2018 20171 Jan 2017
% % %
RCS Trust1,4 Special purpose trust which invests in a Raffles City integrated development in Singapore
Singapore – # 31.0
Orchard Turn Holding Pte Ltd2 (OTH)
Owner of an integrated development in Singapore
Singapore 50.0 50.0 50.0
CTM Property Trust3,4
(CTM)Special purpose trust
which invests in a Raffles City integrated development
in China
China 62.5 62.5 62.5
CapitaLand Shanghai Malls2,4,5
Owner of two integrated developments in China
China 65% to 73% 65% to 73% 65% to 73%
All the above joint ventures are audited by KPMG LLP Singapore, except for CapitaLand Shanghai Malls, which are audited by other member firms of KPMG International.
1 Indirectly held through CCT and CMT. 2 Indirectly held through CapitaLand Mall Asia Limited.3 Indirectly held through CapitaLand Mall Asia Limited and CapitaLand China Holdings Pte Ltd.4 Considered to be a joint venture as the Group had joint control over the relevant activities of the trust with the joint venture partners.5 CapitaLand Shanghai Malls comprised two joint ventures held through the Group’s subsidiary, CapitaLand Mall Asia Limited,
namely, Ever Bliss International Limited and Full Grace Enterprises Limited.# In 2017, management assessed that the Group has control over RCS Trust through the aggregate interest held via its subsidiaries
and RCS Trust has been reclassified as a subsidiary.
NOTES TO THEFINANCIAL STATEMENTS
FINANCIALS & ADDITIONAL INFORMATIONC
apit
aLan
d L
imit
edA
nnua
l Rep
ort
2018
190

8. JOINT VENTURES (continued)
The following summarises the financial information of each of the Group’s material joint ventures based on their respective consolidated financial statements prepared in accordance with SFRS(I), modified for fair value adjustments on acquisition and differences in the Group’s accounting policies. The table also includes summarised financial information for the Group’s interest in immaterial joint ventures, based on the amounts reported in the Group’s consolidated financial statements.
OTH GroupCTM
Group
CapitaLand Shanghai
Malls
Other individuallyimmaterial
joint ventures Total
$’000 S$’000 $’000 $’000 $’000
31 December 2018Revenue 265,301 – 186,364Profit/(Loss)1 after tax 138,352 (13,188) 264,644Other comprehensive income (3,739) (43,292) (110,336)Total comprehensive income 134,613 (56,480) 154,308
1 Includes: - depreciation and amortisation (2,518) (78) (639) - interest income 1,055 2,354 9,849 - interest expense (43,791) – (50,820) - tax expense (24,324) (1,509) (97,305)
Current assets2 122,327 1,959,848 492,594Non-current assets 3,345,947 1,491,602 3,129,738Current liabilities3 (76,252) (996,965) (76,287)Non-current liabilities4 (1,703,149) (1,439,134) (1,601,513)Net assets 1,688,873 1,015,351 1,944,532
2 Includes cash and cash equivalents 109,202 318,083 227,149
3 Includes current financial liabilities (excluding trade and other payables and provisions) (17,536) (98,710) (13,807)
4 Includes non-current financial liabilities (excluding trade and other payables and provisions) (1,702,634) (1,432,379) (1,122,213)
Carrying amount of interest in joint venture at beginning of the year 832,130 667,657 873,513
Additions during the yearGroup’s share of:- Profit/(Loss) 69,176 (5,996) 124,083 147,123 334,386- Other comprehensive income (119) (27,058) (48,948) (8,032) (84,157)- Total comprehensive income 69,057 (33,054) 75,135 139,091 250,229Dividends received during the year (56,750) – –Translation and other adjustments – (9) 8,684Carrying amount of interest in
joint venture at end of the year 844,437 634,594 957,332 879,338 3,315,701
NOTES TO THEFINANCIAL STATEMENTS
FINANCIALS & ADDITIONAL INFORMATION
Cap
itaL
and
Lim
ited
Ann
ual R
epor
t 20
18
191

8. JOINT VENTURES (continued)
OTH GroupCTM
Group
CapitaLand Shanghai
Malls
Other individuallyimmaterial
joint ventures Total
$’000 S$’000 $’000 $’000 $’000
31 December 2017Revenue 269,221 – 171,284Profit/(Loss)1 after tax 204,227 (15,558) 39,330Other comprehensive income (5,688) (19,013) 88,250Total comprehensive income 198,539 (34,571) 127,580
1 Includes: - depreciation and amortisation (619) (123) (73) - interest income 559 581 8,839 - interest expense (38,514) – (45,898) - tax expense (23,211) (1,230) (46,183)
Current assets2 109,269 1,352,325 408,816Non-current assets 3,322,397 1,218,305 2,784,367Current liabilities3 (77,213) (707,508) (364,914)Non-current liabilities4 (1,690,193) (794,871) (1,078,084)Net assets 1,664,260 1,068,251 1,750,185
2 Includes cash and cash equivalents 90,950 62,438 206,478
3 Includes current financial liabilities (excluding trade and other payables and provisions) (46,382) (345,101) (244,917)
4 Includes non-current financial liabilities (excluding trade and other payables and provisions) (1,690,193) (792,255) (1,171,773)
Carrying amount of interest in joint venture at beginning of the year 797,862 689,263 857,405
Additions during the yearGroup’s share of:- Profit/(Loss) 102,113 (14,215) 49,014 191,717 328,629- Other comprehensive income (2,845) (11,883) 44,125 (22,372) 7,025- Total comprehensive income 99,268 (26,098) 93,139 169,345 335,654Dividends received during the year (65,000) – –Translation and other adjustments – 4,492 (77,031)Carrying amount of interest in
joint venture at end of the year 832,130 667,657 873,513 1,024,571 3,397,871
NOTES TO THEFINANCIAL STATEMENTS
FINANCIALS & ADDITIONAL INFORMATIONC
apit
aLan
d L
imit
edA
nnua
l Rep
ort
2018
192
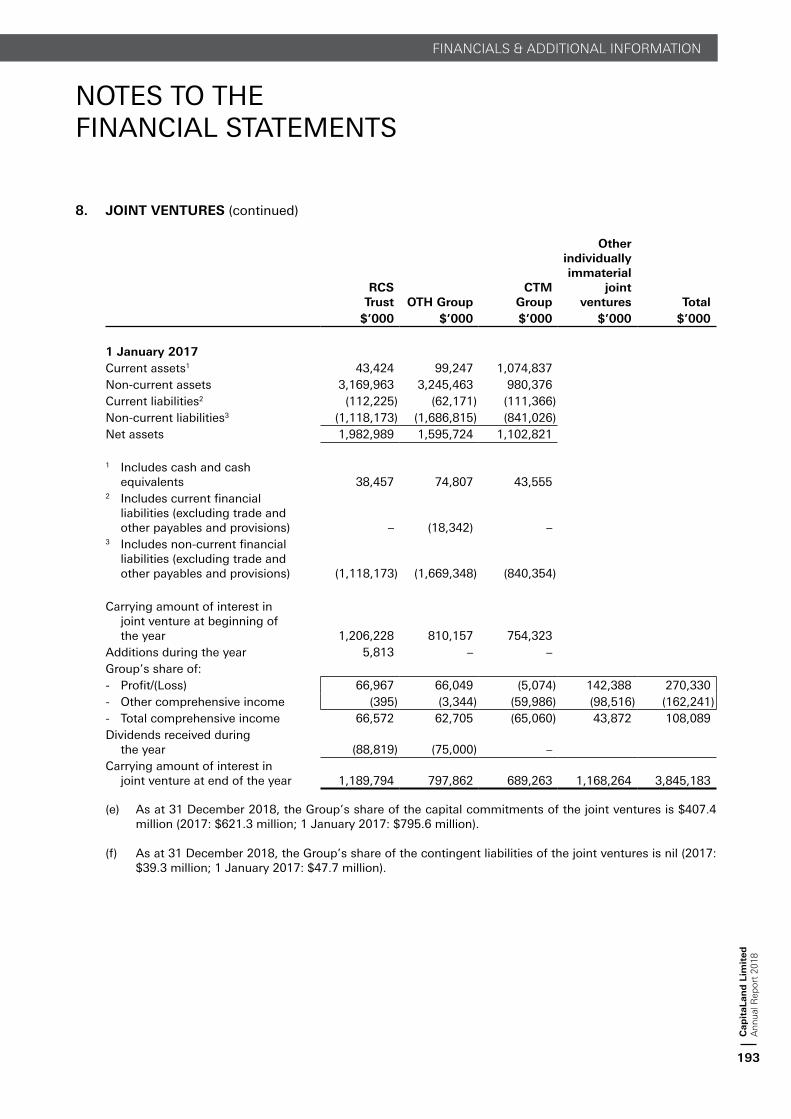
8. JOINT VENTURES (continued)
RCS Trust OTH Group
CTM Group
Other individuallyimmaterial
joint ventures Total
$’000 $’000 $’000 $’000 $’000
1 January 2017Current assets1 43,424 99,247 1,074,837Non-current assets 3,169,963 3,245,463 980,376Current liabilities2 (112,225) (62,171) (111,366)Non-current liabilities3 (1,118,173) (1,686,815) (841,026)Net assets 1,982,989 1,595,724 1,102,821
1 Includes cash and cash equivalents 38,457 74,807 43,555
2 Includes current financial liabilities (excluding trade and other payables and provisions) – (18,342) –
3 Includes non-current financial liabilities (excluding trade and other payables and provisions) (1,118,173) (1,669,348) (840,354)
Carrying amount of interest in joint venture at beginning of the year 1,206,228 810,157 754,323
Additions during the year 5,813 – –Group’s share of:- Profit/(Loss) 66,967 66,049 (5,074) 142,388 270,330- Other comprehensive income (395) (3,344) (59,986) (98,516) (162,241)- Total comprehensive income 66,572 62,705 (65,060) 43,872 108,089Dividends received during
the year (88,819) (75,000) –Carrying amount of interest in
joint venture at end of the year 1,189,794 797,862 689,263 1,168,264 3,845,183
(e) As at 31 December 2018, the Group’s share of the capital commitments of the joint ventures is $407.4 million (2017: $621.3 million; 1 January 2017: $795.6 million).
(f) As at 31 December 2018, the Group’s share of the contingent liabilities of the joint ventures is nil (2017: $39.3 million; 1 January 2017: $47.7 million).
NOTES TO THEFINANCIAL STATEMENTS
FINANCIALS & ADDITIONAL INFORMATION
Cap
itaL
and
Lim
ited
Ann
ual R
epor
t 20
18
193

9.
DEFE
RR
ED
TA
X
The
mov
emen
ts in
th
e d
efer
red
tax
ass
ets
and
liab
iliti
es (
pri
or
to o
ffse
ttin
g o
f b
alan
ces
wit
hin
th
e sa
me
tax
juri
sdic
tio
n)
wer
e as
fo
llow
s:
At
1/1
/20
18
Rec
og
nis
ed
in p
rofi
t or
loss
Acq
uis
itio
n
/ D
isp
osa
l of
sub
sid
iari
esTr
ansl
atio
n
diff
eren
ces
At
31/1
2/2
018
$’0
00
$’0
00
$’0
00
$’0
00
$’0
00
The
Gro
up
Def
erre
d t
ax lia
bili
ties
Acc
eler
ated
tax
dep
reci
atio
n1
08
,30
424,6
28
(18,5
90)
(10,0
72)
104,2
70
Dis
cou
nts
on
co
mp
ou
nd
fin
anci
al in
stru
men
ts6
,14
3(2
,814)
––
3,3
29
Acc
rued
inco
me
and
inte
rest
rec
eiva
ble
4,6
87
(1)
–(1
06)
4,5
80
Pro
fits
rec
og
nis
ed o
n p
erce
nta
ge
of
com
ple
tio
n a
nd
fai
r
valu
e ad
just
men
ts o
n in
itia
l rec
og
nit
ion
of
dev
elo
pm
ent
p
rop
erti
es f
or
sale
25
5,2
37
(15,1
65)
–(8
,324)
231,7
48
Fair
val
ue
adju
stm
ents
ari
sin
g f
rom
a b
usi
nes
s co
mb
inat
ion
23
,53
8(2
24)
6,8
52
(279)
29,8
87
Fair
val
ue
chan
ges
of
inve
stm
ent
pro
per
ties
37
1,4
61
60,2
04
15,7
16
(6,1
66)
441,2
15
Un
rem
itte
d e
arn
ing
s9
4,2
98
6,3
04
1,8
16
–102,4
18
Oth
ers
37
,63
05,4
80
–456
43,5
66
Tota
l9
01
,29
878,4
12
5,7
94
(24,4
91)
961,0
13
NO
TES
TO
TH
EFI
NA
NC
IAL
STA
TEM
EN
TS
FINANCIALS & ADDITIONAL INFORMATIONC
apit
aLan
d L
imit
edA
nnua
l Rep
ort
2018
194

9.
DEFE
RR
ED
TA
X (
con
tin
ued
)
At
1/1
/20
18
Rec
og
nis
ed
in p
rofi
t or
loss
Acq
uis
itio
n
/ D
isp
osa
l of
sub
sid
iari
esTr
ansl
atio
n
diff
eren
ces
At
31/1
2/2
018
$’0
00
$’0
00
$’0
00
$’0
00
$’0
00
The
Gro
up
Def
erre
d t
ax a
sset
sU
nu
tilis
ed t
ax lo
sses
(5,7
28
)3,3
31
(110)
105
(2,4
02)
Pro
visi
on
s an
d e
xpen
ses
(16
9,1
49
)(6
9,6
88)
–7,5
46
(231,2
91)
Fair
val
ue
adju
stm
ents
on
init
ial r
eco
gn
itio
n o
f d
evel
op
men
t
pro
per
ties
fo
r sa
le(1
4,4
89
)–
––
(14,4
89)
Def
erre
d I
nco
me
(36
)1
–2
(33)
Oth
ers
(36
,96
8)
(270)
–(3
7)
(37,2
75)
Tota
l(2
26
,37
0)
(66,6
26)
(110)
7,6
16
(285,4
90)
NO
TES
TO
TH
EFI
NA
NC
IAL
STA
TEM
EN
TS
FINANCIALS & ADDITIONAL INFORMATION
Cap
itaL
and
Lim
ited
Ann
ual R
epor
t 20
18
195

9.
DEFE
RR
ED
TA
X (
con
tin
ued
)
At
1/1
/20
17
Rec
og
nis
ed
in p
rofi
t or
loss
Acq
uis
itio
n
/ D
isp
osa
l of
sub
sid
iari
es
Tran
sfer
red
to
as
sets
/ lia
bili
ties
h
eld
for
sale
Tran
slat
ion
d
iffer
ence
sA
t 31/1
2/2
017
$’0
00
$’0
00
$’0
00
$’0
00
$’0
00
$’0
00
The
Gro
up
Def
erre
d t
ax lia
bili
ties
Acc
eler
ated
tax
dep
reci
atio
n4
0,6
75
16
,63
260,9
57
(10,0
42)
82
108,3
04
Dis
cou
nts
on
co
mp
ou
nd
fin
anci
al in
stru
men
ts9
,69
2(3
,54
9)
––
–6,1
43
Acc
rued
inco
me
and
inte
rest
rec
eiva
ble
5,4
55
(73
3)
––
(35)
4,6
87
Pro
fits
rec
og
nis
ed o
n p
erce
nta
ge
of
com
ple
tio
n a
nd
fai
r
valu
e ad
just
men
ts o
n in
itia
l rec
og
nit
ion
of
dev
elo
pm
ent
p
rop
erti
es f
or
sale
26
5,2
51
(6,0
29
)–
–(3
,985)
255,2
37
Fair
val
ue
adju
stm
ents
ari
sin
g f
rom
a b
usi
nes
s co
mb
inat
ion
17
,28
4–
6,1
36
–118
23,5
38
Fair
val
ue
chan
ges
of
inve
stm
ent
pro
per
ties
25
5,1
45
22
,79
2127,1
51
(31,7
32)
(1,8
95)
371,4
61
Un
rem
itte
d e
arn
ing
s9
2,8
91
(4,6
32
)8,6
57
(2,5
00)
(118)
94,2
98
Oth
ers
38
,89
0(1
,17
4)
––
(86)
37,6
30
Tota
l7
25
,28
32
3,3
07
202,9
01
(44,2
74)
(5,9
19)
901,2
98
NO
TES
TO
TH
EFI
NA
NC
IAL
STA
TEM
EN
TS
FINANCIALS & ADDITIONAL INFORMATIONC
apit
aLan
d L
imit
edA
nnua
l Rep
ort
2018
196

9.
DEFE
RR
ED
TA
X (
con
tin
ued
)
At
1/1
/20
17
Rec
og
nis
ed
in p
rofi
t or
loss
Rec
og
nis
ed
in e
qu
ity
Acq
uis
itio
n
/ D
isp
osa
l of
sub
sid
iari
esTr
ansl
atio
n
diff
eren
ces
At
31/1
2/2
017
$’0
00
$’0
00
$’0
00
$’0
00
$’0
00
$’0
00
The
Gro
up
Def
erre
d t
ax a
sset
sU
nu
tilis
ed t
ax lo
sses
(7,3
45
)1
,47
6–
–141
(5,7
28)
Pro
visi
on
s an
d e
xpen
ses
(17
0,9
53
)(5
48
)–
38
2,3
14
(169,1
49)
Fair
val
ue
adju
stm
ents
on
init
ial r
eco
gn
itio
n o
f d
evel
op
men
t
pro
per
ties
fo
r sa
le(1
4,4
89
)–
––
–(1
4,4
89)
Def
erre
d I
nco
me
–(3
8)
––
2(3
6)
Oth
ers
(35
,09
7)
(23
2)
53
(1,7
60)
68
(36,9
68)
Tota
l(2
27
,88
4)
65
853
(1,7
22)
2,5
25
(226,3
70)
At
1/1
/20
17
Rec
og
nis
ed
in
pro
fit
or
loss
At
31/1
2/2
017
Rec
og
nis
ed
in p
rofi
t or
loss
At
31/1
2/2
018
$’0
00
$’0
00
$’0
00
$’0
00
$’0
00
The
Com
pan
y
Def
erre
d t
ax lia
bili
ties
Dis
cou
nt
on
co
mp
ou
nd
fin
anci
al in
stru
men
ts9
,69
2(3
,549)
6,1
43
(2,8
14)
3,3
29
Def
erre
d t
ax a
sset
s
Pro
visi
on
s(3
97
)(2
6)
(423)
–(4
23)
NO
TES
TO
TH
EFI
NA
NC
IAL
STA
TEM
EN
TS
FINANCIALS & ADDITIONAL INFORMATION
Cap
itaL
and
Lim
ited
Ann
ual R
epor
t 20
18
197

9. DEFERRED TAX (continued)
Deferred tax liabilities and assets are offset when there is a legally enforceable right to set off current tax assets against current tax liabilities and when the deferred taxes relate to the same taxation authority. The following amounts, determined after appropriate offsetting, are shown on the balance sheets:
The GroupGross
Amount Offset Net
Amount$’000 $’000 $’000
31 December 2018Deferred tax liabilities 961,013 – 961,013Deferred tax assets (285,490) – (285,490)
675,523 – 675,523
31 December 2017Deferred tax liabilities 901,298 (70) 901,228Deferred tax assets (226,370) 70 (226,300)
674,928 – 674,928
1 January 2017Deferred tax liabilities 725,283 (69) 725,214Deferred tax assets (227,884) 69 (227,815)
497,399 – 497,399
As at 31 December 2018, deferred tax liabilities amounting to $4.5 million (2017: $4.6 million; 1 January 2017: $5.0 million) had not been recognised for taxes that would be payable on the undistributed earnings of certain subsidiaries as these earnings would not be distributed in the foreseeable future.
A deferred tax asset is recognised to the extent that it is probable that future taxable profits will be available against which temporary differences can be utilised. Deferred tax assets are reviewed at each reporting date and are reduced to the extent that it is no longer probable that the related tax benefit will be realised. The Group has not recognised deferred tax assets in respect of the following:
2018 20171 Jan 2017
$’000 $’000 $’000
Deductible temporary differences 298,448 476,143 438,569Tax losses 1,005,657 668,397 583,476Unutilised capital allowances 6,912 2,012 3,899
1,311,017 1,146,552 1,025,944
NOTES TO THEFINANCIAL STATEMENTS
FINANCIALS & ADDITIONAL INFORMATIONC
apit
aLan
d L
imit
edA
nnua
l Rep
ort
2018
198
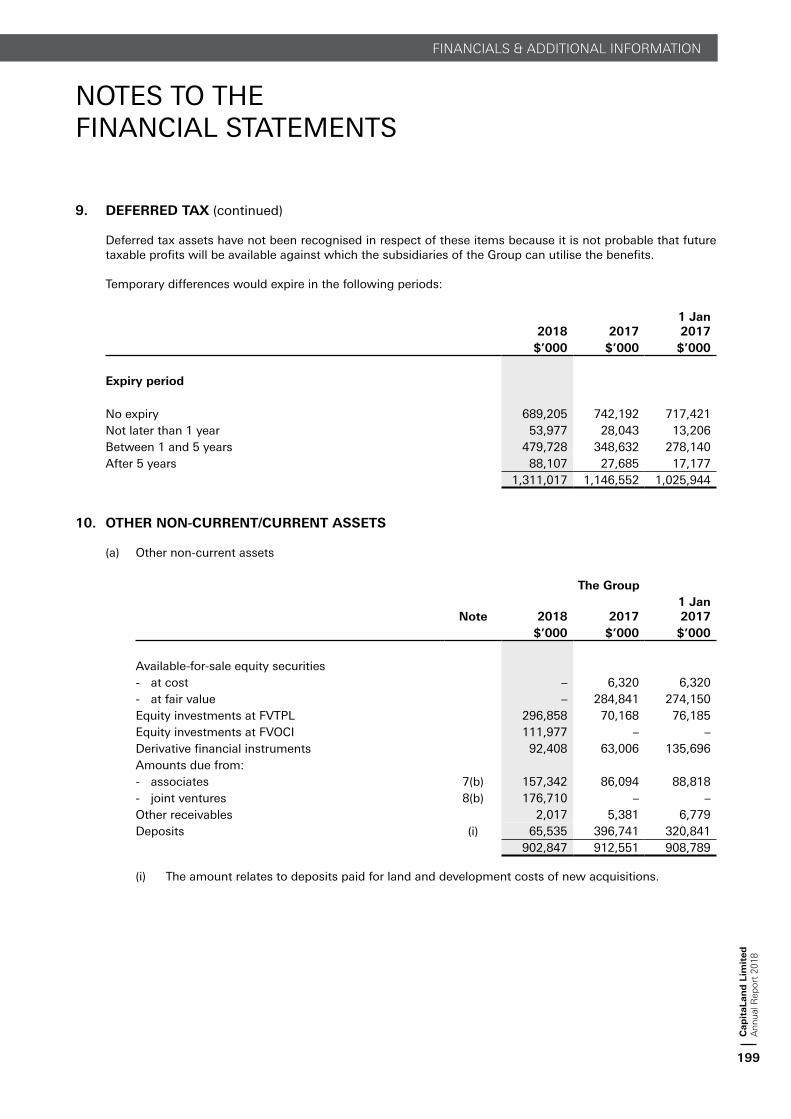
9. DEFERRED TAX (continued)
Deferred tax assets have not been recognised in respect of these items because it is not probable that future taxable profits will be available against which the subsidiaries of the Group can utilise the benefits.
Temporary differences would expire in the following periods:
2018 20171 Jan 2017
$’000 $’000 $’000
Expiry period
No expiry 689,205 742,192 717,421Not later than 1 year 53,977 28,043 13,206Between 1 and 5 years 479,728 348,632 278,140After 5 years 88,107 27,685 17,177
1,311,017 1,146,552 1,025,944
10. OTHER NON-CURRENT/CURRENT ASSETS
(a) Other non-current assets
The Group
Note 2018 20171 Jan 2017
$’000 $’000 $’000
Available-for-sale equity securities- at cost – 6,320 6,320- at fair value – 284,841 274,150Equity investments at FVTPL 296,858 70,168 76,185Equity investments at FVOCI 111,977 – –Derivative financial instruments 92,408 63,006 135,696Amounts due from:- associates 7(b) 157,342 86,094 88,818- joint ventures 8(b) 176,710 – –Other receivables 2,017 5,381 6,779Deposits (i) 65,535 396,741 320,841
902,847 912,551 908,789
(i) The amount relates to deposits paid for land and development costs of new acquisitions.
NOTES TO THEFINANCIAL STATEMENTS
FINANCIALS & ADDITIONAL INFORMATION
Cap
itaL
and
Lim
ited
Ann
ual R
epor
t 20
18
199

10. OTHER NON-CURRENT/CURRENT ASSETS (continued)
(b) Other current assets
The Group
Note 2018 20171 Jan 2017
$’000 $’000 $’000
Derivative financial instruments 5,821 34,499 2,134Contract cost (i) 22,916 24,866 11,867Total 28,737 59,365 14,001
(i) Contract cost relates to commission fees paid to property agents and legal fees for securing sale contracts which were capitalised during the year. The capitalised costs are amortised when the related revenue is recognised. During the year, $13.3 million (2017: $2.2 million) was amortised and there was no impairment loss in relation to the costs capitalised.
11. DEVELOPMENT PROPERTIES FOR SALE AND STOCKS
The Group
2018 20171 Jan 2017
$’000 $’000 $’000
(a) Properties under development, units for which revenue is recognised over time
Land and land related cost 815,458 134,296 381,232Development costs 2,260 9,797 125,987
817,718 144,093 507,219Allowance for foreseeable losses (44,956) (102,364) (188,246)
772,762 41,729 318,973Properties under development, units for which
revenue is recognised at a point in time
Land and land related costs 2,270,562 1,853,951 1,909,296Development costs 1,349,701 1,109,937 638,665
3,620,263 2,963,888 2,547,961Allowance for foreseeable losses – (141) (34,650)
3,620,263 2,963,747 2,513,311
Properties under development 4,393,025 3,005,476 2,832,284
NOTES TO THEFINANCIAL STATEMENTS
FINANCIALS & ADDITIONAL INFORMATIONC
apit
aLan
d L
imit
edA
nnua
l Rep
ort
2018
200

11. DEVELOPMENT PROPERTIES FOR SALE AND STOCKS (continued)
The Group
2018 20171 Jan 2017
$’000 $’000 $’000
(b) Completed development properties, at cost 746,884 1,012,752 2,070,784Allowance for foreseeable losses (12,130) (41,951) (72,776)Completed development properties 734,754 970,801 1,998,008
(c) Consumable stocks 772 729 590
Total development properties for sale and stocks 5,128,551 3,977,006 4,830,882
(d) The Group adopts the percentage of completion method of revenue recognition for residential projects under progressive payment scheme in Singapore. The stage of completion is measured in accordance with the accounting policy stated in note 2.15. Significant assumptions are required in determining the stage of completion and the total estimated development costs. In making the assumptions, the Group evaluates them by relying on past experience and the work of specialists.
The Group makes allowance for foreseeable losses by applying its experience in estimating the net realisable values of completed units and properties under development. References were made to comparable properties, timing of sale launches, location of property, management’s expected net selling prices and estimated development expenditure. Market conditions may, however, change which may affect the future selling prices of the remaining unsold units of the development properties and accordingly, the carrying value of development properties for sale may have to be written down in future periods.
(e) As at 31 December 2018, development properties for sale amounting to approximately $2,313.3 million (2017: $1,148.2 million; 1 January 2017: $1,665.3 million) were mortgaged to banks to secure credit facilities of the Group (note 19).
(f) During the financial year, the following amounts were capitalised as cost of development properties for sale:
The Group
Note 2018 20171 Jan 2017
$’000 $’000 $’000
Staff costs 27(b) 14,614 22,011 32,042Interest costs paid/payable 27(d) 28,127 38,060 38,587Less:Interest income received/receivable from project
fixed deposit accounts 27(a) (238) (120) (438)42,503 59,951 70,191
NOTES TO THEFINANCIAL STATEMENTS
FINANCIALS & ADDITIONAL INFORMATION
Cap
itaL
and
Lim
ited
Ann
ual R
epor
t 20
18
201

11. DEVELOPMENT PROPERTIES FOR SALE AND STOCKS (continued)
Movements in allowance for foreseeable losses in respect of development properties for sale were as follows:
The GroupNote 2018 2017
$’000 $’000
At 1 January (144,456) (295,672)Reversal during the year 27(c)(i) 43,462 27,676Utilisation during the year 43,906 116,311Disposal of a subsidiary – 6,883Translation differences 2 346At 31 December (57,086) (144,456)
12. TRADE AND OTHER RECEIVABLES
The Group The Company
Note 2018 20171 Jan 2017 2018 2017
1 Jan 2017
$’000 $’000 $’000 $’000 $’000 $’000
Trade receivables 13 227,090 294,689 343,471 84 204 2Deposits and other
receivables 14 481,754 518,618 371,445 497 162 142Amounts due from:- subsidiaries 18 – – – 1,165,484 1,972,946 1,112,659- associates 7(b) 37,617 120,066 503,480 – – –- joint ventures 8(b) 63,652 50,959 87,342 – – –- investee (non-trade) (b) 118,452 – – – – –- non-controlling
interests (non-trade) (c) 145,934 170,042 158,850 – – –1,074,499 1,154,374 1,464,588 1,166,065 1,973,312 1,112,803
Prepayments (d) 869,565 307,263 269,465 420 1,474 4081,944,064 1,461,637 1,734,053 1,166,485 1,974,786 1,113,211
(a) As at 31 December 2018, certain trade and other receivables amounting to approximately $2.9 million (2017: $68.9 million; 1 January 2017: $173.6 million) were mortgaged to banks to secure credit facilities of the Group (note 19).
(b) Amount due from an investee is unsecured, interest-bearing and effective interest rate for the interest-bearing loan to an investee is 8.00% per annum.
(c) Amounts due from non-controlling interests are unsecured, interest-free and repayable on demand.
(d) As at 31 December 2018, prepayments of $650.2 million (2017: $133.5 million; 1 January 2017: $147.9 million) were made for the acquisition of shares and land, pending completion of transactions.
NOTES TO THEFINANCIAL STATEMENTS
FINANCIALS & ADDITIONAL INFORMATIONC
apit
aLan
d L
imit
edA
nnua
l Rep
ort
2018
202

13. TRADE RECEIVABLES
The Group The Company
Note 2018 20171 Jan 2017 2018 2017
1 Jan 2017
$’000 $’000 $’000 $’000 $’000 $’000
Trade receivables 241,957 305,226 351,939 84 204 2Less:Allowance for
impairment loss on receivables 33 (14,867) (10,537) (8,468) – – –
12 227,090 294,689 343,471 84 204 2
The Group and the Company’s exposure to credit and currency risks, and impairment losses for trade and other receivables, are disclosed in note 33.
14. DEPOSITS AND OTHER RECEIVABLES
The Group The Company
Note 2018 20171 Jan 2017 2018 2017
1 Jan 2017
$’000 $’000 $’000 $’000 $’000 $’000
Deposits (a) 48,847 340,124 270,897 458 110 126
Other receivables 434,455 187,011 111,554 39 52 16Less:Allowance for
impairment loss on receivables 33 (15,392) (19,205) (17,834) – – –
419,063 167,806 93,720 39 52 16Tax recoverable 13,844 10,688 6,828 – – –
12 481,754 518,618 371,445 497 162 142
(a) As at 31 December 2018, deposits included $27.4 million (2017: $293.3 million; 1 January 2017: $255.6 million) paid for new investments.
NOTES TO THEFINANCIAL STATEMENTS
FINANCIALS & ADDITIONAL INFORMATION
Cap
itaL
and
Lim
ited
Ann
ual R
epor
t 20
18
203
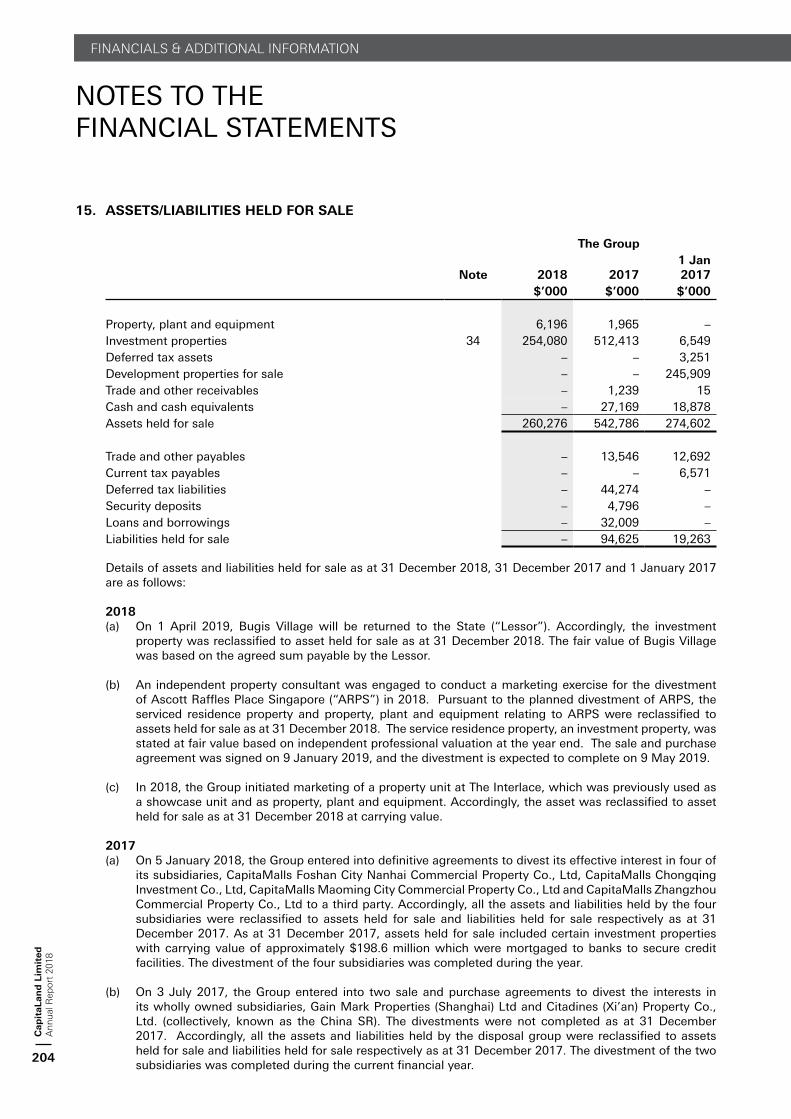
15. ASSETS/LIABILITIES HELD FOR SALE
The Group
Note 2018 20171 Jan 2017
$’000 $’000 $’000
Property, plant and equipment 6,196 1,965 –Investment properties 34 254,080 512,413 6,549Deferred tax assets – – 3,251Development properties for sale – – 245,909Trade and other receivables – 1,239 15Cash and cash equivalents – 27,169 18,878Assets held for sale 260,276 542,786 274,602
Trade and other payables – 13,546 12,692Current tax payables – – 6,571Deferred tax liabilities – 44,274 –Security deposits – 4,796 –Loans and borrowings – 32,009 –Liabilities held for sale – 94,625 19,263
Details of assets and liabilities held for sale as at 31 December 2018, 31 December 2017 and 1 January 2017 are as follows:
2018(a) On 1 April 2019, Bugis Village will be returned to the State (“Lessor”). Accordingly, the investment
property was reclassified to asset held for sale as at 31 December 2018. The fair value of Bugis Village was based on the agreed sum payable by the Lessor.
(b) An independent property consultant was engaged to conduct a marketing exercise for the divestment of Ascott Raffles Place Singapore (“ARPS”) in 2018. Pursuant to the planned divestment of ARPS, the serviced residence property and property, plant and equipment relating to ARPS were reclassified to assets held for sale as at 31 December 2018. The service residence property, an investment property, was stated at fair value based on independent professional valuation at the year end. The sale and purchase agreement was signed on 9 January 2019, and the divestment is expected to complete on 9 May 2019.
(c) In 2018, the Group initiated marketing of a property unit at The Interlace, which was previously used as a showcase unit and as property, plant and equipment. Accordingly, the asset was reclassified to asset held for sale as at 31 December 2018 at carrying value.
2017(a) On 5 January 2018, the Group entered into definitive agreements to divest its effective interest in four of
its subsidiaries, CapitaMalls Foshan City Nanhai Commercial Property Co., Ltd, CapitaMalls Chongqing Investment Co., Ltd, CapitaMalls Maoming City Commercial Property Co., Ltd and CapitaMalls Zhangzhou Commercial Property Co., Ltd to a third party. Accordingly, all the assets and liabilities held by the four subsidiaries were reclassified to assets held for sale and liabilities held for sale respectively as at 31 December 2017. As at 31 December 2017, assets held for sale included certain investment properties with carrying value of approximately $198.6 million which were mortgaged to banks to secure credit facilities. The divestment of the four subsidiaries was completed during the year.
(b) On 3 July 2017, the Group entered into two sale and purchase agreements to divest the interests in its wholly owned subsidiaries, Gain Mark Properties (Shanghai) Ltd and Citadines (Xi’an) Property Co., Ltd. (collectively, known as the China SR). The divestments were not completed as at 31 December 2017. Accordingly, all the assets and liabilities held by the disposal group were reclassified to assets held for sale and liabilities held for sale respectively as at 31 December 2017. The divestment of the two subsidiaries was completed during the current financial year.
NOTES TO THEFINANCIAL STATEMENTS
FINANCIALS & ADDITIONAL INFORMATIONC
apit
aLan
d L
imit
edA
nnua
l Rep
ort
2018
204

15. ASSETS/LIABILITIES HELD FOR SALE (continued)
1 January 2017(a) In 2013, a subsidiary of the Group, ART, launched the strata sale of the 81 individual units in Somerset
Grand Fortune Garden Property Beijing, China (SFG). In view of ART’s commitment to the strata sale plan, the investment property was reclassified to assets held for sale in 2013 and will remain in assets held for sale until the completion of the strata sale. As at 31 December 2017, all remaining units had been divested.
(b) On 16 January 2017, the Group disposed its entire interest in a wholly owned subsidiary. Nassim Hill Realty Pte Ltd (The Nassim), to a third party. Accordingly, all the assets and liabilities held by The Nassim were reclassified to assets held for sale and liabilities held for sale respectively as at 31 December 2016 at cost. The disposal of The Nassim was completed in the last financial year.
16. CASH AND CASH EQUIVALENTS
The Group The Company
Note 2018 20171 Jan 2017 2018 2017
1 Jan 2017
$’000 $’000 $’000 $’000 $’000 $’000
Fixed deposits 2,500,832 4,315,458 3,336,201 – – –Cash at banks and in
hand 2,559,007 1,789,860 1,456,428 15,156 7,247 7,791Cash and cash
equivalents 5,059,839 6,105,318 4,792,629 15,156 7,247 7,791Restricted bank
deposits (a) (55,084) (25,813) (14,877)Cash and cash
equivalents in the statement of cash flows 5,004,755 6,079,505 4,777,752
(a) These are deposit placed in escrow account for acquisition of a subsidiary and bank balances of certain subsidiaries pledged in relation to bankers’ guarantees issued to the subsidiaries’ contractors and banking facilities.
(b) As at 31 December 2018, the Group’s cash and cash equivalents of $59.5 million (2017: $229.0 million; 1 January 2017: $400.6 million) were held under project accounts and withdrawals from which are restricted to payments for expenditure incurred on projects.
(c) The Group’s cash and cash equivalents are held mainly in Singapore Dollars, US Dollars, Chinese Renminbi and Japanese Yen. As at 31 December 2018, the effective interest rates for cash and cash equivalents ranged from 0% to 7% (2017: 0% to 8.75%; 1 January 2017: 0% to 8.75%) per annum. The interest rate of 7% (2017: 8.75%) relates to Indian Rupee where the cash balance was not significant.
The cash and cash equivalents are placed with banks and financial institutions which meet the appropriate credit criteria.
NOTES TO THEFINANCIAL STATEMENTS
FINANCIALS & ADDITIONAL INFORMATION
Cap
itaL
and
Lim
ited
Ann
ual R
epor
t 20
18
205

17. TRADE AND OTHER PAYABLES
The Group The Company
Note 2018 20171 Jan 2017 2018 2017
1 Jan 2017
$’000 $’000 $’000 $’000 $’000 $’000
Trade payables 221,493 271,113 155,943 2,161 4,533 2,284Accruals (a) 790,369 653,277 496,375 37,152 53,955 45,843Accrued development
expenditure 753,905 690,318 827,560 – – –Other payables (b) 905,280 495,217 567,766 1,359 2,241 1,661Rental and other
deposits 274,451 309,398 143,625 – – –Derivative financial
instruments 60,381 10,839 7,650 – – –Liability for employee
benefits 22 39,486 33,550 24,043 3,051 5,565 6,600Amounts due to:- subsidiaries 18 – – – 217,808 820,124 71,405- associates 7(c) 480,238 287,241 258,341 – – –- joint ventures 8(d) 278,862 209,398 213,109 – – –Non-controlling
interests (unsecured):
- interest free 13,004 82,215 113,355 – – –- interest bearing (c) 24,437 24,671 23,737 – – –
3,841,906 3,067,237 2,831,504 261,531 886,418 127,793
(a) Accruals included accrued operating expenses $416.7 million (2017: $345.4 million; 1 January 2017: $270.9 million), accrued interest payable $126.6 million (2017: $103.3 million; 1 January 2017: $74.5 million) as well as accrued expenditure for tax and administrative expenses which are individually immaterial.
(b) Other payables included retention sums and amounts payable in connection with capital expenditure incurred and deferred purchase consideration for acquisition of subsidiaries.
(c) The effective interest rates for amounts due to non-controlling interest ranged from 3.23% to 6.38% (2017: 2.52% to 6.38%; 1 January 2017: 2.17% to 6.38%) per annum.
NOTES TO THEFINANCIAL STATEMENTS
FINANCIALS & ADDITIONAL INFORMATIONC
apit
aLan
d L
imit
edA
nnua
l Rep
ort
2018
206

18. AMOUNTS DUE FROM/(TO) SUBSIDIARIES
The Company
Note 2018 20171 Jan 2017
$’000 $’000 $’000
(a) CurrentAmounts due from subsidiaries:- current accounts, mainly trade 126,471 79,602 39,912- loans - interest free 53,033 87,904 85,158 - interest bearing 1,027,583 1,839,368 1,021,030
1,080,616 1,927,272 1,106,188Less:Allowance for impairment loss on receivables 33 (41,603) (33,928) (33,441)
1,039,013 1,893,344 1,072,74712 1,165,484 1,972,946 1,112,659
Amounts due to subsidiaries:- loans, interest free (217,326) (818,772) (71,395)- current accounts, mainly trade (482) (1,352) (10)
17 (217,808) (820,124) (71,405)
All balances with subsidiaries are unsecured and repayable on demand. The interest-bearing loans due from a subsidiary bore effective interest rates ranging from 1.42% to 2.95% (2017: 0.68% to 1.95%; 1 January 2017: 0.52% to 2.95%) per annum.
The Company’s exposure to credit risks, for amount due from subsidiaries are disclosed in note 33.
The Company
Note 2018 20171 Jan 2017
$’000 $’000 $’000
(b) Non-CurrentAmounts due to subsidiary: - interest free 21 (605,408) – –
The amount due to a subsidiary is unsecured, interest free and not expected to be repaid within twelve months from 31 December 2018.
NOTES TO THEFINANCIAL STATEMENTS
FINANCIALS & ADDITIONAL INFORMATION
Cap
itaL
and
Lim
ited
Ann
ual R
epor
t 20
18
207
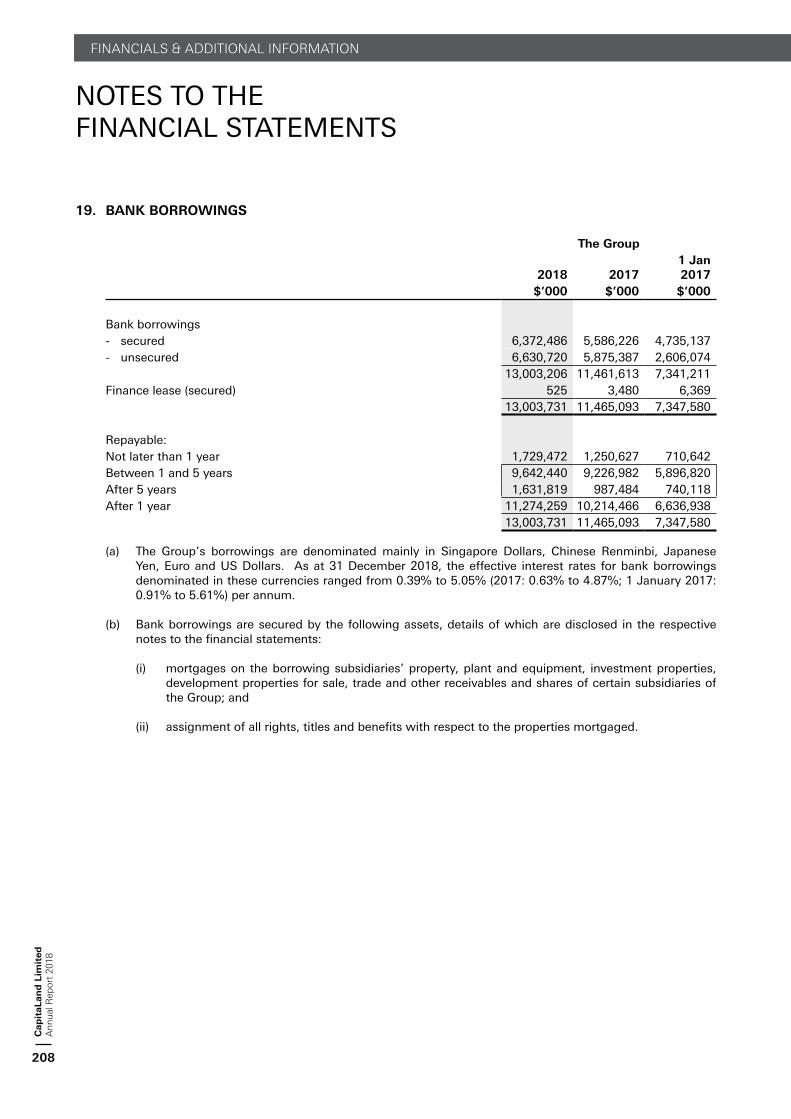
19. BANK BORROWINGS
The Group
2018 20171 Jan 2017
$’000 $’000 $’000
Bank borrowings- secured 6,372,486 5,586,226 4,735,137- unsecured 6,630,720 5,875,387 2,606,074
13,003,206 11,461,613 7,341,211Finance lease (secured) 525 3,480 6,369
13,003,731 11,465,093 7,347,580
Repayable:Not later than 1 year 1,729,472 1,250,627 710,642Between 1 and 5 years 9,642,440 9,226,982 5,896,820After 5 years 1,631,819 987,484 740,118After 1 year 11,274,259 10,214,466 6,636,938
13,003,731 11,465,093 7,347,580
(a) The Group’s borrowings are denominated mainly in Singapore Dollars, Chinese Renminbi, Japanese Yen, Euro and US Dollars. As at 31 December 2018, the effective interest rates for bank borrowings denominated in these currencies ranged from 0.39% to 5.05% (2017: 0.63% to 4.87%; 1 January 2017: 0.91% to 5.61%) per annum.
(b) Bank borrowings are secured by the following assets, details of which are disclosed in the respective notes to the financial statements:
(i) mortgages on the borrowing subsidiaries’ property, plant and equipment, investment properties, development properties for sale, trade and other receivables and shares of certain subsidiaries of the Group; and
(ii) assignment of all rights, titles and benefits with respect to the properties mortgaged.
NOTES TO THEFINANCIAL STATEMENTS
FINANCIALS & ADDITIONAL INFORMATIONC
apit
aLan
d L
imit
edA
nnua
l Rep
ort
2018
208

19.
BA
NK
BO
RR
OW
ING
S (
con
tin
ued
)
(c)
The
reco
nci
liati
on
of
liab
iliti
es a
risi
ng
fro
m fi
nan
cin
g a
ctiv
itie
s w
ere
as f
ollo
ws:
Non
-cas
h c
han
ges
Note
At
1/1
/20
18
Fin
anci
ng
ca
shfl
ow
s *
Acq
uis
itio
n
of
sub
sid
iari
esD
isp
osa
l of
subs
idia
ries@
Conve
rsio
n
of
conve
rtib
le
bon
ds
Ch
ang
es in
fa
ir v
alu
e
Am
ortisa
tion
of
bon
d
dis
cou
nt
Fore
ign
ex
chan
ge
move
men
tO
ther
sA
t 31/1
2/2
018
$’0
00
$’0
00
$’0
00
$’0
00
$’0
00
$’0
00
$’0
00
$’0
00
$’0
00
$’0
00
The
Gro
up
Ban
k b
orr
owin
gs#
11
,49
3,6
22
1,2
79
,89
93
48
,06
6(5
0,2
10
)–
––
(70,1
34)
1,9
63
13,0
03,2
06
Deb
t se
curi
ties
20
10
,22
9,8
36
37
6,6
41
––
––
16,5
31
5,2
07
1,9
99
10,6
30,2
14
Fin
ance
leas
e1
93
,48
0(2
,93
1)
––
––
–(2
4)
–525
Der
ivat
ive
liab
iliti
es1
58
,36
9–
––
–(2
9,4
40)
––
–128,9
29
Der
ivat
ive
asse
ts(9
2,2
97
)–
––
–(1
,134)
––
–(9
3,4
31)
Non
-cas
h c
han
ges
Note
At
1/1
/20
17
Fin
anci
ng
ca
shfl
ow
s *
Acq
uis
itio
n
of
sub
sid
iari
esD
isp
osa
l of
subs
idia
ries@
Conve
rsio
n
of
conve
rtib
le
bon
ds
Ch
ang
es in
fa
ir v
alu
e
Am
ortisa
tion
of
bon
d
dis
cou
nt
Fore
ign
ex
chan
ge
move
men
tO
ther
sA
t 31/1
2/2
017
$’0
00
$’0
00
$’0
00
$’0
00
$’0
00
$’0
00
$’0
00
$’0
00
$’0
00
$’0
00
The
Gro
up
Ban
k b
orr
owin
gs#
7,3
41
,211
2,1
72
,86
92
,08
2,3
27
(39
,19
9)
––
–(6
6,7
51)
3,1
65
11,4
93,6
22
Deb
t se
curi
ties
20
7,5
04
,79
6(4
64
,80
7)
3,4
26
,72
8–
(17
4,5
90
)–
21,1
01
(86,2
42)
2,8
50
10,2
29,8
36
Fin
ance
leas
e1
96
,36
9(3
,16
5)
––
––
–276
–3,4
80
Der
ivat
ive
liab
iliti
es5
2,2
04
–5
8,2
12
––
47,9
53
––
–158,3
69
Der
ivat
ive
asse
ts(1
35
,95
3)
–(8
7,6
90
)–
–1
31,3
46
––
–(9
2,2
97)
* C
ash
flow
fro
m fi
nan
cin
g a
ctiv
itie
s p
rese
nte
d in
th
e co
nso
lidat
ed s
tate
men
t o
f ca
sh fl
ows
incl
ud
e in
tere
st e
xpen
se p
aid
of
$731.7
mill
ion
(2017: $
525.1
mill
ion
) wh
ich
are
incl
ud
ed u
nd
er a
ccru
als,
am
ou
nt
du
e to
ass
oci
ates
an
d jo
int
ven
ture
s o
f n
ote
17 -
tra
de
and
oth
er p
ayab
les.
Th
ere
are
no
mat
eria
l no
n-c
ash
ch
ang
es a
sso
ciat
ed w
ith
inte
rest
pay
able
s.#
Incl
ud
es b
orr
owin
gs
of
$32.0
mill
ion
un
der
liab
iliti
es h
eld
fo
r sa
le a
s at
31 D
ecem
ber
2017 a
nd
1 J
anu
ary
2018.
@
Incl
ud
es b
orr
owin
gs
of
$20.0
mill
ion
un
der
liab
iliti
es h
eld
fo
r sa
le.
NO
TES
TO
TH
EFI
NA
NC
IAL
STA
TEM
EN
TS
FINANCIALS & ADDITIONAL INFORMATION
Cap
itaL
and
Lim
ited
Ann
ual R
epor
t 20
18
209
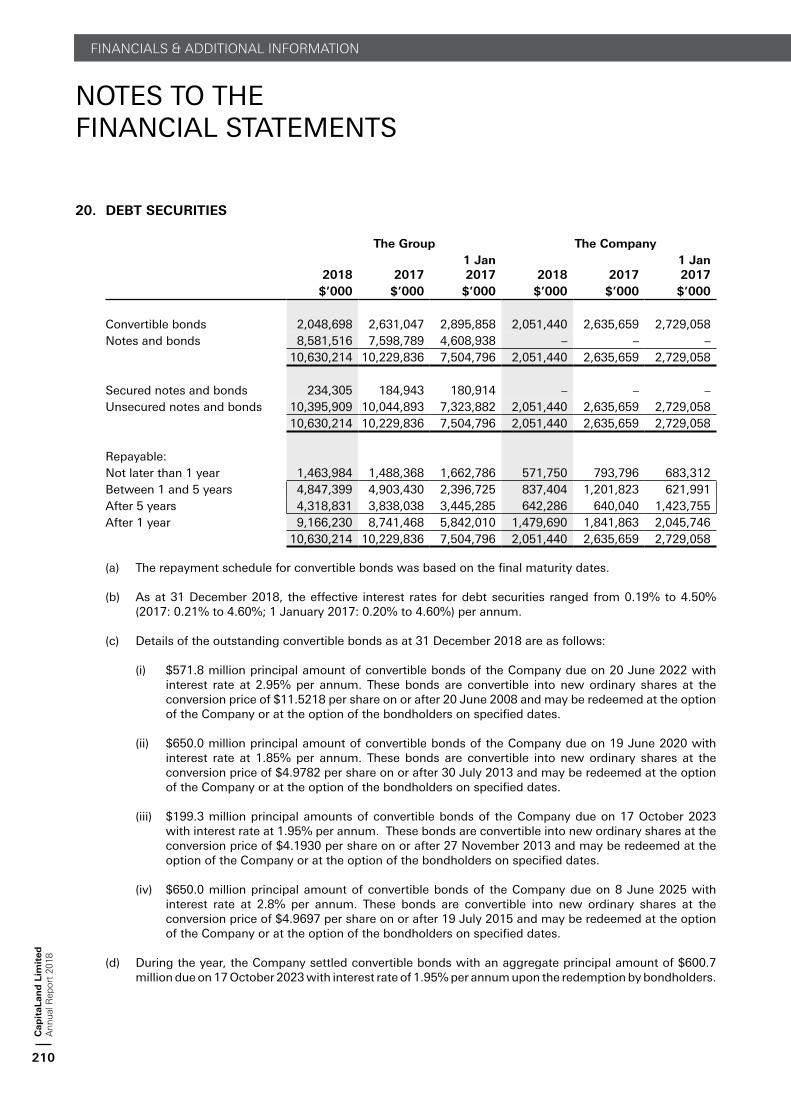
20. DEBT SECURITIES
The Group The Company
2018 20171 Jan 2017 2018 2017
1 Jan 2017
$’000 $’000 $’000 $’000 $’000 $’000
Convertible bonds 2,048,698 2,631,047 2,895,858 2,051,440 2,635,659 2,729,058Notes and bonds 8,581,516 7,598,789 4,608,938 – – –
10,630,214 10,229,836 7,504,796 2,051,440 2,635,659 2,729,058
Secured notes and bonds 234,305 184,943 180,914 – – –Unsecured notes and bonds 10,395,909 10,044,893 7,323,882 2,051,440 2,635,659 2,729,058
10,630,214 10,229,836 7,504,796 2,051,440 2,635,659 2,729,058
Repayable:Not later than 1 year 1,463,984 1,488,368 1,662,786 571,750 793,796 683,312Between 1 and 5 years 4,847,399 4,903,430 2,396,725 837,404 1,201,823 621,991After 5 years 4,318,831 3,838,038 3,445,285 642,286 640,040 1,423,755After 1 year 9,166,230 8,741,468 5,842,010 1,479,690 1,841,863 2,045,746
10,630,214 10,229,836 7,504,796 2,051,440 2,635,659 2,729,058
(a) The repayment schedule for convertible bonds was based on the final maturity dates.
(b) As at 31 December 2018, the effective interest rates for debt securities ranged from 0.19% to 4.50% (2017: 0.21% to 4.60%; 1 January 2017: 0.20% to 4.60%) per annum.
(c) Details of the outstanding convertible bonds as at 31 December 2018 are as follows:
(i) $571.8 million principal amount of convertible bonds of the Company due on 20 June 2022 with interest rate at 2.95% per annum. These bonds are convertible into new ordinary shares at the conversion price of $11.5218 per share on or after 20 June 2008 and may be redeemed at the option of the Company or at the option of the bondholders on specified dates.
(ii) $650.0 million principal amount of convertible bonds of the Company due on 19 June 2020 with interest rate at 1.85% per annum. These bonds are convertible into new ordinary shares at the conversion price of $4.9782 per share on or after 30 July 2013 and may be redeemed at the option of the Company or at the option of the bondholders on specified dates.
(iii) $199.3 million principal amounts of convertible bonds of the Company due on 17 October 2023 with interest rate at 1.95% per annum. These bonds are convertible into new ordinary shares at the conversion price of $4.1930 per share on or after 27 November 2013 and may be redeemed at the option of the Company or at the option of the bondholders on specified dates.
(iv) $650.0 million principal amount of convertible bonds of the Company due on 8 June 2025 with interest rate at 2.8% per annum. These bonds are convertible into new ordinary shares at the conversion price of $4.9697 per share on or after 19 July 2015 and may be redeemed at the option of the Company or at the option of the bondholders on specified dates.
(d) During the year, the Company settled convertible bonds with an aggregate principal amount of $600.7 million due on 17 October 2023 with interest rate of 1.95% per annum upon the redemption by bondholders.
NOTES TO THEFINANCIAL STATEMENTS
FINANCIALS & ADDITIONAL INFORMATIONC
apit
aLan
d L
imit
edA
nnua
l Rep
ort
2018
210

20. DEBT SECURITIES (continued)
(e) Notes and bonds
The Group’s notes and bonds are mainly issued by the Company, CapitaLand Treasury Limited, The Ascott Capital Limited, CapitaLand Mall Trust, Ascott Residence Trust, CapitaLand Commercial Trust, RCS Trust, CapitaLand Retail China Trust and CapitaLand Malaysia Mall Trust under their respective issuance programs. These notes and bonds were denominated mainly in Singapore Dollars, Malaysian Ringgit, Japanese Yen, Hong Kong Dollars, Euro and US Dollars. Saved for the secured notes and bonds below, the notes and bonds issued were unsecured.
As at 31 December 2018, the secured notes and bonds amounting to $234.3 million (2017: $184.9 million; 1 January 2017: $180.9 million) were fully secured by deposits pledged and mortgages on the investment properties of the Group. Details on assets pledged are disclosed in the respective notes to the financial statements.
21. OTHER NON-CURRENT LIABILITIES
The Group The Company
Note 2018 20171 Jan 2017 2018 2017
1 Jan 2017
$’000 $’000 $’000 $’000 $’000 $’000
Amounts due to non-controlling interests (unsecured):
- interest free 64,032 62,331 65,919 – – –- interest bearing (i) 44,233 43,904 – – – –Amounts due to:- a subsidiary 18 – – – 605,408 – –- an associate 7(c) – – 153,976 – – –- a joint venture 8(c) – 87,180 88,416 – – –Liability for employee
benefits 22 14,901 6,381 7,209 8,489 1,937 4,272Derivative financial
instruments 69,181 160,665 50,294 – – –Security deposits and
other non-current payables 346,300 331,874 141,919 235 235 –
Deferred income 5,146 10,517 4 – – –543,793 702,852 507,737 614,132 2,172 4,272
(i) As at 31 December 2018, the effective interest rates for the amounts due to non-controlling interests ranged from 2.50% to 5.50% (2017: 2.50% to 5.50%; 1 January 2017: 2.50% to 5.50%) per annum.
NOTES TO THEFINANCIAL STATEMENTS
FINANCIALS & ADDITIONAL INFORMATION
Cap
itaL
and
Lim
ited
Ann
ual R
epor
t 20
18
211

22. EMPLOYEE BENEFITS
The Group The Company
Note 2018 20171 Jan 2017 2018 2017
1 Jan 2017
$’000 $’000 $’000 $’000 $’000 $’000
Liability for short term accumulating compensated absences 12,543 12,264 7,597 1,068 1,940 1,249
Liability for staff incentive (a) 30,782 16,194 17,687 10,472 5,562 9,623
Liability for cash-settled share-based payments 11,062 11,473 5,968 – – –
54,387 39,931 31,252 11,540 7,502 10,872
Current 17 39,486 33,550 24,043 3,051 5,565 6,600Non-current 21 14,901 6,381 7,209 8,489 1,937 4,272
54,387 39,931 31,252 11,540 7,502 10,872
(a) Staff incentive
This relates to staff incentive which is based on the achievement of the Group’s financial performance and payable over a period of time.
(b) Equity compensation benefits
Share Plans of the Company
The CapitaLand Performance Share Plan 2010 (PSP 2010) and CapitaLand Restricted Share Plan 2010 (RSP 2010) were approved by the members of the Company at the Extraordinary General Meeting held on 16 April 2010. The duration of each share plan is 10 years commencing on 16 April 2010.
The ERCC of the Company has instituted a set of share ownership guidelines for members of senior management who receive shares under the CapitaLand Restricted Share Plan and CapitaLand Performance Share Plan. Under these guidelines, members of senior management are required to retain a portion of the total number of CapitaLand shares received under the two aforementioned share-based plans, which will vary according to their respective job grade and salary.
NOTES TO THEFINANCIAL STATEMENTS
FINANCIALS & ADDITIONAL INFORMATIONC
apit
aLan
d L
imit
edA
nnua
l Rep
ort
2018
212

22. EMPLOYEE BENEFITS (continued)
(b) Equity compensation benefits (continued)
Share Plans of the Company (continued)
The details of awards in the Company since commencement of the Share Plans were as follows:
<------------ Aggregate shares ------------->
Granted ReleasedLapsed/
Cancelled
Balance as of 31 December
2018No. of shares
No. of shares
No. of shares
No. ofshares
CapitaLand Performance Share Plan 2010 30,824,129 (1,179,122) (20,142,000) 9,503,007
CapitaLand Restricted Share Plan 2010 91,543,738 (52,854,075) (15,718,513) 22,971,150
The total number of new shares issued and/or to be issued pursuant to the 2010 Share Plans did not exceed 8% (2017: 8%) of the total number of shares (excluding treasury shares) in the capital of the Company.
CapitaLand Performance Share Plan 2010
This relates to compensation costs of the Company’s PSP 2010 reflecting the benefits accruing to the employees over the service period to which the performance criteria relate.
Movements in the number of shares outstanding under PSP 2010 were summarised below:
2018 2017(‘000) (‘000)
At 1 January 10,593 11,036Granted 2,970 4,046Released (559) –Lapsed/Cancelled (3,501) (4,489)At 31 December 9,503 10,593
The final number of shares to be released will depend on the achievement of pre-determined targets over a three-year performance period. No share will be released if the threshold targets are not met at the end of the performance period. Conversely, if superior targets are met, more shares than the baseline award could be delivered up to a maximum of 200% of the baseline award.
Recipients can receive fully paid shares, their equivalent cash value or combinations thereof, at no cost.
NOTES TO THEFINANCIAL STATEMENTS
FINANCIALS & ADDITIONAL INFORMATION
Cap
itaL
and
Lim
ited
Ann
ual R
epor
t 20
18
213

22. EMPLOYEE BENEFITS (continued)
(b) Equity compensation benefits (continued)
CapitaLand Performance Share Plan 2010 (continued)
The fair values of the shares are determined using Monte Carlo simulation method which projects future share price assuming log normal distribution based on Geometric Brownian Motion Theory at measurement date. The fair values and assumptions are set out below:
Year of award 2018 2017
Weighted average fair value of shares and assumptions
Weighted average fair value at measurement date $2.65 $3.57Expected volatility of Company’s share price based on 36
months closing share price prior to grant date 19.62% 19.94%Average volatility of companies in the peer group based on 36
months prior to grant date 28.63% 27.01%Share price at grant date $3.62 $3.69Risk-free interest rate equal to the implied yield on zero-coupon Singapore
Government bond with a term equal to the length of vesting period 1.94% 1.30%Expected dividend yield over the vesting period 3.27% to
3.43%3.00% to
3.60%Initial total shareholder return (TSR) performance based on historical TSR
performance of the Company and each company in the peer group 0.66% 23.43%Average correlation of Company’s TSR with those companies in
the peer group 52.45% 34.99%
CapitaLand Restricted Share Plan 2010 – Equity-settled/Cash-settled
This relates to compensation costs of the Company’s RSP 2010 reflecting the benefits accruing to the employees over the service period to which the performance criteria relate.
Movements in the number of shares outstanding under the RSP 2010 were summarised below:
2018 2017(‘000) (‘000)
At 1 January 22,432 20,544Granted 16,677 15,789Released@ (12,909) (11,402)Lapsed/Cancelled (3,229) (2,499)At 31 December 22,971 22,432
@ The number of shares released during the year was 12,908,954 (2017: 11,401,653) of which 2,269,948 (2017: 1,496,770) were cash-settled.
NOTES TO THEFINANCIAL STATEMENTS
FINANCIALS & ADDITIONAL INFORMATIONC
apit
aLan
d L
imit
edA
nnua
l Rep
ort
2018
214

22. EMPLOYEE BENEFITS (continued)
(b) Equity compensation benefits (continued)
CapitaLand Restricted Share Plan 2010 – Equity-settled/Cash-settled (continued)
As at 31 December 2018, the number of shares in awards granted under the RSP 2010 is as follows:
2018 2017Equity-settled
Cash- settled Total
Equity-settled
Cash- settled Total
(‘000) (‘000) (‘000) (‘000) (‘000) (‘000)
Final number of shares has not been determined (baseline award) # 7,839 1,977 9,816 8,280 2,439 10,719
Final number of shares determined but not released 10,386 2,769 13,155 9,896 1,817 11,713
18,225 4,746 22,971 18,176 4,256 22,432
# The final number of shares released could range from 0% to 150% of the baseline award.
The final number of shares to be released will depend on the achievement of pre-determined targets at the end of a one-year performance period. No share will be released if the threshold targets are not met at the end of the performance period. Conversely, if superior targets are met, more shares than the baseline award could be delivered up to a maximum of 150% of the baseline award. The shares have a vesting period of two to three years. Recipient can receive fully paid shares, their equivalent cash value or combinations thereof, at no cost. From 2014, an additional number of shares of a total value equal to the value of the accumulated dividends which are declared during each of the vesting periods and deemed forgone due to the vesting mechanism of the RSP 2010, will also be released upon the final vesting.
Cash-settled awards of shares are measured at their current fair values at each balance sheet date.
The fair values of the shares granted to employees are determined using Discounted Cashflow method at the measurement date. The fair values and assumptions are set out below:
Year of award 2018 2017
Weighted average fair value of shares and assumptions
Weighted average fair value at measurement date $3.40 $3.48Share price at grant date $3.62 $3.69Risk-free interest rate equal to the implied yield on zero-coupon
Singapore Government bond with a term equal to the length of vesting period
1.75% to 1.94%
1.04% to 1.60%
The fair value of the shares awarded to non-executive directors for the payment of directors’ fees in 2018 was $3.59 (2017: $3.59) which was the volume-weighted average price of a CapitaLand share on the SGX-ST over the 14 trading days from (and including) the ex-dividend date following the date of CapitaLand’s Annual General Meeting.
NOTES TO THEFINANCIAL STATEMENTS
FINANCIALS & ADDITIONAL INFORMATION
Cap
itaL
and
Lim
ited
Ann
ual R
epor
t 20
18
215

22. EMPLOYEE BENEFITS (continued)
(b) Equity compensation benefits (continued)
Unit-based Plans of Subsidiaries
(a) Ascott Residence Trust Management Limited (ARTML)
The ARTML Performance Unit Plan 2016 and the ARTML Restricted Unit Plan 2016 (collectively referred to as the “ARTML Unit Plans”) were approved by the Board of Directors of ARTML on 15 April 2016.
(b) CapitaLand Commercial Trust Management Limited (CCTML)
The CCTML Performance Unit Plan 2016 and the CCTML Restricted Unit Plan 2016 (collectively referred to as the “CCTML Unit Plans”) were approved by the Board of Directors of CCTML on 14 April 2016.
(c) CapitaLand Mall Trust Management Limited (CMTML)
The CMTML Performance Unit Plan 2016 and the CMTML Restricted Unit Plan 2016 (collectively referred to as the “CMTML Unit Plans”) were approved by the Board of Directors of CMTML on 15 April 2016.
(d) CapitaLand Retail China Trust Management Limited (CRCTML)
The CRCTML Performance Unit Plan 2016 and the CRCTML Restricted Unit Plan 2016 (collectively referred to as the “CRCTML Unit Plans”) were approved by the Board of Directors of CRCTML on 13 April 2016.
The Boards of ARTML, CCTML, CMTML and CRCTML have instituted a set of unit ownership guidelines for senior management who receive units under the ARTML Unit Plans, CCTML Unit Plans, CMTML Unit Plans and CRCTML Unit Plans (collectively referred to as “Subsidiary Unit Plans”) respectively. Under these guidelines, members of the senior management team are required to retain a portion of the total number of units received under the Subsidiary Unit Plans, which will vary according to their respective job grade and salary.
During the financial year ended 31 December 2018, the Group recognised share-based expenses in relation to the unit based plans of the Subsidiaries Unit Plans of $2,064,880 (2017: $1,303,897) in the profit or loss.
Performance Unit Plan 2016 of ARTML, CCTML, CMTML and CRCTML
This relates to compensation costs of the Performance Unit Plans of ARTML, CCTML, CMTML and CRCTML that reflects the benefits accruing to the participants over the service period to which the performance criteria relate.
The final number of units to be released will depend on the achievement of pre-determined relative total unitholder return targets over a three-year performance period. No unit will be released if the threshold targets are not met at the end of the performance period. Conversely, if superior targets are met, up to a maximum of 200% of the baseline award could be released. Participants receive fully paid units at no cost upon vesting.
NOTES TO THEFINANCIAL STATEMENTS
FINANCIALS & ADDITIONAL INFORMATIONC
apit
aLan
d L
imit
edA
nnua
l Rep
ort
2018
216

22. EMPLOYEE BENEFITS (continued)
(b) Equity compensation benefits (continued)
Restricted Unit Plan 2016 of ARTML, CCTML, CMTML and CRCTML
This relates to compensation costs of the Restricted Unit Plans for ARTML, CCTML, CMTML and CRCTML that reflects the benefits accruing to the participants over the service period to which the performance criteria relate.
The final number of units to be released will depend on the achievement of pre-determined distribution per unit and net property income or gross profit targets over a one-year performance period. No unit will be released if the threshold targets are not met at the end of the performance period. Conversely, if superior targets are met, up to a maximum of 150% of the baseline award could be released. The units will vest over three years. Participants receive fully paid units at no cost upon vesting. An additional number of units of a total value equal to the value of the accumulated distributions which are declared during each of the vesting periods and deemed forgone due to the vesting mechanism of the Restricted Unit Plans, will also be released upon the final vesting.
Units vested to participants will be delivered using existing units held by ARTML, CCTML, CMTML and CRCTML. No new units will be issued by the respective REITs to meet the obligations under the unit based plans of the Subsidiaries.
23. SHARE CAPITAL
The Company2018 2017
No. of shares
No. of shares
Issued and fully paid, with no par value (‘000) (‘000)
At 1 January and 31 December, including treasury shares 4,274,384 4,274,384Less: Treasury shares (111,570) (27,092)At 31 December, excluding treasury shares 4,162,814 4,247,292
(a) The holders of ordinary shares (excluding treasury shares) are entitled to receive dividends as declared from time to time and are entitled to one vote per share at meetings of the Company. All shares (excluding treasury shares) rank equally with regard to the Company’s residual assets.
(b) At 31 December 2018, there is a maximum of 19,006,014 (2017: 21,186,882) shares under the PSP 2010 and 23,599,024 (2017: 23,758,442) shares under the RSP 2010, details of which are disclosed in note 22(b).
(c) As at 31 December 2018, the convertible bonds issued by the Company which remained outstanding as follows:
Principal amount $ million
Final maturity date Year
Conversion price
$
Convertible intonew ordinary shares
No. of shares
650.00 2020 4.9782 130,569,282650.00 2025 4.9697 130,792,603571.75 2022 11.5218 49,623,322199.25 2023 4.1936 47,512,876
There has been no conversion of any of the above convertible bonds since the date of their respective issue.
NOTES TO THEFINANCIAL STATEMENTS
FINANCIALS & ADDITIONAL INFORMATION
Cap
itaL
and
Lim
ited
Ann
ual R
epor
t 20
18
217

23. SHARE CAPITAL (continued)
(d) Movements in the Company’s treasury shares were as follows:
The Company2018 2017
No. of shares
No. of shares
(‘000) (‘000)
At 1 January 27,091 36,996Purchase of treasury shares 95,677 –Treasury shares transferred pursuant to employee share plans (11,036) (9,749)Payment of directors’ fees (162) (156)At 31 December 111,570 27,091
Capital management
The Group’s policy is to build a strong capital base so as to maintain investor, creditor and market confidence and to sustain future development of the business. The Group monitors the return on capital, which the Group defines as total shareholders’ equity, excluding non-controlling interests, and the level of dividends to ordinary shareholders.
The Group also monitors capital using a net debt equity ratio, which is defined as net borrowings divided by total equity (including non-controlling interests).
The Group
2018 20171 Jan 2017
$’000 $’000 $’000
Bank borrowings and debt securities 23,633,945 21,694,929 14,852,376Cash and cash equivalents (5,059,839) (6,105,318) (4,792,629)Net debt 18,574,106 15,589,611 10,059,747Total equity 33,306,939 32,117,824 24,314,954Net debt equity ratio 0.56 0.49 0.41
The Group seeks to strike a balance between the higher returns that might be possible with higher level of borrowings and the liquidity and security afforded by a sound capital position.
In addition, the Company has a share purchase mandate as approved by its shareholders which allows the Company greater flexibility over its share capital structure with a view to improving, inter alia, its return on equity. The shares which are purchased are held as treasury shares which the Company may transfer for the purposes of or pursuant to its employee share-based incentive schemes so as to enable the Company to take advantage of tax deductions under the current taxation regime. The use of treasury shares in lieu of issuing new shares would also mitigate the dilution impact on existing shareholders.
NOTES TO THEFINANCIAL STATEMENTS
FINANCIALS & ADDITIONAL INFORMATIONC
apit
aLan
d L
imit
edA
nnua
l Rep
ort
2018
218
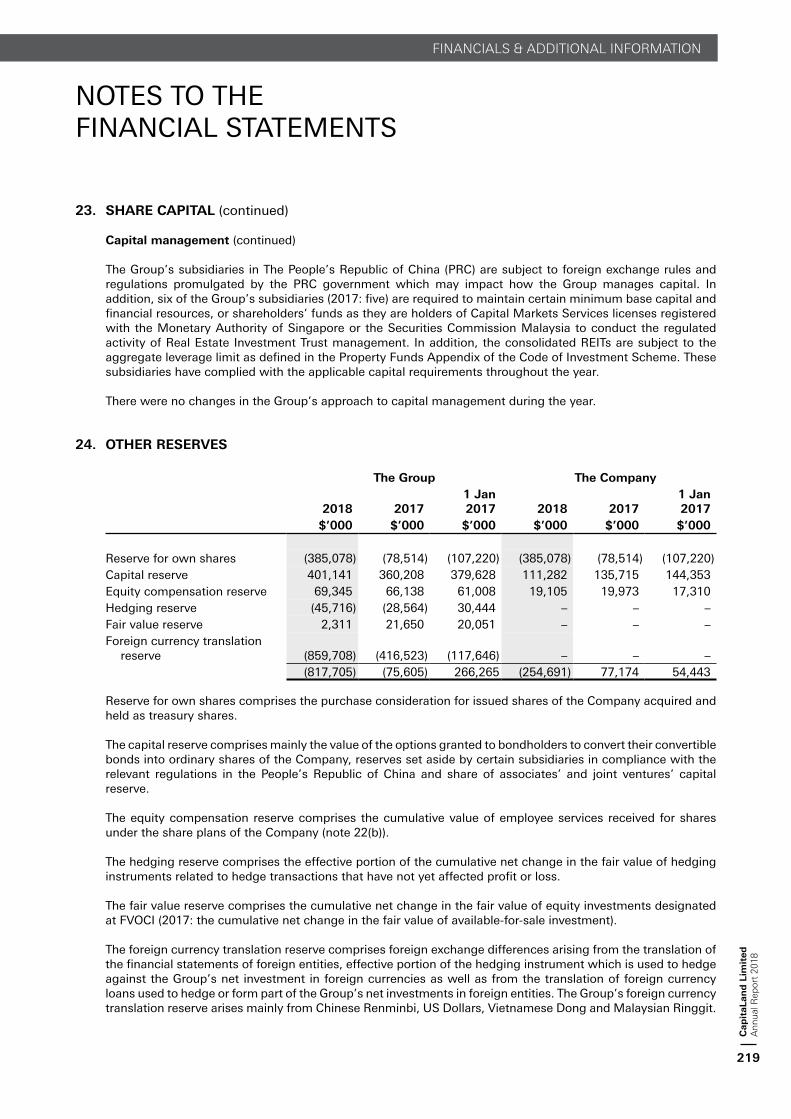
23. SHARE CAPITAL (continued)
Capital management (continued)
The Group’s subsidiaries in The People’s Republic of China (PRC) are subject to foreign exchange rules and regulations promulgated by the PRC government which may impact how the Group manages capital. In addition, six of the Group’s subsidiaries (2017: five) are required to maintain certain minimum base capital and financial resources, or shareholders’ funds as they are holders of Capital Markets Services licenses registered with the Monetary Authority of Singapore or the Securities Commission Malaysia to conduct the regulated activity of Real Estate Investment Trust management. In addition, the consolidated REITs are subject to the aggregate leverage limit as defined in the Property Funds Appendix of the Code of Investment Scheme. These subsidiaries have complied with the applicable capital requirements throughout the year.
There were no changes in the Group’s approach to capital management during the year.
24. OTHER RESERVES
The Group The Company
2018 20171 Jan 2017 2018 2017
1 Jan 2017
$’000 $’000 $’000 $’000 $’000 $’000
Reserve for own shares (385,078) (78,514) (107,220) (385,078) (78,514) (107,220)Capital reserve 401,141 360,208 379,628 111,282 135,715 144,353Equity compensation reserve 69,345 66,138 61,008 19,105 19,973 17,310Hedging reserve (45,716) (28,564) 30,444 – – –Fair value reserve 2,311 21,650 20,051 – – –Foreign currency translation
reserve (859,708) (416,523) (117,646) – – –(817,705) (75,605) 266,265 (254,691) 77,174 54,443
Reserve for own shares comprises the purchase consideration for issued shares of the Company acquired and held as treasury shares.
The capital reserve comprises mainly the value of the options granted to bondholders to convert their convertible bonds into ordinary shares of the Company, reserves set aside by certain subsidiaries in compliance with the relevant regulations in the People’s Republic of China and share of associates’ and joint ventures’ capital reserve.
The equity compensation reserve comprises the cumulative value of employee services received for shares under the share plans of the Company (note 22(b)).
The hedging reserve comprises the effective portion of the cumulative net change in the fair value of hedging instruments related to hedge transactions that have not yet affected profit or loss.
The fair value reserve comprises the cumulative net change in the fair value of equity investments designated at FVOCI (2017: the cumulative net change in the fair value of available-for-sale investment).
The foreign currency translation reserve comprises foreign exchange differences arising from the translation of the financial statements of foreign entities, effective portion of the hedging instrument which is used to hedge against the Group’s net investment in foreign currencies as well as from the translation of foreign currency loans used to hedge or form part of the Group’s net investments in foreign entities. The Group’s foreign currency translation reserve arises mainly from Chinese Renminbi, US Dollars, Vietnamese Dong and Malaysian Ringgit.
NOTES TO THEFINANCIAL STATEMENTS
FINANCIALS & ADDITIONAL INFORMATION
Cap
itaL
and
Lim
ited
Ann
ual R
epor
t 20
18
219

25. OTHER COMPREHENSIVE INCOME
2018 2017Before
taxTax
expenseNet
of taxBefore
taxTax
expenseNet of
tax$’000 $’000 $’000 $’000 $’000 $’000
The GroupExchange differences arising
from translation of foreign operations and foreign currency loans, forming part of net investment in foreign operations (252,117) – (252,117) (418,587) – (418,587)
Recognition of foreign exchange differences on disposal or liquidation of foreign operations in profit or loss 14,378 – 14,378 (704) – (704)
Change in fair value of available-for-sale investments – – – 3,456 – 3,456
Change in fair value of equity investments at fair value through other comprehensive income (4,047) – (4,047) – – –
Effective portion of change in fair value of cash flow hedges 17,823 – 17,823 (93,218) – (93,218)
Recognition of hedging reserve in profit or loss 9 – 9 – – –
Share of other comprehensive income of associates and joint ventures (327,533) – (327,533) 69,790 – 69,790
Recognition of share of other comprehensive income of associates and joint ventures in profit or loss – – – 29,519 – 29,519
(551,487) – (551,487) (409,744) – (409,744)
NOTES TO THEFINANCIAL STATEMENTS
FINANCIALS & ADDITIONAL INFORMATIONC
apit
aLan
d L
imit
edA
nnua
l Rep
ort
2018
220

26. REVENUE
Revenue of the Group and of the Company is analysed as follows:
The Group The Company2018 2017 2018 2017
$’000 $’000 $’000 $’000
Revenue from contract with customers 2,390,362 2,451,551 85,956 133,572Rental of investment properties:- Retail and commercial rental and related income 2,084,342 1,297,741 – –- Serviced residence rental and related income 1,100,266 860,774 – –Others 27,453 8,134 – –Dividend income from subsidiaries – – 446,449 401,074
5,602,423 4,618,200 532,405 534,646
(a) Disaggregation of revenue from contracts with customers:
The Group The CompanyDevelopment
properties for sale Fee income Total Fee income
2018 $’000 $’000 $’000 $’000
Primary segmentCL SMI 450,882 27,716 478,598 –CL China 1,611,419 191,483 1,802,902 –CL Vietnam 54,652 13,967 68,619 –CL International – 35,354 35,354 –Corporate and others – 4,889 4,889 85,956
2,116,953 273,409 2,390,362 85,956
Secondary segmentResidential and commercial strata 2,116,953 37,713 2,154,666 –Retail – 135,899 135,899 –Commercial – 20,943 20,943 –Lodging – 72,225 72,225 –Corporate and others – 6,629 6,629 85,956
2,116,953 273,409 2,390,362 85,956
Timing of revenue recognitionProducts transferred at a point in time 1,666,071 – 1,666,071 –Products and services transferred
over time 450,882 273,409 724,291 85,9562,116,953 273,409 2,390,362 85,956
NOTES TO THEFINANCIAL STATEMENTS
FINANCIALS & ADDITIONAL INFORMATION
Cap
itaL
and
Lim
ited
Ann
ual R
epor
t 20
18
221

26. REVENUE (continued)
(a) Disaggregation of revenue from contracts with customers: (continued)
The Group The CompanyDevelopment
properties for sale Fee income Total Fee income
2017 $’000 $’000 $’000 $’000
Primary segmentCL SMI 811,588 112,356 923,944 –CL China 1,251,942 211,749 1,463,691 –CL Vietnam 30,761 7,589 38,350 –CL International – 24,520 24,520 –Corporate and others – 1,046 1,046 133,572
2,094,291 357,260 2,451,551 133,572
Secondary segmentResidential and commercial strata 2,094,291 29,166 2,123,457 –Retail – 218,145 218,145 –Commercial – 45,142 45,142 –Lodging – 63,761 63,761 –Corporate and others – 1,046 1,046 133,572
2,094,291 357,260 2,451,551 133,572
Timing of revenue recognitionProducts transferred at a point in time 1,282,703 – 1,282,703 –Products and services transferred
over time 811,588 357,260 1,168,848 133,5722,094,291 357,260 2,451,551 133,572
(b) The following table provides information about contract assets and contract liabilities for contracts with customers.
The Group
2018 20171 Jan 2017
$’000 $’000 $’000
Contract assets (i) 24,805 166,017 152,777Contract liabilities (ii) (908,487) (1,680,597) (1,249,273)
(883,682) (1,514,580) (1,096,496)
(i) Contract assets
Contract assets relate primarily to the Group’s right to consideration for work completed but not billed at the reporting date in respect of its property development business. The contract assets are transferred to trade receivables when the rights become unconditional. This usually occurs when the Group invoices the customer.
The changes in contract assets are due to the differences between the agreed payment schedule and progress of the construction work.
NOTES TO THEFINANCIAL STATEMENTS
FINANCIALS & ADDITIONAL INFORMATIONC
apit
aLan
d L
imit
edA
nnua
l Rep
ort
2018
222

26. REVENUE (continued)
(ii) Contract liabilities
Contract liabilities relate primarily to: • advance consideration received from customers; and• progress billings issued in excess of the Group’s rights to the consideration.
The contract liabilities are recognised as revenue when the Group fulfils its performance obligation under the contract with the customer. The significant changes in the contract liabilities during the year are as follows:
The Group2018 2017
$’000 $’000
Revenue recognised that was included in contract liabilities at the beginning of the year 1,409,618 565,975
Increases due to cash received, excluding amounts recognised as revenue during the year (858,218) (1,553,009)
27. PROFIT BEFORE TAX
Profit before tax includes the following:
The Group The CompanyNote 2018 2017 2018 2017
$’000 $’000 $’000 $’000
(a) Other operating income
Interest income from:- deposits 68,603 54,331 217 96- subsidiaries – – 66,956 66,180- associates and joint ventures 7,950 6,614 – –- investee companies and others 11,691 1,222 – –- interest capitalised in
development properties for sale 11(f) (238) (120) – –Balance carried forward 88,006 62,047 67,173 66,276
NOTES TO THEFINANCIAL STATEMENTS
FINANCIALS & ADDITIONAL INFORMATION
Cap
itaL
and
Lim
ited
Ann
ual R
epor
t 20
18
223

27. PROFIT BEFORE TAX (continued)
Profit before tax includes the following: (continued)
The Group The CompanyNote 2018 2017 2018 2017
$’000 $’000 $’000 $’000
(a) Other operating income (continued)
Balance carried forward 88,006 62,047 67,173 66,276Dividend income 9,340 5,960 – –Foreign exchange gain – 7,913 17 51Mark-to-market gain on derivative
instruments – 1,074 – –Net fair value gains from investment
properties and assets held for sale 677,018 309,833 – –Gain on disposal/redemption of available-
for-sale financial assets – 5,720 – –Gain from bargain purchase arising from
acquisition of subsidiaries 31(b) – 26,941 – –Gain on disposal of property, plant and
equipment 189 820 108 17Gain from liquidation of subsidiary – – – 14Gain from change of ownership interest
in subsidiaries and associates 49,307 319,746* – –Gain on disposal of investment
properties 120,743 95,842 – –Reversal of allowance for impairment
loss on receivables from:- subsidiaries – – 500 209,132- joint venture – 411 – –- others – 82 – –Reversal of impairment of:- joint venture 8(a)(ii) – 1,800 – –- subsidiary 6(a)(iii) – – 18,022 –Others 45,425 12,479 1,489 1,360
990,028 850,668 87,309 276,850
* Includes gain arising from disposal of The Nassim of $160.9 million.
NOTES TO THEFINANCIAL STATEMENTS
FINANCIALS & ADDITIONAL INFORMATIONC
apit
aLan
d L
imit
edA
nnua
l Rep
ort
2018
224

27. PROFIT BEFORE TAX (continued)
Profit before tax includes the following: (continued)
The Group The CompanyNote 2018 2017 2018 2017
$’000 $’000 $’000 $’000
(b) Staff costs
Wages and salaries 562,136 490,001 53,026 79,330Contributions to defined contribution
plans 63,535 57,687 7,121 7,553Share-based expenses:- equity-settled 44,137 45,850 10,223 12,936- cash-settled 6,284 9,483 – –Increase/(Decrease) in liability
for short term accumulating compensated absences 402 1,872 (873) 691
Staff benefits, training/development costs and others 72,253 76,434 6,145 5,765
748,747 681,327 75,642 106,275Less:Staff costs capitalised in development
properties for sale 11(f) (14,614) (22,011) – –734,133 659,316 75,642 106,275
Recognised in:Cost of sales (c)(i) 513,908 426,820 – –Administrative expenses (c)(ii) 220,225 232,496 75,642 106,275
734,133 659,316 75,642 106,275
(c) (i) Cost of sales include:
Costs of development properties for sale 1,266,069 1,631,828 – –
Reversal of foreseeable losses on development properties for sale 11(g) (43,462) (27,676) – –
Operating expenses of investment properties that generated rental income 1,025,163 623,778 – –
Operating lease expenses 205,425 116,444 – –Staff costs (b) 513,908 426,820 – –
NOTES TO THEFINANCIAL STATEMENTS
FINANCIALS & ADDITIONAL INFORMATION
Cap
itaL
and
Lim
ited
Ann
ual R
epor
t 20
18
225

27. PROFIT BEFORE TAX (continued)
Profit before tax includes the following: (continued)
The Group The CompanyNote 2018 2017 2018 2017
$’000 $’000 $’000 $’000
(c)(ii) Administrative expenses include:
Allowance for impairment loss on trade receivables 4,977 4,219 – –
Amortisation of intangible assets 4 11,165 7,022 72 4,165Auditors’ remuneration:- auditors of the Company 4,127 3,794 877 667- other auditors 5,006 4,617 – –Non-audit fees:- auditors of the Company 855 1,187 40 18- other auditors 1,568 1,286 – –Depreciation of property,
plant and equipment 3 63,338 69,270 948 3,221Operating lease expenses 12,666 13,397 5,195 6,817Staff costs (b) 220,225 232,496 75,642 106,275
(c) (iii) Other operating expenses include:
Allowance for impairment on non-trade receivables 5,024 4,109 16,802 5,079
Foreign exchange loss 8,975 – – –Impairment loss on amounts due
from:- joint ventures 8(a)(ii) – 1,737 – –- associates 7(a)(i) 12,454 – – –Impairment and write off of
property, plant and equipment 938 1,473 – –Impairment of intangible assets 4 – 3,226 – –Mark-to-market loss on financial
asset designated as fair value through profit or loss 1,646 1,224 – –
NOTES TO THEFINANCIAL STATEMENTS
FINANCIALS & ADDITIONAL INFORMATIONC
apit
aLan
d L
imit
edA
nnua
l Rep
ort
2018
226

27. PROFIT BEFORE TAX (continued)
Profit before tax includes the following: (continued)
The Group The CompanyNote 2018 2017 2018 2017
$’000 $’000 $’000 $’000
(d) Finance costs
Interest costs paid and payable:- on bank loans and overdrafts 302,961 241,475 – –- on debt securities 258,262 174,591 – –- to non-controlling interests 13,083 1,774 – –Convertible bonds:- interest expense 60,252 65,104 60,253 64,265- amortisation of bond discount 16,531 21,931 16,531 21,101Derivative financial instruments 19,731 60 – –Others 30,215 48,825 16 –Total borrowing costs 701,035 553,760 76,800 85,366Less:Borrowing costs capitalised in:- investment properties 5(e) (36,413) (29,031) – –- development properties for sale 11(f) (28,127) (38,060) – –
(64,540) (67,091) – –636,495 486,669 76,800 85,366
28. TAX EXPENSE
The Group The Company2018 2017 2018 2017
$’000 $’000 $’000 $’000
Current tax expense- Based on current year’s results 400,408 283,504 949 2- Over provision in respect of prior years (8,236) (4,055) – –- Group relief 1,430 (5,604) – –
393,602 273,845 949 2
Deferred tax expense- Origination and reversal of temporary differences 26,805 36,900 (2,814) (3,575)- Over provision in respect of prior years (15,019) (12,935) – –
11,786 23,965 (2,814) (3,575)
Land appreciation tax (LAT)- Current year 253,303 171,140 – –
658,691 468,950 (1,865) (3,573)
NOTES TO THEFINANCIAL STATEMENTS
FINANCIALS & ADDITIONAL INFORMATION
Cap
itaL
and
Lim
ited
Ann
ual R
epor
t 20
18
227

28. TAX EXPENSE (continued)
Comparative information on LAT has been reclassified from cost of sales to tax expense to conform with current year presentation. LAT payable has similarly been reclassified from trade and other payables to current tax payable.
Reconciliation of effective tax rate
The Group2018 2017
$’000 $’000
Profit before tax 3,508,503 2,815,530Less: Share of results of associates and joint ventures (959,407) (882,288)Profit before share of results of associates and joint ventures and tax 2,549,096 1,933,242
Income tax using Singapore tax rate of 17% (2017: 17%) 433,346 328,651Adjustments: Expenses not deductible for tax purposes 146,615 112,778 Income not subject to tax (280,078) (245,493) Effect of unrecognised tax losses and other deductible
temporary differences 16,252 9,025 Effect of different tax rates in foreign jurisdictions 89,497 80,391 Effect of taxable distributions from REITs 43,346 42,420 Land appreciation tax 253,303 171,140 Effect of tax reduction on land appreciation tax (63,326) (42,785) Withholding taxes 45,900 40,025 Over provision in respect of prior years (23,255) (16,990) Group relief 1,430 (5,604) Others (4,339) (4,608)
658,691 468,950
The Company2018 2017
$’000 $’000
Profit before tax 422,240 559,198
Income tax using Singapore tax rate of 17% (2017: 17%) 71,781 95,064Adjustments: Expenses not deductible for tax purposes 16,605 18,842 Income not subject to tax (87,334) (114,144) Effect of other deductible temporary differences (99) (2,858) Others (2,818) (477)
(1,865) (3,573)
NOTES TO THEFINANCIAL STATEMENTS
FINANCIALS & ADDITIONAL INFORMATIONC
apit
aLan
d L
imit
edA
nnua
l Rep
ort
2018
228

29. EARNINGS PER SHARE
(a) Basic earnings per share
The Group2018 2017
$’000 $’000
Basic earnings per share is based on:Net profit attributable to owners of the Company 1,762,493 1,569,560
2018 2017No. of shares
No. of shares
(‘000) (‘000)
Weighted average number of ordinary shares in issue during the year 4,191,314 4,245,629
(b) Diluted earnings per share
In calculating diluted earnings per share, the net profit attributable to owners of the Company and weighted average number of ordinary shares in issue during the year are adjusted for the effects of all dilutive potential ordinary shares:
The Group2018 2017
$’000 $’000
Net profit attributable to owners of the Company 1,762,493 1,569,560Profit impact of conversion of the potential dilutive shares 73,970 60,898Adjusted net profit attributable to owners of the Company 1,836,463 1,630,458
2018 2017No. of shares
No. of shares
(‘000) (‘000)
Weighted average number of ordinary shares in issue during the year 4,191,314 4,245,629Adjustments for potential dilutive shares under:- CapitaLand Performance Share Plan 19,006 21,187- CapitaLand Restricted Share Plan 23,599 23,758- Convertible bonds 471,697 451,524
514,302 496,469Weighted average number of ordinary shares used in the
calculation of diluted earnings per share 4,705,616 4,742,098
NOTES TO THEFINANCIAL STATEMENTS
FINANCIALS & ADDITIONAL INFORMATION
Cap
itaL
and
Lim
ited
Ann
ual R
epor
t 20
18
229

30. DIVIDENDS
The Board of Directors of the Company has proposed a tax-exempt ordinary dividend of 12.0 cents per share in respect of the financial year ended 31 December 2018. This would amount to a payout of approximately $499.5 million based on the number of issued shares (excluding treasury shares) as at 31 December 2018. The tax-exempt dividends are subject to shareholders’ approval at the forthcoming Annual General Meeting of the Company.
For the financial year ended 31 December 2017, a tax-exempt ordinary dividend of 12.0 cents per share was approved at the Annual General Meeting held on 30 April 2018. The said dividends of $504.1 million were paid in May 2018.
31. ACQUISITION/DISPOSAL OF SUBSIDIARIES, NET OF CASH ACQUIRED/DISPOSED OF
(a) Acquisition of subsidiaries
The list of significant acquisition of subsidiaries during 2018 is as follows:
Name of subsidiary Date acquired
Effective interest
acquired
Guangzhou Starshine Properties Co., Ltd. January 2018 63.2%Hien Duc Tay Ho Joint Stock Company March 2018 99.5%Gallileo Property S.a.r.l* June 2018 33.6%Shanghai Mingchang Properties Limited July 2018 100%Chongqing Zhonghua Real Estate Co., Ltd August 2018 100%BCLand Joint Stock Company August 2018 100%
* Includes 5.1% interest held indirectly through CapitaLand International Pte Ltd and 94.9% interest indirectly held through CCT.
The list of significant acquisition of subsidiaries in 2017 is as follows:
Name of subsidiary Date acquired
Effective interest
acquired
Shanghai Zhuju Real Estate Co., Ltd June 2017 100%CapitaLand Mall Trust# August 2017 29.4%CapitaLand Retail China Trust# August 2017 39.4%RCS Trust# August 2017 30.4%MVKimi (BVI) Limited November 2017 100%Viet Hung Phu Business Investment Joint Stock Company November 2017 100%MAC Property Company GmbH December 2017 94.9% # Previously associates/joint venture of the Group.
NOTES TO THEFINANCIAL STATEMENTS
FINANCIALS & ADDITIONAL INFORMATIONC
apit
aLan
d L
imit
edA
nnua
l Rep
ort
2018
230

31. ACQUISITION/DISPOSAL OF SUBSIDIARIES, NET OF CASH ACQUIRED/DISPOSED OF (continued)
(b) Effects of acquisitions
The cash flows and net assets of subsidiaries acquired are provided below:
Recognised valuesNote 2018 2017
$’000 $’000
The GroupProperty, plant and equipment 1,593 14,424Intangible assets 4 27,756 15,806Investment properties 5 1,409,988 17,565,394Joint ventures – 826,794Other non-current assets 309 41,948Development properties for sale 1,174,985 70,224Trade and other receivables 185,883 308,755Cash and cash equivalents 226,465 768,784Other current assets – 46,274Current liabilities (975,176) (517,259)Bank borrowings (348,066) (2,082,327)Debt securities – (3,426,728)Other non-current liabilities (22,351) (96,387)Deferred tax liabilities (6,852) (231,058)Non-controlling interests (6,235) (5,830,030)
1,668,299 7,474,614Amounts previously accounted for as associates and joint
ventures, remeasured at fair value (1,141) (4,505,872)Net assets acquired 1,667,158 2,968,742Goodwill arising from acquisition 4 19,086 87,638Gain from bargain purchase 27(a) – (26,941)Realisation of reserves previously accounted for as an associate – (10,773)Bank and shareholder loans assumed 197,716 –Total purchase consideration 1,883,960 3,018,666Less:Deferred purchase consideration and other adjustments (163,053) (26,525)Deferred purchase consideration paid in relation to prior year’s
acquisition of subsidiaries – 10,030Cash of subsidiaries acquired (226,465) (768,784)Cash outflow on acquisition of subsidiaries 1,494,442 2,233,387
NOTES TO THEFINANCIAL STATEMENTS
FINANCIALS & ADDITIONAL INFORMATION
Cap
itaL
and
Lim
ited
Ann
ual R
epor
t 20
18
231

31. ACQUISITION/DISPOSAL OF SUBSIDIARIES, NET OF CASH ACQUIRED/DISPOSED OF (continued)
(c) Disposal of subsidiaries
The list of significant disposal of subsidiaries during 2018 is as follows:
Name of subsidiary Date disposed
Effective interest
disposed
Gain Mark Properties (Shanghai) Ltd January 2018 44.3%Citadines (Xi’an) Property Co., Ltd. January 2018 44.3%CapitaMalls Foshan City Nanhai Commercial Property Co., Ltd September 2018 51.0%CapitaMalls Chongqing Investment Co., Ltd September 2018 51.0%CapitaMalls Maoming City Commercial Property Co., Ltd September 2018 51.0%CapitaMalls Zhangzhou Commercial Property Co., Ltd September 2018 51.0%Super Plus Limited November 2018 100%
The disposed subsidiaries previously contributed net profit of $4.5 million from 1 January 2018 to the date of disposal.
The list of significant disposal of subsidiaries during 2017 is as follows:
Name of subsidiary Date disposed
Effective interest
disposed
Nassim Hill Realty Pte Ltd January 2017 100%Winterton Investment Limited June 2017 100%CapitaLand Vietnam Commercial Fund I August 2017 60%
The disposed subsidiaries previously contributed net profit of $27.4 million from 1 January 2017 to the date of disposal.
(d) Effects of disposals
The cash flows and net assets of subsidiaries disposed are provided below:
The GroupNote 2018 2017
$’000 $’000
Property, plant and equipment 93 14Investment properties 5 78,650 235,804Development properties for sale – 356,582Assets held for sale 542,262 267,904Other current assets 890 30,085Liabilities held for sale (75,046) (17,238)Other current liabilities (254) (29,061)Bank borrowings (30,152) (39,199)Other non-current liabilities (11,936) (28,157)Non-controlling interests (117,005) (1,650)Net assets 387,502 775,084
NOTES TO THEFINANCIAL STATEMENTS
FINANCIALS & ADDITIONAL INFORMATIONC
apit
aLan
d L
imit
edA
nnua
l Rep
ort
2018
232

31. ACQUISITION/DISPOSAL OF SUBSIDIARIES, NET OF CASH ACQUIRED/DISPOSED OF (continued)
(d) Effects of disposals (continued)
The GroupNote 2018 2017
$’000 $’000
Less:Equity interests retained as associates – (142,339)Net assets disposed 387,502 632,745Realisation of reserves 36,304 (637)Gain on disposal of subsidiaries 52,820 292,530Sale consideration 476,626 924,638Deferred proceeds and other adjustments (10,578) –Deposits received in prior year (104,909) –Deferred sale consideration received in relation
to disposal of subsidiaries – 413,666Cash of subsidiaries disposed (387) (45,295)Cash inflow on disposal of subsidiaries* 360,752 1,293,009
* Includes cash inflow from disposal of subsidiaries of $106.8 million (2017: $899.0 million) as presented in the statement of cashflows and proceeds from disposal of assets held for sale of $254.0 million (2017: $394.0 million) relate to the disposal of subsidiaries.
32. BUSINESS COMBINATIONS
The Group acquires subsidiaries that own real estate. At the time of acquisition, the Group considers whether each acquisition represents the acquisition of a business or the acquisition of an asset. The Group accounts for an acquisition as a business combination where an integrated set of activities is acquired in addition to the property. Typically, the Group assesses the acquisition as a purchase of business when the strategic management function and the associated processes were purchased along with the underlying properties.
There were no significant business combinations in 2018.
In 2017, the Group had the following significant business combination:
Acquisition of CapitaLand Mall Trust (CMT), CapitaLand Retail China Trust (CRCT) and RCS Trust (RCST)
With effect from August 2017, the Group consolidated CMT and CRCT as required under FRS 110. The Group has assessed that it has control over CMT and CRCT, following the progressive increase in the Group’s unitholdings in CMT and CRCT over the years arising from the issuance of units as consideration for management fees, acquisition and divestment fees as well as participation in distribution reinvestment plan. Considering the Group’s aggregate interest in RCST, held via its subsidiaries, the Group also consolidated RCST. Prior to August 2017, the Group equity accounted for CMT and CRCT as associates and RCST as joint venture.
The consolidation of CMT, CRCT and RCST resulted in an increase in revenue of $425.6 million but no change to profit attributable to owners, from the date of acquisition to 31 December 2017. If the acquisition had occurred on 1 January 2017, management estimates that the contribution from CMT, CRCT and RCST in terms of revenue would have been $1,028.1 million, with no change to profit attributable to owners.
Under the accounting standards, the change in control is accounted for using the acquisition method, and the Group’s previously held equity interest is re-measured to fair value and a gain of $12.0 million on deemed disposal was recognised in profit or loss. The fair values of the associates were derived from the quoted market prices of CMT and CRCT at date of acquisition.
NOTES TO THEFINANCIAL STATEMENTS
FINANCIALS & ADDITIONAL INFORMATION
Cap
itaL
and
Lim
ited
Ann
ual R
epor
t 20
18
233

32. BUSINESS COMBINATIONS (continued)
Acquisition of CapitaLand Mall Trust (CMT), CapitaLand Retail China Trust (CRCT) and RCS Trust (RCST) (continued)
The identifiable assets acquired, liabilities assumed and effect of cash flows are presented as follows:
2017$’000
Property, plant and equipment 6,713Intangible assets 1,707Investment properties 14,411,074Joint ventures 826,794Other non-current assets 41,905Cash and cash equivalents 678,880Other current assets 296,477Current liabilities (374,124)Bank borrowings (1,915,852)Debt securities (3,426,727)Non-current liabilities (62,933)Deferred tax liabilities (215,773)Non-controlling interests (5,808,802)Total identifiable net assets 4,459,339Less: Amount previously accounted for as associate
and joint venture, remeasured at fair value (4,504,896)Net assets acquired (45,557)Goodwill on acquisition 56,330Realisation of reserves previously shared as an associate (10,773)Total purchase consideration –Less: Cash and cash equivalents in subsidiary acquired (678,880)Net cash inflow on acquisition (678,880)
33. FINANCIAL RISK MANAGEMENT
(a) Financial risk management objectives and policies
The Group and the Company are exposed to market risk (including interest rate, foreign currency and price risks), credit risk and liquidity risk arising from its diversified business. The Group’s risk management approach seeks to minimise the potential material adverse effects from these exposures. The Group uses financial instruments such as currency forwards, interest rate swaps and cross currency swaps as well as foreign currency borrowings to hedge certain financial risk exposures.
The Board of Directors has overall responsibility for the establishment and oversight of the Group’s risk management framework. The Board has established the Risk Committee to strengthen its risk management processes and framework. The Risk Committee is assisted by an independent unit called the Risk Assessment Group (RAG). RAG generates a comprehensive portfolio risk report to assist the committee. This quarterly report measures a spectrum of risks, including property market risks, construction risks, interest rate risks, refinancing risks and currency risks.
NOTES TO THEFINANCIAL STATEMENTS
FINANCIALS & ADDITIONAL INFORMATIONC
apit
aLan
d L
imit
edA
nnua
l Rep
ort
2018
234

33. FINANCIAL RISK MANAGEMENT (continued)
(b) Market risk
Market risk is the risk that changes in market prices, such as interest rates, foreign exchange rates and equity prices will have on the Group’s income or the value of its holdings of financial instruments. The objective of market risk management is to manage and control market risk exposures within acceptable parameters, while optimising the return on risk.
(i) Interest rate risk
The Group’s exposure to market risk for changes in interest rate environment relates mainly to its investment in financial products and debt obligations.
The investments in financial products are short term in nature and they are not held for trading or speculative purposes. The financial products mainly comprise fixed deposits which yield better returns than cash at bank.
The Group manages its interest rate exposure by maintaining a prudent mix of fixed and floating rate borrowings. The Group adopts a policy of ensuring that between 65% and 75% of its interest rate risk exposure is at a fixed rate. The Group actively reviews its debt portfolio, taking into account the investment holding period and nature of its assets. This strategy allows it to capitalise on cheaper funding in a low interest rate environment and achieve certain level of protection against rate hikes. The Group also uses hedging instruments such as interest rate swaps to minimise its exposure to interest rate volatility and classifies these interest rate swaps as cash flow hedge.
The Group determines the existence of an economic relationship between the hedging instrument and hedged item based on the reference interest rates, tenors, repricing dates and maturities and the notional or par amounts.
The Group assesses whether the derivative designated in each hedging relationship is expected to be effective in offsetting changes in cash flows of the hedged item using the critical terms method.
Hedge ineffectiveness may occur due to changes in the critical terms of either the interest rate swaps or borrowings.
As all critical terms matched during the year, the economic relationship was 100% effective.
The fair value loss of interest rate swaps as at 31 December 2018 was $24.5 million (2017: $26.6 million; 1 January 2017: $13.3 million) comprising derivative assets of $10.5 million (2017: $5.4 million; 1 January 2017: $7.1 million) and derivative liabilities of $35.0 million (2017: $32.0 million; 1 January 2017: $20.4 million).
Sensitivity analysis
For variable rate financial liabilities and interest rate derivative instruments used for hedging, it is estimated that an increase of 100 basis point in interest rate at the reporting date would lead to a reduction in the Group’s profit before tax (and revenue reserves) by approximately $62.0 million (2017: $68.0 million; 1 January 2017: $42.3 million). A decrease in 100 basis point in interest rate would have an equal but opposite effect. This analysis assumes that all other variables, in particular foreign currency rates, remain constant, and has not taken into account the effects of qualifying borrowing costs allowed for capitalisation, the associated tax effects and share of non-controlling interests.
NOTES TO THEFINANCIAL STATEMENTS
FINANCIALS & ADDITIONAL INFORMATION
Cap
itaL
and
Lim
ited
Ann
ual R
epor
t 20
18
235

33. FINANCIAL RISK MANAGEMENT (continued)
(b) Market risk (continued)
(ii) Equity price risk
As at 31 December 2018, the Group has financial assets at FVOCI in equity securities and is exposed to equity price risk. The securities are listed in Malaysia.
Sensitivity analysis
It is estimated that if the prices for equity securities listed in Malaysia increase by five percentage point with all other variables including tax rate being held constant, the Group’s fair value reserves would increase by approximately $2.4 million (2017: $2.4 million; 1 January 2017: $2.2 million). A decrease in five percentage point will have an equal but opposite effect.
(iii) Foreign currency risk
The Group operates internationally and is exposed to various currencies, mainly Chinese Renminbi, Euro, Hong Kong Dollars, Japanese Yen, Malaysian Ringgit, Australian Dollars and US Dollars.
The Group maintains a natural hedge, whenever possible, by borrowing in the currency of the country in which its property or investment is located or by borrowing in currencies that match the future revenue stream to be generated from its investments.
As at the reporting date, the Group uses certain foreign currency denominated borrowings, which include bank loans and medium term notes, and cross currency interest rate swaps to hedge against the currency risk arising from the Group’s net investments in certain subsidiaries in United States of America, Europe and Japan. The carrying amount of these US Dollars, Euro, Sterling Pound and Japanese Yen denominated borrowings as at 31 December 2018 was $1,134.6 million (2017: $751.8 million; 1 January 2017: $576.8 million) and the fair value of the borrowings was $1,124.9 million (2017: $749.2 million; 1 January 2017: $579.7 million).
The Group uses forward exchange contracts or foreign currency loans to hedge its foreign currency risk, where feasible. It generally enters into forward exchange contracts with maturities ranging between three months and one year which are rolled over at market rates at maturity or foreign currency loans which match the Group’s highly probable transactions and investment in the foreign subsidiaries. The Group also enters into cross currency swaps to hedge the foreign exchange risk of its loans denominated in a foreign currency. The foreign exchange forwards and currency swaps are denominated in the same currency as the highly probable transactions, therefore the economic relationship is 100% effective.
Hedge ineffectiveness may occur due to:• Changes in timing of the forecasted transaction from what was originally planned; and • Changes in the credit risk of the derivative counterparty or the Group.
The net fair value loss of the forward exchange and cross currency swap contracts as at 31 December 2018 was $6.8 million (2017: loss of $47.4 million; 1 January 2017: gain of $93.1 million), comprising derivative liabilities of $94.6 million (2017: $139.5 million; 1 January 2017: $37.6 million) and derivative assets of $87.8 million (2017: $92.1 million; 1 January 2017: $130.7 million).
Foreign exchange exposures in transactional currencies other than functional currencies of the operating entities are kept to an acceptable level.
NOTES TO THEFINANCIAL STATEMENTS
FINANCIALS & ADDITIONAL INFORMATIONC
apit
aLan
d L
imit
edA
nnua
l Rep
ort
2018
236

33.
FIN
AN
CIA
L R
ISK
MA
NA
GEM
EN
T (
con
tin
ued
)
(b)
Mar
ket
risk
(co
nti
nu
ed)
The
Gro
up
’s a
nd
th
e C
om
pan
y’s
exp
osu
re t
o f
ore
ign
cu
rren
cies
wer
e as
fo
llow
s:
Sin
gap
ore
D
olla
rsU
SD
olla
rsA
ust
ralia
nD
olla
rsC
hin
ese
Ren
min
bi
Hong
Kong
D
olla
rsJa
pan
ese
Yen
Eu
roM
alay
sian
R
ing
git
Oth
ers#
Tota
l$’0
00
$’0
00
$’0
00
$’0
00
$’0
00
$’0
00
$’0
00
$’0
00
$’0
00
$’0
00
The
Gro
up
31 D
ecem
ber
2018
Oth
er fi
nan
cial
ass
ets
11,3
21
101,6
91
–29,6
13
165
225,4
13
–40,6
32
–408,8
35
Trad
e an
d o
ther
rec
eiva
ble
s393,1
45
423,6
97
22,1
59
759,1
63
16,5
66
22,5
08
226,6
88
39,4
78
104,7
48
2,0
08,1
52
Cas
h a
nd
cas
h e
qu
ival
ents
2,4
90,0
66
172,5
46
15,5
52
1,8
50,2
13
4,6
59
182,8
62
89,2
70
51,9
92
202,6
79
5,0
59,8
39
Ban
k b
orr
owin
gs
and
deb
t se
curi
ties
(13,
300,
000)
(2,3
15,1
84)
(87,0
94)
(2,4
02,9
44)
(1,0
97,3
29)
(2,5
36,1
52)
(1,0
07,2
69)
(497,2
73)
(390,7
00)
(23,
633,
945)
Trad
e an
d o
ther
pay
able
s(1
,348,9
98)
(773,1
97)
(9,5
67)
(2,1
07,6
19)
(2,1
63)
(87,1
12)
(63,5
04)
(70,3
99)
(161,1
96)
(4,6
23,7
55)
Gro
ss c
urr
ency
exp
osu
re(1
1,7
54,4
66)
(2,3
90,4
47)
(58,9
50)
(1,8
71,5
74)
(1,0
78,1
02)
(2,1
92
,481)
(754,8
15)
(435,5
70)
(244,4
69)
(20,7
80,8
74)
Ad
d/L
ess:
Net
fin
anci
al
liab
iliti
es/(
asse
ts)
den
om
inat
ed in
th
e re
spec
tive
en
titi
es’
fun
ctio
nal
cu
rren
cies
11,6
11,5
16
1,5
07,8
26
(11,9
28)
1,6
96,0
89
142,2
06
1,2
37,6
61
349,0
26
526,9
28
89,4
18
17,1
48,7
42
Ad
d: B
ank
bo
rrow
ing
s an
d
deb
t se
curi
ties
des
ign
ated
fo
r n
et in
vest
men
t h
edg
e–
–87,4
62
––
268,5
62
607,1
71
–173,9
59
1,1
37,1
54
Ad
d:
Cro
ss c
urr
ency
sw
aps/
fore
ign
exc
han
ge
forw
ard
co
ntr
acts
–617,8
80
––
955,4
80
715
,811
––
–2,2
89,1
71
Less
: Fin
anci
al a
sset
s at
FV
OC
I–
(3,4
36)
––
(165)
––
(40,6
32)
–(4
4,2
33)
Net
cu
rren
cy e
xpo
sure
(142,9
50)
(268,1
77)
16,5
84
(175,4
85)
19,4
19
29,5
53
201,3
82
50,7
26
18,9
08
(250,0
40)
#
Oth
ers
incl
ud
e m
ain
ly U
nit
ed A
rab
Em
irat
es D
irh
am, S
terl
ing
Po
un
d, Th
ai B
aht,
In
dia
n R
up
ee a
nd
Vie
tnam
ese
Do
ng
.
NO
TES
TO
TH
EFI
NA
NC
IAL
STA
TEM
EN
TS
FINANCIALS & ADDITIONAL INFORMATION
Cap
itaL
and
Lim
ited
Ann
ual R
epor
t 20
18
237

33.
FIN
AN
CIA
L R
ISK
MA
NA
GEM
EN
T (
con
tin
ued
)
(b)
Mar
ket
risk
(co
nti
nu
ed)
Sin
gap
ore
D
olla
rsU
SD
olla
rsA
ust
ralia
nD
olla
rsC
hin
ese
Ren
min
bi
Hong
Kong
D
olla
rsJa
pan
ese
Yen
Eu
roM
alay
sian
R
ing
git
Oth
ers#
Tota
l$’0
00
$’0
00
$’0
00
$’0
00
$’0
00
$’0
00
$’0
00
$’0
00
$’0
00
$’0
00
The
Gro
up
31
Dec
emb
er 2
01
7O
ther
fin
anci
al a
sset
s13,3
66
73,4
15
––
855
226,1
59
–47,5
34
–361,3
29
Trad
e an
d o
ther
rec
eiva
ble
s320,4
94
267,6
58
18,8
65
507,8
47
18,1
46
17
,784
226,3
21
85,9
48
153,5
33
1,6
16,5
96
Cas
h a
nd
cas
h e
qu
ival
ents
3,3
73,7
35
145,9
83
6,6
92
2,1
45,0
81
2,3
14
181
,096
63,2
18
83,4
10
103,7
89
6,1
05,3
18
Ban
k b
orr
owin
gs
and
deb
t se
curi
ties
(1
3,2
35,2
97)
(1,6
95,1
96)
–(1
,684,7
35)
(1,0
35,9
69)
(2,4
56,5
31)
(792,3
21)
(503,2
06)
(291,6
74)
(21,6
94,9
29)
Trad
e an
d o
ther
pay
able
s(1
,573,0
53)
(396,3
13)
(10,0
86)
(2,6
73,0
52)
(2,7
40)
(83
,681)
(69,0
16)
(66,0
52)
(86,8
84)
(4,9
60,8
77)
Gro
ss c
urr
ency
exp
osu
re(1
1,1
00,7
55)
(1,6
04,4
53)
15,4
71
(1,7
04,8
59)
(1,0
17,3
94)
(2,1
15,1
73)
(571,7
98)
(352,3
66)
(121,2
36)
(18,5
72,5
63)
Ad
d/L
ess:
N
et fi
nan
cial
lia
bili
ties
/(as
sets
) d
eno
min
ated
in t
he
resp
ecti
ve e
nti
ties
’ fu
nct
ion
al c
urr
enci
es10,9
31,1
04
431,0
96
(1,0
78)
1,2
62,2
76
192,1
62
1,2
30,4
23
335,8
42
470,7
74
80,9
50
14,9
33,5
49
Ad
d:
Ban
k b
orr
owin
gs
and
deb
t se
curi
ties
d
esig
nat
ed f
or
net
in
vest
men
t h
edg
e–
68,4
76
––
–206
,360
429,7
43
–47,2
18
751,7
97
Ad
d:
Cro
ss c
urr
ency
sw
aps/
fore
ign
exc
han
ge
forw
ard
co
ntr
acts
–1,0
73,0
36
––
843,5
34
699
,872
––
–2,6
16,4
42
Less
: A
vaila
ble
-fo
r-sa
le
fin
anci
al a
sset
s–
––
–(8
55)
––
(47,5
33)
–(4
8,3
88)
Net
cu
rren
cy e
xpo
sure
(169,6
51)
(31,8
45)
14,3
93
(442,5
83)
17,4
47
21,4
82
193,7
87
70,8
75
6,9
32
(319,1
63)
#
Oth
ers
incl
ud
e m
ain
ly U
nit
ed A
rab
Em
irat
es D
irh
am, S
terl
ing
Po
un
d, Th
ai B
aht,
In
dia
n R
up
ee a
nd
Vie
tnam
ese
Do
ng
.
NO
TES
TO
TH
EFI
NA
NC
IAL
STA
TEM
EN
TS
FINANCIALS & ADDITIONAL INFORMATIONC
apit
aLan
d L
imit
edA
nnua
l Rep
ort
2018
238
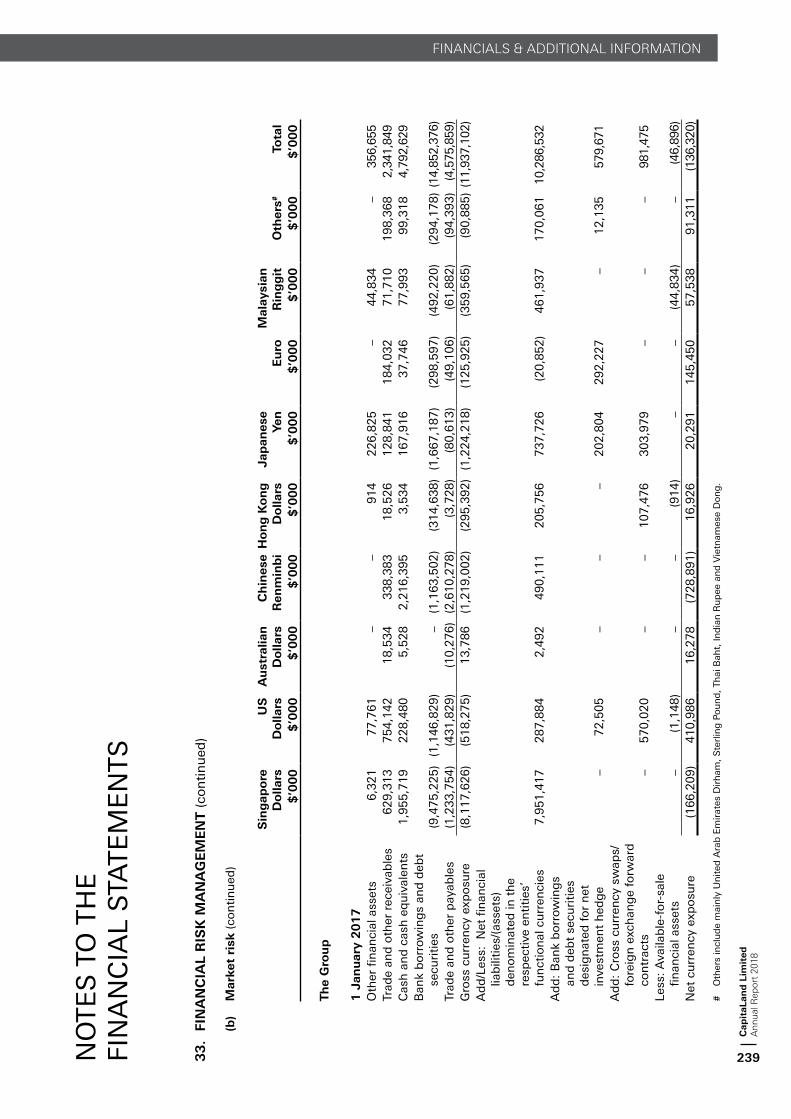
33.
FIN
AN
CIA
L R
ISK
MA
NA
GEM
EN
T (
con
tin
ued
)
(b)
Mar
ket
risk
(co
nti
nu
ed)
Sin
gap
ore
D
olla
rsU
SD
olla
rsA
ust
ralia
nD
olla
rsC
hin
ese
Ren
min
bi
Hong
Kong
D
olla
rsJa
pan
ese
Yen
Eu
roM
alay
sian
R
ing
git
Oth
ers#
Tota
l$
’00
0$
’00
0$
’00
0$
’00
0$
’00
0$
’000
$’0
00
$’0
00
$’0
00
$’0
00
The
Gro
up
1 J
anu
ary
20
17
Oth
er fi
nan
cial
ass
ets
6,3
21
77
,76
1–
–9
14
22
6,8
25
–44,8
34
–35
6,65
5Tr
ade
and
oth
er r
ecei
vab
les
62
9,3
13
75
4,1
42
18
,53
43
38
,38
31
8,5
26
12
8,8
41
184,0
32
71,7
10
198,3
68
2,34
1,84
9C
ash
an
d c
ash
eq
uiv
alen
ts1
,95
5,7
19
22
8,4
80
5,5
28
2,2
16
,39
53
,53
41
67,9
16
37,7
46
77,9
93
99,3
18
4,79
2,62
9B
ank
bo
rrow
ing
s an
d d
ebt
secu
riti
es(9
,47
5,2
25
)(1
,14
6,8
29
)–
(1,1
63
,50
2)
(31
4,6
38
)(1
,66
7,1
87)
(298,5
97)
(492,2
20)
(294,1
78)
(14,
852,
376)
Trad
e an
d o
ther
pay
able
s(1
,23
3,7
54
)(4
31
,82
9)
(10
,27
6)
(2,6
10
,27
8)
(3,7
28
)(8
0,6
13)
(49,1
06)
(61,8
82)
(94,3
93)
(4,5
75,8
59)
Gro
ss c
urr
ency
exp
osu
re(8
,11
7,6
26
)(5
18
,27
5)
13
,78
6(1
,21
9,0
02
)(2
95
,39
2)
(1,2
24,2
18)
(125,9
25)
(359,5
65)
(90,8
85)
(11,
937,
102)
Ad
d/L
ess:
N
et fi
nan
cial
lia
bili
ties
/(as
sets
) d
eno
min
ated
in t
he
resp
ecti
ve e
nti
ties
’ fu
nct
ion
al c
urr
enci
es7
,95
1,4
17
28
7,8
84
2,4
92
49
0,1
11
20
5,7
56
73
7,7
26
(20,8
52)
461,9
37
170,0
61
10,2
86,5
32A
dd
: B
ank
bo
rrow
ing
s an
d d
ebt
secu
riti
es
des
ign
ated
fo
r n
et
inve
stm
ent
hed
ge
–7
2,5
05
––
–2
02,8
04
292,2
27
–12,1
35
579,
671
Ad
d:
Cro
ss c
urr
ency
sw
aps/
fore
ign
exc
han
ge
forw
ard
co
ntr
acts
–5
70
,02
0–
–1
07
,47
63
03,9
79
––
–98
1,47
5Le
ss:
Ava
ilab
le-f
or-
sale
fi
nan
cial
ass
ets
–(1
,14
8)
––
(91
4)
––
(44,8
34)
–(4
6,89
6)N
et c
urr
ency
exp
osu
re(1
66
,20
9)
41
0,9
86
16
,27
8(7
28
,89
1)
16
,92
62
0,2
91
145,4
50
57,5
38
91,3
11
(136
,320
)
#
Oth
ers
incl
ud
e m
ain
ly U
nit
ed A
rab
Em
irat
es D
irh
am, S
terl
ing
Po
un
d, Th
ai B
aht,
In
dia
n R
up
ee a
nd
Vie
tnam
ese
Do
ng
.
NO
TES
TO
TH
EFI
NA
NC
IAL
STA
TEM
EN
TS
FINANCIALS & ADDITIONAL INFORMATION
Cap
itaL
and
Lim
ited
Ann
ual R
epor
t 20
18
239
33. FINANCIAL RISK MANAGEMENT (continued)
(b) Market risk (continued)
Sensitivity analysis
It is estimated that a five percentage point strengthening in foreign currencies against the respective functional currencies of the Group would decrease the Group’s profit before tax by approximately $12.5 million (2017: $16.0 million) and increase the Group’s other components of equity by approximately $2.2 million (2017: $2.4 million). A five percentage point weakening in foreign currencies against the Singapore Dollar would have an equal but opposite effect. The Group’s outstanding forward exchange contracts and cross currency swaps have been included in this calculation. The analysis assumed that all other variables, in particular interest rates, remain constant and does not take into account the translation related risk, associated tax effects and share of non-controlling interests.
There was no significant exposure to foreign currencies for the Company as at 31 December 2018, 31 December 2017 and 1 January 2017.
(c) Credit risk
Credit risk is the risk of financial loss to the Group if a customer or counterparty to a financial instrument fails to meet its contractual obligations. For trade and other receivables, contract assets and financial assets at amortised cost, the Group has guidelines governing the process of granting credit as a service or product provider in its respective segments of business. Trade and other receivables and contract assets relate mainly to the Group’s customers who bought its residential units and tenants from its commercial buildings, shopping malls and serviced residences. Financial assets at amortised cost relate mainly to amounts owing by related parties. Investments and financial transactions are restricted to counterparties that meet the appropriate credit criteria.
The principal risk to which the Group and the Company is exposed to in respect of financial guarantee contracts is credit risk in connection with the guarantee contracts they have issued. To mitigate the risk, management continually monitors the risk and has established processes including performing credit evaluations of the parties it is providing the guarantee on behalf of. Guarantees are only given for the benefit of its subsidiaries and related parties. The maximum exposure to credit risk in respect of these financial guarantees at the balance sheet date is disclosed in note 36.
The Group has a diversified portfolio of businesses and as at balance sheet date, there was no significant concentration of credit risk with any entity. The maximum exposure to credit risk is represented by the carrying amount of each financial asset in the balance sheet, including derivative financial instruments as well as any irrevocable loan undertaking to associates and joint ventures.
(i) Trade receivables and contract assets
The Group uses a provision matrix to measure the lifetime expected credit loss allowance for trade receivables and contract assets.
In measuring the expected credit losses, trade receivables and contract assets are grouped based on similar credit risk characteristics and days past due. In calculating the expected credit loss rates, the Group considers historical loss rates for each category of customers under each business.
Trade and other receivables and contract assets are written off when there is no reasonable expectation of recovery, such as a debtor failing to engage in a repayment plan with the Group. The Group generally considers a financial asset as in default if the counterparty fails to make contractual payments within 90 days when they fall due and writes off the financial asset when the Group assesses that the debtor fails to make contractual payments. Where receivables are written off, the Group continues to engage in enforcement activity to attempt to recover the receivables due. Where recoveries are made, these are recognised in profit or loss.
NOTES TO THEFINANCIAL STATEMENTS
FINANCIALS & ADDITIONAL INFORMATIONC
apit
aLan
d L
imit
edA
nnua
l Rep
ort
2018
240

33. FINANCIAL RISK MANAGEMENT (continued)
(c) Credit risk (continued)
(ii) Financial assets at amortised costs
The Group assesses on a forward-looking basis the expected credit losses associated with financial assets at amortised costs. The impairment methodology applied depends on whether there has been a significant increase in credit risk.
(a) The movements in credit loss allowance are as follows:
Tradereceivables
Otherreceivables
Amounts due from
associates
Amounts due from
joint ventures(current)
Amounts due from
joint ventures
(non-current) Total
$’000 $’000 $’000 $’000 $’000 $’000
The GroupAt 1 January 2018 10,537 19,205 3,172 13,389 13,639 59,942Allowance utilised (622) (9,542) – – – (10,164)Allowance during
the year 4,728 5,844 – 1,450 – 12,022 Reversal of
allowance during the year (362) – (3,067) – – (3,429)
Disposal of subsidiaries (18) (30) – – – (48)
Translation differences 604 (85) (3) 99 139 754
At 31 December 2018 14,867 15,392 102 14,938 13,778 59,077
The movements in allowance for impairment loss on loans (note 6) and amounts due from subsidiaries (note 18) were as follows:
Amounts due
from subsidiaries
$’000
The CompanyAt 1 January 2018 108,902Allowance during the year 16,803Reversal of allowance during the year (500)At 31 December 2018 125,205
Cash and cash equivalents are subject to immaterial credit loss.
NOTES TO THEFINANCIAL STATEMENTS
FINANCIALS & ADDITIONAL INFORMATION
Cap
itaL
and
Lim
ited
Ann
ual R
epor
t 20
18
241

33. FINANCIAL RISK MANAGEMENT (continued)
(c) Credit risk (continued)
(b) The maximum exposure to credit risk for trade receivables at the reporting date (by strategic business units) was:
The Group
2018 20171 Jan 2017
$’000 $’000 $’000
CL SMI 52,980 150,293 241,911CL China 89,961 75,426 40,938CL Vietnam 14,622 13,540 7,328CL International 65,307 54,929 53,057Others 4,220 501 237
227,090 294,689 343,471
(c) The credit quality of trade and other receivables is assessed based on credit policies established by the Risk Committee. The Group monitors customer credit risk by grouping trade and other receivables based on their characteristics. Trade and other receivables with high credit risk will be identified and monitored by the respective strategic business units. The Group’s and the Company’s credit risk exposure in relation to trade and other receivables under SFRS(I) 9 as at 31 December 2018 are set out in the provision matrix as follows:
<---------------- Past due ---------------->
CurrentWithin
30 days30 to 90
days
More than
90 days Total$’000 $’000 $’000 $’000 $’000
The GroupExpected loss rate – 0.2% 21.6% 36.4%Trade receivables 141,409 51,989 19,815 28,744 241,957Loss allowance – 125 4,287 10,455 14,867
Expected loss rate – – – 0.6%Amounts due from associates 13,388 2,683 3,806 17,842 37,719Loss allowance – – – 102 102
Expected loss rate – – – 36.8%Amounts due from
joint ventures 35,253 1,005 1,794 40,538 78,590Loss allowance – – – 14,938 14,938
No aging analysis of contract assets and other receivables are presented as the majority of outstanding balances as at 31 December 2018 are current. The Group assesses that no allowance for impairment loss on other receivables is required, except for the amount written off as there is no reasonable expectation of recovery.
The Company’s credit risk exposure to trade and other receivables as at 31 December 2018 is immaterial.
NOTES TO THEFINANCIAL STATEMENTS
FINANCIALS & ADDITIONAL INFORMATIONC
apit
aLan
d L
imit
edA
nnua
l Rep
ort
2018
242

33. FINANCIAL RISK MANAGEMENT (continued)
(c) Credit risk (continued)
(c) The Company has issued financial guarantees to banks for borrowings of its subsidiaries. These guarantees are subject to the impairment requirements of SFRS (I) 9. The Company has assessed that its subsidiaries have strong financial capacity to meet the contractual cash flow obligations in the near future and hence, does not expect significant credit losses arising from these guarantees.
Previous accounting policy for impairment of trade and other receivables
In 2017, the impairment of financial assets was assessed based on the incurred loss impairment model.
The Group’s and the Company’s credit risk exposure in relation to trade and other receivables as at 31 December 2017 and 1 January 2017 are set out in the provision matrix as follows:
(i) The ageing of trade receivables, amounts due from associates and joint ventures at the reporting date was:
Trade receivables
Amounts due from associates
Amounts due from joint ventures
Grossamount
Allowance for
impairment loss on
receivablesGross
amount
Allowance for
impairment loss on
receivablesGross
amount
Allowance for
impairment loss on
receivables$’000 $’000 $’000 $’000 $’000 $’000
The Group 31 December 2017Not past due 167,084 – 111,024 – 38,960 –Past due
1 – 30 days 97,287 (601) 2,269 (16) 5,480 –Past due
31 – 90 days 19,740 (333) 4,394 (203) 2,845 –More than 90 days 21,115 (9,603) 5,551 (2,953) 17,063 (13,389)
305,226 (10,537) 123,238 (3,172) 64,348 (13,389)
1 January 2017Not past due 292,749 – 489,811 – 80,248 (77)Past due
1 – 30 days 31,049 (50) 2,611 – 1,366 (75)Past due
31 – 90 days 10,908 (76) 5,365 – 555 (152)More than 90 days 17,233 (8,342) 5,806 (113) 17,495 (12,018)
351,939 (8,468) 503,593 (113) 99,664 (12,322)
NOTES TO THEFINANCIAL STATEMENTS
FINANCIALS & ADDITIONAL INFORMATION
Cap
itaL
and
Lim
ited
Ann
ual R
epor
t 20
18
243

33. FINANCIAL RISK MANAGEMENT (continued)
(c) Credit risk (continued)
(ii) The movements in allowance for impairment loss in respect of trade and other receivables, amounts due from associates and joint ventures were as follows:
Tradereceivables
Other receivables
Amounts due from
associates
Amounts due from
joint ventures(current)
Amounts due from
joint ventures
(non-current) Total
$’000 $’000 $’000 $’000 $’000 $’000
The GroupAt 1 January 2017 8,468 17,834 113 12,322 13,105 51,842Allowance utilised (1,862) (433) – – – (2,295)Allowance during
the year 3,615 – 3,067 936 – 7,618Reversal of
allowance during the year (21) 1,552 – (411) – 1,120
Translation differences 337 252 (8) 542 534 1,657
At 31 December 2017 10,537 19,205 3,172 13,389 13,639 59,942
Based on historical default rates, the Group believes that no allowance for impairment loss on receivables is necessary in respect of the trade receivables, except for those balances which were impaired.
(iii) The movements in allowance for impairment loss on loans (note 6) and amounts due from subsidiaries (note 18) were as follows:
Amounts duefrom
subsidiaries$’000
The Company
At 1 January 2017 (312,955)
Allowance during the year (5,079)
Reversal of allowance during the year 27,541
Disposal of a subsidiary 181,591
At 31 December 2017 (108,902) The (allowance)/reversal of allowance for impairment loss in respect of the amounts due from subsidiaries was made based on estimated future cash flow recoveries.
NOTES TO THEFINANCIAL STATEMENTS
FINANCIALS & ADDITIONAL INFORMATIONC
apit
aLan
d L
imit
edA
nnua
l Rep
ort
2018
244

33. FINANCIAL RISK MANAGEMENT (continued)
(d) Liquidity risk
Liquidity risk is the risk that the Group will not be able to meet its financial obligations as they fall due. The Group actively manages its debt maturity profile, operating cash flows and the availability of funding so as to ensure that all refinancing, repayment and funding needs are met. As part of its overall prudent liquidity management, the Group maintains sufficient level of cash or cash convertible investments to meet its working capital requirement. In addition, the Group strives to maintain available banking facilities at a reasonable level to its overall debt position. As far as possible, the Group will constantly raise committed funding from both capital markets and financial institutions and prudently balance its portfolio with some short term funding so as to achieve overall cost effectiveness.
The following are the expected contractual undiscounted cash flows of financial liabilities and derivative financial instruments, including interest payments and excluding the impact of netting agreements:
<--------------- Contractual cash flows -------------->
Carryingamount Total
Not later than 1
year
Between1 and 5
yearsAfter
5 years$’000 $’000 $’000 $’000 $’000
The Group
31 December 2018Financial liabilities, at amortised costBank borrowings (13,003,731) (14,360,143) (2,097,869) (10,674,394) (1,587,880)Debt securities (10,630,214) (12,007,218) (1,781,678) (5,732,208) (4,493,332)Trade and other payables# (3,876,540) (3,902,458) (3,482,334) (388,099) (32,025)
(27,510,485) (30,269,819) (7,361,881) (16,794,701) (6,113,237)
Derivative financial assets/(liabilities), at fair value
Interest rate swaps (net-settled)- assets 10,465 14,181 6,665 7,516 –- liabilities (34,984) (33,261) (11,071) (22,190) –Forward foreign exchange
contracts (net-settled)- assets 4,798 4,798 4,798 – –- liabilities (1,155) (1,155) (1,155) – –Forward foreign exchange
contracts (gross-settled) (78)- outflow (40,233) (40,233) – –- inflow 40,155 40,155 – –Cross currency swaps (gross-settled) 82,966- outflow (1,060,620) (42,985) (904,070) (113,565)- inflow 1,108,455 44,304 949,694 114,457Cross currency swaps (gross-settled) (93,345)- outflow (1,469,835) (341,849) (577,885) (550,101)- inflow 1,424,578 306,757 592,728 525,093
(31,333) (12,937) (34,614) 45,793 (24,116)(27,541,818) (30,282,756) (7,396,495) (16,748,908) (6,137,353)
# Excludes liability for employee benefits.
NOTES TO THEFINANCIAL STATEMENTS
FINANCIALS & ADDITIONAL INFORMATION
Cap
itaL
and
Lim
ited
Ann
ual R
epor
t 20
18
245

33. FINANCIAL RISK MANAGEMENT (continued)
(d) Liquidity risk (continued)
<--------------- Contractual cash flows -------------->
Carryingamount Total
Not later than 1
year
Between1 and 5
yearsAfter
5 years$’000 $’000 $’000 $’000 $’000
The Group
31 December 2017Financial liabilities, at amortised costBank borrowings (11,465,093) (12,304,159) (1,580,151) (9,648,315) (1,075,693)Debt securities (10,229,836) (11,747,471) (1,758,857) (5,812,050) (4,176,564)Trade and other payables# (4,133,989) (4,143,216) (3,645,662) (454,735) (42,819)
(25,828,918) (28,194,846) (6,984,670) (15,915,100) (5,295,076)
Derivative financial assets/(liabilities), at fair value
Interest rate swaps (net-settled)- assets 5,388 5,547 292 5,255 –- liabilities (32,005) (30,543) (19,628) (10,915) –Forward foreign exchange
contracts (net-settled)- assets 5,208 5,208 5,208 – –- liabilities (11,248) (11,248) (11,248) – –Forward foreign exchange
contracts (gross-settled) (1,887)- outflow (230,687) (230,687) – –- inflow 228,800 228,800 – –Cross currency swaps (gross-settled) 86,909- outflow (1,194,127) (546,681) (319,884) (327,562)- inflow 1,264,486 581,202 348,189 335,095Cross currency swaps (gross-settled) (126,364)- outflow (1,704,310) (41,196) (1,002,249) (660,865)- inflow 1,612,889 28,875 936,374 647,640
(73,999) (53,985) (5,063) (43,230) (5,692)(25,902,917) (28,248,831) (6,989,733) (15,958,330) (5,300,768)
# Excludes liability for employee benefits.
NOTES TO THEFINANCIAL STATEMENTS
FINANCIALS & ADDITIONAL INFORMATIONC
apit
aLan
d L
imit
edA
nnua
l Rep
ort
2018
246

33. FINANCIAL RISK MANAGEMENT (continued)
(d) Liquidity risk (continued)
<--------------- Contractual cash flows -------------->
Carryingamount Total
Not later than 1
year
Between1 and 5
yearsAfter
5 years$’000 $’000 $’000 $’000 $’000
The Group
1 January 2017Financial liabilities, at amortised costBank borrowings (7,347,580) (7,999,595) (868,504) (6,306,964) (824,127)Debt securities (7,504,796) (8,555,845) (1,839,059) (3,030,683) (3,686,103)Trade and other payables# (3,629,578) (3,656,808) (3,223,649) (343,409) (89,750)
(18,481,954) (20,212,248) (5,931,212) (9,681,056) (4,599,980)
Derivative financial assets/(liabilities), at fair value
Interest rate swaps (net-settled)- assets 7,137 9,551 (183) 9,734 –- liabilities (20,382) (20,436) (15,432) (5,004) –Forward foreign exchange
contracts (net-settled)- assets 1,672 1,672 1,672 – –- liabilities (5,733) (5,733) (5,733) – –Forward foreign exchange
contracts (gross-settled) 205- outflow (6,934) (6,934) – –- inflow 7,188 7,188 – –Forward foreign exchange contracts
(gross-settled) (7)- outflow (720) (720) – –- inflow 713 713 – –Cross currency swaps (gross-settled) 128,816- outflow (499,488) (26,542) (281,150) (191,796)- inflow 515,907 26,430 289,501 199,976Cross currency swaps (gross-settled) (31,822)- outflow (523,348) (10,601) (181,922) (330,825)- inflow 559,689 14,869 204,430 340,390
79,886 38,061 (15,273) 35,589 17,745(18,402,068) (20,174,187) (5,946,485) (9,645,467) (4,582,235)
# Excludes liability for employee benefits.
NOTES TO THEFINANCIAL STATEMENTS
FINANCIALS & ADDITIONAL INFORMATION
Cap
itaL
and
Lim
ited
Ann
ual R
epor
t 20
18
247

33. FINANCIAL RISK MANAGEMENT (continued)
(d) Liquidity risk (continued)
<--------------- Contractual cash flows -------------->
Carryingamount Total
Not later than 1
year
Between1 and 5
yearsAfter
5 years$’000 $’000 $’000 $’000 $’000
The Company
31 December 2018Financial liabilities,
at amortised costDebt securities (2,051,440) (2,232,288) (611,282) (943,681) (677,325)Trade and other payables# (258,480) (258,480) (258,480) – –
(2,309,920) (2,490,768) (869,762) (943,681) (677,325)
31 December 2017Financial liabilities,
at amortised costDebt securities (2,635,659) (2,924,499) (857,264) (1,371,710) (695,525)Trade and other payables# (880,733) (880,733) (880,733) – –
(3,516,392) (3,805,232) (1,737,997) (1,371,710) (695,525)
1 January 2017Financial liabilities,
at amortised costDebt securities (2,729,058) (3,096,927) (736,630) (815,372) (1,544,925)Trade and other payables# (121,193) (121,193) (121,193) – –
(2,850,251) (3,218,120) (857,823) (815,372) (1,544,925)
# Excludes liability for employee benefits.
NOTES TO THEFINANCIAL STATEMENTS
FINANCIALS & ADDITIONAL INFORMATIONC
apit
aLan
d L
imit
edA
nnua
l Rep
ort
2018
248

33. FINANCIAL RISK MANAGEMENT (continued)
(d) Liquidity risk (continued)
The following table indicates the periods in which the cash flows associated with derivatives that are cash flow hedges are expected to occur and affect the profit or loss:
<--------------- Contractual cash flows -------------->
Carryingamount Total
Not later than 1
year
Between1 and 5
yearsAfter
5 years$’000 $’000 $’000 $’000 $’000
The Group
31 December 2017Interest rate swaps- assets 5,388 5,547 292 5,255 –- liabilities (32,005) (30,543) (19,628) (10,915) –Forward foreign exchange contracts- liabilities (1,887) (1,887) (1,887) – –Cross currency swaps- assets 86,909 70,359 34,521 28,305 7,533- liabilities (126,364) (91,421) (12,321) (65,875) (13,225)
(67,959) (47,945) 977 (43,230) (5,692)
1 January 2017Interest rate swaps- assets 7,137 9,551 (183) 9,734 –- liabilities (20,382) (20,436) (15,432) (5,004) –Forward foreign exchange contracts- assets 205 254 254 – –- liabilities (7) (7) (7) – –Cross currency swaps- assets 128,816 16,419 (112) 8,351 8,180- liabilities (31,822) 36,341 4,268 22,508 9,565
83,947 42,122 (11,212) 35,589 17,745
NOTES TO THEFINANCIAL STATEMENTS
FINANCIALS & ADDITIONAL INFORMATION
Cap
itaL
and
Lim
ited
Ann
ual R
epor
t 20
18
249

33.
FIN
AN
CIA
L R
ISK
MA
NA
GEM
EN
T (
con
tin
ued
)
(d)
Liq
uid
ity
risk
(co
nti
nu
ed)
At
31
Dec
emb
er 2
01
8,
the
Gro
up
hel
d t
he
follo
win
g in
stru
men
ts t
o h
edg
e ex
po
sure
s to
ch
ang
es in
fo
reig
n c
urr
ency
an
d in
tere
st r
ates
:
<--
----
----
----
---C
arry
ing
am
ou
nt-
----
----
----
--->
C
han
ges
in
fai
r va
lue
use
d f
or
<--
-- c
alcu
lati
ng
hed
ge
ineff
ecti
ven
es -
--->
Con
trac
tual
n
oti
on
al
amou
nt
Ass
ets/
(L
iabili
ties
)
Fin
anci
al
stat
emen
t
line
item
Hed
gin
g
inst
rum
ent
Hed
ged
it
em
Hed
ge
ineff
ecti
ven
ess
reco
gn
ised
in
P&
L
Wei
gh
ted
ave
rag
e h
edg
e fo
rex
rate
/ in
tere
st r
ate
(%)
Mat
uri
ty d
ate
$’0
00
$’0
00
$’0
00
$’0
00
$’0
00
The
Gro
up
Cas
hfl
ow
hed
ges
Fore
ign
exc
han
ge
risk
-
Cro
ss c
urr
ency
sw
aps
to h
edg
e
fo
reig
n c
urr
ency
bo
rrow
ing
s2,2
58
,22
7(6
,21
9)
Der
ivat
ive
fin
anci
al
inst
rum
ents
21
,74
6(2
1,7
46
)–
US
D:
SG
D1
.23
7(U
SD
4.0
00
%)
HK
D:
SG
D0
.16
7(H
KD
3.2
69
%)
Oct
ob
er 2
01
9 t
o
Feb
ruar
y 2
02
7
Inte
rest
rat
e ri
sk-
In
tere
st r
ate
swap
s to
hed
ge
flo
atin
g r
ate
bo
rrow
ing
s5,6
80
,83
26
7,5
83
Der
ivat
ive
fin
anci
al
inst
rum
ents
7,2
38
(7,2
38
)–
2.1
44
%Fe
bru
ary
20
19
to
O
cto
ber
20
23
Net
inve
stm
ent
hed
ges
Fore
ign
exc
han
ge
risk
-
Bo
rrow
ing
s to
hed
ge
net
in
vest
men
ts in
fo
reig
n o
per
atio
ns
–1
,13
4,6
06
Bo
rrow
ing
s1
8,4
83
(18
,48
3)
–JP
Y:
SG
D0
.01
21
EU
R:
SG
D1
.56
1G
BP
: S
GD
1.7
53
AU
D:
SG
D0
.97
0
Mar
ch 2
02
0 t
o
Sep
tem
ber
20
25
-
Forw
ard
co
ntr
acts
to
hed
ge
net
in
vest
men
ts in
fo
reig
n o
per
atio
ns
62
4,5
08
3,6
43
Der
ivat
ive
fin
anci
al
inst
rum
ents
5,3
66
(5,3
66
)–
US
D:
SG
D1
.37
5R
MB
: S
GD
0.1
97
HK
D:
SG
D0
.17
6JP
Y:
SG
D0
.01
21
EU
R:
SG
D1
.57
4A
UD
: S
GD
0.9
76
Jan
uar
y 2
01
9 t
o
Mar
ch 2
01
9
-
Cro
ss c
urr
ency
sw
aps
to h
edg
e n
et
inve
stm
ents
in f
ore
ign
op
erat
ion
s4
20
,00
05
78
Der
ivat
ive
fin
anci
al
inst
rum
ents
4,6
00
(4,6
00
)–
JPY
: S
GD
0.0
12
4E
UR
: S
GD
1.5
31
Nov
emb
er 2
02
2 t
o
Mar
ch 2
02
4
NO
TES
TO
TH
EFI
NA
NC
IAL
STA
TEM
EN
TS
FINANCIALS & ADDITIONAL INFORMATIONC
apit
aLan
d L
imit
edA
nnua
l Rep
ort
2018
250

33. FINANCIAL RISK MANAGEMENT (continued)
(d) Liquidity risk (continued)
The following table provides a reconciliation by risk category of components of equity and analysis of other comprehensive income items (net of tax) resulting from cashflow hedge accounting.
Hedgingreserve
$’000
The GroupAt 1 January 2018 (32,763)Change in fair value:- Foreign currency risk 4,673- Interest rate risk (19,040)Amount reclassified to profit or loss:- Foreign currency risk (723)- Interest rate risk 4,914At 31 December 2018 (42,939)
(e) Offsetting financial assets and financial liabilities
The disclosures set out in the tables below include financial assets and financial liabilities that: • are offset in the Group’s and the Company’s balance sheets; or • are subject to an enforceable master netting arrangement, irrespective of whether they are offset in
the balance sheets.
Financial instruments such as trade receivables and trade payables are not disclosed in the tables below unless they are offset in the balance sheets.
The Group’s derivative transactions that are not transacted through an exchange, are governed by the International Swaps and Derivatives Association (ISDA) Master Netting Agreements. In general, under such agreements, the amounts due on a single day in respect of all transactions outstanding in the same currency are aggregated into a single net amount and settled between the counterparties. In certain circumstances, for example when a credit event such as a default occurs, all outstanding transactions under the agreement are terminated, the termination value is assessed and set off into a single net amount to be settled.
The above ISDA agreements do not meet the criteria for offsetting in the balance sheets as a right of set-off of recognised amounts is enforceable only following an event of default, insolvency or bankruptcy of the Group or the counterparties. In addition, the Group and its counterparties do not intend to settle on a net basis or to realise the assets and settle the liabilities simultaneously.
NOTES TO THEFINANCIAL STATEMENTS
FINANCIALS & ADDITIONAL INFORMATION
Cap
itaL
and
Lim
ited
Ann
ual R
epor
t 20
18
251
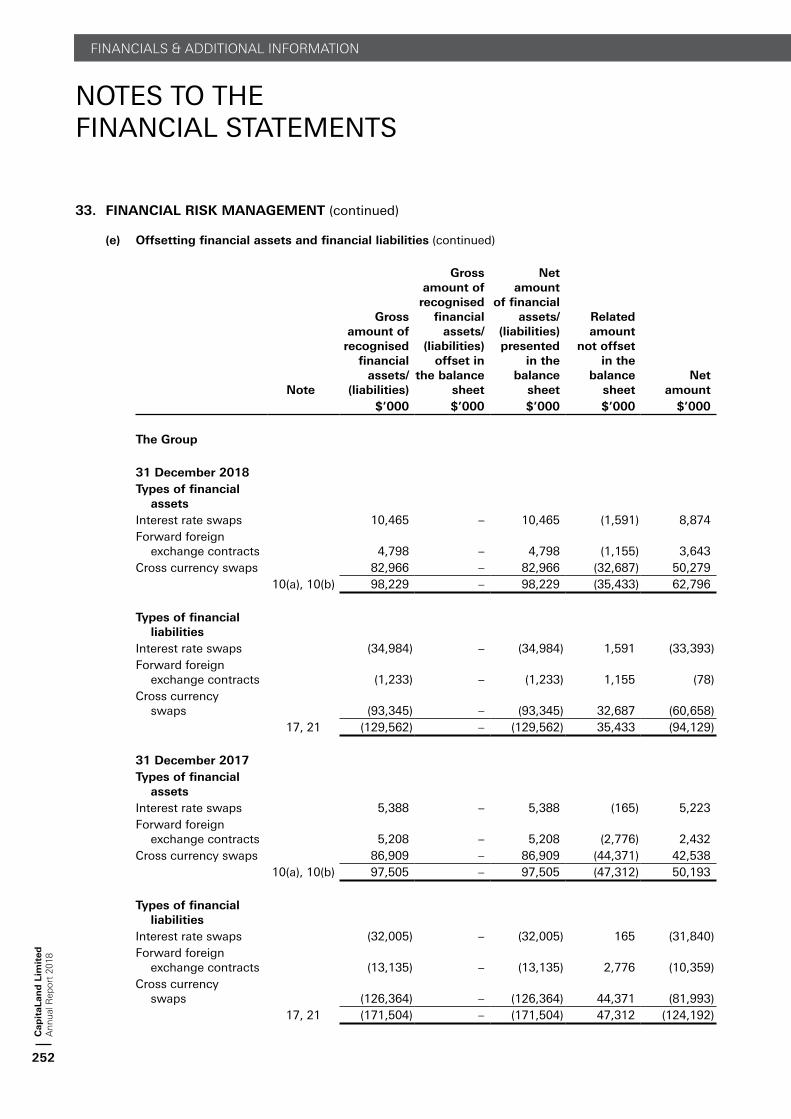
33. FINANCIAL RISK MANAGEMENT (continued)
(e) Offsetting financial assets and financial liabilities (continued)
Note
Gross amount of
recognised financial
assets/ (liabilities)
Gross amount of
recognised financial
assets/ (liabilities)
offset in the balance
sheet
Net amount
of financial assets/
(liabilities) presented
in the balance
sheet
Related amount
not offset in the
balance sheet
Net amount
$’000 $’000 $’000 $’000 $’000
The Group
31 December 2018Types of financial
assetsInterest rate swaps 10,465 – 10,465 (1,591) 8,874Forward foreign
exchange contracts 4,798 – 4,798 (1,155) 3,643Cross currency swaps 82,966 – 82,966 (32,687) 50,279
10(a), 10(b) 98,229 – 98,229 (35,433) 62,796
Types of financial liabilities
Interest rate swaps (34,984) – (34,984) 1,591 (33,393)Forward foreign
exchange contracts (1,233) – (1,233) 1,155 (78)Cross currency
swaps (93,345) – (93,345) 32,687 (60,658)17, 21 (129,562) – (129,562) 35,433 (94,129)
31 December 2017Types of financial
assetsInterest rate swaps 5,388 – 5,388 (165) 5,223Forward foreign
exchange contracts 5,208 – 5,208 (2,776) 2,432Cross currency swaps 86,909 – 86,909 (44,371) 42,538
10(a), 10(b) 97,505 – 97,505 (47,312) 50,193
Types of financial liabilities
Interest rate swaps (32,005) – (32,005) 165 (31,840)Forward foreign
exchange contracts (13,135) – (13,135) 2,776 (10,359)Cross currency
swaps (126,364) – (126,364) 44,371 (81,993)17, 21 (171,504) – (171,504) 47,312 (124,192)
NOTES TO THEFINANCIAL STATEMENTS
FINANCIALS & ADDITIONAL INFORMATIONC
apit
aLan
d L
imit
edA
nnua
l Rep
ort
2018
252

33. FINANCIAL RISK MANAGEMENT (continued)
(e) Offsetting financial assets and financial liabilities (continued)
Note
Gross amount of
recognised financial
assets/ (liabilities)
Gross amount of
recognised financial
assets/ (liabilities)
offset in the balance
sheet
Net amount
of financial assets/
(liabilities) presented
in the balance
sheet
Related amount
not offset in the
balance sheet
Net amount
$’000 $’000 $’000 $’000 $’000
The Group
1 January 2017Types of financial
assetsInterest rate swaps 7,137 – 7,137 (3,257) 3,880Forward foreign
exchange contracts 1,877 – 1,877 (1,333) 544Cross currency swaps 128,816 – 128,816 (13,334) 115,482
10(a), 10(b) 137,830 – 137,830 (17,924) 119,906
Types of financial liabilities
Interest rate swaps (20,382) – (20,382) 3,219 (17,163)Forward foreign
exchange contracts (5,740) – (5,740) 1,333 (4,407)Cross currency
swaps (31,822) – (31,822) 13,372 (18,450)17, 21 (57,944) – (57,944) 17,924 (40,020)
NOTES TO THEFINANCIAL STATEMENTS
FINANCIALS & ADDITIONAL INFORMATION
Cap
itaL
and
Lim
ited
Ann
ual R
epor
t 20
18
253

33. FINANCIAL RISK MANAGEMENT (continued)
(e) Offsetting financial assets and financial liabilities (continued)
Note
Gross amount of
recognised financial
assets/ (liabilities)
Gross amount of
recognised financial
assets/ (liabilities)
offset in the balance
sheet
Net amount
of financial assets/
(liabilities) presented
in the balance
sheet
Related amount
not offset in the
balance sheet
Net amount
$’000 $’000 $’000 $’000 $’000
The Company
31 December 2018Types of financial
assetsAmount due from
subsidiaries, current account 18 126,471 – 126,471 (482) 125,989
Types of financial liabilities
Amount due to subsidiaries, current account 18 (482) – (482) 482 –
31 December 2017Types of financial
assetsAmount due from
subsidiaries, current account 18 79,602 – 79,602 (1,352) 78,250
Types of financial liabilities
Amount due to subsidiaries, current account 18 (1,352) – (1,352) 1,352 –
1 January 2017Types of financial
assetsAmount due from
subsidiaries, current account 18 40,054 (142) 39,912 – 39,912
Types of financial liabilities
Amount due to subsidiaries, current account (142) 142 – – –
NOTES TO THEFINANCIAL STATEMENTS
FINANCIALS & ADDITIONAL INFORMATIONC
apit
aLan
d L
imit
edA
nnua
l Rep
ort
2018
254

34. FAIR VALUE OF ASSETS AND LIABILITIES
(a) Determination of fair value
The following valuation methods and assumptions are used to estimate the fair values of the following significant classes of assets and liabilities:
(i) Derivatives
Forward currency contracts, cross currency swap contracts and interest rate swap contracts are valued using valuation techniques with market observable inputs. The most frequently applied valuation techniques include forward pricing and swap models, using present valuation calculations. The models incorporate various inputs including the credit quality of counterparties, foreign exchange spot and forward rate, interest rate curves and forward rate curves.
(ii) Non-derivative financial liabilities
Fair value, which is determined for disclosure purposes, is calculated based on the present value of future principal and interest cash flows, discounted using the market rate of interest at the reporting date.
In respect of the liability component of convertible bonds, the fair value at initial recognition is determined using a market interest rate of similar liabilities that do not have a conversion option.
Fair value of quoted debt securities is determined based on quoted market prices.
(iii) Other financial assets and liabilities
The fair value of quoted securities is their quoted bid price at the balance sheet date. The carrying amounts of financial assets and liabilities with a maturity of less than one year (including trade and other receivables, cash and cash equivalents and trade and other payables) are assumed to approximate their fair values because of the short period to maturity. All other financial assets and liabilities are discounted to determine their fair values.
Where other valuation techniques, such as discounted cash flow or net asset techniques are used, estimated future cash flows are based on management’s best estimates and the discount rate is a market-related rate for a similar instrument in the balance sheet.
(iv) Investment properties
The Group’s investment property portfolio is mostly valued by external and independent valuation companies every six months. Independent valuation is also carried out on occurrence of acquisition and on completion of construction of investment property. The fair values are based on open market values, being the estimated amount for which a property could be exchanged on the date of the valuation between a willing buyer and a willing seller in an arm’s length transaction wherein the parties had each acted knowledgeably and without compulsion. The valuers have considered valuation techniques including direct comparison method, capitalisation approach, discounted cash flows and residual method in arriving at the open market value as at the balance sheet date. In determining the fair value, the valuers have used valuation techniques which involve certain estimates. The key assumptions used to determine the fair value of investment properties include market-corroborated capitalisation rate, terminal yield rate and discount rate.
Investment property under development is valued by estimating the fair value of the completed investment property and then deducting from that amount the estimated costs to complete the construction and a reasonable profit margin on construction and development. The estimated cost to complete is determined based on the construction cost per square metre in the pertinent area.
NOTES TO THEFINANCIAL STATEMENTS
FINANCIALS & ADDITIONAL INFORMATION
Cap
itaL
and
Lim
ited
Ann
ual R
epor
t 20
18
255

34. FAIR VALUE OF ASSETS AND LIABILITIES (continued)
(a) Determination of fair value (continued)
(v) Assets held for sale
The fair value of the Group’s investment properties held for sale is either valued by an independent valuer or based on agreed contractual selling price on a willing buyer willing seller basis. For investment properties held for sale valued by an independent valuer, the valuer has considered the direct comparison and income capitalisation approaches in arriving at the open market value as at the balance sheet date. In determining the fair value, the valuer used valuation techniques which involve certain estimates. The key assumptions used to determine the fair value of investment properties held for sale include market-corroborated capitalisation rate.
(vi) Property, plant and equipment
The fair value of the property, plant and equipment is the estimated amount for which a property could be exchanged on the date of acquisition between a willing buyer and a willing seller in an arm’s length transaction after proper marketing wherein the parties had each acted knowledgeably and willingly. The residual values of serviced residence properties at the end of the intended holding period are determined based on annual independent professional valuations, using valuation methods such as discounted cash flow and/or comparison method. The key assumptions used to determine the residual values of serviced residence properties include terminal yield rate and discount rate.
(vii) Share-based payment transactions
The fair values of employee performance share plan and restricted share plan are measured using valuation methodology described in note 22. Measurement inputs include the share price at grant date, expected volatility (based on an evaluation of the historical volatility of the Company’s and peer group’s share price), expected correlation of the Company’s return with those of peer group, expected dividends and the risk-free interest rate (based on government bonds). Service and non-market performance conditions attached to the transactions are not taken into account in determining the fair values.
(b) Fair value hierarchy
The Group categorises fair value measurements using a fair value hierarchy that is dependent on the valuation inputs used. The different levels have been defined as follows:
Level 1: Quoted prices (unadjusted) in active markets for identical assets or liabilities.
Level 2: Inputs other than quoted prices included within Level 1 that are observable for the asset or liability, either directly (i.e., as prices) or indirectly (i.e., derived from prices).
Level 3: Inputs for the asset or liability that are not based on observable market data (unobservable inputs).
NOTES TO THEFINANCIAL STATEMENTS
FINANCIALS & ADDITIONAL INFORMATIONC
apit
aLan
d L
imit
edA
nnua
l Rep
ort
2018
256

34.
FAIR
VA
LUE O
F A
SS
ETS
AN
D L
IAB
ILIT
IES
(co
nti
nu
ed)
(c)
Acc
ou
nti
ng
cla
ssifi
cati
on
an
d f
air
valu
es
<--
----
----
----
----
----
----
Car
ryin
g a
mou
nt
----
----
----
----
----
----
-->
<--
----
----
----
----
----
- Fa
ir v
alu
e --
----
----
----
----
->
The
Gro
up
Note
Fair
val
ue
- hed
gin
g
inst
rum
ents
FVO
CI
FVTP
L
Am
ort
ised
C
ost
Tota
lLev
el 1
Lev
el 2
Lev
el 3
Tota
l$
’00
0$
’00
0$
’00
0$
’00
0$
’00
0$
’00
0$
’00
0$
’00
0$
’00
0
31 D
ecem
ber
2018
Fin
anci
al a
sset
s m
easu
red
at
fair
val
ue
Eq
uit
y in
vest
men
ts a
t FV
OC
I 10(a
)–
111,9
77
––
111,9
77
40,6
32
–71,3
45
111,9
77
Eq
uit
y in
vest
men
ts a
t FV
TPL
10(a
)–
–296,8
58
–296,8
58
––
296,8
58
296,8
58
Der
ivat
ive
fin
anci
al a
sset
s:-
Forw
ard
fo
reig
n e
xch
ang
e co
ntr
acts
an
d
cro
ss c
urr
ency
sw
aps
10(b
)5,8
21
––
–5,8
21
–5,8
21
–5,8
21
- In
tere
st r
ate
swap
s, f
orw
ard
fo
reig
n
exch
ang
e co
ntr
acts
an
d c
ross
cu
rren
cy
swap
s 10(a
)92,4
08
––
–92,4
08
–92,4
08
–92,4
08
98,2
29
111,9
77
296,8
58
–507,0
64
Fin
anci
al a
sset
s n
ot
mea
sure
d a
t
fair
val
ue
Oth
er n
on
-cu
rren
t as
sets
–
––
336,0
69
336,0
69
Loan
s d
ue
fro
m a
sso
ciat
es7(a
)–
––
343,7
37
343,7
37
Loan
s d
ue
fro
m jo
int
ven
ture
s8(a
)–
––
656,6
53
656,6
53
Trad
e an
d o
ther
rec
eiva
ble
s12
––
–1,0
74,4
99
1,0
74,4
99
Cas
h a
nd
cas
h e
qu
ival
ents
16
––
–5,0
59,8
39
5,0
59,8
39
––
–7,4
70,7
97
7,4
70,7
97
# D
oes
no
t in
clu
de
fair
val
ue
info
rmat
ion
of
fin
anci
al a
sset
s an
d li
abili
ties
no
t m
easu
red
at
fair
val
ue
if t
he
carr
yin
g a
mo
un
t is
a r
easo
nab
le a
pp
roxi
mat
ion
of
fair
val
ue.
NO
TES
TO
TH
EFI
NA
NC
IAL
STA
TEM
EN
TS
FINANCIALS & ADDITIONAL INFORMATION
Cap
itaL
and
Lim
ited
Ann
ual R
epor
t 20
18
257

34.
FAIR
VA
LUE O
F A
SS
ETS
AN
D L
IAB
ILIT
IES
(co
nti
nu
ed)
(c)
Acc
ou
nti
ng
cla
ssifi
cati
on
an
d f
air
valu
es (
con
tin
ued
)
<--
----
----
----
----
----
----
----
- C
arry
ing
am
ou
nt
----
----
----
----
----
----
----
-><
----
----
----
----
----
----
-- F
air
valu
e --
----
----
----
----
----
-->
The
Gro
up
Note
Fair
val
ue
- h
edg
ing
in
stru
men
tsFV
OC
IFV
TP
L
Am
ort
ised
C
ost
Tota
lLev
el 1
Lev
el 2
Lev
el 3
Tota
l$
’00
0$
’00
0$
’00
0$
’00
0$
’00
0$
’00
0$
’00
0$
’00
0$
’00
0
31 D
ecem
ber
2018
Fin
anci
al lia
bili
ties
mea
sure
d a
t fa
ir v
alu
eD
eriv
ativ
e fi
nan
cial
inst
rum
ents
:-
In
tere
st r
ate
swap
s an
d f
orw
ard
fo
reig
n e
xch
ang
e co
ntr
acts
17
(60,3
81)
––
–(6
0,3
81)
–(6
0,3
81)
–(6
0,3
81)
-
Inte
rest
rat
e sw
aps,
fo
rwar
d
fore
ign
exc
han
ge
con
trac
ts a
nd
cr
oss
cu
rren
cy s
wap
s21
(69,1
81)
––
–(6
9,1
81)
–(6
9,1
81)
–(6
9,1
81)
(129,5
62)
––
–(1
29,5
62)
Fin
anci
al lia
bili
ties
not
mea
sure
d
at f
air
valu
eO
ther
no
n-c
urr
ent
liab
iliti
es#
––
–(4
54,5
65)
(454
,565)
––
(446,9
20)
(446,0
20)
Ban
k b
orr
owin
gs
19
––
–(1
3,00
3,73
1)(1
3,00
3,73
1)–
(13,
007,
704)
–(1
3,0
07,7
04)
Deb
t se
curi
ties
20
––
–(1
0,63
0,21
4)(1
0,63
0,21
4)(2
,646
,640
)(8
,019
,283
)–
(10,6
65,9
23)
Trad
e an
d o
ther
pay
able
s#–
––
(3,4
33,7
36)
(3,4
33,7
36)
––
–(2
7,52
2,24
6)(2
7,52
2,24
6)
#
Exc
lud
es li
abili
ty f
or
emp
loye
e b
enefi
ts.
NO
TES
TO
TH
EFI
NA
NC
IAL
STA
TEM
EN
TS
FINANCIALS & ADDITIONAL INFORMATIONC
apit
aLan
d L
imit
edA
nnua
l Rep
ort
2018
258

34.
FAIR
VA
LUE O
F A
SS
ETS
AN
D L
IAB
ILIT
IES
(co
nti
nu
ed)
(c)
Acc
ou
nti
ng
cla
ssifi
cati
on
an
d f
air
valu
es (
con
tin
ued
)
<--
----
----
----
----
----
----
----
----
----
---
Car
ryin
g a
mou
nt-
----
----
----
----
----
----
----
----
----
----
----
-><
----
----
----
----
----
----
---
Fair
val
ue
----
----
----
----
----
--->
The
Gro
up
Note
Fair
val
ue
- h
edg
ing
in
stru
men
tsLoan
s an
d
rece
ivab
les
Ava
ilab
le-
for-
sale
Des
ign
ated
at
fai
r va
lue
Oth
er
fin
anci
al
liab
iliti
esTo
tal
Lev
el 1
Lev
el 2
Lev
el 3
Tota
l$’0
00
$’0
00
$’0
00
$’0
00
$’0
00
$’0
00
$’0
00
$’0
00
$’0
00
$’0
00
31
Dec
emb
er 2
01
7Fi
nan
cial
ass
ets
mea
sure
d
at f
air
valu
eE
qu
ity
inve
stm
ents
,
avai
lab
le-f
or-
sale
10(a
)–
–2
84
,84
1–
–2
84
,84
14
7,5
33
–2
37
,30
82
84
,84
1E
qu
ity
inve
stm
ents
d
esig
nat
ed a
s FV
TPL
10(a
)–
––
70
,16
8–
70
,16
8–
–7
0,1
68
70
,16
8D
eriv
ativ
e fi
nan
cial
in
stru
men
ts:
- Fo
rwar
d f
ore
ign
exc
han
ge
con
trac
ts a
nd
cro
ss
curr
ency
sw
aps
10(b
)3
4,4
99
––
––
34
,49
9–
34
,49
9–
34
,49
9-
Inte
rest
rat
e sw
aps,
fo
rwar
d
fore
ign
exc
han
ge
con
trac
ts
and
cro
ss c
urr
ency
sw
aps
10(a
)6
3,0
06
––
––
63
,00
6–
63
,00
6–
63
,00
69
7,5
05
–2
84
,84
17
0,1
68
–4
52
,51
4
Fin
anci
al a
sset
s n
ot
mea
sure
d a
t fa
ir v
alu
eO
ther
no
n-c
urr
ent
asse
ts
–9
1,4
75
––
–9
1,4
75
Trad
e an
d o
ther
rec
eiva
ble
s12
–1
,15
4,3
74
––
–1
,15
4,3
74
Ass
ets
hel
d f
or
sale
^–
28
,40
8–
––
28
,40
8C
ash
an
d c
ash
eq
uiv
alen
ts16
–6
,10
5,3
18
––
–6
,10
5,3
18
–7
,37
9,5
75
––
–7
,37
9,5
75
^
Ref
er t
o n
ote
15 f
or
fin
anci
al a
sset
s/lia
bili
ties
in a
sset
s/lia
bili
ties
hel
d f
or
sale
.# D
oes
no
t in
clu
de
fair
val
ue
info
rmat
ion
of
fin
anci
al a
sset
s an
d li
abili
ties
no
t m
easu
red
at
fair
val
ue
if t
he
carr
yin
g a
mo
un
t is
a r
easo
nab
le a
pp
roxi
mat
ion
of
fair
val
ue.
NO
TES
TO
TH
EFI
NA
NC
IAL
STA
TEM
EN
TS
FINANCIALS & ADDITIONAL INFORMATION
Cap
itaL
and
Lim
ited
Ann
ual R
epor
t 20
18
259

34.
FAIR
VA
LUE O
F A
SS
ETS
AN
D L
IAB
ILIT
IES
(co
nti
nu
ed)
(c)
Acc
ou
nti
ng
cla
ssifi
cati
on
an
d f
air
valu
es (
con
tin
ued
)
<--
----
----
----
----
----
----
----
- C
arry
ing
am
ou
nt
----
----
----
----
----
----
----
-><
----
----
----
----
----
----
-- F
air
valu
e --
----
----
----
----
----
-->
The
Gro
up
Note
Fair
val
ue
- h
edg
ing
in
stru
men
tsLoan
s an
d
rece
ivab
les
Ava
ilab
le-
for-
sale
Oth
er
fin
anci
al
liab
iliti
esTo
tal
Lev
el 1
Lev
el 2
Lev
el 3
Tota
l$
’00
0$
’00
0$
’00
0$
’00
0$’0
00
$’0
00
$’0
00
$’0
00
$’0
00
31 D
ecem
ber
2017
Fin
anci
al lia
bili
ties
m
easu
red
at
fair
val
ue
Der
ivat
ive
fin
anci
al in
stru
men
ts:
-
Inte
rest
rat
e sw
aps
and
fo
rwar
d
fore
ign
exc
han
ge
con
trac
ts
17
(10,8
39)
––
–(1
0,8
39)
–(1
0,8
39)
–(1
0,8
39)
-
Inte
rest
rat
e sw
aps,
fo
rwar
d
fore
ign
exc
han
ge
con
trac
ts a
nd
cr
oss
cu
rren
cy s
wap
s21
(160,6
65)
––
–(1
60
,665)
–(1
60,6
65)
–(1
60,6
65)
(171,5
04)
––
–(1
71
,504)
Fin
anci
al lia
bili
ties
not
mea
sure
d
at f
air
valu
eO
ther
no
n-c
urr
ent
liab
iliti
es#
––
–(5
05,4
53)
(505
,453)
––
(503,7
74)
(503,7
74)
Ban
k b
orr
owin
gs
19
––
–(1
1,4
65,0
93)
(11,4
65
,093)
–(1
1,52
5,81
2)–
(11,
525,
812)
Deb
t se
curi
ties
20
––
–(1
0,2
29,8
36)
(10,2
29
,836)
(3,0
27,8
07)
(7,4
54,7
47)
–(1
0,48
2,55
4)Tr
ade
and
oth
er p
ayab
les#
––
–(2
,839,5
56)
(2,8
39
,556)
Liab
iliti
es h
eld
fo
r sa
le^
––
–(5
0,3
51)
(50
,351)
––
–(2
5,0
90,2
89)
(25,0
90,2
89)
#
Exc
lud
es q
uas
i-eq
uit
y lo
ans
and
liab
ility
fo
r em
plo
yee
ben
efits
.^
R
efer
to
no
te 1
5 f
or
fin
anci
al a
sset
s/lia
bili
ties
in a
sset
s/lia
bili
ties
hel
d f
or
sale
.
NO
TES
TO
TH
EFI
NA
NC
IAL
STA
TEM
EN
TS
FINANCIALS & ADDITIONAL INFORMATIONC
apit
aLan
d L
imit
edA
nnua
l Rep
ort
2018
260
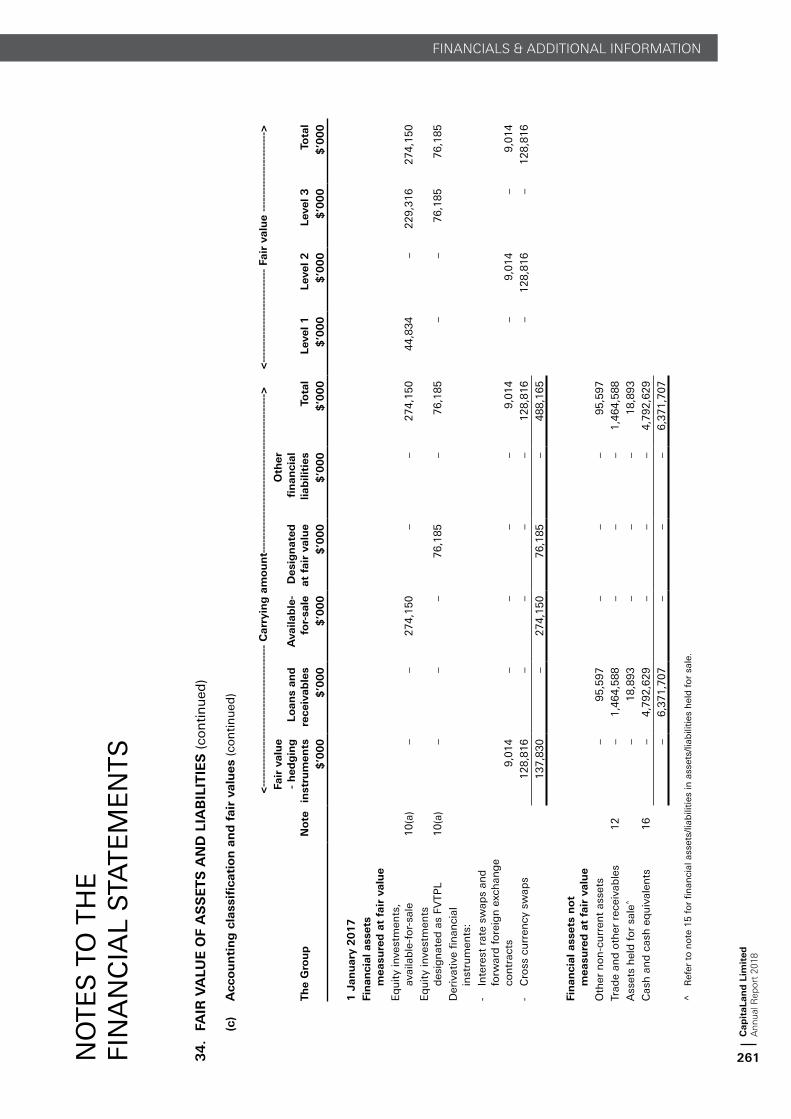
34.
FAIR
VA
LUE O
F A
SS
ETS
AN
D L
IAB
ILIT
IES
(co
nti
nu
ed)
(c)
Acc
ou
nti
ng
cla
ssifi
cati
on
an
d f
air
valu
es (
con
tin
ued
)
<--
----
----
----
----
----
----
----
----
----
---
Car
ryin
g a
mou
nt-
----
----
----
----
----
----
----
----
----
----
----
-><
----
----
----
----
----
----
---
Fair
val
ue
----
----
----
----
----
--->
The
Gro
up
Note
Fair
val
ue
- h
edg
ing
in
stru
men
tsLoan
s an
d
rece
ivab
les
Ava
ilab
le-
for-
sale
Des
ign
ated
at
fai
r va
lue
Oth
er
fin
anci
al
liab
iliti
es
Tota
lLev
el 1
Lev
el 2
Lev
el 3
Tota
l$’0
00
$’0
00
$’0
00
$’0
00
$’0
00
$’0
00
$’0
00
$’0
00
$’0
00
$’0
00
1 J
anu
ary
20
17
Fin
anci
al a
sset
s
mea
sure
d a
t fa
ir v
alu
eE
qu
ity
inve
stm
ents
,
avai
lab
le-f
or-
sale
10(a
)–
–2
74
,15
0–
–2
74
,15
04
4,8
34
–2
29
,31
62
74
,15
0
Eq
uit
y in
vest
men
ts
des
ign
ated
as
FVTP
L 10(a
)–
––
76
,18
5–
76
,18
5–
–7
6,1
85
76
,18
5
Der
ivat
ive
fin
anci
al
inst
rum
ents
:
- In
tere
st r
ate
swap
s an
d
forw
ard
fo
reig
n e
xch
ang
e co
ntr
acts
9,0
14
––
––
9,0
14
–9
,01
4–
9,0
14
- C
ross
cu
rren
cy s
wap
s 1
28
,81
6–
––
–1
28
,81
6–
12
8,8
16
–1
28
,81
6
13
7,8
30
–2
74
,15
07
6,1
85
–4
88
,16
5
Fin
anci
al a
sset
s n
ot
mea
sure
d a
t fa
ir v
alu
eO
ther
no
n-c
urr
ent
asse
ts
–9
5,5
97
––
–9
5,5
97
Trad
e an
d o
ther
rec
eiva
ble
s12
–1
,46
4,5
88
––
–1
,46
4,5
88
Ass
ets
hel
d f
or
sale
^–
18
,89
3–
––
18
,89
3
Cas
h a
nd
cas
h e
qu
ival
ents
16
–4
,79
2,6
29
––
–4
,79
2,6
29
–6
,37
1,7
07
––
–6
,37
1,7
07
^
Ref
er t
o n
ote
15 f
or
fin
anci
al a
sset
s/lia
bili
ties
in a
sset
s/lia
bili
ties
hel
d f
or
sale
.
NO
TES
TO
TH
EFI
NA
NC
IAL
STA
TEM
EN
TS
FINANCIALS & ADDITIONAL INFORMATION
Cap
itaL
and
Lim
ited
Ann
ual R
epor
t 20
18
261

34.
FAIR
VA
LUE O
F A
SS
ETS
AN
D L
IAB
ILIT
IES
(co
nti
nu
ed)
(c)
Acc
ou
nti
ng
cla
ssifi
cati
on
an
d f
air
valu
es (
con
tin
ued
)
<--
----
----
----
----
----
----
Car
ryin
g a
mou
nt
----
----
----
----
----
----
-->
<--
----
----
----
----
----
- Fa
ir v
alu
e --
----
----
----
----
->
The
Gro
up
Note
Fair
val
ue
- h
edg
ing
in
stru
men
tsLoan
s an
d
rece
ivab
les
Ava
ilab
le-
for-
sale
Oth
er
fin
anci
al
liab
iliti
es
Tota
lLev
el 1
Lev
el 2
Lev
el 3
Tota
l$
’00
0$
’00
0$
’00
0$
’00
0$’0
00
$’0
00
$’0
00
$’0
00
$’0
00
1 J
anu
ary
2017
Fin
anci
al lia
bili
ties
m
easu
red
at
fair
val
ue
Der
ivat
ive
fin
anci
al in
stru
men
ts:
- In
tere
st r
ate
swap
s an
d f
orw
ard
fo
reig
n e
xch
ang
e co
ntr
acts
17
(7,6
50)
––
–(7
,650)
–(7
,650)
–(7
,650)
-
Inte
rest
rat
e sw
aps
and
cro
ss
curr
ency
sw
aps
21
(50,2
94)
––
–(5
0,2
94)
–(5
0,2
94)
–(5
0,2
94)
(57,9
44)
––
–(5
7,9
44)
Fin
anci
al lia
bili
ties
not
mea
sure
d
at f
air
valu
eO
ther
no
n-c
urr
ent
liab
iliti
es#
––
–(4
28,6
20)
(428,6
20)
––
(416,8
46)
(416,8
46)
Ban
k b
orr
owin
gs
19
––
–(7
,347,5
80)
(7,3
47,5
80)
–(7
,355,6
10)
–(7
,355,6
10)
Deb
t se
curi
ties
20
––
–(7
,504,7
96)
(7,5
04,7
96)
(3,9
32,8
81)
(3,6
86,3
52)
–(7
,619,2
33)
Trad
e an
d o
ther
pay
able
s#–
––
(2,5
61,7
46)
(2,5
61,7
46)
Liab
iliti
es h
eld
fo
r sa
le^
––
–(1
2,6
92)
(12
,692)
––
–(1
7,85
5,43
4)(1
7,85
5,43
4)
#
Exc
lud
es q
uas
i-eq
uit
y lo
ans
and
liab
ility
fo
r em
plo
yee
ben
efits
.^
R
efer
to
no
te 1
5 f
or
fin
anci
al a
sset
s/lia
bili
ties
in a
sset
s/lia
bili
ties
hel
d f
or
sale
.
NO
TES
TO
TH
EFI
NA
NC
IAL
STA
TEM
EN
TS
FINANCIALS & ADDITIONAL INFORMATIONC
apit
aLan
d L
imit
edA
nnua
l Rep
ort
2018
262

34.
FAIR
VA
LUE O
F A
SS
ETS
AN
D L
IAB
ILIT
IES
(co
nti
nu
ed)
(c)
Acc
ou
nti
ng
cla
ssifi
cati
on
an
d f
air
valu
es (
con
tin
ued
)
<--
- C
arry
ing
am
ou
nt-
-->
<--
----
----
----
----
----
-- Fa
ir v
alu
e -
----
----
----
----
----
-->
The
Com
pan
yN
ote
Am
ort
ised
Cost
Tota
lLev
el 1
Lev
el 2
Lev
el 3
Tota
l$
’00
0$
’000
$’0
00
$’0
00
$’0
00
$’0
00
31
Dec
emb
er 2
01
8Fi
nan
cial
ass
ets
not
m
easu
red
at
fair
val
ue
Am
ou
nt
du
e fr
om
su
bsi
dia
ries
65
,81
7,5
08
5,8
17
,508
Trad
e an
d o
ther
rec
eiva
ble
s1
21
,16
6,0
65
1,1
66
,065
Cas
h a
nd
cas
h e
qu
ival
ents
16
15
,15
61
5,1
56
6,9
98
,72
96
,99
8,7
29
Fin
anci
al lia
bili
ties
not
m
easu
red
at
fair
val
ue
Deb
t se
curi
ties
20
(2,0
51
,44
0)
(2,0
51,4
40)
(2,0
34,7
42)
––
(2,0
34,7
42)
Trad
e an
d o
ther
pay
able
s#(2
58
,47
9)
(25
8,4
79)
(2,3
09
,91
9)
(2,3
09,9
19)
#
Exc
lud
es li
abili
ty f
or
emp
loye
e b
enefi
ts.
NO
TES
TO
TH
EFI
NA
NC
IAL
STA
TEM
EN
TS
FINANCIALS & ADDITIONAL INFORMATION
Cap
itaL
and
Lim
ited
Ann
ual R
epor
t 20
18
263

34.
FAIR
VA
LUE O
F A
SS
ETS
AN
D L
IAB
ILIT
IES
(co
nti
nu
ed)
(c)
Acc
ou
nti
ng
cla
ssifi
cati
on
an
d f
air
valu
es (
con
tin
ued
)
<--
----
---
Car
ryin
g a
mou
nt
----
----
><
----
----
----
----
----
-- Fa
ir v
alu
e -
----
----
----
----
----
>
The
Com
pan
yN
ote
Loan
s an
d
rece
ivab
les
Oth
er
fin
anci
al
liab
iliti
esTo
tal
Lev
el 1
Lev
el 2
Lev
el 3
Tota
l$
’00
0$
’00
0$
’000
$’0
00
$’0
00
$’0
00
$’0
00
31
Dec
emb
er 2
01
7Fi
nan
cial
ass
ets
not
mea
sure
d a
t fa
ir v
alu
eTr
ade
and
oth
er r
ecei
vab
les
12
1,9
73
,31
2–
1,9
73
,312
Cas
h a
nd
cas
h e
qu
ival
ents
16
7,2
47
–7,2
47
1,9
80
,55
9–
1,9
80,5
59
Fin
anci
al lia
bili
ties
not
mea
sure
d a
t fa
ir v
alu
eD
ebt
secu
riti
es2
0–
(2,6
35
,65
9)
(2,6
35,6
59)
(2,6
63,8
07)
––
(2,6
63,8
07)
Trad
e an
d o
ther
pay
able
s#–
(88
0,7
33
)(8
80
,733)
–(3
,51
6,3
92
)(3
,51
6,3
92)
1 J
anu
ary
20
17
Fin
anci
al a
sset
s n
ot
mea
sure
d a
t fa
ir v
alu
eTr
ade
and
oth
er r
ecei
vab
les
12
1,1
12
,80
3–
1,1
12,8
03
Cas
h a
nd
cas
h e
qu
ival
ents
16
7,7
91
–7
,791
1,1
20
,59
4–
1,1
20
,594
Fin
anci
al lia
bili
ties
not
mea
sure
d a
t fa
ir v
alu
eD
ebt
secu
riti
es2
0–
(2,7
29
,05
8)
(2,7
29,0
58)
(2,7
30,6
74)
––
(2,7
30,6
74)
Trad
e an
d o
ther
pay
able
s#–
(12
1,1
93
)(1
21
,193)
–(2
,85
0,2
51
)(2
,85
0,2
51)
#
Exc
lud
es q
uas
i-eq
uit
y lo
ans
and
liab
ility
fo
r em
plo
yee
ben
efits
.
NO
TES
TO
TH
EFI
NA
NC
IAL
STA
TEM
EN
TS
FINANCIALS & ADDITIONAL INFORMATIONC
apit
aLan
d L
imit
edA
nnua
l Rep
ort
2018
264

34. FAIR VALUE OF ASSETS AND LIABILITIES (continued)
(c) Accounting classification and fair values (continued)
The following table shows the carrying amounts and fair values of significant non-financial assets, including their levels in the fair value hierarchy.
Fair valueLevel 3
Note $’000
The Group
31 December 2018Non-financial assets measured at fair valueInvestment properties 5 39,445,960Assets held for sale – investment properties 15 254,080
39,700,040
31 December 2017Non-financial assets measured at fair valueInvestment properties 5 36,479,434Assets held for sale – investment properties 15 512,413
36,991,847
1 January 2017Non-financial assets measured at fair valueInvestment properties 5 18,998,389Assets held for sale – investment properties 15 6,549
19,004,938
NOTES TO THEFINANCIAL STATEMENTS
FINANCIALS & ADDITIONAL INFORMATION
Cap
itaL
and
Lim
ited
Ann
ual R
epor
t 20
18
265

34. FAIR VALUE OF ASSETS AND LIABILITIES (continued)
(d) Level 3 fair value measurements
(i) Reconciliation of Level 3 fair value
The movements of financial and non-financial assets classified under Level 3 and measured at fair value are presented as follows:
Equity
investments – available-for-
sale
Equity investments
designated at FVTPL
Equity investments
at FVOCI
Equity investments
at FVTPL
Assets held for sale –
investment properties
Note $’000 $’000 $’000 $’000 $’000
The Group 2018At 1 January 2018
per FRS 39 237,308 70,168 – – 512,413Adjustment on initial
application of SFRS(I) 9 41(c) (237,308) (70,168) 17,469 296,327 –
Adjusted balance as at 1 January 2018 per SFRS(I) 9 – – 17,469 296,327 512,413
Additions – – 51,027 – 2,609Disposals – – – – (515,022)Changes in fair value
recognised in the profit or loss – – – (746) –
Changes in fair value recognised in other comprehensive income – – 2,849 – –
Reclassifications from development properties for sale to assets held for sale – – – – 254,080
Translation differences – – – 1,277 –At 31 December 2018 – – 71,345 296,858 254,080
Movement for investment properties are set out in note 5.
NOTES TO THEFINANCIAL STATEMENTS
FINANCIALS & ADDITIONAL INFORMATIONC
apit
aLan
d L
imit
edA
nnua
l Rep
ort
2018
266

34. FAIR VALUE OF ASSETS AND LIABILITIES (continued)
(d) Level 3 fair value measurements (continued)
(i) Reconciliation of Level 3 fair value (continued)
Equity investments –
available- for-sale
Equity investments designated
at FVTPL
Assets held for sale –
investment properties
$’000 $’000 $’000
The Group2017Balance as at 1 January 2017 229,316 76,185 6,549Additions 9,890 – –Disposals (1,149) – (6,669)Capital reduction – (1,986) –Changes in fair value recognised in the
profit or loss – 207 74,855Changes in fair value recognised in other
comprehensive income (725) – –Reclassifications (to) assets held for sale/
from development properties for sale – – 438,368Translation differences (24) (4,238) (690)Balance as at 31 December 2017 237,308 70,168 512,413
NOTES TO THEFINANCIAL STATEMENTS
FINANCIALS & ADDITIONAL INFORMATION
Cap
itaL
and
Lim
ited
Ann
ual R
epor
t 20
18
267

34.
FAIR
VA
LUE O
F A
SS
ETS
AN
D L
IAB
ILIT
IES
(co
nti
nu
ed)
(d)
Lev
el 3
fai
r va
lue
mea
sure
men
ts (
con
tin
ued
)
(ii)
Val
uatio
n t
ech
niq
ues
and
sig
nifi
can
t un
obse
rvab
le in
put
s
The
follo
win
g t
able
sh
ows
the
valu
atio
n t
ech
niq
ues
use
d in
mea
suri
ng
sig
nifi
can
t Le
vel 3
fai
r va
lues
, as
wel
l as
the
sig
nifi
can
t u
no
bse
rvab
le in
pu
ts u
sed
.
Inve
stm
ent
pro
per
ties
(in
clu
din
g inve
stm
ent
pro
per
ties
cla
ssifi
ed a
s as
sets
hel
d f
or
sale
)
Val
uat
ion
met
hod
s
Key
u
nob
serv
able
in
pu
tsS
hop
pin
g
mal
lsC
om
mer
cial
Inte
gra
ted
d
evel
op
men
tsS
ervi
ced
re
sid
ence
s
Inte
r-re
lati
on
ship
b
etw
een
key
u
nob
serv
able
in
pu
ts a
nd
fa
ir v
alu
e m
easu
rem
ent
Cap
ital
isat
ion
ap
pro
ach
Cap
ital
isat
ion
rat
e (n
et)1
The
esti
mat
ed f
air
valu
e va
ries
inve
rsel
y ag
ain
st
the
cap
ital
isat
ion
rat
e an
d in
crea
ses
wit
h
hig
her
occ
up
ancy
rat
e.
20
18
3.8
% t
o 7
.3%
3.5
% t
o 8
.0%
3.5
% t
o 1
0.5
%–
20
17
4.5
% t
o 8
.3%
3.6
% t
o 8
.0%
5.8
% t
o 1
0.0
%–
Cap
ital
isat
ion
rat
e (g
ross
)2
20
18
––
––
20
17
––
5.5
%3.5
%O
ccu
pan
cy r
ate
20
18
68
.7%
to
10
0%
75
.0%
to
99
.0%
50
.1%
to
99.0
%–
20
17
66
.6%
to
10
0%
80
.0%
to
10
0.0
%5
2.0
% t
o 9
2.0
%89.0
%
Dis
cou
nte
d c
ash
flow
ap
pro
ach
Dis
cou
nt
rate
The
esti
mat
ed f
air
valu
e va
ries
inve
rsel
y ag
ain
st
the
dis
cou
nt
rate
an
d
term
inal
yie
ld r
ate
and
in
crea
ses
wit
h h
igh
er
occ
up
ancy
rat
e.
20
18
6.9
% t
o 1
2.5
%3
.7%
to
8.0
%6
.8%
to
13.0
%3.8
% t
o 1
3.0
%2
01
75
.1%
to
13
.5%
3.8
% t
o 7
.5%
7.8
% t
o 1
4.5
%4.0
% t
o 1
5.0
%Te
rmin
al y
ield
rat
e2
01
84
.3%
to
11
.0%
3.5
% t
o 5
.0%
3.8
% t
o 1
1.0
%3.0
% t
o 9
.2%
20
17
4.5
% t
o 1
2.0
%3
.6%
to
6.5
%4
.3%
to
12.0
%3.0
% t
o 1
1.0
%O
ccu
pan
cy r
ate
20
18
68
.7%
to
10
0%
60
.0%
to
99
.0%
50
.5%
to
100%
50.0
% t
o 9
9.0
%2
01
76
6.6
% t
o 1
00
%7
1.0
% t
o 1
00
%6
5.0
% t
o 1
00%
60.0
% t
o 9
9.0
%
1
Net
yie
ld b
asis
: af
ter
ded
uct
ing
pro
per
ty a
nd
rel
ated
exp
ense
s2
Gro
ss y
ield
bas
is: b
efo
re d
edu
ctin
g p
rop
erty
an
d r
elat
ed e
xpen
ses
NO
TES
TO
TH
EFI
NA
NC
IAL
STA
TEM
EN
TS
FINANCIALS & ADDITIONAL INFORMATIONC
apit
aLan
d L
imit
edA
nnua
l Rep
ort
2018
268

34.
FAIR
VA
LUE O
F A
SS
ETS
AN
D L
IAB
ILIT
IES
(co
nti
nu
ed)
(d)
Lev
el 3
fai
r va
lue
mea
sure
men
ts (
con
tin
ued
)
(ii)
Val
uatio
n t
ech
niq
ues
and
sig
nifi
can
t un
obse
rvab
le in
put
s (
con
tin
ued
)
Val
uat
ion
met
hod
s
Key
u
nob
serv
able
in
pu
tsS
hop
pin
g
mal
lsC
om
mer
cial
Inte
gra
ted
d
evel
op
men
tsS
ervi
ced
re
sid
ence
s
Inte
r-re
lati
on
ship
b
etw
een
key
u
nob
serv
able
in
pu
ts a
nd
fa
ir v
alu
e m
easu
rem
ent
Res
idu
al v
alu
e m
eth
od
Gro
ss d
evel
op
men
t va
lue
($ m
illio
n)
The
esti
mat
ed f
air
valu
e in
crea
ses
wit
h h
igh
er
gro
ss d
evel
op
men
t va
lue
and
dec
reas
es
wit
h h
igh
er c
ost
to
co
mp
leti
on
.
20
18
––
94
4 t
o 2
,000
–2
01
7–
–2,0
00
–
Est
imat
ed c
ost
to
com
ple
tio
n (
$ m
illio
n)
20
18
––
340 t
o 9
50
–2
01
7–
–950
–
Dir
ect
com
par
ison
m
eth
od
Co
mp
arab
le p
rice
($ p
er s
qu
are
met
re)
The
esti
mat
ed f
air
valu
e in
crea
ses
wit
h h
igh
er
com
par
able
pri
ce.
20
18
83
54
,73
6 t
o 6
,73
41
,360 t
o 2
,390
–2
01
7–
––
–
NO
TES
TO
TH
EFI
NA
NC
IAL
STA
TEM
EN
TS
FINANCIALS & ADDITIONAL INFORMATION
Cap
itaL
and
Lim
ited
Ann
ual R
epor
t 20
18
269

34. FAIR VALUE OF ASSETS AND LIABILITIES (continued)
(d) Level 3 fair value measurements (continued)
(ii) Valuation techniques and significant unobservable inputs (continued)
TypeValuation methods Key unobservable inputs
Inter-relationship between key unobservable inputs and fair value measurement
Equity investments at FVPTL
Income Approach
- Enterprise value/Revenue multiple of comparable companies: 1.8x to 3.1x (2017: 2.7x to 3.9x)
- Volatility of comparable companies: 36% to 48% (2017: 47% to 57%)
The estimated fair value increases with higher multiple and varies inversely against volatility.
The fair value of another equity investment at FVTPL was estimated based on the fair value of the underlying investment property of the investee company. The valuation was based on discounted cash flow approach and its significant unobservable inputs were consistent with the investment properties information presented above.
The fair value of equity investments at FVOCI was estimated based on net asset value approach which takes into consideration the fair value of the underlying assets and liabilities of the entities to which the financial instruments relate as well as the latest transaction price of the equity raising by the investees.
In 2017, the fair value of the China serviced residence properties which are classified as assets held for sale are based on the agreed contractual selling price. Management considers that any reasonably possible changes to the unobservable input will not result in a significant financial impact.
(iii) Valuation processes applied by the Group
The significant non-financial asset of the Group categorised within Level 3 of the fair value hierarchy is investment properties. The fair values of investment properties are determined by external, independent property valuers, who have the appropriate and recognised professional qualifications and recent experience in the location and category of property being valued. The property valuers provide the fair values of the Group’s investment property portfolio every six months. The valuation and its financial impact are discussed with the Audit Committee and Board of Directors in accordance with the Group’s reporting policies.
NOTES TO THEFINANCIAL STATEMENTS
FINANCIALS & ADDITIONAL INFORMATIONC
apit
aLan
d L
imit
edA
nnua
l Rep
ort
2018
270

35. COMMITMENTS
As at the balance sheet date, the Group and the Company had the following commitments:
(a) Operating lease
The Group leases a number of offices, motor vehicles, office equipments, industrial land, serviced residences and shopping malls under operating leases. The leases have tenure ranging from one to 48 years, with an option to renew the lease after that date. Lease payments are usually revised at each renewal date to reflect the market rate. Future minimum lease payments for the Group and the Company on non-cancellable operating leases are as follows:
The Group The Company2018 2017 2018 2017
$’000 $’000 $’000 $’000
Lease payments payable: Not later than 1 year 108,483 102,053 13,491 14,991 Between 1 and 5 years 202,516 197,200 55,503 61,330 After 5 years 584,865 575,565 548 16,319
895,864 874,818 69,542 92,640
(b) Commitments
The Group The Company2018 2017 2018 2017
$’000 $’000 $’000 $’000
Commitments in respect of:- capital expenditure contracted but not
provided for in the financial statements 77,116 84,660 – 1,233- development expenditure contracted
but not provided for in the financial statements 1,127,128 1,409,336 – –
- capital contribution in associates, joint ventures and investee companies 750,997 1,274,419 – –
- purchase of land/a property contracted but not provided for in the financial statements 269,714 458,764 – –
- shareholders’ loan committed to joint ventures and associates 70,656 407,662 – –
2,295,611 3,634,841 – 1,233
NOTES TO THEFINANCIAL STATEMENTS
FINANCIALS & ADDITIONAL INFORMATION
Cap
itaL
and
Lim
ited
Ann
ual R
epor
t 20
18
271
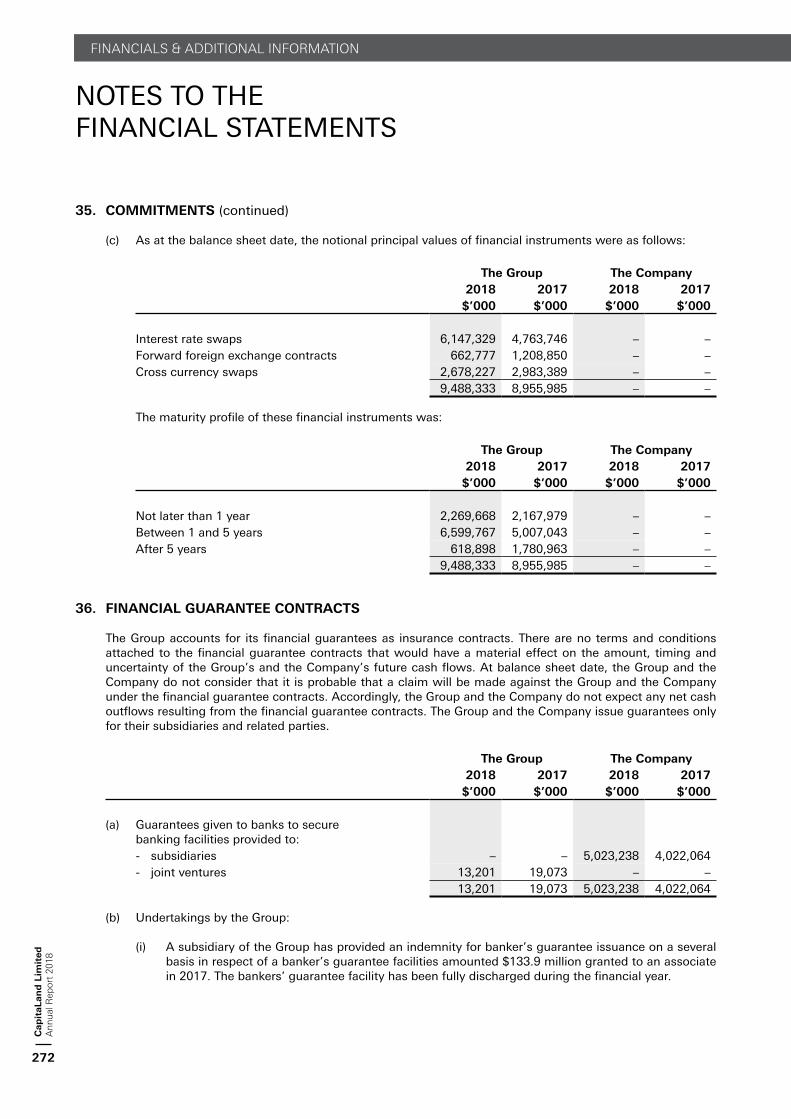
35. COMMITMENTS (continued)
(c) As at the balance sheet date, the notional principal values of financial instruments were as follows:
The Group The Company2018 2017 2018 2017
$’000 $’000 $’000 $’000
Interest rate swaps 6,147,329 4,763,746 – –Forward foreign exchange contracts 662,777 1,208,850 – –Cross currency swaps 2,678,227 2,983,389 – –
9,488,333 8,955,985 – –
The maturity profile of these financial instruments was:
The Group The Company2018 2017 2018 2017
$’000 $’000 $’000 $’000
Not later than 1 year 2,269,668 2,167,979 – –Between 1 and 5 years 6,599,767 5,007,043 – –After 5 years 618,898 1,780,963 – –
9,488,333 8,955,985 – –
36. FINANCIAL GUARANTEE CONTRACTS
The Group accounts for its financial guarantees as insurance contracts. There are no terms and conditions attached to the financial guarantee contracts that would have a material effect on the amount, timing and uncertainty of the Group’s and the Company’s future cash flows. At balance sheet date, the Group and the Company do not consider that it is probable that a claim will be made against the Group and the Company under the financial guarantee contracts. Accordingly, the Group and the Company do not expect any net cash outflows resulting from the financial guarantee contracts. The Group and the Company issue guarantees only for their subsidiaries and related parties.
The Group The Company2018 2017 2018 2017
$’000 $’000 $’000 $’000
(a) Guarantees given to banks to secure banking facilities provided to:- subsidiaries – – 5,023,238 4,022,064- joint ventures 13,201 19,073 – –
13,201 19,073 5,023,238 4,022,064
(b) Undertakings by the Group:
(i) A subsidiary of the Group has provided an indemnity for banker’s guarantee issuance on a several basis in respect of a banker’s guarantee facilities amounted $133.9 million granted to an associate in 2017. The bankers’ guarantee facility has been fully discharged during the financial year.
NOTES TO THEFINANCIAL STATEMENTS
FINANCIALS & ADDITIONAL INFORMATIONC
apit
aLan
d L
imit
edA
nnua
l Rep
ort
2018
272

36. FINANCIAL GUARANTEE CONTRACTS (continued)
(b) Undertakings by the Group: (continued)
(ii) Two subsidiaries of the Group provided project completion undertakings on a joint and several basis, in respect of multi-currency term loan and revolving loan facilities amounting to $300 million (2017: $127.6 million) granted to an associate. In addition, the shares in this associate were pledged as part of the securities to secure the credit facilities. As at 31 December 2018, the total amount outstanding under the facilities was $253.3 million (2017: $116.2 million).
(iii) Two subsidiaries of the Group provided interest shortfall and loan repayment undertaking on a proportionate and several basis, in respect of term loan and revolving loan facilities amounting to $350 million (2017: $320.0 million) granted to a joint venture. In addition, the shares in this joint venture were pledged as part of the securities to secure the credit facilities. As at 31 December 2018, the total amount outstanding under the facilities was $317.2 million (2017: $304.4 million).
(iv) Two subsidiaries of the Group provided an undertaking on security margin on a joint and several basis, in respect of term loan and revolving loan facilities amounting to $1,020.0 million (2017: $1,020.0 million) granted to an associate. As at 31 December 2018, the amount outstanding under the facilities was $922.2 million (2017: $759.1 million).
(v) Certain subsidiaries of the Group in China, whose principal activities are the trading of development properties, would in the ordinary course of business act as guarantors for the bank loans taken by the buyers to finance the purchase of residential properties developed by these subsidiaries. As at 31 December 2018, the outstanding notional amount of the guarantees amounted to $431.5 million (2017: $1,057.8 million).
(vi) During the year, a subsidiary of the Group has provided several undertakings on cost overrun, security margin and interest shortfall issued on a several basis as well as project completion undertakings on a joint and several basis, in respect of term loan and revolving construction facilities amounting to $631.0 million granted to joint ventures as at 31 December 2018. As at 31 December 2018, the amounts outstanding under the term loan is $512.6 million.
(vii) Two subsidiaries of the Group has pledged its shares and redeemable preference shares in an associate for a term loan facility obtained by the associate amounting to $1,096.3 million (2017: $672.9 million).
37. CONTINGENCY
AST2 Co., a subsidiary which the Group acquired in 2017, was named in an arbitration in 2014. The subsidiary prevailed in the arbitration as well as in all appeals therefrom and other related lawsuits, and only limited avenues of appeal remain. The vendor group has also agreed to indemnify the losses which AST2 Co., may incur from such arbitration and related proceedings.
In January 2019, the Court of Appeal dismissed the outstanding appeals in relation to the arbitration in full and in favour of AST2 Co. Accordingly, the vendor group’s indemnity to AST2 Co. has also been released.
NOTES TO THEFINANCIAL STATEMENTS
FINANCIALS & ADDITIONAL INFORMATION
Cap
itaL
and
Lim
ited
Ann
ual R
epor
t 20
18
273

38. SIGNIFICANT RELATED PARTY TRANSACTIONS
For the purposes of these financial statements, parties are considered to be related to the Group if the Group has the direct and indirect ability to control the party, jointly control or exercise significant influence over the party in making financial and operating decisions, or vice versa, or where the Group and the party are subject to common control or significant influence. Related parties may be individuals or other entities.
The Group considers the directors of the Company, and CapitaLand Management Council comprising the President & Group CEO and key management officers of the corporate office as well as CEOs of the strategic business units, to be key management personnel in accordance with SFRS(I) 1-24 Related Party Disclosures.
In addition to the related party information disclosed elsewhere in the financial statements, there were significant related party transactions which were carried out in the normal course of business on terms agreed between the parties as follows:
The Group The Company2018 2017 2018 2017
$’000 $’000 $’000 $’000
Related corporationsProject management fee income 1,347 1,808 – –
SubsidiariesManagement fee income – – 84,503 93,756IT and administrative support services – – 1,426 39,816Rental expense – – (16,868) (15,047)Proceeds from the sale of property, plant
and equipment and software – – 35,187 –Others – – (412) (354)
Associates and joint venturesManagement fee income 114,317 193,319 – –Construction and project management income 21,837 14,825 – –Rental expense (9,510) (7,765) – –Proceeds from the sale of properties – 881,578 – –Purchase consideration for acquisition of
investments – 1,538 – –Accounting service fee, acquisition fee,
divestment fee, marketing income and others 47,872 53,155 (1) (19)
Key management personnelRedemption of bonds issued by a subsidiary – 930 – –Sale of a residential property by a subsidiary 352 – – –Interest paid/payable by the Company and its
subsidiaries 83 92 64 –
Remuneration of key management personnel
Salary, bonus and other benefits 24,996 17,316 14,396 9,797Employer’s contributions to defined
contribution plans 190 143 98 68Equity compensation benefits 11,339 7,752 6,937 4,374
36,525 25,211 21,431 14,239
NOTES TO THEFINANCIAL STATEMENTS
FINANCIALS & ADDITIONAL INFORMATIONC
apit
aLan
d L
imit
edA
nnua
l Rep
ort
2018
274

39. OPERATING SEGMENTS
Management determines the operating segments based on the reports reviewed and used by the CapitaLand Management Council for strategic decisions making and resources allocation. With effect from 1 January 2018, the Group has organised its structure into real estate investment and operating platforms to allow the Group to harness the competitive advantages and core competences across various asset classes as well as enable it to allocate capital more efficiently.
For segment reporting purpose, the primary segment is by geography and it comprises CapitaLand Singapore, Malaysia and Indonesia (CL SMI), CapitaLand China (CL China), CapitaLand Vietnam (CL Vietnam) and CapitaLand International (CL International).
The Group’s reportable operating segments are as follows:
(i) CL SMI – involves in the residential, commercial, shopping malls and serviced residence properties development for sale in Singapore, Malaysia and Indonesia.
(ii) CL China – involves in the residential, commercial, shopping malls and serviced residences property development in China.
(iii) CL Vietnam– involves in the residential, commercial and serviced residences property development in Vietnam.
(iv) CL International – involves in commercial, shopping malls and serviced residences property development in Europe, United States of America and Middle East as well as key cities of Asia Pacific excludes Singapore, Malaysia, Indonesia, China and Vietnam.
(v) Others – includes Corporate Office and Group Treasury.
Information regarding the operations of each reportable segment is included below. Management monitors the operating results of each of its business units for the purpose of making decisions on resource allocation and performance assessment. Performance is measured based on segment earnings before interest and tax (EBIT). EBIT is used to measure performance as management believes that such information is the most relevant in evaluating the results of certain segments relative to other entities that operate within these industries. Group financing (including finance costs) and income taxes are managed on a group basis and are not allocated to operating segments. Segment assets and liabilities are presented net of inter-segment balances. Inter-segment pricing is determined on arm’s length basis.
In term of secondary segment, the Group presents its businesses based on asset classes of residential and commercial strata, retail, commercial and lodging.
NOTES TO THEFINANCIAL STATEMENTS
FINANCIALS & ADDITIONAL INFORMATION
Cap
itaL
and
Lim
ited
Ann
ual R
epor
t 20
18
275

39.
OP
ER
ATIN
G S
EG
MEN
TS
(co
nti
nu
ed)
Op
erat
ing
Seg
men
ts –
31
Dec
emb
er 2
01
8
CL
SM
IC
LC
hin
aC
L
Vie
tnam
CL
Inte
rnat
ion
alO
ther
sElim
inat
ion
Tota
l$
’00
0$
’00
0$
’00
0$’0
00
$’0
00
$’0
00
$’0
00
Rev
enu
eE
xter
nal
rev
enu
e2
,10
3,3
90
2,3
10
,16
21
21
,56
01,0
04,9
19
62,3
92
–5,6
02,4
23
Inte
r-se
gm
ent
reve
nu
e5
6,2
26
41
,53
35
54
38,5
25
559,6
28
(696,4
66)
–To
tal re
ven
ue
2,1
59
,61
62
,35
1,6
95
12
2,1
14
1,0
43,4
44
622,0
20
(696,4
66)
5,6
02,4
23
Seg
men
tal re
sult
sC
om
pan
y an
d s
ub
sid
iari
es1
,74
8,7
55
1,1
67
,37
31
1,0
21
304,2
53
847,0
85
(892,8
96)
3,1
85,5
91
Ass
oci
ates
16
,73
85
97
,79
83
8,1
14
(27,6
27)
(2)
–625,0
21
Join
t ve
ntu
res
80
,68
92
22
,39
02
2,6
44
8,6
63
––
334,3
86
Ear
nin
gs
bef
ore
in
tere
st a
nd
tax
1,8
46
,18
21
,98
7,5
61
71
,77
9285,2
89
847,0
83
(892,8
96)
4,1
44,9
98
Fin
ance
co
sts
(636,4
95)
Tax
exp
ense
(658,6
91)
Pro
fit
for
the
year
2,8
49,8
12
Seg
men
t as
sets
29
,26
1,3
95
23
,40
7,4
79
1,2
64
,26
48,6
65,8
91
8,2
91,3
32
(6,2
42,8
04)
64,6
47,5
57
Seg
men
t lia
bili
ties
10
,69
8,8
92
8,9
24
,38
64
35
,14
03,8
29,0
22
7,4
53,1
78
–31,3
40,6
18
NO
TES
TO
TH
EFI
NA
NC
IAL
STA
TEM
EN
TS
FINANCIALS & ADDITIONAL INFORMATIONC
apit
aLan
d L
imit
edA
nnua
l Rep
ort
2018
276

39.
OP
ER
ATIN
G S
EG
MEN
TS
(co
nti
nu
ed)
Op
erat
ing
Seg
men
ts –
31
Dec
emb
er 2
01
8 (
con
tin
ued
)
CL
SM
IC
LC
hin
aC
L
Vie
tnam
CL
Inte
rnat
ion
alO
ther
sElim
inat
ion
Tota
l$’0
00
$’0
00
$’0
00
$’0
00
$’0
00
$’0
00
$’0
00
Oth
er s
egm
ent
item
s:
Inte
rest
in
com
e1
5,4
30
34
,21
32
,24
24
,58
83
1,5
33
–8
8,0
06
Dep
reci
atio
n a
nd
am
ort
isat
ion
(9,3
22
)(8
,22
3)
(2,5
58
)(3
7,2
85
)(1
7,1
15
)–
(74
,50
3)
Rev
ersa
l of
pro
visi
on
for
fore
seea
ble
loss
es
43
,32
3–
13
9–
––
43
,46
2
Allo
wan
ce m
ade
of
pro
visi
on
for
im
pai
rmen
t lo
sses
for
asse
ts(1
77
)(1
79
)(2
9)
(12
,90
7)
(10
0)
–(1
3,3
92
)
Fair
val
ue
gai
ns
on
inve
stm
ent
p
rop
erti
es a
nd
ass
ets
hel
d f
or
sale
45
9,9
81
15
2,1
42
4,3
96
60
,49
9–
–6
77
,01
8
Sh
are-
bas
ed e
xpen
ses
(14
,83
2)
(13
,85
8)
(1,1
76
)(5
,78
5)
(14
,77
0)
–(5
0,4
21
)
Gai
ns/
(loss
) on
dis
posa
l of
inve
stm
ents
11
0,6
02
81
,42
8(2
3,7
07
)(2
,01
0)
3,9
26
–1
70
,23
9
Ass
oci
ates
24
7,3
22
5,9
18
,65
63
0,0
51
9,9
57
1,2
78
–6
,20
7,2
64
Join
t ve
ntu
res
1,4
01
,73
22
,21
8,4
59
71
,56
72
80
,59
6–
–3
,97
2,3
54
Cap
ital
exp
end
itu
re#
39
4,7
33
49
9,8
09
12
,82
61
,24
7,5
15
29
,76
0–
2,1
84
,64
3
Non
-cu
rren
t as
sets
42
6,3
55
,72
11
5,8
31
,35
55
54
,31
87
,79
0,2
79
15
,03
1,8
33
(15
,55
0,9
48
)5
0,0
12
,55
8
Ear
nin
gs
bef
ore
in
tere
st, ta
x,
dep
reci
atio
n a
nd
am
ort
isat
ion
1,8
55
,50
41
1,9
95
,78
42
74
,33
73
22
,57
43
(28
,69
8)1
–4
,21
9,5
01
#
Cap
ital
exp
end
itu
re c
on
sist
s o
f ad
dit
ion
s o
f p
rop
erty
, p
lan
t an
d e
qu
ipm
ent,
inve
stm
ent
pro
per
ties
an
d in
tan
gib
le a
sset
s.1
Incl
ud
ed c
on
trib
uti
on
fro
m S
ing
apo
re o
f $1,7
33.9
mill
ion
. 2
Incl
ud
ed c
on
trib
uti
on
fro
m H
on
g K
on
g o
f $62.1
mill
ion
. 3
Incl
ud
ed c
on
trib
uti
on
fro
m J
apan
, K
ore
a, F
ran
ce, G
erm
any,
Bel
giu
m, U
nit
ed K
ing
do
m, S
pai
n, A
ust
ralia
, N
ew Z
eala
nd
, Ir
elan
d a
nd
Un
ited
Sta
tes
of
Am
eric
a am
ou
nti
ng
to
$369.7
mill
ion
.4
No
n-c
urr
ent
asse
ts c
om
pri
sed
pro
per
ty, p
lan
t an
d e
qu
ipm
ent,
inta
ng
ible
ass
ets,
inve
stm
ent
pro
per
ties
, as
soci
ates
an
d jo
int
ven
ture
s.
NO
TES
TO
TH
EFI
NA
NC
IAL
STA
TEM
EN
TS
FINANCIALS & ADDITIONAL INFORMATION
Cap
itaL
and
Lim
ited
Ann
ual R
epor
t 20
18
277

39.
OP
ER
ATIN
G S
EG
MEN
TS
(co
nti
nu
ed)
Op
erat
ing
Seg
men
ts –
31
Dec
emb
er 2
01
7
CL
SM
IC
LC
hin
aC
L
Vie
tnam
CL
Inte
rnat
ion
alO
ther
sElim
inat
ion
Tota
l$
’00
0$
’00
0$
’00
0$’0
00
$’0
00
$’0
00
$’0
00
Rev
enu
eE
xter
nal
rev
enu
e1
,97
6,6
73
1,7
85
,07
79
3,1
08
760,8
23
2,5
19
–4,6
18,2
00
Inte
r-se
gm
ent
reve
nu
e1
4,1
53
1,8
78
25
30,7
46
614,8
98
(661,7
00)
–To
tal re
ven
ue
1,9
90
,82
61
,78
6,9
55
93
,13
3791,5
69
617,4
17
(661,7
00)
4,6
18,2
00
Seg
men
tal re
sult
sC
om
pan
y an
d s
ub
sid
iari
es1
,27
1,8
21
88
8,1
20
48
,62
4253,7
41
1,0
48,5
63
(1,0
90,9
58)
2,4
19,9
11
Ass
oci
ates
12
7,7
02
46
2,6
96
(1,0
15
)(3
5,6
96)
(28)
–553,6
59
Join
t ve
ntu
res
16
0,0
00
14
8,9
64
18
,63
91,0
26
––
328,6
29
Ear
nin
gs
bef
ore
in
tere
st a
nd
tax
1,5
59
,52
31
,49
9,7
80
66
,24
8219,0
71
1,0
48,5
35
(1,0
90,9
58)
3,3
02,1
99
Fin
ance
co
sts
(486,6
69)
Tax
exp
ense
(468,9
50)
Pro
fit
for
the
year
2,3
46,5
80
Seg
men
t as
sets
28
,09
5,8
97
22
,27
8,0
16
1,1
81
,94
97,0
74,3
62
9,1
22,8
45
(6,2
13,8
90)
61,5
39,1
79
Seg
men
t lia
bili
ties
10
,72
9,5
32
8,1
10
,75
33
03
,69
63,5
17,9
71
6,7
59,4
03
–29,4
21,3
55
NO
TES
TO
TH
EFI
NA
NC
IAL
STA
TEM
EN
TS
FINANCIALS & ADDITIONAL INFORMATIONC
apit
aLan
d L
imit
edA
nnua
l Rep
ort
2018
278

39.
OP
ER
ATIN
G S
EG
MEN
TS
(co
nti
nu
ed)
Op
erat
ing
Seg
men
ts –
31
Dec
emb
er 2
01
7 (
con
tin
ued
)
CL
SM
IC
LC
hin
aC
L
Vie
tnam
CL
Inte
rnat
ion
alC
orp
ora
te a
nd
O
ther
sElim
inat
ion
Tota
l$’0
00
$’0
00
$’0
00
$’0
00
$’0
00
$’0
00
$’0
00
Oth
er s
egm
ent
item
s:
Inte
rest
in
com
e1
2,8
89
27
,57
71
,68
33
,55
11
6,3
47
–6
2,0
47
Dep
reci
atio
n a
nd
am
ort
isat
ion
(13
,80
2)
(10
,45
8)
(2,8
97
)(3
4,8
71
)(1
4,2
64
)–
(76
,29
2)
(Allo
wan
ce m
ade)
/Rev
ersa
l of
pro
visi
on
for
fo
rese
eab
le loss
es
(20
0)
24
,01
9(1
43
)4
,00
0–
–2
7,6
76
Allo
wan
ce m
ade
of
pro
visi
on
for
im
pai
rmen
t lo
sses
for
asse
ts(2
,13
6)
(72
4)
–(1
,75
5)
(20
)–
(4,6
35
)
Fair
val
ue
gai
ns/
(loss
es)
on
inve
stm
ent
p
rop
erti
es a
nd
ass
ets
hel
d f
or
sale
19
5,7
46
5,9
90
(85
4)
10
8,9
51
––
30
9,8
33
Sh
are-
bas
ed e
xpen
ses
(17
,13
6)
(15
,44
2)
(1,0
34
)(6
,30
6)
(15
,41
5)
–(5
5,3
33
)
Gai
ns
on
dis
posa
l of
inve
stm
ents
26
4,3
62
90
,10
81
9,8
47
47
,78
52
6–
42
2,1
28
Ass
oci
ates
20
4,6
07
5,7
63
,54
81
36
,82
38
5,6
65
1,2
79
–6
,19
1,9
22
Join
t ve
ntu
res
1,3
14
,78
02
,34
1,6
66
60
,50
22
85
,41
51
1,1
64
–4
,01
3,5
27
Cap
ital
exp
end
itu
re#
1,2
23
,07
81
08
,25
51
5,7
92
95
8,8
23
18
,48
7–
2,3
24
,43
5
Non
-cu
rren
t as
sets
42
6,2
96
,74
41
3,9
99
,59
06
26
,57
96
,12
0,6
24
15
,34
4,5
60
(15
,26
8,8
70
)4
7,1
19
,22
7
Ear
nin
gs
bef
ore
in
tere
st, ta
x,
dep
reci
atio
n a
nd
am
ort
isat
ion
1,5
73
,32
51
1,5
10
,23
82
69
,14
52
53
,94
23
(28
,15
9)1
–3
,37
8,4
91
NO
TES
TO
TH
EFI
NA
NC
IAL
STA
TEM
EN
TS
FINANCIALS & ADDITIONAL INFORMATION
Cap
itaL
and
Lim
ited
Ann
ual R
epor
t 20
18
279

39.
OP
ER
ATIN
G S
EG
MEN
TS
(co
nti
nu
ed)
Op
erat
ing
Seg
men
ts –
31
Dec
emb
er 2
01
7 (
con
tin
ued
)
#
Cap
ital
exp
end
itu
re c
on
sist
s o
f ad
dit
ion
s o
f p
rop
erty
, p
lan
t an
d e
qu
ipm
ent,
inve
stm
ent
pro
per
ties
an
d in
tan
gib
le a
sset
s.1
Incl
ud
ed c
on
trib
uti
on
fro
m S
ing
apo
re o
f $1,4
54.4
mill
ion
.2
Incl
ud
ed lo
ss f
rom
Ho
ng
Ko
ng
of
$0.4
mill
ion
.3
Incl
ud
ed c
on
trib
uti
on
fro
m J
apan
, K
ore
a, F
ran
ce, G
erm
any,
Bel
giu
m, U
nit
ed K
ing
do
m, S
pai
n, A
ust
ralia
, Ir
elan
d a
nd
Un
ited
Sta
tes
of
Am
eric
a am
ou
nti
ng
to
$293.0
mill
ion
.4
No
n-c
urr
ent
asse
ts c
om
pri
sed
pro
per
ty, p
lan
t an
d e
qu
ipm
ent,
inta
ng
ible
ass
ets,
inve
stm
ent
pro
per
ties
, as
soci
ates
an
d jo
int
ven
ture
s.
Ass
et C
lass
In
form
atio
n
Res
iden
tial
an
d
Com
mer
cial
S
trat
aR
etai
lC
om
mer
cial
Lod
gin
gO
ther
s*G
rou
p$
’00
0$
’00
0$’0
00
$’0
00
$’0
00
$’0
00
31
Dec
emb
er 2
01
8
Ext
ern
al r
even
ue
2,1
68
,64
21
,61
3,8
18
646,4
65
1,2
00,7
31
(27,2
33)
5,6
02,4
23
Ear
nin
gs
bef
ore
in
tere
st a
nd
tax
8
80
,54
22
,06
2,0
55
959,8
48
319,7
40
(77,1
87)
4,1
44,9
98
Tota
l as
sets
9,5
40
,46
92
5,8
53
,16
617,2
02,9
35
9,9
39,4
56
2,1
11,5
31
64,6
47,5
57
31
Dec
emb
er 2
01
7
Ext
ern
al r
even
ue
2,1
31
,42
51
,01
9,6
83
505,1
40
990,5
16
(28,5
64)
4,6
18,2
00
Ear
nin
gs
bef
ore
in
tere
st a
nd
tax
8
85
,17
41
,07
2,6
37
1,0
39,6
77
351,5
36
(46,8
25)
3,3
02,1
99
Tota
l as
sets
8,0
19
,80
32
5,7
82
,48
315,5
41,4
74
9,2
77,0
82
2,9
18,3
37
61,5
39,1
79
* In
clu
des
inte
rco
mp
any
elim
inat
ion
s an
d e
xpen
ses
at S
BU
Co
rpo
rate
.
NO
TES
TO
TH
EFI
NA
NC
IAL
STA
TEM
EN
TS
FINANCIALS & ADDITIONAL INFORMATIONC
apit
aLan
d L
imit
edA
nnua
l Rep
ort
2018
280

40. SUBSEQUENT EVENTS
(a) On 7 January 2019, CapitaLand announced that it had formed a 50:50 joint venture with an unrelated third party to acquire approximately 70% of Pufa Tower in Shanghai, China, a 34-storey office property in Shanghai’s core Lujiazui central business district in Pudong New Area, for RMB2,752 million (about $546.3 million).
(b) On 9 January 2019, Ascott Residence Trust announced that it had entered into a sale and purchase agreement with an unrelated third party to divest Ascott Raffles Place in Singapore for an aggregate consideration of $353.3 million.
(c) On 14 January 2019, CapitaLand announced that it had entered into a sale and purchase agreement with Ascendas-Singbridge Pte. Ltd. to acquire all the issued and paid-up ordinary shares of Ascendas Pte Ltd and Singbridge Pte. Ltd., respectively, for a total consideration of $6,035.9 million. 50% of the total consideration amounting to $3,017.93 million, to be financed by debt, will be paid in cash and the balance of the 50% amounting to $3,017.93 million will be paid via the allotment and issuance of 862,264,714 CapitaLand Shares.
41. EXPLANATION OF TRANSITION TO SFRS(I) AND ADOPTION OF NEW ACCOUNTING STANDARDS
As stated in note 2.1, these are the first financial statements of the Group and of the Company prepared in accordance with SFRS(I).
The accounting policies set out in note 2 have been applied in preparing the financial statements for the year ended 31 December 2018, the comparative information presented in these financial statements for the year ended 31 December 2017 and in the preparation of the opening SFRS(I) statement of financial position at 1 January 2017 (the Group’s date of transition), subject to the mandatory exceptions and optional exemptions under SFRS(I) 1. No material adjustments were made in preparing the opening SFRS(I) statement of financial position.
In addition to the adoption of the new framework, the Group also concurrently applied the following SFRS(I), interpretations of SFRS(I) and requirements of SFRS(I) which are mandatorily effective from the same date.
• SFRS(I) 15 Revenue from Contracts with Customers;• SFRS(I) 9 Financial Instruments;• Amendments to SFRS(I) 2 Share-based Payment;• Amendments to SFRS(I) 1-40 Investment Property;• Amendments to SFRS(I) 1;• Amendments to SFRS(I) 1-28 Investments in Associates and Joint Ventures; and• SFRS(I) INT 22 Foreign Currency Transactions and Advance Consideration.
The application of the above standards and interpretations do not have a material effect on the financial statements, except for SFRS(I) 15.
The adoption of SFRS(I) does not have any impact to the Company’s balance sheets as at 1 January 2017, 31 December 2017 and 1 January 2018.
The following reconciliations summarise the impact on initial application of SFRS(I) 15 on the Group’s financial position as at 1 January 2017, 31 December 2017 and 1 January 2018 and the Group’s profit or loss and other comprehensive income for the year ended 31 December 2017.
NOTES TO THEFINANCIAL STATEMENTS
FINANCIALS & ADDITIONAL INFORMATION
Cap
itaL
and
Lim
ited
Ann
ual R
epor
t 20
18
281

41. EXPLANATION OF TRANSITION TO SFRS(I) AND ADOPTION OF NEW ACCOUNTING STANDARDS (continued)
The GroupBalance Sheet
As at 31 December 2017FRS framework SFRS(I) 15
As at 31 December 2017
SFRS(I) framework
$’000 $’000 $’000
Property, plant and equipment 840,021 – 840,021Intangible assets 563,295 – 563,295Investment properties 36,479,434 – 36,479,434Associates 6,189,822 2,100 6,191,922Joint ventures 4,007,362 6,165 4,013,527Deferred tax assets 226,300 – 226,300Other non-current assets 912,551 – 912,551Development properties for sale and stocks 4,073,708 (96,702) 3,977,006Trade and other receivables 1,470,573 (8,936) 1,461,637Contract assets – 166,017 166,017 Other current assets 34,499 24,866 59,365 Assets held for sale 542,786 – 542,786
Cash and cash equivalents 6,105,318 – 6,105,318
Total assets 61,445,669 93,510 61,539,179
Trade and other payables 4,689,075 (1,621,838) 3,067,237Contract liabilities – 1,680,597 1,680,597 Short term bank borrowings 1,250,627 – 1,250,627
Current portion of debt securities 1,488,368 – 1,488,368Current tax payable 1,279,887 – 1,279,887Liabilities held for sale 94,625 – 94,625Long term bank borrowings 10,214,466 – 10,214,466Debt securities 8,741,468 – 8,741,468Deferred tax liabilities 901,228 – 901,228
Other non-current liabilities 702,852 – 702,852
Total liabilities 29,362,596 58,759 29,421,355Net assets 32,083,073 34,751 32,117,824
Share capital 6,309,496 – 6,309,496Revenue reserves 12,148,192 30,807 12,178,999Other reserves (75,314) (291) (75,605)
Non-controlling interests 13,700,699 4,235 13,704,934
Total equity 32,083,073 34,751 32,117,824
NOTES TO THEFINANCIAL STATEMENTS
FINANCIALS & ADDITIONAL INFORMATIONC
apit
aLan
d L
imit
edA
nnua
l Rep
ort
2018
282

41. EXPLANATION OF TRANSITION TO SFRS(I) AND ADOPTION OF NEW ACCOUNTING STANDARDS (continued)
The GroupBalance Sheet
As at 1 January 2017FRS framework
SFRS(I) 15
As at 1 January 2017
SFRS(I) framework
$’000 $’000 $’000
Property, plant and equipment 781,431 – 781,431 Intangible assets 441,835 – 441,835 Investment properties 18,998,389 – 18,998,389 Associates 8,052,412 1,070 8,053,482 Joint ventures 4,564,845 1,542 4,566,387 Deferred tax assets 227,815 – 227,815 Other non-current assets 908,789 – 908,789 Development properties for sale and stocks 4,837,081 (6,199) 4,830,882 Trade and other receivables 1,858,809 (124,756) 1,734,053 Contract assets – 152,777 152,777 Other current assets 2,134 11,867 14,001Assets held for sale 274,602 – 274,602
Cash and cash equivalents 4,792,629 – 4,792,629
Total assets 45,740,771 36,301 45,777,072
Trade and other payables 4,058,955 (1,227,451) 2,831,504Contract liabilities – 1,249,273 1,249,273 Short term bank borrowings 710,642 – 710,642 Current portion of debt securities 1,662,786 – 1,662,786 Current tax payable 1,276,751 – 1,276,751 Liabilities held for sale 19,263 – 19,263 Long term bank borrowings 6,636,938 – 6,636,938 Debt securities 5,842,010 – 5,842,010 Deferred tax liabilities 725,214 – 725,214
Other non-current liabilities 507,737 – 507,737
Total liabilities 21,440,296 21,822 21,462,118Net assets 24,300,475 14,479 24,314,954
Share capital 6,309,496 – 6,309,496 Revenue reserves 11,029,084 11,997 11,041,081 Other reserves 266,265 – 266,265
Non-controlling interests 6,695,630 2,482 6,698,112
Total equity 24,300,475 14,479 24,314,954
NOTES TO THEFINANCIAL STATEMENTS
FINANCIALS & ADDITIONAL INFORMATION
Cap
itaL
and
Lim
ited
Ann
ual R
epor
t 20
18
283

41. EXPLANATION OF TRANSITION TO SFRS(I) AND ADOPTION OF NEW ACCOUNTING STANDARDS (continued)
The GroupIncome Statement
FRS framework SFRS(I) 15
SFRS(I) framework
Year ended 31 December 2017 $’000 $’000 $’000
Revenue 4,609,776 8,424 4,618,200Cost of sales (2,600,552) 6,465 (2,594,087)Gross profit 2,009,224 14,889 2,024,113Other operating income 850,668 – 850,668Administrative expenses (422,998) – (422,998)Other operating expenses (31,872) – (31,872)Profit from operations 2,405,022 14,889 2,419,911Finance costs (486,669) – (486,669)Share of results of associates (net of tax) 552,624 1,035 553,659Share of results of joint ventures (net of tax) 323,989 4,640 328,629Profit before tax 2,794,966 20,564 2,815,530Tax expense (468,950) – (468,950)Profit for the year 2,326,016 20,564 2,346,580
Attributable to:Owners of the Company 1,550,750 18,810 1,569,560Non-controlling interests 775,266 1,754 777,020Profit for the year 2,326,016 20,564 2,346,580
(a) SFRS(I) 1
In adopting SFRS(I) in 2018, the Group has applied the transition requirements in SFRS(I) 1 with 1 January 2017 as the date of transition. SFRS(I) 1 generally requires that the Group applies SFRS(I) that are effective as at 31 December 2018 on a retrospective basis, as if such accounting policy had always been applied, subject to the mandatory exceptions and optional exemptions in SFRS(I) 1. The application of the mandatory exceptions and the optional exemptions in SFRS(I) 1 did not have any significant impact on the financial statements.
(b) SFRS(I) 15
SFRS(I) 15 establishes a comprehensive framework for determining whether, how much and when revenue is recognised. It also introduces new cost guidance which requires certain costs of obtaining and fulfilling contracts to be recognised as separate assets when specified criteria are met.
The Group adopted SFRS(I) 15 in its financial statements using the retrospective approach. As a result, the Group has applied all of the requirements of SFRS(I) 15 retrospectively, except as described below, and the information presented for 2017 has been restated.
The Group has applied the practical expedients for completed contracts. This means that completed contracts that began and ended in the same comparative reporting period, as well as completed contracts at the beginning of the earliest period presented, are not restated.
NOTES TO THEFINANCIAL STATEMENTS
FINANCIALS & ADDITIONAL INFORMATIONC
apit
aLan
d L
imit
edA
nnua
l Rep
ort
2018
284

41. EXPLANATION OF TRANSITION TO SFRS(I) AND ADOPTION OF NEW ACCOUNTING STANDARDS (continued)
(b) SFRS(I) 15 (continued)
The impact on the adoption of SFRS(I) 15 is explained below:
(i) Sales commissions paid to sales or marketing agents on the sale of real estate units
The Group pays commissions to property agents on the sale of property and previously recognised such commissions as expense when incurred. Under SFRS(I) 15, the Group capitalises such commissions as incremental costs to obtain a contract with customer if these costs are recoverable. The capitalised costs are amortised to profit or loss as the Group recognises the related revenue. The impact to the financial statements is as follow:
20171 Jan 2017
$’000 $’000
Sales commissionThe GroupBalance sheetsIncrease in other assets - contract costs 24,866 11,868 Increase in interest in associates 2,100 1,070 Increase in interest in joint ventures 6,165 1,541 Decrease in trade and other payables 1,620 –Increase in net assets 34,751 14,479
Increase in retained earnings 30,807 11,997 Decrease in other reserves (291) –Increase in NCI 4,235 2,482 Increase in total equity 34,751 14,479
Income statementDecrease in cost of sales 14,889 Increase in share of results of associates 1,035 Increase in share of results of joint ventures 4,640 Increase in profit attributable to NCI (1,754)Increase in profit for the year 18,810
(ii) Significant financing components arising from payments from customers
The Group receives payments from customers for the sale of residential projects. Under certain payment schemes, the time when payments are made by the buyer and the transfer of control of the property to the buyer do not coincide and where the difference between the timing of receipt of the payments and the transfer of goods and services is 12 months or more, there may exist a significant financing component arising from payments from buyers. A finance income or finance expenses will be recognised depending on the arrangement.
NOTES TO THEFINANCIAL STATEMENTS
FINANCIALS & ADDITIONAL INFORMATION
Cap
itaL
and
Lim
ited
Ann
ual R
epor
t 20
18
285

41. EXPLANATION OF TRANSITION TO SFRS(I) AND ADOPTION OF NEW ACCOUNTING STANDARDS (continued)
(b) SFRS(I) 15 (continued)
(ii) Significant financing components arising from payments from customers (continued)
20171 Jan 2017
$’000 $’000
Significant financing componentsThe GroupBalance sheetsIncrease in development properties for sale 60,379 21,822 Increase in contract liabilities (60,379) (21,822)
Increase in net asset – –
Income statementIncrease in revenue 8,424 Increase in costs of sales (8,424)
Increase in profit for the year –
(iii) Presentation of contract assets and contract liabilities
The Group has also changed the presentation of certain amounts in the balance sheet on adopting SFRS(I) 15:
(a) Contract assets mainly relate to the Group’s right to consideration for work completed but not billed at the reporting date in respect of its property development business. Contracts assets were previously presented as “trade receivables” and “development properties for sale” of $8.9 million and $157.1 million (1 January 2017: $124.8 million and $28.0 million) respectively under FRS.
(b) Contract liabilities relate mainly to advance consideration received from customers and progress billings in excess of the Group’s right to the consideration. Contract liabilities were previously presented as “trade and other payables” of $1,680.6 million (1 January 2017: $1,249.3 million) under FRS.
(c) SFRS(I) 9
SFRS(I) 9 introduces new requirements for classification and measurement of financial assets, impairment of financial assets and hedge accounting. The Group adopted SFRS(I) 9 from 1 January 2018.
In accordance with the exemption in SFRS(I) 1, the Group elected not to restate comparative information for 2017. Accordingly, the information presented for 2017 is presented, as previously reported, under FRS 39 Financial Instruments: Recognition and Measurement. Differences in the carrying amounts of financial assets and financial liabilities resulting from the adoption of SFRS(I) 9 are recognised in retained earnings and reserves as at 1 January 2018.
Arising from this election, the Group is exempted from providing disclosures required by SFRS(I) 7 Financial Instruments: Disclosures for the comparative period to the extent that these disclosures relate to items within the scope of SFRS(I) 9. Instead, disclosures under FRS 107 Financial Instruments: Disclosures relating to items within the scope of FRS 39 are provided for the comparative period.
NOTES TO THEFINANCIAL STATEMENTS
FINANCIALS & ADDITIONAL INFORMATIONC
apit
aLan
d L
imit
edA
nnua
l Rep
ort
2018
286

41. EXPLANATION OF TRANSITION TO SFRS(I) AND ADOPTION OF NEW ACCOUNTING STANDARDS (continued)
(c) SFRS(I) 9 (continued)
Changes in accounting policies resulting from the adoption of SFRS(I) 9 have been generally applied by the Group retrospectively, except as described below.
(i) The following assessments were made on the basis of facts and circumstances that existed at 1 January 2018.• The determination of the business model within which a financial asset is held;• The determination of whether the contractual terms of a financial asset give rise to cash flows
that are solely payments of principal and interest on the principal amount outstanding; and• The designation of an equity investment that is not held-for-trading at FVOCI.
(ii) New hedge accounting requirements are applied prospectively. All hedging relationships designated under FRS 39 at 31 December 2017 met the criteria for hedge accounting under SFRS(I) 9 at 1 January 2018 and therefore were regarded as continuing hedging relationships.
Classification and measurement of financial assets
For financial assets held by the Group on 1 January 2018, management has assessed the business model that are applicable on that date to these assets so as to classify them into the appropriate categories under SFRS(I) 9. Material reclassifications resulting from management’s assessment are disclosed below.
The GroupFinancial assets Note
Original classification under FRS 39
New classification
under SFRS(I) 9Carrying amount under
FRS 39 and SFRS(I) 9$’000
Equity investments (a) Available-for-sale FVOCI – equity investment 65,002
Equity investments (b) Available-for-sale FVTPL – equity investment 226,159
Equity investments (c) Designated as FVTPL
FVTPL – equity investment 70,168
(a) These equity investments represent investments that the Group intends to hold for the long term for strategic purposes. The Group has designated these investments at 1 January 2018 as measured at FVOCI. Unlike FRS 39, the accumulated fair value reserve related to these investments will never be reclassified to profit or loss.
(b) Under FRS 39, this equity investment was designated at available-for-sale. The Group elected to classify it as FVTPL as the underlying asset held by the investment is a property measured at fair value.
(c) Under FRS 39, these equity investments were designated at FVTPL because they were managed on a fair value basis and their performance was monitored on this basis. These assets have been classified as mandatorily measured under FVTPL under SFRS(I) 9.
NOTES TO THEFINANCIAL STATEMENTS
FINANCIALS & ADDITIONAL INFORMATION
Cap
itaL
and
Lim
ited
Ann
ual R
epor
t 20
18
287

41. EXPLANATION OF TRANSITION TO SFRS(I) AND ADOPTION OF NEW ACCOUNTING STANDARDS (continued)
(c) SFRS(I) 9 (continued)
Impairment of financial assets
The Group has the following financial assets subject to the expected credit loss impairment model under SFRS(I) 9:• trade receivables and contract assets recognised under SFRS(I) 15; and• loans to related parties and other receivables at amortised cost.
The impairment methodology under FRS and SFRS(I) for each of these classes of financial assets is different. The adoption of new impairment model under SFRS(I) did not give rise to transition adjustments. The impairment methodology for each of these classes of financial assets under SFRS(I) 9 is as disclosed in note 2.8 (e) and note 33.
(d) SFRS(I) 16
SFRS(I) 16 introduces a single, on-balance sheet lease accounting model for lessees. The adoption of SFRS(I) 16 will result in almost all leases being recognised on the balance sheet, as the distinction between operating and finance leases is removed. Under the new standard, an asset (the right of use (ROU) asset) and a financial liability to pay rentals are recognised. The only exceptions are short-term and low-value leases. The accounting for lessors will not change significantly.
The Group plans to apply SFRS(I) 16 on 1 January 2019, using the modified retrospective approach. Therefore, the cumulative effect of adopting SFRS(I) 16 will be recognised as an adjustment to the opening balance of retained earnings at 1 January 2019, with no restatement of comparative information. The Group plans to apply the practical expedient to grandfather the definition of a lease on transition. This means that it will apply SFRS(I) 16 to lease contracts entered into before 1 January 2019 and identified as leases in accordance with SFRS(I) 1-17 and SFRS(I) INT 4.
(i) The Group as lessee
The Group expects to measure lease liabilities by applying a single discount rate to the portfolio of leases. Furthermore, the Group will measure its ROU on a lease-by-lease basis at the amount of the lease liability or as if the SFRS(I) 16 had always been applied.
As at 1 January 2019, the Group expects an increase in ROU assets of $544.4 million, an increase in lease liabilities of $548.8 million, a decrease in payables for operating leases of $5.5 million, and an decrease in retained earnings of $22.6 million. The Company expects an increase in ROU assets and lease liabilities of $63.7 million as at 1 January 2019.
The nature of expenses related to those leases will change as SFRS(I) 16 replaces the straight-line operating lease expense with depreciation charge for ROU assets and interest expense on lease liabilities.
No significant impact is expected for the Group’s finance leases.
(ii) The Group as lessor
SFRS(I) 16 substantially carries forward the current existing lessor accounting requirements. Accordingly, the Group continues to classify its leases as operating leases or finance leases, and to account for these two types of leases using the existing operating lease and finance lease accounting models respectively.
No significant impact is expected for other leases in which the Group is a lessor.
NOTES TO THEFINANCIAL STATEMENTS
FINANCIALS & ADDITIONAL INFORMATIONC
apit
aLan
d L
imit
edA
nnua
l Rep
ort
2018
288
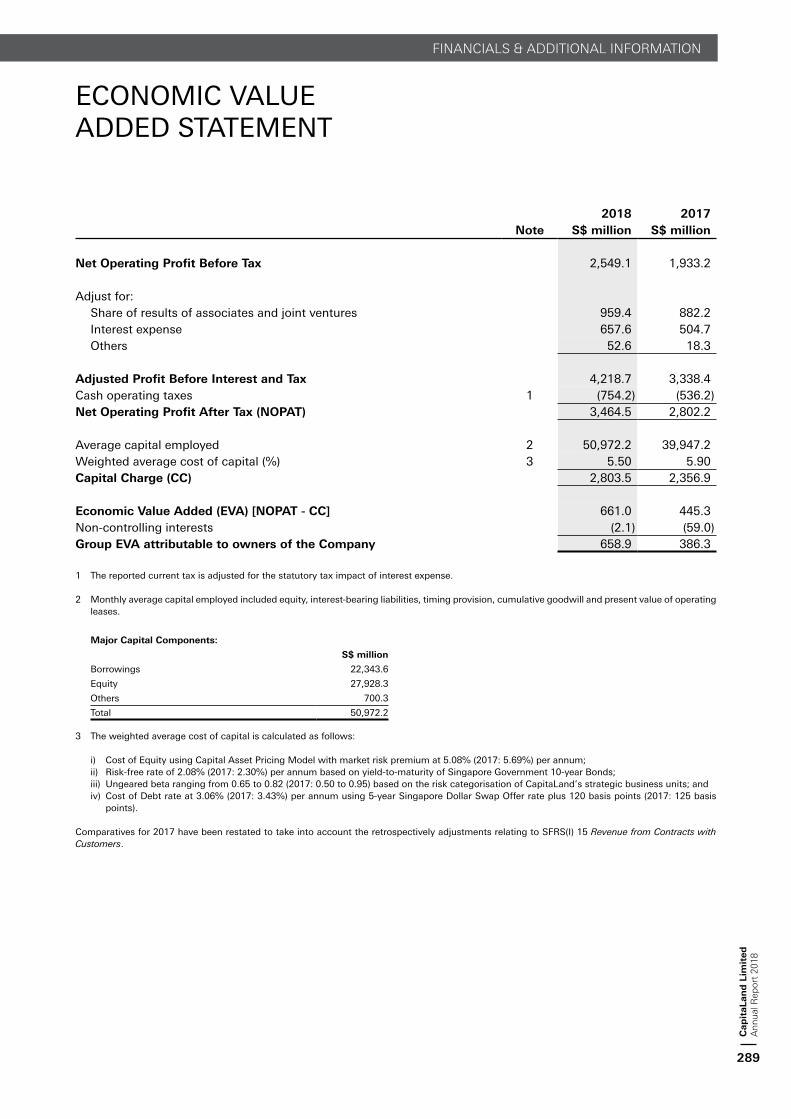
ECONOMIC VALUE ADDED STATEMENT
2018 2017Note S$ million S$ million
Net Operating Profit Before Tax 2,549.1 1,933.2
Adjust for:Share of results of associates and joint ventures 959.4 882.2 Interest expense 657.6 504.7 Others 52.6 18.3
Adjusted Profit Before Interest and Tax 4,218.7 3,338.4 Cash operating taxes 1 (754.2) (536.2)Net Operating Profit After Tax (NOPAT) 3,464.5 2,802.2 Average capital employed 2 50,972.2 39,947.2 Weighted average cost of capital (%) 3 5.50 5.90Capital Charge (CC) 2,803.5 2,356.9
Economic Value Added (EVA) [NOPAT - CC] 661.0 445.3 Non-controlling interests (2.1) (59.0)Group EVA attributable to owners of the Company 658.9 386.3
1 The reported current tax is adjusted for the statutory tax impact of interest expense.
2 Monthly average capital employed included equity, interest-bearing liabilities, timing provision, cumulative goodwill and present value of operating leases.
Major Capital Components:
S$ million
Borrowings 22,343.6
Equity 27,928.3
Others 700.3
Total 50,972.2
3 The weighted average cost of capital is calculated as follows:
i) Cost of Equity using Capital Asset Pricing Model with market risk premium at 5.08% (2017: 5.69%) per annum;ii) Risk-free rate of 2.08% (2017: 2.30%) per annum based on yield-to-maturity of Singapore Government 10-year Bonds;iii) Ungeared beta ranging from 0.65 to 0.82 (2017: 0.50 to 0.95) based on the risk categorisation of CapitaLand’s strategic business units; andiv) Cost of Debt rate at 3.06% (2017: 3.43%) per annum using 5-year Singapore Dollar Swap Offer rate plus 120 basis points (2017: 125 basis
points).
Comparatives for 2017 have been restated to take into account the retrospectively adjustments relating to SFRS(I) 15 Revenue from Contracts with Customers.
FINANCIALS & ADDITIONAL INFORMATION
Cap
itaL
and
Lim
ited
Ann
ual R
epor
t 20
18
289

VALUE ADDEDSTATEMENT
2018 2017S$ million S$ million
Value Added From:Revenue earned 5,602.4 4,618.2 Less: Bought in materials and services (2,178.6) (2,082.0) Gross Value Added 3,423.8 2,536.2
Share of results of associates and joint ventures 959.4 882.3 Exchange (loss)/gain (net) (9.0) 7.9 Other operating income (net) 872.8 752.5
1,823.2 1,642.7
Total Value Added 5,247.0 4,178.9 Distribution:To employees in wages, salaries and benefits 729.6 656.2 To government in taxes and levies 903.2 632.5 To providers of capital in: - Net interest on borrowings 679.7 459.4 - Dividends to owners of the Company 504.1 424.7
2,816.6 2,172.8
Balance Retained in the Business:Depreciation and amortisation 74.5 76.3 Revenue reserves net of dividends to owners of the Company 1,258.6 1,145.0 Non-controlling interests 1,087.3 777.0
2,420.4 1,998.3
Non-Production Cost:Allowance for impairment loss on receivables 10.0 7.8 Total Distribution 5,247.0 4,178.9 Productivity Analysis: Value added per employee (S$’000) # 403 299 Value added per dollar of employment cost (S$) 4.69 3.86 Value added per dollar sales (S$) 0.61 0.55
Comparatives for 2017 have been restated to take into account the retrospectively adjustments relating to SFRS(I) 15 Revenue from Contracts with Customers.
# Based on average 2018 headcount of 8,498 (2017: 8,484).
FINANCIALS & ADDITIONAL INFORMATIONC
apit
aLan
d L
imit
edA
nnua
l Rep
ort
2018
290

SUPPLEMENTALINFORMATION
1. INTERESTED PERSON TRANSACTIONS
Interested person transactions carried out during the financial year which fall under Chapter 9 of the Listing Manual of the Singapore Exchange Securities Trading Limited are as follows:
Aggregate value of all interested person
transactions during the financial year under
review (excluding transactions less
than S$100,000 and transactions conducted
under shareholders’ mandate pursuant to
Rule 920)
Aggregate value of all interested person
transactions conducted under shareholders’
mandate pursuant to Rule 920 (excluding
transactions less than S$100,000)
$’000 $’000
Transactions with Temasek Holdings (Private) Limited and its associates:
Sale of goods and servicesPurchase of goods and services
626 2,377
––
Transactions with Singapore Telecommunications Limited and its associates:
Purchase of goods and services 1,244 –
Transactions with Starhub Ltd and its associates:Purchase of goods and services 1,159 –
FINANCIALS & ADDITIONAL INFORMATION
Cap
itaL
and
Lim
ited
Ann
ual R
epor
t 20
18
291

2. DIRECTORS STANDING FOR RE-ELECTION AT THE ANNUAL GENERAL MEETING
The following information relating to Mr Ng Kee Choe, Mr Stephen Lee Ching Yen, Dr Philip Nalliah Pillai and Mr Lee Chee Koon, each of whom is standing for re-election as a Director at the Annual General Meeting of the Company on 12 April 2019, is provided pursuant to Rule 720(6) of the Listing Manual of the Singapore Exchange Securities Trading Limited.
Name of Director Ng Kee Choe Stephen Lee Ching Yen Dr Philip Nalliah Pillai Lee Chee Koon
The Board’s comments on the re-election Mr Ng has continued to discharge his duties well and continued to positively contribute to the Company.
In addition, the experience gained by Mr Ng from serving the Company places him in a good position to lead the strategic initiatives being considered and to oversee the transition and provide guidance to the new leadership team.
Mr Lee has continued to discharge his duties well and continued to positively contribute to the Company.
Dr Pillai has continued to discharge his duties well and continued to positively contribute to the Company.
Mr Lee is the President & GCEO of the Company. His inside perspectives on all aspects of the Company will be beneficial to Board deliberations.
Age 74 72 71 44
Country of principal residence Singapore Singapore Singapore Singapore
Job title • Chairman, Non-Executive Independent Director
• Executive Resource and Compensation Committee (Chairman)
• Strategy, Investment and Finance Committee (Chairman)
• Nominating Committee (Member)
• Non-Executive Independent Director • Executive Resource and Compensation
Committee (Member)• Nominating Committee (Chairman)
• Non-Executive Independent Director • Audit Committee (Member)• Nominating Committee (Member)
• President & GCEO• Executive Non-Independent Director
Whether appointment is executive and if so, the area of responsibility Non-executive Non-executive Non-executive Executive. Mr Lee is the President & GCEO of CapitaLand and he oversees the business of CapitaLand Group
Professional qualifications Bachelor of Science (Honours), University of Singapore
Master of Business Administration, Northwestern University, USA
• Bachelor of Laws (First Class Honours), University of Singapore
• LLM (Master of Laws) & SJD (Doctor of Juridical Sciences), Harvard Law School, USA
• Advocate & Solicitor, Singapore• Solicitor, England & Wales
• Bachelor of Science in Mechanical Engineering (First Class Honours), National University of Singapore
• Master of Science in Advanced Mechanical Engineering (Distinction), Imperial College London, UK
Date of first appointment as a Director 16 April 2010 1 January 2013 25 April 2014 1 January 2019
Date of last re-appointment/re-election as a Director 18 April 2016 18 April 2016 24 April 2017 -
Shareholding interest in the Company and its subsidiaries 346,578 CapitaLand shares 72,587 CapitaLand shares 53,130 CapitaLand shares 468,076 CapitaLand shares
Any relationship (including immediate family relationships) with any existing Director, existing executive officer, the Company and/or substantial shareholder of the Company or of any of its principal subsidiaries
No No No No
Conflict of interest (including any competing business) No No No No
Other principal commitments (including directorships) – Present • PT Bank Danamon Indonesia, Tbk (President-Commissioner)
• China Development Bank (Member of the International Advisory Council)
• Corporate Governance Advisory Committee (Member)
• Fullerton Financial Holdings Pte Ltd (Director)
• Tanah Merah Country Club (Chairman)• Temasek Trustees Pte. Ltd. (Director)
• Council of Presidential Advisers (Member)• Dr Goh Keng Swee Scholarship Fund
(Board Member)• G2000 Apparel (S) Private Limited
(Director)• Great Malaysia Textile Investments Pte Ltd
(Managing Director)• Kidney Dialysis Foundation (Director)• M+S Pte. Ltd. (Deputy Chairman)• Marina South Investments Pte. Ltd.
(Director)• MS Property Management Pte. Ltd.
(Director)• NTUC Enterprise Co-operative Limited
(Director)• NTUC-ARU (Administration & Research
Unit) (Member of the Board of Trustees)• Ophir-Rochor Investments Pte. Ltd.
(Director)• Shanghai Commercial Bank Ltd (Chairman)• Shanghai Commercial & Savings Bank
Limited (Managing Director)• Singapore Labour Foundation (Director)• Singapore University of Social Sciences
(Chancellor)• Temasek Holdings (Private) Limited
(Director)• Tripartite Alliance Limited (Chairman)
• Hotung Investment Holdings Limited (Director)
• Inland Revenue Authority of Singapore (Director)
• SMRT Corporation Ltd (Director)• SMRT Trains Ltd. (Director)
• Ascott Residence Trust Management Limited (Director)
• CapitaLand Commercial Trust Management Limited (Director)
• CapitaLand Retail China Trust Management Limited (Director)
• EDBI Pte Ltd (Director)• Lifelong Learning Endowment Fund
Advisory Council (Member)• SkillsFuture Singapore Agency (Director)• Temasek Foundation Nurtures CLG Limited
(Director)
SUPPLEMENTALINFORMATION
FINANCIALS & ADDITIONAL INFORMATIONC
apit
aLan
d L
imit
edA
nnua
l Rep
ort
2018
292

2. DIRECTORS STANDING FOR RE-ELECTION AT THE ANNUAL GENERAL MEETING
The following information relating to Mr Ng Kee Choe, Mr Stephen Lee Ching Yen, Dr Philip Nalliah Pillai and Mr Lee Chee Koon, each of whom is standing for re-election as a Director at the Annual General Meeting of the Company on 12 April 2019, is provided pursuant to Rule 720(6) of the Listing Manual of the Singapore Exchange Securities Trading Limited.
Name of Director Ng Kee Choe Stephen Lee Ching Yen Dr Philip Nalliah Pillai Lee Chee Koon
The Board’s comments on the re-election Mr Ng has continued to discharge his duties well and continued to positively contribute to the Company.
In addition, the experience gained by Mr Ng from serving the Company places him in a good position to lead the strategic initiatives being considered and to oversee the transition and provide guidance to the new leadership team.
Mr Lee has continued to discharge his duties well and continued to positively contribute to the Company.
Dr Pillai has continued to discharge his duties well and continued to positively contribute to the Company.
Mr Lee is the President & GCEO of the Company. His inside perspectives on all aspects of the Company will be beneficial to Board deliberations.
Age 74 72 71 44
Country of principal residence Singapore Singapore Singapore Singapore
Job title • Chairman, Non-Executive Independent Director
• Executive Resource and Compensation Committee (Chairman)
• Strategy, Investment and Finance Committee (Chairman)
• Nominating Committee (Member)
• Non-Executive Independent Director • Executive Resource and Compensation
Committee (Member)• Nominating Committee (Chairman)
• Non-Executive Independent Director • Audit Committee (Member)• Nominating Committee (Member)
• President & GCEO• Executive Non-Independent Director
Whether appointment is executive and if so, the area of responsibility Non-executive Non-executive Non-executive Executive. Mr Lee is the President & GCEO of CapitaLand and he oversees the business of CapitaLand Group
Professional qualifications Bachelor of Science (Honours), University of Singapore
Master of Business Administration, Northwestern University, USA
• Bachelor of Laws (First Class Honours), University of Singapore
• LLM (Master of Laws) & SJD (Doctor of Juridical Sciences), Harvard Law School, USA
• Advocate & Solicitor, Singapore• Solicitor, England & Wales
• Bachelor of Science in Mechanical Engineering (First Class Honours), National University of Singapore
• Master of Science in Advanced Mechanical Engineering (Distinction), Imperial College London, UK
Date of first appointment as a Director 16 April 2010 1 January 2013 25 April 2014 1 January 2019
Date of last re-appointment/re-election as a Director 18 April 2016 18 April 2016 24 April 2017 -
Shareholding interest in the Company and its subsidiaries 346,578 CapitaLand shares 72,587 CapitaLand shares 53,130 CapitaLand shares 468,076 CapitaLand shares
Any relationship (including immediate family relationships) with any existing Director, existing executive officer, the Company and/or substantial shareholder of the Company or of any of its principal subsidiaries
No No No No
Conflict of interest (including any competing business) No No No No
Other principal commitments (including directorships) – Present • PT Bank Danamon Indonesia, Tbk (President-Commissioner)
• China Development Bank (Member of the International Advisory Council)
• Corporate Governance Advisory Committee (Member)
• Fullerton Financial Holdings Pte Ltd (Director)
• Tanah Merah Country Club (Chairman)• Temasek Trustees Pte. Ltd. (Director)
• Council of Presidential Advisers (Member)• Dr Goh Keng Swee Scholarship Fund
(Board Member)• G2000 Apparel (S) Private Limited
(Director)• Great Malaysia Textile Investments Pte Ltd
(Managing Director)• Kidney Dialysis Foundation (Director)• M+S Pte. Ltd. (Deputy Chairman)• Marina South Investments Pte. Ltd.
(Director)• MS Property Management Pte. Ltd.
(Director)• NTUC Enterprise Co-operative Limited
(Director)• NTUC-ARU (Administration & Research
Unit) (Member of the Board of Trustees)• Ophir-Rochor Investments Pte. Ltd.
(Director)• Shanghai Commercial Bank Ltd (Chairman)• Shanghai Commercial & Savings Bank
Limited (Managing Director)• Singapore Labour Foundation (Director)• Singapore University of Social Sciences
(Chancellor)• Temasek Holdings (Private) Limited
(Director)• Tripartite Alliance Limited (Chairman)
• Hotung Investment Holdings Limited (Director)
• Inland Revenue Authority of Singapore (Director)
• SMRT Corporation Ltd (Director)• SMRT Trains Ltd. (Director)
• Ascott Residence Trust Management Limited (Director)
• CapitaLand Commercial Trust Management Limited (Director)
• CapitaLand Retail China Trust Management Limited (Director)
• EDBI Pte Ltd (Director)• Lifelong Learning Endowment Fund
Advisory Council (Member)• SkillsFuture Singapore Agency (Director)• Temasek Foundation Nurtures CLG Limited
(Director)
FINANCIALS & ADDITIONAL INFORMATION
Cap
itaL
and
Lim
ited
Ann
ual R
epor
t 20
18
293

Name of Director Ng Kee Choe Stephen Lee Ching Yen Dr Philip Nalliah Pillai Lee Chee Koon
Other principal commitments (including directorships) – Past, for the last 5 years • AusNet Services (Chairman)• CapitaLand Mall Asia Limited (Chairman)• NTUC Income Insurance Co-operative
Limited (Chairman)• Singapore Exchange Limited (Director)• SP Australia Networks (Distribution) Ltd
(Chairman)• SP Australia Networks (Transmission) Ltd
(Chairman)• SP Australia Networks (RE) Ltd (Chairman)• Temasek Trust (Member of the Board of
Trustees)• Temasek Holdings (Private) Limited
(Advisory Panel Member)
• China National Petroleum Corporation Limited (Director)
• COFCO Corporation (Director)• Council of Presidential Advisers (Alternate
Member)• National Wages Council (Member)• NTUC Income Insurance Co-operative
Limited (Chairman)• SIA Engineering Company Limited
(Chairman)• Singapore Airlines Limited (Chairman)• Singapore National Employers Federation
(President)• SLF Strategic Advisers Private Limited
(Director)• Temasek International Advisors Pte Ltd
(Senior International Advisor)
- • Ascott International Management (2001) Pte Ltd (Director)
• Australasian Franchise Systems Pty Ltd (Director)
• Ascott Serviced Residence (Global) Investment Pte. Ltd. (Director)
• Ascott Serviced Residence (Global) Fund Pte. Ltd. (Director)
• Ascott Serviced Residence (China) Fund (Chairman)
• CapitaLand Fund Management Pte. Ltd. (Director)
• CapitaLand CLIMB Management Consultancy (Shanghai) Co., Ltd. (Director)
• CapitaLand International (Europe) Pte. Ltd. (Director)
• CapitaLand Trustee Pte. Ltd. (Director)• CapitaLand Financial Limited (Director)• CapitaLand Limited
(Group Chief Investment Officer)• Guangzhou Slamet Property Co., Ltd.
(Dissolved) (Director)• Quest Tenancy Holdings Pty Ltd (Director)• QSA Group Pty. Ltd. (Director)• Somerset Capital Pte Ltd (Director)• Synergy Global Housing International Pte.
Ltd. (Director)• Synergy Global Housing LLC (Manager)• Somerset Riverview (Chengdu) Property
Co., Ltd. (Legal Representative)• Tujia.com International (Director)• The Ascott Capital Pte Ltd (Director)• The Ascott Holdings Limited (Director)• The Ascott Limited (Chief Executive
Officer)• Ventura Development (Myanmar) Pte Ltd
(Struck off) (Director)
Working experience and occupation(s) during the past 10 years • Vice-Chairman of DBS Group Holdings Ltd (DBS), retired from his executive position in DBS in July 2003 after 33 years of service
• Chairman of NTUC Income Insurance Co-operative Limited (From 2014 to 2018)
• Chairman of SIA Engineering Company Limited (From 2005 to 2018)
• Chairman of Singapore Airlines Limited (From 2006 to 2016)
• Chairman of International Enterprise Singapore (From 1995 to 2002)
• Chairman/Advisor of PSA International Pte Ltd (From 2002 to 2005)
• Chairman of Singapore Business Federation (From 2002 to 2008)
• President of Singapore National Employers Federation (From 1988 to 2014)
• Judge of the Supreme Court of Singapore (From June 2010 to December 2012)
• Judicial Commissioner (From October 2009 to June 2010)
• Member of the Legal Service Commission (From 2007 to 2013)
• Joint Managing Partner, Allen & Overy, Shook Lin & Bok JLV (From 2000 to 2008)
• Partner and Managing Partner, Shook Lin & Bok, Singapore (From 1986 to 2009)
• Over 23 years experience in legal practice specialised in corporate, corporate finance and securities law
• Group Chief Investment Officer of CapitaLand Limited (From 1 January 2018 to 14 September 2018)
• CEO of The Ascott Limited (From June 2013 to December 2017)
• Deputy CEO of The Ascott Limited (From February 2012 to May 2013)
• Managing Director, North Asia of The Ascott Limited (From July 2009 to May 2013)
• Vice President, Office of the President of CapitaLand Limited (From February 2007 to June 2009)
• Head, International Relations & Economic Strategy of Ministry of Finance (From November 2003 to January 2007)
• Senior Assistant Director, Trade Directorate of Ministry of Trade and Industry (From November 2001 to November 2003)
Undertaking (in the format set out in Appendix 7.7) under Rule 720(1) has been submitted to the Company
Yes Yes Yes Yes
Disclosure on the following matters concerning the Director:
a. Whether at any time during the last 10 years, an application or a petition under any bankruptcy law of any jurisdiction was filed against him or against a partnership of which he was a partner at the time when he was a partner or at any time within 2 years from the date he ceased to be a partner?
No No No No
b. Whether at any time during the last 10 years, an application or a petition under any law of any jurisdiction was filed against an entity (not being a partnership) of which he was a director or an equivalent person or a key executive, at the time when he was a director or an equivalent person or a key executive of that entity or at any time within 2 years from the date he ceased to be a director or an equivalent person or a key executive of that entity, for the winding up or dissolution of that entity or, where that entity is the trustee of a business trust, that business trust, on the ground of insolvency?
No No No No
SUPPLEMENTALINFORMATION
2. DIRECTORS STANDING FOR RE-ELECTION AT THE ANNUAL GENERAL MEETING (continued)
FINANCIALS & ADDITIONAL INFORMATIONC
apit
aLan
d L
imit
edA
nnua
l Rep
ort
2018
294
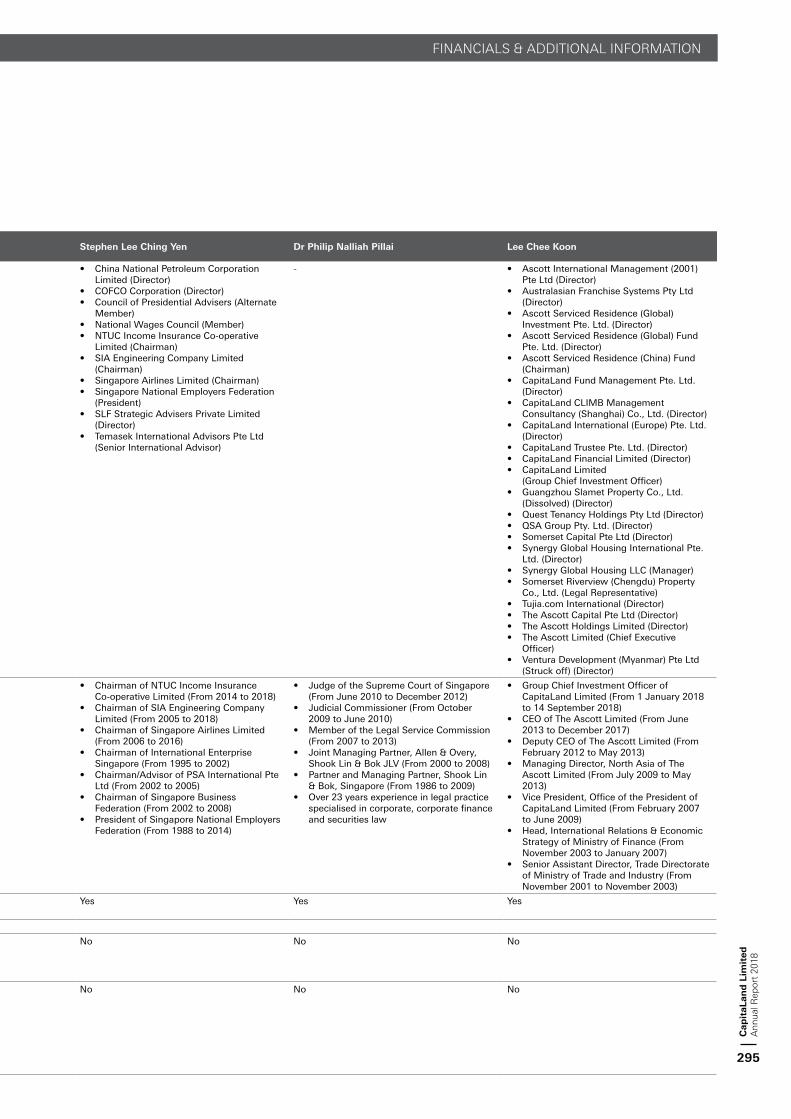
Name of Director Ng Kee Choe Stephen Lee Ching Yen Dr Philip Nalliah Pillai Lee Chee Koon
Other principal commitments (including directorships) – Past, for the last 5 years • AusNet Services (Chairman)• CapitaLand Mall Asia Limited (Chairman)• NTUC Income Insurance Co-operative
Limited (Chairman)• Singapore Exchange Limited (Director)• SP Australia Networks (Distribution) Ltd
(Chairman)• SP Australia Networks (Transmission) Ltd
(Chairman)• SP Australia Networks (RE) Ltd (Chairman)• Temasek Trust (Member of the Board of
Trustees)• Temasek Holdings (Private) Limited
(Advisory Panel Member)
• China National Petroleum Corporation Limited (Director)
• COFCO Corporation (Director)• Council of Presidential Advisers (Alternate
Member)• National Wages Council (Member)• NTUC Income Insurance Co-operative
Limited (Chairman)• SIA Engineering Company Limited
(Chairman)• Singapore Airlines Limited (Chairman)• Singapore National Employers Federation
(President)• SLF Strategic Advisers Private Limited
(Director)• Temasek International Advisors Pte Ltd
(Senior International Advisor)
- • Ascott International Management (2001) Pte Ltd (Director)
• Australasian Franchise Systems Pty Ltd (Director)
• Ascott Serviced Residence (Global) Investment Pte. Ltd. (Director)
• Ascott Serviced Residence (Global) Fund Pte. Ltd. (Director)
• Ascott Serviced Residence (China) Fund (Chairman)
• CapitaLand Fund Management Pte. Ltd. (Director)
• CapitaLand CLIMB Management Consultancy (Shanghai) Co., Ltd. (Director)
• CapitaLand International (Europe) Pte. Ltd. (Director)
• CapitaLand Trustee Pte. Ltd. (Director)• CapitaLand Financial Limited (Director)• CapitaLand Limited
(Group Chief Investment Officer)• Guangzhou Slamet Property Co., Ltd.
(Dissolved) (Director)• Quest Tenancy Holdings Pty Ltd (Director)• QSA Group Pty. Ltd. (Director)• Somerset Capital Pte Ltd (Director)• Synergy Global Housing International Pte.
Ltd. (Director)• Synergy Global Housing LLC (Manager)• Somerset Riverview (Chengdu) Property
Co., Ltd. (Legal Representative)• Tujia.com International (Director)• The Ascott Capital Pte Ltd (Director)• The Ascott Holdings Limited (Director)• The Ascott Limited (Chief Executive
Officer)• Ventura Development (Myanmar) Pte Ltd
(Struck off) (Director)
Working experience and occupation(s) during the past 10 years • Vice-Chairman of DBS Group Holdings Ltd (DBS), retired from his executive position in DBS in July 2003 after 33 years of service
• Chairman of NTUC Income Insurance Co-operative Limited (From 2014 to 2018)
• Chairman of SIA Engineering Company Limited (From 2005 to 2018)
• Chairman of Singapore Airlines Limited (From 2006 to 2016)
• Chairman of International Enterprise Singapore (From 1995 to 2002)
• Chairman/Advisor of PSA International Pte Ltd (From 2002 to 2005)
• Chairman of Singapore Business Federation (From 2002 to 2008)
• President of Singapore National Employers Federation (From 1988 to 2014)
• Judge of the Supreme Court of Singapore (From June 2010 to December 2012)
• Judicial Commissioner (From October 2009 to June 2010)
• Member of the Legal Service Commission (From 2007 to 2013)
• Joint Managing Partner, Allen & Overy, Shook Lin & Bok JLV (From 2000 to 2008)
• Partner and Managing Partner, Shook Lin & Bok, Singapore (From 1986 to 2009)
• Over 23 years experience in legal practice specialised in corporate, corporate finance and securities law
• Group Chief Investment Officer of CapitaLand Limited (From 1 January 2018 to 14 September 2018)
• CEO of The Ascott Limited (From June 2013 to December 2017)
• Deputy CEO of The Ascott Limited (From February 2012 to May 2013)
• Managing Director, North Asia of The Ascott Limited (From July 2009 to May 2013)
• Vice President, Office of the President of CapitaLand Limited (From February 2007 to June 2009)
• Head, International Relations & Economic Strategy of Ministry of Finance (From November 2003 to January 2007)
• Senior Assistant Director, Trade Directorate of Ministry of Trade and Industry (From November 2001 to November 2003)
Undertaking (in the format set out in Appendix 7.7) under Rule 720(1) has been submitted to the Company
Yes Yes Yes Yes
Disclosure on the following matters concerning the Director:
a. Whether at any time during the last 10 years, an application or a petition under any bankruptcy law of any jurisdiction was filed against him or against a partnership of which he was a partner at the time when he was a partner or at any time within 2 years from the date he ceased to be a partner?
No No No No
b. Whether at any time during the last 10 years, an application or a petition under any law of any jurisdiction was filed against an entity (not being a partnership) of which he was a director or an equivalent person or a key executive, at the time when he was a director or an equivalent person or a key executive of that entity or at any time within 2 years from the date he ceased to be a director or an equivalent person or a key executive of that entity, for the winding up or dissolution of that entity or, where that entity is the trustee of a business trust, that business trust, on the ground of insolvency?
No No No No
FINANCIALS & ADDITIONAL INFORMATION
Cap
itaL
and
Lim
ited
Ann
ual R
epor
t 20
18
295

Name of Director Ng Kee Choe Stephen Lee Ching Yen Dr Philip Nalliah Pillai Lee Chee Koon
c. Whether there is any unsatisfied judgment against him? No No No No
d. Whether he has ever been convicted of any offence, in Singapore or elsewhere, involving fraud or dishonesty which is punishable with imprisonment, or has been the subject of any criminal proceedings (including any pending criminal proceedings of which he is aware) for such purpose?
No No No No
e. Whether he has ever been convicted of any offence, in Singapore or elsewhere, involving a breach of any law or regulatory requirement that relates to the securities or futures industry in Singapore or elsewhere, or has been the subject of any criminal proceedings (including any pending criminal proceedings of which he is aware) for such breach?
No No No No
f. Whether at any time during the last 10 years, judgment has been entered against him in any civil proceedings in Singapore or elsewhere involving a breach of any law or regulatory requirement that relates to the securities or futures industry in Singapore or elsewhere, or a finding of fraud, misrepresentation or dishonesty on his part, or he has been the subject of civil proceedings (including any pending civil proceedings of which he is aware) involving an allegation of fraud, misrepresentation or dishonesty on his part?
No No No No
g. Whether he has ever been convicted in Singapore or elsewhere of any offence in connection with the formation or management of any entity or business trust?
No No No No
h. Whether he has ever been disqualified from acting as a director or an equivalent person of any entity (including the trustee of a business trust), or from taking part directly or indirectly in the management of any entity or business trust?
No No No No
i. Whether he has ever been the subject of any order, judgment or ruling of any court, tribunal or governmental body, permanently or temporarily enjoining him from engaging in any type of business practice or activity?
No No No No
j. Whether he has ever, to his knowledge, been concerned with the management or conduct, in Singapore or elsewhere, of the affairs of:
(i) any corporation which has been investigated for a breach of any law or regulatory requirement governing corporations in Singapore or elsewhere; or
No No No No
(ii) any entity (not being a corporation) which has been investigated for a breach of any law or regulatory requirement governing such entities in Singapore or elsewhere; or
No No No No
(iii) any business trust which has been investigated for a breach of any law or regulatory requirement governing business trusts in Singapore or elsewhere; or
No No No No
(iv) any entity or business trust which has been investigated for a breach of any law or regulatory requirement that relates to the securities or futures industry in Singapore or elsewhere,
in connection with any matter occurring or arising during that period when he was so concerned with the entity or business trust?
No No No No
k. Whether he has been the subject of any current or past investigation or disciplinary proceedings, or has been reprimanded or issued any warning, by the Monetary Authority of Singapore or any other regulatory authority, exchange, professional body or government agency, whether in Singapore or elsewhere?
No No No No
2. DIRECTORS STANDING FOR RE-ELECTION AT THE ANNUAL GENERAL MEETING (continued)
SUPPLEMENTALINFORMATION
FINANCIALS & ADDITIONAL INFORMATIONC
apit
aLan
d L
imit
edA
nnua
l Rep
ort
2018
296

Name of Director Ng Kee Choe Stephen Lee Ching Yen Dr Philip Nalliah Pillai Lee Chee Koon
c. Whether there is any unsatisfied judgment against him? No No No No
d. Whether he has ever been convicted of any offence, in Singapore or elsewhere, involving fraud or dishonesty which is punishable with imprisonment, or has been the subject of any criminal proceedings (including any pending criminal proceedings of which he is aware) for such purpose?
No No No No
e. Whether he has ever been convicted of any offence, in Singapore or elsewhere, involving a breach of any law or regulatory requirement that relates to the securities or futures industry in Singapore or elsewhere, or has been the subject of any criminal proceedings (including any pending criminal proceedings of which he is aware) for such breach?
No No No No
f. Whether at any time during the last 10 years, judgment has been entered against him in any civil proceedings in Singapore or elsewhere involving a breach of any law or regulatory requirement that relates to the securities or futures industry in Singapore or elsewhere, or a finding of fraud, misrepresentation or dishonesty on his part, or he has been the subject of civil proceedings (including any pending civil proceedings of which he is aware) involving an allegation of fraud, misrepresentation or dishonesty on his part?
No No No No
g. Whether he has ever been convicted in Singapore or elsewhere of any offence in connection with the formation or management of any entity or business trust?
No No No No
h. Whether he has ever been disqualified from acting as a director or an equivalent person of any entity (including the trustee of a business trust), or from taking part directly or indirectly in the management of any entity or business trust?
No No No No
i. Whether he has ever been the subject of any order, judgment or ruling of any court, tribunal or governmental body, permanently or temporarily enjoining him from engaging in any type of business practice or activity?
No No No No
j. Whether he has ever, to his knowledge, been concerned with the management or conduct, in Singapore or elsewhere, of the affairs of:
(i) any corporation which has been investigated for a breach of any law or regulatory requirement governing corporations in Singapore or elsewhere; or
No No No No
(ii) any entity (not being a corporation) which has been investigated for a breach of any law or regulatory requirement governing such entities in Singapore or elsewhere; or
No No No No
(iii) any business trust which has been investigated for a breach of any law or regulatory requirement governing business trusts in Singapore or elsewhere; or
No No No No
(iv) any entity or business trust which has been investigated for a breach of any law or regulatory requirement that relates to the securities or futures industry in Singapore or elsewhere,
in connection with any matter occurring or arising during that period when he was so concerned with the entity or business trust?
No No No No
k. Whether he has been the subject of any current or past investigation or disciplinary proceedings, or has been reprimanded or issued any warning, by the Monetary Authority of Singapore or any other regulatory authority, exchange, professional body or government agency, whether in Singapore or elsewhere?
No No No No
FINANCIALS & ADDITIONAL INFORMATION
Cap
itaL
and
Lim
ited
Ann
ual R
epor
t 20
18
297
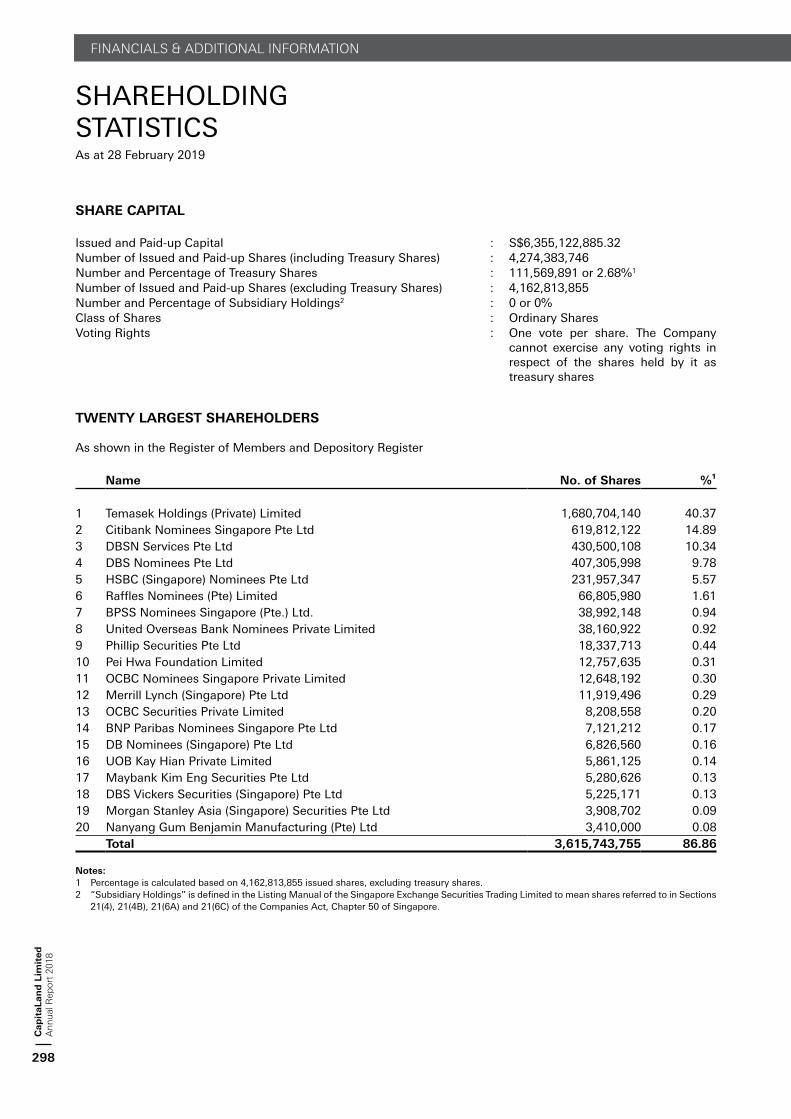
SHAREHOLDINGSTATISTICSAs at 28 February 2019
SHARE CAPITAL
Issued and Paid-up Capital : S$6,355,122,885.32Number of Issued and Paid-up Shares (including Treasury Shares) : 4,274,383,746Number and Percentage of Treasury Shares : 111,569,891 or 2.68%1
Number of Issued and Paid-up Shares (excluding Treasury Shares) : 4,162,813,855Number and Percentage of Subsidiary Holdings2 : 0 or 0%Class of Shares : Ordinary SharesVoting Rights : One vote per share. The Company
cannot exercise any voting rights in respect of the shares held by it as treasury shares
TWENTY LARGEST SHAREHOLDERS
As shown in the Register of Members and Depository Register
Name No. of Shares %¹
1 Temasek Holdings (Private) Limited 1,680,704,140 40.37 2 Citibank Nominees Singapore Pte Ltd 619,812,122 14.89 3 DBSN Services Pte Ltd 430,500,108 10.34 4 DBS Nominees Pte Ltd 407,305,998 9.78 5 HSBC (Singapore) Nominees Pte Ltd 231,957,347 5.57 6 Raffles Nominees (Pte) Limited 66,805,980 1.61 7 BPSS Nominees Singapore (Pte.) Ltd. 38,992,148 0.94 8 United Overseas Bank Nominees Private Limited 38,160,922 0.92 9 Phillip Securities Pte Ltd 18,337,713 0.44 10 Pei Hwa Foundation Limited 12,757,635 0.31 11 OCBC Nominees Singapore Private Limited 12,648,192 0.30 12 Merrill Lynch (Singapore) Pte Ltd 11,919,496 0.29 13 OCBC Securities Private Limited 8,208,558 0.20 14 BNP Paribas Nominees Singapore Pte Ltd 7,121,212 0.17 15 DB Nominees (Singapore) Pte Ltd 6,826,560 0.16 16 UOB Kay Hian Private Limited 5,861,125 0.14 17 Maybank Kim Eng Securities Pte Ltd 5,280,626 0.13 18 DBS Vickers Securities (Singapore) Pte Ltd 5,225,171 0.13 19 Morgan Stanley Asia (Singapore) Securities Pte Ltd 3,908,702 0.09 20 Nanyang Gum Benjamin Manufacturing (Pte) Ltd 3,410,000 0.08 Total 3,615,743,755 86.86
Notes:1 Percentage is calculated based on 4,162,813,855 issued shares, excluding treasury shares.2 “Subsidiary Holdings” is defined in the Listing Manual of the Singapore Exchange Securities Trading Limited to mean shares referred to in Sections
21(4), 21(4B), 21(6A) and 21(6C) of the Companies Act, Chapter 50 of Singapore.
FINANCIALS & ADDITIONAL INFORMATIONC
apit
aLan
d L
imit
edA
nnua
l Rep
ort
2018
298

SHAREHOLDINGSTATISTICSAs at 28 February 2019
SUBSTANTIAL SHAREHOLDERS
As shown in the Register of Substantial Shareholders
Direct Interest Deemed Interest Total Interest
Substantial ShareholdersNo. of
Shares %No. of
Shares %No. of
Shares %
Temasek Holdings (Private) Limited 1,680,704,140 39.886 5,276,0281,2 0.125 1,685,980,168 40.0112
BlackRock, Inc. - - 292,172,9633 7.000 292,172,963 7.000The PNC Financial Services Group, Inc. - - 292,172,9633 7.000 292,172,963 7.000
SIZE OF HOLDINGS
Size of Shareholdings No. of
Shareholders %
No. of Sharesexcluding
Treasury Shares %4
1 - 99 390 0.69 8,499 0.00100 - 1,000 8,987 15.99 7,985,943 0.191,001 - 10,000 37,214 66.22 166,333,596 4.0010,001 - 1,000,000 9,567 17.03 338,803,024 8.141,000,001 and above 38 0.07 3,649,682,793 87.67Total 56,196 100.00 4,162,813,855 100.00
Approximately 52.35%4 of the issued shares are held in the hands of the public. Rule 723 of the Listing Manual of the Singapore Exchange Securities Trading Limited is complied with.
Notes:1 Temasek Holdings (Private) Limited (“Temasek”) is deemed to have an interest in 5,276,028 shares in which its subsidiary and associated
companies have or are deemed to have an interest.2 Based on the information provided by Temasek, as at 10 January 2019 (being two business days prior to the date of the Company’s announcement
released via SGXNet on 14 January 2019), Temasek is deemed to have an interest in 17,316,183 shares which, together with its direct interest in 1,680,704,140 shares, represented an aggregate of approximately 40.79% of the issued shares (based on 4,162,813,855 issued shares, excluding treasury shares) as at 11 January 2019.
3 BlackRock, Inc. is deemed to have an interest in 292,172,963 shares held through its various subsidiaries. The PNC Financial Services Group, Inc. is deemed to have an interest in the same shares held by BlackRock, Inc. through its over 20% interest in BlackRock, Inc..
4 Percentage is calculated based on 4,162,813,855 issued shares, excluding treasury shares.
FINANCIALS & ADDITIONAL INFORMATION
Cap
itaL
and
Lim
ited
Ann
ual R
epor
t 20
18
299

This page has been intentionally left blank.

CORPORATEINFORMATION
BOARD OF DIRECTORS
Ng Kee ChoeChairman
Lee Chee KoonPresident & GCEO
Euleen Goh Yiu KiangTan Sri Amirsham Bin A AzizStephen Lee Ching YenDr Philip Nalliah PillaiKee Teck KoonChaly Mah Chee KheongAnthony Lim Weng KinGabriel Lim Meng LiangGoh Swee Chen
COMPANY SECRETARIES
Michelle Koh Chai PingNg Chooi Peng
BOARD COMMITTEES
Audit CommitteeChaly Mah Chee KheongChairman
Tan Sri Amirsham Bin A AzizDr Philip Nalliah PillaiGabriel Lim Meng Liang
Executive Resource and Compensation CommitteeNg Kee Choe Chairman
Stephen Lee Ching YenKee Teck KoonGoh Swee Chen
Strategy, Investment and Finance CommitteeNg Kee ChoeChairman
Euleen Goh Yiu KiangKee Teck KoonAnthony Lim Weng Kin
(as at 28 February 2019)
Nominating CommitteeStephen Lee Ching YenChairman
Ng Kee ChoeDr Philip Nalliah Pillai
Risk CommitteeTan Sri Amirsham Bin A AzizChairman
Euleen Goh Yiu KiangChaly Mah Chee KheongGabriel Lim Meng Liang
REGISTERED ADDRESS
168 Robinson Road#30-01 Capital TowerSingapore 068912Telephone: +65 6713 2888Facsimile: +65 6713 2999
SHARE REGISTRAR
M & C Services Private Limited112 Robinson Road #05-01Singapore 068902Telephone: +65 6227 6660 Facsimile: +65 6225 1452
AUDITORS
KPMG LLP16 Raffles Quay#22-00 Hong Leong BuildingSingapore 048581Telephone: +65 6213 3388Facsimile: +65 6225 4142(Engagement Partner since financial year ended 31 December 2015: Lee Sze Yeng)
PRINCIPAL BANKERS
Agricultural Bank of China Limited
Bank of China
Bank of Communications Co., Ltd
BNP Paribas
CIMB Bank Berhad
Crédit Agricole Corporate & Investment Bank
DBS Bank Ltd
Industrial and Commercial Bank of China Limited
Joint Stock Commercial Bank for Foreign Trade of Vietnam
Malayan Banking Berhad
Mizuho Bank, Ltd.
MUFG Bank, Ltd.
Münchener Hypothekenbank eG
Oversea-Chinese BankingCorporation Limited
Public Bank Berhad
Standard Chartered Bank
Sumitomo Mitsui BankingCorporation
The Bank of East Asia, Limited
The Hongkong and ShanghaiBanking Corporation Limited
United Overseas Bank Limited

This report is printed using soy-based ink on FSCTM mix uncoated paper which is part
produced using hydroelectric power.
CapitaLand Limited(Registration Number: 198900036N) (Incorporated in the Republic of Singapore)
168 Robinson Road #30-01 Capital Tower Singapore 068912 Tel: +65 6713 2888 Fax: +65 6713 2999Email: [email protected]
www.capitaland.com