
WDA Forum The WDA – HSG Discussion Paper Series · The WDA – HSG Discussion Paper Series on...
58
The WDA – HSG Discussion Paper Series on Demographic Issues WDA Forum The Russian Federation in an Era of Demographic Crisis: The Special Challenges of Population Aging and Social Security Policy by Nicholas Eberstadt and Hans Groth No. 2010/6
Transcript of WDA Forum The WDA – HSG Discussion Paper Series · The WDA – HSG Discussion Paper Series on...
The WDA – HSG Discussion Paper Serieson Demographic Issues
WDA Forum
The Russian Federation in an Era of Demographic Crisis: The Special Challenges of Population Aging and Social Security Policy
by Nicholas Eberstadt and Hans Groth
No. 2010/6

The Russian Federation in an Era of Demographic Crisis: The Special Challenges of Population Aging and Social Security Policy
by Nicholas Eberstadt and Hans Groth
The WDA-HSG Discussion Paper Serieson Demographic Issues
No. 2010/6
MANAGING EDITORS:
Monika BÜTLER Professor, University of St.Gallen, Switzerland
Ilona KICKBUSCH Professor, The Graduate Institute of International and Development Studies, Switzerland
Alfonso SOUSA-POZA Secretary, WDA Forum Foundation, Switzerland Professor, University of Hohenheim-Stuttgart, Germany
ADVISORY BOARD OF THE WDA FORUM:
Isabella ABODERIN Senior Research Fellow, Oxford Institute of Ageing, University of Oxford, UK
Jane BARRATT Secretary General, International Federation on Ageing (IFA), Canada
John BEARD Director, Department of Ageing and Life Course, WHO, Geneva (observer status)
Marcel F. BISCHOF Founder of WDA, Spain
Richard BLEWITT CEO, HelpAge International, UK
David E. BLOOM Clarence James Gamble Professor of Economics and Demography, Harvard University, USA
Robert BUTLER CEO and President, ILC, USA
Xiao CAIWEI Assistant President, China National Committee on Ageing (CNCA), China
Joseph COUGHLIN Professor and Director AgeLab, Massachusetts Institute of Technology (MIT), USA
Werner HAUG Director, Technical Division, United Nations Population Fund, New York
Dalmer HOSKINS Director, Office of Policy Development and Liaison for Public Trustees, US Social Security Administration, USA
Alexandre KALACHE Head, International Centre for Policies on Ageing, Rio de Janeiro, Brazil
Ursula LEHR Former German Minister of Health and Family, and founding Director of the German Centre for Research on Ageing, Germany
Ariela LOWENSTEIN Head, Center for Research & Study of Aging, University of Haifa, Israel
Jean-Pierre MICHEL Professor and Director, Department of Geriatrics of the University Hospitals of Geneva, Switzerland
Hubert ÖSTERLE Professor for Information Management, University of St.Gallen, Switzerland
Ursula M. STAUDINGER Professor and President, German Psychological Society, Vice President Jacobs University Bremen, Germany
Alan WALKER Professor, Director New Dynamics of Ageing Programme and Director of the European Research Area in Ageing ERA-AGE, UK
Main partners of the WDA Forum are:
Helvetia GroupMerck & Co., Inc.University of St.Gallen
This discussion paper series is kindly supported by the Ecoscientia Foundation
The opinions expressed in this article do not represent those of WDA Forum.

The Russian Federation in an Era of Demographic Crisis: The Special Challenges of
Population Aging and Social Security Policyi
By Nicholas Eberstadt and Hans Grothii
In the taxonomy of both the United Nations Population Division (UNPD) and the US
Bureau of the Census (USBC), the Russian Federation is listed as a member of the
contemporary world’s “more developed regions”. This categorization looks entirely
logical in a number of important respects. Like all other countries in this category, for
example, modern Russia’s population profile is characterized by relatively low levels of
fertility, and by a relatively high ratio of older citizens to total population.
But the Russian Federation also exhibits some distinctive features that differentiate it
from most of the other “more developed countries” with which it is regularly grouped
for purposes of global demographic analysis. For one thing, its income level is markedly
lower than in most (although not all) countries of the “more developed regions”. (In
2005, according to World Bank estimates, PPP‐adjusted GDP for the Russian Federation
was about $11,800, as against the OECD‐wide average of $33,500—in other words,
barely one third as high.iii ) Hardly less important, Russia—unlike most other “more
developed countries”—is in the grip of an acute demographic crisis. The most important
manifestations of this crisis are catastrophically high levels of excess mortality for the
adult population (a situation especially acute for the population of conventionally
defined working ages) which has resulted in a pronounced and more or less progressive
depopulation over the nearly two decades since the end of the Soviet era.
All countries in the “more developed regions” face major challenges in coming to grips
with the social security and social protection challenges that await their societies in the
1

decades immediately ahead. By and large, these challenges are being driven by a
common set of demographic trends: namely, pronounced population aging, largely
generated by several generations of low (or even sub‐replacement) fertility levels.
Russia’s faces all those challenges—but additional ones as well. For the Russian
Federation must attempt to provide for the prospective support of a growing pension‐
age population that stands to be far more frail and infirm than its counterparts in
affluent Western societies—and to do so on the basis of a workforce that is unusually
debilitated, constrained by relatively low levels of labor productivity, and set to shrink in
absolute size quite rapidly over the next several decades. In planning to meet the
retirement needs of an aging population over the coming generation, the Russian
Federation’s options are therefore much more limited—and perhaps more unpleasant—
than those available for many other countries in the “more developed regions”.
Russia’s Current Peacetime Demographic Crisis:
The Backdrop to Tomorrow’s Social Security Challenges
Over the decades since the dissolution of the Soviet Union, the Russian Federation has
been in the grip of an unrelenting demographic crisis. Admittedly, “demographic crisis”
is a term that is thrown around these days with an all‐too‐promiscuous—and sometimes
quite unwarranted—abandon. But the particulars of the Russian Federation’s
demographic travails provide empirical demonstration for the proposition that Russian
society is beset by severe demographic paroxysms that are directly and adversely
affecting both individual wellbeing and economic potential.
Since the end of the Soviet era, the Russian Federation has witnessed a pronounced and
continuing depopulation: from 1992 to the present, the country’s total population has
fallen by about 7 million (almost 5%), with almost continuous year‐on‐year population
declines. Russia, to be sure, was by no means the only country to experience population
decline during those years—but the magnitude of this fall‐off was exceptional. In
2
absolute terms, the only drop larger than this one in the postwar era was the bout China
suffered in the wake of Mao’s catastrophic “Great Leap Forward” campaign (a decline in
relative terms roughly similar to Russia’s post‐Communist population decline to date).
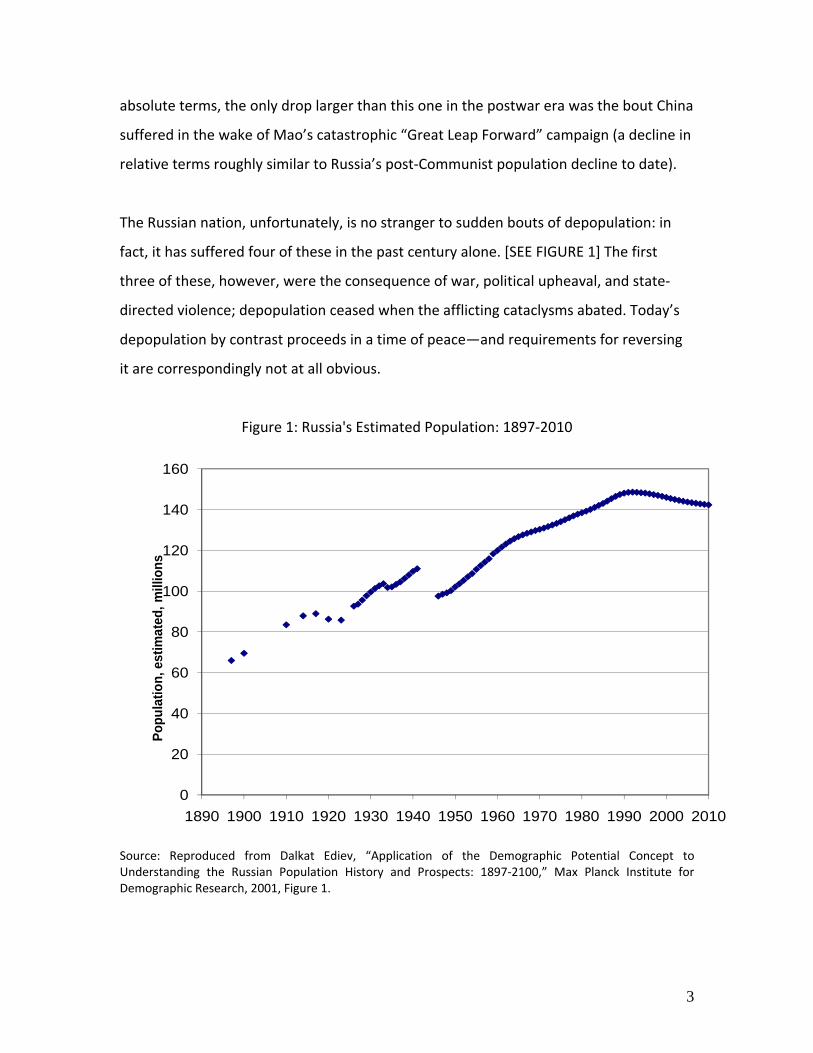
The Russian nation, unfortunately, is no stranger to sudden bouts of depopulation: in
fact, it has suffered four of these in the past century alone. [SEE FIGURE 1] The first
three of these, however, were the consequence of war, political upheaval, and state‐
directed violence; depopulation ceased when the afflicting cataclysms abated. Today’s
depopulation by contrast proceeds in a time of peace—and requirements for reversing
it are correspondingly not at all obvious.
Figure 1: Russia's Estimated Population: 1897‐2010
0
20
40
60
80
100
120
140
160
1890 1900 1910 1920 1930 1940 1950 1960 1970 1980 1990 2000 2010
Popu
latio
n, e
stim
ated
, mill
ions
Source: Reproduced from Dalkat Ediev, “Application of the Demographic Potential Concept to Understanding the Russian Population History and Prospects: 1897‐2100,” Max Planck Institute for Demographic Research, 2001, Figure 1.
3

In arithmetic terms, Russia’s present depopulation has been driven by negative natural
increase: more specifically, by a sharp falloff in births conjoined with an upsurge in
deaths. [SEE FIGURE 2] Between 1992 and 2008, according to official figures, Russia
registered almost 13 million more deaths than births (almost 3 funerals for every 2 live
deliveries). Russia’s negative natural increase during these years was of a scale
equivalent to eliminating the entire contemporary population of the country of Angola.
Net immigration partly mitigated the country’s population decline over these years, but
was by no means sufficient to compensate for it entirely.
Figure 2: Live Births and Deaths in Russia, 1960‐2008
0
500
1000
1500
2000
2500
3000
1960
1963
1966
1969
1972
1975
1978
1981
1984
1987
1990
1993
1996
1999
2002
2005
2008
Thou
sand
s
Birth
s an
d De
aths
Live BirthsDeaths
Sources: 1976–2002 data is from Goskomstat (Moscow), “Demographic Yearbook of Russia” (2004), Table 2.25; 2004–07 data is from Goskomstat, “Demographic Yearbook of Russia” (2008); and 2008 data is from Goskomstat website, available at http://www.gks.ru/bgd/regl/b09_06/IssWWW.exe/Stg/2/01‐01.htm.
Russia experienced a dramatic drop in births during the “transition” period after the end
of Soviet Communism, to be sure. But Russia’s low levels of childbearing today cannot
be attributed entirely to “systemic shock”. To the contrary: low levels of fertility have
4
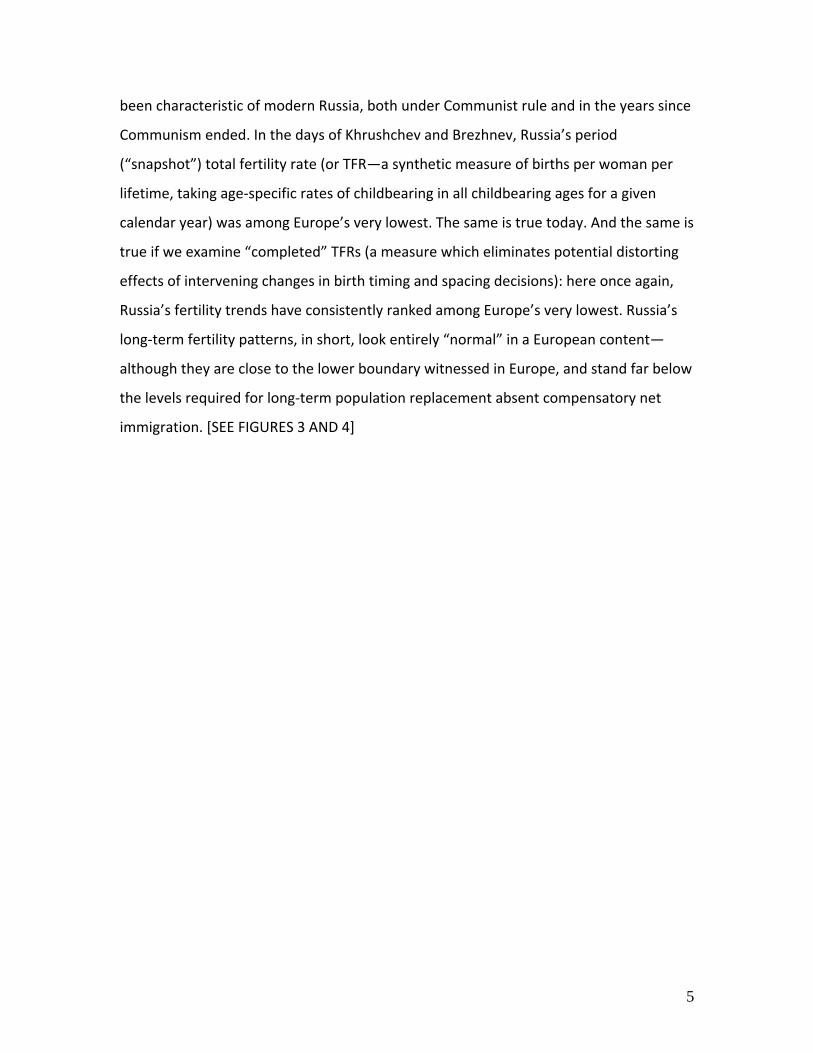
been characteristic of modern Russia, both under Communist rule and in the years since
Communism ended. In the days of Khrushchev and Brezhnev, Russia’s period
(“snapshot”) total fertility rate (or TFR—a synthetic measure of births per woman per
lifetime, taking age‐specific rates of childbearing in all childbearing ages for a given
calendar year) was among Europe’s very lowest. The same is true today. And the same is
true if we examine “completed” TFRs (a measure which eliminates potential distorting
effects of intervening changes in birth timing and spacing decisions): here once again,
Russia’s fertility trends have consistently ranked among Europe’s very lowest. Russia’s
long‐term fertility patterns, in short, look entirely “normal” in a European content—
although they are close to the lower boundary witnessed in Europe, and stand far below
the levels required for long‐term population replacement absent compensatory net
immigration. [SEE FIGURES 3 AND 4]
5

Figure 3: Total Fertility Rate ‐ Europe 1960‐2004
0
1
2
3
4
5
6
7
1960
1961
1962
1963
1964
1965
1966
1967
1968
1969
1970
1971
1972
1973
1974
1975
1976
1977
1978
1979
1980
1981
1982
1983
1984
1985
1986
1987
1988
1989
1990
1991
1992
1993
1994
1995
1996
1997
1998
1999
2000
2001
2002
2003
2004
Year
TFR
Albania Armenia Austria Azerbaijan BelarusBelgium Bulgaria Croatia Czech Republic DenmarkEstonia Finland France Georgia GermanyGreece Hungary Ireland Italy LatviaLithuania Macedonia Moldova Netherlands NorwayPoland Portugal Romania Russia Serbia and MontenegroSlovakia Slovenia Spain Sweden SwitzerlandTurkey Ukraine United Kingdom
Source: “Recent Demographic Developments in Europe 2005,” Council of Europe, 2006.
6

Figure 4: Completed Fertility by Birth Year of Mothers ‐ Europe 1930‐1971
1.00
1.50
2.00
2.50
3.00
3.50
4.00
4.50
5.00
1930
1931
1932
1933
1934
1935
1936
1937
1938
1939
1940
1941
1942
1943
1944
1945
1946
1947
1948
1949
1950
1951
1952
1953
1954
1955
1956
1957
1958
1959
1960
1961
1962
1963
1964
1965
1966
1967
1968
1969
1970
1971
Year
Com
plet
ed F
ertil
ity
Albania Armenia Austria Azerbaijan Belarus BelgiumBulgaria Croatia Czech Republic Denmark Estonia Finland
France Georgia Germany Greece Hungary IrelandItaly Latvia Lithuania Macedonia Moldova Netherlands
Norway Poland Portugal Romania Russia Serbia and MontenegroSlovakia Slovenia Spain Sweden Switzerland Turkey
Ukraine United KingdomS
ource: “Recent Demographic Developments in Europe 2005,” Council of Europe, 2006.
What is entirely distinctive about Russia’s vital trends are the country’s mortality
trends—which are woefully poor, and have been so for literally decades. Estimates from
the Human Mortality Database (HMD), maintained by the University of California and
the Max Planck Institute for Demographic Research (Rostock, Germany), make the
point. By this reckoning, life expectancy at birth for males and females alike was lower in
the Russian Federation in 2006 than it had been four decades earlier: a dubious “first”
for an urbanized, literate society during peacetime. [SEE FIGURE 5]
7
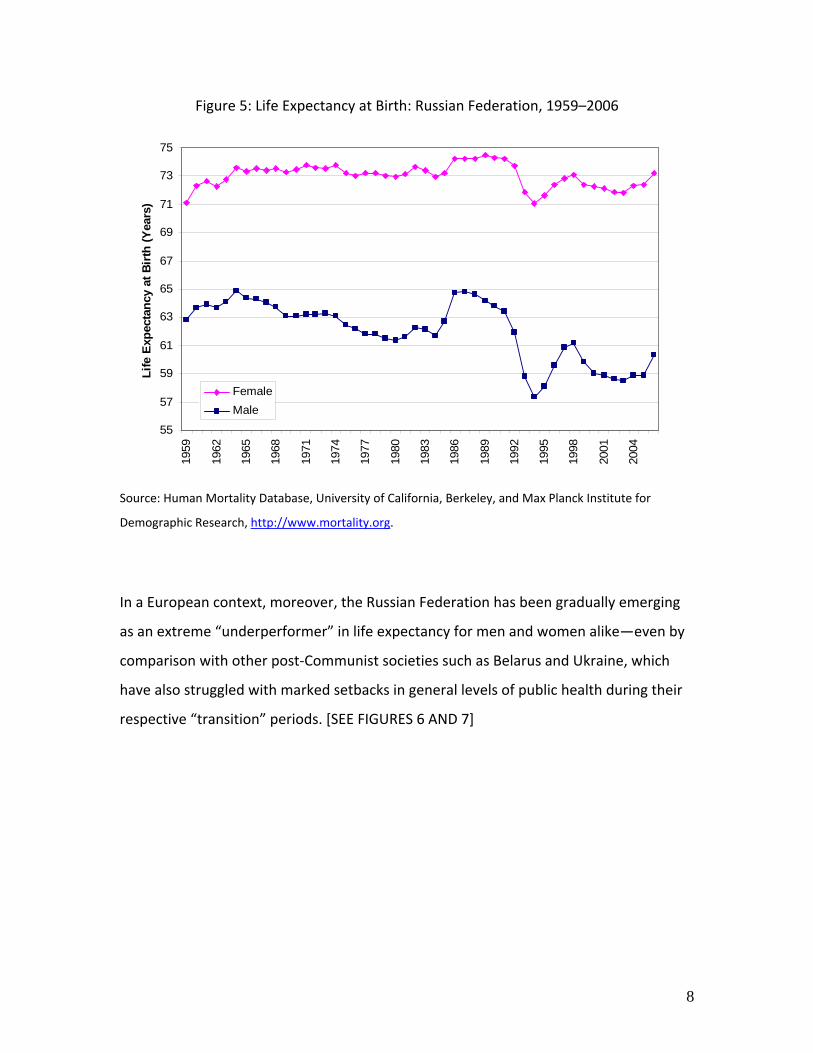
Figure 5: Life Expectancy at Birth: Russian Federation, 1959–2006
55
57
59
61
63
65
67
69
71
73
75
1959
1962
1965
1968
1971
1974
1977
1980
1983
1986
1989
1992
1995
1998
2001
2004
Life
Exp
ecta
ncy
at B
irth
(Yea
rs)
FemaleMale
Source: Human Mortality Database, University of California, Berkeley, and Max Planck Institute for
Demographic Research, http://www.mortality.org.
In a European context, moreover, the Russian Federation has been gradually emerging
as an extreme “underperformer” in life expectancy for men and women alike—even by
comparison with other post‐Communist societies such as Belarus and Ukraine, which
have also struggled with marked setbacks in general levels of public health during their
respective “transition” periods. [SEE FIGURES 6 AND 7]
8

Figure 6: Life Expectancy in Europe, 1959–2006 (males)
55
60
65
70
75
80
85
1959
1961
1963
1965
1967
1969
1971
1973
1975
1977
1979
1981
1983
1985
1987
1989
1991
1993
1995
1997
1999
2001
2003
2005
Life
exp
ecta
ncy,
yea
rs
Austria Belarus Belgium Bulgaria Czech Republic DenmarkEast Germany England and Wales Estonia Finland France GermanyHungary Iceland Italy Latvia Lithuania NetherlandsNorway Poland Portugal Russia Slovak Republic SloveniaSpain Sweden Switzerland Ukraine West Germany
Source: Human Mortality Database, University of California, Berkeley, and Max Planck Institute for
Demographic Research, http://www.mortality.org.
9

Figure 7: Life Expectancy in Europe, 1959–2006 (females)
65
67
69
71
73
75
77
79
81
83
85
1959
1961
1963
1965
1967
1969
1971
1973
1975
1977
1979
1981
1983
1985
1987
1989
1991
1993
1995
1997
1999
2001
2003
2005
Life
exp
ecta
ncy,
yea
rs
Austria Belarus Belgium Bulgaria Czech Republic DenmarkEast Germany England and Wales Estonia Finland France GermanyHungary Iceland Italy Latvia Lithuania NetherlandsNorway Poland Portugal Russia Slovak Republic SloveniaSpain Sweden Switzerland Ukraine West Germany
Source: Human Mortality Database, University of California, Berkeley, and Max Planck Institute for
Demographic Research, http://www.mortality.org.
Post‐Soviet Russia’s current peacetime demographic crisis, in short, is centrally a crisis in
health and mortality. Health conditions were by no means glorious during the days of
Communist rule—but the toll of “excess mortality” since 1992 has been nothing short of
horrendous. Measured against the hardly exacting standard of survival patterns in the
early Gorbachev era, Russia would have suffered a total of 6.6 million “excess deaths”
between 1992 and 2006 alone, according to HMD life tables (a total, incidentally, almost
identical to the country’s absolute population decline over those same years). Measured
against a higher, Western European bar—such as survival schedules in France circa
1992—Russian “excess mortality” for 1992‐2006 would have approached 18 million: a
10

tally of premature mortality that would, if only in arithmetic terms, have matched or
exceeded the territory’s population losses during the catastrophic years of the Great
Patriotic War, as it is called in Russia (World War II as it is known elsewhere).
Mortality and Morbidity for Working‐Age Adults in the Russian Federation:
A Crushing Burden
The Russian Federation’s peacetime demographic crisis is characterized not only
generalized mortality crisis, but by an especially severe health crisis concentrated in the
adult population of working ages (as conventionally defined). This working‐age health
crisis has important ramifications for Russia’s old‐age support capacities, both today and
in the years to come.
The extraordinary severity of this current health and mortality burden weighing upon
Russian working‐age adults is suggested by the proxy of life expectancy at age 15. [SEE
TABLE 1]
By the World Bank’s schema for ranking countries by levels of per capita income,
contemporary Russia qualifies as an “Upper Middle Income Economy” (indeed, after PPP
adjustments, as one of the more affluent states within this grouping).iv Yet Russia’s
estimated life expectancy at age 15 was far lower than would have been expected for a
country with such a relatively favorable economic ranking. For females, life expectancy
at age 15 was a decade or more below levels prevailing among “high income
economies”—but it was also lower than in many “upper middle income economies”
(such as Turkey and Brazil), and in fact lower than in a number of “lower middle income
economies” (such as China or Morocco). Even more striking, combined male and female
life expectancy at age 15 was lower for the Russian Federation than for such “lower
middle income economies” as India. As for male life expectancy at 15, Russia’s appears
to be one of the world’s very lowest—markedly lower, indeed, than in many of the
11
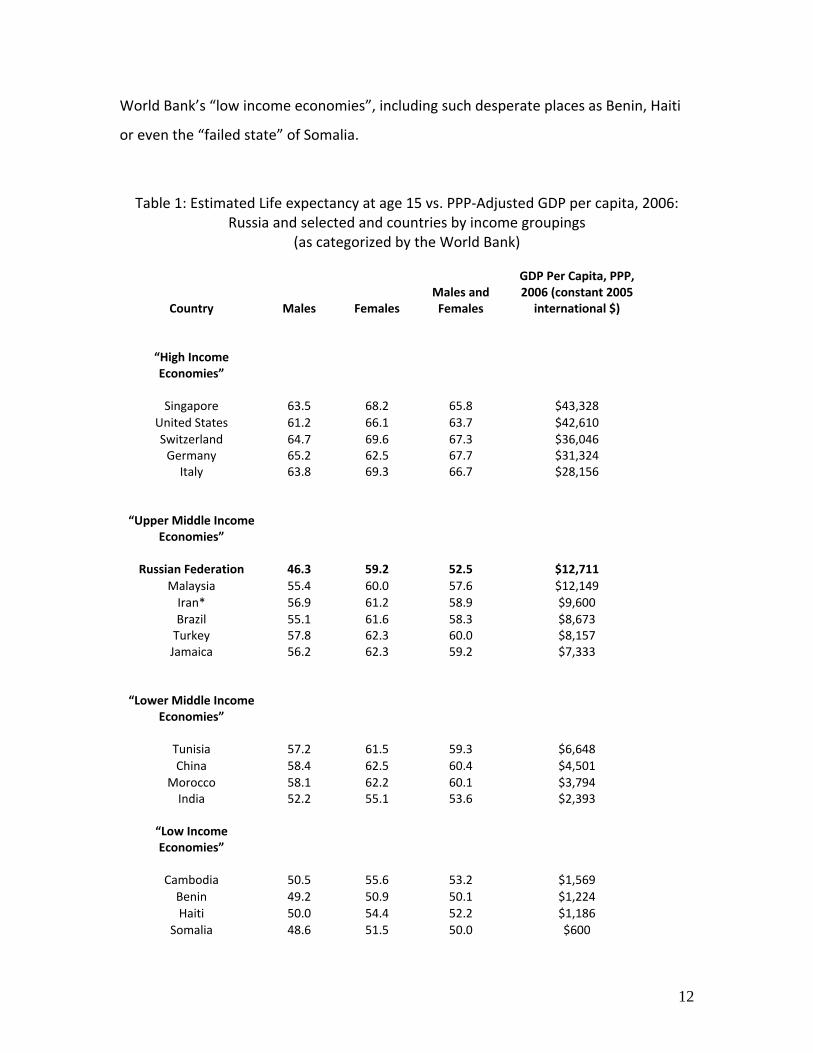
World Bank’s “low income economies”, including such desperate places as Benin, Haiti
or even the “failed state” of Somalia.
Table 1: Estimated Life expectancy at age 15 vs. PPP‐Adjusted GDP per capita, 2006: Russia and selected and countries by income groupings
(as categorized by the World Bank)
Country Males Females Males and Females
GDP Per Capita, PPP, 2006 (constant 2005 international $)
“High Income Economies”
Singapore
63.5
68.2
65.8
$43,328 United States 61.2 66.1 63.7 $42,610 Switzerland 64.7 69.6 67.3 $36,046 Germany 65.2 62.5 67.7 $31,324 Italy 63.8 69.3 66.7 $28,156
“Upper Middle Income Economies”
Russian Federation 46.3 59.2 52.5 $12,711
Malaysia 55.4 60.0 57.6 $12,149 Iran* 56.9 61.2 58.9 $9,600 Brazil 55.1 61.6 58.3 $8,673 Turkey 57.8 62.3 60.0 $8,157 Jamaica 56.2 62.3 59.2 $7,333
“Lower Middle Income Economies”
Tunisia 57.2 61.5 59.3 $6,648 China 58.4 62.5 60.4 $4,501
Morocco 58.1 62.2 60.1 $3,794 India 52.2 55.1 53.6 $2,393
“Low Income Economies”
Cambodia 50.5 55.6 53.2 $1,569 Benin 49.2 50.9 50.1 $1,224 Haiti 50.0 54.4 52.2 $1,186
Somalia 48.6 51.5 50.0 $600
12

Source: Estimated 2006 life expectation at age 15 from “Life Tables for WHO Member States”, World Health Organization, available at http://apps.who.int/whosis/database/life_tables/life_tables.cfm. ; PPP‐adjusted per capita GDP data from 2008 World Bank World Development Indicators, CD‐ROM. Note: Somalia GDP per capita PPP from CIA World Factbook
*Note: The World Bank officially classifies Iran as a lower‐middle income country, even though its per capita GDP ranks among countries in the upper‐middle income category.
The deterioration in general health conditions for Russia’s population of working ages
over the past decades has been dramatic, and indeed extraordinary. This deterioration
is mirrored by a general upsurge in death rates for working age men and women alike.,
as Fiigure 8 demonstrates. [SEE FIGURE 8] Over the four decades between 1965 and
2005, age‐specific mortality rates for men in their 30s and 40s typically rose by around
100%. Scarcely less stunning, mortality levels for women in their 30s and 40s shot up by
nearly 50% during that same period.
The deterioration of health conditions for Russia’s working age population has been a
primary driver of divergence in overall health trends between Russia and the rest of
Europe. By 2006, according to WHO, age‐standardized mortality in the Russian
Federation was over twice as high as in “pre‐accession” states of the European Union
(i.e., Western Europe). Hardly less noteworthy is the divergence in mortality patterns
that has emerged between Russia and the “new” EU members (in the main, former
Soviet bloc states from the Baltic and Central Europe). At the end of the Soviet era, age‐
standardized mortality rates were similar for the aggregated “new” EU states and the
Russian Federation. Just fifteen years later, mortality levels were about 40% higher in
Russia: while the new EU states recorded substantial improvements in overall mortality
levels after the demise of Soviet‐style rule, Russia’s death rates veered erratically
upward.v [SEE FIGURE 9]
What accounts for Russia’s strange new patterns of health reversal? We can answer this
question in a general manner by referring to cause‐of‐death data. Overwhelmingly, the
13

mortality divergence between Russia and the rest of Europe can be accounted for by
mortality from cardiovascular disease (CVD—heart attacks, strokes etc.) and deaths
from “external causes” (injuries, including suicide, homicide, accidents, poisoning, etc.).
CVD mortality appears to be the single greatest driver of Russia’s adverse mortality
trends: while this has been declining in the rest of Europe (and the rest of the OECD, as
well as in many lower‐income societies), it has been grimly rising in Russia. By 2006, age‐
standardized CVD mortality was fully four times as high in Russia as in the “old” EU—and
fully 50% higher than in the “new” EU states. Russia’s CVD mortality was far higher than
would be predicted on the basis of per capita income alone—indeed, according to WHO
estimates for 2002, the Russian Federation was a dreadful “outlier” from the overall
international relationship between income and CVD mortality. [SEE FIGURES 10
THROUGH 11]
Entirely apart from its humanitarian meaning, this heavy mortality burden, concentrated
in working age groups, has ominous economic implications. These extend well beyond
the immediate losses in potential manpower such figures suggest.
Severe and extreme levels of premature adult mortality, for example, cannot help but
have direct and unforgiving effects on the cost‐benefit calculus for investments in higher
education and other forms of post‐secondary training. In 2006, on their current survival
schedules, 7 out of 8 Swiss mean aged 20 could have expected to celebrate a (notional)
retirement at age 65—whereas their Russian counterparts faced less than even odds of
making it from 20 to 65. Less breathtaking, but nonetheless dramatic, disparities
between Swiss and Russian working‐age women were also apparent. [SEE FIGURES 12
AND 13] Since “human capital” investments undertaken after the completion of
secondary education may prove key in eliciting higher levels of productivity in modern
societies, Russia’s adverse adult survival trajectories may therefore have an additional,
unfavorable impact upon future growth prospects.
14

In considering the broader economic implications of Russia’s health and mortality
problems with respect to the outlook for labor productivity, we may also wish to
consider demographic trends for urban areas (insofar as economic growth in the
modern era has been disproportionately generated by urban rather than rural
populations). Although Russia today is often classified as a “BRIC” country (an acronym
coined for the emerging market economies of Brazil, Russia, India and China) overall life
expectancy levels in urban Russia appear to be significantly lower than in China or
Brazil—and may also be lower than in urban India, as well as other urban
agglomerations in contemporary low‐income societies. Further: where the other BRIC
countries are experiencing continuing population growth—and whereas affluent OECD
countries currently on the cusp of depopulation (e.g. Germany, Italy, Japan) still see
their urban center increasing in size, Russia’s total urban population has been falling
since at least 1995. [SEE TABLE 2 AND FIGURE 14] These broad metrics for health and
population change, to be sure, can only approximate international health differentials
for the population of working age—or for differentials in international growth rates for
the urban labor force. Yet these differentials are, we contend, both meaningful and
indicative—and they do not portend auspiciously for Russia with respect either to labor
productivity or to economic growth.
In theory, technological innovation and institutional/economic policy reforms could
substantially improve the prospects for labor productivity and economic growth in
Russia, despite the poor health situation of the Russian workforce. Given Russia’s
present‐day particulars, however, the outlook here is less promising than might be
ordinarily assumed.
Russia’s current capacities for knowledge generation are distinctly limited: despite the
country’s Soviet era achievements in science and high‐technology (mainly in the defense
area), modern‐day Russia is a conspicuous international underperformer in knowledge
generation today. The Russian Federation, for example, accounts for about 6% of the
15
world’s total population of university graduates—but between 1995 and 2008 Russia
was awarded just 0.1% of all patents issues by the US Patent and Trade Office (PTO),
roughly the same international fraction as the US state of West Virginia.vi (This is,
admittedly, an “America‐centric” measure of knowledge generation—but a roughly
similar pattern is seen in a broader measure: international patent applications, as
registered by the World International Property Office (WIPO), where Russia accounted
for less than 0.2% of global out‐of‐country patent applications for 1995‐2007.vii)
Moreover, while the total worldwide numbers for scientific articles published in per‐
review journals has been rising exponentially since 1990, the number of such studies
published by Russian nationals has stagnated over the past two decades, and in fact was
slightly lower in 2008 for Russia than it had been at the end of the Soviet era for the
USSR.viii In addition, broad embrace of higher technological standards within the Russian
workforce in the years ahead stands to be constrained by two demographic factors: 1)
the steep drop‐off in Russian fertility since 1992, which will sharply reduce the absolute
and relative size of the pool of young entrants (typically, the group with the highest level
of educational and technical attainment in all modern societies) into the labor force in
the years immediately ahead, and 2) Russia’s extremely high levels of premature
mortality for its current manpower supply, which discourages investments in higher
education and training for reasons already mentioned.
A full discussion of Russia’s prospects for institutional and economic policy reform is
beyond the scope of this study. We may note, however, that Russia’s international
rankings by some highly pertinent measures here remain very low, despite the country’s
transition from Communist central planning to a market economy. In Transparency
International’s 2009 Corruption Perceptions Index, for example, the Russian Federation
rated 148 out of 180 countries surveyed—below Indonesia, Nigeria and the Philippines,
among many other countries.ix In the Fraser Institute’s 2009 Index of Economic
Freedom, Russia ranked somewhat higher—but it was still only 83 out of 141 countries
surveyed (below Egypt, Uganda, and Ghana, among others).x And in the Heritage
16

Foundation’s 2010 Index of Economic Freedom, Russia ranked 143 out of 179—well
below Kenya, Tanzania, Pakistan and Yemen, to name only a few.xi There is an
inescapably subjective element in all these indices, of course. Notwithstanding: these
international surveys consistently depict Russia as a country with a forbidding “climate”
as regards returns to human capital—and such a climate may be expected to discourage
both investments in human capital and economic growth, all other things being equal.
Figure 8: Death Rate Ratio by Gender, Ages 20–65: Russia, 2005 vs. 1965 (1965 = 100)
50%
100%
150%
200%
250%
20 22 24 26 28 30 32 34 36 38 40 42 44 46 48 50 52 54 56 58 60 62 64
Age
Dea
th R
ate
2005
/Dea
th R
ate
1965
Males
Females
Source: Human Mortality Database
17

Figure 9: Death rates from all causes, 1980–2006: Russia vs. EU (males plus females)
600
800
1000
1200
1400
1600
1980 1985 1990 1995 2000 2005
Age
-sta
ndar
dize
d de
ath
rate
(d
eath
s pe
r 10
0000
) Russia
EU members since 2004
EU members before 2004
Source: Europe Health for All Database, World Health Organization, August 2009. http://www.euro.who.int/HFADB.
18

Figure 10: Death Rates from Cardiovascular Disease, 1970‐2006: Russia vs. EU (males plus females)
200
300
400
500
600
700
800
900
1970 1975 1980 1985 1990 1995 2000 2005
Age-
stan
dard
ized
dea
th r
ate
(dea
ths
per 1
0000
0)
Russian Federation EU EU members before 2004 EU members since 2004
Source: Europe Health for All Database, World Health Organization, August 2009, http://www.euro.who.int/HFADB.
19
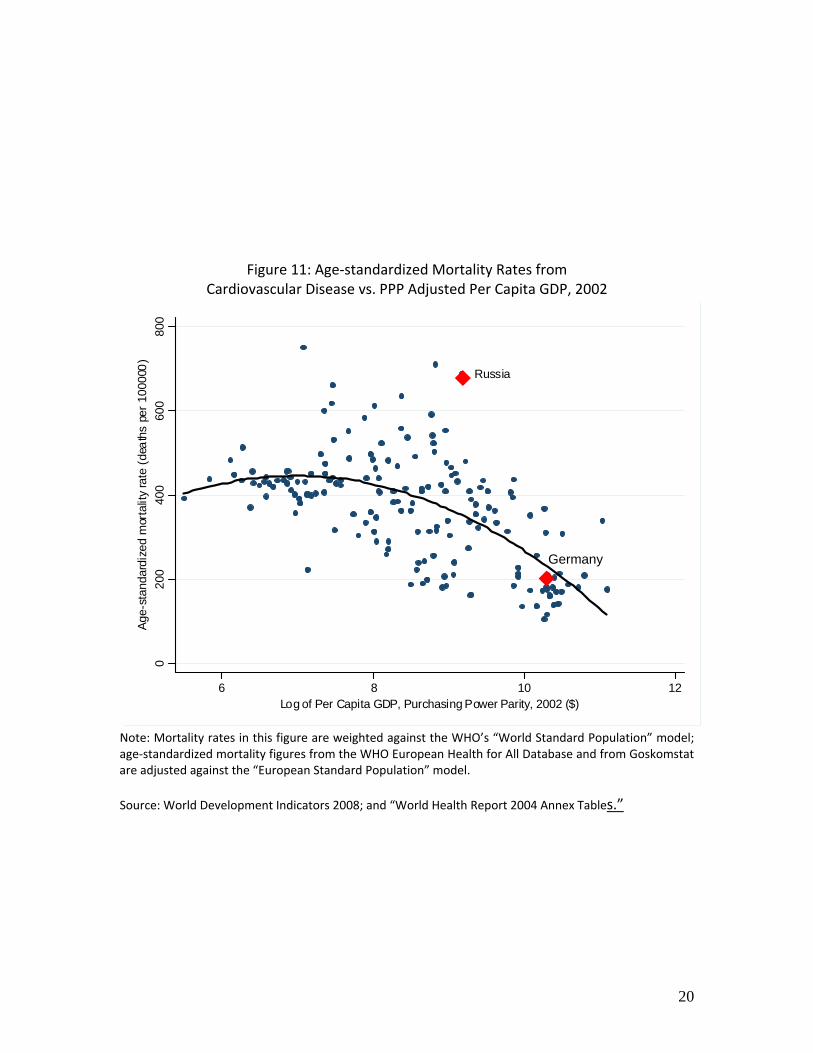
Figure 11: Age‐standardized Mortality Rates from Cardiovascular Disease vs. PPP Adjusted Per Capita GDP, 2002
Russia
020
040
060
080
0Ag
e-st
anda
rdiz
ed m
orta
lity
rate
(dea
ths
per 1
0000
0)
6 8 10 12Log of Per Capita GDP, Purchasing Power Parity, 2002 ($)
Germany
Note: Mortality rates in this figure are weighted against the WHO’s “World Standard Population” model; age‐standardized mortality figures from the WHO European Health for All Database and from Goskomstat are adjusted against the “European Standard Population” model. Source: World Development Indicators 2008; and “World Health Report 2004 Annex Tables.”
20

Figure 12: Male Survival Schedules, Ages 20‐65: Russian Federation vs. Switzerland, 2006
40000
50000
60000
70000
80000
90000
100000
20 22 24 26 28 30 32 34 36 38 40 42 44 46 48 50 52 54 56 58 60 62 64
Russia Switzerland
Source: Human Mortality Database, University of California, Berkeley and Max Planck Institute for Demographic Research, http://www.mortality.org.
21

Figure 13: Female Survival Schedules, Ages 20‐65: Russian Federation vs. Switzerland, 2006
40000
50000
60000
70000
80000
90000
100000
20 22 24 26 28 30 32 34 36 38 40 42 44 46 48 50 52 54 56 58 60 62 64
Russia Switzerland
Source: Human Mortality Database, University of California, Berkeley and Max Planck Institute for Demographic Research, http://www.mortality.org.
22

Table 2: Life Expectancy in Urban Areas and Selected Cities:
Russia and Selected Other Countries (selected recent years) Male Female Total
Russia (2006) 61.03 73.70 67.29
Moscow (2006) 67.17 76.50 71.81
St. Petersburg (2006) 62.84 74.83 68.90
China (2000) 73.11 77.51 75.21
Shanghai (2000) 77.49 81.19 79.36
Beijing (2000) 76.13 79.92 77.96
India (2002‐06) 67.10 70.00 68.80
Chennai (2004) 77.15 77.56 ‐‐
New Delhi (2000) 69.50 69.50 69.50
Kolkata (2001) 74.00 75.00 ‐‐
Maharashtra (1998‐02) 68.70 72.00 70.30
Mumbai (2007) ‐‐ ‐‐ 71.00
Brazil (2005) 68.35 75.93 72.05
São Paulo (1970) ‐‐ ‐‐ 58.50
Rio De Janeiro (1970) ‐‐ ‐‐ 57.10
São Paulo (2005) 69.49 78.03 73.66
Rio De Janeiro (2005) 68.08 77.02 72.44
Brasilia (2005) 71.19 78.74 74.87
Mexico (2004) 71.79 77.21 74.50
Nuevo Leon (2004) 72.69 77.79 75.24
Mexico City (2004) 72.81 78.00 74.58
Turkey (2002) ‐‐ ‐‐ ‐‐ ‐‐
Istanbul (2002) 69.00 74.20 72.40
Indonesia (2002) 64.20 68.10 66.20
Jakarta (2002) 70.30 74.20 72.30
Egypt (2006) 68.98 73.60 71.30
Cairo (2006) 70.20 74.80 71.40
Note: Total Mexico and Brazil not divided by urban and rural.
23

Sources: Russia: Russian Demographic Yearbook, 2007, Goskomstat; China: China Human Development Report, 2005; India:
Chennai–City Report of Chennai 2005; Kolkata–West Bengal Human Development Report 2004; Urban Maharashtra–F. Ram,
Chander Shekhar and S.K Mohanty, Human Development: Strengthening District Level Vital Statistics in India; India Total–Dr. D.K.
Dey, ORGI, MHA, GOI (New Delhi), “Life expectancy at birth by sex and residence, India 1970‐75 to 2002‐06”; Brazil: Indicadores
Sociodemograficos, IBGE, 2006; Brazil 1970 Data (Note: Total LE, not divided by male/female): “Mortality, Income Distribution, and
Rural‐Urban Residence in Brazil”; Jose Alberto M. de Carvalho and Charles H. Wood, Population and Development Review 4, no. 3
(Sep., 1978): 405‐420; Mexico: Conapo (2006a). Indicadores de mortalidad y fecundidad, 1990‐2006. Serie histórica basada en la
conciliación demográfica a partir del XII Censo General de Población y Vivienda 2000 y el II Conteo de Población y Vivienda 2005.;
Indonesia: Human Development Report 2004; Turkey: Human Development Report 2004; Egypt: Human Development Report 2008.
Figure 14: Estimated Annual Urban Growth Rates, 1995‐2005, Russia and selected other countries
-1.00 -0.50 0.00 0.50 1.00 1.50 2.00 2.50 3.00 3.50 4.00
Russian Federation
Germany
Italy
Japan
Brazil
India
China
Urban annual growth rate (%)
2000-2005 1995-2000
Source: Population Division of the Department of Economic and Social Affairs of the United Nations Secretariat, World Population Prospects: The 2006 Revision and World Urbanization Prospects: The 2007 Revision, http://esa.un.org/unup.
Russia: a Rapidly Graying Society
24

Paradoxical though it may sound, given modern Russia’s horrendous mortality record,
the Russian Federation is a society characterized by pronounced population aging, with
much more graying still in prospect. The reason is simple: a population’s age profile is
very largely determined by its fertility patterns (which, so to speak, set the width of the
base for society’s “population pyramid”). With low or sub‐replacement fertility levels,
the overall composition of society shifts toward the older age groups—even when
mortality rates for those same adults are fearfully high.
Table 3 presents some basic data on Russia’s population aging situation, placing the
phenomenon in a global perspective.
Table 3: Russian Federation Population Aging in Global Perspective: 1980 vs. 2005
Median Age (years) 1980 2005 Change (years) Russia 31.3 37.3 6.0 World 23.0 27.9 4.9 Less Developed Regions 20.1 25.4 5.3 More Developed Regions 32.0 38.6 6.6 Percentage of Population 65+ 1980 2005 Change
(percentage points) Russia 10.2 13.8 3.6 World 5.9 7.3 1.4 Less Developed Regions 4.0 5.4 1.4 More Developed Regions 11.7 15.3 3.6 Source: Population Division of the Department of Economic and Social Affairs of the United Nations Secretariat, World Population Prospects: The 2008 Revision, http://esa.un.org/unpp.
As of the year 2005, by the estimate of the United Nations Population Division (UNPD),
Russia’s median age—the age marker that would bisect the entire population into two
equally sized groups—was just over 37 years. By way of comparison, that was nearly a
decade higher than the median age for the world as a whole and almost twelve years
higher than the median age prevailing in less developed regions. Russia’s median age,
by UNPD estimates, was very slightly lower than the average for the more developed
regions as a whole (37.3 years vs. 38.6 years), but well within the range that
characterized the affluent graying societies in Europe, North America, and elsewhere.
25
By the benchmark of median age, Russia has been aging fairly rapidly in recent decades.
Between 1980 and 2005, median age in the Russian Federation rose by 6 years—that is
to say, by almost three months each and every calendar year. In absolute terms, Russia’s
rise in median age over the past generation exceeded the global average (roughly 5
years), falling just below the overall average for the more developed regions (6.0 years
vs. 6.6 years). But by this criterion, Russia’s trajectory of population aging is not
appreciably different from other, Western societies today.
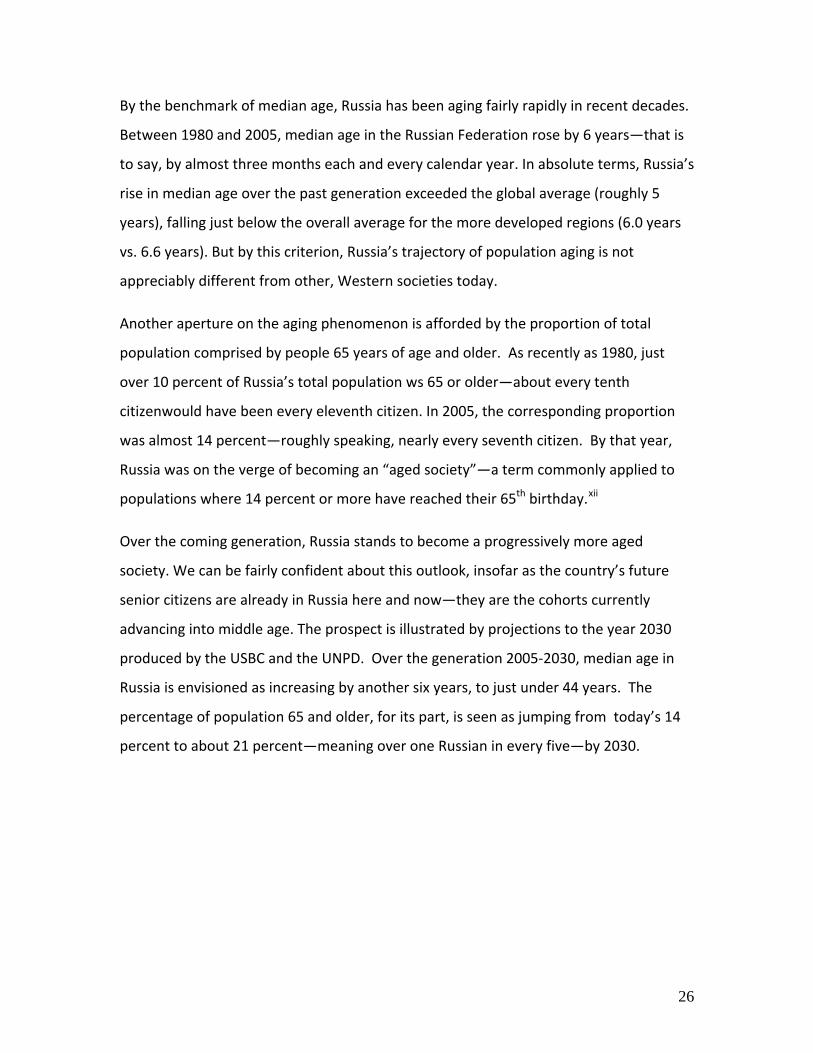
Another aperture on the aging phenomenon is afforded by the proportion of total
population comprised by people 65 years of age and older. As recently as 1980, just
over 10 percent of Russia’s total population ws 65 or older—about every tenth
citizenwould have been every eleventh citizen. In 2005, the corresponding proportion
was almost 14 percent—roughly speaking, nearly every seventh citizen. By that year,
Russia was on the verge of becoming an “aged society”—a term commonly applied to
populations where 14 percent or more have reached their 65th birthday.xii
Over the coming generation, Russia stands to become a progressively more aged
society. We can be fairly confident about this outlook, insofar as the country’s future
senior citizens are already in Russia here and now—they are the cohorts currently
advancing into middle age. The prospect is illustrated by projections to the year 2030
produced by the USBC and the UNPD. Over the generation 2005‐2030, median age in
Russia is envisioned as increasing by another six years, to just under 44 years. The
percentage of population 65 and older, for its part, is seen as jumping from today’s 14
percent to about 21 percent—meaning over one Russian in every five—by 2030.
26

Figure 15, Projected Median Age, 2005‐2030: Russia in International Perspective (Median age in years)
30
35
40
45
50
55
2005 2010 2015 2020 2025 2030
United States of AmericaRussiaJapanGermanyMore developed regionsWestern Europe
Source: Population Division of the Department of Economic and Social Affairs of the United Nations Secretariat, World Population Prospects: The 2008 Revision, http://esa.un.org/unpp.
27

Figure 16, Projected Percentage of Population aged 65+, 2005‐2030: Russia in International Perspective
10%
15%
20%
25%
30%
35%
2005 2010 2015 2020 2025 2030
Western Europe More Developed Countries Japan
Russia United States Germany
Source: U.S. Census Bureau, International Data Base, available at http://www.census.gov/ipc/www/idb/, accessed on April 2, 2010.
By these projections, Russia will certainly not be the most elderly society on earth in the
years immediately ahead—that accolade looks likely to rest securely with Japan’s
populace, at least for the coming several decades. But Russia is not likely to be the most
youthful of the developed region’s steadily aging societies, either. Russia’s median age
is currently higher than corresponding levels in a number of Western societies—the
most populous of these being the United States. That gap in median ages between
Russia and America, in fact, is slated to widen in the years ahead: from just over a year
in 2005 to roughly 4 years in 2030. In 2030, Russia’s 65‐plus group is likewise seen as
28
accounting for a somewhat greater share of total population than America’s (21 percent
versus 19 percent). In terms of its degree and pace of aging, then, Russia’s prospective
trajectory is expected to remain slightly below the average for the more developed
regions as a whole over the coming decades, but it is a trajectory that is unmistakably
characteristic of the more developed societies.
Unhealthy Aging: a Russian Specialty
Viewed in the context of the more developed societies, in short, there is absolutely
nothing exceptional about the magnitude of the graying that Russia is set to experience
in the years immediately ahead. This is very bad news for Russia—for the health of
Russia’s older men and women is exceptionally poor. The elderly tend to be weaker and
frailer than younger adults in every society, but Russia’s elderly are unusually unhealthy
and infirm. For Russia, the prospect of population aging on a major scale almost
certainly portends a serious increase in debilitation and dependence with which Russian
society‐‐a looming reality with which Russian policy will be forced to contend.
In Western Europe, North America, and the rest of the affluent West, the past several
generations have been a period of progressive and appreciable improvement of health
for older persons.xiii (As best we can tell, in fact, continuing and meaningful
improvements in elder health have been characteristic in most modern societies, both
rich and poor, in recent decades.). But Russia presents as a striking exception to this
general global rule. Russia’s predicament is highlighted by long‐term trends in life
expectancy for people 65 years of age, as estimated by researchers in the Human
Mortality Database (HMD) project. Over the period 1965‐2006, Russian life expectancy
at age 65 fell for men and women alike. For older Russian males, the estimated decline
(a drop of a little more than one year) amounted to a reduction of nearly one tenth of
remaining life expectancy—a more than trivial compression at that stage of life. But
older women in Russia also faced a reduction in life expectancy, although of less severe
magnitude.
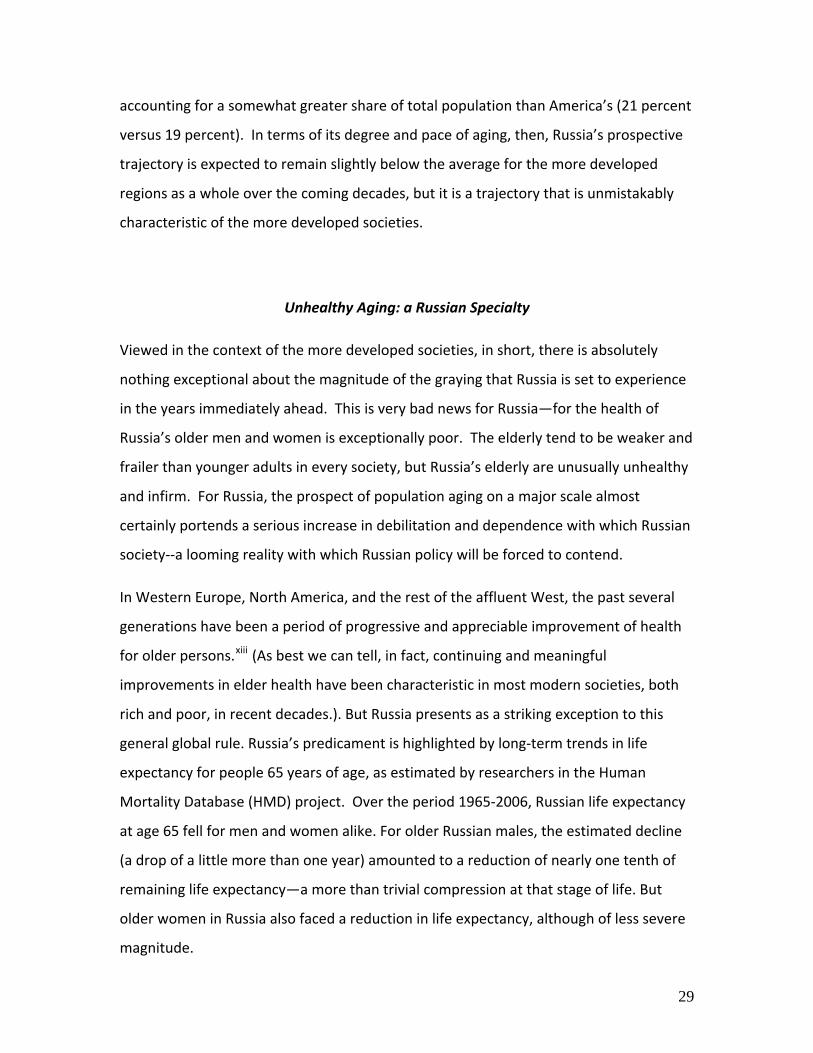
29
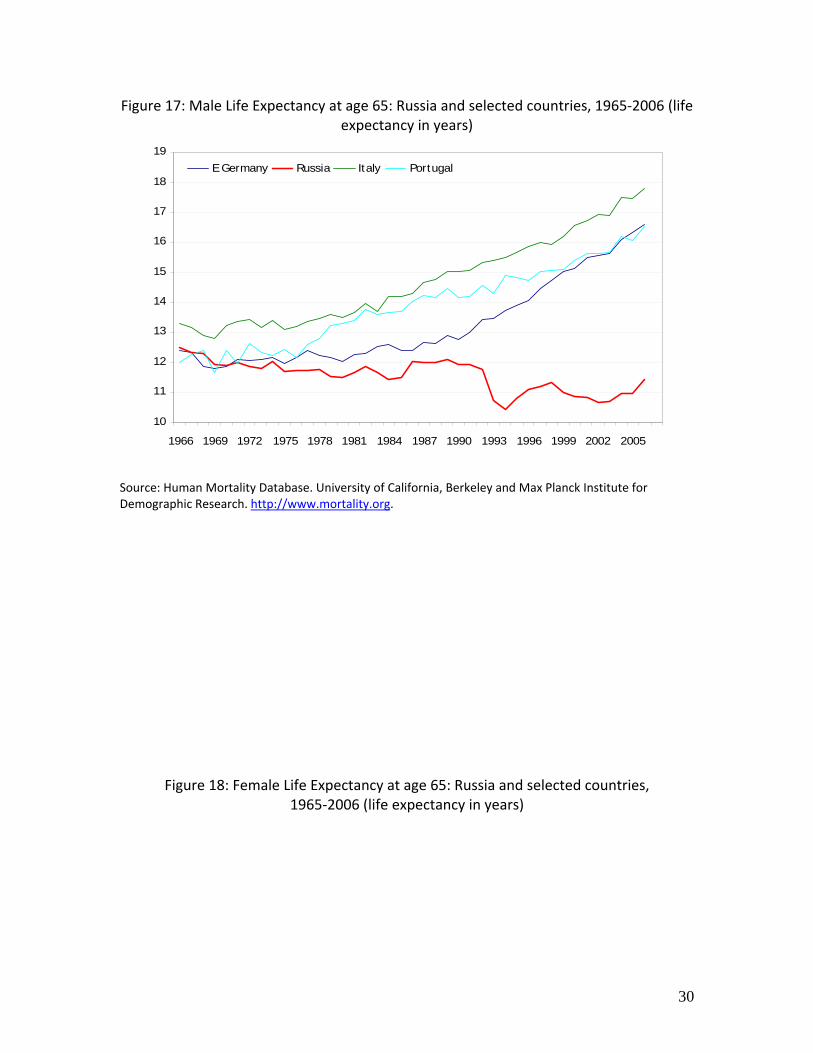
Figure 17: Male Life Expectancy at age 65: Russia and selected countries, 1965‐2006 (life expectancy in years)
10
11
12
13
14
15
16
17
18
19
1966 1969 1972 1975 1978 1981 1984 1987 1990 1993 1996 1999 2002 2005
E Germany Russia Italy Portugal
Source: Human Mortality Database. University of California, Berkeley and Max Planck Institute for Demographic Research. http://www.mortality.org.
Figure 18: Female Life Expectancy at age 65: Russia and selected countries, 1965‐2006 (life expectancy in years)
30
10
12
14
16
18
20
22
24
1965 1968 1971 1974 1977 1980 1983 1986 1989 1992 1995 1998 2001 2004
E Germany Russia Italy Portugal
Source: Human Mortality Database. University of California, Berkeley and Max Planck Institute for Demographic Research. http://www.mortality.org.
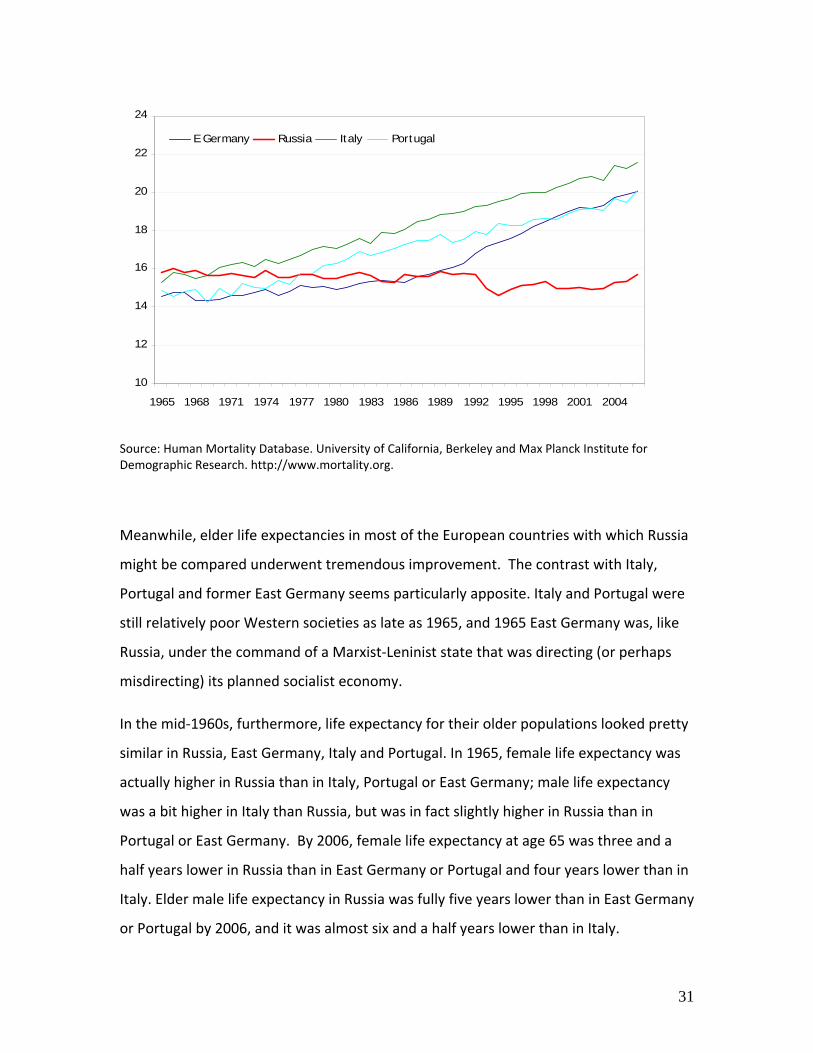
Meanwhile, elder life expectancies in most of the European countries with which Russia
might be compared underwent tremendous improvement. The contrast with Italy,
Portugal and former East Germany seems particularly apposite. Italy and Portugal were
still relatively poor Western societies as late as 1965, and 1965 East Germany was, like
Russia, under the command of a Marxist‐Leninist state that was directing (or perhaps
misdirecting) its planned socialist economy.
In the mid‐1960s, furthermore, life expectancy for their older populations looked pretty
similar in Russia, East Germany, Italy and Portugal. In 1965, female life expectancy was
actually higher in Russia than in Italy, Portugal or East Germany; male life expectancy
was a bit higher in Italy than Russia, but was in fact slightly higher in Russia than in
Portugal or East Germany. By 2006, female life expectancy at age 65 was three and a
half years lower in Russia than in East Germany or Portugal and four years lower than in
Italy. Elder male life expectancy in Russia was fully five years lower than in East Germany
or Portugal by 2006, and it was almost six and a half years lower than in Italy.
31
Nowadays, older men in Italy can expect to live fully half again as long, and Italian
women can expect to live well over a third longer, than their counterparts in Russia.
Elder life expectancy in Russia today, indeed, appears to be akin to levels witnessed in
contemporary Third World countries (settings, incidentally, where the 65‐plus
population accounts for a far smaller share of total population than is the case for the
contemporary Russian Federation). According to “life tables” prepared by the WHO
Statistical Information System (WHOSIS), for example, as of the year 2006, life
expectancy at age 65 was lower in Russia than in Paraguay for men and women alike.
Elder life expectancy in Russia was higher than in Bangladesh for females, but for elder
males, life expectancy actually was estimated to be higher in Bangladesh than in
Russia.xiv But of course Paraguay and Bangladesh are far poorer than Russia. According
to the reckoning of economic historian Angus Maddison, as of 2006 per capita GDP in
Paraguay was less than two‐fifths the Russian level; Bangladesh’s was not even one
seventh Russia’s.xv
In Western Europe (and in major parts of post‐Communist Europe), mortality levels for
older people today are much lower than they were 40 years ago, irrespective of the
number of candles on the birthday cake. This fact is even true at age 90: according to
estimates from the HMD, death rates for those nonagenarians were on average 25
percent lower in Portugal in 2005 than in 1965, 40 percent lower in Italy, and almost 45
percent lower in the former East Germany. On the other hand, death rates in the
Russian Federation were higher—often dramatically higher—in 2005 than in 1965 at
every calendar age from 60 through 90 for both men and women. Consequently, the
risk of death for older people is now vastly higher in Russia than in the developed West.
This may be seen by contrasting age‐specific death rates at older ages in Russia and
Portugal, as in Figure 19. The contraposition is especially meaningful, as Portugal
currently seems to have poorest health and the lowest life expectancy of any state in
Western Europe.
32
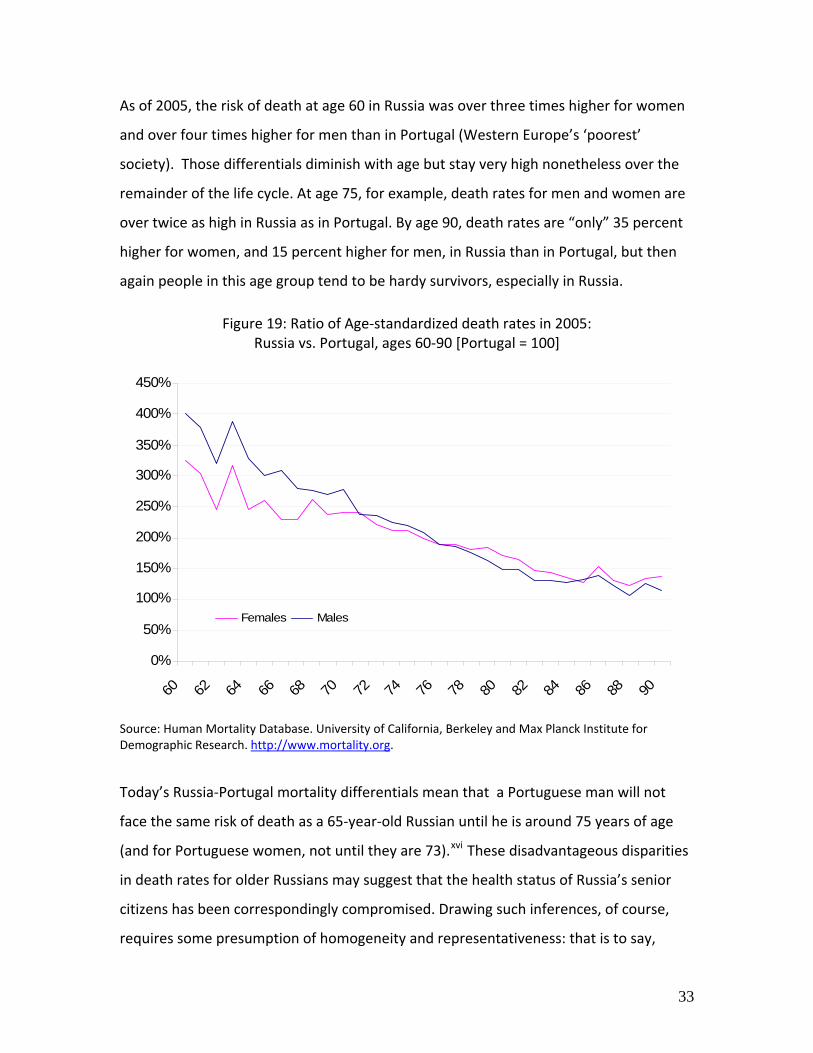
As of 2005, the risk of death at age 60 in Russia was over three times higher for women
and over four times higher for men than in Portugal (Western Europe’s ‘poorest’
society). Those differentials diminish with age but stay very high nonetheless over the
remainder of the life cycle. At age 75, for example, death rates for men and women are
over twice as high in Russia as in Portugal. By age 90, death rates are “only” 35 percent
higher for women, and 15 percent higher for men, in Russia than in Portugal, but then
again people in this age group tend to be hardy survivors, especially in Russia.
Figure 19: Ratio of Age‐standardized death rates in 2005: Russia vs. Portugal, ages 60‐90 [Portugal = 100]
0%
50%
100%
150%
200%
250%
300%
350%
400%
450%
60 62 64 66 68 70 72 74 76 78 80 82 84 86 88 90
Females Males
Source: Human Mortality Database. University of California, Berkeley and Max Planck Institute for Demographic Research. http://www.mortality.org.
Today’s Russia‐Portugal mortality differentials mean that a Portuguese man will not
face the same risk of death as a 65‐year‐old Russian until he is around 75 years of age
(and for Portuguese women, not until they are 73).xvi These disadvantageous disparities
in death rates for older Russians may suggest that the health status of Russia’s senior
citizens has been correspondingly compromised. Drawing such inferences, of course,
requires some presumption of homogeneity and representativeness: that is to say,
33
presumptions that the recorded death rates actually mirror underlying health risks
among the population of survivors in general rather than reflecting the problems of
some specific high‐risk sub‐population with Russia’s growing pool of elderly men and
women. To be sure: there is plenty of evidence to indicate that Russia is a country with
tremendous heterogeneity in socioeconomic health patterns. But there is also
compelling evidence that the overall health status of Russia’s older cohorts of men and
women is far more unfavorable today than their counterparts in other countries
undergoing big surges in population aging.
For example, in a 2004 study led by Martin Bobak of the University College of London,
based on survey data from the late 1990s, found that Swedes and Russians assessed
their own health overall health status and difficulties with physical disabilities very
differently. The results implied that men and women who managed to survive to older
ages were far more brittle in Russia than in Sweden. In Sweden, for instance, just over a
fourth of men in their early 70s, and just under a third of women, rated their own health
as “poor.” In contrast, over half of Russian men in their early 70s rated their own health
as “poor,” while over two‐thirds of Russian women in their early 70s said they suffered
from “poor” health. The survey also showed that Russians, whether male or female,
reported a much higher prevalence of impairment with “physical functioning” at ages
65‐74 than did people from Sweden.xvii
By the same token, a 2009 study by Vladimir Shkolnikov of the Max Planck Institute for
Demography and colleagues investigated differences in grip strength between older
(ages 55 to 89) populations in Moscow City, Denmark, and England and found that older
Muscovites, male and female alike, demonstrated less physical strength by this measure
than counterpart populations of the same age in Western Europe.xviii These results
appear especially meaningful not only because grip strength is a fair predictor of
cardiovascular risk but also because Moscow is one of Russia’s very most prosperous
and educated, and comparatively healthy, regions.
34

Not least important, survey data on lifestyle and behavioral patterns seems to
corroborate this picture of exceptional health risks at older ages in Russia. As T. Paul
Schultz of Yale University showed, risky health behaviors among Russian adults are
pronounced even among senior citizens. Schultz’s analysis of the 2004 round of the
Russia Longitudinal Monitoring Survey (RLMS) found that older people in Russia were
reporting remarkably high alcohol consumption and remarkably low consumption of
health and medical services.xix In his analysis of the 2004 RLMS survey, shown in Table
4, Russian men 65‐74 years of age reported an average alcohol intake equivalent to a
liter of vodka per week—the equivalent of over 22 liters of pure alcohol per year.
Further, only 10 percent of Russian men 65‐74 and 12 percent of Russian woman of
those same ages said they had undergone any sort of medical check‐up or treatment in
the three months before they were surveyed in 2004. Extrapolating on the assumption
that such medical treatment patterns were probabilistic with respect to time, these
results would imply that at nearly 60 percent of Russian men 65‐74 and over half of
Russian women of those same ages would have no medical contact over the course of
that given year. By way of comparison, for the calendar year 2005, only 6 percent of
American men and women aged 65‐74 said they had no medical check‐ups or treatment
by health professionals.xx
Table 4: Selected Health‐Related Characteristics and Behaviors of Older Russians, by Sex and Age: 2004
Years of schooling
Cigarettes per day
Alcohol intake (grams
per day)
Medical checkup in last
3 months (per 1000)
Males 65–74 9.46 6.48 62.2 123 75+ 9.52 2.67 36.2 171 Females 65–74 9.44 0.24 12.0 105 75+ 7.34 0.12 5.0 70[
35

Note: One liter of 80 proof vodka contains approximately 400g pure alcohol.
Sources: Russia Longitudinal Monitoring Survey 2004; Derived in T. Paul Schultz, “Health Disabilities and Labor Productivity in Russia in 2004: Consequences Beyond Premature Death”, in Cem Mete, ed., Economic implications of chronic illness and disability in Eastern Europe and the former Soviet Union, (Washington, DC: World Bank Publications, 2008), Table 3, p. 94.
Russia’s Dilemma: Pervasive Population Aging in the Face of Low Incomes and Poor
Health
The lack of contact between Russia’s sick and aged citizens and the Russian health care
system may partly be a matter of ill‐advised custom and habit, but it also speaks to the
severe resource constraints that press elderly men and women in Russia today. Older
men and women in Russia are not only much less healthy than their Western
counterparts—they are also much poorer. In fact, Russia may virtually be the world’s
poorest aged society—at least, to date. Certainly none of the now‐affluent Western
societies ever entered into the grey terrain that Russia is now traversing on such low
levels of per capita income.
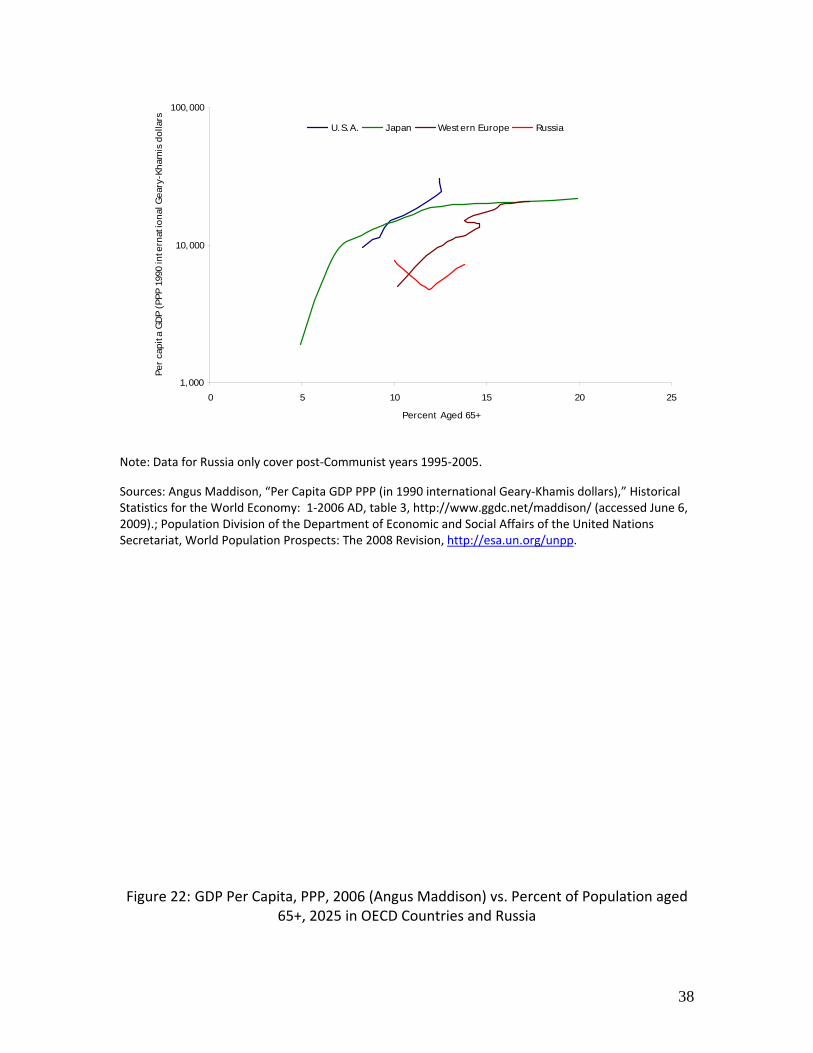
Figures 20 through 22 make this point. They trace the aging‐to‐income trajectories of
Russia and the affluent Western societies over the postwar era, utilizing UNPD estimates
of population aging (median age; percent of population 65+) and estimates of long‐term
international trends in PPP‐adjusted GDP per capita from the economic historian Angus
Maddison. (We exclude Maddison’s estimates of output trends in the Russian
Federation for the Soviet era, owing to the problems of comparability between market‐
oriented and centrally‐planned economic systems.)
Figure 20: Median Age vs. Per Capita GDP PPP, 1950‐2005: The Russian Federation in Western Perspective
36

1,000
10,000
100,000
15 20 25 30 35 40 45
Median Age
Per
cap
ita
GD
P (P
PP 1
990
inte
rnat
iona
l Gea
ry-K
ham
is d
olla
rs U.S.A. Japan Western Europe Russia
Note: Data for Russia only cover post‐Communist years 1995‐2005.
Sources: Angus Maddison, “Per Capita GDP PPP (in 1990 Geary‐Khamis dollars),” Historical Statistics for the World Economy: 1‐2006 AD, table 3, http://www.ggdc.net/maddison/ (accessed June 6, 2009). Population Division of the Department of Economic and Social Affairs of the United Nations Secretariat, World Population Prospects: The 2008 Revision, http://esa.un.org/unpp.
Figure 21: Percent Aged 65+ vs. Per Capita GDP PPP, 1950‐2005:
The Russian Federation in Western Perspective
37
1,000
10,000
100,000
0 5 10 15 20 25
Percent Aged 65+
Per
cap
ita
GD
P (P
PP 1
990
inte
rnat
iona
l Gea
ry-K
ham
is d
olla
rs
U.S.A. Japan Western Europe Russia
Note: Data for Russia only cover post‐Communist years 1995‐2005.
Sources: Angus Maddison, “Per Capita GDP PPP (in 1990 international Geary‐Khamis dollars),” Historical Statistics for the World Economy: 1‐2006 AD, table 3, http://www.ggdc.net/maddison/ (accessed June 6, 2009).; Population Division of the Department of Economic and Social Affairs of the United Nations Secretariat, World Population Prospects: The 2008 Revision, http://esa.un.org/unpp.
Figure 22: GDP Per Capita, PPP, 2006 (Angus Maddison) vs. Percent of Population aged 65+, 2025 in OECD Countries and Russia
38

y = 617.18x + 6765.6R2 = 0.1328
0
5,000
10,000
15,000
20,000
25,000
30,000
35,000
0 5 10 15 20 25 30 35
Population aged 65 and over (percent), medium variant
GD
P pe
r cap
ita, P
PP
(199
0 G
eary
-Kha
mis
inte
rnat
iona
l $)
Russia
Germany
Sources: United Nations, Department of Economic and Social Affairs, Population Division, World Population Prospects: The 2008 Revision, New York, 2009; Angus Maddison, Statistics on World Population, GDP and Per Capita GDP, 1‐2006 AD, available at http://www.ggdc.net/maddison/Historical_Statistics/horizontal‐file_03‐2009.xls.
In 2005, Russia’s median age was a little over 37 years. When Western Europe’s median
age reached that same level, however, per capita GDP there was on average nearly two
and a half times as high as Russia’s today. The same was true for Japan. America’s
median age is still a little lower than Russia’s, but the US per capita income level, by
Maddison’s reckoning, is about four times higher than Russia’s.
So too, with the proportion of population 65 and older: when Western Europe first
attained Russia’s current levels, its average per capita GDP was over 75 percent higher
than Russia’s today. Japan was twice as rich in terms of GDP per capita. America still has
a lower percentage of 65+ population than contemporary Russia, but when Russia’s
39

share was the same as America’s today, its per capita income level was barely a fifth of
that of the US.
Moreover, if we compare current (2006) per capita income levels with prospective
(2025) proportions of total population 65 years of age and older, we can see that
Russia’s coming income‐to‐aging outlook appears generally—one is tempted to say
exceptionally‐‐unfavorable by comparison with the countries in today’s OECD.
Pervasive population aging by a sick and fragile citizenry on what qualifies historically as
an unusually low trajectory for general income levels begs the question of how Russia’s
steadily growing proportion of senior citizens will be supported in the decades ahead.
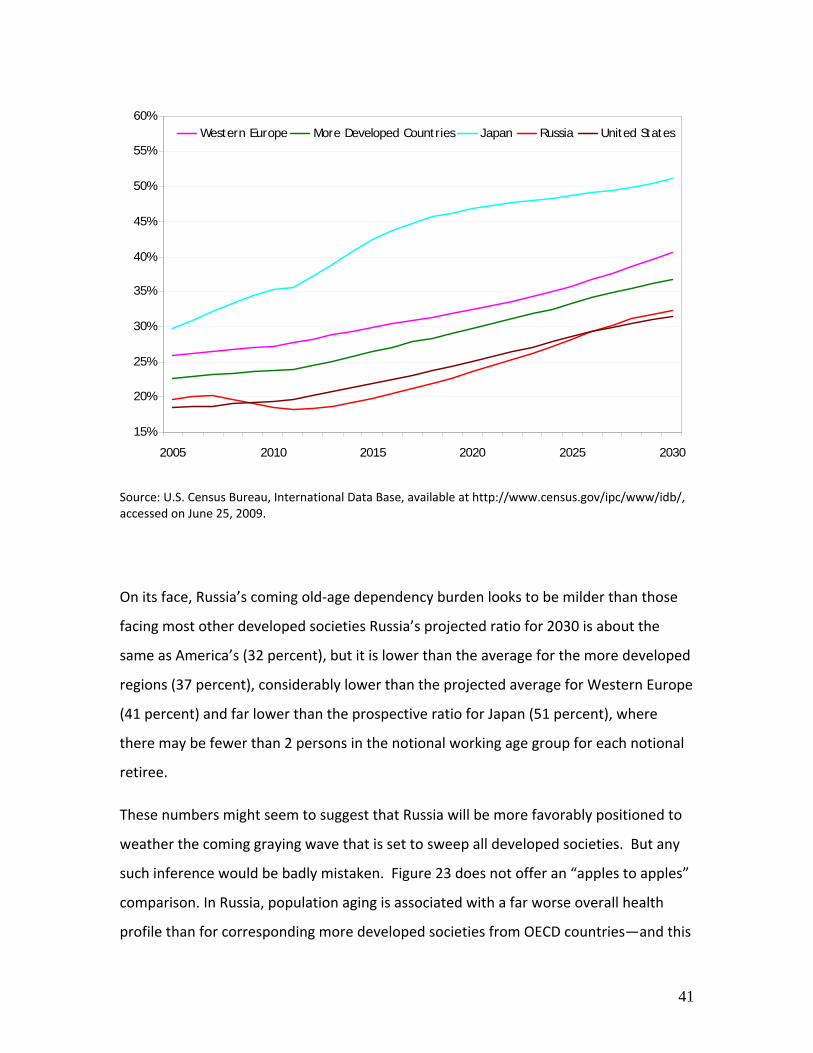
An initial glimpse at the outlook is afforded by USBC projections of “old age dependency
ratios,” the ratio of the 65+ population to people of conventionally defined working ages
(15‐64). By these projections, Russia’s old‐age dependency ratio is slated to rise in the
years ahead from about 20 percent in 2005 to something like 32 percent in 2030. Put
another way, there are about 5 people of notional working age for every notional
retirement age Russian now, but the ratio would be down to about 3:1 in a little over
two decades.
Figure 23: Projected Old Age Dependency Ratios, 2005‐2030: Russian Federation vs. Selected More Developed Regions
[Persons 65+/Persons 15‐64 years of age]
40
15%
20%
25%
30%
35%
40%
45%
50%
55%
60%
2005 2010 2015 2020 2025 2030
Western Europe More Developed Countries Japan Russia United States
Source: U.S. Census Bureau, International Data Base, available at http://www.census.gov/ipc/www/idb/, accessed on June 25, 2009.
On its face, Russia’s coming old‐age dependency burden looks to be milder than those
facing most other developed societies Russia’s projected ratio for 2030 is about the
same as America’s (32 percent), but it is lower than the average for the more developed
regions (37 percent), considerably lower than the projected average for Western Europe
(41 percent) and far lower than the prospective ratio for Japan (51 percent), where
there may be fewer than 2 persons in the notional working age group for each notional
retiree.
These numbers might seem to suggest that Russia will be more favorably positioned to
weather the coming graying wave that is set to sweep all developed societies. But any
such inference would be badly mistaken. Figure 23 does not offer an “apples to apples”
comparison. In Russia, population aging is associated with a far worse overall health
profile than for corresponding more developed societies from OECD countries—and this
41
makes the challenge of coping with aging much greater.xxi Russia’s senior citizens are
significantly more frail and unhealthy than their counterparts in the affluent West;
moreover, their health trends have been heading in the wrong direction for almost two
generations. In the affluent West, “healthy aging” is transforming the demographic
profile of older men and women. These salutary changes, in tandem with ongoing
changes in the nature of work in Western societies (inter alia, the decline of manual
labor and the expansion of employment in a less physically taxing service sector) is
opening new possibilities for continuing labor force participation for a robust and active,
albeit graying, population.xxii In Russia, on the other hand, “unhealthy aging” is not only
limiting the possibilities for older Russians to engage in economically productive activity:
it is also restricting the scope for younger adults to support Russia’s steadily growing
older generations.
Poor health may help to explain contemporary Russia’s distinctive labor force
participation patterns. From age 55 onwards, workforce participation in Russia drops off
very sharply—more sharply, indeed, than in most Western societies. According to
Russia’s 2002 census, only about half of Russians in their late fifties were still in the
country’s workforce. Less than 30 percent of those in their early 60s were economically
active, among those 65 and older, the labor force participation rate was under 5
percent. According to those same statistics, essentially no Russians over the age of 73
were economically active.xxiii For the “more developed regions” as a whole, labor force
participation rates today at older ages are consistently higher than in Russia. In 2002, by
ILO estimates, the corresponding rates for the more developed countries as a whole
were 62 percent for persons in their late 50s, 35 percent for persons in their early 60s,
and about 10 percent for persons 65 and older.
Even this comparison, however, is confounded by income effects—by the preference for
leisure of more affluent populations. In recent decades, there has been a retreat from
the workforce at older ages across Western Europe, but this shift is explained in some
measure by rising affluence and a broad preference for enjoying leisure during a healthy
42

old age. Russia’s exceedingly low workforce participation patterns at older age, by
contrast, may be conditioned much more by sheer exigency: the plain inability of frail
seniors to meet the demands that the Russian workplace imposes.
That latter distinction emerges more sharply when we compare labor force participation
rates for older men and women in Russia today to the rates that prevailed in Western
Europe when Western European societies reported per capita income levels similar to
Russia’s nowadays.xxiv Consider France and Italy—two paragons of early retirement in
Western Europe today. By the reckoning of the economic historian Angus Maddison,
France’s per capita GDP roughly matched the Russia 2002 level in 1954 and Italy in 1960.
In 1961, according to the Italian Census, labor force participation rates in Italy for the
65+ group were over two and a half times higher than Russia’s four decades later. As
for France, its 1962 Census recorded labor force participation rates over three times the
Russia 2002 level for persons 65 and older and nearly twice as high per persons in their
early 60s. Note further that combined male and female life expectancy at age 55 was
higher in both Italy and France in the early 1960s than it was in Russia in 2002.xxv Why
did older Western Europeans do more work in the early postwar era than Russians
today? Perhaps part of the answer is: because they could.
In Russia today, retirement age is conventionally set at 60 for men and 55 for women.
Correspondingly, official Russian statistics regard the working ages as 16‐59 for men, 16‐
54 for women. To be sure: some pension‐aged men and women in Russia today are still
actively engaged in remunerative labor—but the proportion is very low indeed. Figure
24 below makes the point. According to estimates by the Russian Federation Pension
Fund, in fact, fully three quarters of Russia’s pensionable population did not work at all
in the year 2006xxvi—this despite the meager benefits guaranteed by official Russian
social security programs.xxvii As of 2006, Russia’s average public pension payments
actually fell below the country’s official “minimum subsistence” level—meaning that the
typical pensioners who relied on these benefits alone for support without outside
43
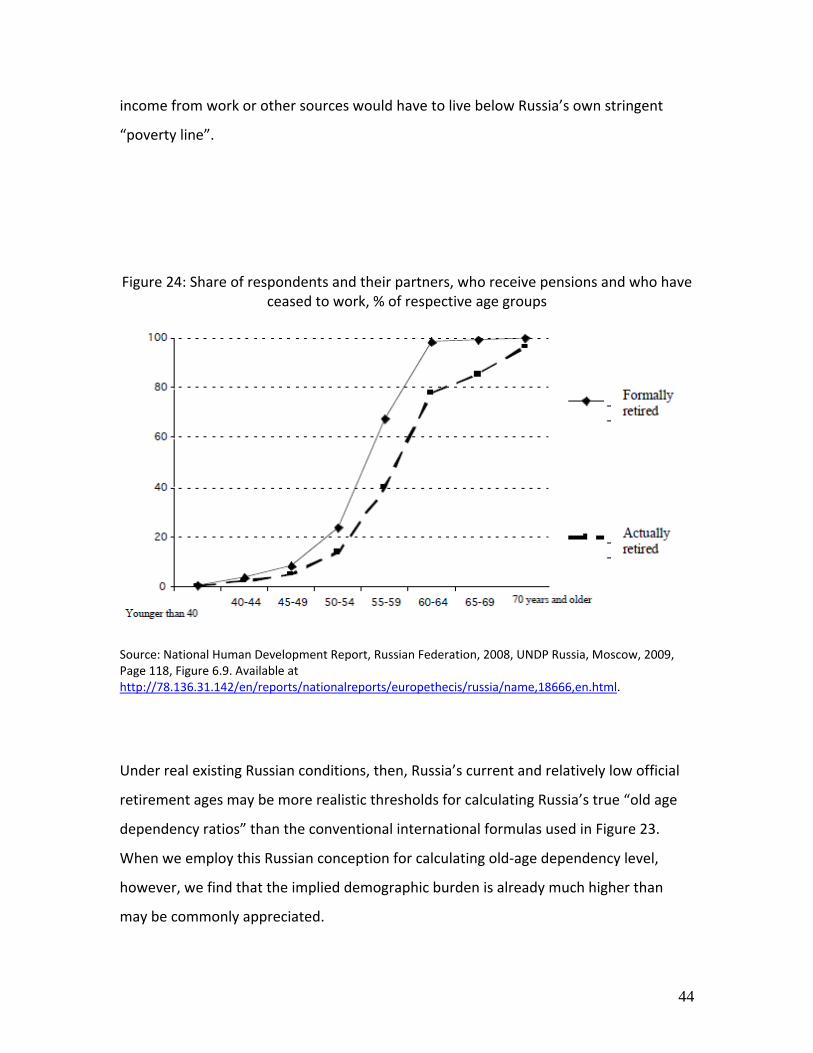
income from work or other sources would have to live below Russia’s own stringent
“poverty line”.
Figure 24: Share of respondents and their partners, who receive pensions and who have ceased to work, % of respective age groups
Source: National Human Development Report, Russian Federation, 2008, UNDP Russia, Moscow, 2009, Page 118, Figure 6.9. Available at http://78.136.31.142/en/reports/nationalreports/europethecis/russia/name,18666,en.html.
Under real existing Russian conditions, then, Russia’s current and relatively low official
retirement ages may be more realistic thresholds for calculating Russia’s true “old age
dependency ratios” than the conventional international formulas used in Figure 23.
When we employ this Russian conception for calculating old‐age dependency level,
however, we find that the implied demographic burden is already much higher than
may be commonly appreciated.
44

According to official estimates by Goskomstat/Rosstat (the Russian Federal Statistical
Service), Russia had just 3 persons “at working age” for every person “over working age”
at the start of 2008. But of course not all of Russia’s working age population was
actively engaged economically. In 2008 (that is, before the impact of the current world
economic crisis on local demand for labor), Russia had a workforce of about 70 million,
and a pension‐age population of nearly 30 million—meaning the ratio of earners to
pensionable population was just 2.5 to 1. Over the years ahead, that ratio is set only to
decline further.
Pension and Old Age Support: A Looming Dilemma for the Russian Federation
By Goskomstat’s own “medium variant” projections, Russia’s ratio of “working age” to
“over working age” population is on track to fall below 2:1 by the year 2030—just 20
years from now. [SEE FIGURE 25] And, of course, in 2030—as now—not all of Russia’s
population of working age will actually be employed. Projections by the Russian Ministry
of Education and the Institute of Demography at Moscow State University suggest that,
on the current trajectory, Russia’s pension‐age population will nearly equal the
country’s workers by the mid‐2020s—and that there could be more pensioners than
workers in Russia as early as the year 2029.xxviii
Figure 25: Ratio of Working Age to Above Working Age Population (medium variant), Russia, 2010‐2031
45

0.0
0.5
1.0
1.5
2.0
2.5
3.0
3.5
2010 2012 2014 2016 2018 2020 2022 2024 2026 2028 2030
Rat
io: W
orki
ng A
ge P
opul
atio
n to
A
bove
Wor
king
Age
Pop
ulat
ion
Source: “1.8. Total population by selected age groups,” Federal State Statistics Service (Goskomstat), Russian Federation, Available at http://www.gks.ru/free_doc/new_site/population/demo/progn3.htm.
In the decades ahead, the Russian Federation will face at the same time the full panoply
of challenges and claims attendant to social protection programs for a modern welfare
state: family benefits (child support, maternity benefits and the like), unemployment
insurance programs, occupational health and safety programs, and health care benefits,
among others. In recent years, the Russian government has begun to address some of
these issues. It has implemented a pro‐natalist program of child allowancesxxix, for
example, and has moved in the direction of reforming its health care system (although
outsiders have argued these health reform measures are as yet halting, inefficient and
incomplete with evident gaps in securing broad access at reasonable quality).xxx
The following discussion will not address these broader questions of social protection,
effective healthcare provision and preventive measures, focusing instead only on the
46
demographic implications of the country’s prospective old age‐support challenges. It is
important to remember, however, that the full range of social protection obligations will
place additional and likely growing fiscal pressure on the Russian budget and the
economy that must support it, above and beyond pressures on the for old‐age support
system described below.
In 2002 the Russian Federation adopted a pension reform strategy modeled broadly on
the World Bank’s “three pillars” schema (i.e., a pay‐as‐you‐go (PAYG) defined‐benefit
nationwide public pension system, a mandatory privately funded defined‐contribution
system, and a notional supplementary privately funded defined‐contribution system).xxxi
Although the World Bank was involved in advising the government on this reform, and
provided financial support for this overhaul, a World Bank project evaluation
assessment has concluded that the pension reform has not been successful, at least to
date.xxxii Given the uncertainties (and lack of transparency) surrounding Russia’s current
financial system and markets for bonds and equities, Russian workers have remained
understandably cautious with their private retirement system investments—opting
largely for holdings in cash or other instruments bearing distinctly negative real returns
in an inflationary environment. Thus the “first” pillar—the basic PAYG Russian public
pension system—remains dominant, and is likely to serve as the primary source of
pension‐based old‐age support for Russia’s retirees in the years immediately ahead.
For pensioners relying solely on public pension income for old‐age support, living
standards are determined by the “replacement rate”: the ratio of monthly pension
benefits to working income (both net of taxes). The International Labor Office (ILO)
recommends that this replacement rate should be no lower than 40%‐‐and in OECD
countries, “the lowest replacement rates are around 40%, but most are well above that
level”.xxxiii In Russia as of 2007, however, the replacement rate for the public pension
system was an estimated 26%. In practice, this meant that average public pension
benefits that year were barely above the country’s penurious poverty line (“minimum
subsistence level”); in some earlier years, as already noted, average benefits had
47

actually been lower than that “minimum subsistence level”. According to one widely‐
accepted analysis by a Russian economist, Evsey Gurvich, Russia’s public pension
system was so seriously underfunded that it could not maintain even that low
replacement rate into the future: absent changes in the then‐existing arrangements, the
system’s replacement rate was projected to fall to a mere 17% by 2027. [SEE FIGURE 26]
All things have not remained equal since 2007: the Russian government has decreed
annual increases in public pension benefits in 2008 and 2009, and 2010 ; in 2009,
furthermore Prime Minister Putin declared that “Poverty among pensioners will be fully
eliminated” (implicitly acknowledging that this was a work still in progress)..xxxiv
Welcome as they were, however, it is essential to recognize that these declarations and
adjustments in pension benefits were ad hoc—entirely provision in nature. No regular
mechanism is in place within the Russian public pension system to assure that
replacement rates will not resume their downward decline in the future. Given its
actuarial imbalance, moreover, the budgetary implications of maintaining a even a
steady replacement ratio—even a meager one—in Russia over the years immediately
ahead appear to be imposing. Calculations by Evsey Gurvich, for example, suggest that it
would take fully 3% of Russian GDP in 2027 just to keep the pension system’s
replacement rate at its 2007 level; by these estimates, raising that rate slightly, to 30%;
would require supplementary budgetary commitments exceeding 4% of GDP. [SEE
FIGURE 27] (Achieving the ILO’s desideratum of a minimum 40% replacement rate
would of course mean a far greater allocation of public funds; Gurvich did not even
consider this possibility.)
Figure 26: Projected Replacement Rate of Russia’s Public Pension System, 2007‐2050 (projections as of 2007)
48

Source: David Hauner, “Macroeconomic Effects of Pension Reform in Russia,” IMF Working Paper, International Monetary Fund, August 2008.
Figure 27: Additional Funding Need under Two Scenarios, Percent of GDP
Source: David Hauner, “Macroeconomic Effects of Pension Reform in Russia,” IMF Working Paper, International Monetary Fund, August 2008.
By 2009, according to official Russian sources, the country was already devoting fully
10% of GDP to old‐age pensions.xxxv Could such additional commitments be sustainable?
49

Russia, of course, is blessed with an abundance of natural resources—most notably
today its oil and gas reserves. These resources present the government an opportunity
to finance social policies and other initiatives that would be unavailable to a country in
Russia’s position, but lacking such natural wealth. Yet the public means afforded by
Russian oil and gas are by not unlimited. One International Monetary Fund (IMF)
analysis has attempted to estimate just how long the monies in Russia’s Oil Stabilization
Fund would last if they were devoted exclusively to supporting the unfunded balances
of the existing PAYG public pension system. [SEE FIGURE 28] Under the assumptions of a
30% replacement rate and $80/barrel oil, the Fund would be completely spent by
2021—eleven years from now. With oil at $100/barrel and a 30% replacement rate, the
date of full depletion for the Fund would be postponed—but by just 4 years. Even under
more optimistic assumptions (i.e., lower replacement rates) and $80/barrel oil, the Fund
would be bankrupt before 2030—that is to say, in less than two decades, and at
precisely the time when Russia’s pension aged population could exceed population of
actively engaged workers under the assumptions of aforementioned Moscow State
University study.
Figure 28: Oil Stabilization and National Welfare Funds in Percent of GDP
Source: David Hauner, “Macroeconomic Effects of Pension Reform in Russia,” IMF Working Paper, International Monetary Fund, August 2008.
50

To sum up: it is no secret that population aging represents a major prospective social
and economic challenge for all affluent Western societies in the decades ahead. What is
less generally recognized is that population aging poses more acute challenges to Russia
than to today’s Western societies – a challenge driven by poor health indicators, an
unfavorable ratio between working age and retired population cohorts, and pension
system by no means sufficient to meet present and future needs of an upper middle
income economy such as Russia. In fact, far more than in today’s affluent Western
societies, population aging and the consequent “aging burden” in Russia may prove to
be both a social problem and constraint on economic development in the decades
ahead.
The challenges for social policymakers in Russia over the years ahead stand to be
especially pressing. (To reiterate: in focusing on old age support, we have been
examining but one of many social support issues that will be confronting the country.)
Devising sustainable social programs in such areas as old‐age support and health care
promises to be a vastly more daunting challenge for Russia than for the aging, but
affluent and relatively healthy, societies of the OECD. What should be apparent from
this study is that meeting Russia’s future needs will take more than another plaintive
call for “integrated, coherent, comprehensive” policies in the social sector. No less
crucial is the imperative of generating the wealth that an aging Russia will need to meet
its social policy claims. Enhancing labor productivity through new skills and better health
is the critical task to tackle. To a degree perhaps not yet fully appreciated, the fate of
Russia’s social security situation on the years ahead will depend on the success with
which three efforts‐‐ 1) policies for radically reducing adult mortality and the working
age in particular 2) policies for revitalizing Russian higher education and knowledge
production and 3) a fundamental reform on institutions and economic policies—are
pursued today.
51

i This essay is a substantially revised and extended version of a chapter from Nicholas Eberstadt, Russia’s Peacetime Demographic Crisis: Dimensions, Causes, Implications (Seattle, WA: National Bureau of Asian Research, forthcoming). An abridged version of the present study will be appearing in The International Social Security Review. The authors would like to salute Mr. Apoorva Shah for his superb research assistance in the present work. Any remaining errors are of course the authors’ own. ii Nicholas Eberstadt Ph.D. holds the Henry Wendt Chair in Political Economy at the American Enterprise Institute (AEI) in Washington, DC and is Senior Adviser to the National Bureau of Asian Research (NBR) in Seattle, WA. Hans Groth MD, MBA is Senior Director for Healthcare Policy & Market Access at Pfizer Europe, Oncology BU and Member of the Board of Directors of Pfizer Switzerland. He is also invited Lecturer on Global Demographic Change & Economic Development at the University of St. Gallen, Switzerland. Both authors are members of the Global Agenda Council (GAC) of the World Economic Forum (WEF). Email contact info: <[email protected]> ; <[email protected]> . iii Estimates are for 2005 per capita GDP in constant 2005 international dollars. World Bank, World Development Indicators Online (WDI online), available electronically at http://ddp-ext.worldbank.org/ext/DDPQQ/showReport.do?method=showReport; accessed January 15, 2010. iv For 2007, the cutoff for membership in the “high income economies” grouping was a PPP-adjusted per capita GNI of $16,830 (for Lithuania). The Russian Federation’s estimated level for that year was $14430—about 15% below the notional “high income economy” threshold. World Bank, World Development Indicators 2009. (CD-ROM). v One particularly dramatic post-Communist transformation in health and mortality conditions for a former Soviet Bloc state was the case of the former German Democratic Republic (now Eastern Germany within the reunified Federal Republic of Germany). Life expectancy in Eastern Germany has soared since reunification: in the sixteen years from 1990-2006, overall life expectancy in Eastern Germany is estimated to have risen by over 8 years—over three and a half days for every passing calendar week. Despite four decades of Communist-era disadvantage, life expectancy at birth for the population in Eastern Germany has converged with that of Western Germany, standing today just a few months of the Western German level. Overall life expectancy at birth in Eastern Germany is now in fact higher than life expectancy in the United States: at the time of reunification, it was nearly three years lower than in America. For more details on this case, see Nicholas Eberstadt and Hans Groth, Die Demografiefalle: Gesundheit als Ausweg für Deutschland und Europa, (Stuttgart: Thieme Verlag, 2008). viCf. Nicholas Eberstadt, Russia’s Peacetime Demographic Crisis: Dimensions, Causes, Implications (Seattle, WA: National Bureau of Asian Research, forthcoming). vii Ibid. viii Cf. “Scientific glasnost”, Nature, 464 , 141-142 (11 March 2010) | doi :10.1038/464141b ; Published online 10 March 2010; see also “Data Everywhere” The Economist, February 25, 2010, available electronically at http://www.economist.com/specialreports/displaystory.cfm?story_id=15557507. ix Transparency International, “Corruption Perceptions Index 2009”, available electronically at http://www.transparency.org/policy_research/surveys_indices/cpi/2009/cpi_2009_table x James D. Gwartney et al., Economic Freedom of the World: 2009 Report, (Vancouver: Fraser Institute, 2009), Chapter 1, available electronically at http://www.freetheworld.com/2009/reports/world/EFW2009_ch1.pdf xi Heritage Foundation, “2010 Index of Economic Freedom—Ranking The Countries”, available electronically at http://www.heritage.org/index/ranking.aspx. xii Students of demography today are generally under the impression that the United Nations has defined an “aging society” as one where 7 percent or more of the citizens are 65+, with an “aged society” benchmarked at 14 percent or more over the age of 65. The documentation for these formal thresholds, as it turns out, is somewhat problematic. (Personal correspondence with Dr. Hania Zlotnik, head of the UN Population Division, and Dr. Joseph Chamie, former head of UNPD, July 2009) But the 7 percent and 14 percent notional thresholds for “aging societies” and “aged societies” are widely used by students of demography nowadays nonetheless. xiii For some details and evidence concerning the correspondence of improved health status with declining mortality levels for older citizens in some of the OECD countries,, see Nicholas Eberstadt and Hans Groth,
52
Europe’s Coming Demographic Challenge: Unlocking the Value of Health, (Washington, DC: AEI Press, 2007). xiv “Life Tables for WHO Member States”, WHO Statistical Information System, available electronically at http://apps.who.int/whosis/database/life_tables/life_tables.cfm, accessed July 23, 2009. xvAngus Maddison, “Statistics on World Population, GDP and Per Capita GDP, 1-2006 AD”, available electronically at http://www.ggdc.net/maddison/Historical_Statistics/bertical-file_03-2009.xls , accessed July 20 2009. xviCf. The Human Mortality Database, available electronically at www.mortality.org, accessed July 10, 2009. xvii Martin Bobak, Margareta Kristenson, Hynek Pikhart, Michael Marmot, “Life span and disability: a cross sectional comparison of Russian and Swedish community based data”, British Medical Journal, vol. 329, p. 767-771 (September 17, 2004). xviii Shkolnikov V.M., Andreev E.M., Demakakos P., Oksuzian A., Christensen K., Shkolnikova M.A. and J.W.Vaupel, “Patterns of grip strength in Moscow as compared to Denmark and England”, 21st REVES Conference “Reducing gaps in health expectancy” 26-29 May 2009, Copenhagen, available electronically at www.ined.fr/.../telechargement_fichier_en_772_shkolnikov_andreev_demakakos_oksuzyan_christensen_ppt.pdf ,accessed July 20, 2009.xixT. Paul Schultz, “Health Disabilities and Labor Productivity in Russia in 2004”, in Cem Mete, ed., Economic Implications of Chronic Illness and Disability in Eastern Europe and the Former Soviet Union, (Washington DC: World Bank, 2008), pp. 85-109. xx Health United States 2008 (Hyattsville, MD: US National Centers for Health Statistics, 2009) Table 83, available electronically at http://www.cdc.gov/nchs/hus/hus08.pdf , accessed July 7, 2009. xxi In all graying societies, the goal should be to age in good health—and many Western countries are recognizing this approach as the viable strategy. This is the reason, for example, why Switzerland is discussing implementation of a preventive health strategy to promote aging in good health. Among the other potential benefits of such an approach, a focus on healthy aging may help the county’s citizens consume less in the way of healthcare service and stay longer in the labor force xxii These possibilities are described and examined in Nicholas Eberstadt and Hans Groth, Europe’s Coming Demographic Challenge: Unlocking the Value of Health, (Washington, DC: AEI Press, 2007). xxiiiILO LABORSTA database, available electronically at http://laborsta.ilo.org. xxiv Cf. Angus Maddison estimates, loc. Cit. xxv Human Mortality Database, loc. Cit. xxvi Cf. UN DP Russia, National Human Development Report: Russia 2008—Russia Facing Demographic Challenges, (Moscow: UNDP Russia, 2009), Figure 6.8, p.117. xxvii According to calculations by UNDP Russia, the “substitution rate” for the Russian pension system—pension income as a proportion of immediate pre-retirement income —was just 25 percent in 2007. This is a far lower rate than in any Western country today. National Human Development Report: Russia 2008; loc. Cit., Figure 7.2; p. 135. xxviii Ibid.; Figure 7.4, p. 138. xxix Cf. Nicholas Eberstadt, Russia Peacetime Demographic Crisis, loc. Cit. xxx See, for example, William Tompson, “ Healthcare reform in Russia: problems and prospects” Economics Department Working Paper No 538. ECO/WKP (2006)66, Organisation for Economic Co-operation and Development(2007), available electronically at http://eprints.bbk.ac.uk/504/1/ECO-WKP(2006)66.pdf. xxxi Cf. World Bank, Averting the Old Age Crisis: Policies To Protect the Old and Promote Growth, (New York: Oxford University Press, 1994). For details on the World Bank’s advice to Russia on pension reform, see “Pension Reform in Russia: Design and Implementation”, (Washington, DC: World Bank, Human Development Sector Unit, Europe and Central Asia Region, November 2002). xxxii See Elsa Fornero and Pier Marco Ferraresi, “Pension Reform and the Development of Pension Systems: An Evaluation of World Bank Assistance—Background Paper, Russia Country Study” (Washington, DC: Independent Evaluation Group, 2007) xxxiii David Hauner, “Macroeconomic Effects of Pension Reform in Russia,” IMF Working Paper, WP08/201, International Monetary Fund, August 2008, p.5.
53

xxxiv“State pensions to grow 20% annually in 2009-2011”, RIA-Novosti, May 14, 2008; “Putin promises to eliminate poverty among pensioners”, Itar-Tass, November 25, 2009; “Over 11 mln Rusian to get higher valorized penions—Golikova”, Itar-Tass, March 16, 2010. xxxv “Russia’s pensions next year to grow by 46 pct—Putin”, Itar-Tass, September 23, 2009.
54

Previous Discussion Papers:
David E. Bloom and David Canning, “Global demography: fact, force and future”, No. 2006/ 1
David E. Bloom, David Canning, Michael Moore and Younghwan Song, “The effect of subjective survival probabilities on retirement and wealth in the United States”, No. 2007/ 1
Glenda Quintini, John P. Martin and Sébastien Martin, “The changing nature of the school-to-work transition process in OECD countries”, No. 2007/2
David Bell, Alison Bowes and Axel Heitmueller, “Did the Introduction of Free Personal Care in Scotland Result in a Reduction of Informal Care?”, No. 2007/3
Alexandre Sidorenko,“International Action on Ageing: Where Do We Stand?“, No. 2007/4
Lord Adair Turner of Ecchinswell, “Population ageing or population growth: What should we worry about?“, No. 2007/5
Isabella Aboderin and Monica Ferreira, “Linking Ageing to Development Agendas in sub-Saharan Africa: Challenges and Approaches“, No. 2008/1
United Nations Population Fund (ed.),“The Madrid International Plan of Action on Ageing: Where Are We Five Years Later?“, No. 2008/2
Svend E. Hougaard Jensen and Ole Hagen Jørgensen, “Low Fertility, Labour Supply, and Retirement in Europe“, No. 2008/3
Ronald Lee and Andrew Mason, “Fertility, Human Capital, and Economic Growth over the Demographic Transition“, No. 2008/4
Asghar Zaidi and Alexandre Sidorenko, “Features and Challenges of Population Ageing using the European Perspective“, No. 2008/5
David E. Bloom, David Canning, Günther Fink and Jocelyn E. Finlay, “The High Cost of Low Fertility in Europe“, No. 2008/6
Robert L. Clark, Naohiro Ogawa, Makoto Kondo and Rikiya Matsukura,“Population Decline, Labor Force Stability, and the Future of the Japanese Economy“,No. 2009/1
Jovan Zamac, Daniel Hallberg and Thomas Lindh,“Low Fertility and Long Run Growth in an Economy with a Large Public Sector“,No. 2009/2
Hans Groth,“Switzerland and its Demography“,No. 2009/3
Hans Groth, Reiner Klingholz and Martin Wehling,“Future Demographic Challenges in Europe: The Urgency to Improve the Management of Dementia“,No. 2009/4
David N.F. Bell and Robert A. Hart,“Retire Later or Work Harder?“,No. 20010/1
Ousmane Faye,“Basic Pensions and Poverty Reduction in sub-Saharan Africa“,No. 2010/2
David E. Bloom and Alfonso Sousa-Poza,“The Economic Consequences of Low Fertility in Europe“,No. 2010/3
David E. Bloom, David Canning and Günther Fink,“The Graying of Global Population and Its Macroeconomic Consequences“, No. 2010/4
Monika Bütler and Stefan Staubli,“Payouts in Switzerland: Explaining Developments in Annuitization”,No. 2010/5
Previous Letters:
Ariela Lowenstein, “The Israeli experience of advancing policy and practice in the area of elder abuse and neglect”, No. 2007/1
Jeffrey L. Sturchio & Melinda E. Hanisch,“Ageing and the challenge of chronic disease: do present policies have a future?” No. 2007/2
Summary of a Special Session with: Bengt Jonsson (chair), Michaela Diamant, Herta Marie Rack and Tony O’Sullivan,“Innovative approaches to managing the diabetes epidemic”, No. 2007/3
Baroness Sally Greengross,“Human Rights Across the Generations in Ageing Societies”,No. 2008/1
Marie F. Smith,“The Role of Lifelong Learning in Successful Ageing”,No. 2008/2
Aurore Flipo, Hélène Derieux and Janna Miletzki, “Three Student Essays on Demographic Change and Migration”,No. 2009/1
Nicholas Eberstadt & Hans Groth, “Too sick to prosper: Russia‘s ongoing health crisis obstructs economic growth and development”,No. 2009/2
Ilona Kickbusch, “Closing Speech of the 5th World Ageing & Generations Congress”,No. 2009/3

WDA Forum
P.O. Box 2239 phone: +41 (0)71 242 79 79 fax: +41 (0)71 242 79 78
CH-9001 St.Gallen, Switzerland www.wdaforum.org [email protected]


