WCM - SRC Research · 19 | May | 2016 WCM Accumulate (opening coverage) Target: Euro 3.25 Portfolio...
15
19 | May | 2016 WCM Accumulate (opening coverage) Target: Euro 3.25 Portfolio outreaches Euro 500m threshold one year after the start and will grow quickly – strong tenan- cy, low interest expenses and virtually no tax burden - Starting our coverage with Accumulate and € 3.25 WCM Beteiligungs- und Grundbesitz-AG is a real estate invest- ment firm focusing on commercial real estate. WCM’s strategy is aiming at Core and Core Plus commercial assets, thus properties which by definition have a low risk profile due to long-term leases and a decent quality of the building with minimum capital expendi- ture requirements. WCM is very ambitious to accelerate the portfo- lio size from an initial portfolio worth Euro 81m to Euro 533m rep- resenting 50 properties as of May 2016. By keeping up this pace we are convinced that the management will reach its self-imposed target of doubling the portfolio size within the next 18 months. WCM has proven its capability of raising equity and securing ex- ternal financing for future growth, is unencumbered by past loan agreements and therefore benefits from historically low interest rates (2.1% on average in 2015), is well-connected in the real es- tate industry and therefore capable of rapidly building up a sub- stantial portfolio volume within a short period of time, is self- disciplined in terms of adhering to its predetermined investment criteria and can benefit from significant future tax savings through enormous loss carry forwards. The year of 2015 was the first full fiscal year in the company’s history as a real estate firm. However, since the portfolio has been successively been build up the annual results are not really a useful guidance for a future outlook. At the end of 2015, total revenues were at Euro 12.6m with rental income of Euro 9.6m and a high sustainable FFO of almost Euro 8m. The EBITDA was at Euro 4.3m resulting in a decent EBITDA-margin of 34%. Neglecting one-off operating expenses of about Euro 3.1m for transaction costs, real estate transfer tax and charged fees for the capital increase, the margin would have been even much higher at 59%. Due to the use of loss carry forwards deferred tax- es positively impacted the earnings through activation of deferred taxes of c. Euro 0.9m for future tax savings. The tax loss carry forwards will help to keep the group’s cash taxation at very low levels in the next years. In 2016, the annualized rental income of the past acquisitions will be entirely incorporated in the P&L. Assuming a further rising portfolio size of more than Euro 700m by end of this year, rental income might triple and the FFO might jump to Euro 21m. Low operating costs as well as a scalable platform will lead to an FFO over proportionally rising by 150% in 2016 and about 20% for the coming years 2017 and 2018. Our FFO excess return approach with conservative assumptions for the future growth comes up with a Fair Value of Euro 3.25 per WCM share and allows for almost 13% additional upside after the share already performed very well in 2015 (+84%) and in the first months of 2016 (+12%). We start the coverage with an Accumulate rating and set our target at Euro 3.25. Price (Euro) 2.89 52 weeks range 3.34 / 1.77 Key Data ISIN DE000A1X3X33 Reuters WCMKK.DE Bloomberg WCM GY Reporting standard IFRS Market Cap (Euro million) 352 Number of shares (million) 122.0 Free Float 66.9% Free Float Market Cap (Euro million) 236 CAGR FFO after taxes ('15 -'18e) 56.0% Multiples 2015 2016e 2017e 2018e Market Cap/ Total revenues 33.7 12.0 9.9 8.2 PE-Ratio 4.0 11.6 11.1 10.9 Dividend Yield 0.0% 2.8% 3.5% 4.2% Price-to-Book-Ratio 1.35 1.25 1.17 1.10 P/ NAV-ratio 1.21 1.08 1.09 1.03 Key Data per share (Euro) 2015 2016e 2017e 2018e Earnings per share (EPS) 0.72 0.25 0.26 0.27 Dividend per share (DPS) 0.00 0.08 0.10 0.12 Book Value per Share (BVPS) 2.14 2.31 2.47 2.62 EPRA NAV per share 2.38 2.69 2.66 2.81 Financial Data (Euro '000) 2015 2016e 2017e 2018e Rental income 10,445 29,350 35,514 42,972 Net revaluation result 9,560 28,230 33,769 40,762 EBITDA profit 59,231 44,942 47,976 50,807 Adj. EBITDA profit (cash driven) 4,327 25,070 29,986 36,247 Operating profit (EBIT) 58,872 44,532 47,546 50,357 Net financial result -2,076 -5,673 -6,695 -8,516 Pre-tax profit (EBT) 56,796 38,859 40,851 41,841 Taxation 879 -2,845 -3,505 -3,635 Net profit after minorities 54,292 30,370 31,625 32,330 FFO (after tax) 7,932 21,218 25,525 30,124 Shareholders' equity (Euro million) 261 282 301 319 Property portfolio (Euro million) 502 707 1,004 1,255 RoE (after tax) 36.0% 10.8% 10.5% 10.1% Equity ratio (incl. equity minorities) 48.9% 37.4% 29.6% 26.1% Main Shareholders DIC Asset Gruppe 20.2% Karl P. Ehlerding 5.4% John F. Ehlerding 5.4% CEO Stavros Efremidis 1.9% Financial calendar 1Q 2016 report 27 May 2016 SRC Forum Financials & Real Estate 8 September 2016 2Q 2016 report 23 September 2016 3Q 2016 report 25 November 2016 Analysts Dipl.-Vw. Ingmar Tripunovic, CREA Dipl.-Kfm. Stefan Scharff, CREA E-Mail [email protected] [email protected] Internet www.src-research.de www.aktienmarkt-international.at www.aktienmarkt-international.de
Transcript of WCM - SRC Research · 19 | May | 2016 WCM Accumulate (opening coverage) Target: Euro 3.25 Portfolio...

19 | May | 2016
WCM
Accumulate (opening coverage) Target: Euro 3.25
Portfolio outreaches Euro 500m threshold one year after the start and will grow quickly – strong tenan-cy, low interest expenses and virtually no tax burden - Starting our coverage with Accumulate and € 3.25
WCM Beteiligungs- und Grundbesitz-AG is a real estate invest-
ment firm focusing on commercial real estate. WCM’s strategy is
aiming at Core and Core Plus commercial assets, thus properties
which by definition have a low risk profile due to long-term leases
and a decent quality of the building with minimum capital expendi-
ture requirements. WCM is very ambitious to accelerate the portfo-
lio size from an initial portfolio worth Euro 81m to Euro 533m rep-
resenting 50 properties as of May 2016. By keeping up this pace
we are convinced that the management will reach its self-imposed
target of doubling the portfolio size within the next 18 months.
WCM has proven its capability of raising equity and securing ex-
ternal financing for future growth, is unencumbered by past loan
agreements and therefore benefits from historically low interest
rates (2.1% on average in 2015), is well-connected in the real es-
tate industry and therefore capable of rapidly building up a sub-
stantial portfolio volume within a short period of time, is self-
disciplined in terms of adhering to its predetermined investment
criteria and can benefit from significant future tax savings through
enormous loss carry forwards. The year of 2015 was the first full
fiscal year in the company’s history as a real estate firm. However,
since the portfolio has been successively been build up the annual
results are not really a useful guidance for a future outlook. At the
end of 2015, total revenues were at Euro 12.6m with rental income
of Euro 9.6m and a high sustainable FFO of almost Euro 8m. The
EBITDA was at Euro 4.3m resulting in a decent EBITDA-margin of
34%. Neglecting one-off operating expenses of about Euro 3.1m
for transaction costs, real estate transfer tax and charged fees for
the capital increase, the margin would have been even much
higher at 59%. Due to the use of loss carry forwards deferred tax-
es positively impacted the earnings through activation of deferred
taxes of c. Euro 0.9m for future tax savings. The tax loss carry
forwards will help to keep the group’s cash taxation at very low
levels in the next years.
In 2016, the annualized rental income of the past acquisitions
will be entirely incorporated in the P&L. Assuming a further
rising portfolio size of more than Euro 700m by end of this
year, rental income might triple and the FFO might jump to
Euro 21m. Low operating costs as well as a scalable platform
will lead to an FFO over proportionally rising by 150% in 2016
and about 20% for the coming years 2017 and 2018. Our FFO
excess return approach with conservative assumptions for
the future growth comes up with a Fair Value of Euro 3.25 per
WCM share and allows for almost 13% additional upside after
the share already performed very well in 2015 (+84%) and in
the first months of 2016 (+12%). We start the coverage with an
Accumulate rating and set our target at Euro 3.25.
Price (Euro) 2.8952 weeks range 3.34 / 1.77
Key Data
ISIN DE000A1X3X33Reuters WCMKK.DEBloomberg WCM GYReporting standard IFRSMarket Cap (Euro million) 352Number of shares (million) 122.0Free Float 66.9%Free Float Market Cap (Euro million) 236 CAGR FFO after taxes ('15 -'18e) 56.0%
Multiples 2015 2016e 2017e 2018e
Market Cap/ Total revenues 33.7 12.0 9.9 8.2PE-Ratio 4.0 11.6 11.1 10.9Dividend Yield 0.0% 2.8% 3.5% 4.2%Price-to-Book-Ratio 1.35 1.25 1.17 1.10P/ NAV-ratio 1.21 1.08 1.09 1.03
Key Data per share (Euro) 2015 2016e 2017e 2018e
Earnings per share (EPS) 0.72 0.25 0.26 0.27Dividend per share (DPS) 0.00 0.08 0.10 0.12Book Value per Share (BVPS) 2.14 2.31 2.47 2.62EPRA NAV per share 2.38 2.69 2.66 2.81
Financial Data (Euro '000) 2015 2016e 2017e 2018e
Rental income 10,445 29,350 35,514 42,972Net revaluation result 9,560 28,230 33,769 40,762EBITDA profit 59,231 44,942 47,976 50,807Adj. EBITDA profit (cash driven) 4,327 25,070 29,986 36,247Operating profit (EBIT) 58,872 44,532 47,546 50,357Net financial result -2,076 -5,673 -6,695 -8,516Pre-tax profit (EBT) 56,796 38,859 40,851 41,841Taxation 879 -2,845 -3,505 -3,635Net profit after minorities 54,292 30,370 31,625 32,330FFO (after tax) 7,932 21,218 25,525 30,124Shareholders' equity (Euro million) 261 282 301 319Property portfolio (Euro million) 502 707 1,004 1,255RoE (after tax) 36.0% 10.8% 10.5% 10.1%Equity ratio (incl. equity minorities) 48.9% 37.4% 29.6% 26.1%
Main Shareholders
DIC Asset Gruppe 20.2%Karl P. Ehlerding 5.4%John F. Ehlerding 5.4%CEO Stavros Efremidis 1.9%
Financial calendar
1Q 2016 report 27 May 2016SRC Forum Financials & Real Estate 8 September 20162Q 2016 report 23 September 20163Q 2016 report 25 November 2016
Analysts Dipl.-Vw. Ingmar Tripunovic, CREA
Dipl.-Kfm. Stefan Scharff, CREA
E-Mail [email protected]@src-research.de
Internet www.src-research.dewww.aktienmarkt-international.atwww.aktienmarkt-international.de

2
19 | May | 2016
WCM Beteiligungs- und Grundbesitz-AG
2 | SRC Equity Research
SWOT Analysis
WCM pursues a quite conservative investment approach targeting assets with a low risk profile characterized by a minimum occupancy rate of 80%, long-term lease agreements with solvent and credit-worthy tenants, financed with an LTV between 50% and 65% and situated in densely populated and economically strong regions.
All assets are structured in SPVs. This enhances the liquidity of the asset and facilitates the disposal of a share of the equity stake only. By doing this, WCM is able to reduce the exposure to a level as desired in order to faster realize any adjust-ments of the portfolio mix for instance. Moreover, in the event of an asset disposal the borrowed loans will also be passed on to the buyer without releasing any pre-payment penalties.
The management team is highly senior and well-experienced in the German real estate sector. The CEO Mr. Stavros Efrimidis can show off more than 23 years of work experience in various positions. Prior to WCM he served as CEO for Kommu-nale Wohnen AG from 2007 to 2013 and oversaw its equity growth from Euro 11m to Euro 172m. After a sale to conwert Immobilien Invest SE he became CEO for con-wert’s operations in Germany. The members of the management team are quite familiar to each other due to successful collaborations as well as business relation-ships in the past. The element of trust and mutual understanding secures lean and efficient structures and the implementation of best practice principles.
The workflow and processes are not well established yet and still influenced to a large extent by the habit and management attitude of each individual. Especially the quadriga which consists of the CEO and those in charge of finance, asset manage-ment and acquisition and sales share a common professional background at Kom-munale Wohnen AG which can be deemed as a non-negligible key personnel risk.
Future growth of the portfolio heavily relies on further capital increases. Since the management indicated a dividend policy of distributing about 50% of the FFO each year and because of little room for further stretching the balance sheet with addition-al debt due to an LTV with 56.4% still slightly above the target level of 55%, the company lacks internal liquidity sources. In addition to capital increases, in-kind capi-tal contribution might be a given alternative.
WCM can fully benefit from the historically low interest rates due to the proper timing of its start of operations and without any undesired heritage of previously borrowed loans.
The vacancy rate as measured by EPRA taking into account potential rental income instead of lettable space is at about 4.0% on total portfolio level. Roughly two third of the properties are fully let. However from the remaining properties, mainly office type, 7 of them exhibit a vacancy rate of double digit numbers. If WCM is aiming at bringing further down in the first instance the vacancy rate of these properties at least by half, the vacancy rate on portfolio level will drop by another 1.8 percentage points down to 2.2%.
Even though the management team has done well in terms of rapidly building up a substantial portfolio volume, the company may struggle with keeping up the same pace as in the previous year. Indicated by the self-imposed target of lifting up the portfolio size by another Euro 500m in the next 18 months, time needed is about 50% longer than what it took for the same size within the 12 months in 2015.
The retail tenant Edeka may entail a major shortfall risk of rental income since it contributes about 25% to the overall resp. even up to 60% to the retail rental income.
Competitive advantage is not secured by any technological leadership or develop-ment skills but rather is kept by management excellence of key people like CEO Stavros Efremidis. WCM’s business model is straight-forward where the value add is largely contributed by careful deal sourcing and smart acquisitions which come into play right upfront of the value chain and while holding assets it is about fast reaction to tenant’s needs and coordination of property and facility managers for quick imple-mentation of appropriate measures where needed.
A change in European monetary policy by the ECB regarding the termination of the currently all-time low-interest period will result in a relatively high increase of interest expenses and might also lead to higher expenses for WCM.
Strenghts
Weaknesses Opportunities Threats

3
19 | May | 2016
WCM Beteiligungs- und Grundbesitz-AG
3 | SRC Equity Research
4
19 | May | 2016
WCM Beteiligungs- und Grundbesitz-AG
4 | SRC Equity Research
Investment Rationale The underlying fundamentals of the portfolio assets are intact and fully comply with the investment strategy: The portfolio is purely commercial and well-balanced between office (63%) and retail
assets (37%). As per the investment criteria WCM aims at acquiring properties with vacancy rates
ranging between 5% and 15%. The current EPRA vacancy as a measure taking into account unrealized rental income instead of vacant space dropped from 4.8% at the end of 2015 to a healthy level of currently 4.0%. In the recent company presentation a showcase as exemplified by 3 office properties located in Wiesbaden, Düsseldorf and Frankfurt demonstrated WCM’s strength of significantly reducing vacant space as. The combined vacancy rate has been significantly reduced from 13.7% down to 1.6%.
An annualized rental income of Euro 32m relatively to a market value of Euro 532.6m results into a gross initial yield of 6.0% for the total portfolio. Taking into ac-count the very low interest expenses at c. 2.1% there is a significant spread of at least 4% for the shareholders’ pocket. This spread is even higher if future rental in-come increases will be taken into consideration. Currently, the positive spread is leveraged up to an LTV of 56.4% at current. Shareholders can benefit from this posi-tive spread on a long term projection since the major bulk of loans, namely more than two third, is subject for prolongation not before 2022 which results in an aver-age time to maturity of 6.4 years at current.
The tenancy schedule shows a well-diversified mix of tenants with a weighted average lease term of about 10.3 years for the total portfolio resp. 8.8% for office properties and 12.4 years for retail properties with the retail tenant Edeka having a WALT of more than 14 years.
The vast majority of properties are each let to one tenant only. This single tenant structure reduces complexity and costs while increasing direct interaction with ten-ants in order to keep possible fluctuation and the risk of temporary vacancy low.
As of now, WCM raised Euro 212.2m of equity, thereof Euro 14m as in-kind capital contribution, and sourced over 300m in debt. Both source of capital are at an all-time cheap level. Equity can be attracted at prime yields of far below 4% for office and retail assets in top German locations and debt financing is available at unprecedented low rates. Due to the start at the end of 2014 WCM is unencumbered by unfavorable loan agreements in the past and can fully benefit from excellent conditions as seen below:
Source: Company Data, SRC Research
Clear office and retail real estate exposure
Risk spread twice as high as cost of debt
Unencumbered by unfavor-able loan agreements in the past, thus low interest rates punch through by 100%

5
19 | May | 2016
WCM Beteiligungs- und Grundbesitz-AG
5 | SRC Equity Research
All assets are indirectly held via special purpose vehicles that allows the company also to pass on the borrowed loans in the event of an asset sale via a share deal. Since the SPV is the borrower from the legal point of view, the change of the ownership does not have any impact to the existing loan agreement between the SPV as the legal entity and the financial institution. Thus, unwanted prepayment penalties are not an issue for WCM at all. Furthermore, an enormous amount of Euro 526m of loss carry forwards were right from the start at the company’s disposal in order to enormously benefit from future tax savings. A projection of a 10-years business plan for the next 10 years reveals future tax savings between Euro 15m and Euro 45m based upon a portfolio volume of up to Euro 1.5bn. The 10 years business plan was projected on the basis of the portfolio as of December 2015. In the meanwhile, the composition of the portfolio has been changed through 4 divestments and 3 acquisitions; nevertheless a simple numeric analysis explains the mechanism of how tax savings will be computed and positively impact future earnings. Please note that for tax avoiding purpose, the earnings cannot fully be deducted by the available TLCF since each year the deduction is constrained by using 60% only for the earnings above Euro 1m. For the analysis, a distinction between earnings subject to corporate tax and/or trade tax has to be done. See the analysis as follows: 1) Corporate tax: TLCF of Euro 274.1m
As per projection of a 10 years business plan, earnings to be subject for corporate tax are assumed to be about Euro 80.2m whereof only TLCF of Euro 52.1m are de-ductible from. Applying a taxation of 15.825%, active deferred tax of Euro 8.2m will be activated in the balance sheet.
Source: Company Data
2) Trade tax: TLCF of Euro 252.1m Exactly the same calculation applies for the trade tax, except for other figures. Earn-ings to be subject for trade tax are assumed to be about Euro 54.2m whereof only TLCF of Euro 36.5m are deductible from. Applying a taxation of 16.100%, active deferred tax of Euro 5.9m will be activated in the balance sheet.
Active deferred taxes amount to Euro 14.1m in total. This corresponds to activated TLCF of Euro 134.4m, thus roughly 17% of available TLCF. The ability to fully activate additional TLCF will be driven by future portfolio growth and related income. But even under the assumption of a portfolio size of Euro 1.5bn, just half of the available TLCF will be activated. For simplicity reasons, recognition of additional deferred tax assets on capital gains from asset valuations are not included in the calculation above. However the recognition of active deferred tax of Euro 26.1m after at the end of 2015 clearly indicates that capital gains will be significantly driving the recognition of additional TLCF.
Special Purpose vehicles with efficient tax structure and better exit options in the future
Tax loss carry forwards sig-nificantly minimize future taxburdens

6
19 | May | 2016
WCM Beteiligungs- und Grundbesitz-AG
6 | SRC Equity Research
Company highlights in 2015
WCM rapidly build up a portfolio with a substantial volume in terms of number of assets and market value
Through the acquisition of stable income producing assets an annualized rental income of Euro 31.5m has been secured. Since the acquisitions were successively closed over the course of 2015 and due to intense management effort for vacancy reduction for some properties (see below the showcase of 3 office properties located in Wiesbaden, Düsseldorf and Frankfurt for instance), about one third of this rental income potential has been effectively generated in 2015.
Long term lease agreements with weighted average lease terms of above 10 years at current for the entire portfolio. Highly solvent and creditworthy top 5 tenants such as Germany’s largest supermarket corporation EDEKA, the federal state of Hesse, the strongest German DIY homestore brand OBI, the multinational recruitment com-pany randstad and finally the globally active technology powerhouse General Elec-tric.
Vacancy has been constantly lowered up a level of 4% at current which is below the criteria as laid down for acquisitions targets. Apart from bringing in new tenants, WCM also successfully spent effort on successfully retaining existing tenants while extending the lease agreements. In other word, active asset management accounts for about Euro 3m resp. 10% of the annualized rental that has been secured in 2015.
Source: Company Data
At the kick-off of WCM at the end of 2014, the company could benefit of tax loss carry forwards of Euro 526.2m in total. In the recent two years this amount increased by another Euro 16m which was mainly due to additionally generated loss in the short fiscal year in 2014 and in 2015 because of cost-intensive portfolio build-up. However, about Euro 26m of TLCF so far has been already activated in the balance sheet which ultimately has a direct positive effect on the NAV.
Within the year of 2015, the share price increased by about 120% from Euro 1.202 to Euro 2.659
Source: Onvista, SRC Research

7
19 | May | 2016
WCM Beteiligungs- und Grundbesitz-AG
7 | SRC Equity Research
Portfolio snapshot (overview as of April 2016)
Source: SRC Research
Composition
WCM’s portfolio comprises 50 real estate assets wherefrom 12 are of office type and the majority of 32 are of retail type of usage. However weighted by market value resp. by rental income, the portfolio clearly dominates the portfolio with a share of 63% resp. 57% for the later. It is part of the strategy to acquire each property only indirectly by means of a special purpose vehicle which already exists due to previous acquisitions or will be set up prior to the acquisition. As of now, WCM AG is the hold-ing company of 21 SPVs. Besides some exemptions, the SPV in general have a tax efficient structure by avoiding real estate transfer tax through the holding rate of less than 95% to the SPV. See the so-called “RETT1-Blocker” share deal structures.
1 Real Estate Transfer Tax (RETT)
PRE Real Estate
Triangel Frankfurt
Immobilien GmbH94,9%
PRE Real Estate
Deutschland 1 ApS94,9%
PRE Real Estate
Deutschland 10 ApS94,9%
Aschgo GmbH & Co. KG 94,0%PRE Real Estate
Deutschland 14 ApS94,9%
WCM
PRE Real Estate
Deutschland A ApS94,9%
Barisk GmbH & Co. KG 94,0%WCM Handelsmärkte
GmbH & Co. KG100,0%
WCM Handelsmärkte II
GmbH & Co. KG100,0%
Berkles GmbH & Co. KG 94,0%WCM Handelsmärkte III
GmbH & Co. KG88,0%
River
WCM Besitzgesellschaft mbH 100,0% River Berlin Immobilien GmbH 94,9%
Greenman 1D GmbH 94,0%WCM Beteiligungsges.
mbH & Co. Objekte North KG100,0% River Bonn GmbH 94,9%
WCM Office 1 GmbH & Co. KG 100,0%River Düsseldorf
Immobilien GmbH94,9%
Seebeck Offshore Industriepark GmbH
& Co. KG92,9% WCM Planbau GmbH 94,0%
River Frankfurt
Immobilien GmbH94,9%
WCM Beteiligungs‐ und Grundbesitz‐AG
Office333.763%
Retail198.937%
12
38
Office Retail
held viaspecial purpose
vehicles

8
19 | May | 2016
WCM Beteiligungs- und Grundbesitz-AG
8 | SRC Equity Research
Brief overview
Some of the main characteristics of each of the two sub-portfolios are as follows:
‒ office portfolio ‒
Number of properties:
12
Market Value: Euro 334m
Lettable space: 114,000 sqm
Vacancy rate: 6.7%
WALT: 8.8 years
Average current in-place rent:
Euro 13.4 per sqm per month
Top tenant: Federal state of Hesse (about 10% of total rental income)
Geographical allocation:
Economically attractive German top cities such Berlin, Bonn, Köln, Frankfurt, Mainz and Wiesbaden
‒ retail portfolio ‒
Number of properties:
38
Market value: Euro 199m
Lettable space: 135,000 sqm
Vacancy rate: 0.4%
WALT: 12.4 years
Average current in-place rent:
Euro 8.5 per sqm per month
Top tenant: EDEKA (about 25% of total rental income)
Geographical allocation:
greater metropoli-tan regions with economically at-tractive spending power for private consumptions

9
19 | May | 2016
WCM Beteiligungs- und Grundbesitz-AG
9 | SRC Equity Research
Geographical allocation of the real estate portfolio by regions
‒ regional clusters ‒
by regions
by market value
by portfolio share

10
19 | May | 2016
WCM Beteiligungs- und Grundbesitz-AG
10 | SRC Equity Research
In terms of the lot size of the assets relatively to each other, please see the charac-teristics as follows:
‒ lot size characteristics ‒
office portfolio
retail portfolio
The rental income is by nearly two third generated from top tenants within their peers. Some minor risk may exist with regard to the high contribution from the tenant Edeka where the rental income amounts to 25% of the total rental income. However, this risk is somehow mitigated by the fact that the rental income is distributed across 20 retail properties rented out to Edeka.
Source: SRC Research
11
19 | May | 2016
WCM Beteiligungs- und Grundbesitz-AG
11 | SRC Equity Research
WCM’s key element of its business model – fast reaction whenever deal opportunities arise and consequently having the patience for long-term value creation
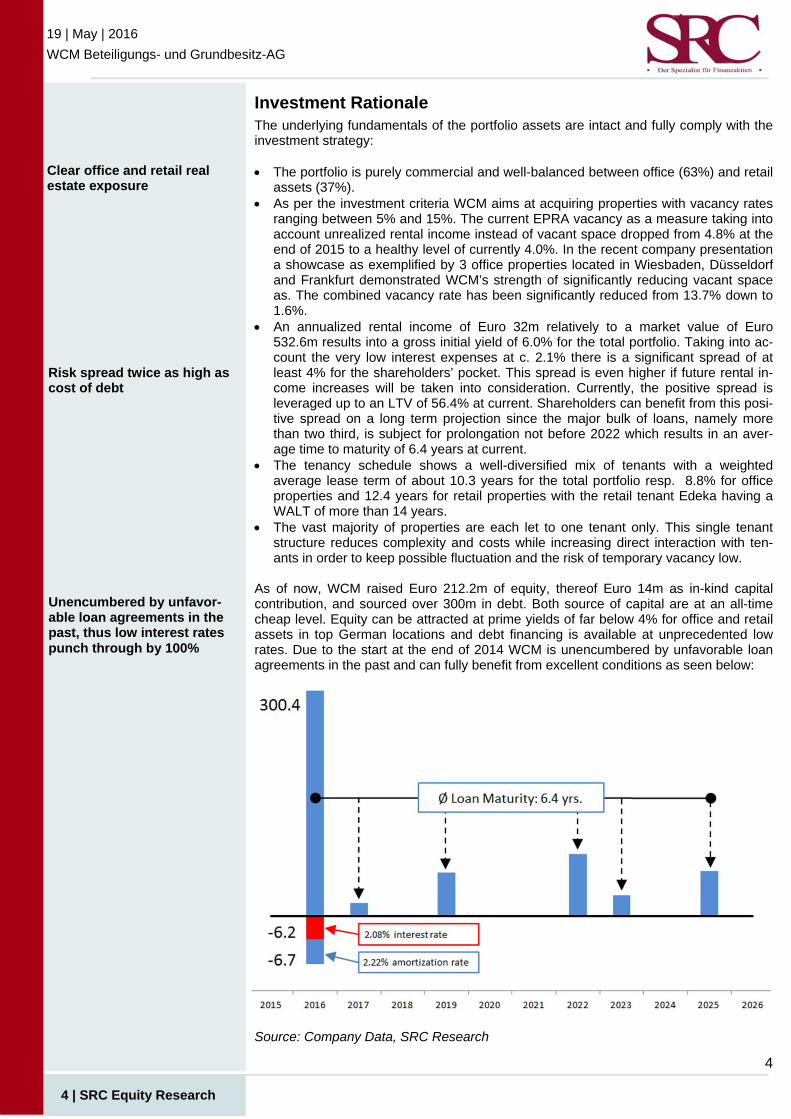
WCM targets real estate properties that offer a high occupancy rate and thus generate stable income through tenancy with solvent and credit-worthy ten-ants. In terms of quality and structure, the properties WCM is looking for should show off high quality standards, require only minor capital expendi-ture for refurbishment if at all and should be appropriate for an alternative third party use. Using the general risk-return matrix that applies for the range of possible real estate investment styles, WCM defines its market position in lower left corner of the matrix as seen as follows:
Source: Peer Realty The management team of WCM demonstrated its capability of deal sourcing and execution in a highly competitive environment where WCM competes with a range of major institutional funds following upon a rather conservative investment strategy for their institutional clients like insurance companies and retirement pension schemes. High integration within the industry and leveraging a broad network to potential buyers and sellers is a prerequisite that finally matters in order to be successful and WCM has proven well on this issue clearly by the high pace of the portfolio build up within slightly more than a year. Once an asset has been purchased, WCM’s business philosophy in general is keeping the asset within the portfolio for at least a minimum of 5 years in order to achieve value creation by proprietary and distinctive in-house man-agement services as seen as follows:
Source: Company Data, SRC Reserach

12
19 | May | 2016
WCM Beteiligungs- und Grundbesitz-AG
12 | SRC Equity Research
The FFO excess return valuation offers a 13% upside for the WCM share – even after the decent share price development
For the valuation of the WCM share we use a FFO excess return valuation model. We project the FFO cash earnings for the next five years and set these returns in relation to the future Cost of Equity to determine an excess return which adds to the EPRA NAV. For the years 2016 to 2018 we have our detailed projection stemming from our P & L forecast. We project the FFO to more than double in 2016. For 2017 and 2018 we project the FFO to rise by about 20% per year with a constantly growing portfolio which crosses the Euro 1bn threshold at the end of 2017 or the beginning of 2018. As we have no detailed projection for 2019 and 2020 yet, we may expect a hike of about 15% per year which is a rather cautious approach in our view. We set the Cost of Equity at 4.25% for 2016 and have a slowly rising Cost of Equity forecast for the coming years as general interest environment might return from an almost Zero interest environment and the company’s risk premiums and Beta may also slowly rise as later years have a higher degree of uncertainty about the sourcing of new attractive property portfolios. Thus, the Cost of Equity in our valuation model gradually increases from 4.20% in 2016 to 5.35% in 2020. Source: SRC Research In our valuation, for the years 2016 to 2020 WCM adds almost Euro 70m excess return to its NAV and ends up with a Fair Value of Euro 3.25 per share. This translates into an upside potential for the share price of almost 13% at the current share price level. With the number of shares of c. 122 million the current Fair Value per WCM share is at Euro 3.25. The WCM share already gained 12% since the beginning of the year, after gaining 84% in 2015, but with a strong FFO generation to be continued we expect the share price to quickly climb clearly above Euro 3.00. Another argument be-sides the decent and strongly rising FFO generation is the shareholders friendly dividend policy as the management plans to pay out about 50% of the future FFO profits. We set our 2016 dividend forecast at 8 Cents, for 2017 we expect 10 Cents and for 2018 our projection is at 12 Cents. This translates into a dividend yield between 3% and 4% at the current share price level.
Our approach is careful as we gradually increase the Cost of Equity and only expect a rather small hike for the 2019 and 2020 FFO.
2016e 2017e 2018e 2019e 2020e
Cost of Equity 4.20% 4.52% 4.83% 5.09% 5.35% thereof risk free 1.00% 1.20% 1.40% 1.55% 1.70% thereof risk premium 3.0% 3.1% 3.2% 3.3% 3.4% thereof Beta factor 0.20% 0.22% 0.23% 0.24% 0.25%
We forecast the FFO cash earnings for the next five years and set these returns in relation to the Cost of Equity to determine an excess re-turn adding to NAV.
WCM adds almost Euro 70m excess return to its NAV within the next five years. The share gained 12% since the beginning of the year and 84% in 2015. However there is still an upside potential of at least more than 10% which is also supported by a shareholders friend-ly dividend policy.

13
19 | May | 2016
WCM Beteiligungs- und Grundbesitz-AG
13 | SRC Equity Research
FFO excess return valuation
Euro '000 2016e 2017e 2018e 2019e 2020eCAGR
2016e - 2019e
FFO 21,787 26,226 30,851 35,479 40,800 17.6%
y-o-y change 151.8% 20.4% 17.6% 15.0% 15.0%
EPRA NAV 327,492 324,351 343,130 360,286 378,301 3.2%
FFO return on NAV 7.05% 8.05% 9.24% 10.09% 11.05% 12.7%
Cost of Equity 4.20% 4.52% 4.83% 5.09% 5.35% thereof risk free 1.00% 1.20% 1.40% 1.55% 1.70% thereof risk premium 3.0% 3.1% 3.2% 3.3% 3.4% thereof Beta factor 0.20% 0.22% 0.23% 0.24% 0.25%
Excess return 2.85% 3.53% 4.41% 5.00% 5.70%
Value creation 9,333 11,439 15,146 18,005 21,556
NPV of value creation 9,169 10,911 14,025 16,188 18,816
EPRA NAV 2016e 327,492
Value creation by excess return (2016e - 2020e) 69,109
EPRA NAV including future value creation (2016e - 2020e) 396,601
Number of shares ('000) 121,965
Fair Value per share (FFO excess return valuation) 3.25 €
Current share price 2.89 €
Upside potential 12.5%
Source: SRC Research

14
19 | May | 2016
WCM Beteiligungs- und Grundbesitz-AG
14 | SRC Equity Research
WCM Beteiligungs- und Grundbesitz AG 31/12 IFRS ('000)
2014 2015 2016e 2017e 2018eCAGR
'15 - '18e
Rental income 0 10,445 29,350 35,514 42,972 60.2%Operating and ancillary costs 0 -885 -1,120 -1,745 -2,210
Net rental income 0 9,560 28,230 33,769 40,762
Unrealized net gains / losses from fair value measurement of investment properties 0 54,904 19,872 17,990 14,560
Other operating income 996 3,012 3,545 3,875 4,120Staff costs -180 -1,530 1,745 1,920 2,150Other operating expenses -1,489 -6715 -8450 -9,578 -10,785
Operating profit (EBITDA) -673 59,231 44,942 47,976 50,807
Depreciation and amortization 0 -359 -410 -430 -450
Operating Profit (EBIT) -673 58,872 44,532 47,546 50,357
Financial income 1 136 312 350 420Financial expenses -209 -2,212 -5,985 -7,045 -8,936Net financial result -208 -2,076 -5,673 -6,695 -8,516
Pre-tax profit (EBT) -881 56,796 38,859 40,851 41,841 -9.7%Tax (cash and deferred) 2,087 879 -2,845 -3,505 -3,635Tax rate n.m. n.m. 7.3% 8.6% 8.7%
Net profit before minorities 1,206 57,675 36,014 37,346 38,206Minorities 0 -3,383 -5,644 -5,721 -5,876Net profit after minorities 1,206 54,292 30,370 31,625 32,330
Number of shares ('000) 15,623 75,664 121,965 121,965 121,965
Earnings per share (EPS) 0.08 0.72 0.25 0.26 0.27
Dividend per share (DPS) 0.00 0.00 0.08 0.10 0.12
in % of FFO result 0.0% 0.0% 46.0% 47.8% 48.6%
EBITDA -673 59,231 44,942 47,976 50,807 -5.0%- revaluations and other adjustments 0 -54,904 -19,872 -17,990 -14,560
Adjusted EBITDA -673 4,327 25,070 29,986 36,247 103.1%
Interest Coverage ratio neg. 2.1 4.4 4.5 4.3
FFO Calculation:
Pre-tax profit -881 56,796 38,859 40,851 41,841
Net revaluation result 0 -54,904 -19,872 -17,990 -14,560
Depreciation and amortisation 0 359 410 430 450
Trading result 0 0 -1,215 -800 -750
Non cash expenses (e.g. increase in provisions) 0 3,260 1,955 1,985 2,020
one off costs 0 3,143 1,650 1,750 1,850
result from interest derivatives 0 0 0 0 0
FFO before tax -881 8,654 21,787 26,226 30,851 52.8%
cash taxes 2,003 879 -1,707 -2,103 -2,181
deferred taxes -2,364 -1,601 1,138 1,402 1,454
FFO after taxes -1,242 7,932 21,218 25,525 30,124 56.0%
FFO per share -0.08 0.10 0.17 0.21 0.25
Shareholders' Equity (without minorities) 30,759 261,359 281,972 301,401 319,095 6.9%Shareholders' Equity (including minorities) 31,809 269,582 290,713 310,443 328,349EPRA NAV n.a. 290,608 327,492 324,351 343,130 5.7%Balance Sheet sum 43,889 550,924 776,803 1,048,684 1,258,421Equity Ratio 72.5% 48.9% 37.4% 29.6% 26.1%RoE (after tax) 8.1% 36.0% 10.8% 10.5% 10.1% -34.5%
Property portfolio 17,337 501,546 707,180 1,004,195 1,255,244Book Value per share (Euro) 1.97 2.14 2.31 2.47 2.62 6.9%NAV per share (Euro) n.a. 2.38 2.69 2.66 2.81 5.7%
15
19 | May | 2016
WCM Beteiligungs- und Grundbesitz-AG
15 | SRC Equity Research
SRC Research
- Der Spezialist für Finanz- und Immobilienaktien -
SRC - Scharff Research und Consulting GmbH
Klingerstr. 23
D-60313 Frankfurt am Main
Germany
Fon: +49 (0)69/ 400 313-80
Mail: [email protected]
Internet: www.src-research.de
Rating chronicle: As this research report is an initiating coverage there is no rating chronicle available.
Please note: The share price mentioned in this report is from 18 May 2016. WCM Beteiligungs- und Grundbesitz-AG mandated SRC Research for covering the WCM share.
Disclaimer © 2016: This equity research report is published by: SRC-Scharff Research und Consulting GmbH, Klingerstr. 23, D-60313 Frankfurt, Germany (short name: SRC Research). All rights reserved. Although we feel sure that all information in this SRC report originates from carefully selected sources withhigh credibility, we cannot give any guarantee for accuracy, trueness and completeness. All opinions quoted in this report give the current judgement of the author which is not necessarily the same opinion as SRC-Scharff Research und Consulting GmbH or another staff member. All the opinions and assessment made inthis report may be changed without prior notice. Within the scope of German regulative framework theauthor and SRC-Scharff Research und Consulting GmbH do not assume any liability for this document or itscontent being used. This report is solely for information purposes and does not constitute a request or an invitation or a recommendation to buy or sell any stock that is mentioned here. Private clients should obtainpersonal advice at their bank or investment house and should keep in mind that prices and dividends of equities can rise and fall and that nobody can give a guarantee of the future development of equities. Theauthor of this report and the SRC-Scharff Research und Consulting GmbH commit themselves on a unsolic-ited basis to having no long or short-positions in equities or derivatives related to equities mentioned in this report. Reproduction, distribution or publishing this report and its content as a whole or in parts is only allowedwith approval of SRC management written form. With acceptance of this document you agree with all regu-lations mentioned here and all general terms and conditions you will find at anytime at our websitewww.src-research.de.