W+cham and Z+b-jets talk
38
Measurement of W+charm, Z → bb and Z+b cross sec5ons in ATLAS Lowx 2014 , Yukawa Ins5tute – Kyoto, 17–21 June Giacomo Snidero for the ATLAS Collabora5on
-
Upload
snidero -
Category
Presentations & Public Speaking
-
view
114 -
download
0
description
Talk on the W+charm, Z->bb and Z+b jets measurements with ATLAS experiment, for the Low x 2014 conference
Transcript of W+cham and Z+b-jets talk
Measurement of W+charm, Z→bb and Z+b cross sec5ons in ATLASLow-‐x 2014 , Yukawa Ins5tute – Kyoto, 17–21 June
Giacomo Snidero for the ATLAS Collabora5on
| G.Snidero | Low-‐x 2014 | 21 Jun
Measurement of the produc?on of a W boson in associa?on with a charm quark
in pp collisions at √s = 7 TeV with the ATLAS detector
2
JHEP 05 (2014) 068

| G.Snidero | Low-‐x 2014 | 21 Jun 0
0.5
1
1.5
2
-310 -210 -1100
0.5
1
1.5
2
NNLOs epWZ free MSTW08 NNLO ABKM09 NNLO
x
d/s
2 = 1.9 GeV2Q
0
0.5
1
1.5
2 ATLAS
W+charm • Produc?on of a W boson with a single charm quark
• LO process is gq → Wc, where q= u, s, b. The s-‐quark ini?ated scaWerings are ≈ 80% in pp collisions at 7 TeV
• W+charm probes the s-‐quark PDF ◦ Loosely constrained by exis?ng data ◦ Strange density is typically suppressed but e.g. an ATLAS QCD analysis of W, Z data suggests
3
s/s W�/W+
c/c
s, s̄/d̄ ⇠ 1
ATLAS-‐epWZ PDF set, PRL 109 (2012) 012001
s̄(x)/d̄(x)
Leading W+charm diagram

| G.Snidero | Low-‐x 2014 | 21 Jun
Measurement Strategy (1/2)• Reconstruct W → eν / µν • Two independent methods for the c-‐quark tagging ◦ Different kinema?c regions ⟹ two fiducial cross sec?on:
4
• Wc-‐jet: c-‐quark semileptonic decay to a muon within a jet – “som muon tagging” (pT(c-‐jet) > 25 GeV, |η|< 2.5)
• WD(*): hadronic decays of D and D* mesons in the tracker (pT(D) > 8 GeV, |η|< 2.2) ◦ D → Kππ ; D* → D0π (D0 → Kπ, Kππ0, Kπππ)
!
�OS�SSfid =
NOS�SSdata �NOS�SS
bkg
L · C
�OS�SSfid (W+c̄) ,�OS�SS
fid (W�c)
�OS�SSfid (Wc-jet) ,�OS�SS
fid (WD(⇤))
s̄/d̄ ⇠ 1
s̄/d̄ < 1
rs ⌘s+ s̄
2d̄= 0.96+0.26
�0.30
R±c ⌘
�OS�SSfid (W+c̄)
�OS�SSfid (W�c)
⇠ s̄+ V 2cd · d̄
s+ V 2cd · d
1
68 W+c production and measurement strategy
The muons originating from the W ! µ ⌫ and c ! µ ⌫ q decays are referred1141
to as W-decay muon and soft muon, respectively. The latter owes its name to the1142
softer energy spectrum with respect to that of a W boson decay. The W boson1143
and the c-quark of the W + c production carry opposite sign charge, W�+ c1144
and W++c ; consequently the W -decay and soft muons have opposite charge, as1145
highlighted in figure 3.5.1146
The identification of a soft muon within a jet is used as the experimental1147
signature of a c-quark. Jets are collimated bunches of particles reconstructed in the1148
detectors which result from the hadronisation of quarks and gluons. The presence1149
of a soft muon is one of the methods used to identify the heavy-flavour jets, which1150
originate from c- or b-quarks. This method is known as soft muon tagging (SMT)1151
and so an identified jet is referred to as an SMT-jet. The definition of reconstructed1152
jets and the description of the SMT algorithm used for this analysis are given in1153
section 4.2.3.1154
s
c
W�
µ+
µ�
⌫̄µ
SMT jet
soft muon
W -muon
⌫q
Figure 3.5: Diagram of the decays used to identify the W +c events in the analysis
of this thesis. The W -decay and the soft muons always carry opposite charge. The
c-quark is identified with the soft muon tagging (SMT) method, i.e. by the presence of
a soft muon within the jet, which is reconstructed from the quark’s hadronisation.
• Data analysed: √s = 7 TeV , ∫Ldt = 4.6 w-‐1 (2011)

| G.Snidero | Low-‐x 2014 | 21 Jun
Measurement Strategy (2/2)• Cross sec?on measured ◦ and their ra?o ◦ Differen?ally in: W-‐decay lepton|η|, jet mul?plicity, pT(D meson)
• Signal yield from difference of OS and SS events (OS-‐SS) ◦ W and c-‐quark produced with opposite charges: signal is mainly OS ◦ Backgrounds largely OS/SS symmetric: for most processes OS ≈ SS
5
�OS�SSfid =
NOS�SSdata �NOS�SS
bkg
L · C
�OS�SSfid (W+c̄) ,�OS�SS
fid (W�c)
s̄/d̄ ⇠ 1
s̄/d̄ < 1
rs ⌘s+ s̄
2d̄= 0.96+0.26
�0.30
R±c ⌘
�OS�SSfid (W+c̄)
�OS�SSfid (W�c)
⇠ s̄+ V 2cd · d̄
s+ V 2cd · d
1
m(D*) -‐ m(D0)
SS eventsOS events

| G.Snidero | Low-‐x 2014 | 21 Jun
• Signal purity ≈ 80%, owing to OS-‐SS event yields
• Signal events yield ◦ WD(*): template fits to D(*) mass distribu?ons ◦ Wc-‐jet: cut-‐and-‐count
• Backgrounds ◦ W+bb/W+cc: cancel out in OS-‐SS events ◦ W+light-‐jets: similar diagram signal, slightly OS/SS asymmetric !
◦ Z+jets: Wc-‐jet , µ channel only ◦ Mul?jet: QCD cc/bb events, slight OS/SS asym. ◦ Top quark, Diboson: small
Signal and Backgrounds
6) [GeV]µ, soft µm( W-decay
0 20 40 60 80 100 120 140O
S-SS
Eve
nts
/ 2.5
GeV
0
100
200
300
400
500
600
700
800DataW+c W+lightZ+jetsMultijetTop+Diboson
ATLAS-1Ldt = 4.6 fb∫ = 7 TeV, s
Wc-jet 1,2 jetsνµ→W
Figure 8. Invariant mass constructed using the four-momenta of the soft muon and the muon fromthe decay of the W -boson candidate.
[GeV]T
SMT jet p30 40 50 60 70 80 90 100 110 120
OS-
SS E
vent
s / 5
GeV
00.20.40.60.8
11.21.41.61.8
22.2
310×
DataW+c W+lightZ+jetsMultijetTop+Diboson
ATLAS-1Ldt = 4.6 fb∫ = 7 TeV, s
Wc-jet 1,2 jetsνµ→W
[GeV]T
Soft muon p5 10 15 20 25 30
OS-
SS E
vent
s / 2
GeV
0
0.5
1
1.5
2
2.5
310×
DataW+c W+lightZ+jetsMultijetTop+Diboson
ATLAS-1Ldt = 4.6 fb∫ = 7 TeV, s
Wc-jet 1,2 jetsνµ→W
Figure 9. Distribution of the SMT jet pT (left) and soft-muon pT (right) in OS–SS events ofthe W+1,2 jets sample for the muon channel. The normalisations of the W+light and Z+jetsbackgrounds and the shape and normalisation of the multijet background are obtained with data-driven methods. All other backgrounds are estimated with MC simulations and normalised to theirtheoretical cross sections. The signal contribution is normalised to the measured yields.
to the measured yields and the background contributions are normalised to the values listedin table 3. The MC simulation is in fair agreement with data.
In addition to the inclusive samples, yields and cross sections are measured in 11 binsof |⌘`|, separately for W
+ and W
�, as is done for the electron channel except that the|⌘`| distribution of the multijet background is derived from the inverted isolation and lowtransverse mass control regions.
– 22 –
W(→µν) + c-‐jet
m( W-‐decay µ, som µ)
72 W+c production and measurement strategy
Diboson. This refer to the production of the ZZ , ZW andW+W� bosons pairs,1231
which can occur in association with jets. An example diagram for the W+W�1232
production is shown in figure 3.6 (d). This process is expected to be OS/SS1233
asymmetric if, for instance, the final state presents a W boson with an oppositely1234
charged c-quark, W+ W� ! W+ cs.1235
(a) (b)
(c) (d)
Figure 3.6: Example of diagrams for the (a) W+cc and W+bb production, (b)
W+light production, (c) multijet cc and bb production, and (d) diboson production.
W+bb/cc produc?on

| G.Snidero | Low-‐x 2014 | 21 Jun
Systema?c Uncertain?es
• Leading uncertain?es: modelling of the c-‐quark decay (acceptance) • W+D(*) slightly smaller systema?cs (but larger data sta?s?cal unc.)
7
and in table 5 for �
OS�SSfid (Wc-jet). Most of the systematic uncertainties either cancel in
the measurement of the ratio R
±c
or are significantly reduced. The remaining systematicuncertainties are shown in table 6 for �
OS�SSfid (W
+D
(⇤)�)/�
OS�SSfid (W
�D
(⇤)+) and table 7
for �
OS�SSfid (W
+c-jet)/�OS�SS
fid (W
�c-jet).
Relative systematic uncertainty in % WD WD
⇤
Lepton trigger and reconstruction⇤ 0.4 0.4Lepton momentum scale and resolution⇤ 0.2 0.2Lepton charge misidentification 0.1 0.1E
missT reconstruction⇤ 0.4 0.4
W background estimation 1.3 1.3Background in WD
(⇤) events 0.7 0.6W efficiency correction 0.6 0.6Tracking efficiency 2.1 2.2Secondary vertex reconstruction efficiency 0.4 0.4D
⇤ isolation efficiency - 2Fitting procedure 0.8 0.5Signal modelling 1.4 1.9Statistical uncertainty on response 0.2 0.2Branching ratio 2.1 1.5Extrapolation to fiducial region 0.8 0.8Integrated luminosity⇤ 1.8 1.8Total 4.3 4.8
Table 4. Summary of the systematic uncertainties on the �
OS�SSfid (WD
(⇤)) measurement. The
uncertainties are given in percent of the measured cross section. Entries marked with an asteriskare correlated between the Wc-jet and WD
(⇤) measurements.
8.1 Common systematic uncertainties
Uncertainties on the basic detector response and its modelling affect both the WD
(⇤) andWc-jet analyses. The trigger and reconstruction efficiencies for electrons and muons arevaried in the simulation within the range of their uncertainties as determined from data,and the WD
(⇤) and Wc-jet cross sections are recalculated. A similar procedure is used toassess the uncertainty due to the lepton momentum scale and resolution. Lepton chargemisidentification effects are also considered. The charge misidentification rates for electronsand muons are given in ref. [18, 63] and are significant only for the electron channel. Uncer-tainties related to the selection and measurement of jets affect primarily the Wc-jet analysisand to a much smaller extent the WD
(⇤) analysis, the latter only via the E
missT reconstruc-
tion. The main sources of uncertainty for jets are due to the jet energy scale (JES) and thejet energy resolution (JER). The impact on the cross-section measurements is evaluated byvarying each of these in the simulation within their respective uncertainties as determinedfrom data. The JES uncertainty ranges from less than 1% to about 7%, depending on
– 26 –
Relative systematic uncertainty in % W (e⌫)c-jet W (µ⌫)c-jetLepton trigger and reconstruction⇤ 0.7 0.8Lepton momentum scale and resolution⇤ 0.5 0.6Lepton charge misidentification 0.2 -Jet energy resolution⇤ 0.1 0.1Jet energy scale 2.4 2.1E
missT reconstruction⇤ 0.8 0.3
Background yields 4.0 1.9Soft-muon tagging 1.4 1.4c-quark fragmentation 2.0 1.6c-hadron decays 2.8 3.0Signal modelling 0.9 0.2Statistical uncertainty on response 1.4 1.4Integrated luminosity⇤ 1.8 1.8Total 6.5 5.3
Table 5. Summary of the systematic uncertainties on the �
OS�SSfid (Wc-jet) measurement. The
uncertainties are given in percent of the measured cross section. Entries marked with an asteriskare correlated between the Wc-jet and WD
(⇤) measurements.
Relative systematic uncertainty in % WD WD
⇤
Lepton reconstruction and identification < 0.1 < 0.1
Background in WD
(⇤) events 0.6 0.4Tracking efficiency 0.2 0.2Statistical uncertainty on response 0.2 0.2Total 0.7 0.5
Table 6. Summary of the significant systematic uncertainties on the measurement of the ratio�
OS�SSfid (W
+D
(⇤)�)/�
OS�SSfid (W
�D
(⇤)+). The uncertainties are given in percent.
jet pT and ⌘ [64], with an additional 2% assigned to charm jets. Together, the JES andJER uncertainties contribute at the few percent level to the Wc-jet cross-section measure-ment. Uncertainties on the lepton and jet momentum scale and resolution are propagatedto the E
missT reconstruction. Additional uncertainties on the E
missT from soft jets (those with
7 GeV< pT < 20GeV) and calorimeter cells not associated with any reconstructed objectsare accounted for separately. The uncertainty on the integrated luminosity is 1.8% [19].
8.2 Systematic uncertainties on WD(⇤)
8.2.1 Tracking efficiency
The primary source of the uncertainty on the tracking efficiency is the potential mismod-elling of the distribution of detector material in the simulation. The amount of material inthe ID is known with a precision of 5% in the central region and up to 15% in the more
– 27 –
Wc-‐jet WD(*)

| G.Snidero | Low-‐x 2014 | 21 Jun
• Measured cross sec?ons compared to aMC@NLO+Herwig++ with 6 PDF sets ◦ CT10, MSTW2008, NNPDF2.3, HERAPDF1.5: ◦ NNPDFcoll2.3, ATLAS-‐epWZ12:
• W+charm data favours PDF sets with non-‐suppressed strange density ◦ Wc-‐jet and WD(*) results are consistent
[pb]fidOS-SSσ
0 10 20 30 40 50 60 70
CT10
MSTW2008
NNPDF2.3
HERAPDF1.5
ATLAS-epWZ12
NNPDF2.3coll
-jetc+WaMC@NLO
ATLAS-1 Ldt = 4.6 fb∫
= 7 TeVs
Data 1.8 [pb]± 0.9 ±33.6
StatStat+syst
[pb]fidOS-SSσ
0 10 20 30 40 50 60 70
CT10
MSTW2008
NNPDF2.3
HERAPDF1.5
ATLAS-epWZ12
NNPDF2.3coll
c-jet-WaMC@NLO
ATLAS-1 Ldt = 4.6 fb∫
= 7 TeVs
Data 1.9 [pb]± 0.8 ±37.3
StatStat+syst
[pb]OS-SSfidσ
5 10 15 20 25 30 35
Data 0.8 [pb]± 1.9 ±17.8
StatStat+syst
-D+W
aMC@NLO
CT10
MSTW2008
NNPDF2.3
HERAPDF1.5
ATLAS-epWZ12
NNPDF2.3coll
ATLAS-1 Ldt = 4.6 fb∫
= 7 TeVs
[pb]OS-SSfidσ
5 10 15 20 25 30 35
Data 1.0 [pb]± 1.8 ±22.4
StatStat+syst
+D-W
aMC@NLO
CT10
MSTW2008
NNPDF2.3
HERAPDF1.5
ATLAS-epWZ12
NNPDF2.3coll
ATLAS-1 Ldt = 4.6 fb∫
= 7 TeVs
[pb]OS-SSfidσ
5 10 15 20 25 30 35
Data 1.0 [pb]± 0.9 ±21.2
StatStat+syst
-D*+W
aMC@NLO
CT10
MSTW2008
NNPDF2.3
HERAPDF1.5
ATLAS-epWZ12
NNPDF2.3coll
ATLAS-1 Ldt = 4.6 fb∫
= 7 TeVs
[pb]OS-SSfidσ
5 10 15 20 25 30 35
Data 1.0 [pb]± 0.8 ±22.1
StatStat+syst
+D*-W
aMC@NLO
CT10
MSTW2008
NNPDF2.3
HERAPDF1.5
ATLAS-epWZ12
NNPDF2.3coll
ATLAS-1 Ldt = 4.6 fb∫
= 7 TeVs
Figure 10. Measured fiducial cross sections compared to various PDF predictions based onaMC@NLO. The solid vertical line shows the central value of the measurement, the inner errorband corresponds to the statistical uncertainty and the outer error band to the sum in quadra-ture of the statistical and systematic uncertainties. The PDF predictions are shown by markers.The inner error bars on the theoretical predictions show the 68% confidence level uncertaintiesobtained from the error sets provided with each PDF set, while the outer error bar represents thetotal theoretical uncertainty (sum in quadrature of PDF, parton shower, fragmentation and scaleuncertainties).
– 35 –
[pb]fidOS-SSσ
0 10 20 30 40 50 60 70
CT10
MSTW2008
NNPDF2.3
HERAPDF1.5
ATLAS-epWZ12
NNPDF2.3coll
-jetc+WaMC@NLO
ATLAS-1 Ldt = 4.6 fb∫
= 7 TeVs
Data 1.8 [pb]± 0.9 ±33.6
StatStat+syst
[pb]fidOS-SSσ
0 10 20 30 40 50 60 70
CT10
MSTW2008
NNPDF2.3
HERAPDF1.5
ATLAS-epWZ12
NNPDF2.3coll
c-jet-WaMC@NLO
ATLAS-1 Ldt = 4.6 fb∫
= 7 TeVs
Data 1.9 [pb]± 0.8 ±37.3
StatStat+syst
[pb]OS-SSfidσ
5 10 15 20 25 30 35
Data 0.8 [pb]± 1.9 ±17.8
StatStat+syst
-D+W
aMC@NLO
CT10
MSTW2008
NNPDF2.3
HERAPDF1.5
ATLAS-epWZ12
NNPDF2.3coll
ATLAS-1 Ldt = 4.6 fb∫
= 7 TeVs
[pb]OS-SSfidσ
5 10 15 20 25 30 35
Data 1.0 [pb]± 1.8 ±22.4
StatStat+syst
+D-W
aMC@NLO
CT10
MSTW2008
NNPDF2.3
HERAPDF1.5
ATLAS-epWZ12
NNPDF2.3coll
ATLAS-1 Ldt = 4.6 fb∫
= 7 TeVs
[pb]OS-SSfidσ
5 10 15 20 25 30 35
Data 1.0 [pb]± 0.9 ±21.2
StatStat+syst
-D*+W
aMC@NLO
CT10
MSTW2008
NNPDF2.3
HERAPDF1.5
ATLAS-epWZ12
NNPDF2.3coll
ATLAS-1 Ldt = 4.6 fb∫
= 7 TeVs
[pb]OS-SSfidσ
5 10 15 20 25 30 35
Data 1.0 [pb]± 0.8 ±22.1
StatStat+syst
+D*-W
aMC@NLO
CT10
MSTW2008
NNPDF2.3
HERAPDF1.5
ATLAS-epWZ12
NNPDF2.3coll
ATLAS-1 Ldt = 4.6 fb∫
= 7 TeVs
Figure 10. Measured fiducial cross sections compared to various PDF predictions based onaMC@NLO. The solid vertical line shows the central value of the measurement, the inner errorband corresponds to the statistical uncertainty and the outer error band to the sum in quadra-ture of the statistical and systematic uncertainties. The PDF predictions are shown by markers.The inner error bars on the theoretical predictions show the 68% confidence level uncertaintiesobtained from the error sets provided with each PDF set, while the outer error bar represents thetotal theoretical uncertainty (sum in quadrature of PDF, parton shower, fragmentation and scaleuncertainties).
– 35 –
W+charm – Results (1/2)
8
|⌘jet| < 2.5). Consequently, the Wc-jet measurement is not combined with the WD
(⇤)
measurement, but is subject to the common averaging procedure using equation (9.1).
�
OS–SSfid [pb]
W
+c-jet 33.6± 0.9 (stat)± 1.8 (syst)
W
�c-jet 37.3± 0.8 (stat)± 1.9 (syst)
W
+D
�17.8± 1.9 (stat)± 0.8 (syst)
W
�D
+22.4± 1.8 (stat)± 1.0 (syst)
W
+D
⇤�21.2± 0.9 (stat)± 1.0 (syst)
W
�D
⇤+22.1± 0.8 (stat)± 1.0 (syst)
Table 8. Measured integrated cross sections times the branching ratio W ! `⌫ in the fiducialregions together with the statistical and systematic uncertainties.
9.2 Theoretical predictions
The theoretical predictions for the cross sections �
OS�SSfid (WD
(⇤)) and �
OS�SSfid (Wc-jet) are
obtained from the aMC@NLO [66] MC simulation that incorporates NLO QCD matrix-element calculations into a parton-shower framework. The aMC@NLO event generator isbased on the MC@NLO formalism [34] and the MadGraph5 framework [69]. The parton-level cross section obtained with aMC@NLO was found to be in good agreement with theprediction obtained using MCFM [70]. Herwig++ [28] is used to model the parton shower,hadronisation and underlying event of the aMC@NLO simulation. The MC predictionsfor the charmed-hadron production fractions are corrected to the average of measurementsobtained in e
+e
� and ep collisions, as compiled in ref. [27]. The uncertainties on theseproduction fractions are 2.4% for the D
⇤ meson and 3.4% for the D meson and are includedin the evaluation of the systematic uncertainty on the prediction.
Events are generated in aMC@NLO using the CT10 NLO PDF set. The dependenceof the results on the choice of PDF set is checked by reweighting the aMC@NLO predic-tions using various NLO and NNLO PDF sets: the CT10, MSTW2008, HERAPDF1.5,NNPDF2.3 and NNPDF2.3coll [71] NLO PDF sets are used in addition to the ATLAS-epWZ12 NNLO PDF set. Asymmetric uncertainties are calculated following the prescrip-tions from the PDF sets.
For MSTW2008 and NNPDF2.3 the s-quark sea is suppressed relative to the d-quarksea for all values of x. The ATLAS-epWZ12 PDF set, which is based on the analysis ofATLAS W and Z cross-section measurements [62] together with HERA data [72], has an s-quark PDF that is not suppressed with respect to the d-quark sea at x ⇠ 0.01. The s-quarksea in CT10 is less suppressed than in MSTW2008 or NNPDF2.3. The NNPDF2.3collPDF set uses only data from HERA, the Tevatron and the LHC, so that the data fromcharm production in neutrino–nucleon scattering are excluded. The s-quark sea of thisPDF is larger than the d-quark sea at most values of x.
Processes with charm quarks in the initial state such as dc ! W
�uc and dc̄ ! W
�uc̄
can contribute to the OS–SS W + c signal if there is an asymmetry in the charm andanti-charm PDFs. The PDF sets studied here do not include a non-perturbative (intrinsic)
– 33 –
W-‐c-‐jet W+D*
s, s̄/d̄ ⇠ 1
�OS�SSfid =
NOS�SSdata �NOS�SS
bkg
L · C
�OS�SSfid (W + c) �OS�SS
fid (W ++c)
s, s̄/d̄ ⇠ 1
s, s̄/d̄ < 1
1

| G.Snidero | Low-‐x 2014 | 21 Jun
x
-310 -210 -110
d)/s =
0.5
(s+
sr
0.50.60.70.80.9
11.11.21.31.41.5
data)*(HERAPDF1.5 + ATLAS Wc-jet/WD
ATLAS-epWZ12HERAPDF1.5
ATLAS W2 = m2Q
Figure 14. Ratio of strange-to-down sea-quark distributions rs = 0.5(s+s)/d as a function of x asassumed in HERAPDF1.5 PDF compared to the ratio obtained from the fit including the ATLASWc-jet/WD
(⇤) data and the ratio obtained from ATLAS-epWZ12. The error band on the ATLASWc-jet/WD
(⇤) measurements represents the total uncertainty. The ratio rs is shown at Q2= m
2W .
sea. Figure 14 also shows that the x-dependence of rs
obtained from the ATLAS-epWZ12PDF is in good agreement with this study.
10 Additional results
10.1 Cross-section ratio �OS�SSfid (WD(⇤))/�fid(W ) differential in pD(⇤)
T
In this section, the measurements of the cross-section ratio �
OS�SSfid (WD
(⇤))/�fid(W ) differ-
ential in p
D
(⇤)T are presented. The measurements are compared in figure 15 to theoretical
predictions obtained from aMC@NLO using the CT10 NLO PDF. The ratio is on average8% higher in data than in simulation. The shape of the p
D
(⇤)T spectrum is reasonably well
described by the MC simulation, although a slight excess in data compared to MC simula-tion is observed in the highest p
D
(⇤)T bin, suggesting that the p
D
(⇤)T spectrum in data might
be slightly harder than the aMC@NLO prediction. The measured integrated cross-sectionratios in the fiducial region are shown in table 10.
�
OS�SSfid (WD
(⇤))/�fid(W ) [%]
W
+D
�0.55± 0.06 (stat)± 0.02 (syst)
W
+D
⇤�0.66± 0.03 (stat)± 0.03 (syst)
W
�D
+1.06± 0.08 (stat)± 0.04 (syst)
W
�D
⇤+1.05± 0.04 (stat)± 0.05 (syst)
Table 10. Measured fiducial cross-section ratios �
OS�SSfid (WD
(⇤))/�fid(W ) together with the sta-
tistical and systematic uncertainty.
– 41 –
W+charm – Results (2/2)• Strange-‐to-‐down sea PDF ra5o, rs(x), constrained from W+charm data exclusively in the HERA1.5 PDF set ◦ The x-‐averaged result consistent withno suppression !!
• Cross sec?on W-‐charge ra?o consistent with (stat. unc. limited)
!!• Differen?al cross sec?ons in W-‐decay lepton|η|, jet mul?plicity and pT(D) in agreement with shapes from all PDF sets
9 c-jet)-(WfidOS-SSσ-jet)/c+(Wfid
OS-SSσ0.4 0.6 0.8 1 1.2 1.4
CT10
MSTW2008
NNPDF2.3
HERAPDF1.5
ATLAS-epWZ12
NNPDF2.3coll
Wc-jetaMC@NLO
ATLAS-1 Ldt = 4.6 fb∫
= 7 TeVs
Data 0.02 ± 0.03 ±0.90
StatStat+syst
)+)*(D-(WOS-SSfidσ)/-)*(D+(WOS-SS
fidσ0.4 0.6 0.8 1 1.2 1.4
Data 0.01± 0.05 ±0.92
StatStat+syst
)*(WDaMC@NLO
CT10
MSTW2008
NNPDF2.3
HERAPDF1.5
ATLAS-epWZ12
NNPDF2.3coll
ATLAS-1 Ldt = 4.6 fb∫
= 7 TeVs
Figure 12. Measured ratios �
OS�SSfid (W
+c-jet)/�OS�SS
fid (W
�c-jet) (left) and
�
OS�SSfid (W
+D
(⇤)�)/�
OS�SSfid (W
�D
(⇤)+) (right) resulting from the averaging procedure com-
pared to various PDF predictions based on aMC@NLO. The blue vertical lines show the centralvalues of the measurements, the inner error bands show the statistical uncertainties and the outererror bands the total experimental uncertainties. The PDF predictions are shown by the blackmarkers. The error bars on the predictions correspond to the 68% CL PDF uncertainties.
R
±c
(Data) to an effect of a strange asymmetry and thereby estimate the sensitivity of thecurrent measurement. Under these assumptions the relative strange asymmetry (A
ss
) canbe written as
A
ss
=
hs(x,Q2)i � hs̄(x,Q2
)ihs(x,Q2
)i ⇡ R
±c
(CT10)�R
±c
(Data), (9.2)
where the s and s distributions are averaged over the phase space. A value of Ass
= (2±3)%
is obtained for the combination of the Wc-jet and WD
(⇤) analyses. The quoted uncertaintyis dominated by statistical uncertainties.
The dependence of the cross section on |⌘`|, along with predictions of aMC@NLO withvarious PDFs, is shown in figure 13. Similar predictions of the shapes of the |⌘`| distributionsare obtained with the various PDF sets. The predictions differ mainly in their normalisation.The predicted shapes are in good agreement with the measured distributions.
In order to perform a quantitative comparison of the measurements and the variousPDF predictions, the �
2 function introduced in equation (9.1) is extended to include theuncertainties on the theoretical predictions:
�
2=
X
k,i
w
i
k
hµ
i
k
�m
i
⇣1 +
Pj
�
i
j,k
b
j
+
Pj
(�
theo)
i
j,k
b
theoj
⌘i2
(�
i
sta,k)2�
k
i
+ (�
i
unc,kmi
)
2+
X
j
b
2j
+
X
j
(b
theoj
)
2, (9.3)
where
�
k
i
= µ
i
k
m
i
0
@1�
X
j
�
i
j,k
b
j
�X
j
(�
theo)
i
j,k
b
theoj
1
A. (9.4)
The notation follows the one introduced in equation (9.1). The matrix (�
theo)
i
j,k
representsthe relative correlated systematic uncertainties on the theory predictions and quantifies
– 37 –
�OS�SSfid =
NOS�SSdata �NOS�SS
bkg
L · C
�OS�SSfid (W + c) �OS�SS
fid (W ++c)
s̄/d̄ ⇠ 1
s̄/d̄ < 1
rs ⌘s+ s̄
2d̄= 0.96+0.26
�0.30
R±c ⌘
�OS�SSfid (W+c̄)
sec (W�c)
1
rs(x)
�OS�SSfid =
NOS�SSdata �NOS�SS
bkg
L · C
�OS�SSfid (W + c) �OS�SS
fid (W ++c)
s̄/d̄ ⇠ 1
s̄/d̄ < 1
rs ⌘s+ s̄
2d̄= 0.96+0.26
�0.30
R±c ⌘
�OS�SSfid (W+c̄)
�OS�SSfid (W�c)
⇠ s̄+ V 2cd · d̄
s+ V 2cd · d
1
R±c
s = s̄

| G.Snidero | Low-‐x 2014 | 21 Jun
Measurement of the cross sec?on of high transverse momentum Z → bb
produc?on in proton-‐proton collisions at √s = 8 TeV with the ATLAS Detector
10
SubmiWed to PLB – arXiv:1404.7042

| G.Snidero | Low-‐x 2014 | 21 Jun
• Z boson decay to a b-‐quark pair in the “boosted” regime (pT>200 GeV) ◦ First LHC measurement of a high-‐pT Z boson + jets fromfully hadronic final state
• Demonstrates the validity of ◦ NLO + parton shower predic?ons for high-‐pT Z boson + jets ◦ Analysis techniques for hadronic decays of boosted objects, relevant for -‐ H → bb and Searches of BSM resonances !
• Can provide benchmark for ATLAS performance ◦ e.g. Z→bb peak to constrain b-‐jet energy scale
• Data analysed ◦ √s = 8 TeV , ∫Ldt = 19.5 w-‐1 (2012) Z
bb
u
u
Z → bb
11Leading Z → bb diagram at the LHC

| G.Snidero | Low-‐x 2014 | 21 Jun
• Select data with 2 b-‐tagged jets (dijet) in 3 to 5 total jets ◦ S/B of few % due to overwhelming QCD mulMjet background
• Quan??es|ηdijet| and Δη(dijet, balancing-‐jet) discriminate signal and background ◦ Signal (qg scaWering) more central η w.r.t. background (mainly gg) ◦ Combined in neural network to define in the data signal region (SR) and control region (CR)
• Signal yield: simultaneous fit to mdijet distribu5ons in CR and SR
• Fit to signal-‐depleted CR determinesmdijet shape of mul?jet background
Measurement Strategy
12NNS
0 0.1 0.2 0.3 0.4 0.5 0.6 0.7 0.8
)N
N(1
/N)(d
N/d
S
0
0.01
0.02
0.03
0.04
0.05
0.06
Databb→Z
ATLAS = 8 TeVs
-1Ldt = 19.5 fb∫
neural network output
CR SR

| G.Snidero | Low-‐x 2014 | 21 Jun
Fit (1/2)
• Signal mdijet distribuMon: sum of 3 gaussians (empirically) ◦ 2 free parameters: normalisa?on in SR and first gaussian peak posi?on ◦ Other params fixed from separate fit to signal MC mdijet distribu?on ◦ In the CR, signal yield frac?on fixed from MC
13
[GeV]dijetm60 70 80 90 100 110 120 130 140 150 160
Even
ts /
5 G
eV
5000
10000
15000
20000
25000Signal Region
Data
Signal + Background
Signalbb→Z
Background
ATLAS = 8 TeVs
-1Ldt = 19.5 fb∫
signal region
[GeV]dijetm60 70 80 90 100 110 120 130 140 150 160
Even
ts /
5 G
eV
10000
20000
30000
40000
50000Control Region
Data
Signal + Background
Signalbb→Z
Background
ATLAS = 8 TeVs
-1Ldt = 19.5 fb∫
control region
mdijet mdijet

| G.Snidero | Low-‐x 2014 | 21 Jun
Fit (2/2)• Background mdijet distribuMons: ◦ Mul?jet: 7th order polynomial shape (CR fit) -‐ 9 free params: polynomial coefficients and normalisa?ons in CR & SR
◦ Wbar, W → qq’, Z → cc: small, gaussians fiWed in MC mdijet distribu?ons
!• Binned maximum likelihood fit ◦ Total of 11 parameters ◦ Simultaneously fit in SR and CR ◦ Signal yield extracted6400 ± 600 (stat. unc.) from ≈ 3M events
14
[GeV]dijetm60 70 80 90 100 110 120 130 140 150 160
(Dat
a - B
ackg
roun
d) /
5 G
eV
-500
0
500
1000
1500
2000Signal Region
Data
Signalbb→Z
ATLAS = 8 TeVs
-1Ldt = 19.5 fb∫
signal region: data -‐ bkg
mdijet

| G.Snidero | Low-‐x 2014 | 21 Jun
Systema?c Uncertain?es
15
Systematic Uncertainties Systematic uncertainties enter in two ways
By affecting the signal yield determination: �NZbb By affecting the acceptance correction: �CZbb
19 24th March 2014 David Wardrope
Source of uncertainty �NZ!bb(%) �CZ!bb(%) ��fidZ!bb
(%)
Jet Energy Scale +3.0/-1.5 ±8.4 +6.5/-5.0Jet Energy Resolution ±5.3 ±0.2 ±5.1b-tagging ±0.1 ±3.6 ±3.6Trigger Modelling N/A ±6 ±6Control Region Bias +4.9/-5.5 N/A +4.9/-5.5Signal SNN Modelling ±0.9 ⌥2.0 ±2.9Signal mdijet Shape ±2.2 N/A ±2.2Z! cc Normalisation ±0.4 N/A ±0.4tt Normalisation ±1.2 N/A ±1.1W!qq0 Normalisation ±1.0 N/A ±1.0
Table 1: The relative systematic uncertainties on NZ!bb, CZ!bb and �fidZ!bb
from each of the sources of uncertainty considered.
estimate of the uncertainty on the measurement due to possible325
mis-modelling of the mdijet shape in the MC signal.326
The impact from the uncertainty on the W!qq0 and tt nor-327
malisations are each assessed by conservatively varying the328
fixed number of events in the Signal and Control Regions in-329
dependently by 50%, and repeating the EML fit.330
8. Results, cross-checks and theoretical predictions331
Using the extracted Z!bb yield, the estimated signal e�-332
ciency correction factor and the integrated luminosity of the333
dataset, the cross section in the fiducial region defined in Sec-334
tion 5 is measured to be335
�fidZ!bb
= 2.02 ± 0.20 (stat.) ± 0.25 (syst.) ± 0.06 (lumi.) pb336
The total systematic uncertainty is the result of adding337
in quadrature all the individual systematic uncertainties on338
�fidZ!bb
listed in Table 1. It is further found that the signal339
mdijet peak position is consistent with the Z!bb expectation:340
�MZ = �1.5 ± 0.7 (stat.)+3.4�2.5 (syst.) GeV341
The robustness of the measurement is supported by several342
cross-checks and complementary studies. In particular, a con-343
sistent cross section measurement is obtained by applying a344
tighter b-tagging selection (with an e�ciency of 60% for tag-345
ging b-jets in a MC sample of tt events) or when the require-346
ment on pdijetT is raised to 250 GeV or 300 GeV. Furthermore,347
when the same methodology is repeated on two independent348
classes of events, those accepted by the dominant trigger de-349
scribed above and all other events, both measured cross sec-350
tions are fully consistent with the baseline measurement, even351
though the mdijet distributions are significantly di↵erent in the352
two classes of events. Finally, repeating the analysis with a353
number of alternative functional forms for the empirical de-354
scription of the background shape (such as a Lognormal func-355
tion convoluted with a 4th order Bernstein polynomial) leads to356
negligible variations in the measured cross section compared to357
the systematic uncertainties of the measurement.358
The measured cross section is compared to the particle-level,359
NLO-plus-parton-shower predictions of two MC generators,360
POWHEG and aMC@NLO, in the same fiducial region. In361
both cases, the cross section of the Z + 1 jet process is calcu-362
lated to NLO accuracy. For aMC@NLO, the Z decay is sim-363
ulated with MadSpin [36]. POWHEG is interfaced to Pythia364
for parton showering, hadronisation and underlying event con-365
tributions, whilst aMC@NLO is interfaced to Herwig++ [8].366
The particle-level predictions are then formed by applying to367
the generated events the fiducial selection defined in Section 5.368
The predicted cross sections are:369
POWHEG : �fidZ!bb
= 2.02 +0.25�0.19(scales) +0.03
�0.04(PDF) pb
aMC@NLO : �fidZ!bb
= 1.98 +0.16�0.08(scales) ± 0.03(PDF) pb .
Both generators use the CT10 PDF set for the central value of370
the prediction, and the renormalisation and factorisation scales371
are set to the pT of the Z boson. The uncertainty due to the372
ambiguity in the renormalisation and factorisation scales is es-373
timated by doubling or halving them simultaneously. The PDF374
uncertainty is evaluated by varying the 52 PDFs in the CT10375
NLO error set following the Hessian method and rescaling to376
the 68% confidence level. Within the experimental and theo-377
retical uncertainties, both predictions are completely consistent378
with the measured cross section.379
POWHEG and aMC@NLO can also be used to provide380
an indication for the fraction of the total cross section for381
Z!bb production at the LHC, with pT > 200 GeV, that is382
contained within the measured fiducial region. The ratio of383
the above cross sections to the cross sections calculated with-384
out applying any particle-level requirements, only requiring385
pT > 200 GeV for the Z boson before parton showering, is 0.53386
for POWHEG and 0.47 for aMC@NLO, indicating that a good387
fraction of the total Z production cross section is included in the388
fiducial region of the measurement. The acceptance decreases389
for Z boson pT > 400 GeV since the likelihood for the Z de-390
cay products to be resolved as two separate anti-kt R = 0.4 jets391
decreases.392
6
Jet energy calibra?on affectsboth fit and acceptance
Modelling of the jet triggers efficiency (acceptance)
CR defini?on changes mul?jet mdijet distribu?on

| G.Snidero | Low-‐x 2014 | 21 Jun
Z→bb – Result• Measured cross sec?on !!!!
• Data in agreement with two NLO + Parton Shower predic5ons !!!!!!!!◦ Independent ME generator and PS simula?on ◦ CT10 PDF set
16
Z�bb Results
Measured fiducial cross-section
17 28th November 2013 David Wardrope
October 14, 2013 – 16 : 01 DRAFT 22
4 Cross-Section Definition424
Our measured cross-section �Z!bb is defined in terms of particle-level b-jets: anti�kT R = 0.4 jets that425
are clustered from stable hadrons, and that contain at least one stable B-hadron with p
T
> 5 GeV and �R426
< 0.3 from the jet axis. We measure the cross-section for Z!bb production where two such b-jets result427
from the Z!bb decay that have:428
• Individual b-jet p
T
> 40 GeV.429
• Individual b-jet |⌘| < 2.5.430
• Magnitude of the vectorial sum of the two b-jets momenta in the transverse plane (pjet1 + pjet2)T
>431
200 GeV.432
• �R(jet1,jet2) < 1.2.433
• Invariant mass (mdijet), that satisfies 60 < mdijet < 160 GeV.434
The cross-section is extracted from the measured yield of Z!bb events in the data NZ!bb as follows:435
�Z!bb =NZ!bb
L ·CZ!bb(2)
Where CZ!bb is the acceptance correction factor to unfold our detector-level Z!bb yield to the particle-436
level (see Section 6) and L is the luminosity of our data sample.437
Theoretical predictions in good agreement with each other and with measurement
October 14, 2013 – 16 : 01 DRAFT 67
+ 1 jet process is calculated to NLO accuracy, with a minimum cut on the transverse momentum of the1027
Z boson at Born-level of 180 GeV. For aMC@NLO the Z decay is simulated with MadSpin. POWHEG1028
is interfaced to Pythia 8 for parton showering, hadronisation and underlying event contributions, whilst1029
aMC@NLO is interfaced to Herwig++. The particle-level predictions are then formed by applying the1030
same fiducial selection to the generated events as described in Section 4. The predicted cross-sections1031
are:1032
POWHEG + Pythia 8: �Z!bb = 2.02+0.25�0.19 (scales) +0.03
�0.04 (PDF) pb1033
aMC@NLO + Herwig++: �Z!bb = 1.98+0.16�0.08 (scales) ±0.03 (PDF) pb1034
Both generators use the CT10 p.d.f for the central value of the prediction. The errors from the p.d.f are1035
evaluated by running over the 52 eigenvector p.d.f’s and adding in quadrature the maximum deviation1036
of each of the pairs of variations and then applying a scaling factor to go from 90% CL to 68% CL.1037
This error is found to be 1-2%. The factorisation and renormalisation scales for both POWHEG and1038
aMC@NLO are the p
T
of the Z boson. These scales are varied simultaneously by a factor of 2.0 and1039
0.5 in order to evaluate the uncertainty in the prediction coming from the choice of these scale values.1040
These scale uncertainties are ⇠10-12% and thus completely dominated over the p.d.f uncertainty. Both1041
predictions are consistent with the measured cross-section to within the errors on the measurement and1042
theory.1043
Predictions have also been produced with the alternative NLO PDF sets; MSTW2008 and NNPDF2.3.1044
The error on MSTW is evaluated with the same method as with CTEQ but without the scaling from 90%1045
CL needing to be applied since the eigenvectors are already done for 68% CL. For NNPDF the error is1046
the standard deviation of the 100 replica PDFs.1047
POWHEG + Pythia 8, CTEQ10: �Z!bb = 2.02+0.03�0.04 (PDF) pb1048
POWHEG + Pythia 8, MSTW2008: �Z!bb = 2.11 ± 0.02 (PDF) pb1049
POWHEG + Pythia 8, NNPDF 2.3: �Z!bb = 2.07 ± 0.01 (PDF) pb1050
aMC@NLO + Herwig++, CTEQ10: �Z!bb = 1.98 ± 0.03 (PDF) pb1051
aMC@NLO + Herwig++, MSTW2008: �Z!bb = 2.10 ± 0.02 (PDF) pb1052
November 27, 2013 – 12 : 04 DRAFT 63
9 Results and Theoretical Predictions891
The final measured cross-section �Z!bb is assembled from our fitted Z!bb yield NZ!bb and calculatedacceptance correction factor CZ!bb using Equation 2. This gives a cross-section of:
�Z!bb = 2.02 ± 0.21 (stat.) +0.29�0.26 (syst.) ± 0.06 (lumi.) = 2.02 +0.37
�0.34 pb
�Z!bb = 2.02 ± 10.6% (stat.) +14.5%�12.9% (syst.) ± 2.8% (lumi.) = 2.02 +18.2%
�16.9% pb
Where the statistical error is the result of propagating the error on NZ!bb returned by the fit, the lumi-892
nosity error is the result of propagating the 2.8% error on the integrated luminosity, and the systematic893
error is the result of propagating the systematic errors on NZ!bb and CZ!bb reported in Tables 6 and 13894
respectively. In propagating the systematic errors to the cross-section the correlation of the impact of a895
particular systematic source on NZ!bb and CZ!bb has correctly been taken into account. In Table 17 a896
summary of the impact of each systematic source on NZ!bb , CZ!bb and �Z!bb is shown. The impact of897
the “Signal SNN modelling” systematic source on NZ!bb and CZ!bb is assumed to be anti-correlated.898
This is the most conservative assumption, and also likely to be true since a systematic mis-modelling of899
SNN by the signal MC which increases CSNNZ!bb
is likely to reduce R
Z
.900
In addition to the cross-section measurement, we also report the consistency of the observed particle-901
level Z!bb mass peak position with the PDG Z mass. This is evaluated as the di↵erence between the902
central Gaussian mean in the signal MC model, and the central Gaussian mean as fitted in the data using903
the same signal MC model, �MZ. We observe a �MZ of -1.48 ± 0.76 (stat.) ± 3.77 (sys.) GeV, where904
the systematic is dominated by the uncertainty in the MC jet energy scale (± 3.7 GeV). To within these905
uncertainties we are thus entirely consistent with the expectation of �MZ =0.0 for a true Z!bb resonance906
obeservation.907
The measured cross-section is compared to two di↵erent particle-level NLO plus parton shower908
Monte Carlo generator predictions, one from POWHEG and one from aMC@NLO. In each case the Z909
+ 1 jet process is calculated to NLO accuracy, with a minimum cut on the transverse momentum of the910
Z boson at Born-level of 180 GeV. For aMC@NLO the Z decay is simulated with MadSpin. POWHEG911
is interfaced to Pythia 8 for parton showering, hadronisation and underlying event contributions, whilst912
aMC@NLO is interfaced to Herwig++. The particle-level predictions are then formed by applying the913
same fiducial selection to the generated events as described in Section 4. The predicted cross-sections914
are:915
POWHEG + Pythia 8: �Z!bb = 2.02+0.25�0.19 (scales) +0.03
�0.04 (PDF) pb916
aMC@NLO + Herwig++: �Z!bb = 1.98+0.16�0.08 (scales) ±0.03 (PDF) pb917
Both generators use the CT10 p.d.f for the central value of the prediction. The errors from the p.d.f are918
evaluated by running over the 52 eigenvector p.d.f’s and adding in quadrature the maximum deviation919
of each of the pairs of variations and then applying a scaling factor to go from 90% CL to 68% CL.920
This error is found to be 1-2%. The factorisation and renormalisation scales for both POWHEG and921
aMC@NLO are the p
T
of the Z boson. These scales are varied simultaneously by a factor of 2.0 and922
0.5 in order to evaluate the uncertainty in the prediction coming from the choice of these scale values.923
These scale uncertainties are ⇠10-12% and thus completely dominated over the p.d.f uncertainty. Both924
predictions are consistent with the measured cross-section to within the errors on the measurement and925
theory.926
Predictions have also been produced with the alternative NLO PDF sets; MSTW2008 and NNPDF2.3.927
The error on MSTW is evaluated with the same method as with CTEQ but without the scaling from 90%928
No
trev
iew
ed
,fo
rin
tern
al
circu
la
tio
no
nly
ATLAS Draft
Measurement of the cross-section of high
transverse momentum Z ! bb production in
proton-proton collisions at
ps = 8 TeV with the
ATLAS Detector
STDM-2013-04
Version: 2.0
To be submitted to: Phys. Lett. B.
Supporting internal notes
ATL-COM-PHYS-2013-606 https://cds.cern.ch/record/1546679/
Comments are due by: Friday, 4th April 2014
Abstract
This letter reports the observation of a high transverse momentum Z!bb signal in proton-proton collisions atp
s = 8 TeV and the measurement of its production cross section. The data analysed were collected in 2012with the ATLAS detector at the LHC and correspond to an integrated luminosity of 19.5 fb�1. The Z!bb decayis reconstructed from a pair of b-tagged jets, clustered with the anti-kt jet algorithm with R = 0.4, that have low
angular separation and form a dijet with pT > 200 GeV. The signal yield is extracted from a fit to the dijetinvariant mass distribution, with the dominant, multi-jet background mass shape estimated employing a fully
data-driven technique that reduces the dependence of the analysis on simulation. The fiducial cross section isdetermined to be
�fidZ!bb
= 2.02 ± 0.20 (stat.) ± 0.25 (syst.) ± 0.06 (lumi.) = 2.02 ± 0.33 pb
in good agreement with next-to-leading-order theoretical predictions.
document created on March 28, 2014 from file ztobb.tex
cover page automatically created with atlascover.sty

| G.Snidero | Low-‐x 2014 | 21 Jun
Measurement of differen?al produc?on cross sec?ons for a Z boson in
associa?on with at least one or two b-‐jets in 7 TeV proton-‐proton collisions
with the ATLAS detector
17
To be submiWed to JHEP

| G.Snidero | Low-‐x 2014 | 21 Jun
Z+b• Produc?on of a Z/γ* → ee/µµ decay in associa?on with b-‐jets • Test predic?ons of pQCD for heavy-‐flavour quark produc?on ◦ 4FNS vs 5FNS flavour number schemes and b-‐quark PDFs ◦ NLO (MCFM, aMC@NLO) vs LO mul?-‐leg (Algen, Sherpa)
• Background for ◦ (ZH) → bb and BSM searches !!
• Measured unfolded differen5al cross sec?ons in 12 kinema5c variables ◦ Z boson with ≥1 or ≥2 b-‐jets ◦ e.g. ΔR(b-‐jet,b-‐jet), y(Z), pT(Z), …
• Data analysed: √s = 7 TeV, ∫Ldt = 4.6 w-‐1 (2011)
18
No
trev
iew
ed
,fo
rin
tern
al
circu
latio
no
nly
b
b
Z
g
(a)
q
q
b
b
Z
(b)
q Z
b
bq
(c)
Figure 1. Leading order Feynman diagrams contributing to Z+ ≥ 1 b-jet and Z+ ≥ 2 b-jetsproduction. Process 1(a) is only present in a 5FNS calculation, while 1(b) and 1(c) are present inboth a 4FNS and 5FNS calculation.
also an important background to ZH associated Higgs boson production with H → bb̄, as13
well as for potential signatures of physics beyond the Standard Model containing leptons14
and b-jets in the final state.15
There has been much progress on the theoretical calculations in recent years, and16
two schemes are generally employed in perturbative QCD (pQCD) calculations containing17
heavy flavour quarks. One is the four-flavour number scheme (4FNS), which only considers18
parton densities from gluons and the first two quark generations in the proton. The other is19
the five-flavour number scheme (5FNS), which allows a b-quark density in the initial state20
and raises the prospect that measurements of heavy flavour production could constrain the21
b-quark parton density function (PDF) of the proton. In a calculation to all orders, the22
4FNS and 5FNS methods must give identical results; however, at a given order differences23
can occur between the schemes. A recent discussion on the advantages and disadvantages24
of each can be found in Ref. [2].25
Next-to-leading-order (NLO) matrix element calculations in both the 4FNS and 5FNS26
have been available for associated Z+b production at parton-level for a number of years27
[3–5], with example leading order (LO) Feynman diagrams shown in figure 1 to illustrate28
some of the basic processes that contribute. Full particle-level predictions have existed at29
LO for some time, obtained by matching parton shower generators to LO multi-leg matrix30
elements in the 4FNS [6, 7], 5FNS [8], or both [9]. More recently, a full particle-level31
prediction at NLO in the 4FNS with matched parton shower [10] has become available,32
and can be extended to a 5FNS prediction as well. The differences in approach in each of33
these calculations gives a range of theoretical predictions to be tested in comparisons to34
data.35
Differential measurements of Z+b-jets production have been made in proton-antiproton36
collisions at√s=1.96TeV by the CDF and D0 experiments [11, 12] as well as inclusively37
in√s=7TeV proton-proton collisions at the LHC by the ATLAS and CMS experiments38
[13, 14]. The results presented in this paper significantly extend the scope of the previous39
ATLAS measurement by taking advantage of the full sample of√s = 7TeV proton-proton40
collisions recorded in 2011, corresponding to an integrated luminosity of 4.6 fb−1, and by41
using improved methods for b-jet efficiency determination to cover a wider kinematic region.42
The larger data sample allows the first differential production cross-section measurements43
– 2 –
No
trev
iew
ed
,fo
rin
tern
al
circu
la
tio
no
nly
b
b
Z
g
(a)
q
q
b
b
Z
(b)
q Z
b
bq
(c)
Figure 1. Leading order Feynman diagrams contributing to Z+ ≥ 1 b-jet and Z+ ≥ 2 b-jetsproduction. Process 1(a) is only present in a 5FNS calculation, while 1(b) and 1(c) are present inboth a 4FNS and 5FNS calculation.
also an important background to ZH associated Higgs boson production with H → bb̄, as13
well as for potential signatures of physics beyond the Standard Model containing leptons14
and b-jets in the final state.15
There has been much progress on the theoretical calculations in recent years, and16
two schemes are generally employed in perturbative QCD (pQCD) calculations containing17
heavy flavour quarks. One is the four-flavour number scheme (4FNS), which only considers18
parton densities from gluons and the first two quark generations in the proton. The other is19
the five-flavour number scheme (5FNS), which allows a b-quark density in the initial state20
and raises the prospect that measurements of heavy flavour production could constrain the21
b-quark parton density function (PDF) of the proton. In a calculation to all orders, the22
4FNS and 5FNS methods must give identical results; however, at a given order differences23
can occur between the schemes. A recent discussion on the advantages and disadvantages24
of each can be found in Ref. [2].25
Next-to-leading-order (NLO) matrix element calculations in both the 4FNS and 5FNS26
have been available for associated Z+b production at parton-level for a number of years27
[3–5], with example leading order (LO) Feynman diagrams shown in figure 1 to illustrate28
some of the basic processes that contribute. Full particle-level predictions have existed at29
LO for some time, obtained by matching parton shower generators to LO multi-leg matrix30
elements in the 4FNS [6, 7], 5FNS [8], or both [9]. More recently, a full particle-level31
prediction at NLO in the 4FNS with matched parton shower [10] has become available,32
and can be extended to a 5FNS prediction as well. The differences in approach in each of33
these calculations gives a range of theoretical predictions to be tested in comparisons to34
data.35
Differential measurements of Z+b-jets production have been made in proton-antiproton36
collisions at√s=1.96TeV by the CDF and D0 experiments [11, 12] as well as inclusively37
in√s=7TeV proton-proton collisions at the LHC by the ATLAS and CMS experiments38
[13, 14]. The results presented in this paper significantly extend the scope of the previous39
ATLAS measurement by taking advantage of the full sample of√s = 7TeV proton-proton40
collisions recorded in 2011, corresponding to an integrated luminosity of 4.6 fb−1, and by41
using improved methods for b-jet efficiency determination to cover a wider kinematic region.42
The larger data sample allows the first differential production cross-section measurements43
– 2 –
examples of Z+b diagrams

| G.Snidero | Low-‐x 2014 | 21 Jun CombNNc∑
-10 -5 0 5 10 15 20
Entri
es /
1.5
0
20
40
60
80
100
120ATLAS Preliminary
R(b,b)<5.0∆3.2<
-1 = 7TeV, 4.6 fbsData Z+bbZ+non-bbnon-Z backgrounds
CombNNc
-4 -2 0 2 4 6 8 10
Entri
es /
0.66
0
500
1000
1500
2000
2500 ATLAS Preliminary1.2<|y(Z)|<1.6
-1 = 7TeV, 4.6 fbsData Z+bZ+non-bnon-Z backgrounds
• Major backgrounds are Z+c-‐jets and Z+light-‐jets
• Template fits to distribuMon discriminaMng the “jet-‐flavour” ◦ Neural network with input secondary ver?ces and displaced tracks informa?on discriminates “real” and fake b-‐tagged jets selected in data
◦ Signal and Z+non-‐b background shapes from MC -‐ non-‐Z background (top quark, mul?jet, diboson) are fixed
Strategy
19 neural network output fit data in each bin of σ(Z+b)

| G.Snidero | Low-‐x 2014 | 21 Jun
Systema?c Uncertain?es
20
No
trev
iew
ed
,fo
rin
tern
al
circu
la
tio
no
nly
Source of
uncertainty σ(Zb)[%] σ(Zbb)[%]
b-jet tagging efficiency 3.4 9.8
c-jet mistag rate 0.2 2.3
light-jet mistag rate 0.4 0.0
JES 2.9 4.7
JER 0.3 0.7
b-jet template shape 4.8 4.8
c-jet template shape 0.2 0.6
light-jet template shape 0.9 0.9
b-jet template scale factor N/A 2.3
MPI 2.5 0.8
gluon splitting 1.2 1.5
background normalisation 1.1 3.6
tt̄ modelling 0.0 2.9
MC sample size 1.0 1.4
lepton scale and resolution 1.2 1.2
EmissT 0.0 0.6
luminosity 1.8 1.8
total 7.7 14.0
Table 3. Summary of systematics uncertainties for integrated event-level fiducial cross-sections forZ+ ≥ 1 b-jet and Z+ ≥ 2 b-jets events.
rected for the effects of QED final-state radiation (FSR), hadronisation, underlying event553
and MPI. The correction for QED FSR is obtained using Photos, interfaced to the Alp-554
gen+Herwig+Jimmy samples used in the data analysis, and evaluated by comparing555
the cross-sections obtained taking leptons before and after FSR. The correction factor for556
hadronisation, underlying event and MPI is obtained for each differential cross-section from557
both Pythia and Sherpa, by taking the ratio of the predictions with these effects turned558
on and turned off. Pythia 6.427 is used, with the CTEQ5L PDF set and the Perugia 2011559
tune, and Sherpa 1.4.1 is used with the CT10 PDF set. Differences between the correction560
factors obtained in Pythia and Sherpa, which are typically at the 1%-level, as well as the561
50% uncertainty on MPI described in section 8, are assigned as a systematic uncertainty.562
A full NLO particle-level prediction is also obtained using amc@nlo [56], in both the563
4FNS and 5FNS. In the 4FNS, the Z+ ≥ 2 b-jets process is calculated at NLO, including564
the effects of the b-quark mass, interfaced to the MSTW08NLO nf4 PDF. For the 5FNS565
prediction, the more inclusive Z+≥ 1-jet process is calculated at NLO, neglecting the b-566
quark mass, and using the MSTW08NLO PDF set. In both cases, Herwig++ is used to567
simulate the hadronisation, underlying event and MPI. Both predictions require a correc-568
tion for a missing component of MPI, in which the Z boson and b-quarks are produced569
in separate scatters within the pp collision. This correction is estimated using the fully570
– 18 –
Jet energy scale modifies jet-‐flavour discriminant shapes and unfolding
MC corrected for b-‐taggingefficiency measured in data
Signal MC shape is checked inb-‐jets from Wbar-‐enriched control data sample

| G.Snidero | Low-‐x 2014 | 21 Jun (Zbb) [pb]σ
0 0.1 0.2 0.3 0.4 0.5 0.6
(stat.)-1 = 7 TeV, 4.6 fbsData 2011 syst.)⊕ (stat.-1 = 7 TeV, 4.6 fbsData 2011
NLO MSTW2008⊗MCFM CT10⊗MCFM NNPDF2.3⊗MCFM
MSTW2008⊗aMC@NLO 4FNS MSTW2008⊗aMC@NLO 5FNS
LO multileg CT10⊗SHERPA
CTEQ6L1⊗ALPGEN+HJ
ATLAS Preliminary2 b-jet≥Z+
(Zb) [pb]σ
0 1 2 3 4 5 6
(stat.)-1 = 7 TeV, 4.6 fbsData 2011 syst.)⊕ (stat.-1 = 7 TeV, 4.6 fbsData 2011
NLO MSTW2008⊗MCFM CT10⊗MCFM NNPDF2.3⊗MCFM
MSTW2008⊗aMC@NLO 4FNS MSTW2008⊗aMC@NLO 5FNS
LO multileg CT10⊗SHERPA
CTEQ6L1⊗ALPGEN+HJ
ATLAS Preliminary1 b-jet≥Z+
Z+b – Results (1/3)• MCFM with various 5FNS PDF sets ◦ All in agreement with data ◦ used MSTW2008, CT10, NNPDF2.3 ◦ Corrected to par?cle level with Pythia and Sherpa
• aMC@NLO + Herwig++ with 4FNS or 5FNS PDFs (MSTW2008)
◦ Z+ ≥1 b-‐jet: 5FNS favoured, 4FNS underes?mates data
◦ Z+ ≥2 b-‐jets: opposite of the above !!• LO mul?-‐leg Alpgen, Sherpa ◦ underes?mate data, but theory uncertain?es not included
21
σ(Z+ ≥1-‐bjet)
σ(Z+ ≥2-‐bjets)

| G.Snidero | Low-‐x 2014 | 21 Jun
[pb]
d(|y
(Z)|)
(Zb)
σd
0.5
1
1.5
2
2.5
3
3.5
4
4.5-1 = 7 TeV, 4.6 fbsData
MSTW2008⊗MCFM NNPDF2.3⊗MCFM CT10⊗MCFM
ATLASPreliminary 1 b-jet≥Z+
|y(Z)|0 0.5 1 1.5 2 2.5
Dat
aN
LO
0.8
1
1.2
1.4
Z+b – Results (2/3)
22
• dσ(Z+ ≥1-‐bjets) / dy(Z) :PDFs differences small w.r.t. scale uncertainty
0.5 1 1.5 2 2.5 3 3.5 4 4.5 5
[pb]
R(b
,b)
∆d(Z
bb)
σd
0.05
0.1
0.15
0.2
0.25
0.3aData
-1 = 7 TeV, 4.6 fbsMCFMaMC@NLO 5FNSaMC@NLO 4FNSALPGEN+HJSHERPA
ATLASPreliminary 2 b-jets≥Z+
0.5 1 1.5 2 2.5 3 3.5 4 4.5 5
Dat
aN
LO
0.5
1
R(b,b)∆0.5 1 1.5 2 2.5 3 3.5 4 4.5 5
Dat
aLO
mul
tileg
0.40.60.8
11.2
4 examples of differen?al σ(Z+b)
• dσ(Z+ ≥2-‐bjets) / dΔR(b-‐jet,b-‐jet) :NLO underes?mate small ΔR

| G.Snidero | Low-‐x 2014 | 21 Jun
Z+b – Results (3/3)
23
0 0.2 0.4 0.6 0.8 1 1.2 1.4 1.6 1.8 2 2.2 2.4
[pb]
b-je
ts/N
d(b-
jet |
y|)
(Zb)
σd
0.5
1
1.5
2
2.5
3
3.5
4aData
-1 = 7 TeV, 4.6 fbsMCFMaMC@NLO 5FNSaMC@NLO 4FNSALPGEN+HJSHERPA
ATLASPreliminary 1 b-jet≥Z+
0 0.2 0.4 0.6 0.8 1 1.2 1.4 1.6 1.8 2 2.2 2.4
Dat
aN
LO
0.60.8
11.21.4
b-jet |y|0 0.2 0.4 0.6 0.8 1 1.2 1.4 1.6 1.8 2 2.2 2.4
Dat
aLO
mul
tileg
0.40.60.8
11.2
• dσ(Z+ ≥1-‐bjet) / dy(b-‐jet) :4FNS underes?mate central rapidity
• dσ(Z+ ≥1-‐bjet) / dpT(Z) :discrepancies at high/low Z-‐pT
[pb/
GeV
](Z
))T
d(p(Z
b)σd
-410
-310
-210
-110
aData-1 = 7 TeV, 4.6 fbs
MCFMaMC@NLO 5FNSaMC@NLO 4FNSALPGEN+HJSHERPA
ATLASPreliminary 1 b-jet≥Z+
Dat
aN
LO
0.5
1
1.5
2
(Z) [GeV]T
p4 5 6 10 20 30 210 210×2
Dat
aLO
mul
tileg
0.40.60.8
11.2

| G.Snidero | Low-‐x 2014 | 21 Jun
ConclusionsPresented ATLAS measurements for the produc?on cross sec?on of !• W+charm ◦ Data favours PDF sets with non-‐suppressed s-‐quark density ◦ Consistent results using two complementary c-‐quark tagging methods
• Z→bb ◦ Measured high-‐pT Z boson + jets in fully hadronic final state ◦ NLO + parton shower predic?ons in agreement with data
• Z+b ◦ Measured unfolded cross sec?ons in 12 kinema?c variables ◦ Various NLO and LO predic?ons in overall agreement with data, excep?ons is selected regions
24

| G.Snidero | Low-‐x 2014 | 21 Jun
Extra
25

| G.Snidero | Low-‐x 2014 | 21 Jun
ATLAS detector
26
The ATLAS Detector
15
• The measurements presented here utilise the inner tracker, calorimeter and muon chamber components.

| G.Snidero | Low-‐x 2014 | 21 Jun
W+charm: s-‐quark densi?es
27
No
trev
iew
ed
,fo
rin
tern
al
circu
la
tio
no
nly
November 15, 2013 – 11 : 44 DRAFT 13
parton momentum fraction x-510 -410 -310 -210 -110
)d/s fr
actio
n of
ant
i-stra
nge
to a
nti-d
own
quar
ks (
0
0.5
1
1.5
2
2.5NNPDF2.3 collider onlyCT10NNPDF2.3epWZMSTW2008HERA1.5
Figure 2: Depicted is the ratio of the anti-strange to the anti-down quark PDF distribution for di↵erentPDFs evaluated at the scale Q2 = M2
W = (80.385GeV)2. This is a measure of di↵erences in the partondistributions for strange and down sea quarks. The range in x relevant for the measurement presentedin here is from 10�1 to 10�3. If no error bands are present, the PDF set in question fixes this fractionwithout assigning an uncertainty.
s̄(x)/d̄(x)
measurement sensi?ve to x range 10-‐3 – 10-‐1
| G.Snidero | Low-‐x 2014 | 21 Jun
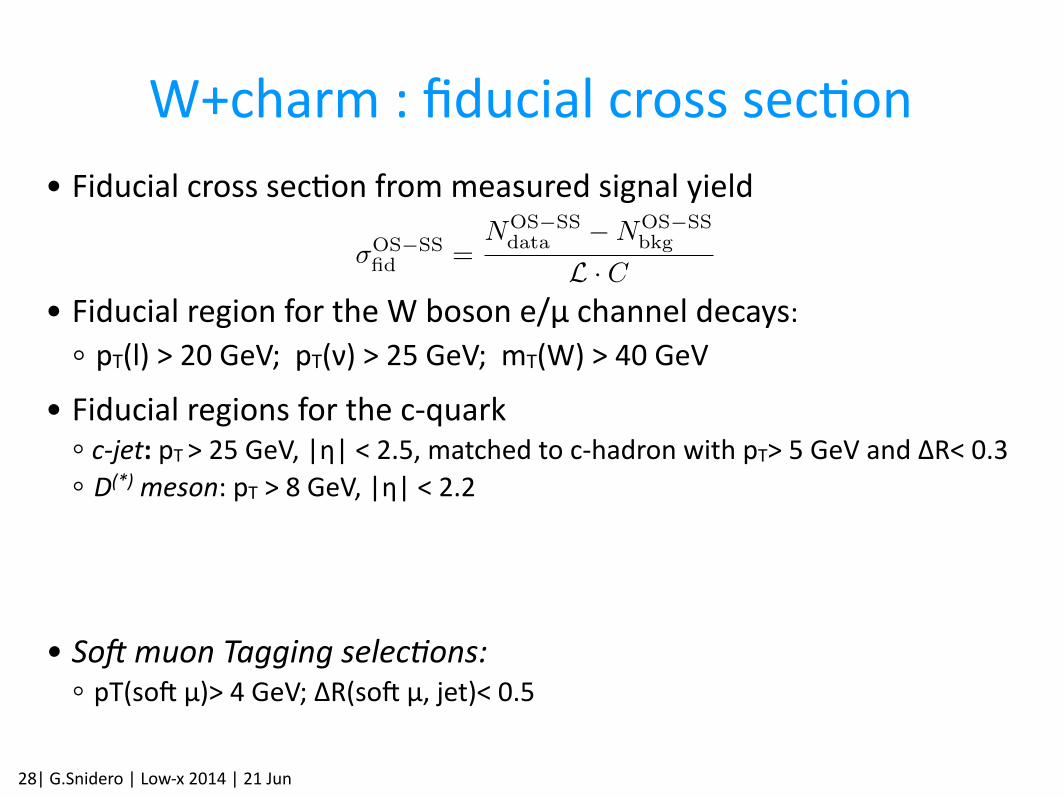
W+charm : fiducial cross sec?on• Fiducial cross sec?on from measured signal yield !!!!• Fiducial region for the W boson e/µ channel decays: ◦ pT(l) > 20 GeV; pT(ν) > 25 GeV; mT(W) > 40 GeV
• Fiducial regions for the c-‐quark ◦ c-‐jet: pT > 25 GeV, |η| < 2.5, matched to c-‐hadron with pT> 5 GeV and ΔR< 0.3 ◦ D(*) meson: pT > 8 GeV, |η| < 2.2 !!!
• Soc muon Tagging selecMons: ◦ pT(som µ)> 4 GeV; ΔR(som µ, jet)< 0.5
28
�OS�SSfid =
NOS�SSdata �NOS�SS
bkg
L · C
1

| G.Snidero | Low-‐x 2014 | 21 Jun
W+charm: W+D(*) mass fit• Signal yield extracted from template fits to the mass distribu?ons m(D) or Δm = m(D*)-‐m(D0) in the 4 D(*) decay channels ◦ Reconstruct decays with selec?ons on tracks ◦ Fit for the frac?on of signal and background using OS-‐SS events
• Signal shape: data control sample with D(*) mesons from b-‐quark semileptonic decays
• Background shape: mainlyW+light-‐jets, from data control region
• Other backgrounds: mul?jet, top, diboson, small, subtracted amer the fit
29) [GeV]-m(D
1.75 1.8 1.85 1.9 1.95 2 2.05 2.1 2.15 2.2
OS-
SS E
vent
s/12
MeV
0
200
400
600
800
1000 ATLAS-1 Ldt = 4.6 fb∫
= 7 TeVs
-D+W-π-π+ K→
-D
DataFitSignalBackground
) [GeV]+m(D1.75 1.8 1.85 1.9 1.95 2 2.05 2.1 2.15 2.2
OS-
SS E
vent
s/12
MeV
0
200
400
600
800
1000 ATLAS-1 Ldt = 4.6 fb∫
= 7 TeVs
+D-W+π+π
- K→+D
DataFitSignalBackground
) [MeV]0 m = m(D*)-m(D∆135 140 145 150 155 160 165 170 175 180 185
OS-
SS E
vent
s/M
eV
0100200300400500600700800 ATLAS
-1 Ldt = 4.6 fb∫ = 7 TeVs
-D*+W-π)-π+ (K→-π
0D →-D*
DataFitSignalBackground
) [MeV]0 m = m(D*)-m(D∆135 140 145 150 155 160 165 170 175 180 185
OS-
SS E
vent
s/M
eV0
100200300400500600700800 ATLAS
-1 Ldt = 4.6 fb∫ = 7 TeVs
+D*-W+π)+π
- (K→+π0 D→+D*
DataFitSignalBackground
) [MeV]0 m = m(D*)-m(D∆135 140 145 150 155 160 165 170 175 180 185
OS-
SS E
vent
s/M
eV
0
100
200
300
400ATLAS
-1 Ldt = 4.6 fb∫ = 7 TeVs
-D*+W-π)0π-π+ (K→-π
0D →-D*
DataFitSignalBackground
) [MeV]0 m = m(D*)-m(D∆135 140 145 150 155 160 165 170 175 180 185
OS-
SS E
vent
s/M
eV
0
100
200
300
400ATLAS
-1 Ldt = 4.6 fb∫ = 7 TeVs
+D*-W+π)0π+π
- (K→+π0 D→+D*
DataFitSignalBackground
) [MeV]0 m = m(D*)-m(D∆135 140 145 150 155 160 165 170 175 180 185
OS-
SS E
vent
s/M
eV
0100200300400500600700800 ATLAS
-1 Ldt = 4.6 fb∫ = 7 TeVs
-D*+W-π)-π+π-π+ (K→-π
0D →-D*
DataFitSignalBackground
) [MeV]0 m = m(D*)-m(D∆135 140 145 150 155 160 165 170 175 180 185
OS-
SS E
vent
s/M
eV
0100200300400500600700800 ATLAS
-1 Ldt = 4.6 fb∫ = 7 TeVs
+D*-W+π)+π-π+π
- (K→+π0 D→+D*
DataFitSignalBackground
Figure 4. Results of the fits to the distributions of m(D) and �m = m(D
⇤) � m(D
0) in OS–
SS W
±D
(⇤)⌥ events. The fit results are shown for W
+D
(⇤)� (left) and W
�D
(⇤)+ (right) in theinclusive sample defined by p
D(⇤)
T > 8GeV and |⌘D(⇤) | < 2.2: D
± ! K
⌥⇡
±⇡
±(top row), D⇤± !D
0⇡
± ! (K
⌥⇡
±)⇡
± (second row), D
⇤± ! D
0⇡
± ! (K
⌥⇡
±⇡
0)⇡
± (third row) and D
⇤± !D
0⇡
± ! (K
⌥⇡
±⇡
⌥⇡
±)⇡
± (bottom row). The data distributions are shown by the filled markers,where the error bars show the statistical uncertainty. The fit result is shown by the solid line.The filled histogram represents the signal template normalised according to the fit result, while thecontribution of the combinatorial background is shown by the dotted line.
– 14 –
m(D-‐)

| G.Snidero | Low-‐x 2014 | 21 Jun
W+charm: theory predic?ons • Predic?ons with aMC@NLO ◦ Generated with CT10NLO, and reweigh to other PDF sets ◦ PDF unc = 68%, according to prescrip?ons ofromeach analysis
• Showered with Herwig++ ◦ unc as the difference between Pythia and Herwig++
• Charm fragmenta?on frac?ons ◦ Rescaled to LEP/HERA measurements (arXiv:1112.3757) ◦ Charm fragmenta?on func?on validated by genera?ng e+e-‐ events and comparing to LEP/BELLE data
• Scale varia?on of μR and μF from 1⁄2μ to 2μ
30

| G.Snidero | Low-‐x 2014 | 21 Jun
W+charm: differen?al in W-‐lepton |η|
31
|ηLepton |0 0.5 1 1.5 2 2.5
| [pb
]η
/d|
fidOS-
SSσd
0
5
10
15
20
25
30
35Data (stat+syst)CT10MSTW2008NNPDF2.3HERAPDF1.5ATLAS-epWZ12NNPDF2.3coll
ATLAS-1 Ldt = 4.6 fb∫
= 7 TeVs
-jetc+W
|ηLepton |0 0.5 1 1.5 2 2.5
| [pb
]η
/d|
fidOS-
SSσd
0
5
10
15
20
25
30
35 Data (stat+syst)CT10MSTW2008NNPDF2.3HERAPDF1.5ATLAS-epWZ12NNPDF2.3coll
ATLAS-1 Ldt = 4.6 fb∫
= 7 TeVs
c-jet-W
|ηLepton |0 0.5 1 1.5 2 2.5
| [pb
]η
/d|
OS-
SSfid
σd
02468
10121416182022
ATLAS-1 Ldt = 4.6 fb∫
= 7 TeVs
-D+W
Data (stat+syst) CT10MSTW2008NNPDF2.3HERAPDF1.5ATLAS-epWZ12NNPDF2.3coll
|ηLepton |0 0.5 1 1.5 2 2.5
| [pb
]η
/d|
OS-
SSfid
σd
02468
10121416182022
ATLAS-1 Ldt = 4.6 fb∫
= 7 TeVs
+D-W
Data (stat+syst) CT10MSTW2008NNPDF2.3HERAPDF1.5ATLAS-epWZ12NNPDF2.3coll
|ηLepton |0 0.5 1 1.5 2 2.5
| [pb
]η
/d|
OS-
SSfid
σd
02468
10121416182022
ATLAS-1 Ldt = 4.6 fb∫
= 7 TeVs
-D*+W
Data (stat+syst) CT10MSTW2008NNPDF2.3HERAPDF1.5ATLAS-epWZ12NNPDF2.3coll
|ηLepton |0 0.5 1 1.5 2 2.5
| [pb
]η
/d|
OS-
SSfid
σd
02468
10121416182022
ATLAS-1 Ldt = 4.6 fb∫
= 7 TeVs
+D*-W
Data (stat+syst) CT10MSTW2008NNPDF2.3HERAPDF1.5ATLAS-epWZ12NNPDF2.3coll
Figure 13. Measured differential cross section as a function of lepton |⌘| compared to predictionsobtained using various PDF sets: (top left) W
+c-jet, (top right) W
�c-jet, (middle left) W
+D
�,(middle right) W
�D
+, (bottom left) W
+D
⇤� and (bottom right) W
�D
⇤+. The measurementsare shown by the filled circles. The error bars give the statistical uncertainty, while the sum inquadrature of the statistical and systematic uncertainties is shown as an error band. The the-ory predictions are based on the aMC@NLO simulation. The different markers correspond to thepredictions obtained using various PDF sets and the corresponding error bars represent the to-tal theoretical uncertainties (sum in quadrature of PDF, parton shower, fragmentation and scaleuncertainties).
– 38 –
|ηLepton |0 0.5 1 1.5 2 2.5
| [pb
]η
/d|
fidOS-
SSσd
0
5
10
15
20
25
30
35Data (stat+syst)CT10MSTW2008NNPDF2.3HERAPDF1.5ATLAS-epWZ12NNPDF2.3coll
ATLAS-1 Ldt = 4.6 fb∫
= 7 TeVs
-jetc+W
|ηLepton |0 0.5 1 1.5 2 2.5
| [pb
]η
/d|
fidOS-
SSσd
0
5
10
15
20
25
30
35 Data (stat+syst)CT10MSTW2008NNPDF2.3HERAPDF1.5ATLAS-epWZ12NNPDF2.3coll
ATLAS-1 Ldt = 4.6 fb∫
= 7 TeVs
c-jet-W
|ηLepton |0 0.5 1 1.5 2 2.5
| [pb
]η
/d|
OS-
SSfid
σd
02468
10121416182022
ATLAS-1 Ldt = 4.6 fb∫
= 7 TeVs
-D+W
Data (stat+syst) CT10MSTW2008NNPDF2.3HERAPDF1.5ATLAS-epWZ12NNPDF2.3coll
|ηLepton |0 0.5 1 1.5 2 2.5
| [pb
]η
/d|
OS-
SSfid
σd
02468
10121416182022
ATLAS-1 Ldt = 4.6 fb∫
= 7 TeVs
+D-W
Data (stat+syst) CT10MSTW2008NNPDF2.3HERAPDF1.5ATLAS-epWZ12NNPDF2.3coll
|ηLepton |0 0.5 1 1.5 2 2.5
| [pb
]η
/d|
OS-
SSfid
σd
02468
10121416182022
ATLAS-1 Ldt = 4.6 fb∫
= 7 TeVs
-D*+W
Data (stat+syst) CT10MSTW2008NNPDF2.3HERAPDF1.5ATLAS-epWZ12NNPDF2.3coll
|ηLepton |0 0.5 1 1.5 2 2.5
| [pb
]η
/d|
OS-
SSfid
σd
02468
10121416182022
ATLAS-1 Ldt = 4.6 fb∫
= 7 TeVs
+D*-W
Data (stat+syst) CT10MSTW2008NNPDF2.3HERAPDF1.5ATLAS-epWZ12NNPDF2.3coll
Figure 13. Measured differential cross section as a function of lepton |⌘| compared to predictionsobtained using various PDF sets: (top left) W
+c-jet, (top right) W
�c-jet, (middle left) W
+D
�,(middle right) W
�D
+, (bottom left) W
+D
⇤� and (bottom right) W
�D
⇤+. The measurementsare shown by the filled circles. The error bars give the statistical uncertainty, while the sum inquadrature of the statistical and systematic uncertainties is shown as an error band. The the-ory predictions are based on the aMC@NLO simulation. The different markers correspond to thepredictions obtained using various PDF sets and the corresponding error bars represent the to-tal theoretical uncertainties (sum in quadrature of PDF, parton shower, fragmentation and scaleuncertainties).
– 38 –
Measured differential cross section as a function of lepton |η| compared to predictions obtained using various PDF sets: (left) W−c-jet and (right) W −D∗+. The measurements are shown by the filled circles. The error bars give the statistical uncertainty, while the sum in quadrature of the statistical and systematic uncertainties is shown as an error band. The theory predictions are based on the aMC@NLO simulation. The different markers correspond to the predictions obtained using various PDF sets and the corresponding error bars represent the total theoretical uncertainties (sum in quadrature of PDF, parton shower, fragmentation and scale uncertainties).
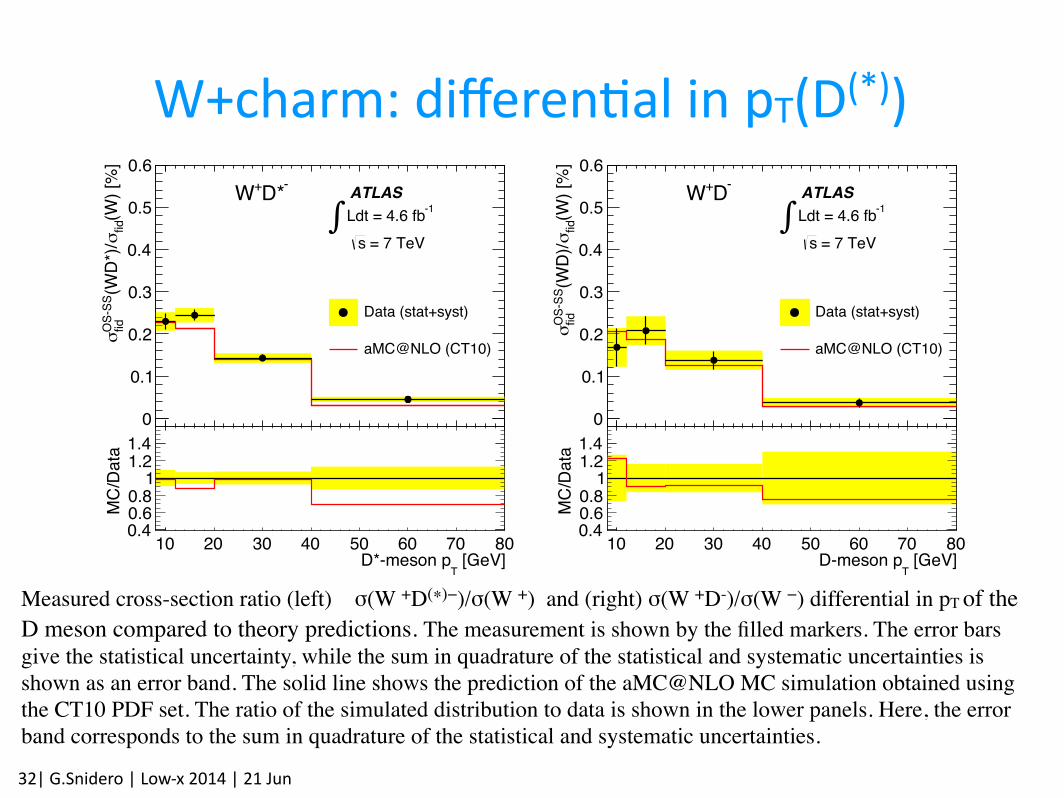
| G.Snidero | Low-‐x 2014 | 21 Jun
W+charm: differen?al in pT(D(*))
32
Measured cross-section ratio (left) σ(W +D(∗)−)/σ(W +) and (right) σ(W +D-)/σ(W −) differential in pT of the D meson compared to theory predictions. The measurement is shown by the filled markers. The error bars give the statistical uncertainty, while the sum in quadrature of the statistical and systematic uncertainties is shown as an error band. The solid line shows the prediction of the aMC@NLO MC simulation obtained using the CT10 PDF set. The ratio of the simulated distribution to data is shown in the lower panels. Here, the error band corresponds to the sum in quadrature of the statistical and systematic uncertainties.
(GeV)T
p
10 20 30 40 50 60 70 80
(W) [
%]
fidσ
(WD*
)/O
S-SS
fidσ
0
0.1
0.2
0.3
0.4
0.5
0.6
Data (stat+syst)
aMC@NLO (CT10)
ATLAS-1 Ldt = 4.6 fb∫
= 7 TeVs
-D*+W
[GeV]T
D*-meson p10 20 30 40 50 60 70 80
MC/
Data
0.40.60.8
11.21.4
(GeV)T
p
10 20 30 40 50 60 70 80
(W) [
%]
fidσ
(WD)
/O
S-SS
fidσ
0
0.1
0.2
0.3
0.4
0.5
0.6
Data (stat+syst)
aMC@NLO (CT10)
ATLAS-1 Ldt = 4.6 fb∫
= 7 TeVs
-D+W
[GeV]T
D-meson p10 20 30 40 50 60 70 80
MC/
Data
0.40.60.8
11.21.4
(GeV)T
p
10 20 30 40 50 60 70 80
(W) [
%]
fidσ
(WD*
)/O
S-SS
fidσ
0
0.1
0.2
0.3
0.4
0.5
0.6
Data (stat+syst)
aMC@NLO (CT10)
ATLAS-1 Ldt = 4.6 fb∫
= 7 TeVs
+D*-W
[GeV]T
D*-meson p10 20 30 40 50 60 70 80
MC/
Data
0.40.60.8
11.21.4
(GeV)T
p
10 20 30 40 50 60 70 80
(W) [
%]
fidσ
(WD)
/O
S-SS
fidσ
0
0.1
0.2
0.3
0.4
0.5
0.6
Data (stat+syst)
aMC@NLO (CT10)
ATLAS-1 Ldt = 4.6 fb∫
= 7 TeVs
+D-W
[GeV]T
D-meson p10 20 30 40 50 60 70 80
MC/
Data
0.40.60.8
11.21.4
Figure 15. Measured cross-section ratio �(W
+D
(⇤)�)/�(W
+) (top) and �(W
�D
(⇤)+)/�(W
�)
(bottom) in percent and differential in p
D(⇤)
T compared to the MC prediction: the left plots are forD
⇤±, while the right plots are for D±. The measurement is shown by the filled markers. The errorbars give the statistical uncertainty, while the sum in quadrature of the statistical and systematicuncertainties is shown as an error band. The solid line shows the prediction of the aMC@NLOMC simulation obtained using the CT10 PDF set. The ratio of the simulated distribution to datais shown in the lower panels. Here, the error band corresponds to the sum in quadrature of thestatistical and systematic uncertainties.
10.2 Cross sections �OS�SSfid (Wc-jet) and �OS–SS
fid (Wc-jet(c ! µ)) as a func-tion of the jet multiplicity
In addition to the Wc-jet fiducial cross section for a W boson with exactly one c-jet andany number of additional jets, the cross section is measured with the requirements definedin section 7.1, except for requiring either exactly one or exactly two jets only one of whichis identified as a c-jet. The results, including the ratio R
±c
, averaged between the electronand muon channels, are shown in table 11. Figure 16 shows the measured Wc-jet fiducialcross sections for events with exactly one or two jets compared to aMC@NLO predictionswith the CT10 NLO PDF set. The aMC@NLO central values do not describe the one-to-two-jets ratio well. The Alpgen predictions normalised to the inclusive W NNLO cross
– 42 –

| G.Snidero | Low-‐x 2014 | 21 Jun
W+charm: differen?al Njets
33
�
OS�SSfid (Wc-jet) [pb]
Wc-jet (1 jet) 52.9± 0.9 (stat)± 3.0 (syst)
Wc-jet (2 jets) 14.2± 0.6 (stat)± 1.2 (syst)
R
±c
(1 jet) 0.91± 0.03 (stat)± 0.02 (syst)
R
±c
(2 jets) 0.87± 0.08 (stat)± 0.02 (syst)
�
OS–SSfid (Wc-jet(c ! µ)) [pb]
Wc-jet (1 jet) 2.47± 0.04 (stat)± 0.13 (syst)
Wc-jet (2 jets) 0.69± 0.03 (stat)± 0.06 (syst)
Wc-jet (inclusive) 3.36± 0.06 (stat)± 0.16 (syst)
Table 11. Measured fiducial cross sections and R
±c for exclusive jet multiplicity together with the
statistical and systematic uncertainties. The lower part of the table shows the measured fiducialcross section for the production of a W boson together with a soft muon from the charm-quarkdecay. The branching ratio W ! `⌫ is included in the fiducial cross section definition.
Jet multiplicity
1 jet 2 jets
[pb]
fidOS-
SSσ
102030405060708090
100
Data (stat+syst) aMC@NLO (CT10)Alpgen (norm. to NNLO)
ATLAS-1 Ldt = 4.6 fb∫
= 7 TeVs
Wc-jet
Jet multiplicity1 jet 2 jets
MC/
Data
0.40.60.8
11.21.4
Figure 16. Measured cross sections as a function of the jet multiplicity compared to aMC@NLOproduced using the CT10 NLO PDF set. The predictions from Alpgen normalised to the inclusiveW NNLO cross section are also shown for reference. In the lower panels, the ratio of the simulateddistribution to data is shown.
section are also shown for reference. The Alpgen central values underestimate the datameasurements for both the samples with one and two jets; however the one-to-two-jets ratiois well described.
Finally, in order to minimise the systematic uncertainties due to the extrapolation tothe fiducial phase space, the cross sections are determined in a phase space as specified insection 7.1 but in which the c-hadron decays semileptonically to a muon with pT > 4GeV,|⌘| <2.5, charge opposite to the W boson and within �R < 0.5 from the c-jet axis. Theresulting cross sections, for both the exclusive jet multiplicity and inclusive jet multiplicitydefinitions are also shown in table 11, indicating a total systematic uncertainty of 4.7% forthe measurement with inclusive jet multiplicity.
– 43 –

| G.Snidero | Low-‐x 2014 | 21 Jun
• Select two jets origina?ng from Z → bb decay ◦ Jets clustered using an?-‐kt with R = 0.4 ◦ dijet momentum pT(dijet) > 200 GeV (reduces bb mul?jet background) ◦ dijet mass 60 < mdijet < 160 GeV ◦ Events with exactly 2 b-‐tagged jets in 3 to 5 total jets
• Fiducial cross sec?on measured from signal event yield
Z → bb: Selec?ons
34
are approximately 8% and 6% of the signal, respectively.
5. Cross-section definition
The fiducial cross section of resonant Z boson production,with Z decaying to bb, �fid
Z!bb, is defined as follows. Particle-
level jets in MC Z!bb events are reconstructed from stableparticles (particles with lifetime in excess of 10 ps, exclud-ing muons and neutrinos) using the anti-kt algorithm with ra-dius parameter R = 0.4 . There must be two particle-levelb-jets in the event that satisfy the following fiducial condi-tions: pT > 40 GeV, |⌘| < 2.5 for the individual jets; and�R(jet1, jet2) < 1.2, pdijet
T > 200 GeV, 60 < mdijet < 160 GeVfor the dijet system.
The cross section is extracted from the measured yield ofZ!bb events in the data, NZ!bb, as
�fidZ!bb
=NZ!bb
L · CZ!bb,
where CZ!bb is the e�ciency correction factor to correct thedetector-level Z!bb yield to the particle level. The value ofCZ!bb in the SherpaMC signal is found to be 16.2%, which canbe factorised into the product of: trigger e�ciency (88.1%), b-tagging and kinematic selection e�ciency (52.7%), and the ef-ficiency of the SNN requirement that defines the Signal Region(35.0%). The uncertainties on CZ!bb are discussed in Section 7.
6. Signal extraction
The signal yield is extracted by fitting simultaneously themdijet distributions of the Signal and Control Regions inthe range [60, 160] GeV with a binned, extended maximum-likelihood (EML) fit, using a bin width of 1 GeV.
The Z ! bb signal shape is modelled in the EML fit asthe sum of three Gaussians. This empirical model describeswell both the Sherpa and the Pythia signal MC samples, albeitwith slightly di↵erent parameters. Given this, the Sherpa-basedmodel is used as the baseline for the fit, and the Pythia-basedmodel is used for an estimate of the systematic uncertainty onthe measurement due to the signal shape. The only free pa-rameters of the signal model in the EML fit are the yield inthe Signal Region and the shift, �MZ , of the mean of the nar-rowest Gaussian from its MC-predicted value. The widths andrelative contributions of the three Gaussians, as well as the dif-ferences between the mean of each of the two wider Gaussiansand the narrowest one, are fixed to the values determined bya separate fit to the signal MC mdijet distributions. Given thatthe Control Region is not signal-free, the simultaneous fit in-cludes a signal component in both the Signal Region and theControl Region. The relative proportion of signal in the two re-gions, RZ = (NControl
Z!bb)/(NSignal
Z!bb), is fixed to the value predicted
by Sherpa, RZ = 0.62. This choice is supported by the goodagreement found between Sherpa and data in the SNN distribu-tion obtained from a pure sample of high-pT Z ! µ+µ� events,as discussed in Section 7.
The dominant multi-jet background is modelled in the EMLfit using a seventh-order Bernstein polynomial [30]. This ispurely an empirical model and the order of the polynomial ischosen by a �2 saturation test by fitting the mdijet distributionin the Control Region with the background-only hypothesis andan increasing polynomial order, until no improvement is seen inthe fit quality when adding higher-order terms. The coe�cientsof the Bernstein polynomial are determined by the simultaneousEML fit and are identical for the Signal and Control Regions.In this way, the signal-depleted Control Region constrains thebackground prediction in the Signal Region. The only addi-tional parameters of the fit are the background normalisationsin the Signal and Control Regions.
The small Z! cc, tt and W!qq0 backgrounds are includedas separate components in the EML fit for both the Signal andControl Regions, with their mdijet shapes being parameterisedfrom MC simulation as follows. The Z! cc and W!qq0 com-ponents are each modelled as three-Gaussian sums like the sig-nal, with all parameters fixed to values from fits to MC sim-ulation. The means of the Gaussians are expressed with re-spect to the mean of the narrowest Z!bb Gaussian: this cou-ples the position of these backgrounds to the Z!bb signal.The W!qq0 component is normalised absolutely to its PythiaLO cross section, corrected to NLO by a K-factor derived us-ing MCFM [31]. The acceptance of the Z! cc background istaken from the simulation, but its yield is linked to the fittedZ!bb yield, since the Z! cc production di↵ers from the sig-nal only in the well-known branching fractions of the Z decays.All properties of the tt component are fixed using the tt simula-tion, with normalisation from the NNLO+NNLL prediction ofthe tt production cross section [32–37]. The contribution fromHiggs decays to bb is expected to be ⇠ 3% of the Z!bb signaland therefore no such component is included in the EML fit.
Fig. 3 shows the result of the simultaneous fit to the mdijetdistributions of the Signal and Control Regions, as well as thecorresponding background-subtracted data distributions. Therather complex shape of the background invariant mass distri-bution results from the use of the six jet-based triggers, all ofwhich have di↵erent jet pT thresholds and hence shape di↵er-ently the invariant mass distributions. The fitted function mod-els the data well, with a signal peak compatible with Z!bbdecays. The fitted signal yield is 6420 ± 640 (stat.) events.
7. Systematic uncertainties
The sources of systematic uncertainties considered in thisanalysis, which may a↵ect the fitted signal yield, the e�ciencycorrection factor or both, are listed in Table 1.
The jet energy scale (JES) and jet energy resolution (JER)uncertainties are determined using the techniques described inRefs. [27, 38]. The JES uncertainty has a relatively large im-pact on the signal e�ciency, due to the pT requirements on theindividual jets and the dijet system, but a comparatively smallimpact on the fitted yield, because of the data-driven approachfor the background determination and the fact that the locationof the signal peak is a free parameter of the EML fit. The JER
4

| G.Snidero | Low-‐x 2014 | 21 Jun
W+charm : s-‐to-‐d sea PDF ra?o• HERAPDF1.5 PDF set: ◦ The frac?on of strange-‐quarks in the sea is expressed as fs = sbar/(dbar + sbar) The central value fs = 0.31 at Q2 = 1.9 GeV2, consistent with N-‐ν data
• strange density frac?on fs extracted with χ2 fit: ◦ χ2 function constructed with measured σ(W+charm) and HERAPDF1.5 predictions, including all experimental and theory uncertainties
◦ Uncertainty on fS is a nuisance parameter in the χ2 minimisa?on; the baseline uncertainty (0.23-‐0.38) is ar?ficially increased (100 ?mes)
◦ This procedure corresponds to a free fit of fs to the W+charm data
35

| G.Snidero | Low-‐x 2014 | 21 Jun
Z → bb: |ηdijet| Δη(dijet, balancing-‐jet)
36
The distributions of (a) the dijet pseudorapidity and of (b) the pseudorapidity difference between the dijet and the balancing jet
|dijetη|
0 0.5 1 1.5 2 2.5 3
)di
jet
η(1
/N)(d
N/d
0
0.005
0.01
0.015
0.02
0.025
0.03
0.035
Databb→Z
ATLAS = 8 TeVs
-1Ldt = 19.5 fb∫
(a)
(Dijet - BalanceJet)η∆ 0 0.5 1 1.5 2 2.5 3 3.5 4 4.5 5
)η∆
(1/N
)(dN
/d
0
0.01
0.02
0.03
0.04
0.05
0.06
0.07
Databb→Z
ATLAS = 8 TeVs
-1Ldt = 19.5 fb∫
(b)
NNS0 0.1 0.2 0.3 0.4 0.5 0.6 0.7 0.8
)N
N(1
/N)(d
N/d
S
0
0.01
0.02
0.03
0.04
0.05
0.06
Databb→Z
ATLAS = 8 TeVs
-1Ldt = 19.5 fb∫
(c)
Figure 1: The distributions of: (a) the dijet pseudorapidity, |⌘dijet |; (b) the pseu-dorapidity di↵erence, |�⌘|, between the dijet and the balancing jet; and (c) theneural network discriminant SNN , in the Z!bb signal (red squares) and in thedata (black circles), including all events with 60 < mdijet < 160 GeV. The datais dominated by the multi-jet background. The two dashed lines in (c) indicatethe SNN values defining the Signal (SNN > 0.58) and Control (SNN < 0.45)Regions.
the signal MC sample and in the data. The data shown here in-clude all events with 60 < mdijet < 160 GeV, and are representa-tive of the background as the signal contribution is estimated tobe only about 1%. The Signal Region is defined by SNN > 0.58and the Control Region by SNN < 0.45. These values providethe optimal statistical significance for the expected signal. Thediscriminating power of ⌘dijet and �⌘ stems from the fact thatsignal production proceeds predominantly via a quark–gluonhard scatter, as opposed to the dominant multi-jet backgroundwhich is largely initiated by gluon-gluon scattering. Due to thedi↵erences between the gluon and quark PDFs, the Z + jet sys-tem tends to be more boosted along the beam axis; hence theZ boson is produced with higher ⌘ and smaller �⌘ separationfrom its recoil, compared to the background.
Since SNN is minimally correlated with mdijet the ControlRegion can be used as an unbiased model of the backgroundin the Signal Region. Fig. 2 shows the normalised ratio of themdijet distributions in the Signal and Control Regions, excludingthe Z mass window. A first-order polynomial fit to this distribu-tion gives a good �2 probability, 0.18, and a gradient consistentwith zero, (�1.37 ± 1.10) ⇥ 10�4 GeV�1. In addition, the va-lidity of assuming minimal correlation is supported by a test,performed with events from a Pythia 8 multi-jet MC samplesatisfying the above analysis requirements, giving a ratio of theabove distributions consistent with being flat. The impact ofpossible di↵erences in the background mdijet shape between theSignal and Control Regions is considered as one of the system-atic uncertainties on the measurement.
[GeV]dijetm60 70 80 90 100 110 120 130 140 150 160
Sign
al R
egio
n / C
ontro
l Reg
ion
0.80.850.9
0.951
1.051.1
1.151.2
1.25Data
1st Order Polynomial
ATLAS = 8 TeVs
-1Ldt = 19.5 fb∫
Figure 2: The normalised ratio of dijet mass distributions in the Signal andControl Regions, excluding the signal mass window, fitted with a first-orderpolynomial. The dashed line indicates unity.
The total number of data events satisfying the full analysisselection is 236172 in the Signal Region and 474810 in the Con-trol Region. The signal-to-background ratio in a 30 GeV win-dow around the Z boson mass is expected to be about 6% (2%)in the Signal (Control) Region. The tt events are estimated torepresent about 0.5% of the total background in both the Signaland Control Regions, and the Z! cc and W!qq0 backgrounds
3
|dijetη|
0 0.5 1 1.5 2 2.5 3
)di
jet
η(1
/N)(d
N/d
0
0.005
0.01
0.015
0.02
0.025
0.03
0.035
Databb→Z
ATLAS = 8 TeVs
-1Ldt = 19.5 fb∫
(a)
(Dijet - BalanceJet)η∆ 0 0.5 1 1.5 2 2.5 3 3.5 4 4.5 5
)η∆
(1/N
)(dN
/d0
0.01
0.02
0.03
0.04
0.05
0.06
0.07
Databb→Z
ATLAS = 8 TeVs
-1Ldt = 19.5 fb∫
(b)
NNS0 0.1 0.2 0.3 0.4 0.5 0.6 0.7 0.8
)N
N(1
/N)(d
N/d
S
0
0.01
0.02
0.03
0.04
0.05
0.06
Databb→Z
ATLAS = 8 TeVs
-1Ldt = 19.5 fb∫
(c)
Figure 1: The distributions of: (a) the dijet pseudorapidity, |⌘dijet |; (b) the pseu-dorapidity di↵erence, |�⌘|, between the dijet and the balancing jet; and (c) theneural network discriminant SNN , in the Z!bb signal (red squares) and in thedata (black circles), including all events with 60 < mdijet < 160 GeV. The datais dominated by the multi-jet background. The two dashed lines in (c) indicatethe SNN values defining the Signal (SNN > 0.58) and Control (SNN < 0.45)Regions.
the signal MC sample and in the data. The data shown here in-clude all events with 60 < mdijet < 160 GeV, and are representa-tive of the background as the signal contribution is estimated tobe only about 1%. The Signal Region is defined by SNN > 0.58and the Control Region by SNN < 0.45. These values providethe optimal statistical significance for the expected signal. Thediscriminating power of ⌘dijet and �⌘ stems from the fact thatsignal production proceeds predominantly via a quark–gluonhard scatter, as opposed to the dominant multi-jet backgroundwhich is largely initiated by gluon-gluon scattering. Due to thedi↵erences between the gluon and quark PDFs, the Z + jet sys-tem tends to be more boosted along the beam axis; hence theZ boson is produced with higher ⌘ and smaller �⌘ separationfrom its recoil, compared to the background.
Since SNN is minimally correlated with mdijet the ControlRegion can be used as an unbiased model of the backgroundin the Signal Region. Fig. 2 shows the normalised ratio of themdijet distributions in the Signal and Control Regions, excludingthe Z mass window. A first-order polynomial fit to this distribu-tion gives a good �2 probability, 0.18, and a gradient consistentwith zero, (�1.37 ± 1.10) ⇥ 10�4 GeV�1. In addition, the va-lidity of assuming minimal correlation is supported by a test,performed with events from a Pythia 8 multi-jet MC samplesatisfying the above analysis requirements, giving a ratio of theabove distributions consistent with being flat. The impact ofpossible di↵erences in the background mdijet shape between theSignal and Control Regions is considered as one of the system-atic uncertainties on the measurement.
[GeV]dijetm60 70 80 90 100 110 120 130 140 150 160
Sign
al R
egio
n / C
ontro
l Reg
ion
0.80.850.9
0.951
1.051.1
1.151.2
1.25Data
1st Order Polynomial
ATLAS = 8 TeVs
-1Ldt = 19.5 fb∫
Figure 2: The normalised ratio of dijet mass distributions in the Signal andControl Regions, excluding the signal mass window, fitted with a first-orderpolynomial. The dashed line indicates unity.
The total number of data events satisfying the full analysisselection is 236172 in the Signal Region and 474810 in the Con-trol Region. The signal-to-background ratio in a 30 GeV win-dow around the Z boson mass is expected to be about 6% (2%)in the Signal (Control) Region. The tt events are estimated torepresent about 0.5% of the total background in both the Signaland Control Regions, and the Z! cc and W!qq0 backgrounds
3
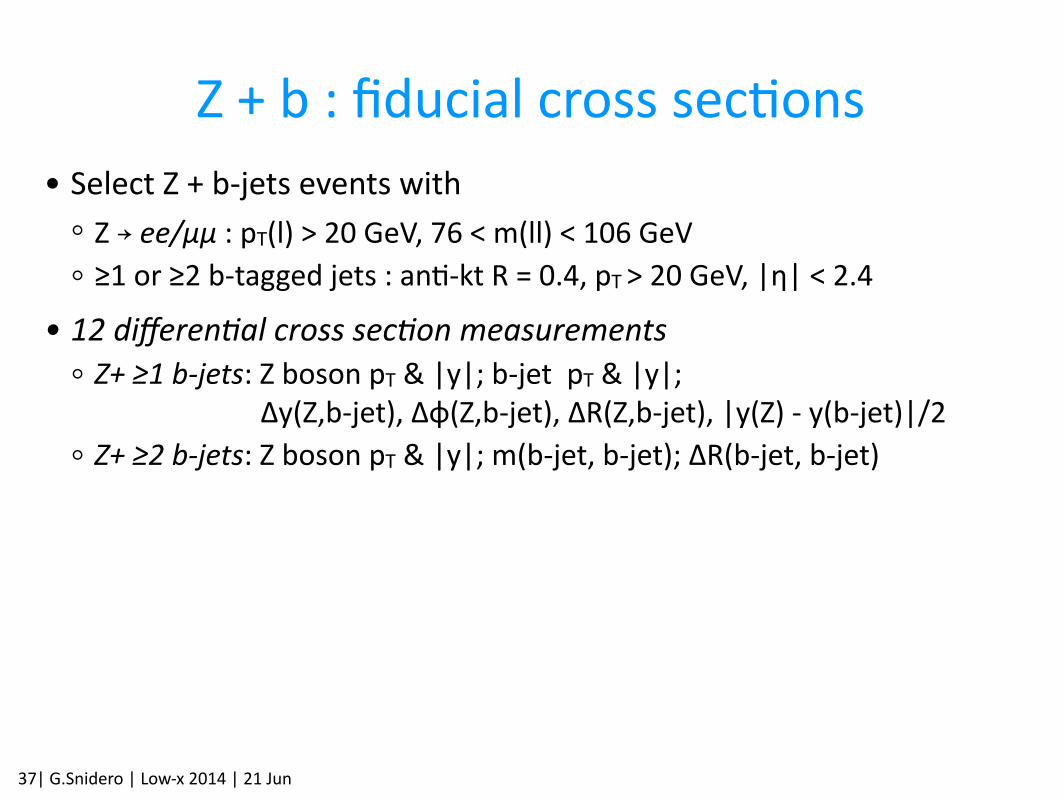
| G.Snidero | Low-‐x 2014 | 21 Jun
Z + b : fiducial cross sec?ons• Select Z + b-‐jets events with ◦ Z → ee/µµ : pT(l) > 20 GeV, 76 < m(ll) < 106 GeV ◦ ≥1 or ≥2 b-‐tagged jets : an?-‐kt R = 0.4, pT > 20 GeV, |η| < 2.4
• 12 differenMal cross secMon measurements ◦ Z+ ≥1 b-‐jets: Z boson pT & |y|; b-‐jet pT & |y|; Δy(Z,b-‐jet), Δφ(Z,b-‐jet), ΔR(Z,b-‐jet), |y(Z) -‐ y(b-‐jet)|/2
◦ Z+ ≥2 b-‐jets: Z boson pT & |y|; m(b-‐jet, b-‐jet); ΔR(b-‐jet, b-‐jet)
37

| G.Snidero | Low-‐x 2014 | 21 Jun
Z + b: NN output shapes
38
CombNNc
-4 -2 0 2 4 6 8 10
Jets
/ 0.
67
0
1000
2000
3000
4000
5000
6000
7000
Z+bZ+cZ+light
ATLAS Simulation Preliminary-1 = 7 TeV, 4.6 fbs
Jet flavour distributions for CombNNc in simulated Z+jets events for all selected tagged jets in events with at least one tagged jet. The Z → ee and Z → μμ channels are combined and simulated data are normalised such that the predicted number of jets in 4.6 fb−1 are shown.