
Wayne Zage and Dolores Zage Computer Science Department Ball State University An Overview of Design...
80
-
Upload
marjorie-brooks -
Category
Documents
-
view
216 -
download
0
Transcript of Wayne Zage and Dolores Zage Computer Science Department Ball State University An Overview of Design...


Wayne Zage and Dolores Zage
Computer Science Department Ball State University
An Overview of Design Metrics An Overview of Design Metrics Research in the SERCResearch in the SERC

OutlineOutline
IntroductionIntroduction
Metric Definitions, ProjectsMetric Definitions, Projects
Research ResultsResearch Results
Design Metrics AnalyzersDesign Metrics Analyzers
Extending DM TechnologyExtending DM Technology
AppendixAppendix
Click a button for more information

The Design Metrics Research TeamThe Design Metrics Research Team
Principal InvestigatorsWayne Zage Dolores Zage
Research AssociateJ. Michael McGrew Jeff Zhang
Industry AssociatesScott Garner Jeff Stineburg
Research StudentsJames West Robin Shimp
Rembert Parker Srirama Koneru Melissa May

Design Metrics Research at Ball Design Metrics Research at Ball State University has been funded byState University has been funded by
National Science FoundationSoftware Engineering Research Center
Motorola Corp.Nortel Technologies
Telcordia TechnologiesNorthrop Grumman Corp.Computer Sciences Corp.
GTE Data ServicesMagnavox Electronic Systems Co.
Harris Corp.Indiana Business Modernization and Tech. Corp.
Ball State University

Long Term GoalLong Term Goal
The goal of the design metrics research is to support the design process of software development by providing validated metrics that can be used to highlight stress points in a design and determine overall design quality.

OutlineOutline
IntroductionIntroduction
Metric Definitions, ProjectsMetric Definitions, Projects
Research ResultsResearch Results
Design Metrics AnalyzersDesign Metrics Analyzers
Extending DM TechnologyExtending DM Technology
AppendixAppendix
Click a button for more information


Design Metrics Feedback ExperimentDesign Metrics Feedback Experiment
We evaluated the performance of our design metrics as they were applied to ongoing software development in a controlled experiment at Northrop Grumman Corporation.
Analyze Design
Calculate Metrics
Code Test
De D i


MERLIN MERLIN :: A
ME t
R i c sm
ode
l
f o rL eg
acy
so
f tw
are
re j
ne a to
vu
IN

System Improvement StrategiesSystem Improvement StrategiesDetermined by Metrics AnalysisDetermined by Metrics Analysis
DESIGN METRICSDesign Phase
look for design alternatives
assign difficult components
to experienceddevelopers
provide extratesting effortfor indicatedstress points

System Improvement StrategiesSystem Improvement StrategiesDetermined by Metrics AnalysisDetermined by Metrics Analysis
CODE METRICS+DESIGN METRICS
Design Phaselook for design alternatives
assign difficult components
to experienceddevelopers
provide extratesting effortfor indicatedstress points
restructuring
reengineering
ordinarymaintenance
reverseengineeringthrow away
andstart over
Rejuvenation Phase


To capture all of the information To capture all of the information in a design, our metric D(G) in a design, our metric D(G) consists of:consists of:
an external metric De
an internal metric Di
D(G) = De + Di

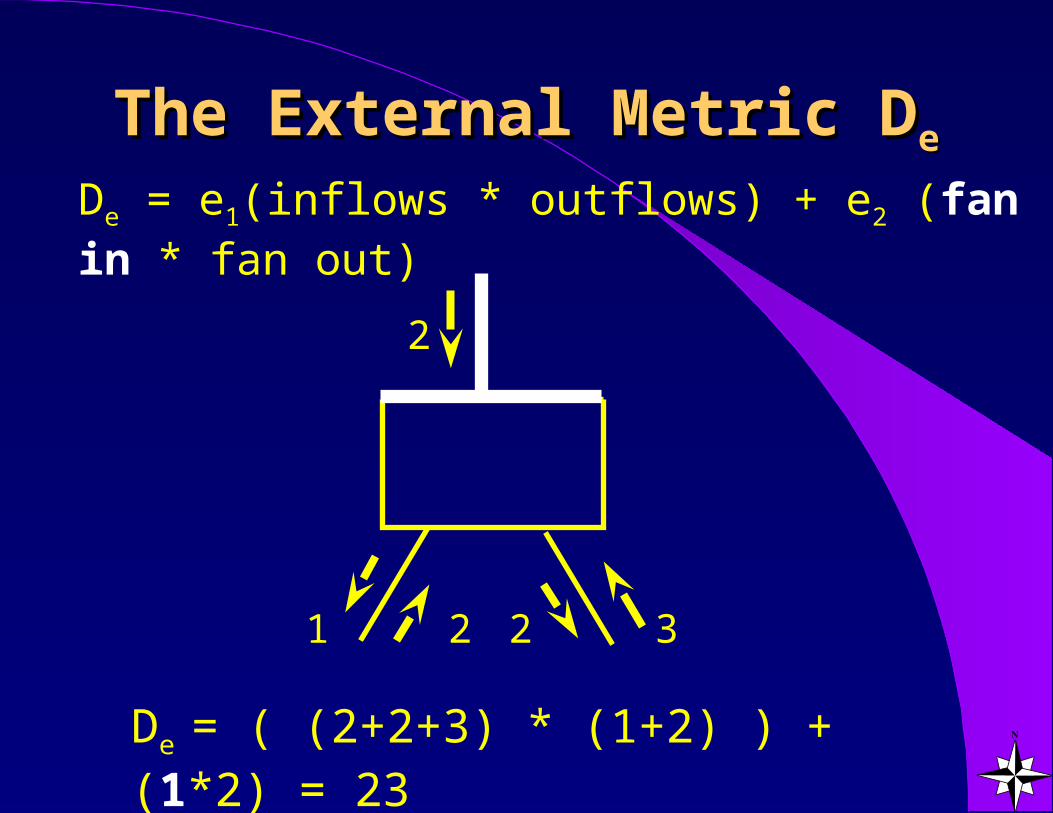
The External Metric DThe External Metric Dee
De = e1(inflows * outflows) + e2 (fan in * fan out)
21 3
2
2
De = ( (2+2+3) * (1+2) ) + (1*2) = 23

The External Metric DThe External Metric Dee
De = e1(inflows * outflows) + e2 (fan in * fan out)
21 3
2
2
De = ( (2+2+3) * (1+2) ) + (1*2) = 23

The External Metric DThe External Metric Dee
De = e1(inflows * outflows) + e2 (fan in * fan out)
21 3
2
2
De = ( (2+2+3) * (1+2) ) + (1*2) = 23
The External Metric DThe External Metric Dee
De = e1(inflows * outflows) + e2 (fan in * fan out)
21 3
2
2
De = ( (2+2+3) * (1+2) ) + (1*2) = 23

The External Metric DThe External Metric Dee
De = e1(inflows * outflows) + e2 (fan in * fan out)
21 3
2
2
De = ( (2+2+3) * (1+2) ) + (1*2) = 23

The Internal Metric DThe Internal Metric Dii
Di = w1(CC) + w2(DSM) + w3(I/O)
where:CC ( Central Calls ) are procedure or
function invocationsDSM ( Data Structure Manipulations ) are
references to complex data typesI/O ( Input/Output ) are external device
accesses

Design BalanceDesign Balance
De Di
The Design Balance metric, DB, is defined as
DB =average De
average Di

Design ConnectivityDesign Connectivity
The Design Connectivity Metric, DC, is a measure of the "connectedness" of the set of modules under consideration.
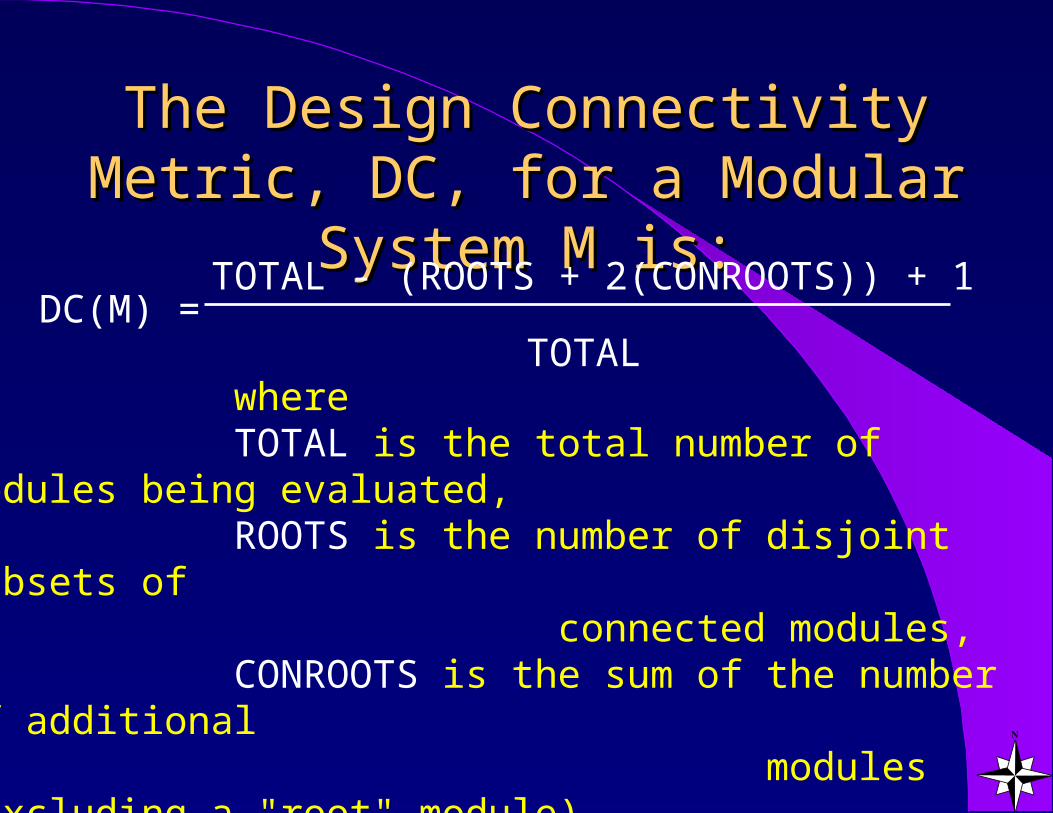
The Design Connectivity Metric, DC, for a The Design Connectivity Metric, DC, for a Modular System M is:Modular System M is:
DC(M) =TOTAL - (ROOTS + 2(CONROOTS)) + 1
TOTAL where TOTAL is the total number of modules being evaluated, ROOTS is the number of disjoint subsets of connected modules, CONROOTS is the sum of the number of additional modules (excluding a "root" module) with a fan-in of 0 in each of the disjoint subsets of connected modules.

OutlineOutline
IntroductionIntroduction
Metric Definitions, ProjectsMetric Definitions, Projects
Research ResultsResearch Results
Design Metrics AnalyzersDesign Metrics Analyzers
Extending DM TechnologyExtending DM Technology
AppendixAppendix
Click a button for more information


Our First Major AnalysisOur First Major Analysis
Mods HighlightedHltd.Mods w/Faults
Faults Found
False Positives
V(G)
LOC Di
De
D(G)
11%
44%
37%
56%
11%11%
56%
51%
44%
89%
94%
11%
12%
50%
53%
50%
12%
100%
97%
0%

The design metrics have been The design metrics have been computed oncomputed on
university-based projects CSC’s STANFINS project systems from the US Army Research Lab Magnavox’s AFATDS project Harris’ ROCC project three Northrop Grumman projects PBX system from Telcordia Technologies telecommunications systems from Motorola Results:
The design metrics have been excellent predictors of error-prone modules.

Other ResultsOther Results
Number of mods
Modules w/faults
Fault-free Modules31
4355
207054
The De mean for modules with faults was over six times the De mean for the fault-free modules!
De mean

So far, our design metrics give a software So far, our design metrics give a software designer a good indication of where potential designer a good indication of where potential trouble spots exist. The designer can take actions trouble spots exist. The designer can take actions such as:such as:
look for alternatives to a particular part of a design
assign difficult components to experienced developers
provide extra testing effort for indicated stress points

OutlineOutline
IntroductionIntroduction
Metric Definitions, ProjectsMetric Definitions, Projects
Research ResultsResearch Results
Design Metrics AnalyzersDesign Metrics Analyzers
Extending DM TechnologyExtending DM Technology
AppendixAppendix
Click a button for more information

The Need for Metrics AnalyzersThe Need for Metrics Analyzers
The metrics highlight error-prone modules, but the calculations are not consistent and are too slow when performed by hand.
A 14,000 line Ada program required 420 hours to hand-calculate and analyze the metrics, but only seconds using the tool.

Design Metric Analyzer ReportsDesign Metric Analyzer Reports
Metric Stress-Point Content Information

The DMA Reports CanThe DMA Reports Can
provide input for the software process design and code inspections maintenance documentation
be used to inspect the process adherence to design guidelines compliance with standards

OutlineOutline
IntroductionIntroduction
Metric Definitions, ProjectsMetric Definitions, Projects
Research ResultsResearch Results
Design Metrics AnalyzersDesign Metrics Analyzers
Extending DM TechnologyExtending DM Technology
AppendixAppendix
Click a button for more information

Extending Design Metrics TechnologyExtending Design Metrics Technology
Motorola: SDL project

Results of Pilot StudyResults of Pilot Study
The design metrics model was able to correctly classify the difficulty level of 96% of the SDL modules.

Metrics Analysis of the SDL Model Metrics Analysis of the SDL Model Study DataStudy Data
Reviewed 56 states containing a total of 1476 errors. Each state had at least 1 error and a maximum of 157 errors, as identified by a review of 581 DDTs.
The three states with the largest error counts (157, 75, 61) also have the largest De metric values (80217, 5964, and 8645 respectively).

Extending Design Metrics TechnologyExtending Design Metrics Technology
Motorola: SDL project Nortel Technologies: Predicting
Performance Behavior


Extending Design Metrics TechnologyExtending Design Metrics Technology
Telcordia Technologies : Moving metrics technology into practice
Raytheon: VHDL and OO metrics
Motorola: SDL project Nortel Technologies: Predicting
Performance Behavior

Design Metrics on Design Metrics on Object-Oriented Object-Oriented
Industrial SoftwareIndustrial Software

Study Data CharacteristicsStudy Data Characteristics
C++
9 classes
4 derived classes from one base class
67 class methods
8 free functions

Observations on Study Data FaultsObservations on Study Data FaultsObservations on Study Data FaultsObservations on Study Data Faults
22 faults were detected 7 of the class methods contained
20 faults 4 classes contained the 7 class
methods with faults 2 of the free functions contained
2 faults

Mapping OO Constructs to Design Mapping OO Constructs to Design Metric PrimitivesMetric Primitives
Mapping OO Constructs to Design Mapping OO Constructs to Design Metric PrimitivesMetric Primitives
Design metrics at the class level Design metrics at the method and
function level
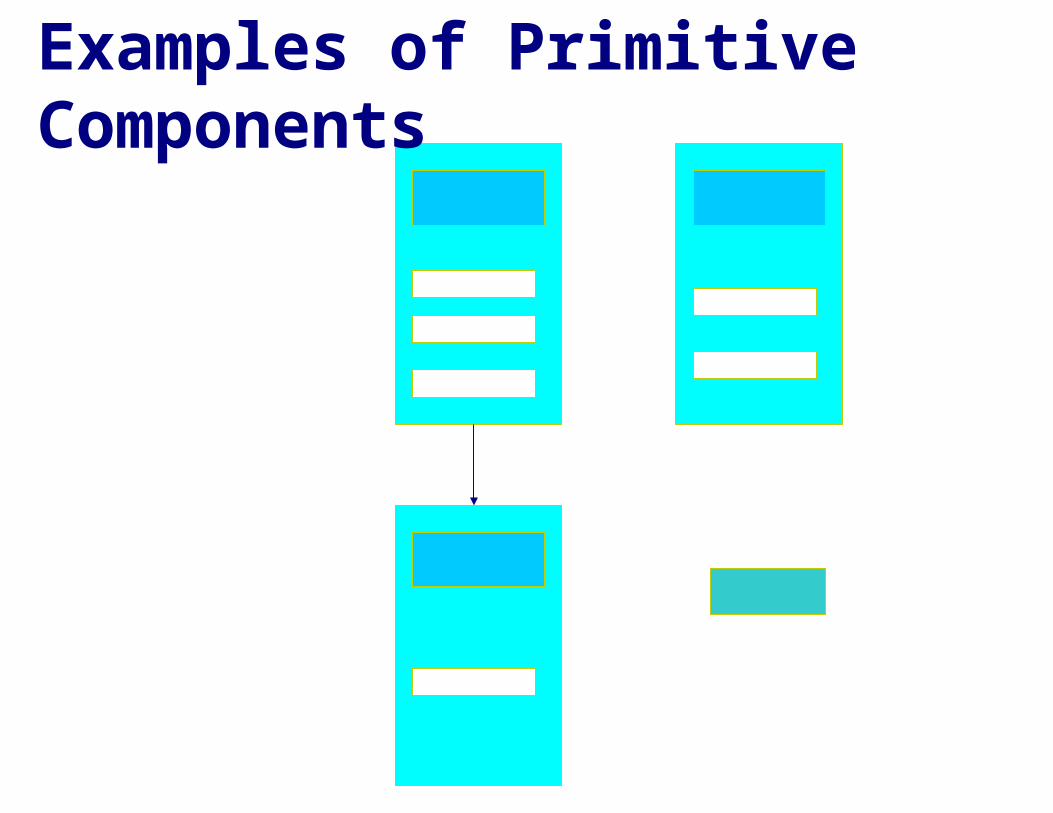
Examples of Primitive Components

Examples of Primitive Components

Design Metrics at the Method LevelDesign Metrics at the Method LevelDesign Metrics at the Method LevelDesign Metrics at the Method Level
CMDe = (method inflows * method outflows) + (fan-in*fan-out)
CMDi = CentralCalls + DataStructureManipulations + I/O
CMD(G) = CMDe + CMDi

Design Metrics at the Class LevelDesign Metrics at the Class LevelDesign Metrics at the Class LevelDesign Metrics at the Class Level
CDe = (class inflows * class outflows) + the sum of class methods’ CMDe
CDi = the sum of class methods’ CMDi
CD(G) = CDe + CDi

Applying OO Design MetricsApplying OO Design MetricsApplying OO Design MetricsApplying OO Design Metrics Applied to four C++ programs
Three small object-oriented trial programs
~ 500 LOC One object-oriented industrial
software project ~ 5000 LOC

CM
De
CM
Di
CM
De a
nd
CM
Di
CM
De a
nd
CM
Di +
CD
(G)
Mods Highlighted 9% 9% 4% 11%Highlighted Mods with Faults 57% 57% 100% 88%Faults Found 59% 68% 55% 86%False Positives 43% 43% 0% 12%
OO System Metric Analysis
Future Research DirectionFuture Research Direction
Further investigation of the applicability of CDe, CDi, CMDe and CMDi as indicators of fault-prone components

Potential Benefits of Design Potential Benefits of Design Metrics Research for the Metrics Research for the
Software ProductSoftware Product identification of design stress points early indication of project status limit design complexity modularization so that the resulting
modules are both testable and maintainable
analysis of the impact of changes on the rest of the system
analysis of version or system builds

Potential Benefits of Design Potential Benefits of Design Metrics Research for the Metrics Research for the
Software ProcessSoftware Process identification of potential problems early in
the life cycle selection of alternative designs modularization so that the resulting
modules are both testable and maintainable allocation of testing resources review of design architecture as one
considers rejuvenation alternatives

OutlineOutline
IntroductionIntroduction
Metric Definitions, ProjectsMetric Definitions, Projects
Research ResultsResearch Results
Design Metrics AnalyzersDesign Metrics Analyzers
Extending DM TechnologyExtending DM Technology
AppendixAppendix
Click a button for more information

Visit our homepage at http://www.cs.bsu.edu/~metrics/
DESIGNMETRICS
DESIGNMETRICS
Design Metrics AnalyzerDesign Metrics AnalyzerDesign Metrics AnalyzerDesign Metrics AnalyzerDesign Metrics AnalyzerDesign Metrics Analyzer

DMA ReportsDMA Reports
Metric Stress-Point Content Information

Metric ReportsMetric Reports
three composite design metrics, De , Di and D(G)
three composite design metrics, De , Di and D(G) on packages
thirteen metrics, both composite and primitive design metrics
extra metrics, including LOC and counts of some syntactic constructs used
design balance of the system

Stress-Point ReportsStress-Point Reports
module and package level summaries of the analysis of each of the
design metrics De (de_stress*.rpt) Di (di_stress*.rpt) D(G) (dg_stress*.rpt) statistical view names of highlighted modules and their
file names

Content Information ReportsContent Information Reports
overloaded module information files analyzed connectivity call structure
call index variable table set analysis postscript Venn

Overloaded ReportOverloaded Report
contains a listing of overloaded module names and their parameters
names are uniquely identified by appending three underscores and a constant to the module name
informs developers of the number of modules with the same name and parentage
helps with referencing module names from other reports
overload.rpt

Module Information ReportModule Information Report
textual summary of each module modules called and called by whether called modules were submitted
to the tool (missing information) global variables accessed and/or modified imports of the module (with and use lists)
unit_info.rpt

Files Analyzed ReportFiles Analyzed Report
contains file names submitted to the tool and a physical line count for each
provides a reference point for the user to check that the appropriate files were submitted to the DMA
files_analyzed.rpt
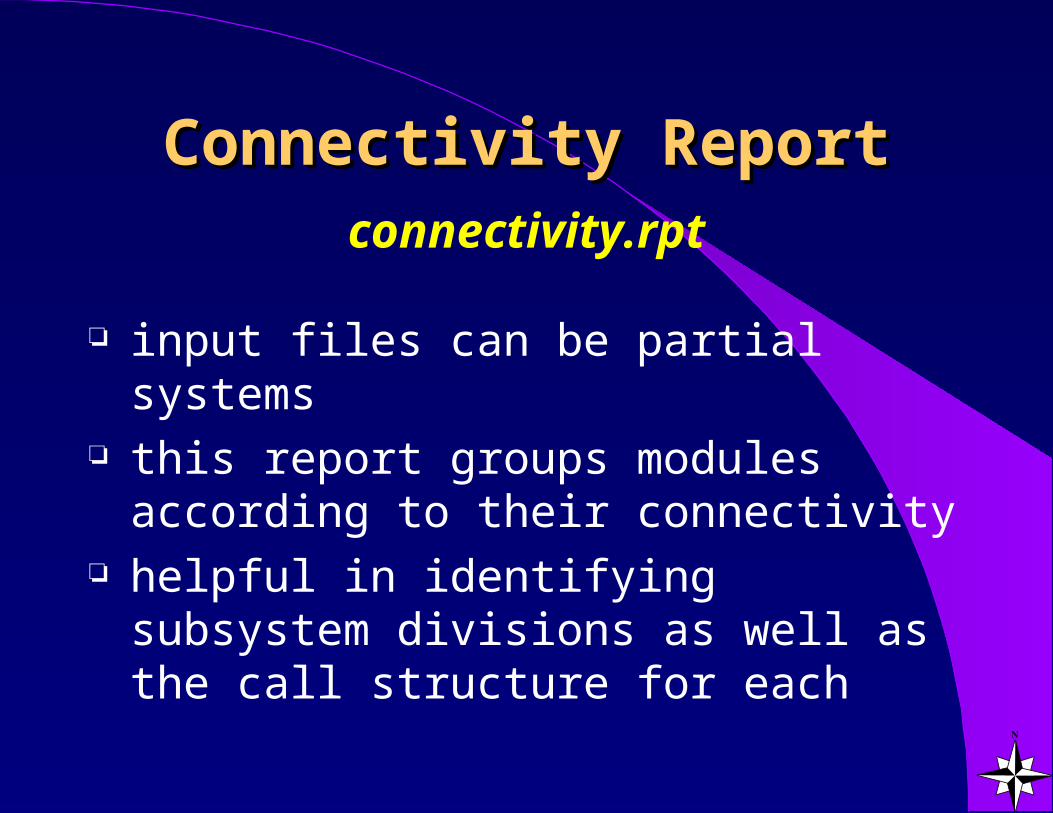
Connectivity ReportConnectivity Report
input files can be partial systems this report groups modules
according to their connectivity helpful in identifying subsystem
divisions as well as the call structure for each
connectivity.rpt

Connectivity Report ExampleConnectivity Report Example
Subsystem Information ________________________________________________The files submitted to the DMA contained 2 subsystemsSubsystem 1 : 3 modules
: 1 zero fan-in modulesSubsystem 2 : 5 modules
: 2 zero fan-in modules

Call Structure ReportCall Structure Report
uses indented notation to signify subordinate modules
helpful to developers, maintainers and testers
call_struct.rpt

Example Call StructureExample Call Structure
A
B
C
D
E F G
H

Call Structure Report ExampleCall Structure Report Example
Subsystem 1 Section 1
Connected under root module : Apage 1reference 11 A2 B3 C
Subsystem 2 Section 1
Connected under root module : Dpage 1reference 11 D2 F3 H4 G
Subsystem 2 Section 2
Connected under root module : Epage 1reference 11 E2 H

Call Index ReportCall Index Report
alphabetized module index for the call structure report
provides the subsystem, section, page reference, and line number of each module listed in the call structure report
call_index.rpt

Call Index Report ExampleCall Index Report Example
Subsystem Section Page Reference Line#A 1 1 1 1 1 B 1 1 1 1 2 C 1 1 1 1 3 D 2 1 1 1 1 E 2 2 1 1 1 F 2 1 1 1 2 G 2 1 1 1 4 H 2 1 1 1 3 H 2 2 1 1 2 I 2 2 1 1 2

Variable Table ReportVariable Table Report
provides a complete listing of variables and their types
lists where each variable is declared
variable access initialization and modification
var_table.rpt

Set Analysis ReportSet Analysis Report
listing of the module names that are identified as stress points by one, two or three of the design metrics
set_analysis.rpt

D(G) only....Di only....De only....Di and D(G)....De and D(G)....De and Di....De, Di and D(G)....
Set Analysis Report ExampleSet Analysis Report Example

Postscript Venn ReportPostscript Venn Report
graphically shows the number in each intersection of modules highlighted by De, Di, and D(G) in the form of a Venn diagram
venn.ps

Postscript Venn Report Postscript Venn Report ExampleExample
Highlighted Subprogram AnalysisHighlighted Subprogram Analysis
2 8
0
15
6
0
De Di
D(G)
De Highlighted = 23
Di Highlighted = 24
D(G) Highlighted = 22

Other ReportsOther Reports
generic.rpt rename.rpt


![SERC[1] Copy](https://static.fdocuments.net/doc/165x107/577d21281a28ab4e1e94a21a/serc1-copy.jpg)


![VTU – IISc Workshop (C)RG@SERC,IISc Compiler, Architecture and HPC Research in Heterogeneous Multi-Core Era R. Govindarajan CSA & SERC, IISc govind@[csa,serc].iisc.ernet.in.](https://static.fdocuments.net/doc/165x107/56649eeb5503460f94bfc78b/vtu-iisc-workshop-crgserciisc-compiler-architecture-and-hpc-research.jpg)


