Way2wealth Steel 27Sep10
29
Indian Steel Scenario Indian Steel Scenario Sep 2010 Sep 2010 Way2Wealth Way2Wealth making investing simpler, more understandable and profitable making investing simpler, more understandable and profitable. .
-
Upload
nishant-pathak -
Category
Documents
-
view
217 -
download
0
Transcript of Way2wealth Steel 27Sep10

7/30/2019 Way2wealth Steel 27Sep10
http://slidepdf.com/reader/full/way2wealth-steel-27sep10 1/29
Indian Steel ScenarioIndian Steel ScenarioSep 2010Sep 2010
Way2WealthWay2Wealthmaking investing simpler, more understandable and profitablemaking investing simpler, more understandable and profitable..

7/30/2019 Way2wealth Steel 27Sep10
http://slidepdf.com/reader/full/way2wealth-steel-27sep10 2/29
Commodity Update
9
9 Manufacturin
Indian Economy
9 Agriculture
9 Inflation & Interest Rates
9 Trade
9 FII & Credit Growth
9 Indian Steel Scenarioaw a er a – eserves, ro uc on ra e
9 Crude Steel – Capacity & Production
9 Consumption – Sector & Product
–
9 Global Steel Scenario
9 Domestic Steel Balance Sheet
9 Steel Companies under focus

7/30/2019 Way2wealth Steel 27Sep10
http://slidepdf.com/reader/full/way2wealth-steel-27sep10 3/29
Indian Economy – Manufacturing
- --
12.0
16.0
20.0
IIP Index Grow th
20.0
30.0
40.0
50.0
0.0
4.0
8.0
10.0
0.0
10.0
Manufactur ing (%-YoY) Other Manufactur ing (%-YoY)
4.0
Jul-02 Jul-03 Jul-04 Jul-05 Jul-06 Jul-07 Jul-08 Jul-09 Jul-10
Source:MOSPI
¾ Indian manufacturing growth remain positive via strong growth in capital goods and moderategrowth in consumer goods & Others
20.0
Jul-02 Jul-03 Jul-04 Jul-05 Jul-06 Jul-07 Jul-08 Jul-09 Jul-10
Source:MOSPI
¾ Strong order book, expansion mode by major Corporates amid optimistic consumerism augur well
with steady IIP growth with Metal, Automobile and SME enterprises in focus
¾ Latest IIP growth of 13 percent induced higher volatility and moving forward base effect & higher
¾ Despite hiccups, moving forwards from higher interest rates & uncertain global markets; Govt
additional spending on supplementary demand for grants coupled with higher outlay for
Infrastructure Capex, keep IIP to remain above/around +8.5 percent
7/30/2019 Way2wealth Steel 27Sep10
http://slidepdf.com/reader/full/way2wealth-steel-27sep10 4/29
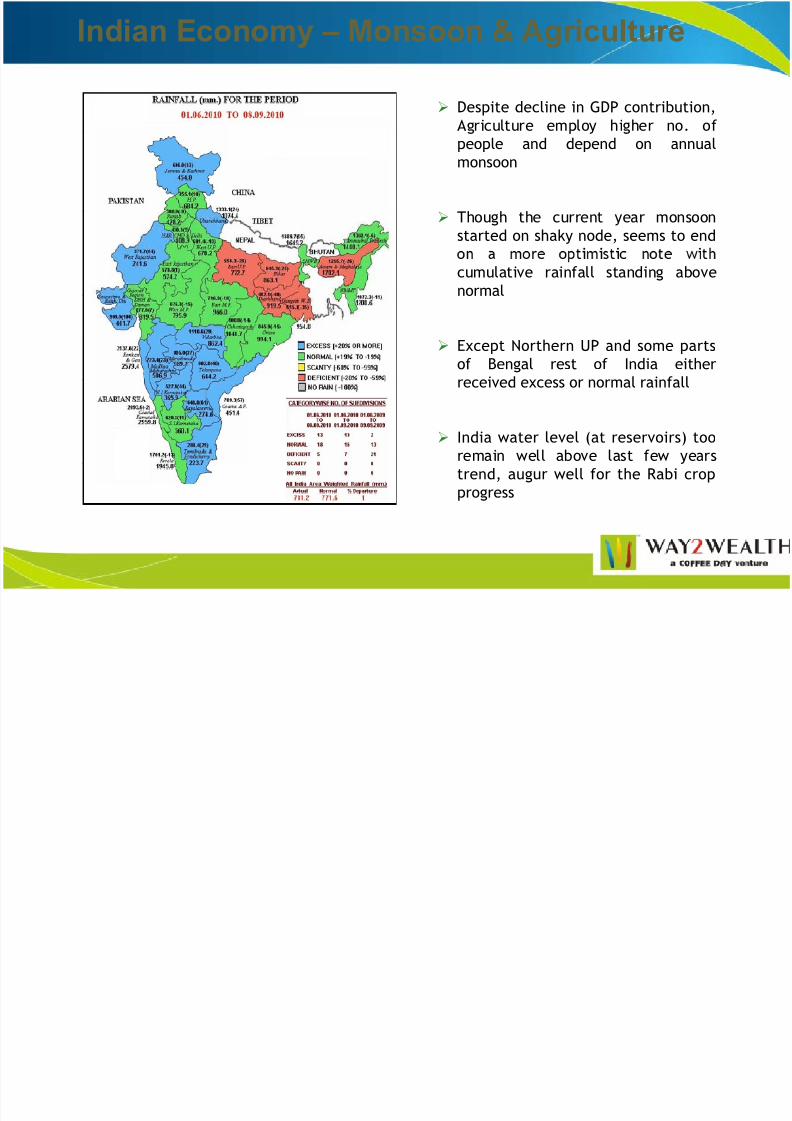
Indian Economy – Monsoon & Agriculture
¾ Despite decline in GDP contribution,Agriculture employ higher no. of
people and depend on annual
monsoon
¾ Though the current year monsoon
started on shaky node, seems to end
cumulative rainfall standing above
normal
¾ Except Northern UP and some parts
of Bengal rest of India either
received excess or normal rainfall
¾ India water level (at reservoirs) too
remain well above last few years
trend, augur well for the Rabi crop
progress

7/30/2019 Way2wealth Steel 27Sep10
http://slidepdf.com/reader/full/way2wealth-steel-27sep10 5/29
Indian Economy – Inflation & Interest rates
-
5.0
10.0
15.0
20.0n a - ey n eres a es
7
8
9
10
10.0
5.0
0.0
WPI Total WPI Prim ArtiWPI Manf WPI Fuel & power
3
4
5
6
¾ Though moderating off late, overall inflation remain above the double digit levels thanks to Non
.
Aug-07 Feb-08 Aug-08 Feb-09 Aug-09 Feb-10 Aug-10 29/02/2008 31/08/2008 28/02/2009 31/08/2009 28/02/2010 31/08/2010
CRR Repo Cut Off Rev Repo Cut Off Source: RBI
oo n a on
¾ Despite ease in food prices, strong demand, higher MSP and market based energy prices expected
to leave inflation a stubborn thorn in the months to come
¾ Moderation in IIP, good harvest and base impact to lower the inflation only by the end of the
year/fiscal period
¾ Credit/capital growth, energy imports and overall firmness in food prices made RBI change policy
stance towards controlling & anchoring inflation
’ ,
Nov’10
7/30/2019 Way2wealth Steel 27Sep10
http://slidepdf.com/reader/full/way2wealth-steel-27sep10 6/29
Indian Economy – Trade
Indian Trade Scenario (YoY-%)
40
60
80Indian Trade Balance
4000
0
4000
Surplus
20
0
20
- -
16000
12000
8000
Trade Balance (m ln USD)
Deficit
40
Nov-99 Mar-01 Jul-02 Nov-03 Mar-05 Jul-06 Nov-07 Mar-09 Jul-10
Source:RBI 20000
Nov-99 Mar-01 Jul-02 Nov-03 Mar-05 Jul-06 Nov-07 Mar-09 Jul-10
Source:RBI
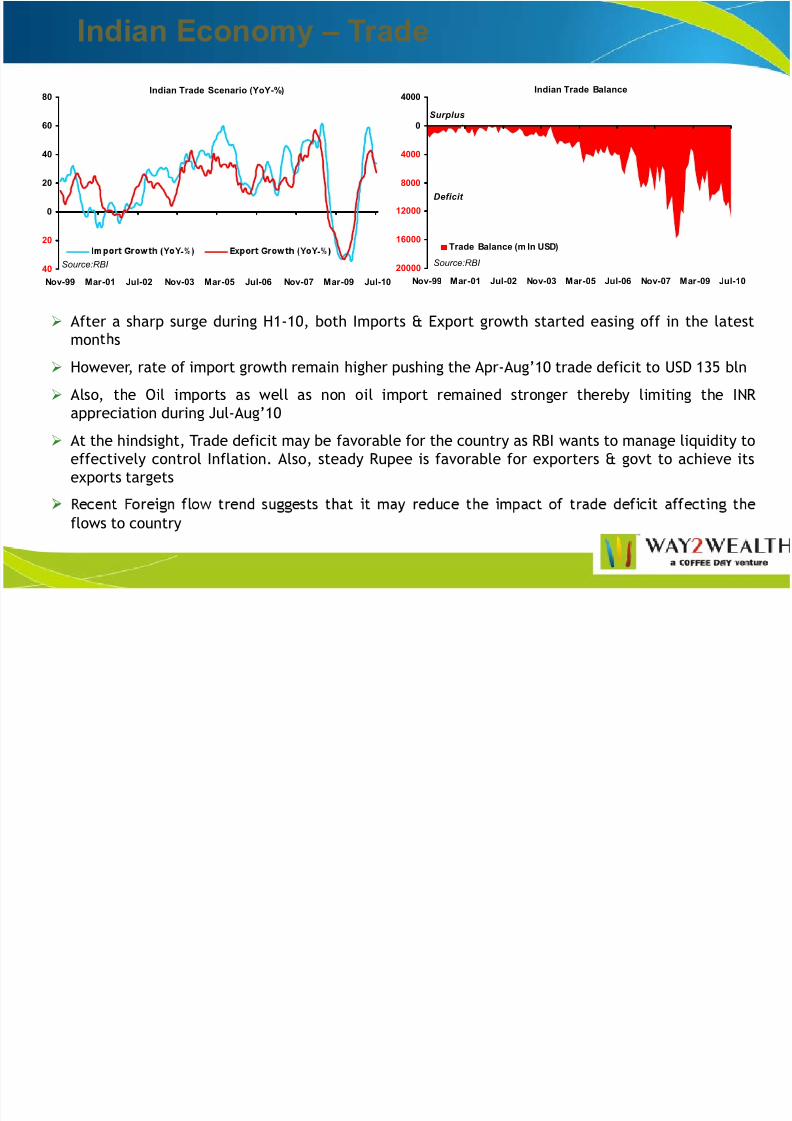
¾ After a sharp surge during H1-10, both Imports & Export growth started easing off in the latest
mon s
¾ However, rate of import growth remain higher pushing the Apr-Aug’10 trade deficit to USD 135 bln
¾ Also, the Oil imports as well as non oil import remained stronger thereby limiting the INR
appreciation during Jul-Aug’10
¾ At the hindsight, Trade deficit may be favorable for the country as RBI wants to manage liquidity to
effectively control Inflation. Also, steady Rupee is favorable for exporters & govt to achieve its
exports targets
flows to country

7/30/2019 Way2wealth Steel 27Sep10
http://slidepdf.com/reader/full/way2wealth-steel-27sep10 7/29
Indian Economy – Capital Flows & Credit
Net Foreign Investme nts - 3M Avg
1000
1500
2000
25003000
-
2
4
6
2
3
3
2000
1500
1000500
0
500
Net FII (Mln USD)
6
4
2
0
1
1
Total Food Non Food
Apr-06 Feb-07 Dec-07 Oct-08 Aug-09 Jun-10 Jul-07 Jan-08 Jul-08 Jan-09 Jul-09 Jan-10 Jul-10
Source:RBI
¾ Both FII & FDI continue to remain strong & Positive so far during FY10-11, while availability of other
forms of fund raising by corporate India could let credit growth remain slower
¾ Credit growth has picked up significantly from its recent lows to 18-20 percent levels with
expectations of the trend to remain upbeat as govt borrowing would be lower in H2
¾ Key concerns to credit growth is the increasingly direct access of credit by corporate in the primary
debt market coupled with fall in deposit growth.
¾ If deposit growth doesn't pick up to 17-18 percent levels then it may impede the credit growth given
the deficit systemic liquidity
¾ However, the money growth and overall optimism in the underlying economy augur well for the pick

7/30/2019 Way2wealth Steel 27Sep10
http://slidepdf.com/reader/full/way2wealth-steel-27sep10 8/29
Indian Economy – Capital Flows & Credit
2008-09 2009-10 2010-11 F
Real GDP 6.70 7.40 8.30
IIP 2.75 10.3 10.8
WPI 8.46 3.17 6.50
9.6
9.0
6.7
7.4
8.3
8
10
CPI 8.93 11.9 10.0
PLR 12.8 11.8 13.0
91-181 TB Yield 7.09 - 7.15 3.53 - 4.33 4.5 - 5.5
10 Yr G Sec Yield 7.6 7.2 8 2
4
6
Source: RBI, W2W Estimates
¾ Rise in investments, better than expected monsoon and GoI emphasis on creation of infrastructureaugur well for the Indian growth momentum to move from cyclical to structural
2004-05 2005-06 2006-07 2007-08 2008-09 2009-10 E 2010-11 F
Source:RBI, W2W Estimates
¾ However, normalizing incentives, monetary policy amid weaker external consumer call for
moderation during Q3 of FY 2010-11
¾ Upbeat in sentiments from monsoon, steady to upswing in the job market amid softer lending
-
¾ Despite ease in Food inflation (largely statistical) pick up in demand, limited capacity in short term,
firm commodity prices globally is expected to keep the inflation higher in the current cycle
¾ Emergence of a new crisis and untimely policy/inability to balance inflation/growth momentum are
t e ey r s to t e a ove out oo

7/30/2019 Way2wealth Steel 27Sep10
http://slidepdf.com/reader/full/way2wealth-steel-27sep10 9/29
Commodity Update
9 Indian Economy
9 Manufacturing
9 Agriculture
9 Inflation & Interest Rates
9 Trade
9 FII & Credit Growth
9
9 –Indian Steel Scenario
,
9 Crude Steel – Capacity & Production
9 Consumption Sector & Product
9 Demand Scenario – Em hasis On Infrastructure
9 Global Steel Scenario
9 Domestic Steel Balance Sheet
9 Steel Price Outlook
9 Steel Companies under focus

7/30/2019 Way2wealth Steel 27Sep10
http://slidepdf.com/reader/full/way2wealth-steel-27sep10 10/29
Indian Steel: Iron Ore - Reserves
14630Haematite
India Iron Ore Reserves
Source: JPC, in mln t
25249Total
10619Magnetite
¾ Ukraine, Russia, Australia, China and Brazil hold significant share in global Iron Ore reserves with
proven Iron content
¾ India’s share in global Iron Ore reserve base stand at +6 percent, equals to +25.2 bln tons spread
across Karnataka, Jharkhand, Orissa and Chhattisgarh
¾ India’s resources of iron ore are classified under Haematite–14.6 bln t and Magnetite-10.6 bln t
¾ India produces Iron Ore in all marketable products, like lumps, concentrates, pellets, powder and
sinter
¾ Beneficiation and Pelletization remain low in the Indian Iron Ore industry, which otherwise can
improve the quality

7/30/2019 Way2wealth Steel 27Sep10
http://slidepdf.com/reader/full/way2wealth-steel-27sep10 11/29
Indian Steel: Iron Ore - Production
314
257
200
250
300
350
20
25
30 Production Share of Iron Ore - India
62%
15%
0%
6.4 6.1
8.2
0
50
100
150
0
5
10
23%
- - - - -
Production (mln t) Production Growth (%-YoY)Source: JPC, W2W Source: JPC, W2W
¾ Amid absence of any new mining project, Indian Iron Ore production is largely driven by the
growth/demand for exports over the last decade
ue o prox m y an qua y na rema ne arges mpor er on spo mar e as s an a n urn
let the Indian Iron Ore production to register a CAGR growth of 16 percent during FY 2004-10
¾ Restriction on export (quality/tax), allocation of fresh mining and clampdown on illegal mining
expected to result in slower to steady pace of production during 2010~2013
¾ 62 percent of the Indian iron Ore production is of medium quality (Iron content between 62~65
percent), while high quality Ore production stand at 23 percent
¾ Our analysis shows that during 2010-15, the Indian Iron ore production is likely to register a CAGR
growth of +7 percent amid strong growth in domestic steel capacity
¾ As a result of which, we foresee limited export growth of Iron Ore in the future (2~3 years)

7/30/2019 Way2wealth Steel 27Sep10
http://slidepdf.com/reader/full/way2wealth-steel-27sep10 12/29
Indian Steel: Coal - Reserves
¾ North America, Russia, China and Australia hold major share in the global Coal reserves, while’
¾ India’s proven coal reserves stand at 105.8 bln tons (8 percent of the global reserves) with little
Coking coal (key for Iron & Steel) reserves ~ 4 percent of 105.8 bln tons
¾ Further Indian coal reserves contain high Ash content (avg~34.1)with low Carbon (avg~31.6)&
a or c va ue avg~
¾ Further majority of the Industry/production is in the hands of public sector companies limiting the
innovation/advancement in the process of production
¾ Thou h the NMDP-2008 su est ease in minin / roduction ermits recent develo ments across ke
producing states may keep the production growth below the targets

7/30/2019 Way2wealth Steel 27Sep10
http://slidepdf.com/reader/full/way2wealth-steel-27sep10 13/29
Indian Steel: Coal – S&D & Imports
India Coal Scenario - S&D Growth
15.0
20.0
25.0
Production Growth
Consumption Growth
130
150
170
190
Import Requirements
(mln t)
5.0
10.0
30
50
70
90
0.0
2000-01 2003-04 2006-07 2009-10 2012-13 FSource: MoC, W2W Research
10
2000-01 2004-05 2008-09 2012-13 FSource: MoC W2W Research
¾ Upcoming projects in Power Generation, Cement and Iron & Steel are expected to keep thedomestic consumption of coal at a scorching pace
¾ On the other hand, the current production trend and policy suggest the domestic supply to remain
below the consumption and thereby open the door for significant rise in coal/coke imports
¾ Iron and Steel sector is expected to drive the demand by an average +10 percent, Power Sector and
~
¾ However, the pace of production may alter (probably on the higher side) as the mining policy
towards fuel mineral is expected to change over the due course
¾ Despite ‘major’ steel players are integrated and are scouting for resources elsewhere, the average
global coal prices are expected to remain higher during 2010-12

7/30/2019 Way2wealth Steel 27Sep10
http://slidepdf.com/reader/full/way2wealth-steel-27sep10 14/29
Indian Steel: Crude Steel – Capacity
93
80
73
112
21
16
80
100
120
15
20
25
7366
60
86
1850
60
70
80
90
10
12
14
16
18
20
9
0
20
40
0
5
1010
0
10
20
30
2004-05 2006-07 2008-09 2010-11 E 2012-13 F
0
24
6
8
- - - - -
Crude Capacity (mlnt) Capacity Growth (%-YoY)Source: JPC, W2W
¾ An expanding consumer market make India a place for host of steel companies to set up
manufacturing capacities
Finished Steel Production Crude Steel Prod Growth (%-YoY)
Source: JPC, W2W
m suppor ve po cy rom o , e omes c s ee sec or as a rac e a s agger ng nves men o
about USD 238 billion, during 2008-10 consisting 222 MoUs signed
¾ Majority of the new capacities are of brown field (74 percent) and are coming up across Orissa,
Jharkhand, Chhattisgarh, Karnataka and West Bengal
¾ Although the industry is exhibiting positive growth, it is facing some major challenges also in terms
of regulatory barriers in land acquisition, raw material availability and other issues
¾ The best case scenario suggest that Indian crude steel capacity to register a CAGR growth of 11.4
percent during 2010-13 reaching 112.3 mln tons
¾ As a result of expanding capacities, Indian crude steel production would also register a CAGR growthof 10.7 percent during 2010-13 to reach +97 mln tons
7/30/2019 Way2wealth Steel 27Sep10
http://slidepdf.com/reader/full/way2wealth-steel-27sep10 15/29
Indian Steel: Demand – Sector & Product
Consum tion Share of Finished Steel - Sectorwise Consumption Share of Finished Stee l - Productwise
13%
11%
19%
32%
17%
Constr & Infra Manuf Automobiles Others
35%
11%
3%
Bar & Rod HR Coil CR Coil GP/GC Sheets HR Sheets
Source: JPC, W2W Source: JPC, W2W
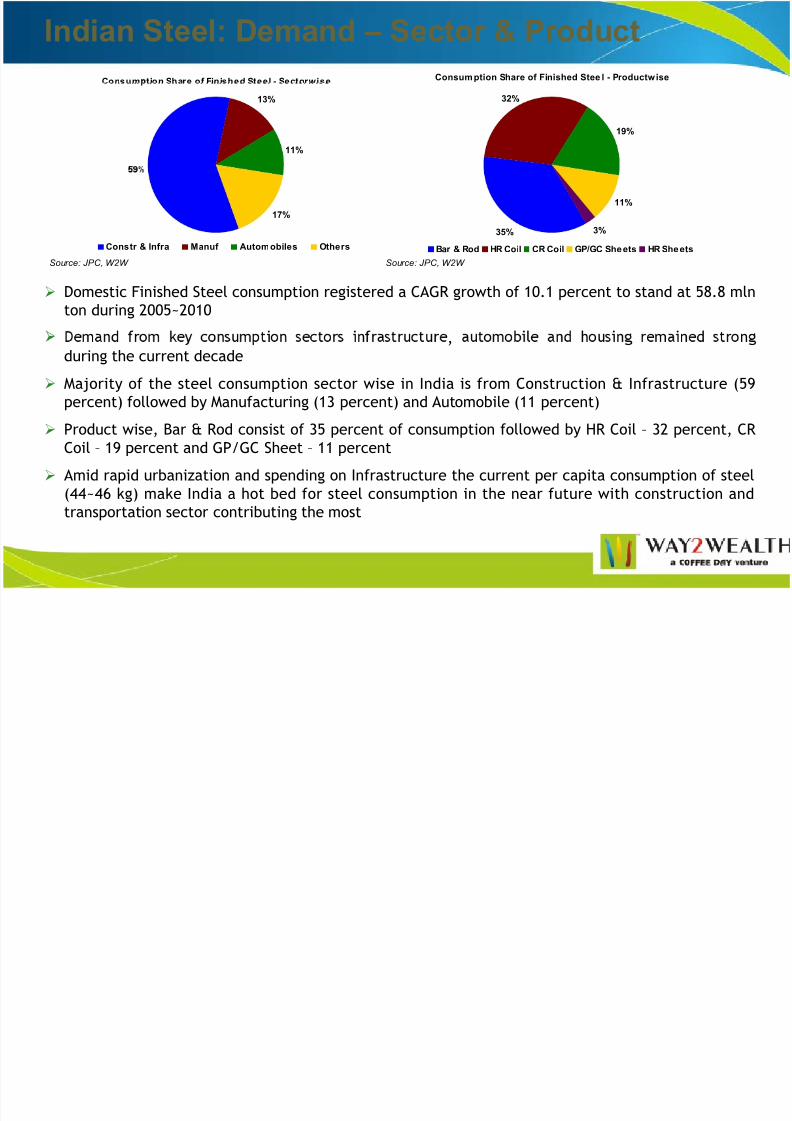
¾ Domestic Finished Steel consumption registered a CAGR growth of 10.1 percent to stand at 58.8 mln
ton during 2005~2010
,
during the current decade
¾ Majority of the steel consumption sector wise in India is from Construction & Infrastructure (59
percent) followed by Manufacturing (13 percent) and Automobile (11 percent)
¾ Product wise, Bar & Rod consist of 35 percent of consumption followed by HR Coil – 32 percent, CR
Coil – 19 percent and GP/GC Sheet – 11 percent
¾ Amid rapid urbanization and spending on Infrastructure the current per capita consumption of steel
(44~46 kg) make India a hot bed for steel consumption in the near future with construction and
transportation sector contributing the most

7/30/2019 Way2wealth Steel 27Sep10
http://slidepdf.com/reader/full/way2wealth-steel-27sep10 16/29
Indian Steel: Demand – Infrastructure
Infrastructure¾ The basic facilities, services, and installations - of a country or community - such as transportation
network, communications systems, water, power lines, Roads & Buildings and Other public
institutions is considered essential for enablin roductivit of an econom and re uire hu e
initial investments
¾ During early 80’s infrastructure was defined primarily with respect to the nation’s public works and
.
According to Dr. C. Rangarajan Commission, Infrastructure in India include,
¾ Railways (Tracks, Signalling systems, Stations etc)
oa s r es
¾ Airports, Runways and Other facilities
¾ Electricity (T&D)
¾ Pipelines (water, energy and other)
¾ Port facilities
7/30/2019 Way2wealth Steel 27Sep10
http://slidepdf.com/reader/full/way2wealth-steel-27sep10 17/29
Indian Steel – Demand – Infrastructure
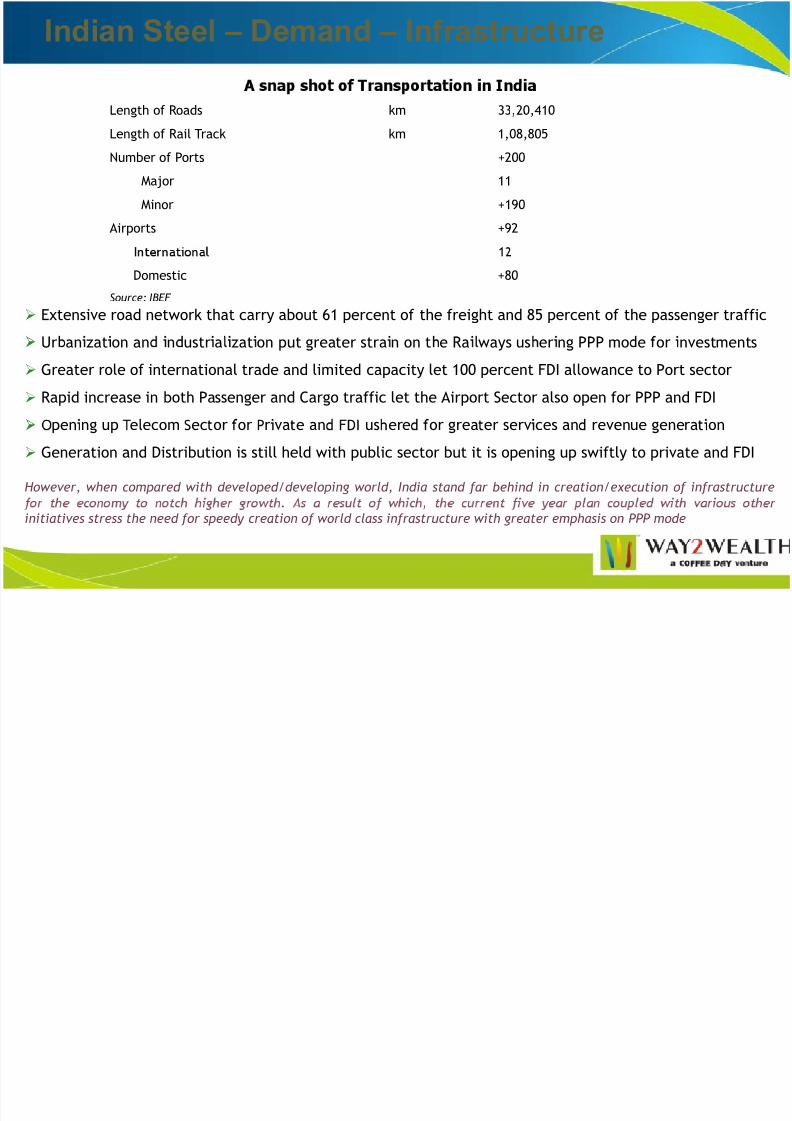
Length of Roads km 33,20,410
Length of Rail Track km 1,08,805
Number of Ports +200
Major 11
Minor +190Airports +92
Domestic +80
Source: IBEF
¾ Extensive road network that carry about 61 percent of the freight and 85 percent of the passenger traffic
Ur an zat on an n ustr a zat on put greater stra n on t e Ra ways us er ng PPP mo e or nvestments
¾ Greater role of international trade and limited capacity let 100 percent FDI allowance to Port sector
¾ Rapid increase in both Passenger and Cargo traffic let the Airport Sector also open for PPP and FDI
pen ng up e ecom ec or or r va e an us ere or grea er serv ces an revenue genera on
¾ Generation and Distribution is still held with public sector but it is opening up swiftly to private and FDI
However, when compared with developed/developing world, India stand far behind in creation/execution of infrastructure
. ,
initiatives stress the need for speedy creation of world class infrastructure with greater emphasis on PPP mode

7/30/2019 Way2wealth Steel 27Sep10
http://slidepdf.com/reader/full/way2wealth-steel-27sep10 18/29
Indian Steel – Demand – Infrastructure
-
80
100
120
140-
3.3
3.0
2.6
1.92
3
3
4
20
40
60
Actual Outla USD bln Pro ected Outla USD bln
1.0
1
1
2
0
2003-04 2005-06 2007-08 2009-10 2011-12Source: Planning Commiss ion
¾ Total lanned outla for infrastructure for 11th FYP um ed b 138.9 ercent to USD 514 bln from
2003-04 2005-06 2007-08 2009-10 2011-12Private Sector Contribution to Infrastructure (as a % of GDP)
Source: Planning Commission
USD 218 bln during the 10th FYP
¾ However, hurdled by various policy issues in identifying, granting and allocating finances, the
expenditure is expected to be lower than the projected/assumed outlay
,push the overall spending on infrastructure from current 7 percent of GDP to +8.5 percent of GDP
by 2012
¾ Despite all the above, India still need to spend more than USD 1 trillion on infrastructure by 2020
,

7/30/2019 Way2wealth Steel 27Sep10
http://slidepdf.com/reader/full/way2wealth-steel-27sep10 19/29
Indian Steel: Demand – Infrastructure
¾ Power generation and Distribution continue to’
India - Investments Into Infrastructure
8.49
followed by Roads & Telecom
¾ However, under the 11th FYP Sea Ports &
Airways increased the share of investments
with sli ht decline in the Road and Rail4.8
5.9
7.5
.
5
6
7
8
¾ PPP mode of operations and increased
allocation in the planned investments augur
well for infrastructure growth2
3
4
2003-04 2005-06 2007-08 2009-10 2011-12
As a % of GDPSource: Planning Commission

7/30/2019 Way2wealth Steel 27Sep10
http://slidepdf.com/reader/full/way2wealth-steel-27sep10 20/29
Indian Steel: Demand – Infrastructure
Planned Expansion of Roads
60000
80000
100000
Power Generation (MWh)
15000
20000
25000
Thermal Hydro
Nuclear Total
0
20000
40000
Target (in km)
0
5000
10000
- - - - - - -
Source: Planning Commission
Planned Expansion of Port Capacity1300
- - - -Source: Planning Commission
¾Near term targets for road, power and portremain higher when compared to the 10th FYP
700
900
1100¾ Achieved targets so far remain low in Road and
Power, while the capacities at ports are
increasing
¾ Elsewhere rivate artici ation in housin
300
500
2005-06 2006-07 2007-08 2008-09 2009-10 2010-11 2011-12
Port Capacity (mln t)
Source: Planning Commission
urban facilities and telecom continue to
increase the capacities

7/30/2019 Way2wealth Steel 27Sep10
http://slidepdf.com/reader/full/way2wealth-steel-27sep10 21/29
Indian Steel: Demand – Infrastructure
As infrastructure inadequacies would constitute a significant constraint in realizing the potential
growth of the economy an ambitious programme of infrastructure investment has been developed
for the 11th FYP
¾ RGGVY – Rajiv Gandhi Grameen Vidyutikaran Yojana – Electricity Distribution
– –
¾ JNNURM – Jawaharlal Nehru National Urban Renewal Mission – Urban Infrastructure
¾ AIBP – Accelerated Irrigation Benefit Programme – Irrigation and Canal Development
¾ NHDP – National Highways Development Programme – Roads
¾ NMDP – National maritime Development Programme – Ports
¾ MRTS – Mass Rapid Transport Systems – Urban Transport
7/30/2019 Way2wealth Steel 27Sep10
http://slidepdf.com/reader/full/way2wealth-steel-27sep10 22/29
Indian Steel: Demand – Automobile
Investments Into Auto Sector - India
7.2 7.3
9.0
12.0
8.0
10.0
12.0
14.0Indian Automobile Sector
16%
0.71.2 1.2 1.3
0.0
2.0
4.0
6.075%
5%
4%
- - - -FDI in to Automobile (bln USD)
Domestic Inv's into Auto Compone nts (bln USD)Source: DIPP, ACMA
Two Wheeler's Passenger Vehicles
Three Wheeler's Commerical Vehicless
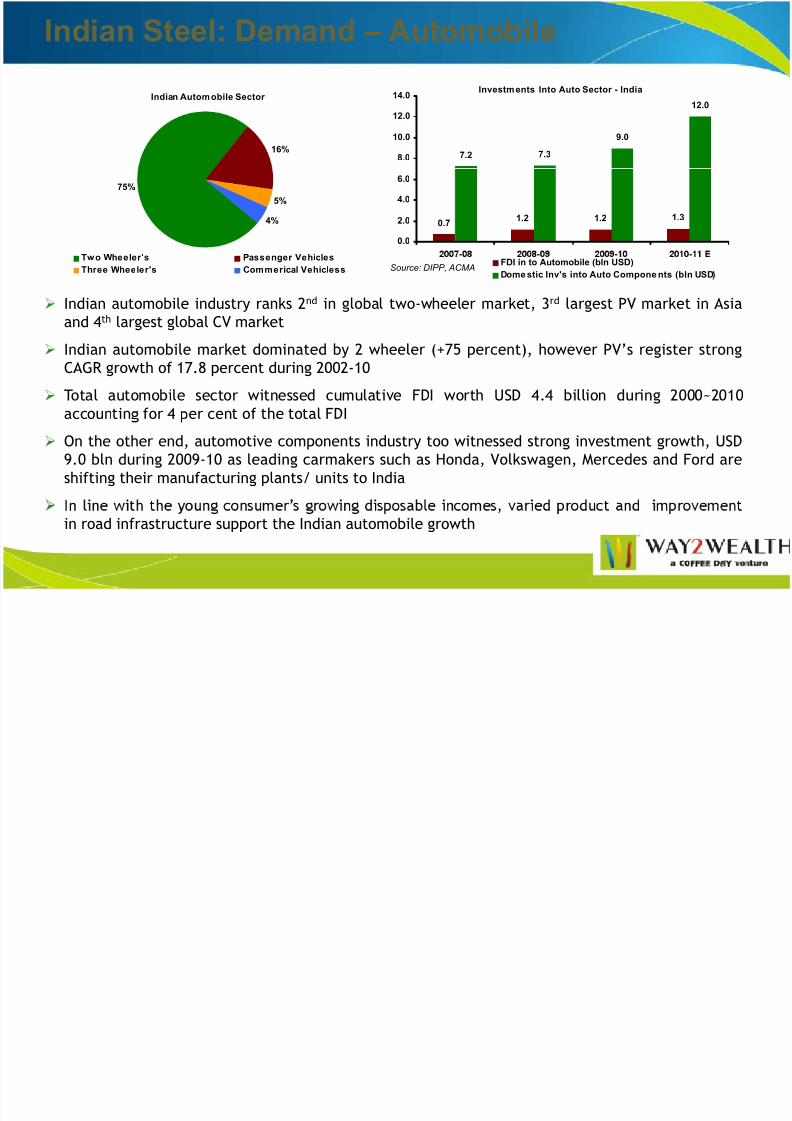
¾ Indian automobile industry ranks 2nd in global two-wheeler market, 3rd largest PV market in Asia
and 4th largest global CV market
¾ Indian automobile market dominated by 2 wheeler (+75 percent), however PV’s register strong
CAGR growth of 17.8 percent during 2002-10
¾ Total automobile sector witnessed cumulative FDI worth USD 4.4 billion during 2000~2010
accountin for 4 er cent of the total FDI
¾ On the other end, automotive components industry too witnessed strong investment growth, USD
9.0 bln during 2009-10 as leading carmakers such as Honda, Volkswagen, Mercedes and Ford are
shifting their manufacturing plants/ units to India
’ ,
in road infrastructure support the Indian automobile growth

7/30/2019 Way2wealth Steel 27Sep10
http://slidepdf.com/reader/full/way2wealth-steel-27sep10 23/29
Indian Steel: Final Demand – Sector wise
2009-
10 2012-13 F CAGR GrowthAutomobile 6.5 10.3 16.7
Construction 23.5 33.2 12.2
Indian Finished Stee l Consumption & Grow th
7265
59
79
10.310.310.750
60
70
80
90
10
12
14
16
. . .
Manufacturing 7.1 9.1 8.8
Railways 3.2 3.9 6.0
Other Manf 3.9 4.6 5.3
Others 12.2 14.8 6.7 0
10
20
30
40
0
2
4
6
8
Source: MoS, W2W Research, in mln tons finished steel
¾ Automobile & auto components, Construction, Household Appliances (white goods) and-
2004-05 2006-07 2008-09 2010-11 E 2012-13 F
Domestic FS Consum ption Consumption Growth (%-YoY)
Source: JPC, W2W Research
¾ Assuming Indian GDP to register an average GDP growth of +8.32 percent during 2010-13,
domestic finished steel consumption estimated to grow at a CAGR of +9 percent to reach +79 mln
tons
¾ However, steady consumer at matured economies and any unforeseen spillover of risks can limit
the above estimated growth
¾ The same is expected to register a higher CAGR growth of +9.2 percent to reach +82 mln tons if
the external and internal economy remain robust and intensity of consumption increase with
growth
7/30/2019 Way2wealth Steel 27Sep10
http://slidepdf.com/reader/full/way2wealth-steel-27sep10 24/29
Steel: Global Dynamics
Raw Material
¾ Above cash cost prices over the last few years and significant amount of Capex to boost Iron ore miningcapacity & production in the medium term (6~8 months)
¾ Global Iron ore production set to register a CAGR growth of 5.7percent with incremental gains coming from
India China and Latin American countries
¾ Global coking coal production continue to suffer mild set back in short term (3~6 months) with majority of
the new capacities are coming up with execution risks¾ During 2011-12, global Iron ore prices would trend south steadily, while Coking Coal prices would remain
firm from the current levels
Supply
¾ Global supply of finished steel remain well balanced with emerging Asia add on new capacities, while thatof the matured economies increases the operating rate.
¾ After China & India, Japan, Korea and Taiwan continue to add the production gains
¾ Longs production remain strong across South Asia, while flat and semis production to remain strong in China
Demand ¾ Strong demand coming from emerging Asia and concentrated in India and China
¾ Demand remain robust from transportation, house hold appliances amid steady demand from
infrastructure, construction and housing
,
across

7/30/2019 Way2wealth Steel 27Sep10
http://slidepdf.com/reader/full/way2wealth-steel-27sep10 25/29
Indian Steel: Balance Sheet
2008-09 2009-10 2010-11 E 2011-12 F 2012-13 F
Finished Steel Production 57 60 66 73 86
Imports 5.8 7.2 7.7 5.7 6.2
o a upp y
Domestic FS Consumption 53 59 65 72 79
Exports 4.0 3.2 4.0 4.7 5.5
S&D Balance 5.1 4.9 4.6 1.8 7.0
Source: MoS, W2W Research, In mln tons
¾ Demand is estimated to remain robust & above production, resulting domestic S/D to remain
balanced in the short run
¾ However as demand would outpace during Q4-10 CY to Q2-11 CY Indian S/D would turn tight,
¾ As new capacities comes up with execution risk amid high dependency on key raw materials, the
average steel prices are set to move steadily higher during 2010-12
¾ Average domestic Mild Steel Ingots ( Mandi Gobindgarh) prices are likely to move higher
y13.5~16.8 percent n FY 10 15~18 percent n FY 11

7/30/2019 Way2wealth Steel 27Sep10
http://slidepdf.com/reader/full/way2wealth-steel-27sep10 26/29
Indian Steel: Technical Scenario 1
ee ngo s on nuous ar on
40000
3
5
30000
35000
B[A]
[C](5)(3)
31,000
27,000
20000
250004
(1)
[B](4)
(2)
23,000
15000
Jan-07 Nov-07 Sep-08 Jul-09 May-10
A
Source:Bloomberg,Way2Wealth Research
¾ We believe, steel has entered B primary wave correction and the current upwards correction is
expected to conclude at ` 31,000 in next couple of months
¾ As it is forming a wedge pattern, initially steel can correct back to ` 23,000, which would be the
opportunity for longs to accumulate for subsequent targets of ` 27,000 & ` 31,000 subsequently

7/30/2019 Way2wealth Steel 27Sep10
http://slidepdf.com/reader/full/way2wealth-steel-27sep10 27/29
Indian Steel – Outlook & Strategy
Global S/D to remain
steady in medium term
Asian S/D to remain
As prices are
supported by raw
material firmness in
the short run and
As raw material pricesare expected to calm
down in medium term
investors should also
Steel tighter in the medium
term
Indian demand to
outpace the supply in
ec n ca y, s ee oo s
attractive at the base of
22000-24000 levels,
which gives opportunity
for an upside target of
-
demand in the
medium term,
Go LONG on Steel
Long GHZ @ INR
~
expose emse ves o
gain from the volumetric
growth besides price
growth. Go LONG on
steel majors like TATA &
Supply to remain firm in
As Iron ore prices are
expected to ease down
globally albeit with
robust demand growth in
Iron Ore
concerns over new
mining and trade
Supply to remain healthy
with new production
,
companies may witness
slower revenue growth.
However short term
strength and volatility in
However, as industry try
to converge from long
term contracts to
quarterly with
the best of the available
stocks for gains
Look for building Long
in SESA GOA on
volatility intact

7/30/2019 Way2wealth Steel 27Sep10
http://slidepdf.com/reader/full/way2wealth-steel-27sep10 28/29
Indian Steel: Stocks in Focus
COMPANY PRODUCTS
Tata Flat Lon Tube and Wire
JSW HR, CR, Galvanized Sheet
Sesa Goa Iron Ore, Pig Iron & Coke
NMDC Iron Ore
Adhunik Metallic Medium Integrated company
Raj Ratan Global Wire
Kalyani Pig Iron, Steel, Tube
Maharashtra Seamless Pipes & Tubes
7/30/2019 Way2wealth Steel 27Sep10
http://slidepdf.com/reader/full/way2wealth-steel-27sep10 29/29
Thank you
Research Department
Premise A, 15th Floor, Chandramukhi Building, Backbay Reclamation,
Nariman Point (near Inox Theatre), MUMBAI : 400021
Phone: 022 4019 2900, Fax: 022 40192939