Wavelet Test of Multifractality of Asia-Pacific Index ...web.usm.my/journal/aamjaf/vol...
21
AAMJAF, Vol. 2, No. 1, 63–83, 2006 ASIAN ACADEMY of MANAGEMENT JOURNAL of ACCOUNTING and FINANCE WAVELET TEST OF MULTIFRACTALITY OF ASIA-PACIFIC INDEX PRICE SERIES Rossitsa Yalamova Department of Finance, Faculty of Management, University of Lethbridge, 4401 University Dr, W. Lethbridge, 71K 3M4, Canada Corresponding author: [email protected] ABSTRACT This paper argues for the superiority of multifractal over ARCH methods where the objective is to understand market microstructure based on accurate volatility modeling. The paper examines the multifractality of index price series on daily data of Nikkei 225, All Ordinaries, Hang Seng, KLSE Composite and Straits Times Index. Wavelets, short form waves with local support are used for time/scale decomposition of financial time series. The multifractal spectrum (MFS) of daily index prices is calculated with Wavelet Transform Modulus Maxima method described in Yalamova (2003). The MFS may reveal trading time irregularities suggested by the Multifractal Model of Asset Returns (Calvet & Fisher, 2002). The trading time deformation process may uncover information on the efficiency of the trading system that would be useful for regulatory and reorganization purposes. Multifractals describe the cascade of volatility of returns and are suited for research at different time scales simultaneously unlike ARCH type models. In addition, this method provides dimension estimates for the detection of emerging chaotic patterns. The Hurst exponent calculated from the scaling function indicates persistence in volatility of index returns. The choice of data around the October 1997 drawdown is based on the scientific evidence that markets as complex dynamical systems reveal their properties better in extreme conditions. Keywords: wavelet transform, market microstructure, multifractals, volatility INTRODUCTION Growing competition between different stock exchanges raises the general objective of finding the most efficient way to organize securities trading. Toward the end, financial market microstructure research has determined certain 63
Transcript of Wavelet Test of Multifractality of Asia-Pacific Index ...web.usm.my/journal/aamjaf/vol...

AAMJAF, Vol. 2, No. 1, 63–83, 2006 ASIAN ACADEMY of
MANAGEMENT JOURNAL of ACCOUNTING
and FINANCE
WAVELET TEST OF MULTIFRACTALITY OF ASIA-PACIFIC INDEX PRICE SERIES
Rossitsa Yalamova
Department of Finance, Faculty of Management, University of Lethbridge,
4401 University Dr, W. Lethbridge, 71K 3M4, Canada
Corresponding author: [email protected] ABSTRACT This paper argues for the superiority of multifractal over ARCH methods where the objective is to understand market microstructure based on accurate volatility modeling. The paper examines the multifractality of index price series on daily data of Nikkei 225, All Ordinaries, Hang Seng, KLSE Composite and Straits Times Index. Wavelets, short form waves with local support are used for time/scale decomposition of financial time series. The multifractal spectrum (MFS) of daily index prices is calculated with Wavelet Transform Modulus Maxima method described in Yalamova (2003). The MFS may reveal trading time irregularities suggested by the Multifractal Model of Asset Returns (Calvet & Fisher, 2002). The trading time deformation process may uncover information on the efficiency of the trading system that would be useful for regulatory and reorganization purposes. Multifractals describe the cascade of volatility of returns and are suited for research at different time scales simultaneously unlike ARCH type models. In addition, this method provides dimension estimates for the detection of emerging chaotic patterns. The Hurst exponent calculated from the scaling function indicates persistence in volatility of index returns. The choice of data around the October 1997 drawdown is based on the scientific evidence that markets as complex dynamical systems reveal their properties better in extreme conditions. Keywords: wavelet transform, market microstructure, multifractals, volatility INTRODUCTION Growing competition between different stock exchanges raises the general objective of finding the most efficient way to organize securities trading. Toward the end, financial market microstructure research has determined certain
63

Rossitsa Yalamova characteristics believed to characterize an efficient securities market: low operational costs, availability of information, liquidity, and information efficiency. Of potential concern, however, is that a significant part of this research on market microstructure depends on the accuracy of volatility modeling that is based upon problematic assumptions about the underlying distribution of price variations in the market. In particular, excess volatility and non-normality undermine assumptions of both market efficiency and the random walk hypo-thesis. Dependence upon assumptions of normality and limited volatility have also led mainstream financial economists to prefer autoregressive conditional heteroscedasticity (ARCH) type models that capture only imperfectly the volatility correlation and the fat tails of the probability density function of price variations. While explaining clustered volatility, such models fail to recognize the presence of power laws in the volatility autocorrelations. Finally, these models also demonstrate some inaccuracies in terms of changes of time scales. This paper will argue and attempt to demonstrate, using Asia-Pacific exchange data, the superiority of multifractal modeling where the objective is to understand market microstructure. In contrast to ARCH type models, the distinguishing feature of the multifractal model is multiscaling of the return distribution's moments under time-rescaling. Multiscaling is a form of time-invariance that combines extreme returns with long memory in volatility. Calvet and Fisher (2002) show that a model characterized by multiscaling is consistent with economic equilibrium and that such a model may also imply the presence of uncorrelated returns and semi-martingale process. The multifractal spectrum shows the renormalized probability density of the occurrence of the local scales or the scaling of the distribution's moments with the scaling exponent on the x-axis and their renormalized probability on the y-axis. For example, the monofractal Brownian motion has only one scaling exponent (Hurst exponent) equal to 1/2, therefore the second moment of the distribution scales with the squared root of time. Although the multifractal nature of financial time series has been proven in a number of Mandelbrot's publications since 1962, this type of empirical research has been limited and not systematic until recently. Lux (2003) acknowledges the advantage of multifractal models to capture long memory in different powers of returns which are characteristics for financial time series. This ability is absent in traditional stochastic volatility and generalized autoregressive conditional heteroscedasticity (GARCH) models as well as in their long-memory variants (e.g. fractionally integrated generalized autoregressive conditonal heteroscedasticity, FIGARCH). Although the FIGARCH of Baillie, Bollerslev and Mikkelsen (1996) explores long memory, it does not include representation at different scales. On the other hand, the relationship between statistical representations at different time scales is addressed by Drost and
64

Wavelet Test of Multifractality
Nijman (1993), but by temporal aggregation of log-returns only for a given class of discrete processes, which weakens the scale consistency. Calvet and Fisher (2002) propose a class of continuous-time processes that incorporates the thick tails and volatility persistence of financial time series. They also show that in Monte Carlo simulations, the estimated multifractal process replicates the scaling properties of the data and compares favorably with the above specifications. The multifractal nature of stock and foreign exchange (FX) returns has been documented by Schmitt, Schertzer and Lovejoy (1999), Mandelbrot (1999), Bershadskii (2001), Ausloos and Ivanova (2002), Fisher, Calvet and Mandelbrot (1997), Xu and Gençay (2003), Fillol (2003) among others. Additionally, the multifractal spectrum contains important information on existing nonlinear patterns, including detection of important singularities, as shown by Struzik (2000). The multifractal nature of stock prices also leads to volatility clustering (conditional heteroscedasticity) and long memory (slowly decaying auto-correlation). Both properties might be labeled as horizontal dependency when viewing volatility in the time domain. Moreover, Gençay, Selçuk and Whitcher (2002) documented asymmetric vertical dependence of volatility across various time scales, emphasizing that volatility decreases at higher frequency earlier than it does at lower frequency. Breymann, Ghashghaie and Talkner (2000), and Muzy, Bacry and Arreodo (2001) also show that the return volatility displays long-term correlations from large to small time scales and that using a fixed time scale is not suitable for an analysis of the real dynamics of price moves. In such situations, wavelets would be an appropriate tool as they capture dependencies in the two dimensional time-scale plane. Temporal analysis is performed with a contracted, high-frequency version of the prototype wavelet, while scale/ frequency analysis is performed with a dilated, low-frequency version of the same wavelet.
Figure 1. Time series analysis is performed with translated in
time and dilated in scale prototype wavelets
65

Rossitsa Yalamova MULTIFRACTAL SPECTRA FOR THE DESCRIPTION OF COMPLEX DYNAMICAL SYSTEMS The financial markets have been shown to be similar to complex dynamical systems (Johansen, Sornette & Ledoit, 2000). The different parts of complex systems are linked and affect one another. A complex system may exhibit deterministic and random characteristics with the level of complexity depending on the system's dynamics and interactions with the environment. The use of multifractal spectra to better understand aspects of financial time series is based on the characterization of financial markets as complex dynamical systems. The behavior of financial markets has been increasingly quantified by the means of statistical physics, for examples, scaling, multifractality and multiplicative cascades. Pesin and Weiss (1997) motivate the study of multifractals and offer complete multifractal analyses for several classes of dynamical systems, the topology of dynamical systems is revealed in the multifractal spectrum. Invariant sets with complicated geometry can be decomposed into subsets with scaling symmetry, Lovejoy and Schertzer (1999) argue that nonlinear scale invariant dynamics lead to stochastic chaos (universal multifractals). Stochastic chaos allows for the presence of richer scale invariance, e.g. multifractals produced in cascade processes. In finance, cascade models are tested in Turiel and Pérez-Vicente (2002), Schmitt et al. (2000), Muzy et al. (2000) among others. Other work links wavelets, power laws and complex dynamical systems: Corcos et al. (2002) suggest that exponentially growing bubbles cross over to a non-linear power-law growth rate leading to a finite time singularity. Time-scale adaptive wavelets are appropriate for the detection of power-laws. Mallat and Hwang (1992), also develop an algorithm for singularity detection based on wavelet transform modulus maxima that allows the calculation of the multifractal spectrum of time series. Based on the multifractal spectrum, Barreira, Pesin and Schmeling (1997) attempt a "physical" classification of dynamical systems, which takes care of various aspects of the dynamics (chaoticity, instability, geometry, etc.) simultaneously. Halsey et al. (1986) asserts that strange attractors for chaotic dynamical systems are also characterized by their dimension and multifractal spectra. Research on chaotic dynamics in finance is scarce and non-systematic and we are not aware of multifractal analysis in that venue. Therefore, acknowledging the importance of multifractal analysis as a powerful tool for the numerical study of dynamical systems, we hope to increase interest in this methodology among scholars and gather more empirical evidence of non-linear patterns in financial data. Furthermore, multifractal dimension estimations can be used for the detection of emerging chaos in financial time series. For example, Brock and Hommes (1998), Chen, Lux and Marchesi (2001), Guanersdorfer (2000), Lux (1995, 1998) among others, suggest that the heterogeneous beliefs of
66

Wavelet Test of Multifractality
market players lead to market instability and complex dynamics such as chaotic fluctuations. If wavelet methodology continues to show the promise as evidenced by Wei, Zhan and Lai (2002), it may become possible for emerging chaotic dynamics to be detected and policymakers may be able to resort to active chaos control to achieve efficiency and prevent crashes. METHODOLOGY AND DATA A comparison of the multifractal spectra of stock index prices of Asia-Pacific markets was performed in an attempt to characterize market ability to efficiently process information and to ensure high liquidity. The investigation is based on the Multifractal Model of Asset Returns (MMAR) of Calvet and Fisher (2002) where stock prices follow a compound process of Fractional Brownian motion and stochastic trading time. The trading time deformation is a multiplicative cascade process reflected in the multifractal spectra and the specification of the multifractal generating process can be construed from the estimates of the spectrum. The comparative analysis of stock market data during periods of extremes is motivated by the scientific evidence in physics that such complex dynamical systems reveal their properties better under stress than in normal conditions. A number of studies attempt to research the impact of the system on the efficiency of trading. Our conjecture is that the organization of trading impacts the price diffusion process and accurate estimates of volatility can be used for the analysis of the information efficiency of different markets. Furthermore, these insights may lead to better regulatory practices of the financial system to prevent or at least limit the magnitude of "crashes" and loss of economic welfare. The Hurst exponent measures the persistence in volatility and can be calculated from the scaling function. The multifractal spectrum (MFS) is estimated from the moments of the data and conveys information on the multifractal generating process. MFS is a humped function with maximum 1 at f(α0). The decreasing renormalized probabilities of singularities lower than α0 pertain to the positive higher moments of the distribution as shown on Figure 2. Sornette, Johansen and Bouchaud (1996) argue that scale invariance and self-similarity are the dominant concepts in the processes surrounding significant drawdowns in stock index prices. Johansen et al. (2000) identify log-periodic oscillation in daily price data extending two to four years before and after such events. Therefore, we perform our analysis on 512 daily observations before and after the drawdown date, a period of approximately two years that also accommodates wavelet properties.
67

Rossitsa Yalamova Daily data of index closing price series for the Asia-Pacific region was tested for multifractality. Concavity of the scaling function determines the presence of multifractality. The multifractal spectrum of a number of indices was calculated for periods of different length in normal and "stressed" market (around significant "drawdowns" as defined in Johansen & Sornette, 2001). The results reported are on five index price series that experienced stress during the same period around October 1997 on the premise that multifractal description of volatility changes in extreme periods might be used for comparative analysis of market microstructure and establishment of corrective measures in the organization of security trading. Preliminary results of similar research were reported at the 18th Australasian Finance and Banking Conference.
Figure 2. Empirical and analytical multifractal spectrum with singularity exponents α and their renormalized probability f(α)
The concept of multifractality originated from a general class of multiplicative cascade models introduced by Mandelbrot (1974). A multifractal is a fractal with a probability measure in its support. Multifractal formalism was originally established to account for the statistical scaling properties of singular
68

Wavelet Test of Multifractality
measures through the determination of their singularity spectrum f(α). Fractals appear not only as singular measures, but also as singular functions or signals = time series. Parisi and Frisch (1985) proposed extracting the multifractal spectrum of the velocity field from the inertial scaling properties of structure functions. The structure function approach has serious drawbacks as shown by Muzy et al. (1993). This approach fails to fully characterize the singularity spectrum due to some fundamental limitations in the range of accessible irregularity exponents – it fails to detect that part of the spectrum which lies beyond the value α ≥ 1. As proven by Mallat and Hwang (1990), multifractal formalism based on wavelet transform modulus maxima (WTMM) allows us to determine the whole singularity spectrum directly from any experimental signal. Muzy et al. (1991) define the scaling behavior of partition functions Z(q, a) from the WTMM. The slope of the partition function determines the scaling τ(q) of moments of the distribution. Linearity of the scaling function suggests monofractal behavior of the time series, (all moments exhibit the same H scaling with time). The procedures of calculating the multifractal singularity spectrum based on WTMM is described in Yalamova (2003). Wavelet transform has proved to be a particularly efficient tool for measuring the local regularity of a function. The wavelet transform of f(t) = P(t) is defined as:
(1) +
, ( , ) ( ) ( ) ,aW a f t t dtττ
∞
∞= ∫ ψ
−
where the analyzing wavelet ψ is a function with local support, centered around zero and the family of wavelet vectors is obtained by translation τ and dilatation a.
The modulus maxima (largest wavelet transform coefficients) are found at each scale a as the suprema of the computed wavelet transforms such that:
( , ) 0.W aττ
∂=
∂ (2)
69

Rossitsa Yalamova
Figure 3. An example of maxima lines of wavelet coefficients
Figure 4. Gibb's partition function
70

Wavelet Test of Multifractality
The originality of the WTMM method is in the calculation of the partition function Z(q,a) from these maxima lines. The space-scale partitioning given by the wavelet tiling or skeleton defines the particular Gibb's partition function: sup
,
( , ) ( , ) qa
a
Z q a W aτ
τ=∑ (3)
This partition function effectively computes the moments of the absolute values of the wavelet coefficients W(τ, a). A decay scaling (correlation) exponent τ(q) is computed as the slope of the dyadic logarithm of Gibb's power partition function: 2 2log ( , ) ( ) log ( ),Z q a q a C qτ≈ + (4) where q is the power of the moments, a is the scale.
Scaling function τ(q)
τ(q)
q
Figure 5. Example of a concave scaling function
71

Rossitsa Yalamova There is no explicit local information present in the resulting scaling estimates, because this procedure is based on Gibb's statistical averaging or partition function Z(q,a). The usefulness of the partition function method resides in the fact that it obtains information on global averages, which tend to be more stable than local information. Its disadvantage is that it tends to obscure the local information. It is in fact the scaling exponent τ(q) that measures the asymptotic decay of the partition function Z(q,a), which defines the spectrum of the generalized dimensions Dq: ( ) ( 1) .qq q Dτ = − (5) The generalized dimensions Dq, also called Rényi dimensions:
0
1 1lim log ,log 1
qq iD p
a qα→=
− ∑ (6)
measure the Hausdorff (capacity) dimension D0, the information (Shanon entropy, Lyapunov) dimension D1 and the correlation dimension D2. The properties of these dimensions and their indication of emerging chaotic patterns in the data will be discussed in separate paper. From the Rényi dimensions one can proceed to the spectrum of singularities by a Legendre transformation. This spectrum f(α) is the fractal dimension of the subset of points for which the probability density scales with a local exponent α, that is, statistics of local Hölder exponents. The singularity of a function g(x) is measured by the Hölder exponent (α) at point x0 as: 0( ) ( ) ,L
ng x P x x C x x α− − < − 0 (7) where C is a constant and Pn is the degree of the polynomial, that is, g(x) is n times continuously differentiable in x0 and the polynomial Pn(x) is the first n + 1 terms of the Taylor series expansion of g(x) in x0. The multifractal spectrum gives a description of the singularity content of the time series. Halsey et al. (1986) characterize the singularity of fractal measures by their strength α and their density distribution f(α). The spectrum of singularities is given by ranges of α and their densities f(α). In monofractal cases, the spectrum will collapse to one point only, known as the Hurst exponent. The concavity of
72

Wavelet Test of Multifractality
the scaling function τ(q) gives evidence of multifractality and the existence of more than one singularity exponent. The calculation of the multifractal spectrum of time series is performed on the scaling function τ(q) via the Legendre transform:
[ ]( ) ( ) .q Min q fα
τ α α→ − (8)
For more details on the methodology and the algorithm of the multifractal spectrum calculations in Matlab, see Yalamova (2003). RESULTS Fractional Brownian Motion A Fractional Brownian motion with Hurst exponent (H) between 0 and 1 is defined by a stationary increment process that follows a normal distribution with zero mean and variance σ2H. We report the Hurst exponent of index prices before and after significant "drawdowns" calculated from the scaling function τ(q) according to the following property proved in Calvet and Fisher (2002):
1( ) 0H
τ = (9)
The Hurst exponents are reported for a 1024 day period around a significant drawdown (October 1997). All price series exhibit volatility persistence (H > 0.5), long-memory in volatility. While Nikkei 225 and All Ordinaries Hurst exponents decrease in the period after the "crash", Straits Times Index (STI) and KLCI (slightly) increase. Hang Seng Index (HSI) stays the same. It may cautiously suggest that the order driven market system might produce a decrease in volatility persistence after a drawdown. The quote driven system on the Singapore Stock Exchange produced the opposite effect. Although we could estimate the nature of "structural break" in relation to the Hurst exponent for the overall period, we view such an analysis with reservation, because of the presence of multifractality in the series. Besides, Lux (2003) shows that long term dependence in the various powers of returns can be accounted for by the multifractal time transformation alone. Therefore, we will proceed to the analysis of the multifractal model, while the estimated Hurst exponents are used in the calculation of the trading time deformation process spectrum.
73

Rossitsa Yalamova
TABLE 1 TIME SERIES WITH HURST EXPONENT LARGER THAN 0.5
EXHIBIT PERSISTENCE IN VOLATILITY AND DEVIATION FROM GEOMETRIC BROWNIAN MOTION
Oct. 1997 HSI STI AORD N225 KLSE
Before 0.59952 0.6031363 0.5995204 0.5803831 0.626566 After 0.598444 0.66313 0.547046 0.5310674 0.639795
Multifractality of the Price Series Average Hurst exponents should be viewed with caution as they are only a part in the more complex representation of the asset prices in the fractional Brownian motion in multifractal trading time framework. If the H exponent varies with time, the process exhibits multifractal structure. A test of the multifractality of a process involves the linearity of the scaling function τ(q). Gonçalvès and Riedi (2003) affirm that the empirical scaling function may appear concave outside its theoretical support because empirical estimators, based on a finite length data set, are not sensitive to theoretical divergence of moments. A wavelet based estimator for the characteristic critical order exponents is used to determine the interval of all orders q with finite moments. This estimator was used to select the range of support of the scaling function to which the linearity criterion was applied. The scaling functions of the examined time series were clearly deviating from linearity that prompted to conclude multifractality of the processes under consideration.
AORD scaling function
-2
-1.5
-1
-0.5
0
0.5
1
1.5
-1 0 1 2 3 4 5 6-2
moments
scal
ing
expo
nent
s
AORD scaling function
Scal
ing
expo
nent
Moments
Figure 6. Test on the concavity of the scaling functions of all five stock index prices was performed on the range of moments [–1: +5] (continued on next page)
74
Wavelet Test of Multifractality
NIK225 scaling function
-2
-1.5
-1
-0.5
0
0.5
1
1.5
2
-2 -1 0 1 2 3 4 5 6
moments
scal
ing
expo
nent
sSc
alin
g ex
pone
nt
Moments
NIK225 scaling function
STI scaling function
-2
-1.5
-1
-0.5
0
0.5
1
1.5
2
-2 -1 0 1 2 3 4 5 6
sca
moments
ling
expo
nent
STI scaling function
Scal
ing
expo
nent
Moments
KLSE scaling function
-2
-1.5
-1
-0.5
0
0.5
1
1.5
2
-2 -1 0 1 2 3 4 5 6
moments
calin
g ex
pone
nts
KLSE scaling function
Scal
ing
expo
nent
Moments
Figure 6. (Continued on next page)
75

Rossitsa Yalamova
HSI scaling function
-2
-1.5
-1
-0.5
0
0.5
1
1.5
2
-2 -1 0 1 2 3 4 5 6
ling
expo
nent
sca
moments
Scal
ing
expo
nent
Moments
HSI scaling function
Figure 6. (Continued)
The index price time series exhibit deviations from linearity of the scaling exponent τ(q) suggesting the existence of a MFS instead of one monofractal Hurst exponent. Muzy et al. (2000) use the non-linearity of the scaling function as evidence of multifractality of price fluctuations of financial time-series. Turiel and Pérez-Vincente (2002), Schmitt et al. (2000), Bacry, Delour and Muzy (2001) among others use the non-linearity of the scaling function to show that the estimate of two moments is by no means sufficient for describing the entire distribution, proposing the use of multifractal analyses and models in finance. Important implications of multifractal analysis are the characterization of all order moments and the validation of scaling models.
Multifractal Trading Times Monofractal Brownian motion often lacks flexibility to model real-world situations, due to simplicity in scaling or due to non-stationarity. Multifractal processes with non-linear scaling function and stationary zero mean increments are proposed by Riedi (2002): (10) ( ) ( ( )),Ht B M tβ where (M(t)), stands for a monotonic multiplicative cascade with flexible multifractal properties and BH generally represents any self-similar process with index H. Based on a multifractal time warping, ß(t) combines in one process the rich multifractal structure of a multiplicative cascade along with the self-similarity and the non-monotonicity of a H-fBm paths.
76

Wavelet Test of Multifractality
A multifractal model of asset returns that compounds a Fractional Brownian Motion with a multifractal time deformation process was first introduced by Mandelbrot and further developed by Calvet and Fisher (2002). Gaussianity, long range dependence and multifractal structure are characteristics of "Brownian motion in multifractal time". If BH(t) is a fractional Brownian motion and stochastic trading time θ(t) is a multiplicative process, then the compound process X(t): = BH[θ(t)] is fractional Brownian motion in multifractal trading time, combining long range dependence process and positive increment process with underlying multifractal structure. The MFS reflects the n-point correlations and thus provides more information about the temporal organization of price fluctuations than two-point correlations. The MFS f(α) is a convex and single-humped function with a maximum at q = 0, where f(α0) = D0 is the capacity dimension. At q = +∞ the slope of the MFS is infinite and αmin = D∞. The minimum alpha in the empirical measurements reaches down to values much lower than 0.5, representing an irregular price process with high risk for investors. According to the MMAR, the multifractal spectra calculated from the price function defines the MFS of the trading time θ as: ( ) ( / ).Pf f Hθα α= (11)
NIK225 MFS
f(alp
ha)
Trading time Price
Alpha
Figure 7: Example of the relationship between price and trading time process multifractal spectra
77
Rossitsa Yalamova
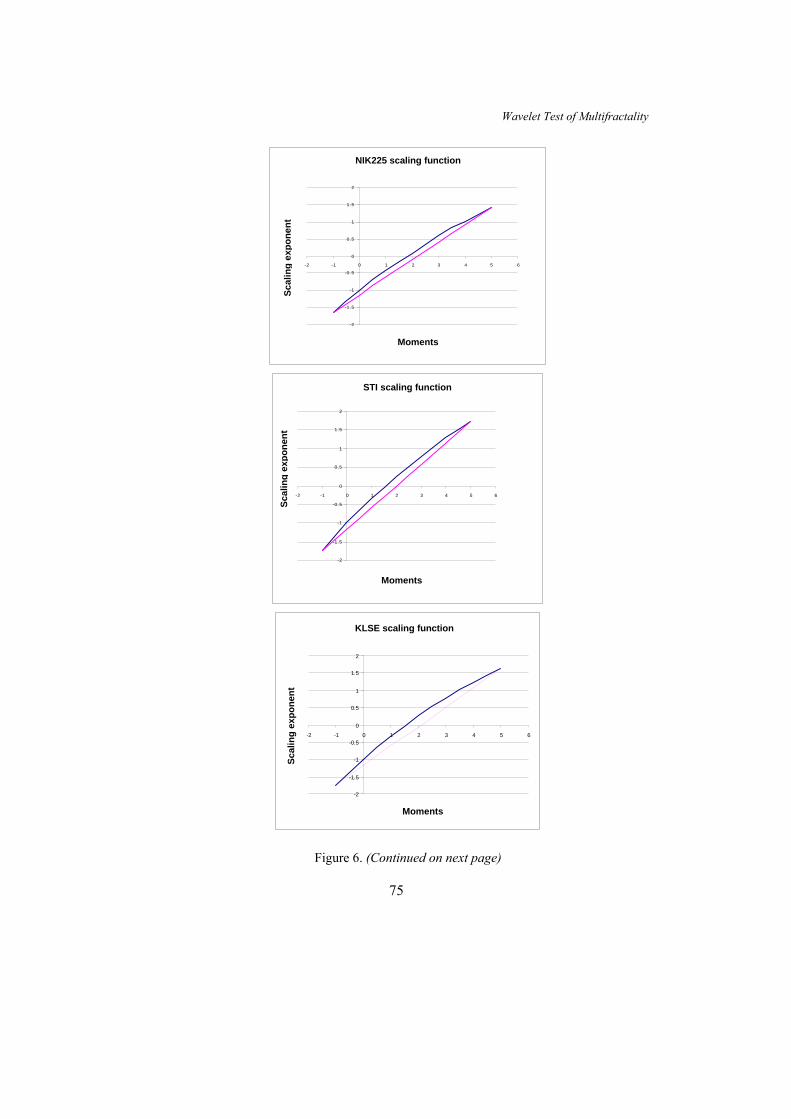
TABLE 2 MULTIFRACTAL SPECTRA OF TRADING TIMES REFLECT CHANGES IN THE PRICE
DIFFUSION PROCESS BEFORE AND AFTER SIGNIFICANT DRAWDOWNS. LOW MINIMUM α IS RELATED TO INSTANCES WITH FAST TRADING
AND HIGH RISK FOR THE INVESTOR
Trading time MFS HSI STI AORD N225 KLSE
Before αmin 0.257489 0.429654 0.39158 0.3172732 0.332415
After αmin 0.190293 0.334474 0.153063 0.2702105 0.167366
After the "crash", markets exhibit increased risk measured by αmin however the concavity of the spectrum for lower Hölder exponents (more irregular instants) implies disproportionate contribution to volatility. The measure of trading time per unit of clock time is high for low α′s and is related to swift passage of trading time. The STI sustained larger αmin values that might be attributed to the automatic quotation system as we obtained similar results for other dealer markets. On the other hand, the Tokyo Stock Exchange, with its continuous auction system, uses price controls (including stop trading) to prevent dramatic swings that might be limiting these instances of fast trading and high risk. It should also explain the lower percentage loss of the Nikkei during this period compared to the rest. In this framework, STI exhibits the highest regularity before the event followed by Australia, Malaysia, Japan and Hong Kong indexes. This could be interpreted that the HSI experienced the strongest outbursts of fast trading, thereby creating high risk situations. The change of the trading pattern after the drawdown may reveal important information that can be of use for regulatory purposes. In "the recovery period", the Australian index exhibits the fastest trading episodes and the largest change in the measure of αmin, although this index did not experience the worst loss for the period but only the second after the Nikkei drop of 225. The latter exhibits the smallest change in trading irregularities. This model accommodates a wide range of financial prices and allows one to identify a multiplicative measure empirically from the estimated spectra. The daily data multifractal spectra are quadratic, generated by log normally distributed multipliers M (–logbM~N(λ, σ²). Calvet and Fisher (2002) derive the calculation of λ from the MFS of trading time:
2( )( ) 1
4( 1)fθ
αα − λ= −
λ − (12)
78

Wavelet Test of Multifractality
TABLE 3 TRADING TIME MULTIFRACTAL SPECTRUM IS CHARACTERIZED
BY LOG NORMALLY DISTRIBUTED MULTIPLIERS M (–logbM~N(λ, σ²), λ′s
Trading time MFS HSI STI AORD N225 KLSE Before λ 1.10604 1.066398 1.048851 1.0579054 1.085247 After λ 1.077984 1.067232 1.070063 1.0787197 1.108478
The lognormal volatility process is fully defined by the location parameter λ. In order to arrive at parameter estimates for λ, it is necessary to compute the best fit to (12) for the empirical spectrum using least square criterion, restricting to the left part of the spectrum. The right part is computed from the partition function with negative moments and is strongly affected by chance fluctuations. An increased λ reflects more pronounced bursts of volatility in the generating process. The STI shows stability in the multifractal parameter estimates before and after the crash that aligns with our previous speculation on the trading process efficiency. In contrast, the auction only system of the Australian and Tokyo Stock Exchange might limit the efficiency of information processing and result in increased volatility after significant drawdowns. (There were similar changes of increased volatility observed in data on auction markets around the 1987 crash, although they was not as pronounced as in dealer markets.) CONCLUSIONS We must be careful to avoid premature or over-generalized empirical conclusions based on our results as the markets in this study differ significantly in regulation, access, size, and maturity. Similarly, our data samples are limited to index prices only. Instead, we hope in this paper to increase the awareness of a methodology that will facilitate the discovery of non-linear patterns in financial time series and the empirical application of the multifractal model of asset returns to measure volatility. As a demonstration of this method, the multifractal spectra of stock index price time series were calculated with the wavelet transform modulus maxima method that eliminates some limitation of the structure function approach and allows access to the full spectrum of singularities and their renormalized densities. Data on daily stock prices for five stock indices were analyzed around the "drawdown" of October 1997 as complex dynamical systems reveal their structure and properties better under stress (in extreme conditions). A time scale
79

Rossitsa Yalamova adapted volatility model incorporating a trading time transformation process was applied with the expectation of revealing the impact of the trading system on the price diffusion process. Evidence of information processing efficiency might be inferred from the multifractal trading time estimates – Hausdorff, information, correlation dimensions etc. and parameters of the multifractal spectrum reveal emerging chaotic behavior of the price process. Such outcomes speak to the goal of this paper which is to increase interest in multifractal analysis of financial time series by presenting advantages and possible applications of a wavelet methodology. Research in this area should contribute to better regulation and intervention for "crisis prevention". The decision to design a proper regulation or even to abandon all regulation should be made on the basis of thorough scientific knowledge of the statistical properties of financial data around financial crises and on substantial factual evidence of time series patterns preceding crashes. We have attempted in the present paper to show how the development of appropriate financial crash risk models might improve our understanding of the market volatility dynamics that lead to the emergence of stock market crashes. To this end, although we did not achieve our goal of arriving at definite conclusions about the non-linear price dynamics in different markets, we trust that we have illustrated the appropriateness of those tests for market microstructure research. The MMAR framework reveals information about the persistence in volatility measured by the Hurst exponent and the multiplicative cascade of trading time recovered from the multifractal spectrum. In all of the markets, we observe decreased minimum alphas in the trading time spectra in the period after October 1997. Those are indications of fast trading with high risk for the investors. In future research, we hope to exploit this framework for detection of emerging non-linear patterns, possibly chaotic dynamics. Dynamic systems with low dimensional chaos possess some degree of predictability and need to be regulated accordingly. Therefore, we propose this framework as a useful tool for market microstructure research to assist in finding the most efficient way to organize securities trade. A lack of proper scientific models of financial market crashes impedes the development of an effective supervisory system. New models arise either from a solid theoretical background or as a result of ample empirical evidence. We strongly believe that non-linear patterns of financial price series ought to be adequately researched with a variety of methods at different scales. Therefore, we advocate in this paper the use of the time scale adaptive wavelet framework and have described in detail the WTMM multifractal spectrum estimation
80

Wavelet Test of Multifractality
methodology. We performed an empirical investigation based on WTMM method of calculating the multifractal spectrum of daily index price series and we have also referred to the parameters in the MFS that can be used for detection of emerging chaotic patterns in dynamical systems. Research into stock market volatility is essential for the effective regulation of financial institutions and for the successful management of financial risk. Stock market volatility has implications for economic, social and public welfare and influences policy decisions at the highest level of government. The need for better risk models has never been as evident as in recent years. The existing regulation to reduce financial market risk not only fails to prevent, but may even exacerbate pending financial market crises (Daníelsson, 2002). The problem arises from the nature of the modeling of financial market risk based on "normal" market conditions, where the statistical properties of data are very different from those in a crash period. Better knowledge of market crashes will possibly make more accurate assessment of regulatory impacts and may produce evidence against the value of existing system of regulation. REFERENCES Ausloos, M. and Ivanova, K. (2002). Multifractal nature of stock exchange prices.
arXiv:cond-mat/0108394 v2. Bacry, E., Delour, J. and Muzy, J. (2001). A multifractal random walk. Phys. Review E,
64, 026103–026106. Baillie, R. T., Bollerslev, T. and Mikkelsen, H. O. (1996). Fractionally integrated
generalized autoregressive conditional heteroscedasticity. Journal of Econometrics, 74, 3–30.
Barreira, L., Pesin, Y. and Schmeling, J. (1997). On a general concept of multifractality: Multifractal spectra for dimensions, entropies, and Lyapunov exponents. Multifractal rigidity. Chaos, 7, 27–38.
Bershadskii, A. (2001). Multifractal diffusion in NASDAQ. J. Phys. A: Math. Gen., 34, L127–L130.
Breymann, W., Ghashghaie, S. and Talkner, P. (2000). A stochastic cascade model for FX dynamics. International Journal of Theoretical and Applied Finance, 3(3), 357–360.
Brock, W. A. and Hommes, C. H. (1998). Heterogeneous beliefs and routes to chaos in a simple asset pricing model. Journal of Economic Dynamics and Control, 22(8&9), 1235–1274.
Calvet, L. and Fisher, A. (2002). Multifractality in asset returns: Theory and evidence. The Review of Economics and Statistics, 84, 381–406.
Chen, S. H., Lux, T. and Marchesi, M. (2001). Testing for non-linear structure in an artificial financial market. Journal of Economic Behavior and Organization, 46, 327–342.
81

Rossitsa Yalamova Corazza, M. and Malliaris, A. G. (2002). Multifractality in foreign currency markets.
Multinational Finance Journal, 6(2), 65–98. Corcos, A., Eckmann, J. P., Malaspinas, A., Malevergne, Y. and Sornette, D. (2002).
Imitation and contrarian behavior: Hyperbolic bubbles, crashes and chaos. Quantitative Finance, 2, 264–281.
Daníelsson, J. (2002). The emperor has no clothes: Limits to risk modeling. Journal of Banking and Finance, 26(7), 1273–1296.
Drost, F. C. and Nijman, T. E. (1993). Temporal aggregation of GARCH processes. Econometrica, 61, 909–927.
Fisher, A., Calvet, L. and Mandelbrot, B. (1997). Multifractality of Deutschemark/US dollar exchange rates. Coelwes Foundation discussion paper #1165.
Fillol, J. (2003). Multifractality: Theory and evidence: An application to the French stock market. Economics Bulletin, 3, 1–12.
Gençay, R., Selçuk, F. and Whitcher, B. (2002). Asymmetry of information flow between volatilities across time scales. Retrieved from http://ssrn.com/abstract=386400.
Gaunersdorfer, A. (2000). Adaptive beliefs and the volatility of asset prices. Technical report. SFB adaptive information systems and modeling in economics and management science.
Gonçalvès, P. and Riedi, R. H. (2003). Diverging moments and parameter estimation., INRIA Report 4647, to appear in J. of Amer. Stat. Ass.
Halsey, T. C., Jensen, M. H., Kadanoff, L. P., Procaccia, I. and. Shraiman, B. I. (1986). Fractal measures and their singularities: The characterization of strange sets. Phys. Rev. A, 33, 1141–1151.
Johansen, A. and Sornette, D. (2001). Large stock market price drawdowns are outliers. Journal of Risk, 4(2), 69–110.
Johansen, A., Sornette, D. and Ledoit, O. (2000). Crashes as critical points. International Journal of Theoretical and Applied Finance, 3(2), 219–255.
Lux, T. (1995). Herd behavior, bubbles and crashes. Economic Journal, 105, 881–896. . (1998). The socioeconomic dynamics of speculative markets: Interacting
agents, chaos and the fat tails of return distributions. Journal of Economic Behavior and Organization, 33, 143–165.
. (2003). Detecting multifractal properties in asset returns: The failure of the 'scaling estimator'. CAU Kiel Economics Working Paper No. 2003–14.
Lovejoy, S. and Schertzer, D. (1999). Stochastic chaos, symmetry and scale invariance. ECO-TEC: Architecture of the in-between. Princeton Architectural Press, 80–99.
Mallat, S. G. and Hwang, W. L. (1990). Technical Report #549, Computer Science Department, New York University, unpublished.
. (1992). Singularity detection and processing with wavelets. IEEE Transactions on Information Theory, 38(2), 617–643.
Mandelbrot, B. (1974). Intermittent turbulence in self similar cascades: Divergence of high moments and dimension of the carrier. Journal of Fluid Mechanics, 62, 331–358.
. (1999). A multifractal walk down Wall Street. Scientific American, 280(2), 50–53.
Muzy, J. F., Bacry, E. and Arneodo, A. (1991). Wavelets and multifractal formalism for singular signals: Application to turbulence data. Physical Review Letters, 67(25), 3515–3518.
82

Wavelet Test of Multifractality
. (1993). Multifractal formalism for fractal signals: The structure function approach versus the wavelet-transform modulus-maxima method. Physical Review E, 47(2), 875–884.
Muzy, J., Delour, J. and Bacry, E. (2000). Modeling fluctuations of financial time series: From cascade process to stochastic volatility model. European Physics Journal B, 17, 537–548.
Muzy, J., Sornette, D., Delour, J. and Arneodo, A. (2001). Multifractal returns and hierarchical portfolio theory. Quantitative Finance, 1, 131–148.
Parisi, G. and Frisch, U. (1985). In Proceedings of the International School on Turbulence and Predictability in Geophysical Fluid Dynamics and Climate Dynamics, North Holland, Amsterdam.
Pesin, Y. and Weiss, H. (1997). The multifractal analysis of Gibbs measures: Motivation, mathematical foundation, and examples. Chaos, 7(1), 89–106.
Riedi, R. H. (2002). Multifractal processes. In: Long range dependence: Theory and applications. Birkhäuser, 625–715.
Schmitt, F., Schertzer, D. and Lovejoy, S. (1999). Multifractal analysis of foreign exchange data. Appl. Stochastic Models Data Anal., 15, 29–53.
. (2000). Multifractal fluctuations in finance. International Journal of Theoretical and Applied Finance, 3, 361–364.
Sornette, D., Johansen, A. and Bouchaud, J. P. (1996), Stock market crashes, precursors and replicas. J. Phys. I France, 6(1), 167–175.
Struzik, Z. R. (2000). Wavelet methods in (financial) time-series processing. Centrum voor Wiskunde en Informatica Report RAPPOPORT, INS-R0023, November 30, p. 14.
Turiel, A. and Pérez-Vicente, C. (2002). Multifractal geometry in stock market time-series. Preprint submitted to Elsevier Science.
Wei, G. W., Zhan, M. and Lai, C. H. (2002). Tailoring wavelets for chaos control. Physical Review Letters, 89(28), 284103-1-4.
Xu, Z. and Gençay, R. (2003). Scaling, self-similarity and multifractality in FX markets, Physica A, 323, 578–590.
Yalamova, R. (2003). Wavelet MRA of index patterns around financial market shocks. Ph.D. thesis, Kent State University.
83