Watershed Vulnerability Analysis Memo -...
22
Watershed Vulnerability Analysis 1 1.0 Introduction In 1998, the Center for Watershed Protection published the Rapid Watershed Planning Handbook which presents a rapid, eight point program for developing effective watershed plans, and details various methodologies used in watershed planning, such as impervious cover measurement and estimation, subwatershed mapping, cost projections, and rapid monitoring techniques. Since then, the Center has worked in over a dozen small watersheds across the country to protect trout, salmon, wetlands, drinking water, habitat quality, lakes, swimming beaches, and other important water resources. The Watershed Vulnerability Analysis was created primarily as a rapid planning tool for application to larger watersheds, but also contains a refinement of the techniques used in Rapid to delineate subwatersheds, estimate current and future impervious cover (and hence likely impacts to the subwatersheds), as well as providing guidance on factors that would alter the initial classification or diagnosis of individual subwatersheds. Examples of application of the vulnerability analysis include instances where more than 15 or 20 subwatersheds exist in a watershed or jurisdiction and it is necessary to group and prioritize subwatersheds for implementation and protection. This technical release outlines the basic process for performing a rapid Watershed Vulnerability Analysis and serves as an update to the Handbook . The analysis compares subwatershed quality across the watershed and yields four primary outcomes of interest to the watershed manager. These are: (A) A defensible rationale for classifying subwatersheds. Typically, these classifications are used to develop specific management criteria for each subwatershed class within the framework of an overall watershed overlay district. (B) An effective framework to organize and integrate mapping and monitoring data that are currently being collected in the subwatershed assessments to make final classifications. (C) A rapid forecast of which specific subwatersheds are most vulnerable to future watershed growth and warrant immediate subwatershed planning efforts. (D) A priority ranking identifying subwatersheds that merit prompt restoration actions. The basic watershed vulnerability analysis presented here follows an eight-step process (Figure 1). Considerable judgment and discretion needs to be exercised in most steps; we have attempted to outline the key choices to be made in these areas. Section 3 of this document goes over each step in detail. 2.0 Analysis Terminology It is critical that the reader recognize and understand the terminology used throughout this document. Two concepts in particular merit special attention - watershed scale and
Transcript of Watershed Vulnerability Analysis Memo -...

Watershed Vulnerability Analysis
1
1.0 Introduction In 1998, the Center for Watershed Protection published the Rapid Watershed Planning Handbook which presents a rapid, eight point program for developing effective watershed plans, and details various methodologies used in watershed planning, such as impervious cover measurement and estimation, subwatershed mapping, cost projections, and rapid monitoring techniques. Since then, the Center has worked in over a dozen small watersheds across the country to protect trout, salmon, wetlands, drinking water, habitat quality, lakes, swimming beaches, and other important water resources. The Watershed Vulnerability Analysis was created primarily as a rapid planning tool for application to larger watersheds, but also contains a refinement of the techniques used in Rapid to delineate subwatersheds, estimate current and future impervious cover (and hence likely impacts to the subwatersheds), as well as providing guidance on factors that would alter the initial classification or diagnosis of individual subwatersheds. Examples of application of the vulnerability analysis include instances where more than 15 or 20 subwatersheds exist in a watershed or jurisdiction and it is necessary to group and prioritize subwatersheds for implementation and protection. This technical release outlines the basic process for performing a rapid Watershed Vulnerability Analysis and serves as an update to the Handbook. The analysis compares subwatershed quality across the watershed and yields four primary outcomes of interest to the watershed manager. These are: (A) A defensible rationale for classifying subwatersheds. Typically, these classifications are
used to develop specific management criteria for each subwatershed class within the framework of an overall watershed overlay district.
(B) An effective framework to organize and integrate mapping and monitoring data that are
currently being collected in the subwatershed assessments to make final classifications. (C) A rapid forecast of which specific subwatersheds are most vulnerable to future watershed
growth and warrant immediate subwatershed planning efforts. (D) A priority ranking identifying subwatersheds that merit prompt restoration actions. The basic watershed vulnerability analysis presented here follows an eight-step process (Figure 1). Considerable judgment and discretion needs to be exercised in most steps; we have attempted to outline the key choices to be made in these areas. Section 3 of this document goes over each step in detail. 2.0 Analysis Terminology It is critical that the reader recognize and understand the terminology used throughout this document. Two concepts in particular merit special attention - watershed scale and

Watershed Vulnerability Analysis
2
subwatershed classification. Watershed scale refers to the size of the land unit selected for assessment and management. Subwatershed classification refers to the assessment and management category assigned to a subwatershed to guide planning decisions and efforts.
Figure 1: Process for Conducting a Watershed Vulnerability Analysis
Watershed Vulnerability Analysis
3
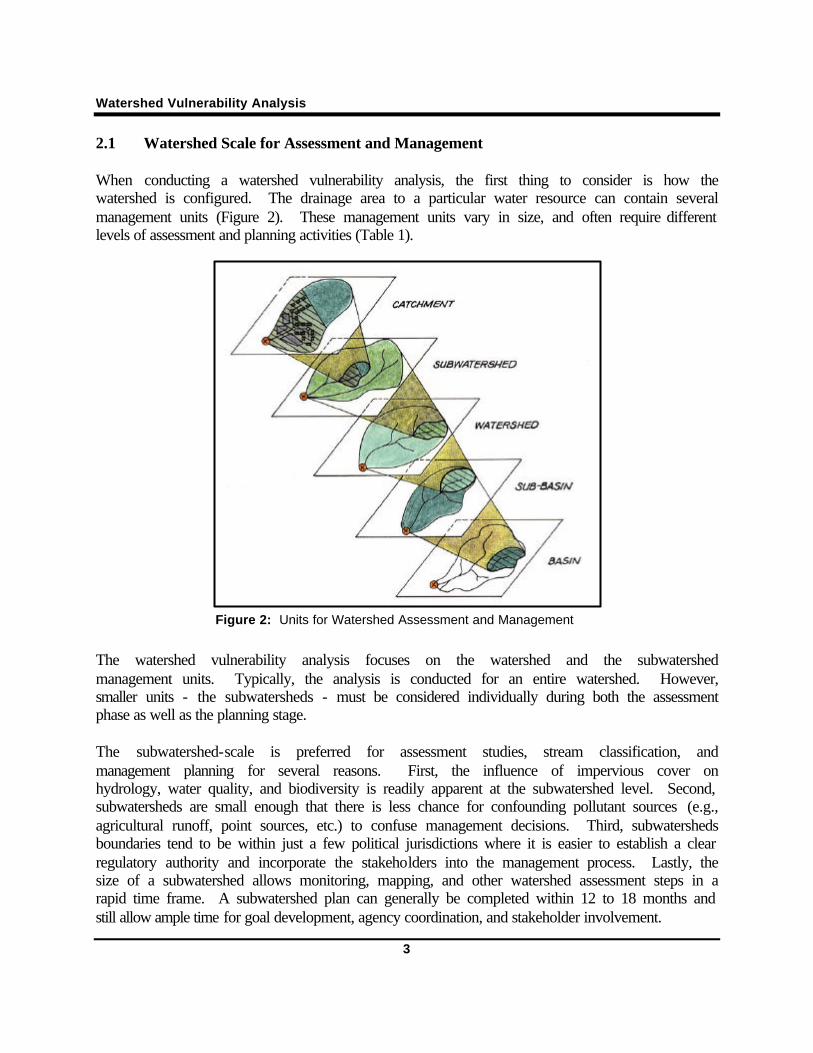
2.1 Watershed Scale for Assessment and Management When conducting a watershed vulnerability analysis, the first thing to consider is how the watershed is configured. The drainage area to a particular water resource can contain several management units (Figure 2). These management units vary in size, and often require different levels of assessment and planning activities (Table 1).
The watershed vulnerability analysis focuses on the watershed and the subwatershed management units. Typically, the analysis is conducted for an entire watershed. However, smaller units - the subwatersheds - must be considered individually during both the assessment phase as well as the planning stage. The subwatershed-scale is preferred for assessment studies, stream classification, and management planning for several reasons. First, the influence of impervious cover on hydrology, water quality, and biodiversity is readily apparent at the subwatershed level. Second, subwatersheds are small enough that there is less chance for confounding pollutant sources (e.g., agricultural runoff, point sources, etc.) to confuse management decisions. Third, subwatersheds boundaries tend to be within just a few political jurisdictions where it is easier to establish a clear regulatory authority and incorporate the stakeholders into the management process. Lastly, the size of a subwatershed allows monitoring, mapping, and other watershed assessment steps in a rapid time frame. A subwatershed plan can generally be completed within 12 to 18 months and still allow ample time for goal development, agency coordination, and stakeholder involvement.
Figure 2: Units for Watershed Assessment and Management

Watershed Vulnerability Analysis
4
Table 1: Description of the Various Watershed Management Units
Watershed Management Unit
Typical Area (square miles)
Influence of Impervious Cover
Sample Management Measures
Catchment 0.05 to 0.5 very strong stormwater management and site design
Subwatershed 0.5 to 30 strong stream classification and management
Watershed 30 to 100 moderate watershed-based zoning
Sub-basin 100 to 1,000 weak basin planning
Basin 1,000 to 10,000 very weak basin planning
2.2 Subwatershed Classification Research has shown that the amount of imperviousness in a watershed can be used to estimate the current and future quality of subwatersheds. The research generally indicates that certain zones of stream quality exist, most notably at about 10% impervious cover, where the most sensitive stream elements are lost from the system. A second threshold appears to exist at around 25 to 30% impervious cover, where most indicators of stream quality consistently shift to a poor condition (e.g., diminished aquatic diversity, water quality, and habitat scores). Using the findings of this research, the Center for Watershed Protection developed a simple Impervious Cover Model (Figure 3) that can be used to categorize subwatersheds into specific management units that have unique characteristics. The model classifies subwatersheds into one of three categories, based on the percentage of impervious cover: sensitive, impacted, and non-supporting (Table 2). The subwatershed categories set forth by the Impervious Cover Model, as well as the other categories described in Table 2, can be used to determine the current and future quality of a subwatershed. The methodology discussed in this document describes how to determine the current impervious cover of a subwatershed, and how to project the future impervious cover of a subwatershed under build-out conditions. Each of the subwatershed categories has an associated suite of tools for assessment and management that can be customized for the specific subwatershed conditions and goals.

Watershed Vulnerability Analysis
5
It is important to keep in mind that there are some limitations to using the Impervious Cover Model. The model generally should only be applied to 3rd order streams and smaller because most of the supporting research has been conducted at this scale. Additionally, much of the research was done in the Pacific Northwest and Mid-Atlantic ecoregions, though supporting data does exist for the Northeast, Upper Midwest, and Southeast. The Impervious Cover Model is intended to predict potential rather than actual stream quality, so an individual stream may depart from the model for various reasons. Lastly, further research is needed regarding the influence of stormwater treatment practices, pervious areas, and riparian forest cover, as well as the threshold between impacted and non-supporting streams. For this watershed vulnerability analysis, the primary purpose of using the impervious cover model is to develop a baseline that benchmarks the current and future quality of subwatersheds. Once these benchmarks are established, planning and management practices to protect or restore the subwatersheds can be established.
Figure 3: The Impervious Cover Model
Watershed Vulnerability Analysis
6
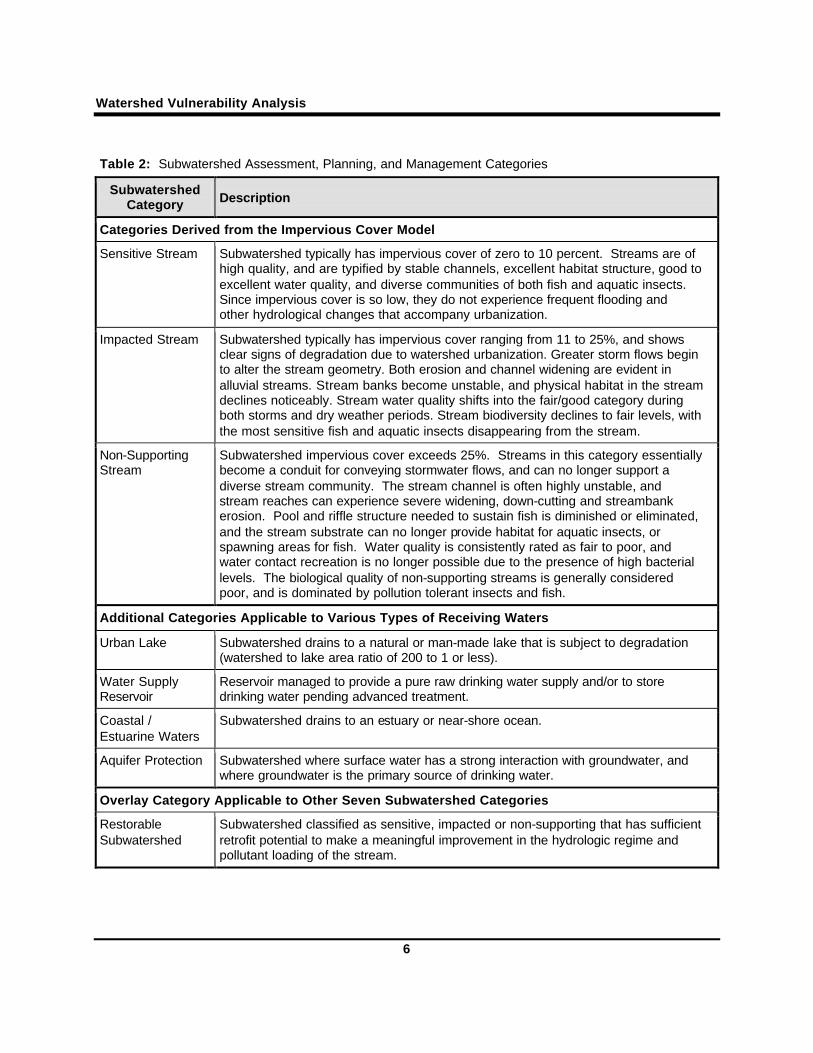
Table 2: Subwatershed Assessment, Planning, and Management Categories
Subwatershed Category Description
Categories Derived from the Impervious Cover Model
Sensitive Stream Subwatershed typically has impervious cover of zero to 10 percent. Streams are of high quality, and are typified by stable channels, excellent habitat structure, good to excellent water quality, and diverse communities of both fish and aquatic insects. Since impervious cover is so low, they do not experience frequent flooding and other hydrological changes that accompany urbanization.
Impacted Stream Subwatershed typically has impervious cover ranging from 11 to 25%, and shows clear signs of degradation due to watershed urbanization. Greater storm flows begin to alter the stream geometry. Both erosion and channel widening are evident in alluvial streams. Stream banks become unstable, and physical habitat in the stream declines noticeably. Stream water quality shifts into the fair/good category during both storms and dry weather periods. Stream biodiversity declines to fair levels, with the most sensitive fish and aquatic insects disappearing from the stream.
Non-Supporting Stream
Subwatershed impervious cover exceeds 25%. Streams in this category essentially become a conduit for conveying stormwater flows, and can no longer support a diverse stream community. The stream channel is often highly unstable, and stream reaches can experience severe widening, down-cutting and streambank erosion. Pool and riffle structure needed to sustain fish is diminished or eliminated, and the stream substrate can no longer provide habitat for aquatic insects, or spawning areas for fish. Water quality is consistently rated as fair to poor, and water contact recreation is no longer possible due to the presence of high bacterial levels. The biological quality of non-supporting streams is generally considered poor, and is dominated by pollution tolerant insects and fish.
Additional Categories Applicable to Various Types of Receiving Waters
Urban Lake Subwatershed drains to a natural or man-made lake that is subject to degradation (watershed to lake area ratio of 200 to 1 or less).
Water Supply Reservoir
Reservoir managed to provide a pure raw drinking water supply and/or to store drinking water pending advanced treatment.
Coastal / Estuarine Waters
Subwatershed drains to an estuary or near-shore ocean.
Aquifer Protection Subwatershed where surface water has a strong interaction with groundwater, and where groundwater is the primary source of drinking water.
Overlay Category Applicable to Other Seven Subwatershed Categories
Restorable Subwatershed
Subwatershed classified as sensitive, impacted or non-supporting that has sufficient retrofit potential to make a meaningful improvement in the hydrologic regime and pollutant loading of the stream.
Watershed Vulnerability Analysis
7
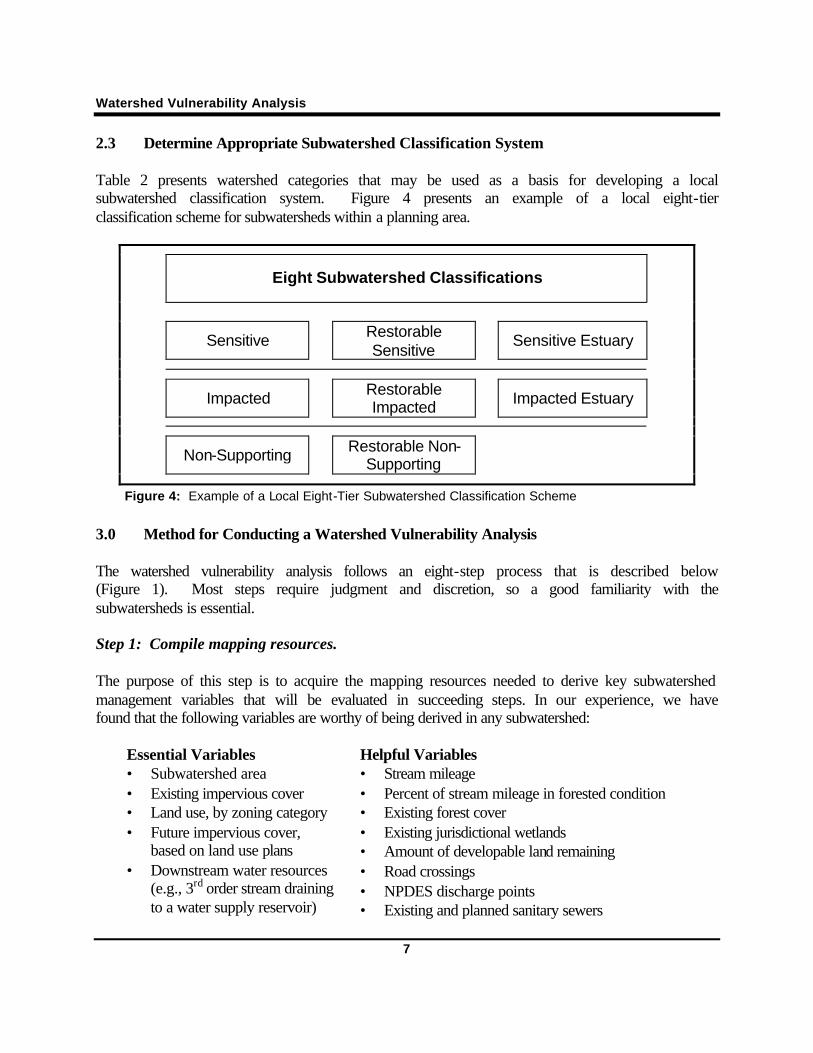
2.3 Determine Appropriate Subwatershed Classification System Table 2 presents watershed categories that may be used as a basis for developing a local subwatershed classification system. Figure 4 presents an example of a local eight-tier classification scheme for subwatersheds within a planning area.
Eight Subwatershed Classifications
Sensitive Restorable Sensitive
Sensitive Estuary
Impacted Restorable Impacted Impacted Estuary
Non-Supporting Restorable Non-Supporting
Figure 4: Example of a Local Eight-Tier Subwatershed Classification Scheme
3.0 Method for Conducting a Watershed Vulnerability Analysis The watershed vulnerability analysis follows an eight-step process that is described below (Figure 1). Most steps require judgment and discretion, so a good familiarity with the subwatersheds is essential. Step 1: Compile mapping resources. The purpose of this step is to acquire the mapping resources needed to derive key subwatershed management variables that will be evaluated in succeeding steps. In our experience, we have found that the following variables are worthy of being derived in any subwatershed:
Essential Variables • Subwatershed area • Existing impervious cover • Land use, by zoning category • Future impervious cover,
based on land use plans • Downstream water resources
(e.g., 3rd order stream draining to a water supply reservoir)
Helpful Variables • Stream mileage • Percent of stream mileage in forested condition • Existing forest cover • Existing jurisdictional wetlands • Amount of developable land remaining • Road crossings • NPDES discharge points • Existing and planned sanitary sewers

Watershed Vulnerability Analysis
8
Mapping layers that play an essential role in determining the above variables, as well as auxiliary layers that may be useful, are outlined in Table 3.
Table 3: Essential and Auxiliary Mapping Layers Used During a Watershed Vulnerability Analysis.
Essential Mapping Layers
• topography • hydrology • impervious cover (roads, sidewalks, buildings, parking lots, etc.) • current land use (typically zoning) • future land use (zoning or master plan) • aerial photos (typically digital ortho-photographs)
Auxiliary Mapping Layers
• existing and planned buffers, riparian cover • floodplains • significant environmental features (wetlands, contiguous forest tracts, steep slopes, etc.) • major stormwater management facilities • strategic monitoring stations • land ownership (public, private) • stormwater retrofit sites • drinking water supplies (wells and reservoirs) • soils and geologic features • lands identified for acquisition or conservation easement • stormwater hot spots (site with significant pollutant loading potential) • hazardous waste sites • historical sites • wells
Step 2: Delineate the subwatershed boundaries. From an operational standpoint, subwatersheds are often defined as the total land area draining to the point just below the confluence of two second-order “blueline” streams1. In reality, watershed managers may need to exercise some discretion in drawing actual subwatershed boundaries. Several practical issues should be evaluated during subwatershed delineation. These issues are illustrated in detail in Figure 5, and should be carefully considered when delineating subwatersheds. 1. Subwatershed size. If the previous definition is used, the average size of subwatersheds typically range from 1 to 10 square miles in size. In some planning and study areas, this may produce an unacceptably large number of potential subwatersheds to study. In these cases, subwatersheds should generally be defined as the total land area draining to the point just below
1“Blueline” streams refers to the bluelines used to depict perennial streams on USGS 7.5 Minute Quadrangle maps.
Watershed Vulnerability Analysis
9
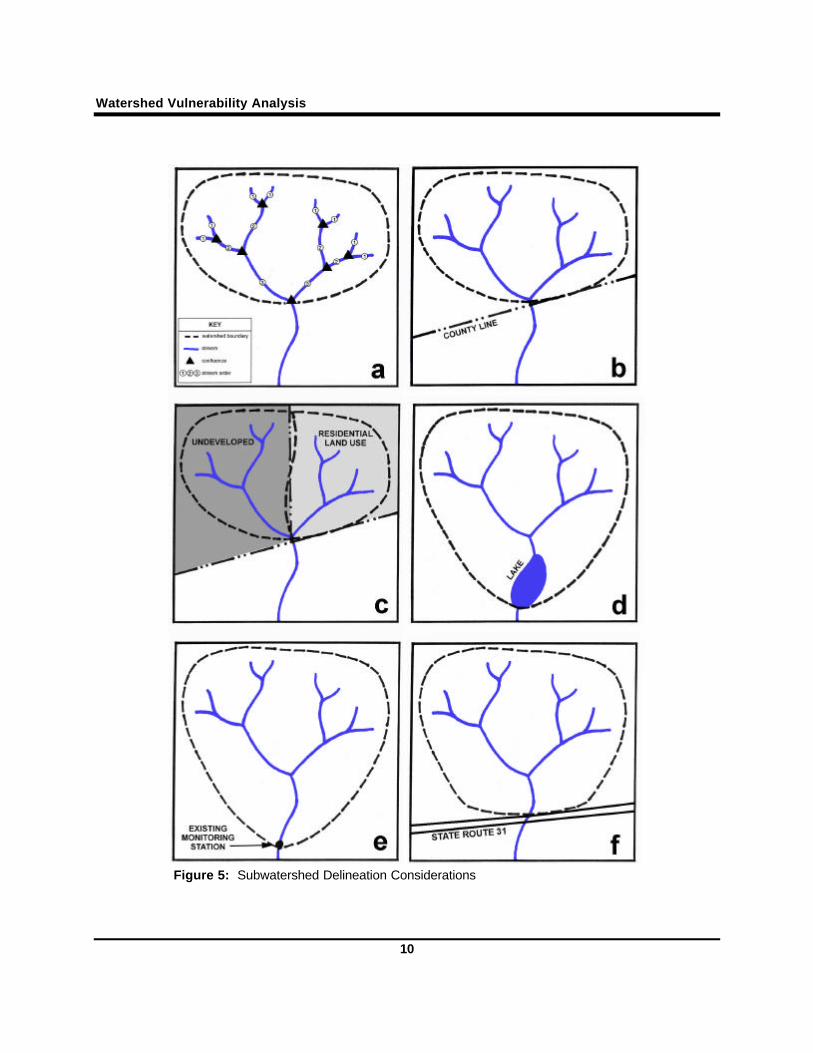
the confluence of third-order “blueline” streams (Figure 5a). In general, it is advisable to keep subwatershed area relatively uniform across the study area. 2. Subwatershed orientation. In general, our convention has been to define subwatersheds along the prime axis of the main stream or river present, and then number them in clockwise fashion around the watershed. 3. Jurisdictional boundaries. Wherever possible, subwatershed boundaries should be drawn so that they are wholly contained within a single political jurisdiction (city, county, township etc.; Figure 5b). This greatly simplifies the planning and management process. 4. Homogeneous land use. To the greatest extent possible, subwatershed boundaries should try to capture the same or similar land use categories within each subwatershed. When sharply different land uses are present in the same watershed (e.g., undeveloped on one side, commercial development on the other) it may be advisable to split them into two subwatersheds (Figure 5c). 5. Ponds / lakes / reservoirs. Where feasible, subwatershed boundaries should be extended downward to the discharge point of any pond, lake, or reservoir present on the primary streams of the subwatershed (Figure 5d). The transition of running water to standing water in a subwatershed usually creates a sharp discontinuity in the nature and quality of aquatic resources. 6. Existing monitoring stations. Subwatershed boundaries should always be extended to include the location of any existing monitoring stations (Figure 5e). In addition, it is good practice to fix the subwatershed at major road crossings or bridges in the stream segment (Figure 5f), since these areas often coincide with stream access and possible monitoring stations.
Watershed Vulnerability Analysis
10
Figure 5: Subwatershed Delineation Considerations

Watershed Vulnerability Analysis
11
7. Direct drainage. A recurring problem when delineating subwatersheds within a larger watershed context is the direct drainage. This happens when first or second order streams drain directly into a fourth or higher order mainstem of a stream. This results in small wedges of watershed area along the mainstem that are too small to be defined as subwatersheds, but still need to be accounted for. Our convention is to accumulate direct drainage along both sides of the mainstem, and then group it together into a composite subwatershed when the combined direct drainage area exceeds about ten square miles in size (Figure 6). Also, the amount of direct drainage can be minimized by extending the downstream point of the primary stream segment of a subwatershed all the way to the confluence with the next higher order stream.
Figure 6: Subwatershed and Direct Drainage (shaded) Delineation for the Powhatan Creek Watershed in James City County, Virginia

Watershed Vulnerability Analysis
12
Step 3: Verify current and future development assumptions. Before estimating current impervious cover (Step 4) and future impervious cover (Step 7), it is useful to verify current and projected land use information. Often, additional land use information beyond mapping resources is required to accurately predict the current and future impervious cover within a subwatershed. This information may be acquired through the local planning department, watershed stakeholders, regional councils, department of public works or parks, citizen associations, land trusts, developers and property owners, farmers, utility companies, and business interests. Key pieces of information that should be gathered at this stage include: • Development plans that are “in the pipeline” and will be completed prior to the watershed
planning process • Plans for municipally owned properties, such as schools, sports complexes, and parks • Properties with conservation easements • Plans for large tracts held by individual landowners • Current and planned transportation corridors • “Holding zones”2 within current zoning • Open space plans In many cases, current land use and impervious cover can be directly estimated from low altitude aerial photography and associated planimetric data (e.g., roads, parking lots, building footprints, etc.), at reasonable cost. However, in rapidly developing subwatersheds, the under-estimation of current impervious cover is a common problem. The local planning department should be consulted to ensure that GIS coverages used in determining impervious cover accurately depict current land use (Figure 7). In some cases, field verification of land use may be necessary. In addition development plans that are in the plan approval stage and will be completed prior to the watershed planning process should be accounted for. The technique most commonly used to estimate future impervious cover - zoning build-out analysis - has the potential to over-estimate impervious cover. For example, zoning build-out analysis assumes that all development shown on a zoning map will ultimately be constructed, and then multiplies each zoned area by average impervious cover for that particular zoned land use. Zoning, however, often reflects a best case scenario in terms of projected economic growth. Consequently, much of the potential development shown on zoning maps may not be built because of local economic conditions or lack of infrastructure. Thus, zoning build-out analysis can overestimate impervious cover, at least for the first several decades.
2“Holding zones” refer to zoned areas (typically agriculture or rural residential) that do not correspond to jurisdictional master planning. These areas may be designated growth areas, but the re-zoning process is not initiated until development plans are submitted.

Watershed Vulnerability Analysis
13
The local government should be consulted regarding development plans for municipally owned properties, current and planned transportation corridors, holding zones within local zoning, open space acquisition plans, and planned modifications to current codes and ordinances pertaining to site design. These factors may modify either what is considered “developable” land, or they may modify land use - impervious cover relationships. Information regarding properties currently covered by conservation easements should be gathered from the local government, land trusts, and citizen and watershed organization, as this will also modify the amount of developable land. Finally, future plans for large tracts, such as farms or contiguous forest, can be obtained from individual landowners or government. Step 4: Estimate the current impervious cover in the subwatersheds. There are several techniques to measure impervious cover at the subwatershed level. Deciding which technique is best for a subwatershed depends largely on the resources and data available for the measurement. One of the most commonly used and most accurate techniques is direct measurement. This technique directly measures each of the individual components of impervious cover. These components may include parking lots, buildings, roads, driveways, and sidewalks (Figure 8). One of the most efficient ways to make these measurements is to use GIS. GIS coverages that are necessary to calculate impervious cover include digital planimetric data for each impervious component. Digital ortho-photographs are useful for double checking the accuracy of the planimetric data. Input from stakeholders or local planners may also help to identify discrepancies if GIS coverages are slightly dated.
Figure 7: Land use may change rapidly, as depicted in these aerial photographs of a three-square mile area of a developing watershed.

Watershed Vulnerability Analysis
14
The area of each impervious component can be directly calculated from the GIS coverages. However, there are some features in an urban landscape that are not always delineated in GIS coverages. These features may include driveways, sidewalks, tennis courts, swimming pools, decks, and sheds. Where these data are missing, estimates can be made based on existing data. For example, if driveways are not included in the planimetric data, their area can be estimated based on average residential density and the number of houses in the subwatershed. A study conducted by Cappiella and Brown (2001) made direct measurements of all the components of impervious cover. Using their data, (Table 4) an estimate of the impervious cover associated with driveways can be made.
Figure 8: Impervious Components of a Subwatershed

Watershed Vulnerability Analysis
15
Table 4: Average Driveway Areas in the Chesapeake Bay Region
Residential Density (lot size in acres) Average Driveway Area (sq. ft.)
2 3,212
1 2,073
1/2 1,152
1/4 652
1/8 432
Source: Cappiella and Brown, 2001
In summary, impervious area is directly calculated from available GIS coverages, adjustments are made to account for impervious areas not identified within the GIS system, and the total impervious area is divided by the subwatershed area to determine the impervious cover fraction. PRIMARY OUTCOME A – INITIAL CLASSIFICATION OF SUBWATERSHEDS Once the first four steps are complete and the current impervious cover has been determined, an initial classification of the subwatersheds can be made. At this initial stage, a subwatershed may be preliminarily classified as a sensitive, impacted, or non-supporting subwatershed draining to an urban lake, water supply reservoir, coastal / estuarine waters, or aquifer. Using the example of a local eight-tier subwatershed classification scheme presented in Figure 4, a subwatershed may be classified within five of the eight proposed categories: • Sensitive - subwatershed with less than 10% imperviousness • Sensitive Estuary - subwatershed with less than 10% imperviousness draining to an
estuary • Impacted - subwatershed with 11 to 25% imperviousness • Impacted Estuary - subwatershed with 11 to 25% imperviousness draining to an estuary • Non-Supporting - subwatershed with greater than 25% imperviousness Steps 5 and 6 of the analysis will refine the subwatershed classification, and also allow for the determination of whether or not a subwatershed is restorable. Step 5: Conduct a stream corridor assessment. Impervious cover is not a perfect indicator of existing stream quality. Field data can provide important insight to the subwatershed classification process, particularly when a subwatershed is on the borderline between one classification and another. We routinely examine ten criteria to decide whether a borderline stream should be classified as sensitive, impacted, or non-supporting. If stream assessment monitoring reveals that the stream meets at least five criteria, it

Watershed Vulnerability Analysis
16
is classified as Sensitive, even if it has slightly more than 10% impervious cover in its subwatershed. Similarly, if a subwatershed meets one to five of these criteria, it is provisionally classified as Restorable Sensitive, even if the subwatershed has less than ten percent impervious cover. The ten criteria are: 1. Reported presence of rare, threatened or endangered species in the aquatic community
(e.g., freshwater mussels, fish, crayfish or amphibians). 2. Confirmed spawning of sensitive fish species. 3. Fair/good, good, or good to excellent macroinvertebrate scores. 4. More than 65% of Ephemeroptera, Plecoptera, and Tricoptera (EPT) species present in
macroinvertebrate scores. 5. No barriers impede movement of fish between the subwatershed and the mainstem. 6. Stream channels show little evidence of historic alteration (ditching, enclosure, tile
drainage or channelization). 7. Water quality monitoring indicates no standards violations during dry weather. 8. Stream and floodplain remain connected and regularly interact. 9. Subwatershed drains to a downstream surface water supply. 10. Stream channels are generally stable, as determined by the Rosgen level III analysis or a
similar geomorphic analysis; stream habitat scores should rate at least fair-to-good. Step 6: Conduct a subwatershed scale assessment. A series of landscape-level criteria are evaluated to make a final determination about the subwatershed classification and priority rank. This is referred to as a subwatershed scale assessment. We typically examine ten criteria to decide borderline subwatershed classifications. If the subwatershed assessment reveals that the stream meets at least five of these criteria, it is classified as Sensitive, even if it has slightly more than 10% impervious cover in its subwatershed. Similarly, if a subwatershed meets more than three criteria, it is classified as Restorable Sensitive, Restorable Impacted, or Restorable Non-Supporting, based on its imperviousness.

Watershed Vulnerability Analysis
17
The ten criteria are: 1. Subwatershed contains documented rare, threatened and endangered plant or animal
populations. 2. Wetlands, floodplains and/or beaver complexes make up more than ten percent of
subwatershed area. 3. Inventoried conservation areas3 comprise more than ten percent of watershed area. 4. More than 50% of the riparian corridor has forest cover, and is either publicly owned or
regulated. 5. Large contiguous forest tracts remain in the watershed, and more than 40% of watershed
is in forest cover. 6. Significant fraction of subwatershed is in public ownership and management. 7. Stream buffers form a continuous network throughout subwatershed. 8. Subwatershed is connected to the watershed through a wide, undisturbed corridor that
allows for wildlife access. 9. Farming, ranching and livestock operations in the watershed utilize best management
practices. 10. Prior development in the subwatershed has utilized stormwater practices for both quality
and quantity control.
3Conservation areas may include critical habitat for plant and animal communities, such as freshwater wetlands, large forest tracts, springs, spawning areas, habitat for rare, threatened, or endangered (RTE) species, and native vegetation areas; the aquatic corridor, including floodplains, stream channels, springs and seeps, steep slopes, and riparian forests; undeveloped areas responsible for maintaining the pre-development hydrologic response of a subwatershed, such as forest, meadow, prairie, and wetlands; or cultural and historic areas, such as archaeological sites, trails, parklands, scenic views, water access, and recreational areas.
Watershed Vulnerability Analysis
18
PRIMARY OUTCOME B – FINAL CLASSIFICATION OF SUBWATERSHEDS The final classification of the subwatersheds, based on information garnered in the stream corridor and subwatershed scale assessments, may now be determined. In addition, the overlay category of “restorable” may not be applied. Using the example of a local eight-tier subwatershed classification scheme presented in Figure 4, a subwatershed may be classified within any of the eight proposed categories: • Sensitive • Restorable Sensitive • Sensitive Estuary • Impacted • Restorable Impacted • Impacted Estuary • Non-Supporting • Restorable Non-Supporting Step 7: Estimate the future impervious cover in the subwatersheds. A simple procedure for predicting future impervious cover can be applied using established land use-impervious cover relationships, the most recent comprehensive plan, and parcel and zoning information which can often be obtained from GIS coverages. The methodology, described in more detail below, assumes future impervious cover estimates represent the maximum level of development that is expected in the subwatersheds. Step 1. Identify undeveloped parcels by their zoning category in each subwatershed (Figure 9). Step 2. Subtract unbuildable land (floodplains, wetlands, steep slopes, conservation areas, etc.)
from the parcel area (Figure 9). Step 3. Multiply each undeveloped parcel by an average impervious cover for the associated
zoning category (Table 5). Step 4. Calculate the area of planned highways and arterial roads and add this number to the sum
of the impervious area for all land uses in the subwatershed. Step 5. Add new impervious area to current impervious area to yield the total future impervious
area. Step 6. Divide the total future impervious area by the total area of the subwatershed to get an
impervious cover fraction, and multiply by 100 to get an impervious percent.

Watershed Vulnerability Analysis
19
Figure 9: The top panel depicts lots and parcels, the middle panel depicts buildable lots and parcels (shaded); and the bottom panel subtracts unbuildable areas (eliminated from shaded areas).

Watershed Vulnerability Analysis
20
Table 5: Impervious Cover Estimates for the Chesapeake Bay Region
Land Use Category Sample Number (N) Mean Impervious Cover
Agriculture 8 1.9%
Open Urban Land 11 8.6%
2 Acre Lot Residential 12 10.6%
1 Acre Lot Residential 23 14.3%
½ Acre Lot Residential 20 21.2%
1/4 Acre Lot Residential 23 27.8%
1/8 Acre Lot Residential 10 32.6%
Townhome Residential 20 40.9%
Multifamily Residential 18 44.4%
Institutional 30 34.4%
Light Industrial 20 53.4%
Commercial 23 72.2%
Source: Cappiella and Brown, 2001
The determination of future impervious cover has assumed build-out conditions with the current level of environmental protection. The future impervious cover may now be used to project the future quality of the subwatershed. As under Primary Outcome A, a subwatershed may be classified as a sensitive, impacted, or non-supporting subwatershed draining to an urban lake, water supply reservoir, coastal / estuarine waters, or aquifer. Using the example of a local eight-tier subwatershed classification scheme presented in Figure 4, a subwatershed may be classified within five of the eight proposed categories: • Sensitive - subwatershed with less than 10% projected imperviousness • Sensitive Estuary - subwatershed with less than 10% projected imperviousness draining
to an estuary • Impacted - subwatershed with 11 to 25% projected imperviousness • Impacted Estuary - subwatershed with 11 to 25% projected imperviousness draining to an
estuary • Non-Supporting - subwatershed with greater than 25% imperviousness It is important to note that the overlay category of Restorable cannot be used to classify the future quality of a subwatershed since the only information available to us to determine the future quality of the subwatershed is the build-out impervious cover. A subwatershed’s restorability is determined through the Stream Corridor Assessment (Step 5) and the Subwatershed Scale Assessment (Step 6).
Watershed Vulnerability Analysis
21
PRIMARY OUTCOME C – DETERMINATION OF MOST VULNERABLE SUBWATERSHEDS Once the current and future subwatershed classifications are determined, the subwatersheds that are most vulnerable to changes in land use can be identified. The primary questions to consider when determining the vulnerability of subwatersheds are: 1. Does the subwatershed drain to a highly valued water resource, such as a water supply
reservoir or an estuary that support shellfish beds? 2. Will the subwatershed classification change? (e.g., shift from sensitive to impacted) 3. Does the subwatershed classification come close to changing? (e.g., future impervious
cover is projected at 10%) 4. What is the absolute change in impervious cover? (e.g., a subwatershed that shifts from
5% to 14% may be more vulnerable than a subwatershed that shifts from 6% to 12%) Step 8: Evaluate the restoration capability. The last step in the watershed vulnerability analysis is a priority ranking that identifies subwatersheds that merit prompt restoration actions. The rank of a subwatershed is relative to the other subwatersheds in the study area. The following criteria are used in determining the priority for subwatershed planning and implementation: 1. Subwatershed vulnerability, as determined under Primary Outcome C. 2. Designated use of the receiving water within the subwatershed. 3. The presence of significant aquatic endangered species habitat (presence = higher
planning priority). 4. Fraction of land considered significant conservation areas (larger fraction = higher
planning priority). 5. Fraction of the subwatershed that is developable (larger fraction = higher planning
priority). 6. Development pressure within the subwatershed, as determined by local master plans,
proximity to major transportation corridors, access to supporting infrastructure, and rate of population growth (more development pressure = higher planning priority).
7. Fraction of land publicly owned, thereby reducing land acquisition fees for conservation areas, riparian corridor protection, or stormwater retrofitting (larger fraction = higher planning priority).

Watershed Vulnerability Analysis
22
8. Presence of a local watershed organization or significant community and stakeholder commitment to a subwatershed planning process (presence = higher planning priority).
9. Availability of financial and staffing resources for plan implementation (availability =
higher planning priority). PRIMARY OUTCOME D – RANKING OF PRIORITY SUBWATERSHEDS FOR IMPLEMENTATION The primary outcome of the watershed vulnerability analysis is the ranking of priority subwatersheds for planning and implementation. There is, however, one final consideration in determining the final schedule for subwatershed plan implementation. Since the subwatershed plans are likely to be developed and implemented on a rotating basis, the first set of plans developed should include a plan for a subwatershed within each of the subwatershed classifications selected for the overall planning area. While individual subwatersheds often have unique management goals, the tools used within a subwatershed management category will eventually be the same. As such, the development of a subwatershed plan for each of the classifications will serve as templates for future subwatershed plans. In addition, planning, protection, or restoration tools developed in the first round of subwatershed plans may be applied to all subwatersheds in the study area as an interim measure until resources are available to develop and implement the remaining subwatershed plans. Discretion, of course, should be used if this approach is taken so that a particularly sensitive subwatershed not selected for the first round of subwatershed plans is not sacrificed. References Cappiella, K. and K. Brown. 2001. Impervious Cover and Land Use in the Chesapeake Bay Watershed. Center for Watershed Protection. Ellicott City, MD. Center for Watershed Protection. 1998. Rapid Watershed Planning Handbook. Center for Watershed Protection. Ellicott City, MD. Center for Watershed Protection. 2001. Wake County Watershed Vulnerability Analysis. Prepared for CH2MHill. Center for Watershed Protection. Ellicott City, MD.