Waterloo, Cedar Falls, & Evansdale, Iowa - Wells Gaming Research
14
Waterloo, Cedar Falls, & Evansdale, Iowa Hotel & Motel Supply, Demand, and Trend Data Supplemental Information Prepared by: Wells Gaming Research March-2005
Transcript of Waterloo, Cedar Falls, & Evansdale, Iowa - Wells Gaming Research

Waterloo, Cedar Falls, & Evansdale, Iowa
Hotel & Motel
Supply, Demand, and Trend Data
Supplemental InformationPrepared by:
Wells Gaming ResearchMarch-2005

Waterloo, Evansdale, & Cedar Falls, IowaHotel Supply, Demand, & Trend Data
Waterloo, Evansdale, & Cedar Falls, IowaHoteł and Motel Room Supply
Hotel Address City/Zip Opened 2004 Rooms
2005 Rooms
Comfort Inn 1945 La Porte Road Waterloo IA 50702 Feb-1990 56 56Country Inn & Suites 4025 Hammond Ave Waterloo IA 50702 Jan-1998 64 64Fairfield Inn 2011 La Porte Road Waterloo IA 50702 Jun-1992 57 57Grand Hotel 300 W. Mullan Waterloo IA 50701 Jan-1968 87 87Heartland Inn Crossroads 1809 La Porte Road Waterloo IA 50702 Nov-1984 113 113Heartland Inn Greyhound 3052 Marnie Ave Watelroo IA 50701 Jun-1989 54 54Holiday Inn Express 2141 La Porte Road Waterloo IA 50702 Nov-1993 51 51Motel 6 2343 Logan Ave Waterloo IA 50703 Jul-1995 50 50Quality Inn & Suites 226 W 5th Street Waterloo IA 50701 Jun-1968 67 67Ramada Inn 4th & Commercial St Waterloo IA 50701 Mar-1983 228 228Super 8 1825 La Porte Road Waterloo IA 50702 Sep-1988 62 62Travel Inn 3350 University Ave Waterloo IA 50701 Jun-1979 104 104Total Waterloo Rooms 993 993
Ramada Limited 450 Evansdale Drive Evansdale, IA 50707 Jun-1995 46 46
Days Inn University Plaza 5826 University Ave. Bldg 2 Cedar Falls, IA 50613 Jun-1958 67 67Holiday Inn University Plaza 5826 University Ave. Bldg 1 Cedar Falls, IA 50613 Jun-1958 112 112Country Inn & Suites 2910 S. Main Street Cedar Falls, IA 50613 Dec-1998 64 64Americinn 1518 Nordic Drive Cedar Falls, IA 50613 Jul-2001 57 57Black Hawk Hotel 115 Main Street Cedar Falls, IA 50613 23 23Garden Motel 1710 W. First Street Cedar Falls, IA 50613 Jun-1932 32 32JLL Extended Stay Inn 4410 University Ave. Cedar Falls, IA 50613 Jun-1965 96 96Midway Inn 4117 University Ave. Cedar Falls, IA 50613 May-1999 78 78Trail’s End 122 Washington Street Cedar Falls, IA 50613 15 15University Inn 4711 University Ave. Cedar Falls, IA 50613 Jun-1957 51 51Wingate Inn Technology Pkwy Cedar Falls, IA 50613 66Carriage House Inn 3030 Grand Blvd. Cedar Falls, IA 50613 2 2Cedar Falls Motel 1315 W. 1st Street Cedar Falls, IA 50613 15 15Shady Rest Motel 2008 Center Street Cedar Falls, IA 50613 12 12Total Cedar Falls Rooms 624 690
Grand Total 1,663 1,729Data Source: Waterloo CVB, Smith Travel Service, Wells Gaming Research
March 2005 Wells Gaming Research Page 1

March 2005 Wells Gaming Research Page 2
Waterloo, Cedar Falls, Evansdale, IowaRoom Supply 1998 to 2005
1,528
1,606 1,606
1,663 1,663 1,663 1,663
1,729
1,400
1,450
1,500
1,550
1,600
1,650
1,700
1,750
1998 1999 2000 2001 2002 2003 2004 2005
Data Sources: Waterloo CVB & Smith Travel, Chart prepared by WGR

March 2005 Wells Gaming Research Page 3
Waterloo, Cedar Falls, Evansdale, IowaAverage Daily Rate
$50.69
$54.46
$57.22
$60.20$59.46
$61.53 $61.30
$40.00
$45.00
$50.00
$55.00
$60.00
$65.00
1998 1999 2000 2001 2002 2003 2004
Source: Smith Travel Trend Report of 12 Participating Properties with 924 rooms, Chart prepared by WGR

March 2005 Wells Gaming Research Page 4
Waterloo, Cedar Falls, Evansdale, IowaAverage Annual Occupancy Percent
55.3%
59.6%
57.1%56.0%
55.4%56.1%
59.6%
30.0%
35.0%
40.0%
45.0%
50.0%
55.0%
60.0%
65.0%
70.0%
1998 1999 2000 2001 2002 2003 2004
Source: Smith Travel Trend Report of 12 Participating Properties with 924 rooms, Chart prepared by WGR

March 2005 Wells Gaming Research Page 5
Waterloo, Cedar Falls, Evansdale, IowaEstimated Annual Room Nights Occupied
308,393
349,318
335,773
339,857
336,126
340,796
362,636
300,000
310,000
320,000
330,000
340,000
350,000
360,000
370,000
1998 1999 2000 2001 2002 2003 2004
Sources: Smith Travel & Waterloo CVB, Chart prepared by WGR

January 1998 to December 2004 Job Number: 38091 Staff: KC Created: February 02, 2005
Tab
Table of Contents 1
Data by Measure 2
Percent Change by Measure 3
Percent Change by Year 4
Twelve Month Moving Average 5
Day of Week Analysis 6
Raw Data 7
Classic 8
Response Report 9
Help 10
Terms & Conditions 11
SMITH TRAVEL RESEARCH
735 East Main Street
Hendersonville, TN 37075
tel. 615.824.8664 x501
fax 615.824.3848
www.smithtravelresearch.com
e-mail: [email protected]
Waterloo & Ceder Falls, IA Area Selected Properties

Tab 2 - Data by MeasureWaterloo & Ceder Falls, IA Area Selected Properties
Job Number: 38091 Staff: KC Created: February 02, 2005
January February March April May June July August September October November December Total Year Dec YTD1998 48.6 55.4 59.6 54.2 57.9 62.3 61.7 61.9 54.1 59.1 50.7 39.1 55.3 55.31999 40.7 55.7 54.9 55.3 60.9 71.1 75.9 69.8 64.1 67.8 57.3 41.4 59.6 59.62000 40.0 56.8 57.2 51.6 58.8 62.8 69.6 64.5 63.5 65.9 54.9 41.2 57.1 57.12001 43.5 54.2 63.3 56.9 59.6 60.0 63.9 65.4 57.8 54.1 51.4 41.7 56.0 56.02002 41.1 50.2 56.3 60.4 54.1 65.9 64.3 60.9 55.2 55.9 55.4 44.8 55.4 55.42003 47.7 53.9 58.5 50.0 56.3 56.7 62.7 63.5 58.7 60.8 62.6 42.2 56.1 56.12004 45.0 60.6 56.9 56.9 56.6 69.9 74.4 67.6 61.9 65.6 57.1 42.7 59.6 59.6Avg 43.7 55.3 58.0 55.0 57.8 64.2 67.6 64.9 59.4 61.4 55.6 41.8 57.0 57.0
January February March April May June July August September October November December Total Year Dec YTD1998 48.03 48.37 49.33 49.06 47.12 49.05 52.06 53.72 52.33 53.33 52.33 52.68 50.69 50.691999 52.18 54.71 54.34 54.91 55.02 54.45 55.30 54.96 54.85 55.05 52.23 54.30 54.46 54.462000 52.90 55.31 56.24 55.75 56.56 56.63 60.37 58.80 57.23 58.59 58.75 57.67 57.22 57.222001 56.99 58.17 61.52 60.03 60.47 61.39 64.00 59.55 61.07 59.60 59.96 57.13 60.20 60.202002 56.27 58.78 59.23 59.68 59.65 60.98 62.58 60.68 58.09 59.75 59.42 55.85 59.46 59.462003 59.08 60.85 61.59 60.91 62.46 61.70 64.59 62.02 61.28 62.26 61.16 58.75 61.53 61.532004 58.15 60.72 60.65 62.31 61.43 61.08 62.36 61.43 61.68 61.86 60.94 62.14 61.30 61.30Avg 54.81 56.73 57.62 57.60 57.52 57.78 60.07 58.67 58.07 58.55 57.85 56.91 57.82 57.82
January February March April May June July August September October November December Total Year Dec YTD1998 23.34 26.77 29.42 26.59 27.29 30.53 32.14 33.28 28.30 31.51 26.54 20.60 28.03 28.031999 21.26 30.47 29.85 30.37 33.53 38.70 41.97 38.38 35.15 37.32 29.93 22.50 32.46 32.462000 21.17 31.39 32.18 28.74 33.27 35.57 42.03 37.92 36.36 38.62 32.26 23.73 32.69 32.692001 24.77 31.54 38.94 34.19 36.06 36.82 40.91 38.95 35.27 32.22 30.81 23.83 33.70 33.702002 23.11 29.51 33.34 36.07 32.25 40.17 40.25 36.98 32.04 33.39 32.91 25.05 32.93 32.932003 28.16 32.81 36.01 30.46 35.16 35.00 40.50 39.39 36.00 37.86 38.30 24.78 34.55 34.552004 26.18 36.77 34.50 35.46 34.77 42.73 46.41 41.54 38.20 40.58 34.78 26.55 36.52 36.52Avg 23.94 31.35 33.44 31.69 33.25 37.07 40.61 38.06 34.47 35.94 32.19 23.81 32.98 32.98
January February March April May June July August September October November December Total Year Dec YTD1998 26,908 24,304 26,908 26,040 26,908 27,960 28,892 28,892 27,960 28,892 27,960 30,876 332,500 332,5001999 30,876 27,888 30,876 29,880 30,876 29,880 30,876 30,876 29,880 30,876 29,880 30,876 363,540 363,5402000 30,876 27,888 30,876 29,880 30,876 29,880 28,644 28,644 27,720 28,644 27,720 28,644 350,292 350,2922001 28,644 25,872 28,644 27,720 28,644 27,720 28,644 28,644 27,720 28,644 27,720 28,644 337,260 337,2602002 28,644 25,872 28,644 27,720 28,644 27,720 28,644 28,644 27,720 28,644 27,720 28,644 337,260 337,2602003 28,644 25,872 28,644 27,720 28,644 27,720 28,644 28,644 27,720 28,644 27,720 28,644 337,260 337,2602004 28,644 25,872 28,644 27,720 28,644 27,720 28,644 28,644 27,720 28,644 27,720 28,644 337,260 337,260Avg 29,034 26,224 29,034 28,097 29,034 28,371 28,998 28,998 28,063 28,998 28,063 29,282 342,196 342,196
January February March April May June July August September October November December Total Year Dec YTD1998 13,073 13,453 16,046 14,110 15,586 17,407 17,840 17,897 15,120 17,071 14,182 12,072 183,857 183,8571999 12,577 15,532 16,960 16,523 18,815 21,236 23,436 21,562 19,145 20,935 17,125 12,792 216,638 216,6382000 12,356 15,831 17,667 15,405 18,161 18,769 19,941 18,472 17,609 18,879 15,223 11,788 200,101 200,1012001 12,452 14,030 18,128 15,785 17,082 16,628 18,310 18,737 16,010 15,483 14,242 11,945 188,832 188,8322002 11,765 12,989 16,124 16,754 15,489 18,262 18,425 17,454 15,292 16,008 15,353 12,844 186,759 186,7592003 13,650 13,951 16,746 13,863 16,124 15,725 17,960 18,190 16,283 17,421 17,361 12,080 189,354 189,3542004 12,895 15,668 16,293 15,775 16,214 19,389 21,317 19,371 17,168 18,790 15,820 12,238 200,938 200,938Avg 12,681 14,493 16,852 15,459 16,782 18,202 19,604 18,812 16,661 17,798 15,615 12,251 195,211 195,211
January February March April May June July August September October November December Total Year Dec YTD1998 627,932 650,663 791,523 692,302 734,389 853,737 928,685 961,424 791,170 910,343 742,130 635,893 9,320,191 9,320,1911999 656,294 849,711 921,582 907,324 1,035,154 1,156,253 1,295,910 1,185,071 1,050,174 1,152,436 894,432 694,650 11,798,991 11,798,9912000 653,586 875,540 993,637 858,833 1,027,262 1,062,959 1,203,801 1,086,173 1,007,815 1,106,119 894,342 679,845 11,449,912 11,449,9122001 709,649 816,078 1,115,321 947,635 1,032,971 1,020,735 1,171,909 1,115,714 977,793 922,814 853,964 682,452 11,367,035 11,367,0352002 662,012 763,464 955,022 999,829 923,863 1,113,549 1,153,057 1,059,135 888,255 956,516 912,227 717,396 11,104,325 11,104,3252003 806,496 848,871 1,031,335 844,393 1,007,163 970,295 1,160,050 1,128,207 997,799 1,084,563 1,061,778 709,704 11,650,654 11,650,6542004 749,832 951,320 988,100 983,004 996,068 1,184,345 1,329,380 1,189,959 1,058,998 1,162,393 964,045 760,517 12,317,961 12,317,961Avg 695,114 822,235 970,931 890,474 965,267 1,051,696 1,177,542 1,103,669 967,429 1,042,169 903,274 697,208 11,287,010 11,287,010
Demand
Revenue ($)
No representation is made as to the completeness or accuracy of the information in this report. The information is in no way to be construed as a recommendation by Smith Travel Research of any industry standard and is intended solely for the internal purposes of your company. It should not be published in any manner unless authorized by Smith Travel Research. A blank row indicates insufficient data. Copyright © 2005 Smith Travel Research, Inc. All rights reserved.
Occupancy (%)
ADR ($)
RevPAR ($)
Supply

Tab 3 - Percent Change from Previous Year - Detail by MeasureWaterloo & Ceder Falls, IA Area Selected Properties
Job Number: 38091 Staff: KC Created: February 02, 2005
January February March April May June July August September October November December Total Year Dec YTD1999 -16.2 0.6 -7.9 2.1 5.2 14.2 22.9 12.7 18.5 14.8 13.0 6.0 7.8 7.82000 -1.8 1.9 4.2 -6.8 -3.5 -11.6 -8.3 -7.7 -0.9 -2.8 -4.2 -0.7 -4.1 -4.12001 8.6 -4.5 10.6 10.5 1.4 -4.5 -8.2 1.4 -9.1 -18.0 -6.4 1.3 -2.0 -2.02002 -5.5 -7.4 -11.1 6.1 -9.3 9.8 0.6 -6.8 -4.5 3.4 7.8 7.5 -1.1 -1.12003 16.0 7.4 3.9 -17.3 4.1 -13.9 -2.5 4.2 6.5 8.8 13.1 -5.9 1.4 1.42004 -5.5 12.3 -2.7 13.8 0.6 23.3 18.7 6.5 5.4 7.9 -8.9 1.3 6.1 6.1Avg -0.7 1.7 -0.5 1.4 -0.3 2.9 3.9 1.7 2.7 2.4 2.4 1.6 1.4 1.4
January February March April May June July August September October November December Total Year Dec YTD1999 8.6 13.1 10.2 11.9 16.8 11.0 6.2 2.3 4.8 3.2 -0.2 3.1 7.4 7.42000 1.4 1.1 3.5 1.5 2.8 4.0 9.2 7.0 4.3 6.4 12.5 6.2 5.1 5.12001 7.7 5.2 9.4 7.7 6.9 8.4 6.0 1.3 6.7 1.7 2.1 -0.9 5.2 5.22002 -1.3 1.1 -3.7 -0.6 -1.4 -0.7 -2.2 1.9 -4.9 0.3 -0.9 -2.2 -1.2 -1.22003 5.0 3.5 4.0 2.1 4.7 1.2 3.2 2.2 5.5 4.2 2.9 5.2 3.5 3.52004 -1.6 -0.2 -1.5 2.3 -1.7 -1.0 -3.4 -1.0 0.7 -0.6 -0.4 5.8 -0.4 -0.4Avg 3.3 4.0 3.7 4.2 4.7 3.8 3.2 2.3 2.9 2.5 2.7 2.9 3.3 3.3
January February March April May June July August September October November December Total Year Dec YTD1999 -8.9 13.8 1.5 14.2 22.8 26.7 30.6 15.3 24.2 18.5 12.8 9.2 15.8 15.82000 -0.4 3.0 7.8 -5.3 -0.8 -8.1 0.1 -1.2 3.4 3.5 7.8 5.5 0.7 0.72001 17.0 0.5 21.0 18.9 8.4 3.5 -2.6 2.7 -3.0 -16.6 -4.5 0.4 3.1 3.12002 -6.7 -6.4 -14.4 5.5 -10.6 9.1 -1.6 -5.1 -9.2 3.7 6.8 5.1 -2.3 -2.32003 21.8 11.2 8.0 -15.5 9.0 -12.9 0.6 6.5 12.3 13.4 16.4 -1.1 4.9 4.92004 -7.0 12.1 -4.2 16.4 -1.1 22.1 14.6 5.5 6.1 7.2 -9.2 7.2 5.7 5.7Avg 2.6 5.7 3.3 5.7 4.6 6.7 7.0 4.0 5.6 5.0 5.0 4.4 4.7 4.7
January February March April May June July August September October November December Total Year Dec YTD1999 14.7 14.7 14.7 14.7 14.7 6.9 6.9 6.9 6.9 6.9 6.9 0.0 9.3 9.32000 0.0 0.0 0.0 0.0 0.0 0.0 -7.2 -7.2 -7.2 -7.2 -7.2 -7.2 -3.6 -3.62001 -7.2 -7.2 -7.2 -7.2 -7.2 -7.2 0.0 0.0 0.0 0.0 0.0 0.0 -3.7 -3.72002 0.0 0.0 0.0 0.0 0.0 0.0 0.0 0.0 0.0 0.0 0.0 0.0 0.0 0.02003 0.0 0.0 0.0 0.0 0.0 0.0 0.0 0.0 0.0 0.0 0.0 0.0 0.0 0.02004 0.0 0.0 0.0 0.0 0.0 0.0 0.0 0.0 0.0 0.0 0.0 0.0 0.0 0.0Avg 1.3 1.3 1.3 1.3 1.3 -0.1 -0.1 -0.1 -0.1 -0.1 -0.1 -1.2 0.3 0.3
January February March April May June July August September October November December Total Year Dec YTD1999 -3.8 15.5 5.7 17.1 20.7 22.0 31.4 20.5 26.6 22.6 20.8 6.0 17.8 17.82000 -1.8 1.9 4.2 -6.8 -3.5 -11.6 -14.9 -14.3 -8.0 -9.8 -11.1 -7.8 -7.6 -7.62001 0.8 -11.4 2.6 2.5 -5.9 -11.4 -8.2 1.4 -9.1 -18.0 -6.4 1.3 -5.6 -5.62002 -5.5 -7.4 -11.1 6.1 -9.3 9.8 0.6 -6.8 -4.5 3.4 7.8 7.5 -1.1 -1.12003 16.0 7.4 3.9 -17.3 4.1 -13.9 -2.5 4.2 6.5 8.8 13.1 -5.9 1.4 1.42004 -5.5 12.3 -2.7 13.8 0.6 23.3 18.7 6.5 5.4 7.9 -8.9 1.3 6.1 6.1Avg 0.0 3.1 0.4 2.6 1.1 3.0 4.2 1.9 2.8 2.5 2.6 0.4 1.8 1.8
January February March April May June July August September October November December Total Year Dec YTD1999 4.5 30.6 16.4 31.1 41.0 35.4 39.5 23.3 32.7 26.6 20.5 9.2 26.6 26.62000 -0.4 3.0 7.8 -5.3 -0.8 -8.1 -7.1 -8.3 -4.0 -4.0 0.0 -2.1 -3.0 -3.02001 8.6 -6.8 12.2 10.3 0.6 -4.0 -2.6 2.7 -3.0 -16.6 -4.5 0.4 -0.7 -0.72002 -6.7 -6.4 -14.4 5.5 -10.6 9.1 -1.6 -5.1 -9.2 3.7 6.8 5.1 -2.3 -2.32003 21.8 11.2 8.0 -15.5 9.0 -12.9 0.6 6.5 12.3 13.4 16.4 -1.1 4.9 4.92004 -7.0 12.1 -4.2 16.4 -1.1 22.1 14.6 5.5 6.1 7.2 -9.2 7.2 5.7 5.7Avg 3.5 7.3 4.3 7.1 6.4 6.9 7.2 4.1 5.8 5.1 5.0 3.1 5.2 5.2
Demand
Revenue
No representation is made as to the completeness or accuracy of the information in this report. The information is in no way to be construed as a recommendation by Smith Travel Research of any industry standard and is intended solely for the internal purposes of your company. It should not be published in any manner unless authorized by Smith Travel Research. A blank row indicates insufficient data. Copyright © 2005 Smith Travel Research, Inc. All rights reserved.
Occupancy
ADR
RevPAR
Supply

Tab 4 - Percent Change from Previous Year - Detail by YearWaterloo & Ceder Falls, IA Area Selected Properties
Job Number: 38091 Staff: KC Created: February 02, 2005
Jan 99 Feb 99 Mar 99 Apr 99 May 99 Jun 99 Jul 99 Aug 99 Sep 99 Oct 99 Nov 99 Dec 99 Total Year Dec YTDOcc -16.2 0.6 -7.9 2.1 5.2 14.2 22.9 12.7 18.5 14.8 13.0 6.0 7.8 7.8
ADR 8.6 13.1 10.2 11.9 16.8 11.0 6.2 2.3 4.8 3.2 -0.2 3.1 7.4 7.4
RevPAR -8.9 13.8 1.5 14.2 22.8 26.7 30.6 15.3 24.2 18.5 12.8 9.2 15.8 15.8
Supply 14.7 14.7 14.7 14.7 14.7 6.9 6.9 6.9 6.9 6.9 6.9 0.0 9.3 9.3
Demand -3.8 15.5 5.7 17.1 20.7 22.0 31.4 20.5 26.6 22.6 20.8 6.0 17.8 17.8
Revenue 4.5 30.6 16.4 31.1 41.0 35.4 39.5 23.3 32.7 26.6 20.5 9.2 26.6 26.6
Jan 00 Feb 00 Mar 00 Apr 00 May 00 Jun 00 Jul 00 Aug 00 Sep 00 Oct 00 Nov 00 Dec 00 Total Year Dec YTDOcc -1.8 1.9 4.2 -6.8 -3.5 -11.6 -8.3 -7.7 -0.9 -2.8 -4.2 -0.7 -4.1 -4.1
ADR 1.4 1.1 3.5 1.5 2.8 4.0 9.2 7.0 4.3 6.4 12.5 6.2 5.1 5.1
RevPAR -0.4 3.0 7.8 -5.3 -0.8 -8.1 0.1 -1.2 3.4 3.5 7.8 5.5 0.7 0.7
Supply 0.0 0.0 0.0 0.0 0.0 0.0 -7.2 -7.2 -7.2 -7.2 -7.2 -7.2 -3.6 -3.6
Demand -1.8 1.9 4.2 -6.8 -3.5 -11.6 -14.9 -14.3 -8.0 -9.8 -11.1 -7.8 -7.6 -7.6
Revenue -0.4 3.0 7.8 -5.3 -0.8 -8.1 -7.1 -8.3 -4.0 -4.0 0.0 -2.1 -3.0 -3.0
Jan 01 Feb 01 Mar 01 Apr 01 May 01 Jun 01 Jul 01 Aug 01 Sep 01 Oct 01 Nov 01 Dec 01 Total Year Dec YTDOcc 8.6 -4.5 10.6 10.5 1.4 -4.5 -8.2 1.4 -9.1 -18.0 -6.4 1.3 -2.0 -2.0
ADR 7.7 5.2 9.4 7.7 6.9 8.4 6.0 1.3 6.7 1.7 2.1 -0.9 5.2 5.2
RevPAR 17.0 0.5 21.0 18.9 8.4 3.5 -2.6 2.7 -3.0 -16.6 -4.5 0.4 3.1 3.1
Supply -7.2 -7.2 -7.2 -7.2 -7.2 -7.2 0.0 0.0 0.0 0.0 0.0 0.0 -3.7 -3.7
Demand 0.8 -11.4 2.6 2.5 -5.9 -11.4 -8.2 1.4 -9.1 -18.0 -6.4 1.3 -5.6 -5.6
Revenue 8.6 -6.8 12.2 10.3 0.6 -4.0 -2.6 2.7 -3.0 -16.6 -4.5 0.4 -0.7 -0.7
Jan 02 Feb 02 Mar 02 Apr 02 May 02 Jun 02 Jul 02 Aug 02 Sep 02 Oct 02 Nov 02 Dec 02 Total Year Dec YTDOcc -5.5 -7.4 -11.1 6.1 -9.3 9.8 0.6 -6.8 -4.5 3.4 7.8 7.5 -1.1 -1.1
ADR -1.3 1.1 -3.7 -0.6 -1.4 -0.7 -2.2 1.9 -4.9 0.3 -0.9 -2.2 -1.2 -1.2
RevPAR -6.7 -6.4 -14.4 5.5 -10.6 9.1 -1.6 -5.1 -9.2 3.7 6.8 5.1 -2.3 -2.3
Supply 0.0 0.0 0.0 0.0 0.0 0.0 0.0 0.0 0.0 0.0 0.0 0.0 0.0 0.0
Demand -5.5 -7.4 -11.1 6.1 -9.3 9.8 0.6 -6.8 -4.5 3.4 7.8 7.5 -1.1 -1.1
Revenue -6.7 -6.4 -14.4 5.5 -10.6 9.1 -1.6 -5.1 -9.2 3.7 6.8 5.1 -2.3 -2.3
Jan 03 Feb 03 Mar 03 Apr 03 May 03 Jun 03 Jul 03 Aug 03 Sep 03 Oct 03 Nov 03 Dec 03 Total Year Dec YTDOcc 16.0 7.4 3.9 -17.3 4.1 -13.9 -2.5 4.2 6.5 8.8 13.1 -5.9 1.4 1.4
ADR 5.0 3.5 4.0 2.1 4.7 1.2 3.2 2.2 5.5 4.2 2.9 5.2 3.5 3.5
RevPAR 21.8 11.2 8.0 -15.5 9.0 -12.9 0.6 6.5 12.3 13.4 16.4 -1.1 4.9 4.9
Supply 0.0 0.0 0.0 0.0 0.0 0.0 0.0 0.0 0.0 0.0 0.0 0.0 0.0 0.0
Demand 16.0 7.4 3.9 -17.3 4.1 -13.9 -2.5 4.2 6.5 8.8 13.1 -5.9 1.4 1.4
Revenue 21.8 11.2 8.0 -15.5 9.0 -12.9 0.6 6.5 12.3 13.4 16.4 -1.1 4.9 4.9
Jan 04 Feb 04 Mar 04 Apr 04 May 04 Jun 04 Jul 04 Aug 04 Sep 04 Oct 04 Nov 04 Dec 04 Total Year Dec YTDOcc -5.5 12.3 -2.7 13.8 0.6 23.3 18.7 6.5 5.4 7.9 -8.9 1.3 6.1 6.1
ADR -1.6 -0.2 -1.5 2.3 -1.7 -1.0 -3.4 -1.0 0.7 -0.6 -0.4 5.8 -0.4 -0.4
RevPAR -7.0 12.1 -4.2 16.4 -1.1 22.1 14.6 5.5 6.1 7.2 -9.2 7.2 5.7 5.7
Supply 0.0 0.0 0.0 0.0 0.0 0.0 0.0 0.0 0.0 0.0 0.0 0.0 0.0 0.0
Demand -5.5 12.3 -2.7 13.8 0.6 23.3 18.7 6.5 5.4 7.9 -8.9 1.3 6.1 6.1
Revenue -7.0 12.1 -4.2 16.4 -1.1 22.1 14.6 5.5 6.1 7.2 -9.2 7.2 5.7 5.7
No representation is made as to the completeness or accuracy of the information in this report. The information is in no way to be construed as a recommendation by Smith Travel Research of any industry standard and is intended solely for the internal purposes of your company. It should not be
published in any manner unless authorized by Smith Travel Research. A blank row indicates insufficient data. Copyright © 2005 Smith Travel Research, Inc. All rights reserved.
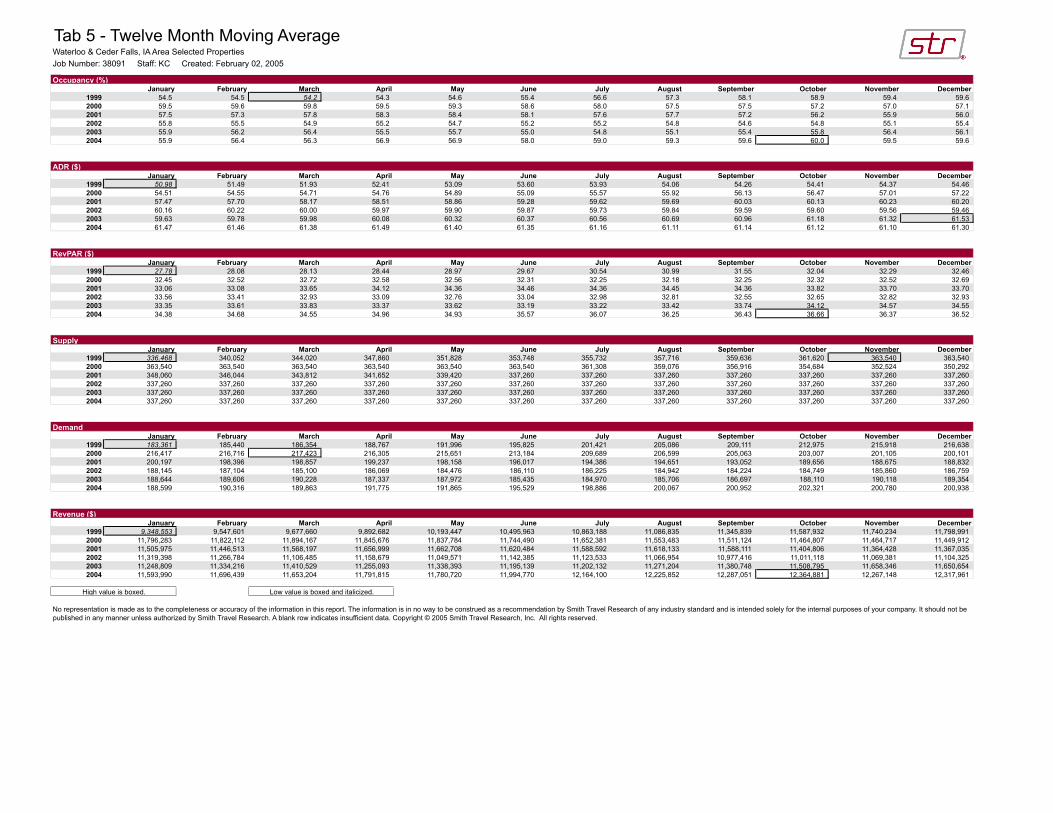
Tab 5 - Twelve Month Moving AverageWaterloo & Ceder Falls, IA Area Selected Properties
Job Number: 38091 Staff: KC Created: February 02, 2005
January February March April May June July August September October November December1999 54.5 54.5 54.2 54.3 54.6 55.4 56.6 57.3 58.1 58.9 59.4 59.6
2000 59.5 59.6 59.8 59.5 59.3 58.6 58.0 57.5 57.5 57.2 57.0 57.1
2001 57.5 57.3 57.8 58.3 58.4 58.1 57.6 57.7 57.2 56.2 55.9 56.0
2002 55.8 55.5 54.9 55.2 54.7 55.2 55.2 54.8 54.6 54.8 55.1 55.4
2003 55.9 56.2 56.4 55.5 55.7 55.0 54.8 55.1 55.4 55.8 56.4 56.1
2004 55.9 56.4 56.3 56.9 56.9 58.0 59.0 59.3 59.6 60.0 59.5 59.6
January February March April May June July August September October November December1999 50.98 51.49 51.93 52.41 53.09 53.60 53.93 54.06 54.26 54.41 54.37 54.46
2000 54.51 54.55 54.71 54.76 54.89 55.09 55.57 55.92 56.13 56.47 57.01 57.22
2001 57.47 57.70 58.17 58.51 58.86 59.28 59.62 59.69 60.03 60.13 60.23 60.20
2002 60.16 60.22 60.00 59.97 59.90 59.87 59.73 59.84 59.59 59.60 59.56 59.46
2003 59.63 59.78 59.98 60.08 60.32 60.37 60.56 60.69 60.96 61.18 61.32 61.53
2004 61.47 61.46 61.38 61.49 61.40 61.35 61.16 61.11 61.14 61.12 61.10 61.30
January February March April May June July August September October November December1999 27.78 28.08 28.13 28.44 28.97 29.67 30.54 30.99 31.55 32.04 32.29 32.46
2000 32.45 32.52 32.72 32.58 32.56 32.31 32.25 32.18 32.25 32.32 32.52 32.69
2001 33.06 33.08 33.65 34.12 34.36 34.46 34.36 34.45 34.36 33.82 33.70 33.70
2002 33.56 33.41 32.93 33.09 32.76 33.04 32.98 32.81 32.55 32.65 32.82 32.93
2003 33.35 33.61 33.83 33.37 33.62 33.19 33.22 33.42 33.74 34.12 34.57 34.55
2004 34.38 34.68 34.55 34.96 34.93 35.57 36.07 36.25 36.43 36.66 36.37 36.52
January February March April May June July August September October November December1999 336,468 340,052 344,020 347,860 351,828 353,748 355,732 357,716 359,636 361,620 363,540 363,540
2000 363,540 363,540 363,540 363,540 363,540 363,540 361,308 359,076 356,916 354,684 352,524 350,292
2001 348,060 346,044 343,812 341,652 339,420 337,260 337,260 337,260 337,260 337,260 337,260 337,260
2002 337,260 337,260 337,260 337,260 337,260 337,260 337,260 337,260 337,260 337,260 337,260 337,260
2003 337,260 337,260 337,260 337,260 337,260 337,260 337,260 337,260 337,260 337,260 337,260 337,260
2004 337,260 337,260 337,260 337,260 337,260 337,260 337,260 337,260 337,260 337,260 337,260 337,260
January February March April May June July August September October November December1999 183,361 185,440 186,354 188,767 191,996 195,825 201,421 205,086 209,111 212,975 215,918 216,638
2000 216,417 216,716 217,423 216,305 215,651 213,184 209,689 206,599 205,063 203,007 201,105 200,101
2001 200,197 198,396 198,857 199,237 198,158 196,017 194,386 194,651 193,052 189,656 188,675 188,832
2002 188,145 187,104 185,100 186,069 184,476 186,110 186,225 184,942 184,224 184,749 185,860 186,759
2003 188,644 189,606 190,228 187,337 187,972 185,435 184,970 185,706 186,697 188,110 190,118 189,354
2004 188,599 190,316 189,863 191,775 191,865 195,529 198,886 200,067 200,952 202,321 200,780 200,938
January February March April May June July August September October November December1999 9,348,553 9,547,601 9,677,660 9,892,682 10,193,447 10,495,963 10,863,188 11,086,835 11,345,839 11,587,932 11,740,234 11,798,991
2000 11,796,283 11,822,112 11,894,167 11,845,676 11,837,784 11,744,490 11,652,381 11,553,483 11,511,124 11,464,807 11,464,717 11,449,912
2001 11,505,975 11,446,513 11,568,197 11,656,999 11,662,708 11,620,484 11,588,592 11,618,133 11,588,111 11,404,806 11,364,428 11,367,035
2002 11,319,398 11,266,784 11,106,485 11,158,679 11,049,571 11,142,385 11,123,533 11,066,954 10,977,416 11,011,118 11,069,381 11,104,325
2003 11,248,809 11,334,216 11,410,529 11,255,093 11,338,393 11,195,139 11,202,132 11,271,204 11,380,748 11,508,795 11,658,346 11,650,654
2004 11,593,990 11,696,439 11,653,204 11,791,815 11,780,720 11,994,770 12,164,100 12,225,852 12,287,051 12,364,881 12,267,148 12,317,961
High value is boxed. Low value is boxed and italicized.
No representation is made as to the completeness or accuracy of the information in this report. The information is in no way to be construed as a recommendation by Smith Travel Research of any industry standard and is intended solely for the internal purposes of your company. It should not be
published in any manner unless authorized by Smith Travel Research. A blank row indicates insufficient data. Copyright © 2005 Smith Travel Research, Inc. All rights reserved.
Demand
Revenue ($)
RevPAR ($)
Supply
Occupancy (%)
ADR ($)

Tab 6 - Day of Week AnalysisWaterloo & Ceder Falls, IA Area Selected Properties
Job Number: 38091 Staff: KC Created: February 02, 2005
Occupancy (%) Three Year Occupancy (%)
Sun Mon Tue Wed Thu Fri Sat Total Month Sun Mon Tue Wed Thu Fri Sat Total Year
Jan - 04 30.9 53.7 58.5 52.8 37.8 40.6 43.9 45.0 Jan 02 - Dec 02 31.7 50.4 59.6 60.0 53.6 61.8 70.4 55.4
Feb - 04 42.9 57.9 62.8 64.9 62.8 64.3 72.7 60.6 Jan 03 - Dec 03 32.7 51.0 59.8 59.9 54.1 63.2 72.3 56.1
Mar - 04 29.9 52.7 59.3 62.4 55.1 63.4 74.5 56.9 Jan 04 - Dec 04 38.5 56.3 64.9 63.8 57.0 64.1 72.3 59.6
Apr - 04 33.0 50.7 60.3 59.5 56.0 65.2 71.9 56.9 3 Yr Avg 34.3 52.6 61.4 61.2 54.9 63.0 71.7 57.0
May - 04 35.4 51.9 66.0 63.2 51.8 60.0 70.8 56.6
Jun - 04 44.6 67.9 73.1 71.8 71.5 75.0 84.6 69.9
Jul - 04 54.1 65.3 78.6 78.8 73.7 76.7 89.6 74.4
Aug - 04 44.2 64.2 69.4 74.0 68.8 74.6 84.5 67.6
Sep - 04 39.8 58.2 68.8 65.2 57.4 64.3 80.2 61.9
Oct - 04 45.9 58.1 77.1 71.8 62.3 69.6 75.7 65.6
Nov - 04 31.0 54.4 59.6 60.4 56.1 70.9 67.2 57.1
Dec - 04 27.1 41.5 44.7 44.2 37.0 49.8 54.2 42.7
Year Avg 38.5 56.3 64.9 63.8 57.0 64.1 72.3 59.6
ADR ($) Three Year ADR ($)
Sun Mon Tue Wed Thu Fri Sat Total Month Sun Mon Tue Wed Thu Fri Sat Total Year
Jan - 04 56.17 58.42 59.06 59.50 58.73 56.27 57.96 58.15 Jan 02 - Dec 02 56.87 58.19 58.28 58.92 58.79 60.97 62.16 59.46
Feb - 04 54.84 57.70 59.68 58.56 60.70 66.67 65.04 60.72 Jan 03 - Dec 03 59.92 60.36 60.64 60.67 61.19 62.62 63.84 61.53
Mar - 04 57.39 57.42 59.83 61.47 59.64 62.77 63.68 60.65 Jan 04 - Dec 04 59.05 59.46 60.43 60.59 60.81 62.94 64.25 61.30
Apr - 04 61.26 59.89 59.49 60.07 61.61 63.86 67.66 62.31 3 Yr Avg 58.65 59.35 59.80 60.07 60.28 62.19 63.43 60.78
May - 04 62.13 59.82 60.11 59.72 59.46 63.00 64.57 61.43
Jun - 04 57.58 58.82 61.15 60.09 61.93 62.92 63.37 61.08
Jul - 04 61.14 60.15 60.97 62.01 60.91 63.73 65.48 62.36
Aug - 04 59.11 60.31 59.46 60.82 61.94 63.44 64.37 61.43
Sep - 04 58.53 59.96 61.60 61.41 61.06 62.39 64.85 61.68
Oct - 04 60.37 60.52 61.60 60.72 60.57 61.59 65.78 61.86
Nov - 04 60.44 59.68 60.56 59.99 60.68 63.17 61.57 60.94
Dec - 04 59.12 61.14 61.39 61.94 61.30 64.04 63.80 62.14
Year Avg 59.05 59.46 60.43 60.59 60.81 62.94 64.25 61.30
RevPAR ($) Three Year RevPAR ($)
Sun Mon Tue Wed Thu Fri Sat Total Month Sun Mon Tue Wed Thu Fri Sat Total Year
Jan - 04 17.35 31.39 34.53 31.45 22.19 22.87 25.47 26.18 Jan 02 - Dec 02 18.06 29.32 34.71 35.35 31.53 37.66 43.77 32.93
Feb - 04 23.53 33.41 37.51 37.99 38.13 42.86 47.27 36.77 Jan 03 - Dec 03 19.57 30.76 36.28 36.35 33.09 39.58 46.14 34.55
Mar - 04 17.17 30.26 35.46 38.36 32.87 39.78 47.42 34.50 Jan 04 - Dec 04 22.74 33.49 39.20 38.68 34.67 40.37 46.46 36.52
Apr - 04 20.20 30.34 35.85 35.72 34.50 41.65 48.67 35.46 3 Yr Avg 20.11 31.20 36.72 36.79 33.10 39.21 45.45 34.66
May - 04 22.01 31.05 39.67 37.75 30.79 37.82 45.72 34.77
Jun - 04 25.66 39.92 44.68 43.17 44.28 47.18 53.59 42.73
Jul - 04 33.05 39.28 47.91 48.86 44.88 48.87 58.69 46.41
Aug - 04 26.10 38.72 41.25 45.02 42.64 47.32 54.40 41.54
Sep - 04 23.29 34.88 42.40 40.06 35.02 40.11 51.99 38.20
Oct - 04 27.69 35.18 47.50 43.59 37.74 42.89 49.82 40.58
Nov - 04 18.72 32.46 36.07 36.24 34.01 44.80 41.40 34.78
Dec - 04 16.02 25.39 27.41 27.36 22.65 31.87 34.56 26.55
Year Avg 22.74 33.49 39.20 38.68 34.67 40.37 46.46 36.52
No representation is made as to the completeness or accuracy of the information in this report. The information is in no way to be construed as a recommendation by Smith Travel Research of any industry standard and is intended solely for the internal purposes of your company. It should not
be published in any manner unless authorized by Smith Travel Research. A blank row indicates insufficient data. Copyright © 2005 Smith Travel Research, Inc. All rights reserved.

Tab 9 - Response ReportWaterloo & Ceder Falls, IA Area Selected Properties
Job Number: 38091 Staff: KC Created: February 02, 2005
STR
Code Name of Establishment City & State Zip Code Aff Date Open Date Rooms
Chg in
Rms J F M A M J J A S O N D J F M A M J J A S O N D J F M A M J J A S O N D
939 Holiday Inn Cedar Falls University Plaza Cedar Falls, IA 50613 Oct 1963 Jun 1958 112 Y ! ! ! ! ! ! ! ! ! ! ! ! ! ! ! ! ! ! ! ! ! ! ! ! ! ! ! ! ! ! ! ! ! ! ! !
940 Ramada Waterloo Convention Center Waterloo, IA 50701 Jan 2002 Mar 1983 228 " " ! ! ! ! ! ! ! ! ! ! ! ! ! ! ! ! ! ! ! ! ! ! ! ! ! ! ! ! ! ! ! ! ! !
10657 Fairfield Inn Waterloo Waterloo, IA 50702 Jun 1992 Jun 1992 57 ! ! ! ! ! ! ! ! ! ! ! ! ! ! ! ! ! ! ! ! ! ! ! ! ! ! ! ! ! ! ! ! ! ! ! !
14653 Motel 6 Waterloo Waterloo, IA 50703 Aug 1998 Jul 1995 50 ! ! ! ! ! ! ! ! ! ! ! ! ! ! ! ! ! ! ! ! ! ! ! ! ! ! ! ! ! ! ! ! ! ! ! !
16583 Quality Inn & Stes Waterloo Waterloo, IA 50701 Dec 1996 Jun 1968 67 Y ! ! ! ! ! ! ! ! ! ! ! ! ! ! ! ! ! ! ! ! ! ! ! ! ! ! ! ! ! ! ! ! ! ! ! !
16921 Ramada Limited Evansdale Evansdale, IA 50707 Jun 1995 Jun 1995 46 ! ! ! ! ! ! ! ! ! ! ! ! ! ! ! ! ! ! ! ! ! ! ! ! ! ! ! ! ! ! ! ! ! ! ! !
26528 Super 8 Waterloo Waterloo, IA 50702 Sep 1988 Sep 1988 62 " " " " " " " " " " " " ! ! ! ! ! ! ! ! ! ! ! ! ! ! ! ! ! ! ! ! ! ! ! !
27396 Comfort Inn Waterloo Waterloo, IA 50702 Feb 1990 Feb 1990 56 ! ! ! ! ! ! ! ! ! ! ! ! ! ! ! ! ! ! ! ! ! ! ! ! ! ! ! ! ! ! ! ! ! ! ! !
29418 Holiday Inn Express Hotel Waterloo Waterloo, IA 50702 Dec 1999 Nov 1993 51 ! ! ! ! ! ! ! ! ! ! ! ! ! ! ! ! ! ! ! ! ! ! ! ! ! ! ! ! ! ! ! ! ! ! ! !
36642 Country Inn & Suites Waterloo Waterloo, IA 50701 Jun 1998 Jun 1998 64 " " " ! ! ! ! ! ! ! ! ! ! ! ! ! ! ! ! ! ! ! ! ! ! ! ! ! ! ! ! ! ! ! ! !
37416 Country Inn & Suites Cedar Falls Cedar Falls, IA 50613 Dec 1998 Dec 1998 64 " " " ! ! ! ! ! ! ! ! ! ! ! ! ! ! ! ! ! ! ! ! ! ! ! ! ! ! ! ! ! ! ! ! !
40563 Days Inn Cedar Falls Cedar Falls, IA 50613 Dec 2001 Jun 1958 67 " " ! ! ! ! ! ! ! ! ! ! ! ! ! ! ! ! ! ! ! ! ! ! ! ! ! ! ! ! ! ! ! ! ! !
Total Properties: 12 924 " - Monthly data received by STR
! - Monthly and daily data received by STR
Blank - No data received by STR
Y - (Chg in Rms) Property has experienced a room addition or drop during the time period of the report
No representation is made as to the completeness or accuracy of the information in this report. The information is in no way to be construed as a recommendation by Smith Travel Research of any industry standard and is intended solely for the internal purposes of your company. It should not be
published in any manner unless authorized by Smith Travel Research. A blank row indicates insufficient data. Copyright © 2005 Smith Travel Research, Inc. All rights reserved.
2002 2003 2004

Tab 10 - Help
Methodology
Glossary
Room revenue divided by rooms sold. Total room revenue generated from the sale or rental of rooms.
Date the property affiliated with current chain/flag
The number of properties and rooms that exist (universe)
Indicator of whether or not an individual hotel has had added or deleted rooms.
Data on selected properties or segments starting in 1997.
The number of rooms sold (excludes complimentary rooms).
STR Code
Data on selected properties or segments starting in 1987.
Rooms sold divided by rooms available. The number of rooms times the number of days in the period.
Date the property opened
Average or sum of values starting January 1 of the given year.
While virtually every chain in the United States provides STR with data on almost all of their properties, there are still some hotels that don't submit data. But we've got you covered.
Every year we examine guidebook listings and hotel directories for information on hotels that don't provide us with data. We don't stop there. We call each hotel in our database every year to obtain "published"
rates for multiple categories. Based on this information we group all hotels - those that report data and those that don't - into groupings based off of price level and geographic proximity. We then estimate the non-
respondents based off of nearby hotels with similar price levels.
Similarly, we sometimes obtain monthly data from a property, but not daily data. We use a similar process. We take the monthly data that the property has provided, and distribute it to the individual days based on
of the revenue and demand distribution patterns of similar hotels in the same location.
We believe it imperative to perform this analysis in order to provide interested parties with our best estimate of total lodging demand and room revenue on their areas of interest. Armed with this information a more
informed decision can be made.
Revenue (Room Revenue)
Demand (Rooms Sold)
Census (Properties and Rooms)
ADR (Average Daily Rate)
RevPAR - Revenue Per Available Room Affiliation Date
Sample % (Rooms)
Supply (Rooms Available)Occupancy
Percent Change
Open Date
Amount of growth, up, flat, or down from the same period last year (month, ytd, three months,
twelve months). Calculated as ((TY-LY)/LY) * "100".
Room revenue divided by rooms available (occupancy times average room rate will closely
approximate RevPAR).
The % of rooms STR receives data from. Calculated as (Sample Rooms/Census Rooms) *
"100". Change in Rooms
Twelve Month Moving Average
Year to Date
Smith Travel Research's proprietary numbering system. Each hotel in the lodging census has
a unique STR code.
Standard Historical TREND
Full Historical TREND
The value of any given month is computed by taking the value of that month and the values of
the eleven preceiding months, adding them together and dividing by twelve.