Waterbirds in the UK 2015/16 - Welcome to the BTO · PINK-FOOTED GOOSE BY CHRIS KNIGHTS, ......
40
1 in association with Waterbirds in the UK 2015/16 The annual report of the Wetland Bird Survey
Transcript of Waterbirds in the UK 2015/16 - Welcome to the BTO · PINK-FOOTED GOOSE BY CHRIS KNIGHTS, ......

1
in associationwith
Waterbirds in the UK 2015/16
The annual report of the Wetland Bird Survey

2
WATERBIRDS IN THE UK 2015/16The Wetland Bird Survey (WeBS) is the principal scheme for monitoring the UK’s wintering waterbird populations, providing an important indicator of their status and the health of wetlands. Waterbirds in the UK 2015/16 is the 35th WeBS annual report and comprises this summary report and data at www.bto.org/webs-reporting.
British Trust for Ornithology The Nunnery Thetford Norfolk IP24 2PU www.bto.org
Joint Nature Conservation Committee Monkstone House City Road Peterborough PE1 1JY www.jncc.defra.gov.uk
Royal Society for the Protection of Birds The Lodge Sandy Bedfordshire SG19 2DL www.rspb.org.uk
The painting of NEWS counting on the Isle
of Skye, used on the cover of this report, is
by Alan Harris. For more of Alan's work, see
www.alanharrisbirdartist.co.uk. All other
artists and photographers are acknowledged on
the pages of this report.
Maps in this report contain Ordnance Survey data
© Crown Copyright and database right 2017.
This report was printed by Swallowtail Print, Norwich.
THE WeBS PARTNERSHIPThe Wetland Bird Survey (WeBS) is run by the British Trust for Ornithology (BTO). It is a partnership between the BTO, the Royal Society for the Protection of Birds (RSPB) and the Joint Nature Conservation Committee (JNCC) (the last on behalf of the statutory nature conservation bodies: Natural England (NE), Natural Resources Wales (NRW) and Scottish Natural Heritage (SNH) and the Department of Agriculture, Environment and Rural Affairs, Northern Ireland (DAERA)) in association with the Wildfowl and Wetlands Trust. (WWT).
The permanent members of the WeBS Steering Committee in 2015/16 were Teresa Frost (BTO), Andy Musgrove (BTO), Dawn Balmer (BTO), David Stroud (JNCC), Deborah Procter (JNCC), Simon Wotton (RSPB) and Richard Hearn (WWT).
THE WeBS TEAM AT BTOTeresa Frost - WeBS National CoordinatorHeidi Mellan - Counter Network OrganiserNeil Calbrade - Low Tide Count OrganiserGraham Austin - Database ManagerMatthew Baxter - Web Software DeveloperDawn Balmer - Head of Surveys Email:[email protected]
General enquiries to WeBS: WeBS,BTO,TheNunnery,Thetford,NorfolkIP242PUEmail:[email protected]:01842750050
WeBS website: www.bto.org/webs
Other contacts:Goose & Swan Monitoring Programme - organised and funded by WWT, JNCC and SNH. Email: [email protected] national waterbird surveys - details of (and contacts for) other waterbird surveys can be obtained via the websites of the WeBS partner organisations.
We are also grateful to the following for providing
supplementary information, data inputting,
proof-reading and particularly invaluable help in
2015/16: Andy Musgrove, Deborah Procter, GSMP,
Sarah Harris, Jane Herridge, Mark Hammond, Nick
Lewis, Richard Minter, RAFOS, SOTEAG and Steve
Pritchard. Grateful thanks to all and apologies to
anyone who has been inadvertently missed.
Report content and production was by Teresa
Frost, Dawn Balmer, Heidi Mellan and Neil
Calbrade. The article on waterbird monitoring in
Sierra Leone was contributed by Papanie Bai-
Sesay (Conservation Society of Sierra Leone), the
article on SPA Review by David Stroud (JNCC)
and seaduck monitoring by Colette Hall (WWT).
ACKNOWLEDGEMENTS
We are indebted to the time and skills of the
thousands of WeBS and NEWS Counters who
collected the data used in this report and to the
invaluable efforts of the NEWS Local Organisers
and the WeBS Local Organisers who are listed on
the back cover.
The WeBS Local Organiser Advisory Committee
(LOAC) (members listed on page 39) provided
advice on behalf of counters and Local Organisers.
The BTO Information Systems team delivered
essential technical assistance and continues to
develop and provide assistance for WeBS Online.
NEWS was funded by SNH, NE, NRW, DAERA,
WeBS and I-WeBS.
Wildfowl & Wetlands TrustSlimbridge Gloucestershire GL2 7BT www.wwt.org.uk
Waterbirds in the UK 2015/16

3
Waterbird Headlines.................... 4Species in the news in 2015/16.
The WeBS Year .............................5Coverage and weather in 2015/16.
Population Trends..................... 10National trends for waterbirds wintering in the UK in 2015/16.
Principal Sites............................12Sites with the largest aggregations of wintering waterbirds.
NEWS III...................................14A summary of the Non-Estuarine Waterbird Survey III.
NEWS Habitat Focus.................16The UK's non-estuarine coast.
CONTENTS...
SPA Review ............................... 22WeBS Counts fed into the SPA Review.
Another National Scheme......... 24Waterbird monitoring in Sierra Leone.
Investigating Trends .................. 26Looking at links to potential drivers of waterbird declines.
Species Focus - Seaducks........... 28A detailed look at monitoring of seaducks in the UK.
Species Focus - Oystercatcher....30A detailed look at Oystercatcher in the UK.
Species Focus - Great Crested Grebe ...32A detailed look at Great Crested Grebe in the UK.
Species Focus - Grey Plover....... 33A detailed look at Grey Plover in the UK.
Low Tide Counts........................34Low Tide Count scheme in 2015/16.
Online Reporting Interface .......37An overview of the online WeBS reporting interface.
Uses of WeBS Data.....................38Review of how WeBS data were utilised in 2015/16.
WeBS Local Organisers..............39A list of WeBS Local Organisers and members of the WeBS LOAC.
Special Thanks ...........back cover
p.14 p.16p.4
Online Resources
More information, including site tables and trends for all regular WeBS species, is available online at: www.bto.org/webs-reporting This summary report can be downloaded from the WeBS website at: www.bto.org/webs-publications
The online and summary outputs in conjunction constitute the report Waterbirds in the UK 2015/16.
p.28
PIN
K-FO
OTE
D G
OO
SE B
Y C
HRI
S KN
IGH
TS, T
URN
STO
NE
BY JO
HN
HAR
DIN
G, B
LAC
K-H
EAD
ED G
ULL
BY
NEI
L C
ALBR
ADE,
LO
NG
-TAI
LED
DU
CK
BY G
LYN
SEL
LORS
Waterbirds in the UK 2015/16
CITATION
Frost,T.M.,Austin,G.E.,Calbrade,N.A.,Mellan,H.J.,Hall,C.,Hearn,R.D.,Stroud,D.A.,Wotton,S.R.&Balmer,D.E.2017.Waterbirds in the UK 2015/16: The Wetland Bird Survey.BTO,RSPBandJNCC,inassociationwithWWT.BritishTrustforOrnithology,Thetford.
Published by the British Trust for Ornithology, Royal Society for the Protection of Birds and Joint Nature Conservation Committee, in association with Wildfowl & Wetlands Trust, May 2017.
© British Trust for Ornithology, Royal Society for the Protection of Birds and Joint Nature Conservation Committee, in association with Wildfowl & Wetlands Trust, 2017.
ISBN 978-1-908581-76-1

4
Waterbird headlines from the WeBS year
The UK Special Protection Area (SPA) network has been reviewed, revealing the value of the contribution WeBS volunteer-collected evidence makes (pages 22–23). Data for over half of all “interest features”, meaning the species that have been used to classify each individual SPA, came from WeBS. For over 50 species of waterbird the only national data source were WeBS counts. Over a third of non-breeding waterbirds occur within SPAs, with coverage particularly good for species that aggregate at high densities. A site that is also used for migration stopover can support many more individuals than the annual peak count for this site implies, as was found in a study of Grey Plover at the Swale Estuary in Kent (page 33).
Just a small selection of notable stories from 2015/16
Waterbird Headlines
This edition of Waterbirds in the UK reports on the Non-Estuarine Waterbird Survey (NEWS III) together with results from WeBS for 2015/16. Regional maps and results from NEWS are now available in the WeBS Report Online (page 37). Coverage was impressive, with visits to over 53% of all UK NEWS sectors and 79% of priority sectors - equating to 9,200 km of coastline. One of the major outputs of NEWS is population estimates for waterbirds on the non-estuarine coast (page 15). Results show the most numerous gull on the open coast is Herring Gull (estimate of 107,900 individuals), the most numerous wader Oystercatcher (69,900; pages 30–31) and the most numerous wildfowl Wigeon (44,600).
NEWS is particularly important for gathering information on intertidal shore specialists. Sanderling numbers increased compared to previous surveys (the WeBS trend likewise has been increasing), but fewer Turnstone, Purple Sandpiper and Ringed Plover (pages 18–19) were recorded. NEWS surveyors also recorded habitat information, including extent and volume of tidal wrack deposits, which will help further understanding of how birds use coastal habitats (pages 16–17). Ducks, divers and grebes that winter offshore are an important component of the UK winter waterbird fauna. Both NEWS and WeBS results suggest that Great Northern Diver numbers are on the up (page 21). Great Crested Grebe is another species that makes use of offshore as well as inland habitats in winter (page 32). Monitoring seaducks is challenging, but both WeBS and NEWS play an important part in increasing our understanding of these species, many of which are of conservation concern (pages 28–29).
JILL
PAKE
NH
AMED
MU
ND
FEL
LOW
ES
JUST
IN C
ARR
See all the numbers and trends at www.bto.org/webs-reporting
3,092registeredWeBSvolunteers

5The WeBS Year
Many populations of wintering geese were censused using other surveys. Counts of Taiga Bean Geese were provided by the Bean Goose Action Group (Slamannan Plateau) and RSPB (Middle Yare Marshes). Surveys of Pink-footed and Icelandic Greylag Geese are undertaken at, primarily, roost sites in October and November as part of the Icelandic-breeding Goose
Goose Censuses
Census. British Greylag Geese at key sites in Scotland were censused by a number of local management groups.
Greenland White-fronted Geese were monitored by the Greenland White-fronted Goose Study. Greenland Barnacle Geese were counted by Scottish Natural Heritage on Islay and other key locations by RSPB Scotland and volunteers, while
Core Counts were carried out at 5,005 WeBS sectors (countunits) at 2,733 sites from July 2015 to June 2016.
Not all Core Counts are linked to individual counters in the WeBS Online database, but an increasing number are; 2,071 counters were associated withWeBS Core Count visits made in 2015/16, an increase of 2% on the previous year.
There were 37,664 count visits, 71% in the core September–March period.
Core Count dates in 2015/16
2015 201619 July 17 January16 August 21 February13 September 13 March18 October 10 April15 November 8 May13 December 5 June
WeBS Core Counts 2015/16 - in numbers
201620061996198619771966
5,000
4,000
3,000
2,000
1,000
0
Num
bero
fsite
sor
sec
tors
Number of WeBS sites and sectors covered 1966/67–2015/16.
Number of WeBS Core Count visits in 2015/16 by month.
4,000
3,000
2,000
1,000
0
Num
bero
fvis
its
WWT counted Svalbard Barnacle Geese on the Solway.
Results from goose surveys are described in more detail on the species account pages at http://monitoring.wwt.org.uk/our-work/goose-swan-monitoring-programme/species-accounts/
AprMarFebJanDecNovOctSepAugJul May Jun
Sites covered
Sector Level
WeBS launch
6
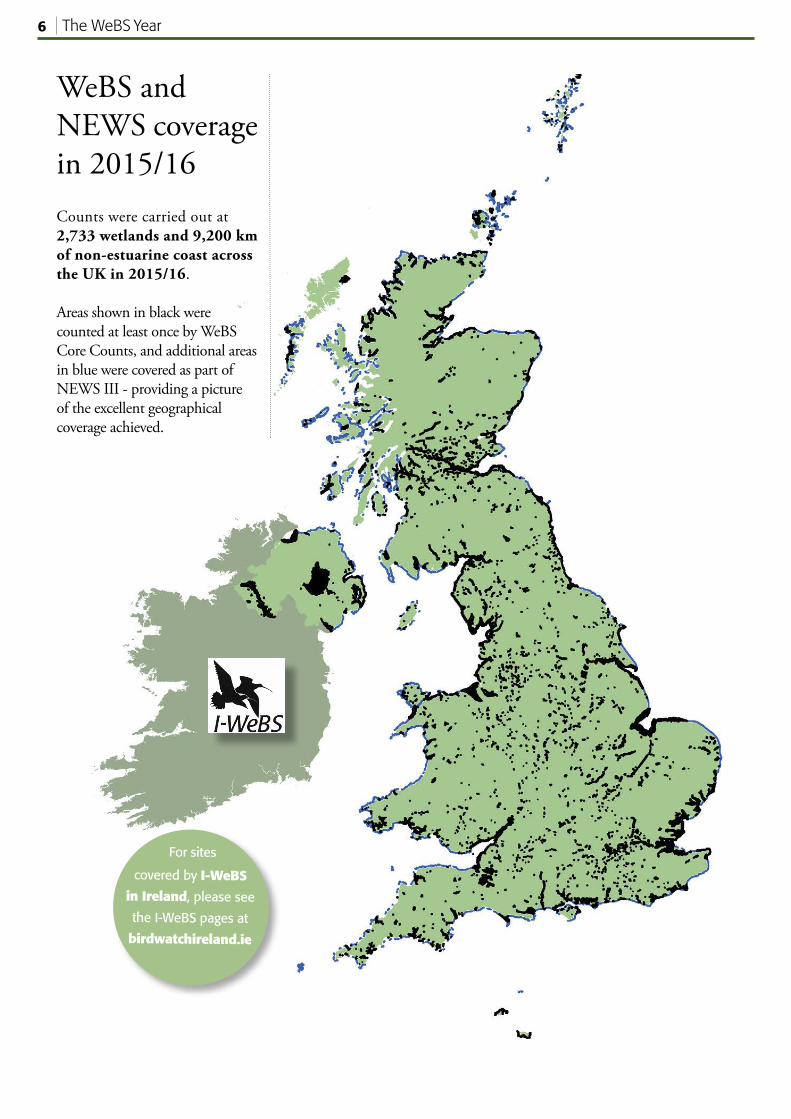
WeBS and NEWS coverage in 2015/16Counts were carried out at 2,733 wetlands and 9,200 km of non-estuarine coast across the UK in 2015/16.
Areas shown in black were counted at least once by WeBS Core Counts, and additional areas in blue were covered as part of NEWS III - providing a picture of the excellent geographical coverage achieved.
Forsites
coveredbyI-WeBSinIreland,pleasesee
theI-WeBSpagesat
birdwatchireland.ie
The WeBS Year

7
UK Low Tide Counts 2015/16Fourteen UK estuaries were counted at low tide, generating important data about feeding areas
The WeBS Low Tide Count scheme facilitates the collection of information about use of the UK’s estuaries by waterbirds at low tide. The scheme has flourished since its inception in the winter of 1992/93, with all the major estuaries in the UK having been counted at least once. The scheme aims to monitor, assess and regularly update information on the relative importance of intertidal feeding areas of UK estuaries for wintering waterbirds, and in doing so complements information gathered through the WeBS Core Counts.
Information collected at low tide represents an important contribution to the conservation of waterbirds, by providing supporting information for the management of UK Ramsar Sites and Special Protection Areas, other site designations, and whole estuary conservation plans. Numbers of waterbirds present in predefined sectors are counted. Most individual estuaries are counted at low tide once every six years, although on some sites more frequent counts are undertaken.
Coordinated counts of waterbirds are made each month from November to February inclusive, in the two-hour period either side of low tide. Each counted sector is divided into a maximum of three distinct habitat components: inter-tidal, sub-tidal, and non-tidal. Species data are divided among these habitats depending on the habitat preferences of the species concerned.
Presentation of WeBS low tide information typically takes two forms: (i) tabulated statistics of peak numbers and mean densities, and (ii) dot density maps to give a visual representation of species’ foraging densities across a site. Dots do not represent the precise positions of birds; they are assigned to habitat
at Pagham Harbour are presented on pages 34–35 of this report.
Further information about WeBS Low Tide Counts are available online via www.bto.org/websreporting-lowtide, including data summaries and distribution maps for different estuaries and species from 2015/16 and previous years.
components proportionally and placed randomly within those areas. No information about distribution of birds at a finer scale than the count sector level should be inferred. For all maps on the online reporting interface, one dot is equivalent to one bird.
During 2015/16, WeBS Low Tide Counts were carried out at 14 estuaries. Results from the counts
The WeBS Year
Estuaries counted as part of WeBS Low Tide Count scheme in 2015/16.
1 - Loch Fleet2 - Breydon Water3 - Stour Estuary4 - Orwell Estuary5 - Adur Estuary6 - Pagham Harbour7 - Langstone Harbour8 - Hayle Estuary9 - Severn Estuary10 - Swansea Bay11 - Dee Estuary12 - Strangford Lough13 - Belfast Lough14 - Wigtown Bay
1
2
43
56
7
8
910
11
12
1314

8
An exceptionally mild and wet winter
Autumn 2015 began with many periods of high pressure in September and October bringing settled conditions. November in contrast was mild and unsettled, and the winter of 2015/16 was notably warm and wet. The north and west of the UK suffered from high rainfall and severe flooding, with many areas having over double the 1981–2010 average rainfall. Only 2013/14 had higher rainfall since 1910.
Temperature records were broken, with it being the warmest winter for England and Wales and the third warmest for the UK since current records began in 1910. This was mostly due to a warm December - the warmest recorded since the Central England Temperature series began in 1659. Temperatures were above average throughout the UK, but particularly in central southern and eastern England, which was over 2.5 degrees warmer than the 1981–2010 average.
Spring 2016 was unremarkable by comparison, with mixed weather. There was a settled period in mid-March. Frosts in northern and eastern areas in April were followed by a fairly dry and warm May.
The2015ArcticBreedingSeasonReports from arctic bird studies suggested 2015 saw an early spring. Low rodent abundance may have increased predation from Arctic Foxes and breeding success was thought to be average or below average for most species.
MigrationNotesIn late July adult arctic-breeding waders began to pass through the UK and small flocks of moulting Spotted Redshank were being recorded at inland waterbodies. Juvenile arctic waders started appearing in early August. There were notable flocks of Wood Sandpiper with 34 at Seaton Marshes in Devon and 22 at Pennington Marshes in Hampshire at the end of August. Although these flocks were not picked up by WeBS Core Counts, the August WeBS count total for this species was the highest for three years.
In mid-October, high pressure extended from the North Sea to central Russia and easterly winds brought some migrant waterbirds, with several hundred Shoveler seen arriving off the sea in north Norfolk on the 15th. Bewick’s Swans were seen flying over Falsterbo, Sweden and a few days later the individual that arrived at WWT Slimbridge, Gloucestershire on the 11th October was the earliest ever.
Movements of Whooper Swans increased their reporting rate on www.birdtrack.net complete lists in the second week of November. Later in November the beginning of the unsettled weather resulted in increased sightings of Goldeneye, Scaup, Long-tailed Duck, Common Scoter and Velvet Scoter at coastal watchpoints, as well as Red-throated and Great Northern Divers.
Central Europe also experienced
mild weather, and waterbodies to the north and east remaining ice-free in December was thought to have led to some short stopping, with birds not needing to travel on to the UK. The stormy weather in December and at times in January and February increased Great Northern Divers in inland waterbodies and lead to increased numbers of rare and scarce gull species. Slightly colder weather in mid-January lead to some late arrivals of European White-fronted Geese and Bewick’s Swan.
By mid-March swans and geese were on the move. Southerly winds at the beginning of April helped Brent Geese and Common Scoter head to their breeding grounds and later in April the start of Bar-tailed Godwit and Whimbrel passage was noted on the coast, although cold northerly winds generally kept movements later than usual. A reported inland wader passage of Grey Plover, Little Stint and Curlew Sandpiper in mid-May was after the WeBS Core Count date that month.
The WeBS Year
SOURCES...
Climate summaries from www.metoffice.gov.uk
Migration updates from btomigrationblog.blogspot.co.uk
Arctic breeding fromwww.arcticbirds.net
ROBE
RT G
ILM
OO
R
Weather and migration context for 2015/16

9The WeBS Year
WeB
SIn
dex
Jul Aug Sep Oct Nov Dec Jan Feb Mar Apr May Jun
50
0
100
150
Autumn arrival: The Shoveler month index plot suggests higher than normal numbers arriving in October. Green bars = 2015/16; blue line/hatched area = previous 5-year mean/range.
Autumn passage: August WeBS count total of Wood Sandpiper in Great Britain 2005/06 to 2015/16.
WeB
SIn
dex
Jul Aug Sep Oct Nov Dec Jan Feb Mar Apr May Jun
50
0
100
150
Winter arrival: European White-fronted Geese numbers peaked in January. Green bars = 2015/16; blue line/hatched area = previous 5-year mean/range.
WeB
SIn
dex
Jul Aug Sep Oct Nov Dec Jan Feb Mar Apr May Jun
50
0
100
150
Late passage: The 2015/16 Whimbrel monthly index plot shows fewer birds than the previous five-year mean in April and more in May. Green bars = 2015/16; blue line/hatched area = previous 5-year mean/range.
200
0
10
20
30
40
50
60
2005/06 2006/07 2007/08 2008/09 2009/10 2010/11 2011/12 2012/13 2013/14 2014/15 2015/16
Mon
thly
tota
l
PETE
R C
HRI
STIA
N

10
National trends
ANN
E C
ARRI
NG
TON
-CO
TTO
N
WeBS annual species indices, with smoothed trends, are available in the WeBS Report Online for all waterbird species with sufficient data. Table 1 contains 25- and 10-year trends for the most abundant waterbird species. Here we highlight some of the latest index and trend figures.
GEESE & SWANS Whooper Swan and Bewick’s Swan indices were both lower than in 2014/15. Recent trends of increasing indices continued for most goose species. Species doing less well such as Greenland and European White-fronted Geese and Taiga Bean Goose also saw indices higher than the previous year.
DUCKS Indices for most ducks decreased slightly on 2014/15. The Mallard index saw a record low, 4% below the previous low in 2012/13, as did the Pochard index which continues its steady decline. The 25-year trends for these two species are now -41% and -67% respectively. Recent declines in Wigeon, Shelduck and Pintail also continued.
Although the WeBS methodology is not ideally suited to seaducks, the WeBS indices provide useful context to NEWS and other data (see page 28). The Velvet
Scoter index was the highest for ten years, three times that of the intervening period.
The Common Scoter trend has been increasing since the early 1980s; the 2015/16 index was 20% higher than in 2014/15, but 20% lower than in 2013/14. Eider numbers were on a par with recent years and Red-breasted Merganser continued their two decade decline from their peak in 1994/95, with the lowest index since 1984/85.
WADERS Of the open shore species, the Turnstone WeBS index was 4% higher than 2014/15, but the long-term trend for this species remains downwards.
The Purple Sandpiper WeBS index has remained fairly stable for the past twelve years but it was encouraging to see an increase of over 20% compared to the previous year. Oystercatcher, Ringed Plover and Dunlin neared their record lows of 2013/14.
The Redshank index continues to show signs of stabilising at around 20% lower than in the 1985–2004 period. Grey Plover (see page 33) continued its decline since its mid-1990s zenith, with the index 43% of its peak and back at levels last seen in the early 1980s.
However, the Avocet index reached a new high.
DIVERSWeBS indices for both Great Northern (see page 21) and Black-throated Divers increased compared to 2014/15, but long-term trends are up for Great Northern and stable for Black-throated. Although Red-throated Diver don’t show a pronounced long-term trend, it was notable that the 2015/16 index was the lowest for ten years.
RAILS, GREBES & HERONSGenerally indices and trends were somewhat depressed for these groups in 2015/16. Black-necked, Great Crested and Little Grebes did not sustain the increases they showed in 2014/15, with Black-necked Grebe falling back to 2009/10 levels. Moorhen, Water Rail and Coot showed a similar reduction compared to the previous year. Even Little Egret, a species with a strong upward trend, had an index value 9% lower than the 2014/15 figure.
GULLS Compared to recent years and declining long-term trends, WeBS indices for Great Black-backed, Lesser Black-backed, Herring and Black-headed Gulls all showed marked increases.
A concise summary of how the UK’s most familiar waterbirds fared in 2015/16
WeBS trend for Coot in UK. Green dots = annual index; blue line = smoothed trend.
WeB
SIn
dex
080/81 85/86 90/91 95/96 10/11 15/16
150
Population Trends
100
50
00/01 05/06 15/16

11
Goosander up 11% since 2004/05.
SARA
H H
ARRI
S
Table 1 Population trends of non-breeding waterbirds in the UK
For all trend graphs see the online report...
www.bto.org/webs-reporting
n/aMuteSwan 33 -10
Bewick'sSwan -95 -74
WhooperSwan 21 17
Pink-footedGoose 120 51
EuropeanWhite-frontedGoose -69 -32
GreenlandWhite-frontedGoose -31 -35
IcelandicGreylagGoose -10 9
n/aBritishGreylagGoose 345 58
n/aCanadaGoose 55 12
GreenlandBarnacleGoose 175 57
SvalbardBarnacleGoose 221 48
Dark-belliedBrentGoose 17 42
CanadianLight-b.BrentGoose 81 65
SvalbardLight-b.BrentGoose 47 -10
Shelduck -32 -27
Wigeon 26 -18
Gadwall 149 15
Teal 41 5
Mallard -41 -17
Pintail -38 -46
Shoveler 70 7
Pochard -67 -42
TuftedDuck 6 7
Scaup -22 -51
Species/population 25-year trend 10-year trend (1989/90 – (2004/05 2014/15) –2014/15)
Species/population 25-year trend 10-year trend (1989/90 (2004/05 –2014/15) –2014/15)
n/aEider* -17 -7
Goldeneye -53 -31
Red-breastedMerganser -20 -20
Goosander 6 11
n/aRuddyDuck -100 -100
LittleGrebe 98 6
GreatCrestedGrebe 6 -21
Cormorant 50 3
Coot 1 -16
Oystercatcher -26 -15
Avocet 718 41
RingedPlover -59 -37
GoldenPlover 76 -30
GreyPlover -30 -19
Lapwing -3 -32
Knot -16 -16
Sanderling 29 10
PurpleSandpiper -59 -9
Dunlin -40 -19
Black-tailedGodwit 300 33
Bar-tailedGodwit -11 2
Curlew -15 -13
Redshank -20 -18
Turnstone -47 -24
Trends are % changes, for the most abundant waterbirds.
The longer term smoothed trend refers to the 25 year period 1989/90 to 2014/15. The shorter term smoothed trend refers to the 10 year period 2004/05 to 2014/15. It is customary to calculate trends to an end-point of year (n-1) (where n = 2015/16).
Preceding each species is an indication of flyway population trend, based on: Nagy, S., Flink, S. & Langendoen, T. 2015. Sixth AEWA Report on the Conservation Status of Migratory Waterbirds in the Agreement Area. Wetlands Int., NL. increasing, decreasing, stable, n/a not applicable as population is non-native (Canada Goose, Ruddy Duck) or non-migratory (Mute Swan, British Greylag Goose and Eider*)
*Eider trends exclude birds on Shetland (of faeroeensis race).
Trends use WeBS data except for Pink-footed Goose, Greenland White-fronted Goose, Icelandic Greylag Goose, Greenland Barnacle Goose, Svalbard Barnacle Goose and Canadian Light-bellied Brent Goose, for which dedicated censuses are undertaken (see page 5).
Population Trends

12
Largest waterbird aggregationsMillions of waterbirds are dependent on the UK’s wetlands each winter
This section of Waterbirds in the UK summarises the sites that support the largest aggregations of waterbirds each year. Understanding precisely how many individual birds use a site is clearly very difficult to ascertain from counts alone, as many sites are used by migrants on passage and consequently there can be high turnover rates. See page 33 on Grey Plover on the Swale Estuary for an example of how collecting other data can give contextual information on turnover rates at a site. Current research uses colour-ringing and remote tracking technologies in order to improve knowledge of turnover rates.
Table 2 lists the Principal Sites for non-breeding waterbirds in the UK as monitored by WeBS. The totals are the summed counted maxima for each species during the course of the WeBS year (missing counts are not imputed). Sites with a five-year average of 20,000+ waterbirds are listed. Non-native species (e.g. Canada Goose and Ruddy Duck) have been excluded from the totals. Although an important component of a site’s waterbird fauna, gulls and terns are also excluded, since the recording of them during WeBS Counts is optional and thus they are inconsistently included in totals.
A total of 54 WeBS sites in 2015/16, one more than in 2014/15, had a five-year average of over 20,000 waterbirds. Typically, there are few changes between years to the top sites listed in the Principal Sites table, and the order of the most important sites tends to remain largely unchanged between years.
SITE FOCUSThe Wash remains the premier site for wintering waterbirds in the UK. The high counts of 103,761 and 107,806 from the Ouse Washes and Alt Estuary, respectively, in 2010/11 now fall outside of the latest five-year period, resulting in a lower ranking of these sites in the Principal Sites table.
Outside of the top ten sites, totals for the Swale Estuary returned to above 50,000. This was largely due to large numbers of Wigeon and Lapwing in the Elmley marshes sector of the site, which was not covered in 2013/14 or 2014/15.
As an increasing species which tends to occur in large groups, Pink-footed Goose can have a big influence on the principal sites table. Fewer Pink-footed Geese at Loch of Strathbeg
sees a reduction of 29,000 birds in 2015/16 compared to 2014/15 and likewise 17,000 fewer birds at Loch of Skene. However, record counts at West Water Reservoir saw the total there increase from around 20–30,000 a year to over 80,000, meaning it climbed 18 places up the table.
Notably low totals at Pegwell Bay may be due to a reduction in supplementary counts being made at that site since 2014/15.
Largest waterbird aggregations in the UK. Sites are those listed in Table 2, with top 15 sites labelled on the map.
30,000 – 50,000
50,000 – 75,000
75,000 – 100,000
>100,000
Principal Sites
20,000 – 30,000
1
23
4
56
7
8
9
10
11
12
13
14
15
1) The Wash2) Ribble Estuary3) Morecambe Bay4) Thames Estuary5) Dee Estuary6) North Norfolk Coast7) Solway Estuary8) Humber Estuary9) Somerset Levels 10) Breydon Water & Berney Marshes 11) Mersey Estuary12) Montrose Basin13) Severn Estuary14) Ouse Washes15) Blackwater Estuary
13
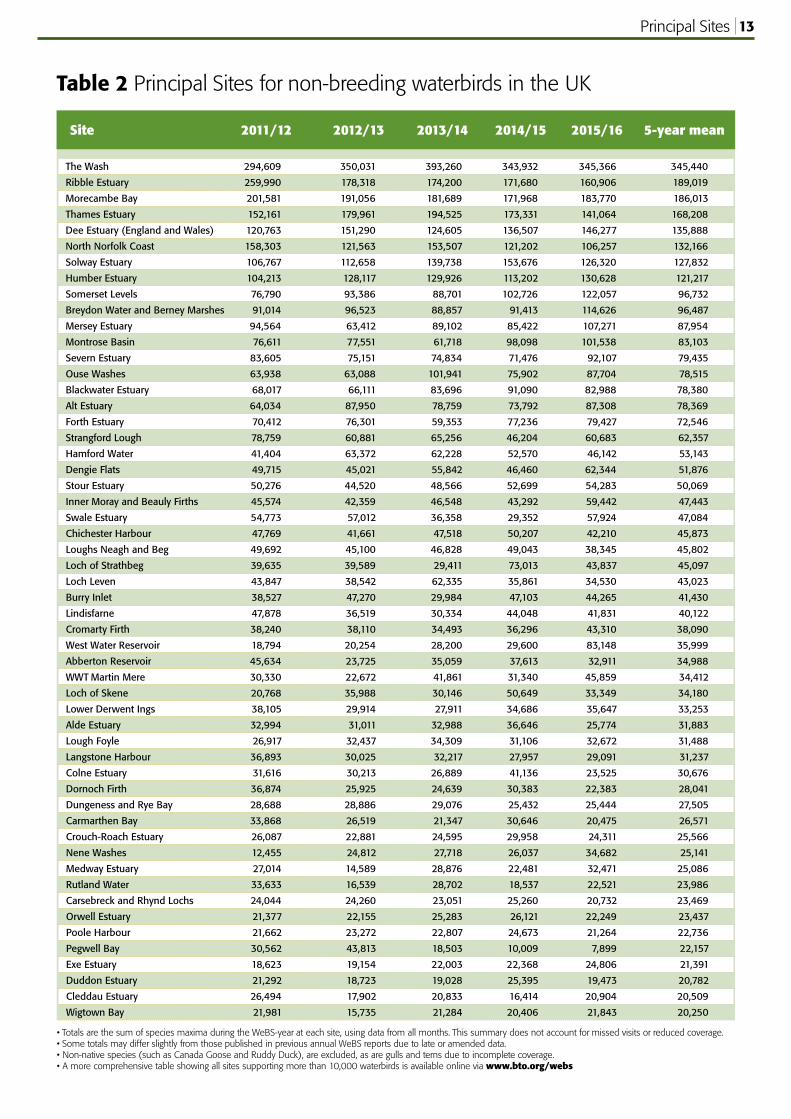
Table 2 Principal Sites for non-breeding waterbirds in the UK
• Totals are the sum of species maxima during the WeBS-year at each site, using data from all months. This summary does not account for missed visits or reduced coverage.• Some totals may differ slightly from those published in previous annual WeBS reports due to late or amended data. • Non-native species (such as Canada Goose and Ruddy Duck), are excluded, as are gulls and terns due to incomplete coverage.• A more comprehensive table showing all sites supporting more than 10,000 waterbirds is available online viawww.bto.org/webs
TheWash 294,609 350,031 393,260 343,932 345,366 345,440
RibbleEstuary 259,990 178,318 174,200 171,680 160,906 189,019
MorecambeBay 201,581 191,056 181,689 171,968 183,770 186,013
ThamesEstuary 152,161 179,961 194,525 173,331 141,064 168,208
DeeEstuary(EnglandandWales) 120,763 151,290 124,605 136,507 146,277 135,888
NorthNorfolkCoast 158,303 121,563 153,507 121,202 106,257 132,166
SolwayEstuary 106,767 112,658 139,738 153,676 126,320 127,832
HumberEstuary 104,213 128,117 129,926 113,202 130,628 121,217
SomersetLevels 76,790 93,386 88,701 102,726 122,057 96,732
BreydonWaterandBerneyMarshes 91,014 96,523 88,857 91,413 114,626 96,487
MerseyEstuary 94,564 63,412 89,102 85,422 107,271 87,954
MontroseBasin 76,611 77,551 61,718 98,098 101,538 83,103
SevernEstuary 83,605 75,151 74,834 71,476 92,107 79,435
OuseWashes 63,938 63,088 101,941 75,902 87,704 78,515
BlackwaterEstuary 68,017 66,111 83,696 91,090 82,988 78,380
AltEstuary 64,034 87,950 78,759 73,792 87,308 78,369
ForthEstuary 70,412 76,301 59,353 77,236 79,427 72,546
StrangfordLough 78,759 60,881 65,256 46,204 60,683 62,357
HamfordWater 41,404 63,372 62,228 52,570 46,142 53,143
DengieFlats 49,715 45,021 55,842 46,460 62,344 51,876
StourEstuary 50,276 44,520 48,566 52,699 54,283 50,069
InnerMorayandBeaulyFirths 45,574 42,359 46,548 43,292 59,442 47,443
SwaleEstuary 54,773 57,012 36,358 29,352 57,924 47,084
ChichesterHarbour 47,769 41,661 47,518 50,207 42,210 45,873
LoughsNeaghandBeg 49,692 45,100 46,828 49,043 38,345 45,802
LochofStrathbeg 39,635 39,589 29,411 73,013 43,837 45,097
LochLeven 43,847 38,542 62,335 35,861 34,530 43,023
BurryInlet 38,527 47,270 29,984 47,103 44,265 41,430
Lindisfarne 47,878 36,519 30,334 44,048 41,831 40,122
CromartyFirth 38,240 38,110 34,493 36,296 43,310 38,090
WestWaterReservoir 18,794 20,254 28,200 29,600 83,148 35,999
AbbertonReservoir 45,634 23,725 35,059 37,613 32,911 34,988
WWTMartinMere 30,330 22,672 41,861 31,340 45,859 34,412
LochofSkene 20,768 35,988 30,146 50,649 33,349 34,180
LowerDerwentIngs 38,105 29,914 27,911 34,686 35,647 33,253
AldeEstuary 32,994 31,011 32,988 36,646 25,774 31,883
LoughFoyle 26,917 32,437 34,309 31,106 32,672 31,488
LangstoneHarbour 36,893 30,025 32,217 27,957 29,091 31,237
ColneEstuary 31,616 30,213 26,889 41,136 23,525 30,676
DornochFirth 36,874 25,925 24,639 30,383 22,383 28,041
DungenessandRyeBay 28,688 28,886 29,076 25,432 25,444 27,505
CarmarthenBay 33,868 26,519 21,347 30,646 20,475 26,571
Crouch-RoachEstuary 26,087 22,881 24,595 29,958 24,311 25,566
NeneWashes 12,455 24,812 27,718 26,037 34,682 25,141
MedwayEstuary 27,014 14,589 28,876 22,481 32,471 25,086
RutlandWater 33,633 16,539 28,702 18,537 22,521 23,986
CarsebreckandRhyndLochs 24,044 24,260 23,051 25,260 20,732 23,469
OrwellEstuary 21,377 22,155 25,283 26,121 22,249 23,437
PooleHarbour 21,662 23,272 22,807 24,673 21,264 22,736
PegwellBay 30,562 43,813 18,503 10,009 7,899 22,157
ExeEstuary 18,623 19,154 22,003 22,368 24,806 21,391
DuddonEstuary 21,292 18,723 19,028 25,395 19,473 20,782
CleddauEstuary 26,494 17,902 20,833 16,414 20,904 20,509
WigtownBay 21,981 15,735 21,284 20,406 21,843 20,250
2011/12 2012/13 2013/14 2014/15 2015/16 5-yearmeanSite
Principal Sites

14 NEWS III
for Sanderling increased compared to NEWS II. More detailed analysis is planned to look at change between the surveys by pairwise sector comparison.
The NEWS Report Online has maps for each region for every waterbird species: from the most widespread and numerous species Oystercatcher and Herring Gull; to single sightings of Surf Scoter (Conwy), Black Scoter (Northumberland), Avocet (Sutherland), Spotted Redshank (Anglesey) and Hudsonian Whimbrel (Cornwall). Information is also available online for the three previous non-estuarine surveys.
the open coast during the winter of 2015/16. These estimates can be viewed on the NEWS Report Online. The regional estimates in turn are used to derive separate estimates for the UK (Table 3) and each of its four constituent countries (Austin et al. 2017).
Compared to NEWS II estimates for 2006/07, the estimates for wader non-estuarine specialists Ringed Plover, Purple Sandpiper and Turnstone on the open coast decreased, although only in the case of Turnstone did the 95% confidence intervals for the two surveys not overlap. The estimate
During December, January and February of winter 2015/16, the BTO ran the fourth in a series of intermittent surveys of the UK's non-estuarine coast (NEWS III). As with NEWS I and NEWS II, the survey was a joint survey with I-WeBS covering the coast of Britain and Ireland. The Channel Islands and Isle of Man were also surveyed.
A main objective of NEWS is to provide evidence of the numbers of birds using the non-estuarine coast. A bootstrap approach was used to derive regional estimates for the numbers of key coastal waterbird species to be found on
Non-Estuarine Waterbird SurveyA summary of the results of the 2015/16 NEWS III survey
Open coast with high density and diversity of key waders species (left; includes Oystercatcher, Ringed Plover, Golden Plover, Grey Plover, Lapwing, Knot, Sanderling, Purple Sandpiper, Dunlin, Bar-tailed Godwit, Curlew, Redshank, and Turnstone) and sea ducks, divers and grebes (right; includes Eider, Long-tailed Duck, Common Scoter, Velvet Scoter, Goldeneye, Red-breasted Merganser, Red-throated Diver, Great Northern Diver and Great Crested Grebe).
Density
High Medium
7 or more species
Density
High Medium
4 or more species

15NEWS III
Table 3 UK population estimates for key species of waterbird and seabird on the open coast (excludes estuarine and offshore)
GreylagGoose 5,332 14,078 10,110–17,900
BrentGoose(Dark-bellied) 1,829 2,011 1,119–3,842
BrentGoose(Light-bellied) 1,040 1,534 820–2,920
Shelduck 1,342 2,042 1,338–2,916
Wigeon 22,619 44,600 36,714–53,228
Teal 5,596 10,329 7,990–13,177
Mallard 6,898 15,098 12,762–16,809
Eider 11,736 23,946 17,604–37,183
Long-tailedDuck 2,994 4,834 3,334–7,085
CommonScoter 10,111 10,543 4,500–22,111
Goldeneye 867 2,136 1,336–3,309
Red-breastedMerganser 2,723 7,424 6,553–8,323
Red-throatedDiver 2,134 2,765 1,504–5,908
GreatNorthernDiver 1,727 4,398 3,728–5,234
GreatCrestedGrebe 5,715 5,751 900–12,697
Fulmar 29,772 66,309 48,202–90,750
Gannet 3,166 9,994 1,200–44,698
Cormorant 9,638 15,792 11,863–21,288
Shag 13,608 34,217 28,348–42,394
GreyHeron 2,172 5,365 4,834–5,932
Oystercatcher 44,116 69,905 64,204–75,545
RingedPlover 8,240 16,203 13,245–18,541
GoldenPlover 10,978 18,513 11,238–30,825
GreyPlover 855 1,012 675–1,481
Lapwing 10,613 17,490 14,148–22,178
Knot 2,332 2,683 1,213–4,484
Sanderling 8,903 12,903 10,248–17,268
PurpleSandpiper 5,603 10,184 7,780–13,945
Dunlin 13,336 19,415 12,737–26,634
Snipe 1,807 4,848 4,097–5,769
Bar-tailedGodwit 3,325 6,217 4,314–9,501
Curlew 24,735 44,344 38,324–50,613
Redshank 11,267 18,513 17,122–19,758
Turnstone 14,215 25,988 23,552–29,324
Kittiwake 2,699 4,029 2,141–7,447
Black-headedGull 50,572 64,198 53,243–80,086
CommonGull 31,871 54,239 45,544–61,989
LesserBlack-backedGull 1,676 2,470 1,944–2,928
HerringGull107,900 159,782 144,377–172,784
GreatBlack-backedGull 11,064 20,333 18,335–22,552
Guillemot 15,576 42,481 8,241–111,665
Razorbill 1,415 2,396 1,597–3,632
BlackGuillemot 1,012 3,551 2,830–4,082
NEWSheadcountSpecies
FIND OUT MORE...
Austin, G.E., Frost, T.M., Mellan, H.J. & Balmer, D.E. 2017. Results of the third Non-Estuarine Waterbird Survey, including populationestimates for key waterbird species. Research Report 697. BTO, Thetford.
NEWS tab on the WeBS Online Report at www.bto.org/webs-reporting-news
OpencoastestimateOpencoast95%
confidenceinterval

16
Coastal HabitatsA look at the habitat information recorded during NEWS III and three species that use these habitats
The importance of the non-estuarine coastline of the UK has been the subject of a previous habitat focus review, in Waterbirds in the UK 2013/14. Here we report some of the main habitat findings from NEWS III (see page 14), where surveyors were asked to record habitats as well as birds and mammals, and we look at three species that make extensive use of these habitats.
Most NEWS surveyed sectors were categorised as open coast. A small number were estuarine in nature and the rest were categorised as bay or exposed or sheltered sea loch. Such habitats are particularly important for species such as Great Northern Diver (page 21).
Looking landward, grassland habitats, including maritime grassland and pastoral farmland, dominated, with over 56% of sectors recording these. 12% of sectors were industrial, suburban or urban in character. Adaptable species such as Black-headed Gull (page 20) can make use of all these coastal adjacent habitats.
The primary intertidal habitat was recorded as being bedrock on just under half of sectors. Sand was the primary substrate on 23% of sectors. Most eastern England sectors were sandy or pebbly, whereas bedrock predominates in the north and west.
Areas which were reported as having
large amounts of tidal wrack deposits include the east of Northern Ireland around the Ards peninsula, Anglesey in Wales, and the Solent, the Yorkshire coast around Flamborough Head, and the north Northumberland coast in England. In Scotland coastlines reported as having high wrack densities include those of Fife, Orkney, Shetland and much of west Scotland.
Initial mapping of the highest densities of wrack deposits (page 17) and waders (page 14) suggests a possible correlation. Observers were also asked to record which species were using the strandline on their NEWS sector. Work is planned to explore the importance of the tidal wrack resource further.
NEWS Habitat Focus... Non-estuarine Coast
Boulders/Pebbles/Gravel
Some of the coastal habitats recorded by NEWS: Primary intertidal habitat (left) and seaward bays and lochs (right).
MudSand
Rock Slabs/Bedrock
Sheltered/narrow sea lochExposed/open sea lochBay

17JO
HN
HAR
DIN
G
Curlew are one of many species that forage among carpets of wrack.
NEWS Habitat Focus... Non-estuarine Coast
Areas with high density of wrack deposits, as recorded during NEWS III in the UK and the Republic of Ireland.

18
RINGED PLOVER Ringed Plover hit the headlines last year when it was added to the Birds of Conservation Concern (BoCC) Red List due to non-breeding declines. The Wetland Bird Survey makes an important contribution to the species assessment for the BoCC every five years. WeBS information revealed a declining winter trend of -59% over 25 years 1988/89–2013/14, and a 10-year trend (2003/04–2013/14) of -38%. Based on the WeBS data, Ringed Plover is on ‘High Alert’ for Northern Ireland and Wales, ‘Medium Alert’ for England, whilst in Scotland, long-term trends have remained stable (Cook et al. 2013). The WeBS Alert process was last carried out in 2013, and identified significant long-term declines on a number of Special Protection Areas (SPAs): Chichester and Langstone Harbours SPA, Humber Estuary SPA, Lindisfarne SPA, Medway Estuary and Marshes SPA, Outer Ards SPA, Solent and Southampton Water SPA and the Stour and Orwell Estuaries SPA. It is now timely to repeat the Alerts work given the continued decline of the
winter Ringed Plover population.Although WeBS covers Ringed Plover reasonably well, a significant proportion of their winter population is found on rocky shores.
During 2015/16, the Non-Estuarine Waterbird Survey (NEWS III) focused survey effort on this important and under-recorded habitat. The population on the open coast has been estimated at 16,203, compared
to 18,575 in the last NEWS survey of 2006/07 (Austin et al. 2017).
The published estimate of UK winter population size (all habitats) suggests 34,000 birds, based on counts from 2004/05–2008/09 (Musgrove et al. 2011). In terms of winter range, fieldwork for Bird Atlas 2007–11 showed +2% change in the number of occupied 10 km squares in Britain since the 1981–84 Winter Atlas,
DAV
E KI
NG
NEWS Habitat Focus... Intertidal
The distribution and relative abundance of Ringed Plovers recorded by NEWS III(light blue) and WeBS (dark blue).
Migration routes of Ringed Plover through Britain and Ireland (from A Time to Fly by Jim Flegg 2004). Blue dots = long-distance recoveries of British and Irish birds.
101–22076–10051–7541–5031–4021–3011–206–101–5

19NEWS Habitat Focus... Intertidal
and -2% change in range in Ireland (Balmer et al. 2013).
Britain and Ireland plays a pivotal role for a significant proportion of the East Atlantic flyway populations; either as a wintering area or stopover site. During migration there is a noticeable passage of Ringed Plover of the race tundrae; these birds breed in northern Fennoscandia and Russia and winter in eastern and southern Africa. These tundrae birds appear smaller and have darker brown upperparts. In addition, birds that breed in Canada, Greenland and Iceland pass through Britain and Ireland, mainly on the coast, to wintering areas in Spain and West Africa. So whilst our breeding birds, of the race hiaticula, are settling
down to breed, we also see significant spring passage of birds that will breed further north.
As a breeding bird, Ringed Plover falls within the ‘monitoring gap’. It is too common to be monitored by the Rare Breeding Birds Panel, but not common enough to be monitored by the Breeding Bird Survey. The breeding distribution is mainly coastal, with significant gaps only in southwest England, Yorkshire, and southwest Wales. Bird Atlas 2007–11 showed a 7% decline in range in Britain since the 1988–91 Breeding Atlas, and a 2% decline in Ireland. Inland breeding occurs in a range of mainly wetland habitats including along rivers, by lochsides and
FIND OUT MORE...
Austin, G.E., Frost, T.M., Mellan, H.J. & Balmer, D.E. 2017. Results of the third Non-Estuarine Waterbird Survey, including population estimates for key waterbird species. Research Report 697. BTO, Thetford.
Balmer, D.E., Gillings, S., Caffrey, B.J., Swann, R.L., Downie, I.S. & Fuller, R.J. (eds). 2013. Bird Atlas 2007–11: the breeding and wintering birds of Britain and Ireland. BTO Books, Thetford.
Conway, G.J., Burton, N.H.K., Handschuh, M. & Austin, G.E. 2008. UK population estimates from the 2007 Breeding Little Ringed Plover and Ringed Plover surveys. Research Report 510. BTO, Thetford.
Cook, A.S.C.P., Barimore, C., Holt, C.A., Read, W.J. & Austin, G.E. 2013. Wetland Bird Survey Alerts 2009/2010: Changes in numbers of wintering waterbirds in the Constituent Countries of the United Kingdom, Special Protection Areas (SPAs) and Sites of Special Scientific Interest (SSSIs). Research Report 641. BTO, Thetford. www.bto.org/webs-alerts
Musgrove, A.J., Austin, G.E., Hearn, R.D., Holt, C.A., Stroud, D.A., & Wotton, S.R. 2011. Overwinter population estimates of British waterbirds. British Birds 104(7): 364–397.
gravel pits. Gains since the 1988–1991 Breeding Atlas have mostly been inland at such wetlands, whereas the Breckland population has continued to decline, despite little apparent loss of habitat. Highest breeding abundance was recorded on Orkney, Shetland and the Outer Hebrides. The breeding population has been monitored through periodic surveys run by BTO; the last survey in 2007 showed that the British breeding population had declined by c.37% during 1984–2007 and estimated 5,400 pairs in the UK (Conway et al. 2008). Disturbance at coastal sites can be a particular issue for breeding Ringed Plover; other issues such as predation are not fully understood.
WeB
SIn
dex
WeB
SIn
dex
100
0
200
300
Jul Aug Sep Oct Nov Dec Jan Feb Mar Apr May Jun
50
0
100
150
70/71 75/76 80/81 85/86 90/91 95/96 00/01 05/06 10/11 15/16
Monthly indices for Ringed Plover in the UK showing the spring and autumn passage peaks. Green bars = 2015/16; blue line/hatched area = previous 5-year mean/range.
WeBS trend for Ringed Plover in the UK. Green dots = annual index; blue line = smoothed trend.

20
BLACK-HEADED GULLGulls; you either love them or loathe them. We encourage all our WeBS counters to count the gulls on their site, but if you’re faced with thousands it’s easy to understand why they might not be your favourite group of birds.
The largest aggregations of Black-headed Gull are recorded at Lower Derwent Ings in Yorkshire (60,000), Bewl Water on Kent/Sussex border (33,600), Abberton Reservoir in Essex (18,855), The Wash (12,988) and the Severn Estuary (12,372). The counts for WeBS are usually made as part of the Core Counts or Low Tide Count, rather than a specific visit to record gulls coming into roost in the evening. However, the monthly counts, by the same counters, provide enough information for a 10-year trend to be calculated; an 8% decline in population between 2004/05–2014/15.
Wintering gulls generally forage away from wetlands during the day and are not adequately covered by WeBS. More targeted surveys, based on counts at roosts exist but are infrequent. The most recent Winter Gull Roost Survey (WinGS) was carried out in 2003/04–2005/06 (Burton et al. 2013) and is the most comprehensive survey of winter gulls to date; with counts undertaken at know key roost sites and sample counts away from key sites. Previous surveys in 1953, 1963, 1973, 1983 and 1993 had just focused on known roost sites.
The UK population estimate derived from the 2003/04–2005/06 survey was 2,200,000 (2,100,000–2,300,000). Analyses of the decadal roost counts indicate that, although numbers have increased significantly since 1953, they reached a peak during 1973–93, and have since declined (Banks et al. 2009). Given the recent decline in numbers
noted by WeBS, more robust annual monitoring, particularly at key sites, augmented by more comprehensive counts at roosts every few years, is needed.
Information on the winter distribution of Black-headed Gull comes from Bird Atlas 2007–11 (Balmer et al. 2013). The change in winter distribution between 1981–84 and 2007–11 is shown below; there was a 4% loss of range in Britain and a 19% loss of range in Ireland.
The colour-ringing of Black-headed Gulls has provided a tremendous insight into the movements of birds within Britain and Ireland, and abroad. There are 8,465 records of birds ringed in Britain and Ireland and found abroad, most commonly in Denmark, Finland, Germany, Sweden and The Netherlands.
NEWS Habitat Focus... Landward
FIND OUT MORE...
Balmer, D.E., Gillings, S., Caffrey, B.J., Swann, R.L., Downie, I.S. & Fuller, R.J. (eds). 2013. Bird Atlas 2007–11: the breeding and wintering birds of Britain and Ireland. BTO Books, Thetford.
Burton, N.H.K., Banks, A.N., Calladine, J.R., and Austin, G.E. 2013. The importance of the United Kingdom for wintering gulls: population estimates and conservation requirements. Bird Study, 60(1), 87–101.
Banks, A.N., Burton, N.H.K., Calladine, J.R. & Austin, G.E. 2009. Indexing winter gull numbers in Great Britain using data from the 1953 to 2004 Winter Gull Roost Surveys. Bird Study: 56: 103–19.
Winter distribution change between 1981–84 and 2007–11.
Gain Present both
Loss
Gain
Present both
Loss
WeB
SIn
dex
0
50
90/91 95/96 00/01 05/06 10/11 15/16
WeBS trend for Black-headed Gull in UK. Green dots = annual index; blue line = smoothed trend.
100
150

21NEWS Habitat Focus... Seaward
GREAT NORTHERN DIVEROf the three diver species most commonly found in the UK, the Great Northern Diver is the largest and is primarily a winter visitor to the coasts of the north and west. It is assumed wintering birds come from the nearest breeding populations of Iceland and Greenland and possibly as far as Canada, but there have been very few birds ringed in Europe and no foreign recoveries of birds ringed in the UK to confirm this.
Most of the world’s Great Northern Divers breed and winter in North America, where it is known as the Common Loon. Studies there suggest they prefer shallow waters less than 35m deep (in some areas less than 20m deep) with high chlorophyll concentrations (Winiarski et al. 2013), and that individuals have high site fidelity to the same coastal wintering locations (Paruk et al. 2015).
NEWS and WeBS counts for 2015/16 show Great Northern Diver to be most frequent on the sheltered lochs of the west coast of Scotland, Orkney and Shetland and Northern Ireland. The species is also recorded in numbers in sheltered bays in southwest England and Wales, but can occur anywhere around the coast, as well as at larger inland lakes and reservoirs.
In Britain, communal night roost rafting during winter has been reported from Shetland, Skye and Mull. For sites where this occurs, counting birds at a roost when conditions are good is an effective monitoring method, and results in higher totals than day counts (Shackleton 2012). Both the WeBS index and NEWS population estimates reached their highest recorded levels in 2015/16, an increase on 1997/98 values for both of around 140%; however there was a difference in between with the
2006/07 NEWS estimate lower than would have been expected from the WeBS trend. The 2015/16 NEWS estimate for the non-estuarine coast was between 3,728 and 5,234 birds.
It is possible that the 2015/16 winter’s storms encouraged birds closer inshore, increasing the proportion picked up by coastal counts, although poor conditions can also sometimes hamper counting. Continued regular coverage of remote coastal WeBS sites, periodic NEWS surveys, together with supplementary counts such as of night roost rafts, will greatly assist with increasing our knowledge of the status of Great Northern Diver in the UK.
FIND OUT MORE...
Paruk, J.D. et al. (10 co-authors). 2015. Winter site fidelity and winter movements in Common Loons (Gavia immer) across North America. The Condor: 117: 485–493.
Shackleton, D. 2012. Night rafting behaviour in Great Northern Divers (Gavia immer) and its potential use in monitoring wintering numbers. Seabird: 25: 39–46.
Winiarski, K.J., Miller, D.L, Patton, P.W.C. & McWilliams, S.R. 2013. Spatially explicit model of wintering Common Loons: Conservation implications. Marine Ecology: Progress Series 492: 273–283.
WeB
SIn
dex
20
0
40
90/91 95/96 00/01 05/06 10/11 15/16
WeBS trend for Great Northern Diver in UK. Green dots = annual index; blue line = smoothed trend.
60
80
100
Peak counts of Great Northern Diver recorded during NEWS III (light blue dots) and WeBS (dark blue dots).
26–5016–2511–159–105–84321

22
The state of the UK
Special Protection Area networkDavid Stroud (JNCC) details the findings of a review of the SPA network in the UK
protected sites. Across the network as a whole, the Review found that 85% of all site-species records were collected by volunteers - an extraordinary public input to national conservation.
The network is of central importance for UK waterbird conservation. The
A third national review of the UK’s network of 270 Special Protection Areas (SPA) - internationally important sites protected under the EU Birds Directive - was submitted by JNCC, on behalf of the country agencies, to Ministers in October 2016. This followed reviews published in 1990 and 2001. All three can be found at http://jncc.defra.gov.uk/page-7307.
The network includes the most important sites for waterbirds in the UK and literally extends across the length and breadth of the UK: from Hermaness in the extreme north of Shetland, to the Isles of Scilly in the south, and from Pettigoe Plateau in the extreme west, to Great Yarmouth North Denes in the east.
WeBS data formed a major part of this assessment. Indeed, of the 1,516 ‘interest features’ (all bird species at all the SPAs that have been classified for them), data for 814 (54%) was provided by WeBS, with another 59 (4%) from the Goose & Swan Monitoring Programme. This reflects the extreme importance of the UK for non-breeding waterbirds, both those visiting us from arctic breeding areas, and those staging en route to winter on African wetlands such as in Sierra Leone (see page 24). This importance is reflected in the comprehensive and proportionately significant protection provided by the SPA network.
WeBS provides all the SPA data for 50 species of waterbird. This highlights the enormous importance of the scheme to government; without these counts we would have little knowledge of the changing status of waterbirds on these statutorily
Review documented that, following development of the network since 2001, overall nearly 2,500,000 non-breeding waterbirds occur within SPAs: 37% of the total occurring in the UK (Table 4). However, coverage varies by taxa. A higher proportion (67%) of the highly aggregating geese
The extent of the UK's SPA network as at 31st March 2016.
SPA Review

23
and swans occur in SPAs than do more dispersed duck species (26%). These are minimum numbers and only include birds on those sites that have been legally classified for the species concerned. A much greater number will occur as non-qualifying species – occurring on sites protected for other waterbirds. A current WeBS project is attempting to estimate this ‘grand total’.
The Review compared the state of the network in the 2000s with the 1990s (as reported in 2001). Whilst a degree of change had been anticipated, not least due to known ‘short-stopping’ effects as reported in previous WeBS Reports for species such as European White-fronted Goose, Icelandic Greylag Goose and Bewick’s Swan, the overall extent of change was surprising and significant. Full details and the advice provided to government can be found in the published Review, but some of the issues include the need to:
• ensure that boundaries of WeBS count areas match SPAs to ensure that data can be appropriately used for such monitoring;• ensure that all parts of relevant SPAs are covered by WeBS to ensure that assessments are complete for the sites concerned;• review/consider further SPA provision as a positive conservation measure for species such as Cormorant, Icelandic Greylag Geese, Greenland White-fronted Goose, Red-breasted Merganser, Goosander, in response to declines in numbers and/or contractions of range;• provide at least some SPAs for Annex I listed species such as Little Egret, Smew, Spoonbill, Crane and Mediterranean Gull, as a result of changes in legal understanding; and• review boundaries of already classified SPAs to ensure that
areas used for feeding or other functional needs are included (for several goose species, Golden Plover, Lapwing and Curlew).
Overall, however, the Review found that current SPA provision was sufficient for most non-breeding waterbirds, with no other factors suggesting the need to revise previously identified SPAs for the species.
The Review concluded as follows:“It is important to acknowledge that this SPA network assessment would simply not have been possible without the massive voluntary efforts of many tens of thousands of volunteers who have given their time (and resources) to participate in systematic surveys and monitoring of UK birds since the 1960s. We acknowledge their huge input and interest, without which knowledge of the UK’s changing bird populations would be immeasurably poorer.”
Table 4 Total SPA network provision in the UK in the 1990s and 2000s
Non-breedingwaterbirds(individuals),including 2,279,545 2,487,993 6,639,846 37%
Divers,grebesandseaducks 7,048144,706 158,100 92%
Geeseandswans 392,539 470,703 699,804 67%
Ducks 499,726 470,108 1,820,180 26%
Waders 1,363,541 1,381,751 3,725,590 37%
Breedingwaterbirds(pairs),including 453,957 41,668 327,153 13%
Waders 22,40028,171 281,397 10%
Total in SPA suites in
1990s
Total in SPA suites in
2000s
Total of relevant UK populations
in 2000s
% of population in SPA suites in
2000s
EDM
UN
D F
ELLO
WES
SPA Review
FIND OUT MORE...
Stroud, D.A., Bainbridge, I.P., Maddock, A., Anthony, S., Baker, H., Buxton, N., Chambers, D., Enlander, I., Hearn, R.D., Jennings, K.R, Mavor, R., Whitehead, S. & Wilson, J.D. - on behalf of the UK SPA & Ramsar Scientific Working Group (eds.) 2016. The status of UK SPAs in the 2000s: the third network review. JNCC, Peterborough. http://jncc.defra.gov.uk/page-7309

24
Monitoring waterbirds in the mudflats,
mangroves and rice fields of Sierra LeonePapanie Bai-Sesay (Conservation Society of Sierra Leone) introduces the waterbird monitoring scheme in Sierra Leone, which has been supported by WeBS in recent years
status and condition of wetlands;3. to encourage greater interest in waterbirds and wetlands amongst people, and thereby promote the conservation of wetlands and waterbirds in the region.
Waterbirds counted during the census include all types of waterbirds regularly encountered at wetlands, including cormorants, pelicans, herons, egrets, storks, ibises, spoonbills, flamingos, and terns. In addition, raptors, kingfishers and other wetland-dependent birds were also recorded. Count data are entered onto standardised count forms.
Yawri Bay is by far the most important wetland for coastal waterbirds. The vast mudflat areas hold very high numbers of waders and herons. It is the only area with substantial numbers
Every year in January, the Conservation Society of Sierra Leone (CSSL) together with other organisations (such as the Ministry of Fisheries and Marine Resources, Ministry of Agriculture Forestry and Food Security, National Association of Certified Tour Guides and Njala University) and community representatives collaborate to carry out the Sierra Leone Waterbird Census. This is part of a global waterbird monitoring programme, the International Waterbird Census (IWC), coordinated by Wetlands International. The census has three major objectives:
1. to obtain information on an annual basis of waterbird populations at wetlands in the region during the non-breeding period of most species (January);
2. as a basis for evaluation of sites and monitoring of populations, to monitor on an annual basis the
of Red Knot, Oystercatcher, Avocet, Black-tailed Godwit and Little Stint. Apart from waders, a large flock of Great White Pelicans are sometimes present and for African Spoonbill and Greater Flamingo it is the only wetland of importance in the country.
The wetlands are faced with numerous challenges which have affected birds and other marine species. The wetlands have changed due to reclamation of mangrove forests into rice fields. These fields are not intensively used and are intercepted with many creeks and small patches of mangroves. Several bird species are likely to profit from these changes.
In other areas, mangrove forests still dominate the intertidal areas with smaller or larger mudflats bordering them. Mudflats are used for collecting shellfish (e.g. cockles and oysters) all by manual methods. Fishing in the wetlands is common practice with all kinds of net types used.
In general small boats are used for transport and small creeks are used for trapping fish moving in and out. In Yawri Bay, small scale salt production is practiced. Birds (all species) and other wildlife (sea turtles, manatees, otters, and monkeys) are hunted by local villagers in an unknown intensity. Local hunters hunt adult birds as well as collecting eggs and young birds in breeding colonies for consumption.
The monitoring in Sierra Leone is part-funded by WeBS, through the Wadden See Flyway Initiative, which is developing coordinated monitoring of coastal waterbird populations along the East Atlantic Flyway.
Turtle Islands
Sherbro River
Yawri Bay
Sierra Leone River Estuary
Scarcies River
Another National Scheme
Map of the key non-breeding waterbird sites monitored in Sierra Leone.

25G
REAT
ER F
LAM
ING
O B
Y D
AWN
BAL
MER
; IN
SET:
CO
UN
TERS
IN S
IERR
A LE
ON
E BY
DAV
E PA
YNTE
R
Greater Flamingos occur at Yawri Bay in Sierra Leone.
Another National Scheme
Counting from a boat in Sierra Leone.

26
Investigating TrendsTwo recent papers have explored hypotheses about the downwards trend in Pochard and other duck species
Pochard is now a species of conservation concern, moving from the Amber to Red List in the UK and Least Concern to Vulnerable on the IUCN Red List of Threatened Species following assessments in 2015. In the UK, numbers have halved in the past twenty-five years. As a result, researchers have begun to look into which factors might be influencing the population trend, such as climate change, breeding success or lead poisoning.
Fox et al. (2016) examined a number of these other possible causes of decline in the abundance of breeding Pochard across Europe, which affects wintering numbers in the UK. Historical records show an expansion of this species’ European breeding range northwest-wards in the second half of the 19th century to countries as far as the UK, Iceland and Sweden. The reason for this is unclear, although later increases in the 20th century were linked to creation of man-made waterbodies.
However, since the late 20th century, in the European countries with
southeast Europe;• non-native predators,
particularly American Mink, are a problem in many countries, as are non-native fish such as Carp which directly compete for similar food resources in the Mediterranean region;
• a decrease in Black-headed Gull colonies, which can act as guardians for nearby nesting Pochard, may be a factor in some areas (but there could be a common factor affecting both species).
Green & Pain (2016) looked at the possible effects of ingested lead gunshot on UK wintering duck populations. It has long been known from observational and experimental studies that ducks which ingest lead shot suffer additional mortality. The African-Eurasian Migratory Waterbird Agreement (AEWA) requires Parties (including the UK) to phase out the use of lead gunshot for shooting wildfowl or over wetlands. Although such use is now forbidden in the UK, surveys have found that even after the ban had been in effect, in about 70% of ducks offered for sale in England had been shot using lead; and the proportion of wildfowl found dead that had died from lead poisoning did not change after the ban was put in place.
Examination of birds that are shot or trapped in ten European countries and those found dead in the UK have previously found that some species are more likely to have ingested lead shot than others, due to differences in their diet or foraging behaviour. Leaf-feeders like Gadwall and Wigeon tend to ingest small particles of grit, whereas seed-feeders ingest larger pieces of grit and so are more likely to ingest lead shot. The most affected species are Pochard, Pintail and Mallard, with Pochard
the largest breeding populations, numbers have been decreasing rapidly, matching declines recorded in wintering populations. These declines have been attributed to various causes across the European breeding range, from late summer hunting, to increases in nest predators. Other factors which the authors identified as likely major contributors in multiple countries included:
• changes in wetland management – intensification or abandonment of fish ponds and other lowland wetland habitats has become widespread in many countries, making these areas less suitable for Pochard;
• deterioration in water quality – whilst some degree of eutrophication can benefit Pochard, hyper-eutrophication can result in reduced food availability and excessive growth of emergent vegetation that can decrease the open water available;
• abstraction and drought, resulting in falling water tables and reducing ephemeral wetlands favoured by Pochard, especially in
Investigating Trends
WeB
SIn
dex
100
0
200
400
65/66 70/71 75/76 80/81 85/86 90/91 95/96 05/06 10/11 15/16
WeBS trend for Pochard in UK. Green dots = annual index; blue line = smoothed trend.
300
00/01

27
having the highest incidence of ingested lead shot in post-mortems of birds found dead in the UK, and Pintail the highest incidence in data from birds shot or trapped.
However, it remains unclear whether lead poisoning incidence is at a level that could have population level effects, compared with other factors. Green & Pain (2016) set out to explore correlations between the population growth rates of the common freshwater dabbling ducks (Gadwall, Shoveler, Teal, Wigeon, Mallard and Pintail) and diving ducks (Tufted Duck and Pochard) and information on the amount of lead ingested by each of those species.
In the paper, the authors compared average changes in smoothed WeBS indices with the prevalence of lead shot for the eight species and reported that the species with higher incidence of lead shot tended to have more negative population trends. They modelled their measure of
UK population changes (based on WeBS indices) together with their previously published estimates of extra mortality poisoning on ducks and found that it is theoretically possible that this could be the sole mechanism for the population trends observed. However, they emphasise that the modelling results do not demonstrate causality. Other factors could also be responsible for the decline in Pochard and some other ducks.
Migratory species may be exposed to lead ammunition differently according to their migration routes, because the prevalence of ingested lead shot varies between countries. The authors noted it is possible that lower survival of female Pochard, which tend to winter further south than males, might be related to greater exposure to lead, although it could also be due to increased hunting pressure in their wintering grounds compared with males, or other natural factors.
FIND OUT MORE...
Fox, A.D., Caizergues, A., Banik, M. V, Devos, K., Dvorak, M. & Sjenic, J. 2016. Recent changes in the abundance of Common Pochard Aythya ferina breeding in Europe. Wildfowl 66: 22–40.
Green, R.E. & Pain, D.J. 2016. Possible effects of ingested lead gunshot on populations of ducks wintering in the UK. Ibis 158, 699–710.
0 0.1 0.2 0.3 0.4-0.06
-0.04
-0.02
0
0.06
0.04
0.02
UK
pop
ulat
ion
grow
th ra
te 1
990
– 20
13
Proportion with ingested lead
Information from WeBS is vital evidence for what is happening to our duck populations and, when combined by scientists with other evidence across flyways, it helps increase our understanding of not only how our wetland communities are changing, but why. There is still more research needed to be able to fully explain why Pochard is becoming a rarer sight on monthly WeBS counts.
Investigating Trends
Mean annual growth rate of the wintering population of ducks in the UK between the 1990/91 and 2013/14 winters in relation to the proportion of hunted and trapped European ducks with ingested lead shot, adjusted for country effects. Redrawn from Green & Pain (2016).
TEAL
BY J
ILL
PAKE
NH
AM, T
UFT
ED D
UC
K BY
JOH
N H
ARD
ING
, SH
OVE
LER,
MAL
LARD
AN
D W
IGEO
N B
Y N
EIL
CAL
BRAD
E, P
OC
HAR
D A
ND
GD
WAL
L BY
DAV
E KI
NG

28
Monitoring our offshore waterbirdsColette Hall (WWT) on the need for monitoring seaduck populations in spite of the challenges
good: visibility exceeding 4 km, light sea swell and preferably overcast (to prevent glare). The site is surveyed from two to three vantage points, with the counter covering a different part of the bay from each location - using a compass and a map to work out the count sections.
During the count, groups of birds are observed for a minute or more to check for any that may be underwater or hidden behind waves, and the entire visit to each location takes one to two hours. Although Carmarthen Bay lends itself to counting Common Scoter, the method used can be adapted for other locations, with the basic procedures mentioned here being amongst the main requirements for counting marine waterbirds from land.
Carmarthen Bay is a great place to practice counting. So if you are ever passing by on a calm winter’s day, it is definitely worth stopping at Pembrey Burrows, Dolwen Point (near Pendine) or Merrifields (near Arbroth) to take a look from shore - particularly if you happen to have a scope - and see if you can locate a vast raft of scoters sitting out at sea…and maybe have a practice counting them too whilst you’re there!
A large raft of seaducks bobbing on the open sea is an impressive spectacle, but it’s something that few of us often get to see. During the winter, seaducks tend to gather in nearshore and offshore waters, and often the flocks extend too far from shore to be seen clearly, if at all, even with a powerful telescope. Needless to say, this makes counting them consistently, and thus monitoring their population status, rather challenging.
The use of aircraft and boats to survey nearshore and offshore areas has been around for many years and in the last decade or two the increased need for assessing the importance of different marine waters - whether it be for designating protected sites or for offshore renewable energy developments - has led to a large increase in offshore surveys. In turn, this has resulted in a vast improvement in our knowledge of seaduck populations, as well as wintering divers and grebes which are typically surveyed at the same time. A number of countries, such
as the Netherlands, Germany and Denmark, have established national programmes of offshore surveys, and in recent years, progress has been made towards conducting coordinated marine waterbird surveys at the international level, with a complete survey of the Baltic Sea and parts of the North Sea taking place in winter 2015/16: only two other surveys of this scale have taken place since the early 1990s (in the mid-1990s and during 2007–09). This increase in surveying has also been in response to the deteriorating status of a number of seaduck species, including Long-tailed Duck and Velvet Scoter which are now listed as globally Vulnerable on the IUCN Red List.
However, to date no coordinated surveys have taken place across the whole winter range of most of these marine waterbirds. In the UK, there is no long-term monitoring programme in place that adequately covers offshore areas and enables robust population estimates and trends to be developed. Here, the
Species Focus...Seaducks
majority of aerial or boat surveys are usually carried out either for protected site monitoring or for industry, such as windfarm developments. The development of a national monitoring programme, synchronised with efforts elsewhere in relevant flyways, is urgently needed as the UK supports internationally important concentrations of species such as Common Scoter and Red-throated Diver. Without coordinated surveys that include the UK it will remain difficult to track the population status of these species.
Unfortunately, the high costs of aerial surveys means that even if a national coordinated census is initiated, it is unlikely to be undertaken more than about once a decade. Given this, consistent counts of seaducks and other marine waterbirds from land can continue to play a useful role in our efforts to track the status of these enigmatic species and provide key information about the use of the UK’s inshore waters.
Carmarthen Bay - ideal for Common Scoter and counters alike
Carmarthen Bay is a perfect spot for wintering Common Scoter, with its shallow waters providing easy access to the bivalves they take as food. Not only that, the landscape of the bay also makes it ideal for those that want to sit and count them: the shallow waters are close to the coast and there are a number of good vantage points along the shore that provide the right elevation and aspect for covering the bay. The site regularly supports over 20,000 Common Scoter, with over 40,000 seen there in February 2010, and it is because of its importance for the species that the site became the first marine Special Protection Area to be designated in the UK.
Because of the nature of the site, researchers have be able to design a specific methodology for monitoring the scoter. The surveys require experienced counters, who will have already visited the site a number of times previously for practice counts, usually with someone who has carried out the surveys before. Conditions on the day need to be

29G
LYN
N S
ELLO
RS
Species Focus...Seaducks
Due to the well-known difficulties faced when counting birds at sea from land (i.e. birds being too far from the coast, poor weather conditions and sea state, lack of suitable vantage points for seeing further offshore), consistent counts from land are not possible everywhere, but where they are they are likely to remain hugely important to our understanding of the status of seaducks, divers and grebes for the foreseeable future.
Red-breasted Merganser is relatively well covered by WeBS. There has been a steady decline since the mid 1990s.Green dots = annual index; blue line = smoothed trend.
Key to maximising their value is to determine a repeatable way of counting the site. This is likely to require a dedicated count conducted on a different day to the standard WeBS Core Count and submitted as a supplementary count to WeBS. Counts of seaducks, divers and grebes from land need optimal conditions - a high vantage point, calm seas and good visibility - that are also comparable to other counts that have been made previously.
Counters will also need a good quality telescope for counting birds at a distance. However, even with the right conditions, observers will only be able to count and identify (though not always) birds that are around 1–2 km out from the coast. If the stretch of coast or estuary is relatively large, more than one counter may be needed in order to carry out a coordinated count. Counters also need to be confident in their identification of birds at a distance and in their ability to count large flocks, some of which can be quite extensive. At some sites, it might be possible to only monitor some species consistently well. For example, Eider and Red-breasted Merganser are typically found closer to shore than scoters and Long-tailed Duck, and it may be that few birds will be missed (though this does differ between sites).
If you are lucky enough to have seaduck at your count site and would like further advice on the best way to approach monitoring them, please contact the WeBS Office or the WWT Monitoring Unit.
WeB
SIn
dex
100
0
200
300
70/71 75/76 80/81 85/86 90/91 95/96 00/01 05/06 10/11 15/1665/66
As with many seaducks, Long-tailed Duck numbers have declined dramatically.

30
1–3536–100101–350351–500501–850851–1,0001,001–2,5002,501–4,000
4,001–6,500
The Oystercatcher is one of the most striking, most familiar and most studied of our wader species. It was recorded on more NEWS stretches than any other species, with an estimated 70,000 on open coast habitats; the only areas where they are noticeably absent being the eastward facing parts of the Holderness and East Anglia coasts.
Even larger numbers are present on estuaries. Over 200,000 were counted during WeBS counts in October 2015. The UK is very important for the nominate sub-
species: home to just under a third of the breeding population, and over a third of the wintering population (van de Pol et al. 2014). Internationally important numbers occur at Morecambe Bay, Solway Estuary, Dee Estuary, The Wash, Thames Estuary, Ribble Estuary, Burry Inlet and Carmarthen Bay.
Whilst commonest in coastal habitats throughout the year, Oystercatchers have proved themselves to be adaptable and have taken advantage of changes in the landscape. The first UK inland nest outside the
FIND OUT MORE...
BirdLife International. 2016. Haematopus ostralegus. The IUCN Red List of Threatened Species 2016: https://tinyurl.com/n6grjem
van de Pol et al. (15 co-authors). 2014. A global assessment of the conservation status of the nominate subspecies of Eurasian Oystercatcher Haematopus ostralegus ostralegus. International Wader Studies: 20: 27–61.
Highlands was on the River Eden in Cumbria in 1889 and since then they have spread further inland each year, first along rivers and then more widely on agricultural grasslands and roofs. Movements to breeding grounds can be seen by the spring decrease in the WeBS monthly index and a corresponding increase in the BirdTrack reporting rate, as birds disperse more widely.
The UK WeBS winter index for Oystercatcher today is similar to that at the start of the time series in 1974/75; however, it peaked twenty-five years ago in 1990/91 at 50% more than the current value. This corresponds to an annual decline of 2% a year over the past 25 years.
This recent rate of decline is repeated at the population level which, in 2015, prompted the IUCN Red Listing of this species to Near Threatened. It is not known if the recent declines are part of a long-term fluctuation. At a site level, overexploitation and disease of shell fisheries are known to have a negative effect and the future conservation status of Oystercatcher will depend on whether numbers stabilise and if conservation actions around shell fisheries lead to population recovery (Birdlife International 2016).
Species Focus...Oystercatcher
Adaptable OystercatchersOystercatchers were one of the most widely recorded species during the NEWS III counts
Oystercatcher winter (December 2015 – February 2016) counts from WeBS (dark blue dots) and NEWS III (light blue dots) with inset map showing breeding presence from Bird Atlas 2007–11 - pink areas have been used for breeding since the 1968–72 atlas, upwards arrows show expansion of breeding areas since then.

31D
AVE
KIN
G
WeBS trend for Oystercatcher in UK. Green dots = annual index; red dots = sparse data; blue line = smoothed trend.
Wintering distribution of nominate subspecies of Oystercatcher (data from van de Pol et al. 2014)
75/76 85/86 95/96 05/06 15/16
50
100
0
200
WeB
SIn
dex
Species Focus...Oystercatcher
Oystercatcher observations as a proportion of complete BirdTrack lists, related to increased dispersal during the breeding season (Mar-Jul).
25
0
30
20
%o
fcom
plet
elis
ts
Monthly indices for Oystercatcher in UK. Green bars = 2015/16; blue line/hatched area = previous 5-year mean/range.
Jul Aug Sep Oct Nov Dec Jan Feb Mar Apr May Jun0
50
100
150
WeB
SIn
dex
Oystercatchers are a very adaptable species and can be found in a variety of habitats from rocky shore and intertidal mudflats to agricultural fields and urban areas.
150
15
5
10
UK - 36%Germany - 21%
Netherlands - 21%
Ireland - 8%
France - 6%
Denmark - 3%
Africa/other - 5%

32
NEI
L C
ALBR
ADE
Throughout the winter, Great Crested Grebes are found on estuaries, shallow sea coasts and on lowland lakes. Inland, birds in winter are most concentrated in central and southern England, central Scotland and in Ireland on the lakes that are north of a diagonal band from Co. Kerry in the west to Co. Antrim and Co. Down in the east. On the coast, winter abundance is highest in the major estuaries and at other shallow coastal sites.
The highest counts on WeBS sites in 2015/16 come from Dungeness and Rye Bay (2,420), Abberton Reservoir (1,276), Dee Estuary (961), Loughs Neagh and Beg (696), Chew Valley Lake (575), Rutland Water (425), Cotswold Water Park (369) and Hanningfield Reservoir (331). Counts at Dungeness and Rye Bay have been consistently high
in recent years, with a peak of 3000 in 2012/13.
Birds in coastal habitats are often difficult to monitor due to the sea state or unfavourable weather conditions (see pages 28–29).
The system of WeBS Alerts (Cook et al. 2013) identified Medium Alerts for Northern Ireland (short- and mid-term) and for Wales (short-, mid- and long-term). In addition, High Alerts were identified for some key Special Protection Areas e.g. Belfast Lough, Firth of Forth, Lough Foyle, Medway Estuary and Marshes, Mersey Estuary, Morecambe Bay and Upper Solway Flats and Marshes.
Given the continuing declines on WeBS sites, a repeat of the WeBS Alerts work would be timely.
The winter fieldwork for Bird Atlas 2007–11 revealed a 22% increase in winter range size in Britain and Ireland since the 1981–84 Winter Atlas.
Despite the increase in range, information from WeBS and I-WeBS suggests a decline in numbers in the short-term trends. The 25 year WeBS trend (1989/90–2014/15) for the UK shows a 6% increase in numbers, whilst the 10-year trend 2004/05–2014/15 reveals a 21% decline; in the Republic of Ireland the 5-year trend (2008/09–2013/14) is -18% and the 10-year trend (2004/05–2013/14) is 16%. Some of this may reflect fewer continental immigrants from declining northwest European breeding populations (Hornman et al. 2012, Wetlands International 2017).
Species Focus...Great Crested Grebe
WeBS trend for Great Crested Grebe in UK. Green dots = annual index; blue line = smoothed trend.
80/81 85/86 00/01 05/06 10/11 15/16
50
0
150
WeB
SIn
dex
100
Focus on... Great Crested Grebe
90/91 95/96
FIND OUT MORE...
Hornman, M., Hustings, F., Koffijberg, K., Kleefstra, R., Klaassen, O., vanWinden, E., SOVON Ganzen- en Zwanenwerkgroep & Soldaat, L. 2012. Watervogels in Nederland in 2009/2010. SOVON-monitoringrapport 2012/02,Waterdienst-rapport BM 12.06. SOVON Vogelonderzoek Nederland, Nijmegen.
Wetlands International. 2017. Waterbird Population Estimates. http://wpe.wetlands.org [25 April 2017].

33PA
UL
HIL
LIO
N
Frequenting the mudflats of large estuaries, when not gathering in high tide roosts, Grey Plover tend to feed and travel singly or with only a few others.
The UK WeBS index of this arctic-breeding species has declined by more than half since its 1993/94 peak, and reached the lowest value for thirty years in 2015/16. In the East Atlantic Flyway the number of birds wintering in west Africa is also declining. However, in the Netherlands the recent trend is slightly increasing, and as the Flyway trend is stable, the recent UK decline is likely to be related to shifts in wintering distribution.
Concordantly, the 2015/16 WeBS maximum monthly total was a low 23,490, in February. The number of birds recorded for NEWS III reached its lowest level, resulting
in the latest open coast estimate of 1,012 birds (Table 3, page 15).
Six sites still surpassed the threshold for international importance with a five-year mean peak of over 2,500 birds. All of these had smaller maxima in 2015/16 than their five-year mean. A further 17 sites had a five-year mean peak of over 430 birds, surpassing the threshold of national importance.
The Kent and Essex mudflats of the Greater Thames Estuary are very important for this species in the UK, having nine sites of international or national importance. A long-term study at one of these, the Swale Estuary, collected data on age, primary moult and mass and analysed it together with WeBS year-round counts and ringing recoveries.
The results showed that birds used
the Swale in many ways: some remain for the whole winter whereas others stopover on southward migration. Birds spend just the start, just the end, or their entire moult on the Swale. It is thought the July Swale WeBS count represents the over-summering population of first year birds, with numbers indicating the success of the previous breeding season and subsequent survival rates. The study implies that the number of individuals supported by the Swale is higher than the WeBS peak count may suggest if turnover is not taken into account (Smith et al. 2016).
FIND OUT MORE...
Smith, R., Derrett, K. & Tardivel, N. 2016. Use of the Swale Estuary, SE England, by Grey Plovers Pluvialis squatarola. Wader Study 123(3): 213–225.
WeBS trend for Grey Plover in UK. Green dots = annual index; blue line = smoothed trend.
65/66 75/76 85/86 95/96 05/06 15/16
100
200
0
300
WeB
SIn
dex
Species Focus...Grey Plover
Focus on... Grey Plover
80/81 90/91 00/01 10/11
Internationally Important Sites (large circles) and Nationally Important Sites (small squares) for Grey Plover (based on WeBS five-year mean for 2011/12 – 2015/16).

34
D-b Brent Goose
Shelduck
Wigeon
Teal
Mallard
Pintail
Oystercatcher
Ringed Plover
Golden Plover
Grey Plover
Lapwing
Dunlin
Black-tailed Godwit
Turnstone
Curlew
Redshank
0 51 62 4Mean density of each species (birds per ha)
3
Pagham Harbour at low tideLow Tide Counts have been carried out in the UK since 1992/93,with repeat visits to sites enabling a comparison of data between years
The distribution of two species are mapped on the opposite page. For Wigeon and Dunlin, distributions based on WeBS Low Tide Counts undertaken in 1995/96 are displayed for comparison with the respective distributions from 2015/16.
Wigeon are present in large, though not in nationally or internationally important numbers with a five-year average of 2,271 birds. The mean winter counts at low tide in Pagham Harbour have fallen slightly with 643 (2.59 birds per ha) in 1995/96, compared with 466 (1.22 birds per ha) in 2015/16. The largest concentrations of Wigeon in 2015/16 were by Ferry House, north of the Pagham Wall and the main flats off Pagham, whereas in 1995/96 they were more numerous on the Church Norton side of the harbour
Pagham Harbour is a relatively small estuary located just east of Selsey Bill, one of the few undeveloped stretches of the Sussex coast. A central area of mudflats and saltmarsh is flanked by brackish marsh and damp pastures. The outlet to the sea is a narrow channel flowing through a shingle beach. There is a brackish lagoon at Pagham and a small pool at Sidlesham Ferry. The area was once claimed as agricultural land but was flooded again early in the 20th century. The harbour is now a designated as a Ramsar Site and SPA. Only a limited amount of sailing takes place in the harbour and fishing is strictly regulated. In January 2012, the RSPB took over the day-to-day management of the site from West Sussex County Council, who remain a very important partner, helping to fund this large and complex site.
Mean densities of waterbirds at low tide at Pagham Harbour in 2015/16.
Area covered: 290 ha Mean total birds: 5,606 Mean bird density: 19.3 birds per ha
GENERAL STATISTICS FOR PAGHAM HARBOUR
and along the Mill Channel.
Dunlin is a species that has shown a long-term decline in the UK and likewise in Pagham Harbour. This decline has been very evident between 1995/96 and 2015/16, with the mean winter low tide counts in 2015/16 (7.12 birds per ha) being less than half that recorded in 1995/96 (19.23 birds per ha). In 1995/96 the largest concentration was at the mouth of the estuary, but in 2015/16 most Dunlin were within the main estuary.
2.23
0.62
1.22
0.69
0.46
0.09
0.38
0.22
1.82
7.35
0.30
7.12
0.17
0.32
0.46
0.30
Low Tide Counts
7 8

35
Low tide distribution of Wigeon (1 dot = 1 bird) and Dunlin (1 dot = 1 bird) at Pagham Harbour, for the winters of 2015/16 (red) and 1995/96 (blue).
Wigeon
Dunlin
WIG
EON
BY
JOH
N H
ARD
ING
; DU
NLI
N B
Y N
ICK
CLA
YTO
N
Low Tide Counts

36
The Wetland Bird Survey (WeBS) monitors non-breeding waterbirds in the UK in order to provide the principal data on which the conservation of their populations is based. To this end, WeBS has three main objectives:
• to assess the size of non-breeding waterbird populations in the UK;
• to assess trends in their numbers and distribution; and
• to assess the importance of individual sites for waterbirds.
These results also form the basis for informed decision-making by conservation bodies, planners and developers, and contribute to the sustainable use and management of wetlands and their dependent waterbirds. The data and this annual WeBS report also fulfil some of the objectives of relevant international Conventions and Directives to which the UK is a signatory. WeBS also provides data to Wetlands International to assist their function of coordinating and reporting upon waterbird status
at an international flyway scale.WeBS continues the traditions of two long-running count schemes which formed the mainstay of UK waterbird monitoring since 1947.
WeBS Core Counts are carried out at a wide variety of wetlands. Coordinated, synchronous counts are advocated to prevent double-counting or birds being missed. Priority dates are recommended nationally, but due to differences in tidal regimes around the UK, counts take place at some estuaries on other dates in order to match the most suitable local conditions. Weather and counter availability also sometimes result in counts being undertaken on alternative dates.
In addition, WeBS Low Tide Counts are undertaken on selected estuaries with the aim of identifying key areas used during the low tide period, principally by feeding birds. It also identifies areas not otherwise noted for their importance from data collected during Core Counts which are normally conducted at, or close to, high tide.
The success and growth of these count schemes reflects the enthusiasm and dedication of the several thousands of participating volunteer ornithologists. It is largely due to their efforts that waterbird monitoring in the UK is held in such high regard internationally.
Full details of WeBS field and analytical methodologies are available via the WeBS website: www.bto.org/webs.
Waterbirds in the UK 2015/16 (comprising this summary report together with numbers and trends available from WeBS Report Online at www.bto.org/webs-reporting) presents the results of WeBS in 2015/16. Data from other national and local waterbird monitoring schemes, notably the WWT/JNCC/SNH Goose & Swan Monitoring Programme, are included where WeBS data alone are insufficient to fulfil specified aims. The annual WeBS report therefore provides a single, comprehensive source of information on waterbird status and distribution in the UK.
LES
FOST
ER
WeBS objectives, aims and methods
General Background
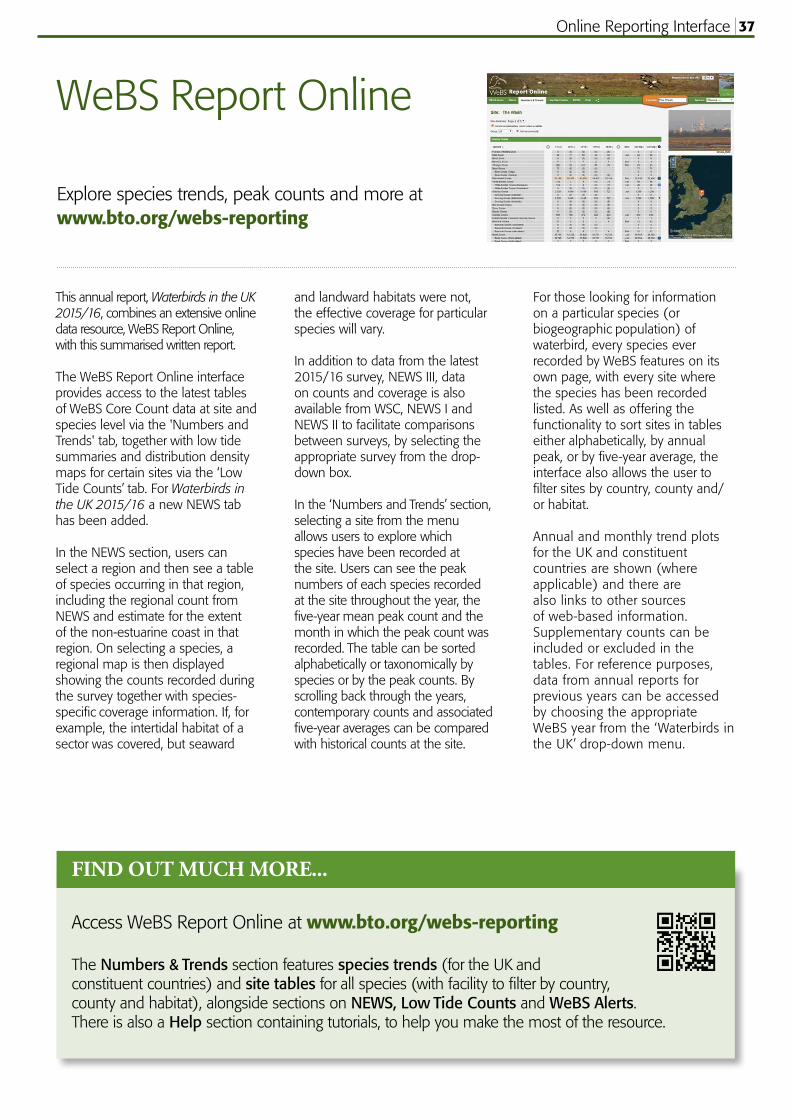
37
FIND OUT MUCH MORE...
Access WeBS Report Online at www.bto.org/webs-reporting
The Numbers&Trends section features speciestrends (for the UK andconstituent countries) and sitetables for all species (with facility to filter by country,county and habitat), alongside sections on NEWS,LowTideCountsand WeBSAlerts. There is also a Help section containing tutorials, to help you make the most of the resource.
This annual report, Waterbirds in the UK 2015/16, combines an extensive online data resource, WeBS Report Online, with this summarised written report.
The WeBS Report Online interface provides access to the latest tables of WeBS Core Count data at site and species level via the 'Numbers and Trends' tab, together with low tide summaries and distribution density maps for certain sites via the ‘Low Tide Counts’ tab. For Waterbirds in the UK 2015/16 a new NEWS tab has been added.
In the NEWS section, users can select a region and then see a table of species occurring in that region, including the regional count from NEWS and estimate for the extent of the non-estuarine coast in that region. On selecting a species, a regional map is then displayed showing the counts recorded during the survey together with species-specific coverage information. If, for example, the intertidal habitat of a sector was covered, but seaward
and landward habitats were not, the effective coverage for particular species will vary.
In addition to data from the latest 2015/16 survey, NEWS III, data on counts and coverage is also available from WSC, NEWS I and NEWS II to facilitate comparisons between surveys, by selecting the appropriate survey from the drop-down box.
In the ‘Numbers and Trends’ section, selecting a site from the menu allows users to explore which species have been recorded at the site. Users can see the peak numbers of each species recorded at the site throughout the year, the five-year mean peak count and the month in which the peak count was recorded. The table can be sorted alphabetically or taxonomically by species or by the peak counts. By scrolling back through the years, contemporary counts and associated five-year averages can be compared with historical counts at the site.
For those looking for information on a particular species (or biogeographic population) of waterbird, every species ever recorded by WeBS features on its own page, with every site where the species has been recorded listed. As well as offering the functionality to sort sites in tables either alphabetically, by annual peak, or by five-year average, the interface also allows the user to filter sites by country, county and/or habitat.
Annual and monthly trend plots for the UK and constituent countries are shown (where applicable) and there are also links to other sources of web-based information. Supplementary counts can be included or excluded in the tables. For reference purposes, data from annual reports for previous years can be accessed by choosing the appropriate WeBS year from the ‘Waterbirds in the UK’ drop-down menu.
WeBS Report Online
Explore species trends, peak counts and more at www.bto.org/webs-reporting
Online Reporting Interface

38
193WeBS Data Requests in 2015/16
Uses of WeBS data 2015/16
More information about the WeBS Data Request Service is available fromwww.bto.org/webs-data where you can see coverage by WeBS of different sites, check data request charges, and view examples of the data that can be provided.
With the UK host to internationally important numbers of over-wintering waterbirds, one of the principal aims of WeBS is to provide data to facilitate their conservation. Indeed, there have been many high-profile examples over the years in which WeBS data have proved to be fundamental in securing the protection of important wetland sites.
A summary of site-based WeBS information is presented on the online interface, but data at a finer level (both spatial and temporal) are available in a user-friendly format through a bespoke WeBS Data Request. Any WeBS-based information that is to be incorporated into site evaluation work, such as Environmental Impact Assessments (EIAs), should be sourced through a WeBS Data Request to ensure the data have been validated and summarised appropriately.
The graph shows the number of Data Requests processed by the WeBS office each year since 2009/10. These are from a range of stakeholder groups, including country conservation agencies, environmental consultancies, academic researchers and bird clubs. Summarised WeBS data are also provided to several online environmental data portals.
January WeBS data are supplied to Wetlands International for inclusion in the International Waterbird Census, and summaries are used in outputs such as waterbird population estimates, and African-Eurasian Migratory Waterbird Agreement (AEWA) Conservation Status reports.
The WeBS Partnership is keen to encourage WeBS data use within environmental research. A number of scientific papers and reports that have used WeBS data in recent years are referenced within
the pages of this annual report, and there is of course an extensive suite of other research questions relating to waterbird ecology and wider wetland management issues to which WeBS data would lend themselves, at both national and international scales.
Academic researchers, students and potential collaborators interested in using WeBS data can email the WeBS office at [email protected].
WeBS Data Requests 2009/10 to 2015/16.
250
200
150
100
50
0
Num
bero
freq
uest
s
2009/10 2010/11 2013/14 2014/15 2015/16
Commercial Counter/Research/EducationWeBSPartner
2011/12 2012/13
WeBS Data Requests
WeBS DATA REQUESTS

39
Selected further reading RecentstudiesthathaveusedWeBSdata
Frost, T.M., Austin, G.E., Calbrade, N.A., Holt, C.A., Mellan, H.J., Hearn, R.D., Stroud, D.A., Wotton, S.R. & Balmer, D.E. 2016. Waterbirds in the UK 2014/15: The Wetland Bird Survey. BTO/RSPB/JNCC. BTO, Thetford.
Austin, G.E., Frost, T.M. & Ross, K. 2017. Providing data for rapid condition assessment of non-breeding waterbird SPAs in England: Phase II. Research Report 684. BTO, Thetford.
Austin, G.E., Frost, T.M., Mellan, H.J. & Balmer, D.E. 2017. Results of the third Non-Estuarine Waterbird Survey, including population estimates for key waterbird species. Research Report 697. BTO, Thetford.
Bowgen, K.M. 2016. Predicting the effect of environmental change on wading birds : insights from individual-based models. PhD Thesis, Bournemouth University.
Cook, A.S.C.P., Barimore, C., Holt, C.A., Read, W.J. & Austin, G.E. 2013. Wetland Bird Survey Alerts 2009/10: Changes in numbers of wintering waterbirds in the UK, SPAs and SSSIs. BTO Research Report 641. www.bto.org/webs-alerts
Eaton, M.A., Aebischer, N.J., Brown, A.F., Hearn, R.D., Lock, L., Musgrove, A.J., Noble, D.G., Stroud, D.A. & Gregory, R.D. 2015. Birds of Conservation Concern 4: the population status of birds in the UK, Channel Islands and Isle of Man. British Birds 108: 708–746.
Green, R.E. & Pain, D.J. 2016. Possible effects of ingested lead gunshot on populations of ducks wintering in the UK. Ibis 158: 699–710.
Hall, C., Crowe, O., McElwaine, G., Einarsson, Ó., Calbrade, N., & Rees, E.C. 2016. Population size and breeding success of Icelandic Whooper Swans Cygnus cygnus: results of the 2015 international census. Wildfowl 66: 75–97.
Hayhow D.B., Bond A.L., Douse A., Eaton M.A., Frost T., Grice P.V., Hall C., Harris S.J., Havery S., Hearn R.D., Noble D.G., Oppel S., Williams J., Win I. & Wotton S. 2017. The state of the UK’s birds 2016. RSPB, BTO, WWT, DAERA, JNCC, NE, NRW & SNH, Sandy, Bedfordshire. www.bto.org/SUKB
Robinson, R.A., Leech, D.I., Massimino, D., Woodward, I., Eglington, S.M., Marchant, J.H., Sullivan, M.J.P., Barimore, C.,Dadam, D., Hammond, M.J., Harris, S.J., Noble, D.G., Walker, R.H. & Baillie, S.R. 2016. BirdTrends 2016: trends in numbers, breeding success and survival for UK breeding birds. Research Report 691. BTO, Thetford. www.bto.org/birdtrends
van Roomen, M., Nagy, S., Foppen, R., Dodman, T., Citegetse, G. & Ndiaye, A. 2015. Status of coastal waterbird populations in the East Atlantic Flyway 2014. With special attention to flyway populations making use of the Wadden Sea. Programme Rich Wadden Sea, Leeuwarden, The Netherlands.
Smith, R., Derrett, K. & Tardivel, N. 2016. Use of the Swale Estuary, SE England, by Grey Plovers Pluvialis squatarola. Wader Study 123(3): 213–225.
Stroud, D.A., Bainbridge, I.P., Maddock, A., Anthony, S., Baker, H., Buxton, N., Chambers, D., Enlander, I., Hearn, R.D., Jennings, K.R, Mavor, R., Whitehead, S. & Wilson, J.D. (eds). 2016. The status of UK SPAs in the 2000s: the third network review. JNCC, Peterborough.
Wood, K.A., Newth, J.L., Hilton, G.M., Nolet, B.A. & Rees, E.C. 2016. Inter-annual variability and long-term trends in breeding success in a declining population of migratory swans. Journal of Avian Biology 47: 597–609.
WALESAnglesey Ian SimsBreconshire Andrew KingBurry Inlet Lyndon JefferyCaernarfonshire Rhion PritchardCaernarfonshire (Foryd Bay) Simon Hugheston-RobertsCardigan (incl Dyfi Estuary) Russell JonesCarmarthenshire Terry WellsClwyd (coastal) VACANTClwyd (inland) Duncan HalpinEast Glamorgan Daniel Jenkins-JonesGwent (excl Severn Estuary) Al VenablesMerioneth (estuaries) Jim DustowMerioneth (other sites) Trefor OwenMontgomeryshire Jane KelsallPembrokeshire Annie HaycockRadnorshire Peter JenningsSevern Estuary (Wales) Al VenablesWest Glamorgan Lyndon Jeffery
NORTHERN IRELANDAntrim (Larne Lough) Doreen HilditchAntrim (other sites) Adam McClureArmagh (excl Loughs Neagh and Beg) Stephen HewittBelfast Lough Shane WolseyDown (Carlingford Lough) Shane WolseyDown (Dundrum Bay) Patrick LynchDown (other sites) Shane WolseyDown (Outer Ards) NIEADown (South Down Coast) Shane WolseyDown (Strangford Lough) Kerry MackieFermanagh Michael StinsonLondonderry (Bann Estuary) Hill DickLondonderry (Lough Foyle) Matthew TicknerLondonderry (other sites) Shane WolseyLoughs Neagh and Beg NIEATyrone (excl Loughs Neagh and Beg) Vacant (now Michael Stinson)
CHANNEL ISLANDSAlderney Alderney Wildlife Trust EcologistChannel Islands (inland) Glyn YoungGuernsey Coast Mary SimmonsJersey Coast Roger Noel
ISLE OF MAN
Isle of Man Pat Cullen
We would be grateful for help organising WeBS in areas currently without a Local Organiser (marked VACANT). If you live in one of these areas and would be interested in taking on the role, please let us know. Email: [email protected]
In 2015/16, the WeBS Local Organiser Advisory Committee (WeBS LOAC) comprised John Armitage, Neil Bielby, Brian O'Leary, Andrew King, Chris Gunn, Brian Moore, Colin Wells and Kerry Mackie. Many thanks to them for representing the wider LO network. Further information about the WeBS LOAC can be found at www.bto.org/webs/loac.
Continued from back page
WeBS Local Organisers in 2015/16
Further information, including site tables and trends for all the regular WeBS species, is available in the online report at www.bto.org/webs-reporting
WeBS ONLINE REPORT
WeBS Local Organisers

We wish to thank all surveyors and Local Organisers for making WeBS the success it is today. Unfortunately space does not permit all observers to be acknowledged individually, but we would especially like to credit the Local Organisers for their efforts.
SPECIAL THANKS
British Trust for OrnithologyThe NunneryThetfordNorfolkIP24 2PU
01842 [email protected]/webs
WeBS Local Organisers in 2015/16
ISBN 978-1-908581-76-1
ENGLANDAvon (excl Severn Estuary) Rupert HigginsBedfordshire Richard BashfordBerkshire Ken White
Buckinghamshire (North) Chris Coppock
Buckinghamshire (South) VACANTCambridgeshire (incl Huntingdonshire) Bruce MartinCambridgeshire (Nene Washes) Charlie KitchinCambridgeshire (Ouse Washes) Paul HarringtonCheshire (North) Kane BridesCheshire (South) David CooksonCleveland (excl Tees Estuary) Chris SharpeCleveland (Tees Estuary) Mike Leakey (now Adam Jones)Cornwall (excl Tamar Complex) Pete RoseveareCornwall (Tamar Complex) Gladys GrantCotswold Water Park Gareth HarrisCumbria (Duddon Estuary) Colin GayCumbria (excl estuaries) Dave ShackletonCumbria (Irt/Mite/Esk Estuary) Peter JonesDee Estuary Colin WellsDerbyshire Peter Gibbon (now VACANT)Devon (other sites) Pete ReayDevon (Exe Estuary)Devon (Taw/Torridge Estuary)
Penny AvantBrian O'Leary (now Tim Davis)
Dorset (excl estuaries) Malcolm BalmerDorset (Poole Harbour) Paul MortonDorset (Radipole and Lodmoor) Toby BranstonDorset (The Fleet and Portland Harbour) Steve GrovesDurham VACANTEssex (Crouch/Roach Estuaries and South Dengie)
Peter Mason (now Stephen Spicer)
Essex (Hamford Water) Julian NovorolEssex (North Blackwater) John ThorogoodEssex (other sites) Gavin Foster (now VACANT)Essex (South Blackwater and North Dengie)
Anthony Harbott
Gloucestershire Michael SmartGreater London (excl Thames Estuary) Helen BakerGreater Manchester Jamie Dunning (now Tim
Wilcox)Hampshire (Avon Valley) John ClarkHampshire (estuaries/coastal) John ShillitoeHampshire (excl Avon Valley) Keith WillsHerefordshire Chris RobinsonHertfordshire Jim TerryHumber Estuary (inner South) Keith ParkerHumber Estuary (mid South) Richard BarnardHumber Estuary (North) Nick CuttsHumber Estuary (outer South) John WalkerIsle of Wight Jim BaldwinKent (Dungeness area) David WalkerKent (East) Norman McCanch (now
VACANT)Kent (North Kent estuaries) Geoff OrtonKent (Pegwell Bay) Ian HodgsonKent (West) Norman McCanch (now
VACANT)Lancashire (East Lancs and Fylde) Stephen DunstanLancashire (North inland) Peter MarshLancashire (Ribble Estuary) Ken AbramLancashire (River Lune) Jean RobertsLancashire (West inland) Tom ClareLee Valley Cath PatrickLeicestershire and Rutland (excl Rutland Water)
Brian Moore
Leicestershire and Rutland (Rutland Water)
Tim Appleton
Lincolnshire (North inland) Chris GunnLincolnshire (South inland) Bob TitmanMerseyside (Alt Estuary) Steve WhiteMerseyside (inland) Kevin FeeneyMerseyside (Mersey Estuary) Dermot SmithMorecambe Bay (North) VACANTMorecambe Bay (South) Jean RobertsNorfolk (Breydon Water) Jim RoweNorfolk (excl estuaries) Tim StrudwickNorfolk (North Nofolk Coast) Neil LawtonNorthamptonshire (excl Nene Valley) VACANTNorthamptonshire (Nene Valley) Steve BrayshawNorthumberland (coastal) Kathy EvansNorthumberland (inland) Steve HollidayNorthumberland (Lindisfarne) Andrew CraggsNottinghamshire David ParkinOxfordshire (North) Sandra BletchlyOxfordshire (South) Ben Carpenter
Severn Estuary (England) Harvey RoseShropshire Michael WallaceSolway Estuary (inner South) Norman Holton (now David
Blackledge)Solway Estuary (outer South) Dave ShackletonSomerset (other sites) Eve TigwellSomerset (Somerset Levels) Steve Meen (now Trish Harper)Staffordshire Scott PetrekSuffolk (Alde Complex) Ian CastleSuffolk (Alton Water) John GlazebrookSuffolk (Blyth Estuary) Adam Burrows (now Will
Russell)Suffolk (Deben Estuary) Nick MasonSuffolk (Orwell Estuary) Mick WrightSuffolk (other sites) Alan MillerSuffolk (Stour Estuary) Rick VonkSurrey Penny WilliamsSussex (Chichester Harbour) James Parkin (now Peter
Hughes)Sussex (other sites) Helen Crabtree and Dave
BoddingtonThames Estuary (Foulness) Chris LewisThe Wash Jim ScottWarwickshire Matthew GriffithsWest Midlands Nick LewisWiltshire Bill QuantrillWorcestershire Andrew WarrYorkshire (East and Scarborough) Jim MorganYorkshire (Harrogate and Yorkshire Dales) Bill HainesYorkshire (Huddersfield/Halifax area) VACANTYorkshire (Leeds area) Paul MorrisYorkshire (South) Jamie DunningYorkshire (Wakefield area) Peter Smith
SCOTLANDAberdeenshire Moray SouterAngus (excl Montrose Basin) VACANTAngus (Montrose Basin) Anna CheshierArgyll Mainland Paul DawArran Jim CasselsAyrshire Dave GrantBadenoch and Strathspey Keith DuncanBorders Andrew BramhallBute Ian HopkinsCaithness Sinclair Manson
Central (excl Forth Estuary) Neil BielbyClyde Estuary John ClarkDumfries and Galloway (Auchencairn and Orchardtown Bays)
Euan MacAlpine
Dumfries and Galloway (Fleet Bay) David HawkerDumfries and Galloway (Loch Ryan) Paul CollinDumfries and Galloway (other sites) Andy RichesDumfries and Galloway (Rough Firth) Judy BaxterDumfries and Galloway (Wigtown Bay) Paul CollinFife (excl estuaries) Allan BrownFife (Tay and Eden Estuaries) Norman ElkinsForth Estuary (inner) Michael BellForth Estuary (outer North) Alastair InglisForth (outer South) Duncan PriddleGlasgow/Renfrewshire/Lanarkshire John ClarkHarris and Lewis Yvonne BentingIslay, Jura and Colonsay David WoodIsle of Cumbrae VACANTLochaber John DyeLothian (excl estuaries) Allan BrownLothian (Tyninghame Estuary) Bobby Anderson (now Tara
Sykes)Moray and Nairn (inland) David LawMoray and Nairn (Lossie Estuary) Bob ProctorMoray Basin Coast Bob SwannMull Paul Daw (now Nigel Scriven)Orkney Morag WilsonPerth and Kinross (excl Loch Leven) Michael BellPerth and Kinross (Loch Leven) Jeremy SquireShetland Paul HarveySkye and Lochalsh Robert MacmillanSolway Estuary (North) Andy RichesSutherland (excl Moray Basin) VACANTTiree and Coll John BowlerUists and Benbecula Yvonne BentingWest Inverness/Wester Ross Vacant (now Andy Douse)
in associationwith