Water & Wastewater Utilities - World Bank & Wastewater Water and ... Metropolitan Ankara...
66
Water & Wastewater Water and Sanitation a Division Utilities The World Bank Indicators 2nd Edition Guillermo Yepes Augusta Dianderas Public Disclosure Authorized Public Disclosure Authorized Public Disclosure Authorized Public Disclosure Authorized
Transcript of Water & Wastewater Utilities - World Bank & Wastewater Water and ... Metropolitan Ankara...

Water & WastewaterWater and Sanitation a
Division UtilitiesThe World Bank
Indicators 2nd Edition
Guillermo YepesAugusta Dianderas
Pub
lic D
iscl
osur
e A
utho
rized
Pub
lic D
iscl
osur
e A
utho
rized
Pub
lic D
iscl
osur
e A
utho
rized
Pub
lic D
iscl
osur
e A
utho
rized

( 1996International Bank for Reconstruction and DevelopmentThe World Bank1818 H Street, NWWashington, DC 20433 USA
The Water and Sanitation Division of the Transportation, Water, and Urban Development Depart-ment is addressing the sectoral challenges articulated in the World Bank's Water Resources Man-agement Policy Paper and in the World Development Reports of 1992 and 1994. These challengesinvolve implementing key management principles:* Water should be treated as both a social and economic good.* Water should be managed within a comprehensive framework, taking into account cross-sectoralconsiderations.* Water should be managed at the lowest appropriate level, employing a demand-based approachand facilitating participation of all stakeholders.* Institutional and policy reforms should be linked to incentives influencing decision making.
The Division's work program is therefore selectively focused on three distinct themes: waterresources management, performance of water and sanitation utilities, and service provision throughnon-formal institutions.
This document is published informally by the World Bank. Copies are available free from the WorldBank. Contact Ms. Mari Dhokai, Room S4-001, Telephone: (202) 473 3970, Fax: (202) 477 0164,Email: [email protected]
The World Bank does not accept responsibility for the views expressed herein, which are those ofthe author and should not be attributed to the World Bank or its affiliated organizations. The findings,interpretations, and conclusions are the results of research supported by the Bank. The designationsemployed and the presentation of the material are solely for the convenience of the reader and donot imply the expression of any legal opinion whatsoever on the part of the World Bank or its affili-ates concerning the delimitations of its boundaries or national affiliation.

INDICATORS2nd Edition
WATER & WASTEWATERUTILITIES
A, I& 'MEOW,5

INDICATORSWATER AND WASTEWATER UTILITIES
INDEXPage No.
Foreword ....................................................... iInformation About Cities And Utilities Cited ...................................................... ii
SET I. OPERATIONAL INDICATORS
Introduction ........................................................
A. WATER CONSUMPTIONA. I Unit Consuption .2A.2 Water Consumption & Metering .3A.3 Distribution of Water Consumption .4A.4 Consumption by Main Users Category .4A.5 Ratio of Peak Day to Average Day .5A.6 Water Price & Income Elasticities .5
B. WATER DISTRIBUTION SYSTEMB. I Length of Water Piped Systems ...................................................... 7B.2 Storage Volume ...................................................... 8B.3 Pipe Breaks ...................................................... 9B.4 Pipe Breaks as a Function of Pipe Material ....................................................... 9
C. UNACCOUNTED FOR WATERC. I Water Losses ...................................................... 10C.2 Composition of UFW ...................................................... 12C.3 UFW Effective Reduction Programs ...................... ................................ 12C.4 Sustainability of UFW Reduction Programs ...................................................... 13
D. WASTE WATERD. I Length of Sewer Systems ...................................................... 14D.2 Infiltration Flows in Sewer Systems ...................................................... 14
E. WASTEWATER TREATMENTE. I Typical Composition of Untreated Municipal Wastewater .. ..................................... 15E.2 Typical Constituent Removal Efficiencies ...................................................... 16E.3 Removal of Microorganisms ...................................................... 16
F. PERSONNELF. I Number of Staff ...................................................... 17F.2 Staff Composition ...................................................... 18F.3 Training Effort ...................................................... 18
G. MISCELLANEOUS INDICATORSG. 1 Vehicles/1000 Water Cornections .................. .................................... 18G.2 Meter Reading ....................................................... 19G.3 Meter Maintenance and Replacement Practices .19

Page No.
SET II. FINANCIAL INDICATORS
Introduction ......................................... 21
A. EFFICIENCY INDICATORSA. 1 Working Ratio ........................................ 29A.2 Operating Ratio ........................................ 23A.3 Accounts Receivable/Collection Period ........................................ 24A.4 Percentage Contribution to Investment ........................................ 25
B. LEVERAGE INDICATORSB. 1 Debt Service Coverage Ratio ........................................ 26B.2 Debt Equity Ratio ........................................ 27
C. LIQUIDITY INDICATORC. l Current Ratio ........................................ 28
D. PROFITABILITY INDICATORSD. 1 Retum of Net Fixed Assets ........................................ 29D.2 Return of Equity ........................................ 30
E. OPERATIONAL RATIOSE. 1 Personnel ........................................ 3 1E. 1. 1 Personnel Costs ........................................ 3 1E. 1.2 Staff Productivity Index ........................................ 31E.2 Composition of Operational Costs ........................................ 33E.3 Unit Operational Costs ........................................ 34
SET III. OVERVIEW OF TARIFF RATES AND STRUCTURESA. I Backgroud .35A.2 Tariff Structure .35A.3 Domestic Tariff .36A.4 Average Charge & Incremental Cost .38A.5 Rate Discrimination by Consumer Group .43A.6 Water Billings. Consumption & Users .44A.7 Conclusions & Hypothesis to be Tested .45
ANNEX: Personnel Costs as an Indicator for Water and Sanitation Utility Peiformance in DevelopingCountries (Infrast-ucture Note: W & S - I2).
We hereby wish to extend our appreciation and thanks to Mr. Jorge A. Serraino for his assistance in thepreparation of this report.

FOREWORD
Indicators can be a valuable tool to sector staff and practitioners working in the evaluationof operations and investments of water and sanitation utilities'. To make this job moremanageable indicators on Water and Waste-Water services, mainly in urban areas, havebeen grouped into three sets:
1. Operational Indicators (first edition, April 1993)2. Financial Indicators (first edition. June 1994), and3. Overview of Tariff Rates and Structures (first edition, June 1994).
In response to the heavy demand. this second edition has been updated and expanded withadditional information collected since the three sets were first published.
Indicators have been collected firomil a selected group of utilities firomii industrialized anddeveloping countries. Indicators from the former group are believed to represent"acceptable" or "desirable" outcomes or best practice. General infonnation about theutilities cited is presented in Tables I and 2.
Staff working in operations have day to day contact with utilities and therefore are in thebest position to collect the infonnation requil-ed to keep this information Lup to date. It isonly through your collaboration and that of practitioners that we will be able to keep theseindicators current and to expand them. We appreciate the inputs and feedback received fromstaff in operations after the first edition was published and look forward to continuereceivinig your comments. suggestion and additional data.
Guillermo YepesAugusta Dianderas
Sectoral and Project Performance Indicators in Bank financed Water and Waste-Water Operationis.A First Edition Note, TWU Departimleit, ESD. April 1995.
- i -

INFORMATION ABOUT CITIES AND UTILITIES CITED
All the companies in the sample are utilities responsible mainily for ulban centers with serviceareas covering a city, region or country. The population to be served by these utilities ranges fromabout 0.2 million to over 17 million. In terms of the service provided these utilities can be dividedinto three groups: water ( I I), waste water (4 - all in Korea) and water and waste water (19).
All the public utilities have some degree of autonomy in the sense that they manage, at least,their own budget. However, their autonomy, regulatory system, sector policies and political forcesthat shape the behavior of these companies are not thoroughly documented in the source reports toallow a meaningful analysis. Therefore, information on these factors. imlpol-tant as they are, is notdocumented here.
Table 1
Country Nanie of Utility Area Serviced Tyvje qf_____________________________ ~ ~~~~~~~~~Utility
Latin America:
Brazil Sao Paulo State Water Co. State of Sao Paulo Regional/PublicBrazil Sta. Catarinia State Water Co. State of Sta. Catarina Regionatl/PublicBrazil Minas Gerais State Watel Co. State of Minas Gerais Regional/PublicChile Obras Sanitarias of Valparaiso Metropolitan Valparaiso Municipal/PublicChile Empresa Municipal Obras Sanitarias Metropolitan Santiago Municipal/PublicColombia Water & Sewage Co. of Bogota Metropolitan Bogota Municipal/PublicCosta Rica Inst. of Water & Sewage of C. Rica 70% of the Country National/Public
Africa:Algeria Water Supply Co. of Oran Oran, Tiemcen, Ain &Mascara Regional/PublicAlgeria Water Supply Co. of Aninaba Annaba & El Tarf Areas Regional/PublicGhana Ghana\s Water & Sewerage Corp. 40% of the Country National/PublicMorocco National Office of Potable Water 75% Urban Morocco National/PublicNigeria Katsina State Water Board 50% of Katsina State Regional/PublicNigeria Kaduna State Water Board 50% of Kaduna State Regional/Public
Europe/Central Asia:Turkey Bursa's Water Supply & Sewrg. Authi. Metropolitan Bursa Municipal/PublicTurkey Ankw-a's Water Supply & Servig. Auth. Metropolitan Ankara Municipal/Public
South & East Asia:Pakistan Karachi Water- & Sewerage Board Metropolitan Karachi MuLnicipal/PublicChina Cbaliaocihiii Water Supply Co. Metropolitan Changchun Municipal/PublicKorea Kwaungju Cosnfluct. Bureau (Se\ig. Div.) Metropolitan Kwangju Municipal/PublicKorea Pusui City Goviit. (Sewerg. Division) Metropolitan Pusan M unicipal/Publ icKorea Seoul Sewerage Division Metropolitan Seoul Mun1icipal/PublicKorea Taejoin City Ciovint. (Sewerg. Division) Metropolitan Taejon Mun1icipal/PublicPhilippines Metrop. Waterwor-ks & Sewrs. Systemil Metropolitan Manila Municipal/Public
High Income Countries:Belgium Compaglie hitelcomimilluniale Brussels area and surroundings Municipal
Bruselloise des EauxEngland Wessex Water Central/South Regiona;lPrivateFrance Banilieue Metro Area/Paris PrivateFrance Bordleaux City PrivateFrance Societe des Eaux de Marseille City PrivateGermany Hambuir City PublicJapan Osaka City PublicJapan Tokyo Capital City PublicSingapore Public Utilities Boardl City/State PublicSpain AgUIas .le Alicante City Mwlicipl/PnivateSpain Aguas de Murcia City MtU1icipXl/PivateSpain Aguas de Torrevieja City Mtuniciplx/Privatc
jjt

Table 2
Utility Year of Connections Service Population PopulationInformation *000 / Provided '000 Served %
Sao Paulo 1988 5080 W&S. 17,500 9o b1S. Catarina 1990 529 W3 S. .3000 85b/
Minas 1990 1870 W &S. 7,600 96 b/
Valparaiso 1990 526 W & S. 760 97 b6
Santiago 1994 1811 :W S. 5.000 100 b/
Bogota 1990 1 2 . 5,000 94 b/
Costa Rica 1991 437 W&S. 1700 84b
Oran 1992 204 Water 1,900 68Annaba 1992 34 Water 600 73Ghana 1988 197 w & S. 7,400 60N.Morocco 1990 601 Water 11,300 90Katsuna 1W990 520 55Kaduna 1990 43 Water 1,600 76
Bursa 1991 ~~~~307 W &S. 710 91 b/
Ankara 1988 832 W&S. 2,200 93b.
Karachi 1989 102 3 W & S. 6.300 N.A.Changchun 1990 388 Water 1.600 90Kwangju 1990 96 d/ Sewrge 1,100 91 d/
Pusan 1990 -287 d/ Sewrge 3.700 95 d/
Seoul 1990 ~~~~~1575 d/ Sewrge 8.700 72 d/
Taejon 1990 90 d/ Sewrge 1.000 87 dj
Manila 1988 641 W&S. 5,000 87 d/
Brussels 1991 N.A. W& S. 1.000 N.A.Wessex 1991 N.A. W&S. N.A. N.A.Banlieue 1987 N.A. Water N.A. N.A.Bordeaux 1982 N.A. Water N.A. N.A.Marseille 1992 N.A. W & S. 1,00( N.A.Hamburg 1990 N.A. Water 1,901 N.A.Osaka 1990 N.A. Water 1.200 N.A.Tokyo 1990 N.A. b W S. 4,900 N.A.Singapore 1994 760 Water 21,800 100Alicante 1990 17 &.600 10061/Murcia l992 b5 W S 3510bTorrevieja 992 946 W&S. 200 loo b6
N.A: Not Availablea/ Includes W and S connections for W & S utilitiesb/ Corresponds only to Water servicesc/ Includes 2.1 million inilabitants in rural areas (17% of the total population)d/ Corresponds to sewerage services only.
iii

WATER & WASTEWATERUTI LITI ES
SET I
OPERATIONAL INDICATORS
U...
-~~


Introduction
Operational indicators can be very useful in assessing the performance of water andwaste-water utilities in the course of project formulation and supervision of Bank financedprojects and in sector work.
Invariable, any indicator portrays an incomplete picture of an utility as it oftenexcludes other contributing factors of performance such as accountability of institutions andincentives, that are not readily captured or quantif'iable. In addition, utilities face differentsocial, political and financial constraints. These factors and constraints need to be taken intoaccount when evaluating the performance of an utility. It follows that indicators should not beused in a rigid prescriptive fashion, and judgment is required to interpret them or to setacceptable or desirable targets.
The idea of a comprehensive and up to date list of indicators fiom a large number ofutilities world wide is attractive but probably not realistic due to the costs involved incollecting this information. We also recognize the interest in con-elating indicators to othervariables like city or utility size or to GNP. No attempt. however, has been made in thisdirection at this time as the data base is still small and, therefore, the conclusions reached fornsuch correlations could be spurious.
Indicators should be used selectively. The use of too many is likely to dilute the powerof all of them. Managers may become confused about priorities and burdened by paperworkand overwhelmed by detail. On the other hand, the use of too few may not adequatelydescribe the utility's performance and progress in reaching its goals.
The quality of the management information systems should be assessed beforediscussing with sector officials about which indicators are important and relevant and to whomand how often they should be reported to. If the management information systems aredeficient or infomiation is not produced on time. it is important to develop a reliable systemand the incentives to keep it relevant and up to date.
Indicators are as good as the data base from which they are (derived. For instance, lackof metering of production or consumption casts doubts about the reliability of estimates onwater consumption or water losses. There is also the danger of reducing performanceevaluation to number-s and for utility managers and staff to play games with them. Therefore:
* watch out for "creaming", e.g., managers tend to produce the numbers they areasked to deliver.
* anticipate resistance. Hard information about efficiency and effectiveness can bethreatening to insecure managers who doubt their ability to compete,
* involve the utility managers in developing corrective measures. This is probablythe best way to deal with resistance. Managers need to "own" the specificmeasures to be implemented and the indicators to be generated and to be convincedthat they will help them improve the service they are in charge of, and
* analyze the evolution of the indicators to assess progress or deteiioration ofutilities' performance.

Operational Indicators Water & Wastewater UtilitiesPage 2 Set I
A. WATER CONSUMPTION
A.1. UNIT CONSUMPTION
Total water consumption, based on metered consumption. is reported as:
* average daily consumption per person served (liters per capita per day, lpcd).* average consumption per connection per month (m'/month/connection, m/mi/c).
Countries Water Consumption
CountIy/City Year Ipcd m3/mn/c
Algeria (average) 1990 46 N/ABrazil (average) 1989 151 1 25 a/* Brasilia 1989 211 60 b/* Sao Paulo 1988 237 38 c/* Sta. Catarina 1990 143 22* Minas 1990 154 25Chile* Santiago 1994 204 34 d/* Valparaiso 1992 N/A 23China, Changchun 1 990 260 33
Colombia, Bogota 1992 167 30Costa Rica 1991 208 29
1994 197 226Cote d' Ivoire, Abidjan 1993 N/A 34Senegal, Dakar 1993 N/A 36Belgium, Brussels 1991 N/A 29Canada (average) 1984 1 431 82France, Paris, C. Banlieue 1987 256 i 75 e/Japan, Tokyo 1990 I 355 57Spain '
* Alicante 1987 267 16* Murcia 1992 268 33
UK (average) I1990 136 1 18USA (average) 1984 666 89
N/A = data not availableNote: One connection serves more than one housinLg unit.
a/ 1.3 units/water connectioni d/ 1.1 units/water connectionb/ 2.3 ullits/water connectioni e/ 3.5 units/water coinectionc/ 1.4 units/water connection

Water & Wastewater Utilities Operational IndicatorsSet I Page 3
A.2. WATER CONSUMPTION AND METERING
The effect of metering, as a proxy for price, on water consLImption is shown in the followinggraphs:
Water Consumption vs Metering
a) Canadian Utilities
Consumption, liters/day/capita
700
\ * ~~~~~~~~Line of best fit
600
500
400
0 20 40 60 80 100
% Metering
SoIure(: AWWA Water Util. Op. Data, 1985
b) Brazilian Utilities
80 ~Consumption (m 3 /m/c)
70
60
50
40 Line of best fit
30
20
10
20 40 60 80 1 00'%c, Metering
Sourcc: Catalogo Brasileiro de Engenharia Sanitaria e Ambiental. CABES. 1990..
Operational Indicators Water & ISWastewater UtilitiesPage4 Set I
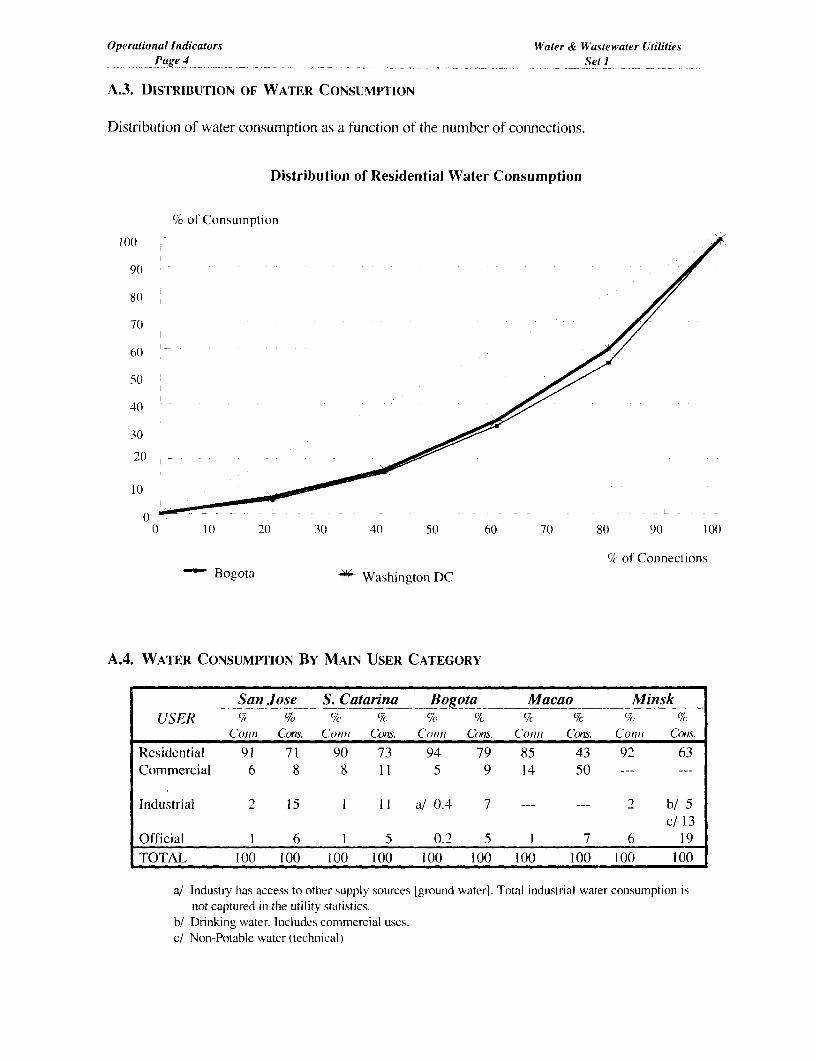
A.3. DISTRIBUTION OF WATER CONSUMPTION
Distribution of water consumption as a function of the number of connections.
Distribution of Residential Water Consumption
% of Consumption
9(
8(J
70
60
50
40
30
10
0) I 0 2(1 30 4(0 50 60 70 80 9( 100
% of ConnectionsBogota Washington DC
A.4. WATER CONSUMPTION BY MAIN USER CATEGORY
San Jose S. Catarina Bogota Macao MinskUSER % % / % % % % % % %
Conni Cons. Conn Cons. Con,ti Cons. Conii Cons. Con/l Coils.
Residential 91 71 90 73 94 79 85 43 92 63Commercial 6 8 8 11 5 9 14 50 --- ---
Industrial 2 15 1 11 a/ 0.4 7 2 b/ 5c/ 13
Official 1 6 1 5 0.2 5 1 7 6 19TOTAL 100 100 100 100 100 100 100 100 100 100
a/ Industry has access to other supply sources [ground water]. Total industrial water consumptioni isnot captured in the utility statistics.
b/ Drinking water. Includes commercial uses.c/ Non-Potable water (technical)

Water & Wastewater Utilities Operational InidicatorsSet I Page
A.5. RATIO OF PEAK DAY TO AVERAGE DAY (USA AVERAGE 1990)
Ratio Peak Day/Average
1.81 1.82 1.77
1.5 ' ... 8 - - -51.6 .6
1.5 ~ ~ ~ ~ ~ ~ ~~~~15
1.410- 25 25 - 50 50 - 100 > 100 Average (all cities)
Population Served (000)
Source: AWWA. Water Industry Database: Utility Profiles. 1992.
A.6.a WATER PRICE & INCOME ELASTICITIES
Investigator Price Elasticity In come CommentsElasticit
Neiswiadomy & Increasing Iblock structures. Random sampleMolina (1989) - 0.55 0.14 of 101 customers' monthly water use
records from the city of Denton. Ohio.Neiswiadomy & Average price under an increasing block rateMolina (1993) - 0.63 0.64 structure. Uses data from the 1984 AWWA
survey. USAChi-Keung Woo Average price. Uses monthly consumption(1992) -0.38 0.28 data collected for Hong Kong during 1973 -
1984.Marginal and average price. Uses 1984
Neiswiadomy -0.11 0.44 AWWA survey of 430 utilities. Reported(1992) -0.28 0.25(a) results correspond to the North Central
Region, USA.IWACO (1989) -0.29, - 0.33 0.40, 0.50 Monthly sales of metered domestic
consumers in Bogor, IndonesiaAverage water price. Cross-sectional
IWACO (1992) - 0.68 0.37 analysis of 100 households in Jakarta.Indonesia
Martin (1992) -0.70. - 0.60 0.18, 0.27 Average and marginal prices. Cross--0.49. - 0.32 0.04, 0.17 sectional analysis of 19,000 households in
urban and suburban Columbia. USA.Rizaiza (1991) - 0.48 0.11 Average water price. Cross-sectional
analysis of 400 households in Saudi Arabia.Hubbell (1977) - 0.48 0.36 Cross-sectional data for 230 households in
Nairobi, Ken'a
Note: (a) The variable is not statistically significant.
Operationtal Indicators IW'ater & Wastewater LUtilitiesPage.6 Set I
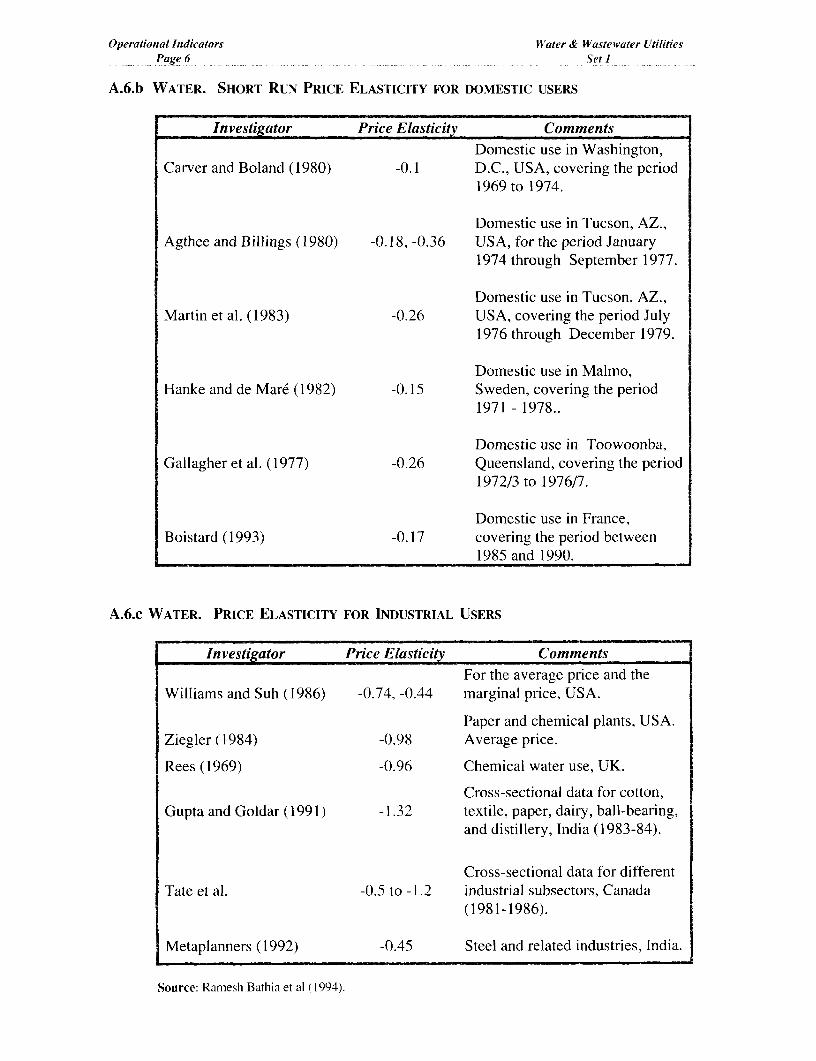
A.6.b WATER. SHORT RUN PRICE ELASTICITY FOR DOMESTIC USERS
Investiaator Price Elasticity CommentsDomestic use in Washington,
Carver and Boland (1980) -0.1 D.C., USA, covering the period1969 to 1974.
Domestic use in Tucson, AZ.,Agthee and Billings (1980) -0.18, -0.36 USA, for the period January
1974 through September 1977.
Domestic use in Tucson, AZ.,Martin et al. (1983) -0.26 USA, covering the period July
1976 through December 1979.
Domestic use in Malmo,Hanke and de Mar6 (1982) -0.15 Sweden, covering the period
1971 - 1978..
Domestic use in Toowoonba,Gallagher et al. (1977) -0.26 Queensland, covering the period
1972/3 to 1976/7.
Domestic use in France,Boistard (1993) -0.17 covering the period between
1985 and 1990.
A.6.c WATER. PRICE ELASTICITY FOR INDUSTRIAL USERS
Investigator Price Elasticity CommentsFor the average price and the
Williams and Suh (1986) -0.74. -0.44 marginal price, USA.
Paper and chemical plants, USA.Ziegler (1984) -(.98 Average price.
Rees (1969) -0.96 Chemical water use, UK.
Cross-sectional data for cotton,Gupta and Goldar (1991) -1.32 textile, paper, dairy, ball-bearing,
and distillery, India (1983-84).
Cross-sectional data for differentTate et al. -0.5 to -1.2 industrial subsectors, Canada
(1981-1986).
Metaplanners (1992) -0.45 Steel and related industries, India.
Source: Ramnesh Bathia et al ( 1994).

Water & Wastewater Utilities Operational IndicatorsSet) Page 7
B. WATER DISTRIBUTION SYSTEM
B.1. LENGTH OF WATER PIPED SYSTEMS
Length of the water distribution pipe system as a function of:
* the number of people served [meters/person],* number of coinections [meters/connection].
CountylCity Year Unit Length Unit Length(mtslperson) (mtlconnection)
Brazil (average) 1989 2.3 12.5 a/* Brasilia 1989 1.8 17.1 b/* Sa6 Paulo 1993 2.6 10.7Chile* Santiago 1994 1.6 8.7* Valparaiso 1992 N/A 11.3Colombia, Bogota 1992 1.4 8.0Costa Rica (average) 1990 N/A 11.6Togo (country total) 1990 9. 1 c/ 74.6 c/Philippines* Cabanatuan 1994 N/A 6.8Romania, Bucarest 1994 1.3 d/ N/ABelgium, Brussels 1991 N/A 9.8France, Marseille 1992 2.6 N/AGermany, Hamburg 1990 2.9 N/AJapan (average) 1990 4.1 11.8* Osaka 1990 3.9 N/A* Tokyo 1990 N/A 9.4Singapore 1991 1.6 5.5Spain* Alicante 1992 N/A 7.6* Murcia 1992 3.1 12.6USA (average) 1984 4.9 24.0
1990 6.4 N/A
Notes: a/ 1.3 units/connectionb/ 2.3 units/coninectionc/ Significant number of standposts (56% of population served).d/ 7%7v of population is served by standposts.

Operational Indicators Water & Wastewater Utilities13-e 8 _ Set I
B.2. STORAGE VOLUME
a) Storage volume in the distribution system expressed as:
* m'/person served.
* m'/water connection.
.ountiy/City Year Storage Volume Storage VolumeCountry/City Year m3 eso mleonnec
m3/person m/cne
Chile,* Santiago 1990 n.d. 0.7* Valparaiso 1992 0.5 1.9
Colombia, Bogota 1991 0.2 0.9
Mexico, Monterrey 1987 0.4 2.3
Belgium, Brussels 1991 n.d. 1.0
Canada (average) 1984 0.6 3.9
France, Bordeaux 1982 n.d. 0.8
Singapore 1990 0.4 1.2
Spain,* Murcia 1992 n.d. 0.7* Torrevieja 1992 0.5 1.9
USA (average) 1984 0.6 3.0
b) Storage volume as a function of population served USA 1/.
Population Served m3 /person('000)
10 - 25 1.08
25 - 50 0.87
50 - 100 0.82
100 - 500 0.80
500 - 1000 0.71
> 1000 0.55
1/ AWWA - 1984 water utility operating data.

Water & Wastewater Utilities Operational IndicatorsSet I Page 9
B.3. PIPE BREAKS
Number of pipe breaks per year per 100 kms of pipes in the water system.
A higher number is indicative of problems due to materials. installation. age. soil conditions,traffic and of inadequate maintenance.
Country/City Year Pipe BreaksBreaksi OOkmlyr.
Chile, Santiago 1994 31"
Colombia. Bogota 1994 187
Belarus* Minsk 1993 70* Gomel 1993 25Belgium, Brussels 1991 21
Singapore 1990 17
USA (average) 1990 17* Denver, Colorado 76-83 7* Oakland, California, EBMUD 73-82 16
Note: a/ Down from 39ih 1991.
B.4. PIPE BREAKS AS A FUNCTION OF PIPE MATERIAL
Infonration on different types of pipes materials. It is useful when designing, strategries toreduce physical water losses.
Pipe BreaksilOOkmlyr.Pipe Material __ __ _ __ ___
Densver EBMUD Bogota Santiago
A.C. 3.7 10.3 294 38Cast Iron 7.5 2.6 --- 23
Concrete 0.9 ---Ductile Iron 1.8 --- ---
Galv. Iron 35.5 5.6 --- ---
PVC --- --- 78 8
Steel 0.4 --- --- 6
Other Materials --- --- 58 ---
Average 6.8 16.8 187 31
Source: a/ Guiding Manual. Rehabilitation Criteria for Water mains. AWWA. 1986.

Operational Indicators Water & Wastewater UtilitiesPage 10 Set I
C. UNACCOUNTED FOR WATER (UFW)
C.1. WATER LOSSES
A major concern about operations of a water utility is the level of UFW. UFW reflectsthe difference between the volume of water delivered to the distribution system and the watersold. The level of UFW is considered a good proxy for the overall efficiency of operations ofa water utility.
UFW includes physical losses [pipe breaks and overflows] and commercial losses[meter under-registration. illegal use including fraudulent or unregistered connections andlegal. but usually not metered uses like fire fighting].
Unaccounted for water (UFW) is expressed as:. a percentage of net water production (delivered to the distribution system, % UFW).. as m/day/kmn of water distribution pipe system network (ml/day/km d.s.).
The average rate of UFW in the developing countries of this sample is 37%. more thantwice what is considered acceptable in industrialized countries (less than 20%). The highestrate is found in Bursa. Turkey, with 62% and the lowest in Abidjan. Ivory Coast with 17%.
Caution should be used in interpreting UFW data, however, as some reported UFWr atios are not more than gross estimates since full metering is not in place and utilities often donot adlhere to the definition given above.

Waler & Wastewater Utilities Operational IndicatorsSet I Page 11
UNACCOUNTED FOR WATER (UFW)
Count.ylCity Year Water Losses Water LossesCountry/City Year % UFW mnldaylkm d.s.
Brazil (average) 1989 39 42* Brasilia 1989 19 27 j* Sao Paulo Metrop. Area 1992 40 a/ 70* S. Catarina 1990 45 n.d.* Minas 1990 25 n.d.
Chile* Valparaiso 1990 41 n.d.* Santiago 1990 28 52
1994 22 44Colombia, Bogota 1991 40 135Costa Rica 1991 45 n.d.
Ivory Coast, Abidjan 1993 17 n.d.Algeria, Annaba 1992 35 n.d.Gambia, Banjol 1993 27 n.d.Guinea, Conakry 1993 53 n.d.Senegal, Dakar 1993 29 n.d.Ghana 1988 49 n.d.Morocco 1990 32 n.d.Nigeria
* Katsina 1990 44 n.d.* Kaduna 1990 41 n.d.
Togo 1990 22 7
Turkey* Bursa 1991 62 n.d.* Ankara 1988 45 n.d.
Pakistan, Karachi 1989 40 n.d.China, Changchun 1990 40 n.d.Philippines, Manila 1988 59 n.d.Thailand. Bangkok 1990 33 73
France, Bordeau 1982 15 n.d.Canada (average) 1984 15 16Japan (average) 1990 11 13
* Tokyo 1990 15 35Macao 1991 11 n.dSingapore 1994 6 9Spain, Murcia 1993 25 h/ 22USA (averag-.e) 1984 12 17
Notes: a/ LJp fhom 25% 'k in 1988.b/ Down from 45%: in 1989.

Operational Indicators Water & Waste water UtilitiesPage 12 Set)I ... ..... ..--- -------
C.2. COMPOSITION OF UFW
UFW is broken down by its two main components: physical [lpipe leaks and storage tankoverflows] and comm-ercial [meter under-registrationi, illegal connections. etc.]. A gooduniderstanding, of the relative weights of these com-ponents is a sine-qiua-non condition for thedevelopment of a sound program- to reduce UFW.
Composition of UFW (%)Country/City Year Physical Commercial Total
Singapore 1989 4 7 11
Spain, Barcelona 1988 1 1 12 23
Colombia, Bogota 1991 14 2)6 40Costa Rica, San Jose 1990 2 1 2 5 46
C.3 UFW EFFECTIVE REDUCTION PROGRAMS
linformation about four highly successful UFW reductionl pr-ogramis is presented hiere.These pr-ograms share one commonl approach: the initial effort was directed towards reducingcommt-ercial losses: users were idenitified, the commnnercial system (meter reading and billing)wvas revamped, defective mieters were replaced and the number of metered connections wassubstantially increased. ReduiCtion of leaks was also par-t of the UFW reduction program butsecondary to the reduction of commercial losses.
a) Macao & Murcia
UFW, Percent
45
40~~~~3
30 ------- -- - - - - - - - - - - - - - - -
t 24 ~~~~~~~24
2012
I'WI0 I 2 3 4 5 6 7 8
U Murcia U Macao Year of Program
Note: Mur-cia: Year 0 = 1988Mvacao: Year 0 = 1982

Water & Waste water Utilities Operational IndicatorsSet I Page 13
b) Singapore & Santiago
UFW, Percent30 29 28 276
25 2
20
.6
10 7- 7a 610:: ~~~~~~~*~~~' ~~6.7 6.4 6.0
5
0'1989 1990 1991 1992 1993 1994
* Singapore U Santiago Year of Program
C.4. SUSTAINABILITY OF UFW REDUCTION PROGRAMS
UFW levels can easily deteriorate when a tight control on operations and maintenanceand of the commercial system hard and software sub-systems that affect productivity levels, isnot maintained. In this particular case, the deterioration is due to a relaxation of policies andaccountability.
Evolution of UFW
a) Sao Paulo, Brazil, 1977-92
U FW . Percent40)
20
1"77 1979 1981 1983 1985 19 89 19)9 19 92
Y ear
Soarce: SA B ESP. Contract 085/92- C Rep.l. 03/93.

Operational Indicators Water & Waste water UtilitiesPage 14 _ _Set I
b) Bogota, Colombia, 1975-89
UFW, Percent50
45
40
35
30
25-
20
15 -10) CD Nl- co CD CD C\ CO LoIf CD N- co a)*n - N- X- N- °D OD C OD CD aD CD CD X CD
ou~~~~~r co co co a 0 a OD co 00 00 OD
Souirce: Yepes Guillermo, Infrastructure Maintenance in LAC. The Costs ofMaintenance Neglect and Options for Improvement. Vol. 3. June 1992.
D. WASTE WATER COLLECTION SYSTEMS
D.1. Length of Sewer Systems
Length of the sewerage distribution system as a fuction of:* the number of people served [meters of pipes/person],- number of connections [nmeters/connection].
Unit lengrth:
Country/City ] Year | mts/person mtslconnec
Brazil (average) 1989 1.6 11.1 a/* Brasilia 1989 1.2 11.9 b/
Chile * Valparaiso 1992 n.d. 9.8* Santiago 1990 1.4 7.5
Colombia, Bogota 1992 0.9 6.0
France, Bordeaux 1982 n.d. 10.1
U.K ,Wessex. 1991 n.d. 5.2
Notes: a/ 1.7 units/sewerage connection.b/ 2.4 units/sewerage connection.
D.2. Infiltration Flows in Sewer Systems
USA, EPA guidelines.... less than 500 gallons/day/ini-dia per mile(465 liters/day/cm-dia per km)

Water & Wastewater Utilities Operational IndicatorsSet I Page 15
E. WASTE WATER TREATMENTE.1. Typical Composition of Untreated Municipal Wastewater
1 Concentration Range bi: U.S.
Constituent al Strong Medium Weak Average c/
Solids (total) 1,200 720 350
Dissolved, total d/ 850 500 250
* Fixed 525 300 145
* Volatile 325 200 105
Suspended 350 220 1(0 192
* Fixed 75 55 20
* Volatile 275 165 80
Settleable solids, ml/L 20 10 5
Biochemical oxygen demand,
5-day20°C 400 220 110 181
Total organic carbon 290 160 80 102
Chemical oxygen demand 1.100 500 250 417
Nitrogen (total) 85 40 20 34
* Organic 1 35 15 8 13
* Ammonia 50 25 1 2 20
* Nitrite 0 0 0 0
* Nitrate 0 0 006
Phosphorus 15 8 4 9.4
* Organic 5 3 1 2.6
* Inorganic 10 5 3 6.8
Chlorides d/ 100 50 30
Alkalinity (as CaCO3) d/ 200 100 50 211
Grease 150 100 50
Total coliform bacteria 107-1(9 107-108 106-107 22x106 e/(no./ 100 mL)
Fecal coliform bacteria --- --- --- 8xl06(no./100 mL) l
Viruses, pfu/100 mL b/ - 500
Notes: a/ Values are expressecl in mg/L. except as rioted. d/ Values should be increased by amoLint in domestic waterb/ After Metcalf & Eddy, lic., 199 1. supply.
c/ CulIp et al.. 1979. e/ Geldreich, 1978.pfu= Plaque-fonning units/IOnL.
Source: Water Reuse. Assessment Repoit Project 92 WRE-1. Enviro-nmeint Research Founldationi 1994.

Operational Indicators Water & Wastewater UtilitiesPage 16 Set I
E.2. Typical Constituent Removal Efficiencies for Primary and Secondary Treatment
A verage Percent Removal
Constituent Primary Secondary Treat!entTreatment Activated Sludge Trickling Filter
BOD 42 89 69
COD 38 72 58TSS 53 81 63
NH 3 --N 18 63
Phosphorus 27 45
Oil and grease 65 86 ---Arsenic 34 83Cadmium 38 28 ---
Chromium 44 55 5
Copper 49 70 19Iron 43 65 56Lead 52 60 46Manganese 20 58 40Mercury I1 30 16
Selenium 0 13 0
Silver 55 7Zinic 36 75 5
Color 15 55 56Foaming agents 27Turbidity 3 1
TOC 34 _ _ _ _ _ _ _ _ _ _ _ _ _ _ _ _ _
Source: Water Reuse. Assessmient Repoil ProJect 9' WRE-I. Environment Research Foundation 1994.
E.3. Removal of Microorganisms
Expected Removal of Excreted Microorganisms in Various Wastewater Systems
Treatment Removal (log 10 units)
Process ' Bacteria Helminths Viruses Cysts
Primary sedimentation
Plain (0-I 0-2 (-1 0-1
Chemically assisted( 1 2 10 (h1 (_-I 0-1
Activated sludge(c' 0-2 0-2 (-I 0-1
Biofiltration(d) 0-2 0-2 ()-I 0-1
Aaerated lagoon(dl 1-2 1-2 0-1
Oxidation ditch 1-2 0-2 1-2 0-1
Disinfectione' 1 6ih) 0-1 0-4 0-3
Waste stabilization pondsr' 16h) 14 h) 1-4 1-4
Effluent stoage r 1-4 1-4
Notes: (a) Conventionial filtration is not included among the processes in the originial table.(b) Furthier reseatch is needed to confiriml performance.(c) Including secondary sedimentation.
(d) Including settlitig pond.
(e) Chlorinationi or ozonation.(f) Perforniance depends on number of ponds in series and other environmental factors.(gI) Performanice depends on retenitioni tine, which varies with demand.(h) With goocd designi and proper- operation, the recommended guidelinies are achievable.(i) A log 10 removal represenits a 90 percent reduction: 2 log 10 unlits represents 99 petcent
removal.
Source: E.P.A. ManItLal Guidelines for Water Reuse, Sept. 19922.

Water & Wastewater Utilities Operational I ndicators
Set I Page 17
F. PERSONNEL
F.1. NUMBER OF STAFF
Number of staff as a function of:* staff per thousand water connections (W/000) or per thousand water plus sewerage
connections ([W + S]/000).* thousands of im of water sold per year per staff (m'[000]/staff).* kns. of pipes in the water supply system per staff (km/staff).* personis served [thousands] per staff (PS [000]/st).
Staff Ratios
Country! City Year W/000 W+S/00 00OOM3 staff kinlstaff 000 PS/st0
Belarus
* Minsk 1993 n.a. n.d. 56 n.d. 0.7
* Gomel 1993 n.a. n.d. 20 n.d. 0.3
Belgium, Brussels 1 992 3.2 n.d. 105 3.3 3.0
Brazil (average) 1989 6.5 5.0 47 1.9 a/ 0.8
* Brasilia 1989 13.5 7.1 54 1.3 b/ 0.7
* Sao Paulo 1993 5.1 3.1 n.d. 2.1 0.8
Canada (average) 1984 2.0 n.d. 424 n.d. 1.7Chile, Santiago 1990 2.1 1.1 191 4.1 2.5Colombia. Bogota 1994 3.6 1.8 106 1.1 1.7France, C. Banlieue 1987 4.5 n.a. 200 n.d. 2.2Guinea (average) 1993 15.0 n.d. 8 n.d. n.d.
Ivory Coast (average) 1995 I 4.8 n.d. 22 n.d. n.d.Japan (average) 1990 1.7 n.a. n.d. 7.0 1.7Macao 1991 2.2 n.a. 148 n.d. n.d.
Mexico, Monterrey 1987 4.1 2.2 86 2.2 1.5
Romania, Bucharest 1994 n.a. n.d. 75 n.d. 0.5
Senegal (average) 1993 8.6 n.d. 13 n.d. n.d.
Spain
* Alicante 1987 1.1 0.6 170 i.d. 1.9
* Murcia 1992 2.5 n.d. 165 4.9 1.6
Togo 1990 2 22.4 n.d. 26 3.3 0.5
Turkey, Bursa 1992 4.6 n.d. 40 0.4 0.9
USA (average) I 1990 1 2.7 n.d. 370 8.6 1.5
n.d. = data not available:na.a. = not applicable.Notes: a/ 1.3 water Lllits anic 1.7 seWerage units per conilection.
b/ 2.3 water unlits and 2.4 sewerage UllitS per connectioni.

Operationtal Indicators Water & Wastewater UtilitiesPage 18 Set I
F.2. STAFF COMPOSITION
CategorylLevel
Country/City, Percentage of Labor Force
Management Professional Clerical Blue Collar
Brazil (range) 0.1 - 0.4 7 - 9 17 - 44 46 - 76
* Brasilia 0.2 12 24 64
Chile, Santiago 3 18 37 42
Macao 25 75
F.3. TRAINING EFFORT
Country/City Year Training
Chile, Esval-Valparaiso 1992 41% staff trained/yr1.2 days/staff/yr
France, C. Banlieue 1987 4% of salaries
G. MISCELLANEOUS INDICATORS
G.1. VEHICLES/1000 WATER CONNECTIONS
This indicator includes all types of vehicles used in the operation and maintenance of theutility's system. When the utility also provides sewerage services the subscript (w + s) is addednext to the figure.
ComntrylCity Year Vehiclesl/ 000 connec
Spain,* Muicia 1992 0.9 (w)* Alicante 1992 0.6 (w)
Chile, Valparaiso 1992 0.4 (w+s)
Washington, WSSC 1992 0.6 (w+s)_~~~~~~ __

Water & Wastewater Utilities Operational IndicatorsSet I Page 19
G.2. METER READING
Number of consumiiption meters read per day per reader.
Count,ylCity Meters read per day/reader
Spain, Murcia (1992) 215
France (1986) 80 - 00
G.3. METER MAINTENANCE & REPLACEMENT PRACTICES
Country Meter Replacement in Years
Macao (1991) 15
Singapore (1991) 7 (domestic)4 (large)
Country Meter Testing ReplacementDiameter (") Years Diameter (") Years
USA (1984)a/ 5/8 -- 3/4 9 5/8 -- 3/4 17(average) 1/ 1 7 1 16
4 4 4 13
6 3 6 12
8 3 8 11
1/. Meter costs are coming down. Therefore, in many cases it is most cost-effective to replacemeters than to repair them.
Source: a/ AWWA. opus cit.


INDICATORS2nd EDITION
WATER & WASTEWATERUTILITIES
SET 11
FINANCIAL INDICATORS
£'I>


Water & Wastewater Utilities Finanicial Indicators
Set 2 Page 21
INTRODUCTION
Only a selected group of financial indicators is presenited in thlis report. since the objective isnot to overwhelm the reader with information that, in most cases, is unlikely to be of relevance.
The technique of ratio analysis is a useful tool to analyze a utility's financial position. Ratioindicators presented here provide information about efficiency and operational performance, creditworthilness and liquidity and profitability. As such they provide insight into areas that merit furtherinvestigation but they do not. in themselves, provide definitive answers on the financial conditioni ofa given utility. Some ratio indicators, such as contributioni to investmenit and rate of retunn, can bevery volatile fi-om one year to the next. Therefore, to present a more realistic picture. they have beencalculated as an average over an arbitrary three year period. Otherwise, the indicators reflect a oneyear perfonniance. based on information available between 1988 and 1994.
The utilities represenited in this paper are from Latil America, Africa, EuL-ope/Cential Asia,andl South and East Asia. Sources of the data collected are recent Staff Appraisal Reports. ProjectCoompletion Reports and the utilities' annual financial reports. The sainple was selected taking intoconsideration diversity in geographical location, type and size of the utilities and service providedby them. Not surprisingly. complete information needed to calculate all ratios was not available forall the utilities. Therefore, some of the tables and graphs present infomiation only of a selectedgroup of utilities.
For the purpose of comparison. infomiation of W&S utilities in industrialized countries ispresented in certain graphs and tables. Unfortunately, pertinent financial information availablefrom these utilities is often consolidated thus making it impossible to obtain many of W&Sfinancial indicators reported here for other utilities.
All monetary values are expressed in US dollars. The exchange rates used for conversionare the average annual exchange rates for each coulitry as reported by the Intemnational FinanceStatistics of the IMF.

Finiancial Indicalors Waler & Wastewaler UtilitiesPage 22 Set 2
A. EFFICIENCY INDICATORS
A.1. WORKING RATIO (WR)
The WR is the ratio of operating costs to operating revenues. Operating costs in this ratioexclude depreciation and interest payments (but no debt service paymenits), a key difference withthe Operating Ratio (OR) that includes these costs. Operating revenues remain the same flor bothratios. They include revenutes from water and sewerage tariffs, connection fees, well abstractionfees and re-connection fees.
Working Ratio and Operating Ratio
3 2.5 2 1.5 1 0.5 0 0.5 1 1.5 2 2.5
0.47 0.19 Pusan
0.56 0.25 Kwangju
0.55 0.29 Morocco
1.06 0.38 Taejon
0.52 0.40 I Manila
0.49 0.43 Sao Paulo
0.75 0.47 Seoul
0.74 0.53 Santiago
0.71 0.58 Ankara
0.89 0.65 Valparaiso
0.73 0.66 Bogota
0.71 0.67 S.Catarina
0.76 0.68 I Minas Gerais
0.92 0.73 Costa Rica
1.21 0.73 Ghana
0.78 0.78 Karachi
1.21 0.81 Bursa
1.01 0.86 Annaba
0.93 0.86 Oran
0.95 _0.89 Changchun
2.47 1.43 2.30 Kaduna
| 2.55 2 Katsina
*Operating Ratio *Working Ratio

Wlater & Waste water Utilities Financial IndicatorsSet 2 Page 23
Soulid finanicial management requires the WR to be well below 1. About 30% of theutilities have a WR lower than 0.50. and two utilities (9%) have a ratio larger than 1. The fourKorean sewerage companies are among the utilities that have a WR lower than 0.5. Otherwise, itdoes not seem to be any signiilicant difference in working ratios between companies that provideW&S services and those that provide only one of these services.
Caution should be used in interpreting this ratio when there is evidence that utilities arecuttinsg down on maintenance costs which would improve the WR but could lead to criticalsituationIs in the future.
A.2. OPERATING RATIO (OR)
The OR is the ratio of operating costs to operating revenues. In this case, operational costsinclude all the expenses together with depreciation and interest costs (but no debt ser-vicepayments).
Sound financial management requires that this ratio should also be less than 1. Nine utilities(41 %') have an OR less than 0.75, 32% an OR between 0.75 and less than I and 27% an OR greaterthan 1. The latter utilities, as in the case of Ghana and Nigeria. must rely on -ovemimient subsidiesto cover their operational expenses.
The same cautionary note made to the WR applies to the OR. In addition. caution should beexercised when assets are not revalued and therefore depreciation charges do not give a realisticvalue or whenl revaluation of assets is not consistently applied.
There does not seem to be any sigiificant difference in ORs between companies thatprovide W&S services and those that provide only one of these services. Interestingly enoughi mostof the utilities that have an OR larger than 1. also have an average UFW ratio larger than 40%c.

Financial IndicalorsV Water & Wastewater UtilitiesPage 24 Set 2
A.3 ACCOUNTS RECEIVABLE/COLLECTION PERIOD (CP)
This indicator, expressed in montlh equivalent of sales, is the ratio between the year-end accountsreceivable and operating revenues, multiplied by 12.
Of the 22 utilities with information on accouLnts receivable, 41 % have collection periods of less than2 months, 20% between 2 and 4 montlhs, and 30% more thani 4 months.
When the CP is increasing the company' cash flow can be in jeopardy. This is specially of concemnin countries where inflation is high. where no charges are levied against late payment or when thesecharges do not reflect the financial cost of borrowing money.
Poor collection efficiency is mostly blamed otn consumers, and in some cases in particular- on publicsector agencies. However, the water utility may also be at fault for delayed and faulty billings,inadequate responses to consumer's queries on billings, and a lukewann effort to collect overdueaccounts. A common factor found among the utilities with poor collection efficiency is the lack ofa clear policy to promote and entforce prompt payment (like disconnecting the service to consumerswitlh ari-ears of more thani 2 to 3 mloniths).
Accounts Receivable/Collection Period(Months equivalent)
Kwangju 0.8
Changchun 0.8
Pusa 1.1
Minas 1.1
Seoul 1.2
Brussels 1.2
Taejon 1.4
SCatarn. 1.5
Sev.Trent 1.9
Sao Paulo 2.7
Bursa 2.8
Valpars. 2.9
Santiago 3
Bogota 3.3
C. Rica 4
Ankara 5.1
Manila 6.3
Karachi~~~~~~~~~MNMMM 7.6X
Ghana 8.
Annabal.9i
Oran 9.9
Morocco _10.8|
-- -T 1 1 - R 10 '~~~~~~~~~~~~~~~~~~~~~~11

W!ater & IVaste water Utilities Financial IndicatorsSet 2 Page 25
A.4. PERCENTAGE CONTRIBUTION TO INVESTMENT (CTI)
The percentage contribution to investment shows the proportion of capital expenditures financed bythe net internal cash gener-ated by the utility. This ratio is often calculated on a yearly basis andtherefore depends oni the annual cash flow of the utility. As a consequence the CTI ratio. calculatedon a yearly basis, can vary widely. Thus, to present a more balanced picture, the CTI has beencalculated as the cash contribution over an arbitrary three year period.
To provide a sense of the magnitude of investmiients, this ratio is contrasted with the relative valueof new investments to fixed assets over the same period. In general, the data suggest, and notsurprisingly, that utilities with relatively large investments have lower CTI ratios.
For the utilities with infonnation available, the overall average contribution to investment rate is40% and the investment over net fix assets is 13%. Twenty five percent have a negative or 0 CTI.35% have CTI of less than 30%, 25% between 30 and 50%. and 15% CTIs larger thanl 50%.
Percentage Contribution to Investment
-40 -20 0 20 40 60 80 100 120 140
Santiago; _ 8.8: 124.3 i
Bursa, 90.3
Annabai _-7.2 61.7
Valpars. 8 37.6
Manilaj 1 34.8
Ankara i 33.4- ~~~~~31.2Minas Q_ 3.
Seoul _3 0S.Catarin.; _16. 29.4
KwangjuC 22.3
Pusan i 44!Taejonj 17Bogota 13C. Rica! 11.2
Changchun; _ 35.9
Katsina! 15.8
Kaduna! 0 s 1.3
Morocco ml 20
Sao Paulo! -15.8 14.4
Sev.Trent -2417.0
Oran! 1.7
* Net Cash genr./Invs. * Inv./Avg.Net F. Asst

Financial Indicators Water & Wastewater UtilitiesPage 26 Set 2
B. LEVERAGE INDICATORS
B.1 DEBT SERVICE COVERAGE RATIO (DSC)
The debt-service-coverage ratio measures the extent to which internal cash geinerationcovers total debt service.. As with the CTI indicator, the DSC has been calculated as the average ofthe last 3 years of information available.
Thirty three percent of the utilities in the sample have a DSC less thani 1; that is, their cashgeneration is not adequate to cover debt service obligations. 28% have a DSC between I and 2 and38% a DSC larger than 2.
Pusan
Bursa 997 16.6
Valparaiso 7.35
Ankara
Santiaqo =
Taejon 2.84
Kwanqiu
Seoul
Annaba
Minas 1.8
Manila -Boqota
C. Rica _
S.Catarina 1.2
Morocco *
Oran
Sao Paulo * 0.7
Katsina PKaduna P
-1 0 1 3 5 7 9 11 13 15 17
The last two utilities in the graph show a negative ratio.

Water & Wastewater U'tilities Finanicial IndicatorsSet 2 Page 27
B.2 DEBT EQUITY RATIO (DER)
This ratio is defined as Total Debt/Equity. The average DER for the sample of utilities is 0.40which is considered quite acceptable: 29% of the utilities show a debt situation that is highlyleveraged (over 0.50 and up to 1.50).
Two water utilities in industrialized countries, Severn Trent in England (private) and the waterutility of Brussels (public) both report a DER of 0.25.
Not surprisingly, when comparing Graphs 3, 4. and 5 we find that utilities with the highest debtservice coverage ratio also have the lowest debt equity ratio.
DER is also affected by the revaluation of fixed assets and therefore caution should be exercisedwlhen using this ratio.
Bursa *0.05
Valparaiso
TaeionSantiaaO 0.06
Chanachun
PusanSeoul 0.14
GhanaKwanaiu
Sev.Trent
BrusselsMorocco 0.27
AnnabaAnkara
C. Rica 0.34
Manila
BoaotaMet. Australia
KarachiSao Paulo 0.70
S.CatarinaOranMinas
Kaduna. 1.5
0 0.2 0.4 0.6 0.8 1 1.2 1.4 1.6

Financial Indicators Water & Wastewater UtilitiesPage 28 Set 2
C. LIQUIDITIY INDICATOR
C.1. CURRENT RATIO (CR)
This ratio is computed by clividing curTent assets by current liabilities. Current assetsinclude cash, accounts receivable and inventories. The CR measures the short-run payingability of the utility.
From the data we obseive that 75% of the utilities have a curTent ratio of less thanone. e.g.. most do seem to have short-tenr liquidity problems. However, this observationshould be taken with caution as this ratio does not provide infonration on utility's capacityto pay and collect its bills promptly. Such is the case of Ghania, for examliple. whichi has aCR of almost 2 and a collection period of 8 monthis.
Bursa I1n.6
Seoul
Pusan
Taejon 4. 4
Valparaiso
KwangjuI:::
Santiago I 1.9
Ghana
S.Catarina
Changchun 1.5
Annaba
Manila
Karachi 1.2
Ankara
S.Paulo St.
Costa Rica 0.9
Sev.Trent 0.82Oran
Morocco
Bogota 0.3
Minas _ _
0 2 4 6 8 10 12

Water & Wastewater Utilities Finanzcial Indicators
Set 2 Page 29
D. PROFITABILITY INDICATORS
The ratios examined thus far provide some information about the operations of the utility.Profitability ratios on the other hand show the combined effects of liquidity, asset management anddebt management on operating results.
D.1. RETURN ON NET FIXED ASSETS (RR)
This indicator measures the productivity of fixed assets in use, expressed as the ratiobetween net operating income and net fixed assets. The RR has been calculated as the average overa three year period.
The median RR of the 18 utilities is 3%: 29% of the utilities report a negative RR. another29% a RR between 0 and 5%, 27% a RR between 5 and 10% and 13% a RR higher than 10%.
However, we should be cautious when comparing this ratio since it runs into the problenimentioned before related to the revaluation of fixed assets. In addition, it is not uncommon toobserve that it would be in the interest of an utility to undervalue its fixed assets in order to meet orshow a higher RR target. On the other hand, it is also quite common to find in balance sheets anaccount "work in progress" which very often includes a large portion of works completed but whichare not included in the RR calculation. For instance, EAAB-Bogota reports 17% of its fixed assetsas work in progress, while EMOS-Santiago reports 5%.
S.Catarina i 20.0Ankara ' -!11.9
Sev.Trent 1 1.0Oran - 8.0
Manila 8.0Sao Paulo 7.0Santiaqo 7= 0Annaba 7.0
Pusan I= .3BogotaMinas 5.0
Morocco O 2.9Seoul 2.6
Kwanqiu _2.2C. Rica _1.6
Brussels 1.5*Valparaiso l
*Taeion*Chancchun
Bursa -1.6Ghana -2.4
Kaduna -11
Katsina _
-25 -20 -15 -10 -5 0 5 10 15 20
Percentaqe* Slightly negative.

Financial Indicators WVater & Waste water Utilities
Page3O Set2~~~~------ --- I,.,~1~-.~-,,~-.-"-,,-..".---"--,~-,,.--",-,- --------- e
D.2. RETURN ON EQUITY (RE)
Return on equity shows the return to the owners, expressed as the relationship between netinicome (net income after interest paymients) and equity (total assets minus liabilities). As for the RRthe RE has been calculated as thie average for three years. The RE also suffers from the problemsassociated with the revaluation of fixed assets which would lower the value of equity which in turnwould increase the RE.
The mediani RE is 0%; 58% of the uitilities show a negative RE. 8% a RE between 0 and 3%and 25% a RE between 3 and 10%. Only two utilities shows a RE larger than 10%.
The RR anid REs behave, in general, in a similar way. However, five utilities (Kar-achi, SaoPaulo, Minas. Orani and Morocco.) shiow completely opposite reSuIltS in both ratios. This isexplained by its low contribution to investment ratio and thus a high debt to equity ratio.
Sev.Trent jAnkara 1.
S.Catarina 8
Pusan 6.
Manila 6.5
Boqota 6.3
Santiaqo~ Annaba
Seoul
Kwangiu 100.5
*Valparaiso*Chanqchun
'C. Rica
*Taejonp
Morocco d1o3Bursa 16
Oran -
Ghana -3.3 -Sao Paulo -7
Katsina -10.2
Karachi -14.2 IMinas -21 J
Kaduna -2 i__-30 -25 -20 -15 -10 -5 0 5 10 15
Per-centage
Sligrhtlv negative.

Water & Wastewater Ltilities Financial IndicatorsSet 2 Page 31
E. OPERATIONAL RATIOS
E.1. PERSONNEL
E.1. 1 PERSONNEL COSTS
Personnel costs are expressed as a ratio to total operating costs (depreciation and debt serviceexcluded). Depreciation and debt service are excluded due to lack of unifonnity in treatingrevaluation of fixed assets and to facilitate comparison of utilities with and without debt serviceobligations.
As indicated in Infrastructure note W5 - 12 (Annex 2), staff productivity index (See E.1.2below) and personnel costs related to operational costs should be examined simultaneously.
Personnel Costs vs. Operating CostsPercent
70
60
50 -
40
30
20
Germally Fiance G.Britain Spain Japan C'oloniibia Bazil C. Rica Mexico Tunkia lTurkey Thailand Nepal
E.1.2 STAFF PRODUCTIVITY INDEX (SPI)
This ratio is an important measure of the efficiency of a water and/or sewerage utility. Itrelates the number of staff with the number of connections.
Sixty percent of the utilities with W&S services have a SPI of 4 or less ([w + slconnections). 20% between 4 and 7 and 20% more than 7. The SPI for utilities in some Africanutilities, that only provide water services is extremely high (over 30 [wj conniection). The foursewerage utilities of Korea. on the other hand, have very low SPI's of under 2 ([s] connection).
As a guideline, it would appear that a SPI of less than 4 could be considered adequate butstill with room for improvement.
In some cities, particularly in Eastern Europe. residential consumers live in large apartmentbuildings where consumption in apartments is not individually metered. In similar circumstances,the practice in Brazil is to report simultaneously the number of apartments (economifus) and thenumber of connections. In these cases this SPI index may not be particularly meaningful.Alternative indicators, to handle this situation, can be found in Set I, Section F. 1.

Financial Indicators Water & WVastewater UtilitiesPage 32 Set 2
It is also important to remember that a reduction in the SPI ratio cannot necessarily beinterpreted as an increase in efficiency. To complete the analysis of staff productivity, as mentionedpreviously, expenditures on personnel also need to be examinled (personnel costs as a % ofoperational costs). There have been cases of utilities with staff/connection ratios decreasing whilestaff costs, in proportion to operating costs. are incr-easinig as slhowin in Graplh 1. In addition, it isalso important to examine the staff composition which might show important imbalances orinadequate number of qualified middle-level managers and technical staff.
Not surprisingly, utilities with large personnel costs show a low contribution to investmentsand a low debt service coverage ratio (Set It A.4 and B. I). such as in Sao Paulo and Costa Rica.
Number Staff /000 Conn.11' % Personnel Costs/ Oper. Costsh
Water & Sanitation Utilities:32.0
Ghana 36.613.7
Manila 47.8
C. Rica 6.1 64.3
Ankara 3.5 36.0_ _ _ _ _ _ _ _ _ _ _ _ _ _ _ _ _ _ _ _ _ _ _ _ _ _ 6 9 . 0
S. Paulo 4.171.3
S.Catarina 6.0BLirsa 2. 71.1~
I f ~~~~~~~~~~~~~~~76.11Bogota, .BW70t ~2.0K
Valparaiso 1.8 46.1
SantiaeoI ' L1.1 I 54.5
Onlv Water Utilities:38.0
Kaduna3 17.433.0 t i
Katsinza 26.330.8w 64.1 '
Annaba _ 64.1
Oran 11.0 55.2
Chanigcehunl 1 8.0 _ 11.1
I l Only Sewerage Utilities:
Pusan 1.7 35.9
Seoul 1.6 36.0
Tae.jon 1.4 * 24.4
Kwangju 1.7 U 56.7
10 5 0 20 40 60 80
Notes: a/ Iicludes water and sewerage connections tor W&S Utilitiesbt/ Opelatiolnal Costs eXclUde Depreciationi and Debt Service.

WVater & Waste water Utilities Financial IndicatorsSet 2 Page 33
Graphic INumber of Staff/'000 Connections vs.
Personnel Costs/m3 SoldBogota (1982-1991)
140 Personnel Costs/rn sold Staff/lOQO water connections 6
120 _ _ _ 5
100 ~^ ~ - - -~ 4
80 3
60 2
40 11982 1983 1984 1985 1986 1987 1988 1989 1990 1991
Year
Personnel Costs 0 Staff/'000 water connections
E.2 COMPOSITION OF OPERATIONAL COSTS
The two main categories of operating costs are often personnel and fuel/energyconisumptioni. Other operating cost components include chemnicals, mainitenance and miscellaneous.Depreciation charges are not included.
Bogota
S.Catarinaom
Bursa
Sao Paulo
Costa Rica
Kwangju
Minas
Manila
Valparaiso
Ghana
Ankara
Pusan _Katsina
Tae jon
Kaduna
Changchu___ i
0% 10% 20% 30% 40% 50% 60% 70% 80% 90% 100%
* Personnel * Energy 0 Other

Finiancial Indicators Water & Waste water Utilities
P 34 ~~~~~~~~~~~~~~~~~~~Set 2
Range of Operational Costs
Low Value Average Value High Value
Personnel 11.1 % 46.0 % 73.4 %Energy 5.3 % 18.4 % 44.0 %Other 11.5 % 35.6 % 6-3.6%
No information is available for industrialized countries for comlparison purposes. BecaulSeoperating, costs are utility specific and given the paucity of data at this time, any further elaborationat this point is not warranted.
E.3 UNIT OPERATIONAL COST (UOC)
Unit operationial cost (operational costs"' / nm' produced) var-ies fromn US$0.05 per cubicmieter in Karachi and Changchun to US$0.31 per cubic myeter in Minas Gerais. About 28% of theutlities have an UOC below 10 cents per cubic meter. 44% an UOC between 10 and 20 cents per
cubic meter. and 28% an UOC of 20 cents or higher.
Contrary to what could be expected. we do not see evidence, in this sample, thlat largeutilities have lower UOCs. This could be explained, in part, by specific site conditions and by widevariationis of domestic costs anid price levels in the different countries. We believe, however, thatmajor differenices in UOC can be explained by the quality of ser-vice provided by the utilities.
US$ Unit Operation Cost IliX M3 Produced
0.31
0.30-
0.26
0.2 5 -0.24
0.20 -0.20
0.15 -0.14 0.140.11 ~~0.12 0.12 0.10.12
0.10 - ~0.11 0.110.10.09 0.090.0
0.05 - ~~~~~~~~~~~~~~~~~0.05 0.05
0.05
0. 0 B .
Excluding depreciation.

INDICATORS2nd EDITION
WATER & WASTEWATERUTI LITI ES
SET III
OVERVIEW OFTARIFF RATES
AND STRUCTURES


Water & Wastewater Utilities Overview of Tariff Rates and StructuresSel 3 Page 35
OVERVIEW OF TARIFF RATES AND STRUCTURES
A. 1 BACKGROUND
An overview of water and sewerage tariff rates and structures, from a sample of 9cities' believed to be representative of practices in developing countries. is presented in thissection. This overview provides some insights into how rates are structured and offers somerecommendations (based on hypotheses that need further testing), into the problems suchstructures may be causing and pitfalls to avoid. This overview is thus a complement to theset on1 financial ratios but is not intended to be a thorough discussion of pricing issues.
An understanding of the implications of tariff structures and of the possibledistortions that they may be causino is an important step in the design of an strategy andaction plan to improve the financial position of a utility based on sound economicprinciples.
A. 2 TARIFF STRUCTURE
Satisfactory tariff levels must provide adequate funds to meet operations, debtservice and capital expansion requirements. Tariffs should also encourage efficiency in theuse of resources; and many would argue. on fairness grounds. that the tariff structure shouldmake these services affordable by the poor. Reconciliation of all these objectives remains anelusive task.
All tariff rates, except Singapore and Ankara. reviewed hele have two components:a fixed charge and a volumetric charge (related to consumptioll). The first is often intendedto cover the fixed costs of the utility and the second the variable ones. In addition, mosttariff rates are progressive. e.g., the volumetric charge increases as consumption increases.
Rate progressivity is often the result of the decision to provide a cross-subsidy fromsome, presumably wealthy, groups to other groups with a more limited capacity to pay (thepoor, schools. hospitaLls, etc.). More recently, rate progressivity has found its defendersamong those interested in promoting water conservation. Whatever the argument.progressivity introduces economic distortions in the use of water, which need to be but areoften poorly understood. In addition, low rates often discourage utilities from reacling thepoor or reducinCg UFW.
Most utilities in the sample have also flat charges, independent of consumption.either by design or fiat (when meters are not installed or operative) to deal with non-meteredconsumption. None of the utilities in this sample fully meters consumption.
In all documented cases here, sewerage charges are a fixed percentage of the watercharges. These charges range from a low 18% in San Jose to 100% in Santa Catarina. The
Ankata. Bogota. Ghana. Manila, San Jose, Santa Cataritna, Sao Paulo. Singapore and Seoul.Sources for the data on water tarifts are Staff Appraisal Reports and fronm the Asian Development Bank publication"Water Utilities Data Book" (for Singapore. and Seouil.

Overview of Tariff Rates and Structures Water & WVaste water UtilitiesPage 36 Set 3
average lies around 40% to 50%2 . In some cases, like Ankara, the tariff charged for wateralso covers sewerage services.
A. 3 DOMESTIC TARIFF
All the utilities in this sample have a progressive tariff structure (normally 3-4 blockrates up to about 60 m' of consumption per month per connection-m3 /m/c). Rateprogressivity applies also to non-residential users.
As shown in Graphs A, B, C and D, we find that:
there seems to be little consistency in how consumption block intervals areestablished;
* all utilities offer a subsidized base line consumption. intended to benefitsome residential users. This base line is in the range of 5 to 20 m3/m/c;
* relatively high fixed charges imposed on base line consumption often negatethe subsidy intended (Graphs F, G. and H). Fixed-charges are also applied tonon-residential users, but most often they are set at higher levels;
* if 2Om3 per month is taken as a reasonable household consumption indeveloping countries, household payment for this volume ranges from US$2to US$12 per month. As a way of comparison, households in someEuropean cities pay for this consumption (1991): US$2.60 in Milan,US$5.40 in Rome. US$14.40 in Paris. and US$29.60 in Brussels (Table 3):
for unmetered connections. the utility often makes an estimate of themonthly consumption based on past consumption patterns or other criteriaand charges a corresponding, de facto, fixed charge.
- It should be noted that the outcome is that incremental costs of seweraee. which are 1.5 to 3 times those of water. areeven less well covered bv user charges than water supply costs.

Water & Wastewater U'tilities Overview of Tariff Rates and StructuresSet 3 Page 37
Table 3
Comparison of annual water charges in industrialized countriesfor a family of four in a house and consuming 200 m3/year [137 liters/capita/dayl
(prices in 1991 US dollars)
Charge Charge ChargeCountry/City US$/m Country/City US$/m3 Country/City US$/m3
Austria Germany Luxembourg* Linz 0.64 * Berlin 1.00 * Luxembourg 1.34* Salzburg 0.99 * Dusseldorf 1.56* Vienna 1.07 * Frankfurt 1.66 Netherlands
* Gelsenwasser 1.95 * Amsterdam 0.94Belgium * Hamburg 1.59 * The Hague 1.17* Antwerp 0.68 * Munich 1.05 * Utrecht 0.57* Brussels 1.48 * Stuttgart 1 .79* Liege 0.93 Spam
Hungary * Madrid 0.84Denmark * Budapest 0.21 * Barcelona 0.90* Aarhus 0.72 * Miskolc 0.72 * Seville 0.51* Copenhagen 0.60 * Pecs 0)8 * Alicante 0.46* Odense 065* Murcia 0.98
ItalyFinland * Bologna 0.49 Switzerland* Helsinki 0.94 * Milan 0.13 * Beme 0.63* Tampere 1.01 * Naples 0.62 * Geneva 2.12
* RomeO.7 Zuih16France * Turin 0.27 1.63* Banlieue/Paris 1.46 0.25 United Kingdom* Lyon 1.52 Japan * Bristol 1.23* Marseille 1.52 * Nagoya 041 * Cardiff 1.72* Nice 1.51 * Osaka 0* London 0.88* Paris 0.72 * Sapporo 0.25 * Manchester 1.29
* Tokyo 0.57 * Newcastle 1 .37* Yokohama 0.45 Upon Tyne
0_0.41 L _ _ __
Low Value (Milan) US$ 0.13 /m3
Average US$ 0.96 /m3
High Value (Geneva) US$ 2.12 /m'
Notes: a/ Average b/ Metered Consumption

Overview of Tariff Rates and Strutetures Water & Wastewater U.tilitiesPage 38 Set 3
A. 4 AVERAGE CHARGES AND AVERAGE INCREMENTAL COST
Information oni rate structuLre, average charges (AR) paid by consumers and averageincremental cost (AIC) for water services provided by the utilities of Ankara, Sao Paulo andManila. is presented in graphs E. F and G. It is worth noting, in these graphs. that all theseutilities are subsidizing a large segment of domestic users (fiinancial subsidy: AR lessaverage charge paid by consumner; economic subsidy: AIC less average paid by consumiier).Although not shown, small commercial and industrial consumers are also often subsidized.
A. 1Domestic Water Tariff Structure
Tariff Rate US$/m3
1.4-
Sta. Catarina (9)
() 8 jS~~~~~~~~~~ao Paulo ('89)
0).6_ ; .
0.4 - --
().2_ _ J w San Jo-----se ('9 2 )
O 1 .-. L i ,
10 20 30 40 50 60 70
Monthly Consumption m 3 /c
A. 2Household's Monthlv Expenditure on Water
Expenditure in US$ per month50
Sta. Catarina ('91)
40Sao Paulo
('89)30
20
10
0 10 20 30 40 50 60 70Monthly consumption m3 /c

Water & Wastewater Utilities v'erview of Tariff Rates and StructuresSet 3 Page 39
B. 1Domestic Water Tariff Structure
Tariff Rate US$/m3
0.8 ~~~~~~~~Ankara ('891)
0.6
Ghana ('88)
0.4
0.2
Manila ('88)
0
0 1 0 20 30 40 50 60 70
Monthiv Consumption m3/c
B. 2Household's Monthly Expenditure on Water
60 - Expenditure in US$ per month
50 - ------- /
Ankara ('89)
_, ~Ghana ('88)_20 -- - -- -- -- -- -- - -- - -- - - - ----------- - -- -- -- -- -------------- - -- - -- -- ---
00 10 20 30 40 50 60 70 8()
Monthly Consumption m3/c

Overview of Tariff Rates and Structures Wt ater & Wastewater UtilitiesPage 40 Set 3
C.1Domestic Water Tariff Structure
Tariff Rate US$/m30.7 .........................
0.6Singapore ('91)
0.5
0.4Seoul ('91)
0.3 -... .
0.1
0( 10 20 30 40 50 60 70
Monthly Consumption m3/c
C. 2Household's Monthly Expenditure on Water
40 Expenditure in US$ per month
30
Singapore ('91)
20
10
0 10 20 30 40 50 60 70
Monthly Consumption m3/c

Water & Wastewater Utilities Overview of Tariff Rates and Structures_Set 3 _ _Page 411
D.Household Payment for Water Consumption
US$ per month
1 2
I 0
8
6
4
0
Seoul Manila S.Paulo Singapore Ghana S. Jose S.Catarina Ankara
U 5m' * 10 m3 20 m 3/month
E.Ankara's Tariff Structure
and Average Incremental Cost (1989)
US$/m3
1 -__ Actual Tariff
0.8
0.6* Average Price
0.4
+ Avg. Increm. Cost0.2
0 I I I0 10 20 30 40 50 60 70
Monthly Household Consumption m3
Source: Staff Appraisal Report November 1989.

Overview of Tariff Rates ard Structures 4ater & Wt'astewater ltilitiesPage 42 Set 3
Sao Paulo's Tariff Structureand Average Incremental Cost (1989)
US$/mn3
-+ Average Price
Manila's TActual Tariff0.5- -- - - - - - -
~~ Average Prwe~Av. ierm os
01 _
0q I III
0 10 20 30 40 50 60 70
Monthly Household Consumption mY
Source: Stalff Appraisal Report May 1 s 99.
G.
Manila's Tariff Structureand Average Incremental Cost (1988)
0.6-
0.5-
0.4- \+Average Ptice
* ~~~~Actual Tariff-0.2--?= _H
0.1 iZ + ~~~~~~Avg. Increm Cost
0 10 '20 30 40 50 60 70
Monthly Household Cnu ti mA
Source: Staff Appraisal Report AugusNt 1989.

Water & Wastewater Utilities Overview of Taniff Rates and StructuresSet 3 Pa~ge
A. 5 RATE DISCRIMINATION BY CONSUMER GROUP
Tariff structures, in this sample of utilities, are often designed in such way thatindustrial, commercial, domestic and other users are subject to different rates for the sameconsumption (rate discrimination).
This practice seems to be rooted in the belief that industrial and other users,presumably wealthy ones, should subsidize all or some of the domestic consumers and onoccasion special groups such as schools, churches and the public sector. This cross subsidyelement is often substantial as shown in the following table:
Rate DiscriminationRatio of Average User Rate to Average Rate
User Utility
Sanl Jose al Sta. Catarina Bogota Bursa Minsk
Domestic 0.76 0.75 0.86 b/ 0.86 0.05
Commercial 1.79 2.51 1.63 1.32
Industrial 1.82 2.85 1.51 1.32 3.84 c/, 2.03 d/
Pub. Sector 0.76 4.11 1.06 1.32 2.63
Other 0.76 0.69 0.34
Average Rate 1.00 1.00 1.00 1.00 1.00
a!. San Jose industrial rates differentiate on the basis of water being part of the final product (e.g., sodawater and beer).
b/. Average of 6 categories for domestic consumers. The corresponding ratio within each category variesfrom about 0.32 to 2.71 and the relative fixed charge from I to 100.
c/. Drinking waterdI. Non-treated water
No explicit rationale for price discrimination or progressivity in rate structure wasprovided in any of the utilities' reports. The implicit rationale seems to be "charge whateverit is thought the market can bear", without analysis of the consequences on the pricediscrimination on the behavior of different consumer groups, and of the distortions created.

Overview of Tariff Rates and Structlures Water & Waste water LUtilitiesPage 44 Set 3
H. Price DiscriminationAverage Tariff Among Consumer Groups
US$/in3
1.2
0.4
0
Manila Bogota San Jose S. Catarina Ankara Barcelona1988 1992 1992 1991 1989 1992
-Avg Tariff U Avg Dom.Trf. M Avg Cornm.Trf. M Avg Ind.Trf.
A. 6 WATER BILLINGS, CONSUMPTION AND USERS.
Consumption pattems in all users groups are often accentuated by discriminatolrypricing practices as a resl]t of cross-subsidies. The following table presents infonrmationl forSan Jose. Manila and Bogota. These differences in consumption and billings must be fullyuniderstood when analyzing the impact of tariff reforms and programs to correct large tariffdistortions.
Water Consumption and Billing(Percentages)
San Jose Manila BogotaType of User %LU %Q %$ %_L/ 1-Q %$ %U %Q %$
Domestic 91 71 55 90 61 42 95 76 69Commercial 6 8 13 9 32 47 5 8 14Industrial 2 15 27 1 7 11 0.5 6 11Public Sector I 6 5 --- --- --- 9.3 5 6Other --- --- 0.( 4 0.3Total 100 100 100 100 100 100 100 100 100
Totals miay not ad(d because of rounding. U = nuiber of usels: Q = total consuiliption; $ = total billing.
Suggestedl reading:a) Nieswianidonilv. Michael L. "Estiniatini Urbhan Residential Water Demiiand: Ef'fects o' Price StnictUre Conservation
and EducIatioll." Water Resouices Research. Vol. 'S. March 1992.hi) K. L. Kollar andL P. 1\acAuley. "Water Reqo irereriets ftii 1Idustrial Dcvelopnieit. ' Jounial AkWXVA, January 198(0.

Water & Wastewater Utilities O'ernview of Tariff Rates and StructuresSet 3 Page 45
A. 7 CONCLUSIONS AND HYPOTHESES TO BE TESTED:
Based on this limited sample, some prelimiiary conclusiolns and hypotheses can bedrawn, that need further testing:
Issue Conclusion/Hypothesis
1. Tariff Structure a) to reach the same level of revenues, for a givenconsumption volume, it is preferable, on efficiencygrounds, to opt for relatively highier volumetric chargesand relatively lower fixed charges. Volumetric chargesrequire metering;
b) water and sewerage rates shoLIld be separated.Otherwise some users are charged for one service thatthey do not receive often (sewerage) and end upsubsidizing those who receive both:
c) cumbersomiie classification of users, based on notionalideas of capacity to pay, are difficult and expensive tomaintain up to date ancl are pronie to abuses andcorruption;
d) consumption estimates based on a proxy sLcic as area ofconstruction, imputed or actual property values or size ofindustry are prone to substantial errors that are bestcolTected by metering consumption.
2. Fixed Charges High fixed charges can have two undesirable etfects:
a) they do not promote water conservation: and
b) they can be regressive e.g., they often penalizeconsumers that use less water and, in particular, lowincome groups.
3. Price Discrimination Price discrimination can also have undesirable effects:
a) industry, in particular. may look for alternative sourcesthus reducing the commercial base of the utility-
b) perceptions of unduly high price discriminationi can leadto fi-aud: and
c) low charges remove incentives for utilities to provideservices in low income areas. They also removeincentives to reduce UFW.

Water & Wastewater Utilities ANNEX
2nd Edition Page I
PERSONNEL COSTS AS AN INDICATOR FOR W&S UTILITY PERFORMANCE INDEVELOPING COUNTRIES'
Karin Kemper, Guillermo Yepes and Mike Gamn
Personnel costs in many Water & Sanitation utilities in developing countries constitute a larger costfactor than usually recognized. draining resources from maintenance and other necessary operatingexpenses and imposing costs on consumers.
Although most developing countries have invested RATIO OF PERSONNEL COSTS TO OPERATINGconsiderable amouLits of money in W&S, new COSTSinvestments are still essential in the sector due to rapidpopulation growth, large unmet needs, and a sizeable When the finanicial statements of sector companies inbacklog of postponed maintenance expenditures. developing countries are examined, it becomes clear that:However, internal generation of funds by W&S utilities (a) the impact of personnel costs on the cost structure inhas been disappointing])' low and consequently the many companies is very high, and (b) the ratio ofpressure on national and local governments to provide personnel costs to operating costs varies widely, evenfunds for investments, and often for operations. is large. from company to company in the same country.It is becoming obvious that needed levels of investment The ratio of personnel costs to operating costs (PC/OC)cannot be sustained over the long run if business for selected W&S utilities in Great Britain. France.continues as usual. Germany. Japan and Spain and selected developing
countries is presented in Figure 1. In spite of thePersonnel costs are not usually expected to play a relatively high unit labor costs in the group ofpredominant role in W&S utilities since other operating industrialized countries, PC/OC ratios are, on average,costs. e.g. for energy, chemicals, and maintenance, weigh under 40 percent. Yet, as illustrated, some utilities inheavily. (Operating costs, as treated here, do not include developing countries have PC/OC ratios in excess of 60depreciation or interest payments). There is evidence, percent. The average for Brazil and Colombia, forhowever, that personnel costs in a number of developing example. is around 55 percent, considerably higher thancountries are disproportionately high in comparison to the average for the industrialized countries (Figure I).other operating costs and should receive closer attentionwhen assessing company performance. Figure 1: Personnel Costs
Pcrsonniel Cosls/Operatin, Costs '.'70
If the ratio of personnel costs to other operating costs istoo high. the sustainability of previous investments may 60
be undercut. The need for external funds increases. 50
draining more resources than necessary from other 40
sectors, and consumers may have to be charged higherprices if maintenanice and other necessary operating 30
expenses are to be met. Thus, although there is asubstantial need to expand W&S services in developing 20
countries. the inefficient allocation of resources within the locompanies may not even permit mainitenianice of current 0levels of service. let alone allow investmenits from GeCn-n. B, C p k, - bil C Ri', Tl Thand
internally generated funds. Selected Counitries
Published in Infrastructure Notes. January 1994 - Transportation. Water and Urban Development Department, World Bank. W & S No.WS 12.

ANNEX Water & Wastewater UtilitiesPage 2 2nd. Edition
The personilel cost figures for the industrialized countries ratio. Thus, the problem would be mechanistic, and ifusually include pension costs. However, in many of the personnel costs were perceived as too high. the solutiondeveloping countries, reported personinel costs do not would be to reduce staff numbers.include all costs. In some documents cases, W&Scompanies provide additional fiinge benefits to their staff The staff/connection indicators alone, however, do notsuch as free water and sanitation services, subsidized give a satisfactory picture of the situation. An analysis ofhousing and housinig loans. educational benefits for family a Colombian sample of 16 W&S utilities shows that in 75members, etc.. These costs are not always identified in percent of the cases the staff/conn1ection indicator wasthe financial statements or easily quantified. It is improving (decreasing) or stationary while the ratio ofreasonable then. to assume that the personinel costs and personnel costs to operating costs was increasing. In onerelated ratios presented here for developing countries are Colombian company, the staff/connection ratio for the lastunderestimated. 10 years has been declining steadily and has reached
levels very few companies in the region can emulate.RELATIVE PRICES However, personnel costs (in real terms) and their impact
on the cost of water delivered have been increasing at anOne explanation for the larger share of personnel costs in alarming rate to the point that the company is now neardeveloping countries compared to industrialized countries insolvency. As a result the company has also reducedmight be that labor in the former is relatively cheaper and allocations for maintenance, and investment plans are intherefore substituted for capital. This would increase, the abeyance.relative share of personnel costs in these utilities'accounts. However, this would not explain wide This is not an isolated case. Average salary levels andintracountry differences. There exist substanitial their impact on the cost per mndelivered are -rowinlg verydifferences between companies withini countr-ies. For fast, in real terms, in many W&S companies ininstance in Ecuador, personnel costs in two companies (leveloping countries. In a sample of Bank-financedconstitLite only 39 percenit of total operating costs, which projects implemented between 1965 and 1987. the ratio ofcorresponds well to the average observed in industrialized salaries to the cost of water sold grew in real terms (over acountries while two other companies exhibit personnel 6 to 10 years period) at unsustainable rates.costs over 60 percent. Similar differences can beobserved in Colombia and Brazil. Thus even if it seems Figure 2 illustrates that the staff/1000 connectionsreasonable to expect that utilities in developing countries indicator does not tell the whole story. As can be seenwill use somewhat more labor than those in industrialized from the sample of 32 Asian and Pacific cities, there is nocountr-ies this would only explain parts of the picture. di-ect connection between staff/1000 connections and the
ratio of personnel costs to operating costs. For example,ECONOMIES OF SCALE in Singapore the staff/1000 connections ratio is a
favourable 2.4, but personnel costs constitute 49 percentAnother explanationi for the large differences between of operating costs. And in Bombay. there are 61 staff percompanies might be their size. Due to economies of 1000 connections, but personnel costs amount to only 32scale, larger companies could be expected to have lower percent of operating costs.personnel costs per unit of service ($mn sold). One study(Yepes. 1990) observed economies of scale in a Brazilian Figure 2: Asian and Pacific Citiessample. and also data from the UJS (1970, 1976) indicatethat there are economies of scale. However. the * Pers.Costs/Oper.Costs * No.of Staff/lOOOConn.Colombian sample illustrates that economies of scale n.
cannot in all cases be counted on. Economies of scale are n50 l hX
observable when measured as staff/10)000 water 4(40
connections ratio. but when measured against personnel 30
cost/mi sold, these economies do not exist. 2I) 20
WHAT DOES THE "NUMBER OF STAFF PER 1000 0 0
CONNECTIONS" TELL US? W&S Utilities in Asian and Pacific Cities
Number of staff per 1000 water connections or 1000 The examples above give an indication that the frequentlywater & sewerage connections are frequently used as Llsed staff/1000 coniiections ratio in itself may beindicators of company performanice. When related to misleading and that an improvement in that ratio cannotpersonnel costs. the picture would be presumed to be necessarily be interpreted as an increase in efficiency.fairly straiogltforward. i.e. companies with high personinlel Personliiel costs in these cases appear not to becosts would be assumed to have a higher staff/connection automatically linked to staff numbers or economies of

Water & Wastewater Utilities ANNVEX2nd Edition Page 3
scale, so that it must be assumed that other factors play a combination of indicators and a determiniationl of therole. trade-offs, between their implications are necessary ifA recent survey carried out by the Unionl Africaine Des company performanice is to be adequately analysed. ToDistributeurs D'Eau in West Africa arnoli its members complemenit the picture, the expenditure on personinel alsosuggests that inadequate iiformationi on personinel costs is needs to be examined. Personnel costs can. tor example.an additional problem in W&S utilities. While most of be related to othel operatino costs andl to the cost of waterthe companiies were able to provi(le all kinds of data soldl.relating to turinover, energy consLimptioll, number ofpersoninel etc.. only three of the 14 respondin- companies In this Note, only technical explanations for highprovided data on personiniel costs. personinel costs, suci as relative prices and economiiies of
scale, are examined. As could be seen. althouhll thesecertainly provide answers in some cases. they do not tell
A LOOK AT STAFFING STRUCTURES the whole story. Complemenitary explanations areprovi(le(l by institutionial economiiics. This evolving field
The data lead to the assumption that in many W&S of economilic theory uses, inter- alia, public choice theory.utilities averace salaries and wages are hioher than one as well as conicepts such as the Soft Budget Constraint.would expect. But this nee(d not be the case for the and principal-agenit relations for the analysis andoverall workforce. Ther-e is evidence from sonie studies explanation of company and sector performance.that salaries of lower-level workers in public utilities are incentive structures and stakeholders' behavior.substantially higher than the average in the private sector.while wages at managemiienlt level are lower. The latter Concerninig the perfor-mlianice of the utilities discLissed inseems to be especially true for smaller- utilities. w*hich this Note, explanations for highli personinlel costs may forconsequenitly have difficulties in attracting qualified example be that the various actors (mitinanaers. employees.managers. Bank reports menition these problems politicians. etc.) are subject to incenitive structuLes thatconcerning the W&S sectors in counitries as differenit as lead to over/underpayments of certain employees, toTurkey and Nigeria. demilands for higher than appropriate salaries and to
overstaffing. This is indicated in sector reports for sonieFurthermore. the repor-t on the W&S sector in T'urkey countries. For future analyses, it would thus be of initer-estpoints out that the combined effect of a reductioll of UFW to look at incenitive structures in the W&S sector byby 20 percenlt and an increase in productivity of personnel employingC the analytical framework of institutionialby 21) percenlt in urban areas on savinas and revenues economiiics. This would give additional guidance in policvwould add about US$180 millioni a year to the cash formiulationi for specific settings.generationi potential of local aiencies. That WLould implythat a significant part of the cash gener-ation effortrecommenided at the local level could be achieved withouta major effect on existing tariff levels. Similar TO LEARN MORE:
calculations for Costa Rica aii( Colombia also point topoteiitial savings. It is thus evident that the opportunity OstronII Elinor. Larry Schroeder. and SUsaIn )Wvnne. 1993.cost of high personiniel expenditures is significant. listin/i//I IIjies and Sleaiale Develn(II.
Boulder: Wesiview Press.
CONCLUSIONS AND POLICY IMPLICATIONS Triche. Thelma. 1992. Prixah Secfor Partcipation in
lnftia. ci rla/nre Serl, l ics in Ni.,,, eim -The (llrban Wato Sup p/,To suLm111marize, personinel costs constitute a sizeable part Ssi tor." TWtUWS Backiround ! Paper, uLnpublished.of overall operating costs in mianiy companiies in a widevariety of developinig countr-ies. Thlis need not be the case World Bank. 1993. "Colnnibia -Review ,f ICVate'r and,
since countries with generally higlher- wages and salaries, SeweragNe Sector Ia.ifolio/o>." Report No. 11560. Washineton.such as Britain. Spaii and Japan. man1age to keep D.C.personnel costs at a relatively low level. Excessivepersoninel costs draini funds from other necessary Yepes. Guillermo. 1990. MMana"'enlient an/d O1erlaianall
expendituires for e.g. mainltenianice and investilents for P/inraMes of Mi//ici ipa ald Re,c,'imial Water and Sewer ae
expansion. This Note thus iniplies that wheni analysing- Coc,anie.i• ini Latili Atucricia ciiiald t Caribbean. W xvortld Baik.W&S utilities' perforim1anice. personnel costs oug7ht to be InfraStrCIure & Urban Developinent Dept.. DiSCuSsion Paper,
Report INU 61. Washingitoni. D.C.taken into accounlt because theii- weight might haveserious imiplicationis for a companlys t'inancialsustainability: routinely used technical indicators. such asstaff/!1000 connection1s mighlt be misleading because theilrelation to finanicial performance is not clear: and a


-