Water & Waste Water Comprehensive Study
122
TOWN OF OCEAN CITY, MARYLAND WATER & WASTEWATER COMPREHENSIVE RATE STUDY FEBRUARY 24, 2015
-
Upload
town-of-ocean-city -
Category
Documents
-
view
39 -
download
3
description
Ocean City Water & Waste Water Comprehensive Study
Transcript of Water & Waste Water Comprehensive Study
TOWN OF
OCEAN CITY,
MARYLAND
WATER &
WASTEWATER
COMPREHENSIVE
RATE STUDY
FEBRUARY 24, 2015

Town of Ocean City, Maryland Water & Wastewater
Comprehensive Rate Study February 6, 2015
Richard W. Meehan Mayor
Lloyd Martin Mary P. Knight Council President Council Secretary
Doug Cymek Dennis Dare Council Member Council Member
Tony DeLuca Wayne Hartman Council Member Council Member
Matthew James Council Member
David L. Recor City Manager
City Hall 301 Baltimore Avenue
Ocean City, MD 21842 (410) 289-8221
www.oceancitymd.gov
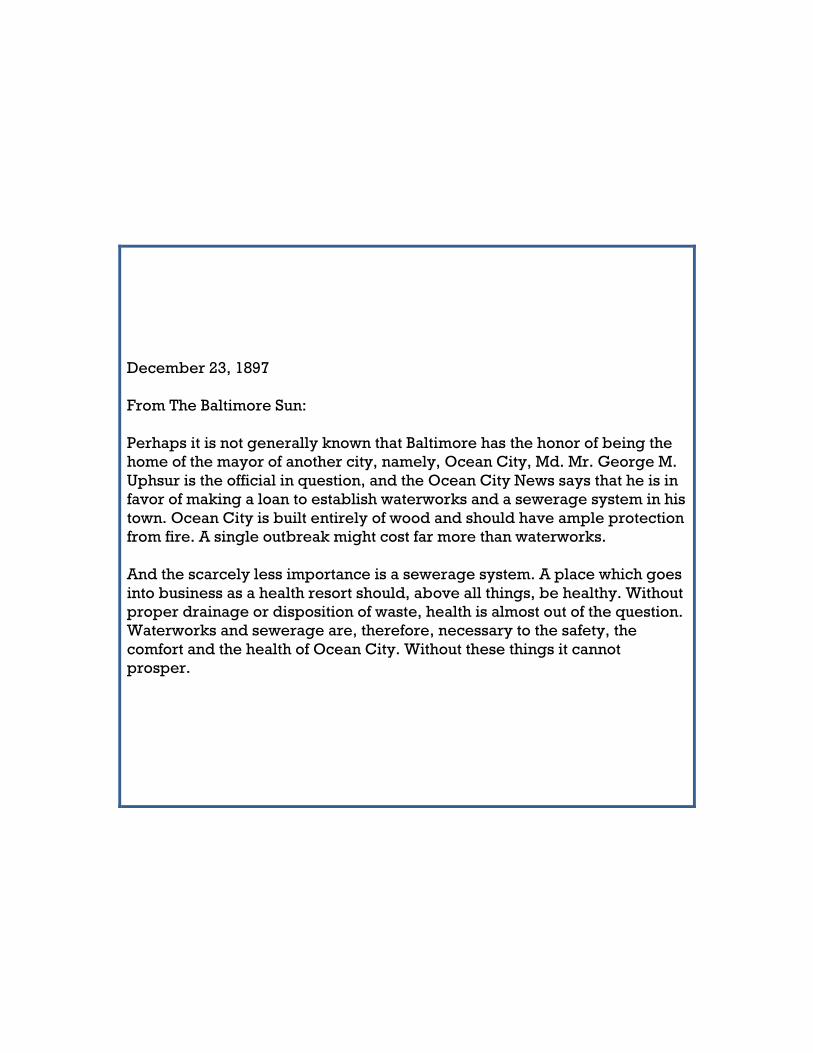
December 23, 1897
From The Baltimore Sun:
Perhaps it is not generally known that Baltimore has the honor of being the
home of the mayor of another city, namely, Ocean City, Md. Mr. George M.
Uphsur is the official in question, and the Ocean City News says that he is in
favor of making a loan to establish waterworks and a sewerage system in his
town. Ocean City is built entirely of wood and should have ample protection
from fire. A single outbreak might cost far more than waterworks.
And the scarcely less importance is a sewerage system. A place which goes
into business as a health resort should, above all things, be healthy. Without
proper drainage or disposition of waste, health is almost out of the question.
Waterworks and sewerage are, therefore, necessary to the safety, the
comfort and the health of Ocean City. Without these things it cannot
prosper.
Town of Ocean City
Water & Wastewater
Comprehensive Rate Study
Table of Contents
Water & Wastewater Rate Study Summary ................................................ 1
Water Treatment and Distribution Facilities ............................................. 21
Water Capital Improvement Plan Summary ............................................. 37
Water Capital Improvement Plan Detail Projects ..................................... 41
Wastewater Treatment Facilities ............................................................... 53
Wastewater Capital Improvement Plan Summary .................................... 60
Wastewater Capital Improvement Plan Detail Projects ............................ 63
Water & Wastewater Rate Model ............................................................. 75
Schedule 14 - Rate Comparisons ............................................................. 115
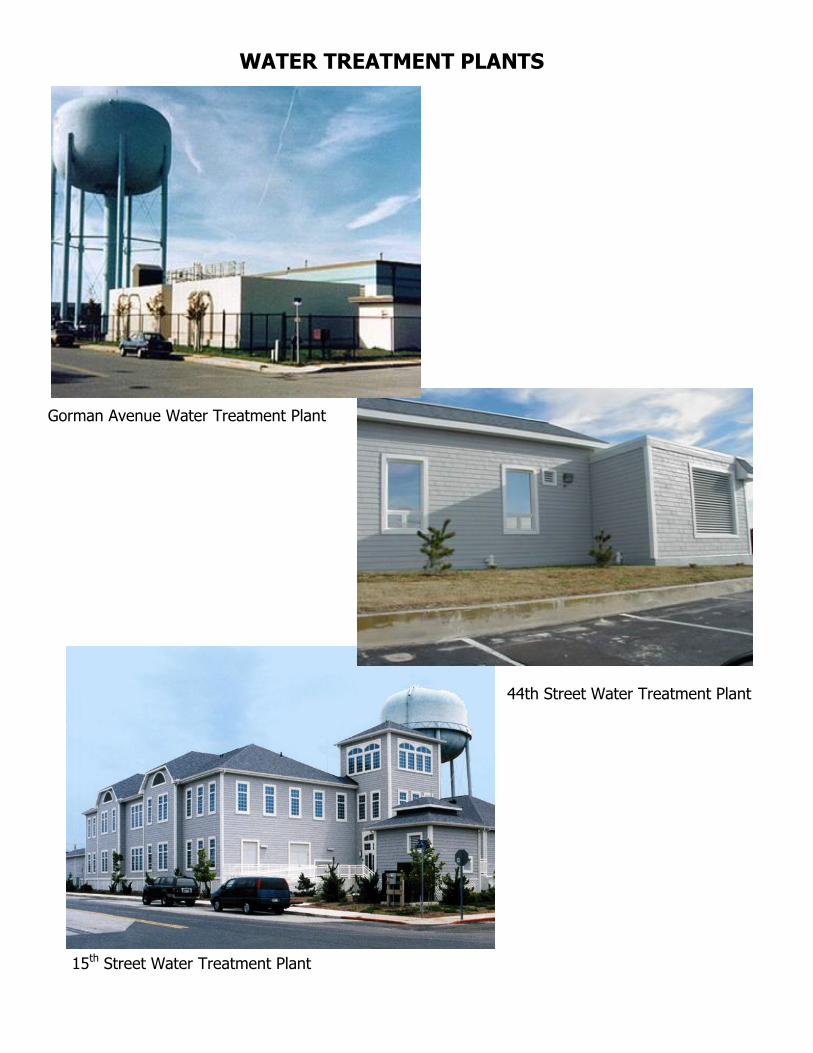
WATER TREATMENT PLANTS
Gorman Avenue Water Treatment Plant
44th Street Water Treatment Plant
15th Street Water Treatment Plant
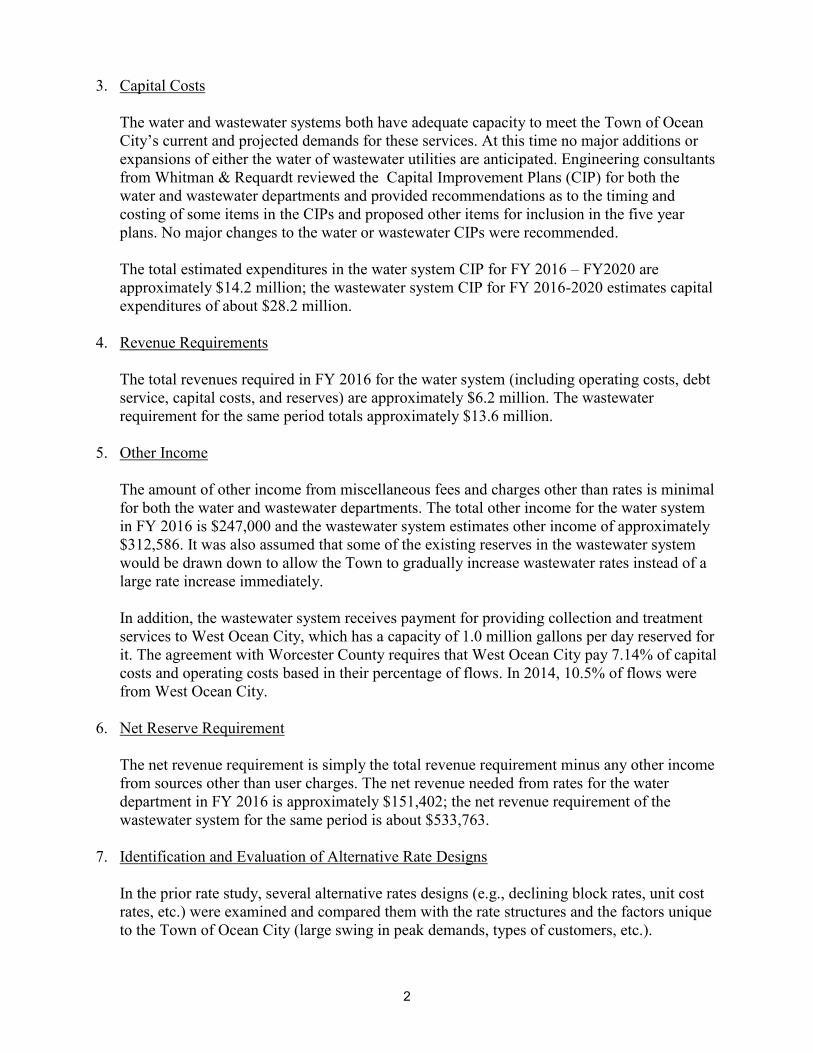
WATER & WASTEWATER RATE STUDY SUMMARY
A. Executive Summary
This report presents the background, conclusions and recommendations of a water and wastewater cost of service study. The study was completed by updating the cost of service financial model previously developed by Municipal Financial Services Group in 2005 and updated in 2009. The study is predicated on the use of a cash flow analysis to support the pricing of utility services using a planning period of 5 years (Fiscal Years 2016 - 2020).
1. Background
The water and wastewater financial model was updated/reviewed using the following data/documents:
Actual revenue and expenses for Fiscal Years 2013 & 2014.
The FY 2015 and proposed FY 2016 operating budgets for Water and Wastewater.
The current capital improvement plan, reviewed by Whitman Requardt & Associates
(WR&A). The current number of fixture counts and the amount of water sold over the past four
fiscal years. The current cash balances within the Water and Wastewater Fund.
In addition to updating the model with the items listed above, the model took into account the use of impact fees to fund growth-related capital costs. This was accomplished by examining each individual capital improvement project to identify if the project or a portion of the project is attributable to growth. As a result of this analysis, the Town’s water and
wastewater user rates exclude growth related capital costs. All of the assumptions used in the model (i.e. growth in fixtures, inflation of the expenses, etc.) were also reviewed to ensure that they are still valid based upon review of historical data. The following conclusions and recommendations were developed during the course of the review/update of the financial model.
2. Operating and Maintenance (O&M) Costs
The water system has an estimated operating budget for FY 2015 of approximately $5.0 million; the wastewater department has an estimated operating budget for FY 2015 of approximately $8.4 million for the same period. For purposes of this study it was assumed that operating costs based on FY 2015 budget would increase at a rate of 1-2% annually.
1
3. Capital Costs
The water and wastewater systems both have adequate capacity to meet the Town of Ocean City’s current and projected demands for these services. At this time no major additions or expansions of either the water of wastewater utilities are anticipated. Engineering consultants from Whitman & Requardt reviewed the Capital Improvement Plans (CIP) for both the water and wastewater departments and provided recommendations as to the timing and costing of some items in the CIPs and proposed other items for inclusion in the five year plans. No major changes to the water or wastewater CIPs were recommended. The total estimated expenditures in the water system CIP for FY 2016 – FY2020 are approximately $14.2 million; the wastewater system CIP for FY 2016-2020 estimates capital expenditures of about $28.2 million.
4. Revenue Requirements
The total revenues required in FY 2016 for the water system (including operating costs, debt service, capital costs, and reserves) are approximately $6.2 million. The wastewater requirement for the same period totals approximately $13.6 million.
5. Other Income
The amount of other income from miscellaneous fees and charges other than rates is minimal for both the water and wastewater departments. The total other income for the water system in FY 2016 is $247,000 and the wastewater system estimates other income of approximately $312,586. It was also assumed that some of the existing reserves in the wastewater system would be drawn down to allow the Town to gradually increase wastewater rates instead of a large rate increase immediately. In addition, the wastewater system receives payment for providing collection and treatment services to West Ocean City, which has a capacity of 1.0 million gallons per day reserved for it. The agreement with Worcester County requires that West Ocean City pay 7.14% of capital costs and operating costs based in their percentage of flows. In 2014, 10.5% of flows were from West Ocean City.
6. Net Reserve Requirement
The net revenue requirement is simply the total revenue requirement minus any other income from sources other than user charges. The net revenue needed from rates for the water department in FY 2016 is approximately $151,402; the net revenue requirement of the wastewater system for the same period is about $533,763.
7. Identification and Evaluation of Alternative Rate Designs
In the prior rate study, several alternative rates designs (e.g., declining block rates, unit cost rates, etc.) were examined and compared them with the rate structures and the factors unique to the Town of Ocean City (large swing in peak demands, types of customers, etc.).
2
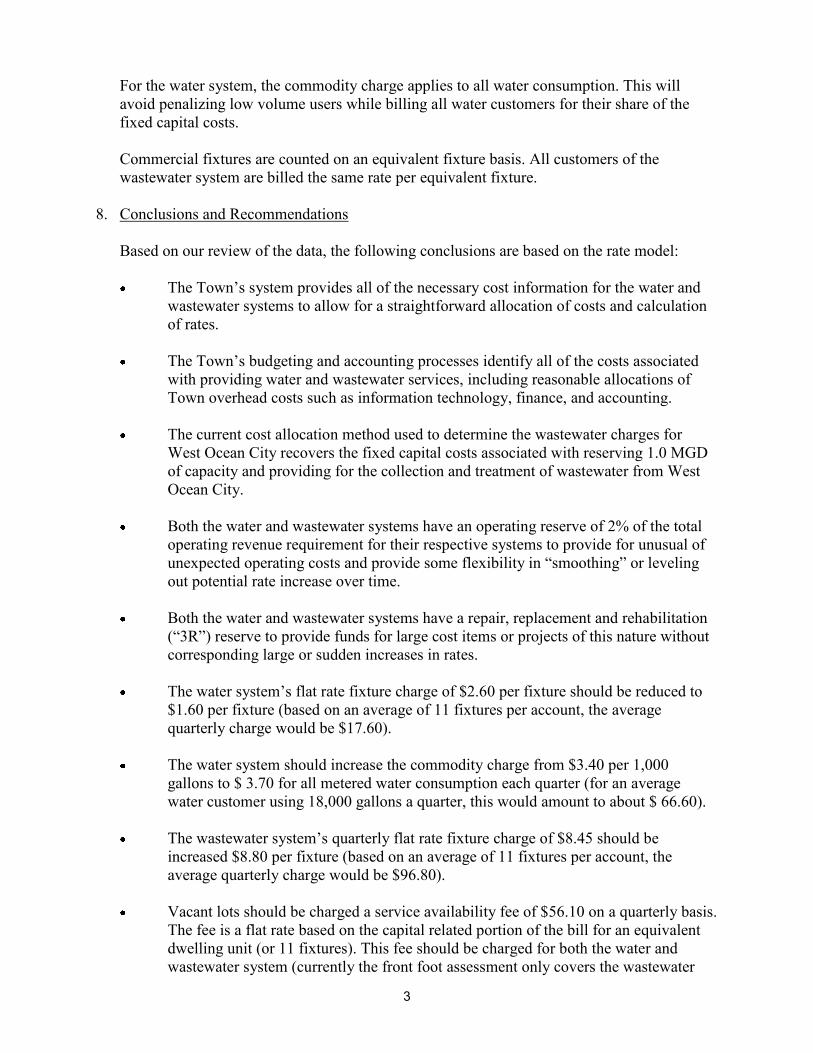
For the water system, the commodity charge applies to all water consumption. This will avoid penalizing low volume users while billing all water customers for their share of the fixed capital costs. Commercial fixtures are counted on an equivalent fixture basis. All customers of the wastewater system are billed the same rate per equivalent fixture.
8. Conclusions and Recommendations
Based on our review of the data, the following conclusions are based on the rate model:
The Town’s system provides all of the necessary cost information for the water and
wastewater systems to allow for a straightforward allocation of costs and calculation of rates.
The Town’s budgeting and accounting processes identify all of the costs associated
with providing water and wastewater services, including reasonable allocations of Town overhead costs such as information technology, finance, and accounting.
The current cost allocation method used to determine the wastewater charges for
West Ocean City recovers the fixed capital costs associated with reserving 1.0 MGD of capacity and providing for the collection and treatment of wastewater from West Ocean City.
Both the water and wastewater systems have an operating reserve of 2% of the total
operating revenue requirement for their respective systems to provide for unusual of unexpected operating costs and provide some flexibility in “smoothing” or leveling
out potential rate increase over time. Both the water and wastewater systems have a repair, replacement and rehabilitation
(“3R”) reserve to provide funds for large cost items or projects of this nature without corresponding large or sudden increases in rates.
The water system’s flat rate fixture charge of $2.60 per fixture should be reduced to
$1.60 per fixture (based on an average of 11 fixtures per account, the average quarterly charge would be $17.60).
The water system should increase the commodity charge from $3.40 per 1,000
gallons to $ 3.70 for all metered water consumption each quarter (for an average water customer using 18,000 gallons a quarter, this would amount to about $ 66.60).
The wastewater system’s quarterly flat rate fixture charge of $8.45 should be
increased $8.80 per fixture (based on an average of 11 fixtures per account, the average quarterly charge would be $96.80).
Vacant lots should be charged a service availability fee of $56.10 on a quarterly basis.
The fee is a flat rate based on the capital related portion of the bill for an equivalent dwelling unit (or 11 fixtures). This fee should be charged for both the water and wastewater system (currently the front foot assessment only covers the wastewater
3
system). The water system portion of the charge is $1.60 ($1.60 x 11 fixtures). The wastewater system portion of the charge is $38.50 ($3.50 x 11 fixtures).
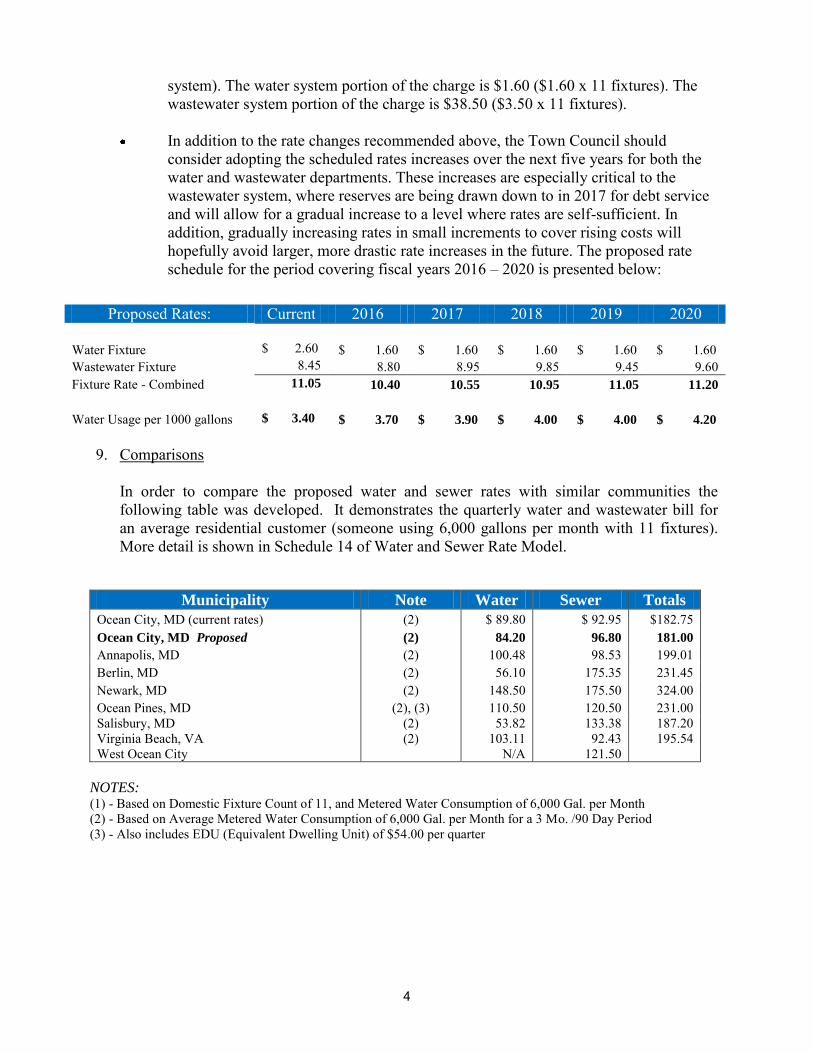
In addition to the rate changes recommended above, the Town Council should
consider adopting the scheduled rates increases over the next five years for both the water and wastewater departments. These increases are especially critical to the wastewater system, where reserves are being drawn down to in 2017 for debt service and will allow for a gradual increase to a level where rates are self-sufficient. In addition, gradually increasing rates in small increments to cover rising costs will hopefully avoid larger, more drastic rate increases in the future. The proposed rate schedule for the period covering fiscal years 2016 – 2020 is presented below:
Proposed Rates: Current 2016 2017 2018 2019 2020
Water Fixture $ 2.60 $ 1.60 $ 1.60 $ 1.60 $ 1.60 $ 1.60 Wastewater Fixture 8.45 8.80 8.95 9.85 9.45 9.60 Fixture Rate - Combined 11.05 10.40 10.55 10.95 11.05 11.20
Water Usage per 1000 gallons $ 3.40 $ 3.70 $ 3.90 $ 4.00 $ 4.00 $ 4.20
9. Comparisons
In order to compare the proposed water and sewer rates with similar communities the following table was developed. It demonstrates the quarterly water and wastewater bill for an average residential customer (someone using 6,000 gallons per month with 11 fixtures). More detail is shown in Schedule 14 of Water and Sewer Rate Model.
Municipality Note Water Sewer Totals
Ocean City, MD (current rates) (2) $ 89.80 $ 92.95 $182.75 Ocean City, MD Proposed (2) 84.20 96.80 181.00
Annapolis, MD (2) 100.48 98.53 199.01 Berlin, MD (2) 56.10 175.35 231.45 Newark, MD (2) 148.50 175.50 324.00 Ocean Pines, MD (2), (3) 110.50 120.50 231.00 Salisbury, MD (2) 53.82 133.38 187.20 Virginia Beach, VA (2) 103.11 92.43 195.54 West Ocean City N/A 121.50
NOTES: (1) - Based on Domestic Fixture Count of 11, and Metered Water Consumption of 6,000 Gal. per Month (2) - Based on Average Metered Water Consumption of 6,000 Gal. per Month for a 3 Mo. /90 Day Period (3) - Also includes EDU (Equivalent Dwelling Unit) of $54.00 per quarter
4
B. General Information
The Town of Ocean City provides potable water to a small year-round population of 7,800, which swells to a summer weekend population of almost 300,000. This drastic shift in population is evidenced by significant seasonal fluctuations in demand for water, which varies from an average consumption of 5.9 MGD to a summer peak of almost three times that quantity. Early in 1994, the Town also took control and ownership of the wastewater treatment plant and wastewater collection system serving the Town; previously, the wastewater system had been owned by Worcester County, and the Worcester County Sanitary Commission. The wastewater system also has fluctuating seasonal demand, ranging from less than 3 MGD of flow in the winter to more than 13 MGD on a max day in the summer.
A summary of this usage data is provided as Schedule 3 of the Water and Wastewater Rate Model in the appendix of this report, listing consumption data for the past five years in thousands of gallons.
C. Operating and Maintenance Costs
The operating and maintenance costs for the water and wastewater utilities were developed from the Town of Ocean City’s current budgets for fiscal year FY 2015 and proposed budget for FY2016. These costs were then adjusted annually by an inflation factor of 1-2% to estimate the budgeted costs for FY 2017 and beyond. The budgets are quite detailed and comprehensive; in addition to basic costs such as salaries and benefits, supplies, heat and light, routine maintenance, etc., detailed data is also provided for costs such as interdepartmental costs such as information technology, accounting and finance, insurance and capital items that may not be large enough to include in the Town’s CIP such as minor
equipment and repairs.
1. Water System O & M Costs
Operating and maintenance (O&M) costs for the water system are categorized into five groups – administration expenses, distribution costs, costs attributable to operation of the water plants, meter installation costs, and meter repair costs. The total estimated administration budget for FY 2016 is nearly $979,948. The largest cost within this category is for the operating transfer of interdepartmental costs of approximately $ 545,537 which represents the reimbursement by the utility for support services provided by the Town (e.g., human resources, finance, and accounting). The water distribution cost component is budgeted at nearly $ 1,289,469, with salaries and benefits making up over half of the budget total.
The costs budgeted for the operation and maintenance of the Town’s water plants make up
almost half of the total water system O&M budget. The three largest costs components relating to the water plants are salaries, energy, and supplies. These three items total approximately $1,674,380 out of a total budget of over $ 2,179,791 for plant O&M. The meter installation budget of $137,522 is primarily made up of $ 75,000 for parts and salaries of $43,793. The major costs elements in the meter repair budget of $ 293,241 are salaries and benefits which constitute over half of the estimated costs in this category.
5
A detailed breakdown of the total estimated O&M costs of $4.8 million for the water department is shown in Schedule 4 of Water and Sewer Rate Model, which is presented in the Appendix to this report.
2. Wastewater System O&M Costs
The budgeted O&M costs for the wastewater system were developed within four groups – administration expenses, collection system costs, wastewater treatment plant costs, and the expenses associated with laboratory services. The total administration costs of approximately $1,455,845 has three major components – the operating transfer for interdepartmental expenses of $762,126 (as discussed above, this represents the reimbursement by the utility for support services provided by the Town such as human resources, finance, and accounting); salaries of nearly $449,702; and insurance expense of $95,094. Within the collection system, over half of the budget of approximately $1,172,526 consists of salaries and fringe benefits.
The operating and maintenance expenses associated with the wastewater treatment plant are the largest expense group within the wastewater system, with a total budget of nearly $5.4 million. The largest cost components of this group are salaries and benefits which are more than one third of the budget, energy expenses of $ 463,500, and supplies of more than $ 638,000. The laboratory services budget of $331,972 primarily consists of salaries of approximately $282,123 and supplies of $ 37,205. A detailed breakdown of the total estimated O&M costs of $8.4 million for the wastewater department is shown in Schedule 4 of Water and Sewer Rate Model, which is presented in the Appendix to this report.
D. Capital Costs
The capital costs associated with the water and wastewater systems are separated into two separate categories – existing debt service and capital improvement projects. The Town’s
CIP and capital budgets were reviewed by staff from Whitman & Requardt, Inc., and incorporated into the master plan for each system and capital project section of this report. The assumptions made as to the funding of future capital projects and purchases of fixed assets, either with cash or through the issuance of debt are reported in this section.
1. Existing Debt Service
The water system has outstanding debt with a total principal balance of approximately $3.2 million. This principal amount is scheduled to be repaid over the next 13 years with scheduled interest payments totaling almost $ 532,000.
The wastewater system has over $27 million of outstanding bond issues at this time. This principal amount is scheduled to be repaid over the next 18 years with scheduled interest payments totaling almost $8.9 million.
6
The total existing debt service for both the water and wastewater systems are presented in Schedule 8 of the Town’s water and wastewater rate model shown in the appendix to this
report.
2. Expected Capital Improvements
The expected capital improvements were derived from the Town of Ocean City’s CIP for the
water and wastewater departments. The engineering consultant members of our project team from Whitman Requardt Engineers reviewed the water and wastewater CIP’s with a focus on four areas – the timing of the items as scheduled on the COP, the adequacy of the costs listed in the CIP, any recommended additions or deletions from the current CIP, and any regulatory issues that may warrant additional consideration.
As a result of their review of the water department CIP, Whitman Requardt had the following recommendations:
Water Main Upgrades $ 1,075,000 Raw Water Main to 66th St 845,000 Treatment Plant Improvements 970,000 66th Street Water Plant - land 1,250,000 66th Street Water Plant - design & construction 5,500,000 Conversion To Automatic Water Meter Reading 600,000 1st Street Water Tower 4,000,000 Total Water Fund Capital Improvements $ 14,240,000
As a result of their review of the wastewater department CIP, Whitman Requardt had the following recommendations:
Wastewater Mains 15,000,000 4th Secondary Clarifier & Improvements 6,000,000 Elevate Incoming Electrical Gear - treatment plant 1,251,450 Ocean outfall lining under beach dune line 1,166,000 Replace Pista Grit Unit 400,000 Oxygen building SCADA upgrades & repairs 600,000 Primary Influent Building MCCA - Replacements 425,000 28th Street pumping station 1,825,000 Chloring contact chamber expansion 1,500,000 Total Wastewater Capital Improvements $ 28,167,450
The water and wastewater system CIPs are presented in Schedule 7 of the Town’s water and
wastewater rate model in the appendix to this report.
3. Cash Purchases of Assets
For purposes of this study, it was assumed that a portion of assets identified in both the water and wastewater department’s CIPs covering the current fiscal year and the next will be
funded with cash outlays. The funds would come either from rates or cash on hand or in reserves for the water and wastewater departments and is found on Schedule 7A.
7
4. Anticipated Debt Service
At the time of this study, new debt financing for capital projects is anticipated for both the water and wastewater utilities over the next few years. For rate modeling purposes, it was estimated that certain items in the water and waste water CIPs would be funded by issuing bonds during the period from FY 2016 – FY 2020.
The estimates made regarding the funding of the water and wastewater capital projects with cash outlays and the issuance of debt are presented in Schedule 15B of the water and wastewater rate model shown in the appendix to this report.
E. Revenue Requirements for Water & Wastewater Rates
The revenue requirements for the water and wastewater systems are simply the total revenues needed by each utility to pay for the total amount of O&M costs, capital costs, plus any reserves established. The cash needed to meet the revenue requirements can come from a variety of sources, such as permits, hook-up fees and other miscellaneous charges. This section summarizes the various cost components of the water and wastewater revenue requirements.
1. Water System Revenue Requirement
The revenue requirement for the water department is split into two major components – operating costs and capital costs, as discussed in Sections C and D (above) of this report. The total estimated operating costs of approximately $4.4 million for the water system consist of the costs for administration, distribution, water plants, meter installation and meter repairs. In addition, the operating reserve allows for unusual or unexpected one-time charges that may arise over the year, or can buffer the impact of lower than anticipated water usage during an excessively wet or dry year. For purposes of this study, an operating reserve base of 2% of the total budget operating costs is included, which amounts to approximately $97,500.
The capital costs component of the water department’s revenue requirement has three elements – capital expenditures to be funded with cash, existing debt service, and projected debt service for future capital expenditures not funded with cash. For purposes of this study, it was assumed that new debt would be issued to pay for approximately $4 million in capital expenditures during fiscal year 2016 along with $6.7 million of the capital projects planned for fiscal year 2020. The total payments for the existing debt service are almost $663,392 for FY2016.
In addition, the Repair, Replacement & Rehabilitation (“3R”) Fund is a reserve to assist in
paying for major projects that were capital related, and to help alleviate possible “spikes” in
the revenue requirement when major projects are required. Typically, utilities with the “3R”
reserve use a percentage of the net book value of their system’s assets. For purposes of this
study, the reserve was calculated at one percent of the water system’s net book value of
approximately $15 million, or about $150,000. This calculation is shown in Schedule 9 of the appendix to this report.
The FY2016 total revenue requirement for the water department therefore consists of total estimated operating costs of $4.4 million and capital costs of approximately $1.8 million, for
8
a combined total revenue requirement of $6.2 million. The water system’s revenue
requirement calculations are presented as Schedule 10 in the appendix to this report.
2. Wastewater System Revenue Requirement
The wastewater system revenue requirement is also split into two components – operating costs and capital costs. The operating cost component totaling approximately $7.8 million consists of the budget costs for administration, the collection system, and the wastewater treatment plant and laboratory services (as discussed in Section C). As with the water system, an operating reserve is charged to allow for unexpected or unusual expenses. The operating reserve of 2% adds approximately $168,500 to the total operating revenue requirement for the wastewater system.
The capital cost component of the wastewater department’s revenue requirement also has
three elements – capital expenditures to be funded with cash, existing debt service, and projected debt service for future capital expenditures not funded with cash. For purposes of this study, it was again assumed that new debt would be issued to pay for approximately $24.6 million in capital expenditures during fiscal years 2016 and 2020. The total payments for the existing debt service are about $3.1 million for FY2016.
As with the water system, a Repair, Replacement & Rehabilitation (“3R”) Fund assists in paying for major projects that are capital related, and to help alleviate possible “spikes” in the
revenue requirement when major projects are required. As stated above, utilities with a “3R”
reserve use a percentage of the net book value of their system’s assets. The reserve for the
wastewater department was calculated at one percent of the water systems net book value of approximately $53.3 million, or about $533,700. This calculation is shown in Schedule 9 of the appendix to this report.
The FY2016 total revenue requirement for the wastewater department therefore consists of total estimated operating costs of $7.8 million and capital costs of approximately $4.9 million, for a combined total revenue requirement of $12.7 million. The water system’s
revenue requirement calculations are presented as Schedule 10 in the appendix to this report.
F. Other Income
In order to determine the amount of revenues required from user charges it is necessary to estimate the level of income that the water and wastewater utilities will receive from other sources, such as interest income, permits and fees, and miscellaneous other charges to water and wastewater customers.
1. Other Income
The water department has limited sources of revenues other than the user fees currently charged. Additional revenues are anticipated from interest on delinquent accounts in the amount of $4,000 sales of materials and services of $30,000 and water connections services (which are discussed below) of $165,000. The total estimated income from sources other than water rates for FY2016 is $216,255.
The wastewater department has several additional sources of income other than user fees. The largest revenue sources are plumbing permits which provide about $66,000 and lab fees
9
which generate about $90,450. Total revenues from sources other than wastewater rates are estimated at $272,194 for FY 2016.
The total other income for the water and wastewater departments is summarized in Schedule 6 of the Town’s water and wastewater rate model in the appendix to this report.
2. Connection Charges
One of the revenue sources other than user fees for the water and wastewater utilities is connection charges. These fees are based on the estimated costs of the Town to install a water meter and hook-up to the water system or connect to wastewater system. The charge for installation of a water meter varies depending on the cost to install the meter, ranging from $1,500-$2,000 for a 1” meter to $25,000 to $30,000 for a 10” meter. Connection charges for the wastewater system can range from $4,500 to $8,500 depending on the size of the service connection and street width and are reviewed on a regular basis to ensure they adequately reflect the cost of the service provided.
3. Impact Fees
The Town of Ocean City uses impact fees or system development charges which have been are billed to new customers since 2005. Impact fees are charged to help pay for the costs associated with expansion of the utility’s capacity. As of June 30, 2014, debt service for expansion of water system capacity exceeded impact fees collected since 2005 by $1,143,387. Debt service for expansion of wastewater capacity exceeded impact fees collected since 2005 by $1,406,476.
4. Costs Related to Wastewater Service for West Ocean City
The wastewater treatment plant in Ocean City provides sewage treatment for the sewage flows transported to it from West Ocean City, which is outside the corporate limits of Ocean City. The sewage is transported across the bay via a dedicated pipeline, and then flows through Ocean City’s collector system to the plant at 65
th street. In a typical situation, Ocean city would charge West Ocean City a sewer rate higher than the rate that was charged to residents of Ocean City. The use of higher rates for service outside the boundaries of a municipal utility’s service area is a fairly typical method to reimburse the utility for financial
risks taken (e.g., the responsibility for debt issued to build capacity for use outside its corporate limits) and for the use of the utility’s credit.
The agreement between the Town of Ocean City and Worcester County transferring the assets and liabilities of Sanitary District #1 (basically, the Ocean City Treatment Plant) to the Town of Ocean City requires that Ocean City charge Worcester County for sewer service provided to West Ocean City on the same basis as sewer service is charged in Ocean City. That is, the Town of Ocean City is precluded from charge the County any profit or surcharge for service provided to West Ocean City.
The basic principal of utility rate-making is to identify or allocate costs to those customers, customer groups or customer classes who are responsible for the costs which are incurred. This approach has been followed in developing rates within Ocean City.
10
For rate making purposes, West Ocean City is one customer; the bill is sent by Ocean City to Worcester County, which then bills the residents of West Ocean City. The calculation of the amount that is charged for service to West Ocean City is exactly the same as that used in Ocean City, and includes no profit or surcharge.
Capital costs are allocated on the basis of the higher of capacity used or reserved. Worcester County requested that 1.0 MGD of capacity be reserved for West Ocean City; this amount of capacity is sufficient to serve existing residents of West Ocean City, and accommodate the growth that is expected in West Ocean City. This amount of capacity represents approximately 7.14% of the total capacity of the Ocean City Treatment plant, so 7.14% of the annualized capital costs for the treatment plan (equal to approximately $210,800 in Fiscal Year 2015) are charged to West Ocean City.
Operating costs are allocated based on the quantity of sewage treated from West Ocean city as a proportion of the total flow treated at the plant. West Ocean City’s
flows, on an annual basis, is approximately 10-11% of the total flow to the plant, resulting in an allocation of $633,787 in operating costs to West Ocean City for Fiscal Year 2015.
The total cost of treating sewage from West Ocean City includes both the costs of building the plant (reflected principally as annual debt service on bonds for which Ocean City is now and will be responsible) and the costs of operating the plant.
The allocation of costs to West Ocean City is presented in Schedule 11 of the Town’s water
and wastewater rate model in the appendix to this report.
5. Availability Charge for Vacant Lots
The capital costs of the water and sewer system are fixed; that is when capacity is constructed, the costs related to paying for the capacity must be paid by Ocean City, whether or not the capacity is currently being used. The most obvious example of this situation is the construction of water and sewer systems to serve seasonal customers, who use the capacity on only an irregular basis, or for part of the year.
A less obvious cost but just as real for Ocean City is the building of capacity for vacant lots; Ocean City must have the capacity to serve these lots, but does not know when construction will actually occur on the lots. It is equitable and fair to charge the owners of these lots for the capital costs of developing and having available the system capacity to serve these lots. It is not appropriate to charge vacant lots for any of the operating costs of the water or sewer systems, because the vacant lots are not responsible for, nor do they benefit from, these costs. If a lot/parcel will not receive water or sewer service (e.g., a parking lot), it is not appropriate to charge an availability fee to the property. Likewise, if the City were to exhaust its capacity for additional customers, it could not reasonably impose an availability fee for vacant lots unless and until it developed additional capacity.
The cost to Ocean City of having water and sewer service available to a vacant lot on the assumption that the vacant lot will be the site of an equivalent Dwelling Unit (EDU), is the approximation of the amount of demand that a single family dwelling can place on a water or sewer system. This calculation is as follows:
11
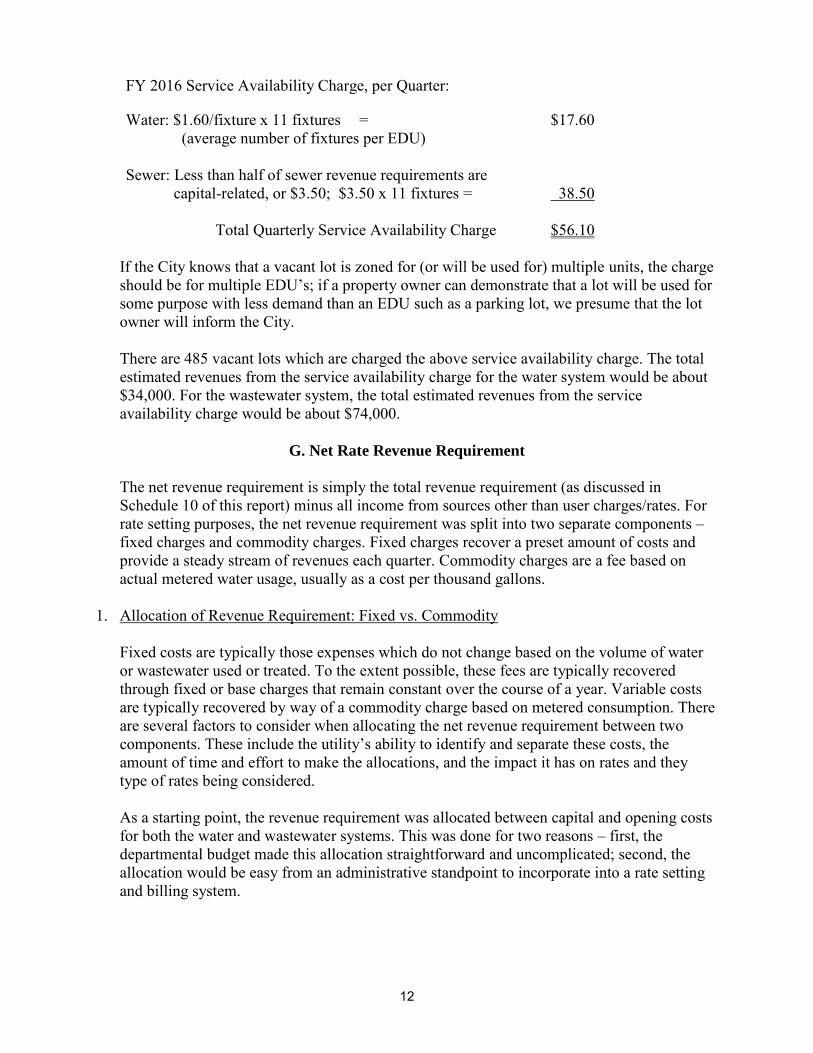
FY 2016 Service Availability Charge, per Quarter:
Water: $1.60/fixture x 11 fixtures = $17.60 (average number of fixtures per EDU)
Sewer: Less than half of sewer revenue requirements are capital-related, or $3.50; $3.50 x 11 fixtures = 38.50
Total Quarterly Service Availability Charge $56.10
If the City knows that a vacant lot is zoned for (or will be used for) multiple units, the charge should be for multiple EDU’s; if a property owner can demonstrate that a lot will be used for
some purpose with less demand than an EDU such as a parking lot, we presume that the lot owner will inform the City. There are 485 vacant lots which are charged the above service availability charge. The total estimated revenues from the service availability charge for the water system would be about $34,000. For the wastewater system, the total estimated revenues from the service availability charge would be about $74,000.
G. Net Rate Revenue Requirement
The net revenue requirement is simply the total revenue requirement (as discussed in Schedule 10 of this report) minus all income from sources other than user charges/rates. For rate setting purposes, the net revenue requirement was split into two separate components – fixed charges and commodity charges. Fixed charges recover a preset amount of costs and provide a steady stream of revenues each quarter. Commodity charges are a fee based on actual metered water usage, usually as a cost per thousand gallons.
1. Allocation of Revenue Requirement: Fixed vs. Commodity
Fixed costs are typically those expenses which do not change based on the volume of water or wastewater used or treated. To the extent possible, these fees are typically recovered through fixed or base charges that remain constant over the course of a year. Variable costs are typically recovered by way of a commodity charge based on metered consumption. There are several factors to consider when allocating the net revenue requirement between two components. These include the utility’s ability to identify and separate these costs, the
amount of time and effort to make the allocations, and the impact it has on rates and they type of rates being considered.
As a starting point, the revenue requirement was allocated between capital and opening costs for both the water and wastewater systems. This was done for two reasons – first, the departmental budget made this allocation straightforward and uncomplicated; second, the allocation would be easy from an administrative standpoint to incorporate into a rate setting and billing system.
12
H. Identification and Evaluation of Alternative Rate Designs
The Town of Ocean City currently charges water customers a minimum charge based on number of fixtures, plus a charge per thousand gallons for all water consumption. For residential customer with 11 fixtures, the current charges each quarter are a minimum of $28.60 plus $3.40 per thousand gallons for any usage. Wastewater customers are billed a flat rate each quarter based on the number of fixtures in their home or business. The current charge for a residential customer each quarter is $8.45 per fixture, or a charge of $92.95. In identifying the rate structure most appropriate for the Town of Ocean City, a variety of rate designs employed by various jurisdictions were studied the prior rate studies. For the study, they were:
Declining Block Rate (sometimes referred to as a “base/extra capacity” rate) – is the
classic engineering approach to rate design, predicated on the assumption that the “base” load of a water system is what allows the system to be sized for optimum
efficiency, and that the incremental costs related to building and operating extra capacity is what should be charged to larger users with relatively even peak demands. This approach has lost favor in recent years, because it effectively amounts to a “volume discount”, giving incentives to use more water.
Unit Cost Rate – the simplest of rate designs, constructed by taking the total annual
O&M costs and capital costs of the utility, and by dividing by the quantity of water used or number of units served. All units are charged at the same price.
Base Plus Commodity Rate – this design identifies the fixed costs to be recovered
through rates and calculates the monthly cost per customer. The O&M costs are recovered based on total estimated water to be consumed to determine a unit cost per 1,000 gallons of water. This usage charge is then added to the monthly base charge to determine the total customer bill for the period.
Ascending Block Rate or Conservation Rate – typically charges an increasing unit
costs on the next unit of consumption. In other words, the unit cost per gallon of water increases as consumption increases.
Lifeline Rates – which give targeted customers a minimum quantity of water at a
minimum price, with water used above this quantity billed at a higher rate. This approach is revenue neutral; that is, the non-lifeline rates have to be increased sufficiently to offset the revenues lost by water sold at the lifeline rates. If lifeline rates are too low, or if a lifeline discount is given to too many customers, the effect is to render the discount meaningless.
Separating the rate into two components, a fixed cost (which typically included
administrative costs, fixed annual costs, debt service and capital costs) and a variable cost (which consists of those costs which vary with water and wastewater treated, such as energy, chemicals, etc.).
Isolating the costs (both capital and operating) of compliance with environmental
regulations, and showing this costs as an environmental surcharge on the customer
13
bill; this approach illustrates to customers just what environmental requirements translate into in terms of costs, and just what the utility is spending for such purposes.
Seasonal rates, which are employed as a form of conservation rates to hold down
consumption during peak usage months (typically, the summertime). In evaluating these alternatives to determine the most appropriate rate design, considerable attention was given to key factors that are somewhat unique to Ocean City. The first factor is the dramatic change in the Town’s population from a year-round population of approximately 7,800 to almost 300,000 during the peak summer season. The second factor is that to meet the demands placed on both the water and wastewater systems during the peak season, the Town’s fixed costs are relatively high due to the amount of capacity it must have
available for peak demands, and the related financial impacts to the fixed portions of the operating and maintenance costs caused by the large shifts in water and wastewater consumption. Only one water treatment facility operates during low water demand months while all three operate in the summer months. Therefore, for the water fund, it is possible to use the base plus commodity rate design which assigns fixed and capital costs to the base or fixture charge and variable costs to the amount of water flow. A usage charge for all gallons of water consumed encourages conservation and installation of low flow plumbing fixtures As there is only one wastewater treatment plant which handles year-round preliminary treatment including screening and grit removal, primary sedimentation, secondary treatment using a high purity oxygen activated sludge process, and disinfection with chlorine gas followed by dechlorination with sulfur dioxide gas and solids handling processes include gravity thickening for primary sludge, dissolved air flotation of waste activated sludge, sludge dewatering of blended sludge using rotary presses, and an EnVessel™ Pasteurization
Process which produces biosolids meeting Class A levels; virtually all costs are fixed except energy and chemicals. Due to amount of fixed costs required for the wastewater plant to be available to meet 14 mgd peak summer demands and fully operate year round, the unit cost rate is applicable for wastewater treatment. The fixture unit is appropriate because it fairly allocates costs between all users, whether a single family home or condominium unit or a large hotel.
I. Conclusions and Recommendations
The first part of this section presents the conclusions developed based on the review of the Town of Ocean City’s water and wastewater utilities. The next part discusses recommendations for changes or modifications within the water and wastewater departments, including recommended rate structures and user fees. Based on prior year and budgeted costs data and the capital improvement plan, the following is concluded and recommended:
The Town’s accounting system provides all of the necessary costs information for the
water and wastewater systems to allow for a straightforward allocation of costs and calculation of rates.
14
The Town’s budgeting and accounting processes identify all of the costs associated
with providing water and wastewater services, including reasonable allocations of Town overhead costs such as management, human resources, billing and accounting.
The current cost allocation method used to determine the wastewater charges for
West Ocean City recovers the fixed capital costs associated with reserving 1.0 MGD of capacity and providing for the collection and treatment of wastewater from West Ocean City.
Both the water and wastewater systems should continue an operating reserve of 2% of
the total operating revenue requirement for their respective systems to provide for unusual or unexpected operating costs and provide some flexibility in “smoothing” or
leveling out potential rate increases over time. Both the water and wastewater systems should continue a repair, replacement and
rehabilitation (“3R”) reserve to provide funds for large cost items or projects of this
nature without corresponding large or sudden increases in rates. The water system’s minimum charge a quarterly fixed charge of $1.60 per fixture
with no usage included (based on an average of 11 fixtures per account, the quarterly minimum charge would be $17.60.
The water system should charge a commodity charge of $3.70 per 1,000 gallons for
all metered water consumption each quarter (for a water customer using 8,000 gallons a quarter, this would amount to about $66.60.
The quarterly flat rate per fixture for wastewater should be established at $8.80 per
fixture (based on an average of 11 fixtures per account, the average quarterly charge would be $96.80.
Impact fees should continue to be collected to pay for debt service on capital projects
that have expanded or will expand water and wastewater treatment capacity. Vacant lots should be charged a service availability fee of $ 56.10 on a quarterly
basis. The fee is a flat rate based on the capital related portion of the bill for an equivalent dwelling unit (or 11 fixtures). The water system portion of the charge is $17.60 ($1.60 x 11 fixtures). The wastewater system portion of the charge is
$ 38.50 ($3.50 x 11 fixtures).
In addition to the rate changes recommended above, the Town Council should consider adopting a series of scheduled rate increases over the next five years for both the water and wastewater departments. These increases are especially critical to the wastewater system, where reserves are being drawn down to allow for a gradual increase to a level where rates are self-sufficient. In addition, gradually increasing rates in small increments to cover rising costs will hopefully avoid larger, more drastic rate increases in the future.
15
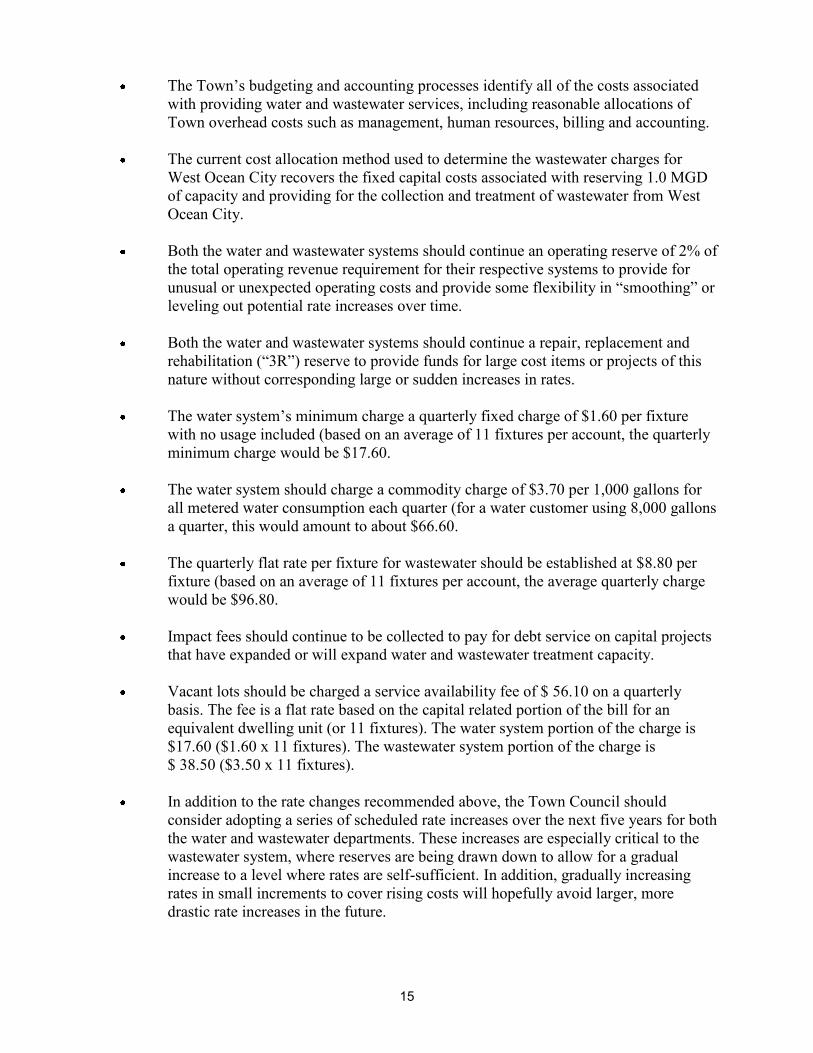
The following is the proposed rate schedule for the period covering fiscal years 2016 – 2020:
Proposed Rates: Current 2016 2017 2018 2019 2020
Water Fixture $ 2.60 $ 1.60 $ 1.60 $ 1.60 $ 1.60 $ 1.60 Wastewater Fixture 8.45 8.80 8.95 9.85 9.45 9.60 Fixture Rate - Combined 11.05 10.40 10.55 10.95 11.05 11.20
Water Usage per 1000 gallons $ 3.40 $ 3.70 $ 3.90 $ 4.00 $ 4.00 $ 4.20
Average Bill:
11 Fixtures & 6,000 gallons/month $ 182.75 $ 181.00 $ 186.25 $ 191.35 $ 193.55 $ 198.80
Percentage change in total bill (0.96%) 2.90% 2.74% 1.15% 2.71%
16
Acknowledgements:
The Town staff thanks the Mayor and City Council for the opportunity to present this Water & Wastewater Comprehensive Rate Study and looks forward to working with them to achieve the goals of the self-sustaining Water & Wastewater funds with investment in infrastructure over the next five years. We believe that the capital program contained in this report will continue the Mayor and City Council’s commitment to the
Town’s infrastructure needs and quality of life in Ocean City.
Financially Sound Government
Excellent Service
Water & Wastewater Comprehensive Rate Study review committees and contributors:
Martha J. Bennett Finance Administrator
Hal Adkins Director of Public Works
Jim Parsons Chief Deputy Director
Charles Felin Wastewater Superintendent
Howard Iman Water Superintendent
Terrence J. McGean, PE City Engineer
Earl L. Swartzendruber, Jr. PE Vice President
Whitman, Requardt & Associates LLP
Dawn Leonard Administrative Office Associate II
17

18
WATER TREATMENT FACILITIES
19
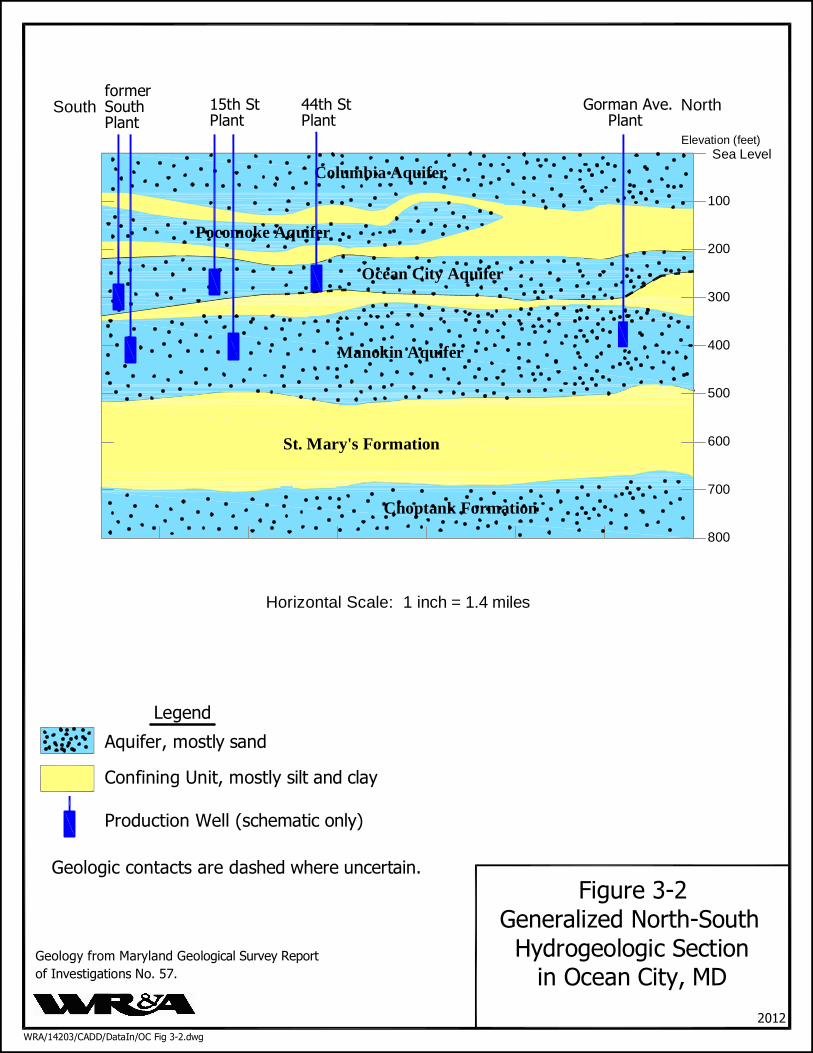
Figure 3-2 Generalized North-South Hydrogeologic Section in Ocean City, MD
2012
Legend
Aquifer, mostly sand
Geology from Maryland Geological Survey Reportof Investigations No. 57.
WRA/14203/CADD/DataIn/OC Fig 3-2.dwg
Sea Level
100
200
North
Elevation (feet)
South
Horizontal Scale: 1 inch = 1.4 miles
300
400
500
600
700
800
Choptank Formation
St. Mary's Formation
Manokin Aquifer
Columbia Aquifer
Pocomoke Aquifer
Ocean City Aquifer
formerSouthPlant
15th StPlant
44th StPlant
Gorman Ave.Plant
Confining Unit, mostly silt and clay
Production Well (schematic only)
Geologic contacts are dashed where uncertain.
DLeonard
Text Box
20
WATER TREATMENT AND DISTRIBUTION FACILITIES
A. Executive Summary
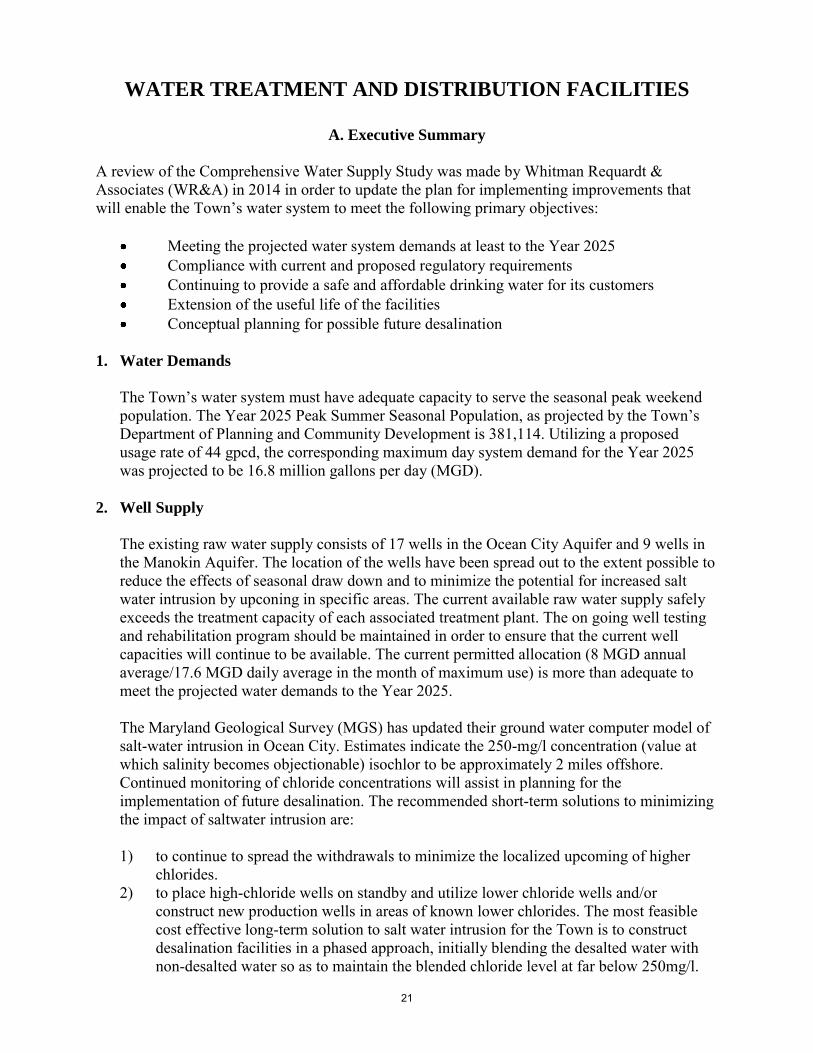
A review of the Comprehensive Water Supply Study was made by Whitman Requardt & Associates (WR&A) in 2014 in order to update the plan for implementing improvements that will enable the Town’s water system to meet the following primary objectives:
Meeting the projected water system demands at least to the Year 2025 Compliance with current and proposed regulatory requirements Continuing to provide a safe and affordable drinking water for its customers Extension of the useful life of the facilities Conceptual planning for possible future desalination
1. Water Demands
The Town’s water system must have adequate capacity to serve the seasonal peak weekend
population. The Year 2025 Peak Summer Seasonal Population, as projected by the Town’s
Department of Planning and Community Development is 381,114. Utilizing a proposed usage rate of 44 gpcd, the corresponding maximum day system demand for the Year 2025 was projected to be 16.8 million gallons per day (MGD).
2. Well Supply
The existing raw water supply consists of 17 wells in the Ocean City Aquifer and 9 wells in the Manokin Aquifer. The location of the wells have been spread out to the extent possible to reduce the effects of seasonal draw down and to minimize the potential for increased salt water intrusion by upconing in specific areas. The current available raw water supply safely exceeds the treatment capacity of each associated treatment plant. The on going well testing and rehabilitation program should be maintained in order to ensure that the current well capacities will continue to be available. The current permitted allocation (8 MGD annual average/17.6 MGD daily average in the month of maximum use) is more than adequate to meet the projected water demands to the Year 2025.
The Maryland Geological Survey (MGS) has updated their ground water computer model of salt-water intrusion in Ocean City. Estimates indicate the 250-mg/l concentration (value at which salinity becomes objectionable) isochlor to be approximately 2 miles offshore. Continued monitoring of chloride concentrations will assist in planning for the implementation of future desalination. The recommended short-term solutions to minimizing the impact of saltwater intrusion are:
1) to continue to spread the withdrawals to minimize the localized upcoming of higher
chlorides. 2) to place high-chloride wells on standby and utilize lower chloride wells and/or
construct new production wells in areas of known lower chlorides. The most feasible cost effective long-term solution to salt water intrusion for the Town is to construct desalination facilities in a phased approach, initially blending the desalted water with non-desalted water so as to maintain the blended chloride level at far below 250mg/l.
21
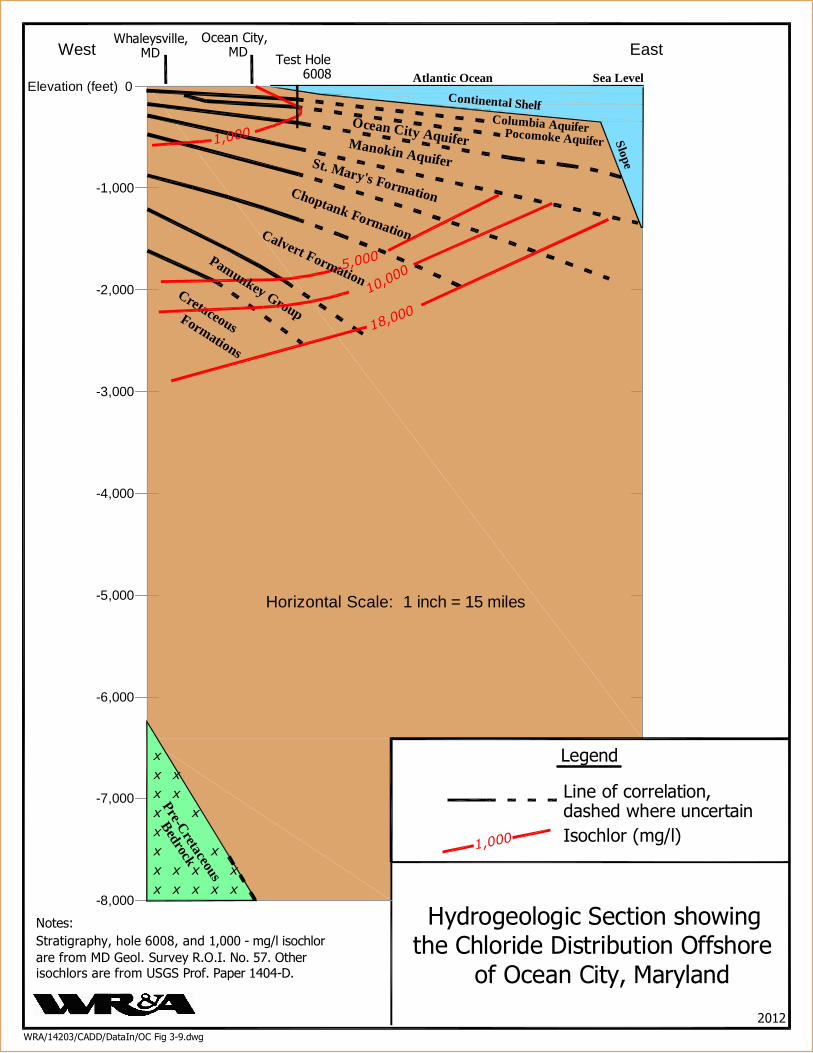
Hydrogeologic Section showing the Chloride Distribution Offshore of Ocean City, Maryland
2012
Legend
Line of correlation,
Notes:Stratigraphy, hole 6008, and 1,000 - mg/l isochlor
WRA/14203/CADD/DataIn/OC Fig 3-9.dwg
-1,000
East
Isochlor (mg/l)
West
are from MD Geol. Survey R.O.I. No. 57. Otherisochlors are from USGS Prof. Paper 1404-D.
-2,000
-3,000
-4,000
-5,000
-6,000
-7,000
-8,000
Elevation (feet) 0
Choptank Formation
St. Mary's Formation
Manokin Aquifer
Ocean City AquiferColumbia AquiferPocomoke Aquifer
Continental Shelf
Slope
Atlantic Ocean Sea Level
1,000
5,000
10,000
18,000
Pamunkey GroupCretaceousFormations
Calvert Formation
MDWhaleysville,
MDOcean City,
6008Test Hole
xxxxxxxx
xx
xx
xx
x
x
x
xx
dashed where uncertain
1,000
Pre-Cretaceous
BedrockHorizontal Scale: 1 inch = 15 miles
DLeonard
Text Box
22
Water Treatment and Distribution Facilities
Whitman, Requardt & Associates, LLP
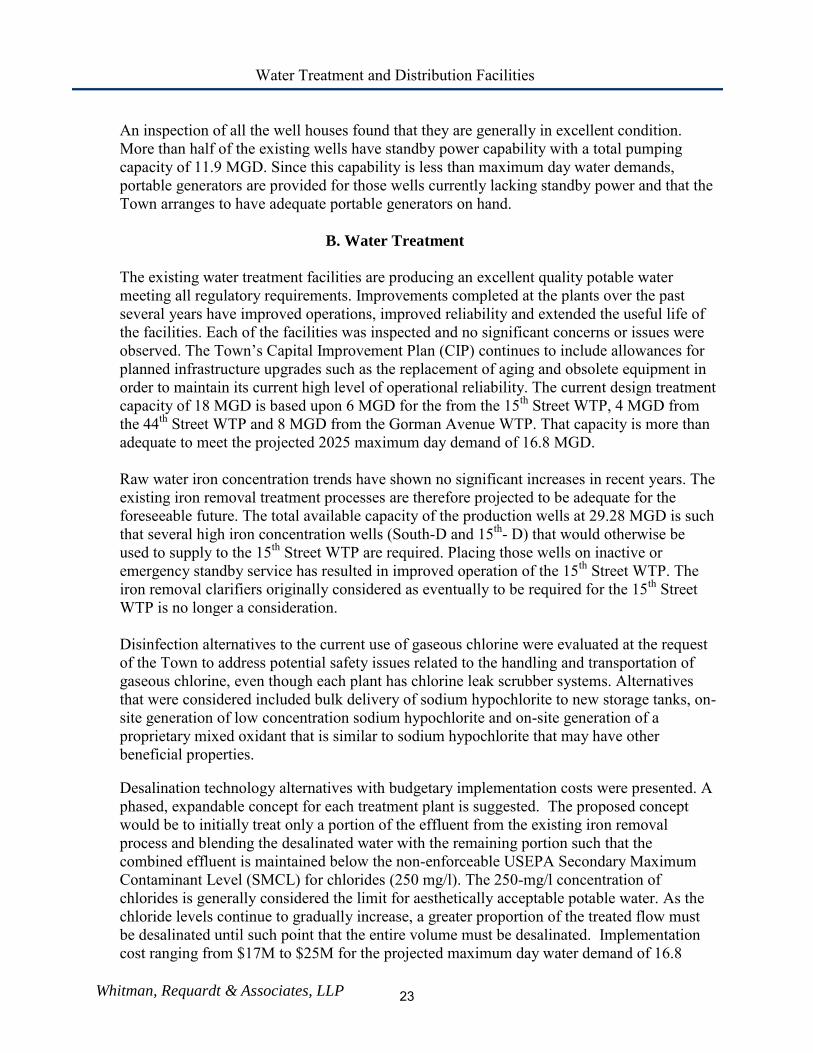
An inspection of all the well houses found that they are generally in excellent condition. More than half of the existing wells have standby power capability with a total pumping capacity of 11.9 MGD. Since this capability is less than maximum day water demands, portable generators are provided for those wells currently lacking standby power and that the Town arranges to have adequate portable generators on hand.
B. Water Treatment
The existing water treatment facilities are producing an excellent quality potable water meeting all regulatory requirements. Improvements completed at the plants over the past several years have improved operations, improved reliability and extended the useful life of the facilities. Each of the facilities was inspected and no significant concerns or issues were observed. The Town’s Capital Improvement Plan (CIP) continues to include allowances for
planned infrastructure upgrades such as the replacement of aging and obsolete equipment in order to maintain its current high level of operational reliability. The current design treatment capacity of 18 MGD is based upon 6 MGD for the from the 15th Street WTP, 4 MGD from the 44th Street WTP and 8 MGD from the Gorman Avenue WTP. That capacity is more than adequate to meet the projected 2025 maximum day demand of 16.8 MGD.
Raw water iron concentration trends have shown no significant increases in recent years. The existing iron removal treatment processes are therefore projected to be adequate for the foreseeable future. The total available capacity of the production wells at 29.28 MGD is such that several high iron concentration wells (South-D and 15th- D) that would otherwise be used to supply to the 15th Street WTP are required. Placing those wells on inactive or emergency standby service has resulted in improved operation of the 15th Street WTP. The iron removal clarifiers originally considered as eventually to be required for the 15th Street WTP is no longer a consideration. Disinfection alternatives to the current use of gaseous chlorine were evaluated at the request of the Town to address potential safety issues related to the handling and transportation of gaseous chlorine, even though each plant has chlorine leak scrubber systems. Alternatives that were considered included bulk delivery of sodium hypochlorite to new storage tanks, on-site generation of low concentration sodium hypochlorite and on-site generation of a proprietary mixed oxidant that is similar to sodium hypochlorite that may have other beneficial properties. Desalination technology alternatives with budgetary implementation costs were presented. A phased, expandable concept for each treatment plant is suggested. The proposed concept would be to initially treat only a portion of the effluent from the existing iron removal process and blending the desalinated water with the remaining portion such that the combined effluent is maintained below the non-enforceable USEPA Secondary Maximum Contaminant Level (SMCL) for chlorides (250 mg/l). The 250-mg/l concentration of chlorides is generally considered the limit for aesthetically acceptable potable water. As the chloride levels continue to gradually increase, a greater proportion of the treated flow must be desalinated until such point that the entire volume must be desalinated. Implementation cost ranging from $17M to $25M for the projected maximum day water demand of 16.8
23
Water Treatment and Distribution Facilities
Whitman, Requardt & Associates, LLP
MGD. Land suitable for desalination facilities is available adjacent to the 15th Street WTP (former library site) and Gorman Avenue WTP (current framed storage building site within yard fencing.). It is recommended that the chloride concentrations continue to be monitored and that appropriate planning efforts discussed herein be scheduled as required for this eventual requirement. The Town of Ocean City’s water treatment and distribution system has several unique physical and operational characteristics as follows: Three separate water treatment facilities that supply water to south, central and north
portions of the system with only one facility typically operating during the low water demand months
Relatively long (10 miles) and narrow (0.2 to 1.0 miles wide) configuration
Six elevated water storage facilities spaced along its length at same overflow elevation of approximately 118’
Dramatic seasonal water demand fluctuations due to differences in population served (7,000 full-time residents and over 300,000 visitors during a peak summer weekend)
The following sections describe the condition of the existing water treatment, storage and distribution facilities; current physical and operational challenges; and recommendations to ensure the adequacy and quality of drinking water distributed to the Town’s residents and
visitors. C. Water Treatment Facilities
There are three ground water treatment facilities owned and operated by the Town of Ocean City Department of Public Works. They include the 15th Street Water Treatment Plant, 44th Street Water Treatment Plant and the Gorman Avenue Water Treatment Plant. These facilities receive ground water pumped from the various wells, treat the water to comply with USEPA drinking water regulations and convey the finished water to the water distribution system. The treatment primarily consists of the oxidation and removal of dissolved iron, adjustment of pH and disinfection.
The current treatment capacity is based upon the following:
15th Street WTP 6 MGD* 44th Street WTP 4 MGD Gorman Avenue WTP 8 MGD
Total 18 MGD
Current treatment capacity currently down-rated based upon Town’s concerns regarding performance at higher rates (Actual design
filtering capacity for 15th Street WTP = 8 MGD) Allowing for an estimated 4% waste as typically required for filter backwashing of the iron removal filters, the current 18 million gallons per day (MGD) treatment capacity will support a maximum water demand of approximately 17.3 MGD (18.0/1.04). The 17.3 MGD
24
Water Treatment and Distribution Facilities
Whitman, Requardt & Associates, LLP
maximum available treatment capacity that may be delivered to the water system is slightly less than the 18 MGD projected maximum day water demand for the Year 2030. However, since the projected 18 MGD maximum day water demand (at Year 2030) includes a 20% allowance for planning purposes, there is no immediate concern that there is a 0.7 MGD deficit (18.0 – 17.3) between projected water demand and deliverable treatment capacity. This projected water delivery deficit can be addressed by the continued periodic review of actual and projected populations and water demands to confirm future water supply needs; conceptual planning for future expansion or enhancement of the water treatment capacity; along with the subsequent implementation of necessary treatment expansion or enhancements when required. In addition, the potential need for desalination facilities in the future to address salt water intrusion must also be factored into water treatment facility planning since desalination facilities typically involve an additional waste component that would further reduce the delivery capacity of the water treatment facilities. The following sections describe the three existing water treatment facilities, and a discussion of general facility upgrades recommended for continued reliability.
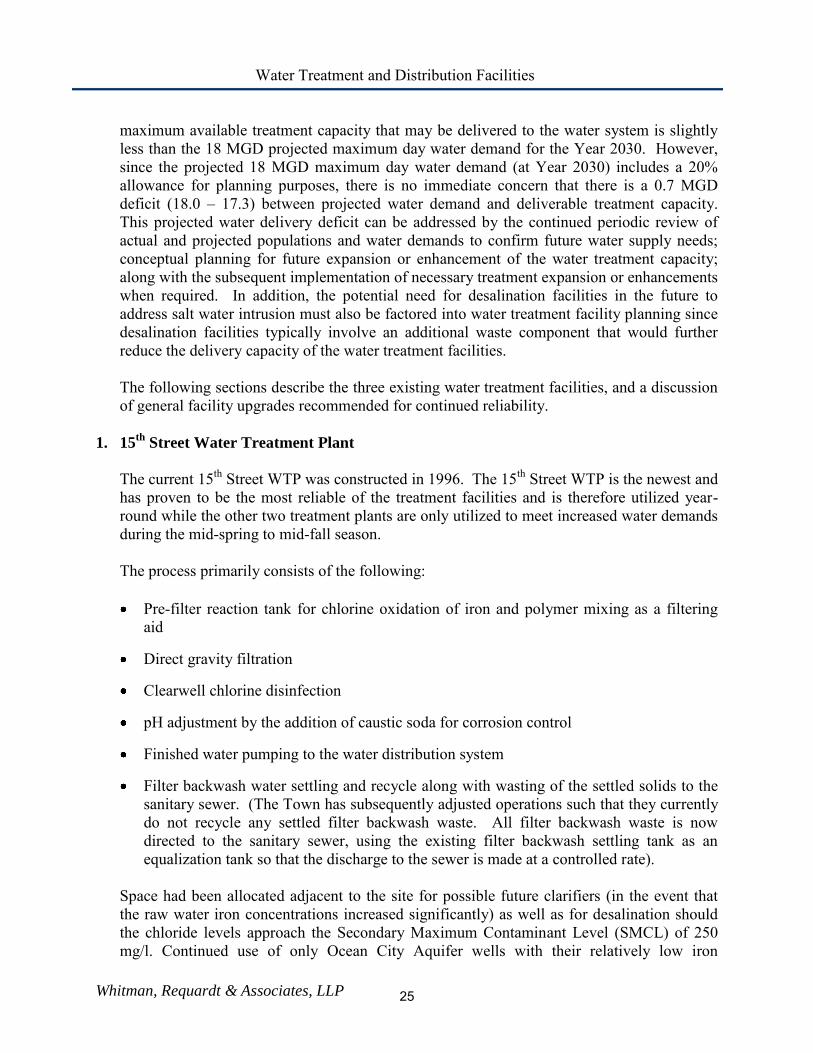
1. 15th
Street Water Treatment Plant
The current 15th Street WTP was constructed in 1996. The 15th Street WTP is the newest and has proven to be the most reliable of the treatment facilities and is therefore utilized year-round while the other two treatment plants are only utilized to meet increased water demands during the mid-spring to mid-fall season. The process primarily consists of the following: Pre-filter reaction tank for chlorine oxidation of iron and polymer mixing as a filtering
aid
Direct gravity filtration
Clearwell chlorine disinfection
pH adjustment by the addition of caustic soda for corrosion control
Finished water pumping to the water distribution system
Filter backwash water settling and recycle along with wasting of the settled solids to the sanitary sewer. (The Town has subsequently adjusted operations such that they currently do not recycle any settled filter backwash waste. All filter backwash waste is now directed to the sanitary sewer, using the existing filter backwash settling tank as an equalization tank so that the discharge to the sewer is made at a controlled rate).
Space had been allocated adjacent to the site for possible future clarifiers (in the event that the raw water iron concentrations increased significantly) as well as for desalination should the chloride levels approach the Secondary Maximum Contaminant Level (SMCL) of 250 mg/l. Continued use of only Ocean City Aquifer wells with their relatively low iron
25
Water Treatment and Distribution Facilities
Whitman, Requardt & Associates, LLP
concentrations averaging approximately 2 mg/l will eliminate the consideration for future clarifiers. Filtering Capacity: The filters were designed to operate at rates up to 4 gallons per minute per square foot (gpm/sf) of filter surface area. That is equivalent to a total filtering rate of 8.4 MGD. Allowing for up to 5% backwash waste, the 15th Street WTP can filter up to 8 million gallons each day. Continued use of only Ocean City Aquifer wells should permit operation of this facility at daily production rates of up to 8 MGD. Standby Power: A 1500 KW standby generator was provided as part of the 15th Street WTP construction. That generator is sized to be able to operate the 15th Street WTP, and nearby Wells A, B, C and D. The well production capacity currently with standby power for the wells typically associated with the 15th Street WTP is 5.8 MGD. That capacity assumes that the two Manokin Aquifer wells are not in service as they are no longer used due to their much higher iron concentration than the Ocean City Aquifer wells serving the 15th Street WTP. In order to ensure a reliable supply of ground water to the 15th Street WTP during a power outage, it is imperative that the recommendations for the improving the standby power capabilities of the production wells be implemented. This can be accomplished by either the construction of new permanent generators at production wells where space allows or constructing and wiring modifications to allow for the connection of a portable generator. Process Optimization Improvements: In addition to possible future implementation of desalination to address salt water intrusion, there are other possible process improvements that may be required, primarily to address the need to reduce concentrations of disinfection byproducts in the distribution system.
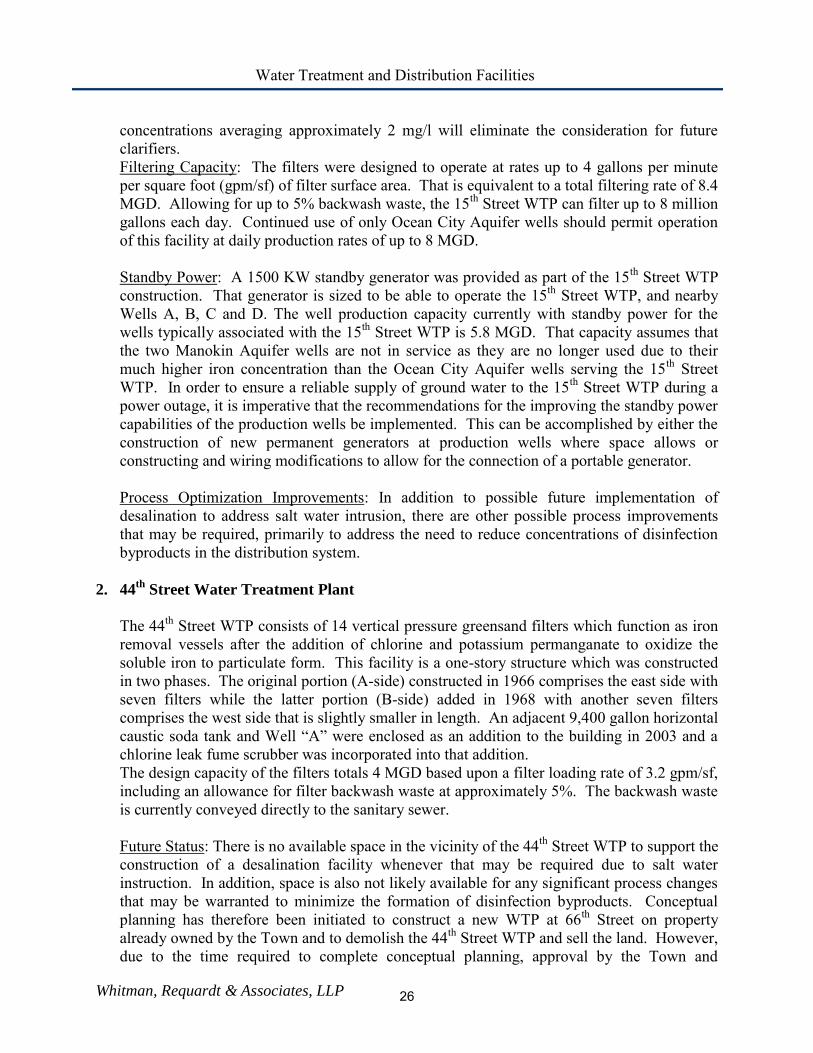
2. 44
th Street Water Treatment Plant
The 44th Street WTP consists of 14 vertical pressure greensand filters which function as iron removal vessels after the addition of chlorine and potassium permanganate to oxidize the soluble iron to particulate form. This facility is a one-story structure which was constructed in two phases. The original portion (A-side) constructed in 1966 comprises the east side with seven filters while the latter portion (B-side) added in 1968 with another seven filters comprises the west side that is slightly smaller in length. An adjacent 9,400 gallon horizontal caustic soda tank and Well “A” were enclosed as an addition to the building in 2003 and a
chlorine leak fume scrubber was incorporated into that addition. The design capacity of the filters totals 4 MGD based upon a filter loading rate of 3.2 gpm/sf, including an allowance for filter backwash waste at approximately 5%. The backwash waste is currently conveyed directly to the sanitary sewer. Future Status: There is no available space in the vicinity of the 44th Street WTP to support the construction of a desalination facility whenever that may be required due to salt water instruction. In addition, space is also not likely available for any significant process changes that may be warranted to minimize the formation of disinfection byproducts. Conceptual planning has therefore been initiated to construct a new WTP at 66th Street on property already owned by the Town and to demolish the 44th Street WTP and sell the land. However, due to the time required to complete conceptual planning, approval by the Town and
26
Water Treatment and Distribution Facilities
Whitman, Requardt & Associates, LLP
implementation of a new 66th Street WTP, the 44th Street WTP must be relied upon to continue successful operation for at least 5 additional years. Therefore, interim improvements may be required at the 44th Street WTP to enable continued successful operation and to comply with water quality and other regulatory requirements. Standby Power: A 130 KW standby generator was provided as part of upgrades to the 44th Street WTP in 2003 to replace an obsolete unit. That generator is sized to be able to operate the 44th Street WTP and Well A that is located within the filter building. Therefore, the available production capacity currently with standby power (or portable generator connection) for the wells typically associated with the 44th Street WTP is 2.3 MGD. In order to ensure a reliable supply of ground water to the 44th Street WTP during a power outage, it is imperative that the recommendations for the improving the standby power capabilities of the production wells be implemented. .
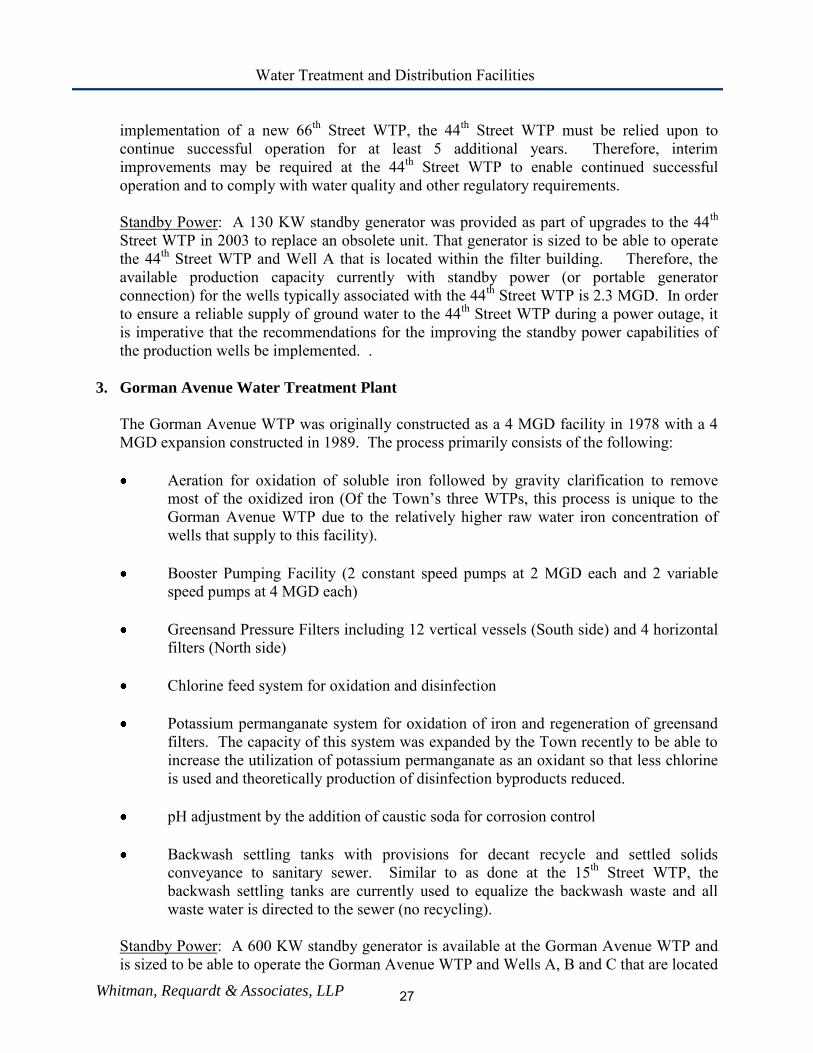
3. Gorman Avenue Water Treatment Plant
The Gorman Avenue WTP was originally constructed as a 4 MGD facility in 1978 with a 4 MGD expansion constructed in 1989. The process primarily consists of the following: Aeration for oxidation of soluble iron followed by gravity clarification to remove
most of the oxidized iron (Of the Town’s three WTPs, this process is unique to the
Gorman Avenue WTP due to the relatively higher raw water iron concentration of wells that supply to this facility).
Booster Pumping Facility (2 constant speed pumps at 2 MGD each and 2 variable speed pumps at 4 MGD each)
Greensand Pressure Filters including 12 vertical vessels (South side) and 4 horizontal
filters (North side)
Chlorine feed system for oxidation and disinfection
Potassium permanganate system for oxidation of iron and regeneration of greensand filters. The capacity of this system was expanded by the Town recently to be able to increase the utilization of potassium permanganate as an oxidant so that less chlorine is used and theoretically production of disinfection byproducts reduced.
pH adjustment by the addition of caustic soda for corrosion control
Backwash settling tanks with provisions for decant recycle and settled solids
conveyance to sanitary sewer. Similar to as done at the 15th Street WTP, the backwash settling tanks are currently used to equalize the backwash waste and all waste water is directed to the sewer (no recycling).
Standby Power: A 600 KW standby generator is available at the Gorman Avenue WTP and is sized to be able to operate the Gorman Avenue WTP and Wells A, B and C that are located
27
Water Treatment and Distribution Facilities
Whitman, Requardt & Associates, LLP
nearby. Well E can be powered by a generator located at a nearby sewage pump station and Well F includes its own standby generator. Therefore, the available production capacity currently with standby power (or portable generator connection) for the wells associated with the Gorman Avenue WTP is 6.5 MGD. In order to ensure a reliable supply of ground water to the Gorman Avenue WTP during a power outage, it is imperative that the recommendations for the improving the standby power capabilities of the production wells be implemented. This can be accomplished by either the construction of new permanent generators at production wells where space allows or constructing and wiring modifications to allow for the connection of a portable generator. The Town would also need to develop a contingency plan that includes the acquisition or rental of portable generators.
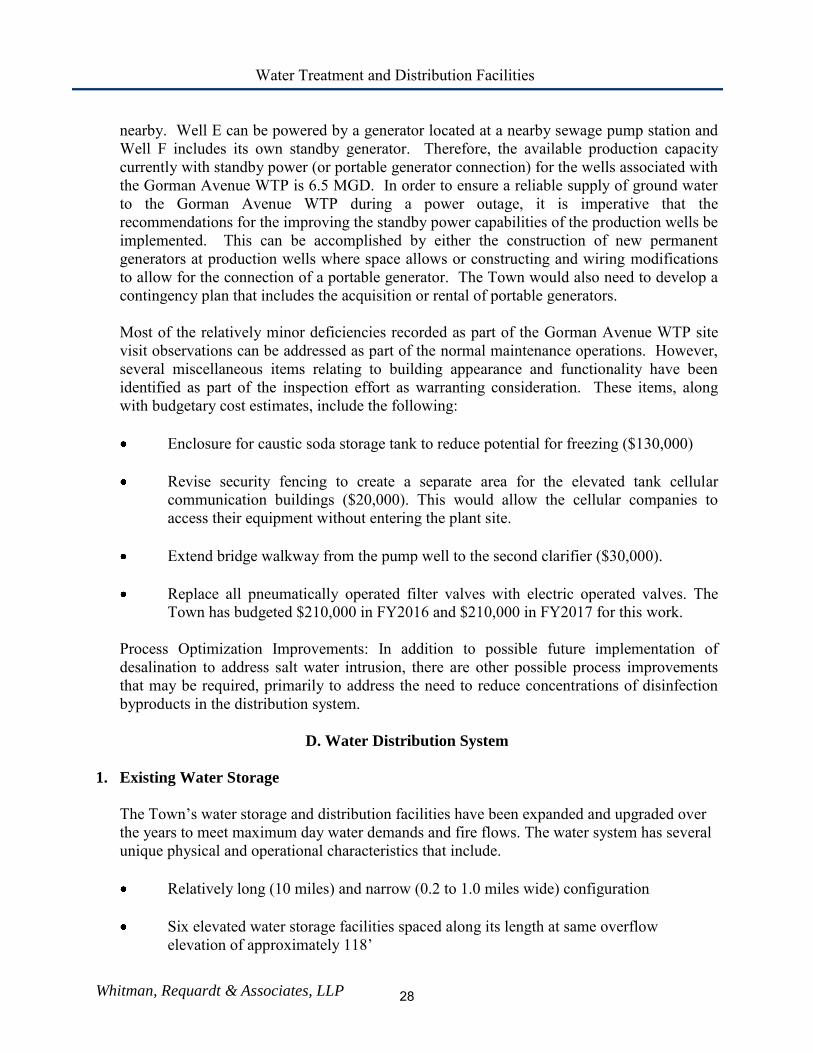
Most of the relatively minor deficiencies recorded as part of the Gorman Avenue WTP site visit observations can be addressed as part of the normal maintenance operations. However, several miscellaneous items relating to building appearance and functionality have been identified as part of the inspection effort as warranting consideration. These items, along with budgetary cost estimates, include the following: Enclosure for caustic soda storage tank to reduce potential for freezing ($130,000)
Revise security fencing to create a separate area for the elevated tank cellular
communication buildings ($20,000). This would allow the cellular companies to access their equipment without entering the plant site.
Extend bridge walkway from the pump well to the second clarifier ($30,000).
Replace all pneumatically operated filter valves with electric operated valves. The
Town has budgeted $210,000 in FY2016 and $210,000 in FY2017 for this work.
Process Optimization Improvements: In addition to possible future implementation of desalination to address salt water intrusion, there are other possible process improvements that may be required, primarily to address the need to reduce concentrations of disinfection byproducts in the distribution system.
D. Water Distribution System
1. Existing Water Storage
The Town’s water storage and distribution facilities have been expanded and upgraded over the years to meet maximum day water demands and fire flows. The water system has several unique physical and operational characteristics that include.
Relatively long (10 miles) and narrow (0.2 to 1.0 miles wide) configuration
Six elevated water storage facilities spaced along its length at same overflow
elevation of approximately 118’
28
Water Treatment and Distribution Facilities
Whitman, Requardt & Associates, LLP
Dramatic seasonal water demand fluctuations due to differences in population served (7,000 full-time residents and over 250,000 visitors during a peak summer weekend)
Three separate water treatment facilities that supply water to south, central and north
portions of the system with only one facility typically operating during the low water demand months.
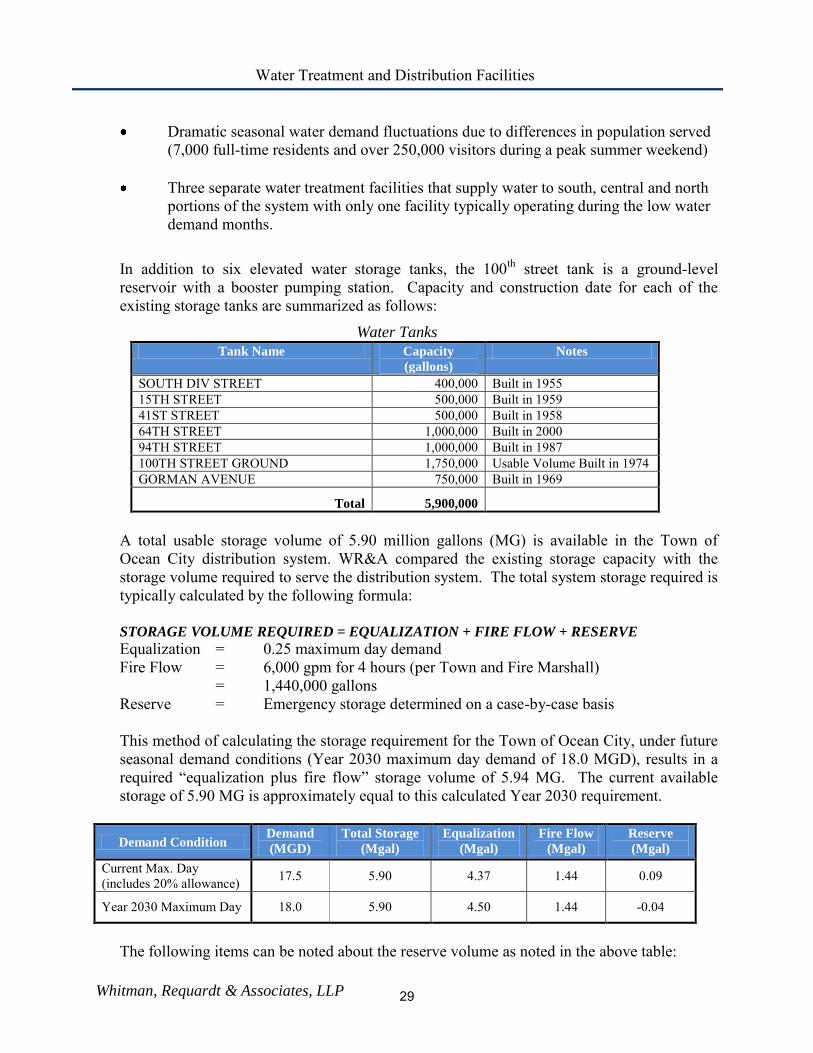
In addition to six elevated water storage tanks, the 100th street tank is a ground-level reservoir with a booster pumping station. Capacity and construction date for each of the existing storage tanks are summarized as follows:
Water Tanks
Tank Name Capacity
(gallons)
Notes
SOUTH DIV STREET 400,000 Built in 1955 15TH STREET 500,000 Built in 1959 41ST STREET 500,000 Built in 1958 64TH STREET 1,000,000 Built in 2000 94TH STREET 1,000,000 Built in 1987 100TH STREET GROUND 1,750,000 Usable Volume Built in 1974 GORMAN AVENUE 750,000 Built in 1969
Total 5,900,000 A total usable storage volume of 5.90 million gallons (MG) is available in the Town of Ocean City distribution system. WR&A compared the existing storage capacity with the storage volume required to serve the distribution system. The total system storage required is typically calculated by the following formula: STORAGE VOLUME REQUIRED = EQUALIZATION + FIRE FLOW + RESERVE
Equalization = 0.25 maximum day demand Fire Flow = 6,000 gpm for 4 hours (per Town and Fire Marshall) = 1,440,000 gallons Reserve = Emergency storage determined on a case-by-case basis This method of calculating the storage requirement for the Town of Ocean City, under future seasonal demand conditions (Year 2030 maximum day demand of 18.0 MGD), results in a required “equalization plus fire flow” storage volume of 5.94 MG. The current available
storage of 5.90 MG is approximately equal to this calculated Year 2030 requirement.
Demand Condition Demand
(MGD)
Total Storage
(Mgal)
Equalization
(Mgal)
Fire Flow
(Mgal)
Reserve
(Mgal)
Current Max. Day (includes 20% allowance) 17.5 5.90 4.37 1.44 0.09
Year 2030 Maximum Day 18.0 5.90 4.50 1.44 -0.04
The following items can be noted about the reserve volume as noted in the above table:
29
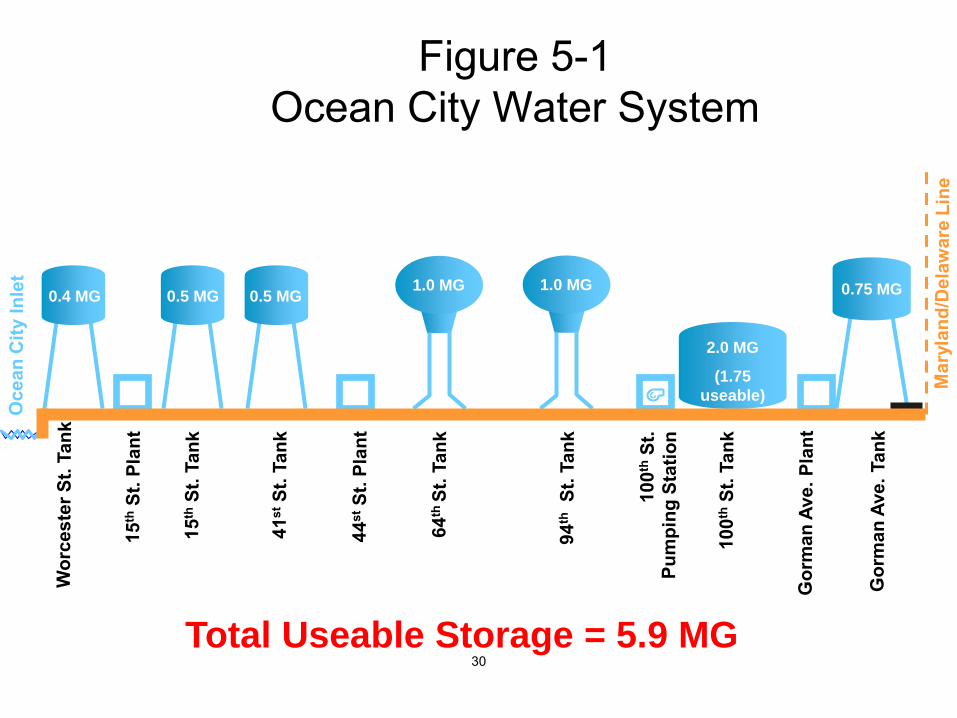
Figure 5-1 Ocean City Water System
2.0 MG
(1.75
useable)
0.5 MG 0.5 MG 1.0 MG 0.75 MG 0.4 MG
6 MGD
1.0 MG
4 MGD 8 MGD
Total Useable Storage = 5.9 MG 30
Water Treatment and Distribution Facilities
Whitman, Requardt & Associates, LLP
Ample storage is available to meet storage needs from current demands through Year
2030 demands with even greater reserve storage due to decreased equalization volume, which is based on maximum day demand as shown in the formula above.
Year 2030 maximum day demand occurs over limited times on specific weekends during the peak season, and it is unlikely that a water emergency will coincide.
Sufficient emergency power supply for water supply, treatment and pumping will
minimize reserve requirement.
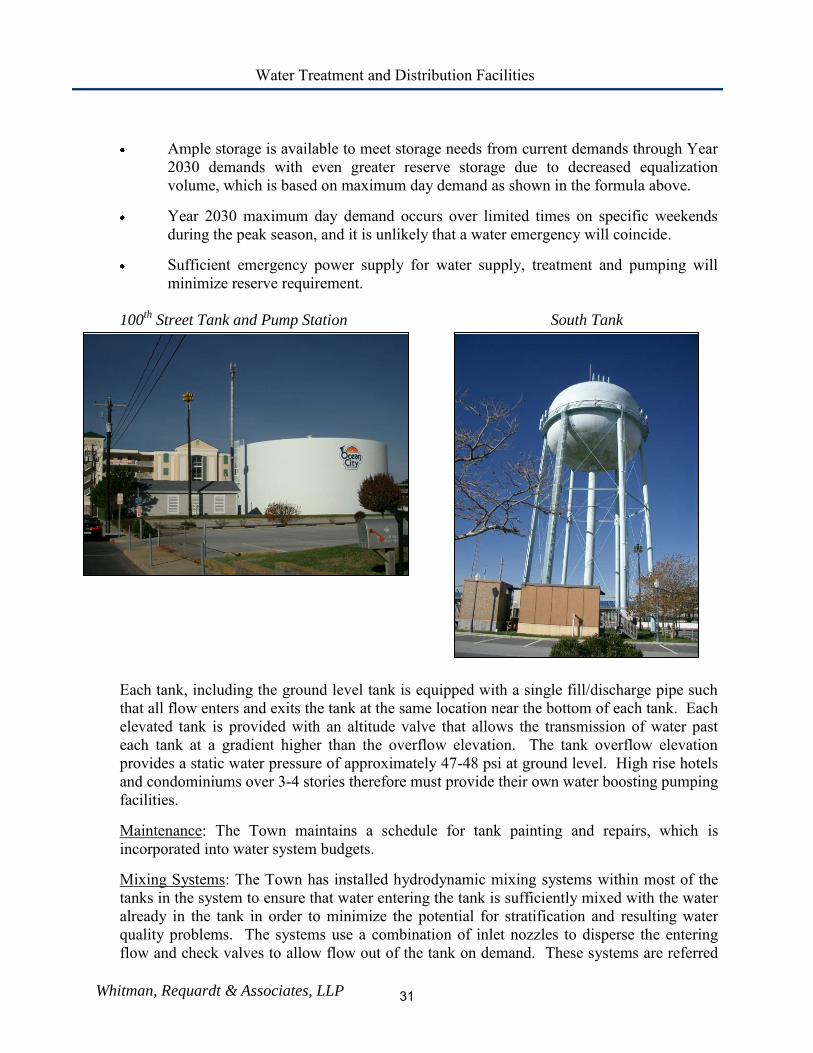
100th
Street Tank and Pump Station South Tank
Each tank, including the ground level tank is equipped with a single fill/discharge pipe such that all flow enters and exits the tank at the same location near the bottom of each tank. Each elevated tank is provided with an altitude valve that allows the transmission of water past each tank at a gradient higher than the overflow elevation. The tank overflow elevation provides a static water pressure of approximately 47-48 psi at ground level. High rise hotels and condominiums over 3-4 stories therefore must provide their own water boosting pumping facilities. Maintenance: The Town maintains a schedule for tank painting and repairs, which is incorporated into water system budgets. Mixing Systems: The Town has installed hydrodynamic mixing systems within most of the tanks in the system to ensure that water entering the tank is sufficiently mixed with the water already in the tank in order to minimize the potential for stratification and resulting water quality problems. The systems use a combination of inlet nozzles to disperse the entering flow and check valves to allow flow out of the tank on demand. These systems are referred
31
Water Treatment and Distribution Facilities
Whitman, Requardt & Associates, LLP
to as “passive” mixing systems since they do not involve any mechanical mixing equipment. Instead, they rely upon significant tank water level fluctuation throughout the day so that the nozzles can thoroughly mixer the entire tank volume during the tank filling cycle. The Town, concerned that they were not able to vary tank water levels sufficiently for optimal mixing using the “passive” mixing system, installed an “active” mixing system in the 100
th Street Tank as an experiment. That system included a small mechanical impeller installed on the tank bottom in the center. Based upon performance at that tank, active mixing systems have been installed at all other tanks, including those that already had been equipped with passive mixing systems.
2. 100
th Street Booster Pumping Station
This facility consists of control valves that fill the 100th Street ground level tank using system pressure. Three 1,000 gpm booster pumps direct water from the ground-level tank to the system. The station is remotely operated each day to promote water turnover in the tank. During periods of high water demand or in the event of a fire, the station is operated to maximize the use of available water in the tank. Upgrades of the facility were completed in 1999 and 2000 that included exterior architectural upgrades, HVAC upgrades, instrumentation upgrades and the addition of a standby generator. The standby generator is capable of providing sufficient power for the station to operate at safe capacity. The station is operating with no reported problems.
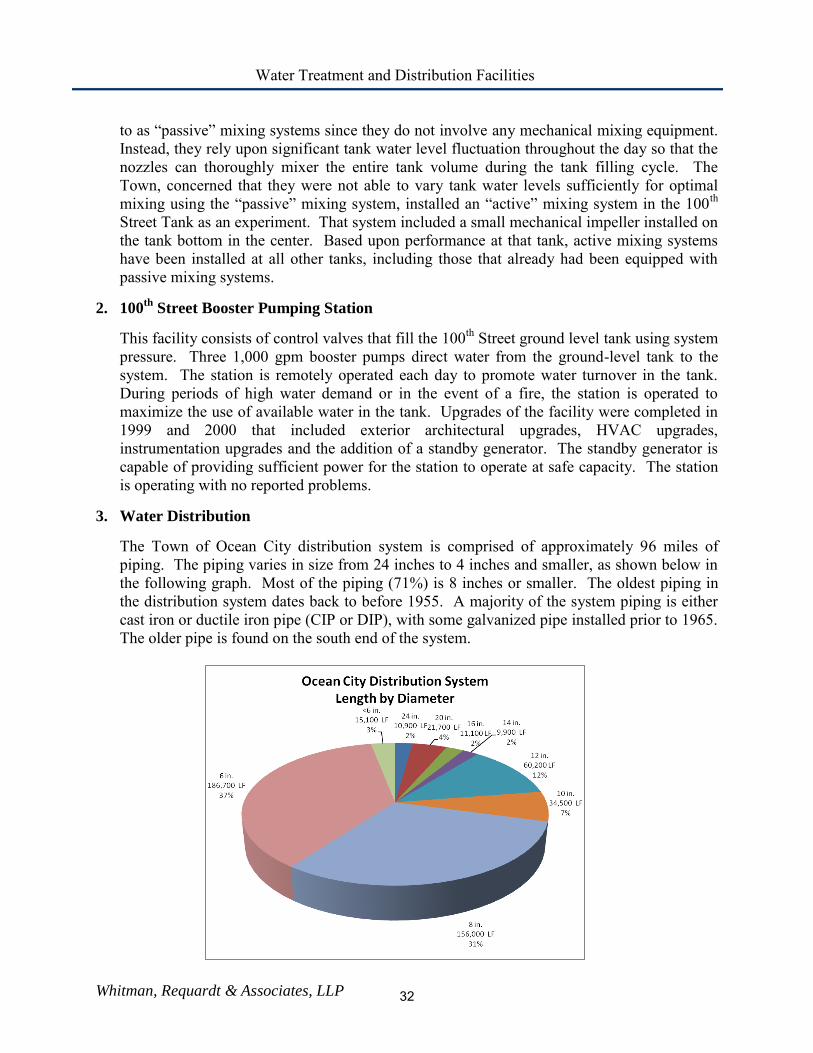
3. Water Distribution
The Town of Ocean City distribution system is comprised of approximately 96 miles of piping. The piping varies in size from 24 inches to 4 inches and smaller, as shown below in the following graph. Most of the piping (71%) is 8 inches or smaller. The oldest piping in the distribution system dates back to before 1955. A majority of the system piping is either cast iron or ductile iron pipe (CIP or DIP), with some galvanized pipe installed prior to 1965. The older pipe is found on the south end of the system.
32
Water Treatment and Distribution Facilities
Whitman, Requardt & Associates, LLP
The water distribution system generally consists of multiple north-south finished water transmission mains in Coastal Highway (Philadelphia Avenue in the southern section of Town) ranging in size from 16” to 24” in diameter, along with numerous smaller distribution lines (4” to 12” in diameter) in the side and cross streets. The water distribution system has
been upgraded and reinforced in recent years to meet fire flow requirements while maintaining adequate residual pressures. Except for a few isolated small sections, all streets are served by at least a 6” main and most streets are served by 8” mains. The water distribution system, due to its long and narrow configuration and presence of multiple parallel canals separating streets on the bay side of the island, includes many dead ends. The shorter dead ends along Coastal Highway are not an issue relative to fire protection due to their close proximity to the larger mains serving hydrants along Coastal Highway. Recently, the Town has undertaken a series of sub-aqueous crossings to connect dead end lines across the canals and improve fire protection in these areas. The water mains are reportedly in acceptable condition with little evidence of corrosion, scale or tuberculation. The water mains are flushed twice each year in the fall and spring to remove accumulated debris and iron sediment. This practice involves the opening of every fire hydrant in sequence until the discharge appears clear. Automatic flushing devices have been installed at several locations typically associated with low flow to serve to promote improved water age. The devices can be set to flush at predetermined intervals and durations. The flushing devices also serve as sampling stations for water quality monitoring.
4. System Operations
Water supply to the distribution system from the three water treatment facilities is typically based upon the anticipated daily water demand. As indicated above, the extreme variance in population served between the summer and winter months impacts the plant operations such that only one facility operates during the low water demand months while all three operate during the summer months. The existing water distribution system is capable of delivering an adequate supply of finished water to all portions of the system regardless of how many or which treatment facility is operating. The water storage tanks are relied upon to meet the maximum hourly water demands and fire flow demands. The storage tanks also are required to meet system water demands during the temporary plant outages for filter backwashing (1-2 hours per day for each plant).
A study entitled “Water Distribution System Water Quality assessment” was performed in
2005 to focus on water system conditions and operations as pertaining to microbial occurrence. Several recommendations were presented including conducting an “Enhanced
Water Quality Monitoring Program”, which was initiated in October 2005 to gain a better
understanding of microbial conditions throughout the distribution system. Looping of dead-ends was done to promote circulation and two automatic flushing devices, north and south, were installed.
33
Water Treatment and Distribution Facilities
Whitman, Requardt & Associates, LLP
The Town’s hydraulic water system model was updated to reflect new water main construction
and new water demand information. The hydraulic modeling evaluations were performed to assess the capabilities and limitations of the existing storage and distribution system, as well as to plan a logical and cost effective program of system improvements to meet existing and future demands and fire protections requirements. The hydraulic modeling has therefore considered the current off-season low water demand conditions typically expected to be accompanied by greater hydraulic retention time as well as the normally modeled conditions of meeting projected maximum day water demands.
Current off-seasonal low flow conditions were modeled with an average day demand of 1.93 MGD. The demand was met by placing a single WTP in operation, which has the following implications: Hydraulic Retention Time (HRT): HRT is used as an indicator of water quality, and
appears to be 10 days or greater in a large portion of the system due to the distance the water must travel to reach the farthest reaches of the system, the storage volume of the distribution system piping (approximately 2 MG) and the storage volume of the water tanks (6.55 MG)
Fire Flow: the 6,000 gpm for 4 hour fire flow requirement along Coastal Highway
does not appear to be met in the northern area of the system, whereas the central and southern areas appear to meet this fire flow requirement. Also, selected tanks cannot be taken out of service for the off-season without compromising the system’s ability
to meet fire flow demands.
Because of the concerns discussed above with fire flow requirements, the following operational scenarios were modeled:
Additional storage in the vicinity of Gorman Avenue to meet the 1.44 MG fire
volume requirement allowed the 6,000 gpm fire flow to be met for a duration of 4 hours, but increased HRT in the vicinity.
Additional transmission capacity to move water north from the 100th Street tank /
pump station and the 94th Street elevated tank. A 16-inch main was modeled from 100th Street north to 130th Street, which allowed the 6,000 gpm fire flow to be met for a 4-hour duration with no additional storage or pumping capacity added.
Addition of high capacity fire pump at the 100th Street tank / pump station was
modeled extensively, and appears to have little effect on the outcome because the water is not dedicated to the fire event, and flows to other demands in the system.
Gorman WTP is modeled to supply base off-season flow, while maintaining the
ability to accelerate production immediately to 8 MGD should an emergency fire flow demand occur. The model indicated that this operational scenario allows the fire flow to be met while maintaining proper pressures in the distribution system.
34
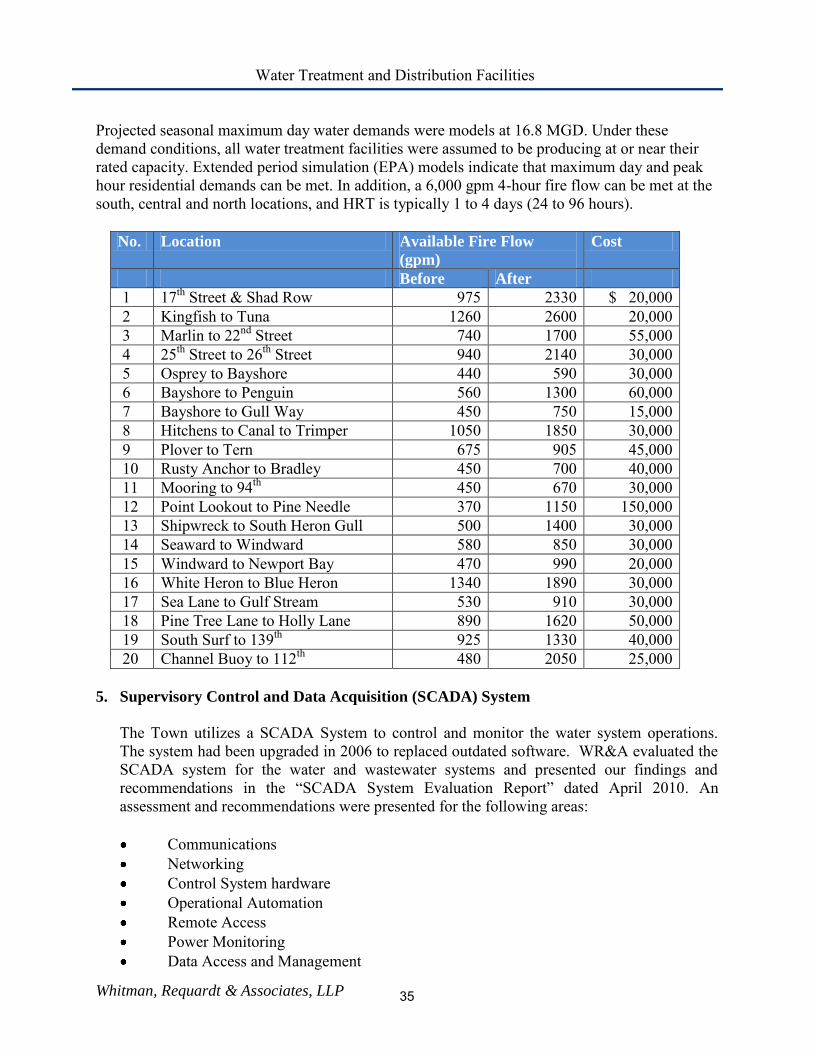
Water Treatment and Distribution Facilities
Whitman, Requardt & Associates, LLP
Projected seasonal maximum day water demands were models at 16.8 MGD. Under these demand conditions, all water treatment facilities were assumed to be producing at or near their rated capacity. Extended period simulation (EPA) models indicate that maximum day and peak hour residential demands can be met. In addition, a 6,000 gpm 4-hour fire flow can be met at the south, central and north locations, and HRT is typically 1 to 4 days (24 to 96 hours).
No. Location Available Fire Flow
(gpm)
Cost
Before After
1 17th Street & Shad Row 975 2330 $ 20,000 2 Kingfish to Tuna 1260 2600 20,000 3 Marlin to 22nd Street 740 1700 55,000 4 25th Street to 26th Street 940 2140 30,000 5 Osprey to Bayshore 440 590 30,000 6 Bayshore to Penguin 560 1300 60,000 7 Bayshore to Gull Way 450 750 15,000 8 Hitchens to Canal to Trimper 1050 1850 30,000 9 Plover to Tern 675 905 45,000 10 Rusty Anchor to Bradley 450 700 40,000 11 Mooring to 94th 450 670 30,000 12 Point Lookout to Pine Needle 370 1150 150,000 13 Shipwreck to South Heron Gull 500 1400 30,000 14 Seaward to Windward 580 850 30,000 15 Windward to Newport Bay 470 990 20,000 16 White Heron to Blue Heron 1340 1890 30,000 17 Sea Lane to Gulf Stream 530 910 30,000 18 Pine Tree Lane to Holly Lane 890 1620 50,000 19 South Surf to 139th 925 1330 40,000 20 Channel Buoy to 112th 480 2050 25,000
5. Supervisory Control and Data Acquisition (SCADA) System
The Town utilizes a SCADA System to control and monitor the water system operations. The system had been upgraded in 2006 to replaced outdated software. WR&A evaluated the SCADA system for the water and wastewater systems and presented our findings and recommendations in the “SCADA System Evaluation Report” dated April 2010. An assessment and recommendations were presented for the following areas:
Communications Networking Control System hardware Operational Automation Remote Access Power Monitoring Data Access and Management
35
Water Treatment and Distribution Facilities
Whitman, Requardt & Associates, LLP
System Documentation SCADA System Management
F. Capital Improvement Program (CIP)
The Town’s Water Department continues to prepare an updated CIP each year for the
consideration of the Mayor and City Council. The preparation of the Town’s CIP for water system improvements is typically based upon a combination of the following:
Scheduling of major capital improvements (such as new wells and major plant upgrades) as
recommended by the Town’s water consultant.
Scheduling of repainting and maintenance of the water storage facilities as recommended by the Town’s tank maintenance consultant.
Scheduling of major well rehabilitation efforts based upon input from a well drilling/maintenance contractor and observations of production well problems by the water operations staff.
Addressing miscellaneous water infrastructure needs as recognized by the Town’s operation
and management staff during the previous year.
Scheduling of miscellaneous water main upgrades for improved fire protection and water circulation based upon input from the Town’s fire department.
Addressing safety and compliance concerns throughout the treatment and distribution system as recognized by the Town’s operation and management staff.
A summary of the CIP is found on the following page and is followed by the detail of each project.
36
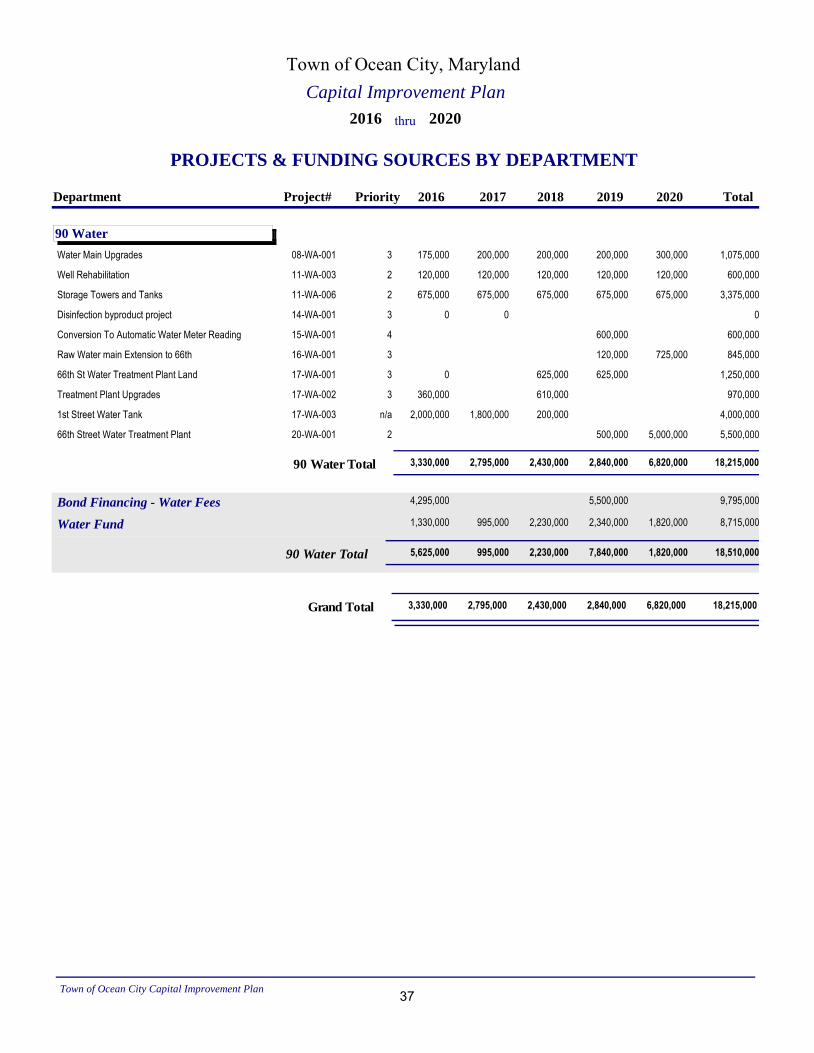
Capital Improvement Plan
Town of Ocean City, Maryland
PROJECTS & FUNDING SOURCES BY DEPARTMENT
2016 2020thru
Total2016 2017 2018 2019 2020Department Project# Priority
90 Water
9,795,0004,295,000 5,500,000Bond Financing - Water Fees
8,715,0001,330,000 995,000 2,230,000 2,340,000 1,820,000Water Fund
18,510,0005,625,000 995,000 2,230,000 7,840,000 1,820,00090 Water Total
08-WA-001 1,075,000175,000 200,000 200,000 200,000 300,000Water Main Upgrades 3
11-WA-003 600,000120,000 120,000 120,000 120,000 120,000Well Rehabilitation 2
11-WA-006 3,375,000675,000 675,000 675,000 675,000 675,000Storage Towers and Tanks 2
14-WA-001 00 0Disinfection byproduct project 3
15-WA-001 600,000600,000Conversion To Automatic Water Meter Reading 4
16-WA-001 845,000120,000 725,000Raw Water main Extension to 66th 3
17-WA-001 1,250,0000 625,000 625,00066th St Water Treatment Plant Land 3
17-WA-002 970,000360,000 610,000Treatment Plant Upgrades 3
17-WA-003 4,000,0002,000,000 1,800,000 200,0001st Street Water Tank n/a
20-WA-001 5,500,000500,000 5,000,00066th Street Water Treatment Plant 2
18,215,0003,330,000 2,795,000 2,430,000 2,840,000 6,820,00090 Water Total
18,215,0003,330,000 2,795,000 2,430,000 2,840,000 6,820,000Grand Total
Town of Ocean City Capital Improvement Plan 37

38
WATER CAPITAL IMPROVEMENT PLAN
DETAILED PROJECTS
39

40
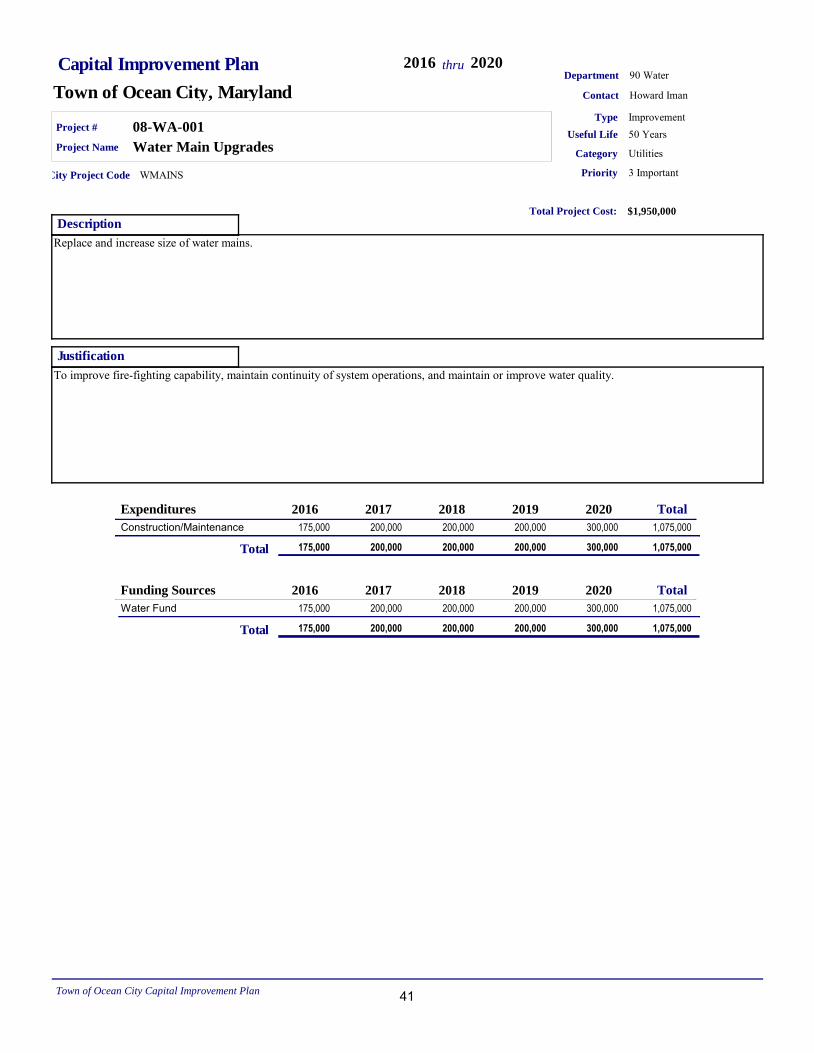
Capital Improvement Plan
Town of Ocean City, MarylandDepartment 90 Water
2016 2020thru
Contact Howard Iman
Description
Replace and increase size of water mains.
Project # 08-WA-001
Priority 3 Important
Justification
To improve fire-fighting capability, maintain continuity of system operations, and maintain or improve water quality.
Useful Life 50 YearsProject Name Water Main Upgrades
Category Utilities
Type Improvement
Total Project Cost: $1,950,000
City Project Code WMAINS
Total2016 2017 2018 2019 2020Expenditures
1,075,000175,000 200,000 200,000 200,000 300,000Construction/Maintenance
175,000 200,000 200,000 200,000 300,000 1,075,000Total
Total2016 2017 2018 2019 2020Funding Sources
1,075,000175,000 200,000 200,000 200,000 300,000Water Fund
175,000 200,000 200,000 200,000 300,000 1,075,000Total
Town of Ocean City Capital Improvement Plan 41

Capital Improvement Plan
Town of Ocean City, MarylandDepartment 90 Water
2016 2020thru
Contact Howard Iman
Description
Wells are monitored and one to two wells are extensively examined and repaired each year.
Project # 11-WA-003
Priority 2 Very Important
Justification
Ocean City draws most of its water from the Ocean City aquifer (over 300') and the Manokin aquifer (over 400'). Wells are subject to corrosion and continual maintenance is required to preserve water quality and volume.
Useful Life 10 YearsProject Name Well Rehabilitation
Category Utilities
Type Maintenance
Total Project Cost: $1,140,000
City Project Code
Total2016 2017 2018 2019 2020Expenditures
600,000120,000 120,000 120,000 120,000 120,000Construction/Maintenance
120,000 120,000 120,000 120,000 120,000 600,000Total
Total2016 2017 2018 2019 2020Funding Sources
600,000120,000 120,000 120,000 120,000 120,000Water Fund
120,000 120,000 120,000 120,000 120,000 600,000Total
Town of Ocean City Capital Improvement Plan 42
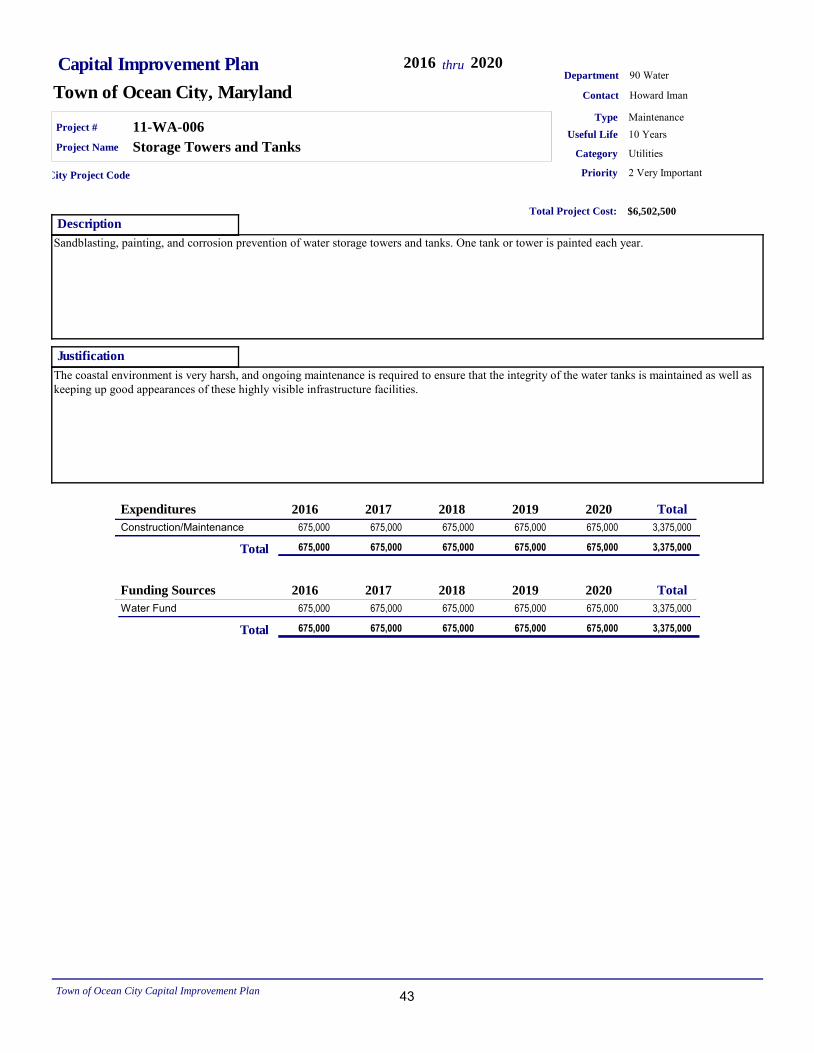
Capital Improvement Plan
Town of Ocean City, MarylandDepartment 90 Water
2016 2020thru
Contact Howard Iman
Description
Sandblasting, painting, and corrosion prevention of water storage towers and tanks. One tank or tower is painted each year.
Project # 11-WA-006
Priority 2 Very Important
Justification
The coastal environment is very harsh, and ongoing maintenance is required to ensure that the integrity of the water tanks is maintained as well as keeping up good appearances of these highly visible infrastructure facilities.
Useful Life 10 YearsProject Name Storage Towers and Tanks
Category Utilities
Type Maintenance
Total Project Cost: $6,502,500
City Project Code
Total2016 2017 2018 2019 2020Expenditures
3,375,000675,000 675,000 675,000 675,000 675,000Construction/Maintenance
675,000 675,000 675,000 675,000 675,000 3,375,000Total
Total2016 2017 2018 2019 2020Funding Sources
3,375,000675,000 675,000 675,000 675,000 675,000Water Fund
675,000 675,000 675,000 675,000 675,000 3,375,000Total
Town of Ocean City Capital Improvement Plan 43
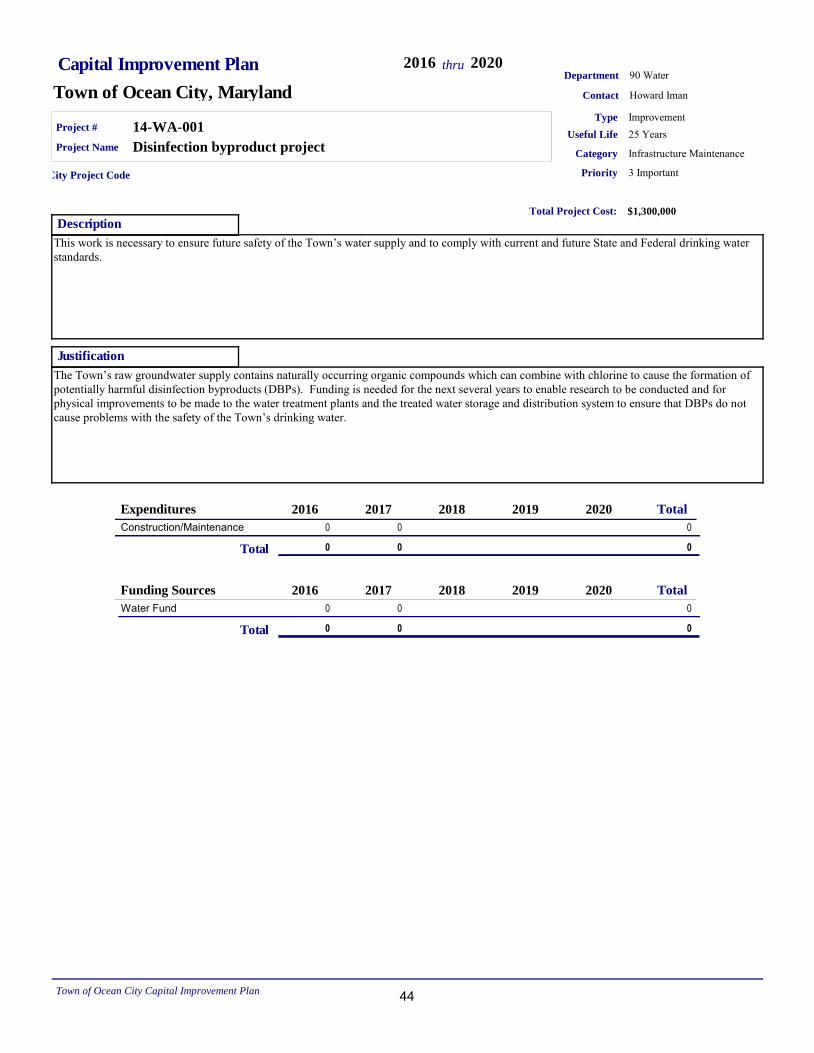
Capital Improvement Plan
Town of Ocean City, MarylandDepartment 90 Water
2016 2020thru
Contact Howard Iman
Description
This work is necessary to ensure future safety of the Town’s water supply and to comply with current and future State and Federal drinking water
standards.
Project # 14-WA-001
Priority 3 Important
Justification
The Town’s raw groundwater supply contains naturally occurring organic compounds which can combine with chlorine to cause the formation of
potentially harmful disinfection byproducts (DBPs). Funding is needed for the next several years to enable research to be conducted and for physical improvements to be made to the water treatment plants and the treated water storage and distribution system to ensure that DBPs do not cause problems with the safety of the Town’s drinking water.
Useful Life 25 YearsProject Name Disinfection byproduct project
Category Infrastructure Maintenance
Type Improvement
Total Project Cost: $1,300,000
City Project Code
Total2016 2017 2018 2019 2020Expenditures
00 0Construction/Maintenance
0 0 0Total
Total2016 2017 2018 2019 2020Funding Sources
00 0Water Fund
0 0 0Total
Town of Ocean City Capital Improvement Plan 44
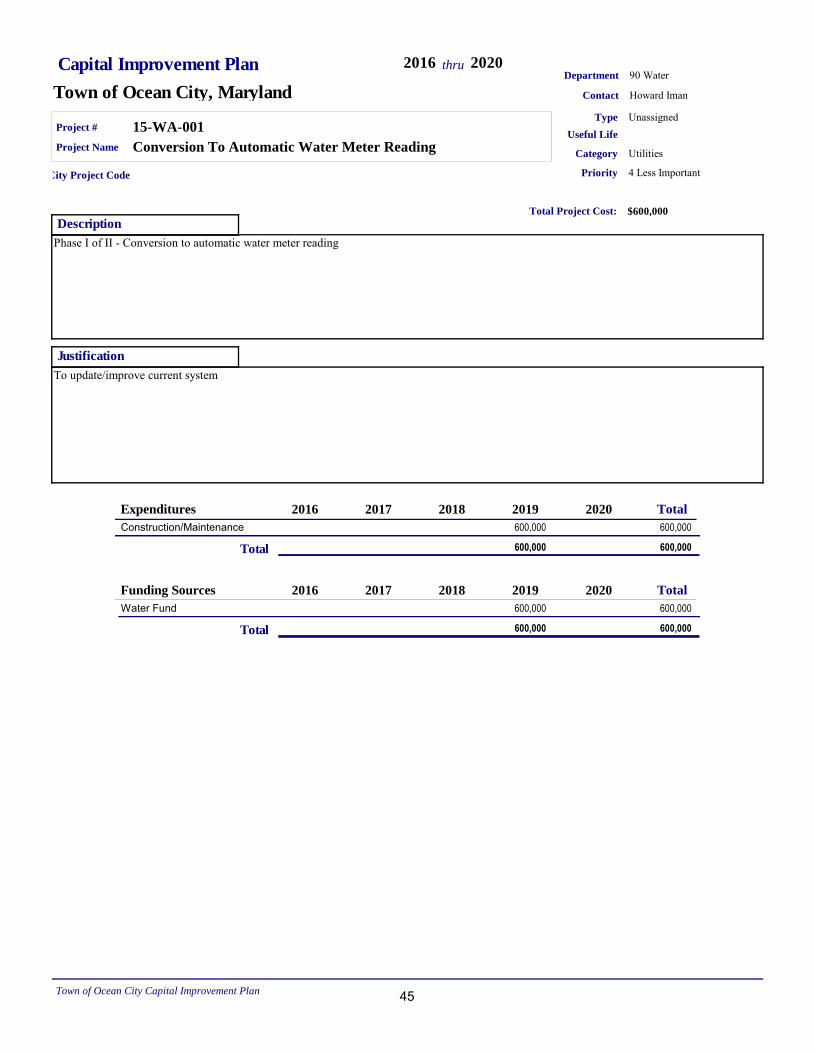
Capital Improvement Plan
Town of Ocean City, MarylandDepartment 90 Water
2016 2020thru
Contact Howard Iman
Description
Phase I of II - Conversion to automatic water meter reading
Project # 15-WA-001
Priority 4 Less Important
Justification
To update/improve current system
Useful Life
Project Name Conversion To Automatic Water Meter ReadingCategory Utilities
Type Unassigned
Total Project Cost: $600,000
City Project Code
Total2016 2017 2018 2019 2020Expenditures
600,000600,000Construction/Maintenance
600,000 600,000Total
Total2016 2017 2018 2019 2020Funding Sources
600,000600,000Water Fund
600,000 600,000Total
Town of Ocean City Capital Improvement Plan 45
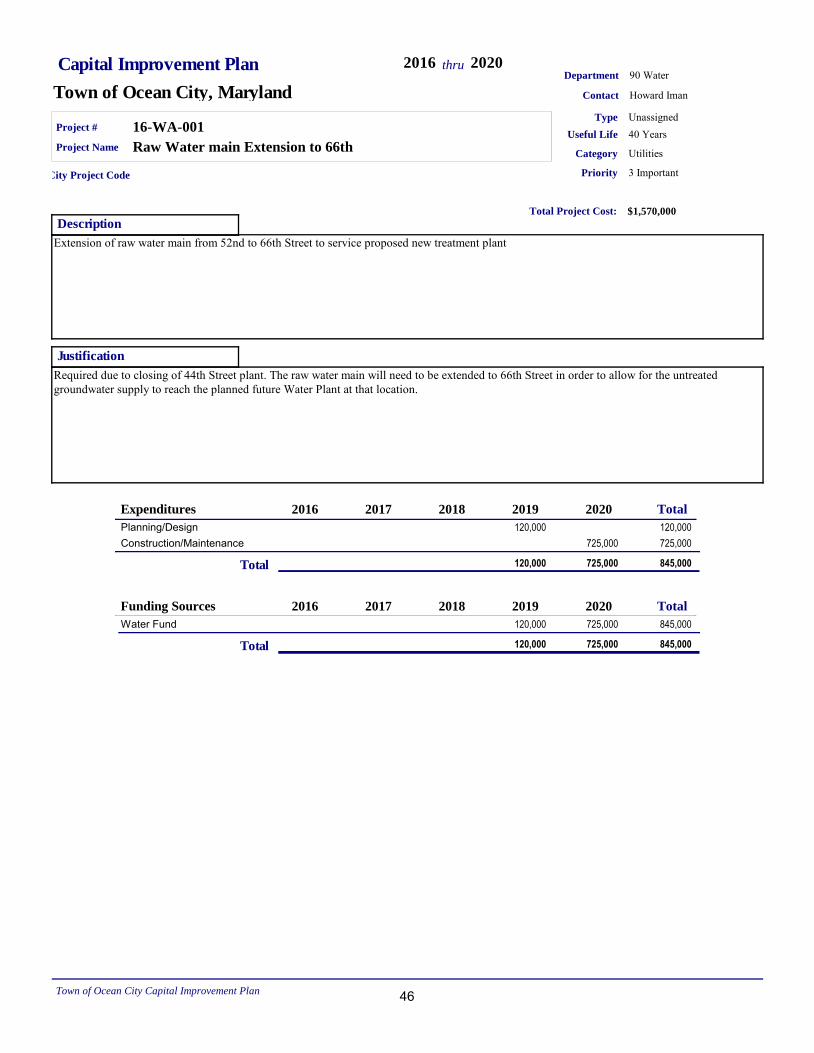
Capital Improvement Plan
Town of Ocean City, MarylandDepartment 90 Water
2016 2020thru
Contact Howard Iman
Description
Extension of raw water main from 52nd to 66th Street to service proposed new treatment plant
Project # 16-WA-001
Priority 3 Important
Justification
Required due to closing of 44th Street plant. The raw water main will need to be extended to 66th Street in order to allow for the untreated groundwater supply to reach the planned future Water Plant at that location.
Useful Life 40 YearsProject Name Raw Water main Extension to 66th
Category Utilities
Type Unassigned
Total Project Cost: $1,570,000
City Project Code
Total2016 2017 2018 2019 2020Expenditures
120,000120,000Planning/Design725,000725,000Construction/Maintenance
120,000 725,000 845,000Total
Total2016 2017 2018 2019 2020Funding Sources
845,000120,000 725,000Water Fund
120,000 725,000 845,000Total
Town of Ocean City Capital Improvement Plan 46
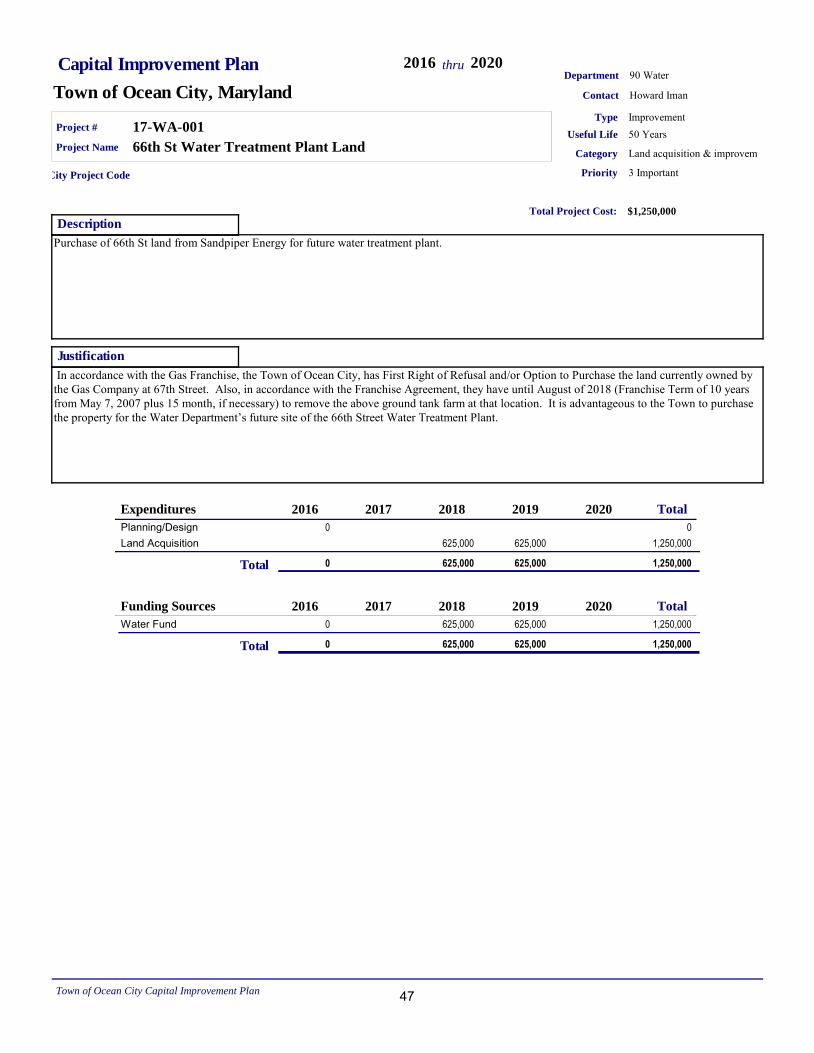
Capital Improvement Plan
Town of Ocean City, MarylandDepartment 90 Water
2016 2020thru
Contact Howard Iman
Description
Purchase of 66th St land from Sandpiper Energy for future water treatment plant.
Project # 17-WA-001
Priority 3 Important
Justification
In accordance with the Gas Franchise, the Town of Ocean City, has First Right of Refusal and/or Option to Purchase the land currently owned by the Gas Company at 67th Street. Also, in accordance with the Franchise Agreement, they have until August of 2018 (Franchise Term of 10 years from May 7, 2007 plus 15 month, if necessary) to remove the above ground tank farm at that location. It is advantageous to the Town to purchase the property for the Water Department’s future site of the 66th Street Water Treatment Plant.
Useful Life 50 YearsProject Name 66th St Water Treatment Plant Land
Category Land acquisition & improvem
Type Improvement
Total Project Cost: $1,250,000
City Project Code
Total2016 2017 2018 2019 2020Expenditures
00Planning/Design1,250,000625,000 625,000Land Acquisition
0 625,000 625,000 1,250,000Total
Total2016 2017 2018 2019 2020Funding Sources
1,250,0000 625,000 625,000Water Fund
0 625,000 625,000 1,250,000Total
Town of Ocean City Capital Improvement Plan 47
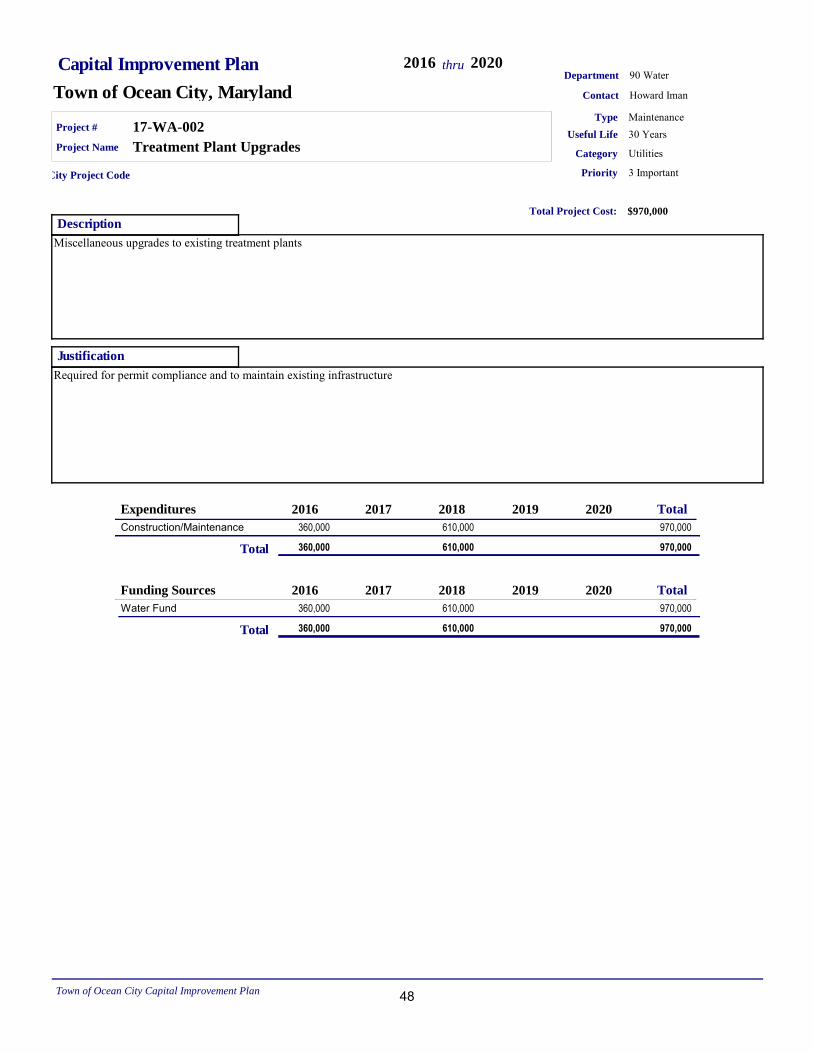
Capital Improvement Plan
Town of Ocean City, MarylandDepartment 90 Water
2016 2020thru
Contact Howard Iman
Description
Miscellaneous upgrades to existing treatment plants
Project # 17-WA-002
Priority 3 Important
Justification
Required for permit compliance and to maintain existing infrastructure
Useful Life 30 YearsProject Name Treatment Plant Upgrades
Category Utilities
Type Maintenance
Total Project Cost: $970,000
City Project Code
Total2016 2017 2018 2019 2020Expenditures
970,000360,000 610,000Construction/Maintenance
360,000 610,000 970,000Total
Total2016 2017 2018 2019 2020Funding Sources
970,000360,000 610,000Water Fund
360,000 610,000 970,000Total
Town of Ocean City Capital Improvement Plan 48
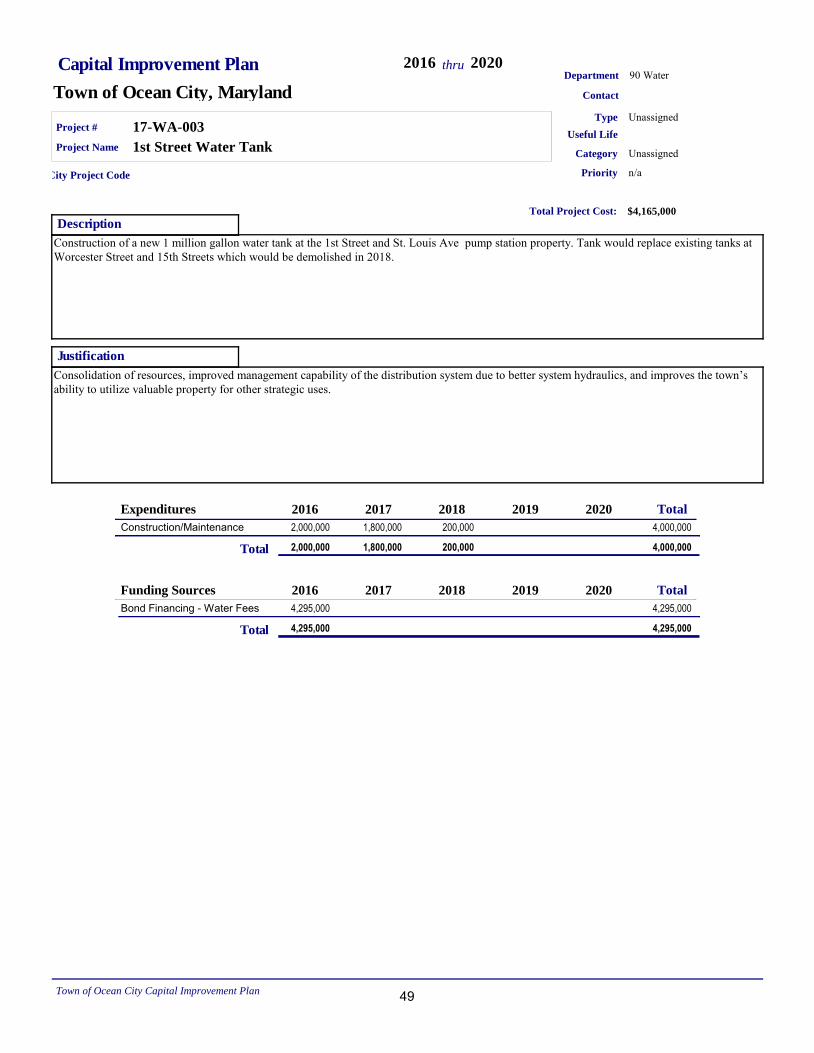
Capital Improvement Plan
Town of Ocean City, MarylandDepartment 90 Water
2016 2020thru
Contact
Description
Construction of a new 1 million gallon water tank at the 1st Street and St. Louis Ave pump station property. Tank would replace existing tanks at Worcester Street and 15th Streets which would be demolished in 2018.
Project # 17-WA-003
Priority n/a
Justification
Consolidation of resources, improved management capability of the distribution system due to better system hydraulics, and improves the town’s
ability to utilize valuable property for other strategic uses.
Useful Life
Project Name 1st Street Water TankCategory Unassigned
Type Unassigned
Total Project Cost: $4,165,000
City Project Code
Total2016 2017 2018 2019 2020Expenditures
4,000,0002,000,000 1,800,000 200,000Construction/Maintenance
2,000,000 1,800,000 200,000 4,000,000Total
Total2016 2017 2018 2019 2020Funding Sources
4,295,0004,295,000Bond Financing - Water Fees
4,295,000 4,295,000Total
Town of Ocean City Capital Improvement Plan 49
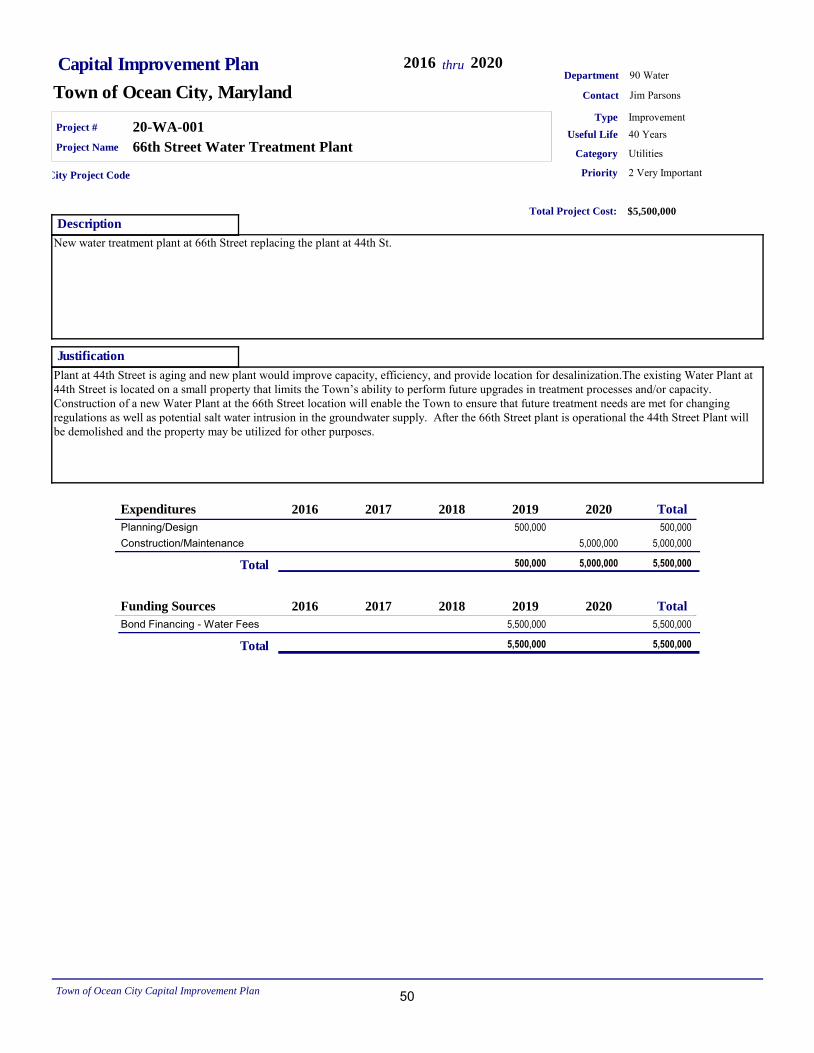
Capital Improvement Plan
Town of Ocean City, MarylandDepartment 90 Water
2016 2020thru
Contact Jim Parsons
Description
New water treatment plant at 66th Street replacing the plant at 44th St.
Project # 20-WA-001
Priority 2 Very Important
Justification
Plant at 44th Street is aging and new plant would improve capacity, efficiency, and provide location for desalinization.The existing Water Plant at 44th Street is located on a small property that limits the Town’s ability to perform future upgrades in treatment processes and/or capacity.
Construction of a new Water Plant at the 66th Street location will enable the Town to ensure that future treatment needs are met for changing regulations as well as potential salt water intrusion in the groundwater supply. After the 66th Street plant is operational the 44th Street Plant will be demolished and the property may be utilized for other purposes.
Useful Life 40 YearsProject Name 66th Street Water Treatment Plant
Category Utilities
Type Improvement
Total Project Cost: $5,500,000
City Project Code
Total2016 2017 2018 2019 2020Expenditures
500,000500,000Planning/Design5,000,0005,000,000Construction/Maintenance
500,000 5,000,000 5,500,000Total
Total2016 2017 2018 2019 2020Funding Sources
5,500,0005,500,000Bond Financing - Water Fees
5,500,000 5,500,000Total
Town of Ocean City Capital Improvement Plan 50
WASTEWATER TREATMENT FACILITIES
51
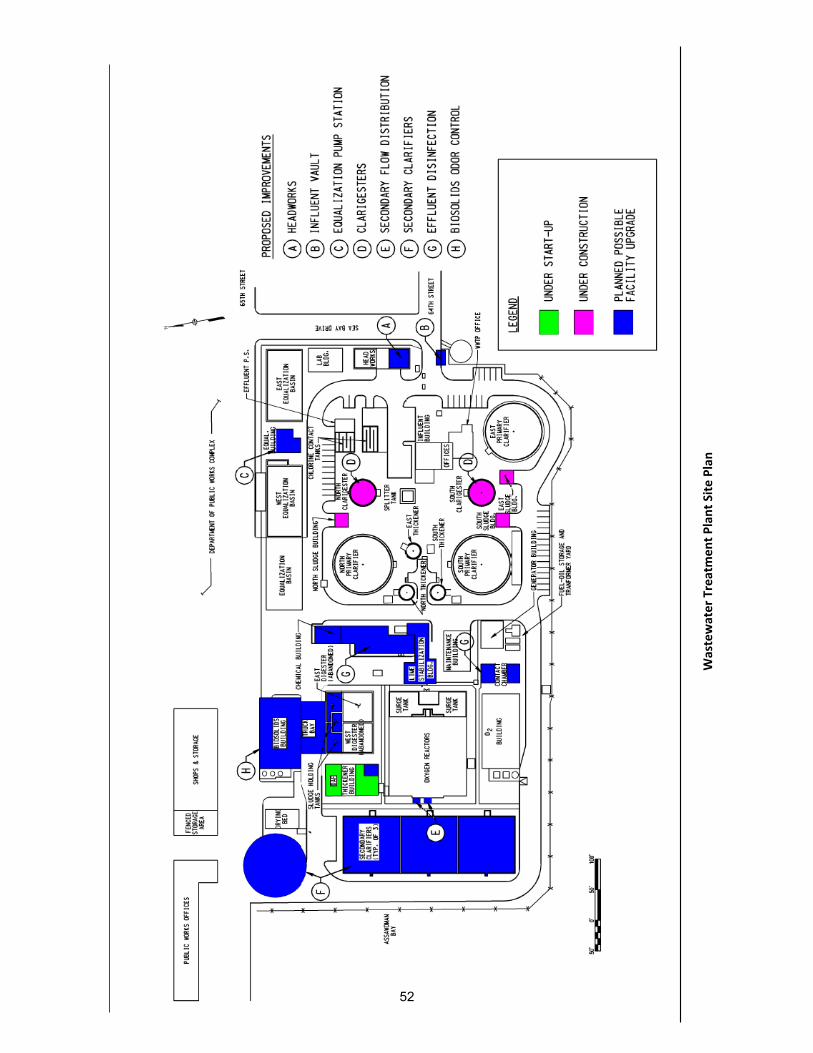
Was
tew
ater
Tre
atm
ent P
lant
Site
Pla
n
52
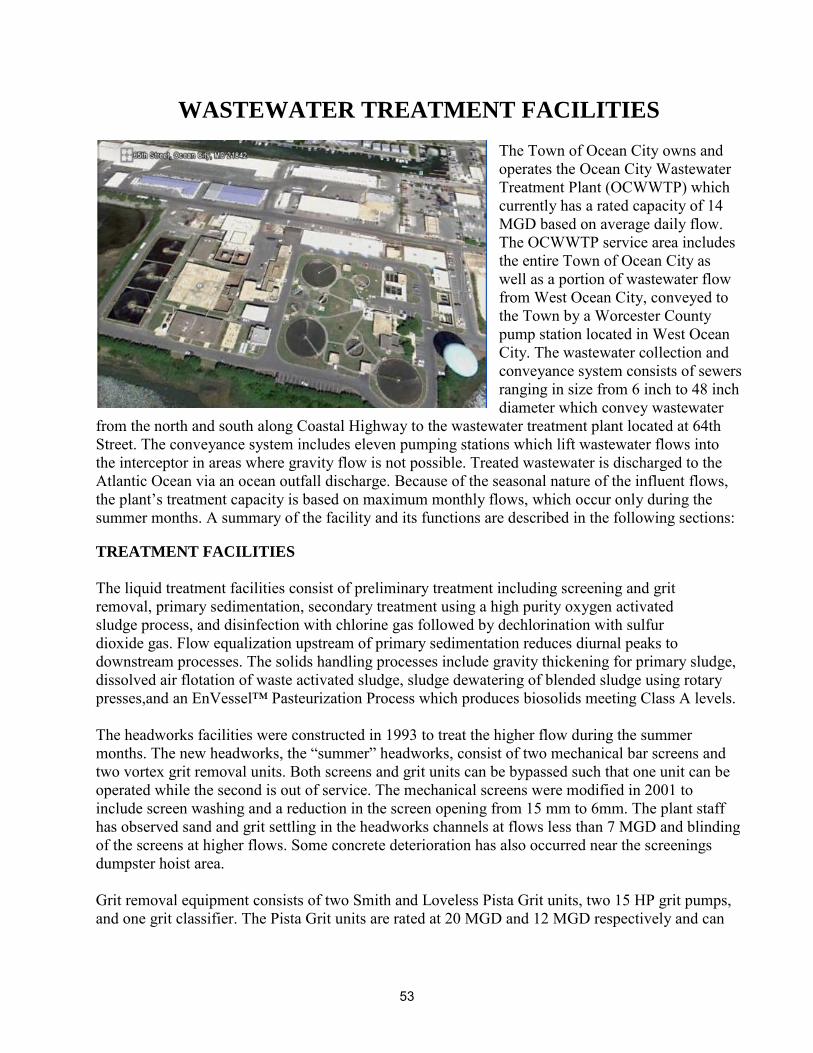
WASTEWATER TREATMENT FACILITIES The Town of Ocean City owns and operates the Ocean City Wastewater Treatment Plant (OCWWTP) which currently has a rated capacity of 14 MGD based on average daily flow. The OCWWTP service area includes the entire Town of Ocean City as well as a portion of wastewater flow from West Ocean City, conveyed to the Town by a Worcester County pump station located in West Ocean City. The wastewater collection and conveyance system consists of sewers ranging in size from 6 inch to 48 inch diameter which convey wastewater
from the north and south along Coastal Highway to the wastewater treatment plant located at 64th Street. The conveyance system includes eleven pumping stations which lift wastewater flows into the interceptor in areas where gravity flow is not possible. Treated wastewater is discharged to the Atlantic Ocean via an ocean outfall discharge. Because of the seasonal nature of the influent flows, the plant’s treatment capacity is based on maximum monthly flows, which occur only during the summer months. A summary of the facility and its functions are described in the following sections: TREATMENT FACILITIES
The liquid treatment facilities consist of preliminary treatment including screening and grit removal, primary sedimentation, secondary treatment using a high purity oxygen activated sludge process, and disinfection with chlorine gas followed by dechlorination with sulfur dioxide gas. Flow equalization upstream of primary sedimentation reduces diurnal peaks to downstream processes. The solids handling processes include gravity thickening for primary sludge, dissolved air flotation of waste activated sludge, sludge dewatering of blended sludge using rotary presses,and an EnVessel™ Pasteurization Process which produces biosolids meeting Class A levels. The headworks facilities were constructed in 1993 to treat the higher flow during the summer months. The new headworks, the “summer” headworks, consist of two mechanical bar screens and
two vortex grit removal units. Both screens and grit units can be bypassed such that one unit can be operated while the second is out of service. The mechanical screens were modified in 2001 to include screen washing and a reduction in the screen opening from 15 mm to 6mm. The plant staff has observed sand and grit settling in the headworks channels at flows less than 7 MGD and blinding of the screens at higher flows. Some concrete deterioration has also occurred near the screenings dumpster hoist area. Grit removal equipment consists of two Smith and Loveless Pista Grit units, two 15 HP grit pumps, and one grit classifier. The Pista Grit units are rated at 20 MGD and 12 MGD respectively and can
53
Wastewater Treatment Facilities
Whitman, Requardt & Associates, LLP
be operated in parallel. It has been noted by the OCWWTP staff that solids settling occurs in the channel leading to the 12 MGD Pista Grit unit. PRIMARY INFLUENT PUMPING
The influent pumping station is equipped with three “summer” pumps, one smaller HP variable
speed “summer” pump, and three constant speed “winter” pumps. The are 200 HP units with original design points of 14 MGD for one pump operation and 23 MGD for two pump operation. The fourth summer pump is a 75 HP pump with a variable frequency drive (VFD) to reduce pump cycling during low flow periods. This pump was originally located at the Montego Bay Pump Station (located at 130th Street). The winter pumps are 75 HP units with an original design point of 1.30 MGD for one pump operation. For the summer pumps, new rotating assemblies with three vane impellers and larger housings have been purchased and installed. Currently, the summer pumps are operated throughout the year and the winter pumps are only used when the summer pumps or summer wet well are being serviced. The primary influent pump station can pump to the equalization basins of to the primary influent splitter chamber. EQUALIZATION BASINS AND EQUALIZATION PUMPS
The OCWWTP equalizes flow with six 55’ x 55’ concrete basins. Each of the four basins has a 10 HP mixer and course bubble air diffusers. The maximum operating volume of the equalization basins is 2.7 million gallons (MG), determined using an operating depth range of 18.75 ft. (Elevation range of –0.5 to 19.25 feet). The basins are used to equalize diurnal peak flows and stormflow events and discharge an approximately steady flow to downstream process units. The discharge flow is manually set and the three variable speed equalization pumps adjust to maintain the selected flow rate. Construction of odor control facilities for the equalization basins was completed in 2006. Wastewater is pumped from the equalization basins to the primary influent splitter chamber by three variable speed 100 HP Equalization Pumps. Each equalization pump has a rated capacity of 7.0 MGD at 300 RPM and the minimum static head. For two pump operation, the rated capacity is 22.0 MGD at the maximum static head conditions. The pumping station is a multi-level building with the motors for the extended shaft pumps located on the grade level. Also located on the grade level of the building are the positive displacement blowers which provide aeration and mixing of the Equalization Basins. Ventilation for the grade level of the pumping station is accomplished by drafting fresh air through motor operated dampers near the blowers, across the room and exhausted through a roof mounted fan. PRIMARY CLARIFIERS AND CLARIGESTERS
The OCWWTP has three primary clarifiers and two clarigesters for primary sedimentation. The north primary clarifier and clarigester are concrete, circular tanks. The north primary clarifier and clarigester and the south primary clarifier and clarigester are center-feed, peripheral overflow type. The primary clarifiers are each 90 ft. diameter with a 10 ft side water depth (SWD) while the clarigesters are each 40 ft. diameter with an 12 ft. SWD. Each primary clarifier has a surface area of
54
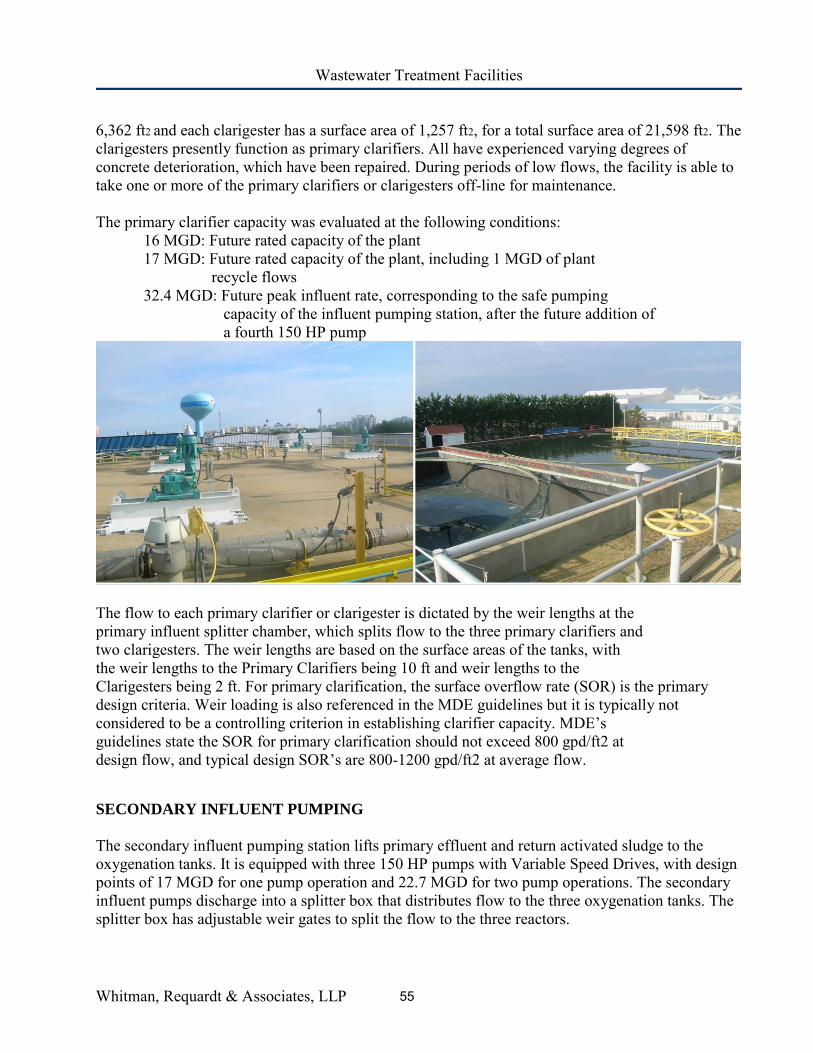
Wastewater Treatment Facilities
Whitman, Requardt & Associates, LLP
6,362 ft2 and each clarigester has a surface area of 1,257 ft2, for a total surface area of 21,598 ft2. The clarigesters presently function as primary clarifiers. All have experienced varying degrees of concrete deterioration, which have been repaired. During periods of low flows, the facility is able to take one or more of the primary clarifiers or clarigesters off-line for maintenance. The primary clarifier capacity was evaluated at the following conditions:
16 MGD: Future rated capacity of the plant 17 MGD: Future rated capacity of the plant, including 1 MGD of plant
recycle flows 32.4 MGD: Future peak influent rate, corresponding to the safe pumping
capacity of the influent pumping station, after the future addition of a fourth 150 HP pump
The flow to each primary clarifier or clarigester is dictated by the weir lengths at the primary influent splitter chamber, which splits flow to the three primary clarifiers and two clarigesters. The weir lengths are based on the surface areas of the tanks, with the weir lengths to the Primary Clarifiers being 10 ft and weir lengths to the Clarigesters being 2 ft. For primary clarification, the surface overflow rate (SOR) is the primary design criteria. Weir loading is also referenced in the MDE guidelines but it is typically not considered to be a controlling criterion in establishing clarifier capacity. MDE’s guidelines state the SOR for primary clarification should not exceed 800 gpd/ft2 at design flow, and typical design SOR’s are 800-1200 gpd/ft2 at average flow. SECONDARY INFLUENT PUMPING
The secondary influent pumping station lifts primary effluent and return activated sludge to the oxygenation tanks. It is equipped with three 150 HP pumps with Variable Speed Drives, with design points of 17 MGD for one pump operation and 22.7 MGD for two pump operations. The secondary influent pumps discharge into a splitter box that distributes flow to the three oxygenation tanks. The splitter box has adjustable weir gates to split the flow to the three reactors.
55
Wastewater Treatment Facilities
Whitman, Requardt & Associates, LLP
HIGH PURITY OXYGEN ACTIVATED SLUDGE
Secondary treatment at the OCWWTP is provided by a high purity oxygen activated sludge system with a total operational volume of 0.34 MG each. The plant has a single-bed vacuum pressure swing adsorption (VPSA) system. The system has a rated capacity of 15 tons/day. A 13,000 gallon high purity liquid oxygen storage tank and associated vaporizers serve as a backup to the VPSA system. The oxygen dissolution system consists of six 25 HP aerators, one installed in the first and second stage of each reactor, and three 20 HP aerators, one installed in the third stage of each reactor. The facility also has two centrifugal blowers located on top of the oxygenation tanks. The original blower was included in the design to provide purge air for the headspace in the oxygenation tanks in the event of an LEL condition. The purge blowers are used to operate the secondary plant on air, instead of pure oxygen, during low flow and loading periods. The purge blowers do not operate when the plant is operating on oxygen, unless there is an LEL condition. The plant has D.O. probes in all three stages of each reactor, to improve control of the oxygen feed. SECONDARY CLARIFIERS
The secondary clarifiers consist of three square, concrete tanks with center-feed, scraper blades and suction tubes. Each clarifier has a ½ HP drive and is equipped with surface skimming for scum removal, including a scum collection box and scum pump. For return activated sludge, each secondary clarifier has 8 suction tubes, 4 of which are normally open and 4 of which are partially open during typical operation. The secondary clarifiers experience uneven flow distribution from the aeration basins as well as floating sludge in the tanks and in the clarifier center feedwells. The following improvements to the secondary clarification process are recommended:
• Replace the remaining composite bearings with stainless steel bearings in the remaining two clarifiers or retain a shelf spare clarifier drive that is readily available. • Install Stamford Baffles in the existing secondary clarifiers, and the new fourth secondary clarifiers when constructed, to improve secondary clarifier performance under peak conditions. • Implement the fourth secondary clarifier to provide additional reliability and unit process redundancy, and improved process performance.
CHLORINATION/DECHLORINATION
Disinfection occurs via chlorination in four chlorine contact tanks operated in series. The chorine feed system includes one chlorine cylinder scale with the capacity for a two ton chlorine cylinder scale with the capacity for a two ton chlorine cylinder. The chlorine evaporator has a capacity of 3,200 lbs/day. Chlorination for disinfection has a design feed rate of 2,000 lbs/day, while an additional 800 lbs/day is used for pre-chlorination and 400 lbs/day is used at the gravity thickeners for odor control. There are two pre-chlorination injectors, one located before the winter headoworks
56
Wastewater Treatment Facilities
Whitman, Requardt & Associates, LLP
and one located directly after. The chlorination storage cylinders and evaporator are located in the North Process Building. The sulfur dioxide storage and feed system are also housed in the North Process Building. Limited space is available in the sulfur dioxide room for additional cylinders. Sulfur dioxide is injected in the final channel of chlorine contact tank No. 1, where two 3 HP Chlor-A-Vac chemical induction units are located. Each Chlor-A-Vac unit has a capacity of 1,500 lbs/day. The OCWWTP currently uses a 10 HP blower, located on top of the ozonation tank, to increase the dissolved oxygen concentration in the effluent. The blower discharge has been connected to the original ozone diffusers in the ozone contact tank. An alternative to the existing disinfection equipment is currently under construction:
Conversion to a liquid sodium hypochlorite (NaOCl) for chlorination and liquid sodium bisulfite (NaHSO3) for dechlorination, with on-site bulk storage of each chemical.
EFFLUENT PUMPING STATION
The effluent pumping station has three 125 HP pumps. The upgraded constant speed pumps are each rated at 14 MGD. BIOSOLIDS TREATMENT AND HANDLING
The OCWWTP solids handling and dewatering facilities consist of the following: Primary Sludge and Waste Activated Sludge (WAS) Pumping
Gravity Thickeners for Primary Sludge
Dissolved Air Flotation Thickeners for WAS
Sludge Blending and Holding Tanks
Sludge Dewatering
Biosolids Stabilization – Class A Envessel Pasteurization Process – Class B Lime Stabilization [Back-up]
PRIMARY SLUDGE PUMPS
The primary sludge pumps consist of six constant speed pumps. The primary sludge pumps are housed in the North, East, and South Sludge Buildings, respectively. The north and south sludge pumping stations share the duty of pumping from both the north and south primary clarifiers and clarigesters to the respective thickeners, while the east sludge pumping station pumps from the east primary clarifier to the east thickener. GRAVITY THICKENERS
There are currently three gravity thickener facilities, north, south, and east. The gravity thickeners are used to thicken primary sludge. Sludge is pumped via the primary sludge pumps from the
57
Wastewater Treatment Facilities
Whitman, Requardt & Associates, LLP
primary clarifiers and clarigesters to the gravity thickeners. Each thickener has a 22 foot diameter, a 10 foot side water depth, and a ½ HP drive. New thickened sludge pumping facilities were built in 1997, with each facility including a 20 HP thickened sludge pump. DISSOLVED AIR FLOTATION THICKENERS
Waste activated sludge (WAS) thickening is provided by two dissolved air flotation (DAF) thickeners which have a surface area of 352 ft2 each with a 7.5 foot side water depth. WAS is pumped from the secondary clarifiers by three 10 HP WAS pumps. The piping and valve arrangements allow for any of the WAS pumps to pull sludge from any clarifier. Polymer is injected in-line to the feed to the DAF units. Thickened WAS is pumped from the DAF to the sludge blending tank. SLUDGE BLENDING AND HOLDING TANKS
The sludge blending tank has an approximate volume of 47, 000 gallons and receives primary and secondary sludge from the thickened primary sludge pumps and the thickened WAS pumps. The blended primary and secondary sludge is drawn off by the blended sludge pumps. The blending tank contains a 20 HP mixer that keeps the thickened sludge mixed and aerated until it drains via gravity through manual operated sluice gates to the holding tanks or is pumped to the presses. Each holding tank has an approximate capacity of 160,000 gallons. BLENDED SLUDGE PUMPS AND DEWATERING
The blended sludge pumps draw blended sludge from the blending tank or the holding tanks and transfers the sludge to the sludge flocculation tanks where it is mixed with polymer. The conditioned sludge is then fed in the dewatering equipment. The two blended sludge pumps have 30 HP motors and each has a capacity of 150 gpm. From the sludge flocculation tanks, the sludge enters the dewatering equipment. The sludge dewatering equipment consists of two Fournier rotary presses. Each press has three working channels with room to add a fourth channel. Each channel is capable of dewatering 38 gpm of flocculated blended sludge. BIOSOLIDS STABILIZATION
The dewatered sludge is transferred via a conveyor to the RDP EnVessel PasteurizationTM Process. The process is designed to produce a Class A biosolids end product. The process begins when the sludge enters the thermal blending tanks, whereupon it is preheated and mixed with lime. The thermal blenders have a maximum feed rate of 2.0 tons/hr/train. The heated sludge/lime mixture then enters the pasteurization vessel and is retained for approximately 30 minutes before being discharged for disposal as a Class A biosolids. The pasteurization vessel has a maximum feed rate of 3.4 tons/hr/train. The plant produces Class A biosolids which are disposed of by Enviro-organic Technologies or at the county landfill. In addition, biosolids that do not meet Class A requirements (i.e. “off spec”
58
Wastewater Treatment Facilities
Whitman, Requardt & Associates, LLP
biosolids that meet Class B requirements) are also disposed of at the landfill. With pending regulations that may restrict the ability of the plant to dispose of biosolids at the current locations, there is a possibility that landfill disposal may be the only outlet remaining, with the existing solids handling process. Because of less stringent requirements for landfill disposal, the plant would expect marginal reductions in costs associated with maintenance and electrical power of the RDP equipment, laboratory analyses, and lime usage. Lime will still be required for mitigating odors in the dewatered sludge but should be significantly lower than the current quantities. It was assumed that polymer usage would remain constant regardless of the disposal option. In summary, disposal of all biosolids in a landfill will result in an approximate increase of 50% when compared to existing disposal options. Based on these significant potential cost increases, it is recommended that a thorough survey of other available disposal options be conducted. If this survey does not yield other viable disposal locations, the Town should consider improvements to the biosolids process which would allow for wider distribution of the end product. CAPITAL IMPROVEMENT PROGRAM (CIP)
The Town’s Wastewater Department prepares an update the CIP each year for consideration of the Mayor and City Council. The CIP is based on the following:
Scheduling of major capital improvements as recommended by the Town’s Wastewater
consultant and MDE requirements. Scheduling maintenance of tanks, pumps and clarifiers as recommended to improve
operations and efficiencies. Scheduling repair and replacement of mains and pumping stations as recognized by the
Town’s operation and management staff during the previous year. Addressing safety and odor concerns throughout the process stream as recognized by the
Town’s operation and management staff. A summary of the CIP is found on the following page and is followed by the detail of each project.
59
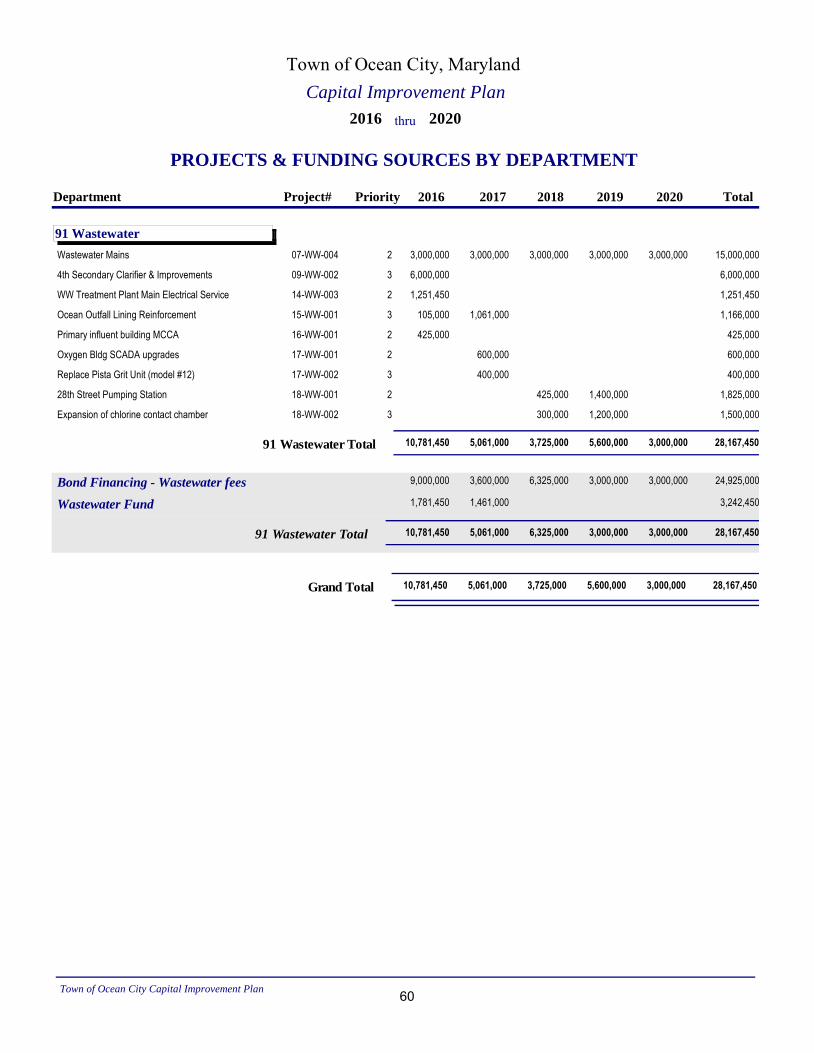
Capital Improvement Plan
Town of Ocean City, Maryland
PROJECTS & FUNDING SOURCES BY DEPARTMENT
2016 2020thru
Total2016 2017 2018 2019 2020Department Project# Priority
91 Wastewater
24,925,0009,000,000 3,600,000 6,325,000 3,000,000 3,000,000Bond Financing - Wastewater fees
3,242,4501,781,450 1,461,000Wastewater Fund
28,167,45010,781,450 5,061,000 6,325,000 3,000,000 3,000,00091 Wastewater Total
07-WW-004 15,000,0003,000,000 3,000,000 3,000,000 3,000,000 3,000,000Wastewater Mains 2
09-WW-002 6,000,0006,000,0004th Secondary Clarifier & Improvements 3
14-WW-003 1,251,4501,251,450WW Treatment Plant Main Electrical Service 2
15-WW-001 1,166,000105,000 1,061,000Ocean Outfall Lining Reinforcement 3
16-WW-001 425,000425,000Primary influent building MCCA 2
17-WW-001 600,000600,000Oxygen Bldg SCADA upgrades 2
17-WW-002 400,000400,000Replace Pista Grit Unit (model #12) 3
18-WW-001 1,825,000425,000 1,400,00028th Street Pumping Station 2
18-WW-002 1,500,000300,000 1,200,000Expansion of chlorine contact chamber 3
28,167,45010,781,450 5,061,000 3,725,000 5,600,000 3,000,00091 Wastewater Total
28,167,45010,781,450 5,061,000 3,725,000 5,600,000 3,000,000Grand Total
Town of Ocean City Capital Improvement Plan 60
WASTEWATER CAPITAL IMPROVEMENT PLAN DETAIL PROJECTS
61

62
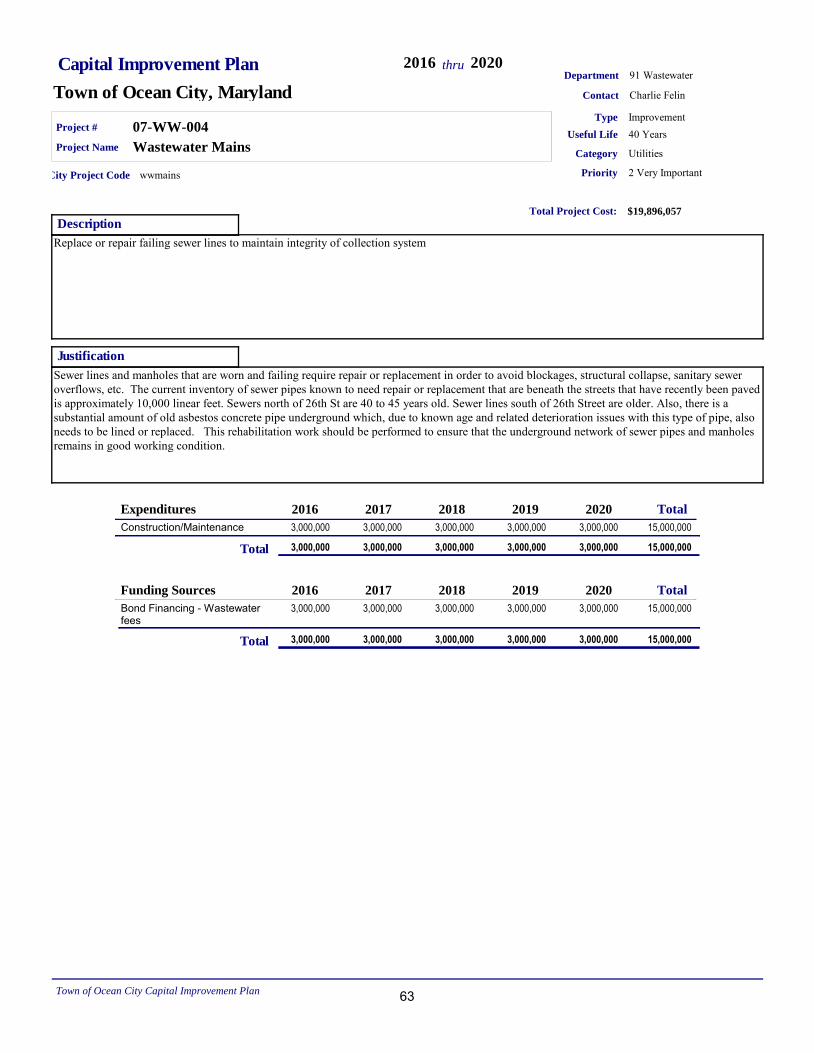
Capital Improvement Plan
Town of Ocean City, MarylandDepartment 91 Wastewater
2016 2020thru
Contact Charlie Felin
Description
Replace or repair failing sewer lines to maintain integrity of collection system
Project # 07-WW-004
Priority 2 Very Important
Justification
Sewer lines and manholes that are worn and failing require repair or replacement in order to avoid blockages, structural collapse, sanitary sewer overflows, etc. The current inventory of sewer pipes known to need repair or replacement that are beneath the streets that have recently been paved is approximately 10,000 linear feet. Sewers north of 26th St are 40 to 45 years old. Sewer lines south of 26th Street are older. Also, there is a substantial amount of old asbestos concrete pipe underground which, due to known age and related deterioration issues with this type of pipe, also needs to be lined or replaced. This rehabilitation work should be performed to ensure that the underground network of sewer pipes and manholes remains in good working condition.
Useful Life 40 YearsProject Name Wastewater Mains
Category Utilities
Type Improvement
Total Project Cost: $19,896,057
City Project Code wwmains
Total2016 2017 2018 2019 2020Expenditures
15,000,0003,000,000 3,000,000 3,000,000 3,000,000 3,000,000Construction/Maintenance
3,000,000 3,000,000 3,000,000 3,000,000 3,000,000 15,000,000Total
Total2016 2017 2018 2019 2020Funding Sources
15,000,0003,000,000 3,000,000 3,000,000 3,000,000 3,000,000Bond Financing - Wastewater fees
3,000,000 3,000,000 3,000,000 3,000,000 3,000,000 15,000,000Total
Town of Ocean City Capital Improvement Plan 63
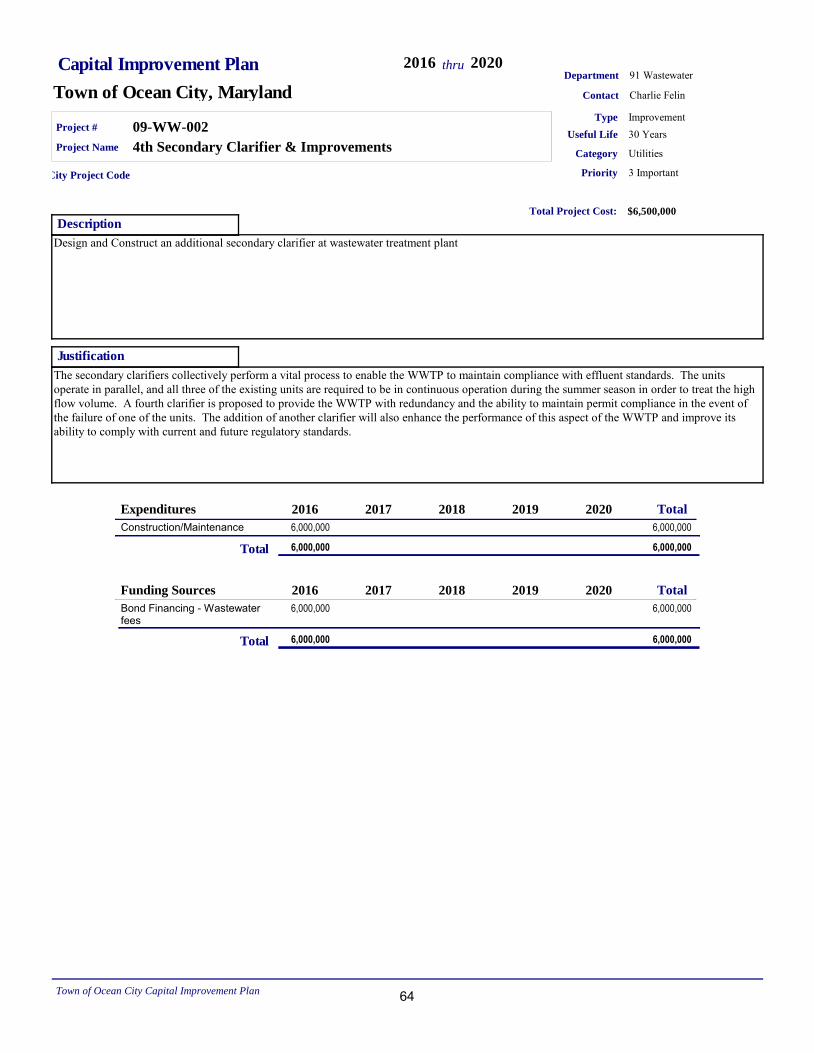
Capital Improvement Plan
Town of Ocean City, MarylandDepartment 91 Wastewater
2016 2020thru
Contact Charlie Felin
Description
Design and Construct an additional secondary clarifier at wastewater treatment plant
Project # 09-WW-002
Priority 3 Important
Justification
The secondary clarifiers collectively perform a vital process to enable the WWTP to maintain compliance with effluent standards. The units operate in parallel, and all three of the existing units are required to be in continuous operation during the summer season in order to treat the high flow volume. A fourth clarifier is proposed to provide the WWTP with redundancy and the ability to maintain permit compliance in the event of the failure of one of the units. The addition of another clarifier will also enhance the performance of this aspect of the WWTP and improve its ability to comply with current and future regulatory standards.
Useful Life 30 YearsProject Name 4th Secondary Clarifier & Improvements
Category Utilities
Type Improvement
Total Project Cost: $6,500,000
City Project Code
Total2016 2017 2018 2019 2020Expenditures
6,000,0006,000,000Construction/Maintenance
6,000,000 6,000,000Total
Total2016 2017 2018 2019 2020Funding Sources
6,000,0006,000,000Bond Financing - Wastewater fees
6,000,000 6,000,000Total
Town of Ocean City Capital Improvement Plan 64
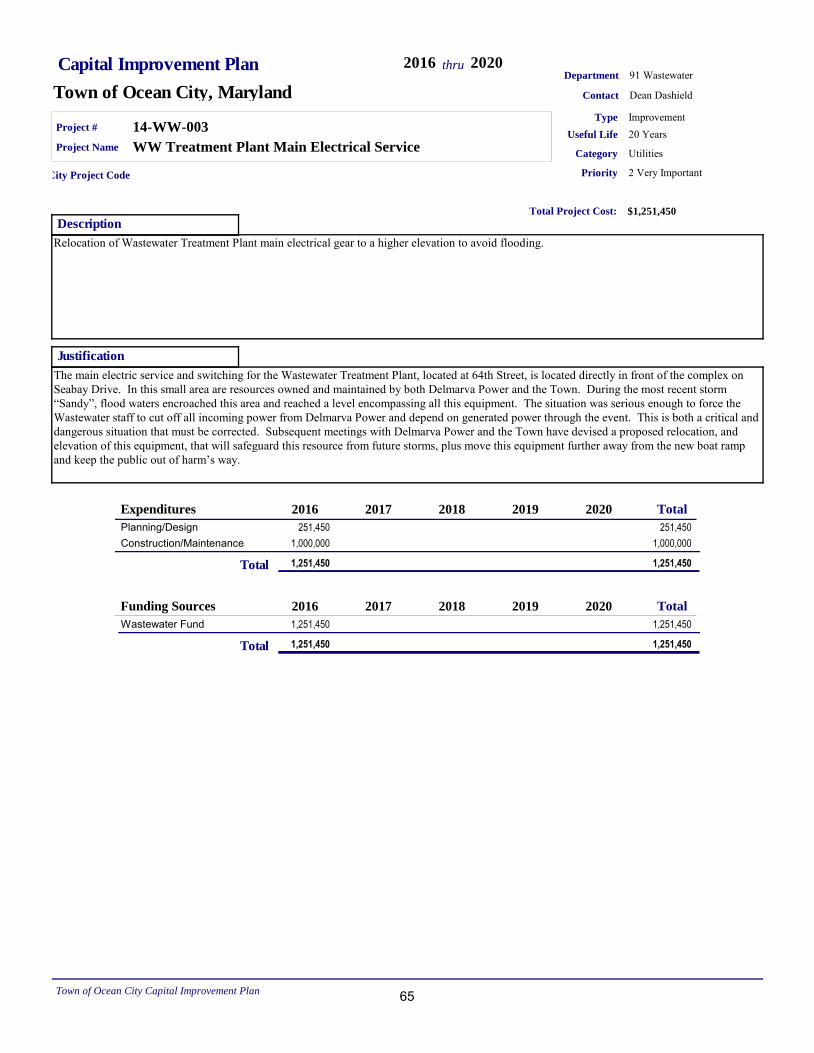
Capital Improvement Plan
Town of Ocean City, MarylandDepartment 91 Wastewater
2016 2020thru
Contact Dean Dashield
Description
Relocation of Wastewater Treatment Plant main electrical gear to a higher elevation to avoid flooding.
Project # 14-WW-003
Priority 2 Very Important
Justification
The main electric service and switching for the Wastewater Treatment Plant, located at 64th Street, is located directly in front of the complex on Seabay Drive. In this small area are resources owned and maintained by both Delmarva Power and the Town. During the most recent storm “Sandy”, flood waters encroached this area and reached a level encompassing all this equipment. The situation was serious enough to force the
Wastewater staff to cut off all incoming power from Delmarva Power and depend on generated power through the event. This is both a critical and dangerous situation that must be corrected. Subsequent meetings with Delmarva Power and the Town have devised a proposed relocation, and elevation of this equipment, that will safeguard this resource from future storms, plus move this equipment further away from the new boat ramp and keep the public out of harm’s way.
Useful Life 20 YearsProject Name WW Treatment Plant Main Electrical Service
Category Utilities
Type Improvement
Total Project Cost: $1,251,450
City Project Code
Total2016 2017 2018 2019 2020Expenditures
251,450251,450Planning/Design1,000,0001,000,000Construction/Maintenance
1,251,450 1,251,450Total
Total2016 2017 2018 2019 2020Funding Sources
1,251,4501,251,450Wastewater Fund
1,251,450 1,251,450Total
Town of Ocean City Capital Improvement Plan 65
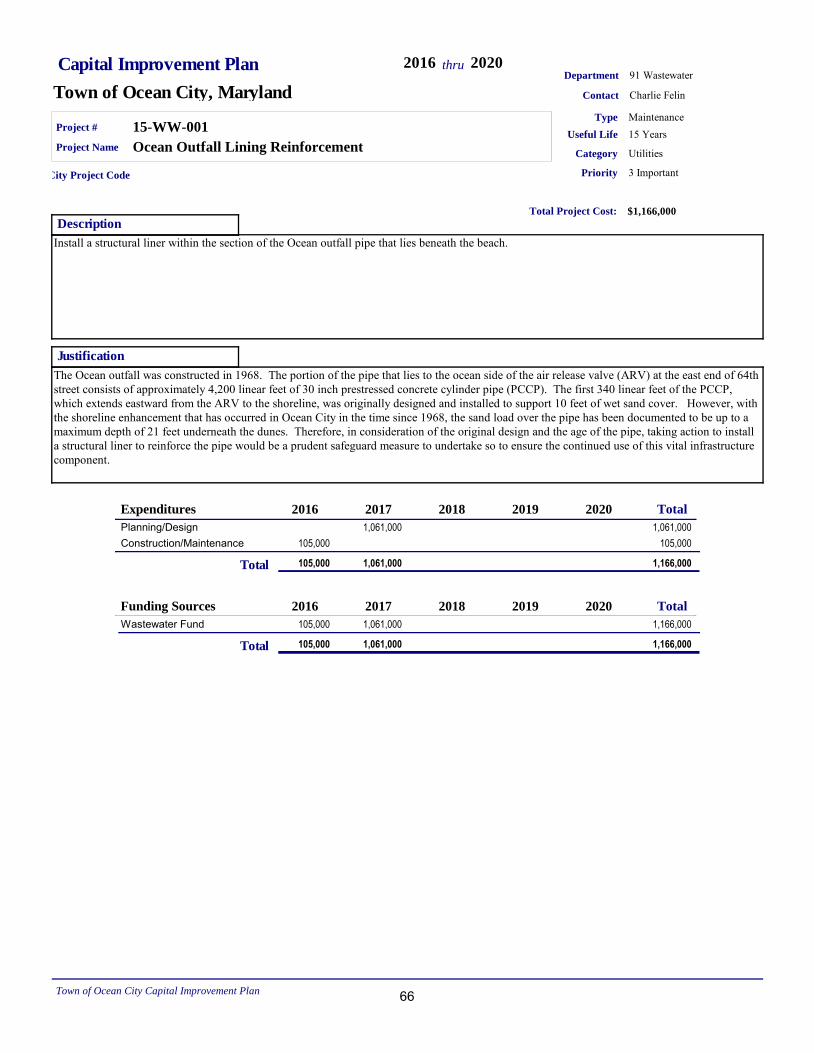
Capital Improvement Plan
Town of Ocean City, MarylandDepartment 91 Wastewater
2016 2020thru
Contact Charlie Felin
Description
Install a structural liner within the section of the Ocean outfall pipe that lies beneath the beach.
Project # 15-WW-001
Priority 3 Important
Justification
The Ocean outfall was constructed in 1968. The portion of the pipe that lies to the ocean side of the air release valve (ARV) at the east end of 64th street consists of approximately 4,200 linear feet of 30 inch prestressed concrete cylinder pipe (PCCP). The first 340 linear feet of the PCCP, which extends eastward from the ARV to the shoreline, was originally designed and installed to support 10 feet of wet sand cover. However, with the shoreline enhancement that has occurred in Ocean City in the time since 1968, the sand load over the pipe has been documented to be up to a maximum depth of 21 feet underneath the dunes. Therefore, in consideration of the original design and the age of the pipe, taking action to install a structural liner to reinforce the pipe would be a prudent safeguard measure to undertake so to ensure the continued use of this vital infrastructure component.
Useful Life 15 YearsProject Name Ocean Outfall Lining Reinforcement
Category Utilities
Type Maintenance
Total Project Cost: $1,166,000
City Project Code
Total2016 2017 2018 2019 2020Expenditures
1,061,0001,061,000Planning/Design105,000105,000Construction/Maintenance
105,000 1,061,000 1,166,000Total
Total2016 2017 2018 2019 2020Funding Sources
1,166,000105,000 1,061,000Wastewater Fund
105,000 1,061,000 1,166,000Total
Town of Ocean City Capital Improvement Plan 66
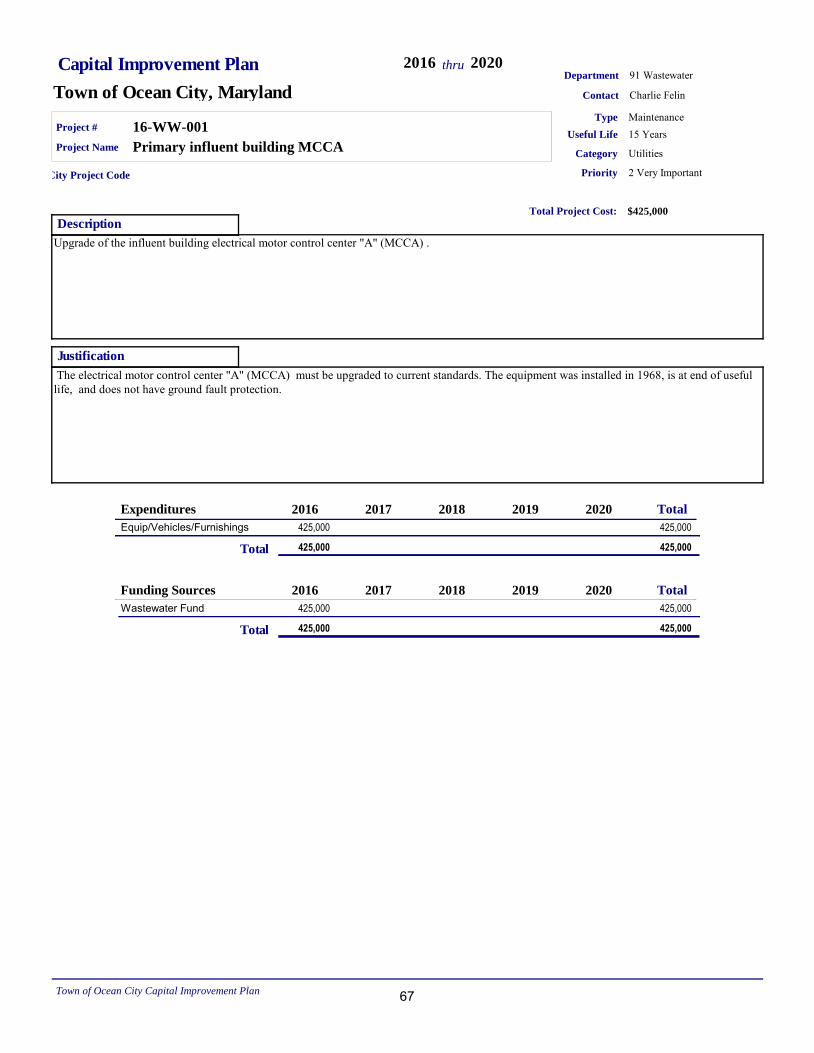
Capital Improvement Plan
Town of Ocean City, MarylandDepartment 91 Wastewater
2016 2020thru
Contact Charlie Felin
Description
Upgrade of the influent building electrical motor control center "A" (MCCA) .
Project # 16-WW-001
Priority 2 Very Important
Justification
The electrical motor control center "A" (MCCA) must be upgraded to current standards. The equipment was installed in 1968, is at end of useful life, and does not have ground fault protection.
Useful Life 15 YearsProject Name Primary influent building MCCA
Category Utilities
Type Maintenance
Total Project Cost: $425,000
City Project Code
Total2016 2017 2018 2019 2020Expenditures
425,000425,000Equip/Vehicles/Furnishings
425,000 425,000Total
Total2016 2017 2018 2019 2020Funding Sources
425,000425,000Wastewater Fund
425,000 425,000Total
Town of Ocean City Capital Improvement Plan 67
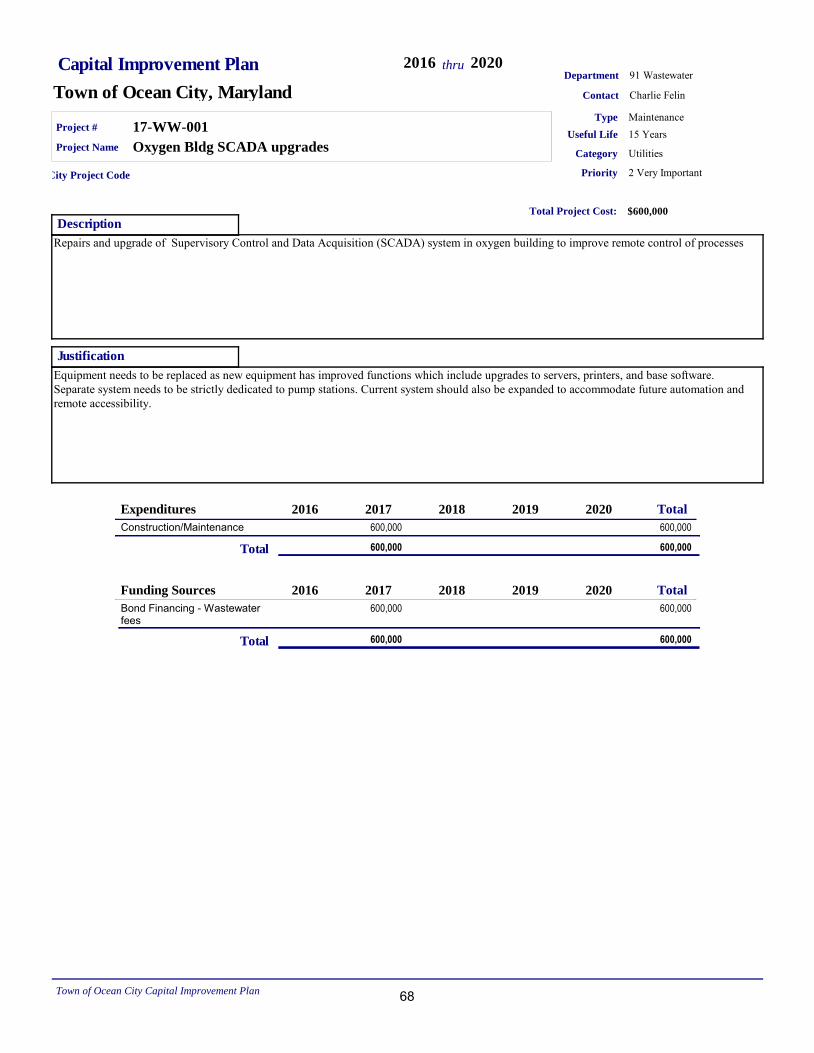
Capital Improvement Plan
Town of Ocean City, MarylandDepartment 91 Wastewater
2016 2020thru
Contact Charlie Felin
Description
Repairs and upgrade of Supervisory Control and Data Acquisition (SCADA) system in oxygen building to improve remote control of processes
Project # 17-WW-001
Priority 2 Very Important
Justification
Equipment needs to be replaced as new equipment has improved functions which include upgrades to servers, printers, and base software. Separate system needs to be strictly dedicated to pump stations. Current system should also be expanded to accommodate future automation and remote accessibility.
Useful Life 15 YearsProject Name Oxygen Bldg SCADA upgrades
Category Utilities
Type Maintenance
Total Project Cost: $600,000
City Project Code
Total2016 2017 2018 2019 2020Expenditures
600,000600,000Construction/Maintenance
600,000 600,000Total
Total2016 2017 2018 2019 2020Funding Sources
600,000600,000Bond Financing - Wastewater fees
600,000 600,000Total
Town of Ocean City Capital Improvement Plan 68
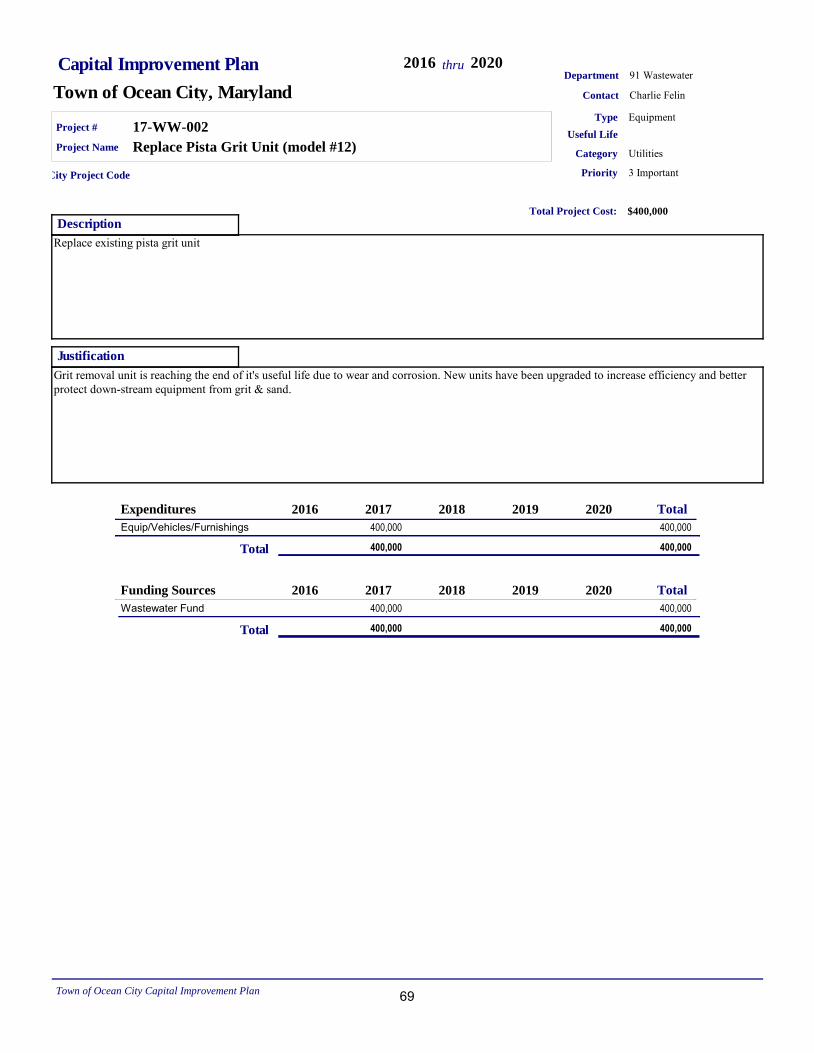
Capital Improvement Plan
Town of Ocean City, MarylandDepartment 91 Wastewater
2016 2020thru
Contact Charlie Felin
Description
Replace existing pista grit unit
Project # 17-WW-002
Priority 3 Important
Justification
Grit removal unit is reaching the end of it's useful life due to wear and corrosion. New units have been upgraded to increase efficiency and better protect down-stream equipment from grit & sand.
Useful Life
Project Name Replace Pista Grit Unit (model #12)Category Utilities
Type Equipment
Total Project Cost: $400,000
City Project Code
Total2016 2017 2018 2019 2020Expenditures
400,000400,000Equip/Vehicles/Furnishings
400,000 400,000Total
Total2016 2017 2018 2019 2020Funding Sources
400,000400,000Wastewater Fund
400,000 400,000Total
Town of Ocean City Capital Improvement Plan 69
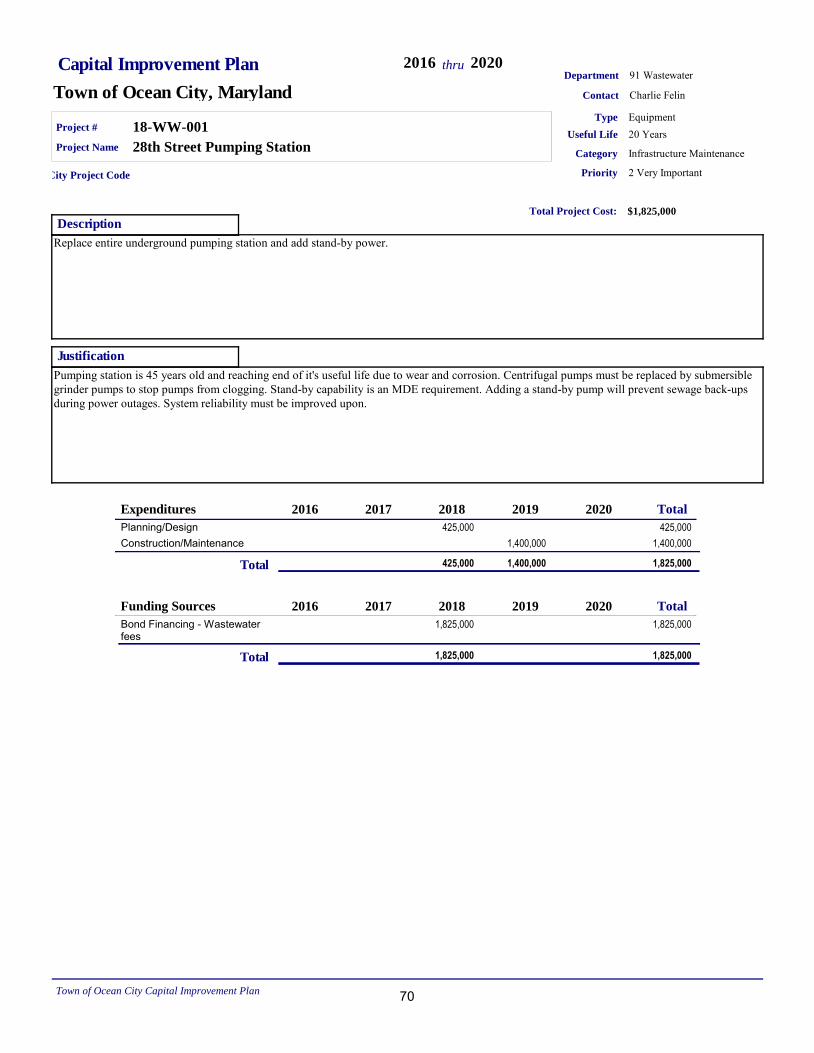
Capital Improvement Plan
Town of Ocean City, MarylandDepartment 91 Wastewater
2016 2020thru
Contact Charlie Felin
Description
Replace entire underground pumping station and add stand-by power.
Project # 18-WW-001
Priority 2 Very Important
Justification
Pumping station is 45 years old and reaching end of it's useful life due to wear and corrosion. Centrifugal pumps must be replaced by submersible grinder pumps to stop pumps from clogging. Stand-by capability is an MDE requirement. Adding a stand-by pump will prevent sewage back-ups during power outages. System reliability must be improved upon.
Useful Life 20 YearsProject Name 28th Street Pumping Station
Category Infrastructure Maintenance
Type Equipment
Total Project Cost: $1,825,000
City Project Code
Total2016 2017 2018 2019 2020Expenditures
425,000425,000Planning/Design1,400,0001,400,000Construction/Maintenance
425,000 1,400,000 1,825,000Total
Total2016 2017 2018 2019 2020Funding Sources
1,825,0001,825,000Bond Financing - Wastewater fees
1,825,000 1,825,000Total
Town of Ocean City Capital Improvement Plan 70
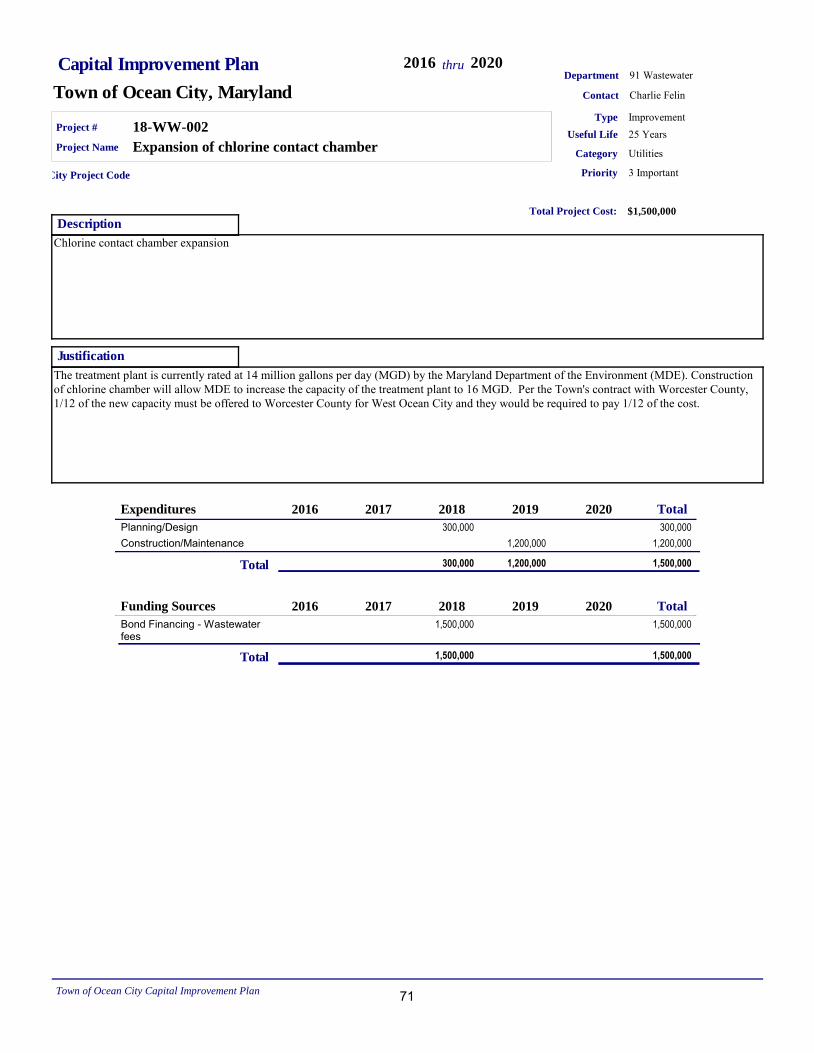
Capital Improvement Plan
Town of Ocean City, MarylandDepartment 91 Wastewater
2016 2020thru
Contact Charlie Felin
Description
Chlorine contact chamber expansion
Project # 18-WW-002
Priority 3 Important
Justification
The treatment plant is currently rated at 14 million gallons per day (MGD) by the Maryland Department of the Environment (MDE). Construction of chlorine chamber will allow MDE to increase the capacity of the treatment plant to 16 MGD. Per the Town's contract with Worcester County, 1/12 of the new capacity must be offered to Worcester County for West Ocean City and they would be required to pay 1/12 of the cost.
Useful Life 25 YearsProject Name Expansion of chlorine contact chamber
Category Utilities
Type Improvement
Total Project Cost: $1,500,000
City Project Code
Total2016 2017 2018 2019 2020Expenditures
300,000300,000Planning/Design1,200,0001,200,000Construction/Maintenance
300,000 1,200,000 1,500,000Total
Total2016 2017 2018 2019 2020Funding Sources
1,500,0001,500,000Bond Financing - Wastewater fees
1,500,000 1,500,000Total
Town of Ocean City Capital Improvement Plan 71

72
WATER & WASTEWATER
RATE MODEL
73

74
Town of Ocean City, MarylandWater & Wastewater Rate Model
Company: Municipal & Financial Services Group 1996Authors: Edward J. Donahue III and Jack QutubUpdated: 03/01/2005
By: David Hyder, Municipal & Financial Services Group
Updated: 03/30/2010 2009 Actual 2010 Budget 2011 BudgetBy: Martha Bennett, CPA, Finance Administrator, Town of Ocean City
Updated: 2/10/2015 2013 Actual 2014 Actual 2015 BudgetBy: Martha Bennett, CPA, Finance Administrator, Town of Ocean City
Capital Master Plan Update as of August 2014
Department of Public Works
Hal Adkins, DirectorJim Parsons, Chief Deputy DirectorCharles Felin, Wastewater SuperintendentHoward Iman, Water Superintendent
Engineering
Terence J. McGean, PE, City Engineer
City Manager
David L. Recor, City Manager ICMA-CM
Whitman, Requardt & Associates LLP
Earl L. Swartzendruber, Jr. PE, Vice President
75
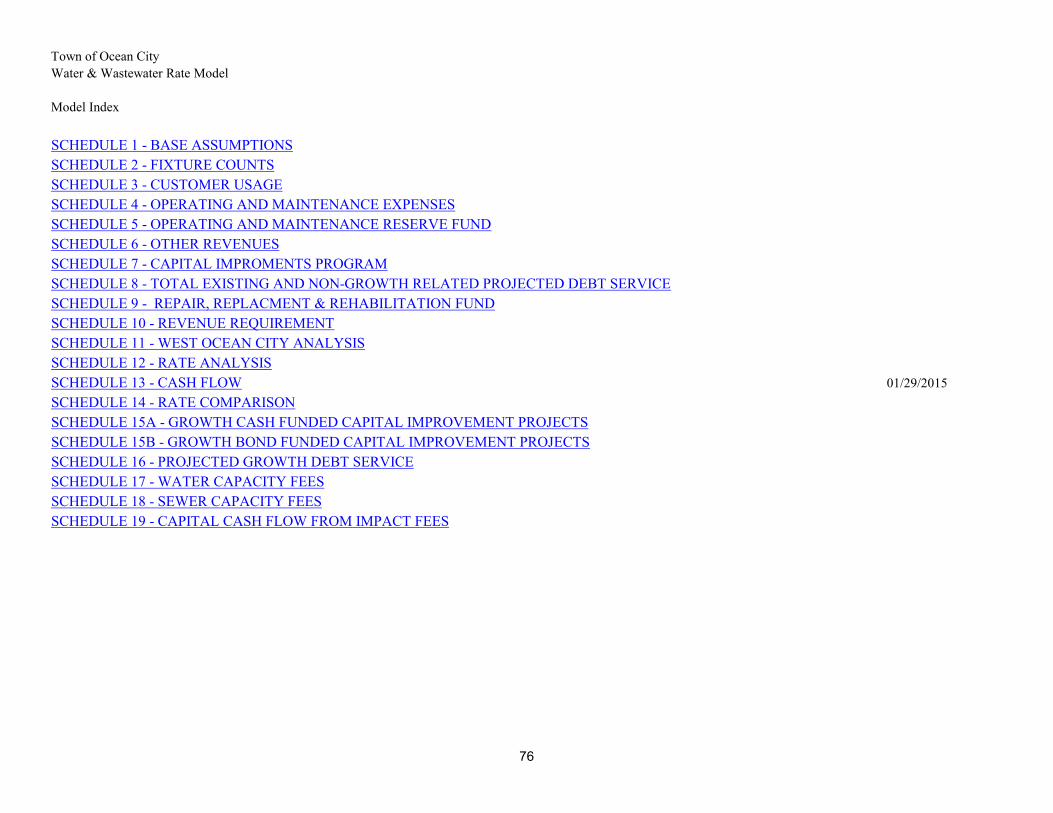
Town of Ocean CityWater & Wastewater Rate Model
Model Index
SCHEDULE 1 - BASE ASSUMPTIONSSCHEDULE 2 - FIXTURE COUNTSSCHEDULE 3 - CUSTOMER USAGESCHEDULE 4 - OPERATING AND MAINTENANCE EXPENSESSCHEDULE 5 - OPERATING AND MAINTENANCE RESERVE FUNDSCHEDULE 6 - OTHER REVENUESSCHEDULE 7 - CAPITAL IMPROMENTS PROGRAMSCHEDULE 8 - TOTAL EXISTING AND NON-GROWTH RELATED PROJECTED DEBT SERVICESCHEDULE 9 - REPAIR, REPLACMENT & REHABILITATION FUNDSCHEDULE 10 - REVENUE REQUIREMENTSCHEDULE 11 - WEST OCEAN CITY ANALYSISSCHEDULE 12 - RATE ANALYSISSCHEDULE 13 - CASH FLOW 01/29/2015SCHEDULE 14 - RATE COMPARISONSCHEDULE 15A - GROWTH CASH FUNDED CAPITAL IMPROVEMENT PROJECTSSCHEDULE 15B - GROWTH BOND FUNDED CAPITAL IMPROVEMENT PROJECTSSCHEDULE 16 - PROJECTED GROWTH DEBT SERVICESCHEDULE 17 - WATER CAPACITY FEESSCHEDULE 18 - SEWER CAPACITY FEESSCHEDULE 19 - CAPITAL CASH FLOW FROM IMPACT FEES
76
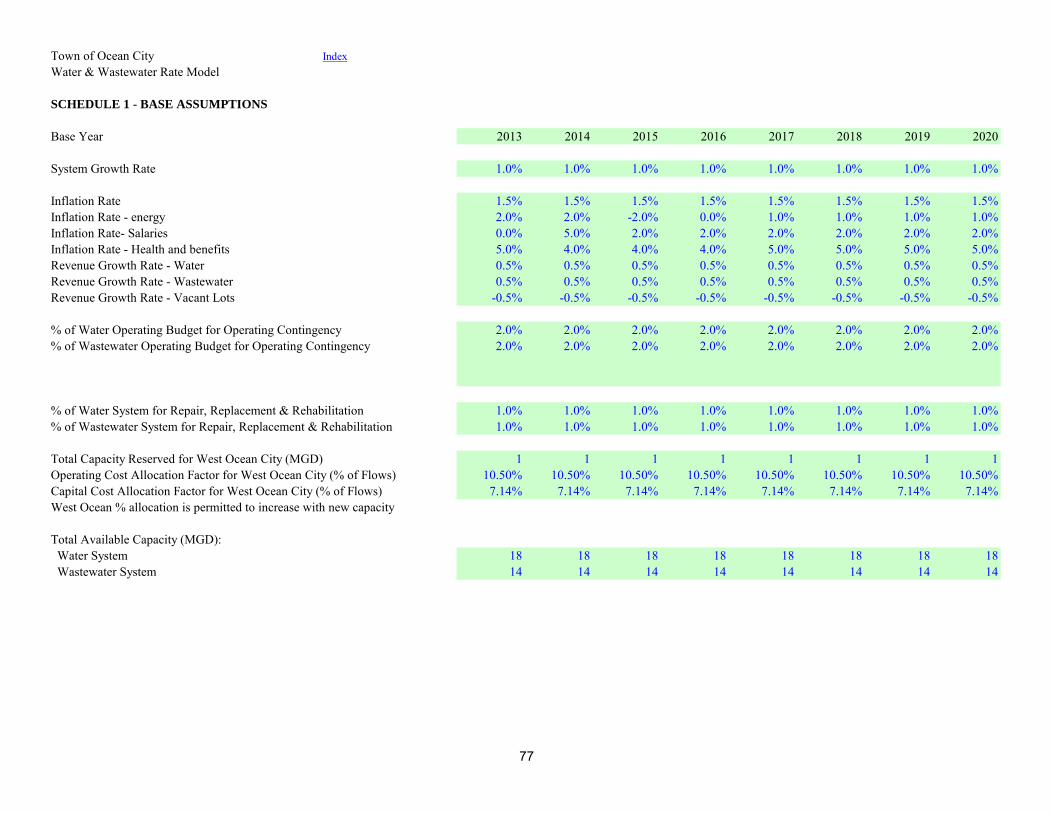
Town of Ocean City IndexWater & Wastewater Rate Model
SCHEDULE 1 - BASE ASSUMPTIONS
Base Year 2013 2014 2015 2016 2017 2018 2019 2020
System Growth Rate 1.0% 1.0% 1.0% 1.0% 1.0% 1.0% 1.0% 1.0%
Inflation Rate 1.5% 1.5% 1.5% 1.5% 1.5% 1.5% 1.5% 1.5%Inflation Rate - energy 2.0% 2.0% -2.0% 0.0% 1.0% 1.0% 1.0% 1.0%Inflation Rate- Salaries 0.0% 5.0% 2.0% 2.0% 2.0% 2.0% 2.0% 2.0%Inflation Rate - Health and benefits 5.0% 4.0% 4.0% 4.0% 5.0% 5.0% 5.0% 5.0%Revenue Growth Rate - Water 0.5% 0.5% 0.5% 0.5% 0.5% 0.5% 0.5% 0.5%Revenue Growth Rate - Wastewater 0.5% 0.5% 0.5% 0.5% 0.5% 0.5% 0.5% 0.5%Revenue Growth Rate - Vacant Lots -0.5% -0.5% -0.5% -0.5% -0.5% -0.5% -0.5% -0.5%
% of Water Operating Budget for Operating Contingency 2.0% 2.0% 2.0% 2.0% 2.0% 2.0% 2.0% 2.0%% of Wastewater Operating Budget for Operating Contingency 2.0% 2.0% 2.0% 2.0% 2.0% 2.0% 2.0% 2.0%
% of Water System for Repair, Replacement & Rehabilitation 1.0% 1.0% 1.0% 1.0% 1.0% 1.0% 1.0% 1.0%% of Wastewater System for Repair, Replacement & Rehabilitation 1.0% 1.0% 1.0% 1.0% 1.0% 1.0% 1.0% 1.0%
Total Capacity Reserved for West Ocean City (MGD) 1 1 1 1 1 1 1 1Operating Cost Allocation Factor for West Ocean City (% of Flows) 10.50% 10.50% 10.50% 10.50% 10.50% 10.50% 10.50% 10.50%Capital Cost Allocation Factor for West Ocean City (% of Flows) 7.14% 7.14% 7.14% 7.14% 7.14% 7.14% 7.14% 7.14%West Ocean % allocation is permitted to increase with new capacity
Total Available Capacity (MGD): Water System 18 18 18 18 18 18 18 18 Wastewater System 14 14 14 14 14 14 14 14
77
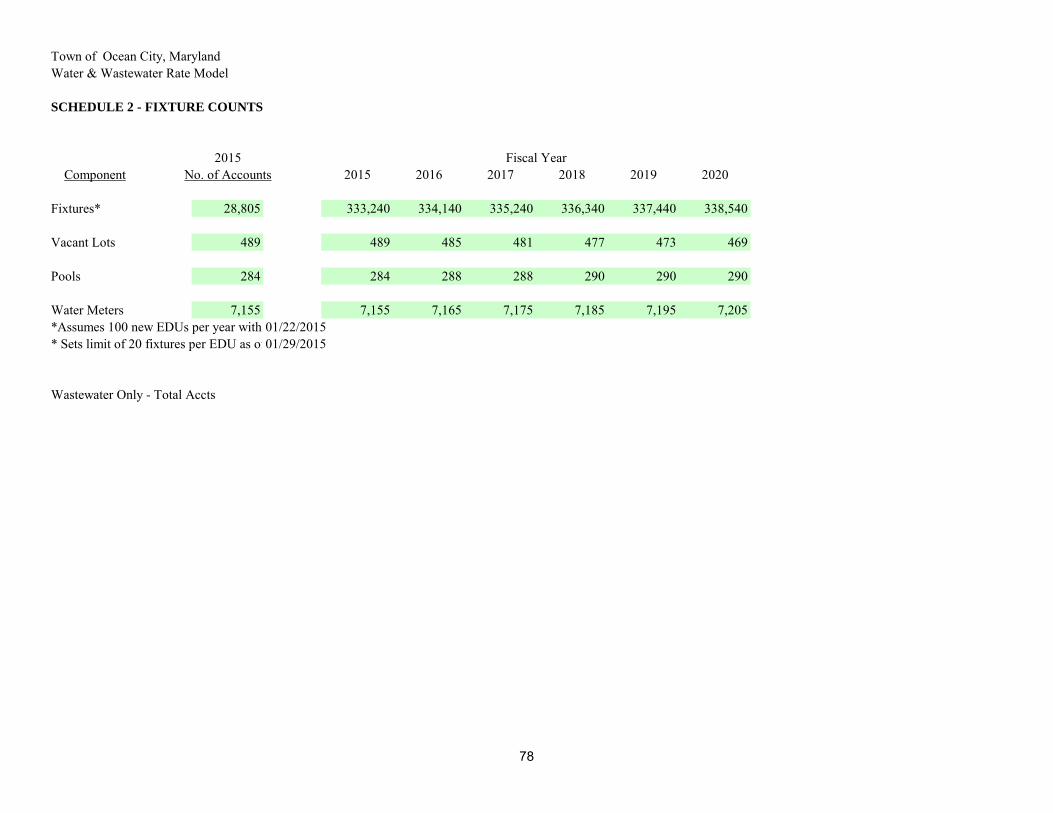
Town of Ocean City, MarylandWater & Wastewater Rate Model
SCHEDULE 2 - FIXTURE COUNTS
2015Component No. of Accounts 2015 2016 2017 2018 2019 2020
Fixtures* 28,805 333,240 334,140 335,240 336,340 337,440 338,540
Vacant Lots 489 489 485 481 477 473 469
Pools 284 284 288 288 290 290 290
Water Meters 7,155 7,155 7,165 7,175 7,185 7,195 7,205*Assumes 100 new EDUs per year with 11 fixtures per EDU01/22/2015* Sets limit of 20 fixtures per EDU as of 201101/29/2015
Wastewater Only - Total Accts
Fiscal Year
78
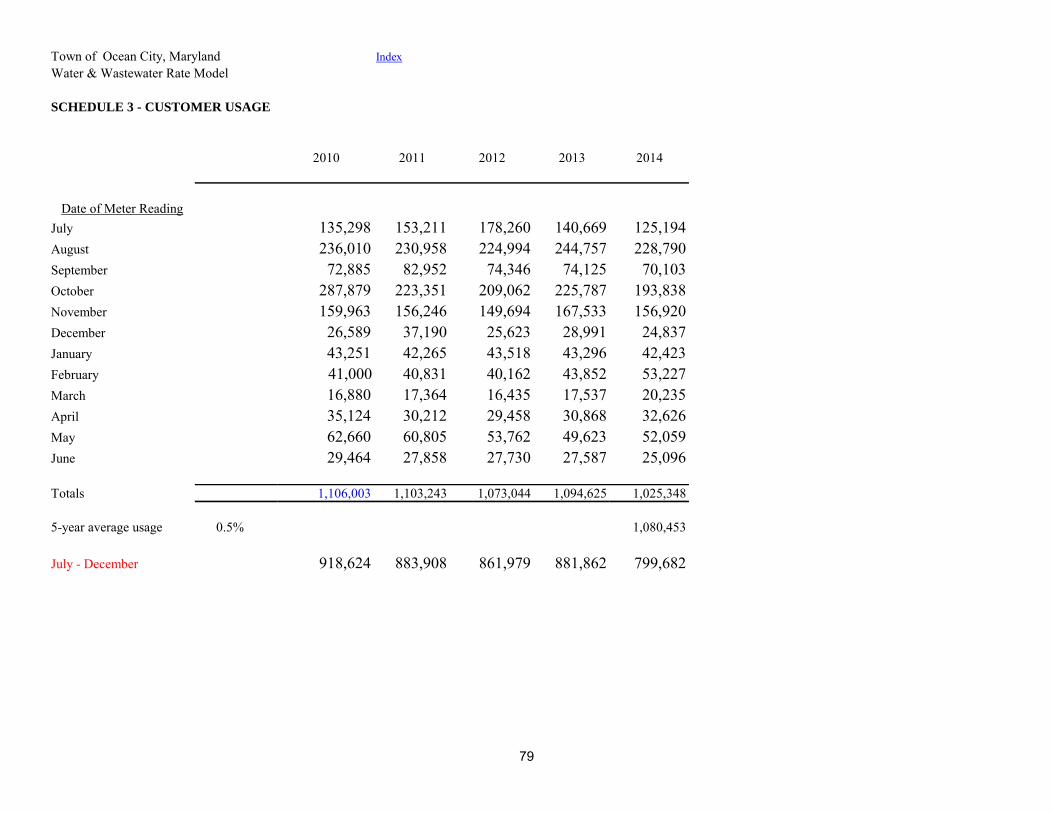
Town of Ocean City, Maryland IndexWater & Wastewater Rate Model
SCHEDULE 3 - CUSTOMER USAGE
2010 2011 2012 2013 2014
Date of Meter ReadingJuly 135,298 153,211 178,260 140,669 125,194August 236,010 230,958 224,994 244,757 228,790September 72,885 82,952 74,346 74,125 70,103October 287,879 223,351 209,062 225,787 193,838November 159,963 156,246 149,694 167,533 156,920December 26,589 37,190 25,623 28,991 24,837January 43,251 42,265 43,518 43,296 42,423February 41,000 40,831 40,162 43,852 53,227March 16,880 17,364 16,435 17,537 20,235April 35,124 30,212 29,458 30,868 32,626May 62,660 60,805 53,762 49,623 52,059June 29,464 27,858 27,730 27,587 25,096
Totals 1,106,003 1,103,243 1,073,044 1,094,625 1,025,348
5-year average usage 0.5% 1,080,453
July - December 918,624 883,908 861,979 881,862 799,682
79
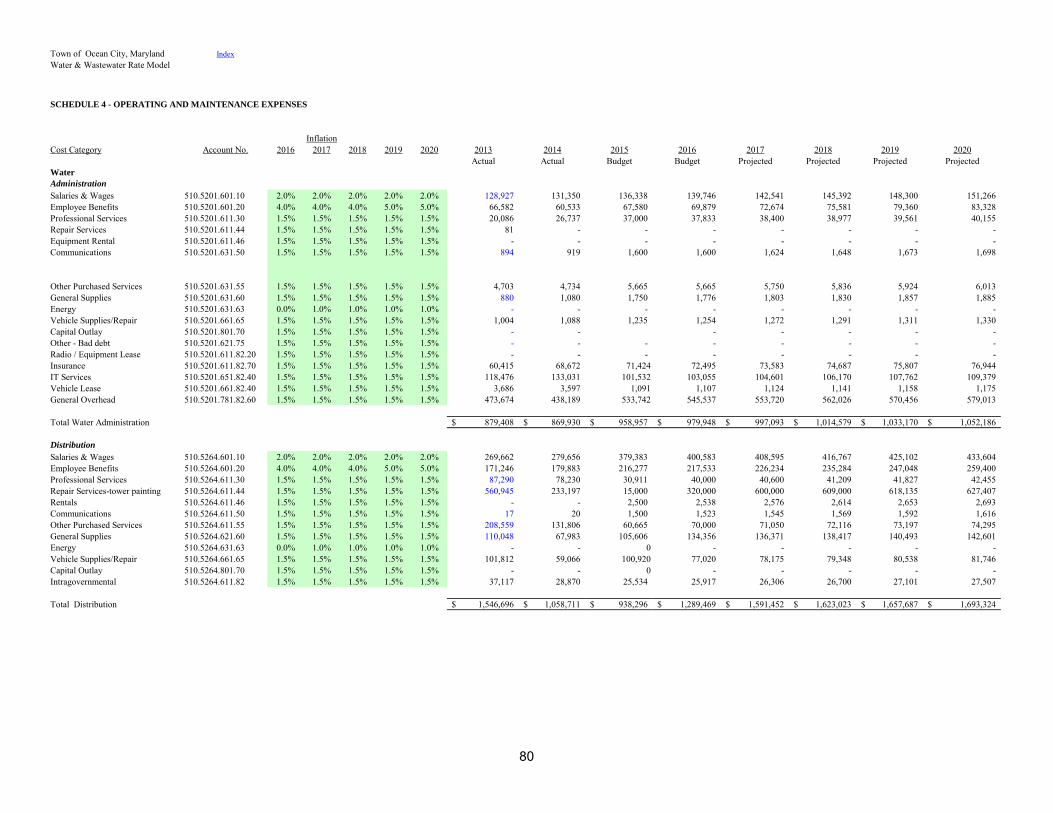
Town of Ocean City, Maryland IndexWater & Wastewater Rate Model
SCHEDULE 4 - OPERATING AND MAINTENANCE EXPENSES
InflationCost Category Account No. 2016 2017 2018 2019 2020 2013 2014 2015 2016 2017 2018 2019 2020
Actual Actual Budget Budget Projected Projected Projected ProjectedWater
Administration
Salaries & Wages 510.5201.601.10 2.0% 2.0% 2.0% 2.0% 2.0% 128,927 131,350 136,338 139,746 142,541 145,392 148,300 151,266 Employee Benefits 510.5201.601.20 4.0% 4.0% 4.0% 5.0% 5.0% 66,582 60,533 67,580 69,879 72,674 75,581 79,360 83,328 Professional Services 510.5201.611.30 1.5% 1.5% 1.5% 1.5% 1.5% 20,086 26,737 37,000 37,833 38,400 38,977 39,561 40,155 Repair Services 510.5201.611.44 1.5% 1.5% 1.5% 1.5% 1.5% 81 - - - - - - - Equipment Rental 510.5201.611.46 1.5% 1.5% 1.5% 1.5% 1.5% - - - - - - - - Communications 510.5201.631.50 1.5% 1.5% 1.5% 1.5% 1.5% 894 919 1,600 1,600 1,624 1,648 1,673 1,698
Other Purchased Services 510.5201.631.55 1.5% 1.5% 1.5% 1.5% 1.5% 4,703 4,734 5,665 5,665 5,750 5,836 5,924 6,013 General Supplies 510.5201.631.60 1.5% 1.5% 1.5% 1.5% 1.5% 880 1,080 1,750 1,776 1,803 1,830 1,857 1,885 Energy 510.5201.631.63 0.0% 1.0% 1.0% 1.0% 1.0% - - - - - - - - Vehicle Supplies/Repair 510.5201.661.65 1.5% 1.5% 1.5% 1.5% 1.5% 1,004 1,088 1,235 1,254 1,272 1,291 1,311 1,330 Capital Outlay 510.5201.801.70 1.5% 1.5% 1.5% 1.5% 1.5% - - - - - - - Other - Bad debt 510.5201.621.75 1.5% 1.5% 1.5% 1.5% 1.5% - - - - - - - - Radio / Equipment Lease 510.5201.611.82.20 1.5% 1.5% 1.5% 1.5% 1.5% - - - - - - - - Insurance 510.5201.611.82.70 1.5% 1.5% 1.5% 1.5% 1.5% 60,415 68,672 71,424 72,495 73,583 74,687 75,807 76,944 IT Services 510.5201.651.82.40 1.5% 1.5% 1.5% 1.5% 1.5% 118,476 133,031 101,532 103,055 104,601 106,170 107,762 109,379 Vehicle Lease 510.5201.661.82.40 1.5% 1.5% 1.5% 1.5% 1.5% 3,686 3,597 1,091 1,107 1,124 1,141 1,158 1,175 General Overhead 510.5201.781.82.60 1.5% 1.5% 1.5% 1.5% 1.5% 473,674 438,189 533,742 545,537 553,720 562,026 570,456 579,013
Total Water Administration 879,408$ 869,930$ 958,957$ 979,948$ 997,093$ 1,014,579$ 1,033,170$ 1,052,186$
Distribution
Salaries & Wages 510.5264.601.10 2.0% 2.0% 2.0% 2.0% 2.0% 269,662 279,656 379,383 400,583 408,595 416,767 425,102 433,604 Employee Benefits 510.5264.601.20 4.0% 4.0% 4.0% 5.0% 5.0% 171,246 179,883 216,277 217,533 226,234 235,284 247,048 259,400 Professional Services 510.5264.611.30 1.5% 1.5% 1.5% 1.5% 1.5% 87,290 78,230 30,911 40,000 40,600 41,209 41,827 42,455 Repair Services-tower painting 510.5264.611.44 1.5% 1.5% 1.5% 1.5% 1.5% 560,945 233,197 15,000 320,000 600,000 609,000 618,135 627,407 Rentals 510.5264.611.46 1.5% 1.5% 1.5% 1.5% 1.5% - - 2,500 2,538 2,576 2,614 2,653 2,693 Communications 510.5264.611.50 1.5% 1.5% 1.5% 1.5% 1.5% 17 20 1,500 1,523 1,545 1,569 1,592 1,616 Other Purchased Services 510.5264.611.55 1.5% 1.5% 1.5% 1.5% 1.5% 208,559 131,806 60,665 70,000 71,050 72,116 73,197 74,295 General Supplies 510.5264.621.60 1.5% 1.5% 1.5% 1.5% 1.5% 110,048 67,983 105,606 134,356 136,371 138,417 140,493 142,601 Energy 510.5264.631.63 0.0% 1.0% 1.0% 1.0% 1.0% - - 0 - - - - - Vehicle Supplies/Repair 510.5264.661.65 1.5% 1.5% 1.5% 1.5% 1.5% 101,812 59,066 100,920 77,020 78,175 79,348 80,538 81,746 Capital Outlay 510.5264.801.70 1.5% 1.5% 1.5% 1.5% 1.5% - - 0 - - - - - Intragovernmental 510.5264.611.82 1.5% 1.5% 1.5% 1.5% 1.5% 37,117 28,870 25,534 25,917 26,306 26,700 27,101 27,507
Total Distribution 1,546,696$ 1,058,711$ 938,296$ 1,289,469$ 1,591,452$ 1,623,023$ 1,657,687$ 1,693,324$
80
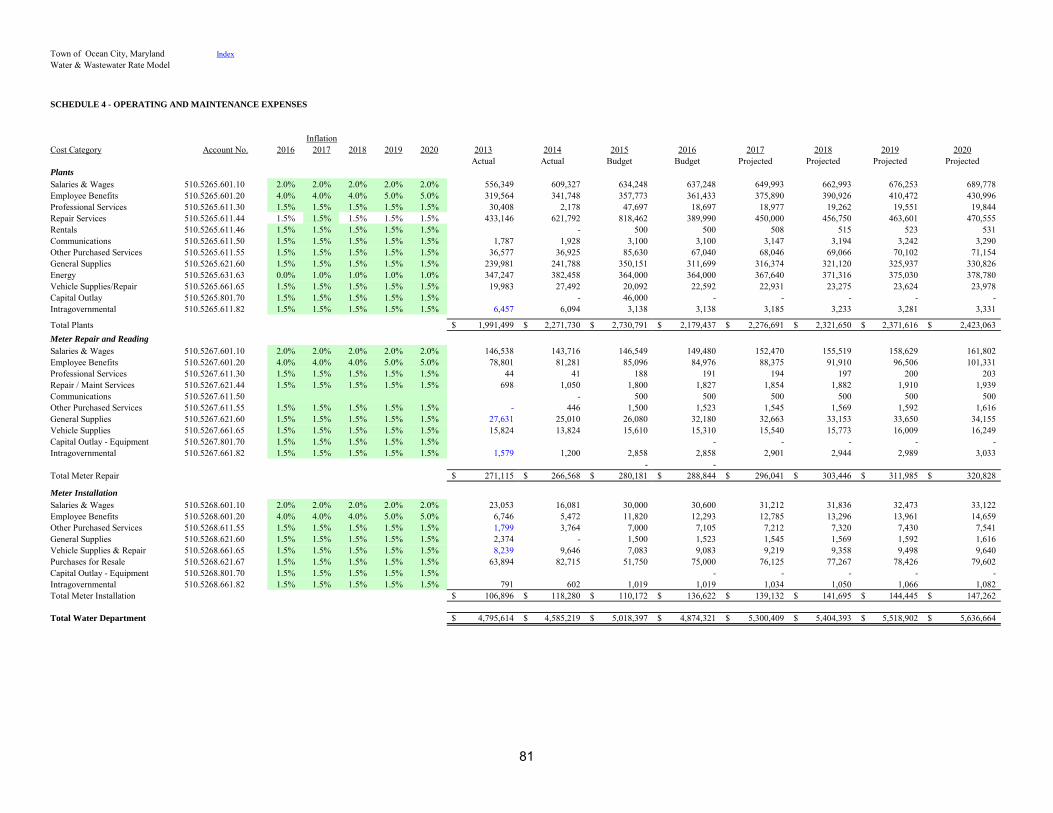
Town of Ocean City, Maryland IndexWater & Wastewater Rate Model
SCHEDULE 4 - OPERATING AND MAINTENANCE EXPENSES
InflationCost Category Account No. 2016 2017 2018 2019 2020 2013 2014 2015 2016 2017 2018 2019 2020
Actual Actual Budget Budget Projected Projected Projected ProjectedPlants
Salaries & Wages 510.5265.601.10 2.0% 2.0% 2.0% 2.0% 2.0% 556,349 609,327 634,248 637,248 649,993 662,993 676,253 689,778 Employee Benefits 510.5265.601.20 4.0% 4.0% 4.0% 5.0% 5.0% 319,564 341,748 357,773 361,433 375,890 390,926 410,472 430,996 Professional Services 510.5265.611.30 1.5% 1.5% 1.5% 1.5% 1.5% 30,408 2,178 47,697 18,697 18,977 19,262 19,551 19,844 Repair Services 510.5265.611.44 1.5% 1.5% 1.5% 1.5% 1.5% 433,146 621,792 818,462 389,990 450,000 456,750 463,601 470,555 Rentals 510.5265.611.46 1.5% 1.5% 1.5% 1.5% 1.5% - 500 500 508 515 523 531 Communications 510.5265.611.50 1.5% 1.5% 1.5% 1.5% 1.5% 1,787 1,928 3,100 3,100 3,147 3,194 3,242 3,290 Other Purchased Services 510.5265.611.55 1.5% 1.5% 1.5% 1.5% 1.5% 36,577 36,925 85,630 67,040 68,046 69,066 70,102 71,154 General Supplies 510.5265.621.60 1.5% 1.5% 1.5% 1.5% 1.5% 239,981 241,788 350,151 311,699 316,374 321,120 325,937 330,826 Energy 510.5265.631.63 0.0% 1.0% 1.0% 1.0% 1.0% 347,247 382,458 364,000 364,000 367,640 371,316 375,030 378,780 Vehicle Supplies/Repair 510.5265.661.65 1.5% 1.5% 1.5% 1.5% 1.5% 19,983 27,492 20,092 22,592 22,931 23,275 23,624 23,978 Capital Outlay 510.5265.801.70 1.5% 1.5% 1.5% 1.5% 1.5% - 46,000 - - - - - Intragovernmental 510.5265.611.82 1.5% 1.5% 1.5% 1.5% 1.5% 6,457 6,094 3,138 3,138 3,185 3,233 3,281 3,331
Total Plants 1,991,499$ 2,271,730$ 2,730,791$ 2,179,437$ 2,276,691$ 2,321,650$ 2,371,616$ 2,423,063$ Meter Repair and Reading
Salaries & Wages 510.5267.601.10 2.0% 2.0% 2.0% 2.0% 2.0% 146,538 143,716 146,549 149,480 152,470 155,519 158,629 161,802 Employee Benefits 510.5267.601.20 4.0% 4.0% 4.0% 5.0% 5.0% 78,801 81,281 85,096 84,976 88,375 91,910 96,506 101,331 Professional Services 510.5267.611.30 1.5% 1.5% 1.5% 1.5% 1.5% 44 41 188 191 194 197 200 203 Repair / Maint Services 510.5267.621.44 1.5% 1.5% 1.5% 1.5% 1.5% 698 1,050 1,800 1,827 1,854 1,882 1,910 1,939 Communications 510.5267.611.50 - 500 500 500 500 500 500 Other Purchased Services 510.5267.611.55 1.5% 1.5% 1.5% 1.5% 1.5% - 446 1,500 1,523 1,545 1,569 1,592 1,616 General Supplies 510.5267.621.60 1.5% 1.5% 1.5% 1.5% 1.5% 27,631 25,010 26,080 32,180 32,663 33,153 33,650 34,155 Vehicle Supplies 510.5267.661.65 1.5% 1.5% 1.5% 1.5% 1.5% 15,824 13,824 15,610 15,310 15,540 15,773 16,009 16,249 Capital Outlay - Equipment 510.5267.801.70 1.5% 1.5% 1.5% 1.5% 1.5% - - - - - Intragovernmental 510.5267.661.82 1.5% 1.5% 1.5% 1.5% 1.5% 1,579 1,200 2,858 2,858 2,901 2,944 2,989 3,033
- - Total Meter Repair 271,115$ 266,568$ 280,181$ 288,844$ 296,041$ 303,446$ 311,985$ 320,828$
Meter Installation
Salaries & Wages 510.5268.601.10 2.0% 2.0% 2.0% 2.0% 2.0% 23,053 16,081 30,000 30,600 31,212 31,836 32,473 33,122 Employee Benefits 510.5268.601.20 4.0% 4.0% 4.0% 5.0% 5.0% 6,746 5,472 11,820 12,293 12,785 13,296 13,961 14,659 Other Purchased Services 510.5268.611.55 1.5% 1.5% 1.5% 1.5% 1.5% 1,799 3,764 7,000 7,105 7,212 7,320 7,430 7,541 General Supplies 510.5268.621.60 1.5% 1.5% 1.5% 1.5% 1.5% 2,374 - 1,500 1,523 1,545 1,569 1,592 1,616 Vehicle Supplies & Repair 510.5268.661.65 1.5% 1.5% 1.5% 1.5% 1.5% 8,239 9,646 7,083 9,083 9,219 9,358 9,498 9,640 Purchases for Resale 510.5268.621.67 1.5% 1.5% 1.5% 1.5% 1.5% 63,894 82,715 51,750 75,000 76,125 77,267 78,426 79,602 Capital Outlay - Equipment 510.5268.801.70 1.5% 1.5% 1.5% 1.5% 1.5% - - - - - Intragovernmental 510.5268.661.82 1.5% 1.5% 1.5% 1.5% 1.5% 791 602 1,019 1,019 1,034 1,050 1,066 1,082 Total Meter Installation 106,896$ 118,280$ 110,172$ 136,622$ 139,132$ 141,695$ 144,445$ 147,262$
Total Water Department 4,795,614$ 4,585,219$ 5,018,397$ 4,874,321$ 5,300,409$ 5,404,393$ 5,518,902$ 5,636,664$
81
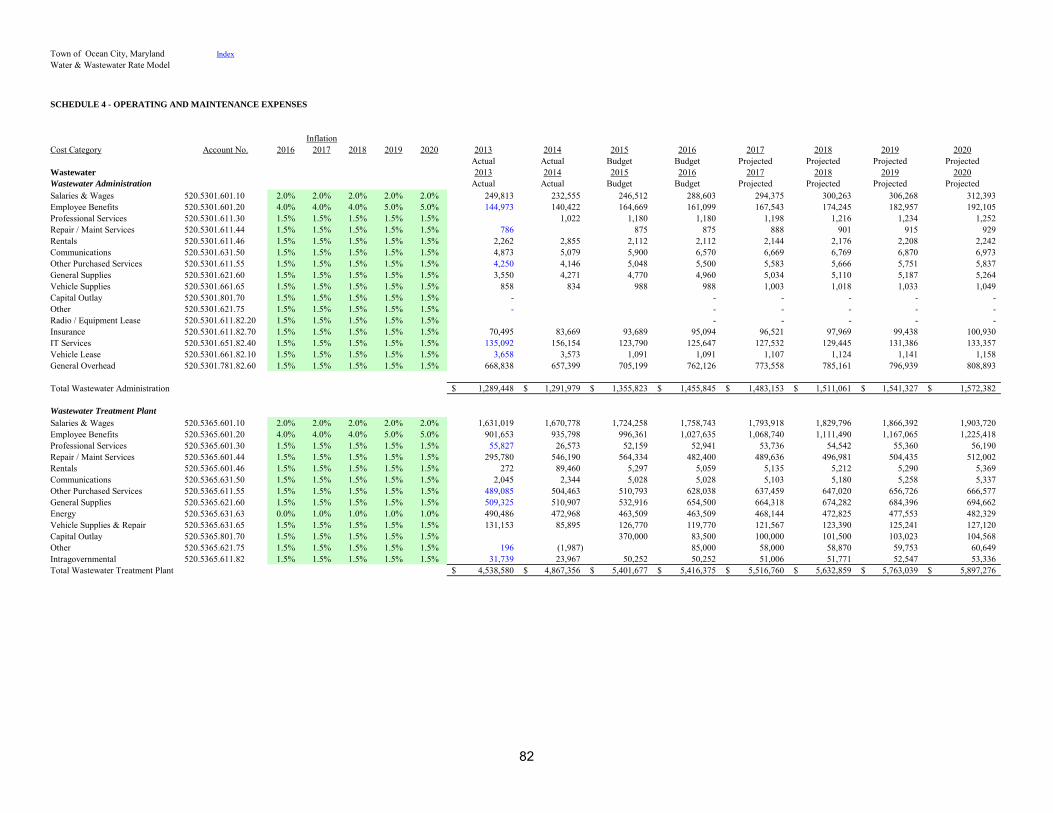
Town of Ocean City, Maryland IndexWater & Wastewater Rate Model
SCHEDULE 4 - OPERATING AND MAINTENANCE EXPENSES
InflationCost Category Account No. 2016 2017 2018 2019 2020 2013 2014 2015 2016 2017 2018 2019 2020
Actual Actual Budget Budget Projected Projected Projected ProjectedWastewater 2013 2014 2015 2016 2017 2018 2019 2020Wastewater Administration Actual Actual Budget Budget Projected Projected Projected ProjectedSalaries & Wages 520.5301.601.10 2.0% 2.0% 2.0% 2.0% 2.0% 249,813 232,555 246,512 288,603 294,375 300,263 306,268 312,393 Employee Benefits 520.5301.601.20 4.0% 4.0% 4.0% 5.0% 5.0% 144,973 140,422 164,669 161,099 167,543 174,245 182,957 192,105 Professional Services 520.5301.611.30 1.5% 1.5% 1.5% 1.5% 1.5% 1,022 1,180 1,180 1,198 1,216 1,234 1,252 Repair / Maint Services 520.5301.611.44 1.5% 1.5% 1.5% 1.5% 1.5% 786 875 875 888 901 915 929 Rentals 520.5301.611.46 1.5% 1.5% 1.5% 1.5% 1.5% 2,262 2,855 2,112 2,112 2,144 2,176 2,208 2,242 Communications 520.5301.631.50 1.5% 1.5% 1.5% 1.5% 1.5% 4,873 5,079 5,900 6,570 6,669 6,769 6,870 6,973 Other Purchased Services 520.5301.611.55 1.5% 1.5% 1.5% 1.5% 1.5% 4,250 4,146 5,048 5,500 5,583 5,666 5,751 5,837 General Supplies 520.5301.621.60 1.5% 1.5% 1.5% 1.5% 1.5% 3,550 4,271 4,770 4,960 5,034 5,110 5,187 5,264 Vehicle Supplies 520.5301.661.65 1.5% 1.5% 1.5% 1.5% 1.5% 858 834 988 988 1,003 1,018 1,033 1,049 Capital Outlay 520.5301.801.70 1.5% 1.5% 1.5% 1.5% 1.5% - - - - - - Other 520.5301.621.75 1.5% 1.5% 1.5% 1.5% 1.5% - - - - - - Radio / Equipment Lease 520.5301.611.82.20 1.5% 1.5% 1.5% 1.5% 1.5% - - - - - Insurance 520.5301.611.82.70 1.5% 1.5% 1.5% 1.5% 1.5% 70,495 83,669 93,689 95,094 96,521 97,969 99,438 100,930 IT Services 520.5301.651.82.40 1.5% 1.5% 1.5% 1.5% 1.5% 135,092 156,154 123,790 125,647 127,532 129,445 131,386 133,357 Vehicle Lease 520.5301.661.82.10 1.5% 1.5% 1.5% 1.5% 1.5% 3,658 3,573 1,091 1,091 1,107 1,124 1,141 1,158 General Overhead 520.5301.781.82.60 1.5% 1.5% 1.5% 1.5% 1.5% 668,838 657,399 705,199 762,126 773,558 785,161 796,939 808,893
Total Wastewater Administration 1,289,448$ 1,291,979$ 1,355,823$ 1,455,845$ 1,483,153$ 1,511,061$ 1,541,327$ 1,572,382$
Wastewater Treatment Plant
Salaries & Wages 520.5365.601.10 2.0% 2.0% 2.0% 2.0% 2.0% 1,631,019 1,670,778 1,724,258 1,758,743 1,793,918 1,829,796 1,866,392 1,903,720 Employee Benefits 520.5365.601.20 4.0% 4.0% 4.0% 5.0% 5.0% 901,653 935,798 996,361 1,027,635 1,068,740 1,111,490 1,167,065 1,225,418 Professional Services 520.5365.601.30 1.5% 1.5% 1.5% 1.5% 1.5% 55,827 26,573 52,159 52,941 53,736 54,542 55,360 56,190 Repair / Maint Services 520.5365.601.44 1.5% 1.5% 1.5% 1.5% 1.5% 295,780 546,190 564,334 482,400 489,636 496,981 504,435 512,002 Rentals 520.5365.601.46 1.5% 1.5% 1.5% 1.5% 1.5% 272 89,460 5,297 5,059 5,135 5,212 5,290 5,369 Communications 520.5365.631.50 1.5% 1.5% 1.5% 1.5% 1.5% 2,045 2,344 5,028 5,028 5,103 5,180 5,258 5,337 Other Purchased Services 520.5365.611.55 1.5% 1.5% 1.5% 1.5% 1.5% 489,085 504,463 510,793 628,038 637,459 647,020 656,726 666,577 General Supplies 520.5365.621.60 1.5% 1.5% 1.5% 1.5% 1.5% 509,325 510,907 532,916 654,500 664,318 674,282 684,396 694,662 Energy 520.5365.631.63 0.0% 1.0% 1.0% 1.0% 1.0% 490,486 472,968 463,509 463,509 468,144 472,825 477,553 482,329 Vehicle Supplies & Repair 520.5365.631.65 1.5% 1.5% 1.5% 1.5% 1.5% 131,153 85,895 126,770 119,770 121,567 123,390 125,241 127,120 Capital Outlay 520.5365.801.70 1.5% 1.5% 1.5% 1.5% 1.5% 370,000 83,500 100,000 101,500 103,023 104,568 Other 520.5365.621.75 1.5% 1.5% 1.5% 1.5% 1.5% 196 (1,987) 85,000 58,000 58,870 59,753 60,649 Intragovernmental 520.5365.611.82 1.5% 1.5% 1.5% 1.5% 1.5% 31,739 23,967 50,252 50,252 51,006 51,771 52,547 53,336 Total Wastewater Treatment Plant 4,538,580$ 4,867,356$ 5,401,677$ 5,416,375$ 5,516,760$ 5,632,859$ 5,763,039$ 5,897,276$
82
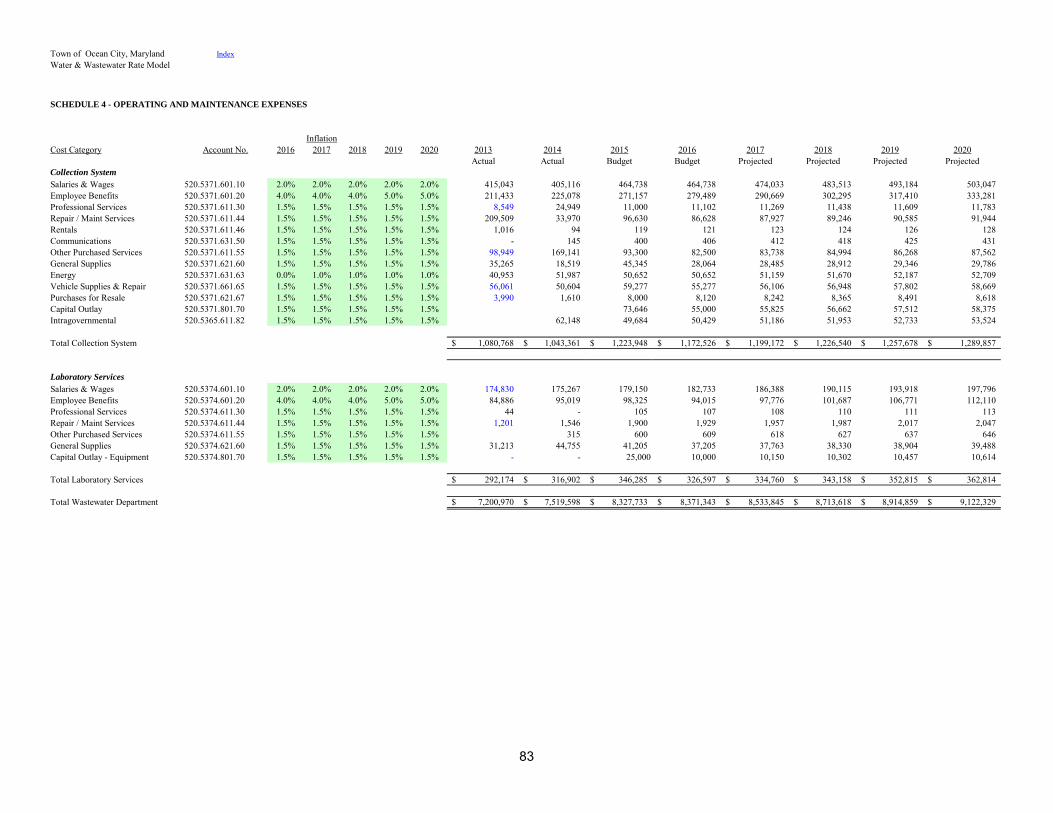
Town of Ocean City, Maryland IndexWater & Wastewater Rate Model
SCHEDULE 4 - OPERATING AND MAINTENANCE EXPENSES
InflationCost Category Account No. 2016 2017 2018 2019 2020 2013 2014 2015 2016 2017 2018 2019 2020
Actual Actual Budget Budget Projected Projected Projected ProjectedCollection System
Salaries & Wages 520.5371.601.10 2.0% 2.0% 2.0% 2.0% 2.0% 415,043 405,116 464,738 464,738 474,033 483,513 493,184 503,047 Employee Benefits 520.5371.601.20 4.0% 4.0% 4.0% 5.0% 5.0% 211,433 225,078 271,157 279,489 290,669 302,295 317,410 333,281 Professional Services 520.5371.611.30 1.5% 1.5% 1.5% 1.5% 1.5% 8,549 24,949 11,000 11,102 11,269 11,438 11,609 11,783 Repair / Maint Services 520.5371.611.44 1.5% 1.5% 1.5% 1.5% 1.5% 209,509 33,970 96,630 86,628 87,927 89,246 90,585 91,944 Rentals 520.5371.611.46 1.5% 1.5% 1.5% 1.5% 1.5% 1,016 94 119 121 123 124 126 128 Communications 520.5371.631.50 1.5% 1.5% 1.5% 1.5% 1.5% - 145 400 406 412 418 425 431 Other Purchased Services 520.5371.611.55 1.5% 1.5% 1.5% 1.5% 1.5% 98,949 169,141 93,300 82,500 83,738 84,994 86,268 87,562 General Supplies 520.5371.621.60 1.5% 1.5% 1.5% 1.5% 1.5% 35,265 18,519 45,345 28,064 28,485 28,912 29,346 29,786 Energy 520.5371.631.63 0.0% 1.0% 1.0% 1.0% 1.0% 40,953 51,987 50,652 50,652 51,159 51,670 52,187 52,709 Vehicle Supplies & Repair 520.5371.661.65 1.5% 1.5% 1.5% 1.5% 1.5% 56,061 50,604 59,277 55,277 56,106 56,948 57,802 58,669 Purchases for Resale 520.5371.621.67 1.5% 1.5% 1.5% 1.5% 1.5% 3,990 1,610 8,000 8,120 8,242 8,365 8,491 8,618 Capital Outlay 520.5371.801.70 1.5% 1.5% 1.5% 1.5% 1.5% 73,646 55,000 55,825 56,662 57,512 58,375 Intragovernmental 520.5365.611.82 1.5% 1.5% 1.5% 1.5% 1.5% 62,148 49,684 50,429 51,186 51,953 52,733 53,524
Total Collection System 1,080,768$ 1,043,361$ 1,223,948$ 1,172,526$ 1,199,172$ 1,226,540$ 1,257,678$ 1,289,857$
Laboratory Services
Salaries & Wages 520.5374.601.10 2.0% 2.0% 2.0% 2.0% 2.0% 174,830 175,267 179,150 182,733 186,388 190,115 193,918 197,796 Employee Benefits 520.5374.601.20 4.0% 4.0% 4.0% 5.0% 5.0% 84,886 95,019 98,325 94,015 97,776 101,687 106,771 112,110 Professional Services 520.5374.611.30 1.5% 1.5% 1.5% 1.5% 1.5% 44 - 105 107 108 110 111 113 Repair / Maint Services 520.5374.611.44 1.5% 1.5% 1.5% 1.5% 1.5% 1,201 1,546 1,900 1,929 1,957 1,987 2,017 2,047 Other Purchased Services 520.5374.611.55 1.5% 1.5% 1.5% 1.5% 1.5% 315 600 609 618 627 637 646 General Supplies 520.5374.621.60 1.5% 1.5% 1.5% 1.5% 1.5% 31,213 44,755 41,205 37,205 37,763 38,330 38,904 39,488 Capital Outlay - Equipment 520.5374.801.70 1.5% 1.5% 1.5% 1.5% 1.5% - - 25,000 10,000 10,150 10,302 10,457 10,614
Total Laboratory Services 292,174$ 316,902$ 346,285$ 326,597$ 334,760$ 343,158$ 352,815$ 362,814$
Total Wastewater Department 7,200,970$ 7,519,598$ 8,327,733$ 8,371,343$ 8,533,845$ 8,713,618$ 8,914,859$ 9,122,329$
83
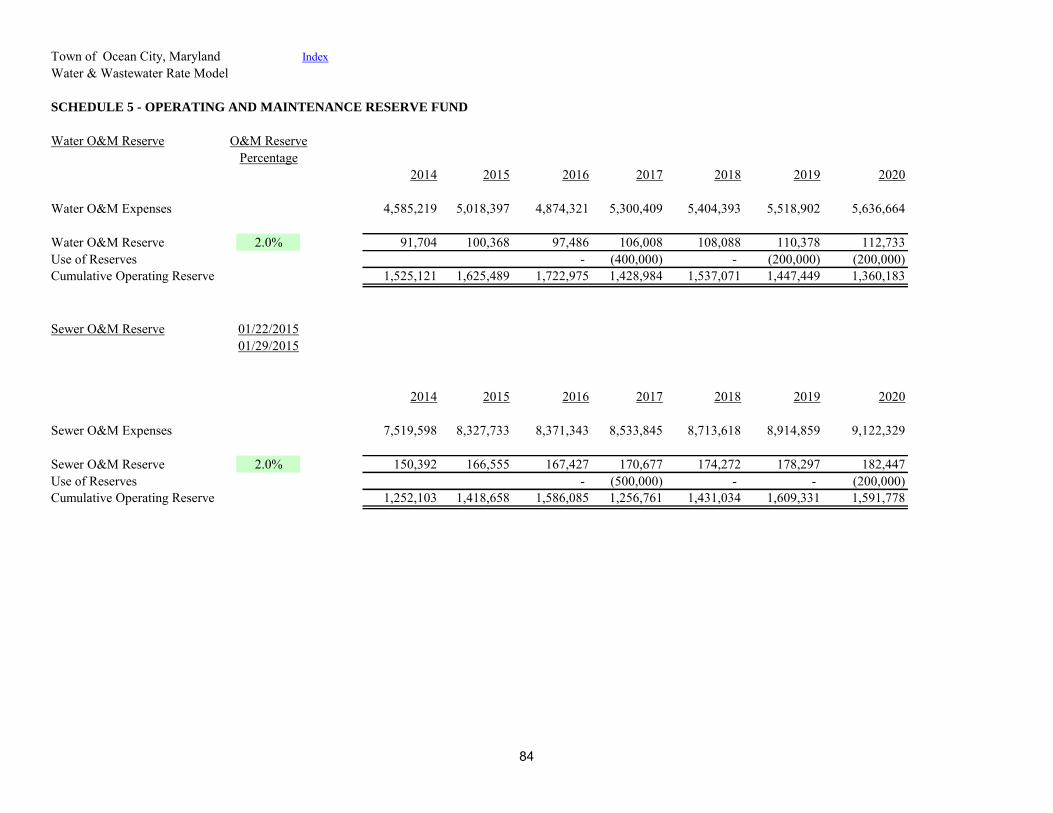
Town of Ocean City, Maryland IndexWater & Wastewater Rate Model
SCHEDULE 5 - OPERATING AND MAINTENANCE RESERVE FUND
Water O&M Reserve O&M ReservePercentage
2014 2015 2016 2017 2018 2019 2020
Water O&M Expenses 4,585,219 5,018,397 4,874,321 5,300,409 5,404,393 5,518,902 5,636,664
Water O&M Reserve 2.0% 91,704 100,368 97,486 106,008 108,088 110,378 112,733Use of Reserves - (400,000) - (200,000) (200,000) Cumulative Operating Reserve 1,525,121 1,625,489 1,722,975 1,428,984 1,537,071 1,447,449 1,360,183
Sewer O&M Reserve 01/22/201501/29/2015
2014 2015 2016 2017 2018 2019 2020
Sewer O&M Expenses 7,519,598 8,327,733 8,371,343 8,533,845 8,713,618 8,914,859 9,122,329
Sewer O&M Reserve 2.0% 150,392 166,555 167,427 170,677 174,272 178,297 182,447Use of Reserves - (500,000) - - (200,000) Cumulative Operating Reserve 1,252,103 1,418,658 1,586,085 1,256,761 1,431,034 1,609,331 1,591,778
84
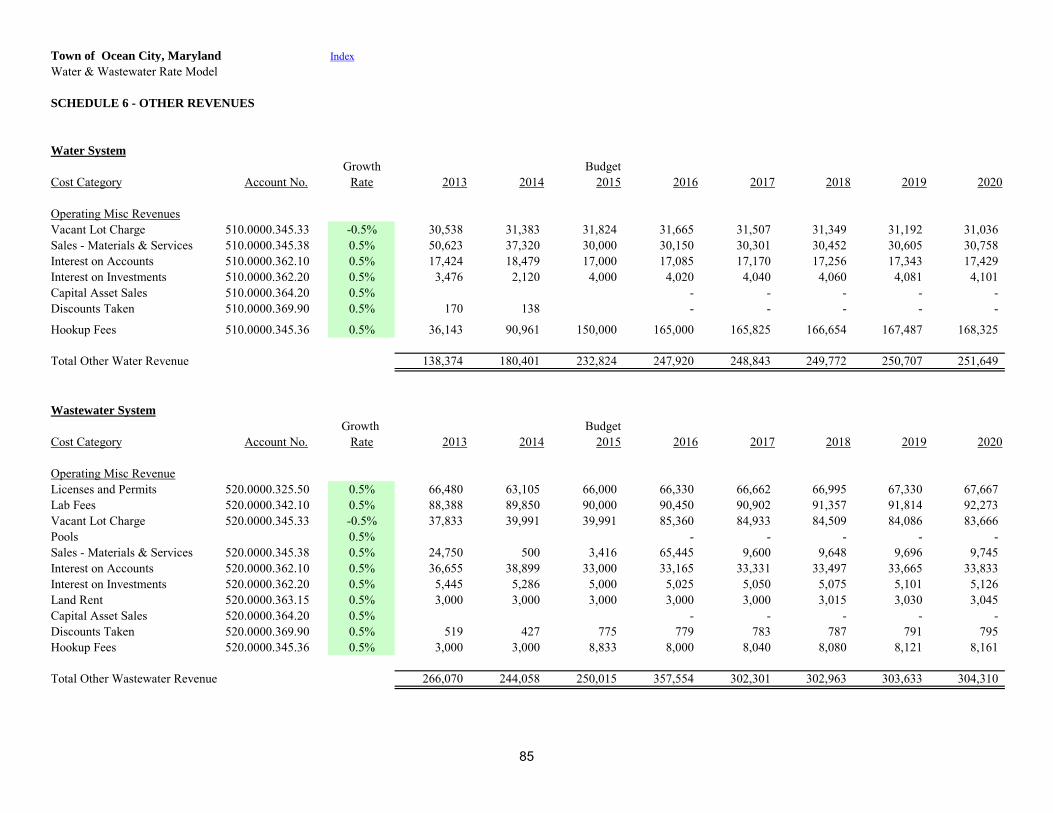
Town of Ocean City, Maryland IndexWater & Wastewater Rate Model
SCHEDULE 6 - OTHER REVENUES
Water System
Growth BudgetCost Category Account No. Rate 2013 2014 2015 2016 2017 2018 2019 2020
Operating Misc RevenuesVacant Lot Charge 510.0000.345.33 -0.5% 30,538 31,383 31,824 31,665 31,507 31,349 31,192 31,036 Sales - Materials & Services 510.0000.345.38 0.5% 50,623 37,320 30,000 30,150 30,301 30,452 30,605 30,758 Interest on Accounts 510.0000.362.10 0.5% 17,424 18,479 17,000 17,085 17,170 17,256 17,343 17,429 Interest on Investments 510.0000.362.20 0.5% 3,476 2,120 4,000 4,020 4,040 4,060 4,081 4,101 Capital Asset Sales 510.0000.364.20 0.5% - - - - - Discounts Taken 510.0000.369.90 0.5% 170 138 - - - - - Prior Year Reserves 510.0000.395.1001/29/20150.5% - - - - - Hookup Fees 510.0000.345.36 0.5% 36,143 90,961 150,000 165,000 165,825 166,654 167,487 168,325
Total Other Water Revenue 138,374 180,401 232,824 247,920 248,843 249,772 250,707 251,649
Wastewater System
Growth BudgetCost Category Account No. Rate 2013 2014 2015 2016 2017 2018 2019 2020
Operating Misc RevenueLicenses and Permits 520.0000.325.50 0.5% 66,480 63,105 66,000 66,330 66,662 66,995 67,330 67,667 Lab Fees 520.0000.342.10 0.5% 88,388 89,850 90,000 90,450 90,902 91,357 91,814 92,273 Vacant Lot Charge 520.0000.345.33 -0.5% 37,833 39,991 39,991 85,360 84,933 84,509 84,086 83,666 Pools 0.5% - - - - - Sales - Materials & Services 520.0000.345.38 0.5% 24,750 500 3,416 65,445 9,600 9,648 9,696 9,745 Interest on Accounts 520.0000.362.10 0.5% 36,655 38,899 33,000 33,165 33,331 33,497 33,665 33,833 Interest on Investments 520.0000.362.20 0.5% 5,445 5,286 5,000 5,025 5,050 5,075 5,101 5,126 Land Rent 520.0000.363.15 0.5% 3,000 3,000 3,000 3,000 3,000 3,015 3,030 3,045 Capital Asset Sales 520.0000.364.20 0.5% - - - - - Discounts Taken 520.0000.369.90 0.5% 519 427 775 779 783 787 791 795 Hookup Fees 520.0000.345.36 0.5% 3,000 3,000 8,833 8,000 8,040 8,080 8,121 8,161
Total Other Wastewater Revenue 266,070 244,058 250,015 357,554 302,301 302,963 303,633 304,310
85
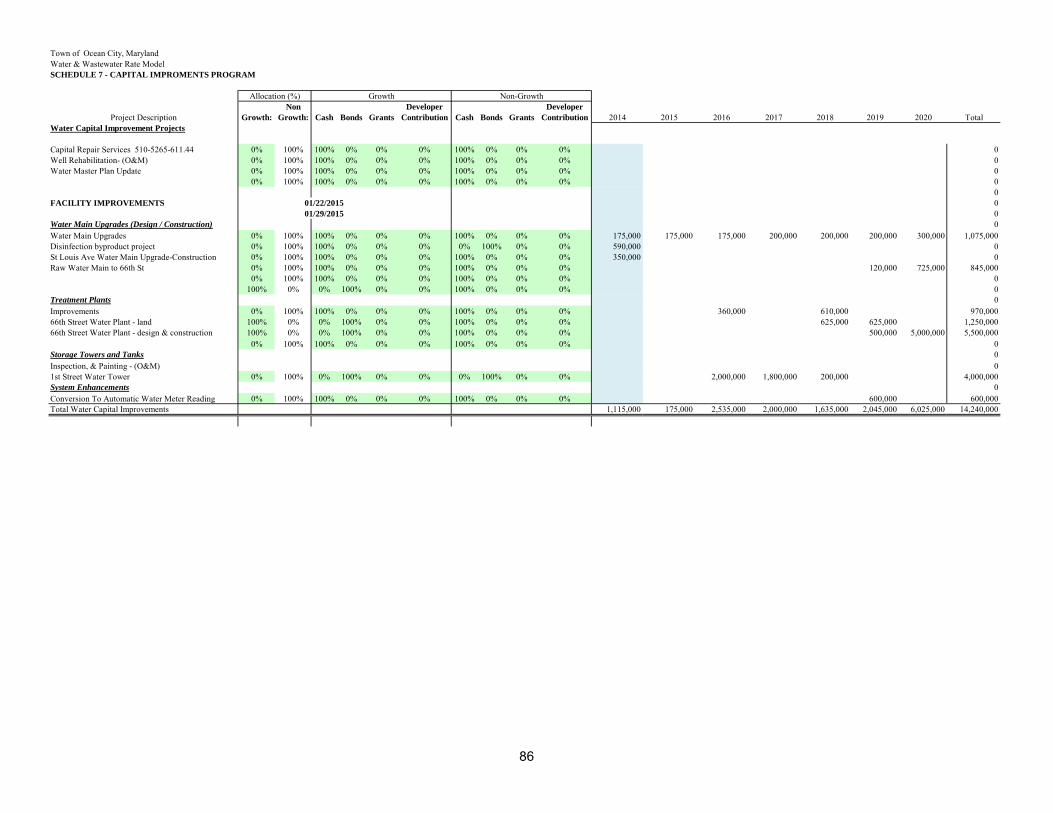
Town of Ocean City, MarylandWater & Wastewater Rate ModelSCHEDULE 7 - CAPITAL IMPROMENTS PROGRAM
Non Developer Developer
Project Description Growth: Growth: Cash Bonds Grants Contribution Cash Bonds Grants Contribution 2014 2015 2016 2017 2018 2019 2020 TotalWater Capital Improvement Projects
Capital Repair Services 510-5265-611.44 0% 100% 100% 0% 0% 0% 100% 0% 0% 0% 0Well Rehabilitation- (O&M) 0% 100% 100% 0% 0% 0% 100% 0% 0% 0% 0Water Master Plan Update 0% 100% 100% 0% 0% 0% 100% 0% 0% 0% 0
0% 100% 100% 0% 0% 0% 100% 0% 0% 0% 00
FACILITY IMPROVEMENTS 01/22/2015 001/29/2015 0
Water Main Upgrades (Design / Construction) 0Water Main Upgrades 0% 100% 100% 0% 0% 0% 100% 0% 0% 0% 175,000 175,000 175,000 200,000 200,000 200,000 300,000 1,075,000Disinfection byproduct project 0% 100% 100% 0% 0% 0% 0% 100% 0% 0% 590,000 0St Louis Ave Water Main Upgrade-Construction 0% 100% 100% 0% 0% 0% 100% 0% 0% 0% 350,000 0Raw Water Main to 66th St 0% 100% 100% 0% 0% 0% 100% 0% 0% 0% 120,000 725,000 845,000
0% 100% 100% 0% 0% 0% 100% 0% 0% 0% 0100% 0% 0% 100% 0% 0% 100% 0% 0% 0% 0
Treatment Plants 0Improvements 0% 100% 100% 0% 0% 0% 100% 0% 0% 0% 360,000 610,000 970,00066th Street Water Plant - land 100% 0% 0% 100% 0% 0% 100% 0% 0% 0% 625,000 625,000 1,250,00066th Street Water Plant - design & construction 100% 0% 0% 100% 0% 0% 100% 0% 0% 0% 500,000 5,000,000 5,500,000
0% 100% 100% 0% 0% 0% 100% 0% 0% 0% 0Storage Towers and Tanks 0Inspection, & Painting - (O&M) 01st Street Water Tower 0% 100% 0% 100% 0% 0% 0% 100% 0% 0% 2,000,000 1,800,000 200,000 4,000,000System Enhancements 0Conversion To Automatic Water Meter Reading 0% 100% 100% 0% 0% 0% 100% 0% 0% 0% 600,000 600,000Total Water Capital Improvements 1,115,000 175,000 2,535,000 2,000,000 1,635,000 2,045,000 6,025,000 14,240,000
GrowthAllocation (%) Non-Growth
86
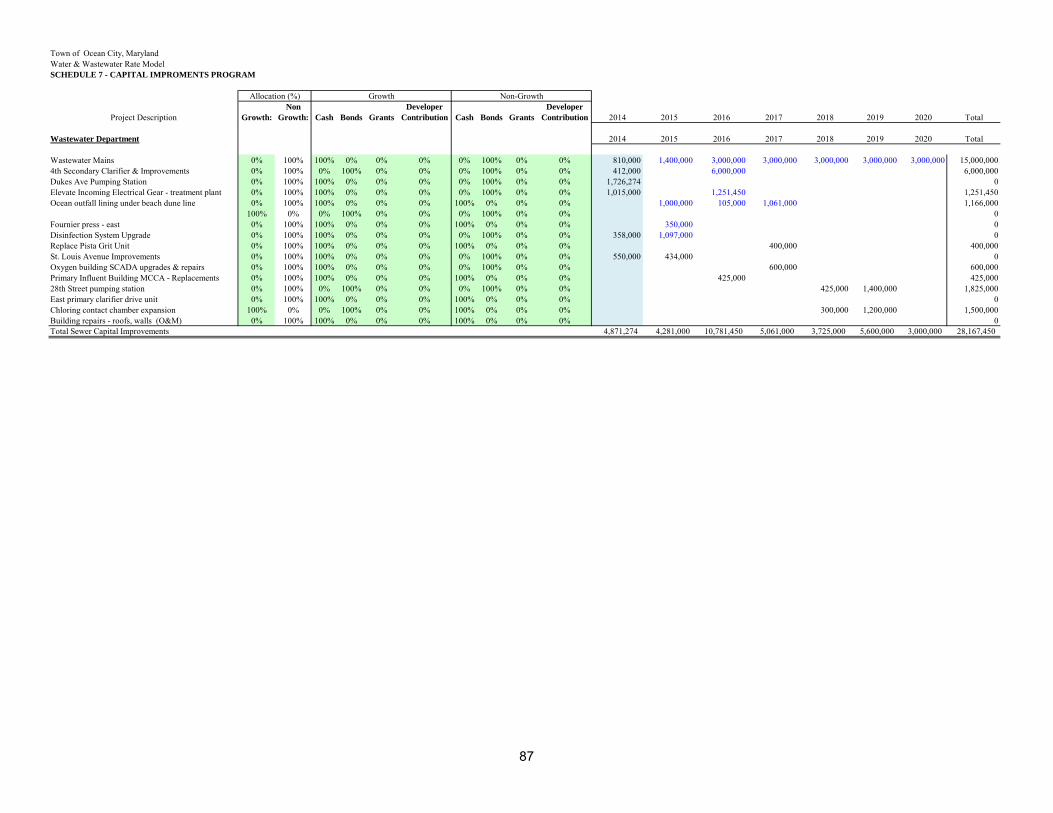
Town of Ocean City, MarylandWater & Wastewater Rate ModelSCHEDULE 7 - CAPITAL IMPROMENTS PROGRAM
Non Developer Developer
Project Description Growth: Growth: Cash Bonds Grants Contribution Cash Bonds Grants Contribution 2014 2015 2016 2017 2018 2019 2020 Total
GrowthAllocation (%) Non-Growth
Wastewater Department 2014 2015 2016 2017 2018 2019 2020 Total
Wastewater Mains 0% 100% 100% 0% 0% 0% 0% 100% 0% 0% 810,000 1,400,000 3,000,000 3,000,000 3,000,000 3,000,000 3,000,000 15,000,0004th Secondary Clarifier & Improvements 0% 100% 0% 100% 0% 0% 0% 100% 0% 0% 412,000 6,000,000 6,000,000Dukes Ave Pumping Station 0% 100% 100% 0% 0% 0% 0% 100% 0% 0% 1,726,274 0Elevate Incoming Electrical Gear - treatment plant 0% 100% 100% 0% 0% 0% 0% 100% 0% 0% 1,015,000 1,251,450 1,251,450Ocean outfall lining under beach dune line 0% 100% 100% 0% 0% 0% 100% 0% 0% 0% 1,000,000 105,000 1,061,000 1,166,000
100% 0% 0% 100% 0% 0% 0% 100% 0% 0% 0Fournier press - east 0% 100% 100% 0% 0% 0% 100% 0% 0% 0% 350,000 0Disinfection System Upgrade 0% 100% 100% 0% 0% 0% 0% 100% 0% 0% 358,000 1,097,000 0Replace Pista Grit Unit 0% 100% 100% 0% 0% 0% 100% 0% 0% 0% 400,000 400,000St. Louis Avenue Improvements 0% 100% 100% 0% 0% 0% 0% 100% 0% 0% 550,000 434,000 0Oxygen building SCADA upgrades & repairs 0% 100% 100% 0% 0% 0% 0% 100% 0% 0% 600,000 600,000Primary Influent Building MCCA - Replacements 0% 100% 100% 0% 0% 0% 100% 0% 0% 0% 425,000 425,00028th Street pumping station 0% 100% 0% 100% 0% 0% 0% 100% 0% 0% 425,000 1,400,000 1,825,000East primary clarifier drive unit 0% 100% 100% 0% 0% 0% 100% 0% 0% 0% 0Chloring contact chamber expansion 100% 0% 0% 100% 0% 0% 100% 0% 0% 0% 300,000 1,200,000 1,500,000Building repairs - roofs, walls (O&M) 0% 100% 100% 0% 0% 0% 100% 0% 0% 0% 0Total Sewer Capital Improvements 4,871,274 4,281,000 10,781,450 5,061,000 3,725,000 5,600,000 3,000,000 28,167,450
87
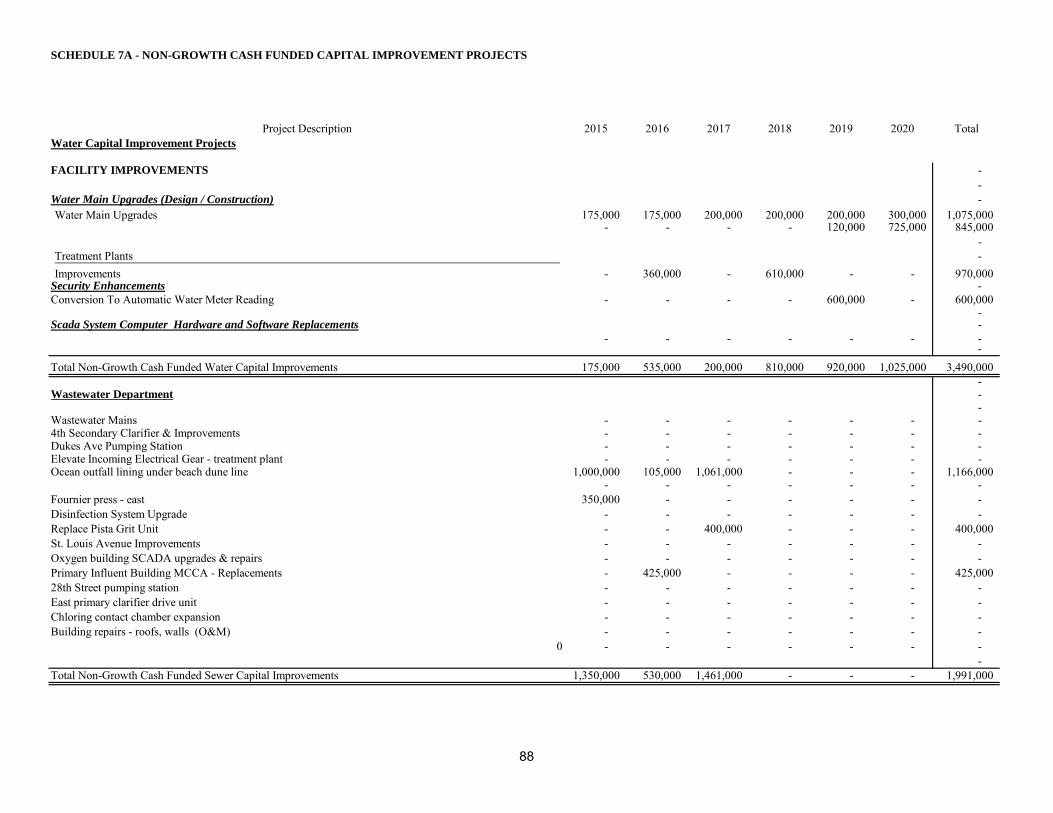
SCHEDULE 7A - NON-GROWTH CASH FUNDED CAPITAL IMPROVEMENT PROJECTS
Project Description 2015 2016 2017 2018 2019 2020 TotalWater Capital Improvement Projects
FACILITY IMPROVEMENTS - -
Water Main Upgrades (Design / Construction) - Water Main Upgrades 175,000 175,000 200,000 200,000 200,000 300,000 1,075,000
- - - - 120,000 725,000 845,000 -
Treatment Plants - Improvements - 360,000 - 610,000 - - 970,000
Security Enhancements - Conversion To Automatic Water Meter Reading - - - - 600,000 - 600,000
- Scada System Computer Hardware and Software Replacements -
- - - - - - - -
Total Non-Growth Cash Funded Water Capital Improvements 175,000 535,000 200,000 810,000 920,000 1,025,000 3,490,000 -
Wastewater Department - -
Wastewater Mains - - - - - - - 4th Secondary Clarifier & Improvements - - - - - - - Dukes Ave Pumping Station - - - - - - - Elevate Incoming Electrical Gear - treatment plant - - - - - - - Ocean outfall lining under beach dune line 1,000,000 105,000 1,061,000 - - - 1,166,000
- - - - - - - Fournier press - east 350,000 - - - - - - Disinfection System Upgrade - - - - - - - Replace Pista Grit Unit - - 400,000 - - - 400,000 St. Louis Avenue Improvements - - - - - - - Oxygen building SCADA upgrades & repairs - - - - - - - Primary Influent Building MCCA - Replacements - 425,000 - - - - 425,000 28th Street pumping station - - - - - - - East primary clarifier drive unit - - - - - - - Chloring contact chamber expansion - - - - - - - Building repairs - roofs, walls (O&M) - - - - - - -
0 - - - - - - - -
Total Non-Growth Cash Funded Sewer Capital Improvements 1,350,000 530,000 1,461,000 - - - 1,991,000
88
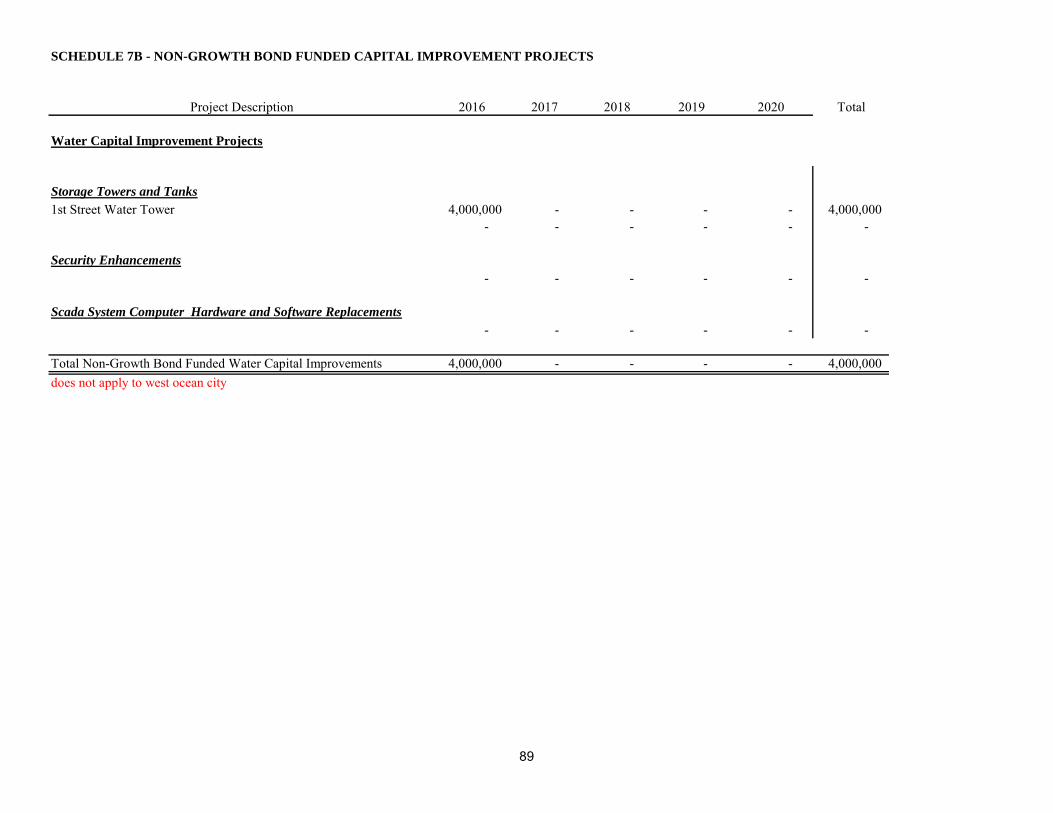
SCHEDULE 7B - NON-GROWTH BOND FUNDED CAPITAL IMPROVEMENT PROJECTS
Project Description 2016 2017 2018 2019 2020 Total
Water Capital Improvement Projects
Storage Towers and Tanks
1st Street Water Tower 4,000,000 - - - - 4,000,000 - - - - - -
Security Enhancements
- - - - - -
Scada System Computer Hardware and Software Replacements
- - - - - -
Total Non-Growth Bond Funded Water Capital Improvements 4,000,000 - - - - 4,000,000 does not apply to west ocean city
89
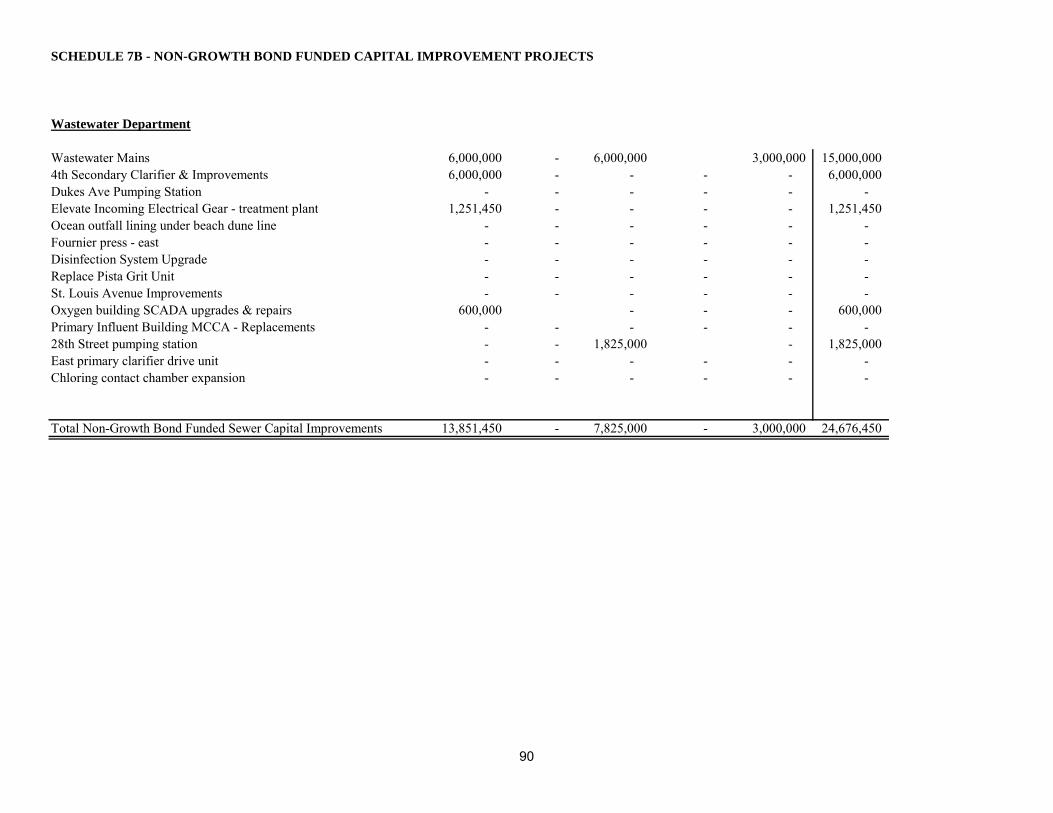
SCHEDULE 7B - NON-GROWTH BOND FUNDED CAPITAL IMPROVEMENT PROJECTS
Wastewater Department
Wastewater Mains 6,000,000 - 6,000,000 3,000,000 15,000,000 4th Secondary Clarifier & Improvements 6,000,000 - - - - 6,000,000 Dukes Ave Pumping Station - - - - - - Elevate Incoming Electrical Gear - treatment plant 1,251,450 - - - - 1,251,450 Ocean outfall lining under beach dune line - - - - - - Fournier press - east - - - - - - Disinfection System Upgrade - - - - - - Replace Pista Grit Unit - - - - - - St. Louis Avenue Improvements - - - - - - Oxygen building SCADA upgrades & repairs 600,000 - - - 600,000 Primary Influent Building MCCA - Replacements - - - - - - 28th Street pumping station - - 1,825,000 - 1,825,000 East primary clarifier drive unit - - - - - - Chloring contact chamber expansion - - - - - -
Total Non-Growth Bond Funded Sewer Capital Improvements 13,851,450 - 7,825,000 - 3,000,000 24,676,450
90
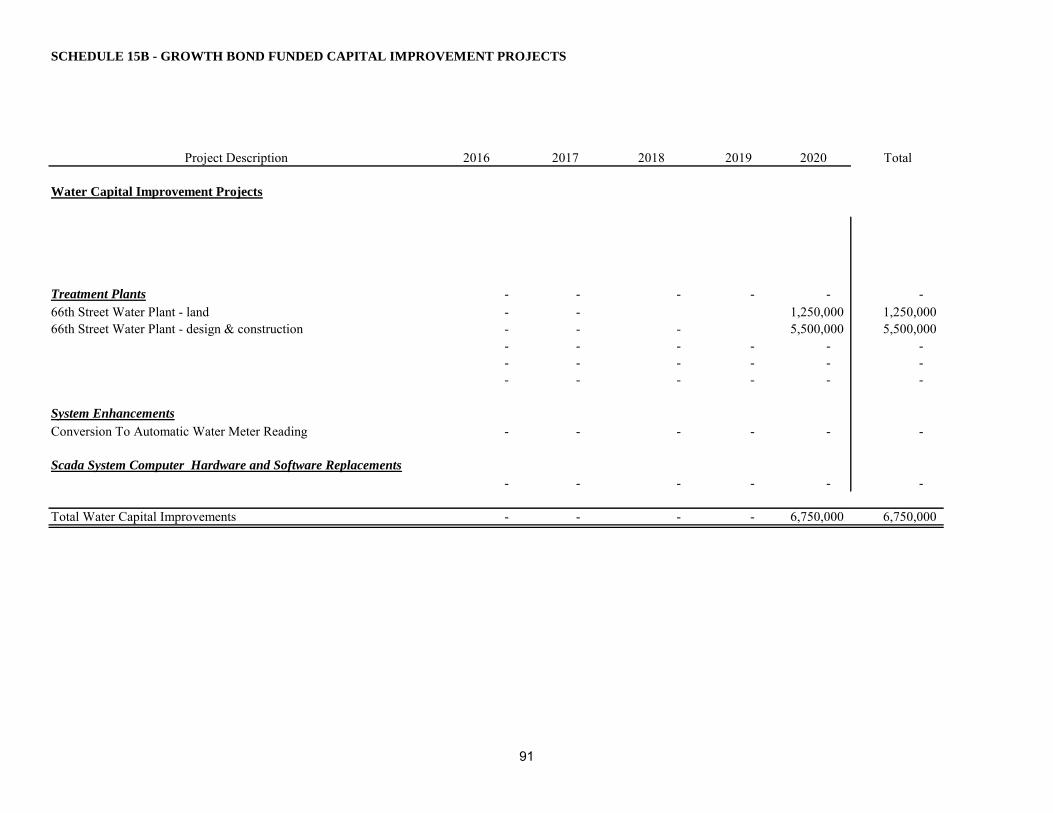
SCHEDULE 15B - GROWTH BOND FUNDED CAPITAL IMPROVEMENT PROJECTS
Project Description 2016 2017 2018 2019 2020 Total
Water Capital Improvement Projects
Treatment Plants - - - - - - 66th Street Water Plant - land - - 1,250,000 1,250,000 66th Street Water Plant - design & construction - - - 5,500,000 5,500,000
- - - - - - - - - - - - - - - - - -
System Enhancements
Conversion To Automatic Water Meter Reading - - - - - -
Scada System Computer Hardware and Software Replacements
- - - - - -
Total Water Capital Improvements - - - - 6,750,000 6,750,000
91
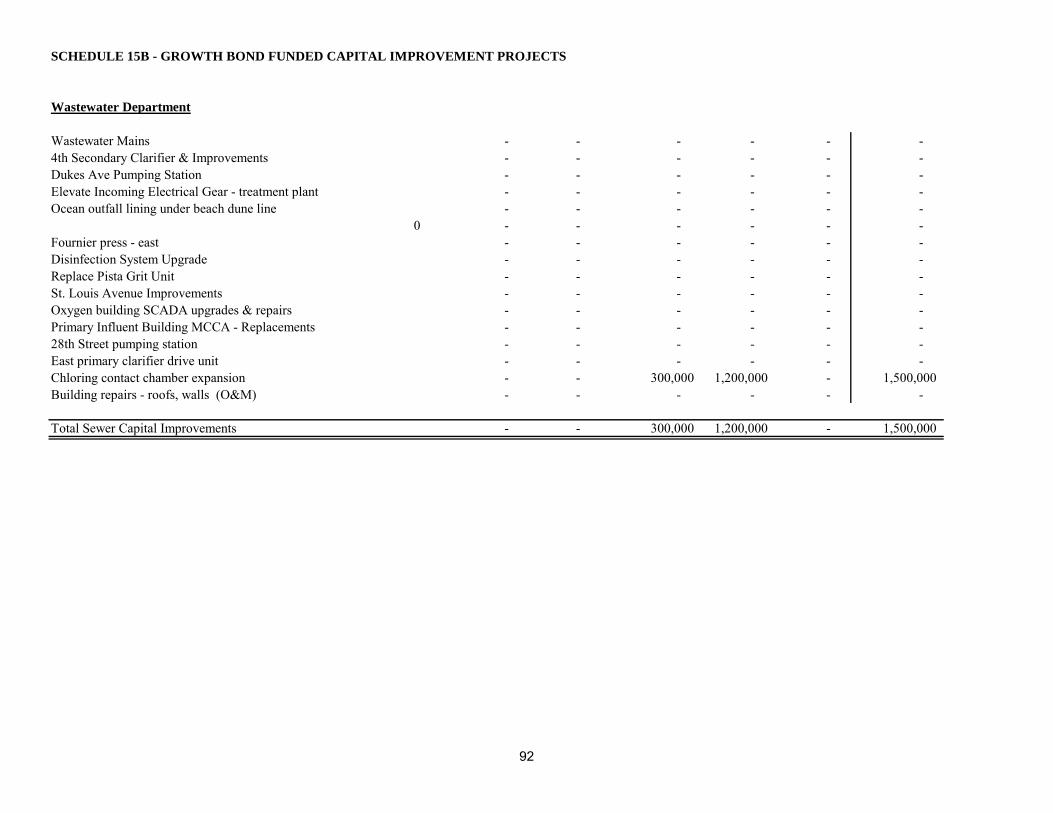
SCHEDULE 15B - GROWTH BOND FUNDED CAPITAL IMPROVEMENT PROJECTS
Wastewater Department
Wastewater Mains - - - - - - 4th Secondary Clarifier & Improvements - - - - - - Dukes Ave Pumping Station - - - - - - Elevate Incoming Electrical Gear - treatment plant - - - - - - Ocean outfall lining under beach dune line - - - - - -
0 - - - - - - Fournier press - east - - - - - - Disinfection System Upgrade - - - - - - Replace Pista Grit Unit - - - - - - St. Louis Avenue Improvements - - - - - - Oxygen building SCADA upgrades & repairs - - - - - - Primary Influent Building MCCA - Replacements - - - - - - 28th Street pumping station - - - - - - East primary clarifier drive unit - - - - - - Chloring contact chamber expansion - - 300,000 1,200,000 - 1,500,000 Building repairs - roofs, walls (O&M) - - - - - -
Total Sewer Capital Improvements - - 300,000 1,200,000 - 1,500,000
92
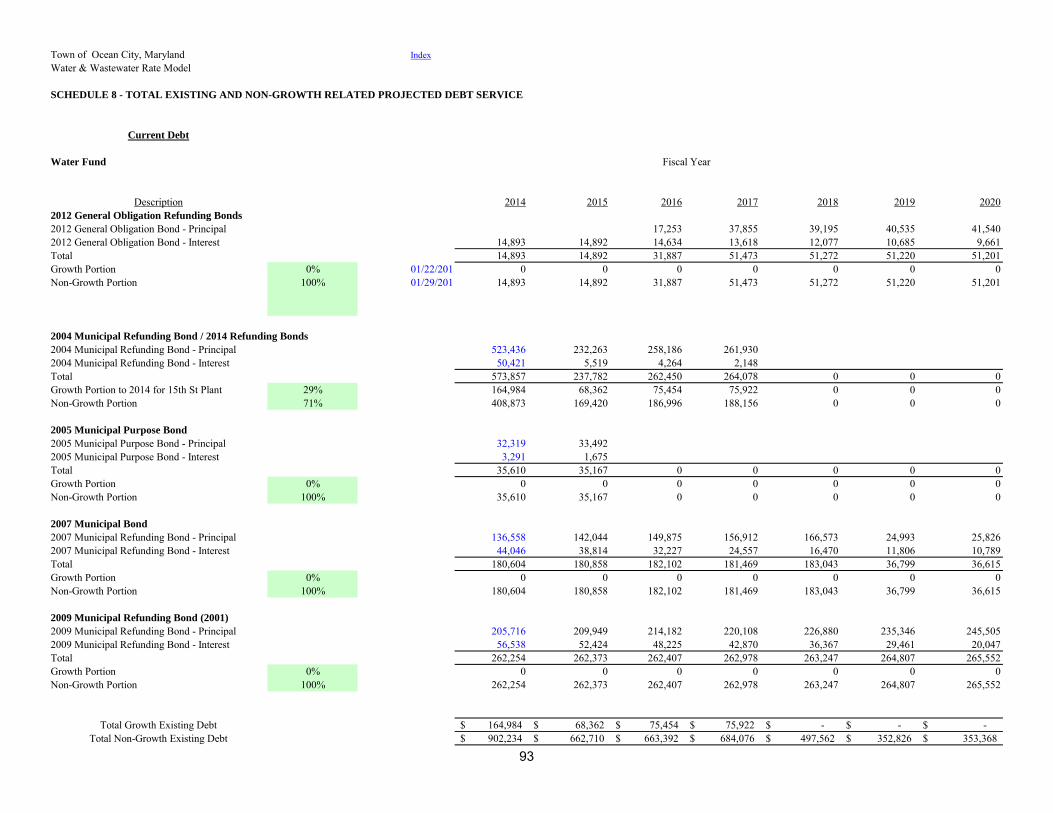
Town of Ocean City, Maryland IndexWater & Wastewater Rate Model
SCHEDULE 8 - TOTAL EXISTING AND NON-GROWTH RELATED PROJECTED DEBT SERVICE
Current Debt
Water Fund Fiscal Year
Description 2014 2015 2016 2017 2018 2019 20202012 General Obligation Refunding Bonds
2012 General Obligation Bond - Principal 17,253 37,855 39,195 40,535 41,5402012 General Obligation Bond - Interest 14,893 14,892 14,634 13,618 12,077 10,685 9,661Total 14,893 14,892 31,887 51,473 51,272 51,220 51,201Growth Portion 0% 01/22/2015 0 0 0 0 0 0 0Non-Growth Portion 100% 01/29/2015 14,893 14,892 31,887 51,473 51,272 51,220 51,201
2004 Municipal Refunding Bond / 2014 Refunding Bonds
2004 Municipal Refunding Bond - Principal 523,436 232,263 258,186 261,9302004 Municipal Refunding Bond - Interest 50,421 5,519 4,264 2,148Total 573,857 237,782 262,450 264,078 0 0 0Growth Portion to 2014 for 15th St Plant 29% 164,984 68,362 75,454 75,922 0 0 0Non-Growth Portion 71% 408,873 169,420 186,996 188,156 0 0 0
2005 Municipal Purpose Bond
2005 Municipal Purpose Bond - Principal 32,319 33,4922005 Municipal Purpose Bond - Interest 3,291 1,675Total 35,610 35,167 0 0 0 0 0Growth Portion 0% 0 0 0 0 0 0 0Non-Growth Portion 100% 35,610 35,167 0 0 0 0 0
2007 Municipal Bond
2007 Municipal Refunding Bond - Principal 136,558 142,044 149,875 156,912 166,573 24,993 25,8262007 Municipal Refunding Bond - Interest 44,046 38,814 32,227 24,557 16,470 11,806 10,789Total 180,604 180,858 182,102 181,469 183,043 36,799 36,615Growth Portion 0% 0 0 0 0 0 0 0Non-Growth Portion 100% 180,604 180,858 182,102 181,469 183,043 36,799 36,615
2009 Municipal Refunding Bond (2001)
2009 Municipal Refunding Bond - Principal 205,716 209,949 214,182 220,108 226,880 235,346 245,5052009 Municipal Refunding Bond - Interest 56,538 52,424 48,225 42,870 36,367 29,461 20,047Total 262,254 262,373 262,407 262,978 263,247 264,807 265,552Growth Portion 0% 0 0 0 0 0 0 0Non-Growth Portion 100% 262,254 262,373 262,407 262,978 263,247 264,807 265,552
Total Growth Existing Debt 164,984$ 68,362$ 75,454$ 75,922$ -$ -$ -$ Total Non-Growth Existing Debt 902,234$ 662,710$ 663,392$ 684,076$ 497,562$ 352,826$ 353,368$
93
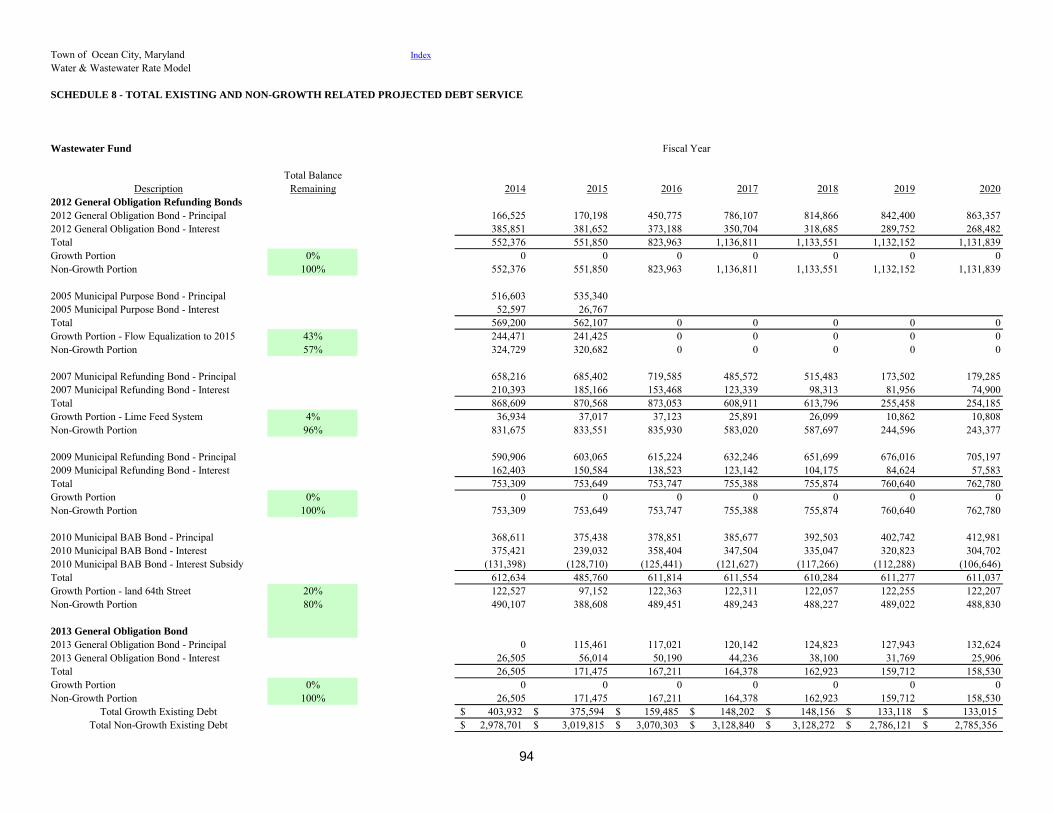
Town of Ocean City, Maryland IndexWater & Wastewater Rate Model
SCHEDULE 8 - TOTAL EXISTING AND NON-GROWTH RELATED PROJECTED DEBT SERVICE
Wastewater Fund Fiscal Year
Total BalanceDescription Remaining 2014 2015 2016 2017 2018 2019 2020
2012 General Obligation Refunding Bonds
2012 General Obligation Bond - Principal 166,525 170,198 450,775 786,107 814,866 842,400 863,3572012 General Obligation Bond - Interest 385,851 381,652 373,188 350,704 318,685 289,752 268,482Total 552,376 551,850 823,963 1,136,811 1,133,551 1,132,152 1,131,839Growth Portion 0% 0 0 0 0 0 0 0Non-Growth Portion 100% 552,376 551,850 823,963 1,136,811 1,133,551 1,132,152 1,131,839
2005 Municipal Purpose Bond - Principal 516,603 535,3402005 Municipal Purpose Bond - Interest 52,597 26,767Total 569,200 562,107 0 0 0 0 0Growth Portion - Flow Equalization to 2015 43% 244,471 241,425 0 0 0 0 0Non-Growth Portion 57% 324,729 320,682 0 0 0 0 0
2007 Municipal Refunding Bond - Principal 658,216 685,402 719,585 485,572 515,483 173,502 179,2852007 Municipal Refunding Bond - Interest 210,393 185,166 153,468 123,339 98,313 81,956 74,900Total 868,609 870,568 873,053 608,911 613,796 255,458 254,185Growth Portion - Lime Feed System 4% 36,934 37,017 37,123 25,891 26,099 10,862 10,808Non-Growth Portion 96% 831,675 833,551 835,930 583,020 587,697 244,596 243,377
2009 Municipal Refunding Bond - Principal 590,906 603,065 615,224 632,246 651,699 676,016 705,1972009 Municipal Refunding Bond - Interest 162,403 150,584 138,523 123,142 104,175 84,624 57,583Total 753,309 753,649 753,747 755,388 755,874 760,640 762,780Growth Portion 0% 0 0 0 0 0 0 0Non-Growth Portion 100% 753,309 753,649 753,747 755,388 755,874 760,640 762,780
2010 Municipal BAB Bond - Principal 368,611 375,438 378,851 385,677 392,503 402,742 412,9812010 Municipal BAB Bond - Interest 375,421 239,032 358,404 347,504 335,047 320,823 304,7022010 Municipal BAB Bond - Interest Subsidy (131,398) (128,710) (125,441) (121,627) (117,266) (112,288) (106,646) Total 612,634 485,760 611,814 611,554 610,284 611,277 611,037Growth Portion - land 64th Street 20% 122,527 97,152 122,363 122,311 122,057 122,255 122,207Non-Growth Portion 80% 490,107 388,608 489,451 489,243 488,227 489,022 488,830
2013 General Obligation Bond
2013 General Obligation Bond - Principal 0 115,461 117,021 120,142 124,823 127,943 132,6242013 General Obligation Bond - Interest 26,505 56,014 50,190 44,236 38,100 31,769 25,906Total 26,505 171,475 167,211 164,378 162,923 159,712 158,530Growth Portion 0% 0 0 0 0 0 0 0Non-Growth Portion 100% 26,505 171,475 167,211 164,378 162,923 159,712 158,530
Total Growth Existing Debt 403,932$ 375,594$ 159,485$ 148,202$ 148,156$ 133,118$ 133,015$ Total Non-Growth Existing Debt 2,978,701$ 3,019,815$ 3,070,303$ 3,128,840$ 3,128,272$ 2,786,121$ 2,785,356$
94
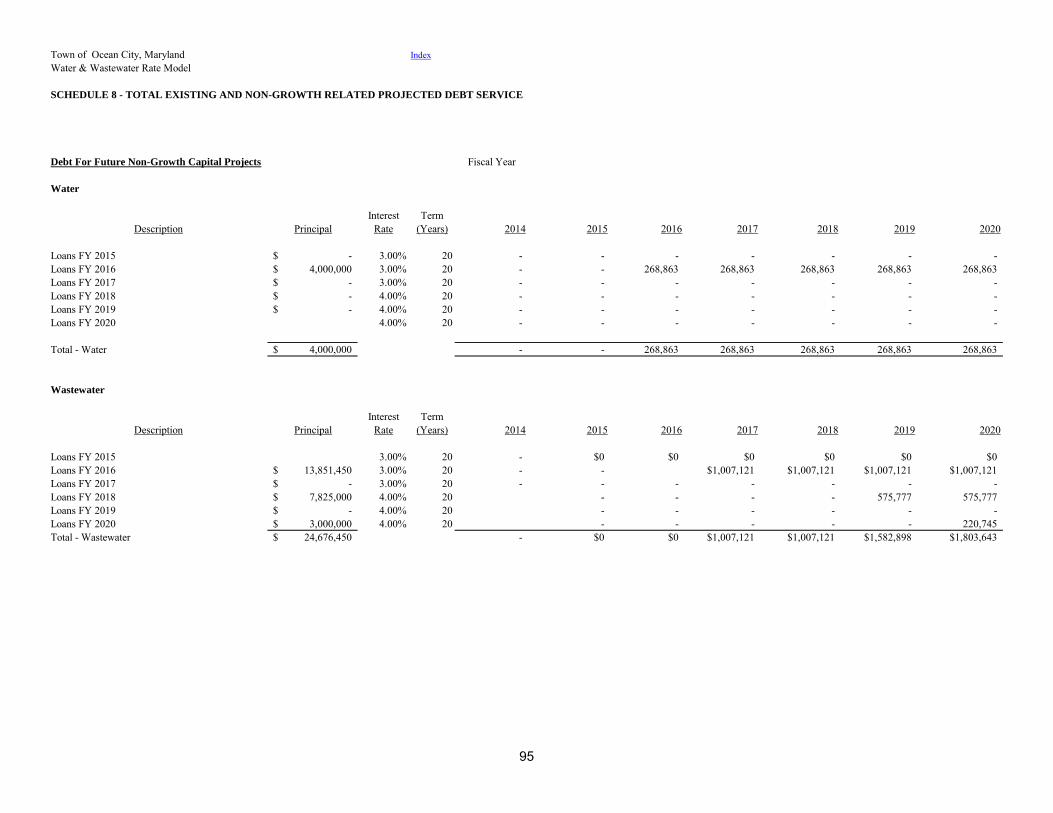
Town of Ocean City, Maryland IndexWater & Wastewater Rate Model
SCHEDULE 8 - TOTAL EXISTING AND NON-GROWTH RELATED PROJECTED DEBT SERVICE
Debt For Future Non-Growth Capital Projects Fiscal Year
Water
Interest TermDescription Principal Rate (Years) 2014 2015 2016 2017 2018 2019 2020
Loans FY 2015 -$ 3.00% 20 - - - - - - - Loans FY 2016 4,000,000$ 3.00% 20 - - 268,863 268,863 268,863 268,863 268,863 Loans FY 2017 -$ 3.00% 20 - - - - - - - Loans FY 2018 -$ 4.00% 20 - - - - - - - Loans FY 2019 -$ 4.00% 20 - - - - - - - Loans FY 2020 4.00% 20 - - - - - - -
Total - Water 4,000,000$ - - 268,863 268,863 268,863 268,863 268,863
Wastewater
Interest TermDescription Principal Rate (Years) 2014 2015 2016 2017 2018 2019 2020
Loans FY 2015 3.00% 20 - $0 $0 $0 $0 $0 $0Loans FY 2016 13,851,450$ 3.00% 20 - - $1,007,121 $1,007,121 $1,007,121 $1,007,121Loans FY 2017 -$ 3.00% 20 - - - - - - - Loans FY 2018 7,825,000$ 4.00% 20 - - - - 575,777 575,777 Loans FY 2019 -$ 4.00% 20 - - - - - - Loans FY 2020 3,000,000$ 4.00% 20 - - - - - 220,745 Total - Wastewater 24,676,450$ - $0 $0 $1,007,121 $1,007,121 $1,582,898 $1,803,643
95
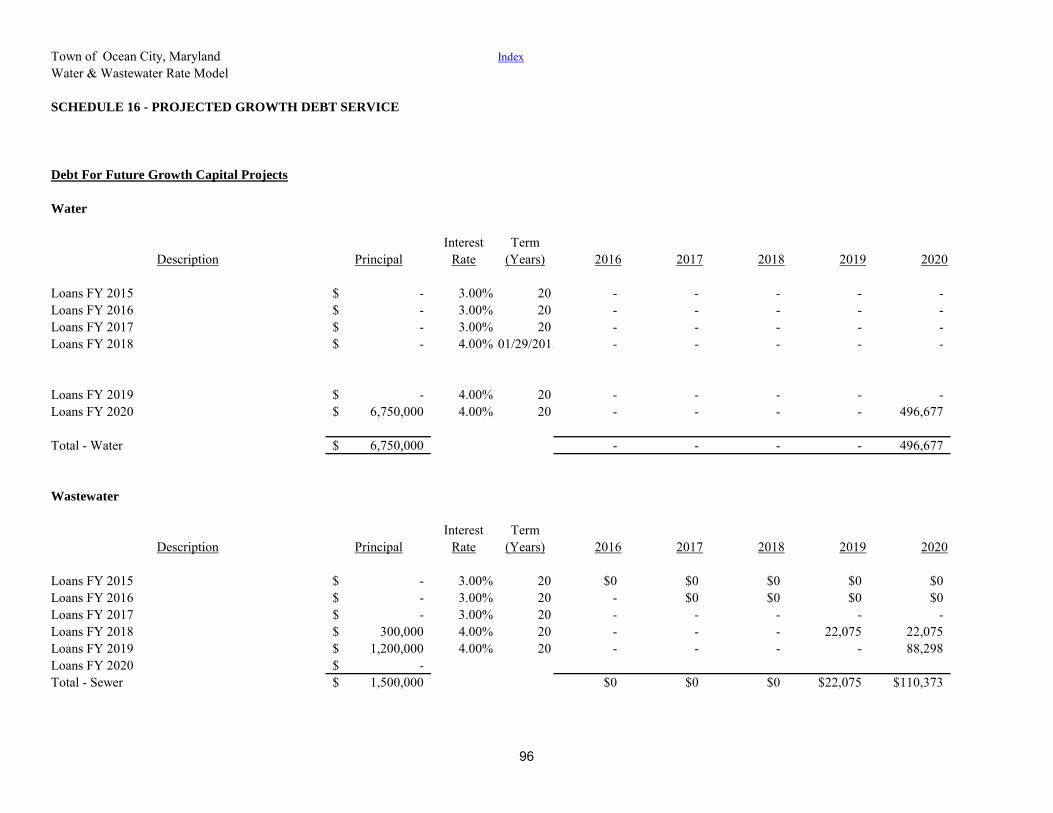
Town of Ocean City, Maryland IndexWater & Wastewater Rate Model
SCHEDULE 16 - PROJECTED GROWTH DEBT SERVICE
Debt For Future Growth Capital Projects
Water
Interest TermDescription Principal Rate (Years) 2016 2017 2018 2019 2020
Loans FY 2015 -$ 3.00% 20 - - - - - Loans FY 2016 -$ 3.00% 20 - - - - - Loans FY 2017 -$ 3.00% 20 - - - - - Loans FY 2018 -$ 4.00% 01/29/2015 - - - - -
Loans FY 2019 -$ 4.00% 20 - - - - - Loans FY 2020 6,750,000$ 4.00% 20 - - - - 496,677
Total - Water 6,750,000$ - - - - 496,677
Wastewater
Interest TermDescription Principal Rate (Years) 2016 2017 2018 2019 2020
Loans FY 2015 -$ 3.00% 20 $0 $0 $0 $0 $0Loans FY 2016 -$ 3.00% 20 - $0 $0 $0 $0Loans FY 2017 -$ 3.00% 20 - - - - - Loans FY 2018 300,000$ 4.00% 20 - - - 22,075 22,075 Loans FY 2019 1,200,000$ 4.00% 20 - - - - 88,298 Loans FY 2020 -$ Total - Sewer 1,500,000$ $0 $0 $0 $22,075 $110,373
96
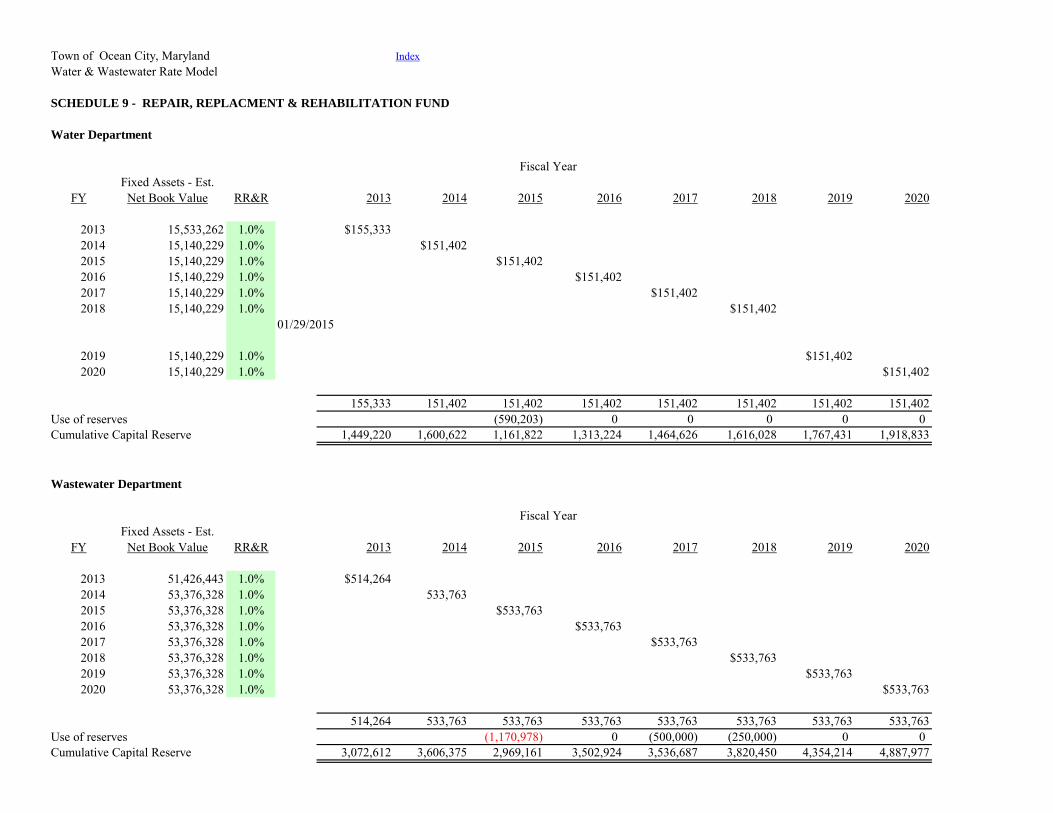
Town of Ocean City, Maryland IndexWater & Wastewater Rate Model
SCHEDULE 9 - REPAIR, REPLACMENT & REHABILITATION FUND
Water Department
Fixed Assets - Est.FY Net Book Value RR&R 2013 2014 2015 2016 2017 2018 2019 2020
2013 15,533,262 1.0% $155,3332014 15,140,229 1.0% $151,4022015 15,140,229 1.0% $151,4022016 15,140,229 1.0% $151,4022017 15,140,229 1.0% $151,4022018 15,140,229 1.0% $151,402
01/29/2015
2019 15,140,229 1.0% $151,4022020 15,140,229 1.0% $151,402
155,333 151,402 151,402 151,402 151,402 151,402 151,402 151,402Use of reserves (590,203) 0 0 0 0 0Cumulative Capital Reserve 1,449,220 1,600,622 1,161,822 1,313,224 1,464,626 1,616,028 1,767,431 1,918,833
Wastewater Department
Fixed Assets - Est.FY Net Book Value RR&R 2013 2014 2015 2016 2017 2018 2019 2020
2013 51,426,443 1.0% $514,2642014 53,376,328 1.0% 533,7632015 53,376,328 1.0% $533,7632016 53,376,328 1.0% $533,7632017 53,376,328 1.0% $533,7632018 53,376,328 1.0% $533,7632019 53,376,328 1.0% $533,7632020 53,376,328 1.0% $533,763
514,264 533,763 533,763 533,763 533,763 533,763 533,763 533,763Use of reserves (1,170,978) 0 (500,000) (250,000) 0 0Cumulative Capital Reserve 3,072,612 3,606,375 2,969,161 3,502,924 3,536,687 3,820,450 4,354,214 4,887,977
Fiscal Year
Fiscal Year
DLeonard
Text Box
97
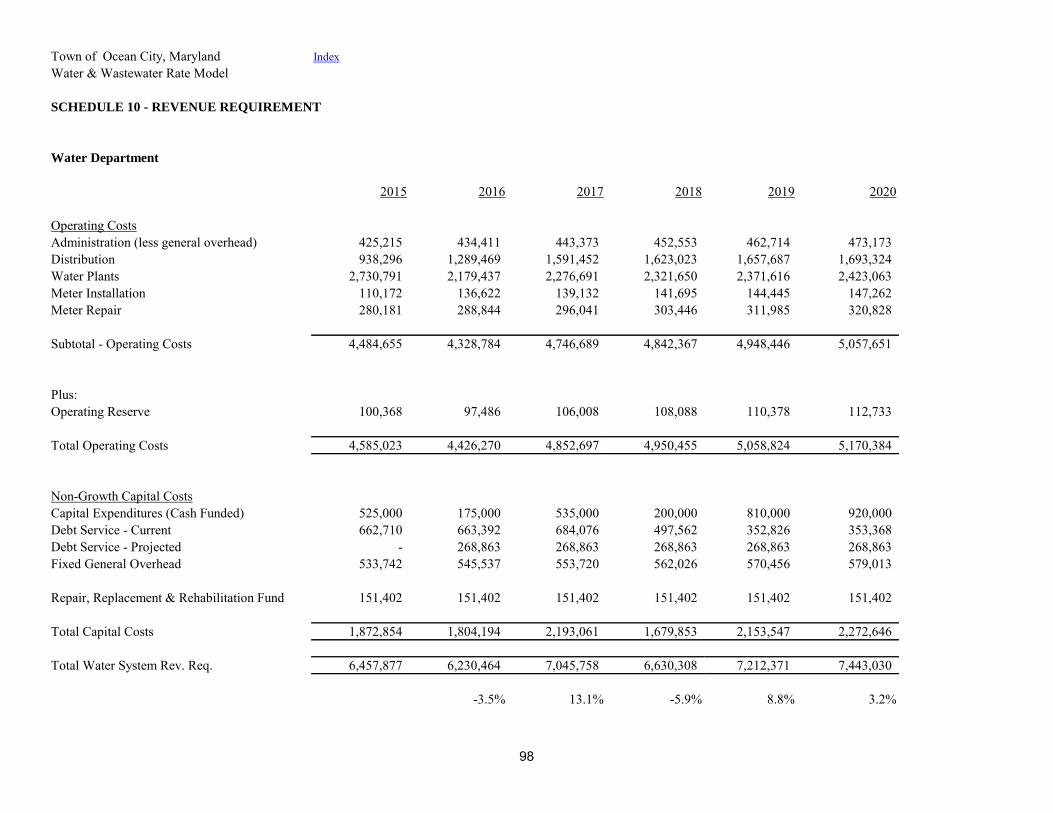
Town of Ocean City, Maryland IndexWater & Wastewater Rate Model
SCHEDULE 10 - REVENUE REQUIREMENT
Water Department
2015 2016 2017 2018 2019 2020
Operating CostsAdministration (less general overhead) 425,215 434,411 443,373 452,553 462,714 473,173 Distribution 938,296 1,289,469 1,591,452 1,623,023 1,657,687 1,693,324 Water Plants 2,730,791 2,179,437 2,276,691 2,321,650 2,371,616 2,423,063 Meter Installation 110,172 136,622 139,132 141,695 144,445 147,262 Meter Repair 280,181 288,844 296,041 303,446 311,985 320,828
Subtotal - Operating Costs 4,484,655 4,328,784 4,746,689 4,842,367 4,948,446 5,057,651
Plus:Operating Reserve 100,368 97,486 106,008 108,088 110,378 112,733
Total Operating Costs 4,585,023 4,426,270 4,852,697 4,950,455 5,058,824 5,170,384
Non-Growth Capital CostsCapital Expenditures (Cash Funded) 525,000 175,000 535,000 200,000 810,000 920,000 Debt Service - Current 662,710 663,392 684,076 497,562 352,826 353,368 Debt Service - Projected - 268,863 268,863 268,863 268,863 268,863 Fixed General Overhead 533,742 545,537 553,720 562,026 570,456 579,013
Repair, Replacement & Rehabilitation Fund 151,402 151,402 151,402 151,402 151,402 151,402
Total Capital Costs 1,872,854 1,804,194 2,193,061 1,679,853 2,153,547 2,272,646
Total Water System Rev. Req. 6,457,877 6,230,464 7,045,758 6,630,308 7,212,371 7,443,030
-3.5% 13.1% -5.9% 8.8% 3.2%
98
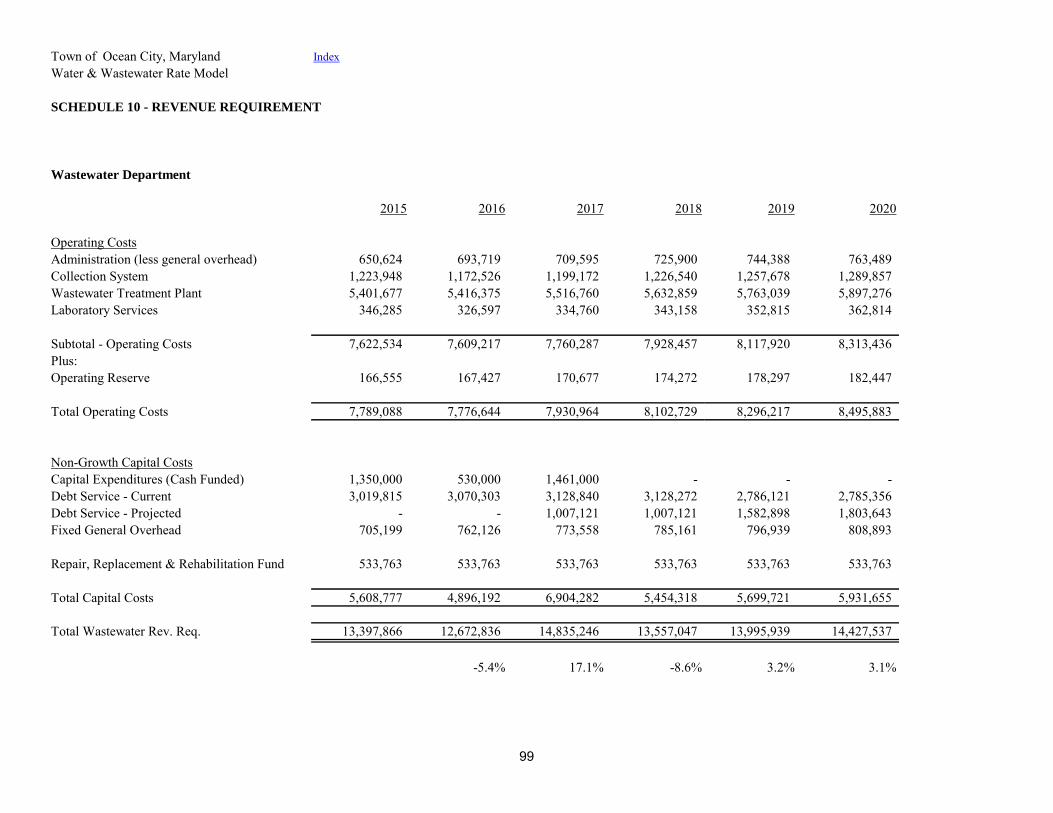
Town of Ocean City, Maryland IndexWater & Wastewater Rate Model
SCHEDULE 10 - REVENUE REQUIREMENT
Wastewater Department
2015 2016 2017 2018 2019 2020
Operating CostsAdministration (less general overhead) 650,624 693,719 709,595 725,900 744,388 763,489 Collection System 1,223,948 1,172,526 1,199,172 1,226,540 1,257,678 1,289,857 Wastewater Treatment Plant 5,401,677 5,416,375 5,516,760 5,632,859 5,763,039 5,897,276 Laboratory Services 346,285 326,597 334,760 343,158 352,815 362,814
Subtotal - Operating Costs 7,622,534 7,609,217 7,760,287 7,928,457 8,117,920 8,313,436 Plus:Operating Reserve 166,555 167,427 170,677 174,272 178,297 182,447
Total Operating Costs 7,789,088 7,776,644 7,930,964 8,102,729 8,296,217 8,495,883
Non-Growth Capital CostsCapital Expenditures (Cash Funded) 1,350,000 530,000 1,461,000 - - - Debt Service - Current 3,019,815 3,070,303 3,128,840 3,128,272 2,786,121 2,785,356 Debt Service - Projected - - 1,007,121 1,007,121 1,582,898 1,803,643 Fixed General Overhead 705,199 762,126 773,558 785,161 796,939 808,893
Repair, Replacement & Rehabilitation Fund 533,763 533,763 533,763 533,763 533,763 533,763
Total Capital Costs 5,608,777 4,896,192 6,904,282 5,454,318 5,699,721 5,931,655
Total Wastewater Rev. Req. 13,397,866 12,672,836 14,835,246 13,557,047 13,995,939 14,427,537
-5.4% 17.1% -8.6% 3.2% 3.1%
99
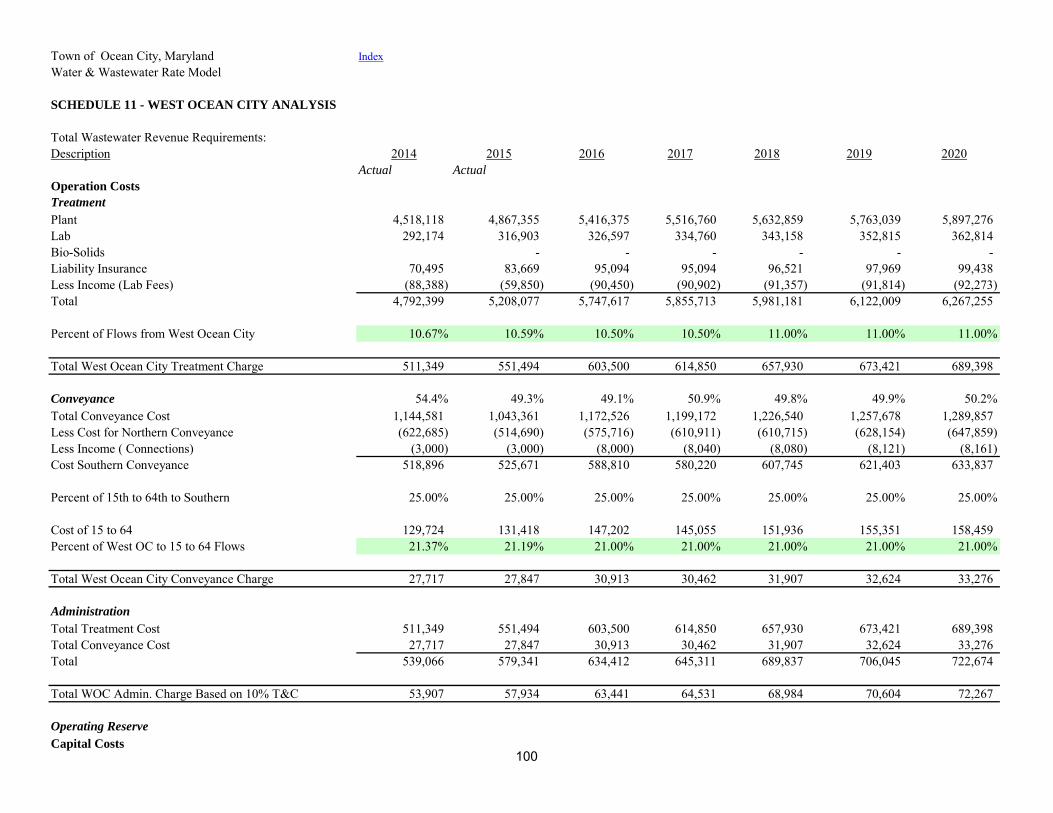
Town of Ocean City, Maryland IndexWater & Wastewater Rate Model
SCHEDULE 11 - WEST OCEAN CITY ANALYSIS
Total Wastewater Revenue Requirements:Description 2014 2015 2016 2017 2018 2019 2020
Actual Actual
Operation Costs
Treatment
Plant 4,518,118 4,867,355 5,416,375 5,516,760 5,632,859 5,763,039 5,897,276 Lab 292,174 316,903 326,597 334,760 343,158 352,815 362,814 Bio-Solids - - - - - - Liability Insurance 70,495 83,669 95,094 95,094 96,521 97,969 99,438 Less Income (Lab Fees) (88,388) (59,850) (90,450) (90,902) (91,357) (91,814) (92,273) Total 4,792,399 5,208,077 5,747,617 5,855,713 5,981,181 6,122,009 6,267,255
Percent of Flows from West Ocean City 10.67% 10.59% 10.50% 10.50% 11.00% 11.00% 11.00%
Total West Ocean City Treatment Charge 511,349 551,494 603,500 614,850 657,930 673,421 689,398
Conveyance 54.4% 49.3% 49.1% 50.9% 49.8% 49.9% 50.2%Total Conveyance Cost 1,144,581 1,043,361 1,172,526 1,199,172 1,226,540 1,257,678 1,289,857 Less Cost for Northern Conveyance (622,685) (514,690) (575,716) (610,911) (610,715) (628,154) (647,859) Less Income ( Connections) (3,000) (3,000) (8,000) (8,040) (8,080) (8,121) (8,161) Cost Southern Conveyance 518,896 525,671 588,810 580,220 607,745 621,403 633,837
Percent of 15th to 64th to Southern 25.00% 25.00% 25.00% 25.00% 25.00% 25.00% 25.00%
Cost of 15 to 64 129,724 131,418 147,202 145,055 151,936 155,351 158,459 Percent of West OC to 15 to 64 Flows 21.37% 21.19% 21.00% 21.00% 21.00% 21.00% 21.00%
Total West Ocean City Conveyance Charge 27,717 27,847 30,913 30,462 31,907 32,624 33,276
Administration
Total Treatment Cost 511,349 551,494 603,500 614,850 657,930 673,421 689,398 Total Conveyance Cost 27,717 27,847 30,913 30,462 31,907 32,624 33,276 Total 539,066 579,341 634,412 645,311 689,837 706,045 722,674
Total WOC Admin. Charge Based on 10% T&C 53,907 57,934 63,441 64,531 68,984 70,604 72,267
Operating Reserve
Capital Costs100
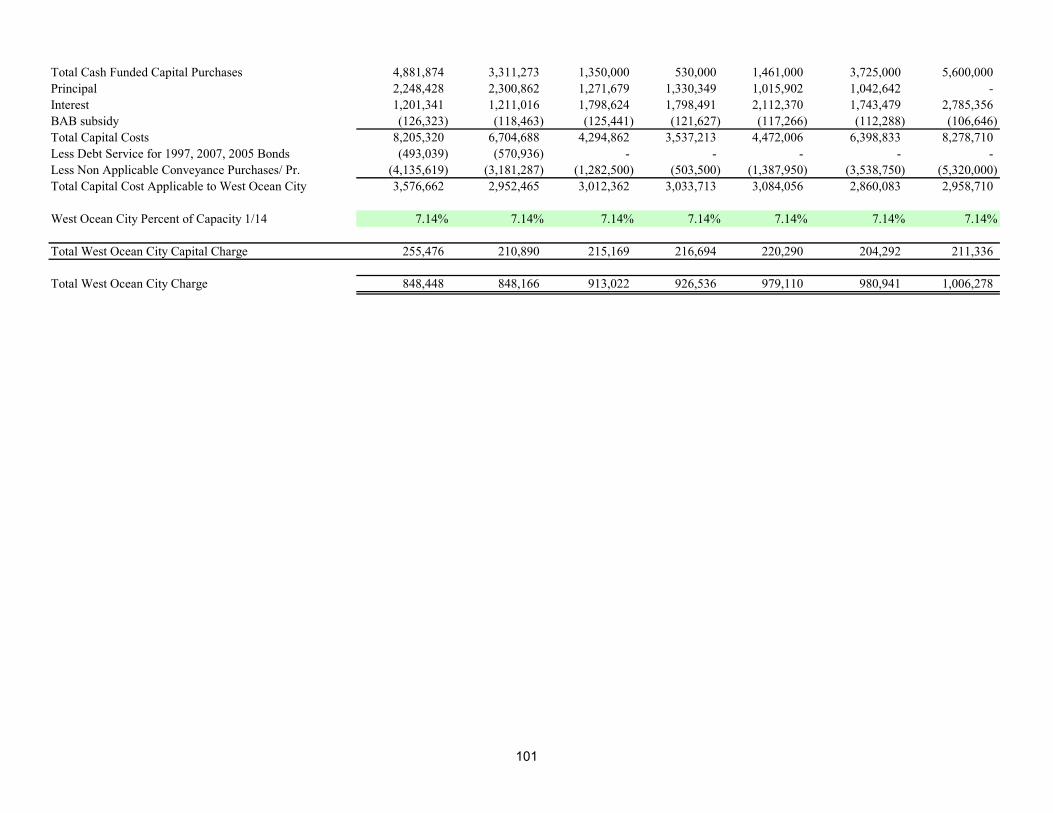
Total Cash Funded Capital Purchases 4,881,874 3,311,273 1,350,000 530,000 1,461,000 3,725,000 5,600,000 Principal 2,248,428 2,300,862 1,271,679 1,330,349 1,015,902 1,042,642 - Interest 1,201,341 1,211,016 1,798,624 1,798,491 2,112,370 1,743,479 2,785,356 BAB subsidy (126,323) (118,463) (125,441) (121,627) (117,266) (112,288) (106,646) Total Capital Costs 8,205,320 6,704,688 4,294,862 3,537,213 4,472,006 6,398,833 8,278,710 Less Debt Service for 1997, 2007, 2005 Bonds (493,039) (570,936) - - - - - Less Non Applicable Conveyance Purchases/ Pr. (4,135,619) (3,181,287) (1,282,500) (503,500) (1,387,950) (3,538,750) (5,320,000) Total Capital Cost Applicable to West Ocean City 3,576,662 2,952,465 3,012,362 3,033,713 3,084,056 2,860,083 2,958,710
West Ocean City Percent of Capacity 1/14 7.14% 7.14% 7.14% 7.14% 7.14% 7.14% 7.14%
Total West Ocean City Capital Charge 255,476 210,890 215,169 216,694 220,290 204,292 211,336
Total West Ocean City Charge 848,448 848,166 913,022 926,536 979,110 980,941 1,006,278
101
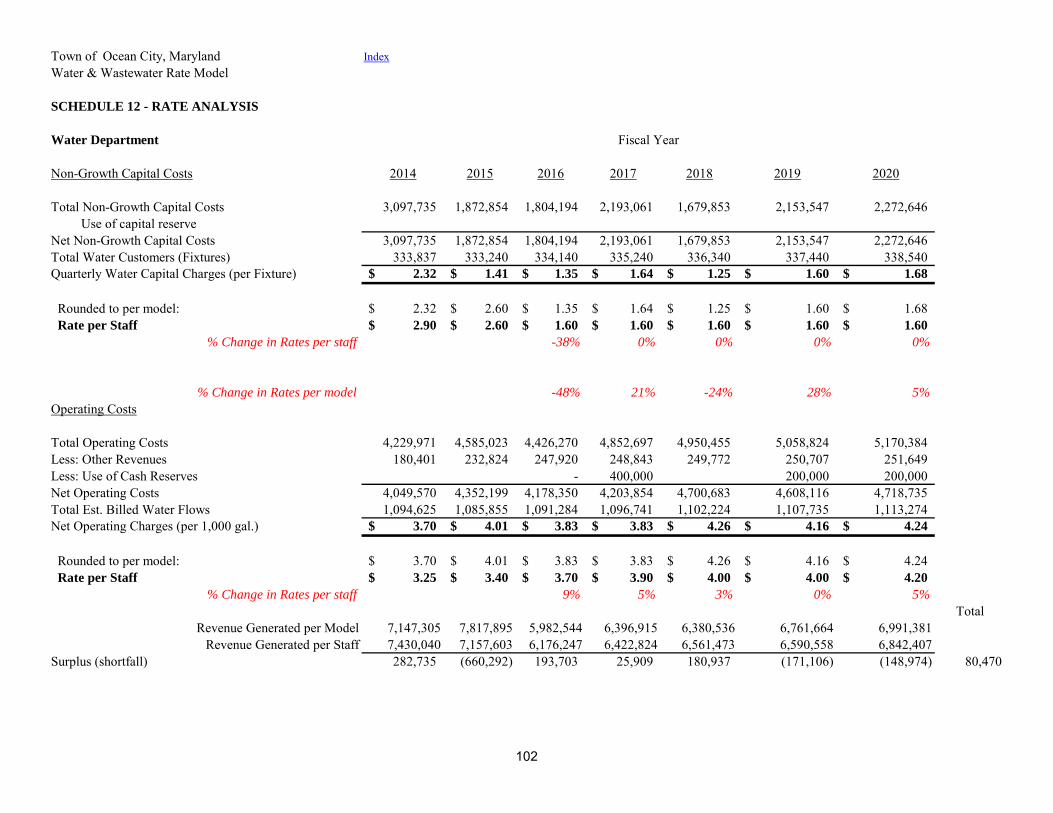
Town of Ocean City, Maryland IndexWater & Wastewater Rate Model
SCHEDULE 12 - RATE ANALYSIS
Water Department
Non-Growth Capital Costs 2014 2015 2016 2017 2018 2019 2020
Total Non-Growth Capital Costs 3,097,735 1,872,854 1,804,194 2,193,061 1,679,853 2,153,547 2,272,646 Use of capital reserveNet Non-Growth Capital Costs 3,097,735 1,872,854 1,804,194 2,193,061 1,679,853 2,153,547 2,272,646 Total Water Customers (Fixtures) 333,837 333,240 334,140 335,240 336,340 337,440 338,540 Quarterly Water Capital Charges (per Fixture) 2.32$ 1.41$ 1.35$ 1.64$ 1.25$ 1.60$ 1.68$
Rounded to per model: 2.32$ 2.60$ 1.35$ 1.64$ 1.25$ 1.60$ 1.68$ Rate per Staff 2.90$ 2.60$ 1.60$ 1.60$ 1.60$ 1.60$ 1.60$
% Change in Rates per staff -38% 0% 0% 0% 0%
% Change in Rates per model -48% 21% -24% 28% 5%
Operating Costs
Total Operating Costs 4,229,971 4,585,023 4,426,270 4,852,697 4,950,455 5,058,824 5,170,384 Less: Other Revenues 180,401 232,824 247,920 248,843 249,772 250,707 251,649 Less: Use of Cash Reserves - 400,000 200,000 200,000 Net Operating Costs 4,049,570 4,352,199 4,178,350 4,203,854 4,700,683 4,608,116 4,718,735 Total Est. Billed Water Flows 1,094,625 1,085,855 1,091,284 1,096,741 1,102,224 1,107,735 1,113,274 Net Operating Charges (per 1,000 gal.) 3.70$ 4.01$ 3.83$ 3.83$ 4.26$ 4.16$ 4.24$
Rounded to per model: 3.70$ 4.01$ 3.83$ 3.83$ 4.26$ 4.16$ 4.24$ Rate per Staff 3.25$ 3.40$ 3.70$ 3.90$ 4.00$ 4.00$ 4.20$
% Change in Rates per staff 9% 5% 3% 0% 5%
TotalRevenue Generated per Model 7,147,305 7,817,895 5,982,544 6,396,915 6,380,536 6,761,664 6,991,381
Revenue Generated per Staff 7,430,040 7,157,603 6,176,247 6,422,824 6,561,473 6,590,558 6,842,407Surplus (shortfall) 282,735 (660,292) 193,703 25,909 180,937 (171,106) (148,974) 80,470
Fiscal Year
102
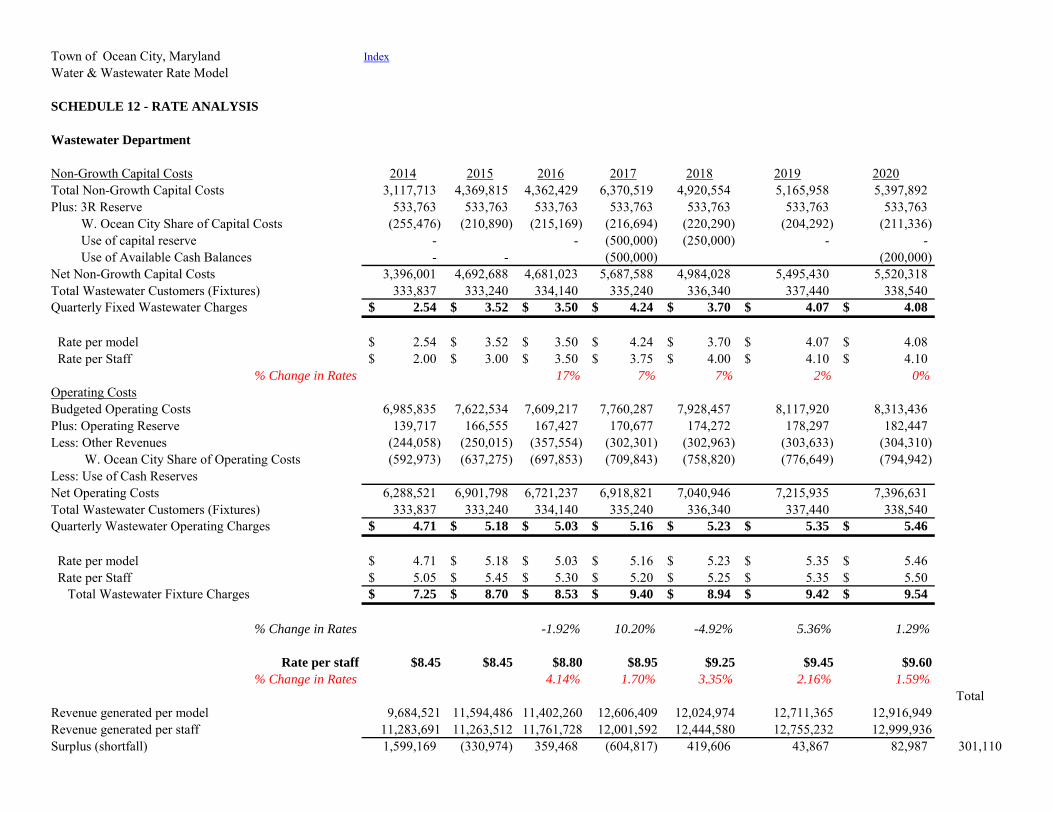
Town of Ocean City, Maryland IndexWater & Wastewater Rate Model
SCHEDULE 12 - RATE ANALYSIS
Wastewater Department
Non-Growth Capital Costs 2014 2015 2016 2017 2018 2019 2020Total Non-Growth Capital Costs 3,117,713 4,369,815 4,362,429 6,370,519 4,920,554 5,165,958 5,397,892 Plus: 3R Reserve 533,763 533,763 533,763 533,763 533,763 533,763 533,763 W. Ocean City Share of Capital Costs (255,476) (210,890) (215,169) (216,694) (220,290) (204,292) (211,336) Use of capital reserve - - (500,000) (250,000) - - Use of Available Cash Balances - - (500,000) (200,000) Net Non-Growth Capital Costs 3,396,001 4,692,688 4,681,023 5,687,588 4,984,028 5,495,430 5,520,318 Total Wastewater Customers (Fixtures) 333,837 333,240 334,140 335,240 336,340 337,440 338,540 Quarterly Fixed Wastewater Charges 2.54$ 3.52$ 3.50$ 4.24$ 3.70$ 4.07$ 4.08$
Rate per model 2.54$ 3.52$ 3.50$ 4.24$ 3.70$ 4.07$ 4.08$ Rate per Staff 2.00$ 3.00$ 3.50$ 3.75$ 4.00$ 4.10$ 4.10$
% Change in Rates 17% 7% 7% 2% 0%
Operating CostsBudgeted Operating Costs 6,985,835 7,622,534 7,609,217 7,760,287 7,928,457 8,117,920 8,313,436 Plus: Operating Reserve 139,717 166,555 167,427 170,677 174,272 178,297 182,447 Less: Other Revenues (244,058) (250,015) (357,554) (302,301) (302,963) (303,633) (304,310) W. Ocean City Share of Operating Costs (592,973) (637,275) (697,853) (709,843) (758,820) (776,649) (794,942) Less: Use of Cash ReservesNet Operating Costs 6,288,521 6,901,798 6,721,237 6,918,821 7,040,946 7,215,935 7,396,631 Total Wastewater Customers (Fixtures) 333,837 333,240 334,140 335,240 336,340 337,440 338,540 Quarterly Wastewater Operating Charges 4.71$ 5.18$ 5.03$ 5.16$ 5.23$ 5.35$ 5.46$
Rate per model 4.71$ 5.18$ 5.03$ 5.16$ 5.23$ 5.35$ 5.46$ Rate per Staff 5.05$ 5.45$ 5.30$ 5.20$ 5.25$ 5.35$ 5.50$ Total Wastewater Fixture Charges 7.25$ 8.70$ 8.53$ 9.40$ 8.94$ 9.42$ 9.54$
% Change in Rates -1.92% 10.20% -4.92% 5.36% 1.29%
Rate per staff $8.45 $8.45 $8.80 $8.95 $9.25 $9.45 $9.60
% Change in Rates 4.14% 1.70% 3.35% 2.16% 1.59%
TotalRevenue generated per model 9,684,521 11,594,486 11,402,260 12,606,409 12,024,974 12,711,365 12,916,949Revenue generated per staff 11,283,691 11,263,512 11,761,728 12,001,592 12,444,580 12,755,232 12,999,936Surplus (shortfall) 1,599,169 (330,974) 359,468 (604,817) 419,606 43,867 82,987 301,110
DLeonard
Text Box
103
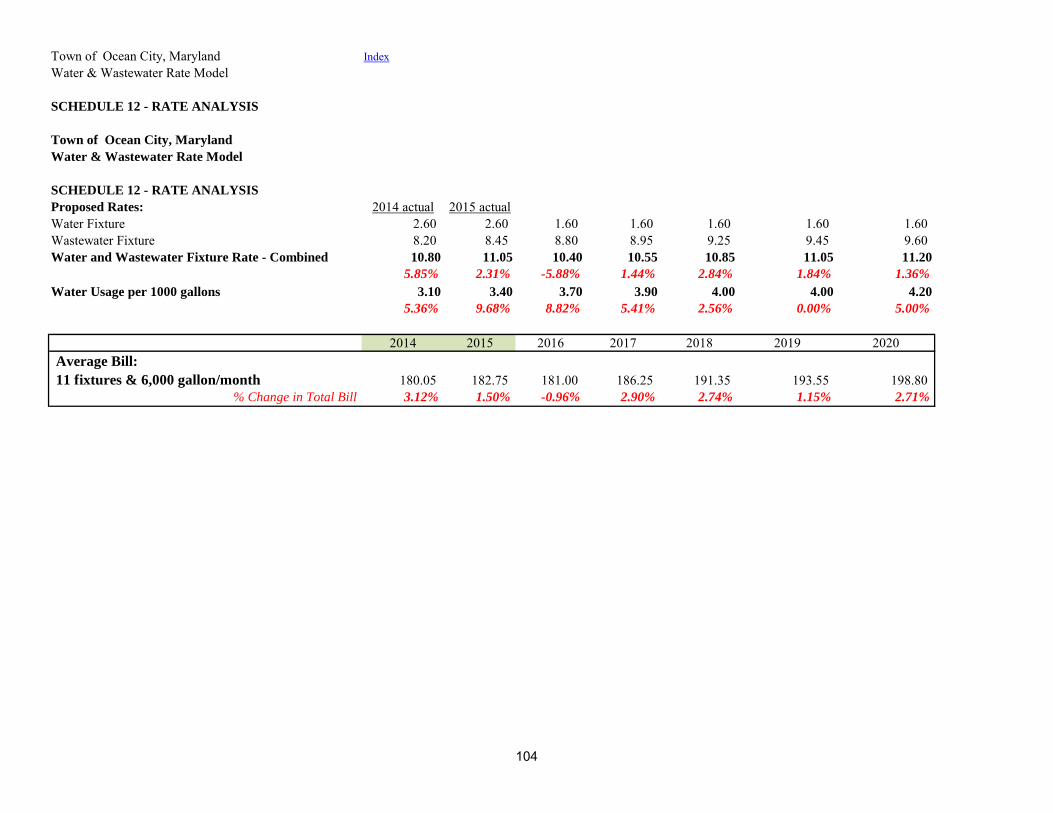
Town of Ocean City, Maryland IndexWater & Wastewater Rate Model
SCHEDULE 12 - RATE ANALYSIS
Town of Ocean City, Maryland
Water & Wastewater Rate Model
SCHEDULE 12 - RATE ANALYSIS
Proposed Rates: 2014 actual 2015 actualWater Fixture 2.60 2.60 1.60 1.60 1.60 1.60 1.60Wastewater Fixture 8.20 8.45 8.80 8.95 9.25 9.45 9.60Water and Wastewater Fixture Rate - Combined 10.80 11.05 10.40 10.55 10.85 11.05 11.20
5.85% 2.31% -5.88% 1.44% 2.84% 1.84% 1.36%
Water Usage per 1000 gallons 3.10 3.40 3.70 3.90 4.00 4.00 4.20
5.36% 9.68% 8.82% 5.41% 2.56% 0.00% 5.00%
2014 2015 2016 2017 2018 2019 2020Average Bill:
11 fixtures & 6,000 gallon/month 180.05 182.75 181.00 186.25 191.35 193.55 198.80% Change in Total Bill 3.12% 1.50% -0.96% 2.90% 2.74% 1.15% 2.71%
104
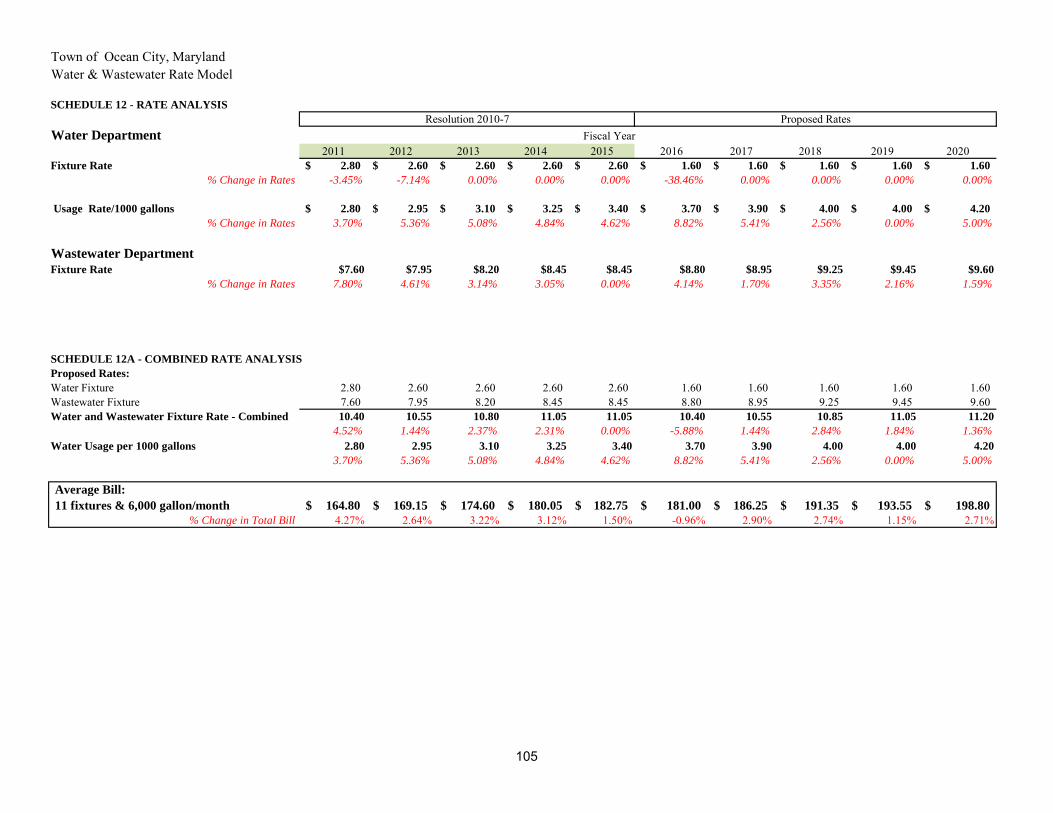
Town of Ocean City, MarylandWater & Wastewater Rate Model
SCHEDULE 12 - RATE ANALYSIS
Water Department
2011 2012 2013 2014 2015 2016 2017 2018 2019 2020Fixture Rate 2.80$ 2.60$ 2.60$ 2.60$ 2.60$ 1.60$ 1.60$ 1.60$ 1.60$ 1.60$
% Change in Rates -3.45% -7.14% 0.00% 0.00% 0.00% -38.46% 0.00% 0.00% 0.00% 0.00%
Annu Usage Rate/1000 gallons 2.80$ 2.95$ 3.10$ 3.25$ 3.40$ 3.70$ 3.90$ 4.00$ 4.00$ 4.20$
% Change in Rates 3.70% 5.36% 5.08% 4.84% 4.62% 8.82% 5.41% 2.56% 0.00% 5.00%
Wastewater Department
Fixture Rate $7.60 $7.95 $8.20 $8.45 $8.45 $8.80 $8.95 $9.25 $9.45 $9.60
% Change in Rates 7.80% 4.61% 3.14% 3.05% 0.00% 4.14% 1.70% 3.35% 2.16% 1.59%
SCHEDULE 12A - COMBINED RATE ANALYSIS
Proposed Rates:
Water Fixture 2.80 2.60 2.60 2.60 2.60 1.60 1.60 1.60 1.60 1.60Wastewater Fixture 7.60 7.95 8.20 8.45 8.45 8.80 8.95 9.25 9.45 9.60Water and Wastewater Fixture Rate - Combined 10.40 10.55 10.80 11.05 11.05 10.40 10.55 10.85 11.05 11.20
4.52% 1.44% 2.37% 2.31% 0.00% -5.88% 1.44% 2.84% 1.84% 1.36%
Water Usage per 1000 gallons 2.80 2.95 3.10 3.25 3.40 3.70 3.90 4.00 4.00 4.20
3.70% 5.36% 5.08% 4.84% 4.62% 8.82% 5.41% 2.56% 0.00% 5.00%
Average Bill:
11 fixtures & 6,000 gallon/month 164.80$ 169.15$ 174.60$ 180.05$ 182.75$ 181.00$ 186.25$ 191.35$ 193.55$ 198.80$
% Change in Total Bill 4.27% 2.64% 3.22% 3.12% 1.50% -0.96% 2.90% 2.74% 1.15% 2.71%
Fiscal YearResolution 2010-7 Proposed Rates
105
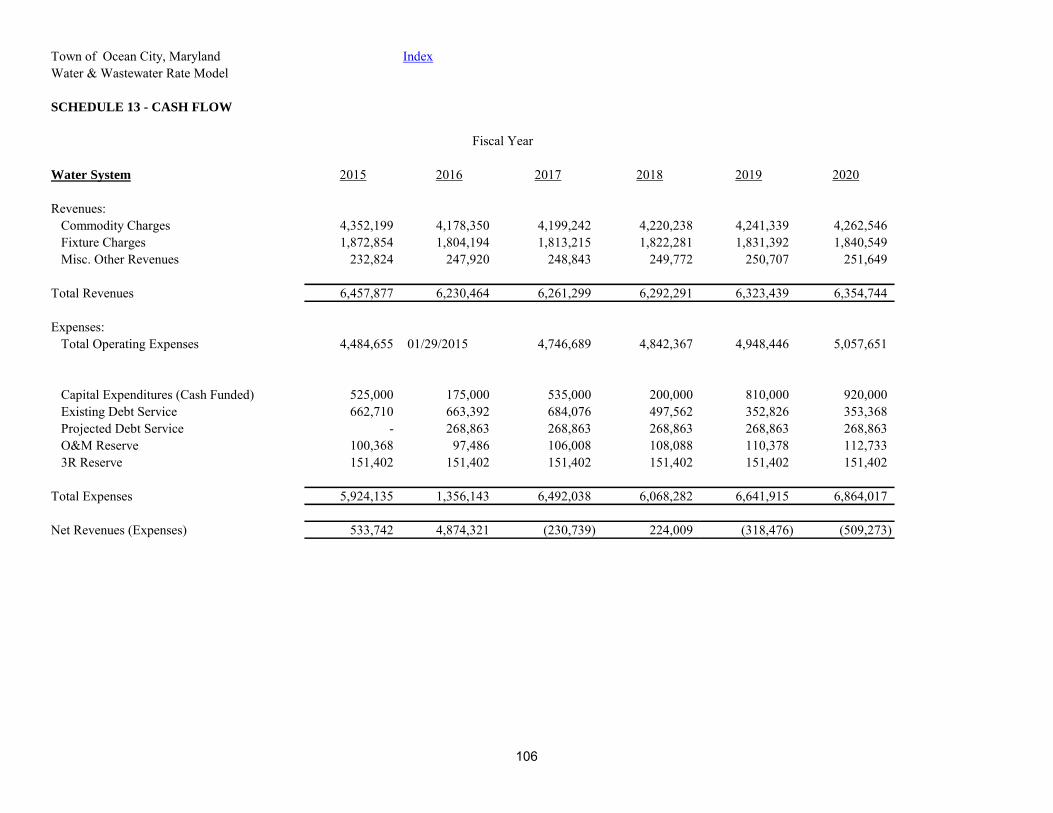
Town of Ocean City, Maryland IndexWater & Wastewater Rate Model
SCHEDULE 13 - CASH FLOW
Water System 2015 2016 2017 2018 2019 2020
Revenues:Commodity Charges 4,352,199 4,178,350 4,199,242 4,220,238 4,241,339 4,262,546 Fixture Charges 1,872,854 1,804,194 1,813,215 1,822,281 1,831,392 1,840,549 Misc. Other Revenues 232,824 247,920 248,843 249,772 250,707 251,649
Total Revenues 6,457,877 6,230,464 6,261,299 6,292,291 6,323,439 6,354,744
Expenses:Total Operating Expenses 4,484,655 01/29/2015 4,746,689 4,842,367 4,948,446 5,057,651
Capital Expenditures (Cash Funded) 525,000 175,000 535,000 200,000 810,000 920,000 Existing Debt Service 662,710 663,392 684,076 497,562 352,826 353,368 Projected Debt Service - 268,863 268,863 268,863 268,863 268,863 O&M Reserve 100,368 97,486 106,008 108,088 110,378 112,733 3R Reserve 151,402 151,402 151,402 151,402 151,402 151,402
Total Expenses 5,924,135 1,356,143 6,492,038 6,068,282 6,641,915 6,864,017
Net Revenues (Expenses) 533,742 4,874,321 (230,739) 224,009 (318,476) (509,273)
Fiscal Year
106
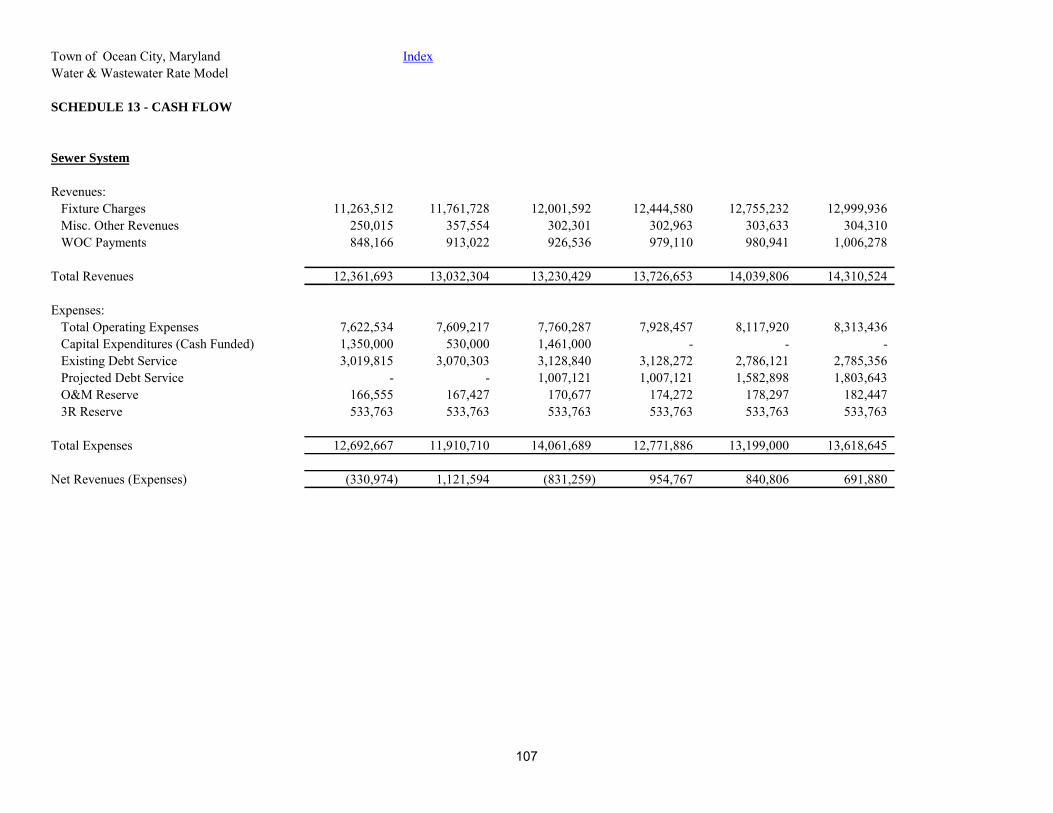
Town of Ocean City, Maryland IndexWater & Wastewater Rate Model
SCHEDULE 13 - CASH FLOW
Sewer System
Revenues:Fixture Charges 11,263,512 11,761,728 12,001,592 12,444,580 12,755,232 12,999,936 Misc. Other Revenues 250,015 357,554 302,301 302,963 303,633 304,310 WOC Payments 848,166 913,022 926,536 979,110 980,941 1,006,278
Total Revenues 12,361,693 13,032,304 13,230,429 13,726,653 14,039,806 14,310,524
Expenses:Total Operating Expenses 7,622,534 7,609,217 7,760,287 7,928,457 8,117,920 8,313,436 Capital Expenditures (Cash Funded) 1,350,000 530,000 1,461,000 - - - Existing Debt Service 3,019,815 3,070,303 3,128,840 3,128,272 2,786,121 2,785,356 Projected Debt Service - - 1,007,121 1,007,121 1,582,898 1,803,643 O&M Reserve 166,555 167,427 170,677 174,272 178,297 182,447 3R Reserve 533,763 533,763 533,763 533,763 533,763 533,763
Total Expenses 12,692,667 11,910,710 14,061,689 12,771,886 13,199,000 13,618,645
Net Revenues (Expenses) (330,974) 1,121,594 (831,259) 954,767 840,806 691,880
107
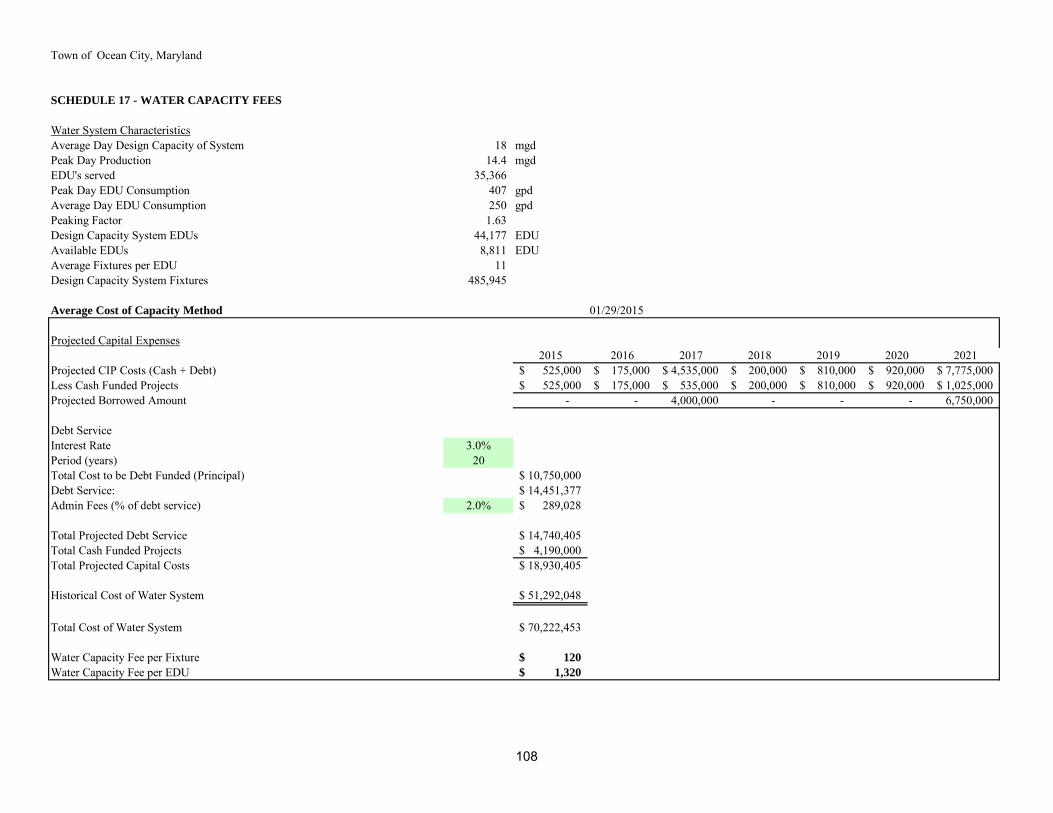
Town of Ocean City, Maryland
SCHEDULE 17 - WATER CAPACITY FEES
Water System CharacteristicsAverage Day Design Capacity of System 18 mgdPeak Day Production 14.4 mgdEDU's served 35,366 Peak Day EDU Consumption 407 gpdAverage Day EDU Consumption 250 gpdPeaking Factor 1.63 Design Capacity System EDUs 44,177 EDUAvailable EDUs 8,811 EDUAverage Fixtures per EDU 11 Design Capacity System Fixtures 485,945
Average Cost of Capacity Method 01/29/2015
Projected Capital Expenses2015 2016 2017 2018 2019 2020 2021
Projected CIP Costs (Cash + Debt) 525,000$ 175,000$ 4,535,000$ 200,000$ 810,000$ 920,000$ 7,775,000$ Less Cash Funded Projects 525,000$ 175,000$ 535,000$ 200,000$ 810,000$ 920,000$ 1,025,000$ Projected Borrowed Amount - - 4,000,000 - - - 6,750,000
Debt ServiceInterest Rate 3.0%Period (years) 20Total Cost to be Debt Funded (Principal) 10,750,000$ Debt Service: 14,451,377$ Admin Fees (% of debt service) 2.0% 289,028$
Total Projected Debt Service 14,740,405$ Total Cash Funded Projects 4,190,000$ Total Projected Capital Costs 18,930,405$
Historical Cost of Water System 51,292,048$
Total Cost of Water System 70,222,453$
Water Capacity Fee per Fixture 120$
Water Capacity Fee per EDU 1,320$
108
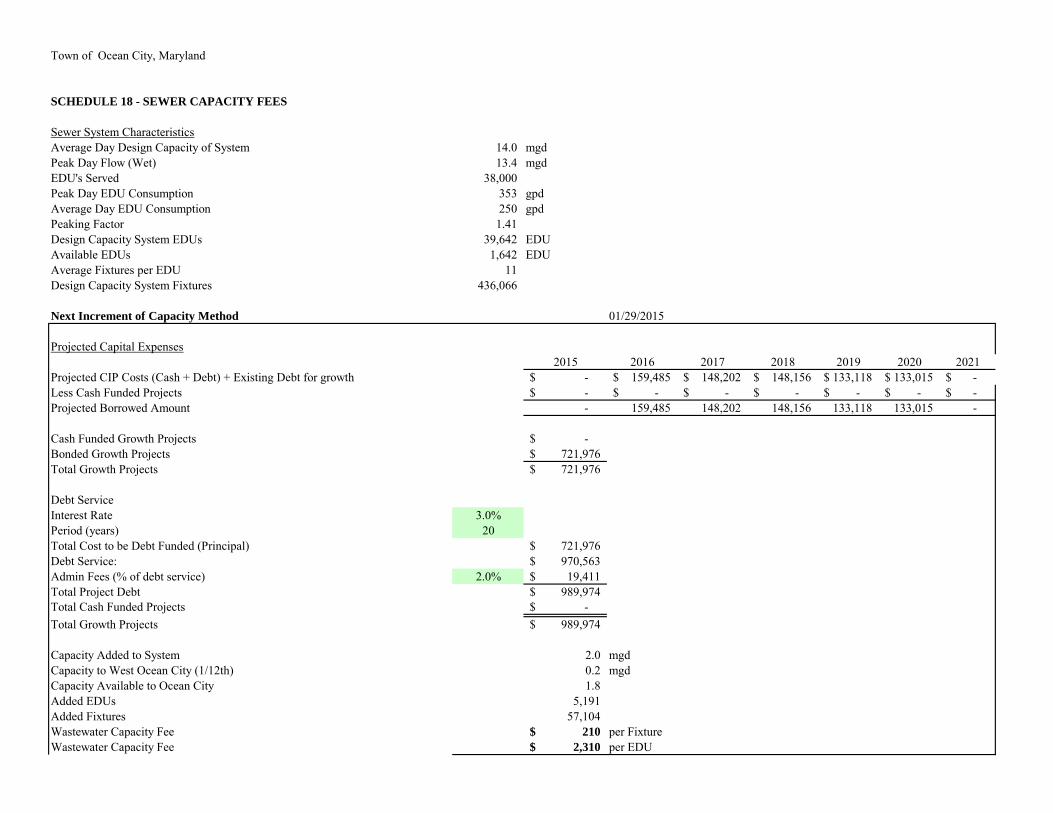
Town of Ocean City, Maryland
SCHEDULE 18 - SEWER CAPACITY FEES
Sewer System CharacteristicsAverage Day Design Capacity of System 14.0 mgdPeak Day Flow (Wet) 13.4 mgdEDU's Served 38,000 Peak Day EDU Consumption 353 gpdAverage Day EDU Consumption 250 gpdPeaking Factor 1.41 Design Capacity System EDUs 39,642 EDUAvailable EDUs 1,642 EDUAverage Fixtures per EDU 11 Design Capacity System Fixtures 436,066
Next Increment of Capacity Method 01/29/2015
Projected Capital Expenses2015 2016 2017 2018 2019 2020 2021
Projected CIP Costs (Cash + Debt) + Existing Debt for growth -$ 159,485$ 148,202$ 148,156$ 133,118$ 133,015$ -$ Less Cash Funded Projects -$ -$ -$ -$ -$ -$ -$ Projected Borrowed Amount - 159,485 148,202 148,156 133,118 133,015 -
Cash Funded Growth Projects -$ Bonded Growth Projects 721,976$ Total Growth Projects 721,976$
Debt ServiceInterest Rate 3.0%Period (years) 20Total Cost to be Debt Funded (Principal) 721,976$ Debt Service: 970,563$ Admin Fees (% of debt service) 2.0% 19,411$ Total Project Debt 989,974$ Total Cash Funded Projects -$ Total Growth Projects 989,974$
Capacity Added to System 2.0 mgdCapacity to West Ocean City (1/12th) 0.2 mgdCapacity Available to Ocean City 1.8 Added EDUs 5,191 Added Fixtures 57,104 Wastewater Capacity Fee 210$ per FixtureWastewater Capacity Fee 2,310$ per EDU
DLeonard
Text Box
109
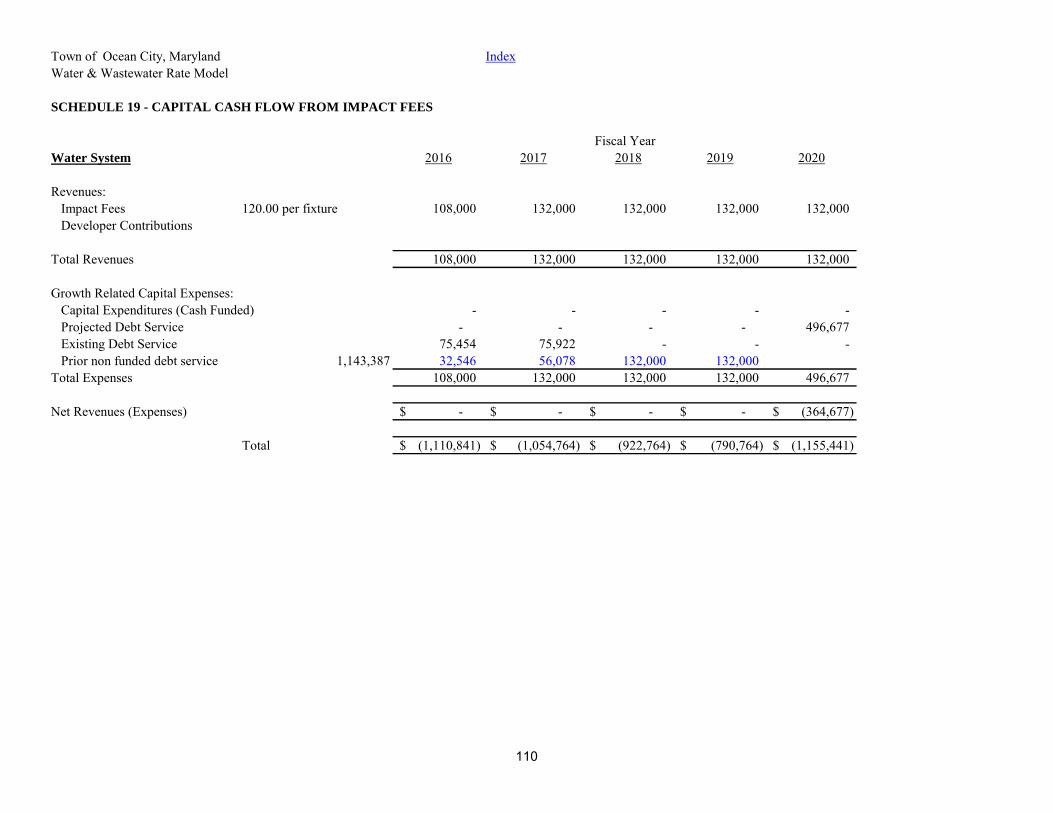
Town of Ocean City, Maryland IndexWater & Wastewater Rate Model
SCHEDULE 19 - CAPITAL CASH FLOW FROM IMPACT FEES
Fiscal YearWater System 2016 2017 2018 2019 2020
Revenues:Impact Fees 120.00 per fixture 108,000 132,000 132,000 132,000 132,000 Developer Contributions
Total Revenues 108,000 132,000 132,000 132,000 132,000
Growth Related Capital Expenses:Capital Expenditures (Cash Funded) - - - - - Projected Debt Service - - - - 496,677 Existing Debt Service 75,454 75,922 - - - Prior non funded debt service 1,143,387 32,546 56,078 132,000 132,000
Total Expenses 108,000 132,000 132,000 132,000 496,677
Net Revenues (Expenses) -$ -$ -$ -$ (364,677)$
Total (1,110,841)$ (1,054,764)$ (922,764)$ (790,764)$ (1,155,441)$
110
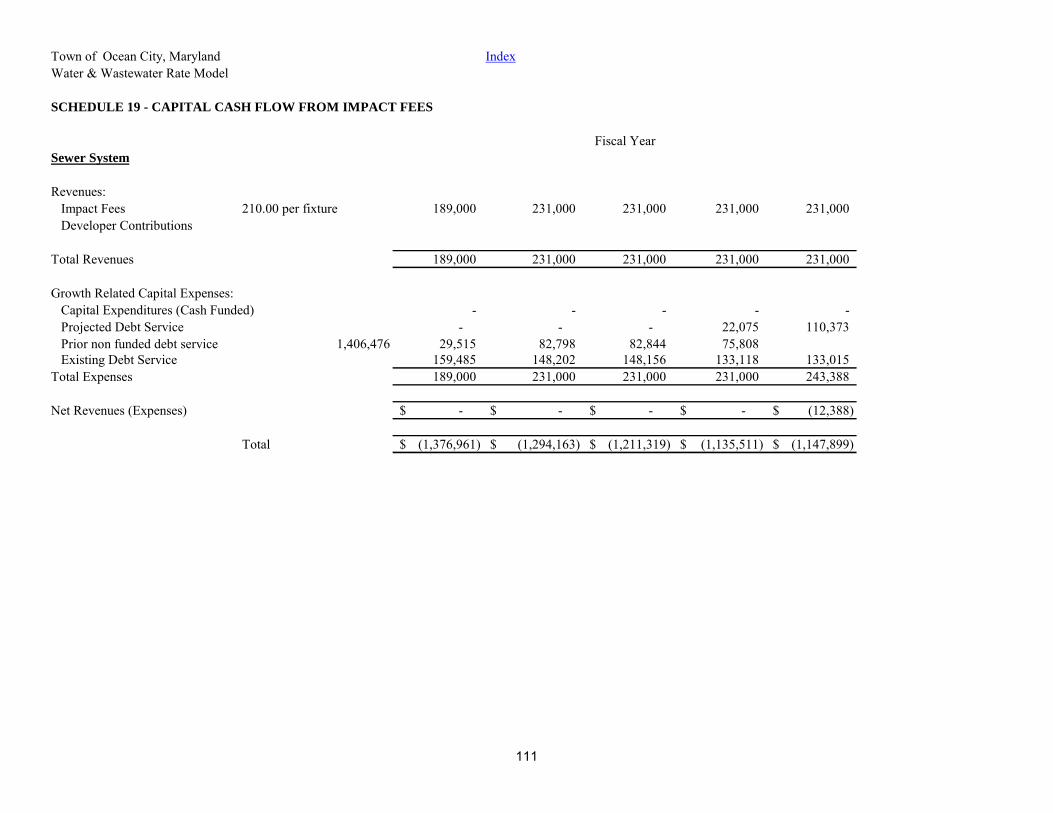
Town of Ocean City, Maryland IndexWater & Wastewater Rate Model
SCHEDULE 19 - CAPITAL CASH FLOW FROM IMPACT FEES
Fiscal YearSewer System
Revenues:Impact Fees 210.00 per fixture 189,000 231,000 231,000 231,000 231,000 Developer Contributions
Total Revenues 189,000 231,000 231,000 231,000 231,000
Growth Related Capital Expenses:Capital Expenditures (Cash Funded) - - - - - Projected Debt Service - - - 22,075 110,373 Prior non funded debt service 1,406,476 29,515 82,798 82,844 75,808 Existing Debt Service 159,485 148,202 148,156 133,118 133,015
Total Expenses 189,000 231,000 231,000 231,000 243,388
Net Revenues (Expenses) -$ -$ -$ -$ (12,388)$
Total (1,376,961)$ (1,294,163)$ (1,211,319)$ (1,135,511)$ (1,147,899)$
111

112
RATE COMPARISONS FOR OTHER MUNICIPALITIES
113

114
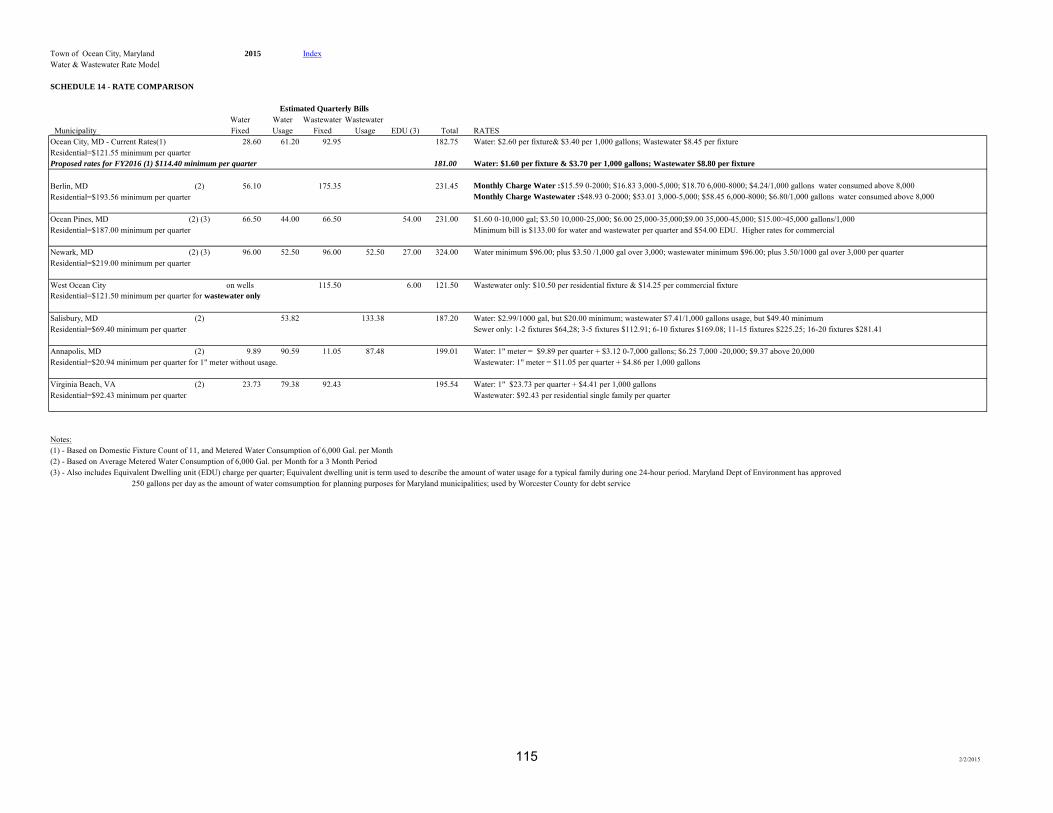
Town of Ocean City, Maryland 2015 IndexWater & Wastewater Rate Model
SCHEDULE 14 - RATE COMPARISON
Estimated Quarterly Bills
Water Water Wastewater Wastewater Municipality Fixed Usage Fixed Usage EDU (3) Total RATESOcean City, MD - Current Rates(1) 28.60 61.20 92.95 182.75 Water: $2.60 per fixture& $3.40 per 1,000 gallons; Wastewater $8.45 per fixtureResidential=$121.55 minimum per quarterProposed rates for FY2016 (1) $114.40 minimum per quarter 181.00 Water: $1.60 per fixture & $3.70 per 1,000 gallons; Wastewater $8.80 per fixture
Berlin, MD (2) 56.10 175.35 231.45 Monthly Charge Water :$15.59 0-2000; $16.83 3,000-5,000; $18.70 6,000-8000; $4.24/1,000 gallons water consumed above 8,000Residential=$193.56 minimum per quarter Monthly Charge Wastewater :$48.93 0-2000; $53.01 3,000-5,000; $58.45 6,000-8000; $6.80/1,000 gallons water consumed above 8,000
Ocean Pines, MD (2) (3) 66.50 44.00 66.50 54.00 231.00 $1.60 0-10,000 gal; $3.50 10,000-25,000; $6.00 25,000-35,000;$9.00 35,000-45,000; $15.00>45,000 gallons/1,000Residential=$187.00 minimum per quarter Minimum bill is $133.00 for water and wastewater per quarter and $54.00 EDU. Higher rates for commercial
Newark, MD (2) (3) 96.00 52.50 96.00 52.50 27.00 324.00 Water minimum $96.00; plus $3.50 /1,000 gal over 3,000; wastewater minimum $96.00; plus 3.50/1000 gal over 3,000 per quarterResidential=$219.00 minimum per quarter
West Ocean City on wells 115.50 6.00 121.50 Wastewater only: $10.50 per residential fixture & $14.25 per commercial fixtureResidential=$121.50 minimum per quarter for wastewater only
Salisbury, MD (2) 53.82 133.38 187.20 Water: $2.99/1000 gal, but $20.00 minimum; wastewater $7.41/1,000 gallons usage, but $49.40 minimumResidential=$69.40 minimum per quarter Sewer only: 1-2 fixtures $64,28; 3-5 fixtures $112.91; 6-10 fixtures $169.08; 11-15 fixtures $225.25; 16-20 fixtures $281.41
Annapolis, MD (2) 9.89 90.59 11.05 87.48 199.01 Water: 1" meter = $9.89 per quarter + $3.12 0-7,000 gallons; $6.25 7,000 -20,000; $9.37 above 20,000 Residential=$20.94 minimum per quarter for 1" meter without usage. Wastewater: 1" meter = $11.05 per quarter + $4.86 per 1,000 gallons
Virginia Beach, VA (2) 23.73 79.38 92.43 195.54 Water: 1" $23.73 per quarter + $4.41 per 1,000 gallons Residential=$92.43 minimum per quarter Wastewater: $92.43 per residential single family per quarter
Notes:(1) - Based on Domestic Fixture Count of 11, and Metered Water Consumption of 6,000 Gal. per Month(2) - Based on Average Metered Water Consumption of 6,000 Gal. per Month for a 3 Month Period(3) - Also includes Equivalent Dwelling unit (EDU) charge per quarter; Equivalent dwelling unit is term used to describe the amount of water usage for a typical family during one 24-hour period. Maryland Dept of Environment has approved
250 gallons per day as the amount of water comsumption for planning purposes for Maryland municipalities; used by Worcester County for debt service
2/2/2015115

116