
WATER USE LICENCE APPLICATION
134
Draft Report Revision 00 May 2020 Compiled By: Bongani Matshazi WATER USE LICENCE APPLICATION Primkop Airport Management (Pty) Ltd Water Use Licence Application in Terms of Section 21 of the National Water Act (Act 36 of 1998) for: Taking Water from a Water Resource (Section 21 (a)); Engaging in a Controlled Activity Identified as such in Section 37(1) (Section 21 (e)); and Disposing of Waste in a Manner which may Detrimentally Impact on a Water Resource (Section 21 (g)).
Transcript of WATER USE LICENCE APPLICATION

Draft Report
Revision 00
May 2020
Compiled By: Bongani Matshazi
WATER USE LICENCE APPLICATION Primkop Airport Management (Pty) Ltd Water Use Licence Application in Terms of Section 21 of the National Water Act (Act 36 of 1998) for: Taking Water from a Water Resource (Section 21 (a)); Engaging in a Controlled Activity Identified as such in Section 37(1) (Section 21 (e)); and Disposing of Waste in a Manner which may Detrimentally Impact on a Water Resource (Section 21 (g)).

CIVIL INF_WS_03_REPORTS_03-WUL Application Report Rev 00.docx Page i
Executive Summary
The National Water Act (Act No. 36 of 1998) provides a framework to protect water resources against
over exploitation and to ensure that there is water for socio-economic development and water for the
future.
The National Water Act (NWA) achieves this by regulating water use through the registration of water
uses and through different types of authorisations, namely:
Existing Lawful Use: A water use that commenced two years prior to the enactment of the National
Water Act that does not pose a risk to a water resource. No registration is required.
Schedule 1: Small quantities of water for domestic use with minimal or no risk. No registration is
required;
General Authorisations: Limited water use, up to 40 000 m³/year or dependent on quaternary
limits. Registration is required; and
Water Use Licence: Greater water use with high risk to the resource. Registration is mandatory.
Primkop Airport Management (PAM) is currently involved in the following water uses as defined by
Clause 21 of the NWA:
Section 21 (a)-Abstraction of groundwater for potable water and agricultural purposes;
Section 21 (e)-Irrigation using effluent from the oxidation ponds; and
Section 21 (g)-Disposal of raw sewage into oxidation ponds.
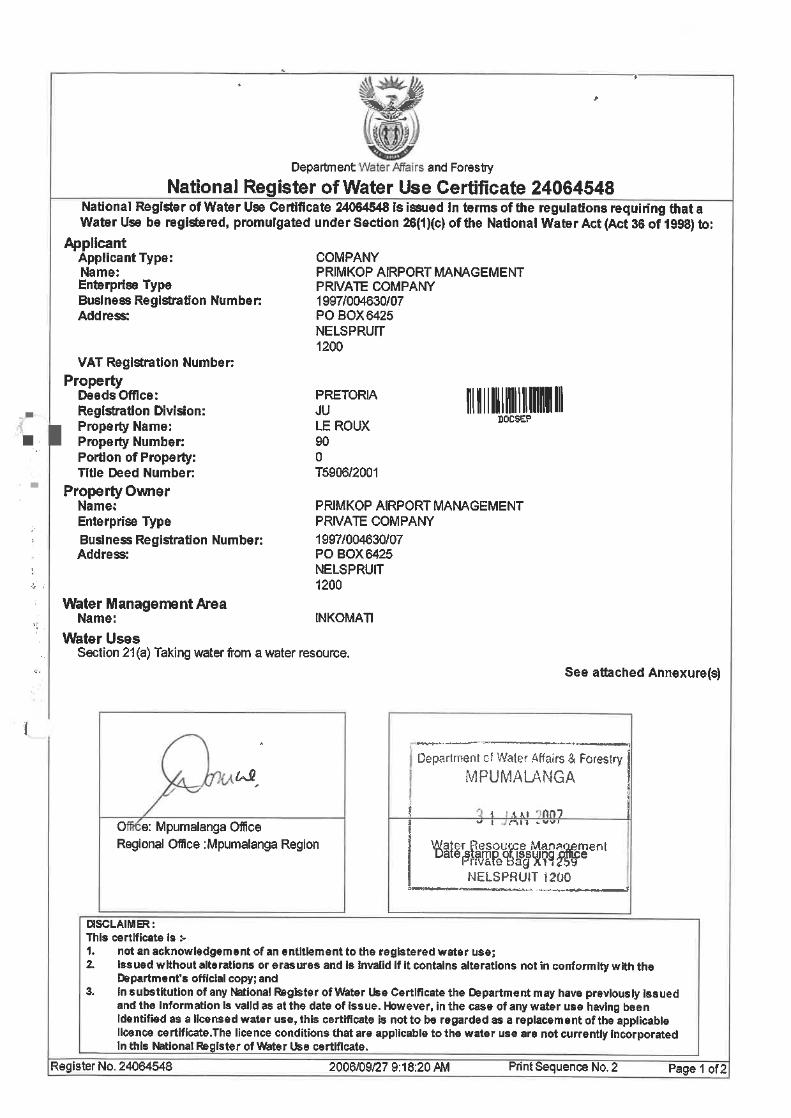
The current water use certificate issued to PAM on the 1st of September 2002 recognises the
abstraction of 24 455 m³ of water per year (See Appendix A). However, the certificate does not
authorise the abstraction of groundwater. Furthermore, the volume of water recognised by this
certificate is insufficient as Kruger Mpumalanga International (KMI) Airport and its MQP Farming
project currently requires 79 728 m³ of water annually to meet demand. This demand is estimated to
increase to 182 840 m³/year within the next few years.
PAM has drilled six (6) boreholes to supply the KMI Airport and the MQP farming project. The current
available yield from the boreholes is 255 616 m³/year. A copy of the yield test results is available in
Appendix B.
Wastewater generated by KMI Airport is treated through five (5) oxidation ponds. The oxidation ponds
are located within the airside fence thereby ensuring controlled access to the site. The oxidation ponds
are lined using HDPE to prevent the seepage of contaminated water into the ground. A monitoring
borehole has been established downstream of the ponds. Water is sampled from the monitoring
borehole every three months to detect leakages from the ponds. KMI Airport follows a set
maintenance manual to ensure the efficiency of the oxidation ponds is maintained. The maintenance
includes:
Water quality tests are conducted monthly;
Cutting grass in the vicinity of the ponds twice a month;
Cleaning the screening rake at the pond inlets twice a day;
Cleaning the sludge channel once a day;

CIVIL INF_WS_03_REPORTS_03-WUL Application Report Rev 00.docx Page ii
Overflows are inspected daily for clogs; and
The irrigation pumps are maintained according to the manufacturer’s specification.
The treated effluent is discharged into the environment by irrigating the grass south of the oxidation
ponds. Records indicate an average irrigation rate of 10.5 m³/day with a peak of 36.25 m³/day.
The above information implies that KMI Airport needs to apply for a WUL. This was confirmed in a pre-
application meeting held at the Inkomati-Usuthu Catchment Agency (IUCMA) offices on the 14th of
February 2020.
A geohydrological investigation and public participation process have been completed to support this
WUL application.
The geohydrological investigation included a risk assessment focused on the disposal of wastewater
in a manner that may detrimentally impact on a water resource. The identified potential impacts
include the deterioration of water quality and pollution. KMI Airport has adopted the
recommendations made in the risk assessment.
The public participation process commenced on the 15th of May 2020 and will continue for at least 60
day. The documentation associated with the process can be found in Appendix D.
It is recommended that the WUL be granted to permit the abovementioned water uses contained in
the WULA forms.

CIVIL INF_WS_03_REPORTS_03-WUL Application Report Rev 00.docx Page iii
Table of Contents
1 Introduction .................................................................................................................................... 1
1.1 Background ............................................................................................................................. 1
1.2 Purpose of Report ................................................................................................................... 1
1.3 Report Structure ..................................................................................................................... 1
2 Status Quo ....................................................................................................................................... 2
2.1 Introduction ............................................................................................................................ 2
2.2 Description of Property ........................................................................................................... 2
2.2.1 Topography ..................................................................................................................... 3
2.2.2 Hydrology and Wetlands ................................................................................................. 6
2.2.3 Geology ........................................................................................................................... 6
2.3 Water Use Activities and Demands ........................................................................................ 8
2.3.1 Current KMI Airport Water Demand and Wastewater Generation ................................ 8
2.3.2 Current MQP Farm Project Water Demand .................................................................... 8
2.3.3 Future Water Demands ................................................................................................... 8
2.4 Water Supply System .............................................................................................................. 9
2.4.1 General Overview ........................................................................................................... 9
2.4.2 Boreholes ........................................................................................................................ 9
2.4.3 Maintenance ................................................................................................................. 13
2.5 Wastewater Management System ....................................................................................... 13
2.5.1 General Overview ......................................................................................................... 13
2.5.2 Oxidation Ponds ............................................................................................................ 13
2.5.3 Maintenance ................................................................................................................. 15
3 Risk Assessment ............................................................................................................................ 17
4 Regulations and Legislation .......................................................................................................... 19
4.1 Introduction .......................................................................................................................... 19
4.2 Water uses ............................................................................................................................ 19
4.2.1 Section 21 (a) Taking water from a water source ......................................................... 19
4.2.2 Section 21 (e) Engaging in a controlled activity identified as such in section 37(1) or
declared under Section 38(1) ........................................................................................................ 19
4.2.3 Section 21 (g) Disposing of waste in a manner which may detrimentally impact on a
water resource .............................................................................................................................. 19
4.3 Section 27 Motivation ........................................................................................................... 19
4.4 Types of water use authorisations ........................................................................................ 22
4.4.1 Schedule 1 ..................................................................................................................... 22

CIVIL INF_WS_03_REPORTS_03-WUL Application Report Rev 00.docx Page iv
4.4.2 Existing Lawful Use ........................................................................................................ 22
4.4.3 General Authorisations ................................................................................................. 23
4.4.4 Water Use Licence ........................................................................................................ 23
5 Water Use Licence Application Methodology .............................................................................. 25
5.1 Pre-application Consultation ................................................................................................ 25
5.2 Information and Technical Report Collation ......................................................................... 25
5.3 Public Participation Process .................................................................................................. 25
5.4 Concerns Raised by Interested and Affected Persons .......................................................... 25
5.5 Submission of the Water Use Licence Application ............................................................... 26
6 Conclusion and Recommendation ................................................................................................ 27
Appendix A Water Use licences and general authorisations ........................................................... 28
Appendix B Geohydrological Report ................................................................................................ 29
Appendix C Hydraulic Design Calculations ....................................................................................... 30
Appendix D Public Participation Documentation ............................................................................. 31
Table of Tables
Table 2-1: Estimated current water demand .......................................................................................... 8
Table 2-2: Borehole locations ................................................................................................................. 9
Table 2-3: Borehole properties ............................................................................................................. 11
Table 2-4: KMI Airport Potable water supply boreholes quality .......................................................... 12
Table 2-5: MQP Farming project irrigation water supply boreholes quality ........................................ 12
Table 2-6: Oxidation pond properties ................................................................................................... 14
Table 2-7: Summary of oxidation pond effluent test results ................................................................ 15
Table 2-8: Summary of monitoring borehole test results..................................................................... 15
Table 3-1: Risk assessment ................................................................................................................... 18
Table 4-1: Water Use Licence Application procedure .......................................................................... 24
Table of Figures
Figure 2-1: Primkop Airport Township Layout ........................................................................................ 3
Figure 2-2: Endangered Legogote Sour Bushveld ................................................................................... 4
Figure 2-3: Mpumalanga Biodiversity Sector Plan .................................................................................. 5
Figure 2-4: Wetlands within the area ..................................................................................................... 6
Figure 2-5: Geological map of KMI Airport and its environs ................................................................... 8
Figure 2-6: Borehole layout .................................................................................................................. 10
Figure 2-7: Borehole and oxidation pond locality plan ......................................................................... 11
Figure 2-8: Oxidation pond layout ........................................................................................................ 14

Water Use Licence Application
Date: 2020/05/15 Revision Number: 00
CIVIL INF_WS_03_REPORTS_03-WUL Application Report Rev 00.docx Page 1 of 35
1 INTRODUCTION
1.1 Background
Primkop Airport Management (PAM) operates the Kruger Mpumalanga International (KMI)
Airport in the Mpumalanga Province. For the airport to continue offering a safe, healthy and
environmentally friendly service to travellers, PAM has drilled four boreholes to supply potable
water to the airport. Two additional boreholes have also been drilled to supply irrigation water to
the farming operations on the PAM property as well. Wastewater generated by the airport is
treated through oxidation ponds before being disposed of by irrigating the land adjacent to the
ponds.
PAM has submitted this Water Use Licence Application (WULA) for the KMI Airport and its MQP
Farming project to comply with the requirements of the National Water Act (NWA) (Act No. 36 of
1998) and the Regulations Regarding the Procedural Requirements for Water Use Licence
Applications and Appeals, 2017.
1.2 Purpose of Report
This document aims to provide the Inkomati-Usuthu Catchment Management Agency (IUCMA)
with the necessary information associated with the operation of KMI Airport and its MQP Farming
project in order to approve the water uses in terms of the NWA related to this development.
1.3 Report Structure
This document comprises the following sections:
Status Quo;
Regulations and Legislation;
WULA Methodology;
Compliance Status; and
Conclusion and Recommendation.

Water Use Licence Application
Date: 2020/05/15 Revision Number: 00
CIVIL INF_WS_03_REPORTS_03-WUL Application Report Rev 00.docx Page 2 of 35
2 STATUS QUO
2.1 Introduction
KMI Airport is the official international port of entry into Mpumalanga Province established on the
21st of October 2002. It is an International Civil Aviation Organization (ICAO) approved
international airport serving an average of 260 000 passengers per annum with the current
capacity to accommodate up to 600 000 passengers per annum and significant expansion
potential.
Parallel to the airport, PAM has established the MQP Farming project on the same property. The
project is aimed at providing much needed employment opportunities to the neighbouring
Dwaleni community. The farm produces low volume high value crops such as vegetables and
berries to supply both local and national retailers. The pilot project commenced on 5 ha of land
with the potential to expand operations to 20 ha.
This section of the document describes the KMI Airport and farming project water requirements
as well as the infrastructure that has been established to satisfy these requirements.
2.2 Description of Property
The KMI Airport and MQP Farming project are situated on farm Kruger Mpumalanga International
Airport No. 666-JU on the Primkop Airport Township. The township is approximately 364.3 ha. The
24 digit code for the farm is T0JU00000000066600000.

Water Use Licence Application
Date: 2020/05/15 Revision Number: 00
CIVIL INF_WS_03_REPORTS_03-WUL Application Report Rev 00.docx Page 3 of 35
Figure 2-1: Primkop Airport Township Layout
2.2.1 Topography
The topography is characterised by rolling hills, dropping eastwards towards the Kruger National
Park. The study site falls within the Legogote Sour Bushveld.

Water Use Licence Application
Date: 2020/05/15 Revision Number: 00
CIVIL INF_WS_03_REPORTS_03-WUL Application Report Rev 00.docx Page 4 of 35
Figure 2-2: Endangered Legogote Sour Bushveld
The following vegetation units are common to the area and within the vegetation unit:
Tall Trees: Pterocarpus angolensis (d), Sclerocarya birrea subsp. caffra (d). Small Trees: Acacia
davyi (d), A. sieberiana var. woodii (d), Combretum zeyheri (d), Erythrina latissima (d), Parinari
curatellifolia (d), Terminalia seri- cea (d), Trichilia emetica (d), Vernonia amygdalina (d), Acacia
caffra, Antidesma venosum, Erythroxylum emarginatum, Faurea rochetiana, F. saligna, Ficus
burkei, F. glumosa, F. ingens, F. petersii, Heteropyxis natalensis, Peltophorum africanum,
Piliostigma thonningii, Pterocarpus rotundifolius, Schotia brachy- petala.
Succulent Trees: Euphorbia ingens.
Tall Shrubs: Diospyros lycioides subsp. sericea, Erythroxylum delagoense, Olea europaea subsp.
africana, Pachystigma macrocalyx, Pseudarthria hookeri var. hookeri, Rhus pentheri.
Low Shrubs: Diospyros galpinii (d), Flemingia grahamiana (d), Agathisanthemum bojeri, Eriosema
psoraleoides, Gymnosporia heterophylla, Hemizygia punctate.
Herbs: Gerbera ambigua, G. viridifolia, Hemizygia persimilis, Hibiscus sidiformis, Ocimum
gratissimum, Waltheria indica.
Succulent Herbs: Orbea carnosa subsp. carnosa, Stapelia gigantea.
Geophytic Herbs: Gladiolus hollandii, Hypoxis rigidula.
Endemic Taxon Succulent Herb: Aloe simii.

Water Use Licence Application
Date: 2020/05/15 Revision Number: 00
CIVIL INF_WS_03_REPORTS_03-WUL Application Report Rev 00.docx Page 5 of 35
The vegetation unit is classified as endangered. The Target is 19% and about 2% is statutorily
conserved mainly in the Bosbokrand and Barberton Nature Reserves; at least a further 2% is
conserved in private reserves including the Mbesan and Kaapsehoop Reserves and Mondi Cycad
Reserve. It has been greatly transformed (50%), mainly by plantations and also by cultivated areas
and urban development.
Scattered alien plants include Lantana camara, Psidium guajava and Solanum mauritianum.
Erosion is very low to moderate (Mucina & Rutherford, 2006).
In terms of the Mpumalanga Biodiversity Sector Plan, most of the KMIA falls within an area
designated as heavily or moderately modified. A drainage area from the airport is classified as a
critical biodiversity area and other natural areas. Most of the area to the east of the airport falls
within other natural areas of the Mpumalanga Biodiversity Sector Plan.
Figure 2-3: Mpumalanga Biodiversity Sector Plan
Water Use Licence Application
Date: 2020/05/15 Revision Number: 00
CIVIL INF_WS_03_REPORTS_03-WUL Application Report Rev 00.docx Page 6 of 35
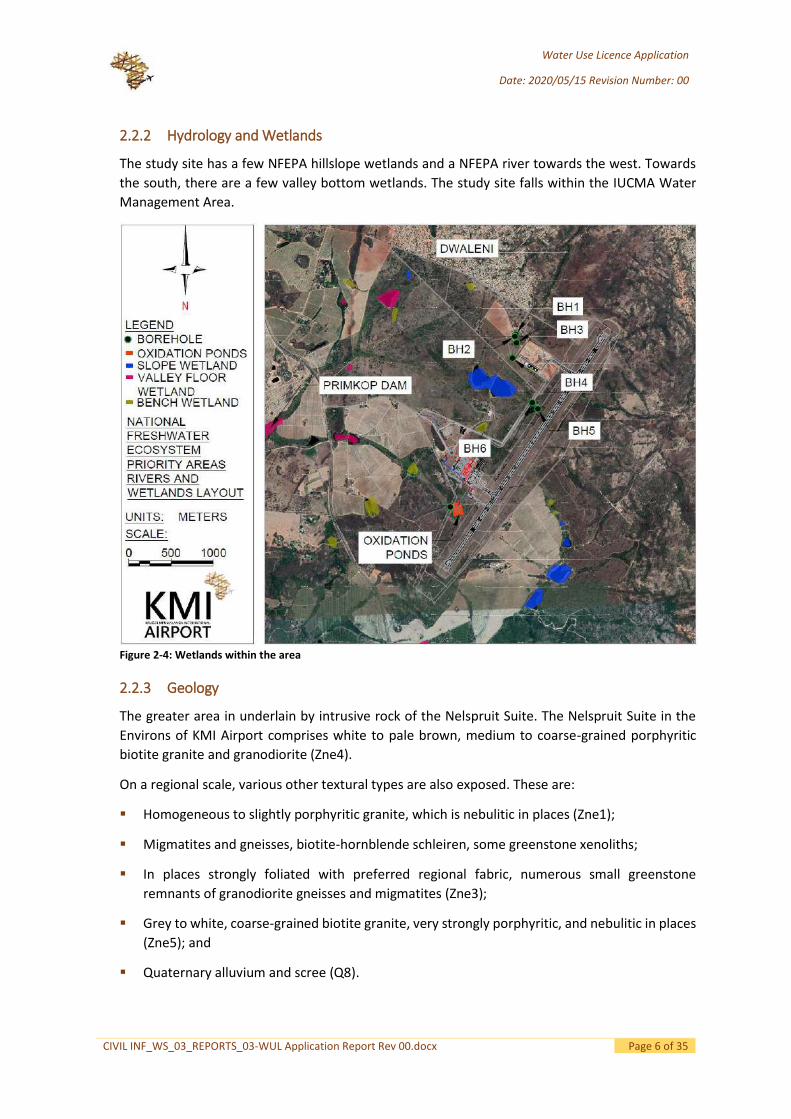
2.2.2 Hydrology and Wetlands
The study site has a few NFEPA hillslope wetlands and a NFEPA river towards the west. Towards
the south, there are a few valley bottom wetlands. The study site falls within the IUCMA Water
Management Area.
Figure 2-4: Wetlands within the area
2.2.3 Geology
The greater area in underlain by intrusive rock of the Nelspruit Suite. The Nelspruit Suite in the
Environs of KMI Airport comprises white to pale brown, medium to coarse-grained porphyritic
biotite granite and granodiorite (Zne4).
On a regional scale, various other textural types are also exposed. These are:
Homogeneous to slightly porphyritic granite, which is nebulitic in places (Zne1);
Migmatites and gneisses, biotite-hornblende schleiren, some greenstone xenoliths;
In places strongly foliated with preferred regional fabric, numerous small greenstone
remnants of granodiorite gneisses and migmatites (Zne3);
Grey to white, coarse-grained biotite granite, very strongly porphyritic, and nebulitic in places
(Zne5); and
Quaternary alluvium and scree (Q8).

Water Use Licence Application
Date: 2020/05/15 Revision Number: 00
CIVIL INF_WS_03_REPORTS_03-WUL Application Report Rev 00.docx Page 7 of 35
Numerous diabase (M1) dykes, trending roughly east west and northwest southeast, traverse the larger area. Only one of these east-west trending dolerite dykes falls within the boundaries of KMI Airport.
Two very prominent regional north-northwest – south-southeast trending linear features are recorded immediately to the west and to the east of the property on the Barberton 1:250 000 geological map. These are interpreted as sericitized and silicified shear zones. Other north-northwest – south-southeast and east-west linear features recorded in Figure 2-5 are undifferentiated.
Kruger Mpumalanga International Airport

Water Use Licence Application
Date: 2020/05/15 Revision Number: 00
CIVIL INF_WS_03_REPORTS_03-WUL Application Report Rev 00.docx Page 8 of 35
Figure 2-5: Geological map of KMI Airport and its environs
2.3 Water Use Activities and Demands
2.3.1 Current KMI Airport Water Demand and Wastewater Generation
Table 2-1 summarises the current estimated water demand for KMI Airport. The water demand
estimate has been confirmed using historic water usage data. The average estimated and historic
demands are 129.8 kℓ/day and 127 kℓ/day, respectively. The current water consumption estimate
is attached in Appendix C. This results in an annual requirement of 34 284 m³/year.
Table 2-1: Estimated current water demand
Facility Users/Area Daily demand rate Daily demand
Airport terminal 800 p/d 20 ℓ/p 16 kℓ/day
Apron staff facility 195 m² 2.4 kℓ/100m² 4.68 kℓ/day
Hangars 4700 m² 0.6 kℓ/100m² 28.2 kℓ/day
Fire station 276 m² 2.4 kℓ/100m² 6.624 kℓ/day
Fuel farm 4400 m² 0.4 kℓ/100m² 17.6 kℓ/day
Car hire parking 9450 m² 0.6 kℓ/100m² 56.7 kℓ/day
Total 129.804 kℓ/day
Sewerage generated by KMIA is estimated at 80% of the demand, i.e. 103.8 kℓ/day.
2.3.2 Current MQP Farm Project Water Demand
Based on meter readings for the period January 2019/January 2020, the MQP farm uses 45 444
m³ of irrigation water a year.
2.3.3 Future Water Demands
Future water demands that are accounted for in the WUL application include:
A light industrial and warehouse area;
A motel area; and

Water Use Licence Application
Date: 2020/05/15 Revision Number: 00
CIVIL INF_WS_03_REPORTS_03-WUL Application Report Rev 00.docx Page 9 of 35
Additional farming.
These additional water uses require 12 224 m³ of potable water and 90 888 m³ of irrigation water.
2.4 Water Supply System
2.4.1 General Overview
KMI Airport
Four (4) boreholes supply potable water to KMI Airport. A chlorination station has been installed
at the site of the boreholes to treat the water before it is stored in pressed steel panel emergency
storage tanks. The one 325 m³ tank has the capacity to store four hours’ worth of firewater while
the other 130 m³ tank has the capacity to store twenty-four hours’ worth of potable water.
From these storage tanks the water is reticulated through the respective potable water and
firewater pipe networks with pumps providing the necessary pressure.
MQP Farm Project
Two boreholes supply the MQP Farm project with irrigation water. The water from the boreholes
is stored in a 250 m³ ground circular steel tank. From the tank, an automated drip irrigation system
distributes irrigation water. A pressurised fertiliser system injects fertiliser into the water as it is
pumped to the fields.
2.4.2 Boreholes
Six (6) boreholes have been drilled on the PAM property:
Two (2) boreholes supplying the farming project; and
Four (4) boreholes supplying the airport.
Table 2-2 provides the coordinates of the boreholes indicated in Figure 2-6 and Figure 2-7.
Table 2-2: Borehole locations
Description Location Elevation (m.a.s.l)
Water level elevation (m.a.s.l)
Supplying
X Y
Borehole 1 31.104396 -25.370623 857 810.31 Airport
Borehole 2 31.104294 -25.370835 858 810.50 Airport
Borehole 3 31.104478 -25.371553 856 812.26 Farming project Borehole 4 31.104002 -25.373143 846 813.95 Farming project
Borehole 5 31.106998 -25.378570 841 838.33 Airport
Borehole 6 31.106339 -25.377907 837 826.90 Airport

Water Use Licence Application
Date: 2020/05/15 Revision Number: 00
CIVIL INF_WS_03_REPORTS_03-WUL Application Report Rev 00.docx Page 10 of 35
Figure 2-6: Borehole layout

Water Use Licence Application
Date: 2020/05/15 Revision Number: 00
CIVIL INF_WS_03_REPORTS_03-WUL Application Report Rev 00.docx Page 11 of 35
Figure 2-7: Borehole and oxidation pond locality plan
The properties of the PAM boreholes are listed in Table 2-3, where m.b.g.l is meters below ground
level.
Table 2-3: Borehole properties
Description Depth (m)
Static water level (m.b.g.l)
Pump installation depth (m)
Discharge rate (ℓ/s)
Yield (ℓ/d)
Borehole 1 68 46.69 60 0.18 6 480
Borehole 2 102 47.50 78 0.54 19 440 Borehole 3 43.74 100 2.88 103 680
Borehole 4 67.19 32.05 63 5.6 362 880
Borehole 5 145 2.67 125 1.1 71 280
Borehole 6 135 7.84 105 2.1 136 080

Water Use Licence Application
Date: 2020/05/15 Revision Number: 00
CIVIL INF_WS_03_REPORTS_03-WUL Application Report Rev 00.docx Page 12 of 35
From Table 2-3 it can be observed that the current available yield from the boreholes is 699 840
ℓ/d (255 616 m³/year). A copy of the Yield test results is available in Appendix B.
Water samples from the six boreholes where collected and tested at a SANAS certified laboratory.
Table 2-4 and Table 2-5 summarises the results of the tests.
Table 2-4: KMI Airport Potable water supply boreholes quality
Parameter Unit Standard and limits: Results
Drinking water BH1 and BH2 BH5 BH6
pH @ 37°C pH Units 5-9.7 6.81 7.13 7.73
Conductivity @ 25°C mS/m ≤170 15 23 31
Chloride as Cl mg/ℓ ≤300 11.3 <0.01 9.5
Total dissolved solids mg/ℓ ≤1200 105 163 222
Dissolved Aluminium as Al mg/ℓ ≤0.30 <0.05 <0.05 <0.05
Dissolved Arsenic as As mg/ℓ ≤0.01 <0.002 0.04 <0.002
Dissolved Cadium as Cd mg/ℓ ≤0.003 <0.0009 <0.0009 <0.0009
Dissolved Chromium as Cr mg/ℓ ≤0.05 <0.003 <0.003 <0.003
Dissolved Copper as Cu mg/ℓ ≤2.0 <0.02 <0.02 <0.02
Dissolved Iron as Fe mg/ℓ ≤0.3 <0.05 <0.05 <0.05
Dissolved Mercury as Hg mg/ℓ ≤0.006 <0.001 <0.001 <0.001
Dissolved Manganese as Mn mg/ℓ ≤0.4 <0.01 12 0.04
Dissolved Sodium as Na mg/ℓ ≤200 16 22 32
Dissolved Nickel as Ni mg/ℓ ≤0.07 <0.005 0.006 0.01
Dissolved Antimony as Sb mg/ℓ ≤0.02 <0.02 <0.02 <0.02
Dissolved Selenium as Se mg/ℓ ≤0.04 <0.010 <0.010 <0.010
Dissolved Zinc an Zn mg/ℓ ≤5.0 0.118 0.223 0.33
Total Coliforms Cfu/100 mℓ
≤10 2 8 5
Table 2-5: MQP Farming project irrigation water supply boreholes quality
Parameter Unit Standard and limits: Results
Irrigation water BH3 BH4
pH @ 37°C pH Units 6.5-8.4 7.27 7.17
Conductivity @ 25°C mS/m <540 15 12
Chloride as Cl mg/ℓ <700 9.8 5.4
Total dissolved solids mg/ℓ −0.5−0.5 108 85
Dissolved Aluminium as Al mg/ℓ <20 <0.05 <0.05
Dissolved Arsenic as As mg/ℓ <2.0 <0.002 <0.002
Dissolved Cadium as Cd mg/ℓ <0.05 <0.0009 <0.0009
Dissolved Copper as Cu mg/ℓ <5.0 <0.02 <0.02
Dissolved Iron as Fe mg/ℓ <20 <0.05 <0.05
Dissolved Manganese as Mn mg/ℓ <10 <0.01 <0.01
Dissolved Sodium as Na mg/ℓ <460 21 19
Dissolved Nickel as Ni mg/ℓ <2.0 0.006 0.006
Dissolved Selenium as Se mg/ℓ <0.06 <0.010 <0.01
Dissolved Zinc an Zn mg/ℓ <0.5 <0.010 <0.010

Water Use Licence Application
Date: 2020/05/15 Revision Number: 00
CIVIL INF_WS_03_REPORTS_03-WUL Application Report Rev 00.docx Page 13 of 35
Parameter Unit Standard and limits: Results
Irrigation water BH3 BH4
E.coli or Faecal Coliforms Cfu/100 mℓ 1000 <1 <1
2.4.3 Maintenance
The KMIA Maintenance Manual contains guidelines for the operation and maintenance of the
boreholes. These include:
Borehole pumps are to be maintained according to the manufacturer’s specifications;
Under no circumstances should the borehole pump rates exceed the yields stated in the
geohydrological Report (Appendix B);
Boreholes are to remain fenced off and no sanitary, fuel or chemical storage facilities are to
be located or placed upstream of them;
Water quality shall be tested monthly or at any time when contamination is suspected; and
If contamination is suspected, a sample shall be taken at the sampling point at the borehole
and at a reticulation outlet to establish locality of contamination.
2.5 Wastewater Management System
2.5.1 General Overview
Sewerage generated by KMI Airport is drained into oxidation ponds where it undergoes aerobic
treatment. The treated effluent is discharged by irrigating the grass south of the ponds.
2.5.2 Oxidation Ponds
The oxidation pond inlet works include a sludge channel, hand rake screens, a drying bed, and a
parshall flume.
A 200 mmø outfall sewer pipeline discharges sewerage into a 400 mm wide x 500 m deep concrete
sludge channel. The sludge channel diverts the sewerage into one of three routes. That is, to either
of the two hand rake screens or to the emergency overflow channel.
Sluice gates control the flow to the hand rake screens allowing for the maintenance of one screen
while the other is in operation.
The invert of the emergency overflow channel is 200 mm higher than the invert of the main
channel there by preventing the bypassing of the hand rake screens during normal operations.
A slab with weep holes draining back into the main concrete channel is located adjacent to the
hand rake screens for the collection and drying of screenings.
The screened wastewater then flows into Oxidation Pond 1 via a 3” parshall flume.
The five (5) oxidation ponds are located in a cluster south-west of the airport as indicated in Figure
2-7 and Figure 2-8. Each oxidation pond is lined using HDPE to prevent the seepage of
contaminants into the ground.

Water Use Licence Application
Date: 2020/05/15 Revision Number: 00
CIVIL INF_WS_03_REPORTS_03-WUL Application Report Rev 00.docx Page 14 of 35
Figure 2-8: Oxidation pond layout
Sewerage generated by KMI Airport enters Oxidation Pond 1 via the inlet structure described
above. The influent is retained in this pond for at least 11 days before flowing into Oxidation Pond
2. In Oxidation Pond 2 the wastewater is retained for at least 5 days before overflowing into
Oxidation Pond 3. Oxidation Pond 3 and 4 will also retain the wastewater for 5 days each. The
properties of the KMI Airport oxidation pond are indicate in Table 2-6.
Table 2-6: Oxidation pond properties
Pond Top Bottom Depth (m) Capacity (m³)
Width (m) Length (m) Width (m) Length (m) Oxidation Pond 1 26.00 46.00 16.00 36.00 1.5 1 185
Oxidation Pond 2 16.15 46.00 5.90 35.75 1.5 579
Oxidation Pond 3 13.25 28.5 2.75 18.00 1.5 219
Oxidation Pond 4 13.35 28.5 2.60 17.75 1.5 212
Oxidation Pond 5 13.4 28.25 2.40 17.50 1.5 203
Oxidation Pond 5 has the capacity to retain wastewater for at least 5 days. At the end of this period
the contaminant and pollutant load of the effluent should be within the stipulations set out in the
Revision of General Authorisations in Terms of Section 39 of the National Water Act, 1998 (Act No.
36 of 1998) GN 665 (GN 665).

Water Use Licence Application
Date: 2020/05/15 Revision Number: 00
CIVIL INF_WS_03_REPORTS_03-WUL Application Report Rev 00.docx Page 15 of 35
Meter readings recorded for the 2019/2020 period indicate an average irrigation rate of 10.5
m³/day with a peak of 36.25 m³/day. Therefore, Table 1.2 of GN 665 which is applicable to
irrigation not exceeding 500 m³/day has been used to define the effluent quality limits for the
oxidation ponds. Table 2-7 summarises the water quality test results for the oxidation pond
effluent sampled in March 2020 while Table 2-8 summarises the water quality test results for
samples collected from the monitoring borehole during the same period.
Table 2-7: Summary of oxidation pond effluent test results
Variable Unit Standard and limits: Results
Wastewater Oxidation Ponds
pH pH units 5.5-9.5 6.77
Electrical Conductivity EC mS/m < 200 48.6
Chemical Oxygen Demand mg/ℓ < 400 after removal of algae 158
E.coli or Faecal Coliforms CFU/100 mℓ 1 000 461
Sodium Adsorption Ratio (SAR)
< 5 for biodegradable industrial wastewater
N/A
Table 2-8: Summary of monitoring borehole test results
Parameter Unit Standard and limits: Results
Wastewater BH7
pH @ 37°C pH Units 5-9.5 7.28
Conductivity @ 25°C mS/m 70-150 19
Total dissolved solids mg/ℓ < 25 104
Dissolved Arsenic as As mg/ℓ 0.02 <0.002
Dissolved Cadium as Cd mg/ℓ 0.005 <0.0009
Dissolved Copper as Cu mg/ℓ 0.01 <0.002
Dissolved Iron as Fe mg/ℓ 0.3 <0.05
Dissolved Mercury as Hg mg/ℓ 0.05 <0.001
Dissolved Manganese as Mn mg/ℓ 0.1 <0.01
Dissolved Sodium as Na mg/ℓ 90 22
Dissolved Selenium as Se mg/ℓ 0.02 <0.010
Dissolved Zinc an Zn mg/ℓ 0.1 <0.010
E.coli or Faecal Coliforms Cfu/100 mℓ 1000 <1
The water quality test results indicate that the effluent from the oxidation ponds is adequately
treated before being discharged. This is supported by the results of the oxidation pond efficiency
calculations (Appendix C).
Treated effluent is released into the environment from Oxidation Pond 5 via a Jo-jo tank and pump
by irrigating the patch of land south of the ponds indicated in Figure 2-8.
2.5.3 Maintenance
The KMIA Maintenance Manual contains guidelines for the operation and maintenance of the
oxidation ponds. These include:
All grids at the oxidation ponds shall be cleaned twice daily;

Water Use Licence Application
Date: 2020/05/15 Revision Number: 00
CIVIL INF_WS_03_REPORTS_03-WUL Application Report Rev 00.docx Page 16 of 35
The sludge channel shall be cleaned once a day;
The side slopes of the ponds shall be mowed twice monthly;
General civil maintenance shall be performed;
The ponds shall be checked daily that overflows do not become clogged;
Water quality shall be tested monthly; and
The irrigation pump at the oxidation ponds shall be maintained according to the
manufacturer’s specification.

Water Use Licence Application
Date: 2020/05/15 Revision Number: 00
CIVIL INF_WS_03_REPORTS_03-WUL Application Report Rev 00.docx Page 17 of 35
3 RISK ASSESSMENT
A risk assessment was conducted by Acmert Consulting and Contracting on behalf of PAM. The
risk assessment is summarised in Table 3-1. The complete assessment is available in Appendix B.
The risk assessment focuses on the disposal of wastewater in a manner that may detrimentally
impact on a water resource.

Water Use Licence Application
Date: 2020/05/15 Revision Number: 00
CIVIL INF_WS_03_REPORTS_03-WUL Application Report Rev 00.docx Page 18 of 35
Table 3-1: Risk assessment
Potential Environmental Impact
Activity
Area Applicable
Corrective Measure
Environmental Significance Before Mitigation Recommended Mitigation Measures
Nature Extent Duration Magnitude Probability Significance
Operational
Deterioration of water quality
All activities at the KMI airport
Leakage from the ponds may occur
Yes Negative 2 4 8 4 56 Maintenance of oxidation ponds Fencing of area around the pond and limited access to the pond system
Pollution Air Odour released from the ponds
Yes Negative 2 4 4 3 30 Use of long distance circulators Routine odour monitoring Oxidation pond maintenance
Water Surface and ground water sources receiving contaminated water
yes Negative 2 5 8 4 60 Constant monitoring of water quality
Environmental risk
Addition of contaminants causing decrease in crop yield
Farming areas using treated wastewater
Yes Negative 2 3 6 3 33 Constant monitoring of water and crop quality
Health Risk Increase in crop yields and nutrients
Farming areas using treated waste water
Yes Positive 2 4 6 3 36
Pathogens associated with waste water
Farming areas using treated waste water
Yes Negative 3 4 8 2 30 Constant monitoring of water and crop quality
Water Use Licence Application
Date: 2020/05/15 Revision Number: 00
CIVIL INF_WS_03_REPORTS_03-WUL Application Report Rev 00.docx Page 19 of 35
4 REGULATIONS AND LEGISLATION
4.1 Introduction
The Republic of South Africa is categorized as a water scarce country with an average rainfall that
is about 40% less than the annual world average rainfall of 850 mm per annum. As such, the NWA
was enacted to manage the limited water that is available in the Republic. This section of the
report gives a brief description of the water uses PAM is engaged in in terms of the NWA and
summarises the different types of water use authorisations included in the NWA:
Schedule 1;
Existing Lawful Use;
General Authorisations; and
Water Use Licence.
4.2 Water uses
PAM is currently engaged in the following water uses as defined by Clause 21 of the NWA:
4.2.1 Section 21 (a) Taking water from a water source
Abstraction of water from six (6) boreholes located on the PAM property. The boreholes are
located in the northern region of the property as indicated in Figure 2-6 and Table 2-2. The
properties of the boreholes are as shown on Table 2-3. The six boreholes have a combined yield
of 699 840 ℓ/d (255 616 m³/year).
4.2.2 Section 21 (e) Engaging in a controlled activity identified as such in section 37(1) or
declared under Section 38(1)
The irrigation of the grass south of the oxidation ponds using treated effluent from the ponds. The
irrigation rate is at an average of 10.5 m³/day.
4.2.3 Section 21 (g) Disposing of waste in a manner which may detrimentally impact on a
water resource
The discharge of raw sewage generated by KMI Airport into five (5) oxidation ponds for treatment.
The HDPE lined oxidation ponds have a combined capacity of 2 398 m³.
4.3 Section 27 Motivation
Section 27 of the NWA states that, in issuing a general authorisation or licence a responsible
authority must take into account all relevant factors, including-
(a) existing lawful water uses;
(b) the need to redress the results of past racial and gender discrimination;
(c) efficient and beneficial use of water in the public interest;
(d) the socio-economic impact -

Water Use Licence Application
Date: 2020/05/15 Revision Number: 00
CIVIL INF_WS_03_REPORTS_03-WUL Application Report Rev 00.docx Page 20 of 35
(i) of the water use or uses if authorised; or
(ii) of the failure to authorise the water use or uses;
(e) any catchment management strategy applicable to the relevant water resource;
(f) the likely effect of the water use to be authorised on the water resource and on other water
users;
(g) the class and the resource quality objectives of the water resource;
(h) investments already made and to be made by the water user in respect of the water use in
question;
(i) the strategic importance of the water use to be authorised;
(j) the quality of water in the water resource which may be required for the Reserve and for
meeting international obligations; and
(k) the probable duration of any undertaking for which a water use is to be authorised.
PAM motivates the issuing of a WUL for activities at KMI Airport based on the factors listed in
Section 27 of the NWA. The motivation is discussed in the following sections.
Section 27 (a) Existing Lawful Water Uses
PAM was issued with a water use certificate on the 1st of September 2002. The certificate is based
on the KMI Airport property size of about 350 ha and an annual water abstraction volume of 24
455 m³. However, the lawfulness was yet to be determined. A copy of the certificate can be found
in Appendix A.
Section 27 (b) Redressing the results of past racial and gender discrimination
Over the years KMI Airport has represented a unique partnership with the 30 000 strong
neighbouring Dwaleni community, which contributed a portion of its land to the airport site, and
holds a 10% share in the airport through the Mbuyane Communal Property Association (MCPA).
The revenue earned by the MCPA from the airport has been utilized to fund development and
services for the community, such as roads, access to water and community facilities. The MCPA
acts on behalf of the inhabitants of the Dwaleni Township and the Mbuyane tribe. KMI Airport
makes a monthly royalty payment to the MCPA, calculated per departing passenger and continues
to invest its resources in various community outreach projects.
One of these projects is the MQP Farming project. The project is aimed at providing much needed
employment opportunities to the neighbouring Dwaleni community. The farm produces low-
volume high-value crops such as vegetables and berries to supply both the local and national
market. The pilot project commenced on 5 ha of land with the potential to expand operations to
20 ha. The WUL application includes two (2) boreholes dedicated to supplying irrigation water to
the farming project.
Section 27 (c) Efficient and beneficial use of water in the public interest
The KMI Airport water reticulation system ensures that a minimal volume of water is lost through
leaks by implementing an efficient leak detection system and a rapid response maintenance

Water Use Licence Application
Date: 2020/05/15 Revision Number: 00
CIVIL INF_WS_03_REPORTS_03-WUL Application Report Rev 00.docx Page 21 of 35
regime. All wash bays and fuelling stations are fitted with oil / water separators preventing the
discharge of contaminated water into the environment.
Treated effluent from the oxidation ponds is tested on a monthly basis to ensure that its quality is
within the limits set out in the GN 665. The effluent is disposed of by irrigation of the field adjacent
to the ponds thereby recharging the groundwater.
The MQP Farming project utilises an automated drip irrigation system. This ensures that crops are
not over-irrigated thereby minimising the wastage of water.
Section 27 (d) The socio-economic impact
Recognising that aviation is essential to South Africa’s economy, and to the regional economy of
Mpumalanga province; KMI Airport serves as an important logistical node in the region, is an
anchor for tourism, and provides a livelihood for thousands of Mbombela residents and their
families. The strategic plan for KMI Airport ensures that long-term development of the airport
takes place in such a way that it continues to contribute to the economic prosperity of the region
for years to come.
Section 27 (e) Any catchment management strategy applicable to the relevant water resource
The Catchment Management Strategy for the IUCMA has been compiled and has been gazetted.
Section 27 (f) The likely effect of the water use to be authorised on the water resource and on
other water users
Acmert Consulting and Contracting compiled the Geohydrological Investigation for Kruger
Mpumalanga International Airport, Mpumalanga Province report for the WUL application. This
report can be found in Appendix B. The investigation concluded that the calculated recharge of
417 036 m³/year in the area is sufficient as KMI Airport and the MQP Farming project requires
about 182 840 m³/year.
Based on the risk analysis included in the Geohydrological Investigation for Kruger Mpumalanga
International Airport, Mpumalanga Province; it is evident that the wastewater treatment and
disposal system employed by KMI Airport has a minimal impact on surrounding water resources
and users. The risks are further mitigated though the frequent maintenance of the oxidation ponds
and testing of effluent that is discharged into the environment as outlined in the KMI Airport
Maintenance Manual.
Section 27 (g) The class and the resource quality objectives of the water resource
KMI Airport falls under catchment X22H that is managed by the IUCMA. According to Classes of
Water Resources and Resource Quality Objectives for the Catchments of the Inkomati GN 1616
(GN 1616), catchment X22H is located in a Class II Integrated Unit of Analysis (IUA); i.e. X2-8. This
class indicates moderate protection and moderate utilisation.
Catchment X22H falls within Groundwater Unit GU 2-4 as indicated in Table 19 of GN 1616. Table
19 of GN 1616 summarises the resource quality objectives for GU 2-4.

Water Use Licence Application
Date: 2020/05/15 Revision Number: 00
CIVIL INF_WS_03_REPORTS_03-WUL Application Report Rev 00.docx Page 22 of 35
Section 27 (h) Investments already made and to be made by the water user in respect of the
water use in question
Since its establishment on the 21st of October 2002, KMI Airport has:
Drilled four (4) boreholes for the supply of potable and firewater, and two (2) boreholes for
the supply of irrigation water;
Constructed five (5) oxidation ponds in series for the disposal and treatment of sewage
generated by the airport; and
Installed an irrigation system for the release of treated effluent from the oxidation ponds into
the environment.
Section 27 (i) The strategic importance of the water use to be authorised
The authorisation of the KMI Airport water use will ensure the continued operation of
Mpumalanga province’s only international port of entry as well as secure the livelihood of the
surrounding community.
Section 27 (j) The quality of water in the water resource which may be required for the Reserve
and for meeting international obligations
The development has not resulted in the degradation of the water resource according to the
report; Geohydrological Investigation for Kruger Mpumalanga International Airport, Mpumalanga
Province compiled by Acmert Consulting and Contracting. This report can be found in Appendix B.
Water quality tests are undertaken monthly to ensure the potable water quality and the treated
effluent quality is within the limits stipulated in SANS 241-1, 2015 and the GN 665 respectively.
Section 27 (k) The probable duration of any undertaking for which a water use is to be
authorised
KMI Airport and its MQP Farming project are expected to continue operating for more than 100
years.
4.4 Types of water use authorisations
4.4.1 Schedule 1
Schedule 1 authorisation allows for the abstraction of water in limited quantities that do not pose
a risk to the resource, typically domestic use. Schedule 1 uses do not require registration.
This authorisation does not apply to the boreholes established by PAM given the high annual
water abstraction rates.
4.4.2 Existing Lawful Use
An Existing Lawful Use refers to a water use that commenced two years prior to the enactment of
the NWA in 1998. Such a water use does not require licencing or registration unless instructed to
do so by a water authority.

Water Use Licence Application
Date: 2020/05/15 Revision Number: 00
CIVIL INF_WS_03_REPORTS_03-WUL Application Report Rev 00.docx Page 23 of 35
This authorisation does not apply to the boreholes established by PAM as they were drilled after
1998.
4.4.3 General Authorisations
General Authorisations are applicable to water uses that fall within specific parameters. The
parameters specific to the abstraction of groundwater as detailed in the NWA GN 538 include:
Water may not be abstracted within 500 m of a wetland or 100 m of a delineated riparian
edge;
No more than 40 000 m³ of water may be abstracted per year on a property; and
The volume of water abstracted from a groundwater resource for use on a single property is
limited to the quantities set out in Table 2: Groundwater Abstraction Rates of NWA GN 538,
based on the size of the property or piece of land on which the water is taken.
According to Table 2: Groundwater Abstraction Rates of the NWA GN 538, properties located in
quaternaries X22H and X24B are permitted to abstract up to 45 m³/ha of ground water a year.
As discussed in Section 2.2, the KMI Airport and MQP Farming project have been established on a
±364 ha property. Therefore, the maximum allowable water abstraction rate is 16 393.5 m³/year.
The records for the past three years, 2017-2019, indicate that on average 43 420 m³ of water is
abstracted from the boreholes per year for the airport.
Based on the limitation of 16 393.5 m³/year set by the General Authorisations, the groundwater
abstraction rates required for the KMI Airport and the MQP farming project preclude the PAM
boreholes from General Authorisations.
4.4.4 Water Use Licence
For a water use that falls outside of the two categories discussed above, authorisation for the
water use may be granted through the submission of an application for a Water Use Licence
(WUL). The steps and timelines for the processing of a WUL application are summarised in Table
4-1.

Water Use Licence Application
Date: 2020/05/15 Revision Number: 00
CIVIL INF_WS_03_REPORTS_03-WUL Application Report Rev 00.docx Page 24 of 35
Table 4-1: Water Use Licence Application procedure
Stage Requirements Duration Cumulative duration
Pre-application
Complete DW758 form
11 days 0 days Copy of title deed
Proof of licence application fee (R114,00 - to be confirmed)
Pre-application meeting 30 days 41 days
Site inspection
Application initiation
Complete DW758, DW760, DW784, DW901, DW902 form
115 days 156 days
Copy of company registration certificate
Copy of title deed
Copy of property zoning certificate
A Topographic map of 1:50 000 /Aerial Photo of 1:10 000 indicating map name, number and property boundaries including subdivisions. Existing and proposed abstraction and discharge points, irrigation fields, boreholes must also be indicated.
Section 27 of NWA motivation
Record of Decision from DEA
B-BBEE certificate
Specialists/technical reports, e.g.:
-Water Quality Management report
-Geohydrological report
-Water and waste management plan
-Environmental Impact Assessment report
-Public participation correspondence
Processing and finalising
Assessment of technical report by DWS 139 days 295 days
Decision by DWS Acceptance / refusal of application by DWS 5 days 300 days
Implementation Issuing licence and conditions of licence
It is worth noting that during the 2020 State of the Nation Address the president of the Republic
of South Africa mentioned that the WUL Application process would be streamlined from 300 days
to 90 days.
PAM was issued with a water use certificate on the 1st of September 2002. The certificate is based
on the KMI Airport property size of about 350 ha and an annual water abstraction volume of
24 455 m³. A copy of the current water use certificate can be found in Appendix A.
As discussed in Section 2.3, the expected annual water demand for the airport alone is 182 840
m³. Furthermore, the current borehole potential yield is .raey a ³m 616 552 tuoba
PAM has to apply for a WUL in order to be compliant with the requirements of the NWA.

Water Use Licence Application
Date: 2020/05/15 Revision Number: 00
CIVIL INF_WS_03_REPORTS_03-WUL Application Report Rev 00.docx Page 25 of 35
5 WATER USE LICENCE APPLICATION METHODOLOGY
5.1 Pre-application Consultation
A pre-application consultation meeting was held with the relevant officials of the IUCMA on the
14th of February 2020.
The pre-application consultation meeting was held to:
Determine the need to authorise the water use;
Determine the applicable water use authorisation type;
To obtain guidance from IUCMA in relation to the application process to be followed; and
To obtain relevant documentation required for the application process.
5.2 Information and Technical Report Collation
Relevant information, in accordance with guidance from the IUCMA provided at the pre-
application meeting held, was sourced from specialists commissioned as part of the WULA. The
information was collated, analysed and relevant sections included in this report as well as the
various WUL application forms required in support of the Water Use License Application.
5.3 Public Participation Process
The public participation processes (PPP) commenced during May 2020 and will continue for a
period of 60 days. The application has been advertised in a local newspaper, namely Lowvelder,
on the 22nd of May 2020. Site Notices have been placed within the vicinity and along the boundary
of the site on the 22nd of May 2020. Written notification was given to the following authorities and
interest groups have also been notified on the 22nd of May 2020:
Department of Water and Sanitation (DWS);
IUCMA;
White River irrigation Board;
Ehlanzeni District Municipality;
City of Mbombela; and
Neighbouring farmers/ businesses.
5.4 Concerns Raised by Interested and Affected Persons
No Comments have been received to date. All comments received will be consolidated, responded
to and submitted to the IUCMA for review after the completion of the 60 day comment period.
A detailed list of comments and responses will be supplied to IUCMA upon completion of the
comment period.
Please refer to Appendix D for Public Participation, including comments received, distribution of
Notification and the interested and affected persons (I&AP) register.
Water Use Licence Application
Date: 2020/05/15 Revision Number: 00
CIVIL INF_WS_03_REPORTS_03-WUL Application Report Rev 00.docx Page 26 of 35
5.5 Submission of the Water Use Licence Application
Upon completion of the Report, all the required License Application forms, the signed final
documentation and all the required appendices will be submitted to IUCMA inclusive of the
confirmation of the paid application fee.

Water Use Licence Application
Date: 2020/05/15 Revision Number: 00
CIVIL INF_WS_03_REPORTS_03-WUL Application Report Rev 00.docx Page 27 of 35
6 CONCLUSION AND RECOMMENDATION
The WULA for the KMI Airport and MQP Farming project six (6) boreholes and oxidation ponds
takes into consideration all DWS and IUCMA requirements. All supporting information has been
included as appendices within the document.
PAM is committed to implementing all recommended mitigation measures as applicable identified
during the risk assessment.
It is recommended that the WUL be granted to permit the abovementioned water uses contained
in the WULA forms. Furthermore, the mitigation measures contained in the specialist studies as
appended in Appendix B be implemented and adhered to.

Water Use Licence Application
Date: 2020/05/15 Revision Number: 00
CIVIL INF_WS_03_REPORTS_03-WUL Application Report Rev 00.docx Page 28 of 35
APPENDIX A WATER USE LICENCES AND GENERAL
AUTHORISATIONS


Water Use Licence Application
Date: 2020/05/15 Revision Number: 00
CIVIL INF_WS_03_REPORTS_03-WUL Application Report Rev 00.docx Page 29 of 35
APPENDIX B GEOHYDROLOGICAL REPORT

i
GEOHYDROLOGICAL INVESTIGATION FOR KRUGER MPUMALANGA INTERNATIONAL AIRPORT, MPUMALANGA PROVINCE.
Report no.: 2020-04
CLIENT: PRIMKOP AIRPORT MANAGEMENT (PTY) LTD
Prepared by:
Tel: + 27 (0)73 640 3187
Email: [email protected]
Compiled by: Reviewed by:
MELUSI MASHEGO Pr.Sci.NatBSc (Hons)
Geology Dr EVISON KAPANGAZIWIRI (PhD), Pr. Sci.
Nat., MWISA (Senior Geohydrologist)

ii
Executive Summary
Acmert Consulting and Contracting was appointed by Primkop Airport Management (PAM)
to undertake hydrogeological assessment for the purpose of a water use license at Kruger
Mpumalanga International airport (KMIA), Mpumalanga Province.
This follows the proposed water uses in terms of the National Water Act, 1998 (Act No. 36
of 1998) by the Department of Water and Sanitation. The PAM is on a process of application
for the following water useactivities:
• Section 21(a) – Taking water from a water resource;
• Section 21(e) – Disposing of treated effluent from oxidation ponds by irrigating;
• Section 21(g) – Disposing of waste in a manner which may detrimentally impact on a water
resource.
This report serves to assess in detail the hydrogeological characteristics in the vicinity of the
study area, paying special attention to recharge in the area, abstraction from boreholes,
water quality and guidelines used for waste water discharge for irrigation purposes.
The calculated recharge of 417 036 m3/annum in the area is sufficient because the airport
only requires ±47 000 m³ of water annually to meet its water demand, so there is an
additional 370 036 m3in excess to the volume required by KMIA.
Remedial action is recommended to improve the microbiological parameters with a
filtration and chlorination system to address the excess total coliforms found in analysed
water samples.
Monitoring of surface water to the northeast of oxidation pond is recommended to avoid
contamination by wastewater from the ponds, and ultimate health risks associated with
contamination.

iii
Contents
1. BACKGROUND ..................................................................................................................................... 1
1.1 Introduction .................................................................................................................................. 1
1.2. Objectives..................................................................................................................................... 1
1.3 Information sources ...................................................................................................................... 1
1.4 Site description ............................................................................................................................. 1
1.4 Climate .......................................................................................................................................... 3
1.5 Land use ........................................................................................................................................ 4
1.6 Topography ................................................................................................................................... 4
1.7 Vegetation and major rivers ......................................................................................................... 6
1.8 Regional Geology .......................................................................................................................... 6
1.8.1 Lithology ................................................................................................................................. 6
1.8.2 Structural geology .................................................................................................................. 6
1.9 Regional Hydrogeology ................................................................................................................. 8
1.9.1. Catchment Area .................................................................................................................... 8
1.9.2 Aquifer Classification ............................................................................................................. 8
1.9.3 Basic Model of Groundwater ............................................................................................... 10
1.9.4 Groundwater quantity ......................................................................................................... 13
1.9.5 Groundwater Uses ............................................................................................................... 14
1.9.7 Waste Management system ................................................................................................ 14
2. GROUNDWATER INFRASTRUCTURE AND ABSTRACTION .................................................................. 14
2.1 Borehole yield tests .................................................................................................................... 14
2.1.1 Step Drawdown Test ............................................................................................................ 14
2.1.2 Constant Rate Test ............................................................................................................... 15
2.1.3 Long Term Sustainable Borehole Yield Estimation .............................................................. 15
3. WATER QUALITY ................................................................................................................................ 15
4. RISK ASSESSMENT ............................................................................................................................. 20
4.1 Risk Assessment Criteria ............................................................................................................. 20
5. CONCLUSIONS AND RECOMMENDATIONS ....................................................................................... 24
General remarks and precautions (WRC, 2010) ........................................................................... 26
REFERENCES .......................................................................................................................................... 28
APPENDICES .......................................................................................................................................... 29
Appendix 1: Step test data ................................................................................................................ 29

iv
Appendix 2: Constant test data ........................................................................................................ 41
Appendix 3: Water Quality data ....................................................................................................... 53
List of Figures
Figure 1 Locality of the KMI airport. ....................................................................................................... 2
Figure 2Histogram showing the climate of the study area (Climate-Data.org). ..................................... 3
Figure 3 Mean Annual A-Pan Equivalent Potential Evaporation (Schulze, 2007) ................................... 4
Figure 4 Elevation map covering the study area and surroundings. ...................................................... 5
Figure 5 Regional geological map covering the study area. ................................................................... 7
Figure 6 Graph showing correlation between topography and water levels. ...................................... 12
Figure 7 Flow direction from the oxidation dam. ................................................................................. 12
List of equations
Equation 1 ............................................................................................................................................. 15
Equation 2 ............................................................................................................................................. 21
List of tables
Table 1 Aquifer classification scheme (Parsons, 1995; Parsons and Conrad, 1998) ............................... 8
Table 2 Rating for the aquifer system management and second variable classification (Parson, 1995).
.............................................................................................................................................................. 10
Table 3 Aquifer System Management and Second Variable Classifications. ........................................ 10
Table 4 Hydro census data from Kruger Mpumalanga International Airport Borehole ....................... 11
Table 5 The sustainable yield of the borehole at site ........................................................................... 15
Table 6 Summary of water quality results. ........................................................................................... 17
Table 7 Scaling risk ................................................................................................................................ 20
Table 8 Significant colour code. ............................................................................................................ 22
Table 9 Risk assessment ........................................................................................................................ 23

1
1. BACKGROUND
1.1 Introduction
Acmert Consulting and Contracting was appointed by Primkop Airport Management (PTY) LTD to
conduct a geohydrological assessment for the purpose of a water use license at Kruger Mpumalanga
International airport (KMIA), Mpumalanga Province.
1.2. Objectives
The scope of work for this report includes:
Assessment of the hydrogeological characteristics of the Kruger Mpumalanga International
airport and surrounding areas.
Assessment of the existing infrastructure through hydro census exercise.
Assessment of the aquifer characteristics within the areas.
Identification of the suitable groundwater exploration areas.
Calculation of average yield within the area from existing boreholes.
Estimation the groundwater levels and groundwater flow direction from existing boreholes.
Water quality and risk assessment.
Recommendations for drilling depths, drilling mechanisms and equipping methods.
By default, the following form part of this geohydrological investigation:
Geology of the site.
Potential technical restraining factors.
Mapping of existing boreholes.
Presence and proximity of groundwater.
1.3 Information sources
The following were studied prior to the investigation taking place:
• A 1:250 000 geological map sheet 2530 Barberton.
• National Groundwater Archives.
• Google Earth Satellite Imagery and online published literature with the site information.
• Hydro Census Data & Department of Water & Sanitation.
• Borehole Yield Testing Data & Water Quality.
1.4 Site description
The study area is located on farmKruger Mpumalanga International Airport No. 666-JU in Primkop
Airport Township,about 17 Km northeast of Nelspruit Town, Mpumalanga Province, South Africa.
The site is accessible via R 538 provincial road. The central coordinates of the KMIA are -25.385264°
and 31.098993°. The investigation is to also consider the surroundings of the study area as they may
also be impacted in terms of groundwater susceptibility. Figure 1 shows the location of the KMIA.

GEOHYDROLOGICAL INVESTIGATION FOR KRUGER MPUMALANGA INTERNATIONAL AIRPORT, MPUMALANGA PROVINCE.Report no.: 2020-04
April 2020
2
Figure 1 Locality of the KMI airport.

GEOHYDROLOGICAL INVESTIGATION FOR KRUGER MPUMALANGA INTERNATIONAL AIRPORT, MPUMALANGA PROVINCE.Report no.: 2020-04
April 2020
3
1.4 Climate
KMIA area is characterised by warm and temperate climate. In winter, there is much less rainfall in
than in summer. The climate is considered to bewarm according to the Köppen-Geiger climate
classification. The warmest month of the year is January with an average temperature of 23.6°C,June
has the lowest temperature of the year with an average of14.6°C. The average annual precipitation
is796 mm. the most precipitation falls in January (130 mm) and the driest month is June (11
mm). The average annual A-pan evaporation for Mpumalanga is 1946 mm (Schulze, 2007). Figure 2
& 3 shows graphs of average climate and evaporation, respectively.
Figure 2Histogram showing the climate of the study area (Climate-Data.org).

4
Figure 3 Mean Annual A-Pan Equivalent Potential Evaporation (Schulze, 2007)
1.5 Land use
The study area is surrounded by residential area immediately to the northeast, and farming area
about 1.5 km from the oxidation pond to the south and southwest direction.
1.6 Topography
An extrapolation assessment of the site topography conducted with Google earth sourced elevations
indicates that the site is characterised by undulating topography with gentle to moderate slopes,
with an average gradient of 3.5%. The maximum height points are at about 880 m above mean sea
level and the minimum heights being about 740 m above mean sea level (Figure 4). According to this
topographical map, the borehole positions in the study area would be a combination of high relief
areas (i.e FR and BH 1-4) andlow relief areas(i.e BH5-7 AR and OD) within the selected boundary. The
topography is an important aspect of this report as it may be associated with groundwater flow.

5
Figure 4Elevation map covering the study area and surroundings.

6
1.7 Vegetation and major rivers
According to the 1: 1000 000 SANBI Vegetation map (2018), the site is regionally characterized by
the Sour Lowveld Bushveld vegetation. The major river in proximity to the study area is Crocodile
River which occurs about 16 km east and west of the KMIA.
1.8Regional Geology
1.8.1 Lithology
According to the published 2530Barberton1:250 000 geological series, this site falls withinIntrusive
rocks of the Archean Nelspruit Granite Suite. The main lithology in the study area is white to grey
coarse-grained porphyritic biotite granite (Figure 5).
1.8.2 Structural geology
A series of southeast-northwest trending diabase dykes are mapped as linear intrusions at a regional
scale. Shear zones are also occur to the east and west of the study area. The areas of deformation
occur across the study area creating potential groundwater flow paths.

GEOHYDROLOGICAL INVESTIGATION FOR KRUGER MPUMALANGA INTERNATIONAL AIRPORT, MPUMALANGA PROVINCE.Report no.: 2020-04
April 2020
7
Figure 5Regional geological map covering the study area.
GEOHYDROLOGICAL INVESTIGATION FOR KRUGER MPUMALANGA INTERNATIONAL AIRPORT, MPUMALANGA PROVINCE.Report no.: 2020-04
April 2020
8
1.9Regional Hydrogeology
1.9.1. Catchment Area
The investigation area falls under the Inkomati-Usuthu Water Management Area, in X22H
Quaternary catchment. The hydrogeology of the investigation area is influenced by attributes such
as:
• Geological structures creating preferential flow pathways i.e. along dykes, porous tension
zones,
• Types of soils, thickness of soils, infiltration rates, recharge rates and discharge rates,
• The direction of groundwater flow and the rate of flow,
• The groundwater levels, types of aquifers and the physical properties of the aquifers.
1.9.2 Aquifer Classification
Primary aquifers are not common within the investigation area, but rather the site is characterised
by secondary aquifer features related to fractures, joints, intrusions and weathering. This is a
common feature for crystalline igneous rocks underlying the site.
Rocks and all forms of geological material have the ability to transmit fluids; this property is
recorded as the hydraulic conductivity (K) property of the geological media. Brassington (1998) and
Lekete (2011) have documented the property of several geological materials and their ability to
conduct water. As discussed, the Kruger Mpumalanga International Airport is within granite igneous
rocks of the Nelspruit suite. Thus, based on Brassington (1998), we may expect hydraulic
conductivity in the range of 3x10⁻⁴ – 0.03 m/d.
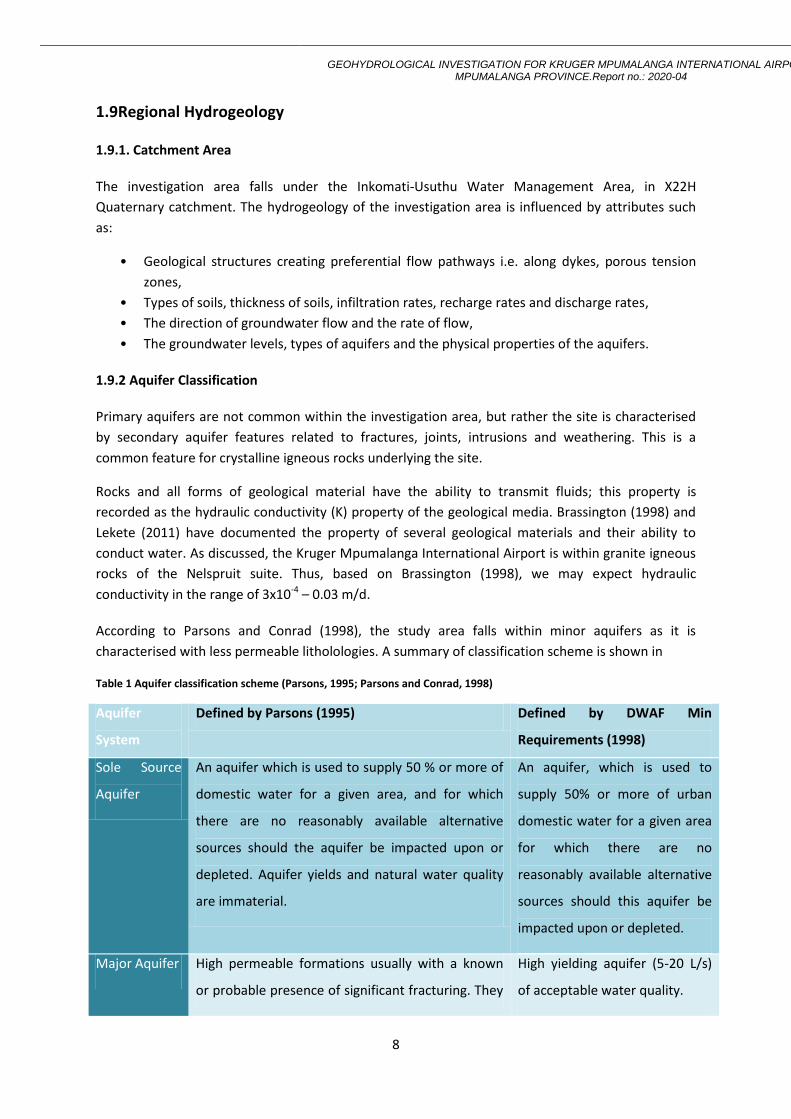
According to Parsons and Conrad (1998), the study area falls within minor aquifers as it is
characterised with less permeable litholologies. A summary of classification scheme is shown in
Table 1 Aquifer classification scheme (Parsons, 1995; Parsons and Conrad, 1998)
Aquifer
System
Defined by Parsons (1995) Defined by DWAF Min
Requirements (1998)
Sole Source
Aquifer
An aquifer which is used to supply 50 % or more of
domestic water for a given area, and for which
there are no reasonably available alternative
sources should the aquifer be impacted upon or
depleted. Aquifer yields and natural water quality
are immaterial.
An aquifer, which is used to
supply 50% or more of urban
domestic water for a given area
for which there are no
reasonably available alternative
sources should this aquifer be
impacted upon or depleted.
Major Aquifer High permeable formations usually with a known
or probable presence of significant fracturing. They
High yielding aquifer (5-20 L/s)
of acceptable water quality.

9
may be highly productive and able to support large
abstractions for public supply and other purposes.
Water quality is generally very good (<150 mS/m).
Minor Aquifer These can be fractured or potentially fractured
rocks, which do not have a high primary
permeability or other formations of variable
permeability. Aquifer extent may be limited and
water quality variable. Although these aquifers
seldom produce large quantities of water, they are
important both for local supplies and in supplying
base flow for rivers.
Moderately yielding aquifer (1-5
L/s) of acceptable quality or
high yielding aquifer (5-20 L/s)
of poor-quality water.
Non-Aquifer These are formations with negligible permeability
that are generally regarded as not containing
groundwater in exploitable quantities. Water
quality may also be such that it renders the aquifer
as unusable. However, groundwater flow through
such rocks, although imperceptible, does take
place, and need to be considered when assessing
the risk associated with persistent pollutants.
Insignificantly yielding aquifer (<
1 L/s) of good quality water or
moderately yielding aquifer (1-5
L/s) of poor quality or aquifer
which will never be utilised for
water supply and which will not
contaminate other aquifers.
SpecialAquifer An aquifer designated as such by the Minister of
Water Affairs, after due process.
An aquifer designated as such
by the Minister of Water Affairs,
after due process.
So in terms of groundwater vulnerability, because of the nature of the basement igneous rocks like
granite, the contaminants will reach the groundwater-table after long periods of time, making such
lithologies less vulnerable aquifers with condition that extensive fracturing / secondary structures
are minimal.
To achieve the Aquifer System Management and Second Variable Classifications, as well as the
Groundwater Quality Management Index, the waiting and rating approach has been adopted for the
area as per South African Aquifer Systems Management Classification (Parson, 1995). Variable
classification considers the three (3) generic classes (High, Medium and Low) as inTable 2; the two
ratings (Aquifer System Management and Aquifer Vulnerability) are then multiplied to yield a
groundwater management decision index.

10
Table 2 Rating for the aquifer system management and second variable classification (Parson, 1995).
Aquifer systems management classification Second variable classification
Class Points Generic Class Points
Sole Source Aquifer System 6 High 3
Major Aquifer System 4 Medium 2
Minor Aquifer System 2 Low 1
Non-Aquifer System 0 n/a n/a
Special Aquifer System 0-6 n/a n/a
Table 3 Aquifer System Management and Second Variable Classifications.
Aquifer Systems Management
Class Points Study area
Sole Source Aquifer System 6
2
Major Aquifer System 4
Minor Aquifer System 2
Non-Aquifer System 0
Special Aquifer System 0-6
Vulnerability Classification (Weathering/ Fracturing)
Class Points Study area
High 3
2 Medium 2
Low 1
1.9.3 Basic Model of Groundwater
The direction of the groundwater flow is determined by the hydraulic head i.e. high hydraulic head
to low hydraulic head. The flow direction also mimics elevation/topography and controlled by
structural boundaries which may be more/less hydraulically conductive. With regards to the site, the
static groundwater levels recorded in Table 4 correlate with elevation as indicated by R2 value close
to 1 (Figure 6). This relationship indicates that topography controls groundwater levels in the study
area and hence ground water divide can be defined as a closed boundary. This is because in areas
where topography controls groundwater levels, groundwater on each side of the divide moves away
from the divide and no flow crosses the divide. Groundwater flow system for the study area is
currently unstressed and the groundwater will flow towards the western direction, following the
surface topography towards the lower laying area.Figure6 has been plotted using once-off

11
groundwater levels data for boreholes in Table 4 obtained from hydro-census investigation.In terms
of groundwater contamination from the point of disposal, the overall flow direction is towards the
northwest direction. According to Figure 7, wastewater flows to surface water sources (including
Primkop River) to the northwest of the oxidation ponds.
Table 4Hydro census data from Kruger Mpumalanga International Airport Borehole
Name X Y Elevation
(masl)
Water level
(mgbl)
water
level
elevations
(masl)
BH:1
AB
31.104396 -25.370623 857 46.69 810.31
BH:2
AB
31.1042940 -25.3708350 858 47.50 810.5
BH:3
AB
31.104478 -25.371553 856 43.74 812.26
BH:4
AB
31.104002 -25.373143 846 32.05 813.95
BH:5
FB
31.1069980 -25.378570 841 2.67 838.33
BH:6
FB
31.106339 -25.377907 837 7.84 829.16
BH:7-
monitoring
borehole
31.09669 -25.38906 830 3.10 826.9

12
Figure 6 Graph showing correlation between topography and water levels.
Figure 7Flow direction from the oxidation dam.
R² = 0.894
0
5
10
15
20
25
30
35
40
45
50
820 830 840 850 860
Bo
reh
ole
leve
l (m
bgl
)
Elevation (masl)
Linear (Regression line)

13
Recharge is the principal vehicle for leaching and transporting solid or liquid contaminants to the
water table (Aller et al., 1987).The annual recharge in the water management area varies from 87 to
119 mm. Considering 119 mm/annum to be the effective recharge at the site and the property size
to be about 11 600 m2. The recharge into the property is calculated as follows:
Recharge into Property = RE x Area
= 0.119 m/a x 3504510 m2
= 417036 m3/a
= 417 036 000 l/a.
The Department of Water and Sanitation (DWS) has categorised abstraction scales as a percentage
of groundwater recharge and grouped them into 3 namely:
• Category A - Small Scale abstraction (<60% of recharge into property).
• Category B – Medium scale abstraction (60–100 % of recharge into property).
• Category C – Large scale abstraction (>100% of recharge into property).
The KMIA requirements for groundwater abstraction falls under a small scale abstraction because
the 47 000 m3/annum the airport requires is about 11% of the calculated recharge the property.
The depth to groundwater table in the region ranges from 3 to 50 m below ground level. The yields
of the boreholes range from 0.1 l/s to 5.6 l/s, indicating uneconomic to moderate groundwater
yields (Du Toit and Sonnekus, 2014).
1.9.4 Groundwater quantity
The usage percentage is calculated against registered groundwater users. Based on DWA (2004) the
formerInkomati Water Management Area had a total of 5.9 million m3/annum registered
groundwater use. This implies that the groundwater in the area and the water management area
was underutilised.
For specifically the site under investigation, groundwater availability will consider:
I. Groundwater Recharge (m/a).
II. Size of the Property of abstraction (m2).
III. Recharge into the property (m3/a).
IV. Existing Groundwater Abstractions & Proposed Abstraction rate.
V. Scale of Abstraction.

14
1.9.5Groundwater Uses
Currently two boreholes namely (BH1-2) supplies KMIA with potable water. However, the yield from
these two boreholes is inadequate. Two additional boreholes have been drilled (BH5 and BH 6) and
will be utilised to supply KMIA with potable water on approval of the WUL.
A chlorination station has been installed to treat the water before it is stored in pressed steel panel
emergency storage tanks. The one 325 m³ tank has the capacity to store four hours’ worth of
firewater while the other 130 m³ tank has the capacity to store twenty-four hours’ worth of potable
water.
From these storage tanks the water is reticulated through the respective potable water and
firewater pipe networks with pumps providing the necessary pressure.
Two boreholes (BH3& BH4) supply the KMIA farming project with irrigation water. The water from
the boreholes is stored in a 250 m³ ground circular steel tank. From the tank, an automated drip
irrigation system distributes irrigation water. A pressurised fertiliser system injects fertiliser into the
water as it is pumped to the fields.
1.9.7Waste Management system
Sewerage generated by KMIA is drained into oxidation ponds where it undergoes aerobic treatment.
The oxidation ponds are located south-west of the airport. The sewerage generated by KMIA enters
the oxidation ponds though a hand rake screen. The waste is retained in the different ponds from
the first to the fifth pond for several days. The treated waste is released from the fifth pond through
a tank and it is pumped and used for irrigation in the patch of land south of the ponds.
2. GROUNDWATER INFRASTRUCTURE AND ABSTRACTION
2.1 Borehole yield tests
The pumping test of the aquifer is conducted to estimate sustainable yield in accordance to the
guidelines by Van Tonder et al. (2001a) and these guidelines include guidelines for:
• Choosing of pump size, possibly with high discharge rate,
• Calibration test,
• Determining length of Constant Rate test
• Measuring of drawdown during the pumping period,
2.1.1 Step Drawdown Test
A Step drawdown test was conducted as a calibration procedure to determine the appropriate
abstraction rate for the constant rate test. A table showing the results of the step drawdown test
can be found in Appendix 1.

15
2.1.2 Constant Rate Test
The constant rate test was conducted to fully stress the aquifer in the borehole at an average
abstraction rate that was determined from the calibration test. Drawdown was measured during the
24-hour pumping test period in intervals using a water level deep meter (See Appendix 2 for the
water levels measured during pumping period). After switching off the pump, groundwater level
recovery was monitored until at least 90% of the initial static groundwater level was reached.
2.1.3 Long Term Sustainable Borehole Yield Estimation
The sustainable yields for boreholes were calculated based on quantifying the effects of no-flow
boundaries as well as the uncertainties in the values of transmissivity, storativity and distances to
the boundaries, using the following general equation:
𝑄 𝑠𝑢𝑠𝑡 = 𝑄
𝑆 ′ × 𝑆
Equation 1
Where 𝑄𝑠ust is sustainable yield, 𝑄 is pumping yield, 𝑠′ is total drawdown and 𝑠 is available
drawdown. The calculated sustainable yield gives an idea of how much water can be abstracted from
an aquifer in a certain period of time. Sustainable yields of boreholes at KMIA are shown in table 2.
Table 5The sustainable yield of the borehole at site
Borehole No Pump Inlet Depth (m)
Sustainable yield Rate (l/s)
Abstraction Schedule (hr)
BH1 60 0.1 18
BH2 78 0.3 18
BH3 100 1.6 18
BH4 63 5.6 18
BH5 125 1.1 18
BH6 105 2.1 18
3. WATER QUALITY
Groundwater samples were extracted from the borehole during the last hour of the borehole yield
testing process. The groundwater was sample into bottles and submitted to a SANAS Certified
Laboratory within a period of 24 hours. A set of samples were taken for the borehole and the
parameters of SANS 241, 2015 potable were assessed. The summary table showing the laboratory
results for six sampled boreholes are shown in Table 6 below, the raw data is found in Appendix 2.

16
Borehole 4 contains amount of coliforms exceeding limits for drinking water in terms of SANS 241-1,
2015. Thus, remedial action is recommended to improve the microbiological parameters with a
filtration and chlorination system to address the excess total coliforms. Monitoring and assessment
in every quarteris recommended to ensure compliance in the future.

GEOHYDROLOGICAL INVESTIGATION FOR KRUGER MPUMALANGA INTERNATIONAL AIRPORT, MPUMALANGA PROVINCE.Report no.: 2020-04
April 2020
17
Table 6 Summary of water quality results.
Parameter Unit Health risk Results Standards and limits
BH6 BH4 BH3 BH7 BH2 BH5 Drinking water
Bottled water
Waste water
Irrigation water
pH @ 37°C pH Units
Operational 7.73 7.17 7.27 7.28 6.81 7.13 5-9.7 5-9.5 5-9.5 6.5-8.4
Conductivity @ 25°C
mS/m Aesthetic 31 12 15 19 15 23 ≤170 70-150 <540
Chloride as Cl mg/l Aesthetic 9.5 5.4 9.8 8.8 11.3 <0.01 ≤300 <700
Nitrate as N¹ mg/l Acute Not requested
Not requested
Not Requested
Not requested
Not requested
Not requested
≤11 10 15
Fluoride as F mg/l Chronic Not requested
Not requested
Not Requested
Not requested
Not requested
Not requested
≤1.5 b 1 15
Colour mg/l Aesthetic Not requested
Not requested
Not Requested
Not requested
Not requested
Not requested
≤15 20
Turbidity mg/l Operational Not requested
Not requested
Not Requested
Not requested
Not requested
Not requested
≤1.0 1
Total dissolved solids
mg/l Aesthetic 222 85 108 104 105 163 ≤1200 −0.5−0.5 −0.5−0.5 −0.5−0.5
Dissolved Aluminium as Al
mg/l Operational <0.05 <0.05 <0.05 <0.05 <0.05 <0.05 ≤0.30 0.15 <20
Dissolved Arsenic as As
mg/l Chronic <0.002 <0.002 <0.002 <0.002 <0.002 0.04 ≤0.01 0.01 0.02 <2.0

18
Dissolved Cadium as Cd
mg/l Chronic <0.0009 <0.0009 <0.0009 <0.0009 <0.0009 <0.0009 ≤0.003 0.003 0.005 <0.05
Dissolved Chromium as Cr
mg/l Chronic <0.003 <0.003 <0.003 <0.003 <0.003 <0.003 ≤0.05 0.05
Dissolved Copper as Cu
mg/l Chronic <0.02 <0.02 <0.02 <0.002 <0.02 <0.02 ≤2.0 0.5 0.01 <5.0
Dissolved Iron as Fe
mg/l Chronic+aesthetic <0.05 <0.05 <0.05 <0.05 <0.05 <0.05 ≤0.3 0.2 0.3 <20
Dissolved Mercury as Hg
mg/l Chronic <0.001 <0.001 <0.001 <0.001 <0.001 <0.001 ≤0.006 0.001 0.05
Dissolved Manganese as Mn
mg/l Chronic+aesthetic 0.04 <0.01 <0.01 <0.01 <0.01 12 ≤0.4 0.5 0.1 <10
mg/l ≤0.1 0.5 0.1 <11
Dissolved Sodium as Na
mg/l Aesthetic 32 19 21 22 16 22 ≤200 90 <460
Dissolved Nickel as Ni
mg/l Chronic 0.01 0.006 0.006 0.005 <0.005 0.006 ≤0.07 0.02 <2.0
Dissolved Lead as Pb
mg/l Chronic ≤0.01 0.01 <2.0
Dissolved Antimony as Sb
mg/l Chronic <0.02 <0.02 <0.02 <0.02 <0.02 <0.02 ≤0.02 0.005
Dissolved Selenium as Se
mg/l Chronic <0.010 <0.01 <0.010 <0.010 <0.010 <0.010 ≤0.04 0.01 0.02 <0.06

19
Dissolved Zinc an Zn
mg/l Aesthetic 0.33 <0.010 <0.010 <0.010 0.118 0.223 ≤5.0 5 0.1 <0.5
Ammonium as N
mg/l Aesthetic Not requested
Not requested
Not requested
Not requested
Not requested
Not requested
≤1.5
Free Chlorine as Cl₂
mg/l Chronic Not requested
Not requested
Not requested
Not requested
Not requested
Not requested
≤5.0 0.25
Free Cyanide as CN
mg/l Acute Not requested
Not requested
Not requested
Not requested
Not requested
Not requested
≤0.2 0.02
Nitrite as NO₂ mg/l Acute Not requested
Not requested
Not requested
Not requested
Not requested
Not requested
≤0.9
Phenols mg/l Not requested
Not requested
Not requested
Not requested
Not requested
Not requested
≤0.01
E.coli or Feacal Coliforms
Cfu/100 ml
<1 <1 <1 <1 <1 <1 Not detected
Not detected
1000 <1000
Total Coliforms
Cfu/100 ml
5 82 4 6 2 8 ≤10 Not detected
Heterotrophic plate count
Cfu/100 ml
Not requested
Not requested
Not requested
Not requested
≤1000 ≤100

GEOHYDROLOGICAL INVESTIGATION FOR KRUGER MPUMALANGA INTERNATIONAL AIRPORT, MPUMALANGA PROVINCE.Report no.: 2020-04
April 2020
20
4. RISK ASSESSMENT
4.1 Risk Assessment Criteria
This section contains a summary and a motivation of the potential interactions and impacts which
may be associated with the project activities. For the purpose of this study, risk assessment will
focus on disposal of wastewater in a manner which may detrimentally impact on a water resource.
The identified potential impacts are summarised as follows:
Deterioration of water quality.
Pollution.
The impacts were rated and ranked based on the system as described below:
Magnitude: is a measure of the degree of change in a measurement or analysis (e.g., the area of
pasture, or the concentration of a metal in water compared to the water quality guideline value
for the metal), and was classified as none/negligible, low, moderate or high. The categorization
of the impact magnitude may be based on a set of criteria (e.g. health risk levels, ecological
concepts and/or professional judgment) pertinent to each of the discipline areas and key
questions analysed. The specialist study must attempt to quantify the magnitude and outline the
rationale used. Appropriate, widely recognized standards were to be used as a measure of the
level of impact.
Scale/Geographic extent refers to the area that could be affected by the impact and was
classified as site, local, regional, national, or international.
Duration: refers to the length of time over which an environmental impact may occur: i.e.
transient (less than 1 year), short-term (1 to 5 years), medium term (5 to 15 years), long-term
(greater than 15 years with impact ceasing after closure of the project), or permanent.
Probability of occurrence is a description of the probability of the impact occurring as
improbable (less than 5% chance), low probability (5% to 40% chance), medium probability (40%
to 60% chance), highly probable (most likely, 60% to 90% chance) or definite (impact will occur).
Table 7 Scaling risk
Status of Impact
The impacts are assessed as either having a:
Negative effect (i.e. at a `cost' to the environment),
Positive effect (i.e. a `benefit' to the environment),
Neutral effect on the environment.
Extent of the impact Duration of the impact

21
(1) Site (site only), 1) Immediate (<1 year),
(2) Local (site boundary and immediate surrounds), (2) Short term (1-5 years),
(3) Regional, (3) Medium term (5-15 years),
(4) National, (4) Long term (ceases after the operational life
span of the project),
(5) International. (5) Permanent.
Magnitude of the Impact Probability of Occurrence
(0) None, The likelihood of the impact actually occurring is
indicated as either:
(2) Minor, (0) None (the impact will not occur),
(4) Low, (1) Improbable (probability very low due to design
or experience),
(6) Moderate (environmental functions altered but
continue),
(2) Low probability (unlikely to occur),
(8) High (environmental functions temporarily
cease),
(3) Medium probability (distinct probability that
the impact will occur),
(10) Very high / unsure (environmental functions
permanently cease.
(4) High probability (most likely to occur),
(5) Definite.
Significance of the Impact
Based on the information contained in the points above, the potential impacts are assigned a
significance rating (S). This rating is formulated by adding the sum of the numbers assigned to extent
(E), duration (D) and magnitude (M) and multiplying this sum by the probability (P) of the impact.
𝑆 = (𝐸 + 𝐷 + 𝑀) × 𝑃
Equation 2
The significance ratings are given below
(<30) low (i.e. where this impact would not have a direct influence on the decision to develop in the
area),
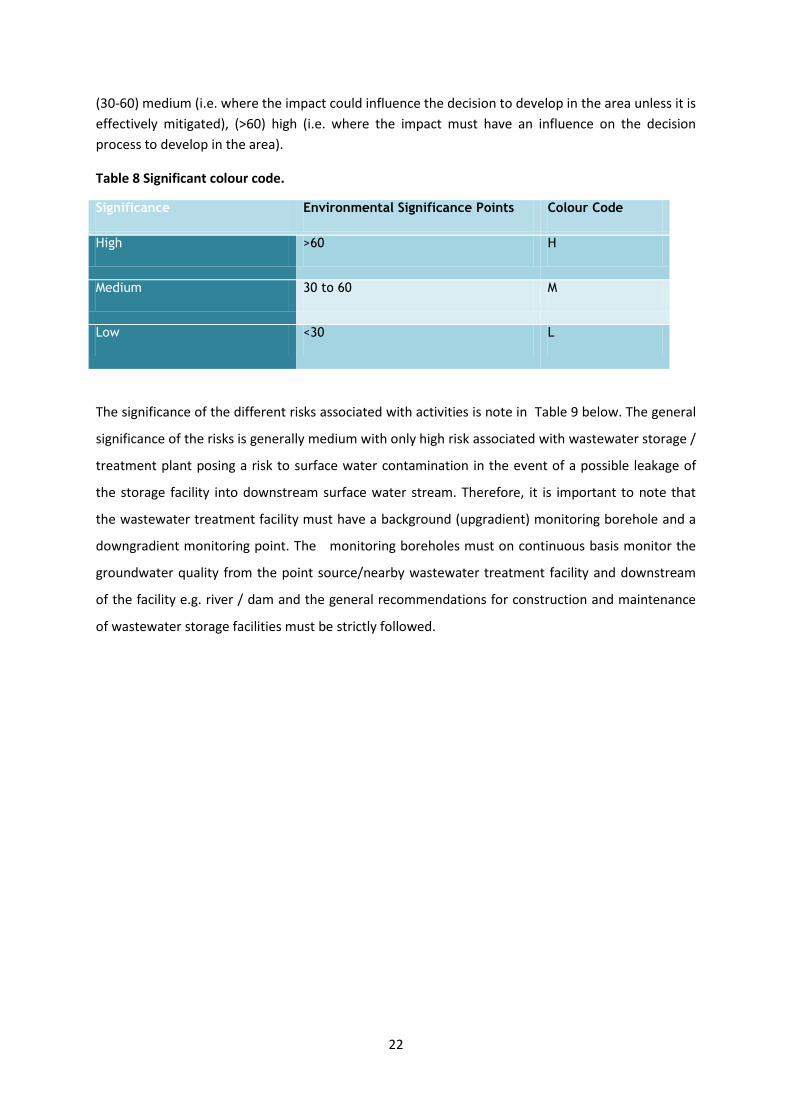
22
(30-60) medium (i.e. where the impact could influence the decision to develop in the area unless it is
effectively mitigated), (>60) high (i.e. where the impact must have an influence on the decision
process to develop in the area).
Table 8 Significant colour code.
Significance Environmental Significance Points Colour Code
High >60 H
Medium 30 to 60 M
Low <30 L
The significance of the different risks associated with activities is note in Table 9 below. The general
significance of the risks is generally medium with only high risk associated with wastewater storage /
treatment plant posing a risk to surface water contamination in the event of a possible leakage of
the storage facility into downstream surface water stream. Therefore, it is important to note that
the wastewater treatment facility must have a background (upgradient) monitoring borehole and a
downgradient monitoring point. The monitoring boreholes must on continuous basis monitor the
groundwater quality from the point source/nearby wastewater treatment facility and downstream
of the facility e.g. river / dam and the general recommendations for construction and maintenance
of wastewater storage facilities must be strictly followed.

GEOHYDROLOGICAL INVESTIGATION FOR KRUGER MPUMALANGA INTERNATIONAL AIRPORT, MPUMALANGA PROVINCE.Report no.: 2020-04
April 2020
23
Table 9 Risk assessment
POTENTIAL ENVIRONMENTAL IMPACT
ACTIVITY AREA APPLICABLE
CORRECTIVE MEASURE
ENVIRONMENTAL SIGNIFICANCE BEFORE MITIGATION
RECOMMENDED MITIGATION MEASURES
Nature Extent Duration Magnitude Probability SIGNIFICANCE
OPERATIONAL
Deterioration of water quality
All activities at the KMI airport
Leakage from the ponds may occur
Yes Negative 2 4 8 4 56 Maintenance of oxidation ponds Fencing of area around the pond and limited access to the pond system
Pollution Air
Odour released from the ponds
Yes Negative 2 4 4 3 30
Use of long distance circulators Routine odour monitoring Oxidation pond maintenance
Water Surface and ground water sources receiving contaminated water
yes Negative 2 5 8 4 60
Constant monitoring of water quality
Environmental risk Addition of contaminants causing decrease in crop yield
Farming areas using treated waste water
Yes Negative 2 3 6 3 33
Constant monitoring of water and crop quality
Health Risk Increase in crop yields and nutrients
Farming areas using treated waste water
Yes Positive 2 4 6 3 36
Pathogens associated with waste water
Farming areas using treated waste water
Yes Negative 3 4 8 2 30 Constant monitoring of water and crop quality

GEOHYDROLOGICAL INVESTIGATION FOR KRUGER MPUMALANGA INTERNATIONAL AIRPORT, MPUMALANGA PROVINCE.Report no.: 2020-04
April 2020
24
5. CONCLUSIONS AND RECOMMENDATIONS
The volume of recharge in the area is more than what the airport requires for its annual use.
However, the calculated recharge figures are for the whole catchment area. The values may
slightly change for the study area due to different structural geology characteristics.
Water quality should be monitored to eliminate health related risks. It is recommended that
another monitoring borehole is drilled downgradient from the oxidation dam in the northwest
direction as per groundwater flow and topographic gradient to capture possible contamination
in the event of a spillage or a malfunctioning or excessive leakage of the oxidation pond. Surface
water should also be sampled and analysed for quality to monitor contamination by wastewater
flowing from the oxidation dam.
The overall water quality from analysed boreholes is suitable for irrigation use. However,
attention must be paid to the guidelines below (Table 7) set for discharge of treated wastewater
from a pond system for irrigation.
Guide for re-use and discharge of treated wastewater from a pond system for irrigation (WRC 2010)
Guidelines for the utilisation of treated effluents for irrigation
Irrigation of: Oxidation pond system
Vegetables and crops consumed raw by man Lawns at swimming pools, nursery schools, children’s playgrounds
Not Permissible
Crops for human consumption which are not eaten raw (vegetables, fruit, sugarcane) Cultivation of cut flowers
Any type of irrigation permissible on its merits Effective draining and drying before harvesting is essential
Grazing for cattle excluding milk producing animals
Any type of irrigation permissible but not during grazing Grazing only permissible after effective draining and drying – no pools Not permissible as drinking water for animals
Crops not for grazing, but utilised as dry Fodder Crop cultivated for seed purposes only tree plantations Nurseries – cut flowers any park or sports field only during Development and before opening thereof
Any type of irrigation permissible
Sports fields where contact is often made with Only flood irrigation permissible sprinkler

25
the surface, e.g. rugby fields, athletics tracks, etc. School grounds Public parks – special children’s playgrounds excluded
irrigation not permissible No over-irrigation and no pool forming
The use of guidelines to identify potential impacts associated with oxidation ponds is essential to
eliminate leaching of contaminants to groundwater resources (see Table 7).
Summary of the checklist for identification of potential impacts associated with oxidation ponds (WRC, 2010)
Design
Are the ponds lined/fully covered?
What kind of lining is used?
Is the anaerobic pond depth as per the recommended depth of 3m?
Is the oxidation pond/s depth as per the recommended depth of 1m-1.5m?
Do you know the size of the ponds (volume)?
What is the size/volume of the ponds (please specify units)?
What population size is served by the pond system?
Is the pond system appropriately sized for this population?
Is the population served lower, middle or upper class?
Is there a flow meter at the inlet?
Is the flow meter at the inlet functional?
Is there space available for future upgrades/expansion?
Are there any fluctuations in input load (e.g. seasonal variations)?
Are the fluctuations frequent?
Any further comments?
Maintenance
Do the ponds appear to be well maintained (grass cut, screenings removed, ponds not
blocked/overflowing)?
Is there a responsible person assigned to cut grass/weeds around the ponds?
Are screenings regularly removed?
Are the screenings discarded appropriately?
Are there prescribed maintenance procedures for process controllers?
Is there algal growth or slime layer removal from the ponds?
Have the ponds ever been desludged?
How frequently are ponds desludged
Is any mechanical equipment used for performance enhancement (e.g. aerators)?
Is the mechanical equipment in good working condition?
Any further comments?
Operation and Performance
Do you measure the influent flow?
What is the effluent type treated by the ponds system?
Do the ponds receive water contaminated with farm chemicals (pesticides, herbicides, etc)?
Do the ponds receive abattoir waste?
Is there any odour release on-site (i.e. the site smells poor)?
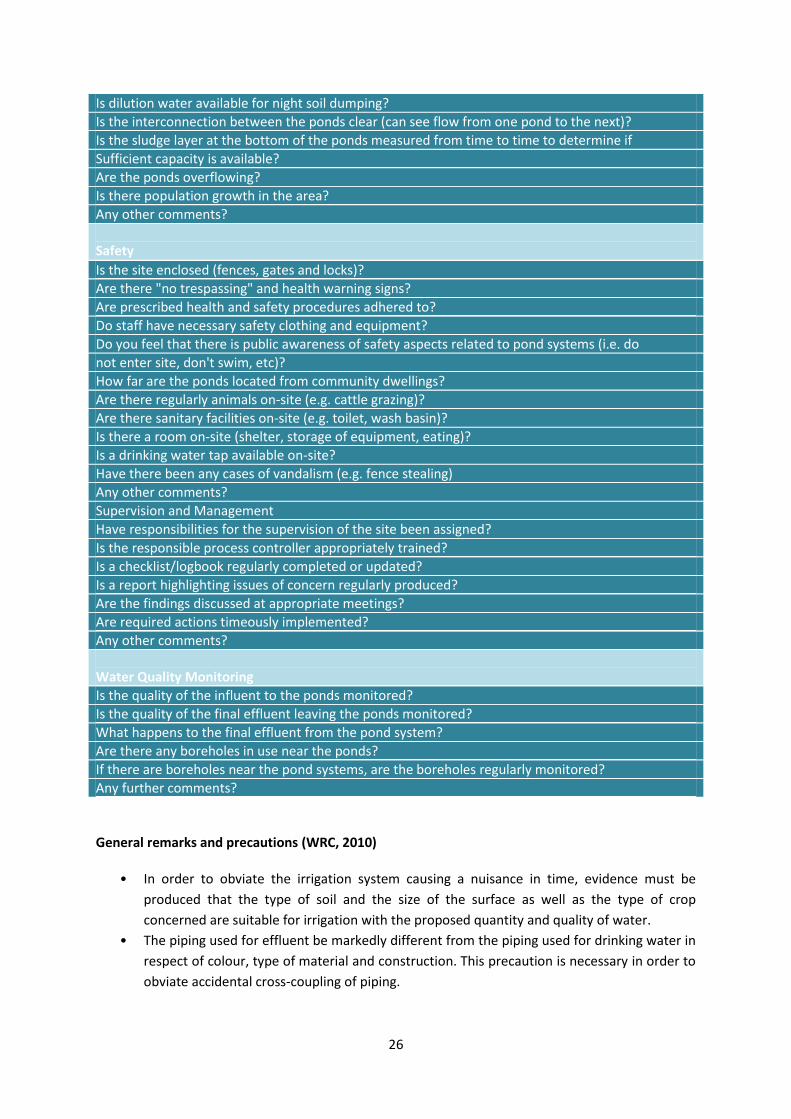
26
Is dilution water available for night soil dumping?
Is the interconnection between the ponds clear (can see flow from one pond to the next)?
Is the sludge layer at the bottom of the ponds measured from time to time to determine if
Sufficient capacity is available?
Are the ponds overflowing?
Is there population growth in the area?
Any other comments?
Safety
Is the site enclosed (fences, gates and locks)?
Are there "no trespassing" and health warning signs?
Are prescribed health and safety procedures adhered to?
Do staff have necessary safety clothing and equipment?
Do you feel that there is public awareness of safety aspects related to pond systems (i.e. do
not enter site, don't swim, etc)?
How far are the ponds located from community dwellings?
Are there regularly animals on-site (e.g. cattle grazing)?
Are there sanitary facilities on-site (e.g. toilet, wash basin)?
Is there a room on-site (shelter, storage of equipment, eating)?
Is a drinking water tap available on-site?
Have there been any cases of vandalism (e.g. fence stealing)
Any other comments?
Supervision and Management
Have responsibilities for the supervision of the site been assigned?
Is the responsible process controller appropriately trained?
Is a checklist/logbook regularly completed or updated?
Is a report highlighting issues of concern regularly produced?
Are the findings discussed at appropriate meetings?
Are required actions timeously implemented?
Any other comments?
Water Quality Monitoring
Is the quality of the influent to the ponds monitored?
Is the quality of the final effluent leaving the ponds monitored?
What happens to the final effluent from the pond system?
Are there any boreholes in use near the ponds?
If there are boreholes near the pond systems, are the boreholes regularly monitored?
Any further comments?
General remarks and precautions (WRC, 2010)
• In order to obviate the irrigation system causing a nuisance in time, evidence must be
produced that the type of soil and the size of the surface as well as the type of crop
concerned are suitable for irrigation with the proposed quantity and quality of water.
• The piping used for effluent be markedly different from the piping used for drinking water in
respect of colour, type of material and construction. This precaution is necessary in order to
obviate accidental cross-coupling of piping.

27
• In order to prevent persons from unwittingly drinking effluent water or washing with it, the
taps, valves and sprayers of the irrigation system must be so designed that only authorised
persons can open them or bring them into operation.
• Every water point where uninformed persons could possibly drink effluent water must be
provided with a notice in clearly legible English, Afrikaans and any other appropriate official
languages, indicating that it is potentially dangerous to drink the water.
• The expression ‘after effective draining and drying” in the above-mentioned table means
that the particular act may take place only when no pools or drops of effluent are evident in
the irrigation area concerned.
• All possible precautions should be taken to ensure that no surface or underground water is
contaminated by the irrigation water, especially where the latter does not comply with the
general standard. Excessive irrigation must therefore be avoided and the irrigation area
protected against storm water by means of suitable contours and screening walls.
• Sprinkler irrigation shall be permitted only if no spray is blown over to areas where, such
irrigation is forbidden. In this connection the quality of the effluent, the use of such
adjoining area and its distance from the irrigation area must be taken into consideration
before sprinkler irrigation is permitted.

28
REFERENCES
Aller, L., Lehr, J.H., Petty, R. 1987. DRASTIC: A standardized system for evaluating ground water
pollution potential using hydrogeologic settings: NWWA/EPA Series, EPA-600/2-87-035.
De Souza, P. and Jack, U. (2010). Guide for management of waste stabilisation pond systems in South
Africa. Water Research Commission, Pretoria, RSA. Report NO. TT 471/10. Pp 1-63.
Parsons, R. and Conrad, J. (1998). Exploratory notes for the aquifer classification map of South
Africa, Water Research Commission Report No. KV 116/98.
Schulze, R.E. and Maharaj, M. 2007. A-Pan Equivalent Reference Potential Evaporation. In: Schulze,
R.E. (Ed). 2007. South African Atlas of Climatology and Agrohydrology. Water Research Commission,
Pretoria, RSA, WRC Report 1489/1/06, Section 13.2.

GEOHYDROLOGICAL INVESTIGATION FOR KRUGER MPUMALANGA INTERNATIONAL AIRPORT, MPUMALANGA PROVINCE.Report no.: 2020-04
April 2020
29
APPENDICES
Appendix 1: Step test data
STEPPED DISCHARGE TEST AND RECOVERY
BOREHOLE NO. : BH:1 STATIC WATER LEVEL (mbdl): 46.69 DEPTH OF PUMP (mbdl): 63.00
DISCHARGE RATE 1 Time Recovery
1 DISCHARGE RATE 2 Time Recovery
2 DISCHARGE RATE 3 Time Recovery
3
DATE: 18-Mar-20 (min) (m) DATE: 18-Mar-20 (min) (m) DATE: (min) (m)
TIME: 11H15 0 50.71 TIME: 12H15 0 TIME:
0 62.76
Time Drawdown Yield 1 Time Drawdown Yield 1 Time Drawdown Yield 1 57.53
(min) (m) (l/s) 2 (min) (m) (l/s) 2 (min) (m) (l/s) 2 54.27
0 47.23 0.44 3 0 50.71 0.90 3 0 3 52.45
1 48.35 0.44 5 1 52.94 0.90 5 1 5 51.14
2 49.49
0.44 7 2 53.87 0.90 7 2 7 49.57
3 49.66 0.44 10 3 55.46 0.90 10 3 10 48.69
5 49.75 0.44 15 5 57.13 0.90 15 5 15 48.03
7 49.84 0.44 20 7 58.75 0.90 20 7 20 47.81
10 49.97 0.44 30 10 59.38 0.90 30 9 30 47.65
15 50.08 0.44 40 15 62.76 0.90 40 15 40 47.54
20 50.13 0.44 50 20 50 20 50 47.43
30 50.26 0.44 60 30 60 30 60 47.31
40 50.37 0.44 70 40 70 35 70 47.23
50 50.60 0.44 80 50 80 50 80
60 50.71 0.44 90 60 90 60 90
70 100 70
100 70 100
80 110 80
110 80 110
90 120 90 120 90 120
100 150 100 150 100 150
110 180 110 180 110 180
120 210 120 210 120 210
Average yield (l/s): 0.44 240 Average yield: 0.90 240 Average yield:
240
DISCHARGE RATE 4 Time Recovery
4 DISCHARGE RATE 5 Time Recovery
5 DISCHARGE RATE 6 Time Recovery

30
DATE: 20-Mar-20 (min) (m) DATE: (min) (m) DATE: (min) (m)
TIME: 16H30 0 0.00 TIME:
0 0.00 TIME:
0
Time Drawdown Yield 1 Time Drawdown Yield 1 Time Drawdown Yield 1
(min) (m) (l/s) 2 (min) (m) (l/s) 2 (min) (m) (l/s) 2
0 3 0 3 0 0.00 3
1 5 1 5 1 5
2 7 2 7 2 7
3 10 3 10 3 10
4 15 5 15 5 15
5 20 7 20 7 20
10 30 10 30 10 30
15 40 15 40 15 40
20 50 20 50 20 50
30 60 30 60 30 60
40 70 40 70 40 70
50 80 50 80 50 80
60 90 60 90 60 90
70 100 70 100 70 100
80 110 80 110 80 110
90 120 90 120 90 120
100 150 100 150 100 150
110 180 110 180 110 180
120 210 120 210 120 210
150 240 150 240 150 240
180 300 180 300 180 300
210 360 210 360 210 360
240 420 240 420 240 420
300 480 300 480 300 480
360 540 360 540 360 540
420 600 420 600 420 600
480 660 480 660 480 660
Average yield:
720 Average yield:
720 Average yield:
720

31
STEPPED DISCHARGE TEST AND RECOVERY
BOREHOLE NO. : BH:2 STATIC WATER LEVEL (mbdl): 47.50 DEPTH OF PUMP (mbdl): 70.00
DISCHARGE RATE 1 Time Recovery
1 DISCHARGE RATE 2 Time Recovery
2 DISCHARGE RATE 3 Time Recovery
3
DATE: 16-Mar-20 (min) (m) DATE: 16-Mar-20 (min) (m) DATE: 16-Mar-20 (min) (m)
TIME: 12H00 0 50.60 TIME: 13H00 0 TIME:
14H00 0 69.05
Time Drawdown Yield 1 Time Drawdown Yield 1 Time Drawdown Yield 1 63.04
(min) (m) (l/s) 2 (min) (m) (l/s) 2 (min) (m) (l/s) 2 58.95
0 48.20 0.32 3 0 50.60 0.96 3 0 63.12 1.82 3 55.45
1 48.70 0.32 5 1 51.52 0.96 5 1 65.50 1.82 5 52.40
2 49.01
0.32 7 2 52.45 0.96 7 2 68.47 1.82 7 51.19
3 49.12 0.32 10 3 53.58 0.96 10 3 69.05 1.82 10 50.32
5 49.24 0.32 15 5 54.01 0.96 15 5 15 49.53
7 49.35 0.32 20 7 54.52 0.96 20 7 20 49.23
10 49.47 0.32 30 10 55.48 0.96 30 9 30 48.82
15 49.54 0.32 40 15 56.75 0.96 40 15 40 48.71
20 49.67 0.32 50 20 57.22 0.96 50 20 50 48.61
30 49.72 0.32 60 30 59.55 0.96 60 30 60 48.50
40 49.88 0.32 70 40 60.79 0.96 70 35 70
50 50.07 0.32 80 50 61.64 0.96 80 50 80
60 50.60 0.32 90 60 63.12 0.96 90 60 90
70 100 70
100 70 100
80 110 80
110 80 110
90 120 90 120 90 120
100 150 100 150 100 150
110 180 110 180 110 180
120 210 120 210 120 210
Average yield (l/s): 0.32 240 Average yield: 0.96 240 Average yield: 1.82 240
DISCHARGE RATE 4 Time Recovery
4 DISCHARGE RATE 5 Time Recovery
5 DISCHARGE RATE 6 Time Recovery
DATE: (min) (m) DATE: (min) (m) DATE: (min) (m)
TIME:
0 0.00 TIME:
0 0.00 TIME:
0
Time Drawdown Yield 1 Time Drawdown Yield 1 Time Drawdown Yield 1
(min) (m) (l/s) 2 (min) (m) (l/s) 2 (min) (m) (l/s) 2

32
0 3 0 3 0 0.00 3
1 5 1 5 1 5
2 7 2 7 2 7
3 10 3 10 3 10
4 15 5 15 5 15
5 20 7 20 7 20
10 30 10 30 10 30
15 40 15 40 15 40
20 50 20 50 20 50
30 60 30 60 30 60
40 70 40 70 40 70
50 80 50 80 50 80
60 90 60 90 60 90
70 100 70 100 70 100
80 110 80 110 80 110
90 120 90 120 90 120
100 150 100 150 100 150
110 180 110 180 110 180
120 210 120 210 120 210
150 240 150 240 150 240
180 300 180 300 180 300
210 360 210 360 210 360
240 420 240 420 240 420
300 480 300 480 300 480
360 540 360 540 360 540
420 600 420 600 420 600
480 660 480 660 480 660
Average yield:
720 Average yield:
720 Average yield:
720

33
STEPPED DISCHARGE TEST AND RECOVERY
BOREHOLE NO. : BH:3 STATIC WATER LEVEL (mbdl): 43.74 DEPTH OF PUMP (mbdl): 94.00
DISCHARGE RATE 1 Time Recovery
1 DISCHARGE RATE 2 Time Recovery
2 DISCHARGE RATE 3 Time Recovery
3
DATE: 20-Mar-20 (min) (m) DATE: 20-Mar-20 (min) (m) DATE: 20-Mar-20 (min) (m)
TIME: 13H30 0 44.86 TIME: 14H30 0 TIME:
15H30 0 93.26
Time Drawdown Yield 1 Time Drawdown Yield 1 Time Drawdown Yield 1 84.39
(min) (m) (l/s) 2 (min) (m) (l/s) 2 (min) (m) (l/s) 2 75.48
0 43.92 0.37 3 0 44.86 0.94 3 0 47.15 2.52 3 63.63
1 44.24 0.37 5 1 45.55 0.94 5 1 48.65 2.52 5 54.24
2 44.25
0.37 7 2 45.73 0.94 7 2 49.57 2.52 7 50.92
3 44.27 0.37 10 3 45.90 0.94 10 3 50.13 2.52 10 50.13
5 44.28 0.37 15 5 46.05 0.94 15 5 51.01 2.52 15 49.10
7 44.29 0.37 20 7 46.15 0.94 20 7 51.53 2.52 20 46.40
10 44.31 0.37 30 10 46.34 0.94 30 9 52.65 2.52 30 46.11
15 44.38 0.37 40 15 46.46 0.94 40 15 53.95 2.52 40 45.78
20 44.47 0.37 50 20 46.58 0.94 50 20 54.44 2.52 50 45.25
30 44.60 0.37 60 30 46.77 0.94 60 30 56.76 2.52 60 44.88
40 44.71 0.37 70 40 46.94 0.94 70 35 58.20 2.52 70 44.56
50 44.78 0.37 80 50 47.09 0.94 80 50 60.21 2.52 80 44.22
60 44.86 0.37 90 60 47.15 0.94 90 60 62.51 2.52 90 43.95
70 100 70
100 70 100
80 110 80
110 80 110
90 120 90 120 90 120
100 150 100 150 100 150
110 180 110 180 110 180
120 210 120 210 120 210
Average yield (l/s): 0.37 240 Average yield: 0.94 240 Average yield: 2.52 240
DISCHARGE RATE 4 Time Recovery
4 DISCHARGE RATE 5 Time Recovery
5 DISCHARGE RATE 6 Time Recovery
DATE: 20-Mar-20 (min) (m) DATE: (min) (m) DATE: (min) (m)
TIME: 16H30 0 93.26 TIME:
0 0.00 TIME:
0
Time Drawdown Yield 1 Time Drawdown Yield 1 Time Drawdown Yield 1
(min) (m) (l/s) 2 (min) (m) (l/s) 2 (min) (m) (l/s) 2
0 62.51 4.03 3 0 3 0 0.00 3
1 64.92 4.03 5 1 5 1 5

34
2 69.63 4.03 7 2 7 2 7
3 74.45 4.03 10 3 10 3 10
4 77.09 4.03 15 5 15 5 15
5 85.21 4.03 20 7 20 7 20
10 93.26 4.03 30 10 30 10 30
15 40 15 40 15 40
20 50 20 50 20 50
30 60 30 60 30 60
40 70 40 70 40 70
50 80 50 80 50 80
60 90 60 90 60 90
70 100 70 100 70 100
80 110 80 110 80 110
90 120 90 120 90 120
100 150 100 150 100 150
110 180 110 180 110 180
120 210 120 210 120 210
150 240 150 240 150 240
180 300 180 300 180 300
210 360 210 360 210 360
240 420 240 420 240 420
300 480 300 480 300 480
360 540 360 540 360 540
420 600 420 600 420 600
480 660 480 660 480 660
Average yield: 4.03 720 Average yield:
720 Average yield:
720

35
STEPPED DISCHARGE TEST AND RECOVERY
BOREHOLE NO. : BH:4 STATIC WATER LEVEL (mbdl): 32.05 DEPTH OF PUMP (mbdl): 65.00
DISCHARGE RATE 1 Time Recovery
1 DISCHARGE RATE 2 Time Recovery
2 DISCHARGE RATE 3 Time Recovery
3
DATE: 23-Mar-20 (min) (m) DATE: 23-Mar-20 (min) (m) DATE: 23-Mar-20 (min) (m)
TIME: 11H00 0 33.18 TIME: 12H00 0 TIME:
13H00 0 40.27
Time Drawdown Yield 1 Time Drawdown Yield 1 Time Drawdown Yield 1 40.10
(min) (m) (l/s) 2 (min) (m) (l/s) 2 (min) (m) (l/s) 2 40.02
0 32.60 0.42 3 0 33.18 0.93 3 0 34.03 2.09 3 39.87
1 32.84 0.42 5 1 33.25 0.93 5 1 34.11 2.09 5 39.63
2 32.86
0.42 7 2 33.31 0.93 7 2 34.27 2.09 7 39.38
3 32.87 0.42 10 3 33.39 0.93 10 3 34.52 2.09 10 39.01
5 32.89 0.42 15 5 33.52 0.93 15 5 34.65 2.09 15 38.40
7 32.91 0.42 20 7 33.60 0.93 20 7 34.74 2.09 20 37.88
10 32.94 0.42 30 10 33.71 0.93 30 9 34.82 2.09 30 36.60
15 33.01 0.42 40 15 33.75 0.93 40 15 34.88 2.09 40 35.41
20 33.05 0.42 50 20 33.80 0.93 50 20 34.94 2.09 50 34.23
30 33.09 0.42 60 30 33.86 0.93 60 30 35.06 2.09 60 32.90
40 33.12 0.42 70 40 33.91 0.93 70 35 35.11 2.09 70
50 33.15 0.42 80 50 33.96 0.93 80 50 35.15 2.09 80
60 33.18 0.42 90 60 34.03 0.93 90 60 35.19 2.09 90
70 100 70
100 70 100
80 110 80
110 80 110
90 120 90 120 90 120
100 150 100 150 100 150
110 180 110 180 110 180
120 210 120 210 120 210
Average yield (l/s): 0.42 240 Average yield: 0.93 240 Average yield: 2.09 240
DISCHARGE RATE 4 Time Recovery
4 DISCHARGE RATE 5 Time Recovery
5 DISCHARGE RATE 6 Time Recovery
DATE: 23-Mar-20 (min) (m) DATE: 23-Mar-20 (min) (m) DATE: (min) (m)
TIME: 14H00 0 38.27 TIME: 15H00 0 40.27 TIME:
0
Time Drawdown Yield 1 Time Drawdown Yield 1 Time Drawdown Yield 1
(min) (m) (l/s) 2 (min) (m) (l/s) 2 (min) (m) (l/s) 2
0 35.19 4.5 3 0 38.27 8.00 3 0 40.27 3
1 35.72 4.5 5 1 38.32 8.00 5 1 5

36
2 36.22 4.5 7 2 38.36 8.00 7 2 7
3 36.89 4.5 10 3 38.41 8.00 10 3 10
4 37.23 4.5 15 5 38.49 8.00 15 5 15
5 37.44 4.5 20 7 38.59 8.00 20 7 20
10 37.68 4.5 30 10 38.73 8.00 30 10 30
15 37.77 4.5 40 15 38.95 8.00 40 15 40
20 37.95 4.5 50 20 39.16 8.00 50 20 50
30 38.18 4.5 60 30 39.45 8.00 60 30 60
40 38.22 4.5 70 40 39.77 8.00 70 40 70
50 38.24 4.5 80 50 39.98 8.00 80 50 80
60 38.27 4.5 90 60 40.27 8.00 90 60 90
70 100 70 100 70 100
80 110 80 110 80 110
90 120 90 120 90 120
100 150 100 150 100 150
110 180 110 180 110 180
120 210 120 210 120 210
150 240 150 240 150 240
180 300 180 300 180 300
210 360 210 360 210 360
240 420 240 420 240 420
300 480 300 480 300 480
360 540 360 540 360 540
420 600 420 600 420 600
480 660 480 660 480 660
Average yield: 4.50 720 Average yield:
720 Average yield:
720

37
STEPPED DISCHARGE TEST AND RECOVERY
BOREHOLE NO. : BH:5 STATIC WATER LEVEL (mbdl): 2.67 DEPTH OF PUMP (mbdl): 111.00
DISCHARGE RATE 1 Time Recovery
1 DISCHARGE RATE 2 Time Recovery
2 DISCHARGE RATE 3 Time Recovery
3
DATE: 13-Mar-20 (min) (m) DATE: 13-Mar-20 (min) (m) DATE: 13-Mar-20 (min) (m)
TIME: 14H00 0 11.11 TIME: 15H00 0 TIME: 16H00 0 110.53
Time Drawdown Yield 1 Time Drawdown Yield 1 Time Drawdown Yield 1 100.49
(min) (m) (l/s) 2 (min) (m) (l/s) 2 (min) (m) (l/s) 2 92.75
0 3.02 0.56 3 0 11.11 1.05 3 0 47.33 2.89 3 73.50
1 4.10 0.56 5 1 12.53 1.05 5 1 55.82 2.89 5 62.19
2 4.60
0.56 7 2 14.01 1.05 7 2 59.71 2.89 7 53.45
3 5.18 0.56 10 3 15.33 1.05 10 3 67.49 2.89 10 45.22
5 6.02 0.56 15 5 17.72 1.05 15 5 78.24 2.89 15 39.18
7 6.75 0.56 20 7 19.40 1.05 20 7 88.99 2.89 20 32.20
10 7.57 0.56 30 10 21.45 1.05 30 9 105.18 2.89 30 27.31
15 8.52 0.56 40 15 25.34 1.05 40 15 110.53 2.89 40 24.18
20 9.16 0.56 50 20 29.42 50 20 50 20.82
30 9.78 0.56 60 30 36.32 60 30 60 17.45
40 10.37 0.56 70 40 41.27 70 35 70 15.19
50 10.77 0.56 80 50 45.03 80 50 80 13.23
60 11.11 0.56 90 60 47.33 90 60 90 10.18
70 100 70
100 70 100 8.60
80 110 80
110 80 110 7.45
90 120 90 120 90 120 6.57
100 150 100 150 100 150 5.72
110 180 110 180 110 180 4.81
120 210 120 210 120 210 3.48
Average yield (l/s): 0.56 240 Average yield: 1.05 240 Average yield: 2.89 240
DISCHARGE RATE 4 Time Recovery
4 DISCHARGE RATE 5 Time Recovery
5 DISCHARGE RATE 6 Time Recovery
DATE: (min) (m) DATE: (min) (m) DATE: (min) (m)
TIME:
0 TIME:
0 0.00 TIME:
0
Time Drawdown Yield 1 Time Drawdown Yield 1 Time Drawdown Yield 1
(min) (m) (l/s) 2 (min) (m) (l/s) 2 (min) (m) (l/s) 2
0 3 0 3 0 0.00 3
1 5 1 5 1 5

38
2 7 2 7 2 7
3 10 3 10 3 10
4 15 5 15 5 15
5 20 7 20 7 20
10 30 10 30 10 30
15 40 15 40 15 40
20 50 20 50 20 50
30 60 30 60 30 60
40 70 40 70 40 70
50 80 50 80 50 80
60 90 60 90 60 90
70 100 70 100 70 100
80 110 80 110 80 110
90 120 90 120 90 120
100 150 100 150 100 150
110 180 110 180 110 180
120 210 120 210 120 210
150 240 150 240 150 240
180 300 180 300 180 300
210 360 210 360 210 360
240 420 240 420 240 420
300 480 300 480 300 480
360 540 360 540 360 540
420 600 420 600 420 600
480 660 480 660 480 660
Average yield:
720 Average yield:
720 Average yield:
720

39
STEPPED DISCHARGE TEST AND RECOVERY
BOREHOLE NO. : BH:6 STATIC WATER LEVEL (mbdl): 2.67 DEPTH OF PUMP (mbdl): 111.00
DISCHARGE RATE 1 Time Recovery
1 DISCHARGE RATE 2 Time Recovery
2 DISCHARGE RATE 3 Time Recovery
3
DATE: 09-Mar-20 (min) (m) DATE: 09-Mar-20 (min) (m) DATE: 09-Mar-20 (min) (m)
TIME: 15H30 0 14.94 TIME: 16H30 0 TIME: 17H30 0 109.85
Time Drawdown Yield 1 Time Drawdown Yield 1 Time Drawdown Yield 1 99.12
(min) (m) (l/s) 2 (min) (m) (l/s) 2 (min) (m) (l/s) 2 82.45
0 8.69 0.23 3 0 14.94 0.53 3 0 25.97 1.07 3 71.61
1 9.51 0.23 5 1 15.50 0.53 5 1 26.30 1.07 5 59.29
2 9.89
0.23 7 2 15.87 0.53 7 2 27.63 1.07 7 53.42
3 10.46 0.23 10 3 16.30 0.53 10 3 28.81 1.07 10 48.50
5 10.97 0.23 15 5 17.15 0.53 15 5 30.79 1.07 15 40.00
7 11.50 0.23 20 7 17.84 0.53 20 7 32.37 1.07 20 33.25
10 12.03 0.23 30 10 18.86 0.53 30 9 34.32 1.07 30 28.32
15 12.72 0.23 40 15 20.25 0.53 40 15 35.25 1.07 40 25.44
20 12.98 0.23 50 20 21.54 50 20 38.15 50 23.15
30 13.47 0.23 60 30 22.95 60 30 41.25 60 20.00
40 14.09 0.23 70 40 24.14 70 35 43.62 70 17.42
50 14.56 0.23 80 50 25.01 80 50 45.48 80 13.73
60 14.94 0.23 90 60 25.97 90 60 48.73 90 10.62
70 100 70
100 70 100 9.72
80 110 80
110 80 110 9.05
90 120 90 120 90 120 8.71
100 150 100 150 100 150
110 180 110 180 110 180
120 210 120 210 120 210
Average yield (l/s): 0.23 240 Average yield: 0.53 240 Average yield: 1.07 240
DISCHARGE RATE 4 Time Recovery
4 DISCHARGE RATE 5 Time Recovery
5 DISCHARGE RATE 6 Time Recovery
DATE: 09-Mar-20 (min) (m) DATE: (min) (m) DATE: (min) (m)
TIME: 18H30 0 109.85 TIME:
0 0.00 TIME:
0
Time Drawdown Yield 1 Time Drawdown Yield 1 Time Drawdown Yield 1
(min) (m) (l/s) 2 (min) (m) (l/s) 2 (min) (m) (l/s) 2

40
0 48.73 3.45 3 0 3 0 0.00 3
1 50.35 3.45 5 1 5 1 5
2 54.98 3.45 7 2 7 2 7
3 61.94 3.45 10 3 10 3 10
4 73.64 3.45 15 5 15 5 15
5 80.76 3.45 20 7 20 7 20
10 87.54 3.45 30 10 30 10 30
15 96.70 3.45 40 15 40 15 40
20 109.85 3.45 50 20 50 20 50
30 60 30 60 30 60
40 70 40 70 40 70
50 80 50 80 50 80
60 90 60 90 60 90
70 100 70 100 70 100
80 110 80 110 80 110
90 120 90 120 90 120
100 150 100 150 100 150
110 180 110 180 110 180
120 210 120 210 120 210
150 240 150 240 150 240
180 300 180 300 180 300
210 360 210 360 210 360
240 420 240 420 240 420
300 480 300 480 300 480
360 540 360 540 360 540
420 600 420 600 420 600
480 660 480 660 480 660
Average yield: 3.45 720 Average yield:
720 Average yield:
720

41
Appendix 2: Constant test data
CONSTANT DISCHARGE TEST AND RECOVERY DATA
BOREHOLE NO:
BH:1
OBSERVATION BOREHOLE 1 OBSERVATION BOREHOLE 2
OBSERVATION BOREHOLE 3
PUMP DEPTH (mbdl): 63.00 No. : No. :
No. :
WATER LEVEL (mbdl): 47.23 DATUM LEVEL (magl):
DATUM LEVEL (magl):
DATUM LEVEL (magl):
TEST DATE:
18-Mar-20
CASING DEPTH (mbdl):
CASING DEPTH (mbdl):
CASING DEPTH (mbdl):
STARTED TIME: 14H15
BOREHOLE DEPTH :
BOREHOLE DEPTH :
BOREHOLE DEPTH :
TEST DATE:
19-Mar-20
WATER LEVEL:
WATER LEVEL:
WATER LEVEL:
COMPLETED TIME: 17H15 DISTANCE (m): DISTANCE (m): DISTANCE (m):
TIME - PUMPED (min): 1440 TIME-RECOVERY(min): 840 TOTAL TEST TIME:
840.00 AVERAGE YIELD (l/s): 0.60
Time Drawdown
Yield
Recovery Time
Drawdown
Rec Time
Drawdown Rec Time
Drawdown
Rec
(min) (m) (l/s) (m) (min) (m) (m) (min) (m) (m) (min) (m)
(m)
0 47.23 0.60 57.85 0 0 0.00 0 0.00
1 47.83 0.60 55.75 1 1 1
2 49.49 0.60 53.15 2 2 2
3 49.75 0.60 51.40 3 3 3
5 49.98 0.60 49.35 5 5 5
7 50.33 0.60 48.85 7 7 7
10 51.50 0.60 48.51 10 10 10
15 51.89 0.60 48.40 15 15 15
20 52.25 0.60 48.23 20 20 20
30 52.62 0.60 48.07 30 30 30
40 52.74 0.60 47.85 40 40 40
60 52.85 0.60 47.70 60 60 60

42
90 52.90 0.60 47.57 90 90 90
120 52.96 0.60 47.43 120 120 120
150 53.24 0.60 47.53 150 150 150
180 53.33 0.60 47.27 180 180 180
210 53.45 0.60 210 210 210
240 53.66 0.60 240 240 240
300 53.74 0.60 300 300 300
360 53.92 0.60 360 360 360
420 54.15 0.60 420 420 420
480 54.37 0.60 480 480 480
540 54.52 0.60 540 540 540
600 54.63 0.60 600 600 600
720 54.74 0.60 720 720 720
840 54.81 0.60 840 840 840
960 54.93 0.60 960 960 960
1080 55.01 0.60 1080 1080 1080
1200 55.64 0.60 1200 1200 1200
1320 56.59 0.60 1320 1320 1320
1440 57.85 0.60 1440 1440 1440
1500 1500 1500 1500

43
CONSTANT DISCHARGE TEST AND RECOVERY DATA
BOREHOLE NO:
BH:2
OBSERVATION BOREHOLE 1 OBSERVATION BOREHOLE 2
OBSERVATION BOREHOLE 3
PUMP DEPTH (mbdl): 70.00 No. : No. :
No. :
WATER LEVEL (mbdl): 48.50 DATUM LEVEL (magl):
DATUM LEVEL (magl):
DATUM LEVEL (magl):
TEST DATE:
16-Mar-20
CASING DEPTH (mbdl):
CASING DEPTH (mbdl):
CASING DEPTH (mbdl):
STARTED TIME: 15H15
BOREHOLE DEPTH :
BOREHOLE DEPTH :
BOREHOLE DEPTH :
TEST DATE:
17-Mar-20
WATER LEVEL: WATER LEVEL:
WATER LEVEL:
COMPLETED TIME: 18H15 DISTANCE (m): DISTANCE (m): DISTANCE (m):
TIME - PUMPED (min): 1440 TIME-RECOVERY(min): 840 TOTAL TEST TIME:
840.00 AVERAGE YIELD (l/s):
Time Drawdown
Yield
Recovery Time
Drawdown
Rec Time
Drawdown Rec Time Drawdown
(min) (m) (l/s) (m) (min) (m) (m) (min) (m) (m) (min) (m)
0 48.50 1.00 64.60 0 0 0.00 0 0.00
1 49.55 1.00 60.10 1 1 1
2 50.40 1.00 58.70 2 2 2
3 50.63 1.00 56.13 3 3 3
5 51.52 1.00 53.28 5 5 5
7 52.50 1.00 52.63 7 7 7
10 53.64 1.00 51.93 10 10 10
15 54.51 1.00 51.30 15 15 15
20 55.73 1.00 50.68 20 20 20
30 56.60 1.00 50.05 30 30 30
40 57.45 1.00 49.75 40 40 40
60 58.39 1.00 49.49 60 60 60
90 59.28 1.00 49.03 90 90 90
120 59.76 1.00 48.82 120 120 120

44
150 60.12 1.00 48.71 150 150 150
180 60.39 1.00 48.54 180 180 180
210 60.83 1.00 210 210 210
240 61.48 1.00 240 240 240
300 61.63 1.00 300 300 300
360 61.79 1.00 360 360 360
420 61.90 1.00 420 420 420
480 62.22 1.00 480 480 480
540 62.48 1.00 540 540 540
600 62.69 1.00 600 600 600
720 62.87 1.00 720 720 720
840 63.19 1.00 840 840 840
960 63.49 1.00 960 960 960
1080 63.77 1.00 1080 1080 1080
1200 64.03 1.00 1200 1200 1200
1320 64.28 1.00 1320 1320 1320
1440 64.60 1.00 1440 1440 1440
1500 1500 1500 1500

45
CONSTANT DISCHARGE TEST AND RECOVERY DATA
BOREHOLE NO:
BH:3
OBSERVATION BOREHOLE 1 OBSERVATION BOREHOLE 2
OBSERVATION BOREHOLE 3
PUMP DEPTH (mbdl): 94.00 No. : No. :
No. :
WATER LEVEL (mbdl): 43.95 DATUM LEVEL (magl):
DATUM LEVEL (magl):
DATUM LEVEL (magl):
TEST DATE:
21-Mar-20
CASING DEPTH (mbdl):
CASING DEPTH (mbdl):
CASING DEPTH (mbdl):
STARTED TIME: 05H00
BOREHOLE DEPTH :
BOREHOLE DEPTH :
BOREHOLE DEPTH :
TEST DATE:
22-Mar-20
WATER LEVEL:
WATER LEVEL:
WATER LEVEL:
COMPLETED TIME: 07H00 DISTANCE (m): DISTANCE (m): DISTANCE (m):
TIME - PUMPED (min): 1440 TIME-RECOVERY(min): 840 TOTAL TEST TIME:
840.00
AVERAGE YIELD (l/s): 2.40
Time Drawdown
Yield
Recovery Time
Drawdown
Rec Time
Drawdown Rec
Time
Drawdown
Rec
(min) (m) (l/s) (m) (min) (m) (m) (min) (m) (m)
(min) (m)
(m)
0 43.95 2.40 85.34 0 0 0.00 0 0.00
1 44.43 2.40 75.02 1 1 1
2 44.98 2.40 65.55 2 2 2
3 45.38 2.40 52.90 3 3 3
5 45.84 2.40 51.12 5 5 5
7 46.30 2.40 50.49 7 7 7
10 46.99 2.40 50.01 10 10 10
15 48.16 2.40 49.39 15 15 15
20 49.38 2.40 48.46 20 20 20
30 50.20 2.40 47.72 30 30 30
40 50.72 2.40 46.15 40 40 40
60 51.45 2.40 45.64 60 60 60
90 52.29 2.40 44.51 90 90 90
120 52.07 2.40 43.96 120 120 120

46
150 53.81 2.40 150 150 150
180 54.54 2.40 180 180 180
210 55.27 2.40 210 210 210
240 55.99 2.40 240 240 240
300 57.45 2.40 300 300 300
360 58.91 2.40 360 360 360
420 60.36 2.40 420 420 420
480 61.79 2.40 480 480 480
540 63.24 2.40 540 540 540
600 64.69 2.40 600 600 600
720 67.60 2.40 720 720 720
840 70.51 2.40 840 840 840
960 73.43 2.40 960 960 960
1080 76.35 2.40 1080 1080 1080
1200 79.27 2.40 1200 1200 1200
1320 82.15 2.40 1320 1320 1320
1440 85.34 2.40 1440 1440 1440
1500 1500 1500 1500

47
CONSTANT DISCHARGE TEST AND RECOVERY DATA
BOREHOLE NO:
BH:4
OBSERVATION BOREHOLE 1 OBSERVATION BOREHOLE 2
OBSERVATION BOREHOLE 3
PUMP DEPTH (mbdl): 65.00 No. : No. :
No. :
WATER LEVEL (mbdl): 32.90 DATUM LEVEL (magl):
DATUM LEVEL (magl):
DATUM LEVEL (magl):
TEST DATE:
23-Mar-20
CASING DEPTH (mbdl):
CASING DEPTH (mbdl):
CASING DEPTH (mbdl):
STARTED TIME: 17H00
BOREHOLE DEPTH :
BOREHOLE DEPTH :
BOREHOLE DEPTH :
TEST DATE:
24-Mar-20
WATER LEVEL:
WATER LEVEL:
WATER LEVEL:
COMPLETED TIME: 11H00 DISTANCE (m): DISTANCE (m): DISTANCE (m):
TIME - PUMPED (min): 720 TIME-RECOVERY(min): 840 TOTAL TEST TIME:
840.00
AVERAGE YIELD (l/s): 8.00
Time Drawdown
Yield
Recovery Time
Drawdown
Rec Time
Drawdown Rec
Time
Drawdown
Rec
(min) (m) (l/s) (m) (min) (m) (m) (min) (m) (m)
(min) (m)
(m)
0 32.90 8.00 45.72 0 0 0.00 0 0.00
1 33.05 8.00 45.20 1 1 1
2 33.19 8.00 44.73 2 2 2
3 33.32 8.00 44.22 3 3 3
5 33.61 8.00 43.18 5 5 5
7 33.91 8.00 42.14 7 7 7
10 34.15 8.00 40.61 10 10 10
15 34.32 8.00 40.23 15 15 15
20 34.57 8.00 39.84 20 20 20
30 34.99 8.00 39.05 30 30 30
40 35.42 8.00 38.25 40 40 40
60 35.81 8.00 36.63 60 60 60

48
90 37.50 8.00 34.53 90 90 90
120 37.71 8.00 34.09 120 120 120
150 38.11 8.00 33.65 150 150 150
180 38.52 8.00 32.12 180 180 180
210 38.90 8.00 210 210 210
240 39.31 8.00 240 240 240
300 40.10 8.00 300 300 300
360 40.92 8.00 360 360 360
420 41.71 8.00 420 420 420
480 42.53 8.00 480 480 480
540 43.34 8.00 540 540 540
600 44.10 8.00 600 600 600
720 45.72 8.00 720 720 720
840 840 840 840

49
CONSTANT DISCHARGE TEST AND RECOVERY DATA
BOREHOLE NO:
BH:5
OBSERVATION BOREHOLE 1 OBSERVATION BOREHOLE 2
OBSERVATION BOREHOLE 3
PUMP DEPTH (mbdl): 111.00 No. : No. :
No. :
WATER LEVEL (mbdl): 3.48 DATUM LEVEL (magl):
DATUM LEVEL (magl):
DATUM LEVEL (magl):
TEST DATE:
14-Mar-20
CASING DEPTH (mbdl):
CASING DEPTH (mbdl):
CASING DEPTH (mbdl):
STARTED TIME: 07H30
BOREHOLE DEPTH :
BOREHOLE DEPTH :
BOREHOLE DEPTH :
TEST DATE:
15-Mar-20
WATER LEVEL:
WATER LEVEL:
WATER LEVEL:
COMPLETED TIME: 13H00 DISTANCE (m): DISTANCE (m): DISTANCE (m):
TIME - PUMPED (min): 1440 TIME-RECOVERY(min): 840 TOTAL TEST TIME:
840.00
AVERAGE YIELD (l/s): 0.80
Time Drawdown
Yield
Recovery Time
Drawdown
Rec Time
Drawdown Rec
Time
Drawdown
Rec
(min) (m) (l/s) (m) (min) (m) (m) (min) (m) (m)
(min) (m)
(m)
0 3.48 0.80 85.30 0 0 0.00 0 0.00
1 4.50 0.80 81.13 1 1 1
2 5.61 0.80 76.48 2 2 2
3 6.45 0.80 74.15 3 3 3
5 7.88 0.80 69.50 5 5 5
7 8.81 0.80 65.82 7 7 7
10 9.90 0.80 61.08 10 10 10
15 11.08 0.80 54.10 15 15 15
20 12.44 0.80 46.11 20 20 20
30 13.58 0.80 30.51 30 30 30
40 14.81 0.80 21.14 40 40 40
60 16.78 0.80 17.32 60 60 60
90 19.12 0.80 15.27 90 90 90
120 22.11 0.80 13.59 120 120 120

50
150 24.48 0.80 11.17 150 150 150
180 26.79 0.80 9.80 180 180 180
210 27.70 0.80 7.55 210 210 210
240 29.50 0.80 6.49 240 240 240
300 34.10 0.80 5.05 300 300 300
360 37.04 0.80 4.70 360 360 360
420 39.97 0.80 420 420 420
480 43.49 0.80 480 480 480
540 46.00 0.80 540 540 540
600 48.62 0.80 600 600 600
720 53.84 0.80 720 720 720
840 59.08 0.80 840 840 840
960 64.32 0.80 960 960 960
1080 69.56 0.80 1080 1080 1080
1200 74.81 0.80 1200 1200 1200
1320 80.05 0.80 1320 1320 1320
1440 85.30 0.80 1440 1440 1440
1500 1500 1500 1500

51
CONSTANT DISCHARGE TEST AND RECOVERY DATA
BOREHOLE NO:
BH:6
OBSERVATION BOREHOLE 1 OBSERVATION BOREHOLE 2
OBSERVATION BOREHOLE 3
PUMP DEPTH (mbdl): 110.00 No. : No. :
No. :
WATER LEVEL (mbdl): 8.71 DATUM LEVEL (magl):
DATUM LEVEL (magl):
DATUM LEVEL (magl):
TEST DATE:
10-Mar-20
CASING DEPTH (mbdl):
CASING DEPTH (mbdl):
CASING DEPTH (mbdl):
STARTED TIME: 05H00
BOREHOLE DEPTH :
BOREHOLE DEPTH :
BOREHOLE DEPTH :
TEST DATE:
11-Mar-20
WATER LEVEL:
WATER LEVEL:
WATER LEVEL:
COMPLETED TIME:
DISTANCE (m): DISTANCE (m): DISTANCE (m):
TIME - PUMPED (min): 1440 TIME-RECOVERY(min): 840 TOTAL TEST TIME:
840.00 AVERAGE YIELD (l/s):
Time Drawdown
Yield
Recovery Time
Drawdown
Rec Time
Drawdown Rec Time Drawdown
(min) (m) (l/s) (m) (min) (m) (m) (min) (m) (m) (min) (m)
0 8.71 1.40 75.85. 0 0 0.00 0 0.00
1 13.47 1.40 73.68 1 1 1
2 15.05 1.40 69.67 2 2 2
3 16.62 1.40 66.19 3 3 3
5 18.91 1.40 60.30 5 5 5
7 22.03 1.40 54.99 7 7 7
10 25.54 1.40 49.04 10 10 10
15 30.53 1.40 42.19 15 15 15
20 33.96 1.40 39.95 20 20 20
30 39.38 1.40 35.44 30 30 30
40 42.60 1.40 32.55 40 40 40
60 43.29 1.40 29.37 60 60 60
90 44.34 1.40 27.42 90 90 90
52
120 45.73 1.40 24.61 120 120 120
150 47.46 1.40 21.44 150 150 150
180 48.61 1.40 19.17 180 180 180
210 49.19 1.40 16.25 210 210 210
240 50.48 1.40 13.85 240 240 240
300 52.67 1.40 10.50 300 300 300
360 54.30 1.40 9.74 360 360 360
420 55.49 1.40 8.80 420 420 420
480 56.40 1.40 8.73 480 480 480
540 57.30 1.40 540 540 540
600 58.45 1.40 600 600 600
720 60.06 1.40 720 720 720
840 63.29 1.40 840 840 840
960 65.37 1.40 960 960 960
1080 68.16 1.40 1080 1080 1080
1200 71.54 1.40 1200 1200 1200
1320 73.72 1.40 1320 1320 1320
1440 75.85 1.40 1440 1440 1440
1500 1500 1500 1500

GEOHYDROLOGICAL INVESTIGATION FOR KRUGER MPUMALANGA INTERNATIONAL AIRPORT, MPUMALANGA PROVINCE.Report no.: 2020-04
April 2020
53
Appendix 3: Water Quality data

Samples Received:
Sampling date:
Sampled by:
Report # :
Order #:
Acc # :
Testing Date (ICP):
Sample condition:
Sub-contractor:
C21-00539
Parameter: Unit: Results:
Dissolved Aluminium as Al mg/l <0.05
Dissolved Arsenic as As mg/l <0.002
Dissolved Boron as B mg/l <0.07
Dissolved Barium as Ba mg/l 0.006
Dissolved Calcium as Ca mg/l 7.5
Dissolved Cadmium as Cd mg/l <0.0009
Dissolved Cobalt as Co mg/l <0.003
Dissolved Chromium as Cr mg/l <0.003
Dissolved Copper as Cu mg/l <0.02
Dissolved Iron as Fe mg/l <0.05
Dissolved Mercury as Hg mg/l <0.001
Dissolved Potassium as K mg/l 0.36
Dissolved Magnesium as Mg mg/l 4.0
Dissolved Manganese as Mn mg/l <0.01
Dissolved Molybdenum as Mo mg/l <0.010
Dissolved Sodium as Na mg/l 16
Dissolved Nickel as Ni mg/l <0.005
Dissolved Phosphorous as P mg/l <0.10
Dissolved Sulphur as S mg/l <0.05
Dissolved Antimony as Sb mg/l <0.02
Dissolved Selenium as Se mg/l <0.010
Dissolved Silicon as Si mg/l 23
Dissolved Vanadium as V mg/l <0.01
Dissolved Zinc as Zn mg/l 0.118
Ca Hardness as CaCO3 mg/l 19
Mg Hardness as CaCO3 mg/l 16
Total Hardness as CaCO3 mg/l 35
Sodium Abs. Ratio 1.16
*SANAS Accredited **Not SANAS Accredited
Tests marked “Not SANAS Accredited” in this report are not included in the SANAS Schedule of Accreditation for this laboratory.
Signed at end of report.
This report relates only to the sample/s tested by LABSERVE. Results and advice are subject to correct sampling procedure being followed. Labserve does not accept
responsibility for any matters arising from the further use of these results. This report is confidential and is only intended for the use of the individual or entity to which it is
addressed. This report may not be reproduced, except in full, without the prior written approval of the Technical Manager. Opinions & interpretations are not accredited.
Uncertainty values available on www.labserve.net.
LAB-001*
LAB-001*
LAB-001*
Calculation**
LAB-001*
LAB-001*
ICP-OES**
ICP-OES**
Calculation**
ICP-OES**
LAB-001*
ICP-OES**
LAB-001*
LAB-001*
LAB-001*
LAB-001*
LAB-001*
Page 1 of 3
Calculation**
LAB-001*
LAB-001*
M99-925
2020-03-23
LAB-001*
LAB-001*
LAB-001*
Method Reference
LAB-001*
LAB-001*
LAB-001*
LAB-001*
Norms
Test Report - Water Analysis
Acmert Trading 2020-03-17
P.O. Box 19390 2020-03-17
Drinkin
g
wate
r
Bott
led
wate
r
Irrigation
wate
r
Waste
-
wate
r
Good- Supplied Container/s
None
LAB No.
Your ReferenceK.M.I Airport B/H2;
Time: 10:30
1200 C21-00539
None
For the use of:
Nelspruit Unknown
Calculation**

Samples Received:
Sampling date:
Sampled by:
Report # :
Order #:
Acc # :
Sample condition:
Sub-contractor:
C21-00539
Parameter: Unit: Results:
pH @ 37°C pH units 6.81
Conductivity @ 25°C mS/m 15
Total Alkalinity as CaCO3 mg/l 50
Chloride as Cl mg/l 11.3
Nitrate as N mg/l NR
Ammonium as N mg/l NR
Fluoride as F mg/l NR
Colour mg/l NR
Turbidity mg/l NR
Nitrite as NO2 mg/l NR
Total Dissolved Solids mg/l 105
pHs @ 20°C 8.91
Langelier Index @ 20°C*** -2.10
Alkalinity Hazard mg/l 1.00
Irrigation Class C1-S1
*SANAS Accredited **Not SANAS Accredited
Tests marked “Not SANAS Accredited” in this report are not included in the SANAS Schedule of Accreditation for this laboratory.
Signed at end of report.
This report relates only to the sample/s tested by LABSERVE. Results and advice are subject to correct sampling procedure being followed. Labserve does not accept
responsibility for any matters arising from the further use of these results. This report is confidential and is only intended for the use of the individual or entity to which it is
addressed. This report may not be reproduced, except in full, without the prior written approval of the Technical Manager. Opinions & interpretations are not accredited.
Uncertainty values available on www.labserve.net.
2020-03-17
P.O. Box 19390 2020-03-17
Page 2 of 3
Nelspruit Unknown
2020-03-19
Good- Supplied Container/s
None
LAB No.
Your ReferenceK.M.I Airport B/H2;
Time: 10:30
Bott
led
wate
r
Test Report - Water Analysis
Acmert Trading
Waste
-
wate
r
Irrigation
wate
r
For the use of:
Testing Date (Gallery):
1200 C21-00539
None
M99-925
Drinkin
g
wate
r
Gallery**
Norms
Gallery**
Gallery**
Gallery**
Calculation**
Calculation**
Calculation**
Gallery**
Gallery**
Gallery**
Gallery**
Method Reference
Gallery**
Calculation**
Gallery**

Samples Received:
Sampling date:
Sampled by:
Report # :
Order #:
Acc # :
Testing Date (Micro):
Sample condition:
Sub-contractor:
C21-00539
Parameter: Unit: Results:
Total Coliform cfu/100 ml 2
E. coli cfu/100 ml <1
Total Coliform cfu/100 ml NR
E. coli cfu/100 ml NR
Heterotrophic plate count cfu/ml NR
Faecal Coliforms cfu/100ml NR
*SANAS Accredited **Not SANAS Accredited
**** SANAS Accedited when reported in conjunction with Total coliforms.
Tests marked “Not SANAS Accredited” in this report are not included in the SANAS Schedule of Accreditation for this laboratory.
Date:
This report relates only to the sample/s tested by LABSERVE. Results and advice are subject to correct sampling procedure being followed. Labserve does not accept
responsibility for any matters arising from the further use of these results. This report is confidential and is only intended for the use of the individual or entity to which it is
addressed. This report may not be reproduced, except in full, without the prior written approval of the Technical Manager. Opinions & interpretations are not accredited.
Uncertainty values available on www.labserve.net. Page 3 of 3
Good- Supplied Container/s
LAB No.
Your ReferenceK.M.I Airport B/H2;
Time: 10:30
None
M99-925
2020-03-17
Nelspruit Unknown
2020-03-26
Method Reference
Lab-002*
Lab-002* / ****
EC/TC Count Plates**
EC/TC Count Plates**
None
1200 C21-00539
Aerobic Count Plate**
Colilert**
Test Report - Water Analysis
For the use of:
Norms
Acmert Trading
2020-03-17
2020-03-17
P.O. Box 19390
Drinkin
g
wate
r
Bott
led
wate
r
Waste
-
wate
r
Irrigation
wate
r

Additional information:
*Sample counts are in cfu (colony forming units, assumed to be individual bacterial cells), thus <1 is effectively ND (Non Detected).
***The water may form scale in operating systems.
***The water may corrode unprotected metal & concrete surfaces in the system.
Drinking water
Bottled water
Wastewater
Irrigation water
For further information, please visit our website at www.labserve.net. or contact [email protected].
SANS 241-1:2015 Ed. 2
Norms sources:
SANS 1657:2007 Ed.2
Water Act No. 36 of 1998: General limits for
wastewater discharge into a water source.
DWAF Irrigation Water Quality Guidelines
ND = None Detected*
Not Compliant
Not Requested = NR
Compliant / No limit

SANS 241-1:2015
Ed. 2 :
SANS 1657:2007
Ed.2 :
Water Act No. 36 of
1998
SANS 241 /
Drinking WaterBottled Water
Wastewater for
discharge into a
water source.
Upper limit for
Class 4 (Marginal)
Irrigation water
Physical Determinands Unit
pH @ 37°C pH Units 5 to 9.7 5.0 to 9.5 5.0 to 9.5 6.5 to 8.4
Conductivity @ 25°C mS/m ≤ 170 - 70 to 150 ª <540
Total Alkalinity as CaCO₃ mg/l - - - -
Chloride as Cl mg/l ≤ 300 - - <700
Nitrate as N¹ mg/l ≤ 11 10 15 -
Fluoride as F mg/l ≤ 1.5 ᵇ 1.0 15
Colour mg/l ≤15 20 - -
≤ 1.0****
≤ 5.0
Total Dissolved Solids mg/l ≤ 1200 - - -
Langelier Index @ 20°C ² -0.5 to 0.5 -0.5 to 0.5 -0.5 to 0.5 -0.5 to 0.5
Ca Hardness as CaCO₃ mg/l - - - -
Mg Hardness as CaCO₃ mg/l - - - -
Total Hardness as CaCO₃ mg/l - - - -
Dissolved Aluminium as Al mg/l ≤ 0.30 0.15 - < 20
Dissolved Arsenic as As mg/l ≤ 0.01 0.01 0.02 < 2.0
Dissolved Boron as B ² mg/l ≤ 0.30 5.0 1.0 < 15
Dissolved Barium as Ba mg/l - 0.7 - -
Dissolved Calcium as Ca mg/l - - - -
Dissolved Cadium as Cd mg/l ≤ 0.003 0.003 0.005 < 0.05
Dissolved Cobalt as Co mg/l - - - < 5.0
Dissolved Chromium as Cr mg/l ≤ 0.05 0.05 - -
Dissolved Copper as Cu mg/l ≤ 2.0 0.5 0.01 < 5.0
mg/l ≤ 2.0
≤ 0.3
Dissolved Mercury as Hg mg/l ≤ 0.006 0.001 0.005 -
Dissolved Potassium as K mg/l - - - -
Dissolved Magnesium as Mg mg/l - - - -
≤ 0.4
≤ 0.1
Dissolved Molybdenum as Mo ² mg/l < 0.07 0.07 - < 0.05
Dissolved Sodium as Na mg/l ≤ 200 - <90ª < 460
Dissolved Nickel as Ni mg/l ≤ 0.07 0.02 - < 2.0
Dissolved Phosphorous as P ² mg/l ≤ 5.0 - - -
Dissolved Lead as Pb mg/l ≤ 0.01 0.01 0.01 < 2.0
Dissolved Sulpher as S mg/l - - - -
Dissolved Antimony as Sb mg/l ≤ 0.02 0.005 - -
Dissolved Selenium as Se mg/l ≤ 0.04 0.01 0.02 < 0.05
Dissolved Silicon as Si mg/l - - - -
Dissolved Vanadium as V mg/l - - - < 1.0
Dissolved Zinc an Zn mg/l ≤ 5.0 5.0 0.1 < 5.0
Chromium as Cr⁶⁺ mg/l - - 0.05 -
Alkalinity Hazard - - - 1.25 to 2.5
Ammonium as N mg/l ≤1.5 - - -
COD as O₂ ³ mg/l - - 75 -
Free Chlorine as Cl₂ mg/l ≤ 5.0 - 0.25 -
Total Chlorine as Cl₂ mg/l - - - -
Free Cyanide as CN mg/l ≤ 0.2 - 0.02 -
Nitrite as NO₂ ¹ ⁴ mg/l ≤ 0.9 - - -
Nitrogen as N mg/l - - - < 30
Ortho-Phosphate as P mg/l - - 10 -
Oxygen Absorbed - 4 hrs mg/l - - <10 ᶜ -
Phenols mg/l ≤ 0.01 - - -
Soap, Oil and Grease mg/l - - 2.5 -
Sodium Abs. Ratio - - - < 15
E.coli or Feacal Coliforms count/100ml Not detected Not detected 1000 < 1000
Total Coliforms count/100ml ≤ 10 Not detected - -
Heterotrophic plate count count/100ml ≤ 1000 ≤100 - -
1.0 - -
Dissolved Iron as Fe 0.2 0.3 < 20
Dissolved Manganese as Mn mg/l 0.5 0.1 < 10
Compliance Requirements
General / Standard Limit
Turbidity mg/l

Irrigation Class Notes:
planted.
C4-S3 : Very high salinity water. Normally unsuitable for irrigation, can be used in exceptional conditions if soil permeability &
drainage is very good. Sodium is high & could cause sodicity problems on most soils if calcium levels are low. Irrigate with
sufficient water to ensure leaching of salts occurs. Apply gypsum if soil calcium is low. Only salt resistant crops should be
C2-S3 : Medium salinity water with a high Sodium content, this could cause a problem on most soils. Special irrigation practices
are required to facilitate leaching of sodium salts. Soil drainage must be good & gypsum must be added if soil calcium levels are low.
C2-S2 : Medium salinity water suitable for irrigation on most soils & crops provided drainage is good. The sodium content is
also fairly high & this could cause problems on badly drained soils or soils low in available calcium.
must be taken to prevent build-up of soil salinity. The sodium is also high and could cause problems if there is not sufficient
calcium in the soil to ensure Na is leached.
C4-S2 : Very high salinity water - should not normally be used for irrigation except under exceptional conditions. Soil must be
penetrable and well drained and well supplied with calcium. Excess water must be used. Only salt resistant crops should be
planted.
C4-S4 : Very high salinity water - should not normally be used for irrigation except under exceptional conditions. Soil
must be penetrable & well drained. Sodium content is also very high & sodium brak conditions will arise unless soil is very well
drained, if there are sufficient calcium reserves & excess water is applied with each application, leaching of salts will occur. Only
salt resistant crops should be planted.
C1-S1 : Low salinity water suitable for irrigation on most soils without danger of salinity or sodium problems developing.
C2-S1 : Medium salinity water suitable for irrigation on most soils and crops provided drainage is good.
C3-S1 : High salinity water - cannot be used on soils with restricted drainage. Even with good drainage, special precautions
must be taken to prevent build-up of salinity in the soil.
C4-S1 : Very high salinity water not suitable for irrigation under normal conditions. If used, soil drainage must be very good and
excess water must be applied to ensure leaching. Only salt resistant crops can be grown.
C3-S2 : High salinity water - cannot be used on soils with restricted drainage. Even with good drainage, special precautions
Aesthetic - determinand that taints water with respect to taste, odour or colour and that does not pose an unacceptable health risk if present
at concentration values exceeding the numerical limits specified.
**** Values in excess of those given may negatively impact disinfection.
Operational - determinand that is essential for assessing the efficient operation of treatment systems and risks to infrastructure.
¹ This is equivalent to nitrate af 50 mg NO₃⁻/L and nitrite at 3 mg NO₂⁻/L. See annex C of SANS 241-2:2014 for an example of the sum of
Nitrate plus Nitrite ratio; the sum of the ratios of the concentrations of each (as detected in the sample) to its guideline value should not
exceed 1.
² Norm form source other than SANS 241-1:2015 Ed. 2. and SANS 1657:2007 Ed. 2.
³ After removal of algea
⁴ Due to the dynamic nature of nitrite-nitrate conversion in distribution networks and the potential health impact on bottle-fed infants, the
standard is applicable at the point of consumption.
ª Above intake
ᵇ Bottled water that contains fluoride >1 mg/L, shall have the expression "contains fluoride" affixed in close proximity to the name of the water
or in a prominent place on the label. Bottled water that contains fluoride >1.5 mg/L shall have the expression "this product is not suitable for
infants or children under the age of 7 years" in close proximity to the name or in a prominent place on the label.
ᶜ Norm from Government Notice No. R991
Acute Health - determinand that poses an immediate unacceptable health risk if present at concentration values exceeding the numerical
limits specified in this part of SANS 241.
Chronic Health - determinand that poses an unacceptable health risk if ingested over an extended period if present at concentration values
exceeding the numerical limits specified in this part of SANS 241.

Samples Received:
Sampling date:
Sampled by:
Report # :
Order #:
Acc # :
Testing Date (ICP):
Sample condition:
Sub-contractor:
C21-00583
Parameter: Unit: Results:
Dissolved Aluminium as Al mg/l <0.05
Dissolved Arsenic as As mg/l <0.002
Dissolved Boron as B mg/l <0.07
Dissolved Barium as Ba mg/l 0.011
Dissolved Calcium as Ca mg/l 8.5
Dissolved Cadmium as Cd mg/l <0.0009
Dissolved Cobalt as Co mg/l <0.003
Dissolved Chromium as Cr mg/l <0.003
Dissolved Copper as Cu mg/l <0.02
Dissolved Iron as Fe mg/l <0.05
Dissolved Mercury as Hg mg/l <0.001
Dissolved Potassium as K mg/l 0.43
Dissolved Magnesium as Mg mg/l 3.6
Dissolved Manganese as Mn mg/l <0.01
Dissolved Molybdenum as Mo mg/l <0.010
Dissolved Sodium as Na mg/l 21
Dissolved Nickel as Ni mg/l 0.006
Dissolved Phosphorous as P mg/l <0.10
Dissolved Sulphur as S mg/l <0.05
Dissolved Antimony as Sb mg/l <0.02
Dissolved Selenium as Se mg/l <0.010
Dissolved Silicon as Si mg/l 26
Dissolved Vanadium as V mg/l <0.01
Dissolved Zinc as Zn mg/l <0.010
Ca Hardness as CaCO3 mg/l 21
Mg Hardness as CaCO3 mg/l 15
Total Hardness as CaCO3 mg/l 36
Sodium Abs. Ratio 1.56
*SANAS Accredited **Not SANAS Accredited
Tests marked “Not SANAS Accredited” in this report are not included in the SANAS Schedule of Accreditation for this laboratory.
Signed at end of report.
This report relates only to the sample/s tested by LABSERVE. Results and advice are subject to correct sampling procedure being followed. Labserve does not accept
responsibility for any matters arising from the further use of these results. This report is confidential and is only intended for the use of the individual or entity to which it is
addressed. This report may not be reproduced, except in full, without the prior written approval of the Technical Manager. Opinions & interpretations are not accredited.
Uncertainty values available on www.labserve.net.
Calculation**
Test Report - Water Analysis
Acmert Trading 2020-03-19
P.O. Box 19390 2020-03-19
Drinkin
g
wate
r
Bott
led
wate
r
Irrigation
wate
r
Waste
-
wate
r
Good- Supplied Container/s
None
LAB No.
Your Reference K.M.I Airport BH3
1200 C21-00583
None
For the use of:
Nelspruit Unknown
M99-925
2020-03-23
LAB-001*
LAB-001*
LAB-001*
Method Reference
LAB-001*
LAB-001*
LAB-001*
LAB-001*
Norms
ICP-OES**
LAB-001*
ICP-OES**
LAB-001*
LAB-001*
LAB-001*
LAB-001*
LAB-001*
Page 1 of 3
Calculation**
LAB-001*
LAB-001*
LAB-001*
LAB-001*
LAB-001*
Calculation**
LAB-001*
LAB-001*
ICP-OES**
ICP-OES**
Calculation**

Samples Received:
Sampling date:
Sampled by:
Report # :
Order #:
Acc # :
Sample condition:
Sub-contractor:
C21-00583
Parameter: Unit: Results:
pH @ 37°C pH units 7.27
Conductivity @ 25°C mS/m 15
Total Alkalinity as CaCO3 mg/l 34
Chloride as Cl mg/l 9.8
Nitrate as N mg/l NR
Ammonium as N mg/l NR
Fluoride as F mg/l NR
Colour mg/l NR
Turbidity mg/l NR
Nitrite as NO2 mg/l NR
Total Dissolved Solids mg/l 108
pHs @ 20°C 9.04
Langelier Index @ 20°C*** -1.77
Alkalinity Hazard mg/l 0.68
Irrigation Class C1-S1
*SANAS Accredited **Not SANAS Accredited
Tests marked “Not SANAS Accredited” in this report are not included in the SANAS Schedule of Accreditation for this laboratory.
Signed at end of report.
This report relates only to the sample/s tested by LABSERVE. Results and advice are subject to correct sampling procedure being followed. Labserve does not accept
responsibility for any matters arising from the further use of these results. This report is confidential and is only intended for the use of the individual or entity to which it is
addressed. This report may not be reproduced, except in full, without the prior written approval of the Technical Manager. Opinions & interpretations are not accredited.
Uncertainty values available on www.labserve.net.
M99-925
Drinkin
g
wate
r
Gallery**
Norms
Gallery**
Gallery**
Gallery**
Calculation**
Calculation**
Calculation**
Gallery**
Gallery**
Gallery**
Gallery**
Method Reference
Gallery**
Calculation**
Gallery**
Irrigation
wate
r
For the use of:
Testing Date (Gallery):
1200 C21-00583
None
Test Report - Water Analysis
Acmert Trading
Waste
-
wate
r
2020-03-19
P.O. Box 19390 2020-03-19
Page 2 of 3
Nelspruit Unknown
2020-03-23
Good- Supplied Container/s
None
LAB No.
Your Reference K.M.I Airport BH3
Bott
led
wate
r

Samples Received:
Sampling date:
Sampled by:
Report # :
Order #:
Acc # :
Testing Date (Micro):
Sample condition:
Sub-contractor:
C21-00583
Parameter: Unit: Results:
Total Coliform cfu/100 ml 4
E. coli cfu/100 ml <1
Total Coliform cfu/100 ml NR
E. coli cfu/100 ml NR
Heterotrophic plate count cfu/ml NR
Faecal Coliforms cfu/100ml NR
*SANAS Accredited **Not SANAS Accredited
**** SANAS Accedited when reported in conjunction with Total coliforms.
Tests marked “Not SANAS Accredited” in this report are not included in the SANAS Schedule of Accreditation for this laboratory.
Date:
This report relates only to the sample/s tested by LABSERVE. Results and advice are subject to correct sampling procedure being followed. Labserve does not accept
responsibility for any matters arising from the further use of these results. This report is confidential and is only intended for the use of the individual or entity to which it is
addressed. This report may not be reproduced, except in full, without the prior written approval of the Technical Manager. Opinions & interpretations are not accredited.
Uncertainty values available on www.labserve.net.
2020-03-19
2020-03-19
P.O. Box 19390
Drinkin
g
wate
r
Bott
led
wate
r
Waste
-
wate
r
Irrigation
wate
r
For the use of:
Norms
Acmert Trading
2020-03-19
Nelspruit Unknown
2020-03-26
Method Reference
Lab-002*
Lab-002* / ****
EC/TC Count Plates**
EC/TC Count Plates**
None
1200 C21-00583
Aerobic Count Plate**
Colilert**
Test Report - Water Analysis
Page 3 of 3
Good- Supplied Container/s
LAB No.
Your Reference K.M.I Airport BH3
None
M99-925

Additional information:
*Sample counts are in cfu (colony forming units, assumed to be individual bacterial cells), thus <1 is effectively ND (Non Detected).
***The water may form scale in operating systems.
***The water may corrode unprotected metal & concrete surfaces in the system.
Drinking water
Bottled water
Wastewater
Irrigation water
For further information, please visit our website at www.labserve.net. or contact [email protected].
Not Compliant
Not Requested = NR
Compliant / No limit
ND = None Detected*
SANS 241-1:2015 Ed. 2
Norms sources:
SANS 1657:2007 Ed.2
Water Act No. 36 of 1998: General limits for
wastewater discharge into a water source.
DWAF Irrigation Water Quality Guidelines

SANS 241-1:2015
Ed. 2 :
SANS 1657:2007
Ed.2 :
Water Act No. 36 of
1998
SANS 241 /
Drinking WaterBottled Water
Wastewater for
discharge into a
water source.
Upper limit for
Class 4 (Marginal)
Irrigation water
Physical Determinands Unit
pH @ 37°C pH Units 5 to 9.7 5.0 to 9.5 5.0 to 9.5 6.5 to 8.4
Conductivity @ 25°C mS/m ≤ 170 - 70 to 150 ª <540
Total Alkalinity as CaCO₃ mg/l - - - -
Chloride as Cl mg/l ≤ 300 - - <700
Nitrate as N¹ mg/l ≤ 11 10 15 -
Fluoride as F mg/l ≤ 1.5 ᵇ 1.0 15
Colour mg/l ≤15 20 - -
≤ 1.0****
≤ 5.0
Total Dissolved Solids mg/l ≤ 1200 - - -
Langelier Index @ 20°C ² -0.5 to 0.5 -0.5 to 0.5 -0.5 to 0.5 -0.5 to 0.5
Ca Hardness as CaCO₃ mg/l - - - -
Mg Hardness as CaCO₃ mg/l - - - -
Total Hardness as CaCO₃ mg/l - - - -
Dissolved Aluminium as Al mg/l ≤ 0.30 0.15 - < 20
Dissolved Arsenic as As mg/l ≤ 0.01 0.01 0.02 < 2.0
Dissolved Boron as B ² mg/l ≤ 0.30 5.0 1.0 < 15
Dissolved Barium as Ba mg/l - 0.7 - -
Dissolved Calcium as Ca mg/l - - - -
Dissolved Cadium as Cd mg/l ≤ 0.003 0.003 0.005 < 0.05
Dissolved Cobalt as Co mg/l - - - < 5.0
Dissolved Chromium as Cr mg/l ≤ 0.05 0.05 - -
Dissolved Copper as Cu mg/l ≤ 2.0 0.5 0.01 < 5.0
mg/l ≤ 2.0
≤ 0.3
Dissolved Mercury as Hg mg/l ≤ 0.006 0.001 0.005 -
Dissolved Potassium as K mg/l - - - -
Dissolved Magnesium as Mg mg/l - - - -
≤ 0.4
≤ 0.1
Dissolved Molybdenum as Mo ² mg/l < 0.07 0.07 - < 0.05
Dissolved Sodium as Na mg/l ≤ 200 - <90ª < 460
Dissolved Nickel as Ni mg/l ≤ 0.07 0.02 - < 2.0
Dissolved Phosphorous as P ² mg/l ≤ 5.0 - - -
Dissolved Lead as Pb mg/l ≤ 0.01 0.01 0.01 < 2.0
Dissolved Sulpher as S mg/l - - - -
Dissolved Antimony as Sb mg/l ≤ 0.02 0.005 - -
Dissolved Selenium as Se mg/l ≤ 0.04 0.01 0.02 < 0.05
Dissolved Silicon as Si mg/l - - - -
Dissolved Vanadium as V mg/l - - - < 1.0
Dissolved Zinc an Zn mg/l ≤ 5.0 5.0 0.1 < 5.0
Chromium as Cr⁶⁺ mg/l - - 0.05 -
Alkalinity Hazard - - - 1.25 to 2.5
Ammonium as N mg/l ≤1.5 - - -
COD as O₂ ³ mg/l - - 75 -
Free Chlorine as Cl₂ mg/l ≤ 5.0 - 0.25 -
Total Chlorine as Cl₂ mg/l - - - -
Free Cyanide as CN mg/l ≤ 0.2 - 0.02 -
Nitrite as NO₂ ¹ ⁴ mg/l ≤ 0.9 - - -
Nitrogen as N mg/l - - - < 30
Ortho-Phosphate as P mg/l - - 10 -
Oxygen Absorbed - 4 hrs mg/l - - <10 ᶜ -
Phenols mg/l ≤ 0.01 - - -
Soap, Oil and Grease mg/l - - 2.5 -
Sodium Abs. Ratio - - - < 15
E.coli or Feacal Coliforms count/100ml Not detected Not detected 1000 < 1000
Total Coliforms count/100ml ≤ 10 Not detected - -
Heterotrophic plate count count/100ml ≤ 1000 ≤100 - -
Compliance Requirements
General / Standard Limit
Turbidity mg/l
Dissolved Manganese as Mn mg/l 0.5 0.1 < 10
1.0 - -
Dissolved Iron as Fe 0.2 0.3 < 20

Irrigation Class Notes:
planted.
ª Above intake
ᵇ Bottled water that contains fluoride >1 mg/L, shall have the expression "contains fluoride" affixed in close proximity to the name of the water
or in a prominent place on the label. Bottled water that contains fluoride >1.5 mg/L shall have the expression "this product is not suitable for
infants or children under the age of 7 years" in close proximity to the name or in a prominent place on the label.
ᶜ Norm from Government Notice No. R991
Acute Health - determinand that poses an immediate unacceptable health risk if present at concentration values exceeding the numerical
limits specified in this part of SANS 241.
Chronic Health - determinand that poses an unacceptable health risk if ingested over an extended period if present at concentration values
exceeding the numerical limits specified in this part of SANS 241.
Operational - determinand that is essential for assessing the efficient operation of treatment systems and risks to infrastructure.
¹ This is equivalent to nitrate af 50 mg NO₃⁻/L and nitrite at 3 mg NO₂⁻/L. See annex C of SANS 241-2:2014 for an example of the sum of
Nitrate plus Nitrite ratio; the sum of the ratios of the concentrations of each (as detected in the sample) to its guideline value should not
exceed 1.
² Norm form source other than SANS 241-1:2015 Ed. 2. and SANS 1657:2007 Ed. 2.
³ After removal of algea
⁴ Due to the dynamic nature of nitrite-nitrate conversion in distribution networks and the potential health impact on bottle-fed infants, the
standard is applicable at the point of consumption.
C1-S1 : Low salinity water suitable for irrigation on most soils without danger of salinity or sodium problems developing.
C2-S1 : Medium salinity water suitable for irrigation on most soils and crops provided drainage is good.
C3-S1 : High salinity water - cannot be used on soils with restricted drainage. Even with good drainage, special precautions
must be taken to prevent build-up of salinity in the soil.
C4-S1 : Very high salinity water not suitable for irrigation under normal conditions. If used, soil drainage must be very good and
excess water must be applied to ensure leaching. Only salt resistant crops can be grown.
C3-S2 : High salinity water - cannot be used on soils with restricted drainage. Even with good drainage, special precautions
Aesthetic - determinand that taints water with respect to taste, odour or colour and that does not pose an unacceptable health risk if present
at concentration values exceeding the numerical limits specified.
**** Values in excess of those given may negatively impact disinfection.
C4-S3 : Very high salinity water. Normally unsuitable for irrigation, can be used in exceptional conditions if soil permeability &
drainage is very good. Sodium is high & could cause sodicity problems on most soils if calcium levels are low. Irrigate with
sufficient water to ensure leaching of salts occurs. Apply gypsum if soil calcium is low. Only salt resistant crops should be
C2-S3 : Medium salinity water with a high Sodium content, this could cause a problem on most soils. Special irrigation practices
are required to facilitate leaching of sodium salts. Soil drainage must be good & gypsum must be added if soil calcium levels are low.
C2-S2 : Medium salinity water suitable for irrigation on most soils & crops provided drainage is good. The sodium content is
also fairly high & this could cause problems on badly drained soils or soils low in available calcium.
must be taken to prevent build-up of soil salinity. The sodium is also high and could cause problems if there is not sufficient
calcium in the soil to ensure Na is leached.
C4-S2 : Very high salinity water - should not normally be used for irrigation except under exceptional conditions. Soil must be
penetrable and well drained and well supplied with calcium. Excess water must be used. Only salt resistant crops should be
planted.
C4-S4 : Very high salinity water - should not normally be used for irrigation except under exceptional conditions. Soil
must be penetrable & well drained. Sodium content is also very high & sodium brak conditions will arise unless soil is very well
drained, if there are sufficient calcium reserves & excess water is applied with each application, leaching of salts will occur. Only
salt resistant crops should be planted.

Samples Received:
Sampling date:
Sampled by:
Report # :
Order #:
Acc # :
Testing Date (ICP):
Sample condition:
Sub-contractor:
C21-00584
Parameter: Unit: Results:
Dissolved Aluminium as Al mg/l <0.05
Dissolved Arsenic as As mg/l <0.002
Dissolved Boron as B mg/l <0.07
Dissolved Barium as Ba mg/l 0.028
Dissolved Calcium as Ca mg/l 6.6
Dissolved Cadmium as Cd mg/l <0.0009
Dissolved Cobalt as Co mg/l <0.003
Dissolved Chromium as Cr mg/l <0.003
Dissolved Copper as Cu mg/l <0.02
Dissolved Iron as Fe mg/l <0.05
Dissolved Mercury as Hg mg/l <0.001
Dissolved Potassium as K mg/l 0.95
Dissolved Magnesium as Mg mg/l 2.7
Dissolved Manganese as Mn mg/l <0.01
Dissolved Molybdenum as Mo mg/l <0.010
Dissolved Sodium as Na mg/l 19
Dissolved Nickel as Ni mg/l 0.006
Dissolved Phosphorous as P mg/l 0.17
Dissolved Sulphur as S mg/l <0.05
Dissolved Antimony as Sb mg/l <0.02
Dissolved Selenium as Se mg/l <0.010
Dissolved Silicon as Si mg/l 27
Dissolved Vanadium as V mg/l <0.01
Dissolved Zinc as Zn mg/l <0.010
Ca Hardness as CaCO3 mg/l 16
Mg Hardness as CaCO3 mg/l 11
Total Hardness as CaCO3 mg/l 28
Sodium Abs. Ratio 1.60
*SANAS Accredited **Not SANAS Accredited
Tests marked “Not SANAS Accredited” in this report are not included in the SANAS Schedule of Accreditation for this laboratory.
Signed at end of report.
This report relates only to the sample/s tested by LABSERVE. Results and advice are subject to correct sampling procedure being followed. Labserve does not accept
responsibility for any matters arising from the further use of these results. This report is confidential and is only intended for the use of the individual or entity to which it is
addressed. This report may not be reproduced, except in full, without the prior written approval of the Technical Manager. Opinions & interpretations are not accredited.
Uncertainty values available on www.labserve.net.
Calculation**
Test Report - Water Analysis
Acmert Trading 2020-03-19
P.O. Box 19390 2020-03-19
Drinkin
g
wate
r
Bott
led
wate
r
Irrigation
wate
r
Waste
-
wate
r
Good- Supplied Container/s
None
LAB No.
Your Reference K.M.I Airport BH4
1200 C21-00584
None
For the use of:
Nelspruit Unknown
M99-925
2020-03-23
LAB-001*
LAB-001*
LAB-001*
Method Reference
LAB-001*
LAB-001*
LAB-001*
LAB-001*
Norms
ICP-OES**
LAB-001*
ICP-OES**
LAB-001*
LAB-001*
LAB-001*
LAB-001*
LAB-001*
Page 1 of 3
Calculation**
LAB-001*
LAB-001*
LAB-001*
LAB-001*
LAB-001*
Calculation**
LAB-001*
LAB-001*
ICP-OES**
ICP-OES**
Calculation**
Samples Received:
Sampling date:
Sampled by:
Report # :
Order #:
Acc # :
Sample condition:
Sub-contractor:
C21-00584
Parameter: Unit: Results:
pH @ 37°C pH units 7.17
Conductivity @ 25°C mS/m 12
Total Alkalinity as CaCO3 mg/l 33
Chloride as Cl mg/l 5.4
Nitrate as N mg/l NR
Ammonium as N mg/l NR
Fluoride as F mg/l NR
Colour mg/l NR
Turbidity mg/l NR
Nitrite as NO2 mg/l NR
Total Dissolved Solids mg/l 85
pHs @ 20°C 9.16
Langelier Index @ 20°C*** -1.99
Alkalinity Hazard mg/l 0.66
Irrigation Class C1-S1
*SANAS Accredited **Not SANAS Accredited
Tests marked “Not SANAS Accredited” in this report are not included in the SANAS Schedule of Accreditation for this laboratory.
Signed at end of report.
This report relates only to the sample/s tested by LABSERVE. Results and advice are subject to correct sampling procedure being followed. Labserve does not accept
responsibility for any matters arising from the further use of these results. This report is confidential and is only intended for the use of the individual or entity to which it is
addressed. This report may not be reproduced, except in full, without the prior written approval of the Technical Manager. Opinions & interpretations are not accredited.
Uncertainty values available on www.labserve.net.
M99-925
Drinkin
g
wate
r
Gallery**
Norms
Gallery**
Gallery**
Gallery**
Calculation**
Calculation**
Calculation**
Gallery**
Gallery**
Gallery**
Gallery**
Method Reference
Gallery**
Calculation**
Gallery**
Irrigation
wate
r
For the use of:
Testing Date (Gallery):
1200 C21-00584
None
Test Report - Water Analysis
Acmert Trading
Waste
-
wate
r
2020-03-19
P.O. Box 19390 2020-03-19
Page 2 of 3
Nelspruit Unknown
2020-03-23
Good- Supplied Container/s
None
LAB No.
Your Reference K.M.I Airport BH4
Bott
led
wate
r

Samples Received:
Sampling date:
Sampled by:
Report # :
Order #:
Acc # :
Testing Date (Micro):
Sample condition:
Sub-contractor:
C21-00584
Parameter: Unit: Results:
Total Coliform cfu/100 ml 82
E. coli cfu/100 ml <1
Total Coliform cfu/100 ml NR
E. coli cfu/100 ml NR
Heterotrophic plate count cfu/ml NR
Faecal Coliforms cfu/100ml NR
*SANAS Accredited **Not SANAS Accredited
**** SANAS Accedited when reported in conjunction with Total coliforms.
Tests marked “Not SANAS Accredited” in this report are not included in the SANAS Schedule of Accreditation for this laboratory.
Date:
This report relates only to the sample/s tested by LABSERVE. Results and advice are subject to correct sampling procedure being followed. Labserve does not accept
responsibility for any matters arising from the further use of these results. This report is confidential and is only intended for the use of the individual or entity to which it is
addressed. This report may not be reproduced, except in full, without the prior written approval of the Technical Manager. Opinions & interpretations are not accredited.
Uncertainty values available on www.labserve.net.
2020-03-19
2020-03-19
P.O. Box 19390
Drinkin
g
wate
r
Bott
led
wate
r
Waste
-
wate
r
Irrigation
wate
r
For the use of:
Norms
Acmert Trading
2020-03-19
Nelspruit Unknown
2020-03-26
Method Reference
Lab-002*
Lab-002* / ****
EC/TC Count Plates**
EC/TC Count Plates**
None
1200 C21-00584
Aerobic Count Plate**
Colilert**
Test Report - Water Analysis
Page 3 of 3
Good- Supplied Container/s
LAB No.
Your Reference K.M.I Airport BH4
None
M99-925

Additional information:
*Sample counts are in cfu (colony forming units, assumed to be individual bacterial cells), thus <1 is effectively ND (Non Detected).
***The water may form scale in operating systems.
***The water may corrode unprotected metal & concrete surfaces in the system.
Drinking water
Bottled water
Wastewater
Irrigation water
For further information, please visit our website at www.labserve.net. or contact [email protected].
Not Compliant
Not Requested = NR
Compliant / No limit
ND = None Detected*
SANS 241-1:2015 Ed. 2
Norms sources:
SANS 1657:2007 Ed.2
Water Act No. 36 of 1998: General limits for
wastewater discharge into a water source.
DWAF Irrigation Water Quality Guidelines
SANS 241-1:2015
Ed. 2 :
SANS 1657:2007
Ed.2 :
Water Act No. 36 of
1998
SANS 241 /
Drinking WaterBottled Water
Wastewater for
discharge into a
water source.
Upper limit for
Class 4 (Marginal)
Irrigation water
Physical Determinands Unit
pH @ 37°C pH Units 5 to 9.7 5.0 to 9.5 5.0 to 9.5 6.5 to 8.4
Conductivity @ 25°C mS/m ≤ 170 - 70 to 150 ª <540
Total Alkalinity as CaCO₃ mg/l - - - -
Chloride as Cl mg/l ≤ 300 - - <700
Nitrate as N¹ mg/l ≤ 11 10 15 -
Fluoride as F mg/l ≤ 1.5 ᵇ 1.0 15
Colour mg/l ≤15 20 - -
≤ 1.0****
≤ 5.0
Total Dissolved Solids mg/l ≤ 1200 - - -
Langelier Index @ 20°C ² -0.5 to 0.5 -0.5 to 0.5 -0.5 to 0.5 -0.5 to 0.5
Ca Hardness as CaCO₃ mg/l - - - -
Mg Hardness as CaCO₃ mg/l - - - -
Total Hardness as CaCO₃ mg/l - - - -
Dissolved Aluminium as Al mg/l ≤ 0.30 0.15 - < 20
Dissolved Arsenic as As mg/l ≤ 0.01 0.01 0.02 < 2.0
Dissolved Boron as B ² mg/l ≤ 0.30 5.0 1.0 < 15
Dissolved Barium as Ba mg/l - 0.7 - -
Dissolved Calcium as Ca mg/l - - - -
Dissolved Cadium as Cd mg/l ≤ 0.003 0.003 0.005 < 0.05
Dissolved Cobalt as Co mg/l - - - < 5.0
Dissolved Chromium as Cr mg/l ≤ 0.05 0.05 - -
Dissolved Copper as Cu mg/l ≤ 2.0 0.5 0.01 < 5.0
mg/l ≤ 2.0
≤ 0.3
Dissolved Mercury as Hg mg/l ≤ 0.006 0.001 0.005 -
Dissolved Potassium as K mg/l - - - -
Dissolved Magnesium as Mg mg/l - - - -
≤ 0.4
≤ 0.1
Dissolved Molybdenum as Mo ² mg/l < 0.07 0.07 - < 0.05
Dissolved Sodium as Na mg/l ≤ 200 - <90ª < 460
Dissolved Nickel as Ni mg/l ≤ 0.07 0.02 - < 2.0
Dissolved Phosphorous as P ² mg/l ≤ 5.0 - - -
Dissolved Lead as Pb mg/l ≤ 0.01 0.01 0.01 < 2.0
Dissolved Sulpher as S mg/l - - - -
Dissolved Antimony as Sb mg/l ≤ 0.02 0.005 - -
Dissolved Selenium as Se mg/l ≤ 0.04 0.01 0.02 < 0.05
Dissolved Silicon as Si mg/l - - - -
Dissolved Vanadium as V mg/l - - - < 1.0
Dissolved Zinc an Zn mg/l ≤ 5.0 5.0 0.1 < 5.0
Chromium as Cr⁶⁺ mg/l - - 0.05 -
Alkalinity Hazard - - - 1.25 to 2.5
Ammonium as N mg/l ≤1.5 - - -
COD as O₂ ³ mg/l - - 75 -
Free Chlorine as Cl₂ mg/l ≤ 5.0 - 0.25 -
Total Chlorine as Cl₂ mg/l - - - -
Free Cyanide as CN mg/l ≤ 0.2 - 0.02 -
Nitrite as NO₂ ¹ ⁴ mg/l ≤ 0.9 - - -
Nitrogen as N mg/l - - - < 30
Ortho-Phosphate as P mg/l - - 10 -
Oxygen Absorbed - 4 hrs mg/l - - <10 ᶜ -
Phenols mg/l ≤ 0.01 - - -
Soap, Oil and Grease mg/l - - 2.5 -
Sodium Abs. Ratio - - - < 15
E.coli or Feacal Coliforms count/100ml Not detected Not detected 1000 < 1000
Total Coliforms count/100ml ≤ 10 Not detected - -
Heterotrophic plate count count/100ml ≤ 1000 ≤100 - -
Compliance Requirements
General / Standard Limit
Turbidity mg/l
Dissolved Manganese as Mn mg/l 0.5 0.1 < 10
1.0 - -
Dissolved Iron as Fe 0.2 0.3 < 20

Irrigation Class Notes:
planted.
ª Above intake
ᵇ Bottled water that contains fluoride >1 mg/L, shall have the expression "contains fluoride" affixed in close proximity to the name of the water
or in a prominent place on the label. Bottled water that contains fluoride >1.5 mg/L shall have the expression "this product is not suitable for
infants or children under the age of 7 years" in close proximity to the name or in a prominent place on the label.
ᶜ Norm from Government Notice No. R991
Acute Health - determinand that poses an immediate unacceptable health risk if present at concentration values exceeding the numerical
limits specified in this part of SANS 241.
Chronic Health - determinand that poses an unacceptable health risk if ingested over an extended period if present at concentration values
exceeding the numerical limits specified in this part of SANS 241.
Operational - determinand that is essential for assessing the efficient operation of treatment systems and risks to infrastructure.
¹ This is equivalent to nitrate af 50 mg NO₃⁻/L and nitrite at 3 mg NO₂⁻/L. See annex C of SANS 241-2:2014 for an example of the sum of
Nitrate plus Nitrite ratio; the sum of the ratios of the concentrations of each (as detected in the sample) to its guideline value should not
exceed 1.
² Norm form source other than SANS 241-1:2015 Ed. 2. and SANS 1657:2007 Ed. 2.
³ After removal of algea
⁴ Due to the dynamic nature of nitrite-nitrate conversion in distribution networks and the potential health impact on bottle-fed infants, the
standard is applicable at the point of consumption.
C1-S1 : Low salinity water suitable for irrigation on most soils without danger of salinity or sodium problems developing.
C2-S1 : Medium salinity water suitable for irrigation on most soils and crops provided drainage is good.
C3-S1 : High salinity water - cannot be used on soils with restricted drainage. Even with good drainage, special precautions
must be taken to prevent build-up of salinity in the soil.
C4-S1 : Very high salinity water not suitable for irrigation under normal conditions. If used, soil drainage must be very good and
excess water must be applied to ensure leaching. Only salt resistant crops can be grown.
C3-S2 : High salinity water - cannot be used on soils with restricted drainage. Even with good drainage, special precautions
Aesthetic - determinand that taints water with respect to taste, odour or colour and that does not pose an unacceptable health risk if present
at concentration values exceeding the numerical limits specified.
**** Values in excess of those given may negatively impact disinfection.
C4-S3 : Very high salinity water. Normally unsuitable for irrigation, can be used in exceptional conditions if soil permeability &
drainage is very good. Sodium is high & could cause sodicity problems on most soils if calcium levels are low. Irrigate with
sufficient water to ensure leaching of salts occurs. Apply gypsum if soil calcium is low. Only salt resistant crops should be
C2-S3 : Medium salinity water with a high Sodium content, this could cause a problem on most soils. Special irrigation practices
are required to facilitate leaching of sodium salts. Soil drainage must be good & gypsum must be added if soil calcium levels are low.
C2-S2 : Medium salinity water suitable for irrigation on most soils & crops provided drainage is good. The sodium content is
also fairly high & this could cause problems on badly drained soils or soils low in available calcium.
must be taken to prevent build-up of soil salinity. The sodium is also high and could cause problems if there is not sufficient
calcium in the soil to ensure Na is leached.
C4-S2 : Very high salinity water - should not normally be used for irrigation except under exceptional conditions. Soil must be
penetrable and well drained and well supplied with calcium. Excess water must be used. Only salt resistant crops should be
planted.
C4-S4 : Very high salinity water - should not normally be used for irrigation except under exceptional conditions. Soil
must be penetrable & well drained. Sodium content is also very high & sodium brak conditions will arise unless soil is very well
drained, if there are sufficient calcium reserves & excess water is applied with each application, leaching of salts will occur. Only
salt resistant crops should be planted.

Samples Received:
Sampling date:
Sampled by:
Report # :
Order #:
Acc # :
Testing Date (ICP):
Sample condition:
Sub-contractor:
C21-00412
Parameter: Unit: Results:
Dissolved Aluminium as Al mg/l <0.05
Dissolved Arsenic as As mg/l 0.004
Dissolved Boron as B mg/l <0.07
Dissolved Barium as Ba mg/l 0.010
Dissolved Calcium as Ca mg/l 12
Dissolved Cadmium as Cd mg/l <0.0009
Dissolved Cobalt as Co mg/l <0.003
Dissolved Chromium as Cr mg/l <0.003
Dissolved Copper as Cu mg/l <0.02
Dissolved Iron as Fe mg/l <0.05
Dissolved Mercury as Hg mg/l <0.001
Dissolved Potassium as K mg/l 1.0
Dissolved Magnesium as Mg mg/l 12
Dissolved Manganese as Mn mg/l 0.07
Dissolved Molybdenum as Mo mg/l <0.010
Dissolved Sodium as Na mg/l 22
Dissolved Nickel as Ni mg/l 0.006
Dissolved Phosphorous as P mg/l <0.10
Dissolved Sulphur as S mg/l <0.05
Dissolved Antimony as Sb mg/l <0.02
Dissolved Selenium as Se mg/l <0.010
Dissolved Silicon as Si mg/l 25
Dissolved Vanadium as V mg/l <0.01
Dissolved Zinc as Zn mg/l 0.223
Ca Hardness as CaCO3 mg/l 30
Mg Hardness as CaCO3 mg/l 50
Total Hardness as CaCO3 mg/l 80
Sodium Abs. Ratio 1.07
*SANAS Accredited **Not SANAS Accredited
Tests marked “Not SANAS Accredited” in this report are not included in the SANAS Schedule of Accreditation for this laboratory.
Signed at end of report.
This report relates only to the sample/s tested by LABSERVE. Results and advice are subject to correct sampling procedure being followed. Labserve does not accept
responsibility for any matters arising from the further use of these results. This report is confidential and is only intended for the use of the individual or entity to which it is
addressed. This report may not be reproduced, except in full, without the prior written approval of the Technical Manager. Opinions & interpretations are not accredited.
Uncertainty values available on www.labserve.net.
LAB-001*
LAB-001*
LAB-001*
Calculation**
LAB-001*
LAB-001*
ICP-OES**
ICP-OES**
Calculation**
ICP-OES**
LAB-001*
ICP-OES**
LAB-001*
LAB-001*
LAB-001*
LAB-001*
LAB-001*
Page 1 of 3
Calculation**
LAB-001*
LAB-001*
M99-925
2020-03-13
LAB-001*
LAB-001*
LAB-001*
Method Reference
LAB-001*
LAB-001*
LAB-001*
LAB-001*
Norms
Test Report - Water Analysis
Acmert Trading 2020-03-11
P.O. Box 19390 2020-03-10
Drinkin
g
wate
r
Bott
led
wate
r
Irrigation
wate
r
Waste
-
wate
r
Good- Supplied Container/s
None
LAB No.
Your Reference KMI Airport
1200 C21-00412
None
For the use of:
Nelspruit Unknown
Calculation**

Samples Received:
Sampling date:
Sampled by:
Report # :
Order #:
Acc # :
Sample condition:
Sub-contractor:
C21-00412
Parameter: Unit: Results:
pH @ 37°C pH units 7.13
Conductivity @ 25°C mS/m 23
Total Alkalinity as CaCO3 mg/l 112
Chloride as Cl mg/l <0.01
Nitrate as N mg/l NR
Ammonium as N mg/l NR
Fluoride as F mg/l NR
Colour mg/l NR
Turbidity mg/l NR
Nitrite as NO2 mg/l NR
Total Dissolved Solids mg/l 163
pHs @ 20°C 8.39
Langelier Index @ 20°C*** -1.26
Alkalinity Hazard mg/l 2.23
Irrigation Class C1-S1
*SANAS Accredited **Not SANAS Accredited
Tests marked “Not SANAS Accredited” in this report are not included in the SANAS Schedule of Accreditation for this laboratory.
Signed at end of report.
This report relates only to the sample/s tested by LABSERVE. Results and advice are subject to correct sampling procedure being followed. Labserve does not accept
responsibility for any matters arising from the further use of these results. This report is confidential and is only intended for the use of the individual or entity to which it is
addressed. This report may not be reproduced, except in full, without the prior written approval of the Technical Manager. Opinions & interpretations are not accredited.
Uncertainty values available on www.labserve.net.
2020-03-11
P.O. Box 19390 2020-03-10
Page 2 of 3
Nelspruit Unknown
Good- Supplied Container/s
None
LAB No.
Your Reference KMI Airport
Bott
led
wate
r
Test Report - Water Analysis
Acmert Trading
Waste
-
wate
r
Irrigation
wate
r
For the use of:
Testing Date (Gallery):
1200 C21-00412
None
M99-925
Drinkin
g
wate
r
Gallery**
Norms
Gallery**
Gallery**
Gallery**
Calculation**
Calculation**
Calculation**
Gallery**
Gallery**
Gallery**
Gallery**
Method Reference
Gallery**
Calculation**
Gallery**

Samples Received:
Sampling date:
Sampled by:
Report # :
Order #:
Acc # :
Testing Date (Micro):
Sample condition:
Sub-contractor:
C21-00412
Parameter: Unit: Results:
Total Coliform cfu/100 ml 8
E. coli cfu/100 ml <1
Total Coliform cfu/100 ml NR
E. coli cfu/100 ml NR
Heterotrophic plate count cfu/ml NR
Faecal Coliforms cfu/100ml NR
*SANAS Accredited **Not SANAS Accredited
**** SANAS Accedited when reported in conjunction with Total coliforms.
Tests marked “Not SANAS Accredited” in this report are not included in the SANAS Schedule of Accreditation for this laboratory.
Date:
This report relates only to the sample/s tested by LABSERVE. Results and advice are subject to correct sampling procedure being followed. Labserve does not accept
responsibility for any matters arising from the further use of these results. This report is confidential and is only intended for the use of the individual or entity to which it is
addressed. This report may not be reproduced, except in full, without the prior written approval of the Technical Manager. Opinions & interpretations are not accredited.
Uncertainty values available on www.labserve.net. Page 3 of 3
Good- Supplied Container/s
LAB No.
Your Reference KMI Airport
None
M99-925
2020-03-10
Nelspruit Unknown
2020-03-18
Method Reference
Lab-002*
Lab-002* / ****
EC/TC Count Plates**
EC/TC Count Plates**
None
1200 C21-00412
Aerobic Count Plate**
Colilert**
Test Report - Water Analysis
For the use of:
Norms
Acmert Trading
2020-03-11
2020-03-11
P.O. Box 19390
Drinkin
g
wate
r
Bott
led
wate
r
Waste
-
wate
r
Irrigation
wate
r

Additional information:
*Sample counts are in cfu (colony forming units, assumed to be individual bacterial cells), thus <1 is effectively ND (Non Detected).
***The water may form scale in operating systems.
***The water may corrode unprotected metal & concrete surfaces in the system.
Drinking water
Bottled water
Wastewater
Irrigation water
For further information, please visit our website at www.labserve.net. or contact [email protected].
SANS 241-1:2015 Ed. 2
Norms sources:
SANS 1657:2007 Ed.2
Water Act No. 36 of 1998: General limits for
wastewater discharge into a water source.
DWAF Irrigation Water Quality Guidelines
ND = None Detected*
Not Compliant
Not Requested = NR
Compliant / No limit

SANS 241-1:2015
Ed. 2 :
SANS 1657:2007
Ed.2 :
Water Act No. 36 of
1998
SANS 241 /
Drinking WaterBottled Water
Wastewater for
discharge into a
water source.
Upper limit for
Class 4 (Marginal)
Irrigation water
Physical Determinands Unit
pH @ 37°C pH Units 5 to 9.7 5.0 to 9.5 5.0 to 9.5 6.5 to 8.4
Conductivity @ 25°C mS/m ≤ 170 - 70 to 150 ª <540
Total Alkalinity as CaCO₃ mg/l - - - -
Chloride as Cl mg/l ≤ 300 - - <700
Nitrate as N¹ mg/l ≤ 11 10 15 -
Fluoride as F mg/l ≤ 1.5 ᵇ 1.0 15
Colour mg/l ≤15 20 - -
≤ 1.0****
≤ 5.0
Total Dissolved Solids mg/l ≤ 1200 - - -
Langelier Index @ 20°C ² -0.5 to 0.5 -0.5 to 0.5 -0.5 to 0.5 -0.5 to 0.5
Ca Hardness as CaCO₃ mg/l - - - -
Mg Hardness as CaCO₃ mg/l - - - -
Total Hardness as CaCO₃ mg/l - - - -
Dissolved Aluminium as Al mg/l ≤ 0.30 0.15 - < 20
Dissolved Arsenic as As mg/l ≤ 0.01 0.01 0.02 < 2.0
Dissolved Boron as B ² mg/l ≤ 0.30 5.0 1.0 < 15
Dissolved Barium as Ba mg/l - 0.7 - -
Dissolved Calcium as Ca mg/l - - - -
Dissolved Cadium as Cd mg/l ≤ 0.003 0.003 0.005 < 0.05
Dissolved Cobalt as Co mg/l - - - < 5.0
Dissolved Chromium as Cr mg/l ≤ 0.05 0.05 - -
Dissolved Copper as Cu mg/l ≤ 2.0 0.5 0.01 < 5.0
mg/l ≤ 2.0
≤ 0.3
Dissolved Mercury as Hg mg/l ≤ 0.006 0.001 0.005 -
Dissolved Potassium as K mg/l - - - -
Dissolved Magnesium as Mg mg/l - - - -
≤ 0.4
≤ 0.1
Dissolved Molybdenum as Mo ² mg/l < 0.07 0.07 - < 0.05
Dissolved Sodium as Na mg/l ≤ 200 - <90ª < 460
Dissolved Nickel as Ni mg/l ≤ 0.07 0.02 - < 2.0
Dissolved Phosphorous as P ² mg/l ≤ 5.0 - - -
Dissolved Lead as Pb mg/l ≤ 0.01 0.01 0.01 < 2.0
Dissolved Sulpher as S mg/l - - - -
Dissolved Antimony as Sb mg/l ≤ 0.02 0.005 - -
Dissolved Selenium as Se mg/l ≤ 0.04 0.01 0.02 < 0.05
Dissolved Silicon as Si mg/l - - - -
Dissolved Vanadium as V mg/l - - - < 1.0
Dissolved Zinc an Zn mg/l ≤ 5.0 5.0 0.1 < 5.0
Chromium as Cr⁶⁺ mg/l - - 0.05 -
Alkalinity Hazard - - - 1.25 to 2.5
Ammonium as N mg/l ≤1.5 - - -
COD as O₂ ³ mg/l - - 75 -
Free Chlorine as Cl₂ mg/l ≤ 5.0 - 0.25 -
Total Chlorine as Cl₂ mg/l - - - -
Free Cyanide as CN mg/l ≤ 0.2 - 0.02 -
Nitrite as NO₂ ¹ ⁴ mg/l ≤ 0.9 - - -
Nitrogen as N mg/l - - - < 30
Ortho-Phosphate as P mg/l - - 10 -
Oxygen Absorbed - 4 hrs mg/l - - <10 ᶜ -
Phenols mg/l ≤ 0.01 - - -
Soap, Oil and Grease mg/l - - 2.5 -
Sodium Abs. Ratio - - - < 15
E.coli or Feacal Coliforms count/100ml Not detected Not detected 1000 < 1000
Total Coliforms count/100ml ≤ 10 Not detected - -
Heterotrophic plate count count/100ml ≤ 1000 ≤100 - -
1.0 - -
Dissolved Iron as Fe 0.2 0.3 < 20
Dissolved Manganese as Mn mg/l 0.5 0.1 < 10
Compliance Requirements
General / Standard Limit
Turbidity mg/l

Irrigation Class Notes:
planted.
C4-S3 : Very high salinity water. Normally unsuitable for irrigation, can be used in exceptional conditions if soil permeability &
drainage is very good. Sodium is high & could cause sodicity problems on most soils if calcium levels are low. Irrigate with
sufficient water to ensure leaching of salts occurs. Apply gypsum if soil calcium is low. Only salt resistant crops should be
C2-S3 : Medium salinity water with a high Sodium content, this could cause a problem on most soils. Special irrigation practices
are required to facilitate leaching of sodium salts. Soil drainage must be good & gypsum must be added if soil calcium levels are low.
C2-S2 : Medium salinity water suitable for irrigation on most soils & crops provided drainage is good. The sodium content is
also fairly high & this could cause problems on badly drained soils or soils low in available calcium.
must be taken to prevent build-up of soil salinity. The sodium is also high and could cause problems if there is not sufficient
calcium in the soil to ensure Na is leached.
C4-S2 : Very high salinity water - should not normally be used for irrigation except under exceptional conditions. Soil must be
penetrable and well drained and well supplied with calcium. Excess water must be used. Only salt resistant crops should be
planted.
C4-S4 : Very high salinity water - should not normally be used for irrigation except under exceptional conditions. Soil
must be penetrable & well drained. Sodium content is also very high & sodium brak conditions will arise unless soil is very well
drained, if there are sufficient calcium reserves & excess water is applied with each application, leaching of salts will occur. Only
salt resistant crops should be planted.
C1-S1 : Low salinity water suitable for irrigation on most soils without danger of salinity or sodium problems developing.
C2-S1 : Medium salinity water suitable for irrigation on most soils and crops provided drainage is good.
C3-S1 : High salinity water - cannot be used on soils with restricted drainage. Even with good drainage, special precautions
must be taken to prevent build-up of salinity in the soil.
C4-S1 : Very high salinity water not suitable for irrigation under normal conditions. If used, soil drainage must be very good and
excess water must be applied to ensure leaching. Only salt resistant crops can be grown.
C3-S2 : High salinity water - cannot be used on soils with restricted drainage. Even with good drainage, special precautions
Aesthetic - determinand that taints water with respect to taste, odour or colour and that does not pose an unacceptable health risk if present
at concentration values exceeding the numerical limits specified.
**** Values in excess of those given may negatively impact disinfection.
Operational - determinand that is essential for assessing the efficient operation of treatment systems and risks to infrastructure.
¹ This is equivalent to nitrate af 50 mg NO₃⁻/L and nitrite at 3 mg NO₂⁻/L. See annex C of SANS 241-2:2014 for an example of the sum of
Nitrate plus Nitrite ratio; the sum of the ratios of the concentrations of each (as detected in the sample) to its guideline value should not
exceed 1.
² Norm form source other than SANS 241-1:2015 Ed. 2. and SANS 1657:2007 Ed. 2.
³ After removal of algea
⁴ Due to the dynamic nature of nitrite-nitrate conversion in distribution networks and the potential health impact on bottle-fed infants, the
standard is applicable at the point of consumption.
ª Above intake
ᵇ Bottled water that contains fluoride >1 mg/L, shall have the expression "contains fluoride" affixed in close proximity to the name of the water
or in a prominent place on the label. Bottled water that contains fluoride >1.5 mg/L shall have the expression "this product is not suitable for
infants or children under the age of 7 years" in close proximity to the name or in a prominent place on the label.
ᶜ Norm from Government Notice No. R991
Acute Health - determinand that poses an immediate unacceptable health risk if present at concentration values exceeding the numerical
limits specified in this part of SANS 241.
Chronic Health - determinand that poses an unacceptable health risk if ingested over an extended period if present at concentration values
exceeding the numerical limits specified in this part of SANS 241.

Samples Received:
Sampling date:
Sampled by:
Report # :
Order #:
Acc # :
Testing Date (ICP):
Sample condition:
Sub-contractor:
C21-00519
Parameter: Unit: Results:
Dissolved Aluminium as Al mg/l <0.05
Dissolved Arsenic as As mg/l <0.002
Dissolved Boron as B mg/l <0.07
Dissolved Barium as Ba mg/l 0.019
Dissolved Calcium as Ca mg/l 14
Dissolved Cadmium as Cd mg/l <0.0009
Dissolved Cobalt as Co mg/l <0.003
Dissolved Chromium as Cr mg/l <0.003
Dissolved Copper as Cu mg/l <0.02
Dissolved Iron as Fe mg/l <0.05
Dissolved Mercury as Hg mg/l <0.001
Dissolved Potassium as K mg/l 2.3
Dissolved Magnesium as Mg mg/l 17
Dissolved Manganese as Mn mg/l 0.04
Dissolved Molybdenum as Mo mg/l <0.010
Dissolved Sodium as Na mg/l 32
Dissolved Nickel as Ni mg/l 0.010
Dissolved Phosphorous as P mg/l <0.10
Dissolved Sulphur as S mg/l 0.49
Dissolved Antimony as Sb mg/l <0.02
Dissolved Selenium as Se mg/l <0.010
Dissolved Silicon as Si mg/l 35
Dissolved Vanadium as V mg/l <0.01
Dissolved Zinc as Zn mg/l 0.33
Ca Hardness as CaCO3 mg/l 35
Mg Hardness as CaCO3 mg/l 69
Total Hardness as CaCO3 mg/l 104
Sodium Abs. Ratio 1.35
*SANAS Accredited **Not SANAS Accredited
Tests marked “Not SANAS Accredited” in this report are not included in the SANAS Schedule of Accreditation for this laboratory.
Signed at end of report.
This report relates only to the sample/s tested by LABSERVE. Results and advice are subject to correct sampling procedure being followed. Labserve does not accept
responsibility for any matters arising from the further use of these results. This report is confidential and is only intended for the use of the individual or entity to which it is
addressed. This report may not be reproduced, except in full, without the prior written approval of the Technical Manager. Opinions & interpretations are not accredited.
Uncertainty values available on www.labserve.net.
LAB-001*
LAB-001*
LAB-001*
Calculation**
LAB-001*
LAB-001*
ICP-OES**
ICP-OES**
Calculation**
ICP-OES**
LAB-001*
ICP-OES**
LAB-001*
LAB-001*
LAB-001*
LAB-001*
LAB-001*
Page 1 of 3
Calculation**
LAB-001*
LAB-001*
M99-925
2020-03-23
LAB-001*
LAB-001*
LAB-001*
Method Reference
LAB-001*
LAB-001*
LAB-001*
LAB-001*
Norms
Test Report - Water Analysis
Acmert Trading 2020-03-16
P.O. Box 19390 2020-03-15
Drinkin
g
wate
r
Bott
led
wate
r
Irrigation
wate
r
Waste
-
wate
r
Good- Supplied Container/s
None
LAB No.
Your ReferenceKMIA Airport B/HS;
Time: 13:00
1200 C21-00519
None
For the use of:
Nelspruit Unknown
Calculation**

Samples Received:
Sampling date:
Sampled by:
Report # :
Order #:
Acc # :
Sample condition:
Sub-contractor:
C21-00519
Parameter: Unit: Results:
pH @ 37°C pH units 7.73
Conductivity @ 25°C mS/m 31
Total Alkalinity as CaCO3 mg/l 153
Chloride as Cl mg/l 9.5
Nitrate as N mg/l NR
Ammonium as N mg/l NR
Fluoride as F mg/l NR
Colour mg/l NR
Turbidity mg/l NR
Nitrite as NO2 mg/l NR
Total Dissolved Solids mg/l 222
pHs @ 20°C 8.20
Langelier Index @ 20°C*** -0.47
Alkalinity Hazard mg/l 3.04
Irrigation Class C2-S1
*SANAS Accredited **Not SANAS Accredited
Tests marked “Not SANAS Accredited” in this report are not included in the SANAS Schedule of Accreditation for this laboratory.
Signed at end of report.
This report relates only to the sample/s tested by LABSERVE. Results and advice are subject to correct sampling procedure being followed. Labserve does not accept
responsibility for any matters arising from the further use of these results. This report is confidential and is only intended for the use of the individual or entity to which it is
addressed. This report may not be reproduced, except in full, without the prior written approval of the Technical Manager. Opinions & interpretations are not accredited.
Uncertainty values available on www.labserve.net.
2020-03-16
P.O. Box 19390 2020-03-15
Page 2 of 3
Nelspruit Unknown
2020-03-19
Good- Supplied Container/s
None
LAB No.
Your ReferenceKMIA Airport B/HS;
Time: 13:00
Bott
led
wate
r
Test Report - Water Analysis
Acmert Trading
Waste
-
wate
r
Irrigation
wate
r
For the use of:
Testing Date (Gallery):
1200 C21-00519
None
M99-925
Drinkin
g
wate
r
Gallery**
Norms
Gallery**
Gallery**
Gallery**
Calculation**
Calculation**
Calculation**
Gallery**
Gallery**
Gallery**
Gallery**
Method Reference
Gallery**
Calculation**
Gallery**

Samples Received:
Sampling date:
Sampled by:
Report # :
Order #:
Acc # :
Testing Date (Micro):
Sample condition:
Sub-contractor:
C21-00519
Parameter: Unit: Results:
Total Coliform cfu/100 ml 5
E. coli cfu/100 ml <1
Total Coliform cfu/100 ml NR
E. coli cfu/100 ml NR
Heterotrophic plate count cfu/ml NR
Faecal Coliforms cfu/100ml NR
*SANAS Accredited **Not SANAS Accredited
**** SANAS Accedited when reported in conjunction with Total coliforms.
Tests marked “Not SANAS Accredited” in this report are not included in the SANAS Schedule of Accreditation for this laboratory.
Date:
This report relates only to the sample/s tested by LABSERVE. Results and advice are subject to correct sampling procedure being followed. Labserve does not accept
responsibility for any matters arising from the further use of these results. This report is confidential and is only intended for the use of the individual or entity to which it is
addressed. This report may not be reproduced, except in full, without the prior written approval of the Technical Manager. Opinions & interpretations are not accredited.
Uncertainty values available on www.labserve.net. Page 3 of 3
Good- Supplied Container/s
LAB No.
Your ReferenceKMIA Airport B/HS;
Time: 13:00
None
M99-925
2020-03-15
Nelspruit Unknown
2020-03-26
Method Reference
Lab-002*
Lab-002* / ****
EC/TC Count Plates**
EC/TC Count Plates**
None
1200 C21-00519
Aerobic Count Plate**
Colilert**
Test Report - Water Analysis
For the use of:
Norms
Acmert Trading
2020-03-16
2020-03-16
P.O. Box 19390
Drinkin
g
wate
r
Bott
led
wate
r
Waste
-
wate
r
Irrigation
wate
r

Additional information:
*Sample counts are in cfu (colony forming units, assumed to be individual bacterial cells), thus <1 is effectively ND (Non Detected).
***The water may form scale in operating systems.
***The water may corrode unprotected metal & concrete surfaces in the system.
Drinking water
Bottled water
Wastewater
Irrigation water
For further information, please visit our website at www.labserve.net. or contact [email protected].
SANS 241-1:2015 Ed. 2
Norms sources:
SANS 1657:2007 Ed.2
Water Act No. 36 of 1998: General limits for
wastewater discharge into a water source.
DWAF Irrigation Water Quality Guidelines
ND = None Detected*
Not Compliant
Not Requested = NR
Compliant / No limit

SANS 241-1:2015
Ed. 2 :
SANS 1657:2007
Ed.2 :
Water Act No. 36 of
1998
SANS 241 /
Drinking WaterBottled Water
Wastewater for
discharge into a
water source.
Upper limit for
Class 4 (Marginal)
Irrigation water
Physical Determinands Unit
pH @ 37°C pH Units 5 to 9.7 5.0 to 9.5 5.0 to 9.5 6.5 to 8.4
Conductivity @ 25°C mS/m ≤ 170 - 70 to 150 ª <540
Total Alkalinity as CaCO₃ mg/l - - - -
Chloride as Cl mg/l ≤ 300 - - <700
Nitrate as N¹ mg/l ≤ 11 10 15 -
Fluoride as F mg/l ≤ 1.5 ᵇ 1.0 15
Colour mg/l ≤15 20 - -
≤ 1.0****
≤ 5.0
Total Dissolved Solids mg/l ≤ 1200 - - -
Langelier Index @ 20°C ² -0.5 to 0.5 -0.5 to 0.5 -0.5 to 0.5 -0.5 to 0.5
Ca Hardness as CaCO₃ mg/l - - - -
Mg Hardness as CaCO₃ mg/l - - - -
Total Hardness as CaCO₃ mg/l - - - -
Dissolved Aluminium as Al mg/l ≤ 0.30 0.15 - < 20
Dissolved Arsenic as As mg/l ≤ 0.01 0.01 0.02 < 2.0
Dissolved Boron as B ² mg/l ≤ 0.30 5.0 1.0 < 15
Dissolved Barium as Ba mg/l - 0.7 - -
Dissolved Calcium as Ca mg/l - - - -
Dissolved Cadium as Cd mg/l ≤ 0.003 0.003 0.005 < 0.05
Dissolved Cobalt as Co mg/l - - - < 5.0
Dissolved Chromium as Cr mg/l ≤ 0.05 0.05 - -
Dissolved Copper as Cu mg/l ≤ 2.0 0.5 0.01 < 5.0
mg/l ≤ 2.0
≤ 0.3
Dissolved Mercury as Hg mg/l ≤ 0.006 0.001 0.005 -
Dissolved Potassium as K mg/l - - - -
Dissolved Magnesium as Mg mg/l - - - -
≤ 0.4
≤ 0.1
Dissolved Molybdenum as Mo ² mg/l < 0.07 0.07 - < 0.05
Dissolved Sodium as Na mg/l ≤ 200 - <90ª < 460
Dissolved Nickel as Ni mg/l ≤ 0.07 0.02 - < 2.0
Dissolved Phosphorous as P ² mg/l ≤ 5.0 - - -
Dissolved Lead as Pb mg/l ≤ 0.01 0.01 0.01 < 2.0
Dissolved Sulpher as S mg/l - - - -
Dissolved Antimony as Sb mg/l ≤ 0.02 0.005 - -
Dissolved Selenium as Se mg/l ≤ 0.04 0.01 0.02 < 0.05
Dissolved Silicon as Si mg/l - - - -
Dissolved Vanadium as V mg/l - - - < 1.0
Dissolved Zinc an Zn mg/l ≤ 5.0 5.0 0.1 < 5.0
Chromium as Cr⁶⁺ mg/l - - 0.05 -
Alkalinity Hazard - - - 1.25 to 2.5
Ammonium as N mg/l ≤1.5 - - -
COD as O₂ ³ mg/l - - 75 -
Free Chlorine as Cl₂ mg/l ≤ 5.0 - 0.25 -
Total Chlorine as Cl₂ mg/l - - - -
Free Cyanide as CN mg/l ≤ 0.2 - 0.02 -
Nitrite as NO₂ ¹ ⁴ mg/l ≤ 0.9 - - -
Nitrogen as N mg/l - - - < 30
Ortho-Phosphate as P mg/l - - 10 -
Oxygen Absorbed - 4 hrs mg/l - - <10 ᶜ -
Phenols mg/l ≤ 0.01 - - -
Soap, Oil and Grease mg/l - - 2.5 -
Sodium Abs. Ratio - - - < 15
E.coli or Feacal Coliforms count/100ml Not detected Not detected 1000 < 1000
Total Coliforms count/100ml ≤ 10 Not detected - -
Heterotrophic plate count count/100ml ≤ 1000 ≤100 - -
1.0 - -
Dissolved Iron as Fe 0.2 0.3 < 20
Dissolved Manganese as Mn mg/l 0.5 0.1 < 10
Compliance Requirements
General / Standard Limit
Turbidity mg/l

Irrigation Class Notes:
planted.
C4-S3 : Very high salinity water. Normally unsuitable for irrigation, can be used in exceptional conditions if soil permeability &
drainage is very good. Sodium is high & could cause sodicity problems on most soils if calcium levels are low. Irrigate with
sufficient water to ensure leaching of salts occurs. Apply gypsum if soil calcium is low. Only salt resistant crops should be
C2-S3 : Medium salinity water with a high Sodium content, this could cause a problem on most soils. Special irrigation practices
are required to facilitate leaching of sodium salts. Soil drainage must be good & gypsum must be added if soil calcium levels are low.
C2-S2 : Medium salinity water suitable for irrigation on most soils & crops provided drainage is good. The sodium content is
also fairly high & this could cause problems on badly drained soils or soils low in available calcium.
must be taken to prevent build-up of soil salinity. The sodium is also high and could cause problems if there is not sufficient
calcium in the soil to ensure Na is leached.
C4-S2 : Very high salinity water - should not normally be used for irrigation except under exceptional conditions. Soil must be
penetrable and well drained and well supplied with calcium. Excess water must be used. Only salt resistant crops should be
planted.
C4-S4 : Very high salinity water - should not normally be used for irrigation except under exceptional conditions. Soil
must be penetrable & well drained. Sodium content is also very high & sodium brak conditions will arise unless soil is very well
drained, if there are sufficient calcium reserves & excess water is applied with each application, leaching of salts will occur. Only
salt resistant crops should be planted.
C1-S1 : Low salinity water suitable for irrigation on most soils without danger of salinity or sodium problems developing.
C2-S1 : Medium salinity water suitable for irrigation on most soils and crops provided drainage is good.
C3-S1 : High salinity water - cannot be used on soils with restricted drainage. Even with good drainage, special precautions
must be taken to prevent build-up of salinity in the soil.
C4-S1 : Very high salinity water not suitable for irrigation under normal conditions. If used, soil drainage must be very good and
excess water must be applied to ensure leaching. Only salt resistant crops can be grown.
C3-S2 : High salinity water - cannot be used on soils with restricted drainage. Even with good drainage, special precautions
Aesthetic - determinand that taints water with respect to taste, odour or colour and that does not pose an unacceptable health risk if present
at concentration values exceeding the numerical limits specified.
**** Values in excess of those given may negatively impact disinfection.
Operational - determinand that is essential for assessing the efficient operation of treatment systems and risks to infrastructure.
¹ This is equivalent to nitrate af 50 mg NO₃⁻/L and nitrite at 3 mg NO₂⁻/L. See annex C of SANS 241-2:2014 for an example of the sum of
Nitrate plus Nitrite ratio; the sum of the ratios of the concentrations of each (as detected in the sample) to its guideline value should not
exceed 1.
² Norm form source other than SANS 241-1:2015 Ed. 2. and SANS 1657:2007 Ed. 2.
³ After removal of algea
⁴ Due to the dynamic nature of nitrite-nitrate conversion in distribution networks and the potential health impact on bottle-fed infants, the
standard is applicable at the point of consumption.
ª Above intake
ᵇ Bottled water that contains fluoride >1 mg/L, shall have the expression "contains fluoride" affixed in close proximity to the name of the water
or in a prominent place on the label. Bottled water that contains fluoride >1.5 mg/L shall have the expression "this product is not suitable for
infants or children under the age of 7 years" in close proximity to the name or in a prominent place on the label.
ᶜ Norm from Government Notice No. R991
Acute Health - determinand that poses an immediate unacceptable health risk if present at concentration values exceeding the numerical
limits specified in this part of SANS 241.
Chronic Health - determinand that poses an unacceptable health risk if ingested over an extended period if present at concentration values
exceeding the numerical limits specified in this part of SANS 241.

Acmert Trading
P.O. Box 19390
Nelspruit
1200
Test Report - Water Analysis
Samples Received:
Sampling date:
Sampled by:
Report # :
Order #:
Acc # :
Testing Date (ICP):
2020-03-19
2020-03-19
Unknown
C21-00587
None
M99-925
2020-03-23
Sample condition:
Sub-contractor:
Good- Supplied Container/s
None
For the use of:
LAB No. C21-00587
Drin
kin
g
wa
ter
Bo
ttle
d
wa
ter
Wa
ste
-
wa
ter
Irri
ga
tio
n
wa
ter
Your Reference
K.M.I Airport BH7
Parameter: Unit: Results: Norms Method Reference
Dissolved Aluminium as Al mg/l <0.05 LAB-001*
Dissolved Arsenic as As mg/l <0.002 LAB-001*
Dissolved Boron as B mg/l <0.07 LAB-001*
Dissolved Barium as Ba mg/l 0.014 LAB-001*
Dissolved Calcium as Ca mg/l 9.5 LAB-001*
Dissolved Cadmium as Cd mg/l <0.0009 LAB-001*
Dissolved Cobalt as Co mg/l <0.003 LAB-001*
Dissolved Chromium as Cr mg/l <0.003 LAB-001*
Dissolved Copper as Cu mg/l <0.02 LAB-001*
Dissolved Iron as Fe mg/l <0.05 LAB-001*
Dissolved Mercury as Hg mg/l <0.001 ICP-OES**
Dissolved Potassium as K mg/l 0.41 ICP-OES**
Dissolved Magnesium as Mg mg/l 3.7 LAB-001*
Dissolved Manganese as Mn mg/l <0.01 LAB-001*
Dissolved Molybdenum as Mo mg/l <0.010 LAB-001*
Dissolved Sodium as Na mg/l 22 LAB-001*
Dissolved Nickel as Ni mg/l 0.005 LAB-001*
Dissolved Phosphorous as P mg/l <0.10 ICP-OES**
Dissolved Sulphur as S mg/l <0.05 LAB-001*
Dissolved Antimony as Sb mg/l <0.02 ICP-OES**
Dissolved Selenium as Se mg/l <0.010 LAB-001*
Dissolved Silicon as Si mg/l 26 LAB-001*
Dissolved Vanadium as V mg/l <0.01 LAB-001*
Dissolved Zinc as Zn mg/l <0.010 LAB-001*
Ca Hardness as CaCO3 mg/l 23 Calculation**
Mg Hardness as CaCO3 mg/l 14 Calculation**
Total Hardness as CaCO3 mg/l 32 Calculation**
Sodium Abs. Ratio 1.56 Calculation**
*SANAS Accredited **Not SANAS Accredited
Tests marked “Not SANAS Accredited” in this report are not included in the SANAS Schedule of Accreditation for this laboratory.
Signed at end of report.
This report relates only to the sample/s tested by LABSERVE. Results and advice are subject to correct sampling procedure being followed. Labserve does not accept
responsibility for any matters arising from the further use of these results. This report is confidential and is only intended for the use of the individual or entity to which it is
addressed. This report may not be reproduced, except in full, without the prior written approval of the Technical Manager. Opinions & interpretations are not accredited.
Uncertainty values available on www.labserve.net. Page 1 of 3

Test Report - Water Analysis
Acmert Trading
P.O. Box 19390
Nelspruit
1200
Samples Received:
Sampling date:
Sampled by:
Report # :
Order #:
Acc # :
Testing Date (Gallery):
2020-03-19
2020-03-19
Unknown
C21-00587
None
M99-925
2020-03-23
Sample condition:
Sub-contractor:
Good- Supplied Container/s
None
For the use of:
LAB No. C21-00587
Drin
kin
g
wa
ter
Bo
ttle
d
wa
ter
Wa
ste
-
wa
ter
Irri
ga
tio
n
wa
ter
Your Reference
K.M.I Airport BH7
Parameter: Unit: Results: Norms Method Reference
pH @ 37°C pH units 7.28 Gallery**
Conductivity @ 25°C mS/m 19 Gallery**
Total Alkalinity as CaCO3 mg/l 39 Gallery**
Chloride as Cl mg/l 8.8 Gallery**
Nitrate as N mg/l NR Gallery**
Ammonium as N mg/l NR Gallery**
Fluoride as F mg/l NR Gallery**
Colour mg/l NR Gallery**
Turbidity mg/l NR Gallery**
Nitrite as NO2 mg/l NR Gallery**
Total Dissolved Solids mg/l 104 Calculation**
pHs @ 20°C 9.04 Calculation**
Langelier Index @ 20°C*** -1.77 Calculation**
Alkalinity Hazard mg/l 0.78 Calculation**
Irrigation Class C1-S1
*SANAS Accredited **Not SANAS Accredited
Tests marked “Not SANAS Accredited” in this report are not included in the SANAS Schedule of Accreditation for this laboratory.
Signed at end of report.
This report relates only to the sample/s tested by LABSERVE. Results and advice are subject to correct sampling procedure being followed. Labserve does not accept
responsibility for any matters arising from the further use of these results. This report is confidential and is only intended for the use of the individual or entity to which it is
addressed. This report may not be reproduced, except in full, without the prior written approval of the Technical Manager. Opinions & interpretations are not accredited.
Uncertainty values available on www.labserve.net. Page 2 of 3

Test Report - Water Analysis
Acmert Trading
P.O. Box 19390
Nelspruit
1200
Samples Received:
Sampling date:
Sampled by:
Report # :
Order #:
Acc # :
Testing Date (Micro):
2020-03-19
2020-03-19
Unknown
C21-00587
None
M99-925
2020-03-19
Sample condition:
Sub-contractor:
Good- Supplied Container/s
None
For the use of:
LAB No. C21-00587
Drin
kin
g
wa
ter
Bo
ttle
d
wa
ter
Wa
ste
-
wa
ter
Irri
ga
tio
n
wa
ter
Your Reference
K.M.I Airport BH7
Parameter: Unit: Results: Norms Method Reference
Total Coliform cfu/100 ml 6 Lab-002*
E. coli cfu/100 ml <1 Lab-002* / ****
Total Coliform cfu/100 ml NR EC/TC Count Plates**
E. coli cfu/100 ml NR EC/TC Count Plates**
Heterotrophic plate count cfu/ml NR Aerobic Count Plate**
Faecal Coliforms cfu/100ml NR Colilert**
*SANAS Accredited **Not SANAS Accredited
**** SANAS Accedited when reported in conjunction with Total coliforms.
Tests marked “Not SANAS Accredited” in this report are not included in the SANAS Schedule of Accreditation for this laboratory.
Date: 2020-03-26
This report relates only to the sample/s tested by LABSERVE. Results and advice are subject to correct sampling procedure being followed. Labserve does not accept
responsibility for any matters arising from the further use of these results. This report is confidential and is only intended for the use of the individual or entity to which it is
addressed. This report may not be reproduced, except in full, without the prior written approval of the Technical Manager. Opinions & interpretations are not accredited.
Uncertainty values available on www.labserve.net. Page 3 of 3
Digitally signed by Tariena Nel Date: 2020.03.26 14:41:29 +02'00'

Additional information:
Not Requested = NR
Compliant / No limit
Not Compliant
ND = None Detected*
*Sample counts are in cfu (colony forming units, assumed to be individual bacterial cells), thus <1 is effectively ND (Non Detected).
***The water may form scale in operating systems.
***The water may corrode unprotected metal & concrete surfaces in the system.
Norms sources:
Drinking water SANS 241-1:2015 Ed. 2
Bottled water SANS 1657:2007 Ed.2
Wastewater Water Act No. 36 of 1998: General limits for
wastewater discharge into a water source.
Irrigation water DWAF Irrigation Water Quality Guidelines
For further information, please visit our website at www.labserve.net. or contact [email protected].

Compliance Requirements
SANS 241-1:2015
Ed. 2 :
SANS 1657:2007
Ed.2 :
Water Act No. 36 of
1998
SANS 241 /
Drinking Water
Bottled Water
Wastewater for
discharge into a
water source.
Upper limit for
Class 4 (Marginal)
Irrigation water
Physical Determinands Unit General / Standard Limit
pH @ 37°C pH Units 5 to 9.7 5.0 to 9.5 5.0 to 9.5 6.5 to 8.4
Conductivity @ 25°C mS/m ≤ 170 - 70 to 150 ª <540
Total Alkalinity as CaCO₃ mg/l - - - -
Chloride as Cl mg/l ≤ 300 - - <700
Nitrate as N¹ mg/l ≤ 11 10 15 -
Fluoride as F mg/l ≤ 1.5 ᵇ 1.0 15
Colour mg/l ≤15 20 - -
Turbidity mg/l ≤ 1.0****
1.0 - - ≤ 5.0
Total Dissolved Solids mg/l ≤ 1200 - - -
Langelier Index @ 20°C ² -0.5 to 0.5 -0.5 to 0.5 -0.5 to 0.5 -0.5 to 0.5
Ca Hardness as CaCO₃ mg/l - - - -
Mg Hardness as CaCO₃ mg/l - - - -
Total Hardness as CaCO₃ mg/l - - - -
Dissolved Aluminium as Al mg/l ≤ 0.30 0.15 - < 20
Dissolved Arsenic as As mg/l ≤ 0.01 0.01 0.02 < 2.0
Dissolved Boron as B ² mg/l ≤ 0.30 5.0 1.0 < 15
Dissolved Barium as Ba mg/l - 0.7 - -
Dissolved Calcium as Ca mg/l - - - -
Dissolved Cadium as Cd mg/l ≤ 0.003 0.003 0.005 < 0.05
Dissolved Cobalt as Co mg/l - - - < 5.0
Dissolved Chromium as Cr mg/l ≤ 0.05 0.05 - -
Dissolved Copper as Cu mg/l ≤ 2.0 0.5 0.01 < 5.0
Dissolved Iron as Fe mg/l ≤ 2.0
0.2 0.3 < 20 ≤ 0.3
Dissolved Mercury as Hg mg/l ≤ 0.006 0.001 0.005 -
Dissolved Potassium as K mg/l - - - -
Dissolved Magnesium as Mg mg/l - - - -
Dissolved Manganese as Mn mg/l ≤ 0.4
0.5 0.1 < 10 ≤ 0.1
Dissolved Molybdenum as Mo ² mg/l < 0.07 0.07 - < 0.05
Dissolved Sodium as Na mg/l ≤ 200 - <90ª < 460
Dissolved Nickel as Ni mg/l ≤ 0.07 0.02 - < 2.0
Dissolved Phosphorous as P ² mg/l ≤ 5.0 - - -
Dissolved Lead as Pb mg/l ≤ 0.01 0.01 0.01 < 2.0
Dissolved Sulpher as S mg/l - - - -
Dissolved Antimony as Sb mg/l ≤ 0.02 0.005 - -
Dissolved Selenium as Se mg/l ≤ 0.04 0.01 0.02 < 0.05
Dissolved Silicon as Si mg/l - - - -
Dissolved Vanadium as V mg/l - - - < 1.0
Dissolved Zinc an Zn mg/l ≤ 5.0 5.0 0.1 < 5.0
Chromium as Cr⁶ ⁺ mg/l - - 0.05 -
Alkalinity Hazard - - - 1.25 to 2.5
Ammonium as N mg/l ≤1.5 - - -
COD as O₂ ³ mg/l - - 75 -
Free Chlorine as Cl₂ mg/l ≤ 5.0 - 0.25 -
Total Chlorine as Cl₂ mg/l - - - -
Free Cyanide as CN mg/l ≤ 0.2 - 0.02 -
Nitrite as NO₂ ¹ ⁴ mg/l ≤ 0.9 - - -
Nitrogen as N mg/l - - - < 30
Ortho-Phosphate as P mg/l - - 10 -
Oxygen Absorbed - 4 hrs mg/l - - <10 ᶜ -
Phenols mg/l ≤ 0.01 - - -
Soap, Oil and Grease mg/l - - 2.5 -
Sodium Abs. Ratio - - - < 15
E.coli or Feacal Coliforms count/100ml Not detected Not detected 1000 < 1000
Total Coliforms count/100ml ≤ 10 Not detected - -
Heterotrophic plate count count/100ml ≤ 1000 ≤100 - -

¹ This is equivalent to nitrate af 50 mg NO₃⁻/L and nitrite at 3 mg NO₂⁻/L. See annex C of SANS 241-2:2014 for an example of the sum of
Nitrate plus Nitrite ratio; the sum of the ratios of the concentrations of each (as detected in the sample) to its guideline value should not
exceed 1.
² Norm form source other than SANS 241-1:2015 Ed. 2. and SANS 1657:2007 Ed. 2.
³ After removal of algea
⁴ Due to the dynamic nature of nitrite-nitrate conversion in distribution networks and the potential health impact on bottle-fed infants, the
standard is applicable at the point of consumption.
**** Values in excess of those given may negatively impact disinfection.
ª Above intake
ᵇ Bottled water that contains fluoride >1 mg/L, shall have the expression "contains fluoride" affixed in close proximity to the name of the water
or in a prominent place on the label. Bottled water that contains fluoride >1.5 mg/L shall have the expression "this product is not suitable for
infants or children under the age of 7 years" in close proximity to the name or in a prominent place on the label.
ᶜ Norm from Government Notice No. R991
Acute Health - determinand that poses an immediate unacceptable health risk if present at concentration values exceeding the numerical
limits specified in this part of SANS 241.
Chronic Health - determinand that poses an unacceptable health risk if ingested over an extended period if present at concentration values
exceeding the numerical limits specified in this part of SANS 241.
Operational - determinand that is essential for assessing the efficient operation of treatment systems and risks to infrastructure.
Aesthetic - determinand that taints water with respect to taste, odour or colour and that does not pose an unacceptable health risk if present
at concentration values exceeding the numerical limits specified.
Irrigation Class Notes:
C1-S1 : Low salinity water suitable for irrigation on most soils without danger of salinity or sodium problems developing.
C2-S1 : Medium salinity water suitable for irrigation on most soils and crops provided drainage is good.
C3-S1 : High salinity water - cannot be used on soils with restricted drainage. Even with good drainage, special precautions
must be taken to prevent build-up of salinity in the soil.
C4-S1 : Very high salinity water not suitable for irrigation under normal conditions. If used, soil drainage must be very good and
excess water must be applied to ensure leaching. Only salt resistant crops can be grown.
C3-S2 : High salinity water - cannot be used on soils with restricted drainage. Even with good drainage, special precautions
must be taken to prevent build-up of soil salinity. The sodium is also high and could cause problems if there is not sufficient
calcium in the soil to ensure Na is leached.
C4-S2 : Very high salinity water - should not normally be used for irrigation except under exceptional conditions. Soil must be
penetrable and well drained and well supplied with calcium. Excess water must be used. Only salt resistant crops should be
planted.
C4-S4 : Very high salinity water - should not normally be used for irrigation except under exceptional conditions. Soil
must be penetrable & well drained. Sodium content is also very high & sodium brak conditions will arise unless soil is very well
drained, if there are sufficient calcium reserves & excess water is applied with each application, leaching of salts will occur. Only
salt resistant crops should be planted.
C4-S3 : Very high salinity water. Normally unsuitable for irrigation, can be used in exceptional conditions if soil permeability &
drainage is very good. Sodium is high & could cause sodicity problems on most soils if calcium levels are low. Irrigate with
sufficient water to ensure leaching of salts occurs. Apply gypsum if soil calcium is low. Only salt resistant crops should be
planted.
C2-S3 : Medium salinity water with a high Sodium content, this could cause a problem on most soils. Special irrigation practices
are required to facilitate leaching of sodium salts. Soil drainage must be good & gypsum must be added if soil calcium levels are low.
C2-S2 : Medium salinity water suitable for irrigation on most soils & crops provided drainage is good. The sodium content is
also fairly high & this could cause problems on badly drained soils or soils low in available calcium.

Water Use Licence Application
Date: 2020/05/15 Revision Number: 00
CIVIL INF_WS_03_REPORTS_03-WUL Application Report Rev 00.docx Page 30 of 35
APPENDIX C HYDRAULIC DESIGN CALCULATIONS
Design water demand
800 p/d 20 16.00 kL/day195 m² 2.4 4.68 kL/day
4 700 m² 0.6 28.20 kL/day276 m² 2.4 6.62 kL/day
4 400 m² 0.4 17.60 kL/day9 450 m² 0.6 56.70 kL/day
129.80 kL/day129.80 kL
34 167.01 kL/year
2 350 m² 0.6 5.64 kL/day13 250 m² 0.6 31.80 kL/day
30 Units 300 9.00 kL/day46.44 kL/day46.44 kL
12 223.94 kL/year
176.24 kL/day176.24 kL
24hr storage requirement
24hr storage requirementTotal (Existing + Proposed Facilities)
Subtotal
Proposed
Annual
kL/100m²kL/100m²
L/single room
24hr storage requirementSubtotal
Fuel farm
Balance of Industrial Zone kL/250m²
Annual
Numbi Express kL/250m²
Car hire parking
Sleepover Motels
kL/100m²kL/100m²
Airport terminal
HangarsFire station
L/p
kL/100m²
Apron staff facility
Users/AreaFacilityExisting
Daily demandDaily demand rate

Historic water useMonth
Jan-19 898 kL/month 29 kL/dayFeb-19 1 866 kL/month 67 kL/dayMar-19 2 519 kL/month 81 kL/dayApr-19 2 494 kL/month 83 kL/day
May-19 2 080 kL/month 67 kL/dayJun-19 2 149 kL/month 72 kL/dayJul-19 2 206 kL/month 71 kL/day
Aug-19 3 261 kL/month 105 kL/daySep-19 3 823 kL/month 127 kL/dayOct-19 3 214 kL/month 104 kL/dayNov-19 3 406 kL/month 110 kL/dayDec-19 3 930 kL/month 127 kL/dayJan-20 1 697 kL/month 55 kL/day
Average 2 580 kL/month 84 kL/dayPeak 3 930 kL/month 127 kL/dayAnnual 33 543 kL/year
MonthJan-19 1 592 kL/month 106 kL/dayFeb-19 3 474 kL/month 124 kL/dayMar-19 3 606 kL/month 116 kL/dayApr-19 2 628 kL/month 88 kL/day
May-19 4 787 kL/month 154 kL/dayJun-19 3 861 kL/month 129 kL/dayJul-19 4 959 kL/month 160 kL/day
Aug-19 4 490 kL/month 145 kL/daySep-19 5 448 kL/month 182 kL/dayOct-19 4 132 kL/month 133 kL/dayNov-19 3 886 kL/month 130 kL/dayDec-19 821 kL/month 26 kL/dayJan-20 1 760 kL/month 57 kL/day
Average 3 496 kL/month 119 kL/dayPeak 5 448 kL/month 182 kL/dayAnnual 45 444 kL/year
Total supplyAirport boreholes
Farming project Total supply

DESIGN OF FACULTATIVE PONDS
Sewage load
Population 800 People
Water consumption 129.80 kl/d
Design volume 96.57 kl/d
Average Temperature 14.60oC
BOD Loading 65.00 g/cap.d
Design BOD load 52.000 kg/d
BOD concentration 538.46 mg/l
Pond Sizing
Pond depth 1.50 m
Loading 160.57 kg/ha.d
0.32 Ha Pond A Pond B
3 238.41 m2789.75 385.86 m2
Pond volume 4 857.62 m31 184.63 578.79 m3
Retention 50.30 days 12.27 5.99 days
DESIGN OF MATURATION PONDS
Sewage load
Population 800 People
Water consumption 129.80 L/c/d
Design volume 103.84 kl/d
Pond Retetion Time 5.00 days
Pond depth 1.5 m
Pond volume 519.20 m3
Pond Area 346.13 m2
Calculation of bacterial die-off in winter
Winter Temperature 14.60oC
Kb 1.016 d-1
Load 40 000 000 FC/100 ml 40 000 000 FC/100 ml
E Coli after first pond 6 577 352 FC/100 ml 2 970 280 FC/100 ml
E Coli after second pond 1 081 539 FC/100 ml 418 874 FC/100 ml
After third pond 177 842 FC/100 ml 68 877 FC/100 ml
After fourth pond 29 243 FC/100 ml 11 326 FC/100 ml
After fifth pond 4 809 FC/100 ml 1 862 FC/100 ml
After sixth pond 791 FC/100 ml
Calculation of bacterial die-off in summer
Summer Temperature 23.60oC
Kb 4.863 d-1
Design load 40 000 000 FC/100 ml 40 000 000 FC/100 ml
E Coli after first pond 1 579 958 FC/100 ml 659 424 FC/100 ml
E Coli after second pond 62 407 FC/100 ml 21 872 FC/100 ml
After third pond 2 465 FC/100 ml 864 FC/100 ml
After fourth pond 97 FC/100 ml 34 FC/100 ml
Design Of Waste Stabilization Pond For Sewage Treatment
Pond area
Design Actual
ActualDesign

Water Use Licence Application
Date: 2020/05/15 Revision Number: 00
CIVIL INF_WS_03_REPORTS_03-WUL Application Report Rev 00.docx Page 31 of 35
APPENDIX D PUBLIC PARTICIPATION DOCUMENTATION