Water & Sustainability (Volume 4): U.S. Electricity...
93
Water & Sustainability (Volume 4): U.S. Electricity Consumption for Water Supply & Treatment - The Next Half Century Technical Report
Transcript of Water & Sustainability (Volume 4): U.S. Electricity...

Water & Sustainability (Volume 4): U.S.Electricity Consumption for Water Supply& Treatment - The Next Half Century
Technical Report


EPRI Project ManagersR. GoldsteinW. Smith
EPRI • 3412 Hillview Avenue, Palo Alto, California 94304 • PO Box 10412, Palo Alto, California 94303 • USA800.313.3774 • 650.855.2121 • [email protected] • www.epri.com
Water & Sustainability (Volume 4):U.S. Electricity Consumption forWater Supply & Treatment—TheNext Half Century
1006787
Topical Report, March 2002

DISCLAIMER OF WARRANTIES AND LIMITATION OF LIABILITIES
THIS DOCUMENT WAS PREPARED BY THE ORGANIZATION(S) NAMED BELOW AS ANACCOUNT OF WORK SPONSORED OR COSPONSORED BY THE ELECTRIC POWER RESEARCHINSTITUTE, INC. (EPRI). NEITHER EPRI, ANY MEMBER OF EPRI, ANY COSPONSOR, THEORGANIZATION(S) BELOW, NOR ANY PERSON ACTING ON BEHALF OF ANY OF THEM:
(A) MAKES ANY WARRANTY OR REPRESENTATION WHATSOEVER, EXPRESS OR IMPLIED, (I)WITH RESPECT TO THE USE OF ANY INFORMATION, APPARATUS, METHOD, PROCESS, ORSIMILAR ITEM DISCLOSED IN THIS DOCUMENT, INCLUDING MERCHANTABILITY AND FITNESSFOR A PARTICULAR PURPOSE, OR (II) THAT SUCH USE DOES NOT INFRINGE ON ORINTERFERE WITH PRIVATELY OWNED RIGHTS, INCLUDING ANY PARTY'S INTELLECTUALPROPERTY, OR (III) THAT THIS DOCUMENT IS SUITABLE TO ANY PARTICULAR USER'SCIRCUMSTANCE; OR
(B) ASSUMES RESPONSIBILITY FOR ANY DAMAGES OR OTHER LIABILITY WHATSOEVER(INCLUDING ANY CONSEQUENTIAL DAMAGES, EVEN IF EPRI OR ANY EPRI REPRESENTATIVEHAS BEEN ADVISED OF THE POSSIBILITY OF SUCH DAMAGES) RESULTING FROM YOURSELECTION OR USE OF THIS DOCUMENT OR ANY INFORMATION, APPARATUS, METHOD,PROCESS, OR SIMILAR ITEM DISCLOSED IN THIS DOCUMENT.
ORGANIZATION(S) THAT PREPARED THIS DOCUMENT
ICF Consulting
ORDERING INFORMATION
Requests for copies of this report should be directed to EPRI Orders and Conferences, 1355 WillowWay, Suite 278, Concord, CA 94520, (800) 313-3774, press 2 or internally x5379, (925) 609-9169,(925) 609-1310 (fax).
Electric Power Research Institute and EPRI are registered service marks of the Electric PowerResearch Institute, Inc. EPRI. ELECTRIFY THE WORLD is a service mark of the Electric PowerResearch Institute, Inc.
Copyright © 2002 Electric Power Research Institute, Inc. All rights reserved.

iii
CITATIONS
This report was prepared by
ICF Consulting9300 Lee HighwayFairfax, Virginia 22031
Principal InvestigatorB. Appelbaum
This report describes research sponsored by EPRI.
The report is a corporate document that should be cited in the literature in the following manner:
Water and Sustainability: U.S. Electricity Consumption for Water Supply & Treatment—TheNext Half Century, EPRI, Palo Alto, CA: 2000. 1006787.


v
REPORT SUMMARY
The fast growing demand for clean, fresh water—coupled with the need to protect and enhancethe environment—has made many areas of the United States and the rest of the world vulnerableto water shortages for various human uses. As they interact with the electricity industry, theseuses encompass agricultural irrigation, thermoelectric generation, municipal water/wastewatertreatment and distribution, and industrial processes. The dependency of electricity supply anddemand on water availability can impede societal and economic sustainability, adversely affectthe future growth of electric demand, cause shortages in current electric supplies, and impactelectric grid topology planning.
BackgroundUnlike gradually developing environmental concerns, such as climate change where long lead-times allow coping strategies to be developed from evolving scientific and technical innovations,water (and energy) shortages can occur relatively suddenly and cripple local and nationaleconomies. EPRI perceived a critical need to better understand and manage the interrelationshipof water and energy, to improve environmentally sustainable economic development.
Objectives• To determine if there will be sufficient electricity available for providing fresh water andtreating wastewater to satisfy the country’s agricultural, power production, industrial, anddrinking water needs.
• To determine typical electricity consumption per unit of water supply and treatment for end-use sectors and thermoelectric generation.
• To project future growth patterns of electric consumption associated with water supply andtreatment over the next half century.
ApproachThe project team combined two decades of expertise in electricity, environmental, and watermanagement efforts to develop a four-volume series of Water & Sustainability documents tomeet the project objectives. This volume is Water & Sustainability: U.S. Electricity Consumptionfor Water Supply & Treatment—The Next Half Century (Volume 4). The other volumes areWater & Sustainability: Research Plan (Volume 1, EPRI report 1006784), Water &Sustainability: An Assessment of Water Demand, Supply, and Quality in the U.S.—The Next HalfCentury (Volume 2, 1006785), and Water & Sustainability: U.S. Water Consumption for PowerProduction—The Next Half Century (Volume 3, 1006786).

vi
ResultsThis screening study’s results included
• For the first time, unit energy (electric) requirements have been estimated for all end-usesectors and for thermal power generation, with respect to water supply and treatment.
• Generally, electricity demand associated with water supply and treatment for various end-use sectors will likely track Bureau of Census population growth projections of 50% bythe year 2050. The only exceptions are irrigation pumping and industrial (excludingmining) uses, both of which will triple over that period. Thermal power generationelectricity requirements associated with water use will remain relatively flat.
• Some 4% of the nation’s electricity use goes towards moving (80%) and treatingwater/wastewater. Approximately 80% of municipal water processing and distributioncosts are for electricity. Electricity availability, while critical for water supply andwastewater processing, is not a major impediment to economic development. However,water is a key constraint on such development and will strongly affect the overall demandfor electricity from human activities that depend on water availability.
• Groundwater supply of water from public sources requires about 30% more electricity ona unit basis than supply from surface water. The difference is due primarily to a higherrequirement for raw water pumping for groundwater systems.
EPRI PerspectiveGiven EPRI’s Electricity Technology Roadmap projections of some 7000 GW of additionalelectric generation needs by the year 2050, it is imperative that any critical resource availabilityon which this projection rests be evaluated and addressed. This Water & Sustainability effort didfind that electricity availability is not a constraint on water supply and treatment capabilities;rather, it is electricity supply and demand that depend on water availability.
KeywordsWater managementSustainabilityElectricity generationElectricity demandElectric grid
vii
ABSTRACT
The use of electricity for public and private supply of water and for wastewater treatment is animportant factor in economic growth and sustainability in the United States. As the economygrows, all sectors increase their demand for fresh water and generate additional quantities ofwastewater that must be treated before discharge.
This report estimates, for the first time, unit electricity requirements for the supply of fresh waterand the treatment of wastewater across the U.S. economy. These unit electricity requirementsare then used to project total electricity requirements for selected sectors of the economy.Sectors included in this analysis include:
• Public water supply agencies
• Publicly owned wastewater treatment facilities and privately operated wastewater treatmentfacilities
• Self-supply of water to the domestic, commercial, industrial, mining, irrigation, livestock,and thermal power generation sectors
Issues regarding changes in unit electricity consumption and aggregate electricity requirementsfor each sector are also identified and their impact on future projections are assessed.
Projected future electricity requirements for water supply and wastewater treatment are expectedto represent less than 4 percent of the total projected annual electricity sales to all sectors overthe period 2000 to 2050.
The amount of electricity required to meet the cooling water needs of thermal plants over theperiod 2000 through 2020 is estimated to represent less than 0.5 percent of the total generation ofthese types of plants.
Overall electricity demand, associated with water supply and treatment for various end-usesectors, will likely track Bureau of Census population growth projections of 50% over the period2000 through 2050, with the exception of irrigation pumping and industrial (excluding mining)uses, both of which will triple over that period. Thermal power generation electricityrequirements associated with water use will remain relatively flat.


ix
CONTENTS
1 INTRODUCTION AND SUMMARY...................................................................................... 1-1Introduction ........................................................................................................................ 1-1Summary of Results ........................................................................................................... 1-2References......................................................................................................................... 1-7
2 ELECTRICITY REQUIREMENTS FOR DELIVERY OF WATER BY PUBLIC SUPPLYAGENCIES ............................................................................................................................. 2-1
Fresh Water Treatment Process Descriptions and Unit Electricity Requirements ............... 2-1Surface Water Treatment Process Description .............................................................. 2-1Surface Water Treatment Unit Electricity Consumption.................................................. 2-2Groundwater Treatment Process Description ................................................................ 2-2Groundwater Treatment Unit Electricity Consumption.................................................... 2-3
Projected Electricity Requirements for Fresh Water Supply by Public Agencies................. 2-3Methodology .................................................................................................................. 2-3Public Water System Inventory ...................................................................................... 2-4Electricity Consumption Projections............................................................................... 2-4
Issues Related to Trends in Electricity Use for Supply of Fresh Water from PublicSupply Agencies................................................................................................................. 2-8
Trends in Unit Electricity Consumption .......................................................................... 2-8Power Quality Issues—Reliability of Supply................................................................... 2-9Other Issues and Observations.....................................................................................2-10
References........................................................................................................................2-10
3 ELECTRICITY REQUIREMENTS FOR WASTEWATER TREATMENT BY POTWSAND PRIVATE FACILITIES ................................................................................................... 3-1
Wastewater Treatment Process Descriptions and Unit Electricity Requirements ................ 3-1Trickling Filter Wastewater Treatment............................................................................ 3-1Activated Sludge Wastewater Treatment ....................................................................... 3-2Advanced Wastewater Treatment.................................................................................. 3-3

x
Unit Electricity Consumption for POTWs........................................................................ 3-4Projected Electricity Requirements for Wastewater Treatment by POTWs ......................... 3-6
Methodology .................................................................................................................. 3-6POTW Inventory ............................................................................................................ 3-7Electricity Consumption Projections for POTWs ............................................................ 3-9
Issues Related to Trends in Electricity Use for Wastewater Treatment by POTWs............3-12Trends in Unit Electricity Consumption .........................................................................3-12Power Quality Issues—Reliability of Supply..................................................................3-12
Electricity Use in Privately Operated Wastewater Treatment Works ..................................3-13References........................................................................................................................3-14
4 ELECTRICITY REQUIREMENTS FOR SUPPLY OF WATER BY END-USERS ................. 4-1Domestic Sector ................................................................................................................. 4-1
Characterization of Sector ............................................................................................. 4-1Unit Electricity Consumption .......................................................................................... 4-4Electricity Consumption Projection................................................................................. 4-4
Commercial Sector............................................................................................................. 4-5Characterization of Sector ............................................................................................. 4-5Unit Electricity Consumption .......................................................................................... 4-5Electricity Consumption Projection................................................................................. 4-7
Industrial and Mining .......................................................................................................... 4-8Characterization of Sectors............................................................................................ 4-8Unit Electricity Consumption .........................................................................................4-11Electricity Consumption Projections..............................................................................4-11
Irrigation and Livestock......................................................................................................4-13Characterization of Sector ............................................................................................4-13Unit Electricity Consumption .........................................................................................4-16Electricity Consumption Projections..............................................................................4-16
Power Generation .............................................................................................................4-18Characterization of Sector ............................................................................................4-18Unit Electricity Consumption .........................................................................................4-20Electricity Consumption Projection................................................................................4-20
References........................................................................................................................4-22

xi
A SUPPORTING DATA..........................................................................................................A-1Population Growth Projections ........................................................................................... A-1Electricity Consumption for Fresh Water Supply by Public Water Supply Agencies............ A-3Electricity Consumption for Wastewater Treatment by POTWs .......................................... A-6Electricity Consumption for Water Supply by End-Users .................................................... A-8
Domestic Sector ............................................................................................................ A-8Commercial Sector ........................................................................................................ A-9Industrial and Mining Sectors....................................................................................... A-10Irrigation and Livestock ................................................................................................ A-12Thermal Power Generation.......................................................................................... A-15
References....................................................................................................................... A-19


xiii
LIST OF FIGURES
Figure 2-1 Representative Surface Water Treatment Plant Process (with Typical DailyElectricity Consumption for a 10 Million Gallon/Day Facility)............................................ 2-2
Figure 2-2 Baseline Regional Energy Consumption Projection for Water Supply byPublic Water Supply Agencies......................................................................................... 2-6
Figure 2-3 Regional Energy Consumption Projections for Water Supply by Public WaterSupply Agencies–Reduced Unit Energy Consumption .................................................... 2-6
Figure 2-4 Regional Energy Consumption Projections for Water Supply by Public WaterSupply Agencies–Increased Unit Energy Consumption ................................................... 2-7
Figure 2-5 Regional Energy Consumption Projections for Water Supply by Public WaterSupply Agencies–Reduced Per Capita Water Consumption............................................ 2-7
Figure 2-6 Regional Energy Consumption Projections for Water Supply by Public WaterSupply Agencies–Increased Per Capita Water Consumption .......................................... 2-8
Figure 2-7 National Energy Consumption Projections for Water Supply by Public WaterSupply Agencies–Baseline and Sensitivity Cases ........................................................... 2-9
Figure 3-1 Representative Trickling Filter Wastewater Treatment Process ............................. 3-2Figure 3-2 Representative Activated Sludge Wastewater Treatment Process Sequence
(with Typical Daily Electricity Consumption for a 10 Million Gallons/Day Facility) ............ 3-3Figure 3-3 Representative Advanced Wastewater Treatment Process Sequence (with
Typical Daily Electricity Consumption’s for a 10 Million Gallons/Day Facility) .................. 3-4Figure 3-4 Variations in Unit Electricity Consumption with Size for Representative
Wastewater Treatment Processes................................................................................... 3-6Figure 3-5 Baseline Regional Energy Consumption Projections for Wastewater
Treatment by POTWs.....................................................................................................3-10Figure 3-6 Regional Energy Consumption Projections for Wastewater Treatment by
POTWs—2.5 Percent Increase in Unit Electricity Consumption......................................3-10Figure 3-7 Regional Energy Consumption Projections for Wastewater Treatment by
POTWs—5 Percent Increase in Unit Electricity Consumption.........................................3-11Figure 3-8 National Energy Consumption Projections Wastewater Treatment by
POTWs–Baseline and Sensitivity Cases ........................................................................3-11Figure 4-1 Baseline Regional Energy Consumption Projection for the Domestic Sector.......... 4-4Figure 4-2 Baseline Regional Energy Consumption Projection for the Commercial Sector ..... 4-7Figure 4-3 Baseline Regional Energy Consumption Projection for the Industrial Sector .........4-12Figure 4-4 Baseline Regional Energy Consumption Projection for the Mining Sector.............4-12Figure 4-5 Baseline Regional Energy Consumption Projection for Irrigation...........................4-17Figure 4-6 Baseline Regional Energy Consumption Projection for Livestock..........................4-17

xiv
Figure 4-7 Baseline Regional Energy Consumption Projection for Thermal PowerGeneration .....................................................................................................................4-22
Figure A-1 DOE Generation Regions ................................................................................... A-17

xv
LIST OF TABLES
Table 1-1 Summary of Unit Energy (Electric) Consumption for Water Supply andWastewater Treatment .................................................................................................... 1-4
Table 1-2 Summary of Electricity Consumption Projections for Water Supply andWastewater Treatment .................................................................................................... 1-5
Table 1-3 Forecast Total Electricity Consumption for all Sectors............................................ 1-6Table 2-1 Unit Electricity Consumption for Surface Water Treatment Plants .......................... 2-3Table 2-2 Summary Data of Public Water Systems -- 1999.................................................... 2-5Table 2-3 Size Distribution of Public Water Systems -- 1999.................................................. 2-5Table 3-1 Unit Electricity Consumption for Wastewater Treatment by Size of Plant ............... 3-5Table 3-2 Number of Wastewater Facilities by Flow Range ................................................... 3-8Table 3-3 Number of Wastewater Treatment Facilities by Level of Treatment........................ 3-9Table 4-1 Supply of Fresh Water by Source 1995.................................................................. 4-2Table 4-2 Supply of Fresh Water to the Domestic Sector 1995 .............................................. 4-3Table 4-3 Supply of Fresh Water to the Commercial Sector 1995.......................................... 4-6Table 4-4 Supply of Fresh Water to the Industrial Sector 1995 .............................................. 4-9Table 4-5 Supply of Fresh Water to the Mining Industry 1995 ...............................................4-10Table 4-6 Supply of Fresh Water for Irrigation 1995..............................................................4-14Table 4-7 Supply of Fresh Water for Livestock 1995.............................................................4-15Table 4-8 Supply of Fresh Water for Thermal Power Generation 1995 .................................4-19Table 4-9 Average Water Requirements for Thermal Power Plant Cooling. ..........................4-21Table A-1 Population Growth Projections by Region.............................................................. A-1Table A-2 Compound Annual Population Growth Rates by Region........................................ A-2Table A-3 Baseline Regional Energy Consumption Projection for Water Supply by
Public Water Supply Agencies......................................................................................... A-3Table A-4 Regional Energy Consumption Projection for Water Supply by Public Water
Supply Agencies–Reduced Unit Energy Consumption .................................................... A-4Table A-5 Regional Energy Consumption Projection for Water Supply by Public Water
Supply Agencies–Increased Unit Energy Consumption ................................................... A-4Table A-6 Regional Energy Consumption Projection for Water Supply by Public Water
Supply Agencies–Reduced Per Capita Water Consumption............................................ A-5Table A-7 Regional Energy Consumption Projection for Water Supply by Public Water
Supply Agencies–Increased Per Capita Water Consumption .......................................... A-5Table A-8 Baseline Regional Energy Consumption Projection for Wastewater Treatment
by POTWs....................................................................................................................... A-6
xvi
Table A-9 Regional Energy Consumption Projection for Wastewater Treatment byPOTWs—2.5 Percent Increase in Unit Electricity Consumption....................................... A-7
Table A-10 Regional Energy Consumption Projection for Wastewater Treatment byPOTWs – 5 Percent Increase in Unit Electricity Consumption ......................................... A-7
Table A-11 Baseline Regional Energy Consumption Projection for Water Supply by theDomestic Sector .............................................................................................................. A-8
Table A-12 Commercial Sector Growth Projections ............................................................... A-9Table A-13 Baseline Regional Energy Consumption Projection for Water Supply by the
Commercial Sector.......................................................................................................... A-9Table A-14 Industrial Sector Growth Projections .................................................................. A-10Table A-15 Baseline Regional Energy Consumption Projection for Water Supply by the
Industrial Sector ............................................................................................................ A-10Table A-16 Mining Sector Growth Projections...................................................................... A-11Table A-17 Baseline Regional Energy Consumption Projection for Water Supply by the
Mining Sector ................................................................................................................ A-11Table A-18 Areas Under Irrigation by Region....................................................................... A-12Table A-19 Compound Annual Irrigation Growth Rates by Region....................................... A-13Table A-20 Baseline Regional Energy Consumption Projection for Water Supply for
Irrigation ........................................................................................................................ A-13Table A-21 Baseline Regional Energy Consumption Projection for Water Supply for
Livestock ....................................................................................................................... A-14Table A-22 Projected Thermal Electricity Generation ........................................................... A-15Table A-23 Estimated Cooling Water Use for Thermal Generation....................................... A-16Table A-24 Baseline Regional Energy Consumption Projection for Make-up and Once
Through Cooling Water Supply for Thermal Power Generation ..................................... A-18
1-1
1 INTRODUCTION AND SUMMARY
Introduction
The use of electricity for public and private supply of water and for wastewater treatment is animportant factor in economic growth and sustainability in the United States. As the economygrows, all sectors increase their demand for fresh water and generate additional quantities ofwastewater that must be treated before discharge.
This report estimates unit electricity requirements for the supply of fresh water and the treatmentof wastewater across the U.S. economy. These unit electricity requirements are then used toproject total electricity requirements for selected sectors of the economy. Sectors included inthis analysis include:
• Public water supply agencies
• Publicly owned wastewater treatment facilities and privately operated wastewater treatmentfacilities
• Self-supply of water to the domestic, commercial, industrial, mining, irrigation, livestock,and thermal power generation sectors
The main question addressed by the study is: “Will there be sufficient electricity available tosatisfy the country’s need for fresh water.” In order to make this assessment, unit electricityrequirements for water supply and wastewater treatment were estimated. These were used inconjunction with projections of water consumption requirements for various economic sectors todevelop aggregate electricity requirements for the period 2000 through 2020, with anextrapolation to the year 2050. Where possible, projections were carried out for each of the ninegeographical areas defined by the U.S. Census Bureau.
The projections of electricity requirements for water delivery and wastewater treatment were alsocompared to a national forecast of electricity consumption by sector through the year 2020 [1] todetermine whether the estimates were reasonable. Further, issues and caveats regarding theforecast estimates were identified, and to the extent possible their impact on the estimates wasqualified and quantified.
Introduction and Summary
1-2
Summary of Results
The key contributions of this study include:
• For the first time, unit energy (electric) requirements have been estimated for all end-usesectors and for thermal power generation, with respect to water supply and treatment.
• Generally, electricity demand associated with water supply and treatment for various end-usesectors, will likely track Bureau of Census population growth projections of 50% by the year2050, with the exception of irrigation pumping and industrial (excluding mining) uses, bothof which will triple over that period. Thermal power generation electricity requirementsassociated with water use will remain relatively flat.
• Some 4% of the nation’s electricity use goes towards moving (80%) and treatingwater/wastewater. Approximately 80% of municipal water processing and distribution costsare for electricity. Electricity availability, while critical for water supply and wastewaterprocessing, is not a major impediment to economic development. However, water is a keyconstraint on such development, and will strongly affect the overall demand for electricityfrom human activities – which depend on water availability.
• Groundwater supply of water from public sources requires about 30% more electricity on aunit basis than supply from surface water. The difference is due primarily to a higherrequirement for raw water pumping for groundwater systems.
• Of the end-use sectors, the industrial sector uses the most self-supplied percentage (80%); themining subsector uses nearly 100% self-supplied water.
• Factors that could increase unit energy (electric) consumption for public supply/treatmentagencies include
-- The age of the water delivery system: as systems age friction in piping increases andefficiency of pumping systems decreases, resulting in an increase in electricityrequirements for pumping
-- Implementation of voluntary or mandatory restrictions on water consumption (includingapplication of home appliance and plumbing fixture water consumption standards): waterconservation programs will should reduce the overall amount of electricity required, butmay actually result in an increase in unit electricity consumption as economies of scalemay be lost or systems operate at below optimum levels
-- Requirements for improved treatment: as standards and requirements for drinking waterquality increase, more rigorous treatment will be required. Regardless of the type ofenhanced treatment employed, more rigorous treatment will result in increased pumpingenergy requirements
-- The additional water pumping associated with advanced wastewater treatment results in 3times the electricity use of a conventional trickling filter approach. In fact, this differenceleads to the expectation of a 20% increase in electricity use by public supply agenciesfrom 2000 to 2005; the projection for the next 45 years after that is only another 20%,since major treatment approach changeovers will have been completed in the first fiveyear period.

Introduction and Summary
1-3
• Factors that could decrease unit energy (electric) consumption for public supply/treatmentagencies include
-- Economies of scale: a trend to larger systems from smaller systems will provideeconomies of scale of operation, resulting in reduced unit electricity consumption
-- Replacement of older equipment with more energy efficient pumps, drives, and waterprocessing equipment
• Conclusions about privately operated wastewater treatment works include-- The average size of privately owned wastewater treatment facilities will fall into the
smallest size range of publicly owned treatment works.
-- Wastewater treatment facilities associated with industrial plants are designed to deal withspecific contaminants generated by the facilities – for instance, wastewater treatmentplants associated with food processing and pulp and paper facilities are designed to dealwith higher loadings/concentrations of BOD and COD than municipal facilities.Municipal wastewater treatment facilities are typically designed to handle domesticwastes, in terms of both volume and concentration of waste.
-- Given the smaller size and potentially higher loadings, the unit electricity consumption ofthese types of facilities will tend to be higher than for POTWs. A reasonable estimate ofunit electricity consumption would be about 2,500 kWh/million gallons (0.661 kWh/cubicmeter).
-- Since discharges from these facilities are typically to surface water, it is likely that moreaggressive wastewater treatment will be required over the next 20 years – this is likely toincrease unit electricity consumption over the period by perhaps 5 to 10 percent.
-- It is expected that more privately operated wastewater treatment facilities will beconstructed over the next 20 years. These facilities would provide either full treatmentfollowed by discharge to surface water, or pretreatment to reduce concentrations tosignificantly reduced levels before discharge to POTWs. In the latter case, the industrialfacilities may be currently discharging untreated wastewater directly to a POTW fortreatment. As municipally owned wastewater treatment facilities are starting to reach theirtreatment limits, it is often less expensive for industrials to engage in pretreatment ratherthan to pay the increasing surcharges imposed on their higher concentration discharges.Hence, the total amount of electricity required to process wastewater in privately operatedfacilities is expected to increase over the 50 year horizon.
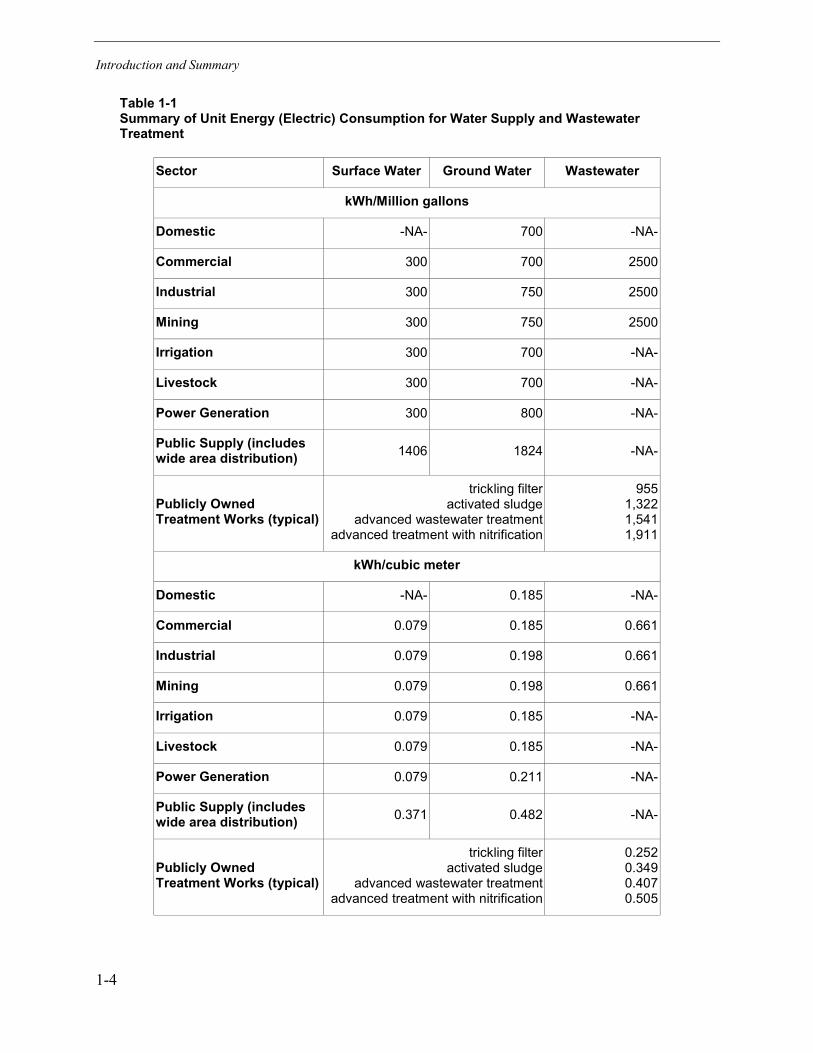
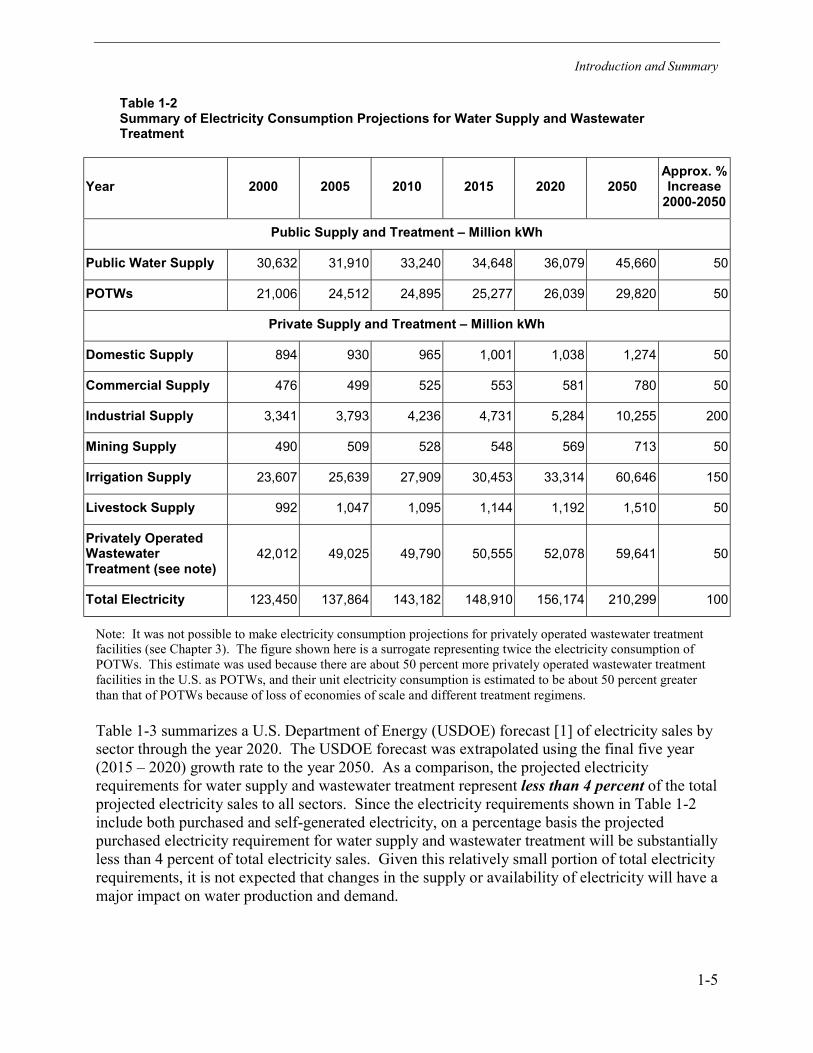
Table 1-1 summarizes the unit energy (electricity) consumption for sectoral and thermal powergeneration water movement and treatment. Table 1-2 summarizes the results of this analysis forsectoral electricity requirements for public and self-supply of fresh water and wastewatertreatment. These electricity requirements do not take into account the source of the electricityfor each of the sectors, which will be a combination of purchased electricity and self-generatedelectricity. Therefore, these projections overestimate the amount of electricity required frompublic utilities to meet requirements for fresh water and wastewater treatment.
Introduction and Summary
1-4
Table 1-1Summary of Unit Energy (Electric) Consumption for Water Supply and WastewaterTreatment
Sector Surface Water Ground Water Wastewater
kWh/Million gallons
Domestic -NA- 700 -NA-
Commercial 300 700 2500
Industrial 300 750 2500
Mining 300 750 2500
Irrigation 300 700 -NA-
Livestock 300 700 -NA-
Power Generation 300 800 -NA-
Public Supply (includeswide area distribution) 1406 1824 -NA-
Publicly OwnedTreatment Works (typical)
trickling filter activated sludge
advanced wastewater treatmentadvanced treatment with nitrification
9551,3221,5411,911
kWh/cubic meter
Domestic -NA- 0.185 -NA-
Commercial 0.079 0.185 0.661
Industrial 0.079 0.198 0.661
Mining 0.079 0.198 0.661
Irrigation 0.079 0.185 -NA-
Livestock 0.079 0.185 -NA-
Power Generation 0.079 0.211 -NA-
Public Supply (includeswide area distribution) 0.371 0.482 -NA-
Publicly OwnedTreatment Works (typical)
trickling filter activated sludge
advanced wastewater treatmentadvanced treatment with nitrification
0.2520.3490.4070.505
Introduction and Summary
1-5
Table 1-2Summary of Electricity Consumption Projections for Water Supply and WastewaterTreatment
Year 2000 2005 2010 2015 2020 2050Approx. %Increase
2000-2050
Public Supply and Treatment – Million kWh
Public Water Supply 30,632 31,910 33,240 34,648 36,079 45,660 50
POTWs 21,006 24,512 24,895 25,277 26,039 29,820 50
Private Supply and Treatment – Million kWh
Domestic Supply 894 930 965 1,001 1,038 1,274 50
Commercial Supply 476 499 525 553 581 780 50
Industrial Supply 3,341 3,793 4,236 4,731 5,284 10,255 200
Mining Supply 490 509 528 548 569 713 50
Irrigation Supply 23,607 25,639 27,909 30,453 33,314 60,646 150
Livestock Supply 992 1,047 1,095 1,144 1,192 1,510 50
Privately OperatedWastewaterTreatment (see note)
42,012 49,025 49,790 50,555 52,078 59,641 50
Total Electricity 123,450 137,864 143,182 148,910 156,174 210,299 100
Note: It was not possible to make electricity consumption projections for privately operated wastewater treatmentfacilities (see Chapter 3). The figure shown here is a surrogate representing twice the electricity consumption ofPOTWs. This estimate was used because there are about 50 percent more privately operated wastewater treatmentfacilities in the U.S. as POTWs, and their unit electricity consumption is estimated to be about 50 percent greaterthan that of POTWs because of loss of economies of scale and different treatment regimens.
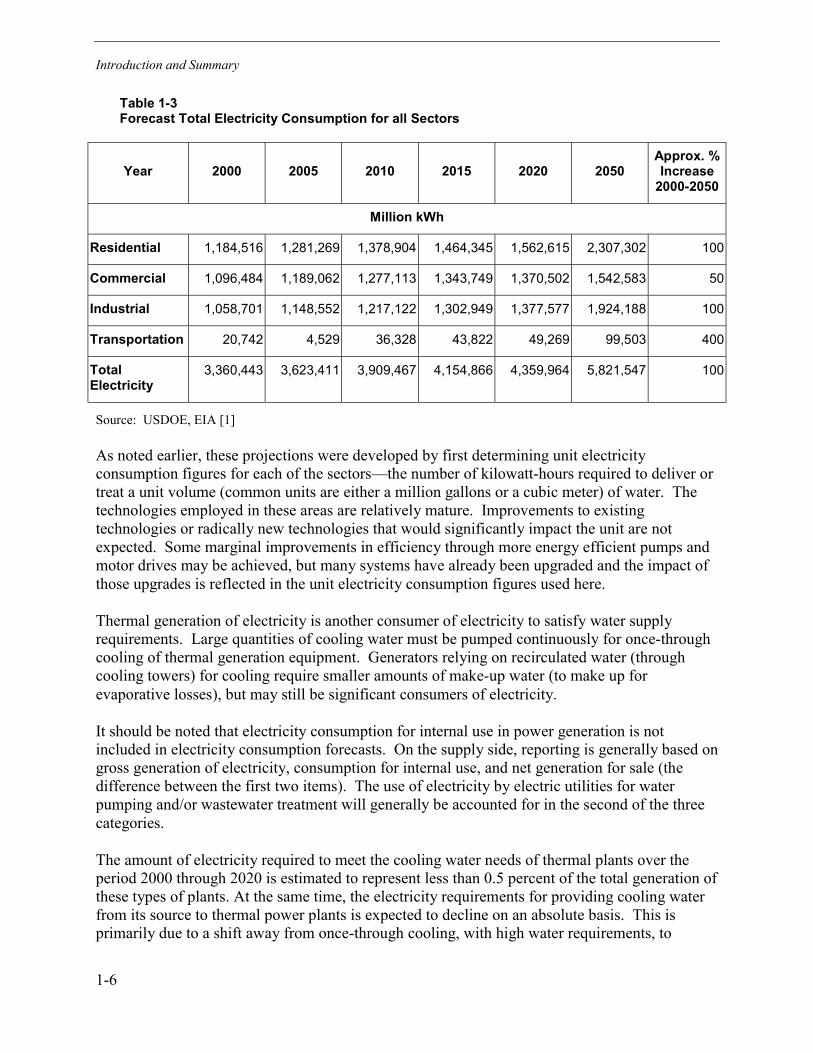
Table 1-3 summarizes a U.S. Department of Energy (USDOE) forecast [1] of electricity sales bysector through the year 2020. The USDOE forecast was extrapolated using the final five year(2015 – 2020) growth rate to the year 2050. As a comparison, the projected electricityrequirements for water supply and wastewater treatment represent less than 4 percent of the totalprojected electricity sales to all sectors. Since the electricity requirements shown in Table 1-2include both purchased and self-generated electricity, on a percentage basis the projectedpurchased electricity requirement for water supply and wastewater treatment will be substantiallyless than 4 percent of total electricity sales. Given this relatively small portion of total electricityrequirements, it is not expected that changes in the supply or availability of electricity will have amajor impact on water production and demand.
Introduction and Summary
1-6
Table 1-3Forecast Total Electricity Consumption for all Sectors
Year 2000 2005 2010 2015 2020 2050Approx. %Increase
2000-2050
Million kWh
Residential 1,184,516 1,281,269 1,378,904 1,464,345 1,562,615 2,307,302 100
Commercial 1,096,484 1,189,062 1,277,113 1,343,749 1,370,502 1,542,583 50
Industrial 1,058,701 1,148,552 1,217,122 1,302,949 1,377,577 1,924,188 100
Transportation 20,742 4,529 36,328 43,822 49,269 99,503 400
TotalElectricity
3,360,443 3,623,411 3,909,467 4,154,866 4,359,964 5,821,547 100
Source: USDOE, EIA [1]
As noted earlier, these projections were developed by first determining unit electricityconsumption figures for each of the sectors—the number of kilowatt-hours required to deliver ortreat a unit volume (common units are either a million gallons or a cubic meter) of water. Thetechnologies employed in these areas are relatively mature. Improvements to existingtechnologies or radically new technologies that would significantly impact the unit are notexpected. Some marginal improvements in efficiency through more energy efficient pumps andmotor drives may be achieved, but many systems have already been upgraded and the impact ofthose upgrades is reflected in the unit electricity consumption figures used here.
Thermal generation of electricity is another consumer of electricity to satisfy water supplyrequirements. Large quantities of cooling water must be pumped continuously for once-throughcooling of thermal generation equipment. Generators relying on recirculated water (throughcooling towers) for cooling require smaller amounts of make-up water (to make up forevaporative losses), but may still be significant consumers of electricity.
It should be noted that electricity consumption for internal use in power generation is notincluded in electricity consumption forecasts. On the supply side, reporting is generally based ongross generation of electricity, consumption for internal use, and net generation for sale (thedifference between the first two items). The use of electricity by electric utilities for waterpumping and/or wastewater treatment will generally be accounted for in the second of the threecategories.
The amount of electricity required to meet the cooling water needs of thermal plants over theperiod 2000 through 2020 is estimated to represent less than 0.5 percent of the total generation ofthese types of plants. At the same time, the electricity requirements for providing cooling waterfrom its source to thermal power plants is expected to decline on an absolute basis. This isprimarily due to a shift away from once-through cooling, with high water requirements, to
Introduction and Summary
1-7
cooling using recycled water (e.g. wet cooling towers) and the expected increased use of drycooling towers, where no water is lost from the system. These latter types of cooling systemsrequire significantly less water than once-through cooling, because of their drastically lowermake-up water need. They therefore consume much less electricity for pumping of make-upwater. However, total power plant electricity consumption for cooling tower technology issimilar to once-through cooling requirements, with pumping for water recirculation through thecooling tower approximately equal to the difference in make-up water requirements.
References
Annual Energy Outlook, 2000, U.S. Department of Energy, Energy Information Agency,Washington DC: 2000. Appendix A. This document can be downloaded from the forecastsections of the EIA website at http://www.eia.doe.gov.


2-1
2 ELECTRICITY REQUIREMENTS FOR DELIVERY OFWATER BY PUBLIC SUPPLY AGENCIES
This chapter describes the methodology used to estimate and project electricity requirements forthe delivery of fresh water by public water supply agencies to end consumers in all sectors.
This chapter describes the methodology used to estimate and project electricity requirements forthe delivery of water by water supply agencies. A brief process description of the types oftreatment used is provided for background and context. The future projections of electricity forpublic water supply agency are also provided in this chapter.
Fresh Water Treatment Process Descriptions and Unit ElectricityRequirements
Fresh water is derived from two main sources in the United States. The first is surface water:lakes, rivers or other bodies of water. The second is groundwater or wells. While some freshwater is derived from desalinization of sea water, this is an extremely small portion of the totaland is not considered further here.
Surface Water Treatment Process Description
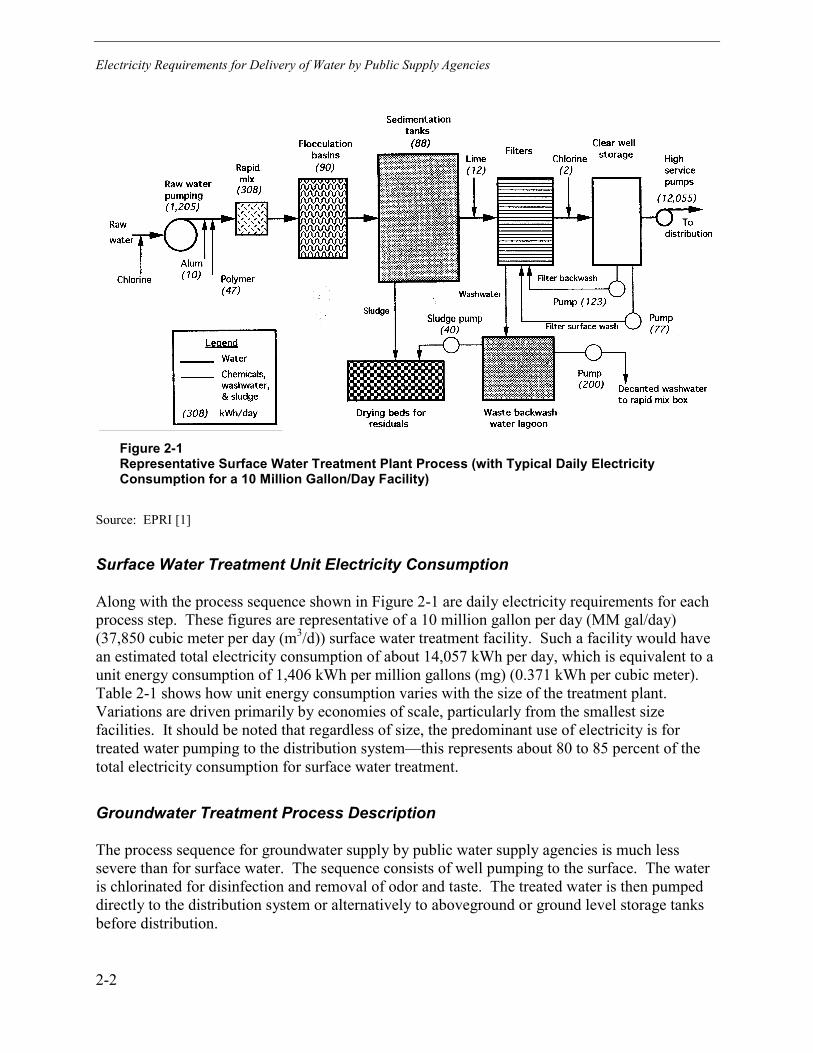
In a typical sequence of operations for surface water treatment, the following steps are followed(refer to Figure 2-1). Raw water is first screened to remove gross debris and contaminants. Thewater is then pre-oxidized using chlorine or ozone treatment to kill any disease-carryingorganisms and to remove taste or odor causing substances. Alum and/or polymeric materials areadded to the water to aid in the flocculation and coagulation of finer particles. The flocculationstep serves to agglomerate finer particles that can then be settled out or removed in thesedimentation and filtration steps. A second disinfection step kills any remaining disease-causing organisms and leaves a disinfectant residue that is carried into the distribution system toprevent the growth of any organisms. The clearwell storage allows contact time for disinfectionand provides surge capacity for the distribution system to meet system demand. The treatedwater is then distributed to consumers by high pressure pumping. Sludges and other impuritiesremoved from the fresh water are concentrated and disposed of.
Electricity Requirements for Delivery of Water by Public Supply Agencies
2-2
Figure 2-1Representative Surface Water Treatment Plant Process (with Typical Daily ElectricityConsumption for a 10 Million Gallon/Day Facility)
Source: EPRI [1]
Surface Water Treatment Unit Electricity Consumption
Along with the process sequence shown in Figure 2-1 are daily electricity requirements for eachprocess step. These figures are representative of a 10 million gallon per day (MM gal/day)(37,850 cubic meter per day (m3/d)) surface water treatment facility. Such a facility would havean estimated total electricity consumption of about 14,057 kWh per day, which is equivalent to aunit energy consumption of 1,406 kWh per million gallons (mg) (0.371 kWh per cubic meter).Table 2-1 shows how unit energy consumption varies with the size of the treatment plant.Variations are driven primarily by economies of scale, particularly from the smallest sizefacilities. It should be noted that regardless of size, the predominant use of electricity is fortreated water pumping to the distribution system—this represents about 80 to 85 percent of thetotal electricity consumption for surface water treatment.
Groundwater Treatment Process Description
The process sequence for groundwater supply by public water supply agencies is much lesssevere than for surface water. The sequence consists of well pumping to the surface. The wateris chlorinated for disinfection and removal of odor and taste. The treated water is then pumpeddirectly to the distribution system or alternatively to aboveground or ground level storage tanksbefore distribution.

Electricity Requirements for Delivery of Water by Public Supply Agencies
2-3
Table 2-1Unit Electricity Consumption for Surface Water Treatment Plants
Treatment Plant Size Unit Electricity Consumption
1 MM gal/day (3,785 m3/d) 1,483 kWh/MM gal (0.392 kWh/m3)
5 MM gal/day (18,925 m3/d) 1,418 kWh/MM gal (0.375 kWh/m3)
10 MM gal/day (37,850 m3/d) 1,406 kWh/MM gal (0.371 kWh/m3)
20 MM gal/day (75,700 m3/d) 1,409 kWh/MM gal (0.372 kWh/m3)
50 MM gal/day (189,250 m3/d) 1,408 kWh/MM gal (0.372 kWh/m3)
100 MM gal/day (378,500 m3/d) 1,407 kWh/MM gal (0.372 kWh/m3)
Source: EPRI [1]
Groundwater Treatment Unit Electricity Consumption
Unit electricity consumption for supply from groundwater is estimated at 1,824 kWh/milliongallons (0.482 kWh/m3) [1], some 30% greater than for surface water. This appears to beindependent of the size of the pumping and treatment facility. The predominant consumer ofelectricity is pumping. About one-third of the electricity is used for well pumping, while themost of the balance is used for booster pumping into the distribution system. Less than 0.5percent of the electricity is used for chlorination of the water.
Projected Electricity Requirements for Fresh Water Supply by PublicAgencies
Methodology
The unit electricity consumption estimates for surface water and groundwater supply of freshwater were used along with a 1999 inventory of public water supply systems to estimate baselineelectricity consumption for the United States. The inventory is maintained by the U.S.Environmental Protection Agency (USEPA) in the Safe Drinking Water Information System [2].The inventory characterizes approximately 30,000 public water supply systems in the UnitedStates by source of water (ground or surface water), size. Water systems are furthercharacterized as community water systems and transient and non-transient non-community watersystems1 and by the population served.
1 All public water systems have at least 15 service connections or serve at least 25 people per day for 60 days peryear. Community water systems are public water systems serving the same population throughout the year; mostresidences in cities and towns are served by community water systems. Non-community water systems are publicwater systems that do not serve the same population year round. A non-transient non-community water systemserves the same people more than six months per year, but not year round (e.g. a school with its own water supply).

Electricity Requirements for Delivery of Water by Public Supply Agencies
2-4
Based on the size of the system and the source of raw water, a unit energy consumption figurewas assigned to each. Further, per capita daily water consumption estimates were assigned toeach of the systems. For community water systems, a per capita consumption of 200 gallons perday (757 liter per day) was assumed; for non-community systems a lower figure of 150 gallonsper day was assumed [1].
System by system baseline daily and annual electricity consumption estimates were generatedand summed for each of the nine U.S. census regions. These baseline regional electricityconsumption estimates were used to develop projections out to the year 2050 using the U.S.Department of Commerce (USDOC) Census Bureau projections of population growth by region.The assumption is that the aggregate supply of fresh water and therefore the electricityconsumption to provide that supply will follow the general trend in population growth.Population growth projections and compound annual growth rates derived from these data areshown in the Appendix.
Sensitivity analyses were conducted to assess the impact on electricity consumption of changesin per capita water consumption and variations in unit electricity consumption for the varioustypes of systems.
Public Water System Inventory
The summary inventory and characteristics of public water systems for 1999 is shown in Tables2-2 and 2-3. Table 2-2 enumerates the inventory by type (community and non-communitysystem), by source of water (ground or surface), and by population served. Table 2-3 breaks theinventory of public water systems down by size of population served.
Electricity Consumption Projections
The baseline regional electricity consumption projections for supply of fresh water by publicwater supply agencies is shown graphically in Figure 2-2 and in tabular form in the Appendix.Electricity consumption is estimated at about 30 billion kWh for the year 2000. This is expectedto reach about 36 billion kWh by the year 2020 and 46 billion kWh by 2050.
Sensitivity analyses were conducted to determine the impact on projected electricityconsumption of downward and upward variations in unit electricity consumption and per capitawater consumption. The results of these cases are illustrated in Figures 2-3 through 2-6. Resultsare presented in tabular form in the Appendix.
Figure 2-7 presents a summary of the projections on a national basis showing how the baselinecase is bounded by the sensitivity cases. In the year 2000, the national baseline electricityconsumption is estimated at 30 billion kWh and is bounded by a sensitivity of about ±. 22percent of the baseline case.
A transient non-community water system serves the public but not the same individuals for more than six months;for example, a rest area or campground can be considered a transient water system.

Electricity Requirements for Delivery of Water by Public Supply Agencies
2-5
The projection out to the year 2020 shows a baseline national energy consumption projection ofabout 36 billion kWh, bounded by a similar sensitivity of about ± 22 percent of the baseline case.
Table 2-2Summary Data of Public Water Systems -- 1999
Primary Water Source Population ServedPublic WaterSystems Source Number Percent Million Percent
Surface 10,728 20 167 66
Ground 43,195 80 86 34Community
Total 53,923 100 253 100
Surface 2,671 2 2 8
Ground 111,140 98 21 92Non-Community
Total 113,811 100 23 100
Surface 13,399 8 169 61
Ground 154,335 92 107 39Total
Total 167,734 100 276 100
Source: USEPA Office of Wastewater Management [4]
Table 2-3Size Distribution of Public Water Systems -- 1999
Population Size Range
< 500 501 –3,300
3,301 –10,000
10,001 –100,000
>100,000 Totals
Number of Systems 31,904 14,040 4,355 3,276 347 53,923
Population Served(millions) 5.2 19.8 23.4 91.0 112.4 253.8
Com
mun
ity W
ater
Syst
ems
Percent ofPopulation served 2.0 8.0 10.0 36.0 44.0 100.0
Number of Systems 107,923 5,509 253 114 12 113,811
Population Served(millions) 9.9 5.4 1.4 3.6 2.8 23.1
Non
-Com
mun
ityW
ater
Sys
tem
s
Percent ofPopulation served 43.0 23.0 6.0 16.0 12.0 100.0
Source: USEPA Office of Wastewater Management [4]

Electricity Requirements for Delivery of Water by Public Supply Agencies
2-6
05
10152025
3035404550
2000 2005 2010 2015 2020 2050
billio
n kW
h/yr
East North Central East South Central Middle Atlantic
Mountain New England Pacific
South Atlantic West North Central West South Central
Figure 2-2Baseline Regional Energy Consumption Projection for Water Supply by Public WaterSupply Agencies
0
5
10
15
20
25
30
35
40
45
2000 2005 2010 2015 2020 2050
billio
n kW
h/yr
East North Central East South Central Middle Atlantic
Mountain New England Pacif ic
South Atlantic West North Central West South Central
Figure 2-3Regional Energy Consumption Projections for Water Supply by Public Water SupplyAgencies–Reduced Unit Energy Consumption

Electricity Requirements for Delivery of Water by Public Supply Agencies
2-7
0
10
20
30
40
50
60
2000 2005 2010 2015 2020 2050
billio
n kW
h/yr
East North Central East South Central Middle Atlantic
Mountain New England Pacif ic
South Atlantic West North Central West South Central
Figure 2-4Regional Energy Consumption Projections for Water Supply by Public Water SupplyAgencies–Increased Unit Energy Consumption
0
5
10
15
20
25
30
35
40
2000 2005 2010 2015 2020 2050
billio
n kW
h/yr
East North Central East South Central Middle Atlantic
Mountain New England Pacific
South Atlantic West North Central West South Central
Figure 2-5Regional Energy Consumption Projections for Water Supply by Public Water SupplyAgencies–Reduced Per Capita Water Consumption

Electricity Requirements for Delivery of Water by Public Supply Agencies
2-8
0
10
20
30
40
50
60
2000 2005 2010 2015 2020 2050
billio
n kW
h/yr
East North Central East South Central Middle Atlantic
Mountain New England Pacific
South Atlantic West North Central West South Central
Figure 2-6Regional Energy Consumption Projections for Water Supply by Public Water SupplyAgencies–Increased Per Capita Water Consumption
Issues Related to Trends in Electricity Use for Supply of Fresh Water fromPublic Supply Agencies
Trends in Unit Electricity Consumption
Unit electricity consumption in water supply is driven upward and downward by a number offactors. Factors that would tend to increase the unit electricity consumption for water supplyinclude:
• The age of the water delivery system: as systems age friction in piping increases, resulting inan increase in electricity requirements for pumping
• Implementation of voluntary or mandatory restrictions on water consumption (includingapplication of home appliance and plumbing fixture water consumption standards): waterconservation programs will should reduce the overall amount of electricity required, but mayactually result in an increase in unit electricity consumption as economies of scale may belost or systems operate at below optimum levels
• Requirements for improved treatment: as standards and requirements for drinking waterquality increase, treatment that is more rigorous will be required. Regardless of the type ofenhanced treatment employed, increased process will result in increased pumping energyrequirements.

Electricity Requirements for Delivery of Water by Public Supply Agencies
2-9
20
25
30
35
40
45
50
55
60
2000 2010 2020 2030 2040 2050
billio
n kW
h/yr
Baseline Projection Reduced Unit Electricity Consumption
Increased Unit Electricity Consumption Reduced Per Capita Water Use
Increased Per Capita Water Use
Figure 2-7National Energy Consumption Projections for Water Supply by Public Water SupplyAgencies–Baseline and Sensitivity Cases
Factors that would tend to decrease the unit electricity consumption for water supply include:
• Economies of scale: a trend to larger systems from smaller systems will provide economiesof scale of operation, resulting in reduced unit electricity consumption
• Replacement of older equipment with more energy efficient pumps, drives, and waterprocessing equipment
It is difficult to estimate the combined impact of all or some of these issues on unit and totalelectricity consumption. Currently, there are over 150,000 public water supply systems in theUnited States, and it is safe to say to few or none operate identically. As the population grows,additional systems will be added. Given the diversity of water supply systems, it is difficult topredict how electricity consumption will react to the net aggregate impact of these factors andissues. For the purpose of this exercise, it is probably adequate to note that unit electricityconsumption will most likely remain close to present levels or increase slightly over the next 20years. The slight increase would most likely be due to increased inefficiencies related to agingof existing equipment and the need for more aggressive water treatment to remove contaminantsto ensure a safe supply of drinking water. Further, the use of chlorine for disinfection hasbecome a subject of controversy, because of concerns of dioxin formation. The use of chlorinemay be reduced in favor of ozonation or UV treatment.
Power Quality Issues—Reliability of Supply
Most water processing facilities have backup power in case of electricity interruptions. Most ofthis is in the form of conventional diesel generator sets. Backup power is required to maintainthe security of system operations, given that water systems typically have little storage capacity

Electricity Requirements for Delivery of Water by Public Supply Agencies
2-10
compared to demand. At least one public agency (Orange County, California) is known tobypass electricity as a prime mover entirely in at least a portion of their operation—natural gasengine driven pumps are employed. This trend is apparently not widespread in the industry [5],with emissions being one major issue.
Other Issues and Observations
Electricity is probably the most costly input to fresh water treatment. Despite this it is interestingto note that few of the persons contacted in the preparation of this assessment who are associatedwith public supply agencies were able to provide information on the unit or total energyconsumption of their facilities.
References
1. Water and Wastewater Industries: Characteristics and Energy Management Opportunities: AReport That Describes How Electricity is Used and Can Be Managed Efficiently in Waterand Wastewater Treatment, EPRI, Palo Alto, CA: 1996. Product ID # CR-106491.
2. United States Environmental Protection Agency, Office of Water, Office of Groundwater andDrinking Water. Information on the Safe Drinking Water Information System (SDWIS)from the USEPA website at http://www.epa.goc/safewater/data/getdata.html where MicrosoftExcel versions of the databases can be downloaded.
3. “Current Population Reports: Population Projections,” United States Department ofCommerce, Economics and Statistics Administration, Census Bureau, Washington, DC:1997.
4. EPA Safe Drinking Water Information System Factoids 1999, United States EnvironmentalProtection Agency, Office of Water, Office of Wastewater Management, Washington, DC:2000. Downloaded from http://www.epa.goc/safewater/data/getdata.html
5. Personal communication, Howard Johnson, Water Production Supervisor, Orange CountyCity Water, Orange County, CA.

3-1
3 ELECTRICITY REQUIREMENTS FOR WASTEWATERTREATMENT BY POTWS AND PRIVATE FACILITIES
This chapter describes the methodology used to estimate and project electricity requirements forthe treatment of wastewater by publicly owned treatment works (POTWs) to end consumers inall sectors. A brief process description of the types of treatment used is provided for backgroundand context. The future projections of electricity for POTW use based on a baseline estimate arealso provided in this chapter.
Wastewater Treatment Process Descriptions and Unit ElectricityRequirements
There are many strategies and process sequences available for treatment of wastewater in theUnited States. Given that there are over 15,000 publicly owned wastewater treatment facilities(POTWs) in the United States, it is impossible to capture those variations in the estimation ofunit electricity consumption. Instead, four representative types of facilities will be used tocharacterize the larger population, with unit electricity consumption estimates for each of thesetypes provided over a range of sizes. The four types of treatment facilities to be included in thisanalysis are:
• Trickling Filter
• Activated Sludge
• Advanced Wastewater Treatment
• Advanced Wastewater Treatment with Nitrification
These four types of systems were chosen as being the most important wastewater treatmentfacilities, comprising a significant portion of the overall population of POTWs. All are based onbiological and chemical treatment of the wastewater. The sections below provide an overview ofthe sequence of operations of each of these processes.
Trickling Filter Wastewater Treatment
In the typical process sequence for a trickling filter wastewater treatment plant (see Figure 3-1),influent wastewater is screened to remove gross material carried in the stream. Finer particlesare then removed with an aerated grit removal system. The wastewater is held in a settlingvessel to remove other particulates before it is biologically treated in the trickling filter system.The trickling filter itself is a substrate over which the organic wastewater is passed. The

Electricity Requirements for Wastewater Treatment by POTWs and Private Facilities
3-2
trickling filter substrate supports the growth of bacteria that aerobically consume the organicmaterial. A secondary settling step removes other particulate matter. The treated wastewater isthen disinfected by chlorination before discharge. The remaining sludges may be further treatedbiologically to remove organic materials, then are thickened. A further anaerobic digestion stepremoves remaining organics, and the sludge is then dewatered mechanically and disposed of byincineration or by being sent to landfill.
Figure 3-1Representative Trickling Filter Wastewater Treatment Process
Source: EPRI [1]
Activated Sludge Wastewater Treatment
As with the previous system, incoming wastewater to the activated sludge process is firstscreened to remove gross contaminants, and then passes through a grit removal system to removesmaller particulate matter (refer to Figure 3-2). A primary settling chamber is used to removesmaller particulate and suspended matter and the effluent is then digested aerobically in anaeration tank. After sufficient residence time for digestion has passed, the wastewater stream ispumped to a secondary settling tank, for removal of digested material. After secondary settling,the treated wastewater is disinfected with chlorine and discharged. The sludge from primarysettling is similarly aerobically digested, then pumped to a settling tank to separate the liquidfrom the solid stream. The solids are thickened and then anaerobically digested for removal of

Electricity Requirements for Wastewater Treatment by POTWs and Private Facilities
3-3
remaining organic materials. The waste sludge is then dewatered and disposed of in landfill orby incineration.
Figure 3-2Representative Activated Sludge Wastewater Treatment Process Sequence (with TypicalDaily Electricity Consumption for a 10 Million Gallons/Day Facility)
Source: EPRI [1]
Advanced Wastewater Treatment
The advanced wastewater treatment process (see Figure 3-3) is similar to the activated sludgeprocess, but includes additional treatment in the form of filtration prior to discharge of thebiologically treated waste stream. These types of systems are more effective in removingnitrogen, phosphorus, and suspended solids by filtration. The front part of the process is similarto the activated sludge process. Incoming effluent is screened and grit is removed. After settlingto remove suspended solids, the wastewater is aerobically digested in an activated sludgeprocess. If nitrogen removal is required, bacteria specific for nitrification are used in this step.After secondary settling chemicals are injected into the waste stream to aid in agglomeration ofremaining solids, which are removed in the subsequent filtration step. After disinfection, thetreated water is discharged. The sludges are thickened, anaerobically digested, dewatered anddisposed of in landfill or by incineration.

Electricity Requirements for Wastewater Treatment by POTWs and Private Facilities
3-4
Figure 3-3Representative Advanced Wastewater Treatment Process Sequence (with Typical DailyElectricity Consumption’s for a 10 Million Gallons/Day Facility)
Source: EPRI [1]
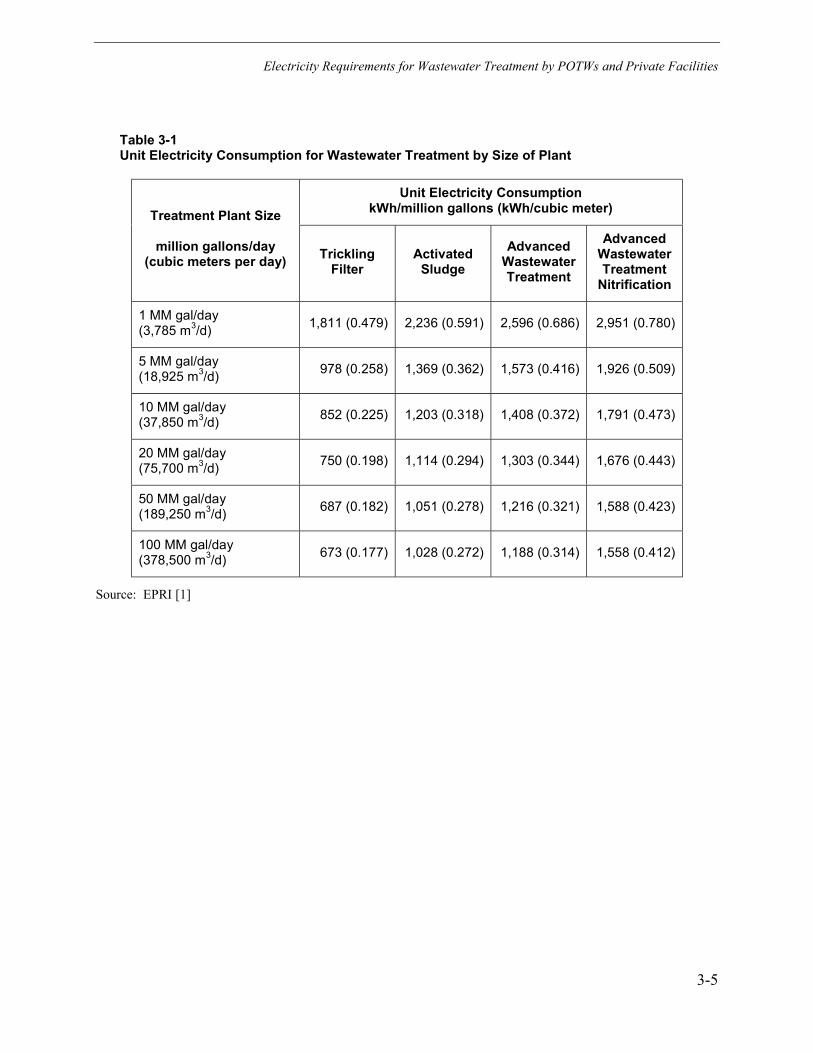
Unit Electricity Consumption for POTWs
Unit electricity consumption for the four processes are shown in Table 3-1, broken down by sizeof the treatment facility. Variation in unit electricity consumption with size is illustrated inFigure 3-4. As would be expected, the unit electricity consumption decreases with the size of theplant due to economies of scale. As also would be expected, unit electricity consumption ishigher as the degree of treatment and complexity of the process increases – advanced wastewatertreatment with nitrification is 3 times as energy intensive (due to additional pumpingrequirements) than the relatively simple trickling filter treatment.
Electricity Requirements for Wastewater Treatment by POTWs and Private Facilities
3-5
Table 3-1Unit Electricity Consumption for Wastewater Treatment by Size of Plant
Unit Electricity ConsumptionkWh/million gallons (kWh/cubic meter)Treatment Plant Size
million gallons/day(cubic meters per day) Trickling
FilterActivated
SludgeAdvanced
WastewaterTreatment
AdvancedWastewaterTreatment
Nitrification
1 MM gal/day(3,785 m3/d) 1,811 (0.479) 2,236 (0.591) 2,596 (0.686) 2,951 (0.780)
5 MM gal/day(18,925 m3/d) 978 (0.258) 1,369 (0.362) 1,573 (0.416) 1,926 (0.509)
10 MM gal/day(37,850 m3/d) 852 (0.225) 1,203 (0.318) 1,408 (0.372) 1,791 (0.473)
20 MM gal/day(75,700 m3/d) 750 (0.198) 1,114 (0.294) 1,303 (0.344) 1,676 (0.443)
50 MM gal/day(189,250 m3/d) 687 (0.182) 1,051 (0.278) 1,216 (0.321) 1,588 (0.423)
100 MM gal/day(378,500 m3/d) 673 (0.177) 1,028 (0.272) 1,188 (0.314) 1,558 (0.412)
Source: EPRI [1]

Electricity Requirements for Wastewater Treatment by POTWs and Private Facilities
3-6
0
500
1000
1500
2000
2500
3000
1 10 100
Capacity mgd
kWh
per m
g
Trickling Filter Activated Sludge
Advanced w /o Nitrif ication Advanced w ith Nitrif ication
Figure 3-4Variations in Unit Electricity Consumption with Size for Representative WastewaterTreatment Processes
Source: EPRI [1]
Projected Electricity Requirements for Wastewater Treatment by POTWs
Methodology
The unit electricity consumption estimates for the representative types of treatment processeswere used along with a 1996 inventory of publicly owned treatment works (POTWs) to estimatebaseline energy consumption for the United States. The inventory is maintained by the U.S.Environmental Protection Agency (USEPA) and forms the basis for the Clean Water NeedsSurvey, reported on a regular basis to Congress [2]. The underlying data for the surveycharacterizes approximately 15,000 POTWs currently in operation, and defines the need for anadditional 2,500 facilities to meet future needs.
Unit electricity requirements (kWh per million gallons) for the generic systems above wereaggregated over the range of capacities to yield a single value for national use projections:
• 955 kWh/million gallons (0.252 kWh/m3) for trickling filter systems
• 1,322 kWh/million gallons (0.349 kWh/m3) for activated sludge

Electricity Requirements for Wastewater Treatment by POTWs and Private Facilities
3-7
• 1,541 kWh/million gallons (0.407 kWh/m3) for advanced wastewater treatment withoutnitrification
• 1,911 kWh/million gallons (0.505 kWh/m3) for advanced wastewater treatment withnitrification
The value used for a level of treatment less than secondary2 was taken at about 50 percent of thevalue for activated sludge treatment (661 kWh/million gallons). For secondary treatment, aweighted unit value was used assuming 70 percent of capacity was activated sludge and 30percent was trickling filters; the weighted value is 1,212 kWh/million gallons. For advancedwastewater treatment, it was assumed 50 percent of the capacity included nitrification. Theweighted values are 1,578 and 1,726 kWh/million gallons, respectively. For no discharge andother, 400 kWh/million gallons was assumed. No allowance for onsite generation of electricityfrom biogas was included.
POTW Inventory
The summary inventory and characteristics of POTWs is shown in Tables 3-2 and 3-3. Table 3-2 lists the number of facilities by flow range and aggregate flow, while Table 3-3 shows thenumber of facilities by level of treatment and aggregate design flow. For comparison, data for1998 and 1996, the last two surveys are presented, to illustrate how the POTW inventory hasbeen changing over time. As can be seen, there has been a substantial increase in both thenumber of facilities and the aggregate flow. Further, there has been a trend toward largerfacilities, and toward facilities with more aggressive levels of wastewater treatment. Indeed, thenumber of facilities providing less than secondary levels of treatment in 1996 was one-tenth thenumber in the previous survey.
2 Primary treatment is designed to remove large solids (e.g., rags and debris) and smaller inorganic grit and is thefirst stage of each of the four representative processes (screening and settling). Secondary treatment removesorganic contaminants using microorganisms to consume biodegradable organics (e.g., activated sludge or tricklingfilters). Advanced treatment systems go beyond secondary treatment to include nitrification (to convert ammonia tonitrates), denitrification (to convert nitrates to nitrogen), physical-chemical treatment (to remove dissolved metalsand organics), and/or disinfection (to kill any remaining pathogens).

Electricity Requirements for Wastewater Treatment by POTWs and Private Facilities
3-8
Table 3-2Number of Wastewater Facilities by Flow Range
1988 1996Flow Rangemillion gallons/day(m3/day) Number of
facilities
Total designcapacity
MM gal/day(m3/day)
Number offacilities
Aggregateflow
MM gal/day(m3/day)
0.01 – 0.10(37.85 – 378.5) 5,983 259
(980,315) 6,444 287(1,086295)
0.11 – 1.00(378.6 – 3,785) 6,589 2,307
(8,731,995) 6,476 2,323(8,792,555)
1.01 – 10.0(3,786 – 37,850) 2,427 7,178
(27,168,730) 2,573 7,780(29,447,300)
10.1 – 100.0(37,851 – 378,500) 466 11,666
(44,155,810)
10.1 and over(37,851 and over) 466 18,992
(71,884,720)
100.1 and over(378,500 and over) 47 10,119
(38,300,415)
Unknown 146 --- 38 ---
Total 15,591 28,736(108,765,760) 16,024 32,175
(121,782,375)
Source: USEPA [2]

Electricity Requirements for Wastewater Treatment by POTWs and Private Facilities
3-9
Table 3-3Number of Wastewater Treatment Facilities by Level of Treatment
1988 1996
Level of Treatment Number offacilities
Total designcapacity
MM gal/day(m3/day)
Number offacilities
Total designcapacity
MM gal/day(m3/day)
Less than secondary 1,789 5,030(19,038,550) 176 3,054
(11,559,390)
Secondary 8,536 16,097(60,927,145) 9,388 17,734
(67,123,190)
Greater thansecondary 3,412 15,488
(58,622,080) 4,428 20,016(75,760,560)
No discharge 1,854 1,034(3,913,690) 2,032 1,421
(5,378,465)
Total 15,591 37,649(142,501,465) 16,024 42,225
(159,821,625)
Source: USEPA [2]
Electricity Consumption Projections for POTWs
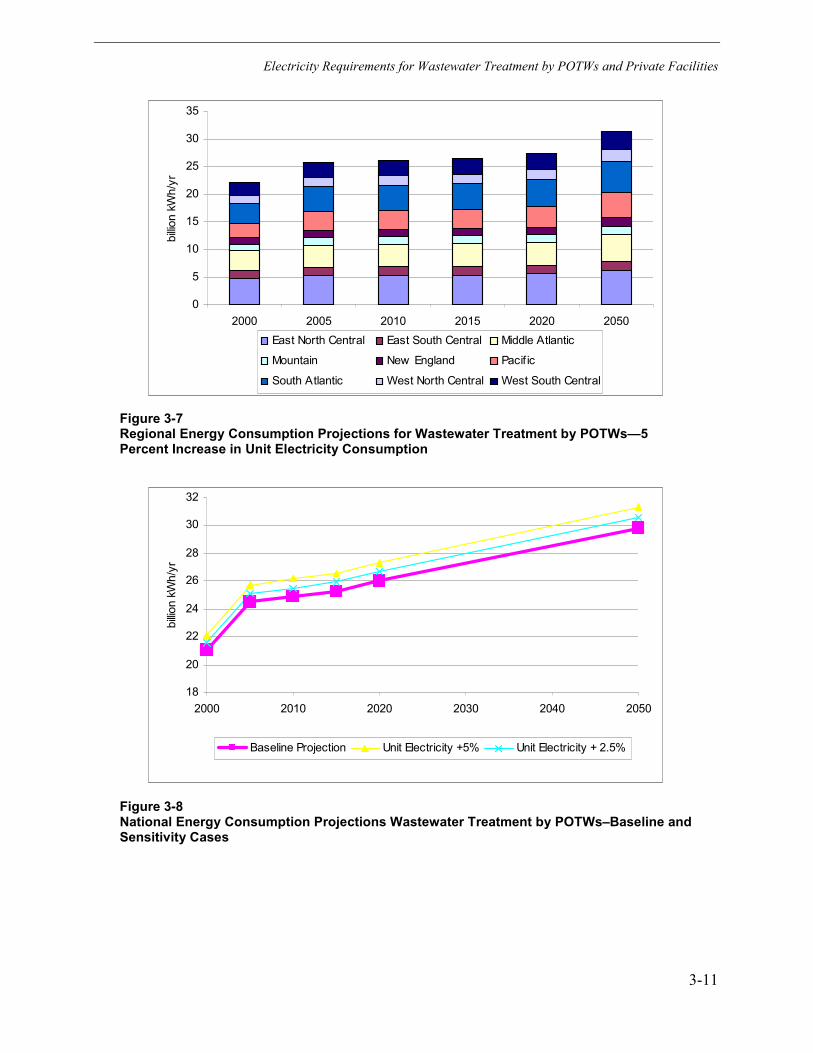
The baseline electricity consumption projection for wastewater treatment by POTWs is shown ingraphically in Figure 3-5; data are provided in tabular form in the Appendix. Electricityconsumption for the baseline case is estimated at about 21 billion kWh for the year 2000. This isexpected to increase to about 26 billion kWh by 2020 and 30 billion kWh by 2050.
Sensitivity analyses were conducted to determine the impact on projected electricityconsumption of upward variations in unit energy consumption, representing the need forincreased processing. Results of the sensitivity analyses are illustrated in Figures 3-6 and 3-7,and are provided in tabular form in the Appendix.
Figure 3-10 presents a summary of the projections on a national basis, showing how the baselinecase compares to the case where unit electricity consumption increases further by 2.5 and 5percent reflecting the need for more aggressive water treatment.

Electricity Requirements for Wastewater Treatment by POTWs and Private Facilities
3-10
0
5
10
15
20
25
30
35
2000 2005 2010 2015 2020 2050
billio
n kW
h/yr
East North Central East South Central Middle Atlantic
Mountain New England Pacif ic
South Atlantic West North Central West South Central
Figure 3-5Baseline Regional Energy Consumption Projections for Wastewater Treatment by POTWs
0
5
10
15
20
25
30
35
2000 2005 2010 2015 2020 2050
billio
n kW
h/yr
East North Central East South Central Middle Atlantic
Mountain New England Pacif ic
South Atlantic West North Central West South Central
Figure 3-6Regional Energy Consumption Projections for Wastewater Treatment by POTWs—2.5Percent Increase in Unit Electricity Consumption
Electricity Requirements for Wastewater Treatment by POTWs and Private Facilities
3-11
0
5
10
15
20
25
30
35
2000 2005 2010 2015 2020 2050
billio
n kW
h/yr
East North Central East South Central Middle Atlantic
Mountain New England Pacif ic
South Atlantic West North Central West South Central
Figure 3-7Regional Energy Consumption Projections for Wastewater Treatment by POTWs—5Percent Increase in Unit Electricity Consumption
18
20
22
24
26
28
30
32
2000 2010 2020 2030 2040 2050
billio
n kW
h/yr
Baseline Projection Unit Electricity +5% Unit Electricity + 2.5%
Figure 3-8National Energy Consumption Projections Wastewater Treatment by POTWs–Baseline andSensitivity Cases
Electricity Requirements for Wastewater Treatment by POTWs and Private Facilities
3-12
Issues Related to Trends in Electricity Use for Wastewater Treatment byPOTWs
Trends in Unit Electricity Consumption
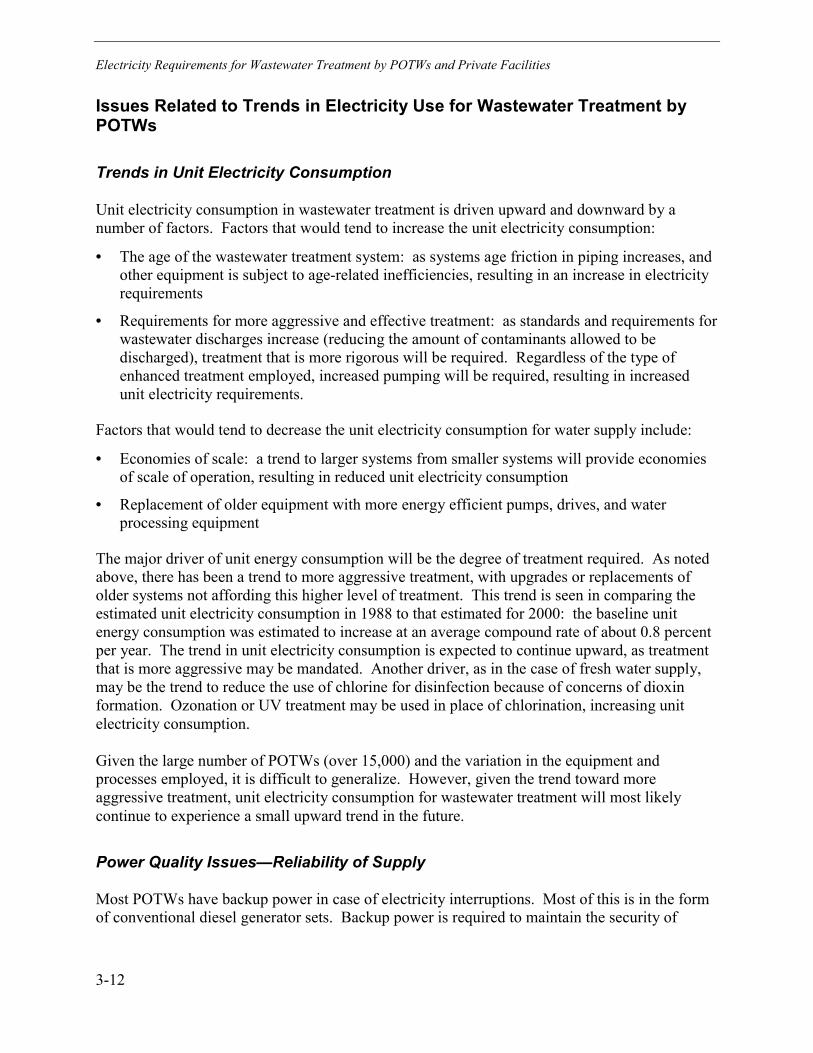
Unit electricity consumption in wastewater treatment is driven upward and downward by anumber of factors. Factors that would tend to increase the unit electricity consumption:
• The age of the wastewater treatment system: as systems age friction in piping increases, andother equipment is subject to age-related inefficiencies, resulting in an increase in electricityrequirements
• Requirements for more aggressive and effective treatment: as standards and requirements forwastewater discharges increase (reducing the amount of contaminants allowed to bedischarged), treatment that is more rigorous will be required. Regardless of the type ofenhanced treatment employed, increased pumping will be required, resulting in increasedunit electricity requirements.
Factors that would tend to decrease the unit electricity consumption for water supply include:
• Economies of scale: a trend to larger systems from smaller systems will provide economiesof scale of operation, resulting in reduced unit electricity consumption
• Replacement of older equipment with more energy efficient pumps, drives, and waterprocessing equipment
The major driver of unit energy consumption will be the degree of treatment required. As notedabove, there has been a trend to more aggressive treatment, with upgrades or replacements ofolder systems not affording this higher level of treatment. This trend is seen in comparing theestimated unit electricity consumption in 1988 to that estimated for 2000: the baseline unitenergy consumption was estimated to increase at an average compound rate of about 0.8 percentper year. The trend in unit electricity consumption is expected to continue upward, as treatmentthat is more aggressive may be mandated. Another driver, as in the case of fresh water supply,may be the trend to reduce the use of chlorine for disinfection because of concerns of dioxinformation. Ozonation or UV treatment may be used in place of chlorination, increasing unitelectricity consumption.
Given the large number of POTWs (over 15,000) and the variation in the equipment andprocesses employed, it is difficult to generalize. However, given the trend toward moreaggressive treatment, unit electricity consumption for wastewater treatment will most likelycontinue to experience a small upward trend in the future.
Power Quality Issues—Reliability of Supply
Most POTWs have backup power in case of electricity interruptions. Most of this is in the formof conventional diesel generator sets. Backup power is required to maintain the security of

Electricity Requirements for Wastewater Treatment by POTWs and Private Facilities
3-13
system operations, given that these systems typically have little storage capacity compared todemand.
Electricity Use in Privately Operated Wastewater Treatment Works
Along with the approximately 16,000 publicly owned wastewater treatment plants in the UnitedStates, there are approximately 23,000 additional treatment facilities that are privately owned andoperated, according to the United States Geological Survey (USGS). These are generally captivefacilities associated with industrial plants and commercial operations [3]. Robust detailedstatistics on the number, type, and aggregate flows of these treatment facilities are not availablethrough published sources making it difficult to characterize these facilities3. However, thefollowing general comments can be made:
• The average size of privately owned wastewater treatment facilities will fall into the smallestsize range of POTWs.
• Wastewater treatment facilities associated with industrial plants are designed to deal withspecific contaminants generated by the facilities – for instance, wastewater treatment plantsassociated with food processing and pulp and paper facilities are designed to deal with higherloadings/concentrations of BOD and COD than municipal facilities. Municipal wastewatertreatment facilities are typically designed to handle domestic wastes, in terms of both volumeand concentration of waste.
• Given the smaller size and potentially higher loadings, the unit electricity consumption ofthese types of facilities will tend to be higher than for POTWs. A reasonable estimate of unitelectricity consumption would be about 2,500 kWh/million gallons (0.661 kWh/cubic meter).
• Since discharges from these facilities are typically to surface water, it is likely that moreaggressive wastewater treatment will be required over the next 20 years – this is likely toincrease unit electricity consumption over the period by perhaps 5 to 10 percent.
• It is expected that more privately operated wastewater treatment facilities will be constructedover the next 20 years. These facilities would provide either full treatment followed bydischarge to surface water, or pretreatment to reduce concentrations to significantly reducedlevels before discharge to POTWs. In the latter case, the industrial facilities may becurrently discharging untreated wastewater directly to a POTW for treatment. As
3 The USEPA has an online database of wastewater treatment facilities, which is developed from discharge permits(the Environmental Data Warehouse, at http://www.epa/gov/enviro. The database includes information about themaximum daily average allowable discharge from each facility, the 4-digit SIC code associated with the operation ofthe facility, and other characterizing information. For the purposes of this analysis, however, the database isincomplete: many facilities do not have an SIC code associated with them, and flow rates are not listed for manyother facilities. Further, the flow rates are maximum average allowable discharges, and these may be significantlyhigher than actual flows. The data also do not indicate the type and level of treatment afforded. The databaseincludes a total of about 16,000 records for which non-zero maximum average daily flows are recorded, and forwhich an SIC code is associated with a facility. Of these 16,000 records, about 6,300 are for POTWs, and thebalance are privately operated—or at least are not associated with SIC Code 4952: Sewerage Systems. Thesenumbers of facilities are significantly lower than the population of systems identified by the USGS. Given the poorquality of the data set, it was decided not to try to use it to make projections of total energy use by sector forwastewater treatment in captive facilities.

Electricity Requirements for Wastewater Treatment by POTWs and Private Facilities
3-14
municipally owned wastewater treatment facilities are starting to reach their treatment limits,it is often less expensive for industrials to engage in pretreatment rather than to pay theincreasing surcharges imposed on their higher concentration discharges. Further, USEPAprograms (e.g., the National Pretreatment Program) recognize the need for industrial andother sector pretreatment to reduce the burden on POTWs on handling industrial wastes,which may contain toxic or otherwise hazardous materials or materials that might interferewith the biological processes in place at the POTWs. [4] In some cases, particularly in thepaper industry, notable efforts have been made to reduce both water consumption andwastewater discharges, through the practice of reclaiming and reusing water internally.Finally, the issue of run-off water containing animal wastes (livestock and poultry) has led toinitiatives to collect and treat this waste. These factors will contribute to the expectedincrease in the unit electricity consumption to process wastewater as noted above, and willcontribute to the total volume of processed waste. Hence, the total amount of electricityrequired to process wastewater in privately operated facilities is expected to increase over the20 and 50 year horizons.
• These smaller facilities would tend to be less impacted by power quality issues, particularlyinterruptions, than POTWs. This would be the case where the operations that generate thewastewater are interrupted simultaneously with the treatment facility. However, if thetreatment processes depend on aeration or mechanical processes to aid digestion of wastes,sustained loss of power can result in subsequent problems with the biological processes.
References1. Water and Wastewater Industries: Characteristics and Energy Management Opportunities:
A Report That Describes How Electricity is Used and Can Be Managed Efficiently in Waterand Wastewater Treatment, EPRI, Palo Alto, CA: 1996. Product ID # CR-106491.
2. Clean Water Needs Survey: Report to Congress, 1996, United States EnvironmentalProtection Agency, Office of Water, Office of Wastewater Management.. Information on theClean Water Needs Survey can be found at the USEPA website at http://www.epa.gov/owmwhere portions of the report can be downloaded.
3. Estimated Use of Water in the United States in 1995, U.S. Department of the Interior, U.S.Geological Survey, Washington DC: 1998. This publication can be downloaded from theUSGS website at http://www.usgs.gov.
4. Introduction to the National Pretreatment Program, United States Environmental ProtectionAgency, Office of Water, Office of Wastewater Management, Washington DC: 1999. Thispublication can be downloaded from the USEPA website at http://www.epa.gov/own.

4-1
4 ELECTRICITY REQUIREMENTS FOR SUPPLY OFWATER BY END-USERS
As noted earlier in this report, fresh water is supplied by public water supply agencies withdistribution to end-users, and by end-users themselves. Electricity consumption estimatesassociated with public supply of freshwater were covered in Chapter 2. Here, the unit and totalelectricity estimates associated with the supply of water by the entities for their ownconsumption will be covered. The following sectors will be covered here:
• Domestic (residential)
• Commercial
• Industrial and mining
• Irrigation and livestock
• Thermal power generation
These sectors account for a total of about 334 billion gallons per day of water consumption fromall sources. Table 4-1 shows the breakdown of water consumption by sector and source (publicsupply and self supply) for 1995. The domestic and commercial sectors rely most heavily onpublic water supply sources. The industrial, mining, agricultural, and thermal power generationsectors rely significantly more on water that they provide for themselves.
Domestic Sector
Characterization of Sector
According to the U.S. Geological Survey (USGS), the domestic sector consumed about 26billion gallons of water per day (98 million cubic feet) in 1995. Of this, about 85 percent werefrom public water supply agencies, and the balance was supplied by the end-user. Of the self-supplied water, most is from groundwater (wells). A regional breakdown of water consumptionby source is shown in Table 4-2.
Residential wellwater pumping systems are simple, consisting of the well pump, which liftswater and pressurizes it, and a storage tank, in which the pressurized water is stored fordistribution to the house. For typical homes, the pump size ranges from about ½ hp to 2 hp.Multi-family dwellings have similar types of systems, with larger pumps up to about 10 hpdepending on the volume of the water lifted.
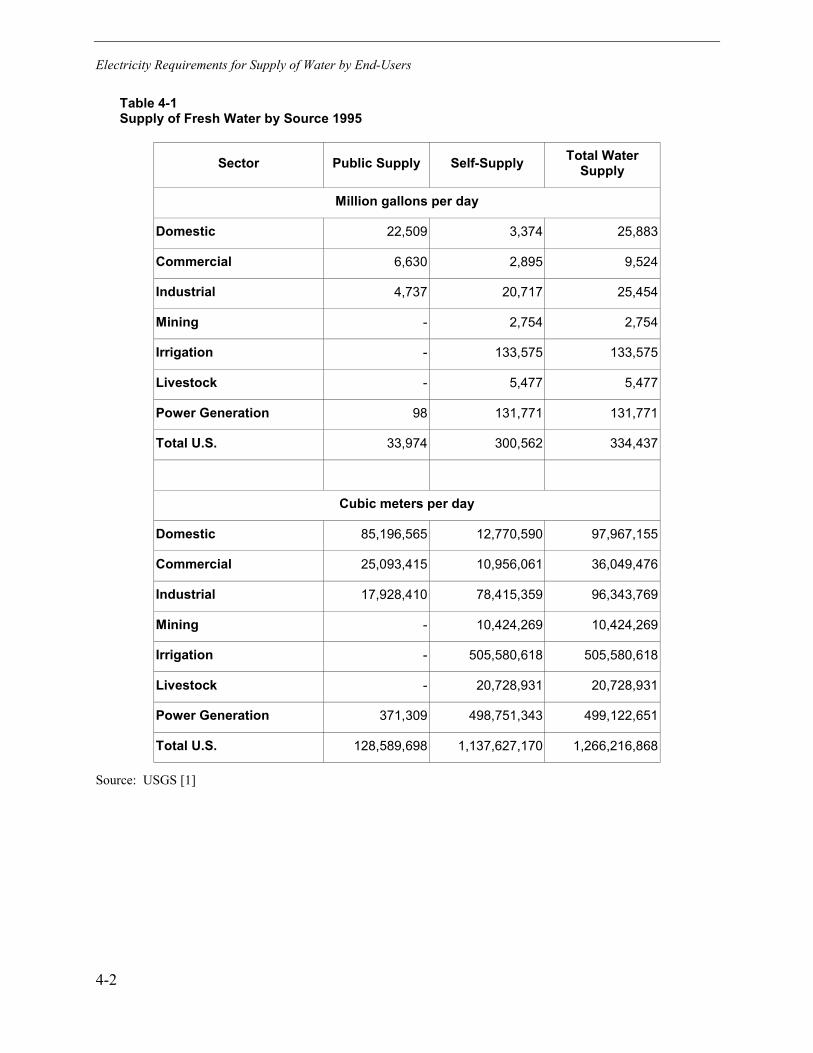
Electricity Requirements for Supply of Water by End-Users
4-2
Table 4-1Supply of Fresh Water by Source 1995
Sector Public Supply Self-Supply Total WaterSupply
Million gallons per day
Domestic 22,509 3,374 25,883
Commercial 6,630 2,895 9,524
Industrial 4,737 20,717 25,454
Mining - 2,754 2,754
Irrigation - 133,575 133,575
Livestock - 5,477 5,477
Power Generation 98 131,771 131,771
Total U.S. 33,974 300,562 334,437
Cubic meters per day
Domestic 85,196,565 12,770,590 97,967,155
Commercial 25,093,415 10,956,061 36,049,476
Industrial 17,928,410 78,415,359 96,343,769
Mining - 10,424,269 10,424,269
Irrigation - 505,580,618 505,580,618
Livestock - 20,728,931 20,728,931
Power Generation 371,309 498,751,343 499,122,651
Total U.S. 128,589,698 1,137,627,170 1,266,216,868
Source: USGS [1]

Electricity Requirements for Supply of Water by End-Users
4-3
Table 4-2Supply of Fresh Water to the Domestic Sector 1995
Self-SuppliedRegion
Ground Surface TotalPublicSupply
GrandTotal
Million gallons/day
East North Central 668 3 671 2,571 3,242
East South Central 172 3 175 1,221 1,396
Middle Atlantic 411 - 411 2,907 3,318
Mountain 202 3 206 2,113 2,319
New England 180 1 181 739 920
Pacific 305 21 326 4,736 5,062
South Atlantic 889 1 890 3,680 4,570
West North Central 278 - 278 1,190 1,468
West South Central 237 - 237 3,352 3,589
Total U.S. 3,343 31 3,374 22,509 25,883
Cubic meters/day
East North Central 2,528,380 10,977 2,539,357 9,731,235 12,270,592
East South Central 651,020 9,463 660,483 4,621,485 5,281,968
Middle Atlantic 1,555,635 - 1,555,635 11,002,995 12,558,630
Mountain 766,084 12,869 778,953 7,997,705 8,776,658
New England 682,436 3,407 685,842 2,797,115 3,482,957
Pacific 1,153,290 78,728 1,232,018 17,925,760 19,157,778
South Atlantic 3,364,865 3,028 3,367,893 13,928,800 17,296,693
West North Central 1,053,366 - 1,053,366 4,504,150 5,557,516
West South Central 897,045 - 897,045 12,687,320 13,584,365
Total U.S. 12,652,120 118,471 12,770,590 85,196,565 97,967,155
Source: USGS [1]
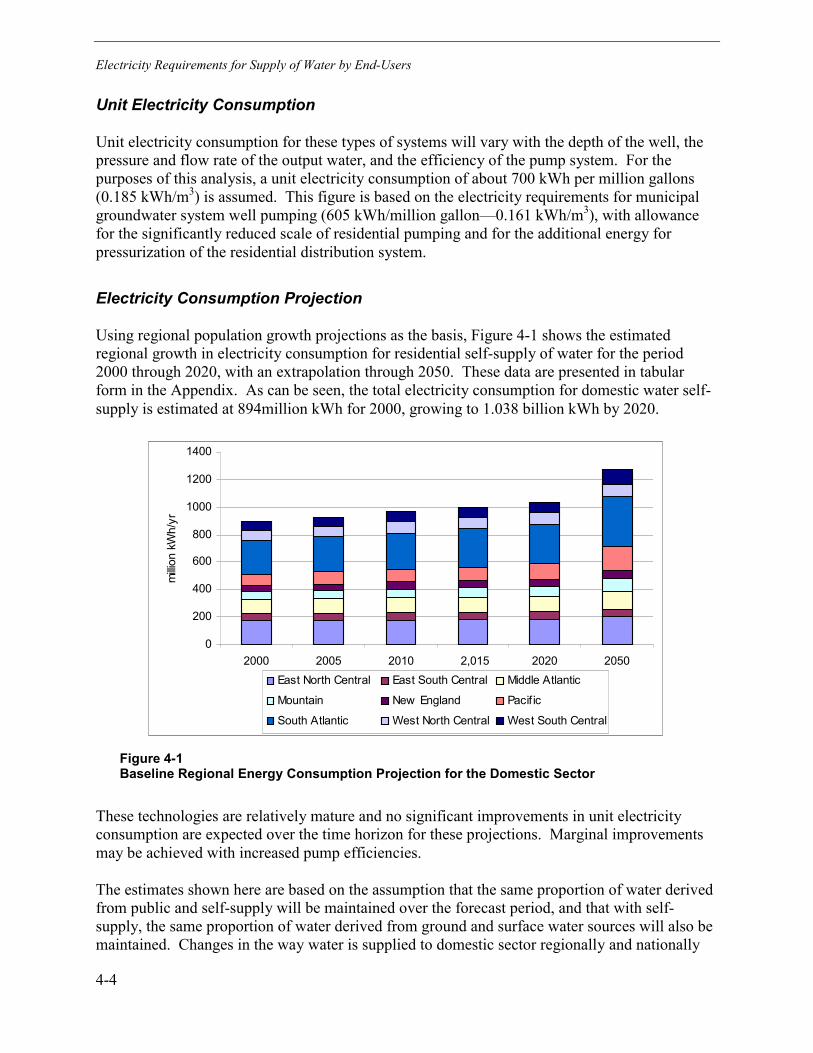
Electricity Requirements for Supply of Water by End-Users
4-4
Unit Electricity Consumption
Unit electricity consumption for these types of systems will vary with the depth of the well, thepressure and flow rate of the output water, and the efficiency of the pump system. For thepurposes of this analysis, a unit electricity consumption of about 700 kWh per million gallons(0.185 kWh/m3) is assumed. This figure is based on the electricity requirements for municipalgroundwater system well pumping (605 kWh/million gallon—0.161 kWh/m3), with allowancefor the significantly reduced scale of residential pumping and for the additional energy forpressurization of the residential distribution system.
Electricity Consumption Projection
Using regional population growth projections as the basis, Figure 4-1 shows the estimatedregional growth in electricity consumption for residential self-supply of water for the period2000 through 2020, with an extrapolation through 2050. These data are presented in tabularform in the Appendix. As can be seen, the total electricity consumption for domestic water self-supply is estimated at 894million kWh for 2000, growing to 1.038 billion kWh by 2020.
0
200
400
600
800
1000
1200
1400
2000 2005 2010 2,015 2020 2050
milli
on k
Wh/
yr
East North Central East South Central Middle Atlantic
Mountain New England Pacif ic
South Atlantic West North Central West South Central
Figure 4-1Baseline Regional Energy Consumption Projection for the Domestic Sector
These technologies are relatively mature and no significant improvements in unit electricityconsumption are expected over the time horizon for these projections. Marginal improvementsmay be achieved with increased pump efficiencies.
The estimates shown here are based on the assumption that the same proportion of water derivedfrom public and self-supply will be maintained over the forecast period, and that with self-supply, the same proportion of water derived from ground and surface water sources will also bemaintained. Changes in the way water is supplied to domestic sector regionally and nationally

Electricity Requirements for Supply of Water by End-Users
4-5
will affect the total electricity consumption, but the unit electricity consumption estimates willnot be affected.
Commercial Sector
Characterization of Sector
The use of water by the commercial sector is estimated at about 9.5 billion gallons per day,according to the USGS [1]. Of this, about 6.6 billion gallons per day is drawn from publicsupply sources and the balance of 2.9 billion gallons per day is self-supplied. Of this, nearly 2billion gallons per day is derived from surface water, and the balance from ground water. Table4-3 shows the breakdown of water supply by source by region for the commercial sector.
Groundwater supply systems for the commercial sector are similar to those employed in thedomestic sector, differing primarily in the size of the pumps and storage systems used. Thesesystems consist of a well pump, which lifts water and pressurizes it, and a storage tank in whichthe pressurized water is stored for distribution. Larger commercial facilities may also employadditional pumping to ensure adequate flow and pressure at the point of water discharge. Thesepumps are relatively small compared with the well pump.
Surface water supply is carried out by low head pumping from nearby bodies of water. Watermay be stored in above-ground tanks (gravity flow to the point of use) or ground-level or below-ground tanks (where additional pumping may be employed to ensure adequate flow and pressureat the point of water use). Pump size depends on distance from the point of water supply towater use.
Unit Electricity Consumption
For groundwater pumping, unit electricity consumption will vary with the depth of the well, thepressure and flow rate of the output water, and the efficiency of the pump system. For thepurposes of this analysis, unit electricity consumption for groundwater pumping of 700 kWh permillion gallons (0.185 kWh/m3) is assumed. This figure is based on the unit electricityrequirement for municipal groundwater system well pumping (605 kWh/million gallon—0.161kWh/m3) with allowance for the reduced scale of commercial pumping and for the additionalenergy requirements for system pressurization and/or distribution pumping
For surface water supply, unit electricity consumption will vary with the distance between pointof supply and point of use, the pressure and flow rate of the output water, and the efficiency ofthe pumping system. For the purposes of this analysis, unit electricity consumption for surfacewater supply of 300 kWh/million gallons (0.079 kWh/m3) is assumed. This figure is based onthe unit electricity consumption for municipal surface water pumping of 278 kWh/milliongallons (0.073 kWh/m3), with an upward adjustment based on the reduced scale of commercialpumping, the need for distribution pumping within the facility, and the energy requirements fortreating (e.g., softening, chlorination) the water prior to use.

Electricity Requirements for Supply of Water by End-Users
4-6
Table 4-3Supply of Fresh Water to the Commercial Sector 1995
Self-SuppliedRegion
Ground Surface TotalPublicSupply
GrandTotal
Million gallons/day
East North Central 122 202 324 1,278 1,602
East South Central 33 32 65 392 457
Middle Atlantic 169 80 249 806 1,055
Mountain 68 314 382 605 987
New England 70 37 107 351 458
Pacific 161 1,062 1,223 1,304 2,527
South Atlantic 178 50 228 1,072 1,300
West North Central 88 50 139 409 548
West South Central 50 128 178 413 591
Total U.S. 940 1,955 2,895 6,630 9,524
Cubic meters/day
East North Central 461,770 764,570 1,226,340 4,837,230 6,063,570
East South Central 124,527 121,120 245,647 1,483,720 1,729,367
Middle Atlantic 639,665 303,557 943,222 3,050,710 3,993,932
Mountain 258,516 1,188,869 1,447,384 2,289,925 3,737,309
New England 264,572 140,802 405,374 1,327,400 1,732,773
Pacific 610,899 4,019,292 4,630,191 4,935,640 9,565,831
South Atlantic 672,973 188,115 861,088 4,057,520 4,918,608
West North Central 334,594 189,629 524,223 1,548,065 2,072,288
West South Central 189,250 483,345 672,595 1,563,205 2,235,800
Total U.S. 3,556,765 7,399,297 10,956,061 25,093,415 36,049,476
Source: USGS [1]
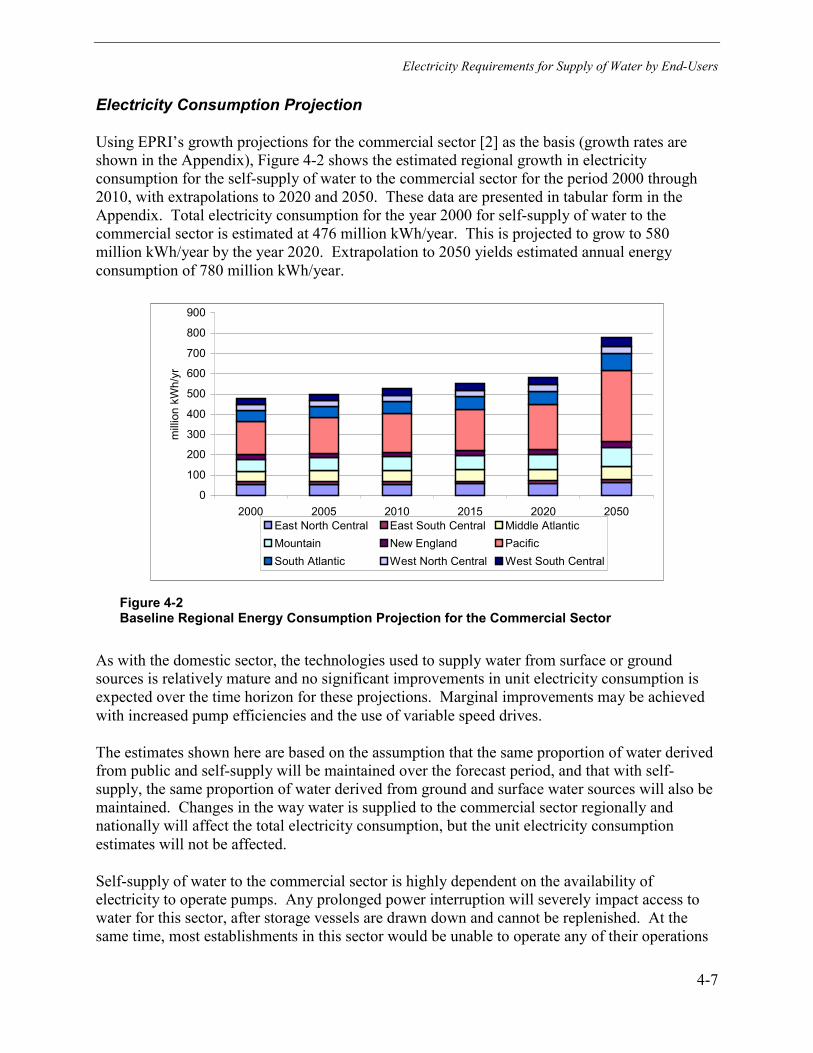
Electricity Requirements for Supply of Water by End-Users
4-7
Electricity Consumption Projection
Using EPRI’s growth projections for the commercial sector [2] as the basis (growth rates areshown in the Appendix), Figure 4-2 shows the estimated regional growth in electricityconsumption for the self-supply of water to the commercial sector for the period 2000 through2010, with extrapolations to 2020 and 2050. These data are presented in tabular form in theAppendix. Total electricity consumption for the year 2000 for self-supply of water to thecommercial sector is estimated at 476 million kWh/year. This is projected to grow to 580million kWh/year by the year 2020. Extrapolation to 2050 yields estimated annual energyconsumption of 780 million kWh/year.
0
100
200
300
400
500
600
700
800
900
2000 2005 2010 2015 2020 2050
milli
on k
Wh/
yr
East North Central East South Central Middle AtlanticMountain New England PacificSouth Atlantic West North Central West South Central
Figure 4-2Baseline Regional Energy Consumption Projection for the Commercial Sector
As with the domestic sector, the technologies used to supply water from surface or groundsources is relatively mature and no significant improvements in unit electricity consumption isexpected over the time horizon for these projections. Marginal improvements may be achievedwith increased pump efficiencies and the use of variable speed drives.
The estimates shown here are based on the assumption that the same proportion of water derivedfrom public and self-supply will be maintained over the forecast period, and that with self-supply, the same proportion of water derived from ground and surface water sources will also bemaintained. Changes in the way water is supplied to the commercial sector regionally andnationally will affect the total electricity consumption, but the unit electricity consumptionestimates will not be affected.
Self-supply of water to the commercial sector is highly dependent on the availability ofelectricity to operate pumps. Any prolonged power interruption will severely impact access towater for this sector, after storage vessels are drawn down and cannot be replenished. At thesame time, most establishments in this sector would be unable to operate any of their operations
Electricity Requirements for Supply of Water by End-Users
4-8
without electricity. For such commercial facilities as offices and retail outlets, the availability ofwater is not critical except for sanitary purposes, and sufficient water storage capacity isgenerally available to meet the needs during short power interruptions. For restaurants, otherfood service facilities, and supermarkets and groceries, water supply is more important andprolonged power interruptions can result in loss of water supply. Larger commercial facilities,such as shopping malls, often have back-up power supplies in the form of diesel generators, andit is assumed that motive power for water supply would be supplied by these types of systems.
Industrial and Mining
Characterization of Sectors
The USGS [1] estimates that the industrial sector consumes about 25 billion gallons of water perday. Of this, about 80 percent are self-supplied with the balance from public water supplysources. Of the self-supplied water, about 4 billion gallons per day comes from groundwater andthe balance from surface water.4 A regional breakdown of water consumption by source is shownin Table 4-4.
The USGS estimates that the mining sector consumes about 2.7 billion gallons per day, all ofwhich is self-supplied. A little over one-third of the water consumed is from groundwaterpumping, while the balance is drawn from surface water. A regional breakdown of waterconsumption by source is shown in Table 4-5.
Groundwater supply systems for these sectors consist of a well pump, which lifts water. Thewater is generally stored in a tank for distribution to the point of use. Additional distributionpumping is required to ensure adequate flow and pressure at the point of water discharge and toovercome frictional losses in the distribution system. Well pump size will depend on the depthof the well and the discharge pressure and volume.
Surface water supply is carried out by low head pumping from nearby bodies of water. Watermay be stored in above ground tanks (gravity flow to the point of use) or ground-level or below-ground tanks (where additional pumping may be employed to ensure adequate flow and pressureat the point of water use). Pump size depends on distance from the point of water supply towater use.
4 It is not unusual for industrial plants to have multiple sources of water, and use the multiple sourcessimultaneously. The author is aware of at least one plant that uses municipally supplied water, water drawn fromwells within the plant boundaries, and water drawn from a large lake by pipeline from a distance of about 2 miles.

Electricity Requirements for Supply of Water by End-Users
4-9
Table 4-4Supply of Fresh Water to the Industrial Sector 1995
Self-SuppliedRegion
Ground Surface TotalPublicSupply
GrandTotal
Million gallons/day
East North Central 694 4,882 5,576 1,019 6,595
East South Central 360 1,873 2,233 560 2,793
Middle Atlantic 317 1,820 2,137 640 2,777
Mountain 216 165 381 129 510
New England 55 105 159 175 334
Pacific 691 910 1,601 703 2,303
South Atlantic 813 3,189 4,002 697 4,698
West North Central 237 302 538 332 871
West South Central 694 3,397 4,091 482 4,573
Total U.S. 4,076 16,642 20,717 4,737 25,454
Cubic meters/day
East North Central 2,626,790 18,478,370 21,105,160 3,856,915 24,962,075
East South Central 1,362,600 7,089,305 8,451,905 2,119,600 10,571,505
Middle Atlantic 1,199,845 6,888,700 8,088,545 2,422,400 10,510,945
Mountain 818,696 623,011 1,441,707 489,401 1,931,107
New England 207,040 395,533 602,572 661,240 1,263,812
Pacific 2,614,678 3,444,350 6,059,028 2,659,341 8,718,369
South Atlantic 3,075,313 12,070,365 15,145,678 2,637,010 17,782,687
West North Central 895,910 1,141,178 2,037,087 1,258,134 3,295,221
West South Central 2,626,033 12,857,645 15,483,678 1,824,370 17,308,048
Total U.S. 15,426,903 62,988,456 78,415,359 17,928,410 96,343,769
Source: USGS [1]

Electricity Requirements for Supply of Water by End-Users
4-10
Table 4-5Supply of Fresh Water to the Mining Industry 1995
Self-SuppliedRegion
Ground Surface TotalPublicSupply
GrandTotal
Million gallons/day
East North Central 78 271 349 - 349
East South Central 18 31 49 - 49
Middle Atlantic 224 177 401 - 401
Mountain 361 258 619 - 619
New England 3 23 26 - 26
Pacific 19 128 146 - 146
South Atlantic 179 204 383 - 383
West North Central 47 516 563 - 563
West South Central 134 85 218 - 218
Total U.S. 1,061 1,693 2,754 - 2,754
Cubic meters/day
East North Central 293,338 1,026,871 1,320,208 - 1,320,208
East South Central 66,995 116,957 183,951 - 183,951
Middle Atlantic 849,354 669,945 1,519,299 - 1,519,299
Mountain 1,366,385 976,530 2,342,915 - 2,342,915
New England 10,977 88,191 99,167 - 99,167
Pacific 70,023 483,723 553,746 - 553,746
South Atlantic 676,758 772,140 1,448,898 - 1,448,898
West North Central 176,760 1,953,060 2,129,820 - 2,129,820
West South Central 506,433 319,833 826,266 - 826,266
Total U.S. 4,017,021 6,407,248 10,424,269 - 10,424,269
Source: USGS [1]

Electricity Requirements for Supply of Water by End-Users
4-11
Unit Electricity Consumption
For groundwater pumping, unit electricity consumption will vary with the depth of the well, thepressure and flow rate of the output water, and the efficiency of the pump system. For thepurposes of this analysis, a unit electricity consumption for groundwater pumping of 750 kWhper million gallons (0.198 kWh/m3) is assumed for both the industrial and mining sectors . Thisfigure is based on the unit electricity requirement for municipal groundwater system wellpumping (605 kWh/million gallon—0.161 kWh/m3) with allowance for the reduced scale ofpumping and for the additional energy requirements (associated with frictional losses and/orhigher pressures) for distribution pumping.
For surface water supply, unit electricity consumption will vary with the distance between pointof supply and point of use, the pressure and flow rate of the output water, and the efficiency ofthe pumping system. For the purposes of this analysis, a unit electricity consumption for surfacewater supply of 300 kWh/million gallons (0.079 kWh/m3) is assumed. This figure is based onthe unit electricity consumption for municipal surface water pumping of 278 kWh/milliongallons (0.073 kWh/m3), with an upward adjustment based on the reduced scale of pumping, theneed for distribution pumping within the facility, and the energy requirements for treating thewater prior to use.
Electricity Consumption Projections
Using EPRI’s growth projections for the industrial and mining sectors [3] as the basis (growthrates are shown in the Appendix), Figure 4-3 shows the estimated regional growth in electricityconsumption for the self-supply of water to the industrial sector for the period 2000 through2010, with extrapolations to 2020 and 2050 and Figure 4-4 shows the projection for the miningsector. These data are also presented in tabular form in the Appendix. Total electricityconsumption for the year 2000 for self-supply of water to industry is estimated at 3.3 billionkWh/year, which is projected to grow to 5.2 billion kWh/year by 2020. Extrapolation to 2050yields estimated annual energy consumption of 10.2 billion kWh/year.

Electricity Requirements for Supply of Water by End-Users
4-12
0
2000
4000
6000
8000
10000
12000
2000 2005 2010 2015 2020 2050
milli
on k
Wh/
yr
East North Central East South Central Middle Atlantic
Mountain New England Pacific
South Atlantic West North Central West South Central
Figure 4-3Baseline Regional Energy Consumption Projection for the Industrial Sector
Total electricity consumption for self-supply of water to the mining industry for the year 2000 isestimated at 490 million kWh/year, which is projected to grow to 569 million kWh/year by 2020.Extrapolation to 2050 yields estimated annual energy consumption of 713 million kWh/year.
0
100
200
300
400
500
600
700
800
2000 2005 2010 2015 2020 2050
milli
on k
Wh/
yr
East North Central East South Central Middle Atlantic
Mountain New England Pacific
South Atlantic West North Central West South Central
Figure 4-4Baseline Regional Energy Consumption Projection for the Mining Sector
The technologies used to supply water from surface or ground sources is relatively mature andno significant improvements in unit electricity consumption is expected over the time horizon for
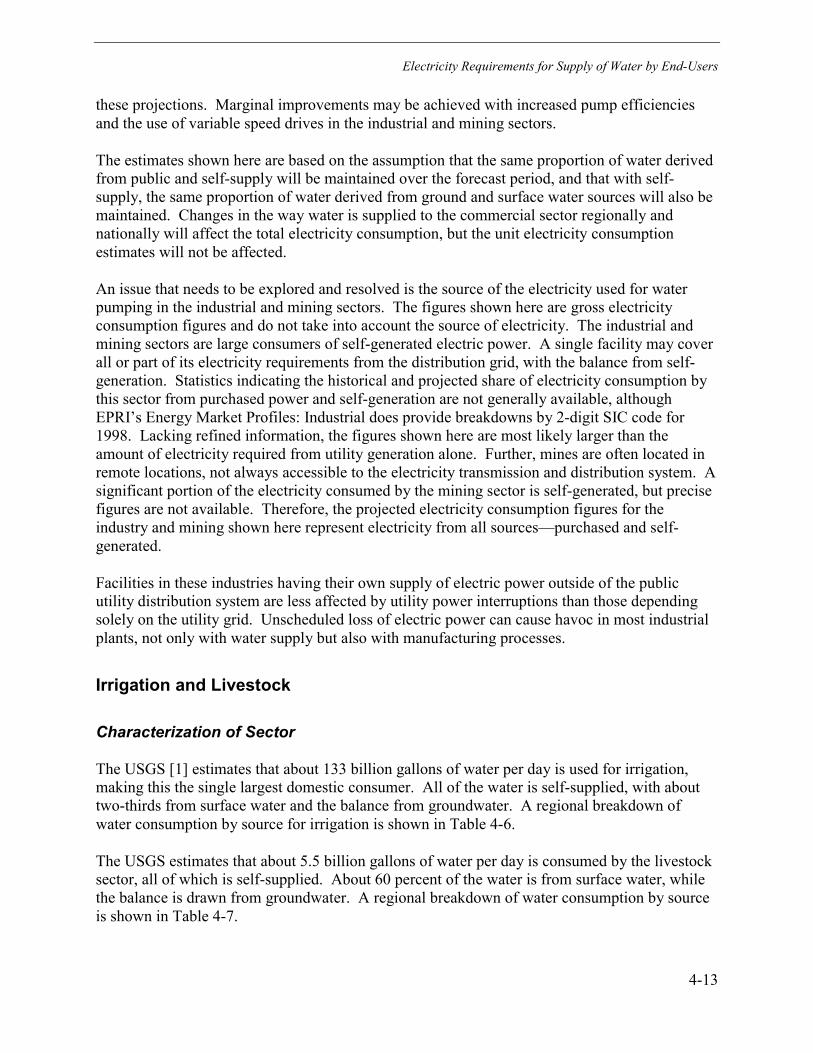
Electricity Requirements for Supply of Water by End-Users
4-13
these projections. Marginal improvements may be achieved with increased pump efficienciesand the use of variable speed drives in the industrial and mining sectors.
The estimates shown here are based on the assumption that the same proportion of water derivedfrom public and self-supply will be maintained over the forecast period, and that with self-supply, the same proportion of water derived from ground and surface water sources will also bemaintained. Changes in the way water is supplied to the commercial sector regionally andnationally will affect the total electricity consumption, but the unit electricity consumptionestimates will not be affected.
An issue that needs to be explored and resolved is the source of the electricity used for waterpumping in the industrial and mining sectors. The figures shown here are gross electricityconsumption figures and do not take into account the source of electricity. The industrial andmining sectors are large consumers of self-generated electric power. A single facility may coverall or part of its electricity requirements from the distribution grid, with the balance from self-generation. Statistics indicating the historical and projected share of electricity consumption bythis sector from purchased power and self-generation are not generally available, althoughEPRI’s Energy Market Profiles: Industrial does provide breakdowns by 2-digit SIC code for1998. Lacking refined information, the figures shown here are most likely larger than theamount of electricity required from utility generation alone. Further, mines are often located inremote locations, not always accessible to the electricity transmission and distribution system. Asignificant portion of the electricity consumed by the mining sector is self-generated, but precisefigures are not available. Therefore, the projected electricity consumption figures for theindustry and mining shown here represent electricity from all sources—purchased and self-generated.
Facilities in these industries having their own supply of electric power outside of the publicutility distribution system are less affected by utility power interruptions than those dependingsolely on the utility grid. Unscheduled loss of electric power can cause havoc in most industrialplants, not only with water supply but also with manufacturing processes.
Irrigation and Livestock
Characterization of Sector
The USGS [1] estimates that about 133 billion gallons of water per day is used for irrigation,making this the single largest domestic consumer. All of the water is self-supplied, with abouttwo-thirds from surface water and the balance from groundwater. A regional breakdown ofwater consumption by source for irrigation is shown in Table 4-6.
The USGS estimates that about 5.5 billion gallons of water per day is consumed by the livestocksector, all of which is self-supplied. About 60 percent of the water is from surface water, whilethe balance is drawn from groundwater. A regional breakdown of water consumption by sourceis shown in Table 4-7.

Electricity Requirements for Supply of Water by End-Users
4-14
Table 4-6Supply of Fresh Water for Irrigation 1995
Self-SuppliedRegion
Ground Surface TotalPublicSupply
GrandTotal
Million gallons/day
East North Central 521 200 721 - 721
East South Central 1,701 211 1,912 - 1,912
Middle Atlantic 56 115 171 - 171
Mountain 9,247 45,460 54,707 - 54,707
New England 48 101 149 - 149
Pacific 12,670 29,520 42,190 - 42,190
South Atlantic 2,310 2,314 4,624 - 4,624
West North Central 9,764 2,315 12,079 - 12,079
West South Central 12,701 4,322 17,023 - 17,023
Total U.S. 49,018 84,557 133,575 - 133,575
Cubic meters/day
East North Central 1,971,985 755,108 2,727,093 - 2,727,093
East South Central 6,439,799 798,635 7,238,434 - 7,238,434
Middle Atlantic 212,717 434,140 646,857 - 646,857
Mountain 34,999,895 172,066,100 207,065,995 - 207,065,995
New England 181,680 383,042 564,722 - 564,722
Pacific 47,956,329 111,731,308 159,687,636 - 159,687,636
South Atlantic 8,741,836 8,758,490 17,500,326 - 17,500,326
West North Central 36,956,740 8,760,761 45,717,501 - 45,717,501
West South Central 48,073,285 16,358,770 64,432,055 - 64,432,055
Total U.S. 185,534,266 320,046,353 505,580,618 - 505,580,618
Source: USGS [1]

Electricity Requirements for Supply of Water by End-Users
4-15
Table 4-7Supply of Fresh Water for Livestock 1995
Self-SuppliedRegion
Ground Surface TotalPublicSupply
GrandTotal
Million gallons/day
East North Central 182 54 235 - 235
East South Central 422 185 607 - 607
Middle Atlantic 72 19 91 - 91
Mountain 133 1,633 1,765 - 1,765
New England 9 14 23 - 23
Pacific 269 259 528 - 528
South Atlantic 200 318 518 - 518
West North Central 395 174 569 - 569
West South Central 572 568 1,140 - 1,140
Total U.S. 2,254 3,223 5,477 - 5,477
Cubic meters/day
East North Central 687,356 202,876 890,232 - 890,232
East South Central 1,598,406 700,225 2,298,631 - 2,298,631
Middle Atlantic 270,628 72,294 342,921 - 342,921
Mountain 501,891 6,179,770 6,681,661 - 6,681,661
New England 35,579 51,855 87,434 - 87,434
Pacific 1,018,165 980,315 1,998,480 - 1,998,480
South Atlantic 758,136 1,203,252 1,961,387 - 1,961,387
West North Central 1,495,075 658,212 2,153,287 - 2,153,287
West South Central 2,165,020 2,149,880 4,314,900 - 4,314,900
Total U.S. 8,530,255 12,198,677 20,728,931 - 20,728,931
Source: USGS [1]

Electricity Requirements for Supply of Water by End-Users
4-16
Groundwater supply systems for these sectors consist of a well pump, which lifts water. Thewater may be stored in a tank for later distribution to the point of use, or distributed immediately.Well pump size will depend on the depth of the well and the discharge pressure and volume.
Surface water supply is carried out by low head pumping from nearby bodies of water. Water isgenerally distributed immediately by gravity flow. Pump size depends on distance from thepoint of water supply to water use.
Unit Electricity Consumption
For groundwater pumping, unit electricity consumption will vary with the depth of the well, thepressure and flow rate of the output water, and the efficiency of the pump system. For thepurposes of this analysis, a unit electricity consumption for groundwater pumping of 700 kWhper million gallons (0.185 kWh/m3) is assumed for both irrigation and livestock . This figure isbased on the unit electricity requirement for municipal groundwater system well pumping (605kWh/million gallon—0.161 kWh/m3) with allowance for the reduced scale of pumping and forthe additional energy requirements for distribution pumping.
For surface water supply, unit electricity consumption will vary with the distance between pointof supply and point of use, the pressure and flow rate of the output water, and the efficiency ofthe pumping system. For the purposes of this analysis, a unit electricity consumption for surfacewater supply of 300 kWh/million gallons (0.079 kWh/m3) is assumed. This figure is based onthe unit electricity consumption for municipal surface water pumping of 278 kWh/milliongallons (0.073 kWh/m3), with an upward adjustment based on the reduced scale of pumping.
Electricity Consumption Projections
Trends in the amount of farmland under irrigation were used as the basis in formulating thegrowth projection for electricity consumption for irrigation pumping. Regional growth rateswere developed from historical data compiled by the United States Department of Agriculture(USDA) [4]. Regional growth rate projects are provided in the Appendix.
Figure 4-5 shows estimated regional growth in electricity consumption for the self-supply ofwater for irrigation for the period 2000 through 2010, with extrapolations to 2020 and 2050 andFigure 4-6 shows the projection for livestock. These data are also presented in tabular form inthe Appendix. Total electricity consumption for the year 2000 for self-supply of water forirrigation is estimated at 23.6 billion kWh/year, which is projected to grow to 33.3 billionkWh/year by 2020. Extrapolation to 2050 yields estimated annual energy consumption of 60.6billion kWh/year.
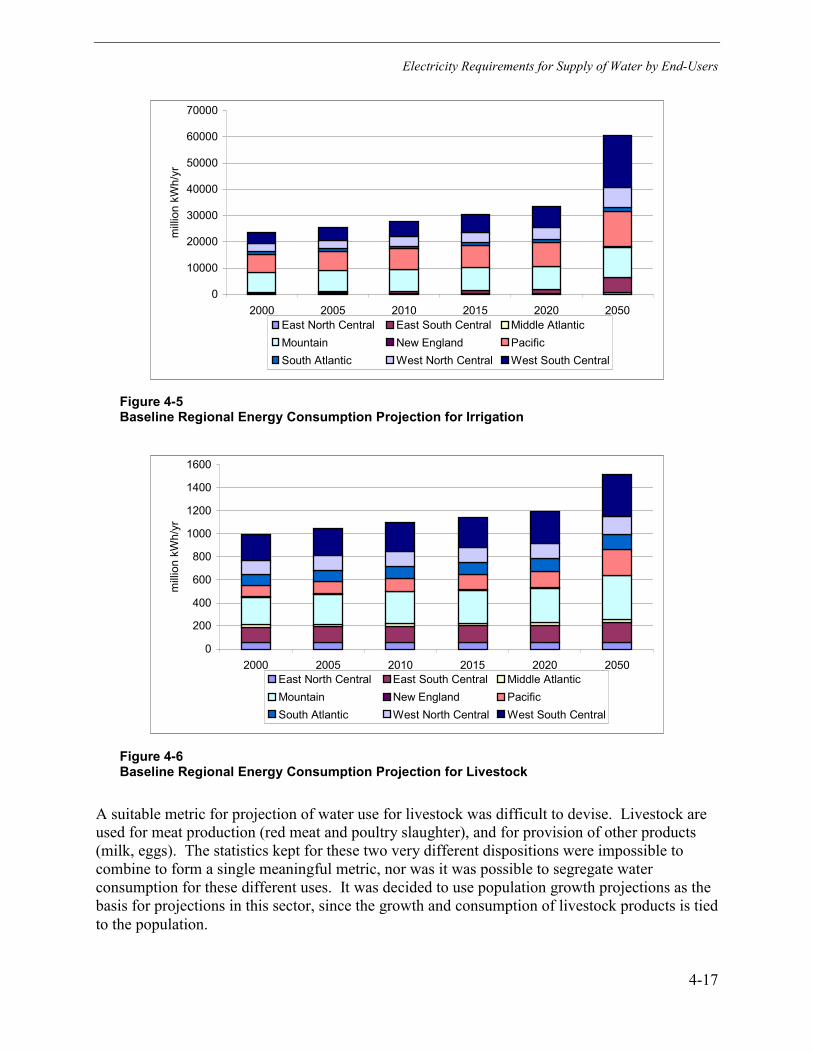
Electricity Requirements for Supply of Water by End-Users
4-17
0
10000
20000
30000
40000
50000
60000
70000
2000 2005 2010 2015 2020 2050
milli
on k
Wh/
yr
East North Central East South Central Middle AtlanticMountain New England PacificSouth Atlantic West North Central West South Central
Figure 4-5Baseline Regional Energy Consumption Projection for Irrigation
0
200
400
600
800
1000
1200
1400
1600
2000 2005 2010 2015 2020 2050
milli
on k
Wh/
yr
East North Central East South Central Middle AtlanticMountain New England PacificSouth Atlantic West North Central West South Central
Figure 4-6Baseline Regional Energy Consumption Projection for Livestock
A suitable metric for projection of water use for livestock was difficult to devise. Livestock areused for meat production (red meat and poultry slaughter), and for provision of other products(milk, eggs). The statistics kept for these two very different dispositions were impossible tocombine to form a single meaningful metric, nor was it was possible to segregate waterconsumption for these different uses. It was decided to use population growth projections as thebasis for projections in this sector, since the growth and consumption of livestock products is tiedto the population.

Electricity Requirements for Supply of Water by End-Users
4-18
Using population growth as the basis for the projection, the total electricity consumption for self-supply of water for livestock for the year 2000 is estimated at 992 million kWh/year, which isprojected to grow to 1.2 billion kWh/year by 2020. Extrapolation to 2050 yields estimatedannual energy consumption of 1.5 billion kWh/year.
The technologies used to supply water from surface or ground sources are relatively mature andno significant improvements in unit electricity consumption are expected over the time horizonfor these projections. Marginal improvements may be achieved with increased pump efficienciesand the use of variable speed drives in the industrial and mining sectors.
Water conservation efforts are continuing in the agricultural sector, with a decrease in theamount of water being used for irrigation and livestock use. While this while impact aggregateelectricity consumption, it should have little impact on the unit electricity consumption estimates.Other factors that could impact total electricity requirements for irrigation and livestock areprecipitation, changes in diet among the population (shifts between red meat and poultry, eggs,and dairy products—this could also impact the types of crops grown for animal feed and hencethe water requirements for those crops), and changes in water requirements of crops due togenetic manipulation.
An issue that needs to be explored is the source of the electricity used for water pumping in theagricultural and livestock sectors. The figures shown here are gross electricity consumptionfigures and do not take into account the source of electricity. Because not all farmland can takeelectricity from the distribution grid, this sector sometimes uses small generators at remotelocations for motive power for pumps. Statistics indicating the historical and projected share ofelectricity consumption by this sector from purchased power and self-generation were notavailable. Hence, the figures shown here are most likely larger than the amount of electricityrequired from utility generation alone.
Power Generation
Characterization of Sector
The USGS [1] estimates that about 131 billion gallons of water per day is used for thermal powerproduction, making this the second largest domestic consumer after irrigation. The water ispredominantly self-supplied, with most from surface water sources. A regional breakdown ofwater consumption by source for thermal power generation is shown in Table 4-8.
Groundwater supply systems for these sectors consist of a well pump, which lifts water. Thewater is generally stored in a tank for distribution to the point of use. Additional distributionpumping is required to ensure adequate flow and pressure at the point of water discharge and toovercome frictional losses in the distribution system. Well pump size will depend on the depthof the well and the discharge pressure and volume.

Electricity Requirements for Supply of Water by End-Users
4-19
Table 4-8Supply of Fresh Water for Thermal Power Generation 1995
Self-SuppliedRegion
Ground Surface TotalPublicSupply
GrandTotal
Million gallons/day
East North Central 50 45,140 45,190 5 45,195
East South Central 86 17,120 17,206 3 17,209
Middle Atlantic 8 13,068 13,076 27 13,103
Mountain 81 469 550 16 565
New England 48 1,620 1,668 2 1,670
Pacific 75 612 687 6 694
South Atlantic 68 22,087 22,155 5 22,160
West North Central 49 14,221 14,269 4 14,274
West South Central 99 16,871 16,970 30 17,000
Total U.S. 563 131,208 131,771 98 131,869
Cubic meters/day
East North Central 188,493 170,854,900 171,043,393 20,061 171,063,454
East South Central 325,510 64,799,200 65,124,710 10,220 65,134,930
Middle Atlantic 30,659 49,462,380 49,493,039 100,681 49,593,720
Mountain 305,071 1,775,165 2,080,236 59,046 2,139,282
New England 182,059 6,131,700 6,313,759 8,327 6,322,086
Pacific 285,011 2,316,420 2,601,431 23,467 2,624,898
South Atlantic 256,623 83,598,160 83,854,783 19,682 83,874,465
West North Central 183,573 53,826,107 54,009,679 15,519 54,025,198
West South Central 373,580 63,856,735 64,230,315 114,307 64,344,622
Total U.S. 2,130,577 496,620,766 498,751,343 371,309 499,122,651
Source: USGS [1]

Electricity Requirements for Supply of Water by End-Users
4-20
Surface water supply is carried out by low head pumping from nearby bodies of water. Watermay be stored in above ground tanks (gravity flow to the point of use) or ground-level or below-ground tanks (where additional pumping may be employed to ensure adequate flow and pressureat the point of water use). Pump size depends on distance from the point of water supply towater use.
Unit Electricity Consumption
For groundwater pumping, unit electricity consumption will vary with the depth of the well, thepressure and flow rate of the output water, and the efficiency of the pump system. For thepurposes of this analysis, a unit electricity consumption for groundwater pumping of 800 kWhper million gallons (0.211 kWh/m3) is assumed. This figure is based on the unit electricityrequirement for municipal groundwater system well pumping (605 kWh/million gallon—0.161kWh/m3) with allowance for the reduced scale of pumping and for the additional energyrequirements for distribution pumping.
For surface water supply, unit electricity consumption will vary with the distance between pointof supply and point of use, the pressure and flow rate of the output water, and the efficiency ofthe pumping system. For the purposes of this analysis, a unit electricity consumption for surfacewater supply of 300 kWh/million gallons (0.040 kWh/m3) is assumed. This figure is based onthe unit electricity consumption for municipal surface water pumping of 278 kWh/milliongallons (0.073 kWh/m3), with an upward adjustment based on the reduced scale of pumping, theneed for distribution pumping within the facility, and the energy requirements for treating thewater prior to use.
Electricity Consumption Projection
The estimate of the amount of electricity required for delivery of water is based on United StatesDepartment of Energy projections of generation by type of generating facility and estimates ofmake-up water requirements for cooling by the various types of generators. DOE thermalgeneration estimates by thermal generation are summarized in Table A-22 in the Appendix, byDOE generating region. These generation figures include only generation by biomass, coal,nuclear, municipal solid waste, other fossil generation, and combined cycle plants; these types ofplants use cooling water. A map of generating regions is provided in Figure A-1 in theAppendix. Estimates of unit water use for various types of generator were developed by BKI [5]in a parallel effort to this project. These figures are summarized in Table 4-9.

Electricity Requirements for Supply of Water by End-Users
4-21
Table 4-9Average Water Requirements for Thermal Power Plant Cooling.
Cooling Type Fuel Type Gal/MWh m3/MWh
Fossil 450 1.7Cooling Pondmake-up water Nuclear 800 3.0
Dry Cooling Tower all ---- ----
Fossil 35,000 132.5
Nuclear 42,500 160.8Once-Through Cooling
Combined Cycle 13,750 52.0
Fossil 550 2.1
Nuclear 950 3.6
Combined Cycle 230 0.9Wet Cooling Tower
make-up water
Gas CombinedCycle
250 0.9
Source: BKI [5]
Figure 4-7 shows the amount of electricity required to meet the cooling water needs of theseplants over the period 2000 through 2020. This represents less than 0.5 percent of the totalgeneration of these types of plants.
As can be seen in Figure 4-7, the electricity requirements for cooling water pumping is expectedto decline. This is primarily due to a shift away from once-through cooling, with high waterrequirements, to cooling using recycled water (e.g. wet cooling towers) and the expectedincreased use of dry cooling towers, where no water is lost from the system.
The technologies used to supply water from surface or ground sources are relatively mature andno significant improvements in unit electricity consumption are expected over the time horizonfor these projections. Marginal improvements may be achieved with increased pump efficienciesand the use of variable speed drives in the industrial and mining sectors. Other new initiatives,such as the reduction in once-through cooling and the increased use of dry cooling towers (asopposed to evaporative or wet cooling towers) in power plants would tend to reduce the amountof water that would be pumped for make-up purposes. However, this should have little impacton the unit electricity requirements for water pumping from groundwater or surface watersources.

Electricity Requirements for Supply of Water by End-Users
4-22
0
2000
4000
6000
8000
10000
12000
14000
16000
2000 2005 2010 2015 2020
milli
on k
Wh/
yr
Region 1 Region 2 Region 3 Region 4 Region 5 Region 6 Region 7
Region 8 Region 9 Region 10 Region 11 Region 12 Region 13
Figure 4-7Baseline Regional Energy Consumption Projection for Thermal Power Generation
It should be noted that electricity consumption for internal use in power generation is notincluded in electricity consumption forecasts. On the supply side, reporting is generally based ongross generation of electricity, consumption for internal use, and net generation for sale (thedifference between the first two items). The use of electricity by electric utilities for waterpumping and/or wastewater treatment will generally be accounted for in the second of the threecategories.
References1. Estimated Use of Water in the United States in 1995, U.S. Department of the Interior, U.S.
Geological Survey, Washington DC: 1998. This publication can be downloaded from theUSGS website at http://www.usgs.gov.
2. 1997 Commercial Energy Forecast, prepared by Regional Economic Research Inc., forEPRI, March 1997.
3. Energy Market Profiles: 1997 Commercial Buildings, Equipment, and Energy Use, EPRI,1997.
4. 1997 Industrial Energy Forecast, prepared by Regional Economic Research Inc., for EPRI,March 1997.
5. Energy Market Profiles: 1998 Industrial Buildings, Equipment, and Energy Use, EPRI, 1998.6. Census of Agriculture 1999, United States Department of Agriculture, Washington DC:
2000. Data derived from Table 9-11, Land in Farms: Irrigated Land by State, 1959-1997.Document downloaded from the USDA website at http://www.usda.gov.
7. Richard Mhyre, BKI, personal communication, September 2000.

A-1
A SUPPORTING DATA
This Appendix contains supporting data and tables for the analyses presented in the mainsections of this report.
Population Growth Projections
U.S. Census Bureau population growth projections used in the electricity consumptionprojections are provided in Tables A-1 and A-2. Table A-1 shows how population will grow inabsolute terms by region. Table A-2 shows compound annual growth rates by region.
Table A-1Population Growth Projections by Region
Population in millions 1995 2000 2005 2010 2015 2020 2025 2050
United States 262.76 274.63 285.98 297.72 310.13 322.74 335.05 406.92
East North Central 43.46 44.42 45.15 45.76 46.41 47.06 47.68 50.86
East South Central 16.07 16.92 17.60 18.12 18.59 19.00 19.35 21.16
Middle Atlantic 38.15 38.53 38.92 39.52 40.29 41.16 42.07 46.91
Mountain 15.65 17.73 19.25 20.22 21.12 22.05 22.96 28.13
New England 13.31 13.58 13.84 14.17 14.55 14.94 15.32 17.39
Pacific 41.95 43.69 46.35 50.29 54.77 59.42 64.14 94.02
South Atlantic 47.00 50.15 52.92 55.46 57.97 60.41 62.68 75.33
West North Central 18.35 19.08 19.67 20.15 20.62 21.05 21.43 23.46
West South Central 28.83 30.55 32.26 34.02 35.83 37.65 39.43 49.67
Source: U.S. Census Bureau [1]

Supporting Data
A-2
Table A-2Compound Annual Population Growth Rates by Region
1995 to2000
2000 to2005
2005 to2010
2010 to2015
2015 to2020
2020 to2025
Projectedthrough
2050
United States 0.89% 0.81% 0.81% 0.82% 0.80% 0.75% 0.78%
East North Central 0.44% 0.33% 0.27% 0.28% 0.28% 0.26% 0.26%
East South Central 1.04% 0.80% 0.58% 0.51% 0.44% 0.36% 0.36%
Middle Atlantic 0.19% 0.21% 0.30% 0.39% 0.43% 0.44% 0.44%
Mountain 2.53% 1.66% 0.99% 0.88% 0.86% 0.81% 0.81%
New England 0.40% 0.38% 0.47% 0.52% 0.53% 0.51% 0.51%
Pacific 0.81% 1.19% 1.64% 1.72% 1.64% 1.54% 1.54%
South Atlantic 1.31% 1.08% 0.94% 0.89% 0.83% 0.74% 0.74%
West North Central 0.79% 0.61% 0.48% 0.46% 0.42% 0.36% 0.36%
West South Central 1.17% 1.10% 1.07% 1.04% 0.99% 0.93% 0.93%
Source: U.S. Census Bureau [1]
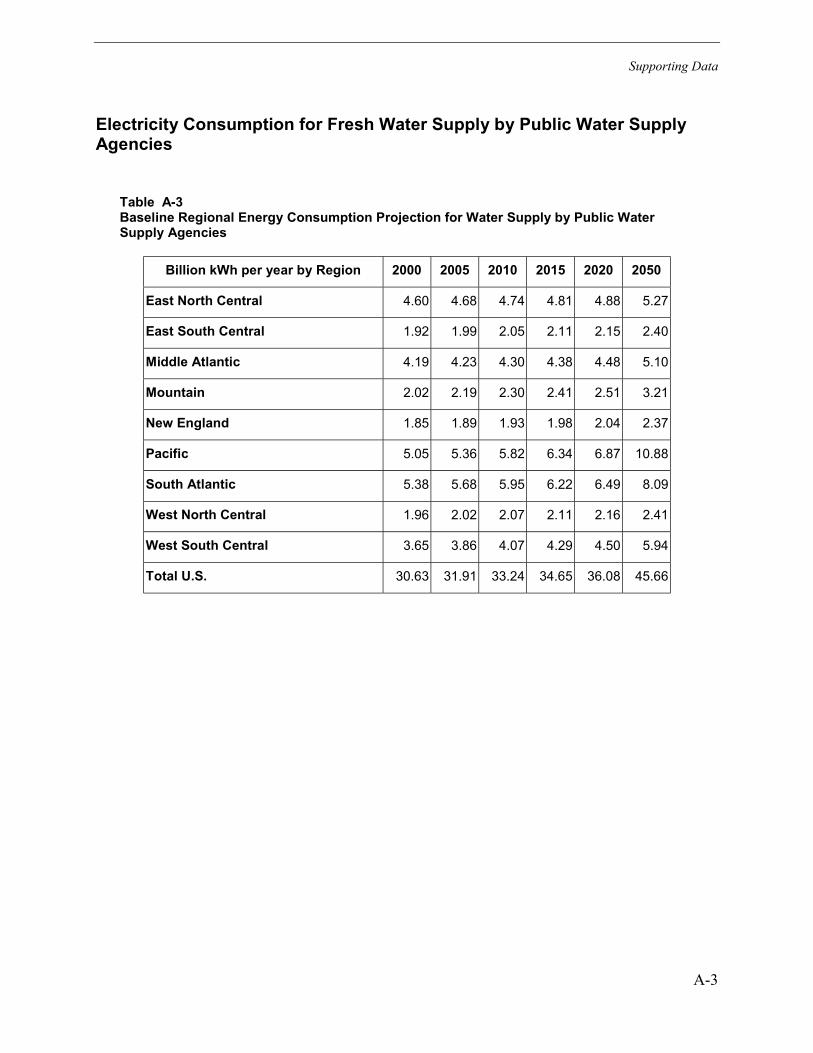
Supporting Data
A-3
Electricity Consumption for Fresh Water Supply by Public Water SupplyAgencies
Table A-3Baseline Regional Energy Consumption Projection for Water Supply by Public WaterSupply Agencies
Billion kWh per year by Region 2000 2005 2010 2015 2020 2050
East North Central 4.60 4.68 4.74 4.81 4.88 5.27
East South Central 1.92 1.99 2.05 2.11 2.15 2.40
Middle Atlantic 4.19 4.23 4.30 4.38 4.48 5.10
Mountain 2.02 2.19 2.30 2.41 2.51 3.21
New England 1.85 1.89 1.93 1.98 2.04 2.37
Pacific 5.05 5.36 5.82 6.34 6.87 10.88
South Atlantic 5.38 5.68 5.95 6.22 6.49 8.09
West North Central 1.96 2.02 2.07 2.11 2.16 2.41
West South Central 3.65 3.86 4.07 4.29 4.50 5.94
Total U.S. 30.63 31.91 33.24 34.65 36.08 45.66

Supporting Data
A-4
Table A-4Regional Energy Consumption Projection for Water Supply by Public Water SupplyAgencies–Reduced Unit Energy Consumption
Billion kWh per year by Region 2000 2005 2010 2015 2020 2050
East North Central 4.14 4.21 4.27 4.33 4.39 4.74
East South Central 1.72 1.79 1.85 1.89 1.94 2.16
Middle Atlantic 3.77 3.81 3.87 3.94 4.03 4.59
Mountain 1.82 1.97 2.07 2.17 2.26 2.88
New England 1.67 1.70 1.74 1.78 1.83 2.13
Pacific 4.55 4.83 5.24 5.70 6.19 9.79
South Atlantic 4.85 5.11 5.36 5.60 5.84 7.28
West North Central 1.76 1.82 1.86 1.90 1.94 2.17
West South Central 3.29 3.47 3.66 3.86 4.05 5.35
Total U.S. 27.57 28.72 29.92 31.18 32.47 41.09
Table A-5Regional Energy Consumption Projection for Water Supply by Public Water SupplyAgencies–Increased Unit Energy Consumption
Billion kWh per year by Region 2000 2005 2010 2015 2020 2050
East North Central 5.06 5.15 5.22 5.29 5.37 5.80
East South Central 2.11 2.19 2.26 2.32 2.37 2.64
Middle Atlantic 4.61 4.66 4.73 4.82 4.92 5.61
Mountain 2.22 2.41 2.53 2.65 2.76 3.53
New England 2.04 2.08 2.13 2.18 2.24 2.61
Pacific 5.56 5.90 6.40 6.97 7.56 11.97
South Atlantic 5.92 6.25 6.55 6.85 7.14 8.90
West North Central 2.15 2.22 2.27 2.33 2.37 2.65
West South Central 4.02 4.25 4.48 4.72 4.95 6.54
Total U.S. 33.69 35.10 36.56 38.11 39.69 50.23
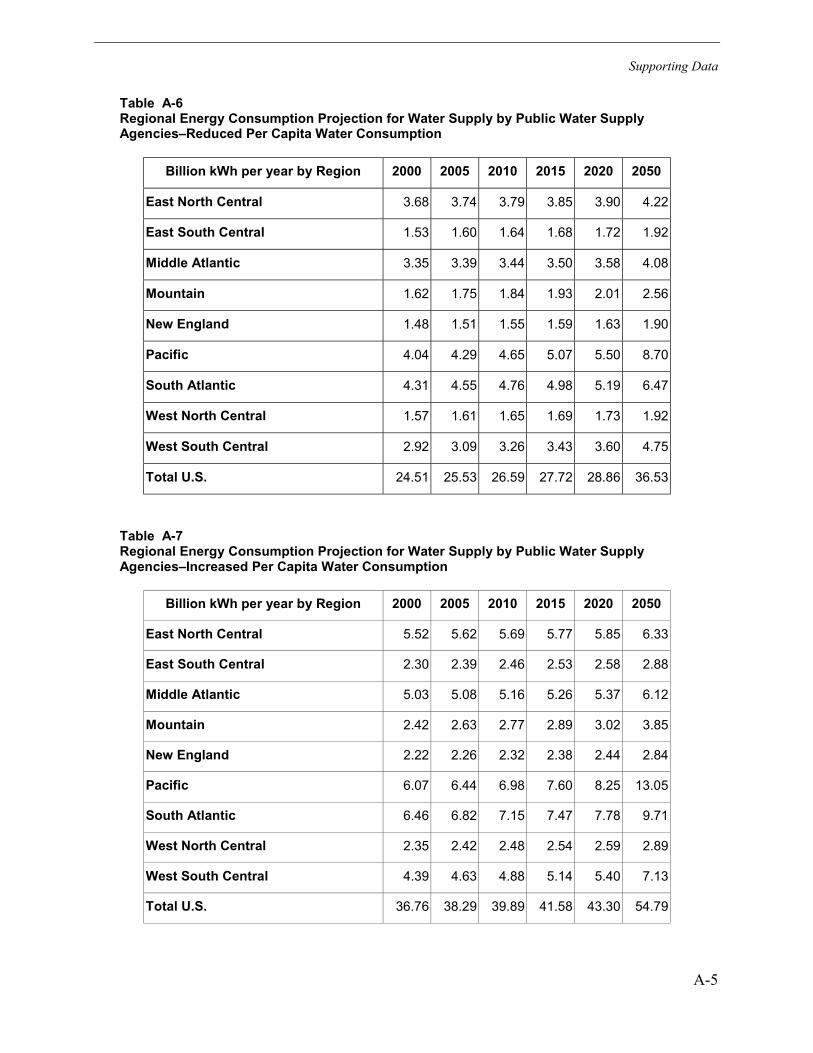
Supporting Data
A-5
Table A-6Regional Energy Consumption Projection for Water Supply by Public Water SupplyAgencies–Reduced Per Capita Water Consumption
Billion kWh per year by Region 2000 2005 2010 2015 2020 2050
East North Central 3.68 3.74 3.79 3.85 3.90 4.22
East South Central 1.53 1.60 1.64 1.68 1.72 1.92
Middle Atlantic 3.35 3.39 3.44 3.50 3.58 4.08
Mountain 1.62 1.75 1.84 1.93 2.01 2.56
New England 1.48 1.51 1.55 1.59 1.63 1.90
Pacific 4.04 4.29 4.65 5.07 5.50 8.70
South Atlantic 4.31 4.55 4.76 4.98 5.19 6.47
West North Central 1.57 1.61 1.65 1.69 1.73 1.92
West South Central 2.92 3.09 3.26 3.43 3.60 4.75
Total U.S. 24.51 25.53 26.59 27.72 28.86 36.53
Table A-7Regional Energy Consumption Projection for Water Supply by Public Water SupplyAgencies–Increased Per Capita Water Consumption
Billion kWh per year by Region 2000 2005 2010 2015 2020 2050
East North Central 5.52 5.62 5.69 5.77 5.85 6.33
East South Central 2.30 2.39 2.46 2.53 2.58 2.88
Middle Atlantic 5.03 5.08 5.16 5.26 5.37 6.12
Mountain 2.42 2.63 2.77 2.89 3.02 3.85
New England 2.22 2.26 2.32 2.38 2.44 2.84
Pacific 6.07 6.44 6.98 7.60 8.25 13.05
South Atlantic 6.46 6.82 7.15 7.47 7.78 9.71
West North Central 2.35 2.42 2.48 2.54 2.59 2.89
West South Central 4.39 4.63 4.88 5.14 5.40 7.13
Total U.S. 36.76 38.29 39.89 41.58 43.30 54.79
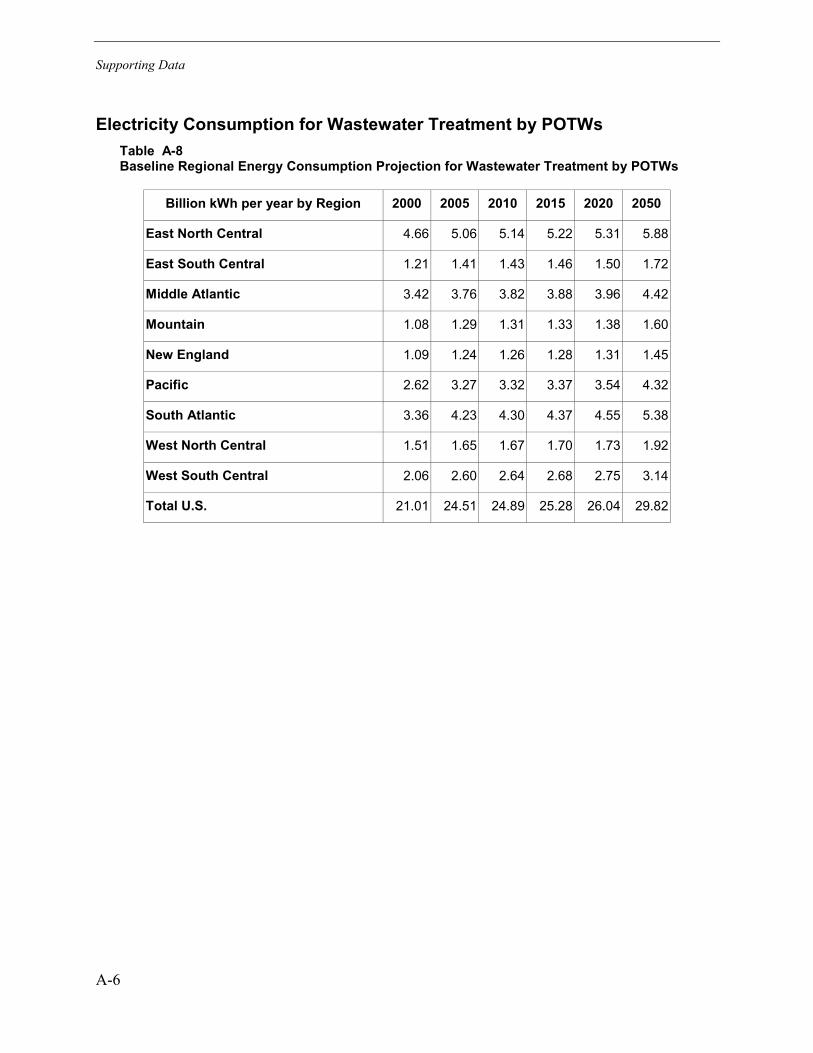
Supporting Data
A-6
Electricity Consumption for Wastewater Treatment by POTWsTable A-8Baseline Regional Energy Consumption Projection for Wastewater Treatment by POTWs
Billion kWh per year by Region 2000 2005 2010 2015 2020 2050
East North Central 4.66 5.06 5.14 5.22 5.31 5.88
East South Central 1.21 1.41 1.43 1.46 1.50 1.72
Middle Atlantic 3.42 3.76 3.82 3.88 3.96 4.42
Mountain 1.08 1.29 1.31 1.33 1.38 1.60
New England 1.09 1.24 1.26 1.28 1.31 1.45
Pacific 2.62 3.27 3.32 3.37 3.54 4.32
South Atlantic 3.36 4.23 4.30 4.37 4.55 5.38
West North Central 1.51 1.65 1.67 1.70 1.73 1.92
West South Central 2.06 2.60 2.64 2.68 2.75 3.14
Total U.S. 21.01 24.51 24.89 25.28 26.04 29.82

Supporting Data
A-7
Table A-9Regional Energy Consumption Projection for Wastewater Treatment by POTWs—2.5Percent Increase in Unit Electricity Consumption
Billion kWh per year by Region 2000 2005 2010 2015 2020 2050
East North Central 4.77 5.18 5.26 5.35 5.44 6.02
East South Central 1.24 1.45 1.47 1.49 1.54 1.76
Middle Atlantic 3.50 3.86 3.92 3.98 4.06 4.53
Mountain 1.11 1.33 1.35 1.37 1.41 1.64
New England 1.12 1.28 1.30 1.32 1.34 1.49
Pacific 2.68 3.35 3.40 3.45 3.63 4.43
South Atlantic 3.44 4.34 4.41 4.48 4.66 5.52
West North Central 1.55 1.69 1.72 1.74 1.77 1.97
West South Central 2.11 2.66 2.70 2.74 2.82 3.22
Total U.S. 21.53 25.13 25.52 25.91 26.69 30.57
Table A-10Regional Energy Consumption Projection for Wastewater Treatment by POTWs – 5Percent Increase in Unit Electricity Consumption
Billion kWh per year by Region 2000 2005 2010 2015 2020 2050
East North Central 4.89 5.31 5.39 5.48 5.58 6.17
East South Central 1.27 1.48 1.51 1.53 1.57 1.80
Middle Atlantic 3.59 3.95 4.01 4.07 4.16 4.64
Mountain 1.14 1.36 1.38 1.40 1.45 1.68
New England 1.15 1.31 1.33 1.35 1.37 1.52
Pacific 2.75 3.43 3.48 3.54 3.72 4.54
South Atlantic 3.52 4.45 4.52 4.58 4.78 5.65
West North Central 1.59 1.73 1.76 1.78 1.82 2.01
West South Central 2.17 2.73 2.77 2.81 2.89 3.30
Total U.S. 22.06 25.74 26.14 26.54 27.34 31.31

Supporting Data
A-8
Electricity Consumption for Water Supply by End-Users
Domestic SectorTable A-11Baseline Regional Energy Consumption Projection for Water Supply by the DomesticSector
Million kWh per year by Region 2000 2005 2010 2015 2020 2050
East North Central 174 177 180 182 185 200
East South Central 46 48 50 51 52 58
Middle Atlantic 106 107 109 111 113 129
Mountain 59 64 67 70 73 93
New England 47 48 49 50 52 60
Pacific 81 86 93 102 110 174
South Atlantic 242 256 268 280 292 364
West North Central 74 76 78 80 82 91
West South Central 64 68 71 75 79 104
Total U.S. 894 930 965 1,001 1,038 1,274

Supporting Data
A-9
Commercial SectorTable A-12Commercial Sector Growth Projections
Commercial Floor Space(million square feet) 1995 2000 2005 2010 2015 2020 2025 2050
United States 71,101 76,963 81,730 86,410 91,358 96,589 102,120 134,904
Average Annual GrowthRate
1995 to2000
2000 to2005
2005 to2010
2010 to2015
2015 to2020
2020 to2025
Projectedthrough
2050
United States 1.60% 1.21% 1.12% 1.12% 1.12% 1.12% 1.12%
Source: EPRI [2]
Table A-13Baseline Regional Energy Consumption Projection for Water Supply by the CommercialSector
Million kWh per year by Region 2000 2005 2010 2015 2020 2050
East North Central 54 55 56 57 58 62
East South Central 13 13 13 14 14 16
Middle Atlantic 52 53 54 55 56 64
Mountain 59 64 67 70 73 93
New England 22 23 23 24 25 29
Pacific 164 174 189 206 223 353
South Atlantic 54 57 60 63 65 82
West North Central 29 30 31 32 32 36
West South Central 28 30 32 33 35 46
Total U.S. 476 499 525 553 581 780

Supporting Data
A-10
Industrial and Mining SectorsTable A-14Industrial Sector Growth Projections
Industrial Value Added(billion 1993 dollars) 1995 2000 2005 2010 2015 2020 2025 2050
United States 1,452 1,651 1,874 2,093 2,338 2,611 2,916 5,659
Average Annual GrowthRate
1995 to2000
2000 to2005
2005 to2010
2010 to2015
2015 to2020
2020 to2025
Projectedthrough
2050
United States 2.61% 2.57% 2.23% 2.23% 2.23% 2.23% 2.23%
Source: EPRI [3]
Table A-15Baseline Regional Energy Consumption Projection for Water Supply by the IndustrialSector
Million kWh per year by Region 2000 2005 2010 2015 2020 2050
East North Central 824 935 1,045 1,167 1,303 2,529
East South Central 345 392 438 489 546 1,060
Middle Atlantic 325 369 412 461 514 999
Mountain 88 100 111 124 139 270
New England 30 34 38 43 48 92
Pacific 328 373 416 465 519 1,008
South Atlantic 650 738 824 920 1,028 1,995
West North Central 111 126 141 158 176 341
West South Central 639 725 810 905 1,011 1,961
Total U.S. 3,341 3,793 4,236 4,731 5,284 10,255

Supporting Data
A-11
Table A-16Mining Sector Growth Projections
Mining Value Added(billion 1993 dollars) 1995 2000 2005 2010 2015 2020 2025 2050
United States 96 98 102 106 110 114 119 149
Average Annual GrowthRate
1995 to2000
2000 to2005
2005 to2010
2010 to2015
2015 to2020
2020 to2025
Projectedthrough
2050
United States 0.58% 0.76% 0.75% 0.75% 0.75% 0.75% 0.75%
Source: EPRI [3]
Table A-17Baseline Regional Energy Consumption Projection for Water Supply by the Mining Sector
Million kWh per year by Region 2000 2005 2010 2015 2020 2050
East North Central 52 54 57 59 61 76
East South Central 8 9 9 9 10 12
Middle Atlantic 83 86 90 93 97 121
Mountain 131 136 141 146 152 190
New England 3 4 4 4 4 5
Pacific 20 20 21 22 23 29
South Atlantic 73 76 79 82 85 107
West North Central 71 74 77 80 83 104
West South Central 47 49 51 53 55 69
Total U.S. 490 509 528 548 569 713

Supporting Data
A-12
Irrigation and Livestock
Table A-18Areas Under Irrigation by Region
Thousand Acres 1997 2000 2005 2010 2015 2020 2025 2050
United States 54,998 57,973 63,403 69,499 76,360 84,105 92,873 158,940
East North Central 1,369 1,500 1,746 2,033 2,367 2,755 3,208 6,862
East South Central 1,257 1,441 1,810 2,273 2,854 3,585 4,502 14,063
Middle Atlantic 198 207 222 238 255 274 294 418
Mountain 14,433 14,785 15,390 16,020 16,676 17,359 18,069 22,084
New England 63 71 87 107 131 160 196 540
Pacific 12,447 12,948 13,827 14,766 15,769 16,840 17,984 24,980
South Atlantic 3,083 3,217 3,453 3,706 3,978 4,270 4,583 6,529
West North Central 11,557 12,197 13,344 14,598 15,971 17,473 19,115 29,957
West South Central 10,591 11,608 13,525 15,757 18,359 21,390 24,922 53,507
Source: U.S. Department of Agriculture [4]

Supporting Data
A-13
Table A-19Compound Annual Irrigation Growth Rates by Region
1997 to2000
2000 to2005
2005 to2010
2010 to2015
2015 to2020
2020 to2025
Projectedthrough
2050
United States 1.72% 1.72% 1.72% 1.72% 1.72% 1.72% 1.72%
East North Central 3.09% 3.09% 3.09% 3.09% 3.09% 3.09% 3.09%
East South Central 4.66% 4.66% 4.66% 4.66% 4.66% 4.66% 4.66%
Middle Atlantic 1.42% 1.42% 1.42% 1.42% 1.42% 1.42% 1.42%
Mountain 0.81% 0.81% 0.81% 0.81% 0.81% 0.81% 0.81%
New England 4.14% 4.14% 4.14% 4.14% 4.14% 4.14% 4.14%
Pacific 1.32% 1.32% 1.32% 1.32% 1.32% 1.32% 1.32%
South Atlantic 1.43% 1.43% 1.43% 1.43% 1.43% 1.43% 1.43%
West North Central 1.81% 1.81% 1.81% 1.81% 1.81% 1.81% 1.81%
West South Central 3.10% 3.10% 3.10% 3.10% 3.10% 3.10% 3.10%
Source: U.S. Department of Agriculture [4]
Table A-20Baseline Regional Energy Consumption Projection for Water Supply for Irrigation
Million kWh per year by Region 2000 2005 2010 2015 2020 2050
East North Central 180 210 245 285 331 825
East South Central 575 722 907 1,139 1,430 5,611
Middle Atlantic 29 31 33 36 38 58
Mountain 7,641 7,954 8,279 8,618 8,971 11,413
New England 29 35 43 53 64 217
Pacific 6,909 7,378 7,879 8,415 8,986 13,330
South Atlantic 905 972 1,043 1,120 1,202 1,838
West North Central 3,007 3,289 3,598 3,937 4,307 7,384
West South Central 4,332 5,048 5,881 6,852 7,983 19,970
Total U.S. 23,607 25,639 27,909 30,453 33,314 60,646

Supporting Data
A-14
Table A-21Baseline Regional Energy Consumption Projection for Water Supply for Livestock
Million kWh per year by Region 2000 2005 2010 2015 2020 2050
East North Central 53 54 55 56 57 61
East South Central 135 140 145 148 152 169
Middle Atlantic 21 21 21 21 22 25
Mountain 241 262 275 287 300 382
New England 4 4 4 4 4 5
Pacific 101 107 116 127 138 218
South Atlantic 92 97 101 106 111 138
West North Central 125 129 132 135 138 153
West South Central 221 233 246 259 272 359
Total U.S. 992 1,047 1,095 1,144 1,192 1,510

Supporting Data
A-15
Thermal Power GenerationTable A-22Projected Thermal Electricity Generation
Million kWh per yearby DOE Region 2000 2005 2010 2015 2020
Region 1 538,398 586,890 614,832 632,654 648,644
Region 2 245,170 251,010 255,480 265,520 280,917
Region 3 223,129 249,910 265,623 265,209 276,798
Region 4 235,939 265,738 279,698 296,679 312,152
Region 5 155,253 168,863 178,832 184,424 190,974
Region 6 93,733 85,829 84,528 97,124 97,356
Region 7 82,627 91,397 83,911 92,156 92,961
Region 8 149,231 161,209 179,880 200,948 216,173
Region 9 600,590 662,575 707,346 728,856 756,565
Region 10 301,274 310,671 327,082 338,388 345,545
Region 11 101,413 154,119 166,847 174,515 187,461
Region 12 123,758 150,342 153,749 153,951 158,136
Region 13 149,189 131,727 164,367 192,511 213,432
Total U.S. 2,999,703 3,270,279 3,462,176 3,622,935 3,777,115
For generation from biomass, coal, combined cycle, municipal solid waste (MSW), nuclear, and other fossil fuelgeneration only.
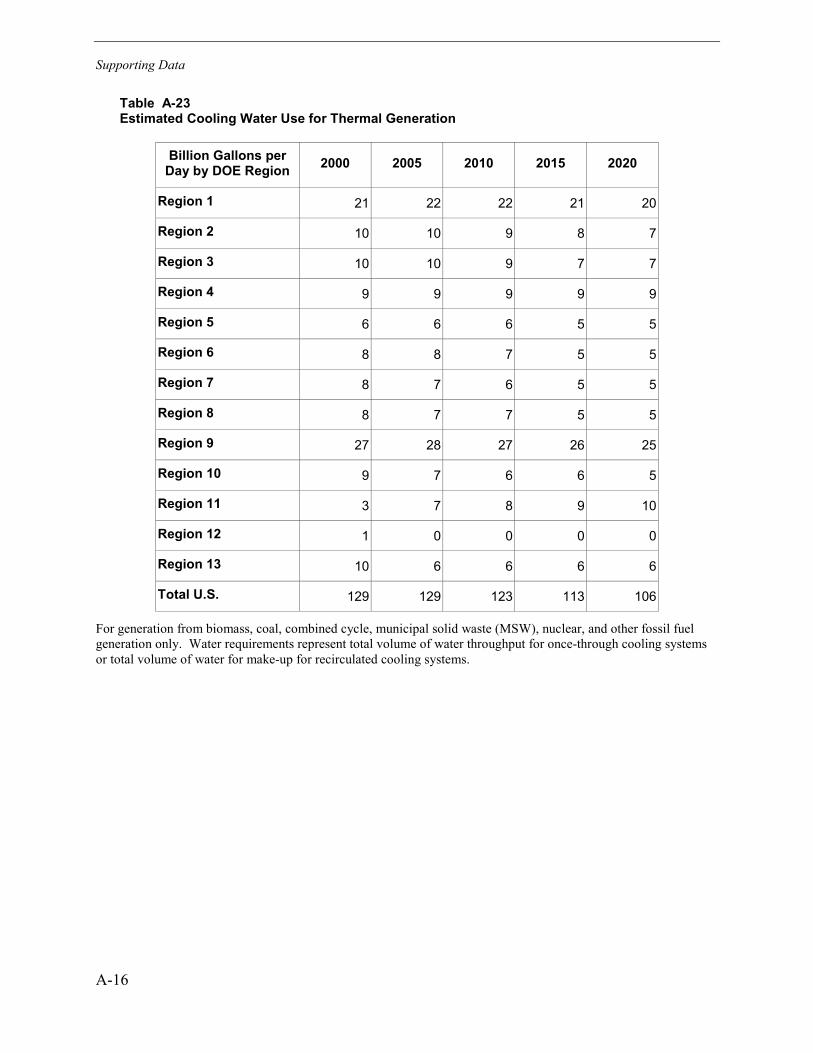
Supporting Data
A-16
Table A-23Estimated Cooling Water Use for Thermal Generation
Billion Gallons perDay by DOE Region 2000 2005 2010 2015 2020
Region 1 21 22 22 21 20
Region 2 10 10 9 8 7
Region 3 10 10 9 7 7
Region 4 9 9 9 9 9
Region 5 6 6 6 5 5
Region 6 8 8 7 5 5
Region 7 8 7 6 5 5
Region 8 8 7 7 5 5
Region 9 27 28 27 26 25
Region 10 9 7 6 6 5
Region 11 3 7 8 9 10
Region 12 1 0 0 0 0
Region 13 10 6 6 6 6
Total U.S. 129 129 123 113 106
For generation from biomass, coal, combined cycle, municipal solid waste (MSW), nuclear, and other fossil fuelgeneration only. Water requirements represent total volume of water throughput for once-through cooling systemsor total volume of water for make-up for recirculated cooling systems.
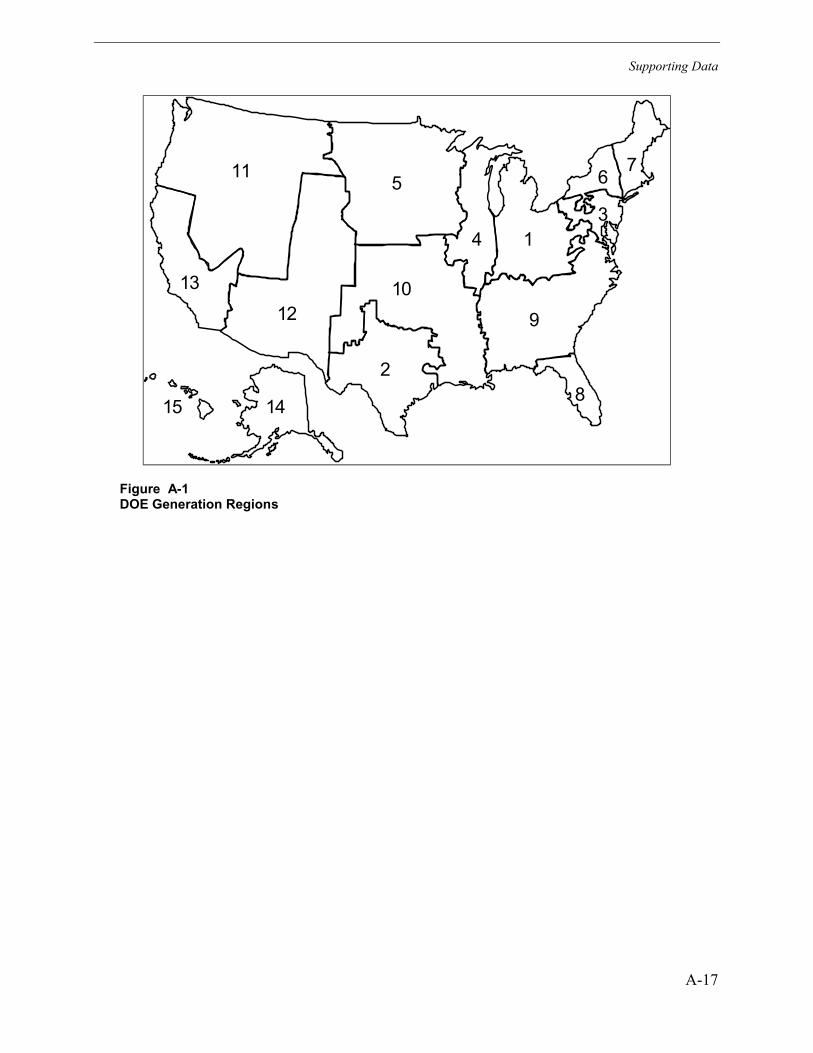
Supporting Data
A-17
511
12
2
4
8
9
1
1013
7
14
3
6
15
Figure A-1DOE Generation Regions
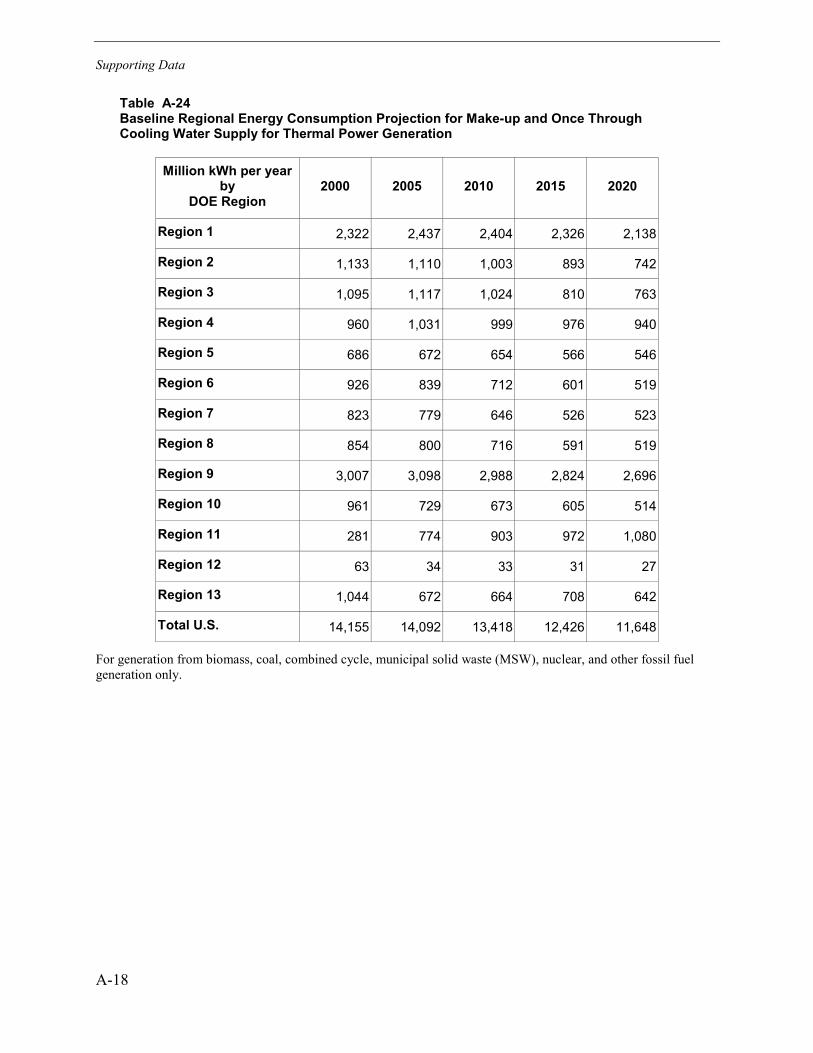
Supporting Data
A-18
Table A-24Baseline Regional Energy Consumption Projection for Make-up and Once ThroughCooling Water Supply for Thermal Power Generation
Million kWh per yearby
DOE Region2000 2005 2010 2015 2020
Region 1 2,322 2,437 2,404 2,326 2,138
Region 2 1,133 1,110 1,003 893 742
Region 3 1,095 1,117 1,024 810 763
Region 4 960 1,031 999 976 940
Region 5 686 672 654 566 546
Region 6 926 839 712 601 519
Region 7 823 779 646 526 523
Region 8 854 800 716 591 519
Region 9 3,007 3,098 2,988 2,824 2,696
Region 10 961 729 673 605 514
Region 11 281 774 903 972 1,080
Region 12 63 34 33 31 27
Region 13 1,044 672 664 708 642
Total U.S. 14,155 14,092 13,418 12,426 11,648
For generation from biomass, coal, combined cycle, municipal solid waste (MSW), nuclear, and other fossil fuelgeneration only.

Supporting Data
A-19
References1. “Current Population Reports: Population Projections,” United States Department of
Commerce, Economics and Statistics Administration, Census Bureau, Washington, DC:1997.
2. 1997 Commercial Energy Forecast, prepared by Regional Economic Research Inc., forEPRI, March 1997.
3. 1997 Industrial Energy Forecast, prepared by Regional Economic Research Inc., for EPRI,March 1997.
4. Census of Agriculture 1999, United States Department of Agriculture, Washington DC:2000. Data derived from Table 9-11, Land in Farms: Irrigated Land by State, 1959-1997.Document downloaded from the USDA website at http://www.usda.gov.


© 2002 Electric Power Research Institute (EPRI), Inc.All rightsreserved. Electric Power Research Institute and EPRI are registered service marks of the Electric Power Research Institute, Inc.EPRI. ELECTRIFY THE WORLD is a service mark of the ElectricPower Research Institute, Inc.
Printed on recycled paper in the United States of America
1006787
Strategic Science & Technology
EPRI • 3412 Hillview Avenue, Palo Alto, California 94304 • PO Box 10412, Palo Alto, California 94303 • USA800.313.3774 • 650.855.2121 • [email protected] • www.epri.com
About EPRI
EPRI creates science and technology solutions for
the global energy and energy services industry. U.S.
electric utilities established the Electric Power
Research Institute in 1973 as a nonprofit research
consortium for the benefit of utility members, their
customers, and society. Now known simply as EPRI,
the company provides a wide range of innovative
products and services to more than 1000 energy-
related organizations in 40 countries. EPRI’s
multidisciplinary team of scientists and engineers
draws on a worldwide network of technical and
business expertise to help solve today’s toughest
energy and environmental problems.
EPRI. Electrify the World