water supply project - United States Agency for …pdf.usaid.gov/pdf_docs/PNADW462.pdfMario...
128
Transcript of water supply project - United States Agency for …pdf.usaid.gov/pdf_docs/PNADW462.pdfMario...


ii

iv
Water Supply Project Appraisal Guidebook
This guidebook was published with assistance from the USAID Philippine Water Revolving Fund (PWRF) Support Program. The views expressed here do not necessarily refl ect those of the USAID or the United States Government.
The PWRF Support Program is a collaborative undertaking of GOP Partners, USAID, Japan International Cooperation Agency (JICA), LGU Guarantee Corporation (LGUGC), and private fi nancing institutions (PFIs) through the Bankers Association of the Philippines. The Program’s GOP partners are led by the Department of Finance and include the Development Bank of the Philippines and the Municipal Development Fund Offi ce.
The PWRF Support Program aims to establish a co-fi nancing facility that combines ODA/JICA resources with PFI funds for creditworthy water service providers, using a fi nancial structure designed to allow affordable loan terms without sacrifi cing the viability of PFIs. PFIs have access to credit risk guarantees provided by LGUGC and USAID’s Development Credit Authority.
The PWRF Support Program operates around three main objectives, which are to:
• Establish the co-fi nancing facility and develop a long-term fi nancing strategy and mechanism with broader private sector participation;
• Strengthen water project fi nancing and enable other conditions necessary for optimizing the PWRF Support Program’s positive impact on the sector, including corollary regulatory reforms; and
• Assist water districts and local government units in developing a pipeline of bankable water projects.
The PWRF Support Program is implemented by Development Alternatives, Inc. in association with The Community Group International LLC, Resource Mobilization Advisors, and CEST, Inc.

v
ContributorsChapter I An overview of the Philippine water supply sector Alma Porciuncula, Chief of Party, Philippines Water Revolving Fund Support Program
Chapter 2 Regulation of water service providers Ramon Alikpala, Executive Director, National Water Resources Board Mario Quitoriano, Department Manager, Local Water Utilities Association (LWUA) Noemi Tan, Acting Division Manager, LWUA
Chapter 3 Water services fi nancing Rodolfo Pantillano, Water and Sanitation Finance Specialist, PWRF SP
Chapter 4 Project and feasibility study preparation Antonio de Vera, Water Utility Development Specialist, PWRF SP Del McCluskey, Technical Area Manager, Development Alternatives, Inc. Ferdinand Asuncion, Senior Project Specialist, PWRF SP Mario Quitoriano, Department Manager, LWUA
Chapter 5 Elements of water system development Ephraim Jacildo, LWUA Armando Paredes, General Manager, Metro Cebu Water District Arnold Alvarez, Hydrogeologist, PWRF SP Jose Marie Lim, Water Treatment Specialist, PWRF SP
Chapter 6 Project appraisal Aileen Castro, Assistant Vice President, LGU Guarantee Corporation Rodolfo Pantillano, Water and Sanitation Finance Specialist, PWRF SP Antonio De Vera, Water Utility Development Specialist, PWRF SP
Chapter 7 Loan application and approval Adoracion Navarro, Economic Policy Specialist, PWRF SP
Chapter 8 Loan implementation Ferdinand Asuncion, Senior Project Specialist, PWRF SP Doreen Carla Erfe, Senior Policy and Institutional Development Specialist, PWRF SP
Technical Editor Del McCluskey, Development Alternatives, Inc.
Technical reviewersMadeline Aldana, Senior Assistant Vice President, Development Bank of the PhilippinesFe Banluta, Program Manager, Department of the Interior and Local GovernmentNanette Biason, Senior Manager, Bank of the Philippine IslandsAlberto Bienvenida, Senior Vice President, Allied Banking CorporationJustino Bote, Assistant Vice President, DBPLiduvino Geron, First Vice President, Land Bank of the Philippines Ephraim Jacildo, Division Manager, Project Planning Division Area 5, LWUALydia Orial, President, LGU Guarantee CorporationMario Quitoriano, Department Manager, LWUAMario Villasan, General Manager, Cabanatuan City Water District

vi
AcknowledgmentThe Philippine Water Revolving Fund Support Program would like to thank all who contributed to the preparation of this project appraisal guidebook:
• The writers and our technical editor who generously shared their valuable time and expertise; • Our peer group reviewers whose insightful comments enriched the material immensely; • Offi cers and staff of the Local Water Utilities Administration who provided vital information on the water sector; • Offi cers and staff of the Philippine Association of Water Districts who shared with us their directory of members
and many others who in various ways made this publication possible.
Last but not least, we thank USAID not only for their support in this undertaking but also for their staunch advocacy of public-private partnerships.
vii
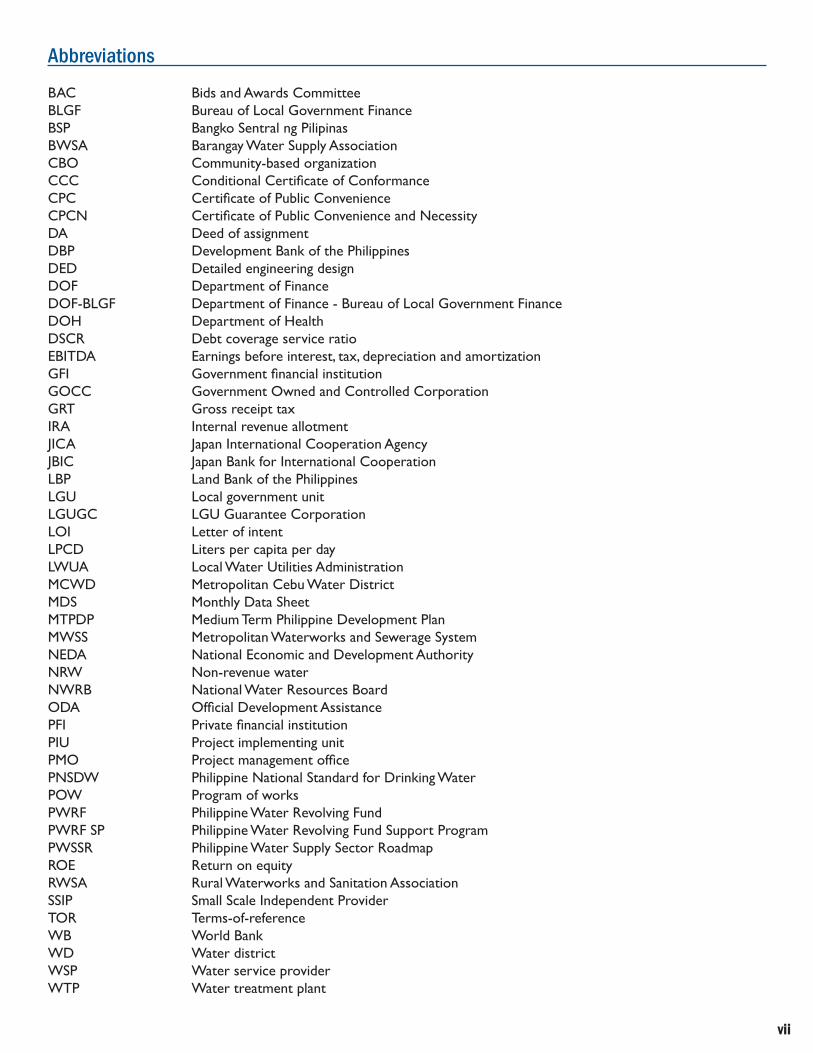
Abbreviations
BAC Bids and Awards CommitteeBLGF Bureau of Local Government FinanceBSP Bangko Sentral ng PilipinasBWSA Barangay Water Supply AssociationCBO Community-based organizationCCC Conditional Certifi cate of ConformanceCPC Certifi cate of Public ConvenienceCPCN Certifi cate of Public Convenience and NecessityDA Deed of assignmentDBP Development Bank of the PhilippinesDED Detailed engineering designDOF Department of FinanceDOF-BLGF Department of Finance - Bureau of Local Government Finance DOH Department of HealthDSCR Debt coverage service ratioEBITDA Earnings before interest, tax, depreciation and amortizationGFI Government fi nancial institutionGOCC Government Owned and Controlled CorporationGRT Gross receipt taxIRA Internal revenue allotmentJICA Japan International Cooperation AgencyJBIC Japan Bank for International Cooperation LBP Land Bank of the PhilippinesLGU Local government unitLGUGC LGU Guarantee CorporationLOI Letter of intentLPCD Liters per capita per dayLWUA Local Water Utilities AdministrationMCWD Metropolitan Cebu Water DistrictMDS Monthly Data SheetMTPDP Medium Term Philippine Development PlanMWSS Metropolitan Waterworks and Sewerage System NEDA National Economic and Development AuthorityNRW Non-revenue waterNWRB National Water Resources BoardODA Offi cial Development AssistancePFI Private fi nancial institutionPIU Project implementing unitPMO Project management offi cePNSDW Philippine National Standard for Drinking WaterPOW Program of worksPWRF Philippine Water Revolving FundPWRF SP Philippine Water Revolving Fund Support ProgramPWSSR Philippine Water Supply Sector RoadmapROE Return on equityRWSA Rural Waterworks and Sanitation AssociationSSIP Small Scale Independent ProviderTOR Terms-of-referenceWB World BankWD Water districtWSP Water service providerWTP Water treatment plant

viii

ix
Table of ContentsContributors ....................................................................................................................................................................................... vTechnical reviewers ............................................................................................................................................................................ vAcknowledgment ............................................................................................................................................................................... viAbbreviations ...................................................................................................................................................................................... viiIntroduction ........................................................................................................................................................................................ xiI. WATER SERVICE PROVISION, REGULATION, AND FINANCING .................................................................................. 1
CHAPTER 1. AN OVERVIEW OF THE PHILIPPINE WATER SUPPLY SECTOR ............................................................................ 2Water supply service levels .................................................................................................................................................................. 2Market structure ..................................................................................................................................................................................... 3Performance of water service providers .......................................................................................................................................... 5
CHAPTER 2. REGULATION OF WATER SERVICE PROVIDERS ...................................................................................................... 7National government policy ................................................................................................................................................................. 7Laws governing water service providers ........................................................................................................................................... 7Regulatory institutions .......................................................................................................................................................................... 9Water rights and regulation ................................................................................................................................................................ 11Economic regulation .............................................................................................................................................................................. 11Quality regulation ................................................................................................................................................................................... 16
CHAPTER 3. WATER SERVICES FINANCING ...................................................................................................................................... 17Municipal water fi nance: An ODA-centric structure ...................................................................................................................... 17Size of municipal water debt market .................................................................................................................................................. 19Estimating potential fi nancial demand ................................................................................................................................................ 20Key considerations for participation in water projects ................................................................................................................. 20
II. DEVELOPING PROJECTS AND ASSESSING FEASIBILITY ................................................................................................. 23CHAPTER 4. PROJECT AND FEASIBILITY STUDY PREPARATION ............................................................................................... 24
Project preparation ................................................................................................................................................................................ 24Effi ciency improvement program ........................................................................................................................................................ 28Alternative analysis ................................................................................................................................................................................. 29
CHAPTER 5. ELEMENTS OF WATER SYSTEM DEVELOPMENT ..................................................................................................... 31Demand analysis and forecasting ........................................................................................................................................................ 31Developing water sources .................................................................................................................................................................... 35Water treatment .................................................................................................................................................................................... 38Water transmission and distribution ................................................................................................................................................. 41
CHAPTER 6. PROJECT APPRAISAL ......................................................................................................................................................... 43Due diligence checklist for project appraisal ................................................................................................................................... 43Institutional analysis ............................................................................................................................................................................... 44Focus on fi nancial modeling and forecasting .................................................................................................................................... 46Technical / operational assumptions ................................................................................................................................................... 46Financial assumptions ............................................................................................................................................................................. 47
III. LOAN APPLICATION, APPROVAL AND IMPLEMENTATION ......................................................................................... 51CHAPTER 7. LOAN APPLICATION AND APPROVAL ....................................................................................................................... 52CHAPTER 8. LOAN IMPLEMENTATION ............................................................................................................................................... 55
Procurement ............................................................................................................................................................................................ 55Project monitoring and supervision ................................................................................................................................................... 59
Appendix 1. LWUA Survey Results: WD Performance Indicators Industry Average (2006) ............................................ 66Appendix 2.A. Scoring System for Creditworthiness Classifi cation of Water Districts .................................................... 68Appendix 2.B. Classifi cation results (as of 2008) ........................................................................................................................ 69Appendix 2.C. Rating system for water districts in the Philippines ........................................................................................ 74Appendix 3. List of LGUs operating water utilities with borrowing capacity of P60 million and above (as of 2008) 78Appendix 4. Retawon City case study ........................................................................................................................................... 80Appendix 4.A. Retawon City Water District ............................................................................................................................... 81Appendix 4.B. Regional Water Tariffs as of September 2007 ................................................................................................... 85

x
References ........................................................................................................................................................................................... 86Contributing authors ........................................................................................................................................................................ 87List of Partners ................................................................................................................................................................................... 90Greetings from the PAWD President ............................................................................................................................................ 91Directory of water districts ............................................................................................................................................................ 92
FiguresFigure 1.Water supply sector structure .................................................................................................................................................... 3Figure 2. PWSSR: correlation of issues, strategies and programs ......................................................................................................... 8Figure 3. Degrees of regulation of water service providers .................................................................................................................. 11Figure 4. Financial fl ows to the water supply sector ............................................................................................................................... 17Figure 5. Schematic for net present-value analysis .................................................................................................................................. 30Figure 6. Maximum day vs. Average day demand ...................................................................................................................................... 32Figure 7. Peak hour demand and average day demand ........................................................................................................................... 33Figure 8. Process fl ow for a loan account ................................................................................................................................................. 52Figure 9. Procurement fl owchart for consulting services ...................................................................................................................... 56Figure 10. Procurement fl owcharts for infrastructure projects ........................................................................................................... 57Figure 11. Stages/activities of a water supply project ............................................................................................................................. 61Figure 12. Monitoring structure/s and reporting fl ow ............................................................................................................................ 64
TablesTable 1. Market share in urban and rural populations ............................................................................................................................ 3Table 2. Water districts by category ........................................................................................................................................................... 4Table 3. Selected performance indicators of water districts ................................................................................................................. 5Table 4. Result of performance benchmarking for small town water supply .................................................................................... 6Table 5. List of major legislation relevant to water supply .................................................................................................................... 10Table 6. Meter service ratio .......................................................................................................................................................................... 14Table 7. Eo 279 creditworthiness classifi cations and funding source .................................................................................................. 18Table 8. Rating system for water districts ................................................................................................................................................. 19Table 9. Estimates of investment demand for water supply infrastructure ........................................................................................ 20Table 10. Components of “in-place” pricing .............................................................................................................................................. 27Table 11. Economic life of common water supply facilities ................................................................................................................... 30Table 12. Maximum-day to average-day demand ratio ............................................................................................................................ 32Table 13. Assumptions in calculating nrw in the absence of actual data ............................................................................................. 35Table 14. Pros and cons of surface and groundwater development .................................................................................................... 36Table 15. Minimum distance between wells .............................................................................................................................................. 38Table 16. Comparing major water treatment technologies .................................................................................................................. 40Table 17. Water treatment process selection ........................................................................................................................................... 40Table 18. Loan terms for water projects ................................................................................................................................................... 48Table 19. Checklist of loan application requirements ............................................................................................................................. 53Table 20. Activities to monitor in a water supply project ...................................................................................................................... 62Table 21. Suggested performance indicators ............................................................................................................................................. 63
BoxesBox 1. Tariff setting guidelines of LWUA for water districts ................................................................................................................. 12Box 2. NWRB Tariff setting guidelines ....................................................................................................................................................... 15Box 3. Metropolitan Cebu Water District vs. Margarita Adala ............................................................................................................. 21Box 4. Needs/problem analysis .................................................................................................................................................................... 24Box 5. Possible approaches to solving a problem .................................................................................................................................... 25Box 6. Physical elements considered in developing cost estimates .................................................................................................... 26Box 7. Guiding Principles of RA 9184 ........................................................................................................................................................ 55Box 8. What is monitoring? ........................................................................................................................................................................... 59

xi
Introduction
This guidebook is designed to provide private and government-owned banks with information helpful in reviewing and appraising loan applications for investments in water supply projects, as well as inform borrowers about loan requirements, evaluation parameters and the application process.
Developed by a team of industry experts from the Local Water Utilities Administration, the National Water Resources Board, Metro Cebu Water District, LGU Guarantee Corporation, and members of the USAID-assisted Philippine Water Revolving Fund Support Program, this guide is an excellent resource for bank account offi cers, bank credit committee members, water project investors and guarantors, offi cers and directors of water districts, LGU offi cials involved in water regulation, private sector operators, and regulators.
The guidebook is divided into three main sections: Section I provides an overview of the current state of water services provision, regulations, and fi nancing; Section II discusses the components of water project development and feasibility study preparation; and Section III focuses on loan appraisal and project implementation.
As with any guidebook, periodic updating is needed to maintain currency and relevance. Your feedback is appreciated as we continue to make this material more useful in the evaluation and appraisal of water supply projects.

xii

1
I. WATER SERVICE PROVISION, REGULATION, AND FINANCING

2 Chapter 1: An overview of the Philippine water supply sector
Water Supply Project Appraisal Guidebook for Investors and Decision Makers
Chapter 1. An overview of the Philippine water supply sector
Investments in water service have failed to grow at par with population growth over the past decade. Instead of raising levels of access to safe water supply, service coverage has in fact slipped from 81.4 percent in 1999 to 80 percent in 2002, and only slightly increased to 80.2 percent in 2004. In keeping with targets of the Millennium Development Goals, the Philippines committed to cut by half the number of people without access to safe water by 2015. In 2004 the population estimate was set at 83.18 million; thus the target is to provide safe water supply to 8.3 million more people.
The responsibility of providing this service rests with more than 5,000 water service providers (WSP). These include approximately 500 water districts (WDs); 1,000 LGU-managed systems; 3,000 barangay water services; 500 rural water associations; 200 cooperatives; and 9 private fi rms, including the two Metro Manila concessionaires Manila Water Company and Maynilad Water Services.1 A large but unknown number of small-scale independent providers (SSIP) also supply piped water in some communities or sell water from trucks and handcarts.
Various policies issued over the years, combined with numerous market coping mechanisms, have produced a complex network of water service providers. Republic Act 6234 created MWSS. Presidential Decree 198 authorized the creation of water districts and the Local Government Code authorized LGU-run systems. Executive policies promoted the creation of community-based water service providers—often a pre-condition for local governments to obtain government or donor fi nancing—and the government’s policy of private sector participation resulted in the establishment of two concessionaires in Metro Manila.
The failure of formal water service providers to deliver
System component Level I Level II Level III
Developed source � � �Water treatment sometimes �Transmission � �Distribution – CommunalDistribution – Household and commercial
� �
Components commonly found in different systems
1World Bank, “Philippines: Meeting Infrastructure Challenges, “ 2005.
adequate, quality service prompted households to drill their own wells, purchase vended water or get piped service from small-scale independent providers, all with different business models, governance structures, levels of performance and government oversight.
Water supply service levelsWater supply services are classifi ed into three levels based on components of the service:
• Level 1 service. This is the simplest form of water service, based only on a developed source which may be a spring, river intake structure or a deep well. Water is seldom treated or disinfected and benefi ciaries, some coming from as far as 250 meters away, must fetch water using buckets and containers. An average 20 liters per capita per day is consumed by users.
• Level 2 service. This system provides communal/public, pipeline/s and faucets at strategic locations in the community. Barangays usually adopt this when the source, usually a spring, is elevated enough to allow the water to fl ow by gravity. Water disinfection may be present but is often unreliable, and benefi ciaries must also fetch water in buckets and containers. The farthest user is about 25 meters away and the average consumption is 60 liters per capita per day.
• Level 3 service. This is a system that provides piped connections to households and commercial establishments, with consumption of at least 100 liters per capita per day.

3Chapter 1: An overview of the Philippine water supply sector
Water Supply Project Appraisal Guidebook for Investors and Decision Makers
Market structureA total 80 percent of the population currently receives water from recognized water service providers—55 percent are served by LGUs and community-based organizations; 20 percent by water districts; and 5 percent by private operators. The remainder receives water through informal providers. Offi cially recognized providers are required to meet national water quality standards; no such oversight exists for informal providers.
Of greatest interest to the fi nancial community are those organizations providing Level 3 services to households. A summary of the market structure is presented in Figure 1 and Table 1.
Access to formal service: 80% Informal access: 20%Level 3
45%Level 2
10%Level 1
25%- Private wells- Tanked or vended water supply- Piped supply provided by SSIPs
Water districts
20%
Private operators 5%
LGUs/CBOs 20%
LGUs and CBOs 35%
Figure 1. Water supply sector structure
Source: WB Report, Philippines: Meeting Infrastructure Challenges, 2005
Table 1. Market share in urban and rural populations (%)Water service provider Urban Rural
LGUs/CBOs 40 65Water districts 30 10Private operators 10 -SSIPs 15 10Self provision 5 15Total 100 100
Source: MTPDP 2001-2004 and WB-funded Filipino Report Card on Pro-poor Services (2001)
Water districtsIn the 1970s advocacy for corporatized service providers grew, paving the way for Presidential Decree 198 or the Provincial Water Utilities Act of 1973. PD 198 authorized the creation of water districts and established the Local Water Utilities Administration (LWUA) as a fi nancing institution primarily for water projects.
PD 198 required LGUs to initiate the creation of water districts through a resolution by the LGU legislative body (local sanggunian). Such resolutions formed the water districts, their initial boards of directors, and transferred assets of the existing waterworks system to the new districts. Under PD 198, municipal and city mayors or governors have the authority to appoint subsequent members of the Board of Directors.2
2 Where a water district covers several municipalities, the mayor of the municipality or city which has at least 75% of service connections will be the appointing authority.Otherwise, the authority is vested on the provincial governor.
4 Chapter 1: An overview of the Philippine water supply sector
Water Supply Project Appraisal Guidebook for Investors and Decision Makers
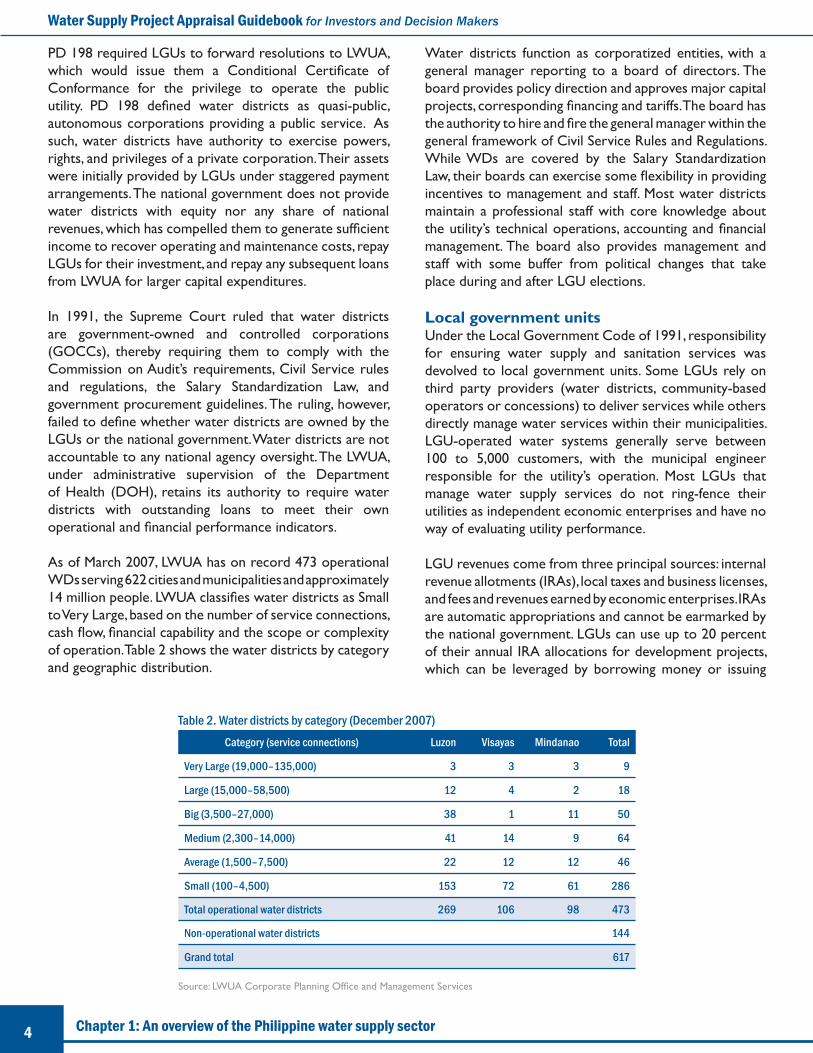
Table 2. Water districts by category (December 2007)Category (service connections) Luzon Visayas Mindanao Total
Very Large (19,000–135,000) 3 3 3 9
Large (15,000–58,500) 12 4 2 18
Big (3,500–27,000) 38 1 11 50
Medium (2,300–14,000) 41 14 9 64
Average (1,500–7,500) 22 12 12 46
Small (100–4,500) 153 72 61 286
Total operational water districts 269 106 98 473
Non-operational water districts 144
Grand total 617
Source: LWUA Corporate Planning Offi ce and Management Services
Water districts function as corporatized entities, with a general manager reporting to a board of directors. The board provides policy direction and approves major capital projects, corresponding fi nancing and tariffs. The board has the authority to hire and fi re the general manager within the general framework of Civil Service Rules and Regulations. While WDs are covered by the Salary Standardization Law, their boards can exercise some fl exibility in providing incentives to management and staff. Most water districts maintain a professional staff with core knowledge about the utility’s technical operations, accounting and fi nancial management. The board also provides management and staff with some buffer from political changes that take place during and after LGU elections.
Local government units Under the Local Government Code of 1991, responsibility for ensuring water supply and sanitation services was devolved to local government units. Some LGUs rely on third party providers (water districts, community-based operators or concessions) to deliver services while others directly manage water services within their municipalities. LGU-operated water systems generally serve between 100 to 5,000 customers, with the municipal engineer responsible for the utility’s operation. Most LGUs that manage water supply services do not ring-fence their utilities as independent economic enterprises and have no way of evaluating utility performance.
LGU revenues come from three principal sources: internal revenue allotments (IRAs), local taxes and business licenses, and fees and revenues earned by economic enterprises. IRAs are automatic appropriations and cannot be earmarked by the national government. LGUs can use up to 20 percent of their annual IRA allocations for development projects, which can be leveraged by borrowing money or issuing
PD 198 required LGUs to forward resolutions to LWUA, which would issue them a Conditional Certifi cate of Conformance for the privilege to operate the public utility. PD 198 defi ned water districts as quasi-public, autonomous corporations providing a public service. As such, water districts have authority to exercise powers, rights, and privileges of a private corporation. Their assets were initially provided by LGUs under staggered payment arrangements. The national government does not provide water districts with equity nor any share of national revenues, which has compelled them to generate suffi cient income to recover operating and maintenance costs, repay LGUs for their investment, and repay any subsequent loans from LWUA for larger capital expenditures.
In 1991, the Supreme Court ruled that water districts are government-owned and controlled corporations (GOCCs), thereby requiring them to comply with the Commission on Audit’s requirements, Civil Service rules and regulations, the Salary Standardization Law, and government procurement guidelines. The ruling, however, failed to defi ne whether water districts are owned by the LGUs or the national government. Water districts are not accountable to any national agency oversight. The LWUA, under administrative supervision of the Department of Health (DOH), retains its authority to require water districts with outstanding loans to meet their own operational and fi nancial performance indicators.
As of March 2007, LWUA has on record 473 operational WDs serving 622 cities and municipalities and approximately 14 million people. LWUA classifi es water districts as Small to Very Large, based on the number of service connections, cash fl ow, fi nancial capability and the scope or complexity of operation. Table 2 shows the water districts by category and geographic distribution.

5Chapter 1: An overview of the Philippine water supply sector
Water Supply Project Appraisal Guidebook for Investors and Decision Makers
bonds, as long as the LGUs’ debt service obligations remain within 20 percent of their regular gross income.
Community-based organizationsCommunity-based systems, particularly rural waterworks and sanitation associations (RWSAs) and barangay water supply associations (BWSAs) and cooperatives generally provide levels 1 and 2 services. These systems, usually serving between 100 to 500 connections, are usually constructed using national government grants and appropriations or donor grants, with only token counterpart resources from the association. Most of these systems require continued subsidy from the LGU to cover operating costs and few have expanded their systems.
Private operators and small-scale independent providersThe two biggest private operators are Manila Water Company Inc. and Maynilad Water Services, Inc. Both hold 25-year franchises under the National Water Crisis Act of 1995. Their contracts, executed in 1997, include performance and regulatory guidelines and provide for tariff adjustment processes. Both concessionaires accessed commercial bank funding, with Manila Water raising capital through public offering of shares.
Other private operators are bulk water suppliers and management contractors that have received certifi cates of public convenience from the National Water Resources Board (NWRB), and small and medium enterprises that have secured business permits from their respective LGUs. These organizations include real estate developers, homeowners associations, local entrepreneurs and mobile water vendors.
3Results are posted on the LWUA website: http://www.lwua.gov.ph4The credit classifi cation results may be accessed from LWUA upon request.
Table 3. Selected performance indicators of water districts (industry averages)Indicators Overall Very Large Large Big Medium Average SmallFinancial
Current ratio 5.22 4.15 4.32 3.90 6.95 3.69 5.38
Debt service ratio 4.20 8.40 4.04 8.18 3.71 3.75 2.50
Net profi t ratio 0.10 0.23 0.10 0.15 0.09 0.24 0.06
Debt equity ratio 0.61 0.40 0.57 0.36 0.52 0.73 0.77
Operational
Collection ratio (%) 90 87 87 98 89 92 88
Non-revenue water (%) 24 34 31 26 26 27 20
Service connection/staff 155 167 192 187 179 148 121
Note: Appendix 1 contains additional data on industry averages; Appendix 2 on the Creditworthiness Index and classifi cation results.
Performance of water service providersWater districts and water service concessions provide the best information on operations and fi nancial performance, especially as water districts with outstanding loans must submit annual fi nancial and performance reports. As of June 2008, almost 97 percent of water districts had outstanding loans with LWUA.
Each year LWUA conducts a survey to determine industry averages on key operating and fi nancial indicators3 (refer to Table 3). The agency has also classifi ed water districts according to a creditworthiness index developed in response to EO 279. 4
Water districts provide more reliable service than other publicly operated water providers, particularly in terms of compliance with water quality standards, continuous supply and hydraulic pressure, and fi nancial performance. Most are able to routinely cover maintenance costs while servicing outstanding debt. Only a few however manage to accumulate suffi cient capital to fi nance system improvements.
A survey conducted by the Water and Sanitation Program with support from the World Bank showed that LGU-managed water systems performed poorly compared to other service providers (see Table 4). The survey, called “Benchmarking Performance of Small Town Water Supply,” covered 45 utilities from water districts, LGU-run systems, RWSAs, cooperatives and private operators serving between 600 to 600,000 connections.

6 Chapter 1: An overview of the Philippine water supply sector
Water Supply Project Appraisal Guidebook for Investors and Decision Makers
Table 4. Result of performance benchmarking for small town water supplyIndicators WD LGU RWSA/ Coops PrivateSample size 18.00 10.00 9.00 8.00
Service coverage (%) 69.00 57.00 66.00 66.00
Availability (hours) 23.00 18.00 20.00 22.00
Consumption (liters per capita/day) 120.00 96.00 127.00 144.00
Non-revenue water 26.00 36.00 16.00 26.00
Operating ratio 0.70 1.18 0.87 0.74
Accounts receivables (months) 1.30 2.30 2.60 1.70
Average tariff (P/m3) 17.82 7.22 7.99 15.37
Collection effi ciency (%) 99.00 91.00 99.00 102.00
Staff/1000 connections ratio 6.80 9.00 6.60 5.80
LGU-managed water systems have the lowest coverage ratios, shortest periods of water availability per day, and deliver the least amount of water to consumers. LGUs charge very low average tariffs which makes it diffi cult for them to meet operations and maintenance costs. They have low revenue collection effi ciency, high collection periods, the highest number of staff per 1000 connections, and the highest levels of non-revenue water. Despite poor performance, however, LGUs continue to operate water utilities because of unchallenged mandates to provide the service.
Banks also see LGUs as viable borrowers because they can secure taxes or revenue as collateral for loans and, for government fi nancing institutions, the assignment of internal revenue allotment. The Bureau of Local Government Finance (BLGF) under the Department of Finance (DOF) certifi es LGUs’ borrowing capacity and many lenders consider income class and the borrowing capacity of LGUs as proxies for creditworthiness. Appendix 3 lists the fi rst, second, and third income class LGUs that have a borrowing capacity of at least P60 million and are not served by WDs (as of 2008).
7Chapter 2: Regulation of water service providers
Water Supply Project Appraisal Guidebook for Investors and Decision Makers
Chapter 2. Regulation of water service providers
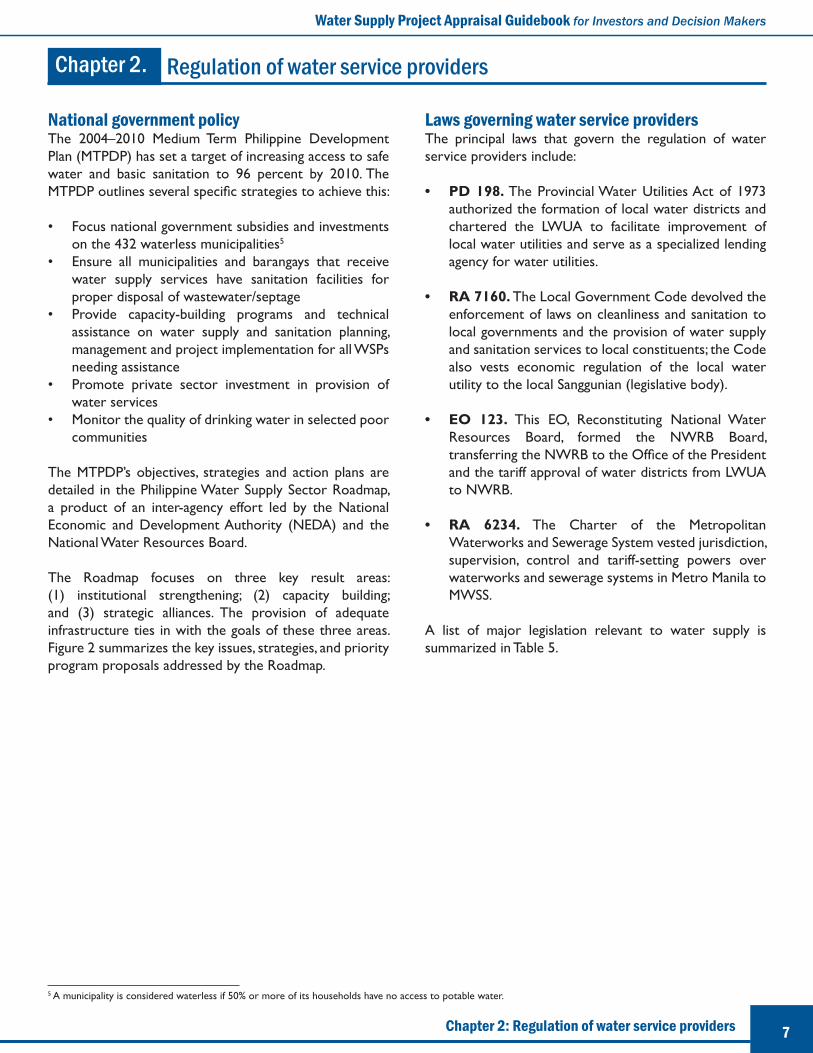
National government policyThe 2004–2010 Medium Term Philippine Development Plan (MTPDP) has set a target of increasing access to safe water and basic sanitation to 96 percent by 2010. The MTPDP outlines several specifi c strategies to achieve this:
• Focus national government subsidies and investments on the 432 waterless municipalities5
• Ensure all municipalities and barangays that receive water supply services have sanitation facilities for proper disposal of wastewater/septage
• Provide capacity-building programs and technical assistance on water supply and sanitation planning, management and project implementation for all WSPs needing assistance
• Promote private sector investment in provision of water services
• Monitor the quality of drinking water in selected poor communities
The MTPDP’s objectives, strategies and action plans are detailed in the Philippine Water Supply Sector Roadmap, a product of an inter-agency effort led by the National Economic and Development Authority (NEDA) and the National Water Resources Board.
The Roadmap focuses on three key result areas: (1) institutional strengthening; (2) capacity building; and (3) strategic alliances. The provision of adequate infrastructure ties in with the goals of these three areas. Figure 2 summarizes the key issues, strategies, and priority program proposals addressed by the Roadmap.
Laws governing water service providersThe principal laws that govern the regulation of water service providers include:
• PD 198. The Provincial Water Utilities Act of 1973 authorized the formation of local water districts and chartered the LWUA to facilitate improvement of local water utilities and serve as a specialized lending agency for water utilities.
• RA 7160. The Local Government Code devolved the enforcement of laws on cleanliness and sanitation to local governments and the provision of water supply and sanitation services to local constituents; the Code also vests economic regulation of the local water utility to the local Sanggunian (legislative body).
• EO 123. This EO, Reconstituting National Water Resources Board, formed the NWRB Board, transferring the NWRB to the Offi ce of the President and the tariff approval of water districts from LWUA to NWRB.
• RA 6234. The Charter of the Metropolitan Waterworks and Sewerage System vested jurisdiction, supervision, control and tariff-setting powers over waterworks and sewerage systems in Metro Manila to MWSS.
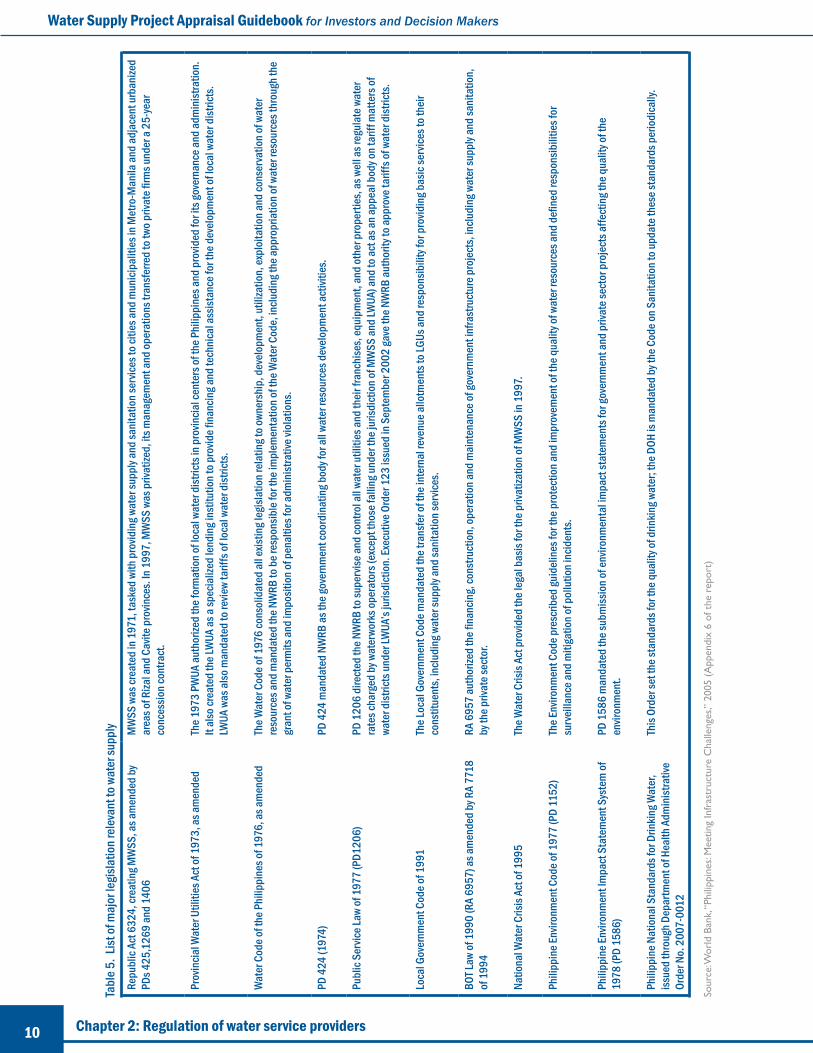
A list of major legislation relevant to water supply is summarized in Table 5.
5 A municipality is considered waterless if 50% or more of its households have no access to potable water.

8 Chapter 2: Regulation of water service providers
Water Supply Project Appraisal Guidebook for Investors and Decision Makers
Figu
re 2
. Cor
rela
tion o
f iss
ues,
stra
tegi
es an
d pr
ogra
ms
Sour
ce:
Phili
ppin
e W
ater
Sup
ply
Sect
or R
oadm
ap, 2
009
9Chapter 2: Regulation of water service providers
Water Supply Project Appraisal Guidebook for Investors and Decision Makers
Regulatory institutionsSeveral government organizations are involved in the regulation of water services, with the National Water Resources Board, the Local Water Utilities Administration and local government units being the principal regulatory agencies.
The NWRB has policy making, regulatory, and quasi-judicial functions. It is responsible for resource regulation—i.e., ensuring optimum development, utilization, conservation, and protection of the country’s water resources consistent with the principles of integrated water resource management. It allocates water resources by issuing water rights and is also responsible for economic regulation, particularly the grant of franchises to private and community-based water service providers, as well as setting tariffs and adjustments for all water service providers, except LGUs and the MWSS.
Despite its broad functions, the NWRB has very limited resources and relies on LWUA to review and approve tariffs of water districts. This allows the NWRB to focus efforts on regulating private and small-scale, community-based service providers as well as some LGU-run systems. To date, it has reviewed and approved tariffs for only a handful of the estimated 6,000 small-scale utilities with franchises. Five LGUs have already opted for consensual regulation by NWRB.
LWUA was originally established to provide oversight, fi nancing and technical assistance to water districts and more recently, RWSAs. As part of its fi nancing function, LWUA reviews and approves tariffs and monitors performance of water districts with outstanding loans. LWUA can exercise step-in rights for non-performing water districts but it usually does so only when water districts default on loans. It can also prescribe interim measures, such as assigning a sixth board member in a water district with outstanding loans. In case of loan default, LWUA can replace a water district’s entire board and take over its management until it recovers and is able to resume payments.
The Local Government Code granted LGUs authority to regulate all economic activities within their constituency, including self-operated water utilities. LGU legislative bodies approve tariffs of water systems operated under the management of the local chief executive.
Aside from NWRB, LWUA and LGUs, other regulatory bodies that enforce pricing and performance agreements include the MWSS Regulatory Offi ce and Subic Water Regulatory Offi ce. Regulations on drinking water quality standards are set and enforced by the Department of Health.
10 Chapter 2: Regulation of water service providers
Water Supply Project Appraisal Guidebook for Investors and Decision Makers
Tabl
e 5. L
ist of
maj
or le
gisla
tion r
elev
ant t
o wat
er su
pply
Repu
blic
Act 6
324,
crea
ting M
WSS
, as a
men
ded
by
PDs 4
25,1
269
and
1406
MW
SS w
as cr
eate
d in
197
1, ta
sked
with
pro
vidin
g wat
er su
pply
and
sani
tatio
n ser
vices
to ci
ties a
nd m
unici
palit
ies i
n Met
ro-M
anila
and
adja
cent
urba
nize
d ar
eas o
f Riza
l and
Cav
ite p
rovin
ces.
In 1
997,
MW
SS w
as p
rivat
ized,
its m
anag
emen
t and
oper
atio
ns tr
ansfe
rred
to tw
o priv
ate fi
rms u
nder
a 25
-year
co
nces
sion c
ontra
ct.
Prov
incia
l Wat
er U
tiliti
es A
ct of
197
3, as
amen
ded
The 1
973
PWUA
auth
orize
d th
e for
mat
ion o
f loc
al w
ater
dist
ricts
in p
rovin
cial c
ente
rs of
the P
hilip
pine
s and
pro
vided
for i
ts go
vern
ance
and
adm
inist
ratio
n.
It al
so cr
eate
d th
e LW
UA as
a sp
ecia
lized
lend
ing i
nstit
utio
n to p
rovid
e fi n
ancin
g and
tech
nica
l ass
istan
ce fo
r the
dev
elop
men
t of l
ocal
wat
er d
istric
ts.
LWUA
was
also
man
date
d to
revie
w ta
riffs
of lo
cal w
ater
dist
ricts
.
Wat
er C
ode o
f the
Phi
lippi
nes o
f 197
6, as
amen
ded
The W
ater
Cod
e of 1
976
cons
olid
ated
all e
xistin
g leg
islat
ion r
elat
ing t
o own
ersh
ip, d
evel
opm
ent,
utili
zatio
n, ex
ploi
tatio
n and
cons
erva
tion o
f wat
er
reso
urce
s and
man
date
d th
e NW
RB to
be r
espo
nsib
le fo
r the
impl
emen
tatio
n of t
he W
ater
Cod
e, in
cludi
ng th
e app
ropr
iatio
n of w
ater
reso
urce
s thr
ough
the
gran
t of w
ater
per
mits
and
impo
sitio
n of p
enal
ties f
or ad
min
istra
tive v
iola
tions
.
PD 4
24 (1
974)
PD 4
24 m
anda
ted
NWRB
as th
e gov
ernm
ent c
oord
inat
ing b
ody f
or al
l wat
er re
sour
ces d
evel
opm
ent a
ctivi
ties.
Publ
ic Se
rvice
Law
of 1
977
(PD1
206)
PD 1
206
dire
cted
the N
WRB
to su
perv
ise an
d co
ntro
l all w
ater
utili
ties a
nd th
eir f
ranc
hise
s, eq
uipm
ent,
and
othe
r pro
perti
es, a
s wel
l as r
egul
ate w
ater
ra
tes c
harg
ed b
y wat
erwo
rks o
pera
tors
(exc
ept t
hose
falli
ng un
der t
he ju
risdi
ctio
n of M
WSS
and
LWUA
) and
to ac
t as a
n app
eal b
ody o
n tar
iff m
atte
rs of
wa
ter d
istric
ts un
der L
WUA
’s ju
risdi
ctio
n. Ex
ecut
ive O
rder
123
issu
ed in
Sep
tem
ber 2
002
gave
the N
WRB
auth
ority
to ap
prov
e tar
iffs o
f wat
er d
istric
ts.
Loca
l Gov
ernm
ent C
ode o
f 199
1Th
e Loc
al G
over
nmen
t Cod
e man
date
d th
e tra
nsfe
r of t
he in
tern
al re
venu
e allo
tmen
ts to
LGUs
and
resp
onsib
ility
for p
rovid
ing b
asic
serv
ices t
o the
ir co
nstit
uent
s, in
cludi
ng w
ater
supp
ly an
d sa
nita
tion s
ervic
es.
BOT L
aw of
199
0 (R
A 69
57) a
s am
ende
d by
RA
7718
of
199
4RA
695
7 au
thor
ized
the fi
nan
cing,
cons
truct
ion,
oper
atio
n and
mai
nten
ance
of go
vern
men
t inf
rast
ruct
ure p
roje
cts,
inclu
ding
wat
er su
pply
and
sani
tatio
n,
by th
e priv
ate s
ecto
r.
Natio
nal W
ater
Cris
is Ac
t of 1
995
The W
ater
Cris
is Ac
t pro
vided
the l
egal
bas
is fo
r the
priv
atiza
tion o
f MW
SS in
199
7.
Phili
ppin
e Env
ironm
ent C
ode o
f 197
7 (P
D 11
52)
The E
nviro
nmen
t Cod
e pre
scrib
ed gu
idel
ines
for t
he p
rote
ctio
n and
impr
ovem
ent o
f the
qua
lity o
f wat
er re
sour
ces a
nd d
efi n
ed re
spon
sibili
ties f
or
surv
eilla
nce a
nd m
itiga
tion o
f pol
lutio
n inc
iden
ts.
Phili
ppin
e Env
ironm
ent I
mpa
ct S
tate
men
t Sys
tem
of
1978
(PD
1586
) PD
158
6 m
anda
ted
the s
ubm
issio
n of e
nviro
nmen
tal im
pact
stat
emen
ts fo
r gov
ernm
ent a
nd p
rivat
e sec
tor p
roje
cts a
ffect
ing t
he q
ualit
y of t
he
envir
onm
ent.
Phili
ppin
e Nat
iona
l Sta
ndar
ds fo
r Drin
king W
ater
, iss
ued
thro
ugh D
epar
tmen
t of H
ealth
Adm
inist
rativ
e Or
der N
o. 2
007-
0012
This
Orde
r set
the s
tand
ards
for t
he q
ualit
y of d
rinkin
g wat
er; t
he D
OH is
man
date
d by
the C
ode o
n San
itatio
n to u
pdat
e the
se st
anda
rds p
erio
dica
lly.
Sour
ce: W
orld
Ban
k, “P
hilip
pine
s: M
eetin
g In
fras
truc
ture
Cha
lleng
es,”
2005
(A
ppen
dix
6 of
the
rep
ort)

11Chapter 2: Regulation of water service providers
Water Supply Project Appraisal Guidebook for Investors and Decision Makers
Water rights and regulationRiparian water rights belong to those who possess land near a water source. Landowners whose properties are adjacent to a body of water have the right to make reasonable use of it. Allocations are made proportionate to the applicant’s frontage on the water source, if there is not enough water to satisfy all users. These rights cannot be sold or transferred and water cannot be transferred out of the watershed.
Water rights give the right to extract and use water from a water source, e.g., river, stream, lake or groundwater. With increasing water scarcity, water rights are becoming more important for farmers, industrial developers and municipal governments.
The Water Code of the Philippines provides the policy framework for allocating rights among competing uses of water. Water may be appropriated for the following purposes (in order of descending priority): domestic, municipal uses; for irrigation, power generation, fi sheries, livestock rearing; and for industrial, recreational and other purposes.
The following excerpts relate to the provision of water allocations:
Article 22 specifi es that between two or more appropriators of water from the same source of supply, the time of issuance of the water right shall defi ne priority, except in times of emergency when the use of water for domestic and municipal purposes shall have a better right over all other uses. Provided that where water shortage is recurrent and the appropriator for municipal use has a lower priority in time of appropriation, then it shall be his duty to fi nd an alternative source of supply in accordance with conditions prescribed by the NWRB.
Article 30 indicates that all water permits are subject to modifi cation or cancellation by the NWRB, after due notice and hearing, in favor of a project of greater benefi cial use for multipurpose development, and a water permitee who suffers shall be duly compensated by the entity or person in whose favor the cancellation was made.
Water utilities are required to get water permits before they can develop bulk sources from either ground or surface waters.
Economic regulationThe power to regulate water service providers includes authority to grant a franchise to operate and to review and approve tariffs. The extent of regulation depends on the type of water provider and the scope of the regulator’s authority. As depicted by Figure 3, private concessionaires are more strictly regulated—scope and standards of service, penalties and incentives are outlined in their contracts. Regulation over water districts, LGU and barangay-operated systems focuses on water quality and pricing; no performance standards or targets are enforced. Independent private operators and small-scale service providers experience the least amount of regulation.
Different methodologies and procedures are used for setting and approving tariffs: NWRB uses a return on rate base approach, LWUA uses a cash-fl ow approach, and LGUs do not have a standard basis. NWRB and LWUA both use cost-based pricing principles and standardized tariff setting methodologies and procedures. LGUs, on the other hand, can formulate their own pricing principles and guidelines.
Figure 3: Degrees of regulation of water service providers
Type of operatorDegree of regulation
Water quality Price Performance standardsConcessionaires (including MWSS and Subic concessions)
Water districts
LGU-operated systems
CBOs (including RWSAs and BWSAs)
Private operators
Small-scale water service providers Nil

12 Chapter 2: Regulation of water service providers
Water Supply Project Appraisal Guidebook for Investors and Decision Makers
Boxes 1 and 2 discuss the tariff setting and adjustment guidelines of LWUA and NWRB, respectively.
Box 1. Tariff setting guidelines of LWUA for water districts
Under Presidential Decree 198 and Letter of Instruction 700, LWUA is mandated to review and approve the water tariffs charged by both Water Districts and Rural Water Supply Associations.6 While EO 123 transferred this function to the NWRB on September 12, 2002, LWUA continues to review and approve tariffs of WDs and RWSAs, based on an agreement between LWUA and the NWRB.
LWUA often provides fi rst-time borrowers with a checklist of requirements to allow the utility to undertake reforms/adjustments prior to LWUA conducting its rate evaluation. LWUA uses data provided by the water service provider and its in-house information to analyze the WSP’s performance and rate structure. If requested by the WSP, LWUA may present and discuss its fi ndings to the WSP’s Board of Directors and Management. The WSP may adopt, modify, revise, or enhance the result of the Tariff Review by LWUA and fi nally fi le with the LWUA its proposed water tariff structure.
Utilities set tariffs to sustain the cost of operations and repay capital infrastructure costs. Utilities may also be required to adjust tariffs to ensure the repayment of a specifi c loan or as part of a restructuring process. Increases in water tariff rates usually follow a rate review by the WSP and LWUA as part of a loan covenant/restructuring agreement.
Role of the water district and LWUA in tariff settingTo substantiate the need for an adjustment in water tariffs, the WD must comply with the following requirements:
A. Tariff review1. Present a Board resolution requesting an evaluation of water tariffs and the WD’s fi nancial
statements and operating highlights for at least the two operating years preceding the request.
2. Five-year cash fl ow projections that show the level of service, committed service effi ciency, and all fi nancial requirements of the WD. Projected cash fl ow must demonstrate the adequacy of the proposed water tariff and the ability of the utility to enforce this rate based on the policies and applicable guidelines adopted by LWUA. The projections should refl ect estimated:i. Growth in number of households served, gross revenueii. O&M expense (wages and salaries, power and chemicals, etc.)iii. Programs to reduce NRW (maximum of 25%), increase revenue, and improve collection
effi ciency (minimum of 90%)iv. Capital investment to support above proposed growth and effi ciency improvement programsv. Reserve requirement
3. Where the proposed rate increase includes provision for loan restructuring or other forms of debt relief, the WD must also submit a report that details the events and circumstances leading to the default and the corrective measures (programs and supporting capital investments) to be undertaken to achieve full cost recovery. Financial data that show the results of events or how present operations depart from previous projections shall also be submitted.
6 RWSAs were created by virtue of Executive Order 577. RWSAs are non-stock, non-profi t cooperative associations organized and registered with the LWUA.

13Chapter 2: Regulation of water service providers
Water Supply Project Appraisal Guidebook for Investors and Decision Makers
B. Conduct of a public hearing4. To comply with PD 198 and Sec. 5 of Letter of Intent (LOI) 700, LWUA shall conduct a public
hearing on the proposed water tariff adjustment. The proposed water tariff increase should be presented in each of the municipalities covered by the WD. The WD may also opt to present the proposed tariff increase/s at the barangay level.
5. Preparatory activities leading to the public hearing are primarily the WD’s responsibility but they should be coordinated with LWUA for consultation or guidance. Section 3 of LOI 744 directs LWUA and the WDs to prepare a comprehensive program for public consultation. This can include individual notices incorporated with the water bill, media broadcast and/or postings of notices in conspicuous public locations. All printed materials, pictures of postings made, and receipts of payment for broadcast form part of the documentary evidence for a public hearing. Public hearing notices are to be posted at least seven (7) days prior to the hearing for WDs that serve only one municipality/city, and at least fi fteen (15) days for WDs serving two or more municipalities/cities.
6. LWUA and the WD share responsibility for the conduct of the formal public hearing process. A LWUA hearing offi cer will conduct the public hearing and shall preside over the deliberations of the pros and cons of the proposed WD/WSP tariff increase. The WD’s board of directors also usually attend to answer questions during the public hearing. The LWUA hearing offi cer’s report forms part of the rate approval documents.
C. Post-public hearing7. Once confi rmed by LWUA, tariff adjustments are executory and enforceable seven (7) days from
posting for WDs serving only one municipality, and at least 15 days of advanced notice for WDs that serve multiple municipalities, without prejudice to an appeal undertaken by a water concessionaire to the National Water Resources Board whose decision is appealable to the Offi ce of the President. An appeal to the NWRB must be perfected within 30 days after the expiration of the seven-day period of posting.
Limits on rate increasesRequests for water rate increases submitted to LWUA are subject to two principal limitations. The fi rst is affordability, limiting water rates (lifeline rate for the initial 10 cubic meters) to no more than fi ve percent of the average income of low-income households. The second is the LOI 700 stipulation that limits increases to no more than 60 percent of existing LWUA-approved water rates.
Tariff formula and design used by LWUALWUA uses the principle of full cost recovery in computing water tariffs to allow the WD to recover all costs involved in producing, transmitting and distributing water. As such, water tariffs are designed to generate suffi cient revenue to: (1) support the operating expenses of the WD; (2) provide for the maintenance, repair and improvement of the existing system; (3) pay for debt service on capital loans; (4) establish reserves of between 3 to 10 percent of gross revenues; and (5) provide for project equity or capital expenditures as supported by a feasibility study or comprehensive work program. In its review of proposed tariff increases, LWUA reviews all relevant costs to ensure sustainability of the WD as well as its compliance with the following conditions:

14 Chapter 2: Regulation of water service providers
Water Supply Project Appraisal Guidebook for Investors and Decision Makers
• Achieving specifi c operational effi ciency standards including: at least 90 percent collection effi ciency, 25 percent or less non-revenue water, and a staffi ng ratio of one employee per 125 connections.
• Salaries, allowances and other benefi ts are within the levels and guidelines prescribed by DBM and the Civil Service Commission.
• Capital investments to reduce unaccounted water, expand service coverage or improve other aspects of utility operations are supported by a work program or feasibility study.
• Reserves are accounted for and properly monitored in a joint LWUA-WD savings account.
Most WDs use an increasing block tariff. The fi rst block is the minimum tariff charged to all customers, typically covering the consumption of one to ten cubic meters, but can vary according to customer classifi cation and meter size.
The minimum charge is determined and differentiated using the meter service ratios shown in the Table 6 below. This table provides the multiplier that, when applied to the cost per cubic meter, forms the actual rate paid by the customer. This approach follows the principle that a higher the meter reading means the customer was afforded more convenience, and therefore may be charged a higher rate for water service.
Table 6. Meter service ratioCustomer type Size of meter (in inches)
0.5 0.75 1.0 1.5 2.0 3.0 >3.0Residential/government 1.0 1.6 3.2 8.0 20.0 36.0 72.0Commercial A 2 times the tariff of residential based on meter sizeCommercial B 1.75 times the tariff of residential users based on meter sizeCommercial C 1.5 times the tariff of residential users based on meter sizeCommercial D 1.25 times the tariff of residential users based on meter sizeBulk 3 times the tariff of residential users based on meter size
Water tariffs are usually divided into four tariff blocks in 10 cubic meter increments. Incremental factors are applied between blocks depending on what the WD board wants to achieve. For example, the utility may sharply increase tariffs for consumption in excess of 20 cubic meters to encourage water conservation, or conversely may offer lower rates to encourage commercial concessionaires to connect or to market excess capacity.
Source: Local Water Utilities Administration

15Chapter 2: Regulation of water service providers
Water Supply Project Appraisal Guidebook for Investors and Decision Makers
Box 2. NWRB Tariff setting guidelines
The powers and functions of NWRB as an economic regulator can be traced back to the Public Service Commission created under Commonwealth Act 146 and Presidential Decree 1206. PD 1206 gave then National Water Resources Council (later renamed NWR Board through EO 124) the following regulatory functions: i) to adjudicate and grant CPC, CPCN to operators of waterworks utility system and services; ii) to impose penalties for administrative violations and promulgate rules and regulations relative thereto; iii) to supervise and control waterworks utilities and their franchises and other properties, regulate and fi x water rates to be charged by waterworks operators, except those under the jurisdiction of the MWSS and LWUA and water districts; iv) to exercise original jurisdiction over all disputes relating to water rates of utilities and decide on appeal on water rates involving water districts; v) to impose and collect Annual Supervision regulation fees or charges from water works systems, and public utility operators pursuant to Commonwealth Act 146. NWRB’s regulation of private utilities covers subdivisions, private water operators, resettlement areas, economic zones, rural water and sanitation associations, locators, small scale service providers and condominiums in 78 provinces and 115 cities nationwide.
Tariff setting principlesTariffs are based on levels of service established in consultation with customers and/or their representative bodies. The proposed tariff should be suffi cient to provide the agreed levels of service, such as number of hours of service, water quality, non-revenue water percentage, service coverage, and water pressure. The fi rst page of the tariff proposal should set these goals. Other parameters for rate-setting are: i) use of a 5-year tariff period based on the utility’s business plan; ii) use of key performance indicators as benchmarks, to provide basis of projections; iii) use of Excel-based tariff model; iv) calculation of an average ROI to reduce price shocks within the fi ve-year period; and v) at the end of the fi ve-year period, a mechanism for calculation of disallowances or adjustments for excess/defi ciencies in meeting the 12 percent ROI, to be applied to succeeding tariff proposals.
Water rates must be adequate to provide for:• operating expenses excluding those related to non-regulated activities and non-recurring expenses
such as losses from force majeure;• depreciation of property in service entitled to return; and• surplus equivalent to 12 percent of net book value of property in service entitled to return
including two months working capital.
Legal requisitesThere must be an application for CPC including a tariff proposal submitted under oath by the applicant utility before the water rates are approved. Proposed water rates and the scheduled hearing dates must be published in a newspaper of general circulation in the utility’s province at least 15 days before the hearing date. Approved tariff rates must be posted within 7 days from approval in conspicuous places within the service area of the water utility.
Computing proposed water ratesThe water rate structure comprises two parts: the minimum and the commodity charge. The minimum charge is also known as service or demand charge. It should be able to cover all the fi xed costs required to carry on the vital water supply functions not directly related with production and distribution. It ensures that there will be enough revenues to meet the utility’s basic costs during periods of low water sales, such as when there is drought. The minimum charge should be within the ability of low income users to pay for 10 cubic meters of water, and should not exceed 5 percent of the family income of the low income group in the municipality where the water utility operates.
16 Chapter 2: Regulation of water service providers
Water Supply Project Appraisal Guidebook for Investors and Decision Makers
The commodity charge is for consumption beyond the minimum charge. This amount varies according to volume consumption and customer category. The quantity block method is used to convert the determined revenue requirements into the tariff structure to be implemented. This supports NWRB’s policy of promoting conservation of water by pricing higher consumption prohibitively. The water rate of commercial/industrial consumers is twice the rate of residential consumers.
Source: NWRB Primer on Tariff Setting and Regulation, March 2005
Recognizing that regulation is an important tool for compelling utilities to provide better service and be more effi cient, efforts to improve the regulatory framework and its enforcement are ongoing. NWRB will establish light-handed regulation guidelines for small-scale private providers, focusing on a registration system, issuance of performance standards to guide their operations, and benchmarking. Over the long term the plan is to establish an independent national economic regulator. This requires legislation and thus expected to be a protracted measure.
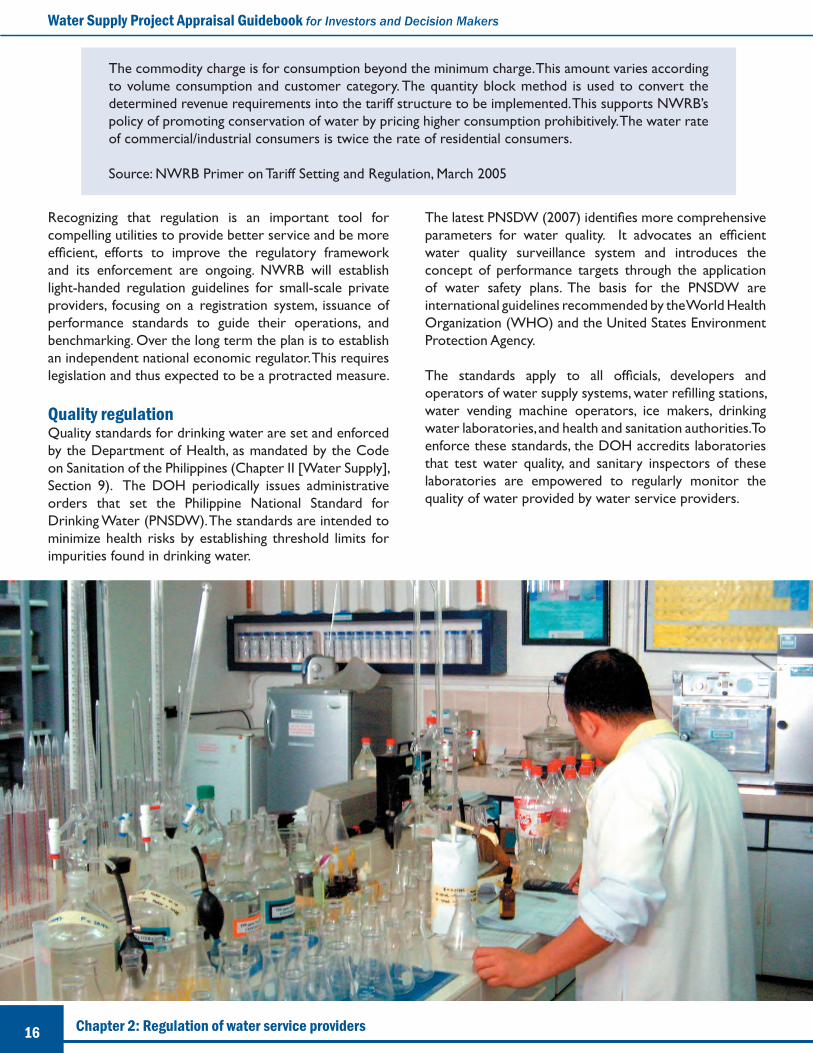
Quality regulationQuality standards for drinking water are set and enforced by the Department of Health, as mandated by the Code on Sanitation of the Philippines (Chapter II [Water Supply], Section 9). The DOH periodically issues administrative orders that set the Philippine National Standard for Drinking Water (PNSDW). The standards are intended to minimize health risks by establishing threshold limits for impurities found in drinking water.
The latest PNSDW (2007) identifi es more comprehensive parameters for water quality. It advocates an effi cient water quality surveillance system and introduces the concept of performance targets through the application of water safety plans. The basis for the PNSDW are international guidelines recommended by the World Health Organization (WHO) and the United States Environment Protection Agency.
The standards apply to all offi cials, developers and operators of water supply systems, water refi lling stations, water vending machine operators, ice makers, drinking water laboratories, and health and sanitation authorities. To enforce these standards, the DOH accredits laboratories that test water quality, and sanitary inspectors of these laboratories are empowered to regularly monitor the quality of water provided by water service providers.

17Chapter 3: Water services fi nancing
Water Supply Project Appraisal Guidebook for Investors and Decision Makers
Chapter 3. Water services fi nancing
The credit market system where private funds are gathered, pooled, and lent on a voluntary basis by fi nancial intermediaries for water supply projects is still underdeveloped. With the exception of some recent loan approvals,7 most fi nancing of municipal water projects still rely on offi cial development assistance (ODA) loans and grants. That there is very little private capital mobilized for water supply investments indicates a need for better strategies and initiatives by the national government for expanding the involvement of private fi nancing in the sector.
Municipal water fi nance: An ODA-centric structure Figure 4 depicts current fl ow of fi nancing into the water sector. The main source of funding has been offi cial development assistance from various multilateral and bilateral sources. ODA loans are covered by a sovereign guaranty and are typically accompanied by a foreign exchange cover (green line) which transfers the currency risk from the GFI/borrower on record to the national government8. These ODA funds are then made accessible to water districts and local government units. ODA loans have repayment periods of as long as 20 years, which are not available from local commercial fi nancing sources.
Figure 4. Financial fl ows to the water supply sector
7This is the case of Manila Water and Maynilad, the two private concessionaires serving the water supply needs of Metro Manila and surrounding areas. Maynilad recently signed a 10-year corporate notes issue worth $365 million with lead underwriters BDO Capital & Investment Corp. and Development Bank of the Philippines to fund its program to rehabilitate the pipe network and reduce system losses. Manila Water, meanwhile, issued a P3 billion fi xed-rate bond last October 2008.
Another important development is the recent entry of private banks willing to provide loans backed by an LGUGC guarantee. Since December 2006, eight water district projects worth P971 million have been approved for fi nancing by four large private commercial banks. Note that LGUGC is partly owned by the Development Bank of the Philippines.
8LWUA has substantial ODA loans that do not have foreign exchange cover. Sovereign guaranty fee and foreign exchange cover fees are eventually passed on to the ultimate user of the funds.
Source: PWRFSP

18 Chapter 3: Water services fi nancing
Water Supply Project Appraisal Guidebook for Investors and Decision Makers
The main policy question that has emerged is how best to allocate these ODA funds and subsidies so that these are used to support the achievement of national water and sanitation priorities and objectives. Executive Order 279 (“Instituting Reforms in the Financing Policies for the Water Supply and Sewerage Sector and Water Service Providers and Providing for the Rationalization of LWUA’s Organizational Structure and Operations in Support Thereof”) requires LWUA to classify water districts into different classes based on their creditworthiness, with “creditworthy” WSPs sourcing their fi nancing requirements from commercial sources. Table 7 below outlines the system envisioned in EO 279.
Though EO 279 represents a signifi cant policy direction toward mobilizing private sector resources, it has two fundamental weaknesses:
Table 7. EO 279 Creditworthiness classifi cations and funding sourceCredit classifi cation Recommended fi nancing sourceCreditworthy • WSPs shall be eligible to source fi nancing at commercial lending rates from GFIs and PFIs.
• LWUA shall enhance and streamline its waiver procedures to effect the reform objectives/policies enunciated in EO279.• GFIs shall strengthen their skills base and develop lending programs specially tailored to the needs of the water supply and
sewerage sector.
Semi-creditworthy • WDs shall be eligible to source concessional debt fi nancing from LWUA as well as GFIs and PFIs when possible
Pre-creditworthy • WDs shall be eligible to source grants from donors and deep concessional fi nancing from the LWUA
Non-creditworthy • WDs shall continue to be eligible for fi nancing under the LWUA. However, LGUs are hereby encouraged to provide fi nancial and operational support for such WDs and other WSPs within their respective jurisdictions.
9 In addition to the LWUA rating system for WDs, USAID through the Philippine Water Revolving Fund Support Program recently assisted the LGUGC to develop a market-based methodology for rating the creditworthiness of WDs. This system was developed by CRISIL, a Standard and Poor’s subsidiary based in India. LGUGC now uses this system as part of its due-diligence on utilities applying for guarantees.
Given the weaknesses inherent in LWUA’s credit rating system, LGUGC formulated a more market-based rating system with the assistance of CRISIL (a Standard and Poor’s affi liate). This system assesses the following types of risks: regulatory, economic, fi nancial, operating and management; and assigns a rating from AAA to D as shown in Table 8. A more comprehensive description of this system can be found in Appendix 2C.
• The credit rating of a particular WD is not set by the market but by LWUA based on a rating system9 approved by the EO 279 Oversight Committee. This poses a signifi cant confl ict of interest since LWUA is also the principal lending institution to the WDs and can use its rating system to maintain dominance in the market.
• The system has an inherent moral hazard as it effectively encourages utilities to avoid becoming credit worthy and thus able to continue accessing concessional or grant fi nancing.
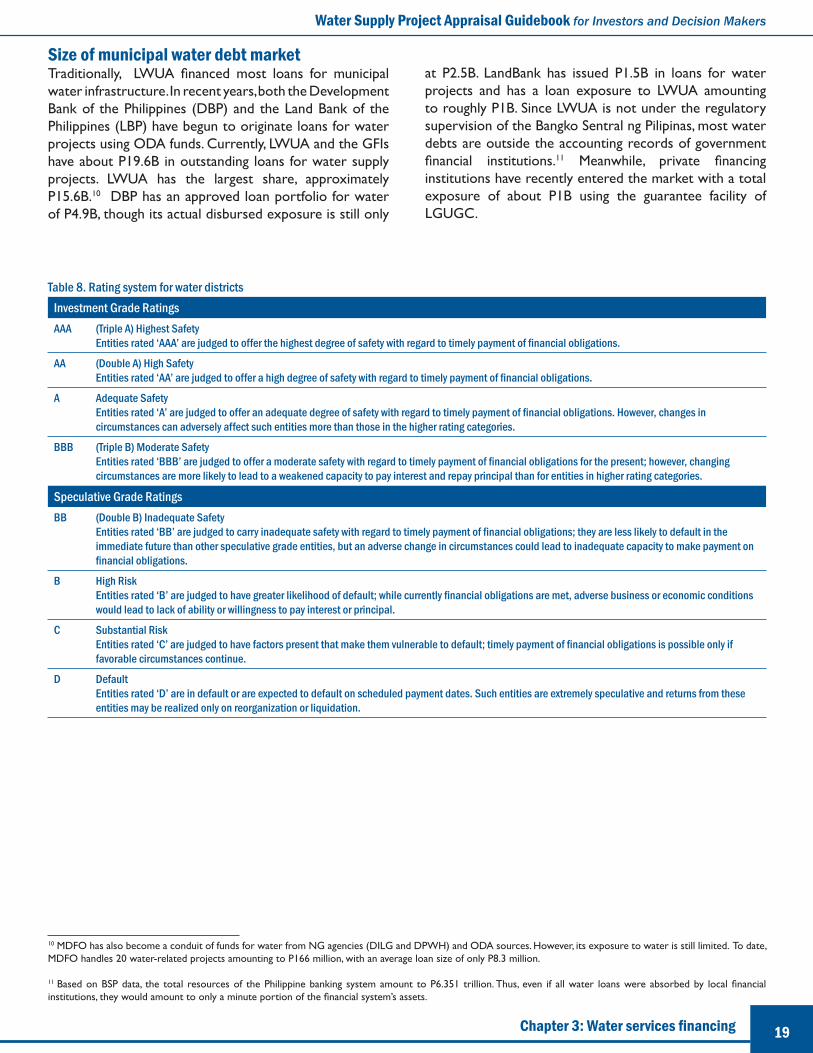
19Chapter 3: Water services fi nancing
Water Supply Project Appraisal Guidebook for Investors and Decision Makers
Table 8. Rating system for water districts Investment Grade RatingsAAA (Triple A) Highest Safety
Entities rated ‘AAA’ are judged to offer the highest degree of safety with regard to timely payment of fi nancial obligations.
AA (Double A) High SafetyEntities rated ‘AA’ are judged to offer a high degree of safety with regard to timely payment of fi nancial obligations.
A Adequate SafetyEntities rated ‘A’ are judged to offer an adequate degree of safety with regard to timely payment of fi nancial obligations. However, changes in circumstances can adversely affect such entities more than those in the higher rating categories.
BBB (Triple B) Moderate SafetyEntities rated ‘BBB’ are judged to offer a moderate safety with regard to timely payment of fi nancial obligations for the present; however, changing circumstances are more likely to lead to a weakened capacity to pay interest and repay principal than for entities in higher rating categories.
Speculative Grade RatingsBB (Double B) Inadequate Safety
Entities rated ‘BB’ are judged to carry inadequate safety with regard to timely payment of fi nancial obligations; they are less likely to default in the immediate future than other speculative grade entities, but an adverse change in circumstances could lead to inadequate capacity to make payment on fi nancial obligations.
B High RiskEntities rated ‘B’ are judged to have greater likelihood of default; while currently fi nancial obligations are met, adverse business or economic conditions would lead to lack of ability or willingness to pay interest or principal.
C Substantial RiskEntities rated ‘C’ are judged to have factors present that make them vulnerable to default; timely payment of fi nancial obligations is possible only if favorable circumstances continue.
D DefaultEntities rated ‘D’ are in default or are expected to default on scheduled payment dates. Such entities are extremely speculative and returns from these entities may be realized only on reorganization or liquidation.
10 MDFO has also become a conduit of funds for water from NG agencies (DILG and DPWH) and ODA sources. However, its exposure to water is still limited. To date, MDFO handles 20 water-related projects amounting to P166 million, with an average loan size of only P8.3 million.
11 Based on BSP data, the total resources of the Philippine banking system amount to P6.351 trillion. Thus, even if all water loans were absorbed by local fi nancial institutions, they would amount to only a minute portion of the fi nancial system’s assets.
Size of municipal water debt market Traditionally, LWUA fi nanced most loans for municipal water infrastructure. In recent years, both the Development Bank of the Philippines (DBP) and the Land Bank of the Philippines (LBP) have begun to originate loans for water projects using ODA funds. Currently, LWUA and the GFIs have about P19.6B in outstanding loans for water supply projects. LWUA has the largest share, approximately P15.6B.10 DBP has an approved loan portfolio for water of P4.9B, though its actual disbursed exposure is still only
at P2.5B. LandBank has issued P1.5B in loans for water projects and has a loan exposure to LWUA amounting to roughly P1B. Since LWUA is not under the regulatory supervision of the Bangko Sentral ng Pilipinas, most water debts are outside the accounting records of government fi nancial institutions.11 Meanwhile, private fi nancing institutions have recently entered the market with a total exposure of about P1B using the guarantee facility of LGUGC.

20 Chapter 3: Water services fi nancing
Water Supply Project Appraisal Guidebook for Investors and Decision Makers
Table 9. Estimates of investment demand for water supply infrastructureInstitution Estimated
investment required
(P billion)
Method of estimation
World Bank (2005)13 23.60 This estimate is based on the calculation as to how much funding is required to meet the Millennium Development Goal target of 90 percent formal access to water supply from 2004-2009. It used simplistic assumptions such as P3,000 cost per capita to deliver level 3 water supply systems.
JBIC (2006)14 9.25 This estimate is based on an actual survey of 93 “creditworthy” water districts and 33 LGUs rated A or B by LGUGC. Respondents were asked what projects they are planning for which they intend to secure loans between 2006 and 2016. Only 48 WDs and LGUs responded.
PWRF (2004) 145.00 This estimate is based on providing water supply and basic sanitation over the 2005-2015 investment period to half of the population who live in urban areas outside of Metro-Manila without access to piped water.
12 Because of LWUA’s limited capital, its expenditures for water district projects have been limited to around P1.352B since 2001. An example of the huge fi nancing requirement of the sector is the Davao City Water District, the country’s largest WD, which has a funding need of around P721M in the near term and P4.653B in the medium term. 13 World Bank: “Philippines: Meeting Infrastructure Challenges.”14 JBIC, Report on the Special Assistance for Projects Formation for the PWRF.
Key considerations for participation in water projectsFinancing institutions should take into account the following key points as they consider lending to WSPs;
Regulatory considerations• Cost recovery and tariffs. National government
policy requires tariffs be set on a cost recovery basis, but different agencies use different methods for determining tariff rates. LWUA employs a cash fl ow methodology; NWRB sets rates using a Return on Rate Base of 12 percent; MWSS uses an Automatic Discount Rate through its contracts with its two concessionaires; and the Subic Bay Metropolitan Authority uses a Return on Equity method. LGUs follow no standard methodology when setting rates. Despite these many systematic approaches, political pressure still limits tariff increases—sometimes at the expense of a water utility’s viability.
Estimating potential fi nancial demandTwo important points must be considered when estimating the water sector’s funding needs. First, there exists no comprehensive market survey of the funding needs of WSPs in the Philippines. LWUA does not conduct any regular survey of funding requirements of the water districts. The closest estimate of actual market demand for funding can be gleaned from a Japan Bank for International Cooperation (JBIC) conducted survey with 48 WD/LGU respondents in 2006. The 48 respondents have a total requirement of P9.25B between 2006 and 2011 (see Table 9). The World Bank estimated that P23.6B in new investments in infrastructure are needed to achieve the Millennium Development Goals. Though it uses simple assumptions, this fi gure does provide a general parameter of what could be required if the national government and utilities were to make a concerted effort to meet these goals. Second, WDs could take on signifi cantly more debt if required to expand their systems to service all customers within their franchise areas. For example, LWUA estimated that 280 WDs could incur an additional P83.6B debt and still have a debt-service cover ratio of 1.2. This amount dwarfs LWUA’s current capitalization of P4.4B.12 The principal challenge, however, is translating potential demand into actual projects.

21Chapter 3: Water services fi nancing
Water Supply Project Appraisal Guidebook for Investors and Decision Makers
• Ownership of water districts. While LGUs can form water districts and the respective mayors can appoint the members of the WD’s board of directors, ownership of the WD is unclear. Coupled with weak enforcement of performance standards, this has resulted in poor performance exhibited by many water districts, especially in terms of expanding systems to meet growing demand.
• Non-exclusive franchises of water service providers. In 2002, a Supreme Court decision (Box 3) declared the unconstitutionality of exclusive franchises for water districts. This decision opened the door to private sector involvement in the sector, and has raised concern among some water districts facing competition for delivering water in unserved areas within their service franchise.
Water district considerations• Requirement for LWUA waiver. WDs that have
existing loans from LWUA must secure a waiver from LWUA before they can enter into any new loan agreement with a private or government bank, to ensure that all creditors are pari passu or on equal basis in terms of priority of repayments.
• LWUA’s right to review tariffs. After undergoing public hearings, any proposed tariff changes by WDs shall be subject to a review by LWUA to ensure that these comply with conditions set by PD 198. Thus, any tariff increase required to service a new loan would automatically be subject to LWUA’s approval.
Box 3. Metropolitan Cebu Water District vs. Margarita Adala
On October 24, 2002 Margarita A. Adala fi led an application with the NWRB for the issuance of a Certifi cate of Public Convenience to operate and maintain a waterworks system within sitios San Vicente, Fatima, and Sambag located in Bulacao, Pardo, Cebu City. The Metro Cebu Water District (MCWD) opposed the application on ground that the area to be served by Margarita A. Adala was within the MCWD’s franchise area pursuant to PD 198 (as amended). On July 2, 2003 the NWRB granted Adala’s application. MCWD appealed the case to the Regional Tribunal Court of Cebu which affi rmed NWRB’s decision. MCWD fi led a petition for review on certiorari with the Supreme Court.
The Supreme Court ruled that “Section 47 of PD 198 which vests an ‘exclusive franchise’ upon public utilities is clearly repugnant to Article XIV, Section 5 of the 1973 Constitution. It is unconstitutional and may not therefore, be relied upon by petitioner in support of its opposition against respondent’s application for Certifi cate of Public Convenience (CPC) and the subsequent grant thereof by the NWRB.”
This ruling covers all water utilities since exclusivity of franchise is prohibited by the constitution. Thus, no public utility can have an exclusive franchise.
• LWUA’s “step-in” rights. LWUA possesses “step-in” rights under its charter that enable it to take over either the management, the board or both of a WD if it believes its loans are threatened by the utility’s poor performance. An institutional arrangement with LWUA can be undertaken to simplify the procedure for working out any fi nancial or operational restructuring or rehabilitation of WDs for and on behalf of the GFIs/PFIs.
• LWUA’s imposition of pre-termination fees. LWUA charges pre-termination fees when existing loans are refi nanced by GFIs or PFIs. Recently, LWUA has slowed approval of PFI/GFI refi nancing schemes.
• GOCC requirements. Since WDs are classifi ed as GOCCs, they must comply with various rules and regulations: Commission on Audit rules require WDs to use GFIs as depository banks; guidelines mandated by RA 9184 require WDs to follow national government procedures for procurement of goods and services and in infrastructure projects; WDs are governed by the Department of Budget and Management’s limits on compensation of offi cers and directors based on size classifi cation.
Local government considerations• Deposit taking. LGUs can use PFIs as depository
banks only with the prior approval from the Bangko Sentral ng Pilipinas (BSP). BSP approval applies only to the specifi c branch, not the bank’s entire branch network.

22 Chapter 3: Water services fi nancing
Water Supply Project Appraisal Guidebook for Investors and Decision Makers
• Borrowing capacity limits. LGUs can borrow money or mobilize capital using bonds provided their total debt service obligations do not exceed 20 percent of their regular gross income.
• Procurement requirements. The rules and regulations mandated by RA 9184 also govern LGUs and their procurement of infrastructure, goods and services.
Technical appraisal of water projectsThe appraisal of water projects represents a major challenge to creditors who are unfamiliar with the sector, especially its technical aspects (e.g., system design, hydrology risks, etc.). Maximizing LWUA’s technical expertise and experience, DBP has an agreement with LWUA for the latter to review feasibility studies of water investment projects on a fee-for-service basis. A similar arrangement may also be benefi cial to PFIs. LGUGC uses experts on a per project basis whose fees may or may not be charged to the borrower, depending on the size of the loan to be guaranteed and LGUGC’s potential fees from the transaction. The expert’s output is shared in full by LGUGC with the PFI that will fund the transaction.

23Chapter 1: An overview of the Philippine water supply sector
Water Supply Project Appraisal Guidebook for Investors and Decision Makers
II. DEVELOPING PROJECTS AND ASSESSING FEASIBILITY

24 Chapter 4: Project and feasibility study preparation
Water Supply Project Appraisal Guidebook for Investors and Decision Makers
Chapter 4. Project and feasibility study preparation
Project development cycle*
Project preparationFinancial institutions can use this information to understand the key elements to consider when carrying out rapid assessments of proposed water projects.
Needs/problem analysis and project identifi cationIn developing a project, a utility will typically begin with a needs analysis (Box 4) and problem identifi cation process. This also involves identifying possible solutions. Project identifi cation can be done to address supply-demand gaps, expand systems, reduce non-revenue water (NRW), improve service quality, and/or improve WSP operating and fi nancial performance. Though usually initiated by the WSP, projects may also be requested by client LGUs, customers or required by laws and regulations.15
Constraints can take the form of inadequate infrastructure, low effi ciency, high water losses, water shortages, and lack of cash fl ow or capital. Once WSP planners and their consultants have identifi ed problem areas, possible interventions should be developed. Note that various groups may identify different problems or defi ne them differently, depending on their perspectives and priorities.
Box 4. Needs/problem analysis
Possible solutions for providing piped water services to a community 10 kilometers from the nearest WSP water lines could be:
i) Contracting with a small scale water provider; ii) Setting up a local system managed by a
community based organization or a cooperative assisted by an NGO;
iii) Constructing a mini-distribution system managed by the WSP; and/or
iv) The LGU funding and putting up its own system.
* Source: NEDA, Reference Manual on Project Development and Evaluation
15 Such as the Clean Water Act or country development plans.
The bank must ensure the project has good potential for success based on documents submitted by the WSP. First, the bank must ensure the proposed project is included in the WSP’s business plan or its capital expenditure budget, and that the submitted documents have been approved by the WSP’s oversight organization (i.e., the WD’s board). The following are examples of the types of projects proposed by WSPs:

25Chapter 4: Project and feasibility study preparation
Water Supply Project Appraisal Guidebook for Investors and Decision Makers
• Comprehensive development. This refers to water infrastructure projects designed to improve coverage. It commonly involves additional source facilities and infrastructure to individual household connections encompassing more than one barangay. A comparison between the actual coverage (population served) and the franchise population (total population) can help determine the need for the project. However, the method used for deriving population fi gures should be verifi ed for reasonableness and consistency.
• Facility improvement. These projects strengthen, augment, or replace components of the supply chain (source-treatment-transmission-distribution-connections). For augmentation of supply sources, ensure that the percentage of non-revenue water is reasonable. Reducing NRW could be an alternative to expand water supplies. Check for water rights applications and approval. Surface water sources will require treatment facilities. Distribution reservoirs are needed in the demand center and reservoir capacity, as a rule of thumb, should be about 15–20 percent of maximum daytime demand. 16
• Expansion to a specifi c area. This is similar to a comprehensive development project on a smaller scale, covering a single barangay or community. If the survey results of the proposed area are not available, a site visit or interview with community leaders—regarding current sources of water and how much people pay for water—can easily determine if there is a need for the project.
• Asset management. This type of project focuses on asset replacement to maintain asset serviceability and/or longevity. Most of these projects involve replacements in the distribution system (pipelines, reservoirs, hydrants, house connections, zones, and house meters). Checking on the NRW, looking at the average age of the pipeline or facility, and other verifi able asset conditions can confi rm the need for the project.
• Buildings. This would include administration buildings, work shops, motor pools, training centers and the like. While these assets can serve as collateral, it would be prudent on the part of the bank to determine the actual purpose for such facilities. For example, some WDs have buildings that have no bearing on their service delivery. The WD could encounter strong criticism for this type of project, thus jeopardizing or delaying its completion.
16 Refer to Chapter 5 for maximum day demand discussion.
Elements of a feasibility studyOnce the project has been identifi ed, a WSP will assess the viability of the preferred option. A WSP borrower that requires debt fi nancing for a major rehabilitation or system expansion should conduct several different analyses to complete its feasibility study, prepare the project, and estimate the funds required to carry it out. For effi ciency improvement investments, (e.g., NRW reduction [Box 5], metering, small-scale distribution network expansion) a pre-feasibility study may suffi ce; for minor repairs and maintenance, a utility only needs a program of works.
A complete feasibility study should contain the following types of analyses, which are based on primary data sources and market surveys. These analyses provide the basis for the project appraisal.
• Demand and supply or market analysis• Technical and engineering analysis • Manpower and administrative support analysis• Financial analysis• Economic analysis• Social soundness and impact analysis• Institutional analysis• Environmental impact analysis
A pre-feasibility study provides a rapid assessment of the above elements, and relies mostly on secondary data and assumptions based on rules of thumb. A program of works only describes the project scope and specifi c activities, and outlines cost calculations and estimated timeline.
Estimating costsIn preparing the project feasibility study, WSPs develop cost estimates for capital investments, operations, and maintenance. The WSP uses these cost estimates to compare options, estimate total project cost, establish fi nancing requirements, and serve as basis for economic and fi nancial evaluations.
Box 5. Possible approaches to solving a problem
Solving NRW starts by analyzing its causes. A project to reduce NRW by changing the pipelines could be caused by dilapidated pipelines but could also be because of theft, major leaks, worn out or un-calibrated production or service connection meters, or inaccurate production fi gures . Different causes have different solution sets. Even with complete fi nancial justifi cation, a project should be subjected to scrutiny if the sources of the NRW are not indicated or disclosed.
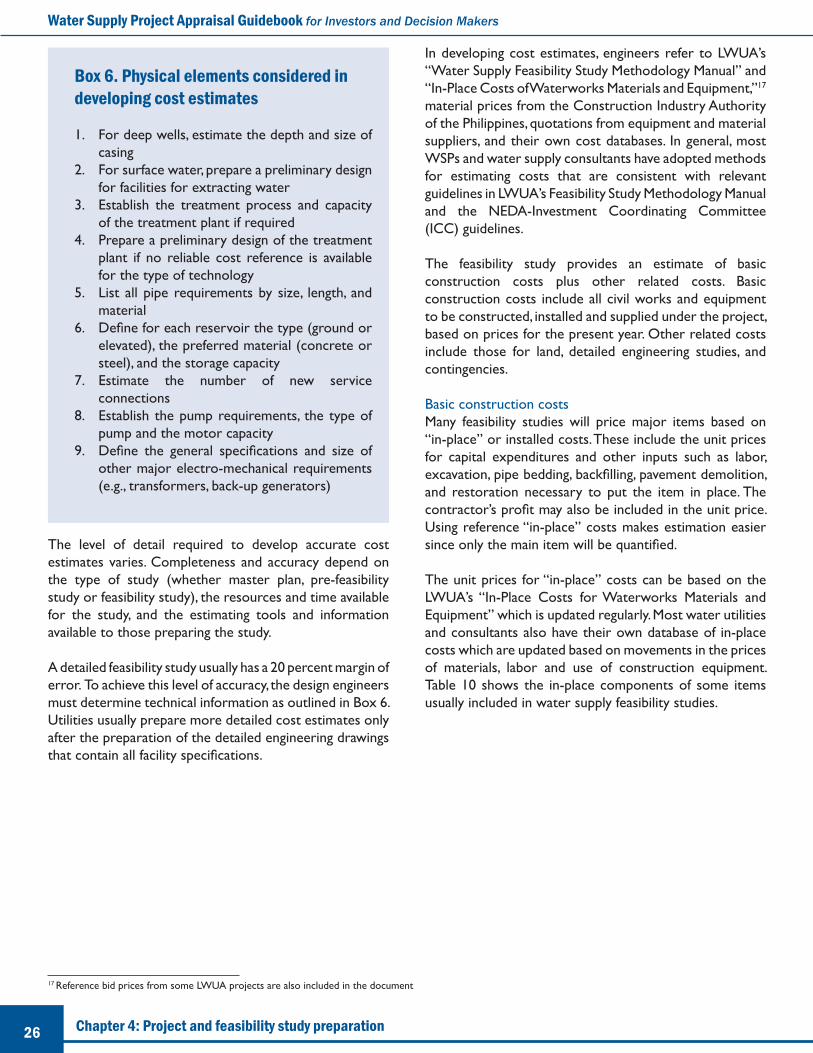
26 Chapter 4: Project and feasibility study preparation
Water Supply Project Appraisal Guidebook for Investors and Decision Makers
The level of detail required to develop accurate cost estimates varies. Completeness and accuracy depend on the type of study (whether master plan, pre-feasibility study or feasibility study), the resources and time available for the study, and the estimating tools and information available to those preparing the study.
A detailed feasibility study usually has a 20 percent margin of error. To achieve this level of accuracy, the design engineers must determine technical information as outlined in Box 6. Utilities usually prepare more detailed cost estimates only after the preparation of the detailed engineering drawings that contain all facility specifi cations.
Box 6. Physical elements considered in developing cost estimates
1. For deep wells, estimate the depth and size of casing
2. For surface water, prepare a preliminary design for facilities for extracting water
3. Establish the treatment process and capacity of the treatment plant if required
4. Prepare a preliminary design of the treatment plant if no reliable cost reference is available for the type of technology
5. List all pipe requirements by size, length, and material
6. Defi ne for each reservoir the type (ground or elevated), the preferred material (concrete or steel), and the storage capacity
7. Estimate the number of new service connections
8. Establish the pump requirements, the type of pump and the motor capacity
9. Defi ne the general specifi cations and size of other major electro-mechanical requirements (e.g., transformers, back-up generators)
In developing cost estimates, engineers refer to LWUA’s “Water Supply Feasibility Study Methodology Manual” and “In-Place Costs of Waterworks Materials and Equipment,”17
material prices from the Construction Industry Authority of the Philippines, quotations from equipment and material suppliers, and their own cost databases. In general, most WSPs and water supply consultants have adopted methods for estimating costs that are consistent with relevant guidelines in LWUA’s Feasibility Study Methodology Manual and the NEDA-Investment Coordinating Committee (ICC) guidelines.
The feasibility study provides an estimate of basic construction costs plus other related costs. Basic construction costs include all civil works and equipment to be constructed, installed and supplied under the project, based on prices for the present year. Other related costs include those for land, detailed engineering studies, and contingencies.
Basic construction costsMany feasibility studies will price major items based on “in-place” or installed costs. These include the unit prices for capital expenditures and other inputs such as labor, excavation, pipe bedding, backfi lling, pavement demolition, and restoration necessary to put the item in place. The contractor’s profi t may also be included in the unit price. Using reference “in-place” costs makes estimation easier since only the main item will be quantifi ed.
The unit prices for “in-place” costs can be based on the LWUA’s “In-Place Costs for Waterworks Materials and Equipment” which is updated regularly. Most water utilities and consultants also have their own database of in-place costs which are updated based on movements in the prices of materials, labor and use of construction equipment. Table 10 shows the in-place components of some items usually included in water supply feasibility studies.
17 Reference bid prices from some LWUA projects are also included in the document

27Chapter 4: Project and feasibility study preparation
Water Supply Project Appraisal Guidebook for Investors and Decision Makers
Table 10. Components of “in-place” pricingItem Common
unit of measureCommon
inclusionsDeep wells (classifi ed by casing size) Depth Well drilling and casing
Pipelines (classifi ed further by pressure class, material type [e.g., steel, PVC, PE] and diameter)
Length in meters Installation, excavation, pipe bedding, backfi lling, pavement demolition and restoration, pipe installation, pressure testing, etc.
Pump equipment (classifi ed by type [submersible, turbine pump, etc.] and pump driver [electric or diesel])
Set Installation, discharge pipes, valves, and controls
Service connection (classifi ed by diameter) Set Service meter, excavation, service pipe, and appurtenances
Reservoirs (classifi ed by material [e.g., steel, concrete] and type [elevated or ground])
Volume (reservoir capacity)
Earthworks, foundation, pressure testing, and minor appurtenances
Flowmeters and valves (by type [gate valve, air release valves, hydrants, etc.] and size)
Set Valve box, concrete base
Chlorinators (by type [gas or hypochlorinator] and capacity) Set Installation, valves, controls
Buildings (operation/administrative buildings, pumping stations) Floor area in square meters
Earthworks, foundation, architectural works, fi nishing
Since available cost references rarely cover all materials and equipment, the cost engineer must also secure price quotations from local suppliers. The disadvantage of this practice is that suppliers usually quote the list price whereas water utilities and contractors, who buy in large quantities, can usually negotiate 30–40 percent discounts on listed prices for pipes and other materials. Ideally the cost engineer should refl ect these discounts in their estimates.
Water treatment facilities pose a special challenge for cost estimation. The cost database only covers a limited range of equipment options because there are only a handful of water treatment facilities in the country, some of which are quite old. For water sourced from deep wells, utilities often use package-type treatment facilities (fi lters) which may be secured from different suppliers. Larger water treatment facilities, especially for surface water, may have numerous tanks and equipment which are sourced from different manufacturers. Furthermore, a major part of plant construction is civil works, carried out by a general contractor. Thus, cost estimates must include quotations from many suppliers and a general contractor. A good cost estimate can be done if a preliminary plant design is completed and costs for major items of work for the plant are estimated separately.
Estimates for minor items are usually made under a lump sum as these are minor additions to overall project cost.
Other items included in cost estimateThe following items are the typical components of basic construction costs:
• Land cost• Physical contingencies. The rule of thumb is 10 percent
of basic construction cost.• Price contingencies. These are normally based on
actual price movements in recent years and refl ected as an escalation rate per year. Some cost estimators use a fi xed percentage applied to basic construction cost, but the basis for this is not as clear as the escalation rate per year.
• Detailed engineering costs. These add up to 6 percent to the base construction cost. For larger projects, the cost estimator should lower the percentage value to come up with reasonable engineering cost estimates.
• Construction supervision costs. These can represent up to 10 percent of the basic construction cost. For larger projects, a lower percentage value should be applied to come up with reasonable construction supervision cost estimates.
Comparing project costsThere is little comparability between projects relative to additional supply of water or additional connections, since project costs vary greatly from one water supply project to another. What can be done is compare the different work items, such as deep wells, pipes, service connections and reservoirs. If there is a large variance, the bases for unit costs should be evaluated.

28 Chapter 4: Project and feasibility study preparation
Water Supply Project Appraisal Guidebook for Investors and Decision Makers
Estimating incremental operational and maintenance costsOperational costs are generally broken down into labor, power and chemicals:
• Additional staff required to run the new facilities are defi ned (position and number).
• The chemical requirement for chlorine disinfection is based on a dosage rate per cubic meter of water produced and a unit cost for chlorine. The unit cost may be based on actual chemical operating cost for the water utility. For water treatment facilities requiring more than disinfection, engineers should present chemical requirements per cubic meter of water produced.
• Power requirement estimates are based on the power rating of major equipment. The cost estimator usually evaluates the number of hours a pump is operated to produce a certain volume of water, which is then multiplied by the power rating (in kilowatt) to come up with a unit power consumption per cubic meter of water produced (kwh/cubic meter).
Maintenance costs are usually estimated based on the capital cost of civil works/fi xed assets and electromechanical equipment. For estimating annual maintenance costs, LWUA’s Feasibility Study Manual uses 0.3 percent of capital cost of civil works and fi xed assets, plus 3 percent of capital cost of electromechanical works.
Effi ciency improvement programAn effi ciency improvement program is a type of intervention that enhances the fi nancial and operating performance of water service providers. It is intended to improve utility performance (operational and fi nancial) and investor confi dence, with a focus on achieving high-impact, quick returns using short-term investments. Utility managers and fi nancing institutions can use the ratios described below to determine whether an effi ciency improvement program is needed.
Improving operating (effi ciency) ratios• Net income ratio. This requires increasing operating
revenues or water sales, and/or reducing operating expenses. Increasing operating revenues or water sales involves raising water production, expanding service area coverage, applying appropriate tariffs, and improving collection effi ciency while reducing operating expenses. Reducing costs requires improving production (pumping) effi ciencies, energy utilization by reducing NRW, and increasing the service connection to staff ratio (staff productivity).
• Debt service ratio. This requires increasing net income and reducing debt service obligations. Decreasing debt service after contracting a loan requires renegotiation of the loan interest rate and/or tenor.
• Collection ratio. Improving billing and collection systems can reduce customer arrears. This may require developing and implementing new billing systems and payment methods, establishing a system of rewards and penalties (including disconnection for overdue accounts and illegal connections) and an information and awareness program.
• Staff ratio. Increasing the number of active service connections per staff involves aligning staff positions with organization objectives, upgrading skills and qualifi cations through training, providing tools and equipment, paying competitive salaries and providing incentives to recruit and retain qualifi ed personnel.
Approaches to improving operating effi ciency and performanceThe utility manager and oversight board can decide on the types of programs they need to improve utility operations and performance. The principal types of programs are generally among the following:
• NRW reduction. Reducing technical and commercial losses and converting non-revenue water into additional revenue can be done by: (1) improving capacity to monitor and account for water losses; (2) increasing accuracy in metering water production and consumption by repairing, calibrating and maintaining water meters; (3) immediately detecting and controlling leaks; (4) detecting illegal connections; and (5) implementing best practices in the installation, rehabilitation and maintenance of the supply networks.
• Revenue enhancement program. This entails increasing the number of service connections and improving billing and collection performance. Service connections can be expanded by instituting affordable connection fees, implementing appropriate tariff structures and levels, and providing reliable customer service. Effective billing, payment and enforcement systems, good customer relations and marketing strategies can help improve collections.

29Chapter 4: Project and feasibility study preparation
Water Supply Project Appraisal Guidebook for Investors and Decision Makers
• Cost reduction/control program. This program aims to improve personnel productivity and control energy costs which are the largest operating expense components for most utilities. Staff productivity can be improved through training in a range of priority areas, holding awareness seminars for senior staff and decision makers, and upgrading equipment. Reducing/controlling operating cost involves: (1) monitoring/controlling cost of power for pumping through regularly conducted energy audits; (2) repair/replacement of energy ineffi cient pumps and motors; (3) proper production and demand matching of pumps; and (4) implementation of a preventive maintenance program.
Alternative analysisAlternative analysis is the process of comparing different approaches to one objective. It uses a net present-worth approach to analyze both initial construction and longer-term operating costs as the basis for comparing different options. The following are the options that may be analyzed using this method:
Source alternatives. Normally source, transmission, and treatment are taken as a single scheme in these analyses since these facilities are closely linked. Transmission lines are designed to handle the maximum daily water demand of the system as this is also the minimum requirement for source capacity. To choose among sources, both sources and the required transmission lines should be considered together.
Reservoir location and volume alternatives. The ideal location for a reservoir is opposite the source—that is, the service area sandwiched between the source and the reservoir—as this will allow the source and reservoir to compensate each other in terms of water pressure in the service area. But this can still pose a problem when source capacity is overtaken by water demand, thus ending up with a reservoir that is not fi lled. The alternatives for storage locations are critical when high ground is available
within a reasonable distance from the service area. Since an elevated reservoir is more costly than a ground reservoir, it may be worth considering locating the reservoir on high ground rather than constructing an elevated one (of either steel or concrete) close to the service area. The options are (1) a less costly ground reservoir but with longer transmission and main distribution lines or (2) a costly elevated reservoir constructed close to or within the service area with shorter transmission and possibly main distribution lines. Only a detailed analysis and computation can determine the more advantageous scheme.
The volume of the reservoir is designed in tandem with the capacity of the source. One may consider having a low-capacity source with smaller-diameter transmission line and a larger reservoir or a higher-capacity source with larger-diameter transmission line and a smaller reservoir.
Pressure zone alternatives. In service areas where the topographies are undulating, it may be necessary to consider different pressure zones to meet minimum peak-hour pressure requirements. Alternatives may be to:
• locate the reservoir on a higher elevation but with higher pumping cost
• provide separate reservoirs for higher areas• increase diameters of distribution lines to reduce head
losses and enhance pressure in pipelines but shoulder higher cost of pipelines
• provide booster pumps for higher areas but with higher pumping cost
Actual trials are necessary to determine the most advantageous scheme in a particular service area.
Using the net present-worth analysis allows the utility to eliminate variability in terms of component lifetimes and construction periods (Table 11) when evaluating options for each major system. By using a common base year for comparing costs, the net present-worth approach provides an objective way to compare options.
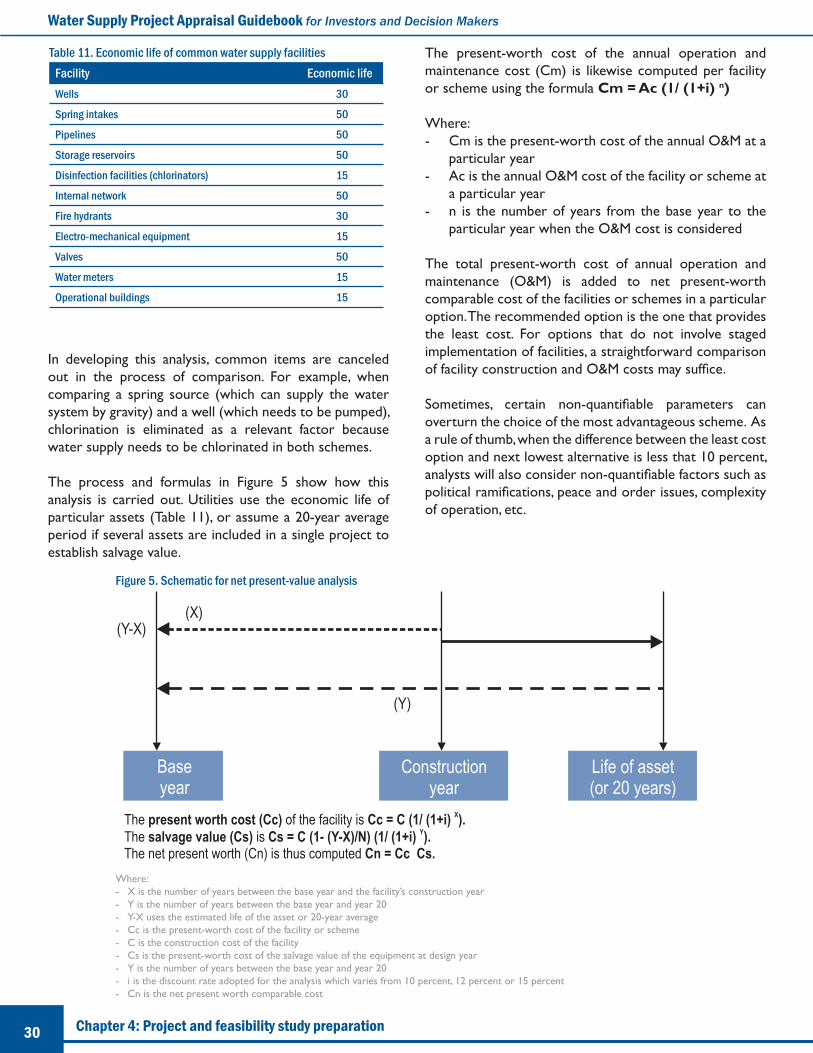
30 Chapter 4: Project and feasibility study preparation
Water Supply Project Appraisal Guidebook for Investors and Decision Makers
Table 11. Economic life of common water supply facilitiesFacility Economic lifeWells 30
Spring intakes 50
Pipelines 50
Storage reservoirs 50
Disinfection facilities (chlorinators) 15
Internal network 50
Fire hydrants 30
Electro-mechanical equipment 15
Valves 50
Water meters 15
Operational buildings 15
In developing this analysis, common items are canceled out in the process of comparison. For example, when comparing a spring source (which can supply the water system by gravity) and a well (which needs to be pumped), chlorination is eliminated as a relevant factor because water supply needs to be chlorinated in both schemes.
The process and formulas in Figure 5 show how this analysis is carried out. Utilities use the economic life of particular assets (Table 11), or assume a 20-year average period if several assets are included in a single project to establish salvage value.
Figure 5. Schematic for net present-value analysis
Where: - X is the number of years between the base year and the facility’s construction year- Y is the number of years between the base year and year 20- Y-X uses the estimated life of the asset or 20-year average- Cc is the present-worth cost of the facility or scheme- C is the construction cost of the facility- Cs is the present-worth cost of the salvage value of the equipment at design year- Y is the number of years between the base year and year 20- i is the discount rate adopted for the analysis which varies from 10 percent, 12 percent or 15 percent- Cn is the net present worth comparable cost
The present-worth cost of the annual operation and maintenance cost (Cm) is likewise computed per facility or scheme using the formula Cm = Ac (1/ (1+i) n)
Where: - Cm is the present-worth cost of the annual O&M at a
particular year- Ac is the annual O&M cost of the facility or scheme at
a particular year- n is the number of years from the base year to the
particular year when the O&M cost is considered
The total present-worth cost of annual operation and maintenance (O&M) is added to net present-worth comparable cost of the facilities or schemes in a particular option. The recommended option is the one that provides the least cost. For options that do not involve staged implementation of facilities, a straightforward comparison of facility construction and O&M costs may suffi ce.
Sometimes, certain non-quantifi able parameters can overturn the choice of the most advantageous scheme. As a rule of thumb, when the difference between the least cost option and next lowest alternative is less that 10 percent, analysts will also consider non-quantifi able factors such as political ramifi cations, peace and order issues, complexity of operation, etc.

31Chapter 5: Elements of water system development
Water Supply Project Appraisal Guidebook for Investors and Decision Makers
Chapter 5. Elements of water system development
As discussed in Chapter One, the national government classifi es water systems into three levels. For purposes of this project appraisal guide, we focus only on Level III systems (systems that provide piped connections). This chapter takes up the elements of water system development and management, and the analyses needed to forecast market growth.
Project development cycle*
Demand analysis and forecastingProjects are developed as a response to an anticipated or actual problem. Utilities require capital for new source development, the expansion of systems and/or major rehabilitation of existing infrastructure. Similarly, proposed projects are developed in response to actual or anticipated demand growth.
Projects with source development or non-revenue water reduction components will result in signifi cant increases in water production or availability. When this happens (and unless the additional water will be used to expand to a 24/7 service), the WSP must increase service connections to absorb the additional volume of available water. Therefore, water demand projections are indispensable in a feasibility study.
If the additional volume goes over the projected growth in water consumption, it could adversely affect the project’s fi nancial viability because of lower-than-expected return on investment. To effectively quantify and project estimated demand for water, utilities must answer the following questions:
• What is the size of the potential market/demand?• What is the size of the target market or niche
market/demand?• Where is the market/demand?• What should be the price of water to
customers?
Factors that drive water demandMarket surveys attempt to understand the factors that drive water demand. There are two major classifi cations of water demand: Domestic household demand and Commercial/industrial demand. Households usually comprise the bulk of water demand. For water utilities that also provide communal faucets, consumption from these communal faucets may be included in the domestic/household demand estimates. Commercial/industrial demand comes from business establishments and industrial fi rms in the service area. Water demand for government offi ces also falls under this classifi cation.
* Source: NEDA, Reference Manual on Project Development and Evaluation

32 Chapter 5: Elements of water system development
Water Supply Project Appraisal Guidebook for Investors and Decision Makers
The common factors that drive water demand are:• Unit consumption• Population/urban growth rates• Commercial/industrial development and growth
rates
Many utilities collect data and develop consumption ratios for each demand category used to project demand growth. Table 12 provides some general planning parameters for estimating the maximum-day to average-day ratio.
Table 12. Maximum-day to average-day demand ratioPopulation served RatioLess than 30,000 1.3:1
30,000 to 200,000 1.25:1
More than 200,000 1.2:1
Figures 6 and 7 illustrate the difference between maximum daily demand, maximum hourly demand, and average daily demand.
Figure 6. Maximum day vs. average day demand
6,000
7,000
8,000
9,000
10,000
11,000
12,000
13,000
DecemberNovemberOctoberSeptemberAugustJulyJuneMayAprilMarchFebruaryJanuary
Dem
and
(m3/d
ay)
MAX DAY DEMAND = 12,275
AVE. DAY DEMAND = 10,243

33Chapter 5: Elements of water system development
Water Supply Project Appraisal Guidebook for Investors and Decision Makers
Figure 7. Peak hour demand and average day demand
Domestic / household potential demandDeveloping good estimates of domestic/household demand requires the following information:
• Total household population of the water utility’s service area, including population growth rate projections
• Degree of urbanization to estimate the urban population, including growth rate projections18
• Percentage of total urban household population already served by the water utility
• Identifi cation of water sources for households and businesses not served by the WSP
• Distribution into regular and communal faucet consumers (based on household income classifi cations)
• Per capita “unsuppressed” and “suppressed” consumption per type of consumer
• Proportion of existing customers with suppressed demand
Commercial / industrial potential demandFor a proper estimation of commercial/industrial potential demand, the following information is needed:
• Total commercial and industrial area within the water utility’s service area (hectares)
• Commercial and industrial development growth rates (percentage of area per year)
• Commercial and industrial “unsuppressed” water demand densities (cubic meter per day per hectare)
• Commercial and industrial water demand densities growth rate (percentage per year)
• Commercial and industrial water demand already served by the water utility
• Source, quality, and price of water for those commercial/ industrial enterprises that do not purchase water from the WSP
18 The urban areas are considered as the water utility’s available market areas owing to the potentially higher fi nancial and economic returns on investments that may be generated compared to rural areas
0
2,000
4,000
6,000
8,000
10,000
12,000
14,000
16,000
18,000
20,000
0:00
23:00
22:00
21:00
20:00
19:00
18:00
17:00
16:00
15:00
14:00
13:00
12:00
11:00
10:009:0
08:0
07:0
06:0
05:0
04:0
03:0
02:0
01:0
00:0
0
AVE. DAY DEMAND = 10,243
PEAK HOUR DEMAND = 17,863
Dem
and
(m3/d
ay)

34 Chapter 5: Elements of water system development
Water Supply Project Appraisal Guidebook for Investors and Decision Makers
Population and commercial/industrial growth projectionsProjections of population or commercial/ industrial growth can provide a basis for estimating future demand, but some trends are diffi cult to project too far into the future. To measure the feasibility of a specifi c project, using a range of possible outcomes rather than any single projection is recommended.
For estimating population growth, NSO statistics provide the best guide. Commercial/industrial projections depend on national and/or local government plans/policies, laws and regulations that affect the business sector. Some projections of population or commercial/industrial growth are simply the continuation of historical trends. These may be considered reasonable assumptions for short- to medium-term projections over which socio-political, legal and economic conditions are expected to be stable.
Unit water demandThe water volume consumption per day of a customer is known as the “unit water demand.” The unit water demand for domestic/household consumers is usually expressed in terms of liters per capita per day (lpcd). In the case of commercial/industrial consumers, this would normally be expressed as cubic meters per hectare per day or cubic meters per day per connection. The actual unit water demand for different types of consumers may be obtained by referring to the water utility’s customer billing records.
For example, the average consumption per regular household customer is 30.3 cubic meters per month. If there is an average of 5.1 persons per regular household served, the average unit water demand can be computed as follows:
In some water utilities, there are areas with discontinuous water supply and low water pressure. In these areas, the actual per capita consumption is considered “suppressed.” That is, consumption could be greater if the system could provide continuous supply or better pressure.
For example, if actual per capita consumption in areas with discontinuous water supply is 168 lpcd and actual per capita consumption in areas with continuous supply/pressure is 198 lpcd, then the ratio of suppressed to unsuppressed consumption is:
Therefore, the level of suppression is 15 percent.
Target / niche demandThe water requirements of existing water utility customers plus a percentage of those without service who are willing to connect to the water utility make up niche demand. Determining target or niche demand is very important as, in some situations, the potential market will not automatically apply for a connection even if water service is already available. Some factors that limit demand for connections include:
• Availability of water from competing water service providers
• Preference for continuing to utilize their own source of water (e.g., private wells)
• Cost of applying for and maintaining a connection from the water utility
To estimate niche demand, it would help to know the percentage of potential customers who plan to secure water from another source and, among these, the percentage who specifi ed the water utility as the other source.
Location of niche demandWSPs should prioritize the installation or marketing of new service connections in niche demand areas. A market survey can provide information on the location of these areas, particularly where respondents have expressed willingness to avail of the water utility’s services as another source of water supply.
Water utility records can also point to areas where the utility has suspended applications for service connections due to insuffi cient water supply and/or low pressure or non-existence of distribution lines. Areas where major commercial, industrial or housing developments are located and which are without their own source of water supply are likely to rely on the water utility.
Water pricing and its impact on demandProper pricing of water supply to consumers allows the utility to recover costs and accumulate capital it can use to expand systems. It also enables the utility to manage demand, especially in areas where the utility must promote water conservation.
Market surveys can provide information on the water pricing perceptions and expectations of existing and potential customers. A survey can include questions to help the utility understand how customers will react to price increases and anticipate customer resistance and curtailed consumption.
(30.3 cu. m. per month) X (1000 liters per cu. m.)= 198 lpcd
(30 days per month) x (5.1 persons per household)
198 - 168198
x 100 = 15%

35Chapter 5: Elements of water system development
Water Supply Project Appraisal Guidebook for Investors and Decision Makers
Non-revenue water Non-revenue water is the difference between the total volume of water produced by the water utility and the total volume of water sold or billed to its customers. NRW consists of water lost through leaks in transmission and distribution systems, unbilled water consumed through theft or meter errors, and unbilled but authorized consumption (i.e., fi re hydrants). The percentage of NRW is computed as follows: % NRW = (1 – (Vol. of water sold / vol. of water produced)) x 100
It is important to understand the level of NRW when a utility proposes a new capital investment project. For example, if a water utility has an NRW rate of 30 percent and requires an additional 70,000 cubic meters per day to meet expected demand growth, it must produce at least an additional 100,000 cubic meters per day to meet this expected growth. NRW is a good indicator of how well a utility is managed and the age of its infrastructure. Well-run utilities have no more than 25 percent NRW. If a utility doesn’t have actual data on NRW, it can use the assumptions shown in Table 13.
Table 13: Assumptions in calculating NRW without actual dataWater system condition NRW as percentage
of productionSystem with old and new pipelines 40
System with new pipelines 20-25
Developing water sources Water utilities secure water from various sources, most commonly from groundwater through wells, which characterizes 86 percent of existing water supply systems. Other water sources include groundwater springs and surface water from rivers, lakes and the sea. Most WSPs tap groundwater because of its proximity to the demand center and its lower treatment costs. Surface water, in contrast, requires considerable treatment that results in higher investments in infrastructure (i.e., intake structures, sedimentation basins and fi ltration facilities) and higher operating and maintenance costs (chemicals, fi lter media, manpower, civil works maintenance, etc).
Evaluating proposed water source development facilitiesWater supply sources must be able to meet the maximum daily water demand of the service area as well as conform to quality standards set by the PNSDW. The following factors are used in evaluating water sources and facilities:
• Quantity of water required• Quality of raw water and treatment requirement• Distance to service area• Difference in elevation between source and
demand centers• Accessibility and potential diffi culties in
construction • Operator safety• Possible future contamination of the water
source • Ease of expansion for future requirements
Water utilities prefer gravity-fed water systems because they cost less to operate. However, overall operating costs of such systems may still rise when transmission and treatment costs are factored in. In general, the fi rst step in evaluating a water source is determining minimum fl ow. The minimum design fl ow for water source facilities should be able to satisfy maximum daily demand (based on the highest water demand for an extended period, i.e., one year). A source may be developed individually or in combination with other sources, depending on estimated water demand. Combined use of surface and groundwater may be benefi cial not only in meeting water demand but in conserving water. During periods of high precipitation, surface water can be used to allow groundwater to swell; groundwater may be used to supplement supply during periods of low surface fl ow.
The choice of whether to use surface or groundwater depends on the quantity of water that can be developed. Table 14 presents the advantages and disadvantages of developing surface and groundwater, which need to be accounted for in evaluating water source options.

36 Chapter 5: Elements of water system development
Water Supply Project Appraisal Guidebook for Investors and Decision Makers
Table 14: Pros and cons of surface and groundwater developmentSurface water Groundwater
Advantages
1. Water may be available by gravity fl ow2. Substantial fl ow3. Can be developed for other uses (e.g., power)4. Where water quality is excellent, minimal
maintenance is required for facilities5. Recharge depends on precipitation
1. Minimal treatment may be necessary2. More protected from contaminants 3. Requires minimal land area4. Discharge can be relatively constant5. Easy to construct6. Usually available from point near demand
Disadvantages
1. Requires complete treatment2. Easily contaminated 3. Needs considerable area for treatment4. Fluctuating discharge5. Construction is not simple6. Requires conveyance to service area
1. Requires pumping 2. Limited fl ow3. Cannot be developed for multiple use4. Maintenance of well and pumps is expensive5. Recharge is diffi cult to manage
Water utilities should routinely consider other factors when evaluating sources, including required treatment and transmission distance, and formulate and analyze alternative schemes to determine the best option. Utilities should also analyze source capacity and required storage volume to design the least cost scheme.
Source capacity is dependent on the system storage capacity and period of operations: for spring and surface water that can be fed into the system by gravity, operation is 24 hours so source capacity should at least be equal to the average hourly demand. For wells that will be operated less than 24 hours per day, the actual discharge must be higher than the average demand by a factor 24/operating hours to supply the required daily production. For example, if a well will be operated for only 18 hours a day, the well discharge must be at least 24 hours/18 hours or 1.33 times the average hourly demand.
Water utilities may also be required to assess the environmental impact of developing a surface water source, especially if withdrawals could impact the downstream ecological requirements of the water source. Finally, utilities should conduct baseline water quality analyses to enable tracking of changes in water quality over time and season as maintaining water quality is essential to ensure the source remains potable.
Surface water developmentSurface waters are more susceptible to contamination than groundwater. The chemical characteristic of surface runoff is dependent on the accumulation of pollutants picked up in water as it runs across the landscape. Common surface water contaminants include nutrients, pathogenic organisms, suspended solids, salts, toxic metals and toxic organic compounds.
Pathogens found in water include bacteria, viruses, and protozoa excreted by diseased animals and persons. When present in surface waters, these render the water non-potable and unsuitable for swimming and fi shing. Locally, drinking water is usually tested for coliform bacteria (i.e., E. coli). The presence of these bacteria does not necessarily mean the water is dangerous, but does raise concerns for a water utility. In addition, water is usually tested for toxic chemicals and heavy metals such as lead, arsenic, chromium and mercury, pesticides and herbicides, polyaromatic hydrocarbons (PAH), polychlorinated biphenyl (PCB), and BTEX (benzene, tolouene, ethylene, xylene).
Aside from water quality, another factor considered in evaluating a surface water source is its “safe yield,” or the amount of water that can be withdrawn without damaging the source. Safe yield is the maximum amount of water that may be withdrawn under registrations and permits. In allocating water, the NWRB considers safe yield to be up to 80 percent base fl ow of the water body. The base fl ow is calculated by analyzing the fl ow of the water body over the course of the year. Setting safe yield at this level allows suffi cient water to remain in the system to preserve the resource and its surrounding habitat.
Flood and drought pose the main risks for surface water. Floods can destroy intake structures and put considerable sediment into the systems, and droughts affect the amount of water supply. Hence, in the hydrologic study of a specifi c water supply, the water utility must assess the probability of drought and fl oods and factor this analysis into their infrastructure planning, as well as establish the fi rm or minimum yield of a surface water source.
37Chapter 5: Elements of water system development
Water Supply Project Appraisal Guidebook for Investors and Decision Makers
Raw water intakeThere are two main types of surface water intake: open or free-level intake, and controlled level intake. An open or free-level intake operates in all water fl ow conditions. This system is simple and relatively cheap, but usually requires constant water supply that does not fl uctuate excessively. A controlled level intake has a diversion structure (e.g., weir) set up downstream for the purpose of maintaining water levels throughout a range of fl ow conditions. Though more expensive, it is more reliable and provides constant supply.
The intake structure should satisfy both engineering and regulatory water quality requirements. Utility engineers take the following issues into consideration when designing a raw water intake:
• Flow regime of the source, daily and seasonal minimum discharge, fl ood occurrence, and the level of the water source (river, stream, etc.) in relation to water supply structures
• Depth from which water may be taken (surface, lower levels, or the full depth of the water supply source)
• Intake should be located upstream of the service area to avoid contamination by sewage discharge or along the outer periphery of a river bend (where there is the least sediment deposit) and should be protected from any damage caused by heavy fl oating objects during fl oods
• Maximum fl ood level and minimum dry season water level (the intake must be below the minimum water level)
• Intake must be equipped with bar screen and strainer
In cases where pumping is necessary, the motors (except for submersibles) should be installed above maximum fl ood level. All equipment should be readily accessible for maintenance and repair at all water conditions. It must be possible to raise the equipment above water level, carry out repairs, and lower it back into position.
Impounding reservoirWater supply reservoirs store water during high river fl ows for use during low fl ows. Utilities should construct impounding reservoirs if the safe yield of the source is less than estimated demand. After determining water demand, the traditional analysis for an impounding reservoir is to determine the yield during the critical period—usually the
driest period in the historical record or from synthesized fl ow—after which the storage area and capacity are analyzed. This is accomplished by using topographic maps to determine area and volume elevation relationships within the specifi c site. Other considerations are usable storage (i.e., available storage less the volume required to store sediments that accumulate during the life of the reservoir) and evaporation.
There are two types of impounding reservoirs: short-term and long-term reservoirs. A short-term reservoir is designed to meet seasonal supply variation, while a long-term reservoir is intended to meet demand during two or more years of drought.
Groundwater developmentGroundwater volume, availability and fl ow are determined by the characteristics of underlying soil and rock. The more porous and permeable the formation, the easier water can fl ow through the soil. Groundwater is replenished by rainfall; it will be depleted if the replenishment rate is less than the rate of withdrawal. This can lead to damaging or harmful consequences such as a change in groundwater fl ow direction, reduction of aquifer storage capacity, ground subsidence, reduction of stream fl ow, lowering of water level in nearby wells, and change in water quality (e.g., intrusion of brackish or salty water, particularly in coastal areas).
As a rule, groundwater is purifi ed as water passes through the soil. However, this is a function of soil type and thickness, concentration of pollutants, and depth of water table. Although groundwater may be considered purifi ed, soluble salts (particularly of calcium, magnesium, sodium, bicarbonate, sulfate and chloride) are present in the rocks through which groundwater fl ows. Minerals in the soil and rock, like arsenic, can sometimes render groundwater non-potable or, in the case of sulfur and iron, give it a bad taste. Most groundwater pollution comes from human activity such as discharge from septic tanks, nitrates and toxic organic compounds from agricultural and industrial waste, and heavy metals and acids from mining operations. The amount of groundwater a utility can safely extract is measured through pumping tests. Water utilities measure drops in the water table and often take other measurements during these tests, such as spring and stream fl ows and groundwater chemistry. Groundwater safe yield is that level where a long-term balance is attained and maintained between the annual amount of groundwater withdrawn and the annual amount of recharge.

38 Chapter 5: Elements of water system development
Water Supply Project Appraisal Guidebook for Investors and Decision Makers
Spacing pumps too closely in an aquifer can pose a serious problem. To avoid this, the Water Code of the Philippines specifi es minimum well spacing to prevent interference (Table 15).
Table 15. Minimum distance between wellsRate of withdrawal (lps) Minimum distance between
wells (m)2–10 200
More than 10–20 400
More than 20–40 600
More than 40 1000
A well may be either shallow or deep. Shallow wells are less than 30 meters deep; deep wells are more than 30 meters in depth. For municipal water supplies, a deep well is preferred. Well development involves drilling a borehole, installing casings and screens (or slotted pipes), placement of gravel pack or fi lter, development of the well, conducting a pumping test, and cleaning and disinfection. The well head should be protected from surface runoff for possible contamination. Typically, public wells are sealed from the surface to a depth of at least 15 meters. Well construction is normally carried out by contractors specializing in this type of service.
Deep wells are usually found through sub-surface investigation or a geo-resistivity survey. A well is designed based on data gathered during drilling, such as penetration rate, soil samples and water table levels. Good design means an optimum combination of performance, long service life, and reasonable cost.
A well consists mainly of two elements: the cased section and the screened section. The casing serves as housing for pumping equipment and a vertical conduit through which the water fl ows upward from the aquifer to where it enters the pump. The well screen is the intake portion; its requires careful consideration of the hydraulic factors that infl uence well performance.
In addition to the actual well, water utilities should also install pump stations. A typical pump station houses control facilities, disinfection facilities, and a stand-by power source. A smaller facility may be designed to accommodate the control and disinfection facilities. Utilities should also design electrical facilities for the pumps and other equipment.
Spring developmentA spring must have year-round water fl ow of at least one liter per second to be considered for development. Proximity to the service area is also an advantage. Several design factors are involved when assessing springs:
• Bacteriological contamination from the ground surface and/or livestock accessing the area around the spring
• Elevation with respect to the service area • Flow rate and the amount of water required
The resource should be protected against any kind of pollution carried by surface runoff. Water utilities could cover the spring intakes to prevent contamination and decrease evaporation, and they could also fence the area and provide proper drainage.
Water treatmentUtilities treat water to ensure its safety for human consumption and to meet quality standards set by the PNSDW. Based on the water source, type and amount of contaminants, land availability, and capital and operating costs, utilities select the appropriate treatment technologies to be used. A combination of technologies is sometimes used to achieve effective and cost-effi cient treatment.
Utilities employ a wide and diverse range of water treatment technologies to make their water safe for human consumption. Generally, surface water undergo a complete water treatment process, including sedimentation, coagulation and fl occulation, fi ltration, and disinfection using chlorine, ozone or ultra-violet light. Water from ground sources (wells and springs) typically only need disinfection, though more treatment is applied in cases where high levels of iron and other minerals occur in ground water.
National drinking water standards as treatment objectives The PNSDW prescribes values for bacteriological, physical and chemical makeup of safe and potable water. These standards are adopted by various water purifi cation technologies in use in the country. Whatever processes are employed by a water, the treated water must pass all prescribed standards prior to distribution and consumption.
• Physical parameters. Turbidity, color and suspended solids are the most common physical parameters addressed by the treatment process.
• Biological parameters. The common biological parameters include bacteria, viruses and algae. All of these are present in water supply sources but the amounts depend on conditions of the surrounding environment. Water sources in areas with urban populations and commercial activities may be highly polluted, carrying large quantities of bacteria and viruses, while most upstream rivers in sparsely populated areas are relatively uncontaminated. All

39Chapter 5: Elements of water system development
Water Supply Project Appraisal Guidebook for Investors and Decision Makers
water treatment plants must have provisions to eliminate these harmful microorganisms prior to distribution.
• Chemical parameters. Chemical parameters include pH levels, hardness, dissolved solids, ions such as sulfates, sulfi des, nitrates, chlorides, and metals such as iron and manganese. The presence of some of these elements in unusually high concentrations imparts objectionable colors, taste and odor to water. Some are toxic to humans at elevated concentrations. Of particular interest for groundwater sources is hardness caused by calcium and magnesium ions. Hardness makes more soap necessary for washing and causes scaling in facilities which operate at high temperatures such as boilers, water heaters, and pipes. Chlorides, on the other hand, are commonly found in water sources near coastal areas.
Water treatment plant (WTP) technology optionsConventional water treatment. Conventional surface water treatment plants have a standard sequence of treatments. After screening out large objects such as twigs and branches, and aeration to remove iron and manganese, utilities will add coagulant chemicals (usually alum) to the water to allow fi ne suspended particles to fl occulate into larger particles (fl occulation), and settle during the sedimentation basin. This sedimentation process will remove most of the suspended and fl occulated solids.
The clarifi ed water is then passed through a fi lter bed to further remove remaining solids. Disinfection is the fi nal step to destroy pathogens such as giardia, cryptosporidium, bacteria, and viruses through the addition of chemicals such a chlorine and ozone, or through exposure to ultraviolet light. In some cases, utilities will add other chemicals after disinfection to adjust the pH level, reduce hardness (water softening), prevent corrosion of the distribution system, or to prevent tooth decay in the case of fl uoride. Activated carbon may also be used as post treatment to remove inorganic or organic contaminants that often impart residual color and rusty or algal taste in the treated water. Groundwater sources generally have higher quality and require less treatment than surface water sources. Utilities will routinely just fi lter groundwater followed by disinfection. (See Table 16 for comparison of water treatment technologies and Table 17 for water treatment process selection.)
Membrane water treatment. Membrane water treatment systems are the latest water treatment innovations originally used only in desalination projects (converting seawater to drinking water). In recent years, new membranes have been developed that remove microorganisms, particulates, and even dissolved organic and inorganic content in raw water. Membranes are thin sheets of composite plastic material that can separate contaminants from raw water based on size and electrical charge of the contaminants. These membranes allow

40 Chapter 5: Elements of water system development
Water Supply Project Appraisal Guidebook for Investors and Decision Makers
Table 16. Comparing major water treatment technologies Treatment Advantages Disadvantages
Conventional surface water treatment
Reliable treatment process with wide process references
• Requires chemicals• Relatively larger footprint required• Susceptible to solids carry-over
Membrane treatment technologies
Very reliable process with high effi ciency in removing most water contaminants
• Higher capital cost per unit volume of water treated• Relatively higher operational cost
Distillation Reliable treatment process when excess energy is available
• Very energy intensive
Table 17. Water treatment process selectionSource of water Priority parameters Treatment optionsA. Surface water (rivers, creeks, lakes)
Class AA* surface water Suspended solids, coliform • Disinfection• Filtration and disinfection
Class A* or slightly polluted / silted water
Turbidity, organics, coliform • Conventional surface water treatment
Brackish or estuarine surface water with TDS > 500 mg/l limit
Turbidity, dissolved solids, chlorides, silica, boron
• Conventional surface water treatment and reverse osmosis
• Membrane process*** using reverse osmosis
B. Ground or spring water
Low TDS** (< 500 ppm) Turbidity, hardness, iron and manganese, trace organics
• Aeration then disinfection• Aeration, fi ltration (or membrane) and
disinfection
High TDS (>500 ppm) TDS, sulfates, hardness, iron, manganese, trace organics, silica
• Aeration then reverse osmosis• Water softening with membrane process as
post treatment
C. Saline Water (sea, ocean)
Low turbidity TDS, chlorides, boron, silica • Distillation• Membrane process using reverse osmosis
High turbidity Turbidity, TDS, chloride, boron, silica • Distillation• Membrane process (with pre-treatment for
solids)
D. Reclaimed water / recycled water
Sewage treatment plant effl uents for recycling
TDS, coliform, trace organics • Membrane process with pre-treatment
* Refer to DENR AO 34. ** Total dissolved solids. *** Using membrane fi lters such as MF, UF, NF then RO.
the water to pass through while screening particles, microorganisms and other contaminants.
Membrane treatment systems (microfi ltration, ultrafi ltration, nano-fi ltration and reverse osmosis) are pressure-driven and vary depending upon pore size. For example, microfi ltration removes sand, silt, clay, algae, bacteria, giardia, and cryptosporidium; ultra-fi ltration removes viruses as well as some heavy metals; nano-fi ltration nearly completely removes all viruses and organic contaminants and reduces water hardness; and reverse osmosis systems remove virtually all organic and inorganic contaminants, particularly chlorides. Water treatment systems using reverse osmosis produce 50–65 percent reject water. This means that out of the 100 m3/day of raw water supplied across the membrane system, only
about 35 to 50 m3/day of treated water is produced while the rest are discharged as waste. For ultra-fi ltration or micro-fi ltration, the reject water is around 5–10 percent.
Other treatment systems• Distillation and solar treatment. Distillation
offers an alternative viable water treatment process when excess energy is available. However, the cost can be prohibitive if an independent source of power is employed.
• Ion exchangers. Ion exchangers use resins that remove charged inorganic contaminants like hardness, arsenic and nitrate. Activated carbon is used when temporary quality problems arise, such as residual color, tastes and odor. Activated carbon is generally preferred for removing organic contaminants.

41Chapter 5: Elements of water system development
Water Supply Project Appraisal Guidebook for Investors and Decision Makers
Water transmission and distribution Aside from the water source and treatment facility, most water systems have three other principal components: transmission, storage, and distribution infrastructure. Water utilities design systems to provide a suffi cient volume of water within a specifi ed pressure range to serve customer needs. In areas where the topography is undulating and where there is more than one pressure zone, utilities should establish different pressure zones using different values to maintain pressure within the system. General standards include maintaining minimum peak-hour pressures of 7m and 14m in residential and commercial areas, respectively.
Transmission/ storage systems Transmission and storage systems consist of transmission mains and storage reservoirs. The transmission pipeline transmits water supply from the source to either the reservoir or directly to the demand center. Storage reservoirs allow for the storage and release of water during the day to meet fl uctuating demand.
Transmission mains. Transmission mains connect a distant water source to the balancing storage tank. Water utilities design transmission pipelines to carry the system’s maximum day demand. In exceptional cases, such as when the source is capable of supplying peak hour demand or is located on fl at terrain and not far from the center of demand, transmission facilities may carry peak hour fl ow. In pumped water systems utilities will choose the most economical pipe size based on the pipe’s energy and construction cost.
Storage reservoirs. Ideally, a water utility’s reservoir should have enough capacity for operational, emergency, and fi re-fi ghting requirements, depending on the viability of the water supply project and the water supply rate. • Operational storage. This refers to the volume of
water consumed at peak-hour demand. Water stored for peak operation makes up about 15–30 percent of
maximum daily demand, depending on the capacity of the source. The greater the source capacity, the lower the volume of operational storage required.
• Fire-fi ghting storage. This is a water reserve intended to be used to combat fi re. Utilities will generally reserve at least 120 cubic meters of space for fi re-fi ghting storage. This is considered suffi cient because fi res seldom occur simultaneously with peak hour demand. In addition, utilities can also manipulate system valves to ensure that water is available for fi lling up fi re trucks. Fire fl ow requirements specify a water fl ow rate of 22 L/s from each of the two adjacent fi re hydrants in residential areas.
• Emergency storage. This is a reserve intended for use in other emergencies, such as facility breakdowns, power outages, calamities, etc. In the Philippines, water utilities set aside two hours of maximum day demand for emergency purposes.
Storage reservoirs may be elevated or at ground level depending on what is more economical in terms of construction cost and overall plan. Reservoirs are classifi ed depending on construction materials (concrete, steel, earth, wooden, etc), elevation (elevated or ground level), function/purpose (operational, fi re, emergency), and operation (fi ll-and-draw or fl oating).
Ground reservoirs are generally made of reinforced concrete and cost less to construct than elevated towers. They also entail lower maintenance costs and are less susceptible to corrosion and possible damage from earthquakes. When designed to have two chambers, ground reservoirs are effective in minimizing water service interruptions during maintenance works.
Elevated reservoirs are mostly cast-in-place reinforced-concrete or fabricated from welded or bolted steel plate. Elevated reservoirs cost more to build, but they can be located close to the source or the service area, thus eliminating the need for long transmission lines.

42 Chapter 5: Elements of water system development
Water Supply Project Appraisal Guidebook for Investors and Decision Makers
Booster pumping stations. In some service areas where topography does not permit the economical location of storage at a desirable hydraulic elevation, a combination of ground storage with booster station and elevated storage may be the best solution. The economy of pumped storage must be weighed against the dependability of having more readily available water from an elevated reservoir.
Distribution systems Distribution pipes carry water from the balancing storage reservoirs and/or the transmission mains to consumer service connections and fi re hydrants. Distribution pipes are designed based on peak hour demand. Distribution systems have the following principal components:
• Distribution pipelines. Distribution pipelines start from the reservoir down to the service connections, distributing water to individual consumers. Designs for new pipelines must factor in possible pressure losses and ensuring adequate pressure during peak-hour and fi re fl ow conditions.
• Valves. Valves allow water service providers to isolate or regulate water fl ows within the water supply system when carrying out maintenance works, responding to emergencies or controlling supply and pressure. Valves are spaced to minimize disruptions during maintenance on the system. High-demand areas have more closely-spaced valves.
• Meters. Many systems have three types of meters: production, district and service connection meters. Production meters measure the volume of water that enters the system from the source or treatment
plant. Comparing the amount of water that enters the system with water actually sold allows the utility to measure its non-revenue water. Many water utilities use district meters to measure the volume of water supplied to distinct areas within its system. These meters allow them to identify areas with leaks and/or high levels of NRW. Service connection meters are installed at every service connection to account for water consumed and the corresponding charges.
• Service connections. Consumers access the water supply system through its service connections, which include meters, curb stop or turnoff valve and box, and a line that connects the water meter to the distribution line.
• Fire hydrants. Hydrants provide water for fi ghting fi res and are used to fl ush sediments out of the system. In residential areas, water utilities are required to connect hydrants to 100 mm distribution pipes and space them 180 meters apart. In commercial/industrial zones, hydrants should be connected to 150 mm distribution pipelines and installed 135 meters apart.
When designing new projects or implementing a major system rehabilitation, water utilities should conduct a hydraulic analysis to determine peak hour demand, maximum day demand, average day demand, minimum hour demand and fi lling condition, and fi re fl ow. They should also conduct fi eld studies of their existing distribution system to assess its present condition, identify defi ciencies, isolate areas of inadequate service, determine unit consumption and location of large water users, and identify necessary improvements.

43Chapter 6: Project appraisal
Water Supply Project Appraisal Guidebook for Investors and Decision Makers
Chapter 6. Project appraisal
A project appraisal is effectively a validation of the project feasibility study. To judge its bankability, appraisers analyze a project in terms of technical and market analysis, cost, fi nancial, social/political and environmental factors, and proposed implementation plan. Following project and loan appraisal and approval, the WSP carries out the fi nal detailed designs and costing of the project prior to implementation.
Project development cycle*
Due diligence checklist for project appraisalThis chapter outlines the types of questions an appraisal team needs to answer when conducting an in-depth appraisal of a proposed project.
Technical and operational soundnessDoes the proposed project address the problem/s identifi ed in the project study? Has the project study explored alternative solutions to the problem(s)? • Is there a balance between water source capacity and
facilities, and the average day or peak hour demand regardless of the level of water losses? If not, what are the measures being recommended under the EIP?
• Is the pipe network appropriately sized to maintain minimum and maximum pressures?
• Is there a study on identifying and segregating the causes of non-revenue water? Are the recommended corrective measures relevant to the identifi ed causes of NRW? Is the schedule of corrective measures consistent with the projected reduction of NRW?
• Is the project technically feasible in the proposed project site? If a well source is being proposed, do groundwater and aquifer capacity studies exist that support the project? If the project is developing surface water sources, have rainfall and stream fl ow measurements been completed, and if so, for what time period? Can data be confi rmed through correlation with actual rainfall and fl ow measurements?
• Is the technology appropriate for the present level of expertise of the WSP? Will it require capacity building and staff training?
Cost analysis• Ensure that quantities refl ected in cost estimates
are refl ected in the preliminary design of works and facilities presented in the feasibility study.
• Check level of detail of estimation. If a single item costs more than 10 percent, then the basis for the cost estimate for that item should be evaluated further.
• Scrutinize the lump sum items, especially if the cost is a signifi cant fraction of the total project cost. If so, request for a breakdown of cost for these items.
• Check assumptions/references for unit costs. If not refl ected in the project document, it is good practice to ask the FS preparer or project proponent to submit their assumptions and references for the costs. Compare with available references.
* Source: NEDA, Reference Manual on Project Development and Evaluation

44 Chapter 6: Project appraisal
Water Supply Project Appraisal Guidebook for Investors and Decision Makers
Financial sustainability• Does the tariff structure provide enough revenue for
O&M, debt service, reserves and taxes? Is the tariff level adjusted based on projected cash requirement and projected infl ation rates? How does the lifeline rate (minimum charge for the fi rst 10 cubic meters) of the tariff schedule compare with the threshold level of household expense for water (5 percent of the average income of “Low Income Group”)? Does the level of “Ending Cash” in the Cash Flow Projection provide enough buffer for emergencies (3 months O&M expense)?
• Is the projected number of connections consistent with the market survey and population growth of the locality? Are there appropriate marketing campaigns to support the projected market growth? Does the market survey and projected growth of service connections support the proposed capital expense program on pipeline extensions and service connections?
• Is the projected increase in consumption consistent with the existing consumption pattern of the locality and/or similar communities?
• Has the WSP presented the project and planned tariff structure to its customers through a public hearing? What is the hearing offi cer’s assessment? Did the regulator (NWRB, LWUA or LGU) approve the proposed tariff structure?19
• What is the source of WSP equity or counterpart? How and when will it be made available? If it is coming from an outside source, is there a legal agreement to ascertain its provision? Are there reasons to believe that the counterpart will not be provided? Will the equity be provided in kind or in cash?
• In case of default or events leading to default, are there available interventions to correct or avert the situation?
Social and political soundness• Does the project address the priority needs of the
locality? How do residents perceive the project? Do present and future customers of understand and appreciate the project as conceptualized and designed by the WSP?
• What is the perception of customers as to the present quality of service delivered to them? Do they trust the WSP can improve its services by implementing the project?
• In securing water rights for its water withdrawal from the source, does the WD have any confl ict with present water users, e.g., farmers, irrigators, other WSPs, fi shermen?
• Are there programs by the WSP to promote “project ownership” by the community through involving local labor during project construction?
• Does the WSP have an advocacy program to win the support of local leadership for the program?
• What image does the WD project to the local leadership? Will the local leadership support the WSP’s proposed project?
Environmental• Will the project require environmental impact
assessment and environmental clearance?• Will the implementation of the project produce
environmental damage? What measures can be taken to mitigate the effects? Would the mitigation measures be suffi cient?
Project implementation• Can the project be implemented any time during the
year, regardless of the season? • Will the project be implemented by the WSP or by a
contractor? • Is the project size attractive to contractors? How
will the required equipment and expertise be made available? If a contractor is employed, what is the extent of the contractor’s responsibility?
• Does the WSP have the technical expertise to supervise the project’s implementation or will it hire services for project supervision?
• How will outside services be procured? Is there an existing procurement procedure? Are these provided for in the project estimate?
• Does the project estimate provide for price and quantity contingencies?
• Is there an offi cer or project management unit to provide progress reports and feedback on the project’s progress, not only in construction but also in implementing other short and long-term recommendations in the study to improve the WSP’s effi ciency ratios?
Institutional analysisWhile the technical aspects of a loan request defi ne the project’s technical viability or desirability and the fi nancial aspects ensure the ability of the WSP to repay the loan, it is the people of the institution who will make it all happen through their implementation, decisions, and actions. A senior LWUA offi cial once noted that “there are three things necessary for a water utility to succeed—water, money, and a capable manager. Among these, the most important is a capable manager.”
19 However, it must not be construed that actual tariff approvals are pre-requisites for loan processing. Tariff 1approval can be made as one of the conditions precedent for the actual release of the loan.
45Chapter 6: Project appraisal
Water Supply Project Appraisal Guidebook for Investors and Decision Makers
LWUA’s experience underscores that the difference between creditworthy and non-creditworthy utilities is usually determined by the people managing the utility. During project appraisal, the institutional analysis will help the evaluator assess the relative strengths and weaknesses of the organization, and determine whether the strengths offset any weaknesses, and if not, if there are specifi c measures that should be implemented prior to loan approval.
The institutional analysis considers six areas of a utility’s operations. This is accomplished through interviews with the people both within and external to the organization, and by reviewing key documents. The following are the types of questions and information an analyst should answer in completing an institutional analysis.
• Vision. Does the utility have a clearly stated vision that is widely known to its staff? A good way to check is to ask three people working in different parts of the organization to give the utility’s vision statement. A documented vision statement or any documents that might contain the vision statement, such as the annual report, may also be requested. The vision should provide a futuristic picture of what the utility wants to attain. If a water utility has a vision statement but the staff cannot state it, then probe why. Confi rm that the LGU vision and WD vision for the community are in harmony.
• Goals. Does the water utility’s business plan or other planning documents spanning a one to three-year period describe short (1 year) to medium term (3–5 years) goals? Ideally, goals should be specifi c, measurable and time-bound. Look for documents required by top management or the board to determine whether the utility’s senior management are monitoring and reporting progress against these goals on a regular basis.
• Cultural values. Interview staff on the presence of employee unions or employee associations and determine whether its objectives are aligned with that of the organization. Check the relationship between board and management and determine whether dysfunctional confl icts occur with respect to decision making, delegated authority, and board remuneration. Check for current legal confl icts as well as morale among employees.
• Structures, systems and processes. Compare the actual organizational structure to the most recent structure approved by the board and get reasons for any deviation. Interview unit heads to
determine if suffi cient authority has been delegated for them to accomplish their desired tasks. Confi rm with LWUA about the integrity and security of the WD commercial practices, especially with respect to billing and collection. Review past COA audits to get additional information. Where does the WD invest its cash? Are they prudent or do they resort to high-risk investments? Determine the monitoring reports which are required by the manager and unit heads. Review these reports for completeness, timeliness and action taken by management. Look into the key performance indicators being monitored by the WD and assess actions taken by management on areas needed. Non-monitoring or lack of performance targets is an indicator of poor management.
• Resources. There are obviously some components lacking in the subsystem hence the need for loan funds and projects. Check for people resources, their qualifi cations vis-à-vis their position. Are there enough technical staff, (engineers, accountants, etc.) and are they in the right position? Check the total number of employees, taking into account benchmarks for staff per thousand connections (less than 8 per 1,000 connections or 1 per 120 is a good indicator of staff productivity). Check for staff training activities to determine how the organization views staff development.
• External relations. Check with various stakeholders outside the water utility to determine the goodwill (or lack of it) that the WD has built over the years. These will include the LWUA, depository banks, LGU offi cials, media and suppliers/contractors. The relationship with LGU offi cials is crucial as this has the most impact on WD operations, i.e., in securing construction permits, tariff adjustment endorsements, board member selection, and even provision of fi nancial resources. Review minutes of public hearing especially on the support or lack of it as shown by its consumers, civil society and LGU representatives. Lastly, look into how customers are being treated by the WD. Does the WD give information sessions or manuals to prospective clients on their rights and responsibilities? Look into customer complaints and determine the percentage of complaints related to billings. Look into the utility practice of settling customer billing complaints. Study the payments made by the WD to its suppliers/contractors. Are they being paid the right amount at a reasonable period? The behavior of organizations will be congruent. If the WD, in general, shows inappropriate behavior towards these mentioned stakeholders, they will show the same attitude toward the bank.

46 Chapter 6: Project appraisal
Water Supply Project Appraisal Guidebook for Investors and Decision Makers
Focus on fi nancial modeling and forecasting In evaluating a project proposal, the analyst will normally make a fi nancial forecast for the project for a defi ned time period. The fi nancial model helps the analyst make recommendations on the loan proposal and provides direction on possible actions or alternatives based on the information presented.
This sub-section is based on the due diligence experience of LGUGC and partner fi nancial institutions with 15 water districts belonging mostly to the big to very large categories and with credit ratings of at least “BBB” under the LGUGC’s Water District Credit Rating System.
To develop the fi nancial model and projections, the analyst needs to obtain, at a minimum, the borrower’s:
• Monthly data sheets• Audited and interim fi nancial statements • Schedule of receivables • Existing loan agreements • Project study
Ideally, the analyst should evaluate the monthly data sheets and audited fi nancial statements for the past fi ve years to establish trends and make plausible assumptions for fi nancial projections.
Critical assumptions To build a fi nancial model for a water project, the analyst needs to identify the critical assumptions. For an assumption to become plausible, the fi nancial analyst has to have: a) a clear understanding of every parameter; b) suffi cient data available, and c) adequate experience/background of the industry. Below are some of the critical assumptions that need to be answered in preparing a fi nancial model. These assumptions are divided into two principal groups: technical/operational assumptions and fi nancial assumptions. Specifi c examples drawn from the case study of the Retawon City Water District (Appendix 4) have been used.
Technical / operational assumptionsExpansion of service connectionsTo assume a growth rate for the succeeding years, refer to the historical trend and assume signifi cant increases if the loan is meant for expansion. Surveys on willingness to connect and to pay the proposed tariff by households in the proposed expansion area may serve as basis for the projection. Household mapping is another way of validating areas for expansion. In some cases, resolutions from barangays or subdivisions requesting the turnover of existing water systems or new connections may justify the assumed increase in connections. Offi cial population
projection must also be checked to ensure that the projected service connections are still achievable against population.
Retawon City Water District (RCWD)
The Retawon WD’s project intended to increase the number of concessionaires in the district. The RCWD fi nance offi cer presented an increase of 792 connections per year for the next fi ve years, which was way below the 13,390 households willing to connect to the water district’s pipeline, as identifi ed in a survey undertaken by the RCWD marketing head.
What an analyst can do here is advise the client to consider increasing the targeted number of connections per annum to a more reasonable level, e.g., 1,000. Moreover, the expansion may be prioritized in the city center where most establishments are concentrated, to optimize marketing opportunities.
Non-revenue waterTo forecast NRW, look at the historical data, particularly the latest, and compare this with the WSP’s strategy to reduce NRW. The strategies may include actions such as the replacement of old and defective pipes and fi ttings, or a massive campaign against illegal connections.
RCWD posted a 58 percent NRW in 2006 and 60 percent in 2007. The high NRW may be attributed partly to leakages because of old pipes (RCWD was put up in 1950, with no extensive improvements on its facilities throughout the years). Its existing storage facility is ridden with cracks, which also contributes to the high NRW. Restoration of this storage facility is now part of the project. Operational data also indicate high NRW in the industrial district where there are informal settlers. It is possible that pilferage may come from this area. Despite the proposed loan, RCWD projects a very marginal annual decline in NRW until it reaches 41 percent level in 2017.
The analyst should recommend revisiting the program of work to focus more effort on NRW reduction rather than source development. If RCWD adopts the target increase in service connections of 1,000 per annum, NRW must be signifi cantly improved because the projected demand cannot be met by existing and projected new water supply. If the NRW is curbed to a desirable level, e.g., 25 percent, then source development may no longer be necessary. The money allotted for source development can instead be utilized for expanding service connections to accommodate the 13,390 households that signifi ed willingness to connect to Retawon sooner than the current plan.

47Chapter 6: Project appraisal
Water Supply Project Appraisal Guidebook for Investors and Decision Makers
Average consumption per connection per monthAverage consumption per connection per month can be derived by dividing billed water with the total number of connections. The consumption pattern should be analyzed to see if it is based on constrained demand (low consumption attributed to lack of water supply, particularly during peak hours). In such case, the average consumption per connection can be expected to increase if the loan purpose is to improve water supplies. The usual range for this is 23 to 30 cubic meters per month.
RCWD registered an average consumption per connection of 23 cubic meters per month in 2006 and 2007. According to the information stated in the case study, RCWD concessionaires are complaining of poor service as water pressure during peak season is almost zero. Since the project is a combination of rehabilitation and expansion, it is expected that water consumption per connection will increase. The rehabilitation will reduce wasted water while source development will increase water supply. Both shall address the low water pressure complaint of RCWD customers and shall facilitate an increase in consumption per connection.
The analyst may consider adopting the assumed average consumption per connection per month as presented by RCWD which gradually increases from 23 to 30 cubic meters per month by 2017.
Water production capacityProduction capacity is evaluated primarily to check if there is enough water supply for the projected increase in water demand. In case of a substantial increase in number of connections, water supply may be augmented by the development of new supply sources. Supporting documents for source development must be obtained, such as results of a geo-resistivity survey for projects involving drilling of wells. For projection purposes, consider only the rated capacity of each source, e.g., for a well with 25 liters per second (lps) capacity, the analyst may want to assume only 18.85 lps (75 percent). This means the well operates for 18 hours only with the remaining 6 hours as buffer or maintenance period.
Financial assumptionsTariffTariff is critical for a water utility. The LWUA website provides a copy of the manual on water rates for water districts (see http://www.lwua.gov.ph/water_rates_08/water_rates_index.htm). This will be a good reference in understanding tariff setting for water districts. (The guidelines are also summarized in Box 1 in Chapter 2.)
The standard practice is to set a minimum tariff for consumption up to 10 cubic meters per month. The rates then increase every 10 cubic meters. Tariffs also differ between customer types, such as residential, commercial/industrial, and institutional/government.
It is always prudent to assume water rates that are cost-based, competitive, and affordable. Equally important is the ability of the WD to implement projected tariff increases according to its proposed schedule. This is why it is important to look at the WD’s track record for at least the past 10 years. The analyst should then assess the ability of the WSP to implement the projected tariff schedule. A sensitivity analysis must be conducted to determine the latest possible implementation of a tariff hike and the minimum tariff increase that the WSP’s cash fl ow can absorb. The resulting fi gures should then be discussed with the WSP management for consideration. There are instances where banks make approval of the tariff increase schedule a condition of loan release. This is a good strategy for some WDs as some boards of directors choose to delay implementation of tariff hikes despite approval.
Looking at the Regional Water Tariffs as of September 2007 as provided by the RCWD’s project proposal, the analyst would note that Retawon has the second highest minimum charge at P210 per cubic meter. This is 21 percent higher than the P174.05 average minimum charge of the other 19 WDs in the region. It was stated that RCWD intends to increase tariff by an average 10 percent per annum for three consecutive years starting 2008, despite a rate hike in February 2006.
Collection effi ciency, accounts receivable, penalty chargeCollection effi ciency is computed by dividing the collections, including arrears for the current year, by total water billings, inclusive of penalty charges, multiplied by 100. This can be projected based on historical data and the new strategies of management to improve collection efforts. Most WDs have a collection effi ciency of 90 percent and above because they impose penalty charges and cut service connections after two months of non-payment.
A 10 percent penalty on their water bill is charged to customers immediately after the due date. This penalty charge contributes about 3 percent of water revenues because on-time payment (computed by dividing current collections with current billings) is normally registered at 60-70 percent.
It is very important for the analyst to examine the schedule/aging of receivables. Most WDs are not authorized by LWUA to write off receivables even if collecting these is

48 Chapter 6: Project appraisal
Water Supply Project Appraisal Guidebook for Investors and Decision Makers
no longer feasible. It is possible that of the P20 million in accounts receivable posted on the WD fi nancial statements, P15 million are already due for write-off. (Some receivables have been accumulated for more than 20 years, yet the Commission on Audit refuses to let WDs write these off.) This does not automatically refl ect poor performance, however. A 20 percent receivable accumulated for 20 years could mean only 1 percent bad debt on a yearly basis. Some of these bad debts are bills of municipal or city halls which are not paid because local government units’ demand for service in lieu of shares in the WD. In such cases, WD management and the LGU need to reach a compromise.
RCWD presented a collection effi ciency rate of 89 percent in 2007. The projected collection effi ciency rates and resulting accounts receivable and penalty charges for 2008 to 2017 are deemed acceptable for a conservative fi nancial projection. However, the analyst can discuss with RCWD management the need to gradually increase collection effi ciency up to at least 95 percent.
Connection fees and customer depositsMost WDs assess connection fees at cost plus a margin. The cost for a new service connection would normally range from P3,000 to P5,000. To attract new customers, WDs often offer a deferred payment plan on the connection fee of up to 1 year without interest. A customer deposit equivalent to twice the minimum charge is also assessed for a new customer.
A new customer of RCWD shall be assessed a connection fee of P4,000 which can be amortized in a year, while the customer deposit shall be P420 or twice its minimum charge of P210.
Terms of existing loan/sThe analyst should obtain a copy of the loan agreement/s of a water district to confi rm the assets pledged as collateral and to learn about restrictions imposed by previous lenders. Most WDs have existing loans with LWUA. Private fi nancial institutions, on the other hand, require the credit enhancement of LGUGC. The PFIs provide term loans of up to 10 years with a grace period that is usually based on project construction period. Refer to Table 18 for LWUA and PFI loan terms.
The loan amount is usually based on the project cost. While LWUA and GFIs require at least 10 percent equity, the PFIs guaranteed by LGUGC can fund 100 percent of a project’s costs. The PFIs usually prepare a sensitivity analysis to identify the threshold for converting variable interest rate to a fi xed rate as a value-added service to the borrower.
PFIs may propose a variable interest rate with a one-time option to convert to fi xed rate to save on interest cost. To illustrate, the variable rate as of June 27, 2008 is approximately 7.25 percent for a “Rated A+” water district. However, for projection purposes, the analyst may use 10.5 percent for a conservative 10-year forecast.
Table 18: Loan terms for water projects Particular LWUA PFITerm Up to 25 years Up to 10 years, indicative term only
Interest Graduated (currently at 8.5–15%)First 2 million – 8.5%Next 5 million – 10.5%Next 13 million – 12.5%Next 30 million – 14% Next 50 million – 15%
Fixed or variable with one-time option to convert to fi xed rate; based on PDST-F plus spread of up to 3%. The spread is risk-based.
Principal repayment Equal monthly installments Monthly; amounts based on projected cash fl ow during account evaluation
Security Reserve fund Combination of the following:• LGUGC Guarantee• Deed of Assignment of reserve fund• Deed of Assignment of water billings
In the case of RCWD, a10-year loan term is acceptable because its excess cash may be allocated for undertaking projects leading to NRW improvement. The excess cash does not mean that the RCWD must secure a shorter term loan because WDs normally have other capital expenditures which are not part of the loan proposal.

49Chapter 6: Project appraisal
Water Supply Project Appraisal Guidebook for Investors and Decision Makers
Reserve fundThe reserve fund is normally a percentage (3–10 percent) of water sales set aside monthly in a deposit account built-up by the WD up to an agreed fund level. The borrower executes a deed of assignment (DA) on the reserve fund which serves as the main collateral to lenders. Normally, the holdout amount is equivalent to the highest 3 months’ worth of amortization.
Section 14 of Chapter VIII of PD 198 encourages WDs to set aside a portion of their income in a reserve account which shall be disbursed for payment of contractual obligations, reserve for debt service, operation and maintenance, and for expansion and improvement of the WDs’ physical facilities.
This same section is the basis of lenders in requiring the deed of assignment on the reserve fund. Under the DA, the borrower cannot withdraw from the reserve fund without consent from the lender. However, the DA also provides that the lender shall not unreasonably withhold such consent.
For the RCWD fi nancial projection, the analyst should set aside about three percent of water sales each year for the reserve fund account under Cash Flow from Financing Activities because the prospective lenders will require the reserve fund as a security.
Production and maintenance expensesThe production and maintenance expenses usually include water supply, pumping, water treatment, and transmission/distribution expenses. These expenses are computed by dividing actual cost with total water production. To project for these expenses, the analyst will multiply the unit cost with the volume of water production. The unit cost per expense item is assumed to have an annual escalation rate based on historical trend and projected infl ation rate.
RCWD’s unit costs (Appendix 4) are the following: water supply at 0.39, pumping at 3.40, water treatment at 0.19, and transmission/distribution expenses at 1.60. The analyst should discuss with the RCWD fi nance offi cer the reason for the reduction in pumping cost by 10 percent as early as 2008 when the project is expected to be operational only towards the last quarter of 2009.
Administrative and customer expensesAdministrative and customer expenses include salaries and wages, provision for bad accounts, and depreciation. These are projected based on historical data and proposed projects.
In the case of depreciation expense, COA Circular No. 2003-007 prescribes the computation of depreciation of assets for government institutions. The depreciation rate
is computed by setting aside 10 percent residual value of an asset while the remaining 90 percent is divided by the estimated useful life of the asset. The following are the usual project assets for fi nancing with their respective estimated useful life: a) offi ce building and other concrete structures, such as pumping stations and reservoir - 30 years; b) machineries and equipment like pumping/production/water treatment equipment - 10 years; c) offi ce and IT equipment - 5 years; and d) motor vehicles - 7 years.
For RCWD, the case shows that historical growth rates for salaries and wages were at 7.2 percent, and provision for bad accounts were at 4 percent. However, the projected escalation rates were erratic and required explanation, especially those in 2010, when salaries and wages increased by 33 percent as against much lower rates in previous years.
Finance chargesInterest rates and guarantee fees are the usual fi nance charges seen on a WD’s income statement. Most private fi nancial institutions waive the gross receipt tax (GRT) on interest on loans, processing fees and commitment fees. However, some government fi nancial institutions charge GRT, processing and commitment fees for WD loan transactions. All these fi nance charges must be considered in the fi nancial projection.
Corporate income tax and franchise taxA BIR ruling requiring WDs to pay a 32 percent corporate income tax is still being questioned by the WDs, but certainly they are subject to a franchise tax of 2 percent of total gross receipts. A few WDs however do not pay the franchise tax.
For prudence, the analyst should provide for both corporate income and franchise taxes in formulating the fi nancial model. For more information on the issues on corporate and income taxes, refer to BIR Revenue Memorandum Circular No. 63-2003 and DOJ Opinion Case No. OSJ-2005-03.
Financial ratiosOnce the above critical assumptions are covered, the fi nancial analyst can set up the income statement, cash fl ow and balance sheet, and use these to estimate indicative thresholds for fi nancial indicators.
While the following fi nancial ratios are good indicators of the past fi nancial performance of a borrower, the analyst must remember that ratio analysis is a retrospective and not prospective examination. This is precisely the reason why, in the discussion of critical assumptions, there is a reiteration on the need to consider the potential impacts of

50 Chapter 6: Project appraisal
Water Supply Project Appraisal Guidebook for Investors and Decision Makers
the proposed projects as well as the management strategies to improve operating and fi nancial performance.
Debt service coverage ratioThe debt service coverage ratio (DSCR) indicates how many times over cash fl ow from operations covers the WD’s obligations. It is calculated by dividing the EBITDA (earnings before interest, tax, depreciation and amortization) by the annual debt amortization. Based on the profi le of WDs evaluated by LGUGC and partner fi nancial institutions, the DSCR averaged 7.2 from a range of 1.2 to 47.9.
Retawon’s DSCR was computed at 2.0 in 2007 while projected DSCR until 2017 is expected to average 2.5 which is considered acceptable.
Debt to equity ratio (total liabilities / total equity)The debt to equity ratio measures solvency. It is a fi nancial ratio that indicates the percentage of a company’s assets provided by debt, and is calculated by dividing the WSP’s total liabilities by its total equity. For water districts, one must not expect low leverage ratios because most WDs borrow to undertake major capital expenditures. The average debt to equity ratio of WDs subjected to evaluation by LGUGC is at 1.6 from a low of 0.1 to a high of 5.1.
The debt to equity ratio of RCWD was at 0.3 in 2007. The projected debt to equity ratio for the duration of the loan shall average 0.6, well within the usual cap of 1.0.
Current ratioThe current ratio compares a fi rm’s current assets to its current liabilities. It measures whether or not a company has enough resources to pay its debts over the next 12 months. Meeting the ideal current ratio is usually not a problem for WDs because they collect revenues on a monthly basis. The current ratio of the 15 sample WDs averaged 2.5 which means they are generally considered to have good short term fi nancial strength.
RCWD posted a current ratio of 6.0 in 2007 while the projected current ratio will range from 6.4 to 30.5, for an average of 16.1.
Net profi t marginThe net profi t margin refl ects an entity’s pricing policies and its ability to control costs, and measures the WSP’s ability to sustain operations and invest in new projects. Net profi t margin is calculated by dividing net income by total revenue. Differences in competitive strategy and even payment of taxes cause the profi t margin to vary among different water utilities. The net profi t margin of previously evaluated WDs averaged 12 percent.
In the case study, the average net profi t margin of RCWD was projected at 14 percent, much higher than the 2007 record of 1 percent.
Return on equity (net income / total net worth)Return on equity (ROE) is considered one of the most important fi nancial ratios. It measures an entity’s effi ciency at generating profi ts from every peso of net assets, and is calculated by dividing net income by total net worth. In the case of WDs, the business is very capital-intensive, requiring large capital investments before profi t can be generated. The average ROE of 15 WDs evaluated by LGUGC was 16 percent.
The ROE for RCWD in 2007 was at 1 percent and is projected to gradually increase from 9 percent in 2009 to 15 percent in 2017.
51Chapter 1: An overview of the Philippine water supply sector
Water Supply Project Appraisal Guidebook for Investors and Decision Makers
III. LOAN APPLICATION, APPROVAL, AND IMPLEMENTATION

52 Chapter 7: Loan application and approval
Water Supply Project Appraisal Guidebook for Investors and Decision Makers
Chapter 7. Loan application and approval
Project development cycle*
The document requirements for loan applications (Figure 8) from water districts and local government-managed water systems should enable loan offi cers to assess the creditworthiness of the institution and the project. Should the loan application be approved, many of these documents, either in their initial or updated forms, can be used during the loan disbursement (project construction) and loan account monitoring (loan repayment) stages.
The usual loan application requirements from water districts and LGUs are outlined in Table 19. This checklist is merely illustrative as lending to the water supply sector is highly context-specifi c and the loan offi cer must tailor such checklists to the specifi c requirements of the program.
* Source: NEDA, Reference Manual on Project Development and Evaluation
Figure 8. Process fl ow for a loan account

53Chapter 7: Loan application and approval
Water Supply Project Appraisal Guidebook for Investors and Decision Makers
Table 19. Checklist of loan application requirementsRequired documents Water districts LGUsTo assess the personality of the borrower
Accomplished loan application form � �Bio-data of the offi cial signatories � �List of key offi cials including Board of Directors �List of key LGU offi cials �Water district board resolution:• Authorizing the general manager to negotiate and sign the loan documents• Committing to provide equity (if applicable)• Committing to secure needed permits and acquire needed site and right of way
�
Sanggunian resolution:• Endorsing the project• Authorizing the LGU chief executive and the LGU treasurer to negotiate and sign the loan documents • Committing to provide equity (if applicable)• Approving the IRA assignment or assignment/mortgage of other assets
�
Latest three-year COA-audited fi nancial statements � �Interim fi nancial statements � �Certifi cate of Borrowing Capacity and Debt Service Capacity issued by the DOF-BLGF �Certifi cate of Indebtedness signed by the Water District/ LGU Treasurer and/or Accountant, including copies of existing loan agreements with debt service schedulesList of outstanding loan balances with other fi nancial institutions, duly certifi edList of Bank accounts especially Joint Accounts with LWUA, reserve funds, etc.
� �
Regular documentary requirements pertaining to offered collaterals such as Transfer Certifi cate Title, tax declaration, vicinity map and lot plan
� �
Clearance/endorsement from LWUA �Certifi cate of Conformance or Conditional Certifi cate of Conformance issued by LWUA �Additional documents required if lender is a PFI:WD Board Resolution on opening a deposit account with the PFIClearance from DOF-BLGF allowing the WD to open an account with the PFI
�
To assess project viability
Feasibility study with:• Development plan and program of work• Detailed project cost estimates• Initial environmental examination or environmental impact statement• Willingness-to-connect-and-pay survey
� �
Monthly data sheet, if applicable �
Lenders must be aware that political dynamics play a crucial role in securing local legislative council (Sangguniang Bayan, Sangguniang Panlungsod, or Sangguniang Panlalawigan) resolutions in the case of LGU-managed water systems. Moreover, since all LGU-run water utilities are not ring-fenced and do not have adequate cost recovery mechanisms, loans to these LGUs will be repaid from general revenues.
GFIs can require LGUs to assign a portion of their IRA for debt servicing and collateral. PFIs can also ask the LGU to sign a deed of assignment of IRA. However, since PFIs are, in general, not authorized depository banks of LGUs, the IRA deposits are not physically with the PFIs.20
20 LGUs cannot use private banks as depository banks without a waiver from the BSP. PFIs may resort to a tripartite agreement with the LGU and GFI on the issue of assigning and IRA deposits.

54 Chapter 7: Loan application and approval
Water Supply Project Appraisal Guidebook for Investors and Decision Makers
The lender should ensure that the LGU borrower submits a certifi cation from the DOF-BLGF of the LGU’s borrowing and debt service capacity. As of 2008, the BLGF requires LGUs to submit the following documents when requesting for such certifi cation:
• Letter from the local chief executive indicating the name of the lending institution and the purpose of the loan
• Copies of detailed income and expenditure statements with pre-closing trial balance for the last three years certifi ed and audited by the local accountant and auditor
• Current year’s annual budget• Annual investment plan for the LGU’s 20 percent
development fund• Updated certifi cation of the total outstanding
balance of existing loans duly certifi ed by the local treasurer and lending institutions
• Updated statement of annual amortization schedule duly certifi ed by the local treasurer and concerned lending institutions
In the case of water districts, political dynamics also play a role in securing WD board resolutions because the mayor or governor is the appointing authority for the directors. Due diligence requirements should include a Certifi cate of indebtedness signed by the water district treasurer and/or accountant, including copies of existing loan agreements with debt service schedules, and audited fi nancial statements for the past three years, and interim fi nancial statements.
As the primary lending institution to WDs, LWUA requires WDs to secure a clearance or endorsement from it whenever a WD seeks loans from other lending institutions. This is designed to protect LWUA’s exposure to the WD. LWUA also requires WDs to secure a waiver if a lending institution insists on being treated equally
with LWUA in the event of default. It also requires the WD to pay pre-termination fees if the PFI loan is to refi nance an existing LWUA loan. A water district-loan applicant must also present a LWUA-issued Certifi cate of Conformance or Conditional Certifi cate of Conformance which certifi es that the WD is in compliance with existing standards on water quality, facility design and construction, materials, equipment and supplies selection, operations and maintenance procedures, and training of personnel. Unfortunately, no institution issues a similar certifi cate to LGU-managed water systems and lenders should hire engineers who can evaluate the conformance of these systems to established water supply standards.
Evidence of project viability can usually be distilled from the feasibility study. Special attention should be accorded to the willingness-to-connect-and-pay surveys. Such surveys are crucial because the failure to determine the willingness of households to pay for potable water can lead to inaccurate demand estimates and network capacity design. To facilitate the assessment of the viability of the project and to have some baseline data for loan account monitoring, lenders may also require the loan applicants with existing LWUA loans to submit copies of the LWUA-designed Monthly Data Sheet (MDS). These data sheets are usually prepared by the WD’s fi nance department head and signed by the general manager. However, there is no consistent validation or audit of these monthly data sheets. In order to have some confi dence on the validity or accuracy of the interim MDS, these sheets are compared with the audited fi nancial statements of the past three years.
As part of the loan application process, lenders are encouraged to document meetings with the borrower and conduct site visits to ensure that all the loan application requirements are in order. It also helps for banks to have a manual of procedures for evaluating the submitted documents and the protocols for site visits.

55Chapter 8: Loan implementation
Water Supply Project Appraisal Guidebook for Investors and Decision Makers
Chapter 8. Loan implementation
Project development cycle*
* Source: NEDA, Reference Manual on Project Development and Evaluation
Procurement A water service provider will inevitably carry out procurement to implement a water supply development project. Looking at the project development cycle, the WSPs may need to procure (1) consultants and associated services for pre-investment studies and detailed design services, (2) goods and infrastructure (through a contractor) for the construction of water supply facilities, and (3) supplies and materials for the operations of the constructed system.
All publicly-owned WSPs must follow the procurement rules described in the Government Procurement Reform Act (RA 9184) and its implementing rules and regulations (IRR). Box 7 summarizes the key principles of RA 9184. Its implementing rules cover government procurement activities, with the following exceptions/conditions:
• Acquisition of real property shall be covered by the Act to Facilitate the Acquisition of Right-of-Way Site or Location for National government Infrastructure Projects and for other Purposes (RA 8974).
• Private sector infrastructure or development projects shall be covered by the Act Authorizing the Financing, Construction, Operation and
Box 7. Guiding principles of RA 9184
The following are key guiding principles for procurements managed by WDs or LGU-operated utilities:
• Transparency in the procurement process and in the implementation of procurement contracts.
• Competitiveness by extending equal opportunity to eligible and qualifi ed companies.
• Streamlined procurement process.• Accountability of public offi cials directly or indirectly
involved in the procurement process and implementation of procurement contracts and the private parties awarded contracts.
• Public monitoring of the procurement process and the implementation of awarded contracts.
Maintenance of Infrastructure Projects by the Private Sector, and for Other Purposes (RA 7718). However, for specifi c components fi nanced by the government, the provisions of RA 9184 and its implementing rules shall apply.
• Procurement provisions of a treaty, international or executive agreement common to foreign-funded projects shall be observed.
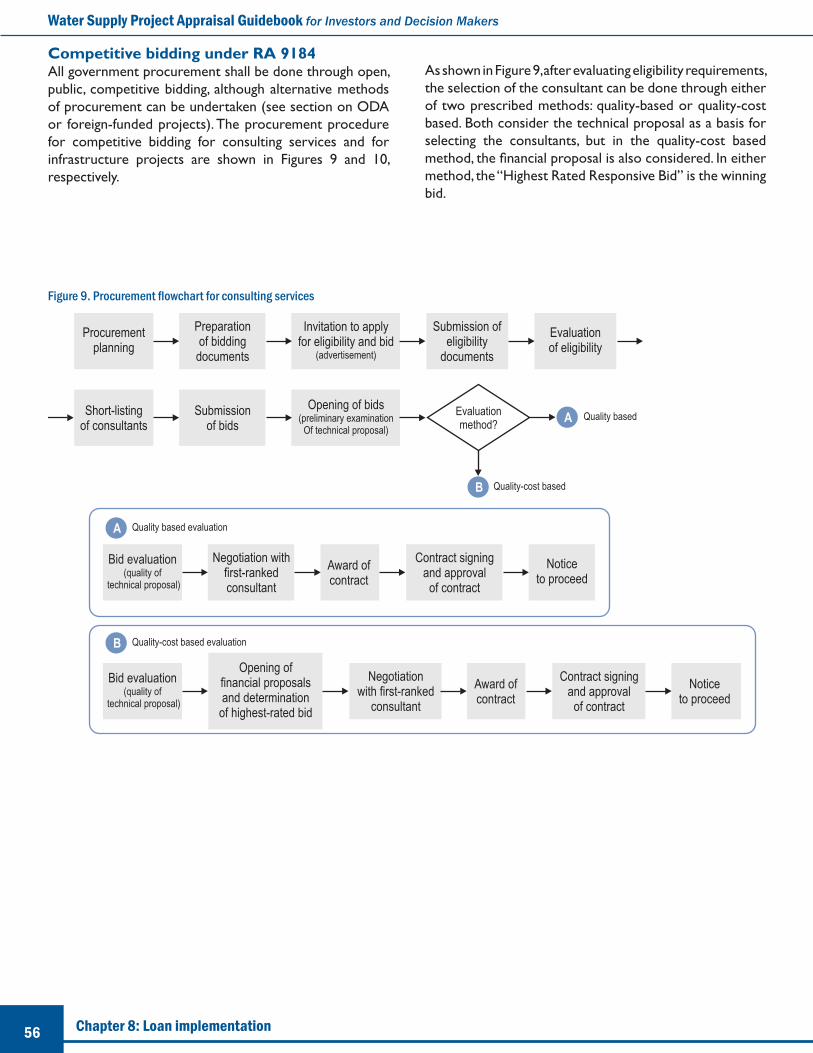
56 Chapter 8: Loan implementation
Water Supply Project Appraisal Guidebook for Investors and Decision Makers
Competitive bidding under RA 9184All government procurement shall be done through open, public, competitive bidding, although alternative methods of procurement can be undertaken (see section on ODA or foreign-funded projects). The procurement procedure for competitive bidding for consulting services and for infrastructure projects are shown in Figures 9 and 10, respectively.
As shown in Figure 9, after evaluating eligibility requirements, the selection of the consultant can be done through either of two prescribed methods: quality-based or quality-cost based. Both consider the technical proposal as a basis for selecting the consultants, but in the quality-cost based method, the fi nancial proposal is also considered. In either method, the “Highest Rated Responsive Bid” is the winning bid.
Figure 9. Procurement fl owchart for consulting services

57Chapter 8: Loan implementation
Water Supply Project Appraisal Guidebook for Investors and Decision Makers
For infrastructure projects, the bidder with the lowest bid is awarded the contract, as long as it meets the minimum required eligibility and technical requirements. The lowest calculated responsive bid is considered the winning bid.
Figure 10. Procurement fl owcharts for infrastructure projects
Key rules for competitive biddingThe more important points of RA 9184 for competitive bidding are as follows:
• Each procuring entity will have a Bids and Awards Committee (BAC) which will undertake the principal procurement activities, including the pre-procurement and pre-bid conferences, evaluate eligibility of bidders, evaluate the bids, resolve motions for reconsideration, and recommend awards of contract. For WDs, the head of the procuring entity shall designate the Chairman and Vice-Chairman of the BAC. For LGUs, the local chief executive shall designate the members of the BAC, who shall elect among themselves the Chairman and Vice-Chairman. The head of the procuring entity is prohibited from being the Chairman or member of the BAC. The BAC is supported by a secretariat.
• The bidding documents shall include the following:• Approved budget for contract • Eligibility requirements• Instruction to bidders• Terms of reference for consulting services• Scope of work (where applicable)
• Plans and technical specifi cations• Form of bid, price form, and list of goods or bill of
quantities• Delivery time or completion schedule• Form, amount and validity period of bid security• Form and amount of performance security and
warranty• Form of contract, and general and special
conditions of contract
• Except for small procurements (Sec 20.2 of the IRR), a pre-procurement conference is held among the BAC, the BAC secretariat, offi cials, staff and consultants of the procuring entity who are directly involved in the project.
• No bidding shall be made without the necessary detailed engineering investigations, surveys, and designs.
• For contracts above P1 million, the BAC shall hold a pre-procurement conference to clarify or explain to the bidders the requirements, terms and conditions, and specifi cations stipulated in the bidding documents.
Ceiling for bid prices. The approved budget for contract shall determine the ceiling price for bids. If the bid is higher than the approved budget, the bidder is automatically disqualifi ed. There is no lower limit for the bids.

58 Chapter 8: Loan implementation
Water Supply Project Appraisal Guidebook for Investors and Decision Makers
Evaluation of technical proposals • For infrastructure projects, evaluation involves checking
the bidders’ submissions on (1) legal requirements, (2) technical requirements (competence and experience, personnel to be assigned, and equipment to be used), and (3) fi nancial requirements (credit lines, cash fl ow, etc.). The submissions are evaluated on a “pass or fail” basis, and a bid is considered responsive if it passes all the criteria.
• For consulting services, evaluation of the technical proposal is based on (1) suitability, qualifi cations and competence of proposed key staff, (2) experience and capability of the consultant/consulting fi rm, and (3) approach and methodology to meet the terms of reference. Instead of a “pass or fail” evaluation, numerical ratings are given to each of the submitted technical proposal. The ratings will then be the basis for selecting the consultant.
Failure of bidding. The bidding is considered a failure if:• No prospective bidder submits a letter of intent or no
bids are received• All prospective bidders are declared ineligible• All bids fail to comply with the bid requirements or fail
post-qualifi cation, or in the case of consulting services, there is no successful negotiation
• The winning bidder refuses, without justifi able cause, to accept the award of contract, and no award is made
Should there be a second failure of bidding, the procuring entity concerned may enter into a negotiated contract.
Exceptions to competitive bidding Alternative methods of procurement can be undertaken by the procuring entity (Rule 16 of the IRR), as follows:
Limited source bidding. This is for goods and services where only a few suppliers or consultants are known to be available. Direct invitations are sent to pre-selected suppliers or consultants with proven experience and capability.
Direct contracting or single-source contracting. Recommended for the procurement of (1) proprietary items or (2) critical goods from a specifi c manufacturer, supplier and it is necessary to hold a contractor to guarantee its project performance, or (3) goods sold by an exclusive supplier for which no suitable replacement can be obtained.
Repeat order. This involves procurement of goods from the previous winning bidder. The order should be availed within six (6) months from the original contract, and should not exceed 25 percent of the original quantity.
Shopping. This involves submission of price quotations from qualifi ed suppliers for readily available off-the-shelf goods or ordinary equipment for purchases not exceeding P50,000.
Negotiated procurement. Procurement where a contract is negotiated with a qualifi ed supplier, contractor, or consultant, and resorted to when:
• there has been a failure of public bidding• there is imminent danger to life and property• contracts are taken-over for causes provided
in the contract, and where immediate action is necessary
• purchases are made from another agency of government
• individual consultants are hired to do highly technical, proprietary, or confi dential work
ODA or foreign-funded projectsInternational or executive agreements covering ODA or foreign-funded projects stipulate the applicable procurement procedures which take precedence over RA 9184 IRR, especially when there are confl icts.
In many cases, especially in projects funded by WB, ADB and JBIC, the procurement process stipulated by RA 9184 and the IRR (see Figures 7 and 8) is generally consistent with the requirements of these fi nancing institutions. The difference lies mainly in:
• Eligibility requirements, particularly where international competitive bidding is required; preference for Filipino consultants or contractors is not allowed
• Ceiling bid prices, where setting of ceiling (or fl oor) bid prices is not allowed; the approved budget for contract is not declared to bidders or included in the bid documents
• Eligibility and bid evaluation, and contract award; For these matters, concurrences from the fi nancing institutions are usually secured

59Chapter 8: Loan implementation
Water Supply Project Appraisal Guidebook for Investors and Decision Makers
Box 8. What is monitoring?
� A continuous process of assessing progress of project implementation based on certain established guidelines and benchmarks
� Identifi es the status of a project at any given time (and over time) relative to respective targets and outcomes
� Measures progress against objectives, indicators and assumptions
� Measures actual expenditures against the planned budget
� Identifi es problems and potential solutions during implementation
Why monitor projectsSystematic monitoring helps manage associated risks22 in project implementation and ensures achievement of outputs of the project being fi nanced. It is conducted to:
Project monitoring and supervisionThe growing emphasis on demonstrating performance rather than simply producing output from a project underscores the importance of monitoring. This section explains the need to monitor water supply projects and provides some guidelines on monitoring.
Monitoring21 is an essential component of project management and loan supervision (see Box 8). It is an internal management function that involves gathering and use of information to track project implementation. Monitoring provides essential information to guide lenders, managers, implementing units and the benefi ciaries in assessing and improving project performance and achieving desired results.
21 Monitoring is part of supervision which connotes a more active involvement in project implementation. Project supervision involves overseeing the project to ensure that planned activities or tasks are carried out and performed correctly. Generally, supervision includes risk assessment and management, monitoring, evaluative review, reporting, and technical assistance activities. Supervision during construction implementation is usually done by the construction or works engineer for the borrower. For lending institutions, supervision of water projects connotes ensuring that the proceeds of any loan are used only for the purposes for which the loan was granted, with due regard to economy and effi ciency. Thus, lending institutions supervise the borrower’s implementation of a fi nanced project, recognizing that project implementation remains as the borrower’s responsibility.
22 Implementation risks include adverse changes in economic factors; incorrect assumptions regarding project logic or sustainability considerations; dissatisfaction on the part of target benefi ciaries; breach of legal or contractual responsibility or failure to meet obligations to the project by the borrower or contractor; fraud and defi ciencies in fi nancial controls and reporting; and mismanagement. During project implementation, both the lending institution and borrower should update and refi ne their risk assessment strategies and formulate a risk management plan. When contingencies arise, risk management strategies should be implemented.
• Track progress indicators towards achieving the desired project objectives and targets
• Identify actual or potential problems as early as possible to facilitate timely adjustments in project implementation
• Check for accountability for project implementation• Identify needed project changes and ensure optimum
use of resources• Reinforce results/ impact-oriented project
management

60 Chapter 8: Loan implementation
Water Supply Project Appraisal Guidebook for Investors and Decision Makers
In particular, monitoring is a tool for...
...the lending institution toa) Determine whether the borrower is carrying out the project with due
diligence in conformity with the loan agreement and other legal documents
b) Check for accountability for project implementationc) Ensure that fi nancial targets are met in consonance with physical
targetsd) Recommend changes in project concept or design, as appropriatee) Identify risks to project sustainability and recommend appropriate
risk management strategies and actions to the borrower.
...the borrower23 toa) Ensure the works are done in accordance with approved design and
specifi cations within a planned timeframe during construction stageb) Safeguard the quality of construction, oversee the safety of
the works, and ensure that mitigation measures for adverse environmental impacts are put in place
c) Verify contractor performance and completion of works; d) Ensure that the water supply system is functional and meets
operational and fi nancial targets and performance standards; ande) Identify problems arising during implementation and ways to
resolve them in a timely manner.
23The borrower refers to a water district, an LGU or private entity implementing a construction, expansion or rehabilitation of a water supply system. The borrower can set up a project management offi ce (PMO) or a project implementing unit (PIU) which directly implements the project.
What monitoring involvesMonitoring involves assessment of progress of implementation at each stage or activity of the project (see Figure 11). The implementation of a water supply project involves four major stages/activities as enumerated below. Lending activities are linked with project activities if fi nanced by a loan.
• Procurement involves the acquisition of goods, consulting services, and contracting for infrastructure projects by the procuring entity. In case of projects involving mixed procurements, the nature of the procurement, i.e., goods, infrastructure projects, or consulting services, shall be determined based on the primary purpose of the contract. For water supply projects, procurement includes materials or services for water service connection materials/fi ttings, well drilling and construction services, water and waste water treatment supply and disposal. Procurement is done by the water district, LGU or private utility undertaking the water supply project.
• Construction supervision involves coordination of construction activities to ensure that the works are undertaken in accordance with design and specifi cation, safeguard the quality of construction and oversee the safety of the works. Construction supervision is done by a construction supervision consultant, project or works engineer usually contracted under the project by the water district, LGU or private utility.
• Turn over. After a complete test run and completion of all works, the water supply system or facility is formally handed by the contractor to the borrowing entity (a water district, LGU or private utility). A certifi cate of completion and borrower’s fi nal acceptance are prepared by the borrower. These are usually required by the lending institution prior to release of the fi nal loan tranche/progress billing.
• Actual operation is the management of operations of the water supply system after construction has been completed. The operations include provision of water/service connection, billing and collection, water quality testing and systems maintenance and monitoring.

61Chapter 8: Loan implementation
Water Supply Project Appraisal Guidebook for Investors and Decision Makers
Both the borrower and the lending institution should monitor activities at all stages of project implementation. Table 20 identifi es the key activities to be monitored during each stage, the documents used to monitor progress, and the unit responsible for carrying out the monitoring. Progress of activities are assessed or verifi ed against
24A project proposal or business plan is prepared as a requirement for loan/funding. These documents describe the physical and fi nancial aspects of the project including physical targets, indicators of viability, and outcome or results to be achieved by the project.
25The DED is a detailed review of the project’s feasibility study or preliminary engineering study. If in the course of this exercise it is found that changes would be needed in the design standards of principal features, as proposed, specifi c recommendations are supported by detailed justifi cations including their effects on the cost. A schedule of detailed engineering activities is then prepared including survey, site investigation, construction materials investigation, preparation of technical specifi cations, design plans, quantity, and cost estimates based on the review.
26The program of works is based on the project’s feasibility study/business proposal and DED and indicates the basic works or facilities to be done and the actual corresponding costs.
targets and technical or performance standards contained in project documents such as the project proposal/feasibility study/business plan,24 detailed engineering design (DED),25 program of works (POW)26 and implementation schedule.
Figure 11. Stages/activities of a water supply project

62 Chapter 8: Loan implementation
Water Supply Project Appraisal Guidebook for Investors and Decision Makers
Table 20: Activities to monitor in a water supply project
Stage/activityWhat are monitored Relevant documents used
for verifi cationResponsible unit
Physical Financial Borrower LenderProcurement Timing of acquisition,
specifi cations and quantity & quality of materials
Cost of materials, loan disbursements27
DED, POW, contractors’ & suppliers’ quotations
WD, LGU or private entity through its Bids and Awards Committee
Loan account offi cer28
Construction implementation & supervision
Timing , cost & quality of works
Expenditures, loan disbursements
DED, POW & implementation schedule, progress billing, loan schedule,other documents (sales invoice, delivery receipt, consultant/engineer’s report, variation or change order as applicable)
Project Mgt Offi ce (PMO)/Project Implementing Unit (PIU) of the WD, LGU or private entity; construction supervision consultant or a project or works engineer; contractor
In-house or contracted engineer29; construction supervision consultant or loan account offi cer (if lender has no in-house engineer or consultant)
Turn over Timing, test run, completion and quality of works
Expenditures, fi nal loan release
Post-project completion report, certifi cate of completion, borrower’s fi nal acceptance, progress billing, other documents
-ditto- -ditto-
Actual operation Service connections, water production (production volume & losses, availability of water per day, system pressure); & water use (water sales, average consumption, billed and unbilled water, leakages, non-revenue water)
Sales, collections, operating expenses, cash fl ow, status of loan and loan payments, tariff increases, other fi nancial indicators
Audited interim and annual fi nancial statements, monthly operations reports such as the monthly data sheet of water districts, loan amortization schedule
PMO/PIU of the WD, LGU or private entity
Loan account offi cer
27Verifi cation of progress billing through site inspection of works prior to release of every loan tranche should be done.
28Loan account offi cers of lending institutions may sit as observers during the bidding process for monitoring purposes with the concurrence of the procuring entity.
29Normally, foreign-funded lending programs being administered by banks have their own construction or works consultants; otherwise, banks usually use the reports prepared by the project engineer hired by the borrowers to verify and monitor project loans.
To facilitate monitoring, both the lending institution and the borrower should have a common simple table or bar-chart summarizing important implementation schedules, in comparison with agreed plans and targets. This should
include not only procurement and civil works but also loan disbursements and other project activities. Any major deviation from the agreed schedule should be analyzed and addressed by the responsible units.

63Chapter 8: Loan implementation
Water Supply Project Appraisal Guidebook for Investors and Decision Makers
When the project or water system is already operational, the PMO/PIU or the water utility staff and lending institution may agree on certain performance indicators to assess project functionality, effi ciency, effectiveness, and sustainability. Ideally, a regulatory body should impose and monitor compliance to these performance standards. Currently, LWUA uses selected performance indicators for water districts based on technical and health standards and industry averages. Some suggested performance indicators for water supply services are found in Table 21.
Monitoring reports Reports on monitoring activities are prepared by the concerned responsible units. Common project report formats should be agreed upon and understood by both borrower and lender. For lending institutions, the account offi cer prepares the project report on fi nancial disbursements and physical progress (the latter based on the construction supervisor or works engineer’s report) and the portfolio management report (on group
Table 21: Suggested performance indicators
Area of performance
Defi nition Key indicators
Functionality of the system
Measures the quantity (and quality) of water services
- number of connections established- number of communities, population or households serviced- compliance with safe water and environmental standards- availability of water per day- increased system pressure
Effi ciency Measures the extent to which resources are appropriately used and recovered
- number of connections/total cost- non revenue water - production capacity utilized- collection effi ciency - operating ratio
Effectiveness Measures the degree to which services affect outcomes and impacts
- % coverage area- decline in waterborne diseases- decline in morbidity or morality rate
Sustainability Indicates how the services can be maintained and supported by the project’s operations
- increased reliability of services (days of continuous service & decrease in number of breakdowns)- customer satisfaction
of accounts) based on their reporting periods. Field reports are prepared by the construction supervisor or the project works engineer on a monthly basis. Financial performance is refl ected in the fi nancial statements prepared by the project’s PMO. For water districts, the monthly data sheet (MDS)31 is prepared by the PMO/PIU containing the following data: service connection, water rates, billing and collection data, fi nancial data, status of loan and project construction activities, and institutional-related information.
Monitoring structure and reporting fl ow Loan monitoring is done by an assigned loan account offi cer.32 Reports are submitted by the loan account offi cer to the loan review or project monitoring board which recommends appropriate risk management actions to the borrower as needed (Figure 12). On the part of the borrower, the construction supervision or project or works engineer during construction stage and the PMO/PIU (water utility staff) are involved in physical and fi nancial monitoring and supervision of the project.
31The MDS is used by the fi nancial institutions (LGUGC, DBP and LBP) as a requirement for loan approval for refi nanced loans or projects and as a basis for monitoring project performance. The MDS, prepared by the PMO of the water district, may need to be verifi ed by the lending institution as part of its monitoring activity.
32 “Loan account offi cer” is a generic term used by lending institutions to refer to staff whose functions may vary from loan soliciting, processing (credit evaluation or appraisal, approval, documentation and release), and monitoring and evaluation. Depending on the organizational structure of the lending institution, these functions may be performed by just one account offi cer or several from different units. Usually, loan monitoring is done by loan account offi cers from the loan administration/operations or monitoring unit.

64 Chapter 8: Loan implementation
Water Supply Project Appraisal Guidebook for Investors and Decision Makers
Reports are submitted to the water utility board or the general manager which recommend mitigating measures for substandard or poor performance of works or operations of the water system. Both structures should work in a parallel manner but not independently of each other to ensure the successful operation of the water supply project. A project monitoring board/committee composed of designated bank offi cers, account offi cer, the general manager, and project or works engineer, or other concerned entity should be formed to coordinate and review project planning, supervision, monitoring, and reporting activities.33 It is recommended that the board or committee meet every quarter during the construction or implementation stage and at least every semester for completed and/or operational projects.
33 LGUGC convenes a project monitoring board during the effectivity of the guarantee agreement to monitor project implementation and advise on policy matters.
34 LWUA charges one percent monitoring fee and four percent supervision fees from total project cost. DBP charges fi ve percent monitoring and supervision fee. LBP charges six percent of total loan for monitoring & supervision and deducts P1,000 inspection fee per visit from project loan releases to verify progress billing requests. LGUGC tucks in monitoring costs in the pricing of guarantee fee.
Funds for monitoring It is important that the required resources for monitoring be integrated in the regular operations of the borrower and the lending institution to sustain the conduct of these activities. Sources of funds for monitoring may vary. Normally, monitoring activities are included as overhead cost of lending institutions and the water utilities when the system is already operational. For new or ongoing projects fi nanced by loans, monitoring (and supervision) fees are included in the total project package or tucked in the pricing of fees for fi nanced loans.34
Figure 12. Monitoring structure/s and reporting fl ow

65Appendices
Water Supply Project Appraisal Guidebook for Investors and Decision Makers
APPENDICES

66 Appendices
Water Supply Project Appraisal Guidebook for Investors and Decision Makers
Appe
ndix
1. LW
UA S
urve
y Res
ults
: Wat
er D
istric
t Per
form
ance
Indi
cato
rs In
dust
ry A
vera
ge (2
006)
SMAL
LAV
ERAG
EM
EDIU
MBI
GLA
RGE
VERY
LARG
EOV
ER A
LLPR
OFITA
BILIT
Y
1Ne
t Inc
ome /
Ope
ratin
g Rev
enue
s%
6 14
9
15
10
23
10
2In
tere
st Ex
pens
e / O
pera
ting R
even
ues
%15
13
16
7
14
8 13
3
Inte
rnal
Cas
h Rat
io%
31
37
35
31
35
40
33
4De
bt S
ervic
e Rat
io%
250
375
371
818
404
840
420
5De
bt S
ervic
e P
1,31
7,60
1 2,
405,
084
6,65
2,98
4 7,
107,
231
29,3
22,4
51
48,3
64,0
37
6,71
9,85
3 6
Net I
ncom
e / N
et U
PIS
%3
12
10
11
9 21
8
7Re
turn
on Fi
xed
Asse
ts%
2 9
5 11
6
16
6 8
Net I
ncom
e / M
onth
P31
,714
22
0,74
2 18
5,48
0 90
8,38
4 1,
302,
091
9,28
1,06
2 67
1,78
9
COST
CON
TROL
1Op
erat
ing R
atio
%75
69
78
78
77
78
76
2
Oper
atin
g Exp
ense
/ M
onth
P32
8,87
3 70
8,22
4 1,
901,
719
4,52
7,33
2 12
,303
,357
45
,169
,638
3,
434,
165
3Op
erat
ing E
xpen
se /
Con
n / M
onth
P30
2 27
6 31
6 35
3 39
8 44
3 32
1 4
Oper
atin
g Exp
ense
/ M
3 Bi
lled
P19
16
16
15
18
15
17
5
Adm
in. &
Gen
. Exp
/ C
onn /
Mon
thP
161
137
142
110
131
145
143
6Ad
min
. & G
en. E
xp /
Ope
ratin
g Exp
%71
64
34
34
34
42
52
7
Mai
nten
ance
Exp
/ Op
erat
ing E
xpen
se%
8 11
13
10
9
16
10
8Ot
her O
pera
tions
& M
aint
enan
ce Ex
pP
1,67
1,28
2 3,
651,
489
8,20
5,08
7 18
,084
,914
55
,778
,347
59
,639
,668
11
,247
,962
MAR
KETIN
G EF
FORT
1Av
e. A
ctive
Ser
vice C
onne
ctio
nNo
.1,
305
3,02
1 6,
430
12,8
51
30,3
81
81,1
16
8,70
7 2
Oper
atin
g Rev
/ M
onth
P42
0,61
9 1,
293,
267
2,39
8,21
2 5,
913,
548
15,8
24,8
24
55,8
96,1
08
4,40
1,37
0 3
Oper
atin
g Rev
/ C
onn /
Mon
thP
349
411
395
460
510
560
402
4Op
erat
ing R
ev /
M3
Bille
dP
26
24
20
21
24
19
23
5M
3 Bi
lled
/ Co
nn /
Mon
thM
316
18
20
22
22
29
19
6
M3
Bille
d /
Mon
thM
320
,880
52
,043
13
0,12
2 29
0,68
7 71
7,71
5 2,
345,
508
203,
799
7M
onth
ly Bi
lling
per
Con
nect
ion
P32
9 39
9 37
8 44
2 49
5 58
1 38
5 8
Peso
Bill
ing p
er cu
. M. B
illed
P21
23
20
20
23
27
21
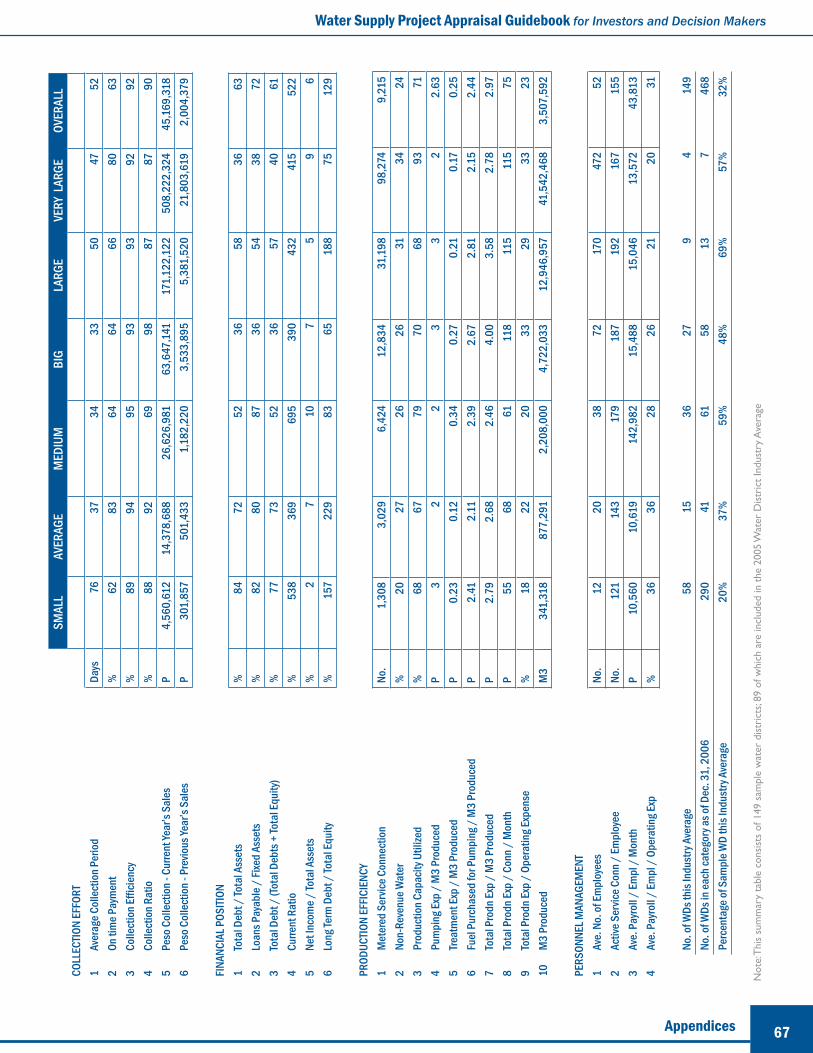
67Appendices
Water Supply Project Appraisal Guidebook for Investors and Decision Makers
SMAL
LAV
ERAG
EM
EDIU
MBI
GLA
RGE
VERY
LAR
GEOV
ERAL
LCO
LLEC
TION
EFFO
RT1
Aver
age C
olle
ctio
n Per
iod
Days
76
37
34
33
50
47
52
2On
tim
e Pay
men
t%
62
83
64
64
66
80
63
3Co
llect
ion E
ffi cie
ncy
%89
94
95
93
93
92
92
4
Colle
ctio
n Rat
io%
88
92
69
98
87
87
90
5Pe
so C
olle
ctio
n - C
urre
nt Ye
ar’s
Sale
sP
4,56
0,61
2 14
,378
,688
26
,626
,981
63
,647
,141
17
1,12
2,12
2 50
8,22
2,32
4 45
,169
,318
6
Peso
Col
lect
ion -
Pre
vious
Year
’s Sa
les
P30
1,85
7 50
1,43
3 1,
182,
220
3,53
3,89
5 5,
381,
520
21,8
03,6
19
2,00
4,37
9
FINA
NCIA
L POS
ITION
1To
tal D
ebt /
Tota
l Ass
ets
%84
72
52
36
58
36
63
2
Loan
s Pay
able
/ Fi
xed
Asse
ts%
82
80
87
36
54
38
72
3To
tal D
ebt /
(Tot
al D
ebts
+ To
tal E
quity
)%
77
73
52
36
57
40
61
4Cu
rrent
Rat
io%
538
369
695
390
432
415
522
5Ne
t Inc
ome /
Tota
l Ass
ets
%2
7 10
7
5 9
6 6
Long
Term
Deb
t / To
tal E
quity
%15
7 22
9 83
65
18
8 75
12
9
PROD
UCTIO
N EF
FICI
ENCY
1M
eter
ed S
ervic
e Con
nect
ion
No.
1,30
8 3,
029
6,42
4 12
,834
31
,198
98
,274
9,
215
2No
n-Re
venu
e Wat
er%
20
27
26
26
31
34
24
3Pr
oduc
tion C
apac
ity U
tilize
d%
68
67
79
70
68
93
71
4Pu
mpi
ng Ex
p /
M3
Prod
uced
P3
2 2
3 3
2 2.
63
5Tre
atm
ent E
xp /
M3
Prod
uced
P0.
23
0.12
0.
34
0.27
0.
21
0.17
0.
25
6Fu
el P
urch
ased
for P
umpi
ng /
M3
Prod
uced
P2.
41
2.11
2.
39
2.67
2.
81
2.15
2.
44
7To
tal P
rodn
Exp
/ M
3 Pr
oduc
edP
2.79
2.
68
2.46
4.
00
3.58
2.
78
2.97
8
Tota
l Pro
dn Ex
p /
Conn
/ M
onth
P55
68
61
11
8 11
5 11
5 75
9
Tota
l Pro
dn Ex
p /
Oper
atin
g Exp
ense
%18
22
20
33
29
33
23
10
M3
Prod
uced
M3
341,
318
877,
291
2,20
8,00
0 4,
722,
033
12,9
46,9
57
41,5
42,4
68
3,50
7,59
2
PERS
ONNE
L MAN
AGEM
ENT
1Av
e. N
o. of
Empl
oyee
sNo
. 12
20
38
72
17
0 47
2 52
2
Activ
e Ser
vice C
onn /
Empl
oyee
No.
121
143
179
187
192
167
155
3Av
e. P
ayro
ll / Em
pl /
Mon
thP
10,5
60
10,6
19
142,
982
15,4
88
15,0
46
13,5
72
43,8
13
4Av
e. P
ayro
ll / Em
pl /
Ope
ratin
g Exp
%36
36
28
26
21
20
31
No. o
f WDs
this
Indu
stry
Ave
rage
58
15
36
27
9
4 14
9 No
. of W
Ds in
each
cate
gory
as of
Dec
. 31,
200
6
290
41
61
58
13
7 46
8 Pe
rcen
tage
of S
ampl
e WD
this
Indu
stry
Ave
rage
20
%37
%59
%48
%69
%57
%32
%
Not
e: T
his
sum
mar
y ta
ble
cons
ists
of 1
49 s
ampl
e w
ater
dis
tric
ts; 8
9 of
whi
ch a
re in
clud
ed in
the
200
5 W
ater
Dis
tric
t In
dust
ry A
vera
ge
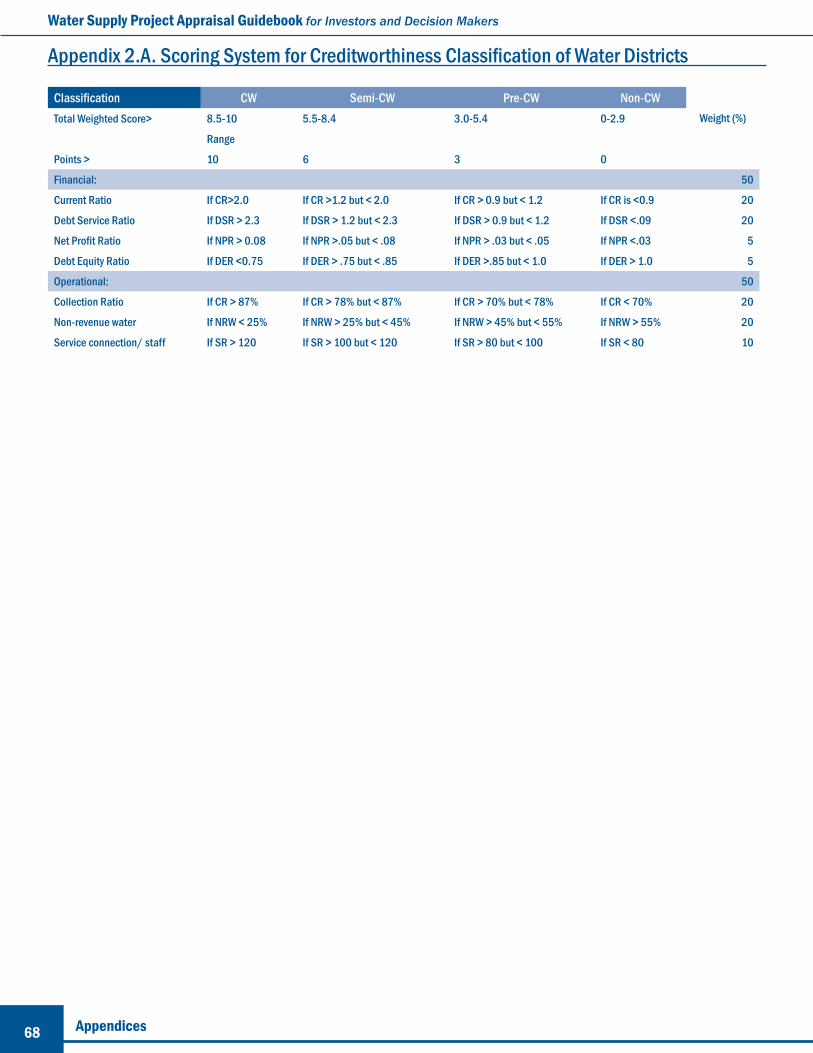
68 Appendices
Water Supply Project Appraisal Guidebook for Investors and Decision Makers
Appendix 2.A. Scoring System for Creditworthiness Classifi cation of Water Districts
Classifi cation CW Semi-CW Pre-CW Non-CWWeight (%)Total Weighted Score> 8.5-10 5.5-8.4 3.0-5.4 0-2.9
Range
Points > 10 6 3 0
Financial: 50
Current Ratio If CR>2.0 If CR >1.2 but < 2.0 If CR > 0.9 but < 1.2 If CR is <0.9 20
Debt Service Ratio If DSR > 2.3 If DSR > 1.2 but < 2.3 If DSR > 0.9 but < 1.2 If DSR <.09 20
Net Profi t Ratio If NPR > 0.08 If NPR >.05 but < .08 If NPR > .03 but < .05 If NPR <.03 5
Debt Equity Ratio If DER <0.75 If DER > .75 but < .85 If DER >.85 but < 1.0 If DER > 1.0 5
Operational: 50
Collection Ratio If CR > 87% If CR > 78% but < 87% If CR > 70% but < 78% If CR < 70% 20
Non-revenue water If NRW < 25% If NRW > 25% but < 45% If NRW > 45% but < 55% If NRW > 55% 20
Service connection/ staff If SR > 120 If SR > 100 but < 120 If SR > 80 but < 100 If SR < 80 10
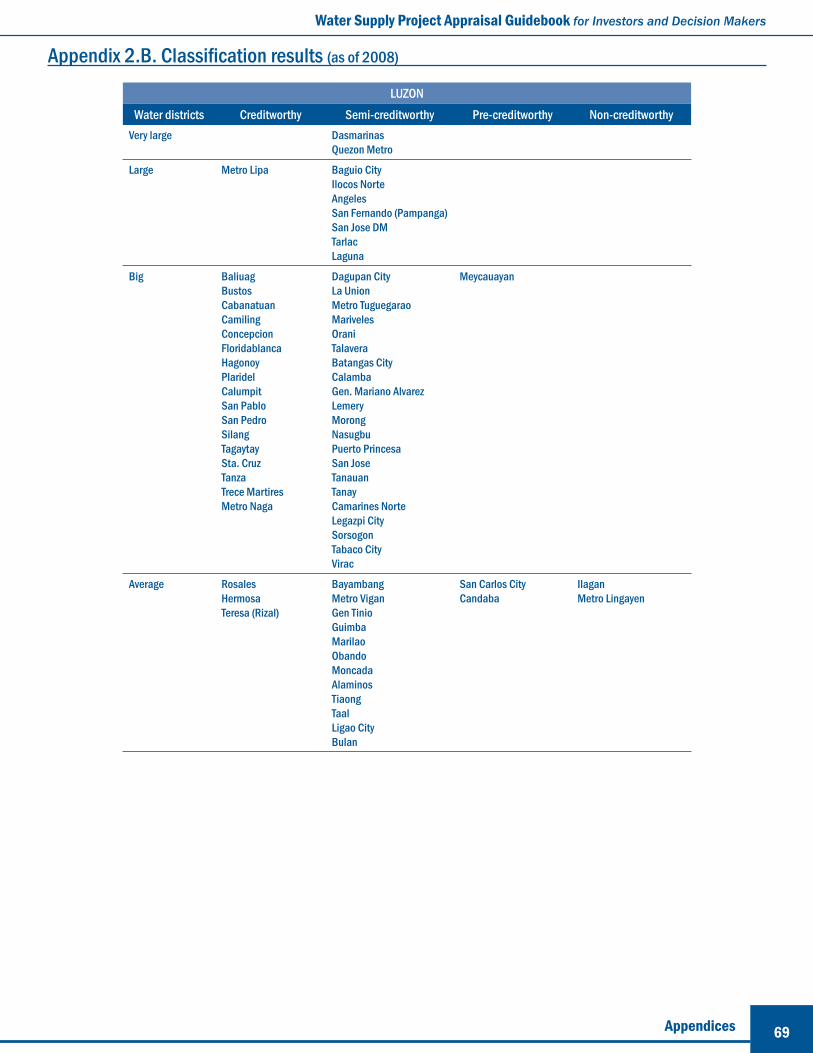
69Appendices
Water Supply Project Appraisal Guidebook for Investors and Decision Makers
LUZONWater districts Creditworthy Semi-creditworthy Pre-creditworthy Non-creditworthy
Very large DasmarinasQuezon Metro
Large Metro Lipa Baguio CityIlocos NorteAngelesSan Fernando (Pampanga)San Jose DMTarlacLaguna
Big BaliuagBustosCabanatuanCamilingConcepcionFloridablancaHagonoyPlaridelCalumpitSan PabloSan PedroSilangTagaytaySta. CruzTanzaTrece MartiresMetro Naga
Dagupan CityLa UnionMetro TuguegaraoMarivelesOraniTalaveraBatangas CityCalambaGen. Mariano AlvarezLemeryMorongNasugbuPuerto PrincesaSan JoseTanauanTanayCamarines NorteLegazpi CitySorsogonTabaco CityVirac
Meycauayan
Average RosalesHermosaTeresa (Rizal)
BayambangMetro ViganGen TinioGuimbaMarilaoObandoMoncadaAlaminosTiaongTaalLigao CityBulan
San Carlos CityCandaba
IlaganMetro Lingayen
Appendix 2.B. Classifi cation results (as of 2008)

70 Appendices
Water Supply Project Appraisal Guidebook for Investors and Decision Makers
LUZONWater districts Creditworthy Semi-creditworthy Pre-creditworthy Non-creditworthy
Small BaniSan ManuelSanchez MiraVillasisRamosSan FelipePalauigSilangSiniloanBacacayRagay
AlcalaAparriAsinganBalungaoBasistaBinalonanBugallonClaveriaDingrasMetro TayugNaguilianPozorrubioRoxasSan NicolasSarratSta. Maria (Pang)BayambangBalagtasBongabonCabanganCabiaoGeronaIbaJaenLimayMasantolMayantocPalayanAgoncilloAmadeoAlitagtagAtimonanBalayanCalauagCatanuanGen. E. AguinaldoLopezMabiniMaubanOdionganPakilPolaRomblonRosarioRoxas (Palawan)SablayanTagkawayanTuyBaaoBato (Cam Sur)LibmananSipocotVigaJose PanganibanBato (Catanduanes)
AngadananBalaoanBatacDiffunPenablancaRosarioSan ManuelSan QuintínSinaitSta. LuciaTagudinUminganDoloresCuyapoGen NatividadCandelaria (Zambales)Sta. Ignacia (Tarlac)CastillejosMacabebeTalavera (N. Ecija)San Antonio (N. Ecija)CabuyaoDoloresGuinyanganLoboNaujanPinamalayanAroroyCalabangaCasiguranDonsolParacalePasacaoPilarSan AndresIrosin
AgooAliciaGonzagaNarvacanRamonUrbiztondoDipaculaoSan NarcisoInfantaRoxas (Or. Mindoro)BalatanCamaligPandanMasbate_Mobo

71Appendices
Water Supply Project Appraisal Guidebook for Investors and Decision Makers
LUZONWater districts Creditworthy Semi-creditworthy Pre-creditworthy Non-creditworthy
Medium AlaminosLa TrinidadMangaldanAngatBocaueBulacanDinalupihanGuaguaLubaoMunoz (N.E.)PeñarandaSan IldefonsoSan MiguelSubicSta. RosaMendezPagsanjanPililla
DaragaGubatIriga CityPiliIndangMaragondonSan Juan (Batangas)BalangaNorzagaraySan RafaelSan Jose CitySta. Maria (Bulacan) BanguedBinmaleyUrdaneta
Manaoag Santiago City

72 Appendices
Water Supply Project Appraisal Guidebook for Investors and Decision Makers
VISAYASWater districts Creditworthy Semi-creditworthy Pre-creditworthy Non-creditworthy
Very large Metro IloiloMetro Cebu
Bacolod City
Large Metro Kalibo Dumaguete CityLeyte Metro
Big Metro RoxasCatbalogan
Average KabankalanSagaySilay CityTalisayDumangas-Barotac-Nuevo
Silay CityMetro Hilongos
Medium Baybay (Leyte) PandanBogoMaasinNavalCarcar
La Carlota CityCalbayogMetro CarigaraToledo City
Small Sogod (Leyte) BuenavistaCalimogPatnongonSibalomTobias-FornierBais CityBayawanCatarmanClarínDalagueteIsabelPinamungajanSan Jose (No. Samar)SimulanTalibon
Banate BugasongEstanciaLibacaoBoronganSan IsidroMetro Siquijor
AjuyConcepción (Iloilo)Numancia (Aklan)SipalayAbuyogGen. McArthur

73Appendices
Water Supply Project Appraisal Guidebook for Investors and Decision Makers
MINDANAOWater districts Creditworthy Semi-creditworthy Pre-creditworthy Non-creditworthy
Very large Davao CityZamboanga City
Large Metro KidapawanCagayan de Oro City
Butuan City
Big Surigao MetroValencia CityDigos CityTagumDipolog CityPagadian City
Gingoog CityMalaybalayCotabato City
Misamis Occidental Jolo Mainland
Average MaramagNasipitTandagNabunturanMetro MidsayapPanaboKapatagan
BongaoPolomok
Marawi City
Medium Sultan Kudarat BayuganBislig CityGen Santos CityDapitan CityIsabela City
Small Don CarlosKibawePlacer
CantilanDel CarmenMambajaoManolo FortichProsperidadWaoAntipasKiblawanLuponMatiMlangNew CorellaTupiPikitBacolod Lanao del NorteKolambuganLamitanPolancoRizalRizalTangub CityWao
Claveria (Misamis Or)Island Garden City of SamalNoralaSurallahKauswaganPres. M. A. RoxasTubod-BaroySindanganTukuran
Ipil-TitayKumalarangLiloySioconKalamansigPigcawayanBacuag (Sur. Del Sur)Balingasag (Misamis Or)
Total 63 182 69 33
74 Appendices
Water Supply Project Appraisal Guidebook for Investors and Decision Makers
Appendix 2.C. Rating system for water districts in the Philippines
Basics of Credit RatingWhat is credit rating?Credit rating is a current opinion on credit quality of the debt in terms of a water district’s (issuer) ability and inclination to meet its debt obligation in a timely manner, and an independent & unbiased evaluation of the creditworthiness of the water district and its relative position vis-à-vis its peers and other corporate borrowers.
As observed in the defi nition, it focuses on both the ability and the inclination (or willingness) of the water district to service its debt obligations. While the credit rating model and analysis focus mainly on the ability of water district, the inclination of the water district is gauged by the management’s quality.
What a credit rating is not?Credit rating is not a general purpose evaluation of issuer; it is neither an audit of water district nor a one time assessment of creditworthiness of the issuer valid over the future life of loan. Most importantly, it should not be perceived as a recommendation to extend or not extend loan to a water district. Instead, credit rating helps in making an informed credit decision backed by an understanding of underlying credit risks.
What are the benefi ts of credit rating of water districts?Apart from the targeted objective of this assignment, namely evaluation and pricing of credit risks in the guarantees provided by LGUGC, the credit rating of water districts is a useful tool. The use of credit rating should be advocated as a cornerstone in the development of the debt market in the Philippines.
Various benefi ts of credit rating of water districts are given below:
• Helps in credit history formation;• Will improve visibility & bankability with
development institutions;• Will facilitate fl ow of capital to water districts;• Is indicative of improved governance and
transparency in WD sector;• Helps in benchmarking among WDs and with
corporate entities;• Facilitates independent monitoring of overall debt
level & fi nancial risks; and• Will facilitate accessibility to funds from the bonds
market in the long-term.
Credit Rating ProcessStep 1: Information requirements furnished by the rating teamThe credit rating process commences with the rating team identifying the information requirements and communicating the same to the water district. This will help the offi cials to be sensitized to the data and information required for their credit rating. The importance of information should also be explained to the management of the water district.
Step 2: Data provided by the rated entity The water district should submit the data in the standard data sheet. While all efforts should be made to ensure completeness of the information, there may be instances wherein some of the information are not available. In such a situation, the rating team has to make suitable assumptions for the parameter.
Step 3: Analysis of the information using credit rating modelOnce the information is received, the rating team will undertake analysis of the information, based on the credit rating model. The analysis can be supplemented by further evaluation of fi nancial projections and projects proposed by the water district.
Step 4: Management interactionThe management interaction is aimed at gaining insights into various analytical aspects as well as management evaluation of water district.
Step 5: Preparation of the rating report The rating report comprises of the background of water district, fi lled-in scoring sheet that assigns the credit rating, peer-benchmarking, rating report to put in public domain and annexes on data provided by the water districts.
Step 6: Presentation to the rating committeeThe rating report outlining credit scores and overall rating should be presented to the rating committee.
Step 7: Credit rating assigned by the rating committeeThe rating committee assigns the fi nal rating after discussing the credit score assigned by the rating team. Deviations, if any, to the rating assigned by the rating model can be undertaken only after due explanation for the same.

75Appendices
Water Supply Project Appraisal Guidebook for Investors and Decision Makers
Credit Rating CriteriaCredit rating frameworkThe credit rating framework for water districts involves an evaluation of fi ve broad credit risk factors as shown below.
Credit Risk factors
Regulatory riskAnalysis of the regulatory framework is based on the various laws and presidential directives governing the water districts.
Economic risk The economic base of the water district’s service area is analyzed to assess the revenue base, elasticity of revenues, and the possibility of enhancing the WD’s revenue base and revenue-generating potential.
Financial risk Financial risk analysis focuses on past fi nancial performance to assess the future performance of the entity. The analysis is based on the audited fi nancial results and is undertaken
for individual parameters, including debt factors, accounts receivable, liquidity, and net revenues available for debt service.
Operating riskThe analysis of operating effi ciency takes into account the concentration risk and existing infrastructure facilities.
Management riskA key parameter for assessing a water district’s credit profi le is the quality of its economic management and project management. A water district’s fi nancial health is, to a large extent, linked to the initiatives its management has taken to enhance its resource base and improve the level of its services. The assessment revolves around the degree of effectiveness and effi ciency exhibited by the management in harnessing the available resources and providing adequate infrastructure in its service area.
While assessing projects, it is important to analyze the revenue infl ows arising out of improvements envisaged through the project, the project cost, the means of funding the project, and the effect of debt funding on the water district’s debt service coverage ratio.

76 Appendices
Water Supply Project Appraisal Guidebook for Investors and Decision Makers
Rating CommitteeThe Rating Committee is comprised of experts who bring long standing experience in diverse companies and industrial sectors. Rating Committee Meetings (RCMs) form a crucial part of a rigorous exercise of assigning a credit rating. The RCM process ensures objectivity of the rating, since the decision results from the collective thinking of the think-tank that comprises experts. The RCM process also ensures high analytical quality and consistency since the reports and discussions are focused on critical rating factors that are relevant to a particular issuer. Accordingly, by drawing on the knowledge and expertise of the participants, the RCM decides on the individual ratings recommended by the rating team.
Credit Rating ScaleThe rating scale is an 18-point scale to enable the wide distribution of rated entities. Credit rating scale varies from AAA to D category, where AAA rating belongs to highest degree of safety and D rating refers to default. Categories from AA to B have modifi ers ‘+’ and ‘-’ suffi xed.
SurveillanceFrequencyThe rating is kept under surveillance after the initial rating is assigned and during the entire time the loan guarantee is in force. The minimum frequency of surveillance should be one year when the latest fi nancial results of the water district are available, though the rating should be reviewed as and when there is any event that can potentially impact the credit rating.
ProcessThe process for credit rating review is similar to the initial rating assigned, though the emphasis of the exercise would largely be to obtain an update on the existing information and analysis. The rating team should undertake a continuous, monitoring process to ensure that it is completely aware of the internal and external events that can affect the credit rating of the water district. The surveillance process should involve regular interaction with the key offi cials of the water district as well as with the external experts of the water sector.
The possible outcomes of rating review can be ‘change in rating’, ‘outlook change’ or ‘credit watch’.
Investment Grade RatingsAAA (Triple A) Highest Safety
Entities rated ‘AAA’ are judged to offer the highest degree of safety with regard to timely payment of fi nancial obligations.
AA (Double A) High Safety Entities rated ‘AA’ are judged to offer a high degree of safety with regard to timely payment of fi nancial obligations.
A Adequate Safety Entities rated ‘A’ are judged to offer an adequate degree of safety with regard to timely payment of fi nancial obligations. However, changes in circumstances can adversely affect such entities more than those in the higher rating categories.
BBB (Triple B) Moderate Safety Entities rated ‘BBB’ are judged to offer a moderate safety with regard to timely payment of fi nancial obligations for the present; however, changing circumstances are more likely to lead to a weakened capacity to pay interest and repay principal than for entities in higher rating categories.
Speculative Grade RatingsBB (Double B) Inadequate Safety
Entities rated ‘BB’ are judged to carry inadequate safety with regard to timely payment of fi nancial obligations; they are less likely to default in the immediate future than other speculative grade entities, but an adverse change in circumstances could lead to inadequate capacity to make payment on fi nancial obligations.
B High Risk Entities rated ‘B’ are judged to have greater likelihood of default; while currently fi nancial obligations are met, adverse business or economic conditions would lead to lack of ability or willingness to pay interest or principal.
C Substantial Risk Entities rated ‘C’ are judged to have factors present that make them vulnerable to default; timely payment of fi nancial obligations is possible only if favorable circumstances continue.
D Default Entities rated ‘D’ are in default or are expected to default on scheduled payment dates. Such entities are extremely speculative and returns from these entities may be realized only on reorganization or liquidation.
‘+’ (plus) or ‘-’ (minus) signs can be added for ratings from ‘AA’ to ‘B’ to refl ect comparative standing within the category.
77Appendices
Water Supply Project Appraisal Guidebook for Investors and Decision Makers
Credit rating outlookThe credit rating outlook can be assigned by the Rating Committee for ratings from ‘AAA’ to ‘B’, based on their assessment of future fi nancial projections or expected improvement in operating parameters.
The outlook is assigned at the time of initial rating and is reviewed whenever the credit rating is reviewed. Ratings on credit rating watch will not carry outlooks. A rating outlook indicates the direction in which a rating may move over a medium-term horizon of one to two years. A rating outlook can be ‘Positive’, ‘Stable’ or ‘Negative’. The default credit rating outlook will always be ‘Stable’.
A ‘positive’ or ‘negative’ rating outlook is not necessarily a precursor of a rating change, however it provides investors an early indication of possible direction of rating change.Positive outlook means that a rating may be raised. Negative outlook means that a rating may be lowered.
Stable outlook means that a rating is not likely to change.
Credit rating watchThe credit rating can be put on watch by the Rating Committee in case there are events or circumstances (such as mergers and acquisitions, shareholding change, regulatory actions), the impact of which on outstanding rating needs to be evaluated with further information. The credit rating watch should be typically resolved within a 3 to 6 months timeframe.
Difference between credit rating watch and outlookA credit rating watch is assigned only when there is an uncertainty on the assignment of exact credit rating. Accordingly, until the clarity on the credit rating emerges, the rating is put under watch. A credit rating is under watch only after some exceptional, uncertain events have taken place. Under normal circumstances, a credit rating watch will not be imposed.
An outlook is assigned for all ratings, under normal circumstances. When a rating watch is assigned, an outlook is not applicable.
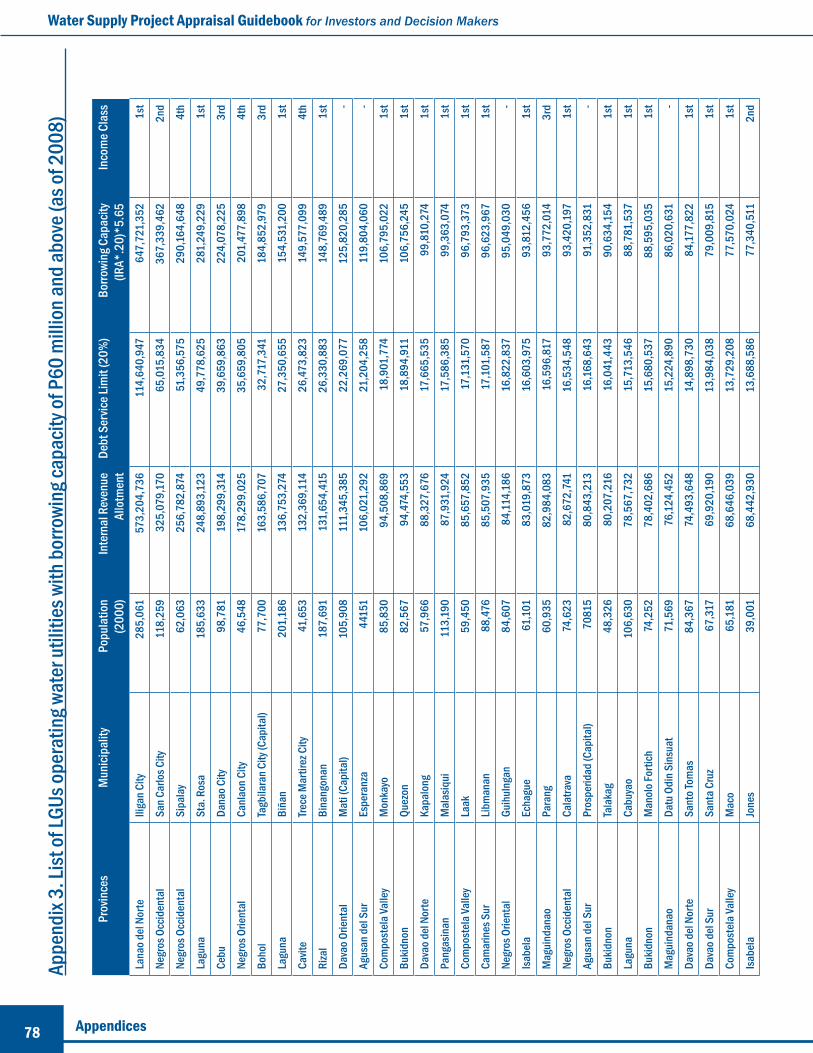
78 Appendices
Water Supply Project Appraisal Guidebook for Investors and Decision Makers
Appe
ndix
3. Li
st of
LGUs
oper
atin
g wat
er ut
ilitie
s with
bor
rowi
ng ca
pacit
y of P
60 m
illio
n and
abov
e (as
of 2
008)
Prov
ince
sM
unici
palit
yPo
pula
tion
(200
0)In
tern
al R
even
ue
Allo
tmen
tDe
bt S
ervic
e Lim
it (2
0%)
Borro
wing
Cap
acity
(IR
A*.2
0)*5
.65
Inco
me C
lass
Lana
o del
Nor
teIli
gan C
ity28
5,06
1 5
73,2
04,7
36
114
,640
,947
6
47,7
21,3
52
1st
Negr
os O
ccid
enta
lSa
n Car
los C
ity11
8,25
9 3
25,0
79,17
0 6
5,01
5,83
4 3
67,3
39,4
62
2nd
Negr
os O
ccid
enta
lSi
pala
y62
,063
256
,782
,874
51
,356
,575
2
90,1
64,6
48
4th
Lagu
naSt
a. R
osa
185,
633
248
,893
,123
4
9,77
8,62
5 2
81,2
49,2
29
1st
Cebu
Dana
o City
98,7
81 1
98,2
99,3
14
39,
659,
863
224
,078
,225
3r
d
Negr
os O
rient
alCa
nlao
n City
46,5
48 17
8,29
9,02
5 3
5,65
9,80
5 2
01,4
77,8
98
4th
Boho
lTa
gbila
ran C
ity (C
apita
l)77
,700
163
,586
,707
3
2,71
7,34
1 1
84,8
52,9
79
3rd
Lagu
naBi
ñan
201,
186
136
,753
,274
2
7,35
0,65
5 1
54,5
31,2
00
1st
Cavit
eTre
ce M
artir
ez C
ity41
,653
132
,369
,114
2
6,47
3,82
3 1
49,5
77,0
99
4th
Riza
lBi
nang
onan
187,
691
131
,654
,415
2
6,33
0,88
3 1
48,7
69,4
89
1st
Dava
o Orie
ntal
Mat
i (Ca
pita
l)10
5,90
8 1
11,3
45,3
85
22,
269,
077
125
,820
,285
-
Agus
an d
el S
urEs
pera
nza
4415
1 1
06,0
21,2
92
21,
204,
258
119
,804
,060
-
Com
post
ela V
alle
yM
onka
yo85
,830
94,
508,
869
18,
901,
774
106
,795
,022
1s
t
Bukid
non
Quez
on82
,567
94,
474,
553
18,
894,
911
106
,756
,245
1s
t
Dava
o del
Nor
teKa
palo
ng57
,966
88,
327,
676
17,6
65,5
35
99,
810,
274
1st
Pang
asin
anM
alas
iqui
113,
190
87,
931,
924
17,5
86,3
85
99,
363,
074
1st
Com
post
ela V
alle
yLa
ak59
,450
85,
657,
852
17,1
31,5
70
96,
793,
373
1st
Cam
arin
es S
urLib
man
an88
,476
85,
507,
935
17,1
01,5
87
96,
623,
967
1st
Negr
os O
rient
alGu
ihul
ngan
84,6
07 8
4,11
4,18
6 1
6,82
2,83
7 9
5,04
9,03
0 -
Isabe
laEc
hagu
e61
,101
83,
019,
873
16,
603,
975
93,
812,
456
1st
Mag
uind
anao
Para
ng60
,935
82,
984,
083
16,
596,
817
93,
772,
014
3rd
Negr
os O
ccid
enta
lCa
latra
va74
,623
82,
672,
741
16,
534,
548
93,
420,
197
1st
Agus
an d
el S
urPr
ospe
ridad
(Cap
ital)
7081
5 8
0,84
3,21
3 1
6,16
8,64
3 9
1,35
2,83
1 -
Buki
dnon
Tala
kag
48,3
26 8
0,20
7,21
6 1
6,04
1,44
3 9
0,63
4,15
4 1s
t
Lagu
naCa
buya
o10
6,63
0 7
8,56
7,73
2 1
5,71
3,54
6 8
8,78
1,53
7 1s
t
Bukid
non
Man
olo F
ortic
h74
,252
78,
402,
686
15,
680,
537
88,
595,
035
1st
Mag
uind
anao
Datu
Odi
n Sin
suat
71,5
69 7
6,12
4,45
2 1
5,22
4,89
0 8
6,02
0,63
1 -
Dava
o del
Nor
teSa
nto T
omas
84,3
67 74
,493
,648
1
4,89
8,73
0 8
4,17
7,82
2 1s
t
Dava
o del
Sur
Sant
a Cru
z67
,317
69,
920,
190
13,
984,
038
79,
009,
815
1st
Com
post
ela V
alle
yM
aco
65,1
81 6
8,64
6,03
9 1
3,72
9,20
8 7
7,57
0,02
4 1s
t
Isabe
laJo
nes
39,0
01 6
8,44
2,93
0 1
3,68
8,58
6 7
7,34
0,51
1 2n
d

79Appendices
Water Supply Project Appraisal Guidebook for Investors and Decision Makers
Prov
ince
sM
unici
palit
yPo
pula
tion
(200
0)In
tern
al R
even
ue
Allo
tmen
tDe
bt S
ervic
e Lim
it (2
0%)
Borro
wing
Cap
acity
(IR
A*.2
0)*5
.65
Inco
me C
lass
Alba
yGu
inob
atan
71,0
71 6
8,27
4,07
2 1
3,65
4,81
4 7
7,14
9,70
1 1s
t
Negr
os O
rient
alSi
aton
64,2
58 6
8,17
5,13
8 1
3,63
5,02
8 7
7,03
7,90
6 2n
d
Cam
arin
es S
urBu
hi67
,762
66,
540,
497
13,
308,
099
75,
190,
762
2nd
Cebu
Naga
80,1
89 6
6,19
0,51
9 1
3,23
8,10
4 74
,795
,286
-
Agus
an d
el S
urTre
nto
4169
6 6
5,34
8,53
9 1
3,06
9,70
8 7
3,84
3,84
9 -
Boho
lUb
ay59
,827
65,
282,
458
13,
056,
492
73,
769,
178
2nd
Cebu
Bala
mba
n59
,922
64,
905,
948
12,
981,
190
73,
343,
721
1st
Dava
o Orie
ntal
Cara
ga33
,481
63,
958,
062
12,
791,
612
72,
272,
610
2nd
Com
post
ela V
alle
yCo
mpo
stel
a61
,667
63,
591,
758
12,
718,
352
71,8
58,6
87
1st
Mar
indu
que
Sta.
Cru
z60
,055
62,
891,
837
12,
578,
367
71,0
67,7
76
1st
Alba
yPo
lang
ui70
,451
62,
571,
051
12,
514,
210
70,
705,
288
1st
Negr
os O
ccid
enta
lM
urcia
59,3
58 6
2,55
5,05
7 1
2,51
1,01
1 7
0,68
7,21
4 1s
t
Quez
onM
ulan
ay45
,903
60,
132,
797
12,
026,
559
67,
950,
061
2nd
Pang
asin
anBo
linao
61,0
68 5
8,50
9,55
2 1
1,70
1,91
0 6
6,11
5,79
4 3r
d
Apay
aoCo
nner
20,4
29 5
8,43
4,70
3 1
1,68
6,94
1 6
6,03
1,21
4 3r
d
Agus
an d
el S
urSi
baga
t28
685
57,
428,
476
11,
485,
695
64,
894,
178
2nd
Dava
o Orie
ntal
Gove
rnor
Gen
eros
o42
,705
56,
893,
922
11,
378,
784
64,
290,
132
3rd
Sam
arPa
rana
s (W
right
)27
,926
56,
337,
835
11,
267,
567
63,
661,
754
-
Zam
boan
ga d
el N
orte
Serg
io O
smeñ
a, S
r.27
,500
56,
221,
887
11,
244,
377
63,
530,
732
-
Pang
asin
anBu
gallo
n57
,445
55,
915,
579
11,
183,
116
63,
184,
604
3rd
Zam
boan
ga S
ibug
ayTu
ngaw
an33
,194
55,
274,
267
11,
054,
853
62,
459,
922
3rd
Dava
o del
Nor
teAs
uncio
n46
,910
55,
187,
764
11,
037,
553
62,
362,
173
2nd
Dava
o Orie
ntal
Man
ay36
,697
54,
910,
121
10,
982,
024
62,
048,
437
2nd
Bukid
non
Lant
apan
42,3
83 5
4,22
2,81
0 1
0,84
4,56
2 6
1,27
1,77
5 3r
d
Leyte
Bura
uen
47,1
80 5
3,99
6,38
1 1
0,79
9,27
6 6
1,01
5,91
1 2n
d
Cebu
Baril
i57
,764
53,
167,
017
10,
633,
403
60,
078,
729
3rd
Mar
indu
que
Boac
48,5
04 5
3,12
0,72
5 1
0,62
4,14
5 6
0,02
6,41
9 2n
d

80 Appendices
Water Supply Project Appraisal Guidebook for Investors and Decision Makers
Appendix 4. Retawon City Case Study
I. Case Study: Financial Modeling & Forecasting
Retawon City Water District (RCWD)City of Retawon, Visayas Region Urban Population: 335,215 Estimated Population Served as of 2007: 93,886 Estimated Urban Population Growth Rate: 3.1% per annum
To fi nance its Water Service Improvement Program, RCWD approached your institution to borrow P139.4 million. The balance sheet of RCWD, as of end-September 2007 is shown below:
The RCWD District Finance Offi cer presented a summary table of the operating and fi nancial statistics shown in Annex 4.A. From your discussions, the bank account offi cer gathered that subscribers have been constantly complaining about poor service. A quick estimate of the account receivables, amounting to P36.9 million, shows that it is equivalent to 114 days of sales. Annual revenues are estimated to reach P138.6 million in 2007 from P118.7 million in 2006 year after the implementation of a 13 percent tariff hike in February 2006.
The Finance Offi cer presented the fi nancial plan to the bank, which shows how RCWD can suffi ciently service the additional debt. The fi nancial plan assumes following:
1) A projected increase in connections of 792 net additional connections per year in the next 5 years. The RCWD Head of Marketing says Retawon has undertaken a survey showing there are around 13,390 households willing to connect to the Water District.
2) An average annual increase of 10 percent on tariff rates for the next three years, to enable suffi cient debt service coverage of the additional loan. Annual tariff increase for 2011-2014 and 2015-2020 is estimated at 6 percent and 3 percent, respectively. The bank was given a copy of the table of tariffs (Annex 4.B) in the Visayas Region compiled by LWUA, to allow comparison of RCWD rates with the other cities in the region.
3) Cost of production is forecasted by the RCWD Technical Group to decline in the next 3 years as the new source will benefi t from transmission of water by gravity. (See cost data in Annex 4.A). This claim was verifi ed by an independent engineering consultant.
4) The RCWD Technical Group estimated that the Water District has to invest around P5.3 million every two years starting 2010 to maintain its level of service. (See schedule of maintenance capex in the statement of cash fl ows – Annex 4.A.)
5) The Finance Offi cer assumed in his forecasts that the term of the loan is 10 years (inclusive of a 3-year grace period on principal payments) with an interest rate of 10.5 percent fi xed over the entire life of the loan.
Retawon City Water District (RCWD)Balance Sheet, as of September 2007 (Php’000)
Cash and equivalents 25,124
Accounts Receivable (net) 37,213
Inventory 10,522
Fixed Assets (net) 87,211
Others Assets 234
Total Assets 160,304
Account Payables 12,222
Loans - LWUA 23,158
Total Liabilities 35,380
Total Capital Funds 124,924

81Appendices
Water Supply Project Appraisal Guidebook for Investors and Decision Makers
I. Se
lect
ed O
pera
tiona
l and
Fina
ncia
l Dat
a
2006
2007
2008
2009
2010
2011
2012
2013
2014
2015
2016
2017
Estim
ated
Pop
ulat
ion S
erve
d 9
1,06
9 9
3,88
6 9
8,00
4 1
02,1
23
106
,241
1
10,3
60
114
,478
1
18,5
96
122
,715
1
26,8
33
130
,952
1
35,0
70
Num
ber o
f Con
nect
ions
(net
of
disc
onne
ctio
ns)
17,5
13
18,
055
18,
847
19,
639
20,
431
21,
223
22,
015
22,
807
23,
599
24,
391
25,
183
25,
975
Incr
ease
in N
umbe
r of C
onne
ctio
ns 5
25
542
7
92
792
7
92
792
7
92
792
7
92
792
7
92
792
Cons
umpt
ion p
er C
onne
ctio
n per
mon
th 2
3.4
22.
8 2
3.7
25.
8 2
6.5
27.
8 2
8.1
29.
9 31
.6
30.
9 3
0.2
29.
6
Bille
d W
ater
(cu.
m.)
4,9
17,7
49
4,9
39,8
48
5,3
60,0
87
6,0
80,2
34
6,4
97,0
58
7,0
79,9
93
7,4
23,4
58
8,1
83,1
52
8,9
48,7
41
9,0
44,1
83
9,1
26,3
19
9,2
26,3
20
Non R
even
ue W
ater
(NRW
)58
%60
%57
%56
%54
%53
%51
%47
%42
%42
%42
%41
%
Tota
l Wat
er D
eman
d 1
1,70
8,92
5 1
2,34
9,62
0 1
2,46
5,31
8 1
3,81
8,71
5 1
4,12
4,03
9 1
5,06
3,81
4 1
5,14
9,91
4 1
5,43
9,90
9 1
5,42
8,86
3 1
5,59
3,41
9 1
5,73
5,03
3 1
5,63
7,83
1
Wat
er S
uppl
y Cap
acity
:
Aver
age M
onth
ly Bi
ll per
Con
nect
ion
(Php
)54
3.0
615.
0 6
76.5
74
4.2
818
.6
867
.7
919
.7
974
.9
1,0
33.4
1
,064
.4
1,0
96.4
1
,129
.2
Incr
ease
in M
onth
ly Bi
ll6%
13.3
%10
.0%
10.0
%10
.0%
6.0%
6.0%
6.0%
6.0%
3.0%
3.0%
3.0%
Dire
ct P
rodu
ctio
n Cos
t (Ph
p pe
r cu.
m.)
Wat
er S
uppl
y Exp
ense
s 0
.39
0.4
0 0
.40
0.4
1 0
.41
0.4
2 0
.42
0.4
2 0
.43
0.4
3 0
.44
0.4
4
Pum
ping
Expe
nses
3.4
0 3
.70
3.3
3 3
.00
2.8
5 2
.82
2.7
1 2
.62
2.6
8 2
.73
2.7
9 2
.84
Wat
er Tr
eatm
ent E
xpen
ses
0.1
9 0
.20
0.2
1 0
.22
0.2
4 0
.25
0.2
7 0
.28
0.3
0 0
.32
0.3
4 0
.36
Trans
miss
ion a
nd D
istrib
utio
n Exp
ense
s 1
.60
1.7
0 1
.80
1.9
1 2
.02
2.1
5 2
.28
2.4
1 2
.56
2.7
1 2
.87
3.0
4
Tota
l Cos
t of P
rodu
cing W
ater
(Php
per
cu
. m.)
5.5
8 6
.00
5.7
5 5
.54
5.5
2 5
.63
5.6
7 5
.74
5.9
6 6
.19
6.4
3 6
.69
Colle
ctio
n Effi
cienc
y87
.5%
89.0
%91
.0%
92.0
%92
.0%
93.0
%93
.0%
93.0
%93
.0%
93.0
%93
.0%
93.0
%
Days
Col
lect
ion
113
1
34
147
1
55
163
17
2 1
80
188
1
95
207
2
18
228
Appendix 4.A. Retawon City Water District

82 Appendices
Water Supply Project Appraisal Guidebook for Investors and Decision Makers
II. In
com
e Sta
tem
ent (
Php)
2006
2007
2008
2009
2010
2011
2012
2013
2014
2015
2016
2017
Oper
atin
g Rev
enue
s
Wat
er S
ales
114
,116
,989
1
33,2
45,9
00
152
,999
,946
17
5,37
2,34
2 2
00,6
89,2
18
220
,976
,992
2
42,9
76,8
17
266
,821
,103
2
92,6
51,9
88
311,
547,
815
331
,314
,004
3
51,9
85,7
72
Othe
r Rev
enue
s
Pena
lty C
harg
es 3
,698
,888
5
,164
,593
6
,541
,592
7
,944
,571
9
,550
,084
1
1,09
6,92
3 1
2,79
7,76
1 1
4,66
5,50
9 1
6,71
4,07
3 1
8,89
4,90
7 2
1,21
4,10
6 2
3,67
8,00
6
New
Conn
ectio
n Fee
s 2
,101
,602
2
,166
,600
3
,168
,000
3
,168
,000
3
,168
,000
3
,168
,000
3
,168
,000
3
,168
,000
3
,168
,000
3
,168
,000
3
,168
,000
3
,168
,000
Tota
l Rev
enue
s 1
19,9
17,4
78
140
,577
,093
1
62,7
09,5
38
186
,484
,913
2
13,4
07,3
03
235
,241
,915
2
58,9
42,5
78
284
,654
,612
31
2,53
4,06
1 3
33,6
10,7
22
355
,696
,110
3
78,8
31,7
78
Annu
al W
ater
Pro
duct
ion
11,
708,
925
12,
349,
620
12,
465,
318
13,
818,
715
14,
124,
039
15,
063,
814
15,
149,
914
15,
439,
909
15,
428,
863
15,
593,
419
15,
735,
033
15,
637,
831
Prod
uctio
n and
Mai
nten
ance
Expe
nses
65,
359,
222
74,0
97,7
20
71,6
50,6
49
76,
554,
020
77,
995,
780
84,
863,
902
85,
884,
318
88,
695,
293
92,
002,
315
96,
558,
307
101
,221
,792
1
04,5
47,9
20
Wat
er S
uppl
y Exp
ense
s 4
,589
,899
4
,939
,848
5
,035
,989
5
,638
,588
5
,820
,805
6
,270
,186
6
,369
,085
6
,555
,910
6
,616
,732
6
,754
,175
6,8
83,6
70
6,9
09,5
57
Pum
ping
Expe
nses
39,
810,
346
45,
693,
594
41,5
09,5
09
41,4
14,6
87
40,
213,
258
42,
460,
050
40,
994,
628
40,
525,
953
41,3
06,9
01
42,
582,
406
43,
828,
508
44,
428,
914
Wat
er Tr
eatm
ent E
xpen
ses
2,2
48,1
14
2,4
69,9
24
2,6
42,6
47
3,1
05,3
42
3,3
64,3
91
3,8
03,5
44
4,0
54,8
01
4,3
80,3
61
4,6
39,8
61
4,9
70,7
08
5,3
16,8
01
5,6
00,9
95
Trans
miss
ion a
nd D
istrib
utio
n Exp
ense
s 1
8,71
0,86
3 2
0,99
4,35
4 2
2,46
2,50
3 2
6,39
5,40
3 2
8,59
7,32
6 3
2,33
0,12
2 3
4,46
5,80
5 3
7,23
3,06
9 3
9,43
8,82
0 4
2,25
1,01
8 4
5,19
2,81
2 47
,608
,454
Gros
s Pro
fi t 5
4,55
8,25
6 6
6,47
9,37
3 9
1,05
8,88
9 1
09,9
30,8
93
135
,411
,522
1
50,3
78,0
13
173,
058,
259
195
,959
,319
2
20,5
31,7
46
237
,052
,415
2
54,4
74,3
18
274
,283
,858
Adm
inist
rativ
e and
Cus
tom
er Ex
pens
es 5
6,25
5,88
6 5
9,81
5,56
1 6
6,92
2,93
0 8
0,36
3,65
0 1
02,2
23,0
56
104
,114
,563
1
11,6
97,9
14
112
,824
,838
1
51,5
30,6
53
177,
433,
613
186
,370
,525
1
95,3
44,8
90
Sala
ries a
nd W
ages
47,9
41,2
02
51,4
00,8
77
58,
404,
246
65,
463,
805
87,
210,
725
88,
985,
247
96,
446,
932
97,
447,
325
136
,021
,546
1
61,7
87,6
49
170,
582,
231
179,
408,
571
Prov
ision
for B
ad A
ccou
nts
2,5
00,0
00
2,6
00,0
00
2,7
04,0
00
2,8
12,1
60
2,9
24,6
46
3,0
41,6
32
3,1
63,2
98
3,2
89,8
29
3,4
21,4
23
3,5
58,2
80
3,7
00,6
11
3,8
48,6
35
Depr
ecia
tion E
xpen
ses
5,8
14,6
84
5,8
14,6
84
5,8
14,6
84
12,
087,
684
12,
087,
684
12,
087,
684
12,
087,
684
12,
087,
684
12,
087,
684
12,
087,
684
12,
087,
684
12,
087,
684
Net O
pera
ting I
ncom
e (1
,697
,630
) 6
,663
,812
2
4,13
5,95
9 2
9,56
7,24
3 3
3,18
8,46
7 4
6,26
3,45
0 6
1,36
0,34
6 8
3,13
4,48
1 6
9,00
1,09
3 5
9,61
8,80
2 6
8,10
3,79
3 7
8,93
8,96
8
Finan
cial C
harg
es 2
,431
,667
2
,161
,481
9
,344
,889
1
6,39
3,20
4 1
6,12
3,01
8 1
4,80
7,33
3 1
2,44
6,14
8 1
0,08
4,96
3 7
,723
,778
5
,362
,593
3
,136
,500
1
,045
,500
Inte
rest
Expe
nses
2,4
31,6
67
2,1
61,4
81
9,3
44,8
89
16,
393,
204
16,
123,
018
14,
807,
333
12,
446,
148
10,
084,
963
7,7
23,7
78
5,3
62,5
93
3,1
36,5
00
1,0
45,5
00
Othe
r Inc
ome a
nd Ex
pens
es 2
,398
,350
2
,811
,542
3
,254
,191
3
,729
,698
4
,268
,146
4
,704
,838
5
,178,
852
5,6
93,0
92
6,2
50,6
81
6,6
72,2
14
7,1
13,9
22
7,5
76,6
36
Fran
chise
Tax
2,3
98,3
50
2,8
11,5
42
3,2
54,1
91
3,7
29,6
98
4,2
68,1
46
4,7
04,8
38
5,17
8,85
2 5
,693
,092
6
,250
,681
6
,672
,214
7
,113
,922
7
,576
,636
NET I
NCOM
E (6
,527
,646
) 1
,690
,788
1
1,53
6,87
9 9
,444
,341
1
2,79
7,30
2 2
6,75
1,27
9 4
3,73
5,34
6 6
7,35
6,42
5 5
5,02
6,63
4 47
,583
,995
5
7,85
3,37
1 7
0,31
6,83
2

83Appendices
Water Supply Project Appraisal Guidebook for Investors and Decision Makers
III. C
ash F
low
Stat
emen
t (Ph
p)
2006
2007
2008
2009
2010
2011
2012
2013
2014
2015
2016
2017
Cash
Flow
from
Ope
ratin
g Act
ivitie
s
Net I
ncom
e (6
,527
,646
) 1
,690
,788
1
1,53
6,87
9 9
,444
,341
1
2,79
7,30
2 2
6,75
1,27
9 4
3,73
5,34
6 6
7,35
6,42
5 5
5,02
6,63
4 47
,583
,995
5
7,85
3,37
1 7
0,31
6,83
2
Add:
Dep
recia
tion
5,8
14,6
84
5,8
14,6
84
5,8
14,6
84
12,
087,
684
12,
087,
684
12,
087,
684
12,
087,
684
12,
087,
684
12,
087,
684
12,
087,
684
12,
087,
684
12,
087,
684
Colle
ctio
n of A
ccou
nts R
ecei
vabl
es 3
6,98
8,87
6 51
,645
,925
6
5,41
5,92
0 7
9,44
5,70
8 9
5,50
0,84
5 1
10,9
69,2
34
127
,977
,612
1
46,6
55,0
89
167
,140
,728
1
88,9
49,0
75
212
,141
,055
Prov
ision
for A
ccou
nts R
ecei
vabl
es (3
6,98
8,87
6) (5
1,64
5,92
5) (6
5,41
5,92
0) (7
9,44
5,70
8) (9
5,50
0,84
5) (1
10,9
69,2
34)
(127
,977
,612
) (1
46,6
55,0
89)
(167
,140
,728
) (1
88,9
49,0
75)
(212
,141
,055
) (2
36,7
80,0
59)
Tota
l Cas
h Flo
w fro
m O
pera
ting A
ctivi
ties
(37,
701,
838)
(7,1
51,5
77)
3,5
81,5
68
7,5
02,2
38
8,8
29,8
49
23,
370,
573
38,
814,
653
60,
766,
632
46,
628,
679
37,
863,
332
46,
749,
074
57,
765,
512
Cash
Flow
from
Fina
ncin
g Act
itivit
es
Bank
Loan
- 1
39,4
00,0
00
- -
- -
- -
- -
-
Prin
cipal
Pay
men
t (2
,573
,192
) (2
,573
,192
) (2
,573
,192
) (2
,573
,192
) (2
2,48
7,47
8) (2
2,48
7,47
8) (2
2,48
7,47
8) (2
2,48
7,47
8) (2
2,48
7,47
8) (1
9,91
4,28
6) (1
9,91
4,28
6)
Exist
ing L
oan
2,5
73,1
92
2,5
73,1
92
2,5
73,1
92
2,5
73,1
92
2,5
73,1
92
2,5
73,1
92
2,5
73,1
92
2,5
73,1
92
2,5
73,1
92
New
Loan
19,
914,
286
19,
914,
286
19,
914,
286
19,
914,
286
19,
914,
286
19,
914,
286
19,
914,
286
Tota
l Cas
h Flo
w fro
m Fi
nanc
ing A
ctivi
ties
2,5
73,1
92
141
,973
,192
2
,573
,192
2
,573
,192
2
2,48
7,47
8 2
2,48
7,47
8 2
2,48
7,47
8 2
2,48
7,47
8 2
2,48
7,47
8 1
9,91
4,28
6 1
9,91
4,28
6
Cash
Flow
from
Inve
stin
g Act
itivit
es
Capi
tal E
xpen
ditu
res-
Wat
er S
ervic
e Im
prov
emen
t Pro
gram
-
(139
,400
,000
) -
- -
- -
- -
- -
Mai
nten
ance
Cap
ital E
xpen
ditu
re -
- -
(5,3
00,0
00)
- (5
,300
,000
) (5
,300
,000
) (5
,300
,000
)
Tota
l Cas
h Flo
w fro
m In
vest
ing A
ctivi
ties
- -
(1
39,4
00,0
00)
- (5
,300
,000
) -
(5,3
00,0
00)
- (5
,300
,000
) -
(5,3
00,0
00)
-
NET C
ASH
FLOW
(37,
701,
838)
(4,5
78,3
85)
6,1
54,7
60
10,
075,
430
6,1
03,0
41
45,
858,
051
56,
002,
131
83,
254,
110
63,
816,
157
60,
350,
810
61,
363,
360
77,
679,
798
Begi
nnin
g Cas
h 2
3,00
0,43
2 1
8,42
2,04
7 2
4,57
6,80
8 3
4,65
2,23
8 4
0,75
5,27
9 8
6,61
3,33
0 1
42,6
15,4
61
225
,869
,571
2
89,6
85,7
28
350
,036
,538
41
1,39
9,89
8
ENDI
NG C
ASH
BALA
NCE
18,
422,
047
24,
576,
808
34,
652,
238
40,
755,
279
86,
613,
330
142
,615
,461
2
25,8
69,5
71
289
,685
,728
3
50,0
36,5
38
411,
399,
898
489
,079
,696

84 Appendices
Water Supply Project Appraisal Guidebook for Investors and Decision Makers
IV. D
ebt T
able
2006
2007
2008
2009
2010
2011
2012
2013
2014
2015
2016
2017
Exist
ing L
oan f
rom
LWUA
2
3,15
8,72
9 2
0,58
5,53
7 1
8,01
2,34
5 1
5,43
9,15
3 1
2,86
5,96
1 1
0,29
2,76
9 7
,719
,576
5
,146
,384
2
,573
,192
0
Addi
tiona
l Loa
n (10
Year
s to p
ay w
ith 3
ye
ars g
race
per
iod)
139
,400
,000
1
39,4
00,0
00
139
,400
,000
1
19,4
85,7
14
99,
571,
429
79,
657,
143
59,
742,
857
39,
828,
571
19,
914,
286
-
Tota
l Out
stan
ding
Loan
s 2
0,58
5,53
7 1
57,4
12,3
45
154
,839
,153
1
52,2
65,9
61
129
,778
,483
1
07,2
91,0
05
84,
803,
527
62,
316,
049
39,
828,
571
19,
914,
286
-
Inte
rest
Rat
e on o
ld an
d ne
w lo
an10
.5%
10.5
%10
.5%
10.5
%10
.5%
10.5
%10
.5%
10.5
%10
.5%
10.5
%10
.5%
10.5
%
Estim
ated
Inte
rest
Expe
nse
2,4
31,6
67
2,1
61,4
81
9,3
44,8
89
16,
393,
204
16,
123,
018
14,
807,
333
12,
446,
148
10,
084,
963
7,7
23,7
78
5,3
62,5
93
3,1
36,5
00
1,0
45,5
00
V. Fi
nanc
ial R
atio
s
Parti
cula
rs20
0620
0720
0820
0920
1020
1120
1220
1320
1420
1520
1620
17
Debt
Ser
vice C
over
age R
atio
0.7
2
.0
2.2
2
.0
2.2
1
.4
2.0
2
.7
2.5
2
.3
3.2
4
.0
Debt
-to-E
quity
Rat
io -
0.3
0
.3
1.2
1
.1
1.0
0
.7
0.5
0
.3
0.2
0
.1
0.1
Net P
rofi t
Mar
gin
-5%
1%7%
5%6%
11%
17%
24%
18%
14%
16%
19%
Retu
rn on
Equi
ty0%
1%9%
7%9%
16%
23%
28%
18%
13%
14%
15%
Curre
nt R
atio
- 6
.0
6.4
7.
6 9
.1
11.
0 1
2.3
15.
0 1
9.7
23.
3 2
6.4
30.
5

85Appendices
Water Supply Project Appraisal Guidebook for Investors and Decision Makers
Local Water Utilities Administration (Php)
Minimum Charge 11 - 20 21 - 30 31 - 40 41 - 50 51 - 60
cu m
Ajay 180.00 21.00 24.25 27.75 31.50 31.50
Bagu 170.00 18.00 19.50 21.50 24.00 24.00
Banatel 150.00 15.50 16.75 18.75 21.00 21.00
Caciquejor 160.00 17.60 19.50 21.85 24.90 24.90
Capisce 150.00 16.00 17.00 18.00 20.00 20.00
Carmencita 162.00 19.50 21.25 23.25 25.50 25.50
Concepcional 170.00 17.30 18.05 18.50 18.95 18.95
Corcolonan 150.00 16.00 18.50 21.50 25.50 25.50
Culasisi 132.00 14.00 15.50 17.50 20.00 20.00
Dingalen-Pototan 183.50 20.15 22.30 25.00 28.50 28.50
Duenos 188.00 19.80 22.20 26.50 24.50 24.50
Escalantico 169.00 18.50 20.50 23.00 25.50 25.50
Ibajoy 183.50 22.45 24.45 27.00 30.75 30.75
Matinog 193.00 20.55 22.25 24.50 27.50 27.50
Metro Anihao 205.00 21.25 22.75 24.75 27.00 27.00
Pandagnanan 213.00 22.45 24.45 27.00 30.75 30.75
Retawon 210.00 20.00 23.00 26.00 31.00 31.00
Silayan 185.00 22.90 25.65 28.90 32.40 36.15
Tagbilad 153.00 17.00 18.00 19.00 21.00 21.00
Regional Average 174.05 18.94 20.83 23.17 25.80 26.00
Appendix 4.B. Regional Water Tariffs as of September 2007

86
REFERENCES
American Water Works Association and American Society of Civil Engineers. Water Treatment Plant Design (3rd Edition). Mc Graw-Hill New York, 1998.
Expertelligence Development Corporation. “A Market Study for the Metropolitan Cebu Water District.” Cebu City, 1996.
Kusek, Jody Zall & Ray C. Rist. A Handbook for Development Practitioners. Ten Steps to a Results-Based Monitoring and Evaluation System. The International Bank for Reconstruction and Development / The World Bank. Washington, DC, 2004.
LGU Guarantee Corporation. Portfolio Risk Management Manual. Manila, 2008.
Local Water Utilities Administration and Motor Columbus. Water Supply Feasibility Study Methodology Manual. 19xx
McGhee, Terence J. Water Supply and Sewerage (6th Edition). McGraw-Hill New York, 1991.
National Economic and Development Authority. Reference Manual on Project Development and Evaluation. Manila, 2005.
National Water Resources Board. “Primer on Tariff Setting and Regulation.” Manila, 2005.
Research Division, Water Resources Research and Training Department, Local Water Utilities Administration. “In-place Costs of Waterworks Materials and Equipment.” 2003.
The World Bank. Operations Manual. www.worldbank.org.
The World Bank. “Philippines: Meeting Infrastructure Challenges.” Manila, 2005.
UN Environment Programme. UNEP Project Manual: Formulation, Approval, Monitoring and Evaluation. UNEP Programme Coordination and Management Unit. New York, 2005.
Van Westendorp, P. “Price Sensitivity Meter,” MarketVision Research. www.mv-research.com.
Department of Environment and Natural Resources. DENR Administrative Order 34.
Department of Heath. Philippine National Standard for Drinking Water.
Presidential Decree 198 or the Provincial Water Utilities Act (1973).
Presidential Decree 1067 or the Water Code of the Philippines.
Republic Act 7160 or the Local Government Code of the Philippines.
Implementing Rules and Regulation of Republic Act No. 9184 or the Government Procurement Reform Act (2003).

87
Ramon B. Alikpala heads the National Water Resources Board. His fi elds of expertise cover economic regulation, business analysis and strategy, and water governance. Since 2003, he has served as Chairman of the Asian Development Bank Peer Review of Apex Bodies, and a member of The Water Dialogue – International Working Group. He is also a Steering Committee Member of the Global Water Partnership and the Chairman of the Philippine Water Partnership. He holds a Master’s Degree in Business Administration from the Fordham University in New York.
Arnold R. Alvarez is a Water Resources and Water Supply Specialist from CEST, Incorporated. He holds a Bachelor’s Degree in Geology and is currently completing his thesis for post-graduate studies on Environmental Engineering. He has been involved in water supply projects for the past 15 years.
Ferdinand S. Asuncion is a Water and Sanitation Engineer with 19 years of experience in a range of infrastructure projects in the Philippines, Southeast Asia, and South America. He is a BS Civil Engineering graduate of the University of the Philippines and holds a Master’s Degree in Sanitary Engineering from the International Institute for Hydraulic and Environmental Engineering, in Delft, Netherlands. He is currently the Senior Project Specialist of the PWRF Support Program.
Aileen B. Castro earned her AB Economics and MBA degrees from the University of Santo Tomas and the Ateneo Graduate School of Business, respectively. She has been working with fi nancial institutions for 15 years, and is currently the head of the Relationship Management Department of LGUGC and acts as the head of LGUGC’s credit rating team for water districts.
Doreen Carla E. Erfe is currently the Policy and Institutional Development Specialist of the PWRF Support Program. She has extensive experience in policy development and review, and in project development and monitoring, particularly in the fi elds of fi nance, agriculture and environment. She has assisted in the establishment and implementation of monitoring and evaluation systems of several foreign-assisted projects. Ms. Erfe has a Master’s Degree in Economics from the University of the Philippines.
Ephraim M. Jacildo is a civil engineer by profession and has been in the water industry for the past 32 years. His exposure is mostly in the preparation of water supply feasibility studies and development plans for various water districts in the Philippines. He had been involved in the water supply feasibility study undertakings of different foreign consultants (Camp Dresser and McKee, C. Lotti & Asociati, Motor Columbus) when their services were engaged by the Philippine Government from mid-1970s to late 1980s.
Contributing authors

88
Jose Marie U. Lim is a BS Chemical Engineering and MS Environmental Engineering graduate of the University of the Philippines. He is a Water and Wastewater Treatment Specialist and has worked as a process design consultant on several projects for Metropolitan Waterworks and Sewerage System, Maynilad Water Services, Inc. and Manila Water. He is an Assistant Professorial Lecturer at the De La Salle University - Manila teaching graduate environmental engineering courses. He started his doctorate studies in chemical engineering at DLSU-Manila in January 2006.
Del N. McCluskey, a DAI staff member and Technical Area Manager for the water sector, has 26 years of development experience worldwide, having designed, led, and managed more than $1.2 billion worth of USAID projects in Latin America and Asia. Since joining DAI in 2004, Mr. McCluskey has led the development of several DAI contracts funded by USAID focused on addressing water management and service delivery challenges. Before joining DAI, Mr. McCluskey served in a variety of different positions during a 21–year career with USAID, including a four–year assignment leading the development and implementation of environment and energy programs in the Philippines.
Adoracion M. Navarro has 12 years experience in infrastructure economics and fi nance, initially as a Project Evaluation Specialist in Philippine government agencies and later as an independent consultant. She currently works as an Economic Policy Specialist for the Philippine Water Revolving Fund (PWRF) Support Program’s technical assistance to the National Water Resources Board (NWRB). She is a graduate of the University of the Philippines and Columbia University in New York.
Rodolfo A. Pantillano is an Infrastructure Finance Specialist from TCGI LLC., a Washington-based development consultancy fi rm. He has over 17 years experience as an investment and economic analyst and has held consultancy positions in several international development and fi nance institutions. Mr Pantillano as a Water and Sanitation Finance Specialist of the PWRF Support Program conceptualized the Water Project Appraisal Guidebook and was assigned as its Development Task Manager. He holds a bachelor and masteral degrees in Economics from the University of the Philippines.
Armando H. Paredes is the General Manager and concurrently Assistant General Manager for Technical Services and Operations, as well as the Manager of the Special Projects Department of the Metropolitan Cebu Water District. He also serves as the Technical Consultant to its Board of Directors. He is currently the President of the Visayas Association of Water Districts; Vice-President for Visayas of the Philippine Association of Water Districts (PAWD) Foundation; member of the Philippine Waterworks Association and the Philippine Water Partnership. Mr. Paredes is a chemical engineer by profession and has a Master’s Degree in Business Administration from the University of the Philippines.

89
Alma D. Porciuncula has 25 years of experience in infrastructure capital project fi nancing, privatization, project appraisal, policy analysis, institutional strengthening, and project development and management for private sector and international donor clients. She is currently the Chief of Party of the Philippine Water Revolving Fund Support Program which introduces new options for fi nancing water and sanitation investment by leveraging scarce public resources with domestic private capital. Ms. Porciuncula holds a post graduate diploma in Development Studies from the Institute of Developing Economies Advanced School in Japan and a Master’s Degree in Urban and Regional Planning from the University of the Philippines.
Mario I. Quitoriano is in charge of reviewing and recommending project proposals and water rate adjustments for water districts in Visayas and Mindanao for the Local Water Utilities Administration. He has been with LWUA since 1975 and has held various positions including Senior Deputy Administrator. Mr. Quitoriano is a Chemical Engineering graduate of the University of the Philippines and has taken some MBA units from De LaSalle University.
Antonio R. de Vera has worked for 35 years in water supply institutions, 25 of which he spent with the Local Water Utilities Administration. His experience covers technical, policy, managerial, and fi nancial aspects of different water supply models. Since 2000, he has been an active consultant for a number of projects in the Philippines and Southeast Asia, conducting performance reviews for water districts, evaluating technical and fi nancial proposals, advising on rural water supply frameworks, and consulting on tariffs and fi nancial monitoring systems. He has also served as Chairman of the Subic Bay Water Regulatory Board for the Freeport Zone since 2000.

90
List of Partners
HON. JEREMIAS PAUL, JR.UndersecretaryDepartment of Finance5/F DOF BuildingBangko Sentral ng Pilipinas ComplexRoxas Boulevard, ManilaTel: 523 9222Fax: 525 1313Email: [email protected]
MR. REYNALDO DAVIDPresidentDevelopment Bank of the PhilippinesSen. Gil Puyat cor Makati Ave.Makati CityTel: 812 6537Fax: 815 1607Email: [email protected]
MS. HELEN HABULANExecutive DirectorMunicipal Development Fund Offi ce7/F, EDPC BuildingRoxas BoulevardManilaTel: 525 9187Fax: 525 9186Email: [email protected]
MR. DANIEL LANDINGINActing AdministratorLocal Water Utilities AdministrationMWSS-LWUA ComplexKatipunan Road, Balara, Quezon CtiyTel: 9205433Fax: 9205433Email: [email protected]
MS. LYDIA ORIALPresidentLGU Guarantee Corporation28/F, Antel 2000, 121 Valero St.Salcedo Vill., Makati CityTel: 845 3386Fax: 888 4217Email: [email protected]
MR. DANIEL MOOREChiefOffi ce of Energy and EnvironmentUSAID Philippines8/F PNB Financial CenterDiosdado Macapagal Avenue, ManilaTel: 552 9800Fax: 552 9997Email: [email protected]
MS. JOY JOCHICOOffi ce of Energy and EnvironmentUSAID Philippines8/F PNB Financial CenterDiosdado Macapagal Avenue, ManilaTel: 552 9800Fax: 552 9997Email: [email protected]
MR. HIROSHI TOGOPrincipal Senior Representative40/F Yuchengco TowerRCBC Plaza, Makati CityTel: 889 7119 loc 251Fax: 8896850Email: [email protected]
MR. JIN WAKABAYASHIRepresentative40/F Yuchengco TowerRCBC Plaza, Makati CityTel: 889 7119 loc 251Fax: 8896850Email: [email protected]

91
Greetings from the PAWD President
My esteemed felicitations to the partnership of the Government of the Philippines (GOP), USAID and the JICA, for spearheading the development of the PWRF to specifi cally address the huge fi nancing requirements of water and sanitation services in our country. This trilateral effort assures a sustained mobilization of resources to meet the nation’s Millennium Development Goal (MDG). The PAWD gladly welcomes PWRF publication of its “Water Supply Project Appraisal Guidebook for Investors and Decision Makers.” This would greatly enhance the energy and momentum which the guidebook seeks to achieve. PAWD, with its more than 500 members, serving about 25 million people in the countryside, fully supports such relentless commitment to meet the government’s program for sustainable and convenient access to safe drinking water and basic sanitation services, to the greatest number of people and to the farthest extent practicable, by year 2015. More power and Mabuhay!
DELFIN C. HILARIOPresidentPAWD

92
Dire
ctor
y of w
ater
dist
ricts
PHIL
IPPI
NE
ASS
OC
IAT
ION
OF
WAT
ER D
IST
RIC
TS,
INC
.
Reg
iona
l Lis
t of
Wat
er D
istr
icts
CO
RD
ILLE
RA
AD
MIN
IST
RAT
IVE
REG
ION
(C
AR
)
Com
pris
es: A
bra,
Beng
uet,
Kal
inga
, Apa
yao
& M
ount
ain
Prov
ince
- 12
/ 6
CC
C N
o.W
ATER
D
IST
RIC
TA
DD
RES
SG
ENER
AL
MA
NA
GER
CH
AIR
MA
NT
ELEP
HO
NE
NU
MBE
R/S
FAX
NU
MBE
R/S
STA
S/C
CLA
SS
18Ba
guio
003
Puro
k BW
D, #
003
Brg
y, M
arco
ville
, Ba
guio
City
260
0M
s. Te
resi
ta P
. de
Guz
man
Att
y. M
oise
s P.
Cat
ing
(074
) 44
2-34
56 /
4858
/ 3
218
(074
) 44
2-34
56
/ 485
8O
28,9
09La
rge
456
Dol
ores
Pobl
acio
n, D
olor
es, A
bra
280
1M
s. A
nnel
i E. B
arbe
roM
s. R
egin
a G
. Rey
esO
537
Smal
l
325
Ifuga
o36
2 Lu
min
gay
St.,
Pob.
Nor
th, L
agaw
e,
Ifuga
o 36
00M
s. M
arjo
rie
P. M
alin
gan
Mr. V
icen
te H
. Lun
ag(0
74)
382-
2106
O54
8Sm
all
483
Itogo
nIto
gon,
Ben
guet
260
4En
gr. L
omin
o N
. Kam
iteng
(O
IC)
Engr
. Lom
ino
N. K
amite
ngN
O
100
La T
rini
dad
Km
. 5, C
entr
al P
ico,
La T
rini
dad,
Ben
guet
26
01En
gr. O
liver
L. T
aule
Engr
. Joh
n P.
Cut
iyog
(074
) 42
2-26
79 /
2078
/ 18
48 /
2477
(074
) 42
2-18
48O
10,1
69M
ediu
m
442
Laga
ngila
ngPo
blac
ion,
Laa
ng, L
agan
gila
ng, A
bra
2802
Mr. W
infr
ed T
. Gao
iran
Mr. V
icen
te A
. Tan
seco
(074
) 75
2-77
60
(req
uest
)O
565
Smal
l
469
Lubu
agan
Lubu
agan
, Kal
inga
380
2N
O
28M
etro
Ban
gued
Cor
. Taf
t &
Act
ivid
ad E
cono
mia
Sts
., Ba
ngue
d, A
bra
2800
Ms.
Lean
ida
A. B
albi
nM
r. Ju
lian
Q. T
ajol
osa
(IB)
(074
) 75
2-80
01 /
8169
(074
) 75
2-81
69O
5,31
2Bi
g
614
Para
celis
Pa
race
lis, M
ount
ain
Prov
ince
26
25N
O
453
San
Juan
San
Juan
, Abr
a 2
823
Engr
. Elp
idio
Gal
inat
o, Jr
.M
r. Be
njam
in O
. Dic
kson
NO
384
Tabu
kTa
buk,
Kal
inga
380
0En
gr. F
elix
ande
r C
. Fal
gui
Mr.
Jove
nal A
rbol
eda
NO
454
Tayu
mPo
blac
ion,
Tay
um, A
bra
2803
Mr.
Hid
olfo
Bri
llant
esM
s. G
eron
ima
Elve
naN
O
REG
ION
1
Com
pris
es: I
loco
s N
orte
, Ilo
cos
Sur,
La U
nion
& P
anga
sina
n -
53 /
45
468
Agn
oA
gno,
Pan
gasi
nwan
240
8M
r. Ed
uard
o N
avar
ette
Mr.
Dom
inad
or P
. N
avar
roN
O
178
Ago
oFa
ngon
il R
oad,
Sta
. Bar
bara
, Ago
o, L
a U
nion
250
4En
gr. R
omeo
M. D
iaz
(IGM
)M
r. Er
lindo
N. P
ocsi
dio
(072
) 71
0-00
79O
206
Smal
l
34A
lam
inos
City
Ala
min
os C
ity W
D B
ldg.
, Pob
laci
on,
Ala
min
os C
ity, P
anga
sina
n 24
04M
r. Fe
lipe
B. P
agad
orM
r. Le
on M
. Riv
era,
Jr.(0
75)
552-
7180
; 551
-543
2(0
75)
551-
3230
O9,
094
Big
166
Alc
ala
Riz
al A
ve.,
Pob.
Wes
t, A
lcal
a, Pa
ngas
inan
24
25M
r. N
oel R
odri
go A
. Dac
anay
(A
ctin
g)M
r. C
atal
ino
H. M
agno
(075
) 59
3-30
38(0
75)
593-
3038
O1,
000
Smal
l
524
Asi
ngan
May
or’s
Blvd
., Asi
ngan
, Pan
gasi
nan
2439
Engr
. Ale
xand
er C
. Mon
ceM
r. Es
piri
dion
B. S
onac
o(0
75)
563-
2984
(075
) 56
3-29
84O
2,22
7Sm
all
81Ba
doc
Bado
c, Ilo
cos
Nor
te 2
904
Mr.
Esm
eral
do C
. Aga
bin
O60
0Sm
all
59Ba
laoa
nN
at’l
Hi-w
ay -
Dr.
Cam
ilo O
sias
, Bal
aoan
, La
Uni
on 2
517
Engr
. Vic
tor
R. O
billo
Mr.
Ric
hard
I. R
amire
z(0
72)
607-
0360
(072
) 60
7-03
60O
921
Smal
l
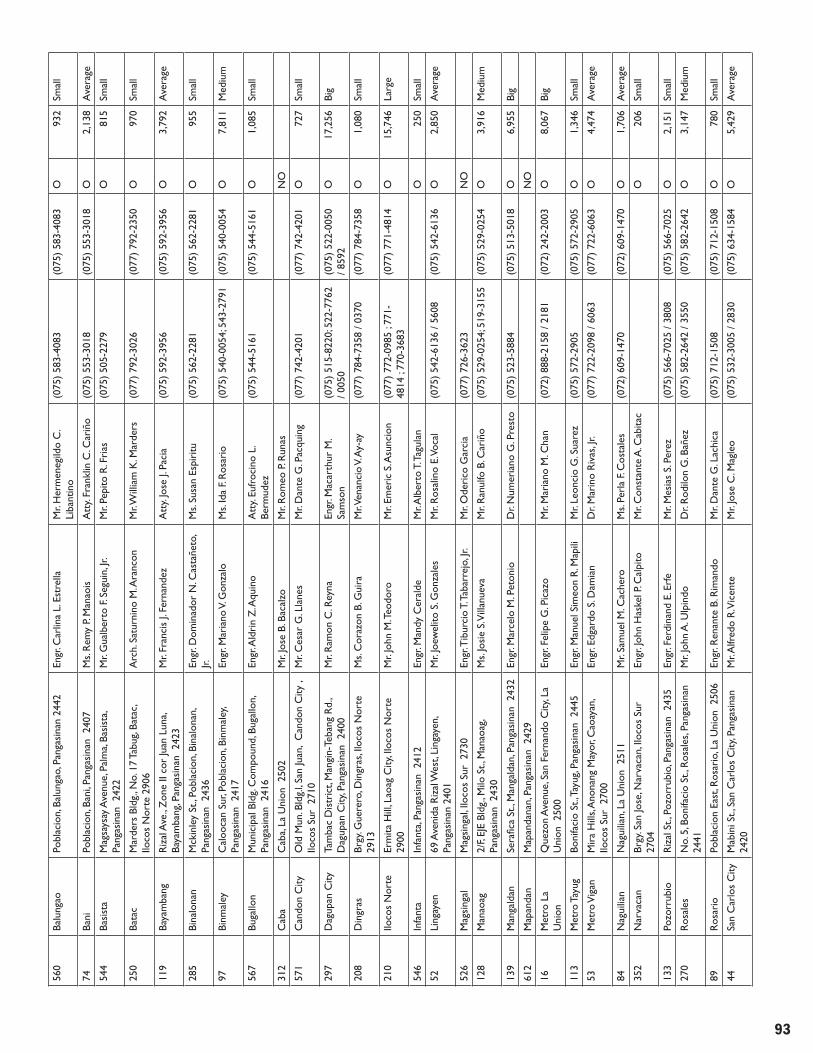
93
560
Balu
ngao
Pobl
acio
n, B
alun
gao,
Pan
gasi
nan
2442
Engr
. Car
lina
L. E
stre
llaM
r. H
erm
eneg
ildo
C.
Liba
ntin
o(0
75)
583-
4083
(075
) 58
3-40
83O
932
Smal
l
74Ba
niPo
blac
ion,
Ban
i, Pa
ngas
inan
240
7M
s. R
emy
P. M
anao
isA
tty.
Fran
klin
C. C
ariñ
o(0
75)
553-
3018
(075
) 55
3-30
18O
2,13
8A
vera
ge
544
Basi
sta
Mag
says
ay A
venu
e, P
alm
a, Ba
sist
a, Pa
ngas
inan
242
2M
r. G
ualb
erto
F. S
egui
n, Jr
.M
r. Pe
pito
R. F
rias
(075
) 50
5-22
79O
815
Smal
l
250
Bata
cM
arde
rs B
ldg.
, No.
17
Tabu
g, Ba
tac,
Iloco
s N
orte
290
6A
rch.
Sat
urni
no M
. Ara
ncon
Mr. W
illia
m K
. Mar
ders
(077
) 79
2-30
26(0
77)
792-
2350
O97
0Sm
all
119
Baya
mba
ngR
izal
Ave
., Z
one
II co
r Ju
an L
una,
Baya
mba
ng, P
anga
sina
n 2
423
Mr.
Fran
cis
J. Fe
rnan
dez
Att
y. Jo
se J.
Pac
ia(0
75)
592-
3956
(075
) 59
2-39
56O
3,79
2A
vera
ge
285
Bina
lona
nM
ckin
ley
St.,
Pobl
acio
n, B
inal
onan
, Pa
ngas
inan
243
6En
gr. D
omin
ador
N. C
asta
ñeto
, Jr.
Ms.
Susa
n Es
piri
tu(0
75)
562-
2281
(075
) 56
2-22
81O
955
Smal
l
97Bi
nmal
eyC
aloo
can
Sur,
Pobl
acio
n, B
inm
aley
, Pa
ngas
inan
241
7En
gr. M
aria
no V
. Gon
zalo
Ms.
Ida
F. R
osar
io(0
75)
540-
0054
; 543
-279
1(0
75)
540-
0054
O7,
811
Med
ium
567
Buga
llon
Mun
icip
al B
ldg.
Com
poun
d, B
ugal
lon,
Pa
ngas
inan
241
6En
gr. A
ldri
n Z
. Aqu
ino
Att
y. Eu
froc
ino
L.
Berm
udez
(075
) 54
4-51
61(0
75)
544-
5161
O1,
085
Smal
l
312
Cab
aC
aba,
La U
nion
250
2M
r. Jo
se B
. Bac
alzo
Mr.
Rom
eo P
. Run
asN
O
571
Can
don
City
Old
Mun
. Bld
g.l,
San
Juan
, C
ando
n C
ity ,
Iloco
s Su
r 2
710
Mr.
Ces
ar G
. Lla
nes
Mr.
Dan
te G
. Pac
quin
g(0
77)
742-
4201
(077
) 74
2-42
01O
727
Smal
l
297
Dag
upan
City
Tam
bac
Dis
tric
t, M
angi
n-Te
bang
Rd.
, D
agup
an C
ity, P
anga
sina
n 2
400
Mr.
Ram
on C
. Rey
naEn
gr. M
acar
thur
M.
Sam
son
(075
) 51
5-82
20; 5
22-7
762
/ 005
0(0
75)
522-
0050
/ 8
592
O17
,256
Big
208
Din
gras
Brgy
. Gue
rero
, Din
gras
, Ilo
cos
Nor
te
2913
Ms.
Cor
azon
B. G
uira
Mr. V
enan
cio
V. A
y-ay
(077
) 78
4-73
58 /
0370
(077
) 78
4-73
58O
1,08
0Sm
all
210
Iloco
s N
orte
Erm
ita H
ill, L
aoag
City
, Ilo
cos
Nor
te
2900
Mr.
John
M. T
eodo
roM
r. Em
eric
S. A
sunc
ion
(077
) 77
2-09
85 ;
771-
4814
; 77
0-36
83(0
77)
771-
4814
O15
,746
Larg
e
546
Infa
nta
Infa
nta,
Pang
asin
an 2
412
Engr
. Man
dy C
eral
deM
r. Alb
erto
T. T
agul
anO
250
Smal
l
52Li
ngay
en69
Ave
nida
Riz
al W
est,
Ling
ayen
, Pa
ngas
inan
240
1M
r. Jo
ewel
ito S
. Gon
zale
sM
r. R
osal
ino
E. V
ocal
(075
) 54
2-61
36 /
5608
(075
) 54
2-61
36O
2,85
0A
vera
ge
526
Mag
sing
alM
agsi
ngal
, Ilo
cos
Sur
273
0En
gr. T
ibur
cio
T. Ta
barr
ejo,
Jr.
Mr.
Ode
rico
Gar
cia
(077
) 72
6-36
23N
O
128
Man
aoag
2/F,
EJE
Bldg
., M
ilo S
t., M
anao
ag,
Pang
asin
an 2
430
Ms.
Josi
e S.
Vill
anue
vaM
r. R
anul
fo B
. Car
iño
(075
) 52
9-02
54; 5
19-3
155
(075
) 52
9-02
54O
3,91
6M
ediu
m
139
Man
gald
anSe
rafi c
a St
., M
anga
ldan
, Pan
gasi
nan
243
2En
gr. M
arce
lo M
. Pet
onio
D
r. N
umer
iano
G. P
rest
o(0
75)
523-
5884
(075
) 51
3-50
18O
6,95
5Bi
g
612
Map
anda
nM
apan
dana
n, P
anga
sina
n 2
429
NO
16M
etro
La
Uni
onQ
uezo
n A
venu
e, S
an F
erna
ndo
City
, La
Uni
on 2
500
Engr
. Fel
ipe
G. P
icaz
oM
r. M
aria
no M
. Cha
n(0
72)
888-
2158
/ 21
81(0
72)
242-
2003
O8,
067
Big
113
Met
ro T
ayug
Boni
faci
o St
., Tay
ug, P
anga
sina
n 2
445
Engr
. Man
uel S
imeo
n R
. Map
iliM
r. Le
onci
o G
. Sua
rez
(075
) 57
2-29
05(0
75)
572-
2905
O1,
346
Smal
l
53M
etro
Vig
anM
ira
Hill
s, A
nona
ng M
ayor
, Cao
ayan
, Ilo
cos
Sur
270
0En
gr. E
dgar
do S
. Dam
ian
Dr.
Mar
ino
Riv
as, J
r.(0
77)
722-
2098
/ 60
63(0
77)
722-
6063
O4,
474
Ave
rage
84N
agui
lian
Nag
uilia
n, L
a U
nion
251
1M
r. Sa
mue
l M. C
ache
roM
s. Pe
rla
F. C
osta
les
(072
) 60
9-14
70(0
72)
609-
1470
O1,
706
Ave
rage
352
Nar
vaca
nBr
gy. S
an Jo
se, N
arva
can,
Iloc
os S
ur
2704
Engr
. Joh
n H
aske
l P. C
alpi
toM
r. C
onst
ante
A. C
abita
cO
206
Smal
l
133
Pozo
rrub
ioR
izal
St.,
Poz
orru
bio,
Pan
gasi
nan
243
5En
gr. F
erdi
nand
E. E
rfe
Mr.
Mes
ias
S. Pe
rez
(075
) 56
6-70
25 /
3808
(075
) 56
6-70
25O
2,15
1Sm
all
270
Ros
ales
No.
5, B
onifa
cio
St.,
Ros
ales
, Pan
gasi
nan
24
41M
r. Jo
hn A
. Ulp
indo
Dr.
Rod
ilon
G. B
añez
(075
) 58
2-26
42 /
3550
(075
) 58
2-26
42O
3,14
7M
ediu
m
89R
osar
ioPo
blac
ion
East
, Ros
ario
, La
Uni
on 2
506
Engr
. Ren
ante
B. R
iman
doM
r. D
ante
G. L
achi
ca(0
75)
712-
1508
(075
) 71
2-15
08O
780
Smal
l
44Sa
n C
arlo
s C
ityM
abin
i St.,
San
Car
los
City
, Pan
gasi
nan
24
20M
r. Alfr
edo
R. V
icen
teM
r. Jo
se C
. Mag
leo
(075
) 53
2-30
05 /
2830
(075
) 63
4-15
84O
5,42
9A
vera
ge

94
329
San
Jaci
nto
San
Jaci
nto,
Pan
gasi
nan
243
1M
r. Pa
troc
ino
Dum
pit
Ms.
Ade
laid
a N
ato
NO
562
San
Man
uel
San
Man
uel,
Pang
asin
an 2
438
Engr
. Car
olin
a M
oral
eda
O96
7Sm
all
207
San
Nic
olas
Brgy
. 11,
San
Nic
olas
, Ilo
cos
Nor
te 2
901
Dr. W
ilson
D. d
ela
Cru
zM
s. M
arie
l S. H
erna
ndo
(077
) 77
0-40
17 ;
773-
1212
(077
) 77
0-40
17O
3,20
9A
vera
ge
255
San
Nic
olas
Zam
ora
St.,
San
Nic
olas
, Pan
gasi
nan
24
47En
gr. M
arite
s R
. Gon
zale
sM
r. Sa
ntia
go S
. Rea
ligue
(075
) 57
3-37
53(0
75)
573-
3753
O1,
441
Smal
l
553
San
Qui
ntin
Pob.
, Zon
e 1
San
Qui
ntin
, Pan
gasi
nan
24
44En
gr. J
ayso
n C
. Ant
olin
Ms.
Jovi
ta R
. Ord
onio
(075
) 57
5-33
42 /
2629
(075
) 57
5-33
42O
668
Smal
l
299
Sant
aSa
nta,
Iloco
s Su
r 2
703
Mr.
Edua
rdo
Saba
lbur
oO
400
Smal
l
417
Sant
a C
ruz
Sant
a C
ruz,
Iloco
s Su
r 2
713
Mr. A
dria
n Ve
lasc
o, Jr
.N
O
349
Sant
a Lu
cia
Bara
ngob
ong,
Sant
a Lu
cia,
Iloco
s Su
r
2712
Mr. A
leja
ndro
E. F
aust
oM
r. D
omin
go B
. Bod
año
(077
) 67
4-77
92(0
77)
674-
7792
O32
0Sm
all
311
Sant
a M
aria
Sant
a M
aria
, Ilo
cos
Sur
270
5M
r. G
odof
redo
Bel
mon
teN
O
554
Sant
a M
aria
Cen
daña
cor
. Mun
an S
ts.,
Pob.
Wes
t, Sa
nta
Mar
ia, P
anga
sina
n 24
40M
r. Ant
onio
N. J
unio
Ms.
Luis
a S.
Pasc
ua(0
75)
574-
2105
/ 26
55(0
75)
574-
2105
O
1,37
2Sm
all
429
Sant
o D
omin
goSa
nto
Dom
ingo
, Ilo
cos
Sur
272
9N
O
350
Sarr
atBr
gy. 5
, Sta
. Bar
bara
, Sar
rat,
Iloco
s N
orte
29
14M
s. Fl
oren
ce S
. Gel
acio
Mr.
Evar
isto
R. A
gor,
Jr.(0
77)
782-
2091
(077
) 78
2-20
91O
744
Smal
l
573
Sina
itSi
nait,
Iloc
os S
ur 2
733
Mr.
Man
uel I
nes
Ms.
Elen
a C
abac
uñga
nO
Smal
l
177
Tagu
din
G/F
, Gar
deni
a’s B
ldg.
, Del
Pila
r, Tag
udin
, Ilo
cos
Sur
271
4M
r. U
lpia
no C
. Vill
amar
Mr.
Edua
rdo
M. C
usto
dio
(077
) 65
2-20
12(0
77)
652-
2012
O1,
007
Smal
l
148
Um
inga
nPr
ogre
so S
t., U
min
gan,
Pan
gasi
nan
244
3M
r. Ju
an F
. Cal
ibus
o, Jr
.En
gr. S
impl
icio
C.
Belis
ario
, Jr.
(075
) 57
6-21
70(0
75)
576-
2170
O1,
008
Smal
l
304
Urb
izto
ndo
Luna
St.,
Urb
izto
ndo,
Pan
gasi
nan
241
4M
r. R
afae
l L. A
lmen
dral
aM
r. R
izal
O. M
endo
za(0
75)
594-
3713
O82
4Sm
all
24U
rdan
eta
City
Cul
tura
l & S
port
s C
ente
r, U
rdan
eta
City
, Pa
ngas
inan
242
8M
r. C
asia
no J.
Cal
lant
aM
r. Jo
se D
. Sum
ait
(075
) 56
8-24
25 /
3553
(075
) 56
8-35
53O
4,81
7M
ediu
m
95V
illas
isPo
blac
ion,
Vill
asis
, Pan
gasi
nan
242
7M
r. Ly
dio
S. R
agui
ndin
Mr.
Rom
eo S
. Abr
enic
a(0
75)
564-
4016
(075
) 56
4-40
16O
2,54
5A
vera
ge
REG
ION
2
Com
pris
es: C
agay
an, I
sabe
la,
Qui
rino
& N
ueva
Viz
caya
- 4
1 / 2
5
354
Agl
ipay
-Sag
uday
San
Leon
ardo
, Agl
ipay
, Qui
rino
340
3M
r. Pr
imiti
vo D
. Tal
lung
anN
O
535
Alc
ala
Alc
ala,
Cag
ayan
350
7M
r. Lo
renz
o A
. Cla
vine
z, Jr.
Mr.
Erne
sto
Man
uel
NO
198
Alic
iaM
unic
ipal
Com
p., Q
uezo
n St
., M
agsa
ysay
, A
licia
, Isa
bela
330
6M
s. M
aria
Nim
fa C
. Abu
anD
r. Fe
lipe
A. S
alva
dor,
Jr.(0
78)
662-
7172
(078
) 66
2-71
72O
1,01
2Sm
all
426
Alla
capa
nA
llaca
pan,
Cag
ayan
352
3M
r. Pa
cifi c
o Ba
laan
NO
278
Ang
adan
anC
entr
o II,
Ang
adan
an, I
sabe
la 3
307
Mr.
Man
uel S
. Gaf
fud
Mr.
Hila
rion
M. M
aria
no(0
78)
694-
1009
(078
) 69
4-10
09O
575
Smal
l
68A
parr
iJ. A
bad
Sant
os S
t., S
an A
nton
io, A
parr
i, C
agay
an 3
515
Mr.
Ram
on F
. Gor
ospe
Ms.
Emer
enci
ana
A.
Gar
cia
(078
) 82
2-83
79(0
78)
822-
8379
O1,
309
Smal
l
391
Balle
ster
osBa
llest
eros
, Cag
ayan
351
6N
O
196
Bam
bang
Bam
bang
, Nue
va V
izca
ya 3
702
Mr.
Este
ban
Pobr
eN
O
283
Beni
to S
oliv
enD
istr
ict
2, B
enito
Sol
iven
, Isa
bela
333
1En
gr. W
ilson
G. V
alde
z M
r. Je
olito
Ave
s(0
78)
622-
3623
O21
6Sm
all
392
Bugu
ey-S
ta.
Tere
sita
Cen
tro,
Bug
uey,
Cag
ayan
351
1M
r. Ju
lio V
aler
osN
O

95
182
Cab
agan
Cen
tro,
Cab
agan
, Isa
bela
332
8M
r. C
andi
do T
. Cal
ata,
Jr.M
s. Es
ther
Z. A
nton
io(0
78)
636-
3107
(078
) 63
6-31
07O
1,86
7Sm
all
344
Cab
arro
guis
BLIS
S, Z
amor
a, C
abar
rogu
is, Q
uiri
no
3400
Mr.
Joel
C. N
arci
soEn
gr. P
aulin
o B.
Tur
la(0
927)
222
-497
7O
167
Smal
l
538
Cab
atua
nC
abat
uan,
Isab
ela
331
5M
r. D
emet
rio
J. M
arce
loN
O
183
Cau
ayan
City
#166
Cor
. Afr
ican
o &
Bur
gos
Sts.
, C
auay
an C
ity, I
sabe
la 3
305
Engr
. Art
emio
A. Q
uint
ero
Mr.
Gil
AQ
. Guz
man
(078
) 65
2-21
96 ;
897-
1318
(078
) 65
2-06
44O
5,77
7Bi
g
203
Cla
veri
a#
69 C
entr
o 2,
Cla
veri
a, C
agay
an 3
519
Dr. A
drel
ina
N. P
ulid
oA
tty.
Cec
ilio
SY. J
avie
r, Jr.
(078
) 86
6-10
24(0
78)
866-
1024
O93
9Sm
all
287
Cor
don
Mag
says
ay, C
ordo
n, Is
abel
a 33
12En
gr. G
odof
redo
L. V
icm
udo
Mr.
Gen
e G
. Nav
al(0
78)
694-
9019
(078
) 69
4-90
19O
661
Smal
l
412
Del
fi n A
lban
oD
elfi n
Alb
ano,
Isab
ela
332
6M
r. N
elso
n B.
Tag
ufa
NO
613
Dia
diD
iadi
, Nue
va V
izca
ya 3
712
NO
279
Diff
unPu
blic
Mar
ket
Bldg
., D
iffun
, Qui
rino
34
01En
gr. M
anue
l T. M
eña
Mr.
Cle
men
te S
. Sal
vado
r, Jr.
(078
) 69
4-70
50(0
78)
694-
7015
O
695
Smal
l
615
Gam
uG
amu,
Isab
ela
NO
239
Gat
tara
nM
ahar
lika
Hi-w
ay c
or. L
iban
St.,
Gat
tara
n,
Cag
ayan
350
8En
gr. J
oel G
. Sin
gson
Engr
. Dan
ilo C
. Nol
asco
O23
6Sm
all
214
Gon
zaga
29 A
ddur
o St
., Sm
art
Zon
e, G
onza
ga,
Cag
ayan
351
3M
r. M
arco
s G
. Gas
par
Mr.
Pedr
o B.
Cim
atu
(078
) 85
6-65
02
(req
uest
)O
1,07
5Sm
all
90Ila
gan
2/F
Publ
ic M
arke
t Bl
dg.,
Riz
al S
t., Il
agan
, Is
abel
a 3
300
Engr
. Jos
e M
ari G
. Cla
rava
llEn
gr. T
omas
A. B
eltr
an(0
78)
624-
2083
; 62
2-27
64(0
78)
624-
2083
O2,
321
Ave
rage
302
Lal-l
oM
unic
ipal
Hal
l Com
poun
d, C
entr
o, L
al-
lo, C
agay
an 3
509
Engr
. Jos
e Ja
cob
S. M
edin
acel
iM
r. Em
ilio
P. D
agur
o(0
78)
854-
3026
(078
) 85
4-30
26O
828
Smal
l
374
Lasa
mLa
sam
, Cag
ayan
352
4M
r. Ig
naci
o B.
Juad
o, Jr
.M
r. M
enes
es S
. Seb
astia
nN
O
460
Luna
Cen
tro,
Lun
a, Is
abel
a 3
304
Mr.
Rom
ulo
C. M
artin
ezN
O
337
Mad
dela
Pobl
acio
n Su
r, M
adde
la, Q
uiri
no 3
404
Mr.
Edar
lino
A. L
adia
Mr.
Benj
amin
Gal
apon
O10
5Sm
all
65M
etro
Tu
gueg
arao
2/
F, Su
perm
arke
t Bl
dg., T
ugue
gara
o C
ity,
Cag
ayan
350
0M
r. Arn
ulfo
P. V
illan
iaD
r. R
osar
io S
. Mal
long
a(0
78)
844-
1586
/ 73
09(0
78)
844-
8540
O22
,596
Big
458
Peña
blan
caC
amas
i, Pe
ñabl
anca
, Cag
ayan
350
2En
gr. C
alix
to C
. de
Leon
Mr. A
dria
no D
. Tag
acay
(078
) 30
4-04
98O
902
Smal
l
294
Ram
onG
/F, O
ld M
unic
ipal
Bld
g., R
amon
, Isa
bela
33
19En
gr. H
ercu
lano
P. V
alm
oja
Mr.
Jose
G. C
astil
loO
338
Smal
l
572
Rei
na M
erce
des
Tallu
ngan
, Rei
na M
erce
des,
Isab
ela
3303
Dr.
Rom
eo B
. Bal
ayan
(092
7) 3
93-5
152
O75
0Sm
all
199
Rox
as2/
FPub
lic M
arke
t Bl
dg.,
M. M
arco
s Ave
., R
oxas
, Isa
bela
332
0En
gr. J
uani
to S
. Sal
udar
es, J
r.M
r. R
olan
do B
. Lin
tao
(078
) 64
2-81
46O
1,63
7A
vera
ge
485
San
Gui
llerm
oC
entr
o I,
San
Gui
llerm
o, Is
abel
a 3
308
Engr
. Dav
id K
. Tom
asM
r. Ir
eneo
P. N
arne
(076
) 62
2-20
28N
O
421
San
Man
uel
Dis
tric
t 3,
San
Man
uel,
Isab
ela
3317
Engr
. Edg
ar P
. Cas
ayur
anM
r. Fe
lino
Mat
eo(0
78)
664-
6185
O1,
220
Smal
l
338
San
Mar
iano
San
Mar
iano
, Isa
bela
333
2N
O
534
Sanc
hez
Mir
aM
ahar
lika
Hi-w
ay, C
entr
o I,
Sanc
hez
Mir
a, C
agay
an 3
518
Engr
. Mar
iano
R. A
gdep
paM
r. Arn
ulfo
A. A
post
ol(0
78)
822-
9231
(078
) 82
2-92
31O
700
Smal
l
585
Sant
a A
naC
entr
o, S
anta
Ana
, Cag
ayan
351
4A
rch.
Nes
tor
S. Bu
man
glag
Engr
. Arn
old
G. C
osta
les
(078
) 37
2-05
31O
215
Smal
l
411
Sant
a M
aria
Sant
a M
aria
, Isa
bela
333
0M
r. R
omeo
G. C
arin
ugan
Mr.
Dan
ilo C
abau
atan
NO
92Sa
ntia
go
3 C
arre
on S
t., C
entr
o Ea
st, S
antia
go
City
, Isa
bela
331
1M
r. Win
ston
A. F
ozD
r. Jo
se C
. Nav
arro
, Jr.
(078
) 68
2-83
00 /
5639
(078
) 68
2-83
00O
6,67
8Bi
g
480
Tuao
Tuao
, Cag
ayan
352
8M
r. R
ober
to G
. Rec
heta
NO
309
Tum
auin
i2/
F Pu
blic
Mar
ket
Bldg
., Sa
n Pe
dro,
Tu
mau
ini,
Isab
ela
332
5M
r. Ju
stito
S. J
imen
ez, J
r.M
r. Ig
naci
o B.
Cab
auat
an(0
78)
632-
4051
(078
) 63
2-40
51O
1,55
0Sm
all

96
REG
ION
3
Com
pris
es: A
uror
a, Bu
laca
n, P
ampa
nga,
Tarl
ac
Nue
va E
cija
, Bat
aan
& Z
amba
les
- 10
0 / 8
3
292
Ang
at26
9 M
.A. F
erna
ndo
St., A
ngat
, Bul
acan
30
12En
gr. A
rtur
o S.
Torr
esM
r. El
mer
F. G
onza
les
(044
) 67
1-12
04(0
44)
908-
0058
O5,
575
Med
ium
322
Ang
eles
City
Pam
pang
Roa
d, B
rgy.
Lour
des
Nor
th
Wes
t, A
ngel
es C
ity 2
008
Engr
. Rom
eo P
. Cal
ara
Mr.
Edga
r C
. Lop
ez(0
45)
888-
7222
/ 43
52 /
4891
; 323
-420
9(0
45)
888-
7222
O34
,809
Larg
e
463
Ara
yat
Ara
yat,
Pam
pang
a 20
12M
s. Lo
rna
S. K
iban
off
Mr.
Efre
n Pa
min
tuan
NO
160
Baco
lor
Sta.
Ines
, Bac
olor
, Pam
pang
a 20
01M
s. Lu
cian
a R
. Cap
iliEn
gr. B
embe
nuto
M.
Mag
laqu
i(0
45)
900-
2911
O76
0Sm
all
272
Baga
cO
ld M
unic
ipal
Bld
g., B
agac
, Bat
aan
2107
Mr.
Edua
rdo
C. M
endo
zaM
sa. T
eres
ita M
. Bar
ker
(047
) 61
2-03
38O
1,25
0Sm
all
362
Bala
gtas
BCC
DI B
ldg.
, Waw
a, Ba
lagt
as, B
ulac
an
3016
Engr
. Jes
us A
. Gar
cia
Ms.
Ani
ta C
. Rab
uya
(044
) 69
3-10
62(0
44)
693-
1062
O2,
097
Smal
l
124
Bala
nga
St. J
osep
h St
., Po
blac
ion
Bala
nga
City
, Ba
taan
210
0M
r. C
arlit
o B.
de
Leon
En
gr. R
icar
do B
. Dat
u(0
47)
237-
3491
(047
) 23
7-38
68O
6,00
4M
ediu
m
233
Bale
rT.
Mol
ina
St.,
Brgy
. V, B
aler
, Aur
ora
3200
Mr.
Port
ia L
. Alc
aide
Ms.
Glo
ria
S. Pa
ladi
o(0
919)
449
-037
6O
326
Smal
l
407
Baliw
agB.
A. A
quin
o A
venu
e, B
aliw
ag, B
ulac
an
3006
Mr. A
rtem
io F
. Bay
losi
sM
r. C
onra
do E
. Ev
ange
lista
(044
) 76
6-26
18 ;
673-
2682
(044
) 76
6-37
37O
17,6
80Bi
g
223
Bam
ban
Bam
ban,
Tar
lac
2317
NO
86Bo
caue
No.
130
Gov
. F. H
alili
Ave
. Ext
n., B
iñan
g II,
Bo
caue
, Bul
acan
301
8En
gr. R
icar
do B
. Per
ezM
r. R
aine
rio
Y. Sa
ntos
(044
) 69
2-16
59 /
5864
(044
) 69
2-58
64O
7,29
4M
ediu
m
410
Bong
abon
#82
Brgy
. Mag
tang
gol,
Bong
abon
, Nue
va
Ecija
312
8M
r. D
anilo
R. G
amill
a II
Mr.
Emm
anue
l D.
Men
doza
(044
) 96
1-00
79(0
44)
961-
0079
O1,
365
Smal
l
545
Boto
lan
Banc
al, B
otol
an, Z
amba
les
2202
NO
378
Bula
can
Agu
as P
otab
les
Bldg
., Ba
gum
baya
n,
Bula
can,
Bul
acan
301
7M
s. M
a. Li
za D
J. D
ela
Cru
z (O
IC)
Ms.
Ma.
Lour
des
C.d
ela
Cru
z(0
44)
792-
0191
; 66
8-14
99(0
44)
792-
0191
O9,
195
Med
ium
369
Bust
osA
. Ray
mun
do S
t., P
obla
cion
, Bus
tos,
Bula
can
3007
Mr.
Jose
Adl
ai G
. Tan
cang
coM
r. R
estit
uto
L.
Ray
mun
do(0
44)
617-
1514
; (02
) 29
9-82
99(0
44)
903-
0301
; (0
2) 2
99-8
299
O7,
763
Big
15C
aban
atua
n C
ity22
9 Br
gy. D
icar
ma
CV
R,
Cab
anat
uan
City
, Nue
va E
cija
310
0M
r. M
ario
G. V
illas
anM
r. Art
uro
G. V
illas
an(0
44)
463-
1643
to
47 ;
964-
2274
(044
) 46
3-16
43
/ 164
6O
26,9
03Bi
g
505
Cab
anga
nD
olor
es, C
aban
gan,
Zam
bale
s 22
03En
gr. H
onor
io L
. Dila
g, Jr.
Ms.
Dom
inga
R. A
vizo
(091
6) 3
50-0
551
O73
4Sm
all
414
Cab
iao
San
Juan
Sou
th, C
abia
o, N
ueva
Eci
ja 3
107
Engr
. Man
uel L
. Lug
tuEn
gr. M
anue
l Ort
iz(0
44)
486-
3678
(044
) 48
6-56
15
/ 367
8O
3,20
0A
vera
ge
140
Cal
umpi
tBa
lung
ao, C
alum
pit,
Bula
can
3003
Engr
. Efr
en Z
. Red
Mr. A
rthu
r M
. Car
los
(044
) 67
5-23
80 /
2550
/ 1
453
(044
) 20
2-51
25O
15,1
33Bi
g
43C
amili
ngLu
na S
t., P
obla
cion
E, C
amili
ng, T
arla
c 23
06En
gr. E
mili
o T.
Julia
nM
r. Fe
deri
co L
. Man
uel,
Jr.(0
45)
934-
0284
/ 03
04
/ 149
1(0
45)
934-
1907
O6,
359
Big
593
Can
daba
B. A
quin
o A
ve.,
Sitio
7, P
ulon
g Pl
azan
, C
anda
ba, P
ampa
nga
2013
Engr
. Fra
ncis
G. V
inuy
aD
r. Po
ncia
no M
. G
atbo
nton
, Jr.
O1,
236
Smal
l
541
Can
dela
ria
Pobl
acio
n, C
ande
lari
a, Z
amba
les
2212
Ms.
Vir
gini
a Q
. Fer
rer
Mr.
Ger
vaci
o Sa
les,
Jr.(0
917)
396
-107
4O
470
Smal
l
262
Cap
asM
unic
ipal
Hal
l, C
apas
, Tar
lac
2315
Mr.
Leon
ardo
J. P
anlic
anD
r. Fr
anci
sco
Oco
NO

97
551
Cas
tille
jos
Mun
. Hea
lth C
tr. C
ompd
., Sa
n A
gust
in,
Cas
tille
jos,
Zam
bale
s 22
08En
gr. D
omin
ador
A. G
alla
rdo
(OIC
)D
r. Em
ily S
. Cam
us
(Act
ing
Cha
ir)
(047
) 62
4-14
53(0
47)
624-
1453
O87
4Sm
all
288
City
of M
alol
osPo
blac
ion,
City
of M
alol
os, B
ulac
an 3
000
Mr.
Nic
asio
C. R
eyes
Mr.
Rom
eo M
. Cru
z(0
44)
791-
4539
/ 35
62(0
44)
791-
4539
O35
,458
Med
ium
40C
ity o
f San
Fe
rnan
doB.
Men
doza
St.,
City
of S
an F
erna
ndo,
Pa
mpa
nga
2000
Engr
. Jor
ge P
. Gum
baD
r. En
rica
S. R
eyes
(045
) 96
1-35
46(0
45)
963-
3729
O21
,335
Larg
e
134
Con
cepc
ion
Jaci
nto
St.,
San
Nic
olas
, Con
cepc
ion,
Ta
rlac
231
6En
gr. R
olan
do T
. Est
acio
Mr.
Rom
eo P
. Sab
lan
(045
) 92
3-04
30(0
45)
923-
1576
O6,
015
Big
224
Cuy
apo
Mul
ti-Pu
rpos
e Bl
dg.,
M.L
. Que
zon
Ave
., C
uyap
o, N
ueva
Eci
ja 3
117
Engr
. Gil
E. E
steb
anM
r. Jo
se I.
Hid
algo
, Sr.
(044
) 60
8-02
41(0
44)
608-
0237
O1,
200
Smal
l
409
Din
alup
ihan
Pag-
asa,
Kat
aasa
n, D
inal
upih
an, B
ataa
n 21
10M
r. Vir
gilio
P. M
anal
ili
Mr.
Fran
cisc
o R
ey C
. C
uart
ero,
Jr.
(047
) 48
1-14
44 /
3718
(047
) 48
1-37
17O
6,09
5M
ediu
m
408
Dip
acul
aoG
en. L
una
St.,
Nor
th P
ob.,
Dip
acul
ao,
Aur
ora
3203
Mr.
John
ny M
. Mac
tal
Mr.G
rego
rio
Batu
riO
554
Smal
l
256
Flor
idab
lanc
aR
izal
St.,
Pob
., Fl
orid
abla
nca,
Pam
pang
a 20
06M
r. Je
ffrey
C. L
inta
gA
tty.
Ros
elle
r T. L
ogro
nio
(045
) 97
0-03
37 /
1466
(045
) 97
0-10
97O
10,5
44Bi
g
493
Gab
aldo
nG
abal
don,
Nue
va E
cija
313
1M
r. Am
ado
Vill
aman
toM
r. Fr
anci
sco
L. B
aluy
otN
O
21G
apan
City
Tin
io S
t., S
an V
icen
te, G
apan
City
, Nue
va
Ecija
310
5En
gr. E
dmun
do T
. Est
acio
(IG
M)
Mr.
Ray
mun
do C
. Mat
ias
(044
) 97
6-20
40(0
44)
976-
1823
O3,
318
Ave
rage
353
Gen
. M.
Nat
ivid
adPo
b., G
en. M
. Nat
ivid
ad, N
ueva
Eci
ja
3125
Ms.
Mar
y Ja
ne S
. Ver
aEn
gr. F
erdi
nand
B. Y
ango
O39
5Sm
all
191
Gen
. Tin
ioPo
b. C
entr
al, G
en. T
inio
, Nue
va E
cija
31
04M
s. Jo
cely
n C
. Paj
arill
aga
Att
y. C
elso
P. A
besa
mis
(044
) 97
3-02
90(0
44)
973-
0290
O1,
859
Ave
rage
222
Ger
ona
Don
Ped
ro S
imeo
n St
., G
eron
a, Ta
rlac
23
02M
r. Ed
uard
o D
.L. T
añed
oM
r. O
scar
T. S
ison
(045
) 60
8-04
07(0
45)
608-
0407
O1,
859
Smal
l
46G
uagu
a#4
0 Sa
n N
icol
as S
t., G
uagu
a, Pa
mpa
nga
2003
Mr.
Edua
rdo
P. R
odri
guez
Mr.
Mar
celin
o C
. Jia
o(0
45)
900-
0547
; 96
3-76
02(0
45)
900-
2949
O8,
779
Med
ium
295
Gui
mba
Cor
. Fai
gal &
Dan
zala
n St
s., G
uim
ba,
Nue
va E
cija
311
5En
gr. F
elix
bert
o C
. Leg
arda
Dr. A
rmes
to S
. Cor
puz,
Sr.
(044
) 61
1-12
07(0
44)
611-
0141
O2,
800
Ave
rage
31H
agon
oyG
. Pan
gani
ban
St.,
Sto.
Niñ
o, H
agon
oy,
Bula
can
3002
Engr
. Cel
estin
o S.
Veng
coM
r. R
olda
n R
. Um
ali
(044
) 79
3-00
19 /
0433
/ 1
409
(044
) 79
3-25
24O
23,4
28Bi
g
286
Her
mos
aD
oor
2, Jo
rge
Apt
., M
agsa
ysay
St.,
H
erm
osa,
Bata
an 2
111
Engr
. Cha
rlito
G. R
odri
guez
(IG
M)
Engr
. Enr
ique
Q. G
ita (
IB)
(047
) 49
1-24
72(0
47)
491-
2472
O1,
793
Ave
rage
238
Iba
Riz
al S
t., Z
one
6, Ib
a, Z
amba
les
2201
Engr
. Ado
nis
J. Z
arag
oza,
Jr.D
r. Fe
licia
na A
. Bal
onso
(047
) 81
1-13
32(0
47)
811-
1332
O1,
273
Smal
l
290
Jaen
Pobl
acio
n, Ja
en, N
ueva
Eci
ja 3
109
Engr
. Lam
bert
o L.
Rox
as, J
r.M
s. Em
ilian
a C
. Gar
cia
(044
) 48
6-28
89(0
44)
486-
2889
O1,
929
Smal
l
603
Lica
bSa
n C
rist
obal
, Lic
ab, N
ueva
Eci
ja 3
112
Ms.
Nen
ita B
. Jav
ier
Mr.
Jove
ncio
D.
Laca
men
to(0
917)
803
0125
O40
0Sm
all
379
Lim
ayR
. Am
bros
io S
t., T
owns
ite, L
imay
, Bat
aan
2103
Engr
. Ant
heno
r R
. Gar
cia
Mr.
Rau
l E. E
scal
er(0
47)
244-
5274
(047
) 24
4-52
74O
5,31
5Bi
g
605
Llan
era
Llan
era,
Nue
va E
cija
312
6N
O
232
Luba
o Sa
n N
icol
as I,
Lub
ao, P
ampa
nga
2005
Ms.
Evel
ina
S. G
alic
iaM
r. D
anilo
B. C
apitu
lo(0
45)
971-
6656
(045
) 97
1-66
56O
6,17
3M
ediu
m
316
Lupa
oLu
pao,
Nue
va E
cija
312
2N
O
61M
abal
acat
0255
McA
rthu
r H
i-way
, Mab
iga,
Mab
alac
at, P
ampa
nga
2010
Att
y. Fr
anci
s A. D
imal
iwat
Mr.
Dio
sdad
o T.
Pang
ilina
n(0
45)
331-
7423
/ 74
04
/ 712
0(0
45)
331-
7423
; 62
6-08
38O
24,2
36La
rge
171
Mac
abeb
ePo
blac
ion,
Mac
abeb
e, P
ampa
nga
2018
Mr.
Ren
e B.
Ber
nart
eM
r. Ant
onio
F. P
anga
n, Jr
.(0
45)
921-
1203
(045
) 92
1-07
97O
3,81
8Sm
all
475
Mar
ia A
uror
aM
aria
Aur
ora,
Aur
ora
3202
Mr.
Nic
asio
G. G
atch
alia
nEn
gr. J
aim
e S.
Gos
e, S
r.N
O
227
Mar
ilao
11 T
. San
dico
St.,
Pob
. 2, M
arila
o, B
ulac
an
3019
Mr.
Fern
ando
L. D
iaz
Mr. A
lber
to S
. Asc
ona,
Jr.(0
44)
711-
1529
(044
) 71
1-44
23O
14,3
25A
vera
ge

98
48M
ariv
eles
Prov
’l R
oad,
San
Isid
ro, M
ariv
eles
, Bat
aan
2105
Engr
. Jim
my
L. G
onza
les
Mr.
Ros
auro
C. L
iloc
(047
) 93
5-46
35 /
5561
(047
) 93
5-55
61O
11,1
85Bi
g
320
Mas
anto
lSa
n N
icol
as, M
asan
tol,
Pam
pang
a 20
17M
r. R
olan
do B
. Tol
entin
oM
r. Wilf
redo
P. M
anan
sala
(045
) 98
1-13
06(0
45)
981-
1306
O1,
170
Smal
l
430
Mas
inlo
cEs
tella
St.
cor.
Nat
’l H
i-way
, Mas
inlo
c, Z
amba
les
2211
Mr.
Ren
e E.
Edo
raM
s. A
ngel
ita G
. Erm
ita(0
47)
821-
1248
(047
) 82
1-12
48O
1,75
0Sm
all
335
May
anto
cPo
blac
ion
Nor
te, M
ayan
toc,
Tarl
ac 2
304
Engr
. Cip
rian
o P.
Baut
ista
Mr.
Noe
l L. T
olen
tino
O94
1Sm
all
251
Mey
caua
yan
Pobl
acio
n, C
ity o
f Mey
caua
yan,
Bul
acan
30
20En
gr. M
aria
no C
. San
gala
ng, J
r.M
r. Fe
licia
no G
. Don
ato
(044
) 84
0-45
03 /
7413
(044
) 84
0-45
06O
15,2
38Bi
g
60M
onca
daPo
blac
ion
1, M
onca
da, T
arla
c 23
08En
gr. R
ogel
io B
. Min
a, Jr.
Mr.
Fede
rico
R. A
pdan
(045
) 60
1-04
07(0
45)
601-
0407
O3,
416
Ave
rage
264
Mor
ong
Burg
os S
t., P
obla
cion
, Mor
ong,
Bata
an
2108
Engr
. Dan
ilo T
. Bas
ilio
(IGM
)A
tty.
Reb
ecca
A. B
arbo
(IB
)O
330
Smal
l
328
Muñ
ozE.
Bay
uga
St.,
Scie
nce
City
of M
uñoz
, N
ueva
Eci
ja 3
119
Engr
. Rog
elio
L. M
igue
lM
r. Ed
gard
o S.
dela
Cru
z(0
44)
456-
0599
; 94
5-03
28(0
44)
456-
5063
O2,
865
Med
ium
261
Nor
zaga
ray
Brgy
. Mat
ictic
, Nor
zaga
ray,
Bula
can
3013
Engr
. Aim
er B
. Cru
zEn
gr. J
ose
C. M
endo
za(0
44)
694-
0799
(044
) 69
4-07
99O
6,81
8M
ediu
m
186
Oba
ndo
P. Se
villa
St.,
Cat
angh
alan
, Oba
ndo,
Bu
laca
n 30
21En
gr. L
eona
rdo
C. L
anda
yan
Mr.
Panc
rasi
o F.
dela
Cru
z(0
2) 2
93-0
609
; 294
-096
6 to
68
(02)
293
-060
9 ;
294-
0967
O8,
090
Ave
rage
54O
rani
Cen
tro
Uno
, Ora
ni, B
ataa
n 21
12M
r. Be
nign
o P.
And
res
Dr.
God
ofre
do B
. Gal
icia
, Jr.
(047
) 43
1-13
64 /
1262
; 63
8-15
00(0
47)
431-
1364
O
5,88
3Bi
g
527
Ori
onN
atio
nal R
oad,
Bal
agta
s, O
rion
, Bat
aan
2102
Mr.
Cri
spin
Q. T
ria
Rev
. Leo
nard
o R
. Car
los
(047
) 24
4-67
56(0
47)
244-
6756
O3,
117
Smal
l
529
Pala
uig
Wes
t Po
blac
ion,
Pal
auig
, Zam
bale
s 22
10M
r. R
omel
Y. d
el F
ierr
oM
r. Fe
rnan
do A
. Rey
es, J
r.O
390
Smal
l
343
Pala
yan
City
Brgy
. Mal
ate,
Pal
ayan
City
, Nue
va E
cija
31
32En
gr. G
erar
do L
ope
L. C
allin
gM
s. C
arm
en T
. Sib
lag
(044
) 95
8-17
73(0
44)
958-
1773
O1,
374
Smal
l
271
Pand
i Se
rgio
Osm
eña
St.,
Pobl
acio
n, P
andi
, Bu
laca
n 30
14M
s. El
vira
B. S
anto
sEn
gr. M
arce
lino
S. Sa
ntos
(044
) 66
1-10
50(0
44)
661-
1050
O1,
200
Smal
l
58Pa
niqu
iM
onte
Squ
are
Bldg
., Bu
rgos
St.,
Pan
iqui
, Ta
rlac
230
7M
r. R
aden
C. S
antil
lan
Ms.
Ros
alin
a Y. D
y(0
45)
931-
0293
/ 08
89(0
45)
931-
0889
O5,
560
Ave
rage
509
Pant
aban
gan
Pant
aban
gan,
Nue
va E
cija
312
4N
O
306
Peña
rand
aP.
Padi
lla S
t., P
obla
cion
1, P
eñar
anda
, N
ueva
Eci
ja 3
103
Engr
. Mar
lon
J. Abe
sam
isM
r. G
il A
. Sal
azar
, Sr.
(044
) 48
6-40
49
(044
) 48
6-40
49O
2,92
8M
ediu
m
277
Plar
idel
A.C
. Rey
es S
t., P
lari
del,
Bula
can
3004
Ms.
Ger
trud
es D
. Dum
agui
n (A
ctg)
Att
y. Is
agan
i C. R
amos
(044
) 79
5-01
02 /
1613
(044
) 67
0-27
25O
10,2
23Bi
g
402
Pora
cM
odel
Com
mun
ity, B
rgy.
Pio,
Por
ac,
Pam
pang
a 20
08En
gr. G
il R
. Man
alas
tas
Engr
. Rom
meo
Duy
a(0
45)
329-
3182
(045
) 32
9-31
82O
2,20
0Sm
all
265
Pulil
anBr
gy. C
utco
t, Pu
lilan
, Bul
acan
300
5M
r. Am
ado
E. C
ruz,
Jr.(0
44)
676-
0180
O6,
000
Smal
l
566
Pura
Pura
, Tar
lac
2312
NO
482
Ram
osPo
blac
ion
Cen
ter,
Ram
os, T
arla
c 23
11M
r. M
anue
l E. M
acar
aeg
Mr.
Rem
egio
P. S
oria
no(0
45)
931-
1905
(045
) 93
1-19
05O
952
Smal
l
326
Riz
al24
Vill
anue
va S
t., R
izal
, Nue
va E
cija
312
7M
r. H
erm
ogen
es I.
Im
peri
oN
O
131
San
Ant
onio
Po
blac
ion,
San
Ant
onio
, Nue
va E
cija
31
08M
s. C
elic
idad
P. G
ambo
a M
r. R
ober
to R
. C
riso
stom
o(0
44)
486-
3556
(044
) 48
6-35
56O
2,53
2Sm
all
152
San
Ant
onio
Brgy
. Riz
al, S
an A
nton
io, Z
amba
les
2206
Mr.
Jose
M. S
antia
goM
r. M
aria
no E
. Pas
casi
o(0
47)
913-
4108
(047
) 91
3-41
08O
1,14
2Sm
all
472
San
Felip
eA
bad
St.,
Brgy
. E. F
eria
, San
Fel
ipe,
Z
amba
les
2204
Engr
. Ars
enio
C. P
agal
Mr.
Luis
C. G
arci
a(0
47)
913-
4511
(047
) 91
3-33
09O
1,71
5Sm
all
273
San
Ildef
onso
Don
Ped
ro B
orja
Sub
d., P
ob.,
San
Ildef
onso
, Bul
acan
301
0M
r. G
alo
Ant
onio
V. V
iola
goM
r. Ari
ston
V. F
ranc
isco
(044
) 90
1-10
60 ;
677-
0483
(044
) 90
1-10
60
O5,
669
Med
ium

99
300
San
Isid
roSa
n Is
idro
, Nue
va E
cija
310
6En
gr. L
eand
ro M
agno
Mr.
Rem
egio
Ban
alag
ayO
Smal
l
36Sa
n Jo
se C
ityM
ahar
lika
Rd.
, Aba
r 1s
t, Sa
n Jo
se C
ity,
Nue
va E
cija
312
1En
gr. S
onia
S. N
acua
Dr.
Rel
ito S
. Ign
acio
(044
) 51
1-10
04 /
2671
(044
) 51
1-26
71O
5,24
9M
ediu
m
123
San
Jose
del
M
onte
City
Lot
9, B
lk. 1
9, R
d. 1
, Brg
y. M
inuy
an, C
ity
of S
an Jo
se d
el M
onte
, Bul
acan
302
4En
gr. L
oret
o G
. Lim
colio
cM
r. H
erm
inio
E. M
ateo
(044
) 81
5-03
78 ;
0916
-50
5929
4(0
44)
815-
0378
O55
,695
Larg
e
308
San
Leon
ardo
San
Leon
ardo
, Nue
va E
cija
310
2M
r. Fi
del A
. Rey
esM
r. Vic
tori
o G
alve
zN
O
427
San
Mar
celin
oBr
gy. C
onsu
elo
Nor
te, S
an M
arce
lino,
Z
amba
les
2207
Mr.
Gilb
ert V
illen
a (A
ctg.
)M
r. M
anue
l R. R
odri
guez
(047
) 62
3-00
15(0
47)
623-
0015
O1,
145
Smal
l
132
San
Mig
uel
Vic
tor
St.,
Pobl
acio
n, S
an M
igue
l, Bu
laca
n 30
11M
s. Br
igid
a C
arlo
s-V
iola
Mr.
Raf
ael B
. Pay
aual
(044
) 76
4-03
34 ;
678-
0832
(044
) 76
4-03
34 ;
678-
0832
O4,
587
Med
ium
307
San
Nar
ciso
Brgy
. Lib
erta
d, S
an N
arci
so, Z
amba
les
2205
Ms.
Hel
en G
. Fer
nand
ezM
r. Ale
jand
ro R
. Ate
jera
O19
5Sm
all
528
San
Raf
ael
Brgy
. Lic
o, S
an R
afae
l, Bu
laca
n 30
08M
r. R
olan
do M
. De
La F
uent
eM
r. D
anilo
R. B
orja
(044
) 90
2-04
73 t
o 74
(044
) 90
2-04
73O
4,59
2M
ediu
m
488
Sant
a A
naSa
nta
Ana
, Pam
pang
a 20
22M
r. Teo
fi lo
G. E
ugen
ioM
r. C
asim
iro V
illez
aN
O
365
Sant
a C
ruz
Mun
icip
al H
all,
Pob.
Sou
th, S
anta
Cru
z, Z
amba
les
2213
Att
y. Le
onar
do S
. Lus
tria
, Jr.
Engr
. Ele
nito
B. M
artin
ez09
19-3
9600
78O
859
Smal
l
413
Sant
a Ig
naci
aPo
blac
ion
Wes
t, Sa
nta
Igna
cia,
Tarl
ac
2303
Ms.
Min
a Jo
y A
. Acu
zar
Mr.
Julia
n M
angi
no(0
45)
605-
0248
(045
) 60
5-02
48O
1,20
9Sm
all
310
Sant
a M
aria
3 M
. de
Leon
St.,
Pob
., Sa
nta
Mar
ia,
Bula
can
3022
Engr
. Car
los
N. S
anto
s,. J
r.M
s. M
igue
la G
. Ple
yto
(044
) 64
1-17
03 /
5451
(044
) 64
1-51
68O
8,73
3M
ediu
m
618
Sant
a R
itaSa
nta
Rita
, Pam
pang
a 2
002
NO
217
Sant
a R
osa
Mun
icip
al H
all,
Pob.
, San
ta R
osa,
Nue
va
Ecija
310
1M
r. Jo
el F
elix
H. B
erna
rdo
Engr
. Am
ador
I. S
anqu
i(0
44)
311-
1323
(044
) 94
0-01
42O
3,71
7M
ediu
m
450
Sant
o D
omin
goSt
o. D
omin
go, N
ueva
Eci
ja 3
133
NO
484
Sasm
uan
Sant
a Lu
cia,
Sasm
uan,
Pam
pang
a 20
04M
r. Be
da M
. Car
los
Ms.
Jhoa
nna
D. T
orre
s(0
45)
436-
0421
(045
) 90
0-11
01O
1,99
3Sm
all
126
Subi
cM
anga
n-Va
ca, S
ubic
, Zam
bale
s 22
09M
s. Ir
ene
G. A
nche
taM
s. C
arol
ina
A. D
ucos
(047
) 23
2-26
50 /
4570
(047
) 23
2-45
70O
8,34
2M
ediu
m
293
Tala
vera
#042
Dia
z St
., Pa
g-A
sa D
is., T
alav
era,
Nue
va E
cija
311
4En
gr. L
eand
ro Ju
n C
. Lac
sam
ana
Mr.
Dio
scor
o F.
de L
eon,
Jr.
(044
) 41
1-15
89(0
44)
411-
1408
O4,
488
Big
494
Talu
gtug
Que
zon
Dis
tric
t, Ta
lugt
ug, N
ueva
Eci
ja
3118
Mr.
Edga
r J.
Sapl
aEn
gr. R
omeo
Men
doza
O60
0Sm
all
14Ta
rlac
City
Tarl
ac-S
ta. R
osa
Roa
d, M
aliw
alo,
Tar
lac
City
230
0 M
s. Es
ter T
. Ven
gco
Engr
. Ger
ardo
C. G
omez
, Jr.
(045
) 98
2-13
46 /
3616
/ 1
545
(045
) 98
2-76
04
/ 095
6O
19,2
36La
rge
461
Zar
agoz
aZ
arag
oza,
Nue
va E
cija
311
0N
O
REG
ION
4
Com
pris
es: B
atan
gas,
Cav
ite, L
agun
a, O
cc. &
Or.
Min
doro
Que
zon,
Riz
al a
nd R
ombl
on -
79
/ 71
440
Abo
rlan
Abo
rlan
, Pal
awan
53
02M
r. N
elso
n A
izo
Mr.
Epifa
nio
Mag
banu
aN
O
347
Ago
ncill
oPo
blac
ion,
Ago
ncill
o, B
atan
gas
421
1En
gr. R
icar
do M
. Cab
ello
Ms.
Ado
raci
on L
. Div
ino
(043
) 21
0-21
51 /
3289
(043
) 21
0-21
51O
3,07
9Sm
all
120
Ala
min
osD
el P
ilar
St., A
lam
inos
, Lag
una
400
1En
gr. E
mili
ano
D. C
astil
loD
r. C
esar
de
Mes
a Fu
le(0
49)
567-
1432
; 80
5-13
60(0
49)
567-
1432
O3,
944
Ave
rage
373
Alit
agta
gPo
blac
ion
East
, Alit
agta
g, Ba
tang
as 4
205
Ms.
Cha
rity
S. R
eneg
ado
Mr.
Fran
cisc
o Tu
bo(0
43)
772-
0116
(043
) 77
2-01
16O
1,91
2Sm
all
601
Am
adeo
J. de
la P
eña
St.,
Brgy
. 9, A
mad
eo, C
avite
41
19En
gr. N
ilo C
. del
a Pe
ñaM
r. R
eyna
ldo
L. B
ayot
(046
) 41
3-15
08(0
46)
413-
1508
O3,
189
Smal
l
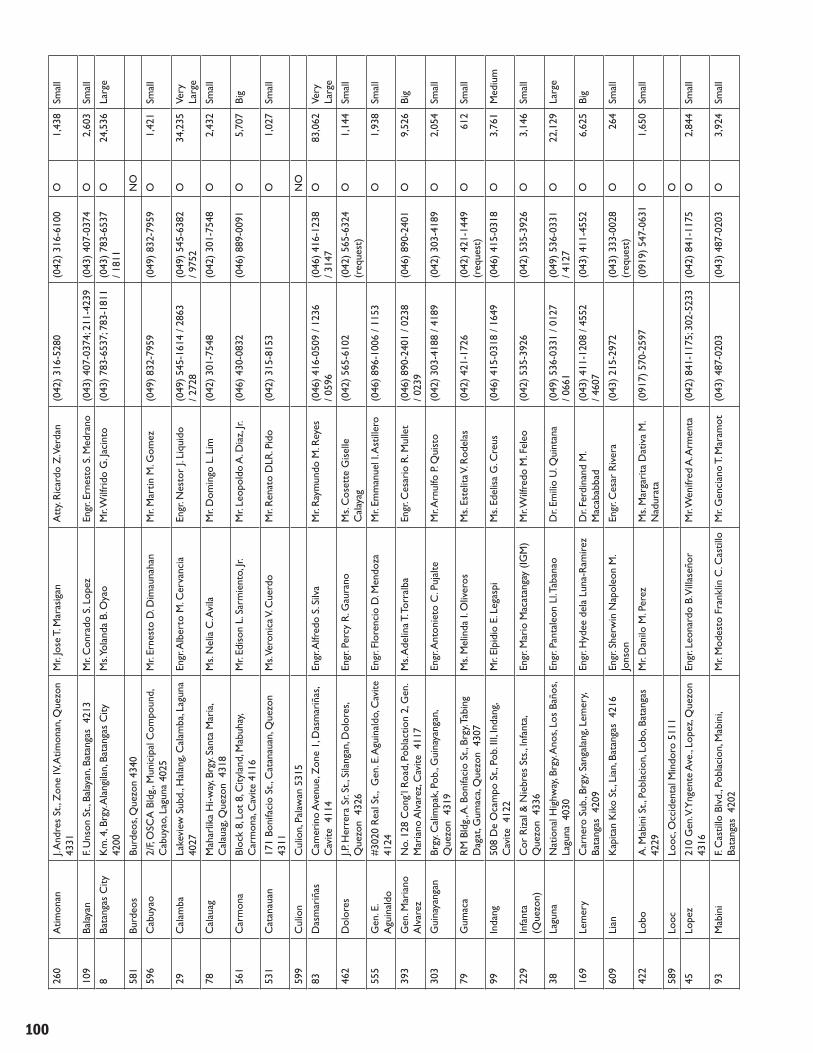
100
260
Atim
onan
J. And
res
St.,
Zon
e IV
, Atim
onan
, Que
zon
4331
Mr.
Jose
T. M
aras
igan
Att
y. R
icar
do Z
. Ver
dan
(042
) 31
6-52
80(0
42)
316-
6100
O1,
438
Smal
l
109
Bala
yan
F. U
nson
St.,
Bal
ayan
, Bat
anga
s 4
213
Mr.
Con
rado
S. L
opez
Engr
. Ern
esto
S. M
edra
no(0
43)
407-
0374
; 211
-423
9(0
43)
407-
0374
O2,
603
Smal
l
8Ba
tang
as C
ityK
m. 4
, Brg
y. A
lang
ilan,
Bat
anga
s C
ity
4200
Ms.
Yola
nda
B. O
yao
Mr. W
ilfri
do G
. Jac
into
(043
) 78
3-65
37; 7
83-1
811
(043
) 78
3-65
37
/ 181
1O
24,5
36La
rge
581
Burd
eos
Burd
eos,
Que
zon
4340
NO
596
Cab
uyao
2/F,
OSC
A B
ldg.
, Mun
icip
al C
ompo
und,
C
abuy
ao, L
agun
a 40
25M
r. Er
nest
o D
. Dim
auna
han
Mr.
Mar
tin M
. Gom
ez(0
49)
832-
7959
(049
) 83
2-79
59O
1,42
1Sm
all
29C
alam
baLa
kevi
ew S
ubd.
, Hal
ang,
Cal
amba
, Lag
una
4027
Engr
. Alb
erto
M. C
erva
ncia
Engr
. Nes
tor
J. Li
quid
o(0
49)
545-
1614
/ 28
63
/ 272
8(0
49)
545-
6382
/ 9
752
O34
,235
Very
La
rge
78C
alau
agM
ahar
lika
Hi-w
ay, B
rgy.
Sant
a M
aria
, C
alau
ag, Q
uezo
n 4
318
Ms.
Nel
ia C
. Avi
laM
r. D
omin
go L
. Lim
(042
) 30
1-75
48(0
42)
301-
7548
O2,
432
Smal
l
561
Car
mon
aBl
ock
8, L
ot 8
, City
land
, Mab
uhay
, C
arm
ona,
Cav
ite 4
116
Mr.
Edis
on L
. Sar
mie
nto,
Jr.
Mr.
Leop
oldo
A. D
iaz,
Jr.(0
46)
430-
0832
(046
) 88
9-00
91O
5,70
7Bi
g
531
Cat
anau
an17
1 Bo
nifa
cio
St.,
Cat
anau
an, Q
uezo
n
4311
Ms.
Vero
nica
V. C
uerd
oM
r. R
enat
o D
LR. P
ido
(042
) 31
5-81
53O
1,02
7Sm
all
599
Cul
ion
Cul
ion,
Pal
awan
531
5N
O
83D
asm
ariñ
asC
amer
ino
Ave
nue,
Zon
e 1,
Das
mar
iñas
, C
avite
411
4En
gr. A
lfred
o S.
Silv
aM
r. R
aym
undo
M. R
eyes
(046
) 41
6-05
09 /
1236
/ 0
596
(046
) 41
6-12
38
/ 314
7O
83,0
62Ve
ry
Larg
e
462
Dol
ores
J.P. H
erre
ra S
r. St
., Si
lang
an, D
olor
es,
Que
zon
432
6En
gr. P
ercy
R. G
aura
noM
s. C
oset
te G
isel
le
Cal
ayag
(042
) 56
5-61
02(0
42)
565-
6324
(r
eque
st)
O1,
144
Smal
l
555
Gen
. E.
Agu
inal
do#3
020
Rea
l St.,
Gen
. E. A
guin
aldo
, Cav
ite
4124
Engr
. Flo
renc
io D
. Men
doza
Mr.
Emm
anue
l I. A
still
ero
(046
) 89
6-10
06 /
1153
O
1,93
8Sm
all
393
Gen
. Mar
iano
A
lvar
ezN
o. 1
28 C
ong’
l Roa
d, P
obla
ctio
n 2,
Gen
. M
aria
no A
lvar
ez, C
avite
411
7M
s. A
delin
a T. T
orra
lba
Engr
. Ces
ario
R. M
ulle
t(0
46)
890-
2401
/ 02
38
/ 023
9(0
46)
890-
2401
O9,
526
Big
303
Gui
naya
ngan
Brgy
. Cal
impa
k, Po
b., G
uina
yang
an,
Que
zon
431
9En
gr. A
nton
ieto
C. P
ujal
teM
r. Arn
ulfo
P. Q
uist
o(0
42)
303-
4188
/ 41
89(0
42)
303-
4189
O2,
054
Smal
l
79G
umac
aR
M B
ldg.
, A. B
onifa
cio
St.,
Brgy
. Tab
ing
Dag
at, G
umac
a, Q
uezo
n 4
307
Ms.
Mel
inda
I. O
liver
osM
s. Es
telit
a V. R
odel
as(0
42)
421-
1726
(042
) 42
1-14
49
(req
uest
)O
612
Smal
l
99In
dang
508
De
Oca
mpo
St.,
Pob
. III,
Inda
ng,
Cav
ite 4
122
Mr.
Elpi
dio
E. L
egas
piM
s. Ed
elis
a G
. Cre
us(0
46)
415-
0318
/ 16
49(0
46)
415-
0318
O3,
761
Med
ium
229
Infa
nta
(Que
zon)
Cor
Riz
al &
Nie
bres
Sts
., In
fant
a, Q
uezo
n 4
336
Engr
. Mar
io M
acat
anga
y (IG
M)
Mr. W
ilfre
do M
. Fel
eo(0
42)
535-
3926
(042
) 53
5-39
26O
3,14
6Sm
all
38La
guna
Nat
iona
l Hig
hway
, Brg
y. A
nos,
Los
Baño
s, La
guna
403
0En
gr. P
anta
leon
Ll. T
aban
aoD
r. Em
ilio
U. Q
uint
ana
(049
) 53
6-03
31 /
0127
/ 0
661
(049
) 53
6-03
31
/ 412
7O
22,1
29La
rge
169
Lem
ery
Car
nero
Sub
., Br
gy. S
anga
lang
, Lem
ery,
Bata
ngas
420
9En
gr. H
ydee
del
a Lu
na-R
amire
zD
r. Fe
rdin
and
M.
Mac
abab
bad
(043
) 41
1-12
08 /
4552
/ 4
607
(043
) 41
1-45
52O
6,62
5Bi
g
609
Lian
Kap
itan
Kik
o St
., Li
an, B
atan
gas
421
6En
gr. S
herw
in N
apol
eon
M.
Jons
onEn
gr. C
esar
Riv
era
(043
) 21
5-29
72(0
43)
333-
0028
(r
eque
st)
O26
4Sm
all
422
Lobo
A. M
abin
i St.,
Pob
laci
on, L
obo,
Bat
anga
s
4229
Mr.
Dan
ilo M
. Per
ezM
s. M
arga
rita
Dat
iva
M.
Nad
urat
a(0
917)
570
-259
7(0
919)
547
-063
1O
1,65
0Sm
all
589
Looc
Looc
, Occ
iden
tal M
indo
ro 5
111
O
45Lo
pez
210
Gen
. V. Y
ngen
te A
ve.,
Lope
z, Q
uezo
n
4316
Engr
. Leo
nard
o B.
Vill
aseñ
orM
r. Wen
ifred
A. A
rmen
ta(0
42)
841-
1175
; 302
-523
3 (0
42)
841-
1175
O2,
844
Smal
l
93M
abin
iF.
Cas
tillo
Blv
d., P
obla
cion
, Mab
ini,
Bata
ngas
420
2M
r. M
odes
to F
rank
lin C
. Cas
tillo
Mr.
Gen
cian
o T.
Mar
amot
(043
) 48
7-02
03(0
43)
487-
0203
O3,
924
Smal
l

101
580
Mac
alel
onM
acal
elon
, Que
zon
430
9M
r. Si
meo
n V.
Ald
ea II
I M
s. Le
ona
M. S
amad
an(0
42)
393-
4283
(042
) 39
3-44
48
(req
uest
)O
268
Smal
l
451
Mag
dale
naM
agda
lena
, Lag
una
402
7N
O
503
Mar
agon
don
Col
. Rie
l St.,
Pob
laci
on II
-A, M
arag
ondo
n,
Cav
ite 4
112
Mr.
Man
uel M
a. A
ngel
es
Mr.
Fran
do R
. Reg
ino
(046
) 41
2-07
87 /
1575
(046
) 41
2-07
87O
3,13
5M
ediu
m
298
Mau
ban
Don
Juan
cho
Ext.,
Brg
y. Lu
al, M
auba
n,
Que
zon
433
0En
gr. J
ulito
C. T
alas
tas
Dr.
Ros
enio
B. M
eden
illa
(042
) 78
4-05
27(0
42)
784-
0527
O2,
212
Smal
l
424
Men
dez
Dim
aran
an S
t., B
rgy.
1, M
ende
z, C
avite
41
21M
r. Ale
xand
er S
. Man
alo
Ms.
Irm
a T. M
endo
za(0
46)
413-
0245
(046
) 41
3-02
45O
3,35
4M
ediu
m
12M
etro
Lip
aIn
t. B.
Mor
ada
Ave
., Li
pa C
ity, B
atan
gas
42
17En
gr. H
erm
ogen
es M
. Ila
gan
Mr.
Edua
rdo
D.
Segu
ism
undo
(043
) 75
6-11
18 /
1670
/ 16
11 /
6972
(043
) 75
6-34
50O
44,9
79La
rge
144
Mor
ong
T. C
laud
io S
t., P
agla
bas,
San
Pedr
o,
Mor
ong,
Riz
al 1
960
Mr.
Cri
spin
S. G
utie
rrez
Engr
. Ado
rabl
e G
. Bau
tista
(02)
653
-118
4 ; 6
91-5
822
(02)
691
-564
5O
7,22
4Bi
g
155
Nas
ugbu
J.P. L
aure
l St.,
Brg
y. 12
, Nas
ugbu
, Bat
anga
s 42
31En
gr. A
bela
rdo
L. R
ojal
esM
r. D
anie
l M. V
illaf
ranc
a(0
43)
931-
1278
; 41
2-00
45(0
43)
931-
1278
; 41
2-00
45O
5,00
0Bi
g
245
Nau
jan
Pobl
acio
n 1,
Nau
jan,
Ori
enta
l Min
doro
52
04M
r. R
io M
. Alb
ufer
aM
r. R
uper
to V
. Ord
inar
io(0
43)
208-
3127
(043
) 20
8-31
27O
839
Smal
l
75O
dion
gan
G/F
Atie
nza
Bldg
., M
.L. Q
uezo
n St
., Li
wan
ag, O
dion
gan,
Rom
blon
550
5En
gr. C
arlo
s M
. For
mill
eza
Mr. A
nton
io L
. Atie
nza
(042
) 56
7-51
01(0
42)
567-
5101
O2,
003
Smal
l
122
Pags
anja
n#
52 J.
P. R
izal
St.,
Pag
sanj
an, L
agun
a
4008
Engr
. Ale
x C
. Pag
uio
Engr
. Fre
d V.
Cap
istr
ano
(049
) 80
8-42
98 /
6953
(049
) 80
8-43
21O
5,02
0M
ediu
m
518
Paki
lBu
rgos
St.,
Pak
il, La
guna
401
7M
r. Ed
gard
o R
. Bal
itaM
r. Vir
gilio
R. S
an G
aspa
r(0
49)
557-
0266
(049
) 55
7-02
66O
1,43
0Sm
all
487
Pilil
laN
atio
nal R
oad,
Bag
umba
yan,
Pili
lla, R
izal
19
10M
r. Pa
ulin
o J.
Raf
anan
Mr. V
alen
tin E
. Paz
(02)
654
-081
7(0
2) 6
54-4
089
O4,
056
Med
ium
327
Pina
mal
ayan
Brgy
. Sta
. Rita
, Pin
amal
ayan
, Or.
Min
doro
52
08M
s. R
afae
la M
. Gal
itEn
gr. E
nric
o A
. Axa
lan
(043
) 28
4-32
03(0
43)
284-
3203
O2,
596
Smal
l
471
Pito
goPi
togo
, Que
zon
430
8N
O
96Po
laBr
gy. Z
one
II, B
ayan
an, P
ola,
Ori
enta
l M
indo
ro 5
206
Ms.
Reb
ecca
R. S
egov
iaM
s. Li
lia L
. Mat
inin
gO
771
Smal
l
600
Polil
loPA
CD
Bld
g., S
an Jo
se S
t., P
olili
o, Q
uezo
n 43
39M
r. Tol
entin
o R
. Acq
uiob
enM
s. En
erita
G. G
aela
(042
) 31
4-85
28(0
42)
314-
8544
O99
3Sm
all
26Pu
erto
Pri
nces
a C
ity26
3 R
izal
Ave
., Pu
erto
Pri
nces
a C
ity,
Pala
wan
530
0M
r. Ant
onio
Jesu
s R
. Rom
asan
taEn
gr. A
nton
io G
. Goh
(048
) 43
3-68
02 /
5032
/ 24
08 /
9745
(048
) 43
3-68
03O
19,2
35Bi
g
513
Que
zon
Que
zon,
Pal
awan
530
4N
O
17Q
uezo
n M
etro
Ibab
ang
Dup
ay, R
ed V
, Luc
ena
City
, Q
uezo
n 43
01M
r. En
rico
B. P
asum
bal
Att
y. G
ilber
t D
. Cam
alig
an(0
42) 3
73-3
692
; 710
-29
65(0
42)
373-
3692
O33
,516
Very
La
rge
64R
ombl
onR
oxas
St.,
Rom
blon
, Rom
blon
550
0M
s. Ed
na P
. Mar
tos
(OIC
)C
ol. T
eodo
ro M
. Mar
tinez
(R
et.)
(042
) 47
2-82
18(0
42)
472-
8218
O1,
944
Smal
l
111
Ros
ario
Y. Z
uño
St.,
Ros
ario
, Bat
anga
s 4
225
Engr
. Cyn
thia
T. L
una
Att
y. R
omeo
T. R
eyes
(043
) 32
1-15
32(0
43)
321-
1532
O3,
700
Ave
rage
334
Rox
asPo
blac
ion,
Rox
as, O
rien
tal M
indo
ro
5212
Engr
. Dan
ilo B
. Siñ
elEn
gr. C
exzu
r Jim
enez
(043
) 28
9-21
22(0
43)
289-
2122
O39
7Sm
all
449
Rox
asJa
cint
o St
., Br
gy. I
I, R
oxas
, Pal
awan
530
8En
gr. F
erna
ndo
N. R
amire
zM
r. Pe
dro
R. A
bid
(048
) 72
3-04
60O
950
Smal
l
197
Sabl
ayan
C. S
alvo
St.,
Brg
y. Bu
enav
ista
, Sab
laya
n,
Occ
. Min
. 51
04M
r. Jo
se M
. Abe
leda
, Jr.
Mr. A
lfred
o R
. Ven
tura
(092
9) 3
02-8
560
O1,
487
Smal
l
150
San
Agu
stin
Pobl
acio
n, S
an A
ugus
tin, R
ombl
on 5
501
Mr.
Rol
and
F. Fe
talc
o (O
IC)
Mr.
Rol
and
F. Fe
talc
oO
200
Smal
l
62Sa
n Jo
seM
un. C
ompd
., Br
gy. 7
, San
Jose
, Occ
. M
indo
ro 5
100
Mr.
Ren
ato
G. G
atuz
Ms.
Mar
y A
nn D
. Rey
es(0
43)
491-
1357
/ 19
72
/ 442
9(0
43)
491-
4430
O5,
255
Larg
e
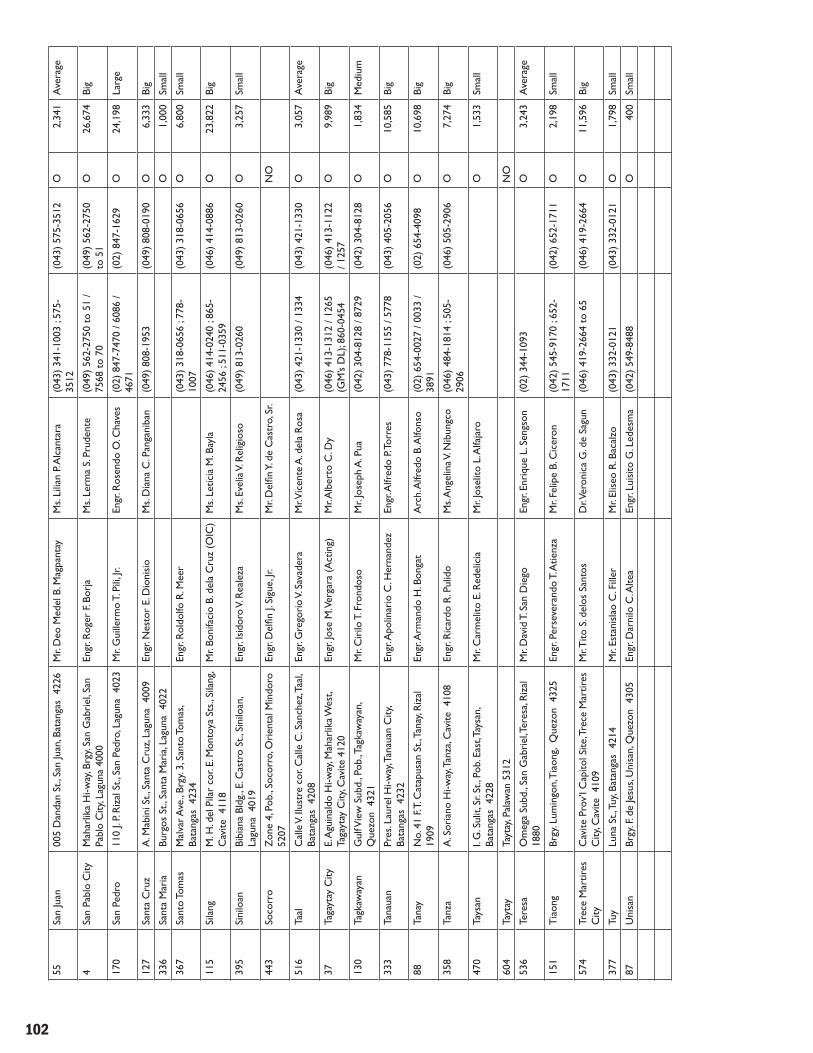
102
55Sa
n Ju
an00
5 D
anda
n St
., Sa
n Ju
an, B
atan
gas
422
6M
r. D
eo M
edel
B. M
agpa
ntay
Ms.
Lilia
n P.
Alc
anta
ra(0
43)
341-
1003
; 57
5-35
12(0
43)
575-
3512
O2,
341
Ave
rage
4Sa
n Pa
blo
City
Mah
arlik
a H
i-way
, Brg
y. Sa
n G
abri
el, S
an
Pabl
o C
ity, L
agun
a 40
00En
gr. R
oger
F. B
orja
Ms.
Lerm
a S.
Prud
ente
(049
) 56
2-27
50 t
o 51
/ 75
68 t
o 70
(049
) 56
2-27
50
to 5
1O
26,6
74Bi
g
170
San
Pedr
o11
0 J.
P. R
izal
St.,
San
Ped
ro, L
agun
a 4
023
Mr.
Gui
llerm
o T.
Pili,
Jr.En
gr. R
osen
do O
. Cha
ves
(02)
847
-747
0 / 6
086
/ 46
71(0
2) 8
47-1
629
O24
,198
Larg
e
127
Sant
a C
ruz
A. M
abin
i St.,
San
ta C
ruz,
Lagu
na 4
009
Engr
. Nes
tor
E. D
ioni
sio
Ms.
Dia
na C
. Pan
gani
ban
(049
) 80
8-19
53(0
49)
808-
0190
O6,
333
Big
336
Sant
a M
aria
Burg
os S
t., S
anta
Mar
ia, L
agun
a 4
022
O1,
000
Smal
l
367
Sant
o To
mas
Mal
var A
ve.,
Brgy
. 3, S
anto
Tom
as,
Bata
ngas
423
4En
gr. R
oldo
lfo R
. Mee
r(0
43)
318-
0656
; 77
8-10
07(0
43)
318-
0656
O6,
800
Smal
l
115
Sila
ngM
. H. d
el P
ilar
cor.
E. M
onto
ya S
ts.,
Sila
ng,
Cav
ite 4
118
Mr.
Boni
faci
o B.
del
a C
ruz
(OIC
)M
s. Le
ticia
M. B
ayla
(046
) 41
4-02
40 ;
865-
2456
; 51
1-03
59(0
46)
414-
0886
O23
,822
Big
395
Sini
loan
Bibi
ana
Bldg
., E.
Cas
tro
St.,
Sini
loan
, La
guna
401
9En
gr. I
sido
ro V
. Rea
leza
Ms.
Evel
ia V
. Rel
igio
so(0
49)
813-
0260
(049
) 81
3-02
60O
3,25
7Sm
all
443
Soco
rro
Zon
e 4,
Pob
., So
corr
o, O
rien
tal M
indo
ro
5207
Engr
. Del
fi n J.
Sig
ue, J
r.M
r. D
elfi n
Y. d
e C
astr
o, S
r.N
O
516
Taal
C
alle
V. I
lust
re c
or. C
alle
C. S
anch
ez, T
aal,
Bata
ngas
420
8En
gr. G
rego
rio
V. Sa
vade
raM
r. Vic
ente
A. d
ela
Ros
a(0
43)
421-
1330
/ 13
34(0
43)
421-
1330
O3,
057
Ave
rage
37Ta
gayt
ay C
ityE.
Agu
inal
do H
i-way
, Mah
arlik
a Wes
t, Ta
gayt
ay C
ity, C
avite
412
0En
gr. J
ose
M. V
erga
ra (
Act
ing)
Mr. A
lber
to C
. Dy
(046
) 41
3-13
12 /
1265
(G
M’s
DL)
; 860
-045
4(0
46)
413-
1122
/ 1
257
O9,
989
Big
130
Tagk
away
anG
ulf V
iew
Sub
d., P
ob., T
agka
way
an,
Que
zon
432
1M
r. C
irilo
T. F
rond
oso
Mr.
Jose
ph A
. Pua
(042
) 30
4-81
28 /
8729
(042
) 30
4-81
28O
1,83
4M
ediu
m
333
Tana
uan
Pres
. Lau
rel H
i-way
, Tan
auan
City
, Ba
tang
as 4
232
Engr
. Apo
linar
io C
. Her
nand
ezEn
gr. A
lfred
o P.
Torr
es(0
43)
778-
1155
/ 57
78(0
43)
405-
2056
O10
,585
Big
88Ta
nay
No.
41
F. T.
Cat
apus
an S
t., T
anay
, Riz
al
1909
Engr
. Arm
ando
H. B
onga
t A
rch.
Alfr
edo
B. A
lfons
o(0
2) 6
54-0
027
/ 003
3 /
3891
(02)
654
-409
8O
10,6
98Bi
g
358
Tanz
aA
. Sor
iano
Hi-w
ay, T
anza
, Cav
ite 4
108
Engr
. Ric
ardo
R. P
ulid
oM
s. A
ngel
ina V
. Nib
ungc
o(0
46)
484-
1814
; 50
5-29
06(0
46)
505-
2906
O7,
274
Big
470
Tays
anI.
G. S
ulit,
Sr.
St.,
Pob.
Eas
t, Ta
ysan
, Ba
tang
as 4
228
Mr.
Car
mel
ito E
. Red
elic
iaM
r. Jo
selit
o L.
Alfa
jaro
O1,
533
Smal
l
604
Tayt
ayTa
ytay
, Pal
awan
531
2N
O
536
Tere
saO
meg
a Su
bd.,
San
Gab
riel
, Ter
esa,
Riz
al
1880
Mr.
Dav
id T
. San
Die
goEn
gr. E
nriq
ue L
. Sen
gson
(02)
344
-109
3O
3,24
3A
vera
ge
151
Tia
ong
Brgy
. Lum
ingo
n, T
iaon
g, Q
uezo
n 4
325
Engr
. Per
seve
rand
o T.
Atie
nza
Mr.
Felip
e B.
Cic
eron
(042
) 54
5-91
70 ;
652-
1711
(042
) 65
2-17
11O
2,19
8Sm
all
574
Trec
e M
artir
es
City
Cav
ite P
rov’
l Cap
itol S
ite, T
rece
Mar
tires
C
ity, C
avite
410
9M
r. Tito
S. d
elos
San
tos
Dr. V
eron
ica
G. d
e Sa
gun
(046
) 41
9-26
64 t
o 65
(046
) 41
9-26
64O
11,5
96Bi
g
377
Tuy
Luna
St.,
Tuy
, Bat
anga
s 4
214
Mr.
Esta
nisl
ao C
. Fill
erM
r. El
iseo
R. B
acal
zo(0
43)
332-
0121
(043
) 33
2-01
21O
1,79
8Sm
all
87U
nisa
n Br
gy. F
. de
Jesu
s, U
nisa
n, Q
uezo
n 4
305
Engr
. Dar
nilo
C. A
ltea
Engr
. Lui
sito
G. L
edes
ma
(042
) 54
9-84
88O
400
Smal
l

103
REG
ION
5
Com
pris
es: A
lbay
, Cam
arin
es N
orte
, Cam
arin
es S
ur
Cat
andu
anes
, Mas
bate
& S
orso
gon
- 46
/ 37
137
Aro
roy
Apa
lit S
t., A
roro
y, M
asba
te 5
414
Engr
. Ped
rito
E. C
orpu
sM
r. Jim
my
J. C
han
(091
0) 8
02-5
447
O50
0Sm
all
313
Baao
2/F
Publ
ic M
arke
t Bl
dg.,
San
Roq
ue, B
aao,
C
am. S
ur 4
432
Mr. V
icen
te V
ic B
. Rob
osa
Mr.
Zan
dro
O. B
abol
(054
) 26
6-31
61 /
3124
(054
) 26
6-36
42O
2,07
2Sm
all
135
Baca
cay
Hin
di, B
acac
ay, A
lbay
450
9M
s. A
lma
B. C
alle
jaM
r. R
ober
to C
abre
do(0
52)
558-
3228
O1,
858
Smal
l
478
Baga
man
ocBa
gam
anoc
, Cat
andu
anes
480
7N
O
445
Bala
tan
Sira
mag
, Bal
atan
, Cam
arin
es S
ur 4
436
Ms.
Hay
dee
D. B
orja
Mr.
Rog
elio
O. T
orie
nte
O41
2Sm
all
455
Bara
sSa
n Jo
se S
t., B
aras
, Cat
andu
anes
480
3En
gr. S
eth
G. C
arra
nza
NO
437
Bato
Sant
iago
, Bat
o, C
amar
ines
Sur
443
5En
gr. P
aul R
aym
ond
L. B
onne
vie
Mr.
Dom
ingo
R.
Doc
tole
ro(0
54)
277-
4269
(054
) 27
7-42
69O
1,53
8Sm
all
101
Bato
Riz
al C
ross
ing,
Bato
, Cat
andu
anes
480
1M
s. A
mel
ia T
. Bon
galo
sM
r. Z
osim
o T.
Rey
es, J
r.O
1,25
3Sm
all
22Bu
lan
Zon
e 4,
De
Vera
St.,
Bul
an, S
orso
gon
47
06En
gr. A
rnul
fo M
. Tec
son
Ms.
Mar
ia P
az G
. Baj
aro
(056
) 41
1-13
23(0
56)
411-
1323
O4,
456
Ave
rage
314
Cal
aban
gaSa
n Pa
blo,
Cal
aban
ga, C
amar
ines
Sur
44
05En
gr. A
jerc
o C
. Com
ia (
IGM
)A
tty.
Edel
win
a D
G.
Paru
ngao
(IB
)(0
54)
255-
4041
/ 47
0-20
00(0
54)
255-
4041
O2,
247
Smal
l
125
Cam
alig
Brgy
. 2, C
amal
ig, A
lbay
450
2En
gr. R
amon
E. S
an Jo
se (
IGM
)M
r. Ave
lino
Cas
tillo
(IB
)(0
52)
826-
0308
; 484
-124
7(0
52)
483-
3906
(r
eque
st)
O1,
173
Smal
l
9C
amar
ines
N
orte
Vin
zons
Ave
nue,
Pan
dan,
Dae
t, C
amar
ines
Nor
te 4
600
Ms.
Ma.
Ant
onia
B. F
. Bom
aA
tty.
Este
ban
P. Pa
note
s(0
54)
721-
1810
; 571
-231
5(0
54)
721-
2237
O20
,089
Big
448
Cap
alon
gaC
apal
onga
, Cam
arin
es N
orte
460
7M
r. Fe
lix M
aral
itN
O
366
Cas
igur
anJ.
B. A
legr
e co
r. A. H
alco
n St
s., C
entr
al,
Cas
igur
an, S
orso
gon
470
2En
gr. E
duar
do P
. Tej
ada
Mr.
Car
los
F. Ba
lolo
yO
3,00
0Sm
all
172
Dar
aga
Sta.
Mar
ia S
t., S
an R
oque
, Dar
aga,
Alb
ay
4501
Att
y. Jo
ey M
. Mar
cella
naM
r. Lo
renz
o L.
Rey
eg(0
52)
483-
3232
/ 82
4-12
56(0
52)
483-
3906
O7,
709
Med
ium
576
Del
Gal
lego
Pob.
, Zon
e 1,
Del
Gal
lego
, Cam
arin
es
Sur
4411
Dr.
Evel
yn B
. Gar
cia
Rev
. Fr.
Ian
S. Tr
illan
es(0
42)
304-
8543
(042
) 30
4-85
43O
861
Smal
l
72D
onso
lPo
so, D
onso
l, So
rsog
on 4
715
Mr. A
nton
io M
. Are
llano
Mr.
Este
lito
L. d
e G
uzm
anO
986
Smal
l
136
Gub
at53
8 M
anoo
k St
., G
ubat
, Sor
sogo
n 4
710
Engr
. Sal
vado
r F. V
illar
oya,
Jr.D
r. R
uben
E. L
elis
(056
) 31
1-13
19(0
56)
311-
1319
O4,
800
Med
ium
91Ir
iga
City
Rufi
no
Llag
as, S
r. St
., Sa
n R
oque
, Iri
ga
City
, Alb
ay 4
431
Engr
. Aje
rco
C. C
omia
(IG
M)
Mr.
Gud
enci
o C
. Asa
nza,
Jr.(0
54)
299-
2220
(0
54)
655-
0508
O8,
329
Med
ium
586
Iros
inM
.H. d
el P
ilar
St.,
Iros
in, S
orso
gon
470
7M
r. Ed
win
G. G
ajo
Att
y. A
rnal
do M
. Esp
inas
(IB
)O
1,80
0Sm
all
575
Jose
Pan
gani
ban
Jose
Lim
Bld
g., P
ob. N
orth
, Jos
e Pa
ngan
iban
, Cam
arin
es N
orte
460
6En
gr. E
duar
do C
. Cam
pita
Ms.
Pris
cilla
G. M
aria
no(0
54)
731-
1676
(054
) 73
1-16
76O
1,91
3Sm
all
173
Lega
zpi C
ityBi
tano
, Leg
azpi
City
, Alb
ay 4
500
Dr.
Rau
l L. C
hua
Dr.
Kerw
in T
. Sis
(052
) 48
0-93
95; 8
20-1
175
(052
) 21
4-34
82
/481
-389
1O
16,0
69Bi
g
606
Libm
anan
Bagu
mba
yan,
Lib
man
an, C
amar
ines
Sur
44
07En
gr. R
odol
fo A
. Jim
enez
Mr.
Ferd
inan
d O
sio
(054
) 45
1-25
75(0
54)
451-
2575
O2,
342
Smal
l
149
Liga
o C
ityN
aper
a St
., D
unao
, Lig
ao C
ity, A
lbay
45
04M
r. M
anol
ito T
. Mat
eum
Dr.
Hila
rio
T. M
ateo
(052
) 83
7-11
65 ;
485-
1399
(052
) 83
7-11
65
O5,
089
Ave
rage
361
Man
daon
Man
daon
, Mas
bate
541
1N
O
69M
asba
te-M
obo
Cap
itol R
oad
F, M
asba
te C
ity, M
asba
te
5400
Engr
. Qui
ntin
C. C
atab
ui II
I (IG
M)
Engr
. Em
man
uel B
. M
alic
dem
(IB
)(0
56)
333-
6310
(056
) 33
3-63
10O
3,74
5M
ediu
m

104
263
Mat
nog
Cam
achi
les,
Mat
nog,
Sors
ogon
470
8M
r. Art
uro
G. A
zul,
Sr.
O65
0Sm
all
106
Met
ro N
aga
40 J.
Mir
anda
Ave
., N
aga
City
, Cam
arin
es
Sur
4400
Engr
. Rey
C. R
eyes
Dr.
Ferd
inan
d M
artin
O.
Zan
tua
(054
) 81
1-31
35; 4
73-7
813
/ 204
0(0
54)
811-
1899
O29
,977
Big
138
Mila
gros
Mila
gros
, Mas
bate
541
0D
r. Ang
el d
e C
astr
o, Jr
.N
O
315
Nab
uaSa
n Fr
anci
sco,
Nab
ua, C
amar
ines
Sur
44
34M
r. Wilm
or B
. Men
iola
sR
ev. M
sgr.
Zos
imo
M.
Saña
do(0
54)
288-
3399
; 47
8-01
23(0
54)
288-
3399
O1,
925
Smal
l
380
Pand
anLi
bod,
Pan
dan,
Cat
andu
anes
480
9M
r. R
ey I.
Alc
anta
raM
r. C
arlo
s A. A
lber
toO
650
Smal
l
467
Pang
anib
anPa
ngan
iban
, Cat
andu
anes
480
6N
O
167
Para
cale
Tugo
s, Pa
raca
le, C
amar
ines
Nor
te 4
605
Engr
. Lot
M. V
illan
ueva
Mr.
Jose
L. T
ungo
lO
1,35
5Sm
all
168
Pasa
cao
Sta.
Ros
a de
l Nor
te, P
asac
ao, C
amar
ines
Su
r 4
417
Ms.
Soni
a L.
O. S
acra
men
toM
s. D
olor
es B
. Bor
ja(0
54)
513-
9890
(054
) 51
3-98
90O
984
Smal
l
474
Pila
rBr
gy.M
arifo
sque
, Pila
r, So
rsog
on 4
714
Engr
. Rod
olfo
P. M
iras
olM
s. A
nnie
M. N
orle
y(0
56)
421-
9602
(056
) 42
1-96
02O
1,30
0Sm
all
176
Pili
2/F
Abi
lay
Bldg
. San
Vic
ente
, Pili
, C
amar
ines
Sur
441
8En
gr. P
aulin
o S.
Cun
anan
Dr. A
nton
io I.
Ort
ega
(054
) 47
7-71
31 /
7133
/ 7
136
(054
) 36
1-17
04O
5,44
1M
ediu
m
340
Piod
uran
Piod
uran
, Alb
ay 4
516
NO
85R
agay
Pana
ytay
an, R
agay
, Cam
arin
es S
ur 4
410
Engr
. Eliz
alde
E. T
uazo
nM
r. C
onra
do S
. Cle
men
te(0
54)
741-
1014
(054
) 74
1-10
14O
2,06
8Sm
all
180
San
And
res
Belm
onte
St.,
San
Roq
ue, S
an A
ndre
s, C
atan
duan
es 4
810
Ms.
Emili
a V. S
omig
aoM
s. Ly
dia T
. Rom
ano
O70
0Sm
all
342
San
Pasc
ual
San
Pasc
ual,
Mas
bate
542
0N
O
76Si
poco
tSa
n Ju
an A
ve.,
Sout
h C
entr
o, S
ipoc
ot,
Cam
arin
es S
ur 4
408
Engr
. Edw
in S
. Zal
diva
rM
r. Bi
enve
nido
D. V
ite(0
54)
256-
6105
; 450
-623
8(0
54)
450-
6238
O2,
626
Ave
rage
20So
rsog
on C
ityC
apito
l Com
poun
d, S
orso
gon
City
, So
rsog
on 4
700
Engr
. Ron
aldo
G. B
arbo
ñoEn
gr. J
ose
Nel
son
D.
Dol
oira
s(0
56)
211-
3219
/ 20
24
/ 503
2(0
56)
211-
1570
O8,
232
Big
13Ta
baco
City
Kar
anga
han
Blvd
., Tab
aco
City
, Alb
ay
4511
Engr
. Noe
l G. B
ien
Dr.
Dio
gene
s B.
Bie
n(0
52)
487-
4835
/ 44
18;
257-
7191
(052
) 48
7-47
41O
9,27
5Bi
g
339
Uso
nU
son,
Mas
bate
540
2N
O
570
Vig
aSa
n Jo
se S
t., V
iga,
Cat
andu
anes
480
5En
gr. C
efer
ino
V. Be
rces
, Jr.
Mr. A
mad
or P
. Uch
iO
499
Smal
l
181
Vir
acSa
n Is
idro
Vill
age,
Vir
ac, C
atan
duan
es
4800
Engr
. Vir
gilio
T. A
rcill
aM
r. Vic
tori
no C
. San
Juan
(052
) 81
1-12
54(0
52)
811-
1254
O5,
288
Med
ium
REG
ION
6
Com
pris
es: A
klan
, Ant
ique
, Cap
iz, G
uim
aras
Iloilo
& N
egro
s O
ccid
enta
l -
76/ 6
3
110
Aju
yR
eal S
t., A
juy,
Iloilo
501
2M
r. N
icol
as D
. Ver
dad,
Jr.
Mr.
Salv
ador
Bag
onoc
O45
0Sm
all
185
Alim
odia
nPl
aza
Libe
rtad
St.,
Alim
odia
n, Il
oilo
502
8En
gr. L
uzbe
rto
T. Be
atin
go, J
r.En
gr. B
enja
min
Am
arra
(033
) 33
1-04
98O
825
Smal
l
331
Ani
lao
San
Mar
celin
o St
., Po
blac
ion,
Ani
lao,
Ilo
ilo 5
009
Mr. A
ndro
S. P
enie
roM
r. Pa
tern
o A
. Ara
neta
(033
) 36
2-04
08(0
33)
362-
0401
(r
eque
st)
O63
4Sm
all
2Ba
colo
d C
ityC
or. G
alo
& S
an Ju
an S
ts.,
Baco
lod
City
, N
eg. O
cc.6
100
Att
y. Ju
liana
B. C
arbo
n A
tty.
Pom
peyo
U.
Que
rubi
n(0
34)
433-
2141
/ 12
94
/463
2 (B
OD
)(0
34)
433-
2141
O32
,310
Very
La
rge
317
Bago
City
Soci
al Ju
stic
e C
ompl
ex,
R. S
alas
Dri
ve,
Bago
City
, Neg
. Occ
. 61
01En
gr. L
eo J.
Esp
ada
Ms.
Felic
iano
L. D
enila
(034
) 46
1-03
65 /
732-
8177
(034
) 46
1-03
65O
3,35
0M
ediu
m
403
Bala
san
Mun
. Bld
g., B
alas
an, I
loilo
501
8N
O
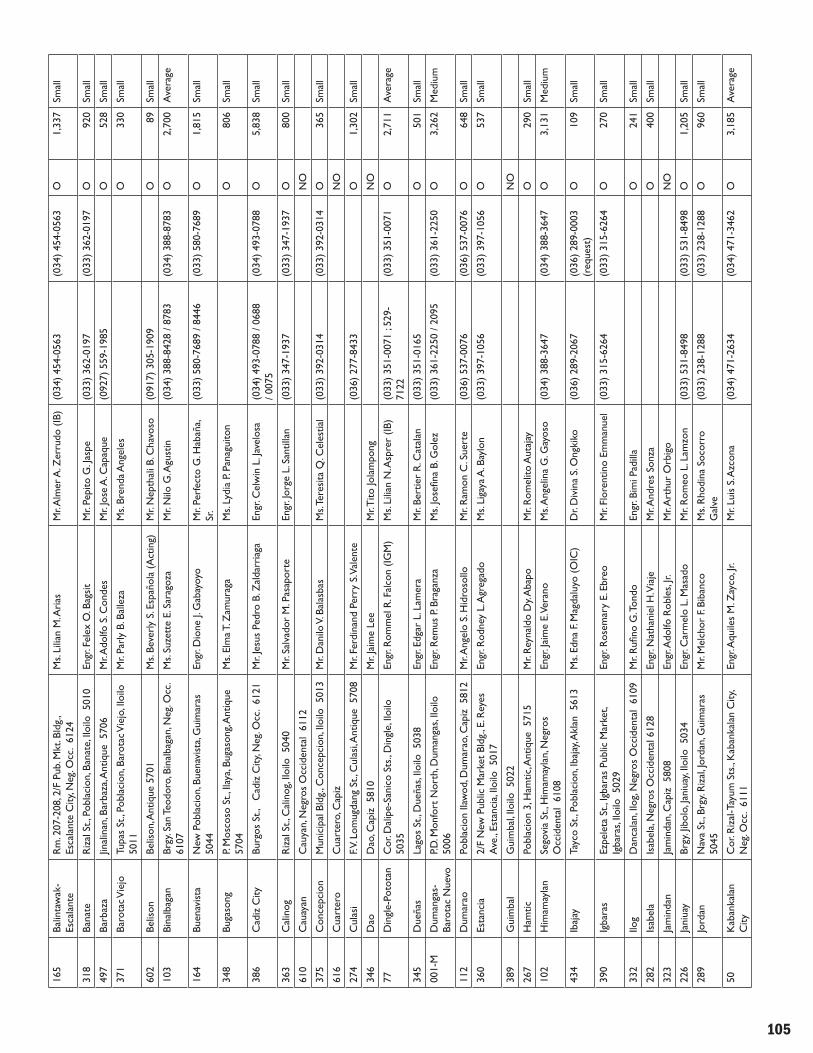
105
165
Balin
taw
ak-
Esca
lant
eR
m. 2
07-2
08, 2
/F P
ub. M
kt. B
ldg.
, Es
cala
nte
City
, Neg
. Occ
. 61
24M
s. Li
lian
M. A
rias
M
r. Alm
er A
. Zer
rudo
(IB
)(0
34)
454-
0563
(034
) 45
4-05
63O
1,33
7Sm
all
318
Bana
teR
izal
St.,
Pob
laci
on, B
anat
e, Il
oilo
501
0En
gr. F
elex
O. B
agsi
tM
r. Pe
pito
G. J
aspe
(033
) 36
2-01
97(0
33)
362-
0197
O92
0Sm
all
497
Barb
aza
Jinal
inan
, Bar
baza
, Ant
ique
570
6M
r. Ado
lfo S
. Con
des
Mr.
Jose
A. C
apaq
ue(0
927)
559
-198
5O
528
Smal
l
371
Baro
tac V
iejo
Tupa
s St
., Po
blac
ion,
Bar
otac
Vie
jo, I
loilo
50
11M
r. Pa
rly
B. B
alle
zaM
s. Br
enda
Ang
eles
O33
0Sm
all
602
Belis
onBe
lison
, Ant
ique
570
1M
s. Be
verl
y S.
Espa
ñola
(A
ctin
g)M
r. N
epth
ali B
. Cha
voso
(091
7) 3
05-1
909
O89
Smal
l
103
Bina
lbag
anBr
gy. S
an T
eodo
ro, B
inal
baga
n, N
eg. O
cc.
6107
Ms.
Suze
tte
E. S
arag
oza
Mr.
Nilo
G. A
gust
in(0
34)
388-
8428
/ 87
83(0
34)
388-
8783
O2,
700
Ave
rage
164
Buen
avis
taN
ew P
obla
cion
, Bue
navi
sta,
Gui
mar
as
5044
Engr
. Dio
ne J.
Gab
ayoy
o M
r. Pe
rfec
to G
. Hab
aña,
Sr.
(033
) 58
0-76
89 /
8446
(033
) 58
0-76
89O
1,81
5Sm
all
348
Buga
song
P. M
osco
so S
t., Il
aya,
Buga
song
, Ant
ique
57
04M
s. El
ma T
. Zam
urag
aM
s. Ly
dia
P. Pa
nagu
iton
O80
6Sm
all
386
Cad
iz C
ityBu
rgos
St.,
C
adiz
City
, Neg
. Occ
. 61
21M
r. Je
sus
Pedr
o B.
Zal
darr
iaga
Engr
. Cel
win
L. J
avel
osa
(034
) 49
3-07
88 /
0688
/ 0
075
(034
) 49
3-07
88O
5,83
8Sm
all
363
Cal
inog
Riz
al S
t., C
alin
og, I
loilo
504
0M
r. Sa
lvad
or M
. Pas
apor
teEn
gr. J
orge
L. S
antil
lan
(033
) 34
7-19
37(0
33)
347-
1937
O80
0Sm
all
610
Cau
ayan
Cau
yan,
Neg
ros
Occ
iden
tal
6112
NO
375
Con
cepc
ion
Mun
icip
al B
ldg.
, Con
cepc
ion,
Iloi
lo 5
013
Mr.
Dan
ilo V
. Bal
asba
sM
s. Te
resi
ta Q
. Cel
estia
l(0
33)
392-
0314
(033
) 39
2-03
14O
365
Smal
l
616
Cua
rter
oC
uart
ero,
Cap
izN
O
274
Cul
asi
F. V. L
omug
dang
St.,
Cul
asi, A
ntiq
ue 5
708
Mr.
Ferd
inan
d Pe
rry
S. Va
lent
e(0
36)
277-
8433
O1,
302
Smal
l
346
Dao
Dao
, Cap
iz 5
810
Mr.
Jaim
e Le
eM
r. Tito
Jola
mpo
ngN
O
77D
ingl
e-Po
tota
nC
or. D
alip
e-Sa
nico
Sts
., D
ingl
e, Il
oilo
50
35En
gr. R
omm
el R
. Fal
con
(IGM
)M
s. Li
lian
N. A
spre
r (IB
)(0
33)
351-
0071
; 52
9-71
22(0
33)
351-
0071
O2,
711
Ave
rage
345
Due
ñas
Lago
s St
., D
ueña
s, Ilo
ilo 5
038
Engr
. Edg
ar L
. Lam
era
Mr.
Bert
ier
R. C
atal
an(0
33)
351-
0165
O50
1Sm
all
001-
MD
uman
gas-
Baro
tac
Nue
voP.D
. Mon
fort
Nor
th, D
uman
gas,
Iloilo
50
06En
gr. R
emus
P. B
raga
nza
Ms.
Jose
fi na
B. G
olez
(033
) 36
1-22
50 /
2095
(033
) 36
1-22
50O
3,26
2M
ediu
m
112
Dum
arao
Pobl
acio
n Ila
wod
, Dum
arao
, Cap
iz 5
812
Mr. A
ngel
o S.
Hid
roso
lloM
r. R
amon
C. S
uert
e(0
36)
537-
0076
(036
) 53
7-00
76O
648
Smal
l
360
Esta
ncia
2/F
New
Pub
lic M
arke
t Bl
dg.,
E. R
eyes
A
ve.,
Esta
ncia
, Ilo
ilo 5
017
Engr
. Rod
ney
L. A
greg
ado
Ms.
Liga
ya A
. Bay
lon
(033
) 39
7-10
56(0
33)
397-
1056
O53
7Sm
all
389
Gui
mba
lG
uim
bal,
Iloilo
502
2N
O
267
Ham
ticPo
blac
ion
3, H
amtic
, Ant
ique
571
5M
r. R
eyna
ldo
Dy.
Aba
poM
r. R
omel
ito A
utaj
ayO
290
Smal
l
102
Him
amay
lan
Sego
via
St.,
Him
amay
lan,
Neg
ros
Occ
iden
tal
6108
Engr
. Jai
me
E. V
eran
oM
s. A
ngel
ina
G. G
ayos
o(0
34)
388-
3647
(034
) 38
8-36
47O
3,13
1M
ediu
m
434
Ibaj
ayTa
yco
St.,
Pobl
acio
n, Ib
ajay
, Akl
an 5
613
Ms.
Edna
F. M
agda
luyo
(O
IC)
Dr.
Div
ina
S. O
ngki
ko(0
36)
289-
2067
(036
) 28
9-00
03
(req
uest
)O
109
Smal
l
390
Igba
ras
Ezpe
leta
St.,
Igba
ras
Publ
ic M
arke
t, Ig
bara
s, Ilo
ilo 5
029
Engr
. Ros
emar
y E.
Ebr
eoM
r. Fl
oren
tino
Emm
anue
l(0
33)
315-
6264
(033
) 31
5-62
64O
270
Smal
l
332
Ilog
Dan
cala
n, Il
og, N
egro
s O
ccid
enta
l 61
09M
r. R
ufi n
o G
. Ton
doEn
gr. B
imi P
adill
aO
241
Smal
l
282
Isab
ela
Isab
ela,
Neg
ros
Occ
iden
tal 6
128
Engr
. Nat
hani
el H
. Via
jeM
r. And
res
Sonz
aO
400
Smal
l
323
Jam
inda
nJa
min
dan,
Cap
iz 5
808
Engr
. Ado
lfo R
oble
s, Jr.
Mr. A
rthu
r O
rbig
oN
O
226
Jani
uay
Brgy
. Jib
olo,
Jani
uay,
Iloilo
503
4En
gr. C
arm
elo
L. M
asad
oM
r. R
omeo
L. L
amzo
n(0
33)
531-
8498
(033
) 53
1-84
98O
1,20
5Sm
all
289
Jord
anN
ava
St.,
Brgy
. Riz
al, J
orda
n, G
uim
aras
50
45M
r. M
elch
or F
. Bib
anco
Ms.
Rho
dina
Soc
orro
G
alve
(033
) 23
8-12
88(0
33)
238-
1288
O96
0Sm
all
50K
aban
kala
n C
ityC
or. R
izal
-Tay
um S
ts.,
Kab
anka
lan
City
, N
eg. O
cc.
6111
Engr
. Aqu
iles
M. Z
ayco
, Jr.
Mr.
Luis
S. A
zcon
a(0
34)
471-
2634
(034
) 47
1-34
62O
3,18
5A
vera
ge

106
49La
Car
lota
City
Riz
al S
t., L
a C
arlo
ta C
ity, N
eg.
Occ
iden
tal
6130
Mr.
Nor
bert
o V.
Bacu
lna
Ms.
Cor
azon
Z. P
ilar
(034
) 46
0-24
88(0
34)
460-
2641
O6,
580
Med
ium
281
La C
aste
llana
Feri
a St
., La
Cas
tella
na, N
eg. O
ccid
enta
l 61
31En
gr. R
anul
fo F
. Yap
Ms.
Hyd
ie G
. Rob
les
(034
) 48
5-00
53(0
34)
485-
0053
O1,
223
Smal
l
225
Lam
buna
oM
unic
ipal
Bld
g., L
ambu
nao,
Iloi
lo 5
042
Mr.
Pabl
o C
. Led
a, Jr.
Mr.
Res
titut
o J.
Last
imoz
a(0
33)
349-
1237
(033
) 34
9-12
37O
411
Ave
rage
431
Lem
ery
Lem
ery,
Iloilo
504
3M
r. M
aria
nito
B. A
limo-
ot
(Act
g.)
Mr.
Serg
io M
. Mas
ongs
ong
(033
) 54
4-00
11(0
33)
544-
0011
NO
466
Leon
E. C
apal
la S
t., L
eon,
Iloi
lo 5
026
Arc
h. E
lmer
L. H
olip
asM
r. R
odol
fo S
aave
dra
(033
) 33
1-00
39(0
33)
331-
0039
O67
5Sm
all
364
Liba
cao
Mal
anga
St.,
Pob
laci
on, L
ibac
ao, A
klan
56
02M
s. El
izab
eth
N. Z
ubia
gaM
r. G
iova
nni Y
. Iqu
iz(0
36)
273-
2256
(036
) 27
3-22
56O
520
Smal
l
357
Maa
yon
Maa
yon,
Cap
iz 5
809
Engr
. Jos
ephi
ne O
rend
ezM
r. R
aym
undo
Dis
tor
NO
559
Mal
ayBr
gy. C
atic
lan,
Mal
ay, A
klan
560
8M
r. Ba
rtol
ome
S. Ba
utis
ta, J
r.M
r. R
ufo
T. Sa
capa
ño(0
36)
288-
7390
(036
) 28
8-73
90O
791
Smal
l
258
Mal
inao
Sta.
Mar
ia S
t., P
obla
cion
, Mal
inao
, Akl
an
5606
Engr
. Val
eria
no I.
Dug
cal,
Jr.M
r. Li
dio
I. Itu
riag
a(0
36)
275-
8040
(036
) 27
5-80
40O
504
Smal
l
356
Mam
busa
oSt
a. C
atal
ina
St.,
Mam
busa
o, C
apiz
580
7En
gr. J
essi
ca M
. Man
silla
Att
y. O
thel
lo V
. Nav
arra
(036
) 64
7-01
13 /
0121
(036
) 647
-012
1O
880
Smal
l
234
Man
apla
B. G
allo
St.,
Man
apla
, Neg
ros
Occ
iden
tal
6120
Engr
. Rol
ando
R. R
amos
(IG
M)
Att
y. R
ebec
ca A
. Bar
bo(0
34)
491-
0013
(034
) 49
1-00
13O
940
Smal
l
71M
etro
Iloi
loBo
nifa
cio
Dri
ve, I
loilo
City
500
0En
gr. E
dwin
R. R
eyes
(IG
M)
Att
y. N
orbe
rto
J. Po
seci
on(0
33)
337-
4744
/ 32
72
/ 848
2(0
33)
336-
6538
O29
,401
Very
La
rge
73M
etro
Kal
ibo
C. L
aser
na S
t., K
alib
o, A
klan
560
0M
r. R
enat
o T.
Alb
ar
Mr.
Edga
r T. I
sada
(036
) 26
2-17
83 ;
268-
6828
/ 42
00(0
36)
262-
4285
O15
,326
Larg
e
32M
etro
Rox
asM
RWD
Bld
g., K
m. 1
, Rox
as C
ity 5
800
Engr
. Pab
lo B
. Ber
cilla
(IG
M)
Engr
. Ant
onio
B. M
agtib
ay
(IB)
(036
) 62
1-00
44 /
3215
(036
) 62
1-54
74
/ 608
3O
18,8
38La
rge
383
Mia
gao
Lega
spi S
t., M
iaga
o, Il
oilo
502
3En
gr. B
obby
F. M
onta
lban
Ms.
Mac
rina
N. N
oble
(033
) 31
5-84
30(0
33)
315-
8430
O44
7Sm
all
611
Mur
cia
Mur
cia,
Neg
ros
Occ
iden
tal
612
9N
O
446
New
Luc
ena
Elva
s St
., N
ew L
ucen
a, Ilo
ilo 5
005
Mr.
Hild
ebra
nd G
alla
zaM
r. Vic
ente
Qui
dato
, Jr.
O35
0Sm
all
259
Num
anci
aLa
guin
banu
a Wes
t, N
uman
cia,
Akl
an
5604
Engr
. Ant
onio
S. G
auri
ña (
IGM
)M
r. Wilf
redo
M. F
eleo
(036
) 26
5-44
51 ;
262-
1610
(036
) 26
2-16
10O
1,69
7A
vera
ge
523
Pand
anM
ayor
M. D
ione
la S
t., C
entr
o N
orte
, Pa
ndan
, Ant
ique
571
2En
gr. C
elso
D. T
ajan
lang
itM
r. Pr
uden
cio
C.
Esto
pere
z, Jr.
(036
) 27
8-92
88 /
9714
(036
) 27
8-92
88O
2,10
0M
ediu
m
63Pa
ssi
Salig
umba
St.,
Pas
si C
ity, I
loilo
503
7O
403
Smal
l
296
Patn
ongo
nR
eal S
t., P
atno
ngon
, Ant
ique
570
2M
s. N
ancy
Gra
ce F
. Raf
ols
Mr.
Mig
uel O
. Obl
ima,
Jr.(0
36)
576-
5524
; (0
905)
97
6-55
24O
693
Smal
l
82Pi
lar
Riz
al S
t., P
obla
cion
, Pila
r, C
apiz
580
4M
r. Ant
hony
A. V
illan
ueva
Dr.
Gid
eon
Ike
R. P
atri
cio
O24
8Sm
all
372
Pont
eved
raIs
agan
i St.,
Brg
y. Ila
wod
, Pon
teve
dra,
Cap
iz 5
802
Mr.
Lean
dro
Ant
onio
B. C
apul
soM
r. G
ilber
t B.
Vill
anue
va(0
36)
634-
0102
/ 03
02(0
36)
634-
0302
O97
3Sm
all
206
Pont
eved
raM
unic
ipal
Hal
l, Po
ntev
edra
, Neg
ros
Occ
iden
tal
6105
Ms.
Nel
ia M
. Tan
Ms.
Cor
azon
Gar
banz
os(0
34)
377-
7273
O36
5Sm
all
341
Pres
. Rox
asM
unic
ipal
Bld
g., P
res.
Rox
as, C
apiz
580
3M
r. R
enat
o D
. Gol
ero
Mr.
Elw
in I.
Cor
vera
(036
) 52
7-30
60 ;
323-
1021
(036
) 32
3-11
43O
742
Smal
l
129
Saga
yC
or. M
aria
Lop
ez &
Mar
añon
Sts
., Sa
gay
City
, Neg
. Occ
. 61
22M
r. M
anfr
ed M
. Fue
ntes
fi na
Ms.
The
lma
M. C
hiu
(034
) 48
8-02
19(0
34)
488-
0219
O6,
330
Ave
rage
607
San
Enri
que
San
Enri
que,
Neg
ros
Occ
iden
tal
6104
NO
388
San
Joaq
uin
No.
4, R
izal
St.,
Pob
laci
on, S
an Jo
aqui
n,
Iloilo
502
4M
s. M
a. C
ecili
a S.
Nie
rves
Mr. T
imot
eo S
. Bac
abac
(033
) 31
4-72
88O
486
Smal
l
249
Siba
lom
Gon
zale
s St
., Si
balo
m, A
ntiq
ue 5
713
Engr
. Jon
atha
n G
. de
Gra
cia
Mr.
Rud
ini E
. Ven
egas
(036
) 54
3-76
99 /
7606
(036
) 54
3-76
06O
1,44
8Sm
all

107
598
Sibu
nag
Sibu
nag,
Gui
mar
as 5
045
NO
27Si
lay
City
Jose
C. L
ocsi
n A
ve.,
Sila
y C
ity, N
egro
s O
cc.
6116
Mr.
Gle
nn C
. Ant
ipor
daM
r. R
odol
fo C
. Lim
(034
) 49
5-01
63 /
5011
(034
) 49
5-41
25O
5,00
0M
ediu
m
252
Sipa
lay
Mer
cede
s Bl
vd.,
Brgy
. 11,
Sip
alay
, Neg
ros
Occ
iden
tal
6113
Ms.
Ros
e Ba
ñare
s (IG
M)
Engr
. Eph
raim
Jaci
ldo
(IB)
O10
6Sm
all
533
Talis
ay C
ityBo
nifa
cio
St., T
alis
ay C
ity, N
egro
s O
cc.
6115
Engr
. Man
olito
P. M
endo
za, J
r.M
r. Ke
nnet
h G
. Tir
thda
s(0
34)
495-
0669
/ 50
91(0
34)
495-
5091
O4,
501
Med
ium
368
Tapa
zTa
paz,
Cap
iz 5
814
Mr.
Joaq
uin
Tio
Att
y. Z
oilo
Fal
coN
O
510
Tig
baua
nT
igba
uan,
Iloi
lo 5
021
Mr.
Flor
enci
o Ta
leon
Mr.
Ric
ardo
Tan
tiado
NO
257
Tobi
as F
orni
erR
izal
St.,
Pob
. Nor
te, T
obia
s Fo
rnie
r, A
ntiq
ue 5
716
Mr.
Jess
e V.
Ysu
lat
Mr.
Boni
faci
o D
. Jos
ueO
514
Smal
l
595
Tubu
ngan
Mun
icip
al H
all,
Pobl
acio
n, T
ubun
gan,
Iloi
lo
5021
Engr
. Car
mel
o T.
Taba
quir
aoM
r. O
rlan
do T
. Tac
sago
n(0
33)
396-
0436
(033
) 39
6-04
36O
209
Smal
l
70V
icto
rias
Qui
rino
St.,
Vic
tori
as C
ity, N
egro
s O
ccid
enta
l 61
19En
gr. P
aulin
o M
. Cru
zM
r. Jo
se M
aria
Val
entin
S.
Gar
cia
(034
) 39
9-28
65 /
3554
(034
) 39
9-35
54O
4,21
2M
ediu
m
508
Zar
raga
Taos
Pus
o Fo
unda
tion
Bldg
., R
eal S
t.,
Zar
raga
, Ilo
ilo 5
004
Engr
. Lau
ro S
. Son
ota
Mr.
Gle
nn L
. Sol
o(0
33)
525-
4354
(033
) 52
5-43
54O
840
Smal
l
REG
ION
7
Com
pris
es: B
ohol
, Ceb
u,
Neg
ros
Ori
enta
l & S
iqui
jor
- 22
/ 17
569
Ayu
ngon
New
Pub
lic M
arke
t Bl
dg.,
, Ayu
ngon
, N
egro
s O
rien
tal
6210
Mr.
Mic
hael
A. E
llaM
r. G
erar
do M
. Gar
cia
(035
) 40
6-70
23(0
35)
406-
6007
O1,
572
Smal
l
530
Bais
City
Doo
r 1,
Vic
ente
App
t., A
glip
ay S
t., B
ais
City
, Neg
ros
Ori
enta
l 62
06M
r. Ev
an Ir
ish
L. A
cas
Mr.
Fred
eric
k F.
Saba
te(0
35)
541-
5660
/ 40
2-82
63(0
35)
402-
8263
O3,
361
Smal
l
489
Bant
ayan
Bant
ayan
, Ceb
u 6
052
Mr. T
eres
ito V
illac
astin
Engr
. Rud
olfo
Nol
asco
NO
221
Baya
wan
Cor
. Zam
ora
& N
at’l.
Hi-w
ay, B
ayaw
an,
Neg
. Or.
622
1M
s. A
lma
L. A
bras
aldo
Engr
. Edd
ie P
. Tan
(035
) 22
8-33
49 ;
531-
0055
(035
) 22
8-33
49O
2,54
0A
vera
ge
577
Bogo
San
Vic
ente
St.,
Bog
o, C
ebu
601
0M
r. O
scar
E. A
rcen
asM
r. Le
e J. V
eral
lo(0
32)
251-
2896
; 43
4-92
85(0
32)
251-
2896
; 43
4-92
85O
3,65
3M
ediu
m
452
Borb
onN
atio
nal H
iway
, Po
blac
ion,
Bor
bon,
C
ebu
600
8En
gr. L
eona
rdo
S. La
was
Mr.
Ben
C. S
epul
veda
(032
) 43
2-56
95(0
32)
432-
5695
O1,
848
Smal
l
117
Car
car
San
Vic
ente
Fer
rer
St.,
Cog
on, C
arca
r, C
ebu
601
9En
gr. E
dwar
d L.
Rem
oA
tty.
Dem
ocri
to B
arce
nas
(032
) 48
7-91
41 /
8500
/ 8
525
(032
) 48
7-91
41O
7,61
3M
ediu
m
231
Car
men
Car
men
, Boh
ol 6
005
NO
398
Cla
rin
Pobl
acio
n C
entr
o, C
lari
n, B
ohol
633
0En
gr. V
icto
rian
o Z
. Ler
ias
Mr.
Emm
anue
l A. S
anch
ez(0
919)
680
-170
5O
1,02
8Sm
all
436
Dal
ague
teSa
rmie
nto
St.,
Dal
ague
te, C
ebu
602
2En
gr. L
uisi
to A
. Leg
aspi
Mr.
Serv
illan
o C
isne
ros
(032
) 48
4-87
24(0
32)
484-
8724
O3,
200
Ave
rage
47D
umag
uete
C
ityC
ircum
fere
ntia
l Rd.
, Pur
ok K
alub
ihan
, D
aro,
Dum
ague
te C
ity 6
200
Mr.
Espa
rato
A. D
icen
Arc
h. C
arlo
s B.
Am
asul
a, Jr.
(035
) 22
5-05
51 ;
422-
6961
(035
) 22
5-66
77O
20,1
73La
rge
486
Mad
ride
jos
Mad
ride
jos,
Ceb
u 6
053
NO
11M
etro
Ceb
uM
agal
lane
s -
Lapu
-Lap
u St
s., C
ebu
City
60
00
Engr
. Arm
ando
H. P
ared
esM
r. Ju
an S
aul F
. Mon
teci
llo(0
32)
254-
8434
to
39 ;
253-
2670
(032
) 25
4-53
91O
116,
768
Very
La
rge
142
Met
ro S
iqui
jor
Sout
h Po
blac
ion,
Siq
uijo
r, Si
quijo
r 6
225
Engr
. Ste
ven
J. D
ando
yM
r. Jo
sue
Mon
era
(035
) 34
4-21
67(0
35)
344-
2167
O2,
264
Smal
l
476
Moa
lboa
lPo
blac
ion
East
, Moa
lboa
l, C
ebu
603
2En
gr. R
icha
rd M
. Sun
gcad
Mr. A
lber
to M
alig
-on
(032
) 47
4-80
68(0
32)
474-
8068
O2,
685
Smal
l

108
420
Pina
mun
gaja
nPo
blac
ion,
Pin
amun
gaja
n, C
ebu
603
9En
gr. A
lfred
o M
. Peñ
aM
s. C
leop
atra
B.
Tang
aror
ang
(032
) 46
8-90
02 /
5506
/ 9
435
(032
) 46
8-90
02O
3,01
8A
vera
ge
481
Sant
a Fe
Pobl
acio
n, S
anta
Fe,
Ceb
u 6
047
Engr
. Wilf
redo
B. S
alis
eN
O
253
Sibu
lan
Nill
as S
t., P
obla
cion
, Sib
ulan
, Neg
ros
Or.
62
01En
gr. T
eres
ita P
. Men
dez
Mr.
Pabl
o J. T
urta
l, Jr.
(035
) 22
6-60
58 ;
419-
8598
(035
) 22
6-60
58O
4,08
7Sm
all
617
Tabu
elan
Tabu
elan
, Ceb
u 60
44N
O
80Ta
libon
San
Jose
, Pob
laci
on, T
alib
on, B
ohol
632
5M
r. Pr
ocul
o A
. Caj
esM
r. Pa
ntal
eon
A.
Evan
gelis
ta(0
38)
332-
1078
O1,
788
Smal
l
163
Tanj
ayLe
gasp
i St.,
Tan
jay,
Neg
ros
Ori
enta
l 62
04En
gr. R
icha
rd V
. Reg
alad
o M
s. M
a. Is
abel
B. B
anog
on(0
35)
415-
8480
/ 98
38(0
35)
415-
8480
O5,
876
Med
ium
195
Tole
do C
ity2n
d Fl
oor, T
oled
o Te
rmin
al B
ldg.
, Bay
bay
1, T
oled
o C
ity, C
ebu
6038
Rev
. Fr.
Rau
l J. G
alle
goEn
gr. A
verl
ino
R. Z
ambo
, Sr
.(0
32)
467-
8533
/ 85
44(0
32)
467-
8533
O6,
828
Med
ium
REG
ION
8
Com
pris
es: B
ilira
n, L
eyte
, Sou
ther
n Le
yte,
East
ern,
Nor
ther
n &
Wes
tern
Sam
ar -
40
/ 26
121
Abu
yog
Brgy
. Can
-Ugu
ib, A
buyo
g, Le
yte
651
0En
gr. T
omas
A. B
autis
ta (
IGM
)M
r. Tel
esfo
ro N
. Nic
art
(053
) 33
4-42
01(0
53)
334-
4201
O1,
700
Smal
l
591
Alle
nA
llen,
Nor
ther
n Sa
mar
640
5En
gr. B
erna
rdo
Nal
daN
O
438
Baba
tngo
nBa
batn
gon,
Ley
te 6
520
Mr.
Dan
ilo R
. Jer
usal
emM
r. D
omin
go C
. Agu
irre
NO
215
Base
yK
KK
Bld
g., S
erafi
n M
arab
ut S
t., M
erca
do
Dis
t., B
asey
, Sa
mar
672
0M
s. El
sie
V. M
erid
aM
r. Ale
xis V
. Yu
(055
) 2
76-1
021
(055
) 2
76-1
021
O89
3Sm
all
39Ba
ybay
119
E. Ja
cint
o co
r. M
.L. Q
uezo
n St
s.,
Bayb
ay, L
eyte
652
1En
gr. E
rnes
to D
. Fer
nand
ezM
r. C
yril
Luis
L. A
rrad
aza
(053
) 33
5-20
10; 5
63-9
478
(053
) 56
3-94
78O
6,18
8M
ediu
m
116
Boro
ngan
Saba
ng S
outh
, Bor
onga
n, E
aste
rn S
amar
68
00En
gr. R
aul A
viel
Lop
ezA
tty.
Socr
ates
Ala
r, Jr.
(055
) 56
0-94
58(0
55)
560-
9548
O2,
200
Smal
l
284
Cal
bayo
g C
ityJ.
D. A
velin
o St
., C
alba
yog
City
, Sam
ar
6710
Engr
. Arn
ulfo
W. B
anzo
nM
r. Er
nest
o L.
Aba
solo
(055
) 20
9-12
18 /
1843
/ 2
976
(055
) 20
9-11
83O
8,60
7M
ediu
m
491
Cal
biga
Cal
biga
, Sam
ar 6
715
Engr
. Orl
ando
B. F
igue
roa
Ms.
Petr
ona
C. F
igue
roa
O1,
700
Smal
l
236
Cal
ubia
nSa
n R
oque
St.,
Pob
laci
on, C
alub
ian,
Ley
te
6534
O25
0Sm
all
359
Cat
arm
an2/
F, C
arde
nas
Bldg
., co
r. R
oxas
&
Boni
faci
o St
s., C
atar
man
, Nor
ther
n Sa
mar
640
0
Engr
. Gui
do A
. Mol
lejo
nA
tty.
Xer
xes
B. C
amac
ho(0
53)
254-
1203
; 25
1-82
90(0
53)
251-
8290
O1,
695
Med
ium
107
Cat
balo
gan
Alle
n A
ve. E
xt.,
Pier
2, C
atba
loga
n, S
amar
67
00En
gr. R
alph
S. U
yA
tty.
Ger
ardo
C. T
eves
(055
) 35
6-10
44 ;
543-
9259
(055
) 25
1-26
69O
5,80
3Bi
g
459
Cen
tral
Ley
teD
ulag
, Ley
te 6
505
Ms.
Glo
ria
M. S
año
Mr.
Jesu
s A. B
aran
daN
O
321
Dol
ores
San
Joaq
uin
St.,
Dol
ores
, Eas
tern
Sam
ar
6817
Mr.
Rod
olfo
P. C
arpe
soM
r. N
erio
T. A
beri
aN
O
568
Gen
. Mac
arth
urG
en. M
acar
thur
, Eas
tern
Sam
ar 6
805
Ms.
Wilm
a C
. Pab
ello
Mr.
Felix
H. A
cost
aO
564
Smal
l
201
Gui
uan
Gui
uan,
Eas
tern
Sam
ar 6
809
Mr.
Rol
ando
D. A
bren
ica
Engr
. Arm
ando
T.
Fern
ande
z (IB
)(0
55)
271-
2241
(055
) 27
1-22
41O
1,07
1Sm
all
521
Isab
elH
otel
Isab
el C
ompo
und,
Riz
al S
t., Is
abel
, Le
yte
653
9En
gr. C
amilo
D. E
chav
iaR
et. C
ol. R
aym
undo
H.
Padu
a, Sr
.(0
53)
556-
9227
; 33
7-21
63(0
53)
556-
9227
O2,
133
Smal
l
157
Jaro
G/F
, ABC
Hal
l Bld
g., R
eal S
t., Ja
ro, L
eyte
65
27En
gr. A
nton
io G
. Sor
ima
Mr.
Bene
dict
o S.
Hor
ca, J
r.(0
53)
541-
5683
(053
) 54
1-56
83O
760
Smal
l

109
381
Laoa
ngBr
gy. G
uila
ongi
, Mun
icip
al S
ite, L
aoan
g, N
orth
ern
Sam
ar 6
411
Mr.
Edga
r C
. Men
doza
Engr
. Alfr
edo
Tin
gkin
gco
O30
0Sm
all
558
Law
a-an
Law
a-an
, Eas
tern
Sam
ar 6
813
NO
19Le
yte
Met
roA
. Mab
ini S
t., T
aclo
ban
City
, Ley
te 6
500
Mr.
Nes
tor
P. V
illas
inM
r. Teo
doro
M. d
e Ve
yra,
Jr.(0
53)
325-
8009
/ 43
12(0
53)
325-
8900
O26
,779
Larg
e
220
Llor
ente
Llor
ente
, Eas
tern
Sam
ar 6
803
NO
291
Maa
sin
S. Pa
nal S
t., A
bgao
, Maa
sin
City
, Ley
te
6600
Engr
. Ron
elo
Ant
onio
Pal
enci
a (IG
M)
Ms.
Vir
gini
a R
. Gon
zale
z(0
53)
381-
2461
/ 21
71;
570-
9708
(053
) 38
1-38
41O
3,22
3M
ediu
m
394
Mat
alom
Mat
alom
, Ley
te 6
526
Mr.
Rob
O. L
aoM
r. G
umer
sind
o S.
Paz
NO
522
Mer
cede
sM
erce
des,
East
ern
Sam
ar 6
808
Ms.
Salu
stia
no A
. Gar
ado
Ms.
Eulo
gia
B. M
acap
ugas
NO
520
Mer
ida
Men
doza
St.,
Pob
laci
on, M
erid
a, Le
yte
65
40M
s. N
onin
a C
. Go
Mr.
Susa
no G
. Tor
ejas
O1,
200
Smal
l
246
Met
ro C
arig
ara
Old
Mun
icip
al B
ldg.
, Rec
lam
atio
n A
rea,
Car
igar
a, Le
yte
652
9En
gr. R
egid
or V
. Cab
alle
sD
r. Be
rnar
do V
. de
Guz
man
(053
) 33
1-21
11 /
2431
/ 2
528
(053
) 33
1-24
31
/ 107
2O
4,68
1M
ediu
m
189
Met
ro H
ilong
osG
omez
Ext
ensi
on, H
ilong
os, L
eyte
652
4En
gr. D
anilo
U. F
ulac
heM
s. Pe
trin
a A
. Ful
ache
(053
) 33
6-20
62 /
2820
(053
) 33
6-28
20O
2,53
8A
vera
ge
275
Mon
drag
onM
ondr
agon
, Nor
ther
n Sa
mar
641
7M
r. Lo
sant
o P.
Bebi
taM
r. M
ario
M. M
ader
aN
O
118
Nav
alC
astin
St.,
Nav
al, B
ilira
n 6
543
Mr.
Mar
io C
. Rob
enta
Mr.
Mar
io L
ydin
no R
. O
peña
(053
) 50
0-90
31(0
53)
500-
9643
O4,
365
Med
ium
276
Ora
sO
ras,
East
ern
Sam
ar 6
818
Mr. V
irgi
lio L
. Mon
tanc
esN
O
542
San
Isid
roSa
n Is
idro
, Ley
te 6
535
Engr
. Bob
y T. M
anri
quez
Engr
. Jos
e Eb
ales
NO
557
San
Isid
roM
unic
ipal
Bld
g., S
an Is
idro
, Nor
ther
n Sa
mar
640
9En
gr. C
onra
do C
. Avi
la, J
r.En
gr. T
hom
as G
. Tom
acas
O38
3Sm
all
583
San
Jose
Brgy
. Eas
t, Po
blac
ion,
San
Jose
, Nor
ther
n Sa
mar
640
2M
s. R
osal
inda
I. S
omor
ayM
r. Le
onar
do S
. Ban
gaO
742
Smal
l
416
San
Julia
nSa
n Ju
lian,
Eas
tern
Sam
ar 6
814
Mr.
Kelv
in L
esac
aN
O
188
Sogo
dK
angl
eon
Dri
ve, S
ogod
, Sou
ther
n Le
yte
66
06M
s. A
nice
ta A
. Eng
coy
Dr.
Beni
to D
. Bas
cug
(053
) 38
2-20
52 /
3041
(053
) 38
2-20
52O
1,72
7Sm
all
425
Sula
tSu
lat,
East
ern
Sam
ar 6
815
Mr.
Jaim
e A
. So
Ms.
Nen
ita C
. Pat
illa
(055
) 56
2-55
72(0
55)
562-
5572
O43
6Sm
all
584
Taft
Rea
l St.,
Brg
y. 3,
Taf
t, Ea
ster
n Sa
mar
681
6M
r. Ja
mes
Fra
ncis
C. C
hica
noM
r. Jo
se P
. Cab
acan
gO
259
Smal
l
556
Vic
tori
aPo
blac
ion,
Vic
tori
a, N
orth
ern
Sam
ar
6406
Mr.
Ced
ric
G. P
urog
Mr. A
lde
C. G
onza
gaO
266
Smal
l
190
Vill
area
lV
illar
eal,
Sam
ar 6
717
Mr.
Ger
ardo
C. S
abio
, Jr.
Att
y. Jo
se Z
. Tan
NO
597
Zum
arra
gaZ
umar
raga
, Sam
ar 6
725
NO
REG
ION
9
Com
pris
es: I
sabe
la C
ity, Z
ambo
anga
del
Nor
te, Z
ambo
anga
del
Sur
,
Zam
boan
ga S
ibug
ay &
Zam
boan
ga C
ity)
20 /
15
184
Dap
itan
City
Nat
iona
l Hi-w
ay, P
olo,
Dap
itan
City
, Z
ambo
anga
del
Nor
te 7
101
Mr.
Man
uel H
. Gal
lem
itM
r. Ja
zmin
Z. H
amoy
(065
) 21
3-64
06(0
65)
213-
6406
O3,
221
Med
ium
179
Dip
olog
City
Hi-w
ay, M
inao
g, D
ipol
og C
ity,
Zam
boan
ga d
el N
orte
710
0En
gr. P
ablit
o S.
Palu
caC
ol. B
ienv
enid
o B.
A
beja
ron
(Ret
)(0
65)
212-
2574
/ 67
42
/ 448
5(0
65)
212-
4485
; 21
2-67
42O
10,0
17Bi
g
492
Ipil-
Tita
yN
atio
nal H
ighw
ay, I
pil,
Zam
boan
ga
Sibu
gay
700
1M
r. M
ario
A. L
andi
ngin
(IG
M)
Mr.
Dan
iel I
. Lan
ding
in
(IB)
(062
) 33
3-22
74 /
2995
(062
) 33
3-29
95O
1,47
7Sm
all
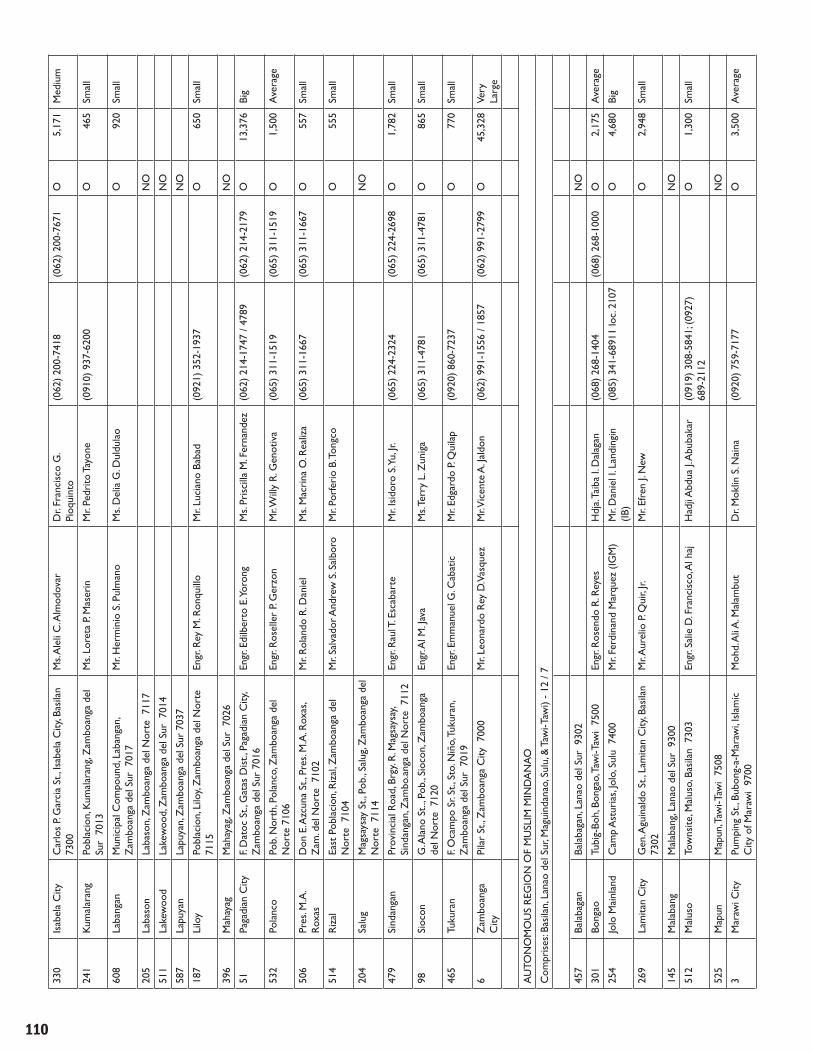
110
330
Isab
ela
City
Car
los
P. G
arci
a St
., Is
abel
a C
ity, B
asila
n
7300
Ms.
Ale
li C
. Alm
odov
ar
Dr.
Fran
cisc
o G
. Pi
oqui
nto
(062
) 20
0-74
18(0
62)
200-
7671
O5,
171
Med
ium
241
Kum
alar
ang
Pobl
acio
n, K
umal
aran
g, Z
ambo
anga
del
Su
r 7
013
Ms.
Lore
ta P
. Mas
erin
Mr.
Pedr
ito T
ayon
e(0
910)
937
-620
0O
465
Smal
l
608
Laba
ngan
Mun
icip
al C
ompo
und,
Lab
anga
n,
Zam
boan
ga d
el S
ur 7
017
Mr.
Her
min
io S
. Pul
man
oM
s. D
elia
G. D
uldu
lao
O92
0Sm
all
205
Laba
son
Laba
son,
Zam
boan
ga d
el N
orte
711
7N
O
511
Lake
woo
dLa
kew
ood,
Zam
boan
ga d
el S
ur 7
014
NO
587
Lapu
yan
Lapu
yan,
Zam
boan
ga d
el S
ur 7
037
NO
187
Lilo
yPo
blac
ion,
Lilo
y, Z
ambo
anga
del
Nor
te
7115
Engr
. Rey
M. R
onqu
illo
Mr.
Luci
ano
Baba
d(0
921)
352
-193
7O
650
Smal
l
396
Mah
ayag
Mah
ayag
, Zam
boan
ga d
el S
ur 7
026
NO
51Pa
gadi
an C
ityF.
Dat
oc S
t., G
atas
Dis
t., P
agad
ian
City
, Z
ambo
anga
del
Sur
701
6En
gr. E
dilb
erto
E. Y
oron
gM
s. Pr
isci
lla M
. Fer
nand
ez(0
62)
214-
1747
/ 47
89(0
62)
214-
2179
O13
,376
Big
532
Pola
nco
Pob.
Nor
th, P
olan
co, Z
ambo
anga
del
N
orte
710
6En
gr. R
osel
ler
P. G
erzo
nM
r. Will
y R
. Gen
otiv
a(0
65)
311-
1519
(065
) 31
1-15
19O
1,50
0A
vera
ge
506
Pres
. M.A
. R
oxas
Don
E. A
zcun
a St
., Pr
es. M
.A. R
oxas
, Z
am. d
el N
orte
710
2M
r. R
olan
do R
. Dan
iel
Ms.
Mac
rina
O. R
ealiz
a(0
65)
311-
1667
(065
) 31
1-16
67O
557
Smal
l
514
Riz
alEa
st P
obla
cion
, Riz
al, Z
ambo
anga
del
N
orte
710
4M
r. Sa
lvad
or A
ndre
w S
. Sal
boro
Mr.
Porf
erio
B. T
ongc
oO
555
Smal
l
204
Salu
gM
agsa
ysay
St.,
Pob
., Sa
lug,
Zam
boan
ga d
el
Nor
te 7
114
NO
479
Sind
anga
nPr
ovin
cial
Roa
d, B
rgy.
R. M
agsa
ysay
, Si
ndan
gan,
Zam
bo.a
nga
del N
orte
711
2En
gr. R
aul T
. Esc
abar
teM
r. Is
idor
o S.
Yu, J
r.(0
65)
224-
2324
(065
) 22
4-26
98O
1,78
2Sm
all
98Si
ocon
G. A
lano
St..
, Pob
., Si
ocon
, Zam
boan
ga
del N
orte
712
0En
gr. A
l M. J
ava
Ms.
Terr
y L.
Zun
iga
(065
) 31
1-47
81(0
65)
311-
4781
O86
5Sm
all
465
Tuku
ran
F. O
cam
po S
r. St
., St
o. N
iño,
Tuk
uran
, Z
ambo
anga
del
Sur
701
9En
gr. E
mm
anue
l G. C
abat
icM
r. Ed
gard
o P.
Qui
lap
(092
0) 8
60-7
237
O77
0Sm
all
6Z
ambo
anga
C
ityPi
lar
St.,
Zam
boan
ga C
ity 7
000
Mr.
Leon
ardo
Rey
D.V
asqu
ezM
r. Vic
ente
A. J
aldo
n(0
62)
991-
1556
/ 18
57(0
62)
991-
2799
O45
,328
Very
La
rge
AU
TON
OM
OU
S R
EGIO
N O
F M
USL
IM M
IND
AN
AO
Com
pris
es: B
asila
n, L
anao
del
Sur
, Mag
uind
anao
, Sul
u, &
Taw
i-Taw
i) -
12 /
7
457
Bala
baga
nBa
laba
gan,
Lan
ao d
el S
ur 9
302
NO
301
Bong
aoTu
big-
Boh,
Bon
gao,
Taw
i-Taw
i 75
00En
gr. R
osen
do R
. Rey
esH
dja.
Taib
a I.
Dal
agan
(068
) 26
8-14
04(0
68)
268-
1000
O2,
175
Ave
rage
254
Jolo
Mai
nlan
dC
amp
Ast
uria
s, Jo
lo, S
ulu
740
0M
r. Fe
rdin
and
Mar
quez
(IG
M)
Mr.
Dan
iel I
. Lan
ding
in
(IB)
(085
) 34
1-68
911
loc.
2107
O4,
680
Big
269
Lam
itan
City
Gen
. Agu
inal
do S
t., L
amita
n C
ity, B
asila
n
7302
Mr. A
urel
io P
. Qui
r, Jr.
Mr.
Efre
n J.
New
O2,
948
Smal
l
145
Mal
aban
gM
alab
ang,
Lana
o de
l Sur
930
0N
O
512
Mal
uso
Tow
nsite
, Mal
uso,
Bas
ilan
730
3En
gr. S
alie
D. F
ranc
isco
, Al h
ajH
adji
Abd
ua J.
Abu
baka
r(0
919)
308
-584
1; (
0927
) 68
9-21
12O
1,30
0Sm
all
525
Map
unM
apun
, Taw
i-Taw
i 75
08N
O
3M
araw
i City
Pum
ping
St.,
Bub
ong-
a-M
araw
i, Is
lam
ic
City
of M
araw
i 97
00M
ohd.
Ali
A. M
alam
but
Dr.
Mok
lin S
. Nai
na(0
920)
759
-717
7O
3,50
0A
vera
ge
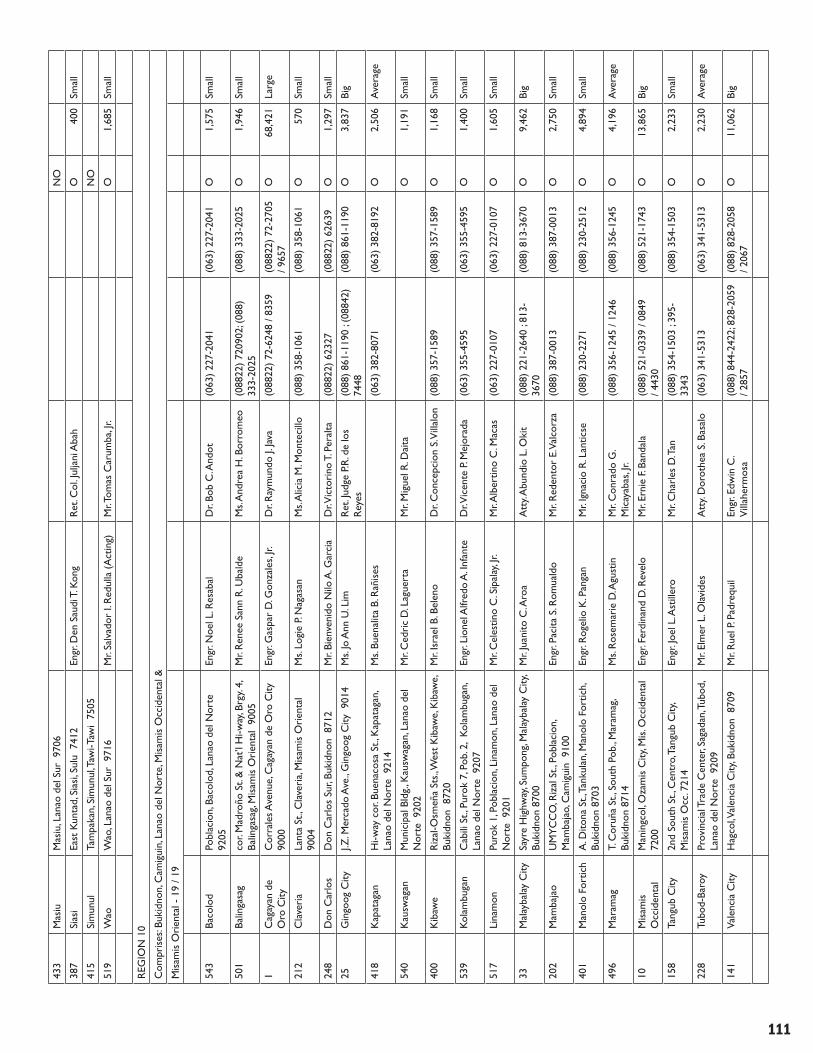
111
433
Mas
iuM
asiu
, Lan
ao d
el S
ur 9
706
NO
387
Sias
iEa
st K
unta
d, S
iasi
, Sul
u 7
412
Engr
. Den
Sau
di T
. Kon
gR
et. C
ol. J
ulja
ni A
bah
O40
0Sm
all
415
Sim
unul
Tam
paka
n, S
imun
ul, T
awi-T
awi
7505
NO
519
Wao
Wao
, Lan
ao d
el S
ur 9
716
Mr.
Salv
ador
I. R
edul
la (
Act
ing)
Mr. T
omas
Car
umba
, Jr.
O1,
685
Smal
l
REG
ION
10
Com
pris
es: B
ukid
non,
Cam
igui
n, L
anao
del
Nor
te, M
isam
is O
ccid
enta
l &
Mis
amis
Ori
enta
l - 1
9 / 1
9
543
Baco
lod
Pobl
acio
n, B
acol
od, L
anao
del
Nor
te
9205
Engr
. Noe
l L. R
esab
alD
r. Bo
b C
. And
ot(0
63)
227-
2041
(063
) 22
7-20
41O
1,57
5Sm
all
501
Balin
gasa
gco
r. M
adro
ño S
t. &
Nat
’l H
i-way
, Brg
y. 4,
Ba
linga
sag,
Mis
amis
Ori
enta
l 90
05M
r. R
enee
San
n R
. Uba
lde
Ms.
And
rea
H. B
orro
meo
(088
22)
7209
02; (
088)
33
3-20
25(0
88)
333-
2025
O1,
946
Smal
l
1C
agay
an d
e O
ro C
ityC
orra
les A
venu
e, C
agay
an d
e O
ro C
ity
9000
En
gr. G
aspa
r D
. Gon
zale
s, Jr.
Dr.
Ray
mun
do J.
Java
(088
22)
72-6
248
/ 835
9(0
8822
) 72
-270
5 / 9
657
O68
,421
Larg
e
212
Cla
veri
aLa
nta
St.,
Cla
veri
a, M
isam
is O
rien
tal
9004
Ms.
Logi
e P.
Nag
asan
Ms.
Alic
ia M
. Mon
teci
llo(0
88)
358-
1061
(088
) 35
8-10
61O
570
Smal
l
248
Don
Car
los
Don
Car
los
Sur,
Buki
dnon
871
2M
r. Bi
enve
nido
Nilo
A. G
arci
aD
r. Vic
tori
no T
. Per
alta
(088
22)
6232
7(0
8822
) 62
639
O1,
297
Smal
l
25G
ingo
og C
ityJ.Z
. Mer
cado
Ave
., G
ingo
og C
ity 9
014
Ms.
Jo A
nn U
. Lim
Ret
. Jud
ge P
.R. d
e lo
s R
eyes
(088
) 86
1-11
90 ;
(088
42)
7448
(088
) 86
1-11
90O
3,83
7Bi
g
418
Kap
atag
anH
i-way
cor
. Bue
naco
sa S
t., K
apat
agan
, La
nao
del N
orte
921
4M
s. Bu
enal
ita B
. Rañ
ises
(063
) 38
2-80
71(0
63)
382-
8192
O2,
506
Ave
rage
540
Kau
swag
anM
unic
ipal
Bld
g., K
ausw
agan
, Lan
ao d
el
Nor
te 9
202
Mr.
Ced
ric
D. L
ague
rta
Mr.
Mig
uel R
. Dai
taO
1,19
1Sm
all
400
Kib
awe
Riz
al-O
smeñ
a St
s., W
est
Kib
awe,
Kib
awe,
Bu
kidn
on 8
720
Mr.
Isra
el B
. Bel
eno
Dr.
Con
cepc
ion
S. V
illal
on(0
88)
357-
1589
(088
) 35
7-15
89O
1,16
8Sm
all
539
Kola
mbu
gan
Cab
ili S
t., P
urok
7, P
ob. 2
, Ko
lam
buga
n,
Lana
o de
l Nor
te 9
207
Engr
. Lio
nel A
lfred
o A
. Inf
ante
Dr. V
icen
te P
. Mej
orad
a(0
63)
355-
4595
(063
) 35
5-45
95O
1,40
0Sm
all
517
Lina
mon
Puro
k 1,
Pob
laci
on, L
inam
on, L
anao
del
N
orte
920
1M
r. C
eles
tino
C. S
ipal
ay, J
r.M
r. Alb
ertin
o C
. Mac
as(0
63)
227-
0107
(063
) 22
7-01
07O
1,60
5Sm
all
33M
alay
bala
y C
itySa
yre
Hig
hway
, Sum
pong
, Mal
ayba
lay
City
, Bu
kidn
on 8
700
Mr.
Juan
ito C
. Aro
aA
tty.
Abu
ndio
L. O
kit
(088
) 22
1-26
40 ;
813-
3670
(088
) 81
3-36
70O
9,46
2Bi
g
202
Mam
baja
oU
MY
CC
O, R
izal
St.,
Pob
laci
on,
Mam
baja
o, C
amig
uin
910
0En
gr. P
acita
S. R
omua
ldo
Mr.
Red
ento
r E.
Val
corz
a(0
88)
387-
0013
(088
) 38
7-00
13O
2,75
0Sm
all
401
Man
olo
Fort
ich
A. D
itona
St.,
Tan
kula
n, M
anol
o Fo
rtic
h,
Buki
dnon
870
3En
gr. R
ogel
io K
. Pan
gan
Mr.
Igna
cio
R. L
antic
se(0
88)
230-
2271
(088
) 23
0-25
12O
4,89
4Sm
all
496
Mar
amag
T. C
oruñ
a St
., So
uth
Pob.
, Mar
amag
, Bu
kidn
on 8
714
Ms.
Ros
emar
ie D
. Agu
stin
Mr.
Con
rado
G.
Mic
ayab
as, J
r.(0
88)
356-
1245
/ 12
46(0
88)
356-
1245
O4,
196
Ave
rage
10M
isam
is
Occ
iden
tal
Man
ingc
ol, O
zam
is C
ity, M
is. O
ccid
enta
l 72
00En
gr. F
erdi
nand
D. R
evel
o M
r. Er
nie
F. Ba
ndal
a(0
88)
521-
0339
/ 08
49
/ 443
0(0
88)
521-
1743
O13
,865
Big
158
Tang
ub C
ity2n
d So
uth
St.,
Cen
tro,
Tan
gub
City
, M
isam
is O
cc. 7
214
Engr
. Joe
l L. A
still
ero
Mr.
Cha
rles
D. T
an(0
88)
354-
1503
; 39
5-33
43(0
88)
354-
1503
O2,
233
Smal
l
228
Tubo
d-Ba
roy
Prov
inci
al T
rade
Cen
ter,
Saga
dan,
Tub
od,
Lana
o de
l Nor
te 9
209
Mr.
Elm
er L
. Ola
vide
sA
tty.
Dor
othe
a S.
Basa
lo(0
63)
341-
5313
(063
) 34
1-53
13O
2,23
0A
vera
ge
141
Vale
ncia
City
Hag
col, V
alen
cia
City
, Buk
idno
n 8
709
Mr.
Rue
l P. P
adre
quil
Engr
. Edw
in C
. V
illah
erm
osa
(088
) 84
4-24
22; 8
28-2
059
/ 285
7(0
88)
828-
2058
/ 2
067
O11
,062
Big

112
REG
ION
11
Com
pris
es: C
ompo
stel
a Val
ley,
Dav
ao C
ity, D
avao
del
Nor
te, D
avao
del
Sur
Dav
ao O
rien
tal)
- 18
/ 16
579
B. E
. Duj
ali
B. E
. Duj
ali,
Dav
ao d
el N
orte
810
5O
13Sm
all
154
Baga
nga
Con
cepc
ion
St.,
Baga
nga,
Dav
ao O
rien
tal
8204
Mr. A
bello
L. D
ongi
apon
Ms.
Ger
aldi
ne R
. M
atab
alan
O51
4Sm
all
57Ba
nsal
an15
35 R
. De
los
Cie
ntos
cor
. Cam
ia S
ts.,
Bans
alan
, Dav
ao d
el S
ur
8005
Mr.
Paul
J. A
rche
sM
r. Vic
ente
Com
ia(0
82)
553-
9228
; (0
919)
82
5-47
83(0
82)
553-
9229
O4,
008
Ave
rage
319
Car
men
Puro
k 7,
Gum
amel
a St
., Po
b., C
arm
en,
Dav
ao d
el N
orte
810
1M
r. Er
nest
o S.
Facu
la, S
r.M
r. Sa
ntia
go S
. Pes
anos
(091
9) 4
66-7
556
O44
5Sm
all
5D
avao
City
Km
. 5, J
. P. L
aure
l Ave
., D
avao
City
800
0 En
gr. R
odor
a N
. Gam
boa
Mr.
Edua
rdo
A. B
anga
yan
(082
) 22
1-94
00 t
o 12
(0
82)
226-
4885
; 22
4-53
91O
158,
788
Very
La
rge
147
Dig
osR
izal
Ave
nue,
Dig
os C
ity, D
avao
del
Sur
80
02A
tty.
Isau
ros
B. G
rava
dor
Att
y. O
llita
P. A
tillo
-Any
og(0
82)
553-
2111
; 351
-007
1(0
82)
553-
2872
O10
,607
Big
548
Hag
onoy
Gui
hing
, Hag
onoy
, Dav
ao d
el S
ur 8
006
Mr.
Ram
on H
. Ven
cio
Dr.
Car
los
C. C
lem
ente
O18
9Sm
all
564
Isla
nd G
arde
n C
ity o
f Sam
alSI
MC
Bld
g., C
or.M
abin
i-Riz
al S
ts.,
Sam
al,
Dav
ao 8
119
Ms.
Ines
D. S
olam
oM
r. Sa
mso
n B.
Pac
ione
s(0
84)
301-
4013
(084
) 30
1-40
13O
2,60
6Sm
all
507
Kib
law
anPo
blac
ion,
Kib
law
an, D
avao
del
Sur
80
08M
r. H
ones
to L
. Cañ
edo
Mr.
Edm
undo
B. T
ampo
sO
850
Smal
l
428
Lupo
nA
guin
aldo
cor
. K. B
arat
ua S
ts.,
Lupo
n,
Dav
ao O
rien
tal
8207
Mr.
Ric
ardo
C. V
icen
teM
r. Wilb
ert
C. N
go(0
87)
808-
0381
(087
) 80
8-03
81O
1,15
6Sm
all
490
Mal
alag
Mal
alag
, Dav
ao d
el S
ur 8
010
NO
35M
ati
Ong
Sub
divi
sion
, Mat
i City
, Dav
ao
Ori
enta
l 82
00En
gr. J
esus
Ces
ar P
. Alb
aric
oA
tty.
Arn
ulfo
Agl
eron
(082
) 81
1-03
92(0
82)
811-
2457
O3,
100
Smal
l
423
Mon
kayo
Mon
kayo
, Com
post
ela V
alle
y 8
111
NO
146
Nab
untu
ran
J. P.
Laur
el B
lvd.
, Pob
., N
abun
tura
n,
Com
post
ela V
alle
y 8
106
Ms.
Flor
enci
a C
. Lag
ura
Mr.
Edga
rdo
D. S
avel
lano
(084
) 37
6-10
10(0
84)
376-
1010
O2,
387
Ave
rage
552
New
Cor
ella
Pobl
acio
n, N
ew C
orel
la, D
avao
del
N
orte
810
4M
r. Pa
ulin
o M
. Day
ocM
r. El
y O
. Bae
rO
915
Smal
l
200
Pana
bo
J.P. L
aure
l St.,
Pan
abo
City
, Dav
ao 8
105
Mr.
Rey
nald
o B.
Ort
izM
r. D
omin
go C
. Cas
lib(0
84)
628-
5356
; 822
-316
7(0
84)
822-
3167
O2,
719
Ave
rage
161
San
Isid
roPo
blac
ion,
San
Isid
ro, D
avao
Or.
820
9En
gr. E
dgar
do F
. Ped
rosa
Mr.
Pio
L. T
e, Jr
.(0
910)
832
-756
0O
714
Smal
l
175
Tagu
mM
iraf
uent
es D
ist.,
Nat
iona
l Hi-w
ay,
Tagu
m C
ity, D
avao
810
0M
r. H
enri
etto
Q. C
astr
ence
Engr
. Eug
enio
S. G
uhao
, Jr.
(084
) 21
7-31
59 /
1620
; 40
0-11
37(0
84)
400-
1137
O16
,183
Big
REG
ION
12
Com
pris
es: N
orth
Cot
abat
o, S
aran
gani
, Sou
th C
otab
ato
& S
ulta
n K
udar
at -
24
/ 24
565
Ant
ipas
Pobl
acio
n, A
ntip
as, N
orth
Cot
abat
o
9414
Mr.
Ron
aldo
R. A
baso
loM
r. Be
njam
in H
. Lop
ez(0
919)
305
-013
0 / (
0910
) 75
6-95
99O
1,12
3Sm
all
230
Bang
aQ
uezo
n A
ve.,
Pobl
acio
n, B
anga
, Sou
th
Cot
abat
o 9
511
Engr
. Eug
enio
G. O
rteg
aM
r. Alfr
edo
C. F
erre
r(0
83)
239-
1036
(083
) 23
9-10
36O
540
Smal
l
370
Gen
. San
tos
City
E. F
erna
ndez
St.,
Lag
ao, G
en. S
anto
s C
ity,
So. C
ot.9
500
Engr
. Arn
B. G
ella
ngar
inEn
gr. J
ose
P. Va
lenz
uela
(083
) 55
3-49
60; 5
54-7
231
(083
) 55
3-49
60O
22,0
85M
ediu
m
439
Gla
nN
atio
nal H
i-way
, Cal
aban
it, G
lan,
Sa
rang
ani 9
517
Mr.
Ren
e S.
Hiz
oler
M
s. R
osita
P. M
alan
ao(0
83)
225-
9036
(083
) 22
5-90
36O
1,20
0Sm
all

113
194
Kab
acan
Riz
al A
venu
e, K
abac
an, N
orth
Cot
abat
o
9407
Mr.
Ferd
ie M
ar S
. Bal
unga
yD
r. Art
uro
N. A
nula
o(0
64)
248-
2074
/ 39
1-11
72(0
64)
248-
2767
O3,
999
Med
ium
376
Kal
aman
sig
341
Pobl
acio
n, K
alam
ansi
g, Su
ltan
Kud
arat
980
8En
gr. A
rist
eo J.
Lao
(IG
M)
Engr
. Fre
d Fa
bello
n (IB
)O
405
Smal
l
156
Koro
nada
l79
G. H
. del
Pila
r St
., Ko
rona
dal C
ity, S
o.
Cot
abat
o 9
506
Engr
. Fre
d Fa
bello
n (IG
M)
Mr.
Dan
iel I
. Lan
ding
in
(IB)
(083
) 38
1-01
27 ;
520-
0764
(083
) 38
1-01
27O
5,17
2A
vera
ge
499
Leba
kG
alid
o Bl
dg.,
Pob.
1, L
ebak
, Sul
tan
Kud
arat
980
7M
r. C
itlan
d R
olan
do C
. Ton
gcua
Rev
. Fr.
Elm
er I.
del
a C
ruz
(064
) 20
5-35
54(0
64)
205-
3003
O42
0Sm
all
209
M’la
ngR
izal
St.,
M’la
ng, N
orth
Cot
abat
o 9
402
Engr
. Rob
ert
S. C
adie
naM
s. Li
lia L
. Cue
rpo
(064
) 26
8-40
06 ;
452-
0117
(064
) 26
8-40
06O
1,13
3Sm
all
444
Maa
sim
Mun
icip
al C
ompo
und,
Pob
laci
on, M
aasi
m,
Sara
ngan
i 9
502
Mr.
Dal
mac
io O
. Pel
ones
Mr.
Cir
iaco
Vel
itaO
625
Smal
l
216
Mal
apat
anM
alap
atan
, Sar
anga
ni 9
516
O10
0Sm
all
592
Mal
ungo
nPo
blac
ion,
Mal
ungo
n, S
aran
gani
950
3M
r. H
enry
Lito
Pac
tes
Ms.
Vio
leta
P. A
nfon
e(0
915)
580
-830
0O
547
Smal
l
30M
etro
C
otab
ato
Gov
. Gut
ierr
ez A
venu
e, C
otab
ato
City
, C
otab
ato
9600
Att
y. D
elfi n
C. H
ilari
oEn
gr. Y
u Be
ng L
. Chu
a(0
64)
421-
3566
/ 35
69
/ 107
0(0
64)
421-
3596
/ 3
009
O22
,700
Big
41M
etro
K
idap
awan
Lana
o, K
idap
awan
, Nor
th C
otab
ato
94
00M
s. St
ella
G. A
nim
aM
s. M
a. C
oraz
on G
. M
alal
uan
(064
) 28
8-18
65 /
1533
/ 5
257
(064
) 28
8-52
57 ;
378-
4376
O19
,012
Larg
e
174
Met
ro M
idsa
yap
007
Pob.
8, M
idsa
yap,
Nor
th C
otab
ato
9416
Ms.
Car
ol S
. Tol
entin
oA
tty.
Rod
olfo
D.
Cam
bron
ero
(064
) 22
9-82
15 /
8973
(064
) 22
9-89
73O
3,65
8A
vera
ge
213
Nor
ala
Alu
nan
Ave
., Po
blac
ion,
Nor
ala,
Sout
h C
otab
ato
950
8En
gr. J
oven
P. A
guila
r (IG
M)
Ms.
Erib
erta
P. P
ulid
o(0
83)
234-
1018
(083
) 23
4-10
18O
622
Smal
l
477
Pigc
away
anR
oque
ro S
t., P
igka
way
an, N
orth
C
otab
ato
941
2En
gr. A
rist
eo J.
Lao
Mr.
Fred
F. F
abel
lon
(IB)
(064
) 22
9-32
26(0
64)
229-
3400
O49
7Sm
all
495
Piki
tN
atio
nal H
i-way
, Pob
., Pi
kit,
Nor
th
Cot
abat
o 9
409
Engr
. Max
Vilo
ria
Boad
oA
tty.
Emm
anue
l G.
Fere
nal
(064
) 45
7-00
85(0
64)
457-
0085
O1,
107
Smal
l
153
Polo
mol
okD
ulay
Sub
dv.,
Nat
iona
l Hi-w
ay,
Polo
mol
ok, S
o. C
ot.
9504
Mr. A
ndre
sito
J. G
illa
Engr
. Pan
fi lo
R. J
aym
e(0
83)
225-
2020
; 500
-902
2(0
83)
500-
8008
O8,
901
Ave
rage
582
Pres
. Rox
asPr
es. R
oxas
, Nor
th C
otab
ato
9405
Engr
. Em
ilio
Vale
nte
(Act
ing)
Mr.
Rob
ert
G. H
erbi
lla, S
r.(0
919)
323
-870
7O
418
Smal
l
247
Sulta
n K
udar
atC
or. B
onifa
cio
& Q
uiri
no S
ts., T
acur
ong
City
, Sul
tan
Kud
arat
980
0En
gr. J
ose
D. T
abug
a, Jr.
Engr
. Non
ito P
. Ber
nard
o(0
64)
200-
3359
/ 33
53
/ 507
2(0
64)
200-
3359
O8,
790
Med
ium
500
Sura
llah
Cro
ssin
g C
urva
, Daj
ay, S
ural
lah,
Sou
th
Cot
abat
o 9
512
Engr
. Igm
edio
E. S
ubill
aga
Att
y. G
erm
an A
. O
peri
ano
(083
) 23
8-37
83(0
83)
238-
3264
O1,
237
Smal
l
590
Tulu
nan
J.P. R
izal
St.,
Pob
laci
on, T
ulun
an, N
orth
C
otab
ato
9403
Ms.
Che
rry
Ann
B. F
aust
ino
Ms.
Libe
rty
Cad
unga
n(0
921)
609
-188
0O
165
Smal
l
280
Tupi
Surr
iga
Bldg
., Tup
i Nat
’l H
iway
, Tup
i, So
. C
otab
ato
950
5M
r. Ja
son
C. S
urri
ga (
OIC
-GM
)M
r. Ja
ime
P. Ja
ngca
n(0
83)
822-
0002
(083
) 82
2-00
02O
624
Smal
l

114
CA
RA
GA
AD
MIN
IST
RAT
IVE
REG
ION
Com
pris
es: A
gusa
n de
l Nor
te, A
gusa
n de
l Sur
,C
LASS
I-
Suri
gao
del N
orte
& S
urig
ao d
el S
ur -
32
/ 20
550
Ale
gria
Ale
gria
, Sur
igao
del
Nor
te 8
425
Engr
. Jai
me
T. G
algo
, Jr.
Mr. V
aler
io R
anay
NO
515
Bacu
agN
aldo
za S
t., B
acua
g, Su
riga
o de
l Nor
te
8408
Engr
. Jim
uel O
. Yu
Ms.
Vic
trec
ia A
. Ade
l(0
86)
826-
5355
(PC
O)
(086
) 82
6-53
55
(PC
O)
O67
2Sm
all
193
Baro
boBa
robo
, Sur
igao
del
Sur
830
9En
gr. C
onso
rcio
P. B
arri
gaN
O
243
Bayu
gan
Lanz
ones
St.,
Pob
., Ba
yuga
n, A
gusa
n de
l Su
r 8
502
Ms.
Felif
a M
. Asi
s M
r. D
arlit
o A
. Sul
it, S
r.(0
85)
830-
0452
/ 22
44 ;
231-
3140
(085
) 83
0-22
44O
2,77
7M
ediu
m
23Bi
slig
City
Cor
. Joh
n Bo
sco
& H
i-way
, Man
gago
y, Bi
slig
City
, Sur
igao
del
Sur
831
1En
gr. M
enill
o C
. Sie
gaM
r. R
ober
to A
. D
orm
endo
(086
) 62
8-20
92; 8
53-2
032
(086
) 62
8-20
92O
8,37
6M
ediu
m
406
Buen
avis
taN
atio
nal H
i-way
, Brg
y. 2,
Bue
navi
sta,
Agu
san
del N
orte
860
1En
gr. C
onch
ito E
. Qui
mzo
nD
r. R
aym
undo
A. A
viso
, Jr.
(085
) 34
3-40
37(0
85)
343-
4037
O1,
810
Smal
l
549
Buna
wan
Puro
k 2,
San
Teo
doro
, Bun
awan
, Agu
san
del S
ur 8
506
Engr
. Arm
ando
T. C
aban
illa
Dr.
Emet
erio
I. C
astil
lo, J
r.O
492
Smal
l
7Bu
tuan
City
Gov
. J. A
. Ros
ales
Ave
., Bu
tuan
City
, A
gusa
n de
l Nor
te 8
600
Engr
. Ans
elm
o L.
San
g Tia
nM
r. Fe
rdin
and
C.
Pien
cena
ves
(085
) 34
2-31
45; 3
41-6
373
to 7
4(0
85)
815-
1268
; 34
1-50
08O
30,7
27Bi
g
240
Cab
adba
ran
Gar
ame
St.,
Cab
adba
ran,
Agu
san
del
Nor
te 8
605
Mr.
Bene
dict
o S.
Flor
esM
s. N
ativ
idad
M. F
uent
es(0
85)
344-
6001
NO
502
Cag
wai
tM
olav
e St
., Ara
s-as
an, C
agw
ait,
Suri
gao
del S
ur 8
304
O60
0Sm
all
441
Can
tilan
Urb
izto
ndo
St.,
Mag
osilo
m, C
antil
an,
Suri
gao
del S
ur 8
317
Mr.
Segu
ndin
o B.
Bun
iel
Mr.
Jesu
s G
. Ort
ega
(086
) 21
2-50
34(0
86)
212-
5034
O1,
389
Smal
l
547
Car
rasc
alC
arra
scas
al, S
urig
ao d
el S
ur 8
318
Mr.
Cel
so P
. Aza
rcon
Mr. A
rcad
io T
rugi
lloN
O
464
Cla
ver
Cla
ver,
Suri
gao
del N
orte
841
0M
r. Ant
onio
Pac
quia
oN
O
588
Del
Car
men
Del
Car
men
, Sur
igao
del
Nor
te 8
418
Mr. A
nder
son
U. L
icua
nEn
gr. J
erw
in P
. Yee
(086
) 23
2-55
95 (
PCO
)O
577
Smal
l
594
Gig
aqui
tG
igaq
uit,
Suri
gao
del N
orte
840
9N
O
594
Hin
atua
nPa
tern
o St
., St
o. N
iño,
Hin
atua
n, S
urig
ao
del S
ur 8
310
Engr
. Jos
e H
ilari
o V.
Pand
ili, J
r.M
r. C
harl
ito C
. Sab
ado
(092
0) 4
20-2
304
O1,
573
Smal
l
104
Lian
gaM
abin
i St.,
Lia
nga,
Suri
gao
del S
ur 8
307
Mr. W
ilfre
do G
. San
chez
Mr. A
ngel
ito M
. Dy
(086
) 61
6-00
20O
1,20
0Sm
all
404
Ling
igPo
blac
ion,
Lin
gig,
Suri
gao
del S
ur 8
312
Mr.
Elyz
er B
. Lim
Mr. A
nton
io P
. Ver
ano
NO
504
Mad
rid
Nat
iona
l Hi-w
ay, M
adri
d, S
urig
ao d
el
Sur
831
6M
r. Er
nest
o D
. Rio
sM
s. Eu
trop
ia P
. Aza
rcon
(086
) 21
3-40
67O
567
Smal
l
435
Mag
alla
nes
G/F
Brg
y. H
all,
Pob.
., M
agal
lane
s, A
gusa
n de
l Nor
te 8
604
Mr.
Ren
ato
V. D
uran
aM
r. M
anue
l R. A
lbas
inN
O
498
Mai
nit
Mai
nit,
Suri
gao
del N
orte
840
7N
O
56M
etro
Sia
rgao
Dap
a, Su
riga
o de
l Nor
te 8
417
Mr. A
nton
io J.
Ada
pon
Mr.
Pio
L. T
iuO
350
Smal
l
211
Nas
ipit
Mam
bo R
oad,
B-5
, Brg
y. Tr
iang
ular
, N
asip
it, A
gusa
n de
l Nor
te 8
602
Ms.
Leon
arda
R. F
uert
esM
r. R
ober
to O
. Pus
a(0
85)
283-
3061
/343
-330
2(0
85)
343-
3302
O3,
234
Ave
rage
355
Plac
erA
. Pat
iño
cor.
E. C
usto
dio,
Pla
cer,
Suri
gao
del N
orte
840
5En
gr. A
ndro
Mic
hael
C.B
ugas
Mr.
Ram
on F
. Alta
mer
o, S
r.(0
86)
623-
0009
(086
) 82
6-44
15O
2,10
0Sm
all
66Pr
ospe
rida
dPo
blac
ion,
Pro
sper
idad
, Agu
san
del S
ur
8500
Mr.
Rud
y E.
Met
ante
Mr.
Rau
l S. T
ello
(085
) 24
1-31
99(0
85)
241-
3199
O1,
500
Smal
l

115
399
San
Fran
cisc
oO
smen
ia S
t., B
rgy.
2, S
an F
ranc
isco
, A
gusa
n de
l Sur
850
1M
r. El
mer
T. L
uzon
Ms.
Judi
th C
. San
saet
(085
) 34
3-86
23 ;
839-
0457
(085
) 36
3-13
30O
4,15
6M
ediu
m
578
San
Jose
(D
inag
at Is
land
)Sa
n Jo
se, D
inag
at Is
land
, Sur
igao
del
N
orte
841
2M
r. Wilf
redo
Cai
nlit
Mr.
Jerr
y L.
Mar
tija
NO
397
San
Mig
uel
San
Mig
uel,
Suri
gao
del S
ur 8
301
Engr
. Sam
uel A
. Esp
anch
oM
r. R
eyna
ldo
L. C
aput
olN
O
324
Suri
gao
Met
roK
m. 2
, Nat
iona
l Hi-w
ay, S
urig
ao C
ity,
Suri
gao
del N
orte
840
0En
gr. B
enja
min
R. E
nsom
o, Jr
. M
r. Bi
enve
nido
C. I
lano
(086
) 23
2-67
06; 2
31-7
163
(086
) 82
6-02
69O
14,2
81Bi
g
419
Tagb
ina
Nat
iona
l Hi-w
ay, P
ob., T
agbi
na, S
urig
ao
del S
ur 8
308
Engr
. Ild
efon
so C
. Alb
arra
cin
Ms.
Fe M
. Pol
izon
(086
) 61
6-00
10O
830
Smal
l
105
Tand
agA
ng’s
Bldg
., N
atio
nal H
i-way
, Nab
ua,
Tand
ag, S
urig
ao d
el S
ur 8
300
Engr
. Rub
en C
. Elp
aM
r. Tim
oteo
T. O
rqui
na, J
r.(0
86)
211-
3258
/ 46
00(0
86)
211-
3258
O4,
826
Med
ium
405
Tuba
yc/
o LG
U, T
ubay
, Agu
san
del N
orte
860
6 M
r. M
anue
l F. C
arlo
ta (
Act
g.)
Mr.
Erne
sto
Z. M
onte
rola
NO
2,56
4,45
4
LEG
END
:
CC
C -
Con
ditio
nal C
ertifi
cat
e of
Con
form
ance
No.
of S
.C. -
as
of D
ecem
ber
31, 2
006
TOTA
L W
DS
FOR
MED
WIT
H
CC
C
592
IB -
Inte
rim
Boa
rd (
LWU
A d
esig
nate
d)O
PER
ATIO
NA
L W
DS
472
IGM
- In
teri
m G
ener
al M
anag
er (
LWU
A -
des
igna
ted)
NO
N-
OPE
RAT
ION
AL
WD
S
120
O -
Ope
ratio
nal