Water Supply and Sanitation Services in South Africa: A ...
125
University of Cape Town UNIVERSITY OF CAPE TOWN Water Supply and Sanitation Services in South Africa: A Cluster Analysis Approach Submitted by Saaligha Gool Masters Thesis Department of Civil Engineering November 2013
Transcript of Water Supply and Sanitation Services in South Africa: A ...

Univers
ity of
Cap
e Tow
n
UNIVERSITY OF CAPE TOWN
Water Supply and
Sanitation Services in
South Africa: A Cluster
Analysis Approach
Submitted by Saaligha Gool
Masters Thesis
Department of Civil Engineering
November 2013

The copyright of this thesis vests in the author. No quotation from it or information derived from it is to be published without full acknowledgement of the source. The thesis is to be used for private study or non-commercial research purposes only.
Published by the University of Cape Town (UCT) in terms of the non-exclusive license granted to UCT by the author.
Univers
ity of
Cap
e Tow
n

Univers
ity of
Cap
e Tow
n
August 2013 i
Executive Summary Previous government policy dictated that municipal services should not be distributed equally to all
South Africans. Consequently, large inequalities in access to water supply and sanitation services
were created along racial and geographic lines. After 1994, government policy sort to rectify this
situation, largely through pro-poor service provision policies and programs.
Continuous and accurate monitoring and reporting of access statistics is crucial to ensuring that
progress is made. Progress within the provinces, however, would not have been equal due to the
difficulty with providing services to different regions. As such, large disparities still exist. In order to
assess the current inequality, local municipalities were grouped according to access to adequate
services and their progress made from 2001, using the statistical method of cluster analysis.
It was discovered that provinces, with access to improved services for over 75% of households, had
municipalities with similar access to adequate services; this includes Western Cape, Gauteng and
Free State. For the other provinces, great inequalities were found between municipalities. Some
municipalities showed a decline in access to improved services; this is despite provincial access to
improved services increasing for all provinces. Cases emerged where local municipalities in the same
district municipality did not show similarly changes in access to improved services.
The progress between water supply and sanitation provision was dissimilar, with growth occurring in
different timeframes. A large number of municipalities showed negative progress for sanitation for
2007-2011 despite the fact that the Bucket Eradication Programme – aimed at diminishing the
number of bucket facilities in the country - was established in 2005.
The lag in sanitation progress between 2007 and 2011 could be attributed to the fact that sanitation
provision from 2007 was focussed in rural areas, which are demonstrably difficult to deliver services
to; that poorly built toilets needed restoration, diverting funds from providing new facilities; and
that transferring responsibility of sanitation provision from DWA to DHS in 2009 led to non-efficient
functioning of the National Sanitation Programme.
More provinces showed a correlation between progress made between 2001 and 2011, and prior
access to adequate services for water supply than sanitation. This coupled with the fact that rural
municipalities had a greater capital expenditure than other local municipalities for water supply and
not for sanitation, indicates that the pro-poor initiatives have been more successful in water supply
than in sanitation. This highlights that sanitation provision has been challenging and slow.
I know the meaning of plagiarism and declare that all the work in the document, save for that which is properly
acknowledged, is my own

Univers
ity of
Cap
e Tow
n
August 2013 ii
Major limitations of the study exist due progress being calculated as a percentage, and assuming
that the facilities access are operational. Calculating progress as a percentage is effected by growth
in the number of households in the municipality. The water services infrastructure in South Africa
was found to be of an unsatisfactory standard. Re-examination of access to water services taking
into account the condition of the services would yield markedly different results.
Looking forward, it would be worthwhile combining other data related to water supply and
sanitation in the cluster analysis, such as Blue& Green Drop scores, MIG expenditure and operation
and maintenance data. Future research could also analyse absolute backlog instead of percentage
backlog. Blue and Green Drop reports have also only been done since 2009. Operation and
maintenance, and state of infrastructure data are not widely available at municipal level.
Univers
ity of
Cap
e Tow
n
August 2013 iii
Acknowledgements There are many people who have helped me through my Masters. Without them (and their genuine
smiles and “How’s it going”), I would not have made it to the other side.
First and most importantly, I would like to express my deepest and sincere thanks to my supervisor:
Prof. Rivett for taking me on as a postgrad student and consistently supporting me throughout my
Masters. She pushed me when I got lazy and encouraged me when I struggled. Our discussions
(about thesis, studying, the hazards of the working world, and life in general) have been invaluable
to me. She has been the greatest supervisor.
Next I would like to thank iCOMMS for funding my postgrad studies. The iCOMMS team: Bianca,
Michael, Patrick, Gordon and Mandisi have been tremendously supportive and constantly giving
advice and feedback. They sat through my incoherent presentations and tried to make sense of my
work – a task that many would have failed. Alayne has always given me words of encouragement
and a much needed smile whenever I happen to stroll into her office – looking for a means of
procrastinating.
Lastly, I would like to thank my fellow postgrad students: Tsitsi (my printing partner), Sophia,
Mpafane (who constantly hounded me to give him a chapter so that he could give me feedback),
Samuel Kwame Norvixoxo (the office Tai Chi instructor), Jules (my sometimes French tutor), Julie,
Nasiphi and Taaipopi for always offering to help in any way or form. They could always sense when I
needed to just step away from my PC and go for walk outside.

Univers
ity of
Cap
e Tow
n
August 2013 iv
List of Abbreviations cidb – Construction Industry Development Board
COGTA – Department of Cooperative Governance and Traditional Affairs
CSIR – Council for Scientific and Industrial Research
DHS – Department of Human Settlements
DM – District Municipality
DWA – Department of Water Affairs
DWF – Department of Water Affairs and Forestry
EA – Enumeration Area
HSRC – Human Sciences Research Council
JMP – Joint Monitoring Programme
LM – Local Municipality
LOS – Level of service
MAUP - Modifiable Areal Unit Problem
MDG – Millennium Development Goals
MIP - Municipal Infrastructure Program
PICC - Presidential Infrastructure Coordinating Commission
RDP – Reconstruction and Development Programme
SAICE – The South African Institution of Civil Engineering
SAIRR – South African Institute of Race Relations
SIP – Strategic Integrated Projects
Stats SA – Statistics South Africa
UNICEF – United Nations Children’s Fund
VIP Latrine – Ventilated Pit Latrine
VRC – Variance Ratio Criterion
WHO – World Health Organization
WSA – Water Service Authority
WSP – Water Service Provider
Univers
ity of
Cap
e Tow
n
August 2013 v
Table of Contents Executive Summary i
Acknowledgements iii
List of Abbreviations iv
Table of Contents v
Introduction 1
Background to water and sanitation services in South Africa 1
Significance of the Water Supply and Sanitation Problem 1
Hypothesis 3
Aims and Objectives 3
Scope and Limitations 3
Statement of Assumptions 3
Literature Review 4
Global interest in water and sanitation 4
Understanding the water supply and sanitation disparities in South Africa 5
Government reform 6
Governance in the water sector 8
Right to safe drinking water and sanitation services in South Africa 10
Programmes, policies and funding 12
Current issues impeding water supply and sanitation provision 14
Method of Research 18
Selecting a data source 18
Census and Community Survey 18
Identification of survey variables 20
Cluster Analysis 21
Clustering Procedure 21
Determining the number of clusters using hierarchical analysis 21
K-means analysis 23
Pearson product moment correlation test 23
Findings and Analysis 24
Descriptive Statistics 24
Cluster Analysis: Water Supply 26
K-Means Clustering 26
Cluster Analysis: Sanitation 35

Univers
ity of
Cap
e Tow
n
August 2013 vi
K-Means Clustering 35
Combined Cluster Description 44
Progress Findings and Analysis 57
Correlation 62
Discussion 72
Progress 74
Correlation 76
Funding 76
Lag in sanitation 77
Strengths and Limitations of the study 78
Strengths - Cluster Analysis 78
Percentage versus absolute backlog 79
Data 81
Municipal level analysis 82
Future research 83
Intended users 83
Conclusions 84
References 86
Appendices 91
Appendix 1 – Changes in Census and Community Survey data 91
Appendix 2 – Critical Values Table for small sample sizes 92
Appendix 3 – 2001 Water Supply k-means cluster membership 93
Appendix 4 – 2007 Water Supply k-means cluster membership 96
Appendix 5 – 2011 Water Supply k-means cluster membership 100
Appendix 6 – 2001 Sanitation k-means cluster membership 105
Appendix 7 – 2007 Sanitation k-means cluster membership 108
Appendix 8 – 2011 Sanitation k-means cluster membership 112
Univers
ity of
Cap
e Tow
n
August 2013 vii
List of Tables Table 1: Classification of municipalities 8
Table 2: Roles and responsibilities of various institutions for water supply and sanitation services 9
Table 3: Water Supply and Sanitation groups 20
Table 4: Final cluster centres for 2001 Water Supply (in percentages) 27
Table 5: Provincial distribution of clusters for 2001 28
Table 6: Final Cluster centres for 2007 Water Supply (in percentages) 29
Table 7: Provincial distribution of clusters for 2007 31
Table 8: Final Cluster centres for 2011 Water Supply (in percentages) 32
Table 9: Provincial distribution of clusters for 2011 34
Table 10: Final cluster centres for Census 2001 Sanitation (in percentages) 36
Table 11: Provincial distribution of clusters for 2001 37
Table 12: Final Cluster centres for 2007 Sanitation (in percentages) 38
Table 13: Provincial distribution of clusters for 2007 40
Table 14: Final Cluster centres for 2011 Sanitation 41
Table 15: Provincial distribution of clusters for 2011 42
Table 13: Illustrating progress in the municipalities in the various provinces (in percentages) 71
Table 17: Municipal movement of OR Tambo and Alfred Nzo municipalities 72
Table 18: Municipal movement of Uthungulu and Lejweleputswa municipalities 74
Table 19: Municipal movement of Umkhanyakude municipalities 75
Table 20: Water supply budgeted expenditure 2006-2013 (National Treasury, 2012: 132) 76
Table 21: Sanitation budgeted expenditure 2006-2013 (National Treasury, 2012: 135) 77
Table 22: Variance Ratio Criterion for water supply 2001 93
Table 23: Cluster membership for water supply 2001 94
Table 24: Variance Ratio Criterion for water supply 2007 96
Table 25: Cluster membership for water supply 2007 97
Table 26: Variance Ratio Criterion for water supply 2011 100
Table 27: Cluster membership for water supply 2011 101
Table 28: Variance Ratio Criterion for sanitation 2001 105
Table 29: Cluster membership for sanitation 2001 106
Table 30: Variance Ratio Criterion for sanitation 2007 108
Table 31: Cluster membership for sanitation 2007 109
Table 32: Variance Ratio Criterion for 2011 Sanitation 112
Table 33: Cluster membership for sanitation 2011 113
Univers
ity of
Cap
e Tow
n
August 2013 viii
Table of Figures Figure 1: Map of bantustans and provinces during Apartheid 6
Figure 2: Map of current provincial boundaries 6
Figure 3: Current government structure 7
Figure 4: Local Government categorisation 7
Figure 5: Water Service Authorities Map (DWA, 2013: 18) 10
Figure 6: Map of Municipal Vulnerability from self-assessment (DWA, 2013: 36) 15
Figure 7: Water Scheme functionality issues (DWA, 2013: 49) 16
Figure 8: National water supply descriptive statistics 24
Figure 9: National sanitation descriptive statistics 25
Figure 10: Illustrating changes in cluster centres for water supply clusters 44
Figure 11: Water supply cluster analysis maps for 2001, 2007 and 2011 48
Figure 12: Illustrating changes in cluster centres for sanitation clusters 50
Figure 13: Sanitation cluster analysis maps for 2001, 2007 and 2011 54
Figure 14: Cluster results of Water Supply progress for 2001-2007, 2007-2011 and 2001-2011 57
Figure 15: Cluster results of Sanitation progress for 2001-2007, 2007-2011 and 2001-2011 58
Figure 16: Water supply progress maps from cluster analysis: 2001-2007, 2007-2011 & 2001-2011 59
Figure 17: Sanitation progress maps from cluster analysis: 2001-2007, 2007-2011 & 2001-2011 60
Figure 18: Water supply national progress 63
Figure 19: Sanitation national progress 64
Figure 20: Scatterplot and Pearson correlation results of previously favourable provinces for Water
Supply 65
Figure 21: Scatterplot and Pearson correlation results of previously backlogged provinces for Water
Supply 66
Figure 22: Scatterplot and Pearson correlation results of previously greatly backlogged provinces for
Water Supply 66
Figure 23: Scatterplot and Pearson correlation results of previously favourable provinces for
Sanitation 68
Figure 24: Scatterplot and Pearson correlation results of previously backlogged provinces for
Sanitation 69
Figure 25: Scatterplot and Pearson correlation results of previously greatly backlogged provinces for
Sanitation 69
Figure 26: Population growth between 2001 and 2011 80
Figure 27: Expected population migration (source PICC, 2012: 11) 81
Figure 28: Illustrating Scree Plot for water supply 2001 93
Figure 29: Illustrating Scree Plot for water supply 2007 96
Figure 30: Illustrating Scree Plot for water supply 2011 100
Figure 31: Illustrating Scree Plot for sanitation 2001 105
Figure 32: Illustrating Scree Plot for sanitation 2007 108
Figure 33: Illustrating Scree Plot for 2011 Sanitation 112

Univers
ity of
Cap
e Tow
n
August 2013 1
Introduction
Background to water and sanitation services in South Africa
After coming into power in 1994, the newly elected democratic government inherited overwhelming
municipal service backlogs that were found largely in rural, black, poor regions in South Africa
(Manase et al., 2009). “Service delivery for the urban and rural poor was non-existent or desultory”
(Levin, 2007: 2). The Department of Public Works, (1997) cited in Bond (1999), reported that “only
27% of African households have running tap water inside their residences, only 34% have access to
flush toilets” (Bond, 1999: 44). Of the 15 million people without access to safe water supply in 1994,
12 million were located in rural areas (Lane, 2004: 10). Furthermore, “21 million people did not have
adequate sanitation” (Torres, 2000: 157). The condition, according to the 1996 Census conducted by
Statistics South Africa (StatsSA), was such that “one in three households rely on a pit latrine, while
less than one in twenty use a bucket” (Torres, 2000: 165).
The service delivery challenge faced by the new government, according to Hemson, (1994) cited in
Smith (2009), was “to reduce the apartheid backlog whilst concurrently raising the level of service
delivered” (Smith, 2009: 20). The newly elected South African government, in 1994, undertook
various measures to rectify these backlogs by ensuring “a more equitable distribution of public
services” (Smith, 2004: 382). Water supply and sanitation were top priorities, with importance
placed on quickly and efficiently providing services to the previously deprived, poor households
(Nnadozie, 2011).
Rectifying measures included incorporating the right to adequate and sustainable water supply and
sanitation services in Section 27 (1b) Bill of Rights in the Constitution of the Republic of SA 1996 (No.
108 of 1996); producing various Acts, White Papers and policies focused on water supply and
sanitation services; and implementing programs aimed at reducing the water supply and sanitation
backlog. The White Paper on Water Supply and Sanitation (1994) further stipulates that performance
monitoring is required to “ensure that standards are maintained” and “that adequate basic service
service coverage is achieved and maintained” (DWAF, 1994: 27).
Water sector governing structures were transformed to consolidate regulation of the sector, where
previously, the homeland governments and local municipalities were each solely responsible for
water supply and sanitation services. After 1994, Department of Water Affairs and Forestry (DWAF)
was tasked with regulating the water sector (DWAF, 2004).
Notable progress has been achieved. The percentage of households without access to piped water
declined from 16% in 2001 to 9% in 2011 and the percentage of households without access to toilets
(including bucket latrine) declined from 18% in 2001 to 7% in 2011 (StatsSA, 2012).
Significance of the Water Supply and Sanitation Problem
The importance of ensuring delivery of acceptable water supply and sanitation systems has long
been investigated. The obvious impact is on the reduction of largely preventable water-related
diseases, such as diarrhoea. Globally, diarrhoeal disease is the fifth leading cause of death in the
world between 2000 and 2011 (WHO, 2013a). The effect of diarrhoeal disease on children is more

Univers
ity of
Cap
e Tow
n
August 2013 2
severe; diarrhoeal disease is the second leading cause of death in children under the age of five
(WHO, 2013b). In South Africa specifically, the mortality rate (65-70 per 1000 births) in children
under the age of 5 is largely due to diarrhoeal disease, which is prevalent in informal settlements
and rural areas (DWA, 2013).
Additional benefits of adequate water supply and sanitation include alleviating conditions associated
with poverty (WEDC, 2003, as cited in Manase et al., 2009, and Heleba, 2009), generating economic
benefits (Lane, 2004), being cost-beneficial (Hutton & Haller, 2004) and, in the case of improved
sanitation, providing greater dignity (Lane, 2004).
It is important to note that while access to both water supply and sanitation services were included
as a human right in the South African Constitution (Act 108 of 1996), progress in sanitation services
has markedly lagged behind water supply; a reality seen in other developing countries. Additionally,
“spending on sanitation was also only about one-tenth of what was spent on water delivery” (Khosa,
2000: 52). Lane (2004) argues that “this was partly because the communities themselves had always
strongly prioritized water supply and partly because there was not a good system for promoting
sanitation at the community level” (Lane, 2004: 12).
Initial backlogs were uneven, in that the backlogs were “more severe in the poorer black rural areas
than they were in the mainly white and more affluent urban areas” (DWAF, 2004: 4). These
previously deprived areas are further disadvantaged by the fact that building social services is more
complex and costly and thus slower than simply maintaining it (Torres, 2000: 17). Given that “the
poor are unevenly distributed by province” (Torres, 2000: 10), and rural areas are notably
impoverished, delivery of these services would expectantly be disparate. As such, there was a
notable pro-poor focus for government services (Nnadozie, 2011).
The Reconstruction and Development Programme (RDP) emphasized the delivery of basic services
(DWAF, 2004). Since 1994, basic water supply and sanitation facilities have been delivered to 21.1
million and 17.3 million people respectively (DWA, 2013: 67). Currently, 1.3 million households (6%)
lack access to piped water supply facilities, while 4.5 million households (31%) lack access to basic
sanitation facilities (DWA, 2013). Furthermore, rural municipalities were found to have the highest
number of municipal services backlogs (National Treasury, 2012). The backlogs indicate the on-going
disparity in access to services.
While the backlog in the urban poor settlements is largely attributed to population growth from
“increased migration and sharp growth of informal settlements” (WSP, 2007: 58), it should be noted
that determining the cause of backlog is not simple. The increase in backlog could be due to an
increase in households or a decline in service (Nnadozie, 2011).
With 71 protests in 2012 being attributed to dissatisfaction in the water sector (DWA, 2013),
ensuring progress in service delivery is fundamental to socio-economic stability in South Africa.
Access to water supply and sanitation services are consistently being assessed in order evaluate
progress. Focussing on disparate progress of the service delivery can shed light on areas that may be
consistently experiencing slow progress and therefore need to be prioritised.

Univers
ity of
Cap
e Tow
n
August 2013 3
Hypothesis The impoverished, rural local municipalities that possessed the worst access statistics after 1994
should have had more progress than the affluent municipalities that initially presented with
favourable access statistics.
Aims and Objectives
- Analyse access statistics at municipal level with maps illustrating the statistics spatially.
- Perform correlation analysis to assess whether or not there is a relationship between access
to adequate services in 2001 and progress from 2001-2011.
Scope and Limitations
- Population Censuses prior to 1994 did not accurately represent all population groups in South
Africa; access data after 1994 was used.
- Municipal demarcations were altered repeatedly over the past 18 years. The municipal statistics
had to be with the same geographic demarcations.
- Access to services was measured at local municipal level.
Statement of Assumptions
- Progress in water supply and sanitation services were measured as the change in percentage
of households that have access to adequate water supply and sanitation services.
- It is assumed that the water and sanitation systems were operational.
- The statistics were presented at 2011 municipal demarcation in order to assure
comparability.

Univers
ity of
Cap
e Tow
n
August 2013 4
Literature Review
Global interest in water and sanitation
Inadequate water supply and sanitation service delivery is a concern in many countries, with over
780 million people without access to safe drinking water and 2.5 billion people without access to
adequate sanitation (UNICEF & WHO, 2012). The reality of inadequate services unduly falls on the
impoverished in developing countries, specifically in rural Africa where the worst access statistics are
found (Hope, 2006: 168). Women and children are also understood to bear the burden of
inadequate water supply and sanitation (Lane, 2004: 3; Tissington, 2011: 68 and Torres, 2000: 157).
Negative effects include limiting the potential for reducing poverty, thus stifling human development
and economic growth (Deininger & Mpuga, 2005: 171; Esfahani, 2005: 498 and Torres, 2000: 7).
Given that inadequate service delivery limits the potential for growth, the benefits for improving the
services are numerous. Geographical, economic and ecological benefits are predicted (Bond, 1999:
52). The most notable benefit is in public health and related cost savings (Lane, 2004: 2). Public
health benefits, arguably, should be the leading influence on policy-making, given the overwhelming
burden that comes from the occurrence of water related diseases (Bond, 1999: 52).
It is crucial to note that sanitation, in conjunction with safe potable water, assists in minimising the
burden of water related diseases. “Water provision, without adequate wastewater disposal
provision such as that provided by waterborne sanitation, may be a health hazard in itself” (Bond,
1999: 54). Additionally, water supply and sanitation provision are integrally linked in that “for
households living with waterborne toilets, access to sanitation requires a continuous supply of water
for flushing. Without access to sufficient water that is affordable, households can have extremely
compromised access to sanitation” (Tissington, 2011: 68).
The impact of water related diseases on developing countries is substantial. Globally, diarrhoeal
disease is the fifth leading cause of death in the world between 2000 and 2011 (WHO, 2013a). The
effect of diarrhoeal disease on children is more severe; diarrhoeal disease is the second leading
cause of death in children under the age of five (WHO, 2013b). In South Africa specifically, the
mortality rate (65-70 per 1000 births) in children under the age of 5 is largely due to diarrhoeal
disease, which is prevalent in informal settlements and rural areas (DWA, 2013).
“The urgent need for basic water and sanitation services for the poor assumes even greater
significance when the linked with other aspects of poverty such as poor education. Water and
sanitation related sicknesses put severe burdens on health service.” (DHS, 2012: 13)
Due to the importance of water supply and sanitation improvement, the UN Millennium
Development Goals (MDGs) established in 2000, aimed at mitigating factors linked to poverty and
mortality in developing countries. This included Target 7C that stipulates having to “halve, by 2015,
the proportion of the population without sustainable access to safe drinking water and basic
sanitation” (Heleba, 2009: 12). Furthermore, access to safe water has been recognised as a human
right in various declarations and conventions. The UN Committee on Economic, Cultural and Social
Rights, for example, states that “the human right to water entitles everyone to sufficient, affordable,
physically accessible, safe and acceptable water for personal and domestic uses” (Lane, 2004: 5).
Univers
ity of
Cap
e Tow
n
August 2013 5
Minimum service provision standards have been set to ensure a universal standard. Regarding water
supply, “WHO and UNICEF have set the minimum of 20 litres of safe drinking water per person per
day, and water source must be located within a reasonable distance from the household” (Heleba,
2009: 11).
The 2012 WHO/UNICEF Joint Monitoring Programme (JMP) for water supply and sanitation report
found that, between 1990 and 2010, over 2 billion people received access to adequate water supply
facilities and 1.8 billion people received access to adequate sanitation facilities (UNICEF & WHO,
2012). The drinking water target was met in 2010, while the sanitation target will not be met
(UNICEF & WHO, 2012). Urban-rural disparities still exist and not all countries are on track to meet
the targets; a large number of these countries are in Sub-Saharan Africa (UNICEF & WHO, 2012).
The on-going disparity highlights that presenting overall statistics alone can obscure the inequalities
that exist locally. “The overall statistics masked extreme contrast between different sectors of
society. In most of the white-ruled local areas, standards were equal to those in industrial countries.
In black rural areas there were often no services at all; in black urban areas service was mixed”
(Lane, 2004: 6).
Understanding the water supply and sanitation disparities in South Africa
The consequence of Apartheid on the current problems experienced in South Africa is undisputed
and widely evident. The Apartheid policies were aimed at creating a disparate country. There was
inadequate provision of municipal services to severely under-resourced and overloaded municipal
structures in rural, impoverished communities. This “presented the ANC with what might arguably
be the greatest transformative challenge ever faced by a democratic government” (Heller, 2001:
143). The disparate access to services was stark. In October 1996, 18% of households in Northern
Province had taps inside the dwelling, compared with 76% in Western Cape. And 29% of households
in Eastern Cape do not have any toilet facilities, compared with 3% in Gauteng (StatsSA, 1996).
The service backlogs are still largely found in rural areas and within urban poor settlements, as
illustrated in the following:
“Despite improvements in government services to the poor, there are concerns. Data released by
Statistics South Africa in 2007 indicated that it has proven difficult to reach many of the poorest
municipal districts as well as informal settlements and farm workers. As a result, poor households
continue to lag in access to government services.” (Heleba, 2009: 25)
Progress has been challenging, particularly with sanitation.
“It is extremely difficult to incrementally upgrade infrastructure, particularly sanitation systems,
from pit latrines to waterborne sewage, resulting in permanently segregated low-income ghettoes
(from which households that raise their real earnings to above R800 per month will have to emigrate
in order to gain access to improved infrastructure and services).” (Bond, 1999: 45)
DWA (2012c) estimates that the sanitation backlog is now at 1.4 million households (11%) (DWA,
2012c). There have, however, been many challenges and setbacks with the implemented projects
and programs.

Univers
ity of
Cap
e Tow
n
August 2013 6
Government reform
During the Apartheid years, homeland governments and local municipalities were each solely
responsible of water supply and sanitation services. Black local authorities were unable to cope with
increasing service demands and were thwarted by mismanagement and corruption (Watson, 1994
cited in Smith, 2004: 382). White local authorities, in contrast, had access to sound services and a
smaller population to provide for (Turok, 2000: 4 cited in Smith, 2004: 382).
In order to achieve the service delivery goals proposed by the new government, the entire municipal
and provincial governments had to be restructured. South Africa was “restructured from 4 provinces
and 10 ‘independent’ and ‘self-governing’ Bantustans to 9 provinces” (DWAF, 2004: 4). The former
homelands, locations with severe backlog in 1994, were largely located in in North West, Limpopo,
KwaZulu Natal and Eastern Cape (Figure 1). This indicates a spatial characteristic to the backlog.
Figure 1: Map of bantustans and provinces during Apartheid
1
Figure 2: Map of current provincial boundaries
2
Municipal boundaries were redefined and the number of municipalities were reduced from 843 to
284 (Khosa, 2000: 40). The new boundaries were organised so that local government could be
transformed, thereby “bridging the gap between the rich and the poor, and between rural and urban
areas, in relation to access to basic services such as water, sanitation, electricity and other
infrastructure” (Khosa, 2000: 41).
1 Source: The Directorate Public State Land Support, 2013. Available at:
http://en.wikipedia.org/wiki/File:Bantustans_in_South_Africa.svg, Accessed: 20 August 2013 2 Source: Yes Media, 2012. Available at: http://www.localgovernment.co.za/, Accessed 20 August 2013

Univers
ity of
Cap
e Tow
n
August 2013 7
Elhiraika (2007) states the various roles established for the three spheres of government (Figure 3).
National Government: functions include “protection services, higher education, national roads, public works,
water affairs, foreign and home affairs and policy functions”
9 Provincial Governments: responsibilities include “school education, health, social welfare, housing and
provincial roads”
Local Government: “functions consist mainly of user fee-based services such as electricity, water and sanitation
besides provision of other public goods like municipal and household infrastructure, streetlights and garbage
collection” (Elhiraika, 2007: 9)
Figure 3: Current government structure
The municipalities were tasked to, according to the Constitutional Assembly, (1996) cited in Bond
(1999),
“give priority to the basic needs of the community, and to promote the social and economic
development of the community, and to participate in national and provincial development
programmes (Constitutional Assembly, 1996, Section 153) …The goal, as spelled out in the Bill of
Rights (Constitutional Assembly, 1996, Ch. 2), is to progressively ensure that citizens can exercise
their rights of access to water, health care, a clean environment, housing and, more generally,
dignity” (Bond, 1999: 44).
According to BESG (2008), the local government is appropriate for providing certain services given
that, “local government is the closest sphere of government to the people, and is therefore assumed
to be the tier that can most readily identify, prioritise, and implement programmes and projects to
address development needs” (BESG, 2008: 1).
Local Government is structured into 3 categories.
8 Metropolitan Municipalities (Category A) 44 District Municipalities (Category C)
Metros represent multiple cities and dense,
large, urbanised areas
Figure 4: Local Government categorisation
Category B and C municipalities are further categorised as follows (Municipal Demarcation Board,
2012):
226 Local Municipalities (Category B)

Univers
ity of
Cap
e Tow
n
August 2013 8
Table 1: Classification of municipalities
Category Characteristics
Secondary cities (B1) Local municipalities (LMs) with the largest budgets
Large towns (B2) Local municipalities with large urban core
Small towns (B3) Local municipalities with small towns and rural areas. Substantial proportion of the population is located in towns. Commercial farms characterise the rural areas.
Mostly rural (B4) Local municipalities that are largely rural – typically located in former homelands – with at most one or two small towns.
Districts (C1) District municipalities (DMs) that are not water service providers
Districts (C2) District municipalities that are water service providers
B3 and B3 municipalities are rural municipalities; the population demographics below show that a
substantial portion of the population lives in rural areas.
The population in 2011 was estimated at 51.77 million people, of which, “18.12 million people (or
35% of the population) live in small rural villages and scattered settlements” (DWA, 2013: 16)
Rural areas were defined in the Rural Development Framework (1997) as having the following two
features:
“sparsely populated areas in which people farm or depend on natural resources, including
villages and small towns that are dispersed through these areas
areas that include large settlements in the former homelands, which depend on migratory
labour and remittances as well as government social grants for their survival, and typically
have traditional land tenure systems” (National Treasury, 2012: 192).
Geographically, rural municipalities are concentrated in KwaZulu-Natal, Eastern Cape, Northern Cape
and Limpopo. The metros such as eThekwini and Tshwane encompass rural areas (National Treasury,
2012: 192).
Furthermore, “[t]here are significant differences in settlement types between B3 and B4
municipalities. Statistics South Africa reported in Census 2001 that 52 per cent of households in B3
municipalities live in small urban settlements, 29 per cent on farms and 10 per cent in settlements
located on tribal land. In B4 municipalities, 83 per cent of households live in tribal settlements, while
only 7 per cent live on farms and in small towns respectively” (National Treasury, 2012: 192).
Governance in the water sector
Water sector governing structures were transformed to consolidate regulation of the sector.
Previously, the homeland governments and local municipalities were each solely responsible of
water supply and sanitation services (DWAF, 2004).
The roles and responsibilities of the water sector were divided up between different organizations,
at various spheres of government. The following table sets out roles and responsibilities for water
supply and sanitation sectors (DWA, 2013).
Univers
ity of
Cap
e Tow
n
August 2013 9
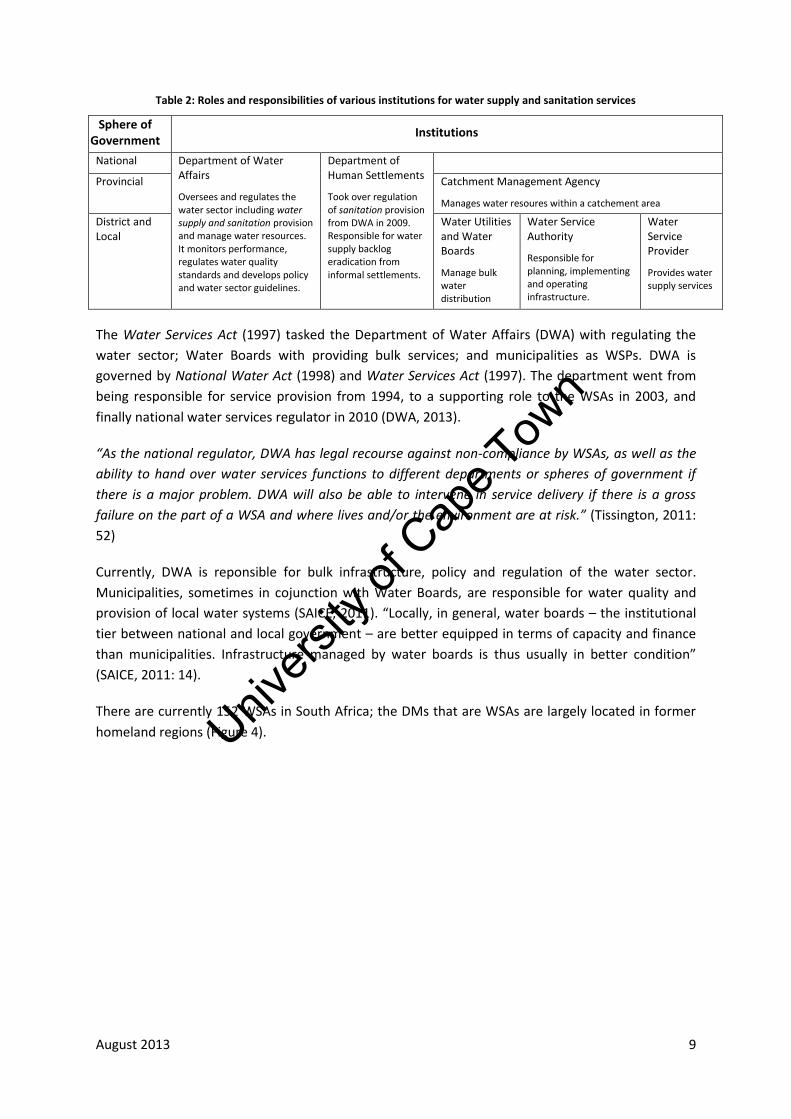
Table 2: Roles and responsibilities of various institutions for water supply and sanitation services
Sphere of Government
Institutions
National Department of Water Affairs
Oversees and regulates the water sector including water supply and sanitation provision and manage water resources. It monitors performance, regulates water quality standards and develops policy and water sector guidelines.
Department of Human Settlements
Took over regulation of sanitation provision from DWA in 2009. Responsible for water supply backlog eradication from informal settlements.
Provincial Catchment Management Agency
Manages water resoures within a catchement area
District and Local
Water Utilities and Water Boards
Manage bulk water distribution
Water Service Authority
Responsible for planning, implementing and operating infrastructure.
Water Service Provider
Provides water supply services
The Water Services Act (1997) tasked the Department of Water Affairs (DWA) with regulating the
water sector; Water Boards with providing bulk services; and municipalities as WSPs. DWA is
governed by National Water Act (1998) and Water Services Act (1997). The department went from
being responsible for service provision from 1994, to a supporting role to the WSAs in 2003, and
finally national water services regulator in 2010 (DWA, 2013).
“As the national regulator, DWA has legal recourse against non-compliance by WSAs, as well as the
ability to hand over water services functions to different departments or spheres of government if
there is a major problem. DWA will also be able to intervene in service delivery if there is a gross
failure on the part of a WSA and where lives and/or the environment are at risk.” (Tissington, 2011:
52)
Currently, DWA is reponsible for bulk infrastructure, policy and regulation of the water sector.
Municipalities, sometimes in cojunction with Water Boards, are responsible for water quality and
provision of local water systems (SAICE, 2011). “Locally, in general, water boards – the institutional
tier between national and local government – are better equipped in terms of capacity and finance
than municipalities. Infrastructure managed by water boards is thus usually in better condition”
(SAICE, 2011: 14).
There are currently 152 WSAs in South Africa; the DMs that are WSAs are largely located in former
homeland regions (Figure 4).

Univers
ity of
Cap
e Tow
n
August 2013 10
Figure 5: Water Service Authorities Map (DWA, 2013: 18)
Under the Water Services Act (No. 108 of 1997), the Water Affairs Minister and the relevant
province is responsible for monitoring the performance of the water services institutions. The
Minister then has to provide a national information system on water services to water services
institutions, consumers and the public (DWAF, 2005: 37).
Other institutions, such as South African Institute of Race Relations (SAIRR) and Human Sciences
Research Council (HSRC), report on access to water and sanitation facilities. There are, however, no
standards for collecting and verifying data, and reporting statistics. The absence of common
measures can be problematic. “The problem has already manifested itself on a number of occasions,
resulting in members of the public, government and politicians questioning the accuracy and
consistency of government reporting with regard to service delivery statistics” (COGTA, 2009a: 10).
While sanitation provision is lagging behind water supply provision, Lane (2004) argues that the
cholera outbreak in 2000 brought to light the slow progress made in sanitation provision (Lane,
2004: 12). There is still an “absence of regulation around sanitation at all levels of government”
(Tissington, 2011). Sanitation provision is further complicated by the fact that sanitation functions
has moved from the Department of Water Affairs (DWA) – previously DWAF - to the Department of
Human Settlements (DHS) in 2009 resulting in “institutional confusion over roles and
responsibilities” (Tissington, 2011: 69).
“According to the DHS the transfer process took over 10 months to complete and: delays in the
movement posed serious challenges to the functioning of National Sanitation Programme as neither
the Department of Water Affairs nor Department of Human Settlements was willing to accept
responsibility for the National Sanitation Programme during the preparatory stage of the move.”
(Tissington, 2011: 61)
Right to safe drinking water and sanitation services in South Africa
The laws and policies advocated by the Apartheid government had to be restructured to better
depict the democratic and non-racial disposition of the new government. The policies related to
Univers
ity of
Cap
e Tow
n
August 2013 11
public service aimed to redress the racial inequities by tackling complex issues associated with
service delivery (Schwella, 2001: 372).
Government legislation which pertain to water and sanitation provision include, but is not limited to,
the following
- The Bill of Rights in the Constitution (1996) includes the right to access to safe water
(Constitution of the Republic of SA 1996, Act 108 of 1996, Article 27(1b)). While the
Constitution does not explicitly state the right to safe sanitation, it is implied through the
presence of rights to human dignity, Section 10, and a safe environment, Section 24 (Tissington,
2011: 68).
- Water Services Act (1997) and Water Services Amendment Act (2004), stipulates the basic
sanitation standards, section 1(ii), and the basic water supply standards, section 1(iii) (Water
Services Act, 108 of 1997). Additionally, responsibility for water services provision lies with local
governments (WSP, 2007: 38).
- National Sanitation Policy (1996)
- White Paper on National Water Policy (1997)
- Municipal Systems Act (2000) which “set out the local government obligations to provide basic
municipal services, with a particular focus the basic needs of the community and the promotion
of social and economic development of the community” (Tissington, 2011: 68). Local
government was stipulated as Water Service Authorities (WSAs) which oversee water services
provision. The WSAs can outsource the service delivery to other capable entities, which then
become the Water Services Providers (WSPs) (WSP, 2007: 38).
- The White Paper on Water and Sanitation (1994) was one of the first policy documents on the
water and sanitation sector that highlighted the importance of rapid water and sanitation
provision (DWAF, 2004: 5). The White Paper on Water and Sanitation (1994) was revised in
2000 in response to sanitation lagging behind water supply (Tissington, 2011: 69).
- South Africa’s Strategic Framework for Water Services (2003) stipulates goals for water and
sanitation provision, including “universal provision of access to a functioning basic water supply
facility by 2008 and universal access to a functioning, basic sanitation facility by 2010” (WSP,
2007: 38).
The Strategic Framework for Water Services (2003) also provides definitions for basic water supply
and basic sanitation.
- Basic water supply “means the provision of a basic water supply facility, the sustainable
operation of the facility (available for at least 350 days per year and not interrupted for more
than 48 consecutive hours per incident) and the communication of good water-use, hygiene
and related practices. (A basic water supply facility is defined as the infrastructure necessary
to provide 25 litres of potable water per person per day within 200 metres of a household
and with a minimum flow of 10 litres per minute.)”

Univers
ity of
Cap
e Tow
n
August 2013 12
- Basic sanitation “means the provision of a basic sanitation facility which is easily accessible
to a household, the sustainable operation of the facility, including the safe removal of human
waste and wastewater from the premises where this is appropriate and necessary, and the
communication of good sanitation, hygiene and related practices. (A basic sanitation facility
is defined as the infrastructure necessary to provide a sanitation service which is safe,
reliable, private, protected from weather, ventilated, keeps smells to the minimum, is easy to
keep clean, minimises the risk of the spread of disease carrying flies and pests, and enables
safe and appropriate treatment and /or removal of human water and wastewater in an
environmentally sound manner.)” (DWAF 2005: 29)
Furthermore, WSAs were instructed to provide Water Services Development Plans (WSDPs) which
includes the current status quo and service delivery targets (DWAF 2005: 34).
Programmes, policies and funding
The Reconstruction and Development Programme (RDP), a socio-economic policy framework,
stipulates the social development policy, aimed at amending the social and economic challenges in
the country by extending basic services (van Niekerk, 1998: 1). Essentially, the main objective is to
“eradicate the legacy of apartheid” (Torres, 2000: 7). The key emphasis of the RDP, with respect to
water supply and sanitation, is ensuring that basic services are accessible universally in South Africa
(Nnadozie, 2011).
The Municipal Infrastructure Program (MIP), created in line with the targets of RDP, aimed to:
“rehabilitate, upgrade and provide new municipal infrastructure to meet the basic needs of
communities as efficiently and effectively as possible. A further objective was to enhance the
developmental capability of municipalities and promote their financial viability and democratisation.
Job creation and the transfer of skills were seen as a secondary benefit” (Torres, 2000: 157).
Funding is a crucial aspect of service delivery; if a service is not adequately budgeted for,
government cannot provide the service (Torres, 2000: 21). Water and sanitation provision is solely
funded by national government, a practice which is typical of middle-income countries and not
developing ones (Lane, 2004: 17). Water and sanitation received the greatest proportion of the MIP
funding, given the importance of water services at national government level (Torres, 2000: 158).
“All local government infrastructure grant funding is now consolidated into the ’Municipal
Infrastructure Grant’ which is aimed at assisting the poor to gain access to infrastructure. MIG funds
can only be used for infrastructure for basic levels of service.” (DWAF, 2005)
The budget presented by government has obviously shifted since the Apartheid years, with the focus
being on providing to the previously marginalised. The budget essentially “redistributes income from
richer to poorer households” given that “the top quintile pays for lion’s share of income tax and
because social spending as a proportion of income is higher for the poor than the rich” (Nattrass &
Seekings 2001: 477). This redistribution of social spending is crucial given that increased public
expenditure does not necessarily equate to “progressive distribution” (Nattrass & Seekings 2001:
477).
Social services accounted for almost 47% of total consolidated national and provincial expenditure in
the 1997-1998 budget (May 1998: 4). Furthermore, social services spending increased faster than
Univers
ity of
Cap
e Tow
n
August 2013 13
other budget items (Torres, 2000: 14). The expenditure has varying effects within the municipalities
depending on the initial level of service, given that building facilities cost more than maintaining
them (Torres, 2000: 27).
The Free Basic Services Policy, adopted in 2001, sought to provide free basic municipal services to all
South Africans, with the priority being the poor (Smith, 2009: 23). The policy was understood to
assist in poverty alleviation and improve hygiene conditions in indigent communities (Smith, 2009:
23). According to Mjoli et al., (2009) cited in Tissington (2011), FBSan has not been implemented in
many municipalities because “there is no common approach to the interpretation of free basic
sanitation service policy by different municipalities” (Tissington, 2011: 65). While RDP standards
state basic sanitation service requires access to a VIP toilet (Torres, 2000: 165), other communities
see urine diversion (UD) toilet as basic level of service (Nnadozie, 2011).
In light of the difficulties surrounding sanitation provision, programmes specific to sanitation, such
as the National Sanitation Programme, were initiated. An evaluation of the National Sanitation
Programme was done to identify obstacles to sanitation provision. “The Minister’s undertaking was
rooted in concern for the human dignity of communities affected by inefficiencies is sanitation
provision as confirmed by various media exposé displaying the unacceptable realities in Makhaza,
Moqhaka and Moutse communities for example” (DHS, 2012).
As a further means of remedying the lag in sanitation services, the bucket eradication programme
was established in 2005. The aim of the programme was to replace existing, inadequate bucket
facilities with more appropriate and acceptable services. At the proposed completion date,
December 2007, “an estimated 252 254 households still needed to be reached” (National Treasury,
2012: 132).
The prioritisation of sanitation provision in rural areas was solidified with the establishment of the
Rural Household Infrastructure Programme (RHIP) in 2010. The mandate of the RHIP is “every rural
household to have basic sanitation and water” and the Programme is set to use R1.2 billion (DHS,
n.d.).
“The RHIP is designed to help municipalities to reduce backlogs in sanitation and water supply. It
is implemented in seven provinces except in Gauteng and Western Cape where there are no rural
backlogs in sanitation. The other important facet of the programme is to alleviate poverty by
implementing programmes through labour intensive methods” (DHS, n.d.: 5).
It is clear from the aforementioned policies and programmes that, after 1994, the focus of water
supply and sanitation provision was pro-poor. This focus was to redress the preceding uneven access
to adequate services. Bhorat et al. (2004); Bhorat and Canbur (2005); Bhorat et al. (2008a;b), cited in
Nnadozie (2011), conducted studies into service delivery that corroborate the notion of a pro-poor
focus. “Households at the bottom of the expenditure deciles (poorest of the poor) were found to
have benefited more from government services” (Nnadozie, 2011: 340).
Despite these programmes and interventions, the service delivery goals set out by government have
largely not been met.
“President Mbeki gave an undertaking in 2006 that the bucket system of sanitation would be
eradicated in formally established areas by the end of this year. In addition, 2.07 million households

Univers
ity of
Cap
e Tow
n
August 2013 14
must be provided with potable water by December 2008. A total of 3.7 million households need to be
provided with sanitation by 2010. A total of 3.4 million households need to be electrified by 2012. A
total of 2.3 million households need to be provided with adequate shelter by 2014. In all these areas,
on the current trajectory the targets will not be met.” (Levin, 2007: 3)
The water supply and sanitation provision targets have thus been revised:
“All people in South Africa have access to a functioning basic water supply facility by 2014.
All people in South Africa have access to a functioning basic sanitation facility by 2014.”
(DWA, 2013: 24)
The DWA has determined that revised targets will not be met (DWA, 2013: 22).
“The operational debt of some municipalities is so severe that, even if no further infrastructure
were acquired, it could well still be impossible for them, without innovative external assistance, to
catch up with existing maintenance backlogs and restore sustainable operations” (DHS, 2012: 71).
Government has stipulated service delivery plans for the future in the South African National
Infrastructure Plan (PICC, 2012). Future Strategic Integrated Projects (SIPs) will “address the spatial
imbalances of the past by addressing the needs of the poorer provinces and enabling socio-
economic development”; the emphasis will be on regions lagging in service delivery provision (PICC,
2012: 15).
For water and sanitation infrastructure specifically,
“10-year plan to address the estimated backlog of adequate water to supply 1.4m households and
2.1m households to basic sanitation. The project will involve provision of sustainable supply of water
to meet social needs and support economic growth. Projects will provide for new infrastructure,
rehabilitation and upgrading of existing infrastructure, as well as improve management of water
infrastructure” (PICC, 2012: 25).
Current issues impeding water supply and sanitation provision
Despite the pro-poor focus of water supply and sanitation provision, substantial backlogs still exist
among poor households (Nnadozie, 2011).
Many factors influence the progress of service delivery in South Africa. Torres (2000) argues the
following points illustrate the complexity of service delivery in South Africa:
Having to build services rather than maintain
High poverty rates
High unemployment
Reconstruction of public service system/structure
Social services expenditure is 21% of GDP while Norway, for example, is able to spend 50%
of GDP on social services (Torres, 2000: 17).
With poor or nonexistent infrastructures found in at risk municipalities, the decentralisation of the
water and sanitation services has had various challenges. 80% of all WSAs can be classified as “very
high vulnerability” due to insufficient technical and financial capacity (DWA, 2012c). “This is of
significant concern, and although programmes have been instituted to boost the capacity of WSAs,

Univers
ity of
Cap
e Tow
n
August 2013 15
these have generally taken the form of short-term interventions that did little to transfer skills and
build and retain capacity within the WSAs” (DWA, 2012c: 8).
“From evidence, it is clear that much of local government is indeed in distress, and that this state
of affairs has become deeply rooted within our system of governance. In assessing the reality of poor
municipal performance, cognisance needs to be taken of the unresolved problems identified in
previous assessments (despite recognition from national government, and legislation that is often in
line with international best practice), and the intergovernmental impact of this failure, both
institutionally and for communities. A recurring theme is the inadequate capacity of service
providers to fulfil their responsibilities. Delivering and operating new infrastructure are complex
activities but competent skilled persons are in short supply, especially in rural areas. The recent trend
towards civil society partnerships with municipalities is beginning to have some positive impact, but
the sustainability of this approach is constantly threatened.” (SAICE, 2011: 11)
In 2013, vulnerability self-assessment of WSAs in terms of planning, capacity, management and
performance found that only 3% of WSAs are currently operating acceptably; 46% are in crisis (DWA,
2013: 35). “One of the most debilitating problems in this regard is a severe lack of capacity at local
level (unchanged or worse since 2006). Many of the smaller, poorer municipalities require assistance
in capacity building to operate as Water Services Authorities and Water Services Providers” (SAICE,
2011: 15).
Figure 6: Map of Municipal Vulnerability from self-assessment (DWA, 2013: 36)
The 46% of WSAs that are in crisis are not limited to former homeland regions (Figure 5). This
indicates that municipalities other than those that were previously disadvantaged are struggling.
This in turn creates further disparities within the provinces. For example, the Blue Drop Score in
2012 for Mpumalanga was 60.9% - an adequate score; there were however Mpumalanga local
municipalities (LMs) with poor scores and therefore undrinkable tap water. Bushbuckridge had a
Blue Drop Score of 30.8% and the Blue Drop Score of Chief Albert Luthuli was 18.4% (DWA, 2012b).

Univers
ity of
Cap
e Tow
n
August 2013 16
Non-functional WSAs are problematic because inefficient infrastructure management leads to non-
delivery of services and non-functional water schemes (DWA, 2013).
“There are approximately 1689 water schemes in South Africa. 9% are currently totally
dysfunctional at present and lie mainly within the 24 DMs which cover the pre 1994 old homeland
areas. Some 48% of schemes are in urgent need of refurbishment. Water treatment and wastewater
treatment works are generally in poor condition, with 66% of WWTWs requiring short to medium
term intervention, 35% requiring capacity upgrades and 56% requiring additional skilled operating
and maintenance staff” (DWA, 2013: 48).
There are a number of factors that have resulted in water scheme functionality issues (Figure 6).
Figure 7: Water Scheme functionality issues (DWA, 2013: 49)
Operation and maintenance issues, specifically, have resulted in issues with quality of service.
Consequently, the Blue and Green Drop initiatives were started to assess the capabilities of
municipalities to provide safe water and sanitation services, respectively. The program, initiated in
2008, has revealed significant issues in certain municipalities. The annual Blue Drop report for 2012
included the following notice for Bushbuckridge in Mpumalanga: “[t]he Department hereby issues a
warning to all residents and visitors to the Bushbuckridge Local Municipal area not to consume the
tap water without taking appropriate measures to improve the drinking water quality” (DWA, 2012b:
248).
The water services infrastructure in South Africa is deteriorating, and therefore adversely affecting
the quality of the service.
“The water infrastructure – with a weighted average age of 39 years – is subject to ageing effects
associated with internal and external stresses and other impacts. Insufficient maintenance and
capital renewal have resulted in further deterioration. According to the DWA, there is substantial
Univers
ity of
Cap
e Tow
n
August 2013 17
maintenance non-compliance with regards to the National Water Resources Strategy (NWRS) of
September 2009. There is also an urgent need to review the NWRS” (SAICE, 2011: 15).
The situation for sanitation systems is also worrying” (SAICE, 2011: 15).
“According to DWA’s 2011 Green Drop assessment report on the performance of waste water
treatment and management in South Africa, of the 821 systems assessed in 2011 only 40 received
Green Drop certification from DWA. Also extremely worrying is that 20 of the previous recipients of
the Green Drop certificates in 2010 lost their certification status in 2011.” (Tissington, 2011: 64)
The findings of the Blue and Green Drop Reports illustrate a key issue in the current service delivery
discourse, where improved infrastructure has not ensured a proficient level of service. As such,
quantity does not equate to quality, even for the most basic of services and infrastructure provided
to many impoverished communities throughout South Africa. Focus has been put on quantity in
order to meet coverage targets and goals, while maintenance has taken a backseat (Tissington,
2011: 59). “Inadequate maintenance has meant that water is no longer flowing through newly
installed pipes and taps in many rural areas” (Nattrass & Seekings, 2001: 480).
“The [State of Local Government Overview] report shows that on the whole local government is
struggling to fulfil this developmental mandate, and many municipalities are failing altogether… The
severity of the number of ever-increasing backlogs across all basic services means that realistically
speaking, meeting the 2014 goals of Government and the Millennium Development Goals may not be
achievable with respect to service” (COGTA, 2009b: 7).
This coupled with the self-assessed vulnerability of a substantial number of municipalities, highlights
the need to critically assess the provision of services at municipal level. Furthermore, setting general
targets for all municipalities is not pragmatic. “National targets for service delivery that apply
uniformly irrespective of the economic and institutional differences between municipalities simply set
municipalities up to fail” (COGTA, 2009b).
In conclusion, despite substantial progress since 1994, backlogs still persist. The pro-poor focus, to
redress the previous unequal service provision, has not yet rectified the backlogs. Furthermore,
municipalities that were not of those that were previously disadvantaged are self-proclaimed
vulnerable WSAs and are unable to provide services adequately; this results in further disparities in
services. Critically assessing progress at municipal level, in order to determine where the disparities
are, can assist in creating focused targets that consider the structural variances between
municipalities. Focussed targets would better suit service delivery assessment; the targets do not
create a situation where municipalities are “set-up to fail”.

Univers
ity of
Cap
e Tow
n
August 2013 18
Method of Research
Large disparities exist between local municipalities within the same province. This reality is evident
from the Blue Drop report of 2012 where provinces with a satisfactory score, for example the
Eastern Cape had a score of 82%, have municipalities with tragic scores; Koukamma Local
Municipality scored the lowest Blue Drop Score in 2012, 5.6% (DWA, 2012a).
This study aimed to assess the progress made in water and sanitation provision at local municipal
level. A cluster analysis was done on access to water supply and sanitation data from the 2001 and
2011 Censuses and the 2007 Community Survey, at local municipal level. The Pearson product
moment correlation test was used to ascertain the strength of the relationship, between the prior
level of access to adequate services and the progress made since then.
Selecting a data source
There are many entities that monitor household access to water supply and sanitation facilities, inter
alia:
- The various governmental structures: municipalities, provinces and national government
- Department of Water Affairs (DWA previously DWAF) and Department of Human Settlements
(DHS)
- South African Institute of Race Relations (SAIRR): South African Survey
- Human Sciences Research Council (HSRC)
- Statistics South Africa (StatsSA)
Most institutions monitor the access to water and sanitation at a provincial level given that it is an
arduous process to collect data at municipal level. “The yearly delivery [of municipal] data are very
erratic and this clearly illustrates the difficulty of undertaking a year by year monitoring and
evaluation of delivery of basic services in numerical terms” (Nnadozie, 2011: 341). All local
municipalities that have to submit annual reports; some have a history of poor reporting.
StatsSA was felt to be the most suitable data provider. They conduct numerous surveys and have
rigorous accompanying metadata documentation, which adds to the understanding of the data.
Other institutions, however, largely rely on data from local and national government; StatsSA
gathers its own data. Through the Census and Community Survey specifically, StatsSA, collects
household level data that is made available at local municipal level.
Census and Community Survey data were selected as appropriate surveys. StatsSA provides access
to these surveys electronically through the PX-WEB platform3.
Census and Community Survey Various factors have changed between the different Censuses and, as such, the data had to be
aligned in order to be comparable.
Census data was gathered from StatsSA Online PX-Web platform. Censes prior to 1996 were not
suitable for inclusion given that the “Census 1996 was the first population census conducted after
3 http://www.statssa.gov.za/timeseriesdata/timeseriesdata.asp

Univers
ity of
Cap
e Tow
n
August 2013 19
the 1994 elections” (StatsSA, 2001). Various factors have changed between the different Censuses
and, as such, the data had to be aligned in order to be comparable.
The survey questionnaire has changed over the years, making different level of service data
available. The following level of service options were not included in the Census 1996 questionnaire:
Water supply - Distance to community tap (i.e. 200m)
- Rain tank
- Dam/pool/stagnant water
- Other
Sanitation - Flush septic tank
- Chemical toilet
- VIP
To ensure comparable level of service data, Census 1996 was not included in analysis.
Geographical boundaries and names of municipalities, with which the surveys were conducted, have
changed since 1994.
Geographical Boundaries in the various post-1994 surveys were:
Census 1996 – Local boundaries consist of Local Councils and Traditional and Magisterial
Districts
Census 2001 – Local and District Municipalities at 2001 demarcations
Community Survey 2007 - Local and District Municipalities at 2005 demarcations, with 237
local municipalities. The Community Survey statistics were collected at 2011 boundaries.
Census 2011 – Local and District Municipalities at 2011 boundaries with 234 local
municipalities.
The data was gathered at the 2011 boundaries in order to be comparable across the years. Following
are changes to 2005 boundaries - 2001 data collected at 2005 boundaries.
The Community Survey was not an actual census. Data collection was done using a two-stage
stratified random sampling of 17 098 out of 80 787 Enumerator Areas (EAs) (COGTA, 2009a). The
sampling entails cautionary use of the Community Survey data.
“No reliance should be placed on numbers for variables broken down at municipal level (i.e. age,
population group etc.)… in a number of instances the number realised in the sample, though not zero,
was very small (maybe as low as a single individual) and in some cases had to be re-weighted by a
very large factor (maximum nearly 800 for housing weight and over 1000 for person weight). As a
further consequence, small sub-populations are likely to be heavily over- or under-represented at a
household level in the data.” (StatsSA, 2007)
Data at municipal level was used because “the aggregated total number per municipality provides
more reliable estimates” (StatsSA, 2007).
Univers
ity of
Cap
e Tow
n
August 2013 20
Name, boundary and category changes can be found in Appendix 1.
Identification of survey variables
The access to water supply and sanitation data, presented in terms of levels of service (LOS), were
grouped depending on whether or not they met the UN MDG standard of “improved” or “adequate”
facilities. The WHO/ UNICEF Joint Monitoring Programme (JMP) – the body monitoring the progress
towards the MDG water supply and sanitation targets – defines standard for improved services as
follows.
“JMP classifies as “improved” water supply: piped water into dwelling, plot or yard; public tap;
tube-well or borehole; protected dug well or spring; and collected rainwater. To be classified as
improved, at least 20 litres per capita per day from a protected source within one kilometre of the
user’s dwelling is required. The classification of improved sanitation comprises flush or pour-flush
toilet to piped sewer system, septic tank or pit latrine; a ventilated improved pit-latrine (VIP); pit
latrine with slab; or composting toilet.” (Hutton & Bartam, 2008: 14)
Furthermore, the South African Government specified that the potable water source be located at
least 200 meters from each dwelling in order to be considered as “improved” water supply (DWAF,
2004: 6).
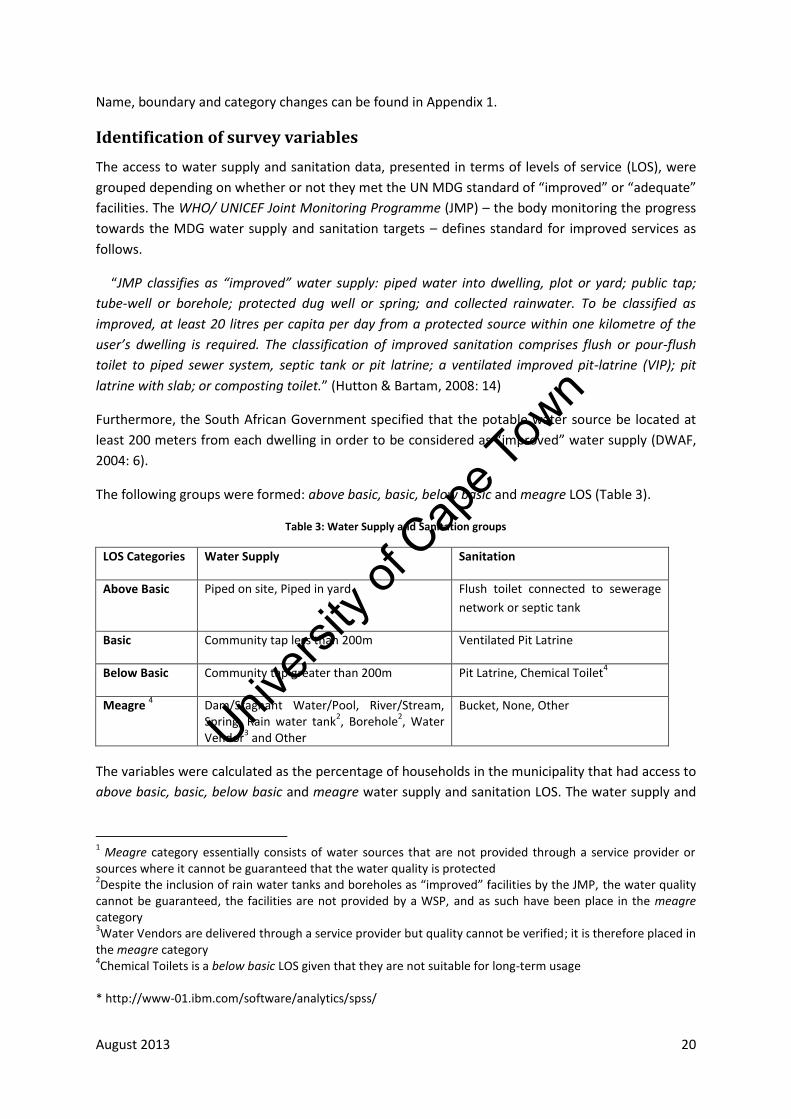
The following groups were formed: above basic, basic, below basic and meagre LOS (Table 3).
Table 3: Water Supply and Sanitation groups
LOS Categories Water Supply Sanitation
Above Basic Piped on site, Piped in yard Flush toilet connected to sewerage
network or septic tank
Basic Community tap less than 200m Ventilated Pit Latrine
Below Basic Community tap greater than 200m Pit Latrine, Chemical Toilet4
Meagre 4
Dam/Stagnant Water/Pool, River/Stream, Spring, Rain water tank
2, Borehole
2, Water
Vendor3 and Other
Bucket, None, Other
The variables were calculated as the percentage of households in the municipality that had access to
above basic, basic, below basic and meagre water supply and sanitation LOS. The water supply and
1 Meagre category essentially consists of water sources that are not provided through a service provider or
sources where it cannot be guaranteed that the water quality is protected 2Despite the inclusion of rain water tanks and boreholes as “improved” facilities by the JMP, the water quality
cannot be guaranteed, the facilities are not provided by a WSP, and as such have been place in the meagre category 3Water Vendors are delivered through a service provider but quality cannot be verified; it is therefore placed in
the meagre category 4Chemical Toilets is a below basic LOS given that they are not suitable for long-term usage
* http://www-01.ibm.com/software/analytics/spss/
Univers
ity of
Cap
e Tow
n
August 2013 21
sanitation provision data were analysed separately for each of the surveys. Analysis was performed
with IBM SPSS*.
Cluster Analysis
Cluster analysis is a method used to determine natural groupings in data sets. The clusters have a
high level of homogeneity, where the variability within clusters is minimised and variability between
clusters is maximised. Using cluster analysis therefore forms groups based on natural tendencies in
the data instead of using predetermined groups.
Studies like Vázquez & Sumner (2012), Ruger & Kim (2006) and Saint-Arnaud & Bernard (2003),
focussing of different characteristics - development indicators, mortality statistics and welfare
regimes, respectively - have used cluster analysis to classify and group countries. Martinez et al.
(2008) performed a cluster analysis of cities depending on shelter characteristics and Ruger & Kim
(2006) used cluster analysis to group countries by mortality to “identify groups, assess intergroup
disparities and examine risk factors associated with such disparities” (Ruger & Kim, 2006: 932).
Similarly, this study used cluster analysis to group local municipalities in terms of access to improved
water supply and sanitation facilities. The creation of clusters is a means of identifying if groups
exist, how many, and which municipalities are grouped together; assessing the differences between
the groups; and how these groups have changed over the years. A change in the number of clusters
over the years would indicate whether or not more municipalities become similar to one another –
in terms of access to services. Assessing how the groups have changed would indicate whether
municipalities, which were found to be similar in terms of access to services, remained similar.
Clustering Procedure
Hierarchical and k-means cluster analysis are clustering procedures available in SPSS. K-means
clustering was selected because the procedure involves maximising variability between clusters and
minimising variability within clusters. K-means clustering requires an initial input stating the number
of clusters. Cases are categorized to the closest cluster based on their distance or proximity to the
cluster centres. A number of iterations occur. Cluster centres are recalculated based on the allocated
cases. Cases are then reclassified into new clusters, based on the updated centres. The iterations
continue until the cluster centre remains relatively fixed between successive iterations (IBM, 2011).
With hierarchical clustering, once a case is classified into a cluster it will remain there; even if more a
suitable cluster is formed after its classification. K-means is however, sensitive to outliers, which may
obscure the initial cluster means (IBM, 2011: 390).
The number of suitable clusters for local municipal water and sanitation access data was unknown.
Consequently, hierarchical clustering was performed prior to k-means clustering in order to
determine the suitable number of clusters.
Determining the number of clusters using hierarchical analysis
Using hierarchical cluster analysis in SPSS requires two inputs, a clustering method and a distance
measure.
Cluster methods stipulate the manner in which clusters are combined. Ward’s method – cluster
membership is determined as the “total sum of squared deviations from the mean of a cluster”

Univers
ity of
Cap
e Tow
n
August 2013 22
(Burns & Burns, 2008: 558) - was selected. A study comparing the accuracy of four clustering
methods, suitable for continuous variables, found that Ward’s method exhibited the highest
accuracy values (Blashfield, 1976).
The distance measure essentially determines the similarity or proximity between the cases. The
distance measure selected was Squared Euclidean distance (Equation 1):
( ) (√( ) ( )
) (1)
Squared Euclidean distance squares the Pythagoras’ right angled triangle formula for calculating
distances, thereby increasing the significance of large distances and decreasing the significance of
small distances. Squared Euclidean distance and Ward’s method are preferred measures in
hierarchical clustering (Vazquez & Sumner, 2012; Burns & Burns, 2008: 557; Clatworthy et al., 2005:
352).
“Specifically, the Ward’s method begins by calculating, for each cluster, the means for all
variables. Then… the squared Euclidean distance to the cluster means is calculated. These distances
are summed for all of the cases. At each step, the two clusters that merge are those that result in the
smallest increase in the overall sum of the squared within-cluster distances.” (Vazquez & Sumner,
2012: 38)
The number of clusters was estimated visually using the ‘elbow’ method on a Scree Plot. The Scree
Plot plots coefficients - which is the distance value used to form the cluster (IBM, 2011) - against the
number of clusters formed at that stage. The coefficient or distance value essentially informs “how
unlike the clusters being combined are” and “[l]arge coefficients tell you that you’re combining
dissimilar clusters” (IBM, 2011: 383). The ‘elbow’ method essentially represents the point at which
creating another cluster is not significantly different to the existing clusters (Vazquez & Sumner,
2012: 18). This method is not very accurate and, as such, was used only to gain an approximate
range for the number of clusters, k.
The approximated k values, from the hierarchical analysis, were used in the Variance Ratio Criterion
(VRC) equation (Equation 2) that introduced by Calinski and Harabasz (1974) to determine the
correct number of clusters (Mooi & Sarstedt, 2011 and Vazquez & Sumner, 2012).
(2)
K: number of clusters
N: number of objects
SSB: overall between-cluster variation
SSW: overall within-cluster variation
VRCk: in essence, represents the F-statistic of a one-way ANOVA which can be done on SPSS
( ) ( ) (3)
Univers
ity of
Cap
e Tow
n
August 2013 23
ωk was calculated for different values of k. The value of k selected was the one that minimizes ωk.
This k was used in the k-means analysis.
K-means analysis
The K-means procedure, described above, computes distances with simple Euclidean distance
measure in SPSS (IBM, 2011b: 184).
Pearson product moment correlation test The variables used in the correlation test were progress made (percentage of households with
access to adequate service from 2001 and 2011) and previous level of access to adequate service
(percentage of households with adequate service in 2001).
The Pearson correlation test was used because it measures correlation of continuous variables
(Wheater & Cook, 2000). This test requires data that is normally distributed in order for the results
to be appropriate. For the purpose of this study, however, the correlation test is of the whole
dataset – all municipalities in South Africa.
The correlation coefficient (r) – which indicates the strength of the relationship between the
variables – is affected by probability (p) and size (n). If the probability is greater than 0.05, the
probability of the relationship measured occurring by chance is greater than 5%; the correlation
coefficient is not significant; and no linear relationship exists between the data. A small sample size
increases the probability of the measured relationship occurring by chance. A critical values table
must be consulted in order to determine if the results are significant (Appendix 2).
If a negative correlation is established for municipalities in a province, it indicates that the
backlogged municipalities had greater progress than the favourable municipalities. If pro-poor
service provision was effective, a negative correlation would exist between progress made and
access to adequate service in 2001.

Univers
ity of
Cap
e Tow
n
August 2013 24
Findings and Analysis
The following section describes the analysis of the water supply and sanitation statistics. Descriptive
statistics of water supply and sanitation are presented to demonstrate the overall change in access
statistics. The results from the k-means cluster analysis for water supply and sanitation are then
presented. This is followed by an analysis of the differences between the water supply and
sanitation results.
Descriptive Statistics
The bar graphs below illustrates the overall progress made - with respect to the different Levels of
Service (LOS): above basic, basic, below basic and meagre - in the access to water supply and
sanitation facilities for 2001, 2007 and 2011. The solid red line marks 50% of South African
households.
Water Supply: The overall trend was positive, with an increase in above basic and basic LOS and
notable overall decrease of below basic and meagre LOS (Figure 8). The change, in above basic LOS
particularly, over the years was notable. 67% of the households had access to this LOS in 2011, up
from 57% in 2001 - an increase of 10%. This indicates that above basic LOS was the service most
provided. Overall changes in the other LOS were of a lesser magnitude – a 2% increase for basic LOS,
a decrease of 5% and 8% for below basic and meagre LOS, respectively. The above basic LOS then
showed the greatest change, compared to the other LOS.
Figure 8: National water supply descriptive statistics
Sanitation: The overall trend was positive, with an increase in above basic and basic LOS and overall
decrease of below basic and meagre LOS (Figure 9). This trend is similar to water supply services. The
most notable change, however, was for meagre LOS, which decreased from 26% in 2001 to 13% in
2011 – a 13% reduction. This indicates that meagre LOS was the service most replaced. 11% of the
13% decrease occurred between 2001 and 2007, indicating more sanitation progress in this period
than between 2007 and 2011. Lesser overall changes include 4% increase in basic LOS and a
57 63 67
11 7
13 12 13
7 20 17 12
0
20
40
60
80
100
2001 2007 2011
Percentage of South African households
Year
Descriptive Statistics - Water Supply
Meagre
Below
Basic
Above
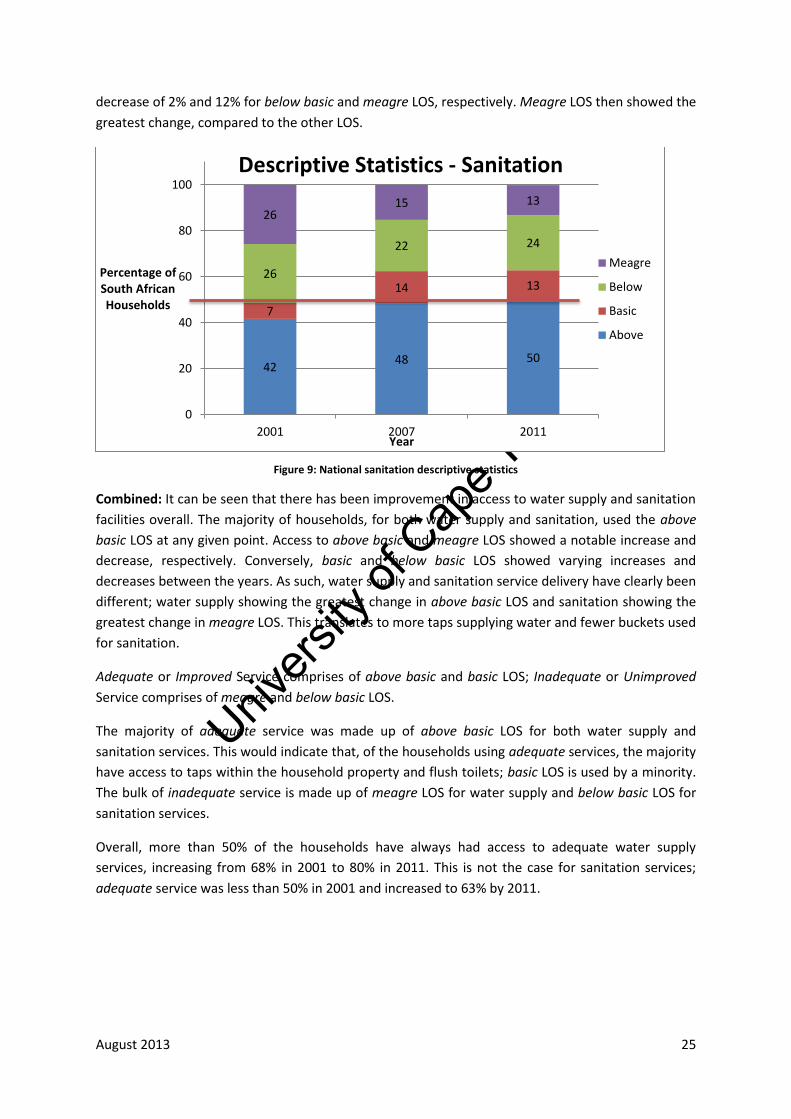
Univers
ity of
Cap
e Tow
n
August 2013 25
decrease of 2% and 12% for below basic and meagre LOS, respectively. Meagre LOS then showed the
greatest change, compared to the other LOS.
Figure 9: National sanitation descriptive statistics
Combined: It can be seen that there has been improvement in access to water supply and sanitation
facilities overall. The majority of households, for both water supply and sanitation, used the above
basic LOS at any given point. Access to above basic and meagre LOS showed a notable increase and
decrease, respectively. Conversely, basic and below basic LOS showed varying increases and
decreases between the years. As such, water supply and sanitation service delivery have clearly been
different; water supply showing the greatest change in above basic LOS and sanitation showing the
greatest change in meagre LOS. This translates to more taps supplying water and fewer buckets used
for sanitation.
Adequate or Improved Service comprises of above basic and basic LOS; Inadequate or Unimproved
Service comprises of meagre and below basic LOS.
The majority of adequate service was made up of above basic LOS for both water supply and
sanitation services. This would indicate that, of the households using adequate services, the majority
have access to taps within the household property and flush toilets; basic LOS is used by a minority.
The bulk of inadequate service is made up of meagre LOS for water supply and below basic LOS for
sanitation services.
Overall, more than 50% of the households have always had access to adequate water supply
services, increasing from 68% in 2001 to 80% in 2011. This is not the case for sanitation services;
adequate service was less than 50% in 2001 and increased to 63% by 2011.
42 48 50
7
14 13 26
22 24
26 15 13
0
20
40
60
80
100
2001 2007 2011
Percentage of South African Households
Year
Descriptive Statistics - Sanitation
Meagre
Below
Basic
Above
Univers
ity of
Cap
e Tow
n
August 2013 26
Cluster Analysis: Water Supply
This section presents the results from the cluster analysis for water supply.
K-Means Clustering
The following tables show the results of the cluster analysis for Census 2001, Community Survey
2007 and Census 2011 for water supply.
Nine clusters were found for 2001; detailed description of this can be found in Appendix 3.
Three of the nine clusters (1-3) had above basic means greater than 50%, at 87.3%, 74.1% and 58.8%
respectively (Table 4). This indicates a prominence of taps within the site in these municipalities,
which included the Metros and all of the LMs from Western Cape, Gauteng and Free State; Buffalo
City was the only metro belonging to cluster 3.
Three clusters (6, 8 and 9) had meagre LOS means greater than 50% at 56.4%, 62.1% and 81.2%
respectively. The LMs in these clusters were solely from KwaZulu Natal and Eastern Cape, except for
one Limpopo LM in cluster 8 – LIM 473: Makhuduthamaga. This indicates that there was a
prevalence of meagre services in these LMs in KwaZulu Natal and Eastern Cape; both provinces
where homelands were located.
For the other three clusters, no one LOS had a mean greater than 50%. Only cluster 7 had a basic
LOS greater than the corresponding above basic LOS. LMs in this cluster were largely from Limpopo,
KwaZulu Natal and Eastern Cape, indicating a substantial growth in basic LOS - taps within 200m -
compared to above basic LOS – taps on site - for LMs in this cluster.
5 out of 9 clusters had greater than 50% of households with access to adequate services (above basic
+ basic LOS). The adequate LOS means for clusters 6 and 7 were equal, but the different LOS
proportions created two different clusters; cluster 6 had a basic LOS mean of 6% while cluster 7 had
a basic LOS mean of 20%. Nearly the entire cluster 6 consisted of LMs from KwaZulu Natal, such as
KZN 431: Ingwe. Cluster 7 was more diverse; it included LMs from North West and Northern Cape,
such as NW381: Ratlou and NC451: Joe Morolong.
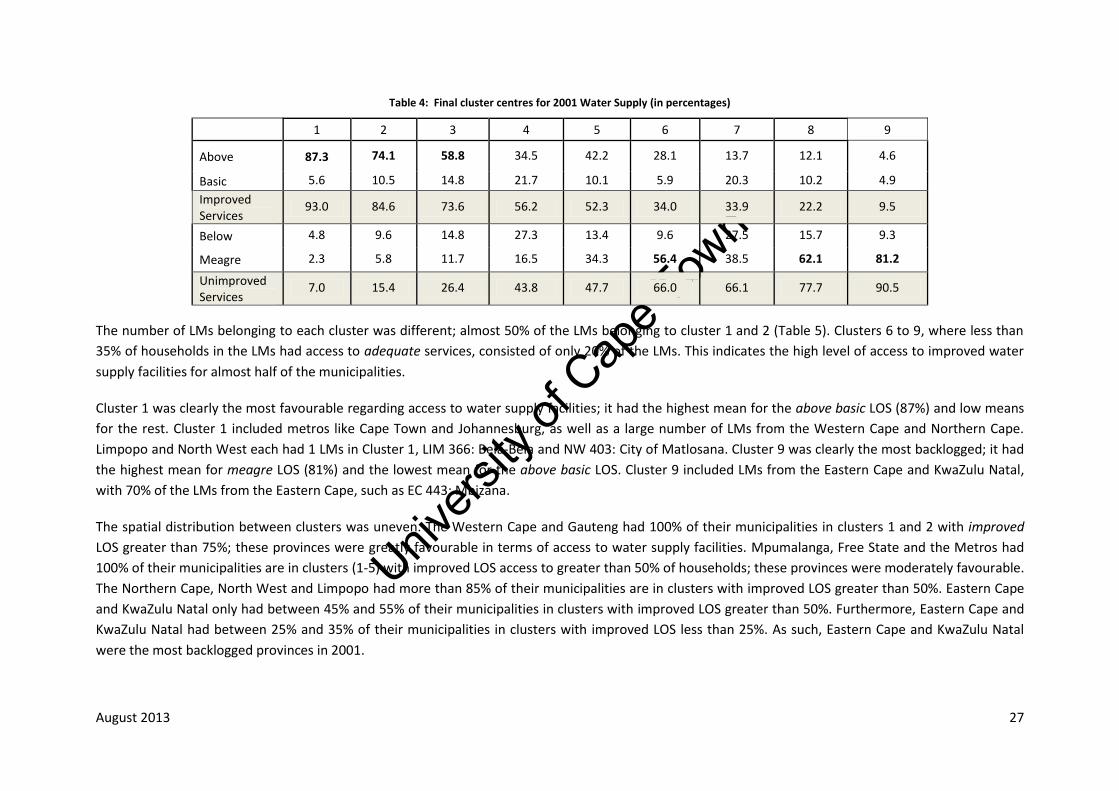
Univers
ity of
Cap
e Tow
n
August 2013 27
Table 4: Final cluster centres for 2001 Water Supply (in percentages)
1 2 3 4 5 6 7 8 9
Above 87.3 74.1 58.8 34.5 42.2 28.1 13.7 12.1 4.6
Basic 5.6 10.5 14.8 21.7 10.1 5.9 20.3 10.2 4.9
Improved Services
93.0 84.6 73.6 56.2 52.3 34.0 33.9 22.2 9.5
Below 4.8 9.6 14.8 27.3 13.4 9.6 27.5 15.7 9.3
Meagre 2.3 5.8 11.7 16.5 34.3 56.4 38.5 62.1 81.2
Unimproved Services
7.0 15.4 26.4 43.8 47.7 66.0 66.1 77.7 90.5
The number of LMs belonging to each cluster was different; almost 50% of the LMs belonging to cluster 1 and 2 (Table 5). Clusters 6 to 9, where less than
35% of households in the LMs had access to adequate services, consisted of only 20% of the LMs. This indicates the high level of access to improved water
supply facilities for almost half of the municipalities.
Cluster 1 was clearly the most favourable regarding access to water supply facilities; it had the highest mean for the above basic LOS (87%) and low means
for the rest. Cluster 1 included metros like Cape Town and Johannesburg, as well as a large number of LMs from the Western Cape and Northern Cape.
Limpopo and North West each had 1 LMs in Cluster 1, LIM 366: Bela-Bela and NW 403: City of Matlosana. Cluster 9 was clearly the most backlogged; it had
the highest mean for meagre LOS (81%) and the lowest mean for the above basic LOS. Cluster 9 included LMs from the Eastern Cape and KwaZulu Natal,
with 70% of the LMs from the Eastern Cape, such as EC 443: Mbizana.
The spatial distribution between clusters was uneven. The Western Cape and Gauteng had 100% of their municipalities in clusters 1 and 2 with improved
LOS greater than 75%; these provinces were greatly favourable in terms of access to water supply facilities. Mpumalanga, Free State and the Metros had
100% of their municipalities are in clusters (1-5) with improved LOS access to greater than 50% of households; these provinces were moderately favourable.
The Northern Cape, North West and Limpopo had more than 85% of their municipalities are in clusters with improved LOS greater than 50%. Eastern Cape
and KwaZulu Natal only had between 45% and 55% of their municipalities in clusters with improved LOS greater than 50%. Furthermore, Eastern Cape and
KwaZulu Natal had between 25% and 35% of their municipalities in clusters with improved LOS less than 25%. As such, Eastern Cape and KwaZulu Natal
were the most backlogged provinces in 2001.

Univers
ity of
Cap
e Tow
n
August 2013 28
Table 5: Provincial distribution of clusters for 2001
1 2 3 4 5 6 7 8 9
Improved
services 93.0% 84.6% 73.6% 56.2% 52.3% 34.0% 33.9% 22.2% 9.5%
Percentage of
municipalities with
improved services > 50% < 25% N
WC 22 2 - - - - - - - 100 - 24
GT 4 3 - - - - - - - 100 - 7
Metros 3 4 1 - - - - - - 100 - 7
FS 5 11 3 - - - - - - 100 - 19
MP - 10 3 2 3 - - - - 100 - 18
NC 16 9 - 1 - - 1 - - 96 - 27
NW 1 4 6 6 1 - 1 - - 95 - 19
LIM 1 1 7 8 5 - 2 1 - 88 4 25
KZ - 7 7 - 10 8 4 11 3 48 28 50
EC 5 5 5 3 1 1 4 6 7 51 35 37
N 57 56 32 20 20 9 12 18 10 234
Eight clusters were found for 2007; see Appendix 4 for detailed description.
Four of the eight clusters (1 to 4) had above basic means greater than 50%, at 92.6%, 79.7%, 61.8% and 57.5%, respectively (Table 6). This was greater than
the 3 clusters in 2001, indicating an increased variability among municipalities with more than 50% household access to above basic LOS. These were the
only clusters that had more than 50% household access to adequate LOS (above basic + basic). This was less than the 5 clusters in 2001, indicating a
decrease in the variability of municipalities with more than 50% household access to adequate LOS. The Metros and all of the LMs from Western Cape,
Gauteng and Free State were all located in Clusters 1 and 2, instead of being located over 3 clusters like in 2001. This indicates that the municipalities had
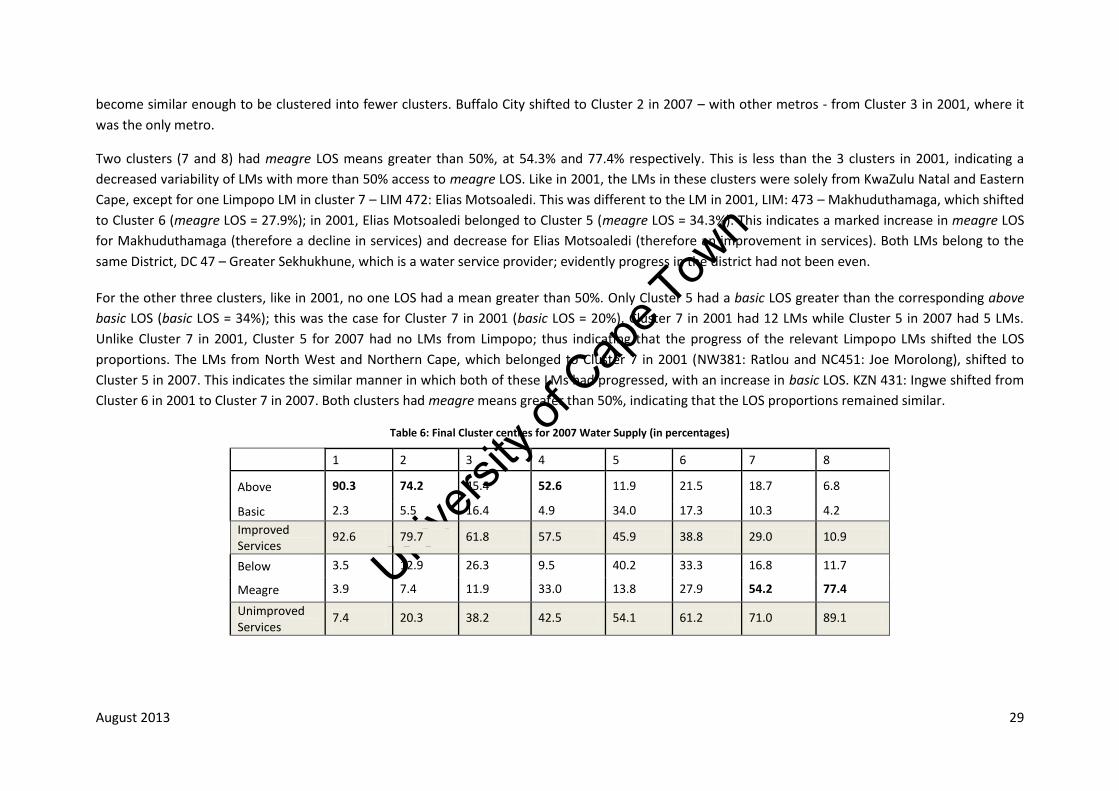
Univers
ity of
Cap
e Tow
n
August 2013 29
become similar enough to be clustered into fewer clusters. Buffalo City shifted to Cluster 2 in 2007 – with other metros - from Cluster 3 in 2001, where it
was the only metro.
Two clusters (7 and 8) had meagre LOS means greater than 50%, at 54.3% and 77.4% respectively. This is less than the 3 clusters in 2001, indicating a
decreased variability of LMs with more than 50% access to meagre LOS. Like in 2001, the LMs in these clusters were solely from KwaZulu Natal and Eastern
Cape, except for one Limpopo LM in cluster 7 – LIM 472: Elias Motsoaledi. This was different to the LM in 2001, LIM: 473 – Makhuduthamaga, which shifted
to Cluster 6 (meagre LOS = 27.9%); in 2001, Elias Motsoaledi belonged to Cluster 5 (meagre LOS = 34.3%). This indicates a marked increase in meagre LOS
for Makhuduthamaga (therefore a decline in services) and decrease for Elias Motsoaledi (therefore an improvement in services). Both LMs belong to the
same District, DC 47 – Greater Sekhukhune, which is a water service provider; evidently progress in the district had not been even.
For the other three clusters, like in 2001, no one LOS had a mean greater than 50%. Only Cluster 5 had a basic LOS greater than the corresponding above
basic LOS (basic LOS = 34%); this was the case for Cluster 7 in 2001 (basic LOS = 20%). Cluster 7 in 2001 had 12 LMs while Cluster 5 in 2007 had 5 LMs.
Unlike Cluster 7 in 2001, Cluster 5 for 2007 had no LMs from Limpopo; thus indicating that the progress of the relevant Limpopo LMs shifted the LOS
proportions. The LMs from North West and Northern Cape, which belonged to Cluster 7 in 2001 (NW381: Ratlou and NC451: Joe Morolong), shifted to
Cluster 5 in 2007. This indicates the similar manner in which both of these LMs had progressed, with an increase in basic LOS. KZN 431: Ingwe shifted from
Cluster 6 in 2001 to Cluster 7 in 2007. Both clusters had meagre means greater than 50%, indicating that the LOS proportions remained similar.
Table 6: Final Cluster centres for 2007 Water Supply (in percentages)
1 2 3 4 5 6 7 8
Above 90.3 74.2 45.4 52.6 11.9 21.5 18.7 6.8
Basic 2.3 5.5 16.4 4.9 34.0 17.3 10.3 4.2
Improved Services
92.6 79.7 61.8 57.5 45.9 38.8 29.0 10.9
Below 3.5 12.9 26.3 9.5 40.2 33.3 16.8 11.7
Meagre 3.9 7.4 11.9 33.0 13.8 27.9 54.2 77.4
Unimproved Services
7.4 20.3 38.2 42.5 54.1 61.2 71.0 89.1

Univers
ity of
Cap
e Tow
n
August 2013 30
The number of LMs belonging to each cluster was different. Almost 60% of the LMs belonging to cluster 1 and 2 (Table 7); this is up from 50% of LMs in
2001. Clusters 7 and 8, with less than 35% household access to adequate services, consisted of only 13% of the LMs; this is down from 20% in 2001.
Cluster 1 was clearly the most favourable regarding access to water supply facilities; it had the highest mean for the above basic LOS (90.3%) and low means
for the rest. Cluster 1 included half of the metros and nearly all of the LMs in Western Cape and the Free State. Limpopo and North West each had more
than 1 LM in Cluster 1, compared to 2001. Like in 2001, NW 403: City of Matlosana belonged to Cluster 1 in 2007, while LIM 366: Bela-Bela shifted to Cluster
2 in 2007; this indicates dissimilar progress. Cluster 8 was clearly the most backlogged; it had the highest mean for meagre LOS (77.4%) and the lowest
mean for the above basic LOS. Cluster 8 had 10 LMs in 2001 and 7 in 2007, indicating that some LMs had progressed more than others, to not be grouped to
Cluster 8 in 2007. Like for Cluster 9 in 2001, Cluster 8 in 2007 had LMs from Eastern Cape and KwaZulu Natal, such as EC 443: Mbizana.
The Western Cape, Free State, Gauteng and the Metros had 100% of their municipalities in Clusters 1 and 2, both with improved LOS greater than 75%,
indicating greatly favourable provinces. The Free State and Metros were not classified as greatly favourable in 2001. Northern Cape and Mpumalanga had
more than 94% of their municipalities in clusters with improved LOS greater than 50%. This is down from 100% of municipalities in 2001, indicating that
some LMs in Northern Cape and Mpumalanga did not improve similarly, in order to be clustered together. The North West and Limpopo had between 75
and 80% of their municipalities in clusters with improved LOS greater than 50%. This is down from more than 85% in 2001, indicating that some LMs in
North West and Limpopo did not improve similarly, in order to be clustered together. The Eastern Cape and KwaZulu Natal had between 54 and 60% of
their municipalities are in clusters with improved LOS greater than 50% (up from 45-55% in 2001). The Eastern Cape and KwaZulu Natal also had 6% and
11% of municipalities belonging to Cluster 8 in 2007, with improved LOS less than 25% (down from 35% in 2001). Eastern Cape and KwaZulu Natal were still
the most backlogged provinces but some LMs were able to progress enough to not be grouped in clusters representing severely backlogged LMs, such as
Cluster 8 in 2007 with 11% access to improved LOS.

Univers
ity of
Cap
e Tow
n
August 2013 31
Table 7: Provincial distribution of clusters for 2007
1 2 3 4 5 6 7 8
Improved
services 92.6 79.7 61.8 57.5 45.9 38.8 29.0 10.9
Percentage of
municipalities with
improved services
> 50% < 25% N
WC 23 1 - - - - - - 100 - 24
FS 16 3 - - - - - - 100 - 19
GT 4 3 - - - - - - 100 - 7
Metros 4 4 - - - - - - 100 - 8
NC 19 6 1 - 1 - - - 96 - 27
MP 5 10 1 1 0 1 - - 94 - 18
NW 5 6 4 - 2 2 - - 79 - 19
LIM 2 4 11 2 - 5 1 - 76 - 25
KZN 3 5 5 16 1 2 15 3 58 6 50
EC 12 3 5 0 2 3 8 4 54 11 37
N 93 45 27 19 6 13 24 7 234
Nine clusters were found for 2011, like for 2001; detailed description can be found in Appendix 5.
Three of the nine clusters (1 to 3) had above basic means greater than 50%, at 89.5%, 62.7% and 69.3% respectively (Table 8). This indicates a decrease in
variability of these LMs from 2007. The Metros and all of the LMs from Western Cape were all located in Cluster 1 instead of over 2 clusters, like in 2007.
Gauteng and Free State each had 1 LM in Cluster 2; the rest were in Cluster 1. This indicates that the LMs in these provinces all progressed such that they
are tending towards one cluster; the LMs in lower clusters progressed enough to be grouped into Cluster 1. Buffalo City was the only metro in Cluster 2, like
in 2001 where it was the only metro in Cluster 3. This indicates that the progress in Buffalo City was not similar to the other metros.

Univers
ity of
Cap
e Tow
n
August 2013 32
Two clusters (8 and 9) had meagre LOS means greater than 50%, at 53.1% and 77.0% respectively. Like for 2001 and 2007, the LMs in these clusters were
solely from KwaZulu Natal and Eastern Cape; Cluster 9 comprised solely of 2 LMs from Eastern Cape. There were no LMs in Cluster 9 from Limpopo, like in
2001 and 2007. LIM 472: Elias Motsoaledi (Cluster 7 in 2007 – meagre LOS: 54.2%) and LIM: 473 – Makhuduthamaga (Cluster 6 in 2007 - meagre LOS:
27.9%) were shifted to Clusters 6 and 7 in 2011, respectively (meagre LOS between 30% and 35%). This indicates slight increase in meagre LOS for
Makhuduthamaga (therefore a decline in services) and marked decrease in meagre LOS for Elias Motsoaledi (therefore an improvement in services). This is
opposite to what happened between 2001 and 2007, indicating the irregular progress in Greater Sekhukhune District.
For the other four clusters, no one LOS had a mean greater than 50%. Clusters 5, 7 and 8 had a basic mean greater than the corresponding above basic
mean; only 1 cluster met this criterion for both 2001 (Cluster 7 – adequate LOS: 34%) and 2007 (Cluster 5 - adequate LOS: 46%). Collectively Clusters 5, 7
and 8 in 2011 contained 50 LMs while Cluster 5 in 2007 only contained 6 LMs. This indicates a striking progress of basic LOS between 2007 and 2011.
Clusters 5, 7 and 8 in 2011 largely consisted of LMs from KwaZulu Natal and Eastern Cape. The LMs from North West and Northern Cape, which belonged to
Cluster 5 in 2007 (NW381: Ratlou and NC451: Joe Morolong), belonged to Cluster 5 in 2011. This indicates the similar manner in which these LMs had
progressed, with an increase in basic LOS. KZN 431: Ingwe belonged to Cluster 6 in 2011 (shifted from Cluster 6 in 2001 to Cluster 7 in 2007). Cluster 6 in
2001 and Cluster 7 in 2007, both had meagre means greater than 50%. For Cluster 6 in 2011, the LOS with the greatest mean was above basic, at 44%; this
indicates improvement in Ingwe, with less than 35% of households access meagre LOS.
6 out of 9 clusters had greater than 50% of households had access to adequate services (above basic + basic). This was greater than both the 5 clusters in
2001 and the 4 clusters in 2007, indicating an increased variability of LMs with more than 50% of households that had access to adequate LOS.
Table 8: Final Cluster centres for 2011 Water Supply (in percentages)
1 2 3 4 5 6 7 8 9
Above 89.5 62.7 69.3 43.4 20.4 43.5 19.9 13.1 7.7
Basic 5.5 20.6 10.1 29.3 44.9 13.2 29.7 20.7 7.3
Improved Services
95.0 83.3 79.5 72.7 65.3 56.7 49.6 33.8 15.0
Below 2.6 8.9 6.1 15.8 25.3 8.8 18.9 13.1 8.0
Meagre 2.4 7.7 14.4 11.5 9.4 34.5 31.5 53.1 77.0
Unimproved Services
5.0 16.7 20.5 27.3 34.7 66.0 50.4 66.2 85.0

Univers
ity of
Cap
e Tow
n
August 2013 33
The number of LMs belonging to each cluster was different (Table 9). Almost 60% of the LMs belonging to Clusters 1 and 2; this is up from 50% of LMs in
2001. Clusters 7 and 8, where less than 35% household access to adequate services, consisted of only 13% of the LMs; this is down from 20% in 2001.
Cluster 1 was clearly the most favourable regarding water supply delivery; it had the highest mean for the above basic LOS (89.5%) and low means for the
rest. Cluster 1 included 100% of the LMs in the Free State and Western Cape. Both Gauteng and the Metros had 1 municipality that belonged to Cluster 2,
the rest belonged to Cluster 1. Like in 2001 the LMs, LIM 366: Bela-Bela and NW 403: City of Matlosana, both belonged to Cluster 1 in 2011. Bela-Bela
belonged to Cluster 2 in 2007 and City of Matlosana belonged to Cluster 1, indicating varying progress for City of Matlosana. Cluster 9 was clearly the most
backlogged; it had the highest mean for meagre LOS (77.0%) and the lowest mean for the above basic LOS. Cluster 9 had 2 LMs from the Eastern Cape,
which is less than the 7 LMs that belonged to Cluster 8 in 2007, indicating that some LMs had progressed more than others to not be grouped back into
Cluster 9. Like in 2001, EC 443: Mbizana was found in Cluster 9; Mbizana always belonged to the most backlogged cluster.
The Western Cape and Free State had 100% of their municipalities in Cluster 1 (from Cluster 1 & 2 in 2007). Gauteng and the Metros have 100% of their
municipalities in Clusters 1 and 2, with improved LOS greater than 80% (up from 75% of municipalities). The favourable provinces have thus improved. The
Northern Cape, Mpumalanga and North West had 100% of their municipalities in clusters with improved LOS greater than 50% (up from 94% of
municipalities). This indicates that the moderately favourable provinces improved back to 2001 standards, for Northern Cape and Mpumalanga. North West
made notable improvement to join this group of provinces instead of being grouped with Limpopo. Limpopo and KwaZulu Natal had between 80 and 95% of
their municipalities in clusters with improved LOS greater than 50% (up from between 75% and 80% of municipalities in 2007), indicating improvement;
KwaZulu Natal made notable improvement to be grouped with Limpopo instead Eastern Cape. The Eastern Cape had 65% of its municipalities in clusters
with improved LOS above 50% and 5% of its municipalities (2 LMs) belonged to Cluster 9. Eastern Cape was the most backlogged province.

Univers
ity of
Cap
e Tow
n
August 2013 34
Table 9: Provincial distribution of clusters for 2011
1 2 3 4 5 6 7 8 9
Improved
services 95.0% 83.3% 79.5% 72.7% 65.3% 56.7% 49.6% 33.8% 15.0%
Percentage of
municipalities with
improved services
> 50% < 25% N
FS 19 - - - - - - - - 100 - 19
WC 24 - - - - - - - - 100 - 24
Metros 7 1 - - - - - - - 100 - 8
GT 6 1 - - - - - - - 100 - 7
NC 23 - 2 1 1 - - - - 100 - 27
MP 10 - 7 1 - - - - - 100 - 18
NW 7 5 3 2 2 - - - - 100 - 19
LIM 4 4 4 7 1 3 2 - - 92 - 25
KZN 5 4 7 7 2 15 5 5 - 80 - 50
EC 13 2 1 5 2 1 6 5 2 65 5 37
N 118 17 24 23 8 19 13 10 2 234

Univers
ity of
Cap
e Tow
n
August 2013 35
Cluster Analysis: Sanitation This section presents the results from the cluster analysis for sanitation.
K-Means Clustering
The following tables show the results of the cluster analysis for Census 2001, Community Survey 2007 and Census 2011 for sanitation.
Ten clusters were found for 2001; detailed description of this can be found in Appendix 6.
Three of the ten clusters (1-3) had above basic means greater than 50%, at 81.0%, 62.4% and 54.1% respectively (Table 10); this translates to a prominence
of flush toilets in these LMs. These were also the only clusters that had more than 50% household access to adequate services (above basic + basic).
Western Cape, Gauteng and the Metros made up 63% of the LMs in Cluster 1, 21% of the LMs in Cluster 2 and 6% of the LMs in Cluster 3. The Northern
Cape alone made up 33% of the LMs in Cluster 3. Cluster 2 had municipalities from all provinces, including Buffalo City, LIM 366: Bela-Bela and NW 403: City
of Matlosana.
Three clusters (5, 8 and 9) had below basic means greater than 50%, at 53.6%, 55.5% and 74.0%, respectively. The only provinces that did not have LMs
located in these clusters were Western Cape, Gauteng and Metros. Clusters 5 and 9, particularly, had the below basic means considerably higher than the
corresponding meagre means. LMs in these clusters were largely from the North West, Eastern Cape and KwaZulu Natal. NC451: Joe Morolong belonged to
Cluster 8, while KZN 431: Ingwe and NW381: Ratlou belonged to Cluster 9. The only LMs from Limpopo, which belonged to Cluster 9, were LIM 472: Elias
Motsoaledi and LIM 473: Makhuduthamaga.
Two clusters (6 and 10) had meagre LOS means greater than 50%, at 54.3% and 63.5% respectively; Eastern Cape and KwaZulu Natal made up 47% of LMs in
Cluster 6 and 79% of LMs in Cluster 10. For the other two clusters, no one LOS had a mean greater than 50%, which indicates that no one LOS was
prominent in the relevant LMs. About 50% LMs in these clusters where from KwaZulu Natal, indicating a variety of LOS proportions for these municipalities.
Only two of the ten clusters (7 and 9) have basic LOS which are greater than the corresponding above basic LOS. LMs in this cluster were largely from
KwaZulu Natal and Eastern Cape, indicating a substantial proportion of basic LOS compared to above basic for these LMs.

Univers
ity of
Cap
e Tow
n
August 2013 36
Table 10: Final cluster centres for Census 2001 Sanitation (in percentages)
1 2 3 4 5 6 7 8 9 10
Above 81.0 62.4 54.1 37.8 20.9 30.7 11.1 10.2 6.1 7.9
Basic 2.4 5.2 4.1 9.8 15.9 4.2 12.0 10.6 10.9 7.1
Improved
Services 83.4 67.6 58.2 47.6 36.8 34.9 23.0 20.9 17.0 15.0
Below 4.7 19.9 8.7 34.9 53.6 10.8 36.6 55.5 74.0 21.5
Meagre 11.9 12.5 33.1 17.5 9.6 54.3 40.3 23.7 9.0 63.5
Unimproved
Services 16.6 32.4 41.8 52.4 63.2 65.1 77.0 79.1 83.0 85.0
The number of municipalities belonging to each cluster was different; almost 50% of the LMs belonging to Clusters 1 to 3 (Table 11). Clusters 7 to 10, with
less than 25% household access to adequate services, consisted of only 30% of the LMs.
Cluster 1 was clearly the most favourable regarding sanitation delivery; it had the greatest mean for the above basic LOS (81.0%) and low percentages for
the rest. Municipalities from the Western Cape, Gauteng and the Metros accounted for 63% of LMs in Cluster 1. No LMs from Limpopo were found in
Cluster 1. Cluster 10 was clearly the most backlogged; it had the highest mean for meagre LOS and one of the lowest percentages for the above basic LOS.
More than 50% of LMs in Cluster 10 were from Eastern Cape, including EC 443: Mbizana.
The spatial distribution between clusters was uneven. The Western Cape, Gauteng and the Metros had 100% of their municipalities in Clusters 1 to 3 with
improved LOS greater than 50%; these provinces were greatly favourable. The Northern Cape, Mpumalanga and Free State had between 50% of 90% of
their municipalities in clusters with improved LOS greater than 50%; these provinces were moderately favourable. North West, Eastern Cape, KwaZulu Natal
and Limpopo had between 10% and 30% of their municipalities in clusters with improved LOS greater than 50%. The Eastern Cape, KwaZulu Natal and
Limpopo have more than 50% of their municipalities belonging to Clusters 7 to 10, which have less than 25% of households with improved LOS. Limpopo,
KwaZulu Natal and Eastern Cape were the most backlogged provinces. For Eastern Cape, of the 20 LMs of the located in clusters with less than 25%
household access to adequate LOS, 10 LMs belonged to the Cluster 10 (meagre at 63.5%). Cluster 10 consisted of 19 LMs, 10 of which are from the Eastern
Cape.

Univers
ity of
Cap
e Tow
n
August 2013 37
Table 11: Provincial distribution of clusters for 2001
1 2 3 4 5 6 7 8 9 10
Improved
services 83.4% 67.6% 58.2% 47.6% 36.8% 34.9% 23.0% 20.9% 17.0% 15.0%
Percentage of
municipalities with
improved services
> 50% < 25% N
WC 22 1 1 - - - - - - - 100 - 24
GT 5 2 - - - - - - - - 100 - 7
Metros 4 3 1 - - - - - - - 100 - 7
NC 10 2 11 1 - 1 - 1 - - 88 4 26
MP 2 7 3 1 2 - 1 1 2 - 63 21 19
FS 1 2 7 - 1 5 - - - 3 53 16 19
NW 3 1 1 5 4 2 - - 3 - 26 16 19
EC 1 3 6 1 - 6 5 4 1 10 27 54 37
KZ 1 5 1 10 4 1 11 8 4 5 14 56 50
LIM - 3 2 3 2 - 3 9 2 1 20 60 25
N 49 29 33 21 13 15 20 23 12 19 234
Eight clusters were found for 2007; detailed description of this can be found in Appendix 7.
Two of the eight clusters (Clusters 1 and 2) had above basic means greater than 50%, at 83.7% and 58.3% respectively; 53% of LMs were in Clusters 1 and 2
(Table 12). Two clusters in 2007 were less than the 3 clusters in 2001 (47% of LMs), indicating a reduced variability of LMs with more than 50% household
access to above basic LOS, even though there was an increased number of LMs that met this criterion. 100% of the LMs from Western Cape, Gauteng and
the Metros belonged to Clusters 1 and 2. KwaZulu Natal alone made up 30% of LMs in Cluster 2. LIM 366: Bela-Bela, NW 403: City of Matlosana and Buffalo
City belonged to Cluster 2 in 2001. Buffalo City was the only municipality of the 3 that remained in Cluster 2 in 2007, while Bela-Bela and City of Matlosana
shifted to Cluster 1. This indicates that the Metro did not progress enough to be shifted to Cluster 1, with Bela-Bela and City of Matlosana.
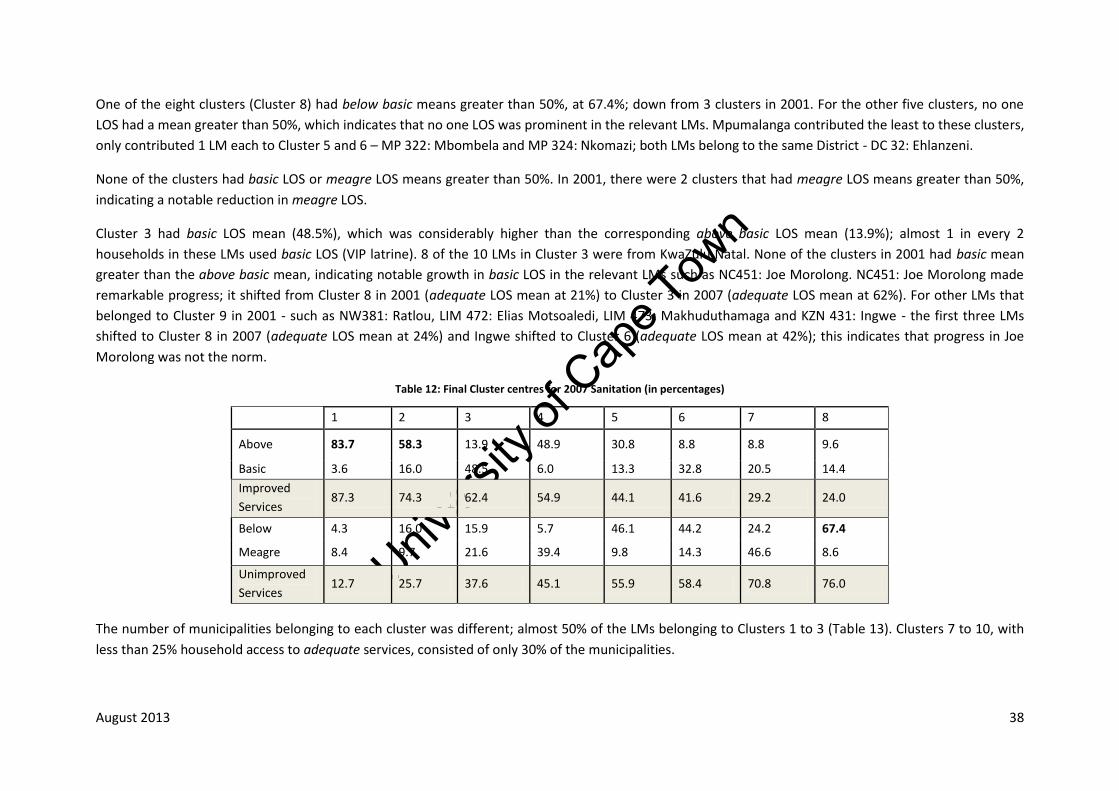
Univers
ity of
Cap
e Tow
n
August 2013 38
One of the eight clusters (Cluster 8) had below basic means greater than 50%, at 67.4%; down from 3 clusters in 2001. For the other five clusters, no one
LOS had a mean greater than 50%, which indicates that no one LOS was prominent in the relevant LMs. Mpumalanga contributed the least to these clusters,
only contributed 1 LM each to Cluster 5 and 6 – MP 322: Mbombela and MP 324: Nkomazi; both LMs belong to the same District - DC 32: Ehlanzeni.
None of the clusters had basic LOS or meagre LOS means greater than 50%. In 2001, there were 2 clusters that had meagre LOS means greater than 50%,
indicating a notable reduction in meagre LOS.
Cluster 3 had basic LOS mean (48.5%), which was considerably higher than the corresponding above basic LOS mean (13.9%); almost 1 in every 2
households in these LMs used basic LOS (VIP latrine). 8 of the 10 LMs in Cluster 3 were from KwaZulu Natal. None of the clusters in 2001 had basic mean
greater than the above basic mean, indicating notable growth in basic LOS in the relevant LMs such as NC451: Joe Morolong. NC451: Joe Morolong made
remarkable progress; it shifted from Cluster 8 in 2001 (adequate LOS mean at 21%) to Cluster 3 in 2007 (adequate LOS mean at 62%). For other LMs that
belonged to Cluster 9 in 2001 - such as NW381: Ratlou, LIM 472: Elias Motsoaledi, LIM 473: Makhuduthamaga and KZN 431: Ingwe - the first three LMs
shifted to Cluster 8 in 2007 (adequate LOS mean at 24%) and Ingwe shifted to Cluster 6 (adequate LOS mean at 42%); this indicates that progress in Joe
Morolong was not the norm.
Table 12: Final Cluster centres for 2007 Sanitation (in percentages)
1 2 3 4 5 6 7 8
Above 83.7 58.3 13.9 48.9 30.8 8.8 8.8 9.6
Basic 3.6 16.0 48.5 6.0 13.3 32.8 20.5 14.4
Improved
Services 87.3 74.3 62.4 54.9 44.1 41.6 29.2 24.0
Below 4.3 16.0 15.9 5.7 46.1 44.2 24.2 67.4
Meagre 8.4 9.7 21.6 39.4 9.8 14.3 46.6 8.6
Unimproved
Services 12.7 25.7 37.6 45.1 55.9 58.4 70.8 76.0
The number of municipalities belonging to each cluster was different; almost 50% of the LMs belonging to Clusters 1 to 3 (Table 13). Clusters 7 to 10, with
less than 25% household access to adequate services, consisted of only 30% of the municipalities.
Univers
ity of
Cap
e Tow
n
August 2013 39
Cluster 1 was clearly the most favourable regarding sanitation delivery; it had the highest mean for the above basic LOS (83.7%) and low means for the rest.
100% of the LMs in the Western Cape, Gauteng and the Metros were in Cluster 1. Cluster 8 was clearly the most backlogged; it had the highest mean for the
below basic LOS and one of the lowest means for the above basic LOS. It contained LMs from Cluster 9 in 2001, were LIM 472: Elias Motsoaledi and LIM
473: Makhuduthamaga. 4 out of 8 clusters had greater than 50% household access to adequate services (above basic + basic).
The Western Cape, Gauteng and the Metros had 100% of their municipalities in clusters with improved LOS greater than 50%. The Northern Cape and Free
State has above 80% of their municipalities in clusters with improved LOS greater than 50%. North West, Eastern Cape, KwaZulu Natal and Mpumalanga had
between 40 and 70% of their municipalities in clusters with improved service greater than 50%. The North West and Mpumalanga also has more than 20%
of their municipalities in Cluster 8. Limpopo had only 24% of its municipalities with improved LOS greater than 50%. The Eastern Cape and KwaZulu Natal
had about 50% of their municipalities with between 25% and 50% household access to improved LOS.

Univers
ity of
Cap
e Tow
n
August 2013 40
Table 13: Provincial distribution of clusters for 2007
1 2 3 4 5 6 7 8
Improved
services 87.3% 74.3% 62.4% 54.9% 44.1% 41.6% 29.2% 24.0%
Percentage of
municipalities with
improved services
> 50% < 25% N
WC 24 - - - - - - - 100 - 24
GT 6 1 - - - - - - 100 - 7
Metros 4 4 - - - - - - 100 - 8
NC 16 7 1 2 1 - - - 96 - 27
FS 8 1 - 7 1 - 2 - 84 - 19
EC 10 3 1 3 2 4 13 1 46 3 37
KZN 1 13 8 - 5 13 6 4 44 8 50
NW 5 4 - 1 3 2 - 4 53 21 19
MP 7 5 - - 1 1 - 4 67 22 18
LIM 2 4 0 0 3 4 1 11
24 44 25
N 83 42 10 13 16 24 22 24 234
Seven clusters were found for 2011; detailed description of this can be found in Appendix 8.
Two of the seven clusters (1 and 3) had above basic LOS means greater than 50%, at 83.9% and 65.3%, respectively (Table 14). One of the seven clusters
had below basic LOS means greater than 50%, at 60.5%. For the other four clusters, no one LOS had a mean greater than 50%, which indicates that no one
LOS was prominent in the relevant LMs. Clusters 4, 6 and 7 had the basic LOS means that were higher than the corresponding above basic means. For
municipalities in these clusters, VIP latrines were more prominent than toilets.

Univers
ity of
Cap
e Tow
n
August 2013 41
Cluster 1 was clearly the most favourable regarding sanitation delivery; it had the highest mean for the above basic LOS (83.9%) and low means for the rest.
Cluster 7 was clearly the most backlogged; it had the highest mean for the below basic LOS and one of the lowest percentages for the above basic LOS. 3
out of 7 clusters had greater than 50% household access to adequate services (above basic + basic).
Table 14: Final Cluster centres for 2011 Sanitation
1 2 3 4 5 6 7
Above 83.9 38.5 65.3 10.2 34.9 10.8 9.6
Basic 2.8 35.4 7.2 37.9 13.1 20.3 19.5
Improved
Services 86.7 73.9 72.5 48.2 48.0 31.0 29.1
Below 4.6 12.2 14.1 36.8 38.0 34.7 60.5
Meagre 8.7 14.0 13.4 15.0 13.1 34.2 10.4
Unimproved
Services 13.3 26.1 27.5 51.8 52.0 69.0 70.9
The Western Cape, Gauteng and the Metros have 100% of their municipalities in clusters with improved LOS greater than 50%; they were the most
favourable provinces. The Northern Cape and Free State had more than 93% of their municipalities in clusters with improved service greater than 50%.
Mpumalanga had 61% of its municipalities in clusters with improved service greater than 50%. North West and the Eastern Cape had between 40% and 50%
of their municipalities in clusters with improved service greater than 50%. KwaZulu Natal and Limpopo had 24% of their municipalities in clusters with
improved service greater than 50%. Mpumalanga, the North West and KwaZulu Natal also had between 15% and 26% of their municipalities belonging to
cluster 7, while Limpopo has 56% of its municipalities belonging to cluster 7. Limpopo was the most backlogged province.

Univers
ity of
Cap
e Tow
n
August 2013 42
Table 15: Provincial distribution of clusters for 2011
1 2 3 4 5 6 7
Improved
services 86.7% 73.9% 72.5% 48.2% 48.0% 31.0% 29.1%
Percentage of
municipalities with
improved services
> 50% < 30% N
WC 23 - 1 - - - - 100 - 24
GT 6 - 1 - - - - 100 - 7
Metros 5 - 3 - - - - 100 - 8
FS 10 1 7 - 1 - - 95 - 19
NC 13 3 9 1 1 - - 93 - 27
MP 6 - 5 2 2 - 3 61 17 18
EC 10 1 5 3 4 11 3 43 8 37
NW 4 1 4 1 4 - 5 47 26 19
KZN 1 2 9 14 8 6 10 24 20 50
LIM 1 1 4 1 3 1 14 24 56 25
N 79 9 48 22 23 18 35 234

Univers
ity of
Cap
e Tow
n
August 2013 43
Combined: The cluster analysis revealed that cluster groupings were different for water supply and
sanitation. The clusters were based on the percentage of households in the municipality with access
to improved services. The fact that access to water supply services was superior to access to
sanitation services is evident.
The greater number of sanitation clusters, in 2001, indicated a greater disparity in terms of access to
sanitation services than water supply services. There were 9 clusters for water supply services for
both 2001 and 2011. There were 10 clusters for sanitation services, which declined to 7 clusters in
2011. The fact that the number of clusters notably declined indicated that municipalities became
more similar in terms of access to improved services.
The municipalities that had access to improved services for greater than 50% of households were
more disparate for water supply services than sanitation services. For water supply, 5 of the 2001
clusters were for municipalities that had more than 50% household access to improved services,
increased to 6 clusters in 2011. For sanitation, 7 of the 2001 clusters were for municipalities that had
less than 50% household access to improved services, which decreased to 4 out of 7 clusters in 2011.
The clusters with the greater access to improved services percentages were more likely to have more
municipalities than clusters with low access to improved services percentages. The number of
municipalities belonging to clusters with access to improved services greater than 50% increased,
indicating that access to improved services increased over time.
Furthermore, the more backlogged the province, the greater the number of clusters that the
municipalities belonged to. This indicated the greater disparity in backlogged provinces compared to
the well-off provinces.
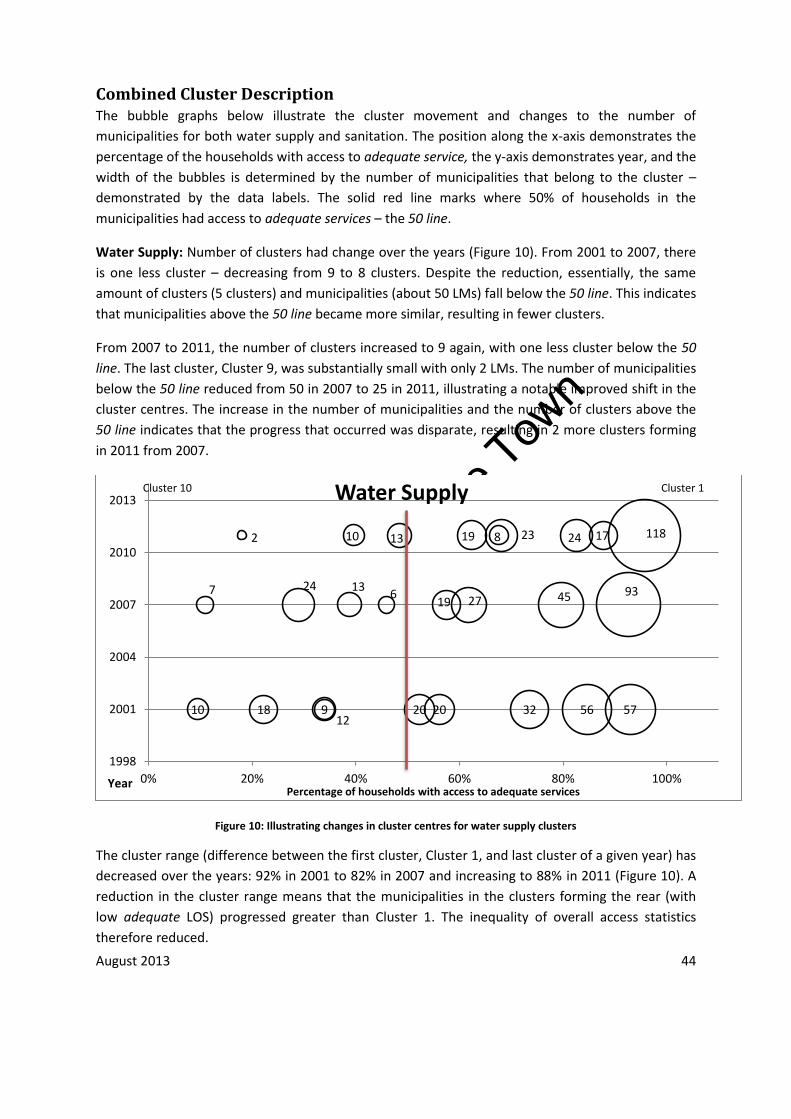
Univers
ity of
Cap
e Tow
n
August 2013 44
Combined Cluster Description The bubble graphs below illustrate the cluster movement and changes to the number of
municipalities for both water supply and sanitation. The position along the x-axis demonstrates the
percentage of the households with access to adequate service, the y-axis demonstrates year, and the
width of the bubbles is determined by the number of municipalities that belong to the cluster –
demonstrated by the data labels. The solid red line marks where 50% of households in the
municipalities had access to adequate services – the 50 line.
Water Supply: Number of clusters had change over the years (Figure 10). From 2001 to 2007, there
is one less cluster – decreasing from 9 to 8 clusters. Despite the reduction, essentially, the same
amount of clusters (5 clusters) and municipalities (about 50 LMs) fall below the 50 line. This indicates
that municipalities above the 50 line became more similar, resulting in fewer clusters.
From 2007 to 2011, the number of clusters increased to 9 again, with one less cluster below the 50
line. The last cluster, Cluster 9, was substantially small with only 2 LMs. The number of municipalities
below the 50 line reduced from 50 in 2007 to 25 in 2011, illustrating a notable improved shift in the
cluster centres. The increase in the number of municipalities and the number of clusters above the
50 line indicates that the progress that occurred was disparate, resulting in 2 more clusters forming
in 2011 from 2007.
Figure 10: Illustrating changes in cluster centres for water supply clusters
The cluster range (difference between the first cluster, Cluster 1, and last cluster of a given year) has
decreased over the years: 92% in 2001 to 82% in 2007 and increasing to 88% in 2011 (Figure 10). A
reduction in the cluster range means that the municipalities in the clusters forming the rear (with
low adequate LOS) progressed greater than Cluster 1. The inequality of overall access statistics
therefore reduced.
57 56 32 20 20 9 12
18 10
93 45 27 19 6
13 24 7
118 17 24 23 8 19 13 10 2
1998
2001
2004
2007
2010
2013
0% 20% 40% 60% 80% 100%Year Percentage of households with access to adequate services
Water Supply Cluster 1 Cluster 10

Univers
ity of
Cap
e Tow
n
August 2013 45
Cluster 9 in 2011 (adequate LOS at 15%), included 2 LMs from the Eastern Cape, EC 153: Ngquza Hill
and EC 443: Mbizana. The adequate LOS for Cluster 8 in 2011 (33.8%), was twice that of Cluster 9.
This substantial gap between cluster centres indicates that Cluster 9 LMs were outliers. Bearing this
in mind, excluding Cluster 9, the reduction in the cluster range was substantial. Between 2001 and
2011, the cluster range decreased by 36%, indicating that the overall inequality in access to
adequate services had declined.
The number of municipalities in Cluster 1 (the rightmost cluster whose centre remains above 90%
household access to adequate LOS) had notably increased, from 57 municipalities in 2001, 93
municipalities in 2007 and 118 municipalities in 2011. Cluster 1 in 2001 had an above basic LOS
greater than 87%, which increased to 90%. This indicates a marginal increase in these municipalities
where a substantial proportion of households accessed above basic LOS.
A few provinces had more than 50% of their municipalities in Cluster 1. Cluster 1 in 2001 consisted of
92% of Western Cape municipalities, between 55% and 60% of municipalities from Gauteng and
Northern Cape, and 3 of the 8 Metros: Cape Town, Ekurhuleni and Johannesburg. Cluster 1 in 2007
consisted of 96% of Western Cape municipalities, 84% of Free State municipalities, 70% of Northern
Cape municipalities, 57% of Gauteng municipalities, and 4 of 8 Metros: the aforementioned metros
plus Nelson Mandela Metro. Cluster 1 in 2011 consisted of 100% of Western Cape and Free State
municipalities, 85% of Gauteng and Northern Cape municipalities, and 7 of 8 Metro: all the metros
except Buffalo City. These provinces increased their proportion of municipalities in Cluster 1. The
municipalities in these provinces became more similar and are tending toward 100% of
municipalities being clustered in Cluster 1.
The municipalities in Cluster 1 had shifted. Over 90% of the municipalities in Cluster 1 in 2001 were
in Cluster 1 in 2007; 95% of these municipalities then were in Cluster 1 in 2011. The rest of the
municipalities shifted to Cluster 2 in 2007 (for example, GT 484: Merafong City) and Cluster 3 in 2011
(for example, EC 106: Sundays River Valley). By and large, municipalities in Cluster 1 tended to
remain in Cluster 1 – indicating similar progress across the board. Of the small number that shifted
to other clusters, the shift was to clusters close to Cluster 1 and with similar LOS proportions: high
adequate LOS (75%) and high above basic LOS (70%).
The number of LMs in the last cluster (the most backlogged) decreased, from 10 in 2001, 7 in 2007
to 2 in 2011. All of the last clusters had meagre LOS greater than 50%. The meagre LOS reduced: 81%
for Cluster 9 in 2001 to 77% for Cluster 9 in 2011; all of which indicated progress made. 100% of the
LMs from Cluster 9 in 2001 were in Clusters 7 and 8 in 2007; 100% of the LMs from Cluster 8 in 2007
were in Clusters 8 and 9 in 2011. The shifting of LMs from the last cluster was to clusters nearby;
either to the last cluster or the one neighbouring it. This, like with Cluster 1, shows similar progress
of LMs in the last cluster; the resultant clusters also had meagre LOS greater than 50%. Additionally,
only Eastern Cape and KwaZulu Natal LMs were found in the last cluster; EC 153: Ngquza Hill and EC
443: Mbizana remained in the last cluster for 2001, 2007 and 2011.
For the central clusters, the shifting of the LMs was more disparate. For example, Cluster 4 in 2001
had an adequate LOS of 56%; the greatest LOS was above basic LOS (34%). 70% of the LMs were

Univers
ity of
Cap
e Tow
n
August 2013 46
from North West and Limpopo, including LIM 331: Greater Giyani, LIM332: Greater Letaba and LIM
333: Greater Tzaneen which are in the Mopani District (DC 33) – a water service provider. 75% of
LMs in Cluster 4 in 2001 were in Cluster 3 in 2007 (adequate LOS at 62%, above basic at 45% and
56% of LMs were from North West and Limpopo). The rest were in Cluster 5 (adequate LOS at 46%
and above basic LOS at 12%) and Cluster 6 (adequate LOS at 39% and above basic LOS at 22%). The
LMs, LIM 331: Greater Giyani, LIM332: Greater Letaba and LIM 333: Greater Tzaneen, were all in
Cluster 3 in 2007. These LMs shifted from 2001 to 2007 together. LIM335: Maruleng, a LM in Mopani
District was also in Cluster 3 in 2007.
56% of LMs in Cluster 3 in 2007 were in Cluster 4 in 2011 (adequate LOS at 73%, above basic LOS at
43% and 35% of LMs were from North West and Limpopo). The rest of the LMs were in Cluster 2
(adequate LOS at 83% and above basic LOS at 63%), Cluster 3 (adequate LOS at 80% and above basic
LOS at 69%) and Cluster 6 (adequate LOS at 57% and above basic LOS at 44%). LIM 333: Greater
Tzaneen was not in Cluster 4 in 2011 like the other LMs from Mopani; it was in Cluster 6. This
illustrates that not all of the LMs went to clusters with adequate LOS greater than the cluster they
belonged to before, indicating a decline in services. This holds true even for LMs in the same district,
such as Mopani.
100% of LMs from Cluster 6 got redistributed to Clusters 4 and 7 in 2007, and 75% of LMs from
Cluster 7 got redistributed to Clusters 5 and 6 in 2007. Despite the fact that Clusters 6 and 7 for 2001
had virtually equal adequate LOS, there were notable differences between these clusters, regarding
LMs and subsequent progress. Clusters 6 and 7 for 2001 had virtually equal adequate LOS means at
34%. The differences between the LOS distributions resulted in there being 2 clusters instead of 1.
Cluster 6 had above basic LOS greater than the basic LOS, while the converse was true for Cluster 7.
100% of LMs in Cluster 6 were from KZN and Eastern Cape, the single LM from the EC was EC 157:
King Sabata Dalindyebo. 67% of LMs in Cluster 7 were from KZN and Eastern Cape. This illustrates
the importance of considering LOS outside of adequate and inadequate LOS.
Cluster 7 in 2001, Cluster 5 in 2007, and Cluster 5, 7 and 8 in 2011 show instances where the basic
LOS was the greater proportion of adequate water supply service. Cluster 7 in 2001 had 12 LMs,
Cluster 5 in 2007 had 6 LMs and Clusters 5, 7 & 8 in 2011 collectively had 31 LMs. These clusters
indicate a persistent growth in basic LOS in the relevant LMs. These clusters had municipalities that
were backlogged; Cluster 5 in 2011 had the largest adequate LOS (65%). A large proportion of LMs in
these clusters were from KwaZulu Natal and Eastern Cape: 67% of LMs for Cluster 7 in 2001, 50% of
LMs for Cluster 5 in 2007, 50% of LMs for Cluster 6 in 2011, 85% of LMs for Cluster 7 in 2011, and
100% of LMs for Cluster 8 in 2011. This indicates the proliferation and increase of basic LOS in
Eastern Cape and KwaZulu Natal.
Only 30% of LMs however, in Cluster 7 in 2001 (basic LOS at 20%) were in Cluster 5 in 2007 (basic
LOS at 34%), including NW 381: Ratlou. 42% of LMs in Cluster 7 in 2001 were in Cluster 6 in 2007,
including EC 441: Matatiele. Cluster 6 in 2007 had above basic LOS greater than basic LOS, indicating
a change in the LOS proportions. 100% of the LMs in Cluster 5 in 2007 were in Cluster 5 in 2011, a
cluster that had basic LOS greater than above basic LOS. This further indicates that the shifting of
Univers
ity of
Cap
e Tow
n
August 2013 47
LMs belonging to central clusters was not predictable; this was true even for the few clusters which
had basic LOS greater than above basic LOS.
The following maps show the spatial aspect of the water supply cluster analysis results for 2001,
2007 and 2011. The green colour scale highlights Group 1 clusters (adequate LOS between 75% and
100%); the brown-orange colour scale highlights Group 2 clusters (adequate LOS between 50% and
75%); the yellow colour scale highlights Group 3 clusters (adequate LOS between 25% and 50%); and
the red colour scale highlights Group 4 clusters (adequate LOS between 0% and 25%).

Univers
ity of
Cap
e Tow
n
August 2013 48
Access to adequate LOS increased from 2001 to 2011; it was however not consistent growth in all provinces.
Figure 11: Water supply cluster analysis maps for 2001, 2007 and 2011
There was clearly a spatial component to access to water supply facilities in South Africa. In 2001, the favourable (in terms of access to adequate services)
Group 1 municipalities were largely located in the western region of South Africa, the Free State and around Gauteng. The only LMs in the Northern Cape that
were not in Group 1 in 2001 were NC 451: Joe Morolong (Group 3) and NC 452: Ga-Segonyana (Group 2); both LMs belong to the same DM, DC 45: John Taolo
Gaetsewe.
Group 2 municipalities were largely concentrated in the Northern region in North West Limpopo and Mpumalanga; the only LM in Limpopo that was in Group
4 was LIM 473: Makhuduthamaga. Group 3 and 4 local municipalities were largely located in the eastern region of South Africa, in the Eastern Cape and

Univers
ity of
Cap
e Tow
n
August 2013 49
KwaZulu Natal. Group 1 municipalities were clearly in the majority for all years; this is verified by the high national average of water supply adequate LOS for
all years.
From 2001 to 2007, Group 1 municipalities spread to the eastern part of Mpumalanga, parts of Limpopo and the North West, and encompassing the entire
Free State. Most of the Group 1 municipalities in 2001 were a darker shade of green in 2007. This indicates growth in adequate LOS in the Northern Cape,
Free State and the western part of Eastern Cape. Joe Morolong and Ga-Segonyana were still not in Group 1 in 2007.
For Group 3 LMs, the LMs were either still in Group 3 or were in Group 2 in 2007; none of these LMs were in Group 4 in 2007. For Group 4 LMs, most of the
LMs were in Group 3 in 2007, indicating growth in adequate LOS. Only 4 LMs in the Eastern Cape (EC 121: Mbhashe, EC 154: Port St Johns, EC 153: Ngquza Hill
and EC 443: Mbizana) and 3 LMs in KwaZulu Natal (KZN 244: Msinga, KZN 294: Maphumulo and KZN 265: Nongoma) were in Group 4 in 2007. Only Port St
Johns and Ngquza Hill belong to the same DM, DC 15: OR Tambo. EC 443: Mbizana, in fact, was a LM in OR Tambo District but was re-demarcated to DC 44:
Alfred Nzo. As such, growth in Group 3 and Group 4 between 2001 and 2007 resulted in the LMs either remaining in the same group or improving.
The change in Group 2 from 2001 to 2007 was different to that of Group 1. A number of LMs in North West, Limpopo, and Eastern Cape that were in Group 2
in 2001 shifted to Group 3 in 2007, indicating a decline in access to adequate LOS. In the eastern part of Mpumalanga, however, most of the Group 2
municipalities in 2001 were in Group 1 in 2007, indicating growth in access to adequate LOS. The only LM in Mpumalanga that was in Group 2 for both 2001
and 2007 was MP 325: Bushbuckridge. This indicates that growth in Group 2 from 2001 to 2007 was less predictable than the other groups, with some decline
in services occurring.
From 2007 to 2011, Group 1 municipalities – similarly for 2001 to 2007 – spread to parts of North West and Mpumalanga, indicating growth. Group 2
municipalities in 2007 were either a darker shade of brown in 2011 or they shifted to Group 1. Growth for Group 2 LMs was evident, unlike for 2001 to 2007
which showed decline in services for some municipalities. Group 3 LMs in 2007 either remained in Group 3 in 2011 – largely in the Eastern Cape and the
western part of KwaZulu Natal - or were in Group 2 in 2011 – largely in North West, Limpopo and the western part of KwaZulu Natal. Growth for Group 3 for
2007 to 2011 was similar to the growth for Group 3 municipalities between 2001 and 2007. The only Group 4 LMs in 2011 were Port St John and Ngquza Hill,
indicating growth similar to that for 2001 to 2007 for both these LMs.

Univers
ity of
Cap
e Tow
n
August 2013 50
Sanitation: Similarly to water supply services, the number of clusters for sanitation services had
changed. There was a constant decline in the number of clusters, decreasing from 10 clusters in
2001, 8 in 2007 to 7 in 2011. This illustrated a decrease in the disparity of the municipalities over the
years.
Additionally, from 2001 to 2007, there was improvement with fewer municipalities and clusters
below the 50 line: from 123 municipalities in 2001 to 86 municipalities in 2007. The reduction in the
number of clusters below the 50 line indicates that these LMs became more similar in terms of
access to improved sanitation services. From 2007 to 2011, however, there was an increase in
municipalities below the 50 line, from 86 municipalities in 2007 to 98 municipalities in 2011. It
should be noted however that Clusters 4 and 5 in 2011 (encompassing 45 LMs together) fell just
below the 50 line, with adequate LOS at 48%.
Figure 12: Illustrating changes in cluster centres for sanitation clusters
The cluster range for sanitation services, similar to water supply, decreased over the years: 68.4% in
2001, 63.3% in 2007, and 57.6% in 2011. A reduction in the cluster range means that the
municipalities in the clusters forming the rear (with low adequate LOS) progressed greater than
Cluster 1; the inequality of overall access statistics thus reduced. The decrease in the cluster range
was not drastic; the decline was just over 10% between 2001 and 2011.
The cluster member of Cluster 1 – whose centre remained between 80%-90% of the households with
access to adequate service – grew from 2001 to 2007 (from 49 to 83 municipalities) before reducing
slightly to 79 LMs in 2011. This indicates a decline in services between 2007 and 2011. Cluster 1 in
2001 had an above basic LOS of 81%. This increased to 84% by 2011, indicating a marginal increase
49 28 33 21
13
15
20
23
12
19
83 42 10 13 16 24
22 24
79 9
48 22 23
18
35
1998
2001
2004
2007
2010
2013
0% 20% 40% 60% 80% 100%Year
Percentage of households with access to adequate services
Sanitation Cluster 1 Cluster 10
Univers
ity of
Cap
e Tow
n
August 2013 51
in these municipalities where a substantial proportion of households accessed above basic LOS. This
is similar to what happened to Cluster 1 for water supply.
A few provinces had more than 50% of their LMs in Cluster 1. Cluster 1 in 2001 consisted of 92% of
Western Cape municipalities, 71% of Gauteng municipalities, and 4 of the 8 metros: Cape Town,
Ekurhuleni, Johannesburg and Nelson Mandela Metro. Cluster 1 in 2007 consisted of 100% of
Western Cape municipalities, 86% of Gauteng municipalities (all except GT483: Westonaria), 59% of
Northern Cape municipalities (up from 38% in 2001), and the 4 aforementioned metros. Cluster 1 in
2011 consisted of 1 less Western Cape municipality (WC011: Matzikama), 86% of Gauteng
municipalities, 53% of Free State municipalities (up from 5% in 2001), and an additional metro:
Tshwane. Northern Cape LMs in Cluster 1 shifted from 59% in 2007 to 48% in 2011. The change in
the proportion of municipalities in these provinces was not consistent. The proportions of all
provinces increased between 2001 and 2007, and not between 2007 and 2011. Between 2007 and
2011, municipalities from the Western Cape and Northern Cape shifted out of Cluster 1.
For sanitation, the below basic LOS declined but remained notably large. In 2001, Cluster 9 had the
largest proportion at 74%. In 2011, Cluster 7 had the largest proportion at 61% and 3 other clusters
had proportions greater than 30%. For water supply in 2011, the greatest below basic LOS is 25%.
Clusters 4 and 5 in 2011 had essentially equivalent adequate LOS (73%). Both clusters had a majority
of the LMs from KwaZulu Natal (64% for Cluster 4 and 35% for Cluster 5); the LOS distribution,
however, was different. The greatest LOS was essentially split for both clusters; Cluster 4 had basic
LOS at 38% and below basic LOS at 37%, and Cluster 5 had above basic LOS at 35% and below basic
LOS at 38%.
For sanitation, above basic LOS dominated the adequate service in 2001, this was similar to water
supply. Meagre LOS, however, only dominated the inadequate service for half of the 10 clusters in
2001. This proportion remained true for 2007 to 2011.
There was a notable decline in meagre LOS in sanitation, with the largest percentage in 2001
belonging to Cluster 10, at 63%, and the largest percentage in 2011 belonging to Cluster 6, at 34%.
Meagre LOS of Cluster 6 in 2011 (consisting of 18 LMs) was lesser than meagre LOS percentages of
the last 3 clusters for water supply in 2011 (together consisting of 25 LMs); the meagre LOS were
each greater than 40%.
Similarly to water supply, the basic LOS notably increased, 0 clusters in 2001, Clusters 3 and 6 in
2007, and Clusters 4, 6 and 7 in 2011 had basic LOS greater than above basic LOS. For Clusters 3 & 6
in 2007 and Cluster 4 in 2011, majority of LMs were from KwaZulu Natal. Clusters 6 and 7 in 2011
had the majority of LMs from Eastern Cape and Limpopo respectively – including the entire DM,
DC47. This indicates a considerable increase in basic LOS provided in these LMs. The growth in basic
LOS in water supply also occurred in KwaZulu Natal and Eastern Cape. Sanitation also showed
growth in Limpopo.

Univers
ity of
Cap
e Tow
n
August 2013 52
The municipalities in Cluster 1 had shifted. 100% of the municipalities in Cluster 1 in 2001 were in
Cluster 1 in 2007; 86% of these municipalities then were in Cluster 1 in 2011. The rest of the
municipalities shifted to Cluster 3 in 2011; none of these 12 municipalities were metros and 5 were
from Northern Cape (such as NC092: Dikgatlong). This indicates that by and large, similarly to water
supply, municipalities in Cluster 1 tended to remain in Cluster 1 – indicating similar progress. Of the
small number that shifted to Cluster 3 in 2011, the shift was to a cluster close to Cluster 1 and with
similar LOS proportions - with high adequate LOS (72%) and with a high above basic LOS (65%).
The number of LMs in the last cluster (most backlogged) increased, from 19 in 2001, 24 in 2007 and
35 in 2011. The adequate LOS for the last cluster had also increased from 15% in 2001, 24% in 2007
and 29% in 2011. The LOS distribution for the last cluster had changed; this was unlike with water
supply. Meagre LOS was greater than 50% (64%) for Cluster 10 in 2001 but not for Cluster 8 in 2007
or Cluster 7 in 2011; the latter pair had below basic LOS greater than 50% (67% and 60%,
respectively). The LMs in the last cluster had also shifted. 68% of LMs, from Cluster 10 in 2001,
shifted to Cluster 7 in 2007 instead of Cluster 8. 9 of these 15 LMs were from the Eastern Cape, such
as EC 132: Tsolwana. 58% of LMs from Clusters 8 and 9 in 2001 were in Cluster 8 in 2007; these
clusters all had similar LOS distributions, with below basic LOS greater than 50%. Additionally, the
greatest shift for Cluster 10 in 2001 were for KZN 271: Umhlabuyalingana and KZN 283:
Ntambanana, which shifted to Cluster 3 in 2007 (adequate LOS at 62%). 92% of LMs, from Cluster 8
in 2007 were in Cluster 7 in 2011. The greatest shift for Cluster 8 in 2007 were for EC441: Matatiele
and MP301: Albert Luthuli, which shifted to Cluster 4 in 2011 (adequate LOS at 48%).
The shifting indicated that improvement of sanitation services was different to water supply
progress. The last cluster for water supply showed both an 8% increase in adequate LOS from 2001
to 2011 and a decrease in the number of LMs. The improvement in sanitation services for the last
cluster was greater than of water supply (increasing by 15%); there was a corresponding increase in
the number of LMs. The last cluster for water supply had, consistently, meagre LOS greater than
50%, while the last sanitation cluster for 2007 and 2011 had below basic LOS greater than 50%. As
such, the LOS proportions for the last cluster were not the same for water supply and sanitation.
The LMs for sanitation tended to remain in clusters with a similar LOS distribution. Since the LOS
distribution for the last cluster does not remain the same between 2001 and 2007, a number of LMs
shifted from Cluster 10 in 2001 to Cluster 7 in 2007 instead of Cluster 8. None of the LMs in Cluster 8
in 2001 were in Cluster 8 in 2007. Sanitation, therefore, showed substantial improvement with
meagre LOS. The 2 clusters 2001, with meagre LOS greater than 50%, were reduced to 0 clusters in
2007.
The shifting of municipalities in the central clusters was more disparate, similar to water supply.
Cluster 4 in 2001 had adequate LOS of 48%; the greatest LOS proportion was essentially split
between above basic and below basic LOS at 38% and 35% respectively. 48% of LMs were from
KwaZulu Natal, including KZN212: Umdoni and KZN216: Hibiscus Coast – both belonging to the same
DM. 62% of LMs in Cluster 4 in 2001 were in Cluster 2 in 2007 (adequate LOS at 74%, above basic
LOS at 58%, and 31% of LMs were from KwaZulu Natal). The rest of the LMs shifted to Cluster 5

Univers
ity of
Cap
e Tow
n
August 2013 53
(adequate LOS at 44%, below basic LOS at 46%) and Cluster 6 in 2007 (adequate LOS at 42%, below
basic LOS at 44%); the 1 LM that shifted to Cluster 6 in 2007 was EC141: Elundini. KZN212 shifted to
Cluster 2 in 2007 and KZN216 shifted to Cluster 5 in 2007, indicating that LMs in the same DM do not
necessarily progress similarly. Note that 3 of the 15 LMs in Cluster 6 in 2001 had notable progress
and shifted to Cluster 1 in 2007: EC104: Makana, EC144: Gariep, and NW 393: Mamusa.
64% of LMs in Cluster 2 in 2007 shifted to Cluster 3 in 2011(adequate LOS at 72%, above basic LOS at
65%, and 20% of LMs were from KwaZulu Natal). The rest of the LMs shifted to Clusters 1, 2, 5 and 6;
KZN212: Umdoni and KZN216: Hibiscus Coast were both in Cluster 5 in 2011.
The following maps show the spatial aspect of the cluster analysis for sanitation for 2001, 2007, and
2011. The green colour scale highlights Group 1 (adequate LOS between 75% and 100%); the brown-
orange colour scale highlights Group 2 (adequate LOS between 50% and 75%); the yellow colour
scale highlights Group 3 (adequate LOS between 25% and 50%); and the red colour scale highlights
Group 4 (adequate LOS between 0% and 25%).

Univers
ity of
Cap
e Tow
n
August 2013 54
Access to adequate LOS increased from 2001 to 2011; it was however not consistent in all provinces.
Figure 13: Sanitation cluster analysis maps for 2001, 2007 and 2011
There was clearly a spatial component to access to sanitation facilities in South Africa. There remained only 1 cluster in Group 1: Cluster 1, indicating that
municipalities that were shifted to Group 1 were similar enough to be grouped to the preceding Group 1 municipalities.
In 2001, the favourable Group 1 municipalities were largely located in the western region of South Africa, with a few located by Gauteng and the northern
region of Northern Cape. No LMs in Limpopo were in Group 1. The North West had 3 LMs, the Eastern Cape and Mpumalanga each had 2 municipalities,
and the Free State and KwaZulu Natal each had 1 municipality. Group 2 was mostly located in Limpopo, with at least 2 LMs from each province. Group 3
LMs were from all provinces except in Western Cape, with a concentration in North West. Group 4 LMs were from all provinces except Western Cape and
Gauteng; and with a concentration in Eastern Cape, KwaZulu Natal and Limpopo. NC 451: Joe Morolong was the only LM in Northern Cape that was in
Group 4.
Univers
ity of
Cap
e Tow
n
August 2013 55
The extensive sanitation backlog was evident, with the greatest number of LMs in Group 4 in 2001.
In 2001, the number of LMs in Group 1 and Group 3 were equal (49 LMs); this was less than the
number of LMs in Group 2 (62 LMs) and in Group 4 (74 LMs). By 2011, however, the absence of red
shows that no LMs belonged to Group 4, indicating substantial progress in LMs in the sanitation
most backlogged clusters.
From 2001 to 2007, Group 1 municipalities spread from the Western Cape to the Northern Cape and
around Gauteng to the Free State. Generally, in these provinces, the Group 2 municipalities in 2001
became Group 1 municipalities in 2007. The number of municipalities in Group 1 was the majority in
2007 (83 LMs); there was growth in this group. The Group 2 municipalities that remained in 2007
were scattered around all provinces except the Western Cape. There was an increase in the number
of Group 3 LMs in Eastern Cape, which were Group 4 LMs in 2001. Sets of Group 3 LMs persisted in
North West, Limpopo and KwaZulu Natal. The number of LMs in Group 4 diminished considerably;
the remaining LMs were largely located in the North – in and around Limpopo. The only Group 4 LMs
were in the Eastern Cape, KwaZulu Natal, North West and Mpumalanga. The only LMs that shifted
from Group 3 LMs in 2001 to Group 4 LMs in 2007 were from the North West, KwaZulu Natal,
Mpumalanga, and Limpopo.
From 2007 to 2011, the number of municipalities in Group 1 spread, encompassing the entire Free
State. Some of the 2007 Group 1 municipalities became Group 2 municipalities in 2011, indicating a
decline in access to adequate LOS in these municipalities. Group 2 municipalities were located in all
provinces except Western Cape. Group 3 LMs were in the majority in 2011 (98 LMs), with the
greatest number of clusters (4 clusters); this was due to no Group 4 LMs in 2011. The Group 4 LMs
were largely found on the outer border – in North West, Limpopo, western Mpumalanga, KwaZulu
Natal and eastern portion of the Eastern Cape.
Combined: For both water supply and sanitation services, there was notable improvement with the
number of LMs below the 50 line reducing, membership in Cluster 1 increasing, and the lowest
clusters improving with their centres shifting to the right. While the number of clusters above the 50
line does not constantly increase, what is evident from the graphs above is that of the number of
clusters above the 50 line, there was an increase in the number of LMs.
The range (distance between the centres of the first and last cluster) was greater for water supply
than sanitation services, 87.8% and 57.6% in 2011 respectively. As such, a greater disparity existed
with water supply services than sanitation services. This disparity was skewed, however, with the
number of municipalities below the 50 line notably less for the water supply than the sanitation
statistics. The 98 municipalities below the 50 line in 2011 for sanitation, was still greater than the 51
municipalities below the 50 line in 2001 for water supply services. While Cluster 9 for water supply in
2011 consisted of 2 LMs, the final cluster for sanitation in 2011 – Cluster 7 – consisted of 35 LMs and
it was the cluster with the third largest membership. As such, there was still a significant number of
LMs with inadequate sanitation service, further illustrating the reality that sanitation services lagged
behind water supply.

Univers
ity of
Cap
e Tow
n
August 2013 56
Cluster 1 was always the cluster with the largest number of municipalities for any given year. For
water supply, Cluster 1 changed from 57 LMs in 2001 - which is 1 municipality greater than the
cluster with the second largest membership - to almost 5 times that of the second largest cluster,
with 118 municipalities in 2011. For sanitation, Cluster 1 changed from 49 municipalities in 2001 –
almost 1.5 times greater than the cluster with the second largest membership – to just over 1.6
times greater with 79 municipalities in 2011.
Group 1 for water supply and sanitation were not the same. For water supply, the number of
clusters increased from 2 to 3 clusters; only Cluster 1 was in Group 1 for sanitation. The number of
municipalities in Group 1 for water supply was in the majority for all years. For sanitation, however,
Group 1 had the majority of LMs for 2007; Group 4 had the majority in 2001 and Group 3 had the
majority in 2011. This indicates that water supply was consistently improving notably even for
favourable municipalities; sanitation growth, however, was less evident between 2007 and 2011.
The last cluster, for water supply, the number of LMs decreased, and last cluster remained in Group
4 in 2011 with 2 LMs from Eastern Cape. The last cluster for sanitation, the number of LMs
increased, and the change in adequate LOS for last cluster much more notable than for water supply
(no Group 4 in 2011). The progress in severely backlogged LMs was greater for sanitation than for
water supply. The decline in meagre LOS for sanitation was enough to shift a large number of LMs in
Cluster 10 in 2001 to Cluster 7 in 2007 (and not Cluster 8). Most municipalities tended to stay in
clusters with the same LOS distribution. The shifting from LMs in the last cluster, for water supply,
was always to the last two clusters; this was not the same for sanitation. This further illustrates that
sanitation progress was more irregular than water supply.
There is clearly a spatial aspect associated with access to adequate services; the LMs that bordered
favourable provinces such as Western Cape and Gauteng showed better access than the rest of the
municipalities in province: the eastern part of the Eastern Cape, eastern Mpumalanga, the western
part of the North West, the southern part of the Northern
Cape, and the Free State.

Univers
ity of
Cap
e Tow
n
August 2013 57
Progress Findings and Analysis Progress statistics were calculated for three periods: 2001-2007, 2007-2011 and 2001-2011 (overall).
The variables were calculated as the change in the percentage of households with access to
adequate services. The figures below illustrate the cluster analysis results of progress variables. The
bubble size and labels show the number of LMs in the cluster.
Water Supply: Clusters had changed over the years (Figure 14). There were 7 clusters for both 2001-
2007 and 2007-2011 periods; 9 clusters for the overall period. This would indicate that the progress
for water supply services overall was much more disparate than for the other time periods.
A large number of the municipalities were found between -5% and 15%: 88% for the 2001-2007
period, 76% for the 2007-2011 period and 63% of the municipalities for the overall period. Also, the
range between the outer cluster centres increased: 57.8% (-8.9% to 48.9%) for 2001-2007, 74.9% (-
18.1% to 56.8%) for 2007-2011 and 87.4% (-18.3% to 69.1%) overall. Further indicating that progress
for the overall period was much more disparate than for the other time periods
The nucleus (or centre of all the clusters in a time period) was largely centred, for all 3 time periods,
near 5% along the x-axis.
Figure 14: Cluster results of Water Supply progress for 2001-2007, 2007-2011 and 2001-2011
Sanitation: Clusters had changed over the years (Figure 15). There were 10 clusters for the 2001-
2007 period, 11 for 2007-2011 period and 7 clusters for the overall period.
A large number of the municipalities can be found between -5% and 25%: 82% for the 2001-2007
period, 63% for the 2007-2011 period and 75% of the municipalities, overall. The range between the
outer cluster centres increased: 67.8% (-21.0% to 46.8%) for 2001-2007, 73.9% (-31.2% to 42.7%) for
2007-2011 and 69.5% (-9.3% to 60.2%) overall.
2
6 20 28 30 39 55 53
1
5 15 34 46 62 71 1
1 1 29 39 83 56 25
1998
2000
2002
2004
2006
2008
2010
2012
2014
-35% -25% -15% -5% 5% 15% 25% 35% 45% 55% 65%Change in percentage of households with adequate access to water supply
Water Supply
2011-2001
2011-2007
2007-2001

Univers
ity of
Cap
e Tow
n
August 2013 58
The different number of clusters and ranges indicated irregular progress for the different time
periods. There was an increase in disparity for the sanitation progress from the 2001-2007 period to
the 2007-2011 period, decreasing for the overall period. The nucleus of the sanitation progress
shifted; centred around 10% for the 2001-2007 and overall periods, and around -2% for the 2007-
2011 period.
Figure 15: Cluster results of Sanitation progress for 2001-2007, 2007-2011 and 2001-2011
Combined: Water supply and sanitation progress graphs showed noticeable differences. The range,
and therefore the general overall variability, was greater for water supply progress than for
sanitation. For sanitation, the number of clusters was greater than for water supply. There were,
however, also a greater number of small clusters - 6 out of 10 clusters for 2001-2007, 6 out of 11
clusters for 2007-2011 and 3 out of 7 clusters overall - with less than 23 municipalities (10% of all
municipalities). These small clusters were also found on the periphery; outside of -5% to 25% on the
x-axis. This indicates that there was a greater variety in sanitation progress in these peripheral
values.
The differences in cluster nuclei show that the progress between water supply and sanitation had
been dissimilar. For water supply, the cluster nucleus for all 3 time periods was around 5%. For
sanitation, the cluster nucleus varies: around 11% for 2001-2007 and 2001-2011, and around -2% for
2007-2011. This indicates that sanitation progress, generally, was greater than water supply for
2001-2007 and overall; for the 2007-2011 period, however, water supply progress was greater than
sanitation.
The dip in sanitation access for the 2007-2011 period is evident; such a notable dip was not found
with the water supply. Thus, highlighting and reinforcing the point that sanitation services lagged
behind that of water supply.
2
15 33 51 67 58
8
1 3 7 20 31 41 56 38 25 8 4
7 11 14 35 40 44 50
23 9 1
1998
2000
2002
2004
2006
2008
2010
2012
2014
-35% -25% -15% -5% 5% 15% 25% 35% 45% 55% 65%Change in percentage of households with adequate access to sanitation
Sanitation
2011-2001
2011-2007
2007-2001

Univers
ity of
Cap
e Tow
n
August 2013 59
The following maps show the progress statistics spatially. The brown-orange colour scale shows municipalities with progress greater than 10%; the neutral
(beige-sand) colour scale shows municipalities with progress between 10% and 0% and the blue colour scale shows municipalities with progress less than
0%
Water Supply: The water supply progress was not been consistent for the 3 time periods (Figure 16).
Figure 16: Water supply progress maps from cluster analysis: 2001-2007, 2007-2011 & 2001-2011
Negative progress was found for 35% of municipalities for 2001-2007. For the other time periods, only one LM was highlighted in blue: Mtubatuba LM,
which is part of the Umkhanyakude District in KZN; progress after the 2001-2007 period was positive across the board.
For 2001-2007, municipalities with negative progress were found largely in 3 regions: in the North – in the North West, Limpopo and Gauteng; the West – in
the Northern Cape and upper border of the Western Cape; and along the eastern border of KwaZulu Natal. The rest of the country, generally, displayed
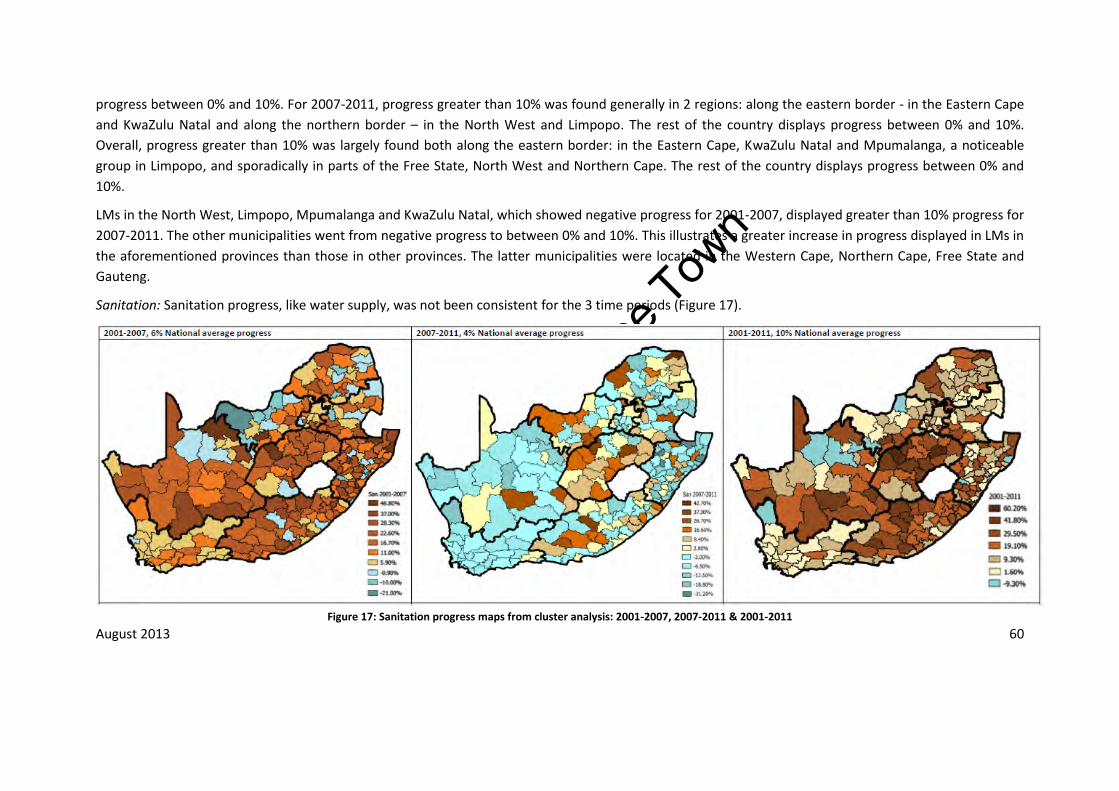
Univers
ity of
Cap
e Tow
n
August 2013 60
progress between 0% and 10%. For 2007-2011, progress greater than 10% was found generally in 2 regions: along the eastern border - in the Eastern Cape
and KwaZulu Natal and along the northern border – in the North West and Limpopo. The rest of the country displays progress between 0% and 10%.
Overall, progress greater than 10% was largely found both along the eastern border: in the Eastern Cape, KwaZulu Natal and Mpumalanga, a noticeable
group in Limpopo, and sporadically in parts of the Free State, North West and Northern Cape. The rest of the country displays progress between 0% and
10%.
LMs in the North West, Limpopo, Mpumalanga and KwaZulu Natal, which showed negative progress for 2001-2007, displayed greater than 10% progress for
2007-2011. The other municipalities went from negative progress to between 0% and 10%. This illustrates a greater increase in progress displayed in LMs in
the aforementioned provinces than those in other provinces. The latter municipalities were located in the Western Cape, Northern Cape, Free State and
Gauteng.
Sanitation: Sanitation progress, like water supply, was not been consistent for the 3 time periods (Figure 17).
Figure 17: Sanitation progress maps from cluster analysis: 2001-2007, 2007-2011 & 2001-2011

Univers
ity of
Cap
e Tow
n
August 2013 61
Negative progress was found for a number of municipalities for 2007-2011; 56% of municipalities belonged to clusters with negative progress. For the other
time periods, the progress was notably more positive. For 2001-2007, 75% of municipalities displayed progress greater than 10%. Overall (2001-2011) 3% of
municipalities displayed negative progress, while 44% displayed greater than 10% progress.
For 2001-2007, the municipalities that displayed greater than 10% progress were largely located centrally; the majority of municipalities were from the Free
State, Eastern Cape, KwaZulu Natal and the Northern Cape. Limpopo and Mpumalanga each had about half of the municipalities with greater than 10%
progress. The Western Cape, North West, and Gauteng had few, sporadic occurrences of municipalities with greater than 10% progress. For 2007-2011, half
of the LMs from Limpopo, Mpumalanga and the Eastern Cape displayed negative progress. The Free State and North West - centrally located provinces -
displayed a minority of LMs with negative progress; the rest of the provinces – Western Cape, Northern Cape, KZN and Gauteng – displayed a majority of
LMs with negative progress. For 2001-2011, greater than 10% progress was largely found in the Free State, Northern Cape and Eastern Cape; the rest of the
provinces displayed a minority of LMs with negative progress.
Combined: Comparing water supply progress maps to the sanitation progress maps revealed notable differences. Similarities exist between the water
supply 2001-2007 and sanitation 2007-2011 maps and the water supply 2007-2011 and sanitation 2001-2007 maps.
For the former set of maps - water supply 2001-2007 and sanitation 2007-2011 - a large number of municipalities displayed negative progress. The number
of municipalities with negative sanitation progress was much greater than for water supply: 56% versus 35%. Another commonality between the maps is
that the Free State and North West do not display a majority of LMs with negative progress. This indicates firstly, that the poor service delivery period -
marked by a large number of municipalities with negative progress - was much worse for sanitation than for water supply; secondly, that the negative
progress for water supply and sanitation did not affect a large majority of municipalities in the Free State and the North West; and thirdly, that the poor
service delivery periods for water supply and sanitation did not occur concurrently.
For the latter set of maps- water supply 2007-2011 and sanitation 2001-2007 – the main commonality was absence of municipalities that displayed negative
progress; 1 LM with negative progress for water supply and 9 LMs for sanitation. The number of municipalities with greater than 10% progress for
sanitation far outweighed that for water supply: 75% versus 43%. The municipalities with greater than 10% progress were found to be commonly located,
for both water supply and sanitation, only in KZN and the Eastern Cape. The other regions, which displayed a high number of municipalities with greater
than 10% progress for the one service: North West and Limpopo for water supply, and Northern Cape and Free State for sanitation, were generally
Univers
ity of
Cap
e Tow
n
August 2013 62
municipalities with 0% to 10% progress for the other service. This indicates firstly, that the good service delivery period - marked by a large number of LMs
with greater than 10% progress- was much better for sanitation than water supply; secondly, that only the Eastern Cape and KwaZulu Natal displayed
greater than 10% progress for a large number of the LMs for both services and thirdly, that the good service delivery periods for water supply and
sanitation did not occur concurrently.
Comparing the overall maps (2001-2011) commonalities exist for both services. Firstly, the majority of municipalities displayed positive progress; secondly,
Mtubatuba LM which is part of the Umkhanyakude District in KwaZulu Natal had seen a decline in progress; thirdly, the majority of LMs in the Western
Cape and Gauteng both displayed between 0% and 10% progress; and finally, the majority of LMs in the Eastern Cape displayed greater than 10% progress.
The progress displayed in municipalities for the Northern Cape, Free State, North West, Mpumalanga and Limpopo – five of the nine provinces - was
generally contradictory; greater than 10% progress in for the one service was usually 0% to 10% progress for the other service. The overall maps, despite
being largely beige-brown in colour, essentially look the inverse of one another; only the Eastern Cape and Mtubatuba LM in KwaZulu Natal displaying
similar progress for both water supply and sanitation.
Correlation The following scatterplots show the overall national pattern of progress made and previous access for the municipalities in the various provinces.
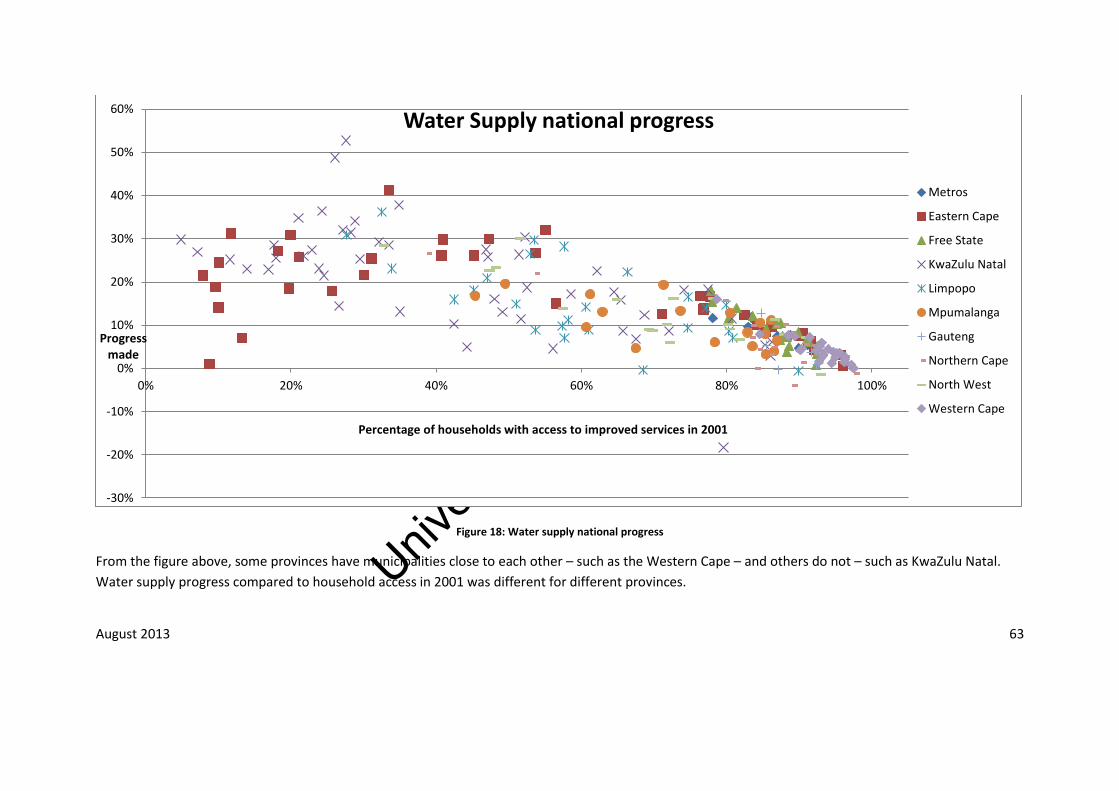
Univers
ity of
Cap
e Tow
n
August 2013 63
Figure 18: Water supply national progress
From the figure above, some provinces have municipalities close to each other – such as the Western Cape – and others do not – such as KwaZulu Natal.
Water supply progress compared to household access in 2001 was different for different provinces.
-30%
-20%
-10%
0%
10%
20%
30%
40%
50%
60%
0% 20% 40% 60% 80% 100%
Progress made
Percentage of households with access to improved services in 2001
Water Supply national progress
Metros
Eastern Cape
Free State
KwaZulu Natal
Limpopo
Mpumalanga
Gauteng
Northern Cape
North West
Western Cape
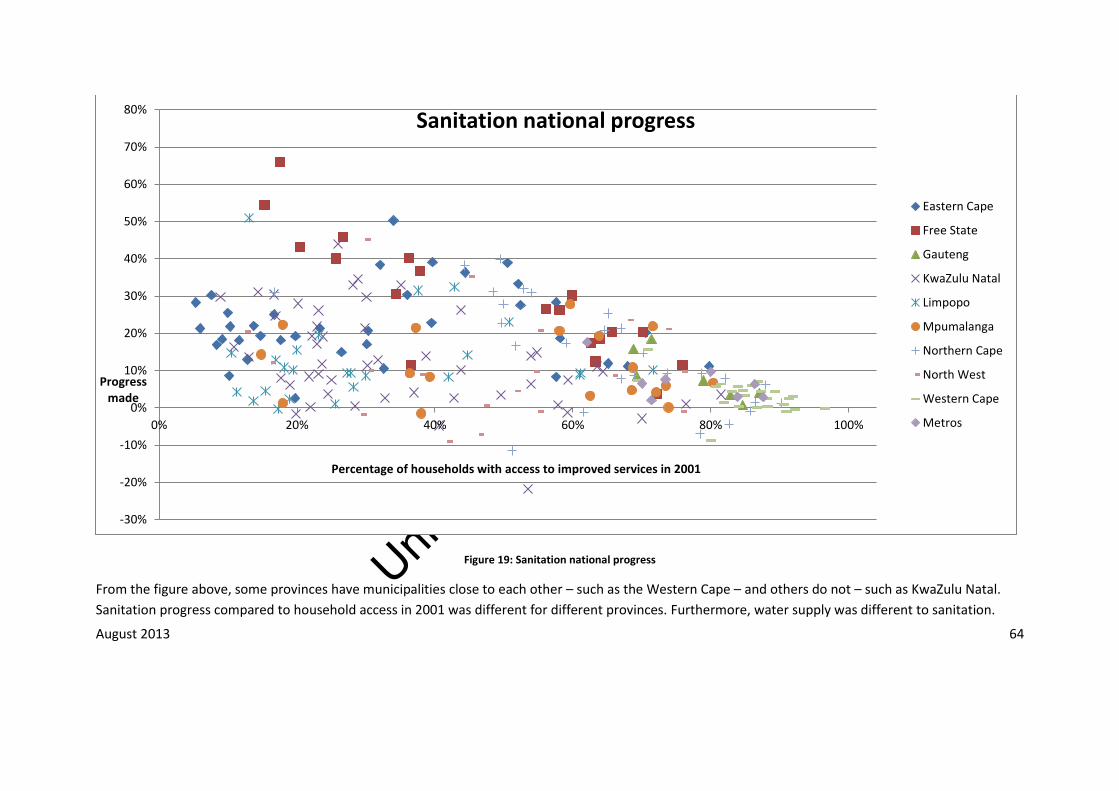
Univers
ity of
Cap
e Tow
n
August 2013 64
Figure 19: Sanitation national progress
From the figure above, some provinces have municipalities close to each other – such as the Western Cape – and others do not – such as KwaZulu Natal.
Sanitation progress compared to household access in 2001 was different for different provinces. Furthermore, water supply was different to sanitation.
-30%
-20%
-10%
0%
10%
20%
30%
40%
50%
60%
70%
80%
0% 20% 40% 60% 80% 100%
Progress made
Percentage of households with access to improved services in 2001
Sanitation national progress
Eastern Cape
Free State
Gauteng
KwaZulu Natal
Limpopo
Mpumalanga
Northern Cape
North West
Western Cape
Metros

Univers
ity of
Cap
e Tow
n
August 2013 65
A two-tailed Pearson product-moment correlation test was run to determine if a correlation exists between progress made and previous access for the
municipalities in the various provinces. The Figures (20, 21 & 22) below show the scatterplots of the various provinces for water supply. The x-axis
represents the percentage of households that had access to adequate services in 2001; the y-axis represents the progress made – change in the percentage
of households with adequate access - from 2001 to 2011. r represents the correlation coefficient, p the statistical significance or probability and n the
sample size (in this case: the number of municipalities in the province).
Water Supply: For the provinces and the metros below, all the municipalities had more than 50% household access to adequate water supply services in
2001, and the range of progress was between -1% and 20% (Figure 20). All cases, except Gauteng, showed a very strong, significant, negative correlation
between household access in 2001 and progress made (r is between -0.9 and -0.93, p < 0.01). For Gauteng, the probability is greater than 0.05 – indicating
that the probability of the results occurring by chance are greater than 5% - therefore r is not statistically significant and a linear relationship between the
variables cannot be established.
Figure 20: Scatterplot and Pearson correlation results of previously favourable provinces for Water Supply
The provinces below all had a few municipalities with less than 50% household access to adequate water supply services in 2001, and the range of the
progress was between -5% and 35% (Figure 21). Northern Cape and North West showed a strong, significant, negative correlation between household
access in 2001 to progress made (r is between -0.85 and -0.88, p < 0.01).For Mpumalanga, the significant correlation was moderate (r = -0.675, p < 0.01).
-5%
5%
15%
25%
0% 50% 100%
Metros
r: -0.922 p: 0.001 n: 8
-5%
5%
15%
25%
0% 50% 100%
Gauteng
r: -0.590 p: 0.163 n: 7
-5%
5%
15%
25%
0% 50% 100%
Western Cape
-5%
5%
15%
25%
0% 50% 100%
Free State
r: -0.906 p: 0.000 n: 19
r: -0.916 p: 0.000 n: 24

Univers
ity of
Cap
e Tow
n
August 2013 66
Figure 21: Scatterplot and Pearson correlation results of previously backlogged provinces for Water Supply
The provinces below all had a large number of municipalities with less than 50% household access to adequate water supply services in 2001, and the range
of the progress was between -20% and 60% (Figure 22). The correlation that the provinces in this group was significant and moderate (r is between -0.54
and -0.68, p < 0.01).
Figure 22: Scatterplot and Pearson correlation results of previously greatly backlogged provinces for Water Supply
-5%
15%
35%
0% 50% 100%
Northern Cape
r: -0.871 p: 0.000 n: 27
-5%
15%
35%
0% 50% 100%
North West
r: -0.856 p: 0.000 n: 19
-5%
15%
35%
0% 50% 100%
Mpumalanga
r: -0.675 p: 0.002 n: 18
-20%
0%
20%
40%
60%
0% 50% 100%
Eastern Cape
r: -0.546 p: 0.000 n: 37
-20%
0%
20%
40%
60%
0% 50% 100%
KwaZulu Natal r: -0.667 p: 0.000 n: 50
-20%
0%
20%
40%
60%
0% 50% 100%
Limpopo r: -0.672 p: 0.000 n: 25
Univers
ity of
Cap
e Tow
n
August 2013 67
The correlation coefficients were negative indicating that, within the provinces, municipalities that had a smaller percentage of households with access to
adequate services in 2001 experienced more progress than the municipalities with a higher percentage. Gauteng was the only province where the results
were not statistically significant.
4 out of 9 provinces showed a strong negative correlation between household access in 2001 and progress made. The Western Cape and Free State showed
a stronger correlation than the Northern Cape and the North West. The former pair of provinces had no municipalities with less than 50% household access
to adequate services; the latter pair had a few municipalities with less than 50% household access to adequate services. Metros also showed a very strong,
negative correlation between household access in 2001 and progress made, and had no municipalities with less than 50% household access to adequate
services. This would indicate that previously favourable provinces showed a strong negative correlation between household access in 2001 and progress
made; provinces, where there were no municipalities with less than 50% household access to adequate services, showed the strongest correlation. These
provinces also showed the smallest progress range when compared to other provinces. Mpumalanga showed a moderate correlation, akin to greatly
backlogged provinces.
3 provinces, out of the 5 provinces that did not show a strong correlation, had a large number of municipalities with less than 50% household access to
adequate services: namely, Eastern Cape, KwaZulu Natal and Limpopo (r is between -0.54 and 0.68, p < 0.001). This would indicate that provinces that were
previously, notably backlogged did not show a strong correlation between household access in 2001 and progress made. The progress range for these
provinces is much larger than the other provinces, indicating that the progress has been made in these municipalities outweighed those in other provinces,
in some cases.
The Eastern Cape was the only case where the trend in the scatterplot resembles an inverse parabola; the other scatterplots more or less resembled a
straight line. The inverse parabola shows that there was no linear relationship between household access in 2001 and progress made. In essence, there are
municipalities in Eastern Cape where large backlogs that existed in 2001 are still present due to the lack of prominent progress. A number of LMs
outperformed LMs with lower percentage of household access to adequate service. One would assume that these previously backlogged LMs would have
been targeted with the aim of ensuring progress. The lack of progress highlights that the water supply service delivery in some LMs in the Eastern Cape
should be of concern. KwaZulu Natal data did not resemble a parabola, despite having more LMs with less than 50% household access to adequate services
than the Eastern Cape, indicating that the water supply service delivery in KwaZulu Natal performed better than the Eastern Cape.

Univers
ity of
Cap
e Tow
n
August 2013 68
Sanitation: The Figures below (23, 24 & 25) show provincial scatterplots of progress made and percentage of household access to adequate sanitation in
2001, and the results of the two-tailed Pearson correlation test.
For the provinces and the metros below, all the municipalities had greater than 50% household access to adequate sanitation services in 2001; the range of
progress was between -10% and 20% (Figure 23). The results for the Gauteng and Western Cape were significant with p < 0.05. Gauteng only has 7 LMs and
thus Gauteng’s results needed to be compared to the critical values table (Appendix 1) to determine if the results were significant for the small sample size.
The critical value for n = 7 at a p= 0.05 is r = 0.754; the magnitude of r for Gauteng was greater than the critical value as such, Gauteng showed a strong,
negative correlation (r = -0.835, p < 0.05, n =7). The correlation found for the Western Cape was weak (r = 0.487, p < 0.05, n = 24). The results for Metros
were not significant (p > 0.05); there was no linear relationship between progress and percentage of household access to adequate sanitation in 2001.
Figure 23: Scatterplot and Pearson correlation results of previously favourable provinces for Sanitation
The provinces below all have less than 50% of their municipalities with less than 50% household access to adequate sanitation services in 2001; the range of
the progress for the Free State was between 0% and 65%, while the rest was between -15% and 35% (Figure 24). Northern Cape and Free State produced
significant results (p < 0.01), while North West and Mpumalanga’s results were non-significant (p > 0.05). The Free State showed a strong, negative
correlation (r = -0.851, p < 0.01, n = 19), and the Northern Cape showed a moderate, negative relationship (r = -0.677, p < 0.01, n = 27).
-10.0%
0.0%
10.0%
20.0%
0.0% 50.0% 100.0%
Metros
r: - 0.621 p: 0.100 n: 8
-10.0%
0.0%
10.0%
20.0%
0.0% 50.0% 100.0%
Gauteng
-10.0%
0.0%
10.0%
20.0%
0.0% 50.0% 100.0%
Western Cape
r: -0.487 p: 0.016 n: 24
r: - 0.835 p: 0.019 n: 7

Univers
ity of
Cap
e Tow
n
August 2013 69
Figure 24: Scatterplot and Pearson correlation results of previously backlogged provinces for Sanitation
The provinces below all have more than 50% of municipalities with less than 50% household access to adequate sanitation services in 2001; the range of the
progress was between -25% and 55% (Figure 25). The results for KwaZulu Natal were significant (p < 0.01), while Eastern Cape and Limpopo’s results were
non-significant (p > 0.05). KwaZulu Natal showed a weak negative correlation (r = -0.456, p < 0.01, n = 50).
Figure 25: Scatterplot and Pearson correlation results of previously greatly backlogged provinces for Sanitation
-15.0%
5.0%
25.0%
45.0%
0.0% 50.0% 100.0%
Northern Cape r: - 0.677 p: 0.000 n: 27
-15.0%
5.0%
25.0%
45.0%
0.0% 50.0% 100.0%
North West
-15.0%
5.0%
25.0%
45.0%
0.0% 50.0% 100.0%
Mpumalanga
-15.0%
5.0%
25.0%
45.0%
65.0%
0.0% 50.0% 100.0%
Free State
-25.0%
-5.0%
15.0%
35.0%
55.0%
0.0% 50.0% 100.0%
Eastern Cape
-25.0%
-5.0%
15.0%
35.0%
55.0%
0.0% 50.0% 100.0%
KwaZulu Natal
-25.0%
-5.0%
15.0%
35.0%
55.0%
0.0% 50.0% 100.0%
Limpopo
r: - 0.120 p: 0.624 n: 19
r: - 0120 p: 0.636 n: 18
r: - 0.851 p: 0.000 n: 19
r: 0.023 p: 0.891 n: 37
r: - 0.456 p: 0.001 n: 50
r: 0.076 p: 0.717 n: 25

Univers
ity of
Cap
e Tow
n
August 2013 70
4 out of the 9 provinces – North West, Mpumalanga, Eastern Cape and Limpopo - and the Metros
produced non-significant results, illustrating the absence of a linear relationship between progress
made and percentage of households with adequate sanitation services in 2001. The lack of a
noticeable trend in the scatterplots of these provinces supports this notion.
Of the 5 provinces with significant results, only 2: Gauteng and Free State, showed a strong negative
correlation (r between -0.83 and -0.86); the probability of the former at a 95% level and the latter at
a 99% level. Free State showed the strongest negative correlation, with the greatest value for r and
significance at a 99% level. Free State belonged to the previously backlogged provinces while
Gauteng belonged to the previously favourable provinces. The Northern Cape, which belonged to
the previously backlogged provinces, showed a moderate correlation (r = -0.677) at a 99% level.
Western Cape and KwaZulu Natal showed a weak correlation (r between -0.45 and -0.49) at a 95%
and 99% level respectively; the former belonged to the previously favourable provinces and the
latter to the previously greatly, backlogged provinces. This indicates that the strength of the
correlation was not dependent on the whether or not province was previously favourable or
backlogged.
Combined: More provinces showed a correlation between progress made and prior access to
adequate services for water supply than for sanitation. Sanitation had 4 of the 9 provinces and the
Metros that showed non-significant results; water supply had 1 province - Gauteng.
The only provinces that showed similar correlations for water supply and sanitation were Northern
Cape, KwaZulu Natal and Free State. The strength of the correlation for sanitation was also less than
water supply. For sanitation, the strength of correlation ranged from weak to strong; for water
supply, the strength of correlation ranged from moderate to very strong.
Northern Cape showed a strong correlation for water supply and a moderate correlation for
sanitation. KwaZulu Natal showed a moderate correlation for water supply and a weak correlation
for sanitation. Free State showed a very strong correlation for water supply and only a strong
correlation for sanitation. With the exception of the Free State, for water supply only, none of these
provinces belong to the favourable provinces for water supply or sanitation. This would indicate
that, for the backlogged provinces, service provision to eradicate previous backlog was achieved.
The lesser the backlog however, the greater the correlation appears to be, with water supply always
displaying a stronger correlation than sanitation. In terms of progress made water supply service
delivery was better than sanitation.
The progress made within municipalities in the provinces was seldom the same for both services.
Inconsistencies existed between water supply and sanitation. Gauteng showed a strong correlation
for sanitation but was the only province that showed non-significant results for water supply.
Western Cape showed a weak correlation for sanitation but a very strong correlation for water
supply. This would allude to a contradiction in service delivery between water supply and sanitation
for the two provinces.
The table below illustrates descriptive statistics of the provinces based on progress made (household
access to adequate service in 2011-2001) of the municipalities in the provinces and metros.
Minimum defined as the minimum progress value for the municipalities in a particular province.
Maximum is defined similarly. Note: the Average is the average progress of the municipalities in the
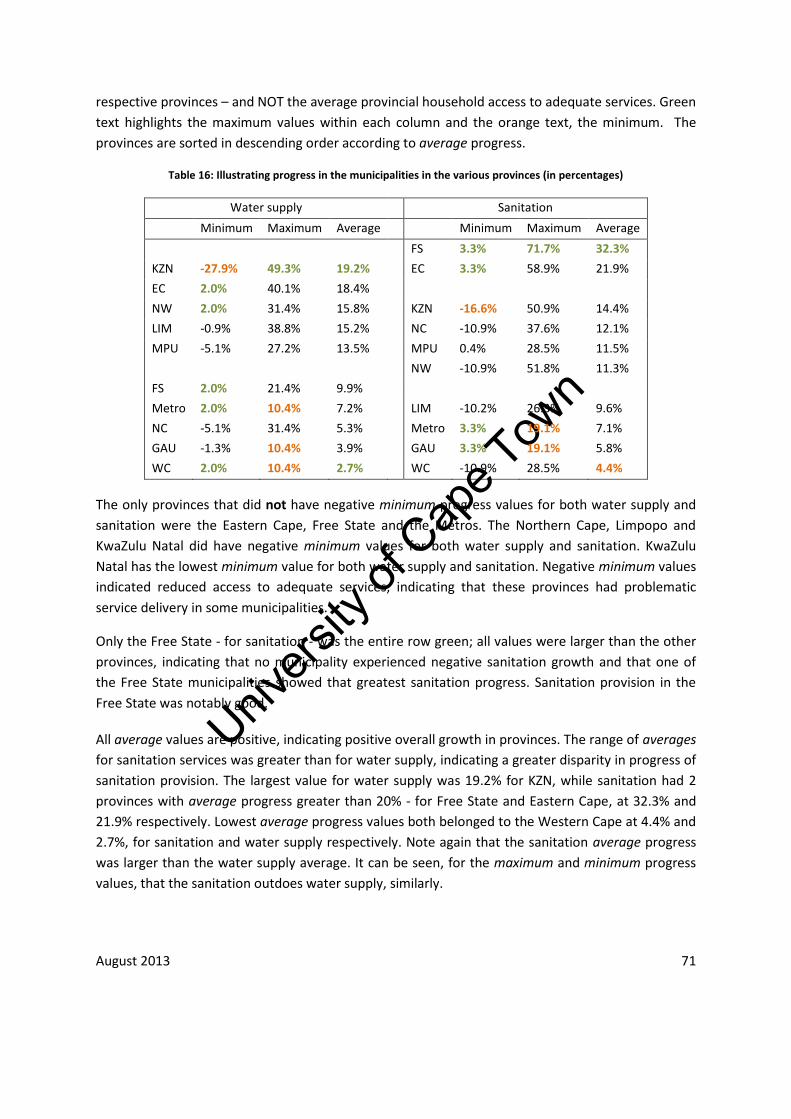
Univers
ity of
Cap
e Tow
n
August 2013 71
respective provinces – and NOT the average provincial household access to adequate services. Green
text highlights the maximum values within each column and the orange text, the minimum. The
provinces are sorted in descending order according to average progress.
Table 16: Illustrating progress in the municipalities in the various provinces (in percentages)
Water supply Sanitation
Minimum Maximum Average
Minimum Maximum Average
FS 3.3% 71.7% 32.3%
KZN -27.9% 49.3% 19.2%
EC 3.3% 58.9% 21.9%
EC 2.0% 40.1% 18.4%
NW 2.0% 31.4% 15.8%
KZN -16.6% 50.9% 14.4%
LIM -0.9% 38.8% 15.2%
NC -10.9% 37.6% 12.1%
MPU -5.1% 27.2% 13.5%
MPU 0.4% 28.5% 11.5%
NW -10.9% 51.8% 11.3%
FS 2.0% 21.4% 9.9%
Metro 2.0% 10.4% 7.2% LIM -10.2% 26.3% 9.6%
NC -5.1% 31.4% 5.3%
Metro 3.3% 19.1% 7.1%
GAU -1.3% 10.4% 3.9%
GAU 3.3% 19.1% 5.8%
WC 2.0% 10.4% 2.7%
WC -10.9% 28.5% 4.4%
The only provinces that did not have negative minimum progress values for both water supply and
sanitation were the Eastern Cape, Free State and the Metros. The Northern Cape, Limpopo and
KwaZulu Natal did have negative minimum values for both water supply and sanitation. KwaZulu
Natal has the lowest minimum value for both water supply and sanitation. Negative minimum values
indicated reduced access to adequate services, indicating that these provinces had problematic
service delivery in some municipalities.
Only the Free State - for sanitation - was the entire row green; all values were larger than the other
provinces, indicating that no municipality experienced negative sanitation growth and that one of
the Free State municipalities showed that greatest sanitation progress. Sanitation provision in the
Free State was notably good.
All average values are positive, indicating positive overall growth in provinces. The range of averages
for sanitation services was greater than for water supply, indicating a greater disparity in progress of
sanitation provision. The largest value for water supply was 19.2% for KZN, while sanitation had 2
provinces with average progress greater than 20% - for Free State and Eastern Cape, at 32.3% and
21.9% respectively. Lowest average progress values both belonged to the Western Cape at 4.4% and
2.7%, for sanitation and water supply respectively. Note again that the sanitation average progress
was larger than the water supply average. It can be seen, for the maximum and minimum progress
values, that the sanitation outdoes water supply, similarly.

Univers
ity of
Cap
e Tow
n
August 2013 72
Discussion
Analysis of the findings revealed that water supply and sanitation services had indeed improved; the
improvement was disparate; water supply and sanitation services had improved differently; and
more provinces showed a negative correlation between progress made (from 2001 to 2011) and
access to improved services in 2001, for water supply than for sanitation.
Growth in the number of municipalities that belonged to clusters that had greater than 50%
household access to both water supply and sanitation adequate services, showed there was an
improvement in services. The decline in the number of clusters, especially for sanitation, and the
decline in the cluster range between the first and last cluster, indicated that the overall municipal
disparity regarding access to services had reduced.
The presence of Cluster 9 in 2011 for water supply, containing Ngquza Hill (from OR Tambo District)
and Mbizana (from Alfred Nzo District), did however, reveal that outliers persist. Looking at the
cluster movement of the other municipalities in OR Tambo District and Alfred Nzo District (Table 17),
it is revealed that there was progress in Ngquza Hill and Mbizana despite being most backlogged in
2011. Ngquza Hill and Mbizana did not progress as substantially as the other municipalities in the
district; this is despite other municipalities belonging to the same cluster in 2001. This indicates
disparity in services, which occurred even for municipalities within the same district.
Table 17: Municipal movement of OR Tambo and Alfred Nzo municipalities
For water supply in 2011, the provinces could be grouped into the following categories - based on
the amount of municipalities that belonged to clusters with a great improved LOS:
Greatly favourable: Free State, Western Cape, Gauteng and Metros
Moderately favourable: Northern Cape, Mpumalanga and North West
Moderately backlogged: Limpopo and KwaZulu Natal
O.R.Tambo District Municipality
Municipal category C2
2001 2011 Change in adequate LOS 2011 – 2001
EC153 Ngquza Hill B4 9 9 9%
EC154 Port St Johns B4 9 8 30%
EC155 Nyandeni B4 9 8 30%
EC156 Mhlontlo B4 8 7 26%
EC157 King Sabata Dalindyebo B2 6 6 28%
Alfred Nzo District Municipality C2
EC441 Matatiele B3 8 7 26%
EC442 Umzimvubu B4 8 7 26%
EC443 Mbizana B4 9 9 9%
EC444 Ntabankulu B4 9 8 30%

Univers
ity of
Cap
e Tow
n
August 2013 73
Severely backlogged: Eastern Cape
For sanitation in 2011, the provinces could be grouped into the following categories - based on the
amount of municipalities that belonged to clusters with a great improved LOS:
Greatly favourable: Free State, Western Cape, Gauteng and Metros
Moderately favourable: Mpumalanga
Moderately backlogged: Eastern Cape and North West
Severely backlogged: Limpopo and KwaZulu Natal
The greatly favourable group is the same for both water supply and sanitation, while the other
groups are not. This indicates that only the greatly favourable provinces (which included the Metros)
had similar access to improved services for both water supply and sanitation.
Nnadozie (2011) found that provinces could be grouped into 3 groups with different trends in water
supply provision.
Group A consisted of Gauteng, Free State and Western Cape. These provinces had a high percentage
of households with access to basic water supply services in 1994 and are understood to be more
technically capable of service provision. Provinces in Group A were characterized by an increasing
trend in additional demand, due to in-migration. Water supply provision was characterised as
increasing until access evens out at about 98% of households.
Group B consisted of Northern Cape, North West and KwaZulu Natal. These provinces had less
favourable access to basic water supply services, compared to Group A. KwaZulu Natal had notably
lower initial access. Water supply provision was characterized by rapid increase in access.
Group C consisted of Eastern Cape, Mpumalanga and Limpopo. These provinces had the least
favourable access to basic water supply services and were former homeland states. Water supply
provision was characterised by a slow decline in backlog which may be attributed to out-migration.
Comparing provincial groups from cluster analysis with the groups from Nnadozie (2011), Group A is
equivalent to greatly favourable group; and Eastern Cape and Limpopo, from Group C, are
backlogged provinces. Mpumalanga, however, was classified as Group C by Nnadozie (2011) but
was found to be moderately favourable for both water supply and sanitation. This would indicate
that Mpumalanga did not experience a slow decline in backlog as asserted by Nnadozie (2011).
Municipalities that belonged to Cluster 1 tended to remain in Cluster 1; the few municipalities that
shifted out of Cluster 1 were shifted to one other cluster with access to adequate services for more
than 70% of households in the municipalities. These clusters both had similar LOS distributions - a
large majority of the households had access to above basic services. This trend was only true for
Cluster 1, however; the municipalities belonging to the other clusters shifted irregularly. Favourable
provinces, such as Western Cape, Gauteng, Free State, Northern Cape and Metros, had the majority
of municipalities in Cluster 1 by 2011. This indicates that municipalities in these provinces shifted so
that the municipalities became similar in terms of access to services; they therefore could be

Univers
ity of
Cap
e Tow
n
August 2013 74
grouped into one cluster. Some backlogged municipalities progressed more than the favourable
municipalities in these provinces.
Progress Water supply and sanitation services did not progress similarly. From analysis of progress made data,
a number of municipalities showed negative progress for water supply for 2001-2007, while a larger
number of municipalities showed negative progress for sanitation for 2007-2011. This indicates that
growth in services for the different sectors occurred in different timeframes. Only Free State and
North West did not have many municipalities with negative progress.
For 2001 to 2011, the majority of municipalities in the Western Cape and Gauteng (favourable
provinces for both water supply and sanitation) both displayed progress between 0% and 10%. This
corroborates with Nnadozie (2011) the notion of slow, steady progress of Group A provinces.
Progress in other provinces was less similar. Despite access to improved sanitation being worse off
than water supply, 6 of the 9 provinces had majority of municipalities with sanitation progress
between 0% and 10%; this progress is similar to water supply progress of previously well-off
provinces. This indicates that for majority of municipalities, the most progress did not occur for the
more backlogged service: sanitation.
Mfolozi LM (from Uthungulu District) showed the greatest progress between 2001 and 2011 for
water supply, and Tswelopele LM (from Lejweleputswa District) showed the greatest progress
between 2001 and 2011 for sanitation (Table 18).
Table 18: Municipal movement of Uthungulu and Lejweleputswa municipalities
Municipality Municipal category
Cluster in
2001
Cluster in
2011
Progress (%)
Municipality Municipal category
Cluster in
2001
Cluster in 2011
Progress (%)
Uthungulu District
Lejweleputswa District
Mfolozi B4 6 2 54
Masilonyana B3 6 1 52
uMhlathuze B1 2 1 11
Tokologo B3 10 2 59
Ntambanana B4 8 7 26
Tswelopele B3 10 1 72
uMlalazi B4 6 6 28
Matjhabeng B1 3 1 29
Mthonjaneni B3 5 6 10
Nala B3 6 3 37
Nkandla B4 8 6 40
Mfolozi is a B4 local municipality and Tswelopele is a B3 local municipality. Both of these are rural
municipalities but have different characteristics, given that they are from different provinces.
Mfolozi is located in KwaZulu Natal and as such, was once part of the former homeland region.
Tswelopele, on the other hand, is located in Free State, which is a favourable province with a high
percentage of households with access to adequate services.
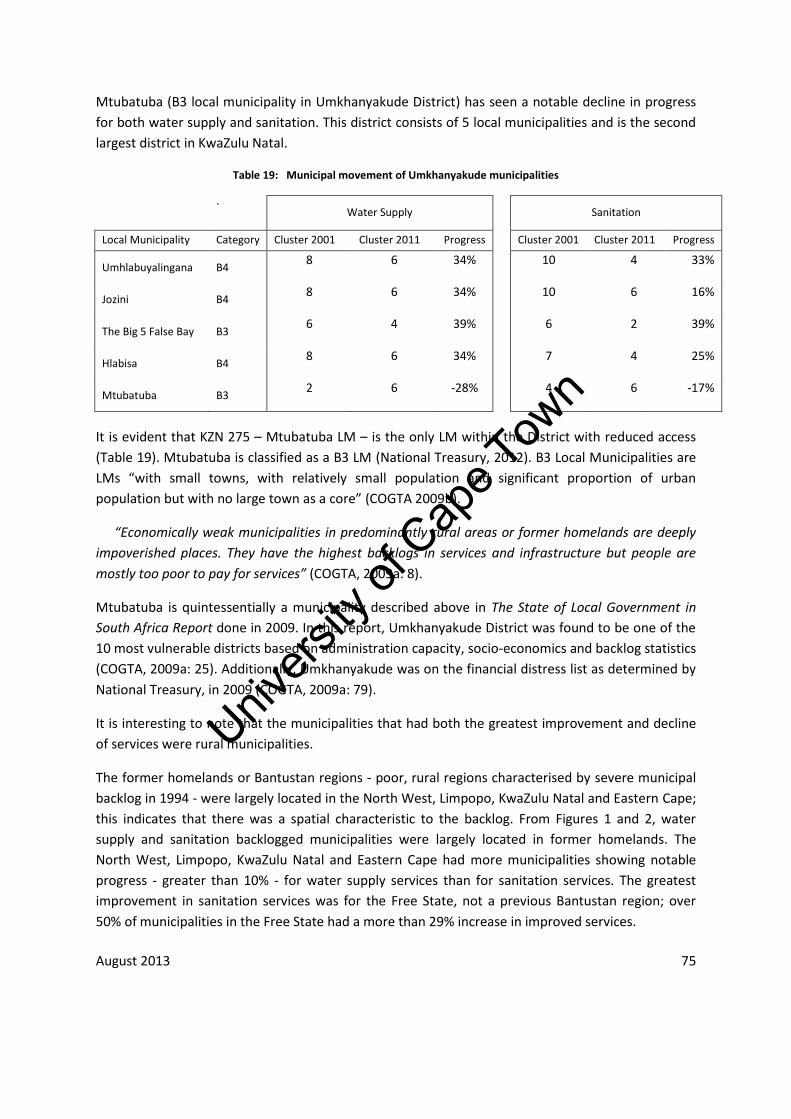
Univers
ity of
Cap
e Tow
n
August 2013 75
Mtubatuba (B3 local municipality in Umkhanyakude District) has seen a notable decline in progress
for both water supply and sanitation. This district consists of 5 local municipalities and is the second
largest district in KwaZulu Natal.
Table 19: Municipal movement of Umkhanyakude municipalities
` Water Supply
Sanitation
Local Municipality Category Cluster 2001 Cluster 2011 Progress
Cluster 2001 Cluster 2011 Progress
Umhlabuyalingana B4 8 6 34%
10 4 33%
Jozini B4 8 6 34%
10 6 16%
The Big 5 False Bay B3 6 4 39%
6 2 39%
Hlabisa B4 8 6 34%
7 4 25%
Mtubatuba B3 2 6 -28%
4 6 -17%
It is evident that KZN 275 – Mtubatuba LM – is the only LM within the District with reduced access
(Table 19). Mtubatuba is classified as a B3 LM (National Treasury, 2012). B3 Local Municipalities are
LMs “with small towns, with relatively small population and significant proportion of urban
population but with no large town as a core” (COGTA 2009b).
“Economically weak municipalities in predominantly rural areas or former homelands are deeply
impoverished places. They have the highest backlogs in services and infrastructure but people are
mostly too poor to pay for services” (COGTA, 2009a: 8).
Mtubatuba is quintessentially a municipality described above in The State of Local Government in
South Africa Report done in 2009. In this report, Umkhanyakude District was found to be one of the
10 most vulnerable districts based on administration capacity, socio-economics and backlog statistics
(COGTA, 2009a: 25). Additionally, Umkhanyakude was on the financial distress list as determined by
National Treasury, in 2009 (COGTA, 2009a: 79).
It is interesting to note that the municipalities that had both the greatest improvement and decline
of services were rural municipalities.
The former homelands or Bantustan regions - poor, rural regions characterised by severe municipal
backlog in 1994 - were largely located in the North West, Limpopo, KwaZulu Natal and Eastern Cape;
this indicates that there was a spatial characteristic to the backlog. From Figures 1 and 2, water
supply and sanitation backlogged municipalities were largely located in former homelands. The
North West, Limpopo, KwaZulu Natal and Eastern Cape had more municipalities showing notable
progress - greater than 10% - for water supply services than for sanitation services. The greatest
improvement in sanitation services was for the Free State, not a previous Bantustan region; over
50% of municipalities in the Free State had a more than 29% increase in improved services.
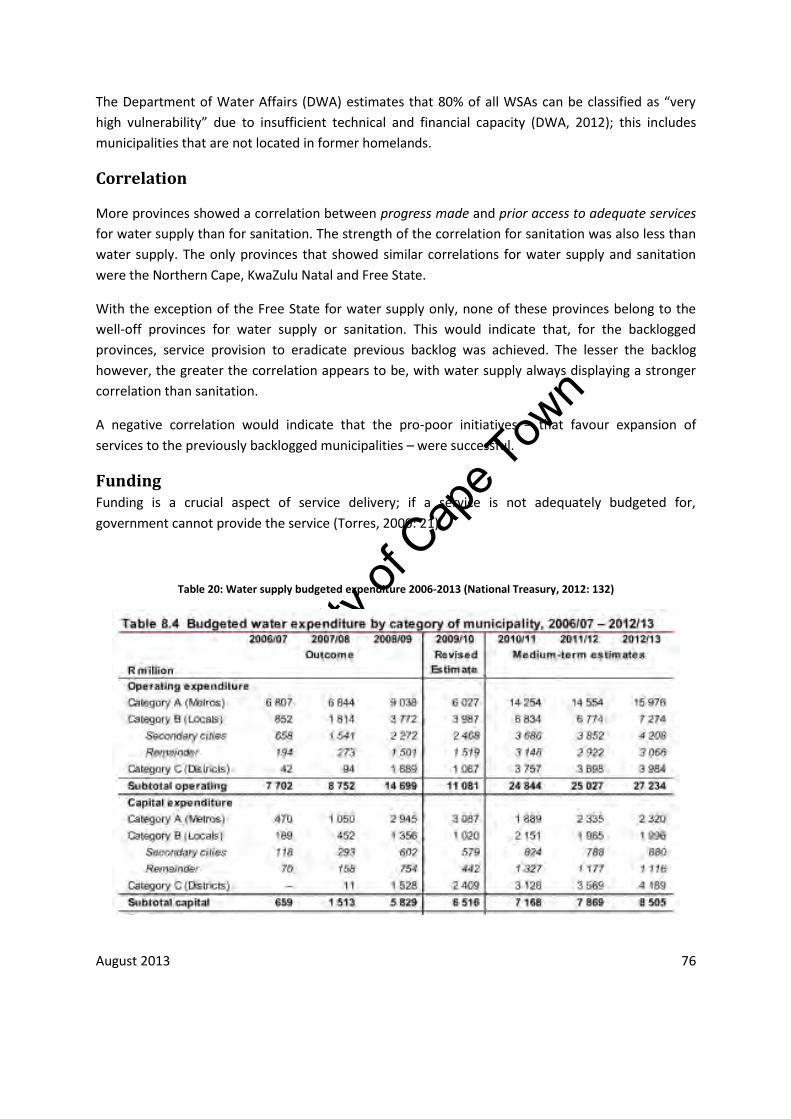
Univers
ity of
Cap
e Tow
n
August 2013 76
The Department of Water Affairs (DWA) estimates that 80% of all WSAs can be classified as “very
high vulnerability” due to insufficient technical and financial capacity (DWA, 2012); this includes
municipalities that are not located in former homelands.
Correlation
More provinces showed a correlation between progress made and prior access to adequate services
for water supply than for sanitation. The strength of the correlation for sanitation was also less than
water supply. The only provinces that showed similar correlations for water supply and sanitation
were the Northern Cape, KwaZulu Natal and Free State.
With the exception of the Free State for water supply only, none of these provinces belong to the
well-off provinces for water supply or sanitation. This would indicate that, for the backlogged
provinces, service provision to eradicate previous backlog was achieved. The lesser the backlog
however, the greater the correlation appears to be, with water supply always displaying a stronger
correlation than sanitation.
A negative correlation would indicate that the pro-poor initiatives – that favour expansion of
services to the previously backlogged municipalities – were successful.
Funding Funding is a crucial aspect of service delivery; if a service is not adequately budgeted for,
government cannot provide the service (Torres, 2000: 21).
Table 20: Water supply budgeted expenditure 2006-2013 (National Treasury, 2012: 132)

Univers
ity of
Cap
e Tow
n
August 2013 77
Table 21: Sanitation budgeted expenditure 2006-2013 (National Treasury, 2012: 135)
The budgeted water supply and sanitation expenditure between 2006 and 2013 showed that Metros
had a higher capital expenditure than local and district municipalities combined, for sanitation but
not for water supply (National Treasury, 2012). Rural municipalities, however, had a higher capital
expenditure than other local municipalities for water supply and not for sanitation. This, in
conjunction with the fact that more provinces showed a correlation between progress made and
prior access to improved services for water supply than for sanitation, indicates that the pro-poor
initiatives have been more successful in water supply services than in sanitation services.
The fact that failing infrastructure needs to be repaired, further adds to the burden of existing
backlog.
“The focus has been on building of new water infrastructure. Unfortunately this is frequently at
the expense of maintenance or improvement of existing infrastructure; hence the sustainability of
water services in many areas is in doubt… The DWA is struggling with serious capacity and funding
problems, which cannot be overstressed. It has estimated that reinvestment of R1.4 billion annually is
required to maintain current infrastructure” (SAICE, 2011: 15).
Lag in sanitation Sanitation provision was challenging. In 2009, the responsibility of sanitation provision was
transferred from DWAF to the Department of Human Settlements (DHS). The purpose of the transfer
was done as a means to prioritize sanitation provision.
“According to the DHS the transfer process took over 10 months to complete and: delays in the
movement posed serious challenges to the functioning of National Sanitation Programme as neither
the Department of Water Affairs nor Department of Human Settlements was willing to accept

Univers
ity of
Cap
e Tow
n
August 2013 78
responsibility for the National Sanitation Programme during the preparatory stage of the move.”
(Tissington, 2011: 61)
Evaluation of the National Sanitation Programme in 2011 revealed a number of constraints to
sanitation provision, thereby contributing to the lag in sanitation provision (DHS, 2012). Challenges
included lack of clarity on the roles and responsibilities of relevant institutions, inadequate budget
allocations that do not consider topography of different area, and lack of special consideration for
provision in informal settlements (DHS, 2012: 84).
“Some Municipalities have failed due to budgetary or environmental constraints related to the
acceleration of eradication of the bucket toilets in urban areas… The lack of earmarked funding on
sanitation provision results in municipalities prioritizing other expenditure priorities at the expense
of sanitation. Combination of sanitation and water budgets results in the disruption and prioritization
of expenditure on water not provision of sanitation. There are insufficient budget allocations for
operation and maintenance of sanitation facilities, systems and upgrades of bulk infrastructure”
(DHS, 2012: 70).
“Since 2007, government had identified rural development as one of the country’s major priorities”
(PMG, 2011). In some rural areas, toilets were poorly built and needed restoration before providing
sustainable service (DHS, 2012: 16).
“Although these statistics reveal the rapidity of sanitation access, users are often not receiving the
full benefit because of high failure rates for two main reasons. Firstly, most sanitation facilities are
not compliant with appropriate technical design standards; hence they are built in a manner
susceptible to quick failure and extreme maintenance difficulties. Secondly, there is a consistent lack
of communication with users on why and how to use these facilities, compounding maintenance
problems” (SAICE, 2011: 16).
The lag in sanitation progress between 2007 and 2011 could be attributed to the fact that sanitation
provision from 2007 was focussed in rural areas, which are demonstrably difficult to deliver services
to; that poorly built toilets needed restoration, diverting funds from providing new facilities; and
that transferring responsibility of sanitation provision from DWA to DHS in 2009 led to non-efficient
functioning of the National Sanitation Programme.
Strengths and Limitations of the study
Strengths - Cluster Analysis
The use of cluster analysis allows natural divisions in the data to create optimal groupings. The
reduction from 10 to 7 clusters for sanitation, between 2001 and 2011, indicates an increased
similarity in the municipalities. Furthermore, in 2011, 6 of the 9 water supply clusters were for
municipalities with more than 50% household access to improved services, while 4 of the 7
sanitation clusters were for municipalities with less than 50% household access to improved
services. This indicates that the disparity within the two services is different. The greater disparity

Univers
ity of
Cap
e Tow
n
August 2013 79
for sanitation services are for poor municipalities with less than 50% household access to improved
services; the converse is true for water supply services.
Additionally, municipalities were able to be grouped according to different levels of service (LOS).
For sanitation, Clusters 2 and 3 in 2011, for example, have virtually the same percentage for
household access to improved services – 73% - but have very different proportions. The percentage
of households with access to a basic LOS was 35% for Cluster 2 and 7% for Cluster 3.
Using cluster analysis allowed for different groupings to be created and shows the disparity (and
changes thereof) between municipalities. Analysis at municipal level showed that even supposedly
similar municipalities, based on the B1-4 categories and within the same district municipality,
progressed differently.
A number of assumptions made have presented a number of limitations to the study.
Percentage versus absolute backlog
It should be noted that calculating access as a percentage of total households obscures localised
changes: access to a tap inside the dwelling in the Eastern Cape increased from 25% in 1996 to 33%
in 2011 while access in the Western Cape decreased slightly from 76% in 1996 to 75% in 2011.
Household numbers in the Eastern Cape increased from 1.3 million in 2001 (StatsSA, 1996) to 1.7
million in 2011 (StatsSA, 2012), while the Western Cape household numbers increased from 0.98
million to 1.6 million. The difference in household growth highlights the need for population growth
to be considered when dealing with service delivery; 75% of households in the Western Cape
equates to 1.2 million households in 2011, which is more than the 0.98 million households in the
Western Cape in 2001. Consequently, more households received taps inside the dwelling despite the
decrease in percentage of households with access.
Looking at household numbers, the municipalities with the greatest progress - Mfolozi LM and
Tswelopele LM – both had a decline in the number of households from 2001 to 2011, by 6% and 9%,
respectively. The municipality with the greatest decline in household access - Mtubatuba LM – had
an increase in the number of households from 2001 to 2011, by 158%. The increase in household
numbers in Mtubatuba LM would have further stressed the already vulnerable municipality and
service delivery, evidently, has not been able to keep up.
The figure below illustrates the population growth from 2001 to 2011 (StatsSA) 5.
5 http://www.world-data-atlas.com/statssa/

Univers
ity of
Cap
e Tow
n
August 2013 80
Figure 26: Population growth between 2001 and 2011
Change in population map shows that different municipalities experienced different population
growth rates. The Free State, that had many municipalities with notable progress, also had a
decrease in the population; the progress calculated is partly attributed to this decline.
The SA National Infrastructure Programme considers aspects of population migration for future
plans. The figure below illustrates expected migration from under-serviced areas to metros. This
migration would further stress service delivery in the economic centres in the country (PICC, 2012).

Univers
ity of
Cap
e Tow
n
August 2013 81
Figure 27: Expected population migration (source PICC, 2012: 11)
The advantage of measuring progress as a percentage of households highlights municipalities that
have had notable household growth and therefore need to be prioritized in order to rectify the
backlog. This highlights the fact that the pace of service delivery has to keep up with population and
household growth.
Data
Gathering annual data would have been preferable instead of at three different points in time, with
the time periods also not being equal. Annual data, which is available, is largely at provincial level
and gathered through various sampling means.
As stated in the Methods chapter, the Community Survey was done using a two-stage stratified
random sampling of 17 098 out of 80 787 Enumerator Areas. As such, it is subject to sampling errors.
The sampling error in the Community Survey would certainly have affected the progress analysis
(done for 2001-2007 and 2007-2011), but the exact quantitative impact is not possible to determine.
This study assumes that the improved facilities that were accessed were operational and
sustainable. When accounting for microbial water quality and sanitary risk, the percentage of the
global population accessing unsafe services in 2010 increased from 11% to 28% (Onda et al., 2012).
The water services infrastructure in South Africa was found to be of an unsatisfactory standard.
Water supply and sanitation facilities were of a “satisfactory for now” standard in major urban areas,

Univers
ity of
Cap
e Tow
n
August 2013 82
while water supply and sanitation facilities in all other areas were “at risk” and “unfit for purpose”,
respectively (SAICE, 2011:3). In essence, the facilities outside of the major urban areas are not
coping with demand, are poorly maintained, and unsafe for public use.
Re-examination of access to water services taking into account the condition of the services would
yield markedly different results.
Municipal level analysis
The geographical structure of the Census and Community Survey data are as follows:
“Level 1 – South Africa
Level 2 – Province
Level 3 – District Council (Category C) or Metropolitan Area (Category A)
Level 4 – Local Municipality (Category B), or District Management Area (DMA)
Level 5 – Main Place
Level 6 – Sub-place
Level 7 – Enumeration Area (EA)” (Census, 2001)
The EA is the smallest geographical unit, consisting of 100 to 250 visiting points (StatsSA, 1996).
The Modifiable Areal Unit Problem (MAUP) is based on the data aggregated to certain geographical
boundaries, where the results yielded from the data will change if a different boundary is selected or
the spatial scale is changed. This is closely linked to the ecological fallacy, which assumes
homogeneity of within a population grouping and heterogeneity between population groupings.
While smaller geographical units of analysis would be preferred in order to minimise the MAUP, the
MAUP, however, would exist for all areal units.
Data at municipal level was used because of the sampling errors that exist with the Community
Survey data. At municipal level, the values are more robust and reliable (StatsSA, 2007).
The analysis at a municipal level does, however, have limitations as it does not take into account the
disparity within the local municipality. The situation in the metros is most notable because the high
household access percentages obscure the disparity in services between urban areas and informal
settlements. Under-5 mortality in informal settlements for example, can be up to 5 times higher
than in the urban areas in cities (Martinez et al., 2008).
eThekwini Metro in KwaZulu Natal, particularly, has informal settlements and rural areas within its
boundaries. Urban areas receive full pressure water services and flush toilets, rural areas use a
variety of water LOS and VIP toilets, and informal settlements use communal taps and sanitation is
either absent or provided through Pit Latrines (Sutherland &Lewis, 2012: 2). This disparate situation
will further regress as migration into metros is expected in future, due to growing urbanisation in the
country (PICC, 2012).
Univers
ity of
Cap
e Tow
n
August 2013 83
Future research Looking forward, it would be worthwhile combining other data related to water supply and
sanitation in the cluster analysis, such as Blue& Green Drop scores, MIG expenditure and operation
and maintenance data. Future research could also analyse absolute backlog instead of percentage
backlog. Blue and Green Drop reports have also only been done since 2009. Operation and
maintenance, and state of infrastructure data are not widely available at municipal level.
“No record could be found of any formal broad-based audits or studies of the state of municipal
infrastructure. Some services authorities, among them some municipalities, have in the past
performed audits in respect of their own infrastructure. Other studies and audits have been
undertaken on an ad-hoc basis. Particularly lacking is any overview of trends in the state and
performance of municipal infrastructure and its maintenance.” (CSIR and cidb, 2007: 1)
Furthermore, it would be useful to perform the cluster analysis on yearly data. Annual data at a
municipal level is difficult to collect. Most bodies monitor the access to water and sanitation at a
provincial level given that it is an arduous process to collect data at municipal level. “The yearly
delivery [of municipal] data are very erratic and this clearly illustrates the difficulty of undertaking a
year by year monitoring and evaluation of delivery of basic services in numerical terms” (Nnadozie,
2009: 341). The annual data would be gathered, most likely, through sampling methods and,
therefore, subject to error.
Another topic for future research is quantifying the spatial correlation between municipalities using
a spatial autocorrelation test. Moran’s I test6, for example, determines the correlation of nearby
locations based on chosen values. The results from spatial statistical tests allow spatial relationships
to be quantified and can attribute to a better understanding of their significance.
There are other iterative clustering methods, besides k-means, that can be used to group the
municipalities. The ISODATA algorithm, for example, is able to test for a range of clusters, while k-
means request the number of clusters prior to execution. Using a different method would lead to
different results; determining whether or not they would have worked better would have to be
investigated.
Intended users A study of this nature could assist in strategic water services planning, done by DWA, provincial and
local government. Future Water Service Plans, interventions and goals can be targeted to similarly
performing municipalities, and not merely based on the municipal categorisation.
“As government strives to achieve universal access to basic services for all households by 2014,
understanding our current status in the delivery of basic services is critical both in terms of reporting
accurately to the nation and in developing appropriate strategies and interventions. The diverse
6
http://resources.esri.com/help/9.3/ArcGISEngine/dotnet/Gp_ToolRef/spatial_statistics_tools/how_spatial_autocorrelation_colon_moran_s_i_spatial_statistics_works.htm
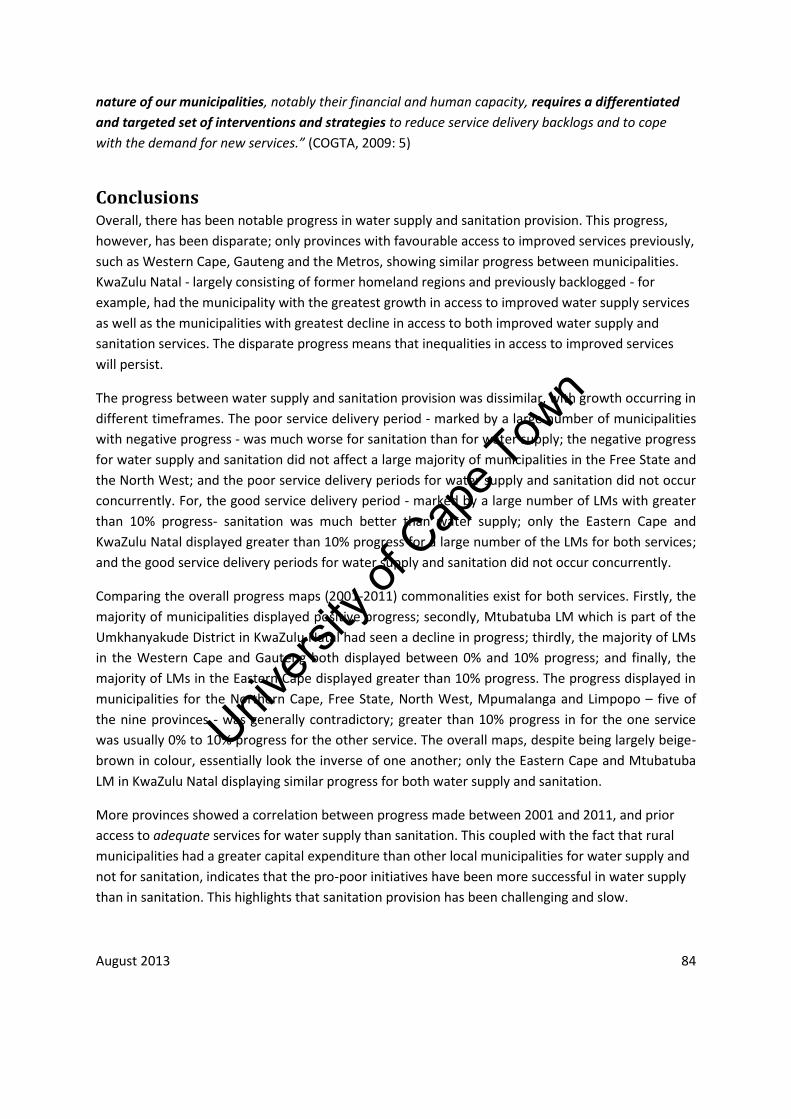
Univers
ity of
Cap
e Tow
n
August 2013 84
nature of our municipalities, notably their financial and human capacity, requires a differentiated
and targeted set of interventions and strategies to reduce service delivery backlogs and to cope
with the demand for new services.” (COGTA, 2009: 5)
Conclusions Overall, there has been notable progress in water supply and sanitation provision. This progress,
however, has been disparate; only provinces with favourable access to improved services previously,
such as Western Cape, Gauteng and the Metros, showing similar progress between municipalities.
KwaZulu Natal - largely consisting of former homeland regions and previously backlogged - for
example, had the municipality with the greatest growth in access to improved water supply services
as well as the municipalities with greatest decline in access to both improved water supply and
sanitation services. The disparate progress means that inequalities in access to improved services
will persist.
The progress between water supply and sanitation provision was dissimilar, with growth occurring in
different timeframes. The poor service delivery period - marked by a large number of municipalities
with negative progress - was much worse for sanitation than for water supply; the negative progress
for water supply and sanitation did not affect a large majority of municipalities in the Free State and
the North West; and the poor service delivery periods for water supply and sanitation did not occur
concurrently. For, the good service delivery period - marked by a large number of LMs with greater
than 10% progress- sanitation was much better than water supply; only the Eastern Cape and
KwaZulu Natal displayed greater than 10% progress for a large number of the LMs for both services;
and the good service delivery periods for water supply and sanitation did not occur concurrently.
Comparing the overall progress maps (2001-2011) commonalities exist for both services. Firstly, the
majority of municipalities displayed positive progress; secondly, Mtubatuba LM which is part of the
Umkhanyakude District in KwaZulu Natal had seen a decline in progress; thirdly, the majority of LMs
in the Western Cape and Gauteng both displayed between 0% and 10% progress; and finally, the
majority of LMs in the Eastern Cape displayed greater than 10% progress. The progress displayed in
municipalities for the Northern Cape, Free State, North West, Mpumalanga and Limpopo – five of
the nine provinces - was generally contradictory; greater than 10% progress in for the one service
was usually 0% to 10% progress for the other service. The overall maps, despite being largely beige-
brown in colour, essentially look the inverse of one another; only the Eastern Cape and Mtubatuba
LM in KwaZulu Natal displaying similar progress for both water supply and sanitation.
More provinces showed a correlation between progress made between 2001 and 2011, and prior
access to adequate services for water supply than sanitation. This coupled with the fact that rural
municipalities had a greater capital expenditure than other local municipalities for water supply and
not for sanitation, indicates that the pro-poor initiatives have been more successful in water supply
than in sanitation. This highlights that sanitation provision has been challenging and slow.

Univers
ity of
Cap
e Tow
n
August 2013 85
The lag in sanitation progress between 2007 and 2011 could be attributed to the fact that sanitation
provision from 2007 was focussed in rural areas, which are demonstrably difficult to deliver services
to; that poorly built toilets needed restoration; and that transferring responsibility of sanitation
provision from DWA to DHS in 2009 led to non-efficient functioning of the National Sanitation
Programme.
Major limitations of the study exist due progress being calculated as a percentage, and assuming
that the facilities access are operational.
Calculating access as a percentage of total households obscures localised changes: access to a tap
inside the dwelling in the Eastern Cape increased from 25% in 1996 to 33% in 2011 while access in
the Western Cape decreased slightly from 76% in 1996 to 75% in 2011. Household numbers in the
Eastern Cape increased from 1.3 million in 2001 (StatsSA, 1996) to 1.7 million in 2011 (StatsSA,
2012), while the Western Cape household numbers increased from 0.98 million to 1.6 million. The
difference in household growth highlights the need for population growth to be considered when
dealing with service delivery; 75% of households in the Western Cape equates to 1.2 million
households in 2011, which is more than the 0.98 million households in the Western Cape in 2001.
Consequently, more households received taps inside the dwelling despite the decrease in
percentage of households with access.
The water services infrastructure in South Africa was found to be of an unsatisfactory standard.
Water supply and sanitation facilities were of a “satisfactory for now” standard in major urban areas,
while water supply and sanitation facilities in all other areas were “at risk” and “unfit for purpose”,
respectively (SAICE, 2011:3). In essence, the facilities outside of the major urban areas are not
coping with demand, are poorly maintained, and unsafe for public use.
Re-examination of access to water services taking into account the condition of the services would
yield markedly different results.
Looking forward, it would be worthwhile combining other data related to water supply and
sanitation in the cluster analysis, such as Blue& Green Drop scores, MIG expenditure and operation
and maintenance data. Future research could also analyse absolute backlog instead of percentage
backlog. Blue and Green Drop reports have also only been done since 2009. Operation and
maintenance, and state of infrastructure data are not widely available at municipal level.
Univers
ity of
Cap
e Tow
n
August 2013 86
References BESG, 2008. Review of Local Government Report 2008: Service Delivery. URL:
<http://www.besg.co.za/downloads/Service_delivery_and_local_government_review_2008.pd
f> [Accessed: 7 April 2012].
Blashfield, R.K., 1976. Mixture Model Tests of Cluster Analysis : Accuracy of Four Agglomerative
Hierarchical Methods. Psychological Bulletin, 83(3), pp.377–388.
Bond, P., 1999. Basic infrastructure for socio-economic development, environmental protection
and geographical desegregation: South Africa’s unmet challenge. Geoforum, 30(1), 43–59.
Burns, Robert & Burns, Richard, 2008. Chapter 23 Cluster Analysis. In Business Research Methods
and Statistics using SPSS. SAGE, pp. 552–567. URL:
<http://www.uk.sagepub.com/burns/chapters.htm> [Accessed: 21 October 2012].
Clatworthy, J. et al., 2005. The use and reporting of cluster analysis in health psychology: a review.
British journal of health psychology, 10(Pt 3), pp.329–58.
COGTA, 2009a. Basic Services Publication: Comparative Information on Basic Services. URL:
<www.gov.za/documents/download.php?f=110099> [Accessed 31 August 2012].
COGTA, 2009b. State of Local Government in South Africa: Overview Report.URL:
<http://www.info.gov.za/view/DownloadFileAction?id=110100> [Accessed: 28 February 2012].
CSIR and cidb, 2007. The state of municipal infrastructure in South Africa and its operation and
maintenance; an overview. URL:
<http://www.cidb.org.za/Documents/KC/cidb_Publications/Ind_Reps_Other/ind_reps_state_of
_municipal_infrastructure.pdf> [Accessed 20 November 2013].
Deininger, K. & Mpuga, P., 2005. Does Greater Accountability Improve the Quality of Public Service
Delivery? Evidence from Uganda. World Development, 33(1), pp.171–191.
DHS, n.d. Rural Household Infrastructure Programme. URL:
<www.dhs.gov.za/uploads/Rural_Housing_Infrastructure_Programme.pdf> [Accessed 12
November 2013].
DHS, 2012. Ministerial Sanitation Task Team Report: July 2012. Review, Investigation and Evaluation
of the National Sanitation Programme - Towards Continuous Improvement. URL:
<http://www.dhs.gov.za/uploads/reports/Sanitation_Task_Team_Report_July2012.pdf>
[Accessed 11 November 2013].
DWA, 2013. Strategic Overview of the Water Sector in South Africa 2013. URL: <http://nepadwatercoe.org/wp-content/uploads/Strategic-Overview-of-the-Water-Sector-in-South-Africa-2013.pdf> [Accessed 11 August 2013].
Univers
ity of
Cap
e Tow
n
August 2013 87
DWA, 2012a. Blue Drop Report 2012, Chapter 3: Eastern Cape Province (p. 20 – 69). URL:
<www.dwaf.gov.za/Documents/BD2012/EC.pdf> [Accessed 26 July 2012].
DWA, 2012b. Blue Drop Report - Chapter 8: Mpumalanga Province, Available at:
http://www.dwaf.gov.za/Documents/BD2012/Mpumalanga.pdf.
DWA, 2012c. Sanitation Services – Quality of Sanitation in South Africa Report on the Status of
sanitation services in South Africa Executive Summary, Available at:
http://www.sahrc.org.za/home/21/files/Quality of sanitation - Exec Summary (Fin).pdf III.pdf.
DWAF, 2005. Water and Sanitation Business - The Roles and Responsibilites of Local Government and
Related Institutions. URL:
<http://www.dwaf.gov.za/IO/Docs/CMA/WMI%20Poster%20Booklets/Roles%20&%20Responsi
bilities%20of%20Local%20Government%20and%20Related%20Institutions.pdf> [Accessed 12
November 2013].
DWAF, 2004. A history of the first decade of Water Service delivery in South Africa 1994 to 2004.
URL: <www.dwaf.gov.za/documents/Publications/firstdecade.pdf> [Accessed 10 July
2012].
DWAF, 1994. Water Supply and Sanitation Policy Whit e Paper. Cape Town. URL:
<http://www.dwaf.gov.za/Documents/Policies/WSSP.pdf> [Accessed 7 April 2012].
Elhiraika, A.B., 2007. Fiscal Decentralization and Public Service Delivery in South Africa. URL:
<http://www.uneca.org/atpc/work in progress/58.pdf> [Accessed: 11 July 2012].
Esfahani, H.S., 2005. Alternative public service delivery mechanisms in Iran. The Quarterly Review of
Economics and Finance, 45(2-3), pp.497–525.
Heleba, S., 2011. The right of access to sufficient water in South Africa: How far have we come?
Law, Democracy and Development. 15 (2011), pp. 244–278.
Heller, P., 2001. Moving the State: The Politics of Democratic Decentralization in Kerala, South Africa,
and Porto Alegre. Politics & Society, 29(1), pp.131–163.
Hope, R.A., 2006. Evaluating Water Policy Scenarios Against the Priorities of the Rural Poor. World
Development, 34(1), pp.167–179.
Hutton, G. & Haller, L., 2004. Evaluation of the Costs and Benefits of Water and Sanitation
Improvements at the Global Level. Geneva: WHO. URL:
<www.who.int/water_sanitation_health/wsh0404.pdf> [Accessed 10 July 2012].
IBM, 2011. IBM SPSS Statistics 19 Statistical Procedures Companion - Chapter 17 Cluster Analysis, pp.
375-404. URL: <www.norusis.com/pdf/SPC_v19.pdf> [Accessed 24 February 2013].
Khosa, M.M., 2000. Facts, Fiction and Fabrication? Service Delivery in South Africa under
Mandela. Urban Forum, 13(1), pp. 38–66.

Univers
ity of
Cap
e Tow
n
August 2013 88
Lane, J., 2004. Ghana, Lesotho, and South Africa: Regional Expansion of Water Supply in Rural
Areas. Washington D.C.: The World Bank. URL:
<http://documents.worldbank.org/curated/en/2004/05/5450119/ghana-lesotho-south-
africa-regional-expansion-water-supply-rural-areas> [Accessed 10 July 2012].
Levin, R.M., 2007. Leadership And Service Delivery In The South African Context. In: African
Association For Public Administration And Management, 29th AAPAM Annual Roundtable
Conference, Mbabane, Swaziland, 3th – 7th September 2007. URL:
<http://unpan1.un.org/intradoc/groups/public/documents/AAPAM/UNPAN028746.pdf>
[Accessed 7 April 2012].
Manase, G. et al., 2009. Using water and sanitation as an entry point to fight poverty and
respond to HIV/AIDS: The case of Isulabasha Small Medium Enterprise. Physics and
Chemistry of the Earth, Parts A/B/C, 34(13-16), pp. 866–873.
Martinez et al., 2008. Trends in urban and slum indicators across developing world cities, 1990 -
2003. Habitat International, 32 (2008), pp. 86-108.
May, J., 1998. Poverty and Inequality in South Africa. University of Natal. URL:
<http://www.info.gov.za/otherdocs/1998/poverty/presentation.pdf> [Accessed: 10 July 2012].
Mooi, E. & Sarstedt, M., 2011. A Concise Guide to Market Research. In Berlin, Heidelberg: Springer
Berlin Heidelberg. URL: <http://www.springerlink.com/index/10.1007/978-3-642-12541-6>
[Accessed March 4, 2013].
Municipal Demarcation Board. (2012). Municipal Capacity Assessment 2011 – National Trends in
Municipal Capacity. URL:
<http://www.demarcation.org.za/Webpage%20upload/Capacity%20Assessment%20%20Repor
t%20All%20Provinces%202011/Final%20Municipal%20Capacity%20Assessment%20National%2
0Trends%20Report%2020121001.pdf> [Accessed 17 August 2013].
National Treasury, 2012. 2011 Local Government Budgets and Expenditure Review: 2006/7 -
2012/13. URL: < http://www.treasury.gov.za/publications/igfr/2011/lg/> [Accessed 17
August 2013].
Nattrass, N. & Seekings, J., 2001. Democracy and distribution in highly unequal economies: the case
of South Africa. The Journal of Modern African Studies, 39(03), pp.471–498.
Nnadozie, R., 2011. Access to adequate water in post-apartheid South African provinces: An
overview of numerical trends. Water SA, 37(3), pp. 339–347.
Onda et al., 2012. Global Access to Safe Water: Accounting for Water Quality and the Resulting
Impact on MDG Progress. International Journal of Environmental Research and Public Health, 9
(2012), p 880-894.

Univers
ity of
Cap
e Tow
n
August 2013 89
PICC, 2012. A summary of the South African National Infrastructure Plan. URL:
<http://www.economic.gov.za/communications/.../202-picc.../download> [Accessed 12
November 2013].
PMG, 2011. Report of the Portfolio Committee on Human Settlements on the Rural Household
Infrastructure Programme, dated 1 July 2011. [online] URL:
<http://www.pmg.org.za/docs/2011/comreports/110810pcsettlereport2.htm> [Accessed 12
November 2013].
Ruger, J.P. & Kim, H.-J., 2006. Global health inequalities: an international comparison. Journal of
Epidemiology and Community Health, 60(11), pp.928–936.
SAICE 2011. SAICE Infrastructure Report Card for South Africa. URL:
<http://www.csir.co.za/enews/2011_jun/download/infrastructure_report_card_sa_2011.pdf>
[Accessed 20 November 2013].
Saint-Arnaud, S. & Bernard, P., 2003. Convergence or Resilience? A Hierarchical Cluster Analysis of
the Welfare Regimes in Advanced Countries. Current Sociology, 51(5), pp.499–527.
Schwella, E., 2001. Public Sector Policy In The New South Africa: A Critical Review. Public
Performance & Management Review, 24(4), pp.367–388.
Smith, J., 2009. Social policy, welfare in urban services in South Africa. A case study of free basic
water, indigency and citizenship in Eastwood, Pietermaritzburg, KwaZulu-Natal (2005-
2007). Ph.D. Rhodes University. URL: <http://eprints.ru.ac.za/1578/1/Smith-PhD-TR09-
115.pdf> [Accessed7 April 2012].
Smith, L., 2004. The murky waters of the second wave of neoliberalism: corporatization as a
service delivery model in Cape Town. Geoforum, 35(3), pp. 375–393.
StatsSA, 2012. Census 2011: Key results. URL:
<http://www.statssa.gov.za/Census2011/Products.asp> [Accessed 13 March 2013].
StatsSA, 2007. Cautionary note. URL:
<http://www.datafirst.uct.ac.za/catalogue3/index.php/catalog/101> [Accessed 11 November
2013].
StatsSA, 2001. Census 2001: Community Profile Databases, SuperCROSS Training Manual. URL:
<www.statssa.gov.za/census01/html/CommProfilesTraining.pdf> [Accessed 3 September 2012].
StatSA, 1996. The People of South Africa Population Census, 1996 - Census in Brief. Statistics South
Africa. URL: <www.statssa.gov.za> [Accessed: 02 October 2012].
Sutherland and Lewis, 2012. Water and Sanitation Service Delivery in eThekwini: a Spatially
Differentiated Model. Chance2Sustain. URL: <http://www.chance2sustain.eu/46.0.html>
[Accessed 12 November 2013].

Univers
ity of
Cap
e Tow
n
August 2013 90
Tissington, K., 2011. Basic Sanitation in South Africa : A Guide to Legislation, Policy and Practice. SERI.
URL: <http://www.escr-net.org/usr_doc/SERI,_Guide_on_Basic_Sanitation_in_SA.pdf>
[Accessed: 10 July 2012].
Torres, L., 2000. “We are emerging; emerging slowly and painfully!” Infrastructure Delivery in
South Africa. Oslo: Fafo Institute for Applied Social Science. URL:
<http://www.nedlac.org.za/media/11174/336-innm.pdf> [Accessed 10 July 2012].
UNICEF & WHO, 2012. Progress on Drinking Water and Sanitation. URL:
<http://www.unicef.org/media/files/JMPreport2012.pdf> [Accessed: 28 August 2013].
Van Niekerk, S., 1998. Private gain, public loss : Service delivery in the new South Africa. Southern
Africa Report, 12(4), pp.1–7.
Vázquez, S.T. & Sumner, A., 2012. IDS WORKING PAPER Volume 2012 No 404 Beyond Low and
Middle Income Countries : What if There Were Five Clusters of Developing Countries ? Institute
of Development Studies. Brighton. 2012 (404). URL:
<http://www.ntd.co.uk/idsbookshop/details.asp?id=1300> [Accessed 18 December 2012].
Wheater, C.P. & Cook, P.A., 2000. Using Statistics to Understand the Environment, London and New
York: Routledge, Taylor & Francis Group. URL: <http://enforester.persiangig.com/using
statistics to understand the environment.pdf> [Accessed: 16 August 2013].
WHO, 2013a. The top 10 causes of death. URL:
<http://who.int/mediacentre/factsheets/fs310/en/index.html> [Accessed 11 November
2013].
WHO, 2013b. Diarrhoeal Disease. URL:
<http://www.who.int/mediacentre/factsheets/fs330/en/> [Accessed 11 November 2013].
WSP (Water and Sanitation Program), 2007. Water Utilities in Africa: Case Studies of
Transformation and Market Access. URL:
<www.wsp.org/userfiles/file/Water_Utilities_Africa.pdf> [Accessed 10 July 2012].

Univers
ity of
Cap
e Tow
n
August 2013 91
Appendices
Appendix 1 – Changes in Census and Community Survey data
NAME CHANGES
- Name change in Western Cape: Breede River/Winelands to Langeberg
- KZN: all LMs in DM 5a changed names to DM 43
BOUNDARY CHANGES
- Provincial boundary movement: Merafong City LM from NW to GT (NW 405 to GT 484)
- North West: Kagisano/Molopo LMs combined (NW 391 and NW 395 to NW 397)
- Eastern Cape: Mbizana, Ntanbankulu (EC 151 & EC 152) along with Matatiele and Umzimvubu (EC
05b 2& EC 05b 3) now form LMs in DM 44 (EC 443, EC 444, EC 441 & EC 442, respectively)
- Free State DM 17 disbanded Naledi (FS 171) became FS 164 and Mantsopa (FS 173) became FS 196
- Gauteng: Nokeng tsa Taemane LM and Kungwini LM join with Tshwane metro
CATEGORY CHANGES
- Free State: Buffalo City LM became a metro (EC 125 to BUF)
- Free State: Mangaung (FS 172) to a metro (MAN)
Thirdly, District Management Areas (DMA) were not included in the analysis because these areas are
not residential but refer to “special interest” areas such as conservation areas.
For consistency – Census 1996 not included in analysis

Univers
ity of
Cap
e Tow
n
August 2013 92
Appendix 2 – Critical Values Table for small sample sizes
(Extracted from Wheater & Cook, 2000: 200)

Univers
ity of
Cap
e Tow
n
August 2013 93
Appendix 3 – 2001 Water Supply k-means cluster membership Determining the Number of Clusters
Hierarchical cluster analysis produced an agglomeration schedule and the following scree plot was
created, where the distances at which the mergers take place are plotted against the number of
formed clusters.
Figure 28: Illustrating Scree Plot for water supply 2001
Using the ‘elbow’ method, “where an additional combination of two clusters occurs at a greatly
increased distance” (Vazquez &Sumner, 2012: 18), the Scree plot shows that the suitable number
clusters lays between 5 and 13 clusters. The elbow method (however is not very accurate and is
instead used as a rough guide. The Variance Ratio Criterion, proposed by Calinski and Harabasz
(1974), was used to better determine the number of clusters that maximizes the between-cluster
variation and minimizes the within-cluster variation (Vazquez & Sumner, 2012: 20).
Table 22: Variance Ratio Criterion for water supply 2001
Number of clusters VRC wk
6 1514.17 -
7 1575.53 -53.21
8 1583.67 152.16
9 1743.98 -190.10
10 1714.19 64.96
The variance test involves selecting the cluster with the smallest wk. The number of selected clusters
is 9, which was used in the k-means analysis.
0
5
10
15
20
25
30
35
233 218 203 188 173 158 143 128 113 98 83 68 53 38 23 8
Co
-eff
icie
nt
(dis
tan
ce t
o c
lust
eri
ng)
Clusters
2001 Water Supply Scree Plot

Univers
ity of
Cap
e Tow
n
August 2013 94
Table 23: Cluster membership for water supply 2001
Cluster
1 2 3 4 5 6 7 8 9
CPT EC102 EC105 EC123 EC138 EC157 EC124 EC442 EC121
EC101 EC104 EC106 EC127 KZN216 KZN245 EC126 EC441 EC137
EC103 EC108 BUF EC132 KZN221 KZN253 EC136 EC122 EC443
EC107 EC109 EC128 MP324 KZN226 KZN266 EC142 EC135 EC444
EC131 EC144 EC134 MP325 KZN227 KZN273 KZN235 EC141 EC153
EC133 ETH EC143 NC452 KZN233 KZN281 KZN236 EC156 EC154
EKU FS161 FS183 LIM331 KZN261 KZN284 KZN242 KZN211 EC155
FS162 FS163 FS191 LIM332 KZN262 KZN293 KZN254 KZN214 KZN213
FS201 FS164 FS194 LIM333 KZN263 KZN431 NC451 KZN215 KZN244
FS203 MAN KZN212 LIM342 KZN285
LIM474 KZN265 KZN294
FS204 FS196 KZN224 LIM343 KZN291
LIM475 KZN271 FS205 FS181 KZN232 LIM344 MP301
NW381 KZN272
GT421 FS182 KZN234 LIM351 MP303
KZN274 GT481 FS184 KZN252 LIM352 MP316
KZN283
GT482 FS185 KZN292 NW371 LIM471
KZN286 GT484 FS192 KZN432 NW375 LIM472
KZN434
JHB FS193 MP304 NW382 LIM353
KZN435 LIM366 FS195 MP322 NW385 LIM355
LIM473
NC061 GT422 MP323 NW394 LIM367 NC062 GT423 LIM334 NW397 NW383 NC065 GT483 LIM335
NC066 KZN222 LIM341 NC067 KZN223 LIM354
NC072 KZN225 LIM361
NC073 KZN241 LIM362
NC074 KZN275 LIM365
NC075 KZN282 NW372
NC077 KZN433 NW373
NC082 MP302 NW384
NC085 MP305 NW393
NC086 MP306 NW401
NC091 MP307 NW404
NC093 MP311
NC453 MP312
NW403 MP313 WC011 MP314 WC012 MP315 WC013 MP321

Univers
ity of
Cap
e Tow
n
August 2013 95
Table 23 continued
WC014 NC064 WC015 NC071 WC022 NC076 WC023 NC078 WC024 NC081 WC025 NC083 WC026 NC084 WC031 NC092 WC032 NC094 WC033 NMA WC034 LIM364 WC041 NW374 WC042 NW392 WC043 NW396 WC044 NW402 WC045 TSH WC051 WC047 WC052 WC048 WC053

Univers
ity of
Cap
e Tow
n
August 2013 96
Appendix 4 – 2007 Water Supply k-means cluster membership
Determining the Number of Clusters
Hierarchical cluster analysis produced an agglomeration schedule and the following Scree plot was
created. The distances at which the mergers take place are plotted against the number of formed
clusters.
Figure 29: Illustrating Scree Plot for water supply 2007
The Scree plot shows that the suitable number clusters lays between 5 and 12 clusters. The elbow
method however is not very accurate and is instead used as a rough guide. The Variance Ratio
Criterion, proposed by Calinski and Harabasz (1974), was used to better determine the number of
clusters that maximizes the between-cluster variation and minimizes the within-cluster variation
(Vazquez & Sumner, 2012: 20).
Table 24: Variance Ratio Criterion for water supply 2007
Number of clusters VRC wk
5 1253.63 -
6 1255.46 -119.02
7 1138.27 430.94
8 1452.02 -449.12
9 1316.65 178.42
10 1359.71 -118.02
11 1284.74 48.74
0
5
10
15
20
25
30
35
40
236 216 196 176 156 136 116 96 76 56 36 16
Co
-eff
icie
nts
Clusters
Scree Plot 2007 Water Supply

Univers
ity of
Cap
e Tow
n
August 2013 97
The variance test involves selecting the cluster with the smallest wk. The number of selected clusters
is 8, which was used in the k-means analysis.
Table 25: Cluster membership for water supply 2007
Cluster
1 2 3 4 5 6 7 8
CPT BUF EC123 KZN221 EC126 EC142 EC122 EC121
EC101 EC128 EC124 KZN224 EC136 EC441 EC135 EC153
EC102 EC134 EC127 KZN226 KZN215 EC442 EC137 EC154
EC103 EC143 EC132 KZN232 NC451 KZN242 EC141 EC443
EC104 ETH EC138 KZN233 NW381 KZN254 EC155 KZN244
EC105 FS161 KZN212 KZN234 NW394 LIM342 EC156 KZN265
EC106 FS193 KZN216 KZN245
LIM351 EC157 KZN294
EC107 FS194 KZN227 KZN253
LIM473 EC444 EC108 GT423 KZN291 KZN261
LIM474 KZN211
EC109 GT483 KZN292 KZN262
LIM475 KZN213 EC131 GT484 LIM331 KZN263
MP325 KZN214
EC133 KZN222 LIM332 KZN266
NW383 KZN235 EC144 KZN223 LIM333 KZN281
NW397 KZN236
EKU KZN252 LIM335 KZN285
KZN271 FS162 KZN275 LIM343 KZN286
KZN272
FS163 KZN433 LIM344 KZN432
KZN273 FS164 LIM341 LIM352 LIM353
KZN274
FS181 LIM361 LIM354 LIM355
KZN283 FS182 LIM364 LIM362 MP316
KZN284
FS183 LIM366 LIM367
KZN293 FS184 MAN LIM471
KZN431
FS185 MP301 MP324
KZN434 FS191 MP302 NC452
KZN435
FS192 MP303 NW371
LIM472 FS195 MP304 NW375
FS196 MP306 NW382 FS201 MP311 NW385 FS203 MP312
FS204 MP321 FS205 MP322 GT421 MP323 GT422 NC064 GT481 NC082 GT482 NC084 JHB NC085 KZN225 NC092

Univers
ity of
Cap
e Tow
n
August 2013 98
Table 25 continued
Clusters
1 2
KZN241 NC094 KZN282 NW372 LIM334 NW373 LIM365 NW374 MP305 NW384 MP307 NW396 MP313 NW401 MP314 TSH MP315 WC048 NC061
NC062 NC065 NC066 NC067 NC071 NC072 NC073 NC074 NC075 NC076 NC077 NC078 NC081 NC083 NC086 NC091 NC093 NC453 NMA NW392 NW393 NW402 NW403 NW404 WC011 WC012 WC013 WC014 WC015 WC022
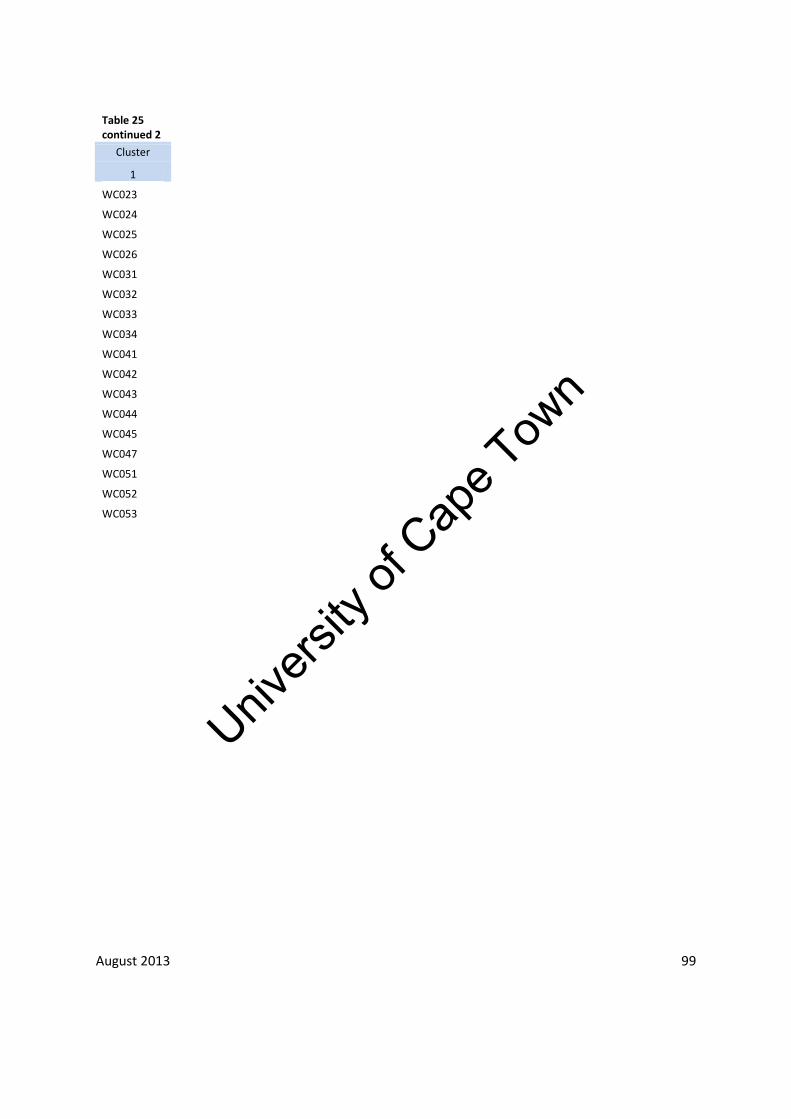
Univers
ity of
Cap
e Tow
n
August 2013 99
Table 25
continued 2
Cluster
1
WC023
WC024 WC025 WC026 WC031 WC032 WC033 WC034 WC041 WC042 WC043 WC044 WC045 WC047 WC051 WC052 WC053

Univers
ity of
Cap
e Tow
n
August 2013 100
Appendix 5 – 2011 Water Supply k-means cluster membership
Determining the Number of Clusters
Hierarchical cluster analysis produced an agglomeration schedule and the following scree plot was
created. The distances at which the mergers take place are plotted against the number of formed
clusters.
Figure 30: Illustrating Scree Plot for water supply 2011
The Scree plot shows that the suitable number clusters lays between 5 and 11 clusters. The elbow
method however is not very accurate and is instead used as a rough guide. The Variance Ratio
Criterion, proposed by Calinski and Harabasz (1974), was used to better determine the number of
clusters that maximizes the between-cluster variation and minimizes the within-cluster variation
(Vazquez & Sumner, 2012: 20).
Table 26: Variance Ratio Criterion for water supply 2011
Number of clusters VRC wk
5 1406.73 -
6 1316.56 173.89
7 1400.28 27.14
8 1511.13 -52.24
9 1569.75 -196.88
10 1431.49 180.19
11 1473.42 -
The variance test involves selecting the cluster with the smallest wk. The number of selected clusters
is 9, which was used in the k-means analysis.
0
5
10
15
20
25
30
233 218 203 188 173 158 143 128 113 98 83 68 53 38 23 8
Co
-eff
icie
nts
Clusters
Scree Plot 2011 Water Supply

Univers
ity of
Cap
e Tow
n
August 2013 101
Table 27: Cluster membership for water supply 2011
Clusters
1 2 3 4 5 6 7 8 9
CPT BUF EC106 EC123 EC126 EC157 EC122 EC121 EC153
EC101 EC132 KZN221 EC124 EC136 KZN226 EC135 EC141 EC443
EC102 EC134 KZN223 EC127 KZN214 KZN233 EC137 EC154 EC103 GT483 KZN232 EC138 KZN215 KZN245 EC156 EC155 EC104 KZN224 KZN234 EC142 LIM342 KZN253 EC441 EC444 EC105 KZN281 KZN261 KZN212 NC451 KZN262 EC442 KZN213 EC107 KZN291 KZN263 KZN216 NW381 KZN266 KZN211 KZN244 EC108 KZN433 KZN432 KZN227 NW394 KZN271 KZN235 KZN265 EC109 LIM352 LIM341 KZN242
KZN272 KZN236 KZN294
EC128 LIM354 LIM353 KZN254
KZN274 KZN283 KZN435 EC131 LIM362 LIM361 KZN273
KZN275 KZN434
EC133 LIM367 LIM471 KZN292
KZN284 LIM473 EC143 NW375 MP301 LIM331
KZN285 LIM475
EC144 NW383 MP302 LIM332
KZN286 EKU NW384 MP303 LIM335
KZN293
ETH NW385 MP316 LIM343
KZN431 FS161 NW401 MP322 LIM344
LIM333
FS162
MP323 LIM351
LIM355 FS163
MP324 LIM474
LIM472
FS164
NC078 MP325 FS181
NC084 NC452
FS182
NW371 NW382 FS183
NW372 NW397
FS184
NW393 FS185
FS191 FS192 FS193 FS194 FS195 FS196 FS201 FS203 FS204 FS205 GT421 GT422 GT423

Univers
ity of
Cap
e Tow
n
August 2013 102
Table 27 continued
Cluster
1
GT481 GT482 GT484 JHB KZN222 KZN225 KZN241 KZN252 KZN282 LIM334 LIM364 LIM365 LIM366 MAN MP304 MP305 MP306 MP307 MP311 MP312 MP313 MP314 MP315 MP321 NC061 NC062 NC064 NC065 NC066 NC067 NC071 NC072 NC073 NC074 NC075 NC076 NC077 NC081 NC082
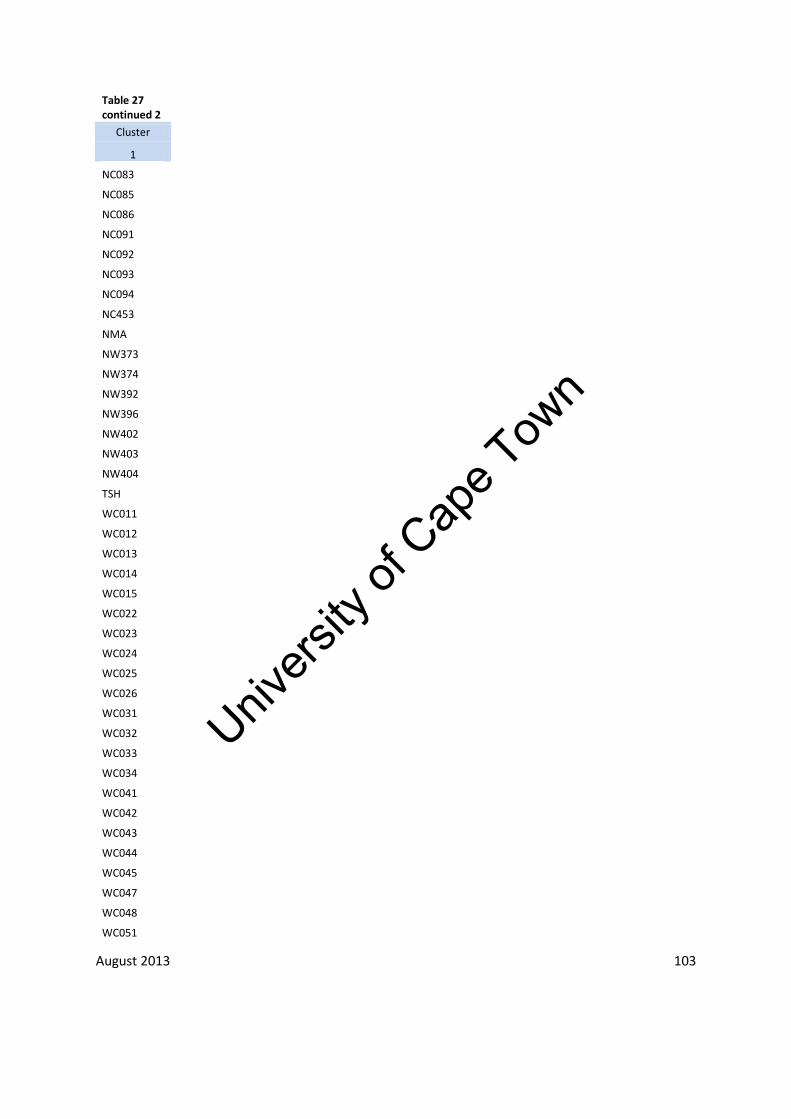
Univers
ity of
Cap
e Tow
n
August 2013 103
Table 27 continued 2
Cluster 1
NC083
NC085
NC086 NC091 NC092 NC093 NC094 NC453 NMA NW373 NW374 NW392 NW396 NW402 NW403 NW404 TSH WC011 WC012 WC013 WC014 WC015 WC022 WC023 WC024 WC025 WC026 WC031 WC032 WC033 WC034 WC041 WC042 WC043 WC044 WC045 WC047 WC048 WC051

Univers
ity of
Cap
e Tow
n
August 2013 104
Table 27 continued 3
Cluster
1
WC052 WC053

Univers
ity of
Cap
e Tow
n
August 2013 105
Appendix 6 – 2001 Sanitation k-means cluster membership Determining the Number of Clusters
Hierarchical cluster analysis produced an agglomeration schedule and the following scree plot was
created, where the distances at which the mergers take place are plotted against the number of
formed clusters.
Figure 31: Illustrating Scree Plot for sanitation 2001
Using the ‘elbow’ method, “where an additional combination of two clusters occurs at a greatly
increased distance” (Vazquez &Sumner, 2012: 18), the Scree plot shows that the suitable number
clusters lays between 6 and 12 clusters. The elbow method (however is not very accurate and is
instead used as a rough guide. The Variance Ratio Criterion, proposed by Calinski and Harabasz
(1974), was used to better determine the number of clusters that maximizes the between-cluster
variation and minimizes the within-cluster variation (Vazquez & Sumner, 2012: 20).
Table 28: Variance Ratio Criterion for sanitation 2001
Number of clusters VRC wk
6 1048.76 -
7 1016.59 -1.94
8 982.49 32.90
9 981.28 101.22
10 1081.30 -167.23
11 1014.09 4.70
12 951.58 -
0
50 000
100 000
150 000
200 000
250 000
300 000
350 000
400 000
233 218 203 188 173 158 143 128 113 98 83 68 53 38 23 8
Co
-eff
icie
nts
Clusters
Scree Plot Sanitation 2001
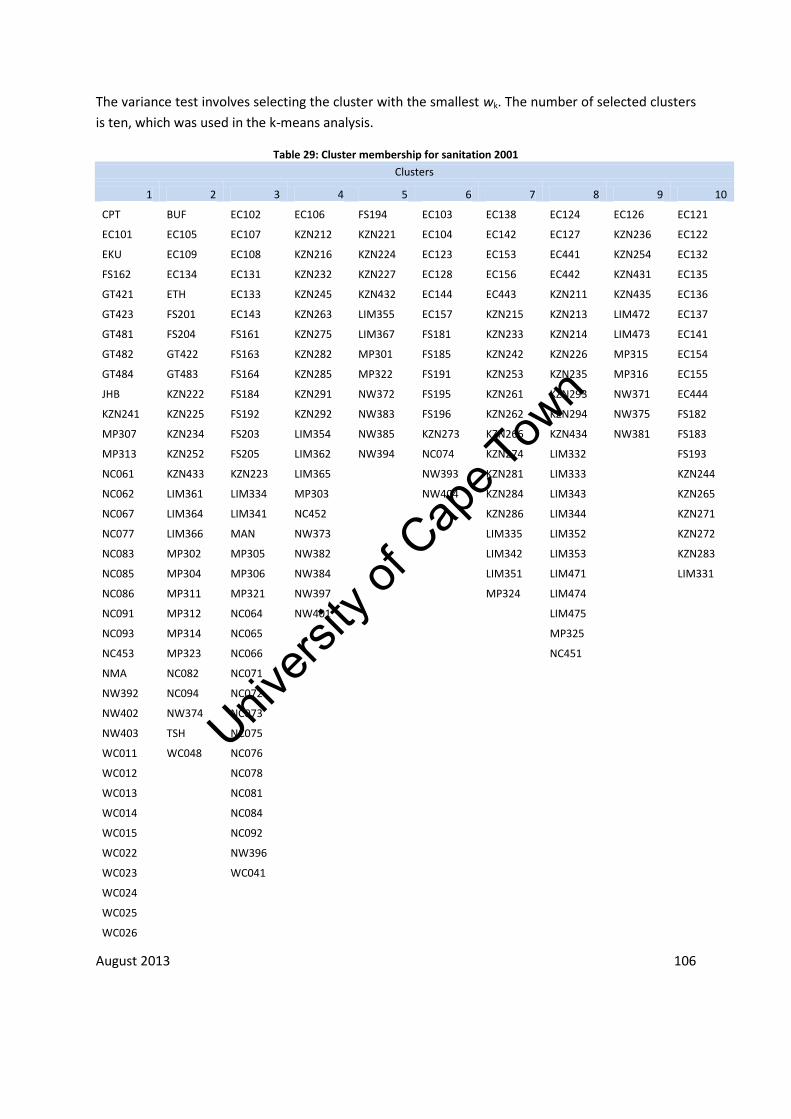
Univers
ity of
Cap
e Tow
n
August 2013 106
The variance test involves selecting the cluster with the smallest wk. The number of selected clusters
is ten, which was used in the k-means analysis.
Table 29: Cluster membership for sanitation 2001
Clusters
1 2 3 4 5 6 7 8 9 10
CPT BUF EC102 EC106 FS194 EC103 EC138 EC124 EC126 EC121
EC101 EC105 EC107 KZN212 KZN221 EC104 EC142 EC127 KZN236 EC122
EKU EC109 EC108 KZN216 KZN224 EC123 EC153 EC441 KZN254 EC132
FS162 EC134 EC131 KZN232 KZN227 EC128 EC156 EC442 KZN431 EC135
GT421 ETH EC133 KZN245 KZN432 EC144 EC443 KZN211 KZN435 EC136
GT423 FS201 EC143 KZN263 LIM355 EC157 KZN215 KZN213 LIM472 EC137
GT481 FS204 FS161 KZN275 LIM367 FS181 KZN233 KZN214 LIM473 EC141
GT482 GT422 FS163 KZN282 MP301 FS185 KZN242 KZN226 MP315 EC154
GT484 GT483 FS164 KZN285 MP322 FS191 KZN253 KZN235 MP316 EC155
JHB KZN222 FS184 KZN291 NW372 FS195 KZN261 KZN293 NW371 EC444
KZN241 KZN225 FS192 KZN292 NW383 FS196 KZN262 KZN294 NW375 FS182
MP307 KZN234 FS203 LIM354 NW385 KZN273 KZN266 KZN434 NW381 FS183
MP313 KZN252 FS205 LIM362 NW394 NC074 KZN274 LIM332
FS193
NC061 KZN433 KZN223 LIM365
NW393 KZN281 LIM333
KZN244
NC062 LIM361 LIM334 MP303
NW404 KZN284 LIM343
KZN265
NC067 LIM364 LIM341 NC452
KZN286 LIM344
KZN271
NC077 LIM366 MAN NW373
LIM335 LIM352
KZN272
NC083 MP302 MP305 NW382
LIM342 LIM353
KZN283
NC085 MP304 MP306 NW384
LIM351 LIM471
LIM331
NC086 MP311 MP321 NW397
MP324 LIM474 NC091 MP312 NC064 NW401
LIM475
NC093 MP314 NC065
MP325 NC453 MP323 NC066
NC451
NMA NC082 NC071 NW392 NC094 NC072 NW402 NW374 NC073 NW403 TSH NC075 WC011 WC048 NC076 WC012
NC078
WC013
NC081 WC014
NC084
WC015
NC092 WC022
NW396
WC023
WC041 WC024
WC025 WC026

Univers
ity of
Cap
e Tow
n
August 2013 107
Table 29 continued
Clusters 1 WC031 WC032
WC033
WC034
WC042 WC043 WC044 WC045 WC047 WC051 WC052 WC053

Univers
ity of
Cap
e Tow
n
August 2013 108
Appendix 7 – 2007 Sanitation k-means cluster membership
Determining the Number of Clusters
Hierarchical cluster analysis produced an agglomeration schedule (see Appendix _) and the following
Scree plot was created. The distances at which the mergers take place are plotted against the
number of formed clusters.
Figure 32: Illustrating Scree Plot for sanitation 2007
Using the ‘elbow’ method, “where an additional combination of two clusters occurs at a greatly
increased distance” (Vazquez &Sumner, 2012: 18), the Scree plot shows that the suitable number
clusters lays between 5 and 11 clusters. The elbow method (however is not very accurate and is
instead used as a rough guide. The Variance Ratio Criterion, proposed by Calinski and Harabasz
(1974), was used to better determine the number of clusters that maximizes the between-cluster
variation and minimizes the within-cluster variation (Vazquez & Sumner, 2012: 20).
Table 30: Variance Ratio Criterion for sanitation 2007
Number of clusters VRC wk
5 1184.73 -
6 1070.30 79.87
7 1035.73 53.78
8 1054.94 -118.30
9 955.85 15.59
10 872.34 122.81
0
10
20
30
40
50
233 218 203 188 173 158 143 128 113 98 83 68 53 38 23 8
Co
-eff
icie
nts
Clusters
Scree Plot 2007 Sanitation

Univers
ity of
Cap
e Tow
n
August 2013 109
The variance test involves selecting the cluster with the smallest wk. The number of selected clusters
is thus eight, which was used in the k-means analysis.
Table 31: Cluster membership for sanitation 2007
Clusters
1 2 3 4 5 6 7 8
CPT BUF EC142 EC103 EC124 EC126 EC121 EC441
EC101 EC105 KZN226 EC123 EC127 EC138 EC122 KZN214
EC102 EC106 KZN233 EC128 FS194 EC141 EC132 KZN224
EC104 EC134 KZN262 FS163 KZN216 EC442 EC135 KZN293
EC107 ETH KZN266 FS181 KZN253 KZN211 EC136 KZN294
EC108 FS161 KZN271 FS183 KZN285 KZN213 EC137 LIM332
EC109 GT483 KZN273 FS185 KZN291 KZN215 EC153 LIM343
EC131 KZN212 KZN281 FS191 KZN432 KZN221 EC154 LIM344
EC133 KZN222 KZN283 FS195 LIM354 KZN227 EC155 LIM352
EC143 KZN223 NC451 FS196 LIM362 KZN235 EC156 LIM353
EC144 KZN225
NC074 LIM367 KZN236 EC157 LIM355
EKU KZN232
NC075 MP322 KZN254 EC443 LIM471
FS162 KZN234
NW404 NC452 KZN261 EC444 LIM472
FS164 KZN245
NW372 KZN274 FS182 LIM473
FS184 KZN252
NW382 KZN431 FS193 LIM474
FS192 KZN263
NW383 KZN434 KZN242 LIM475
FS201 KZN275
KZN435 KZN244 MP301
FS203 KZN282
LIM333 KZN265 MP315
FS204 KZN292
LIM335 KZN272 MP316
FS205 KZN433
LIM342 KZN284 MP325
GT421 LIM334
LIM351 KZN286 NW371
GT422 LIM341
MP324 LIM331 NW375
GT423 LIM361
NW394
NW381
GT481 LIM365
NW397
NW385
GT482 MAN GT484 MP303 JHB MP304 KZN241 MP312 LIM364 MP321 LIM366 MP323 MP302 NC064 MP305 NC066 MP306 NC072 MP307 NC078 MP311 NC081 MP313 NC082 MP314 NC084
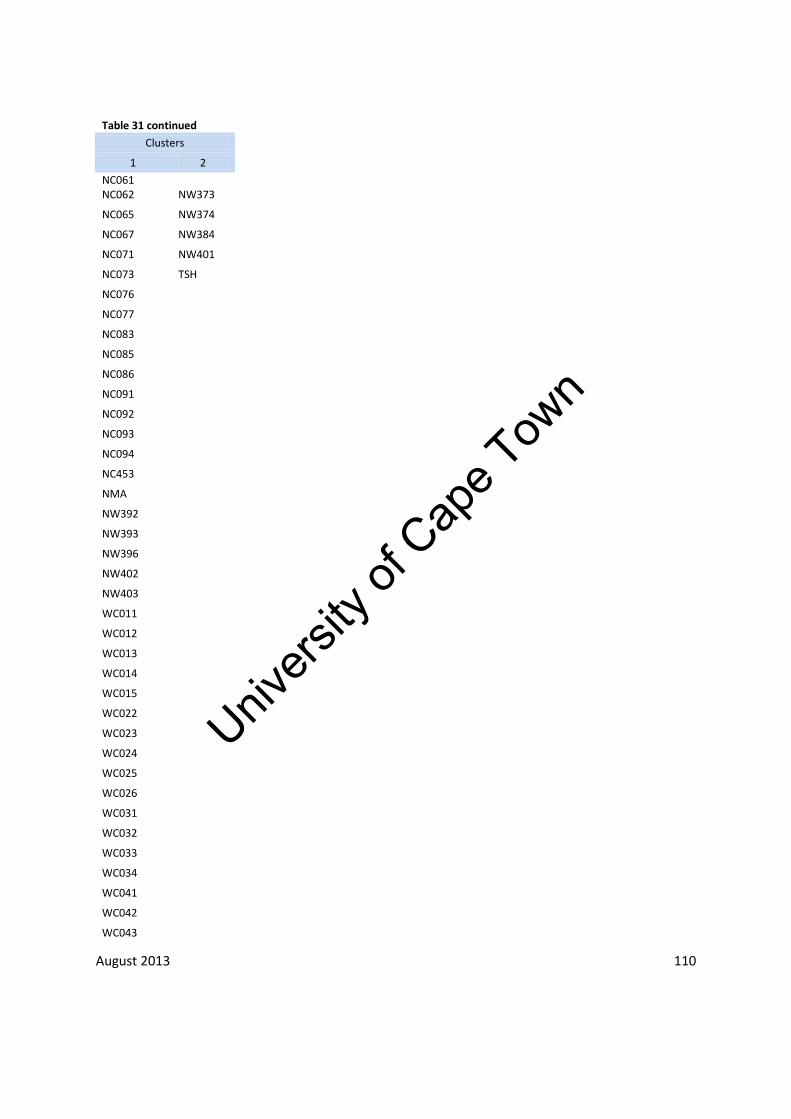
Univers
ity of
Cap
e Tow
n
August 2013 110
Table 31 continued
Clusters
1 2 NC061 NC062 NW373
NC065 NW374 NC067 NW384 NC071 NW401 NC073 TSH NC076
NC077 NC083 NC085 NC086 NC091 NC092 NC093 NC094 NC453 NMA NW392 NW393 NW396 NW402 NW403 WC011 WC012 WC013 WC014 WC015 WC022 WC023 WC024 WC025 WC026 WC031 WC032 WC033 WC034 WC041 WC042 WC043

Univers
ity of
Cap
e Tow
n
August 2013 111
Table 32 continued 2
Cluster 1 WC044
WC045
WC047
WC048 WC051 WC052 WC053

Univers
ity of
Cap
e Tow
n
August 2013 112
Appendix 8 – 2011 Sanitation k-means cluster membership
Determining the Number of Clusters
Hierarchical cluster analysis produced an agglomeration schedule (see Appendix _) and the following
cree plot was created. The distances at which the mergers take place are plotted against the number
of formed clusters.
Figure 33: Illustrating Scree Plot for 2011 Sanitation
The Scree plot shows that the suitable number clusters lays between 5 and 11 clusters. The elbow
method however is not very accurate and is instead used as a rough guide. The Variance Ratio
Criterion, proposed by Calinski and Harabasz (1974), was used to better determine the number of
clusters that maximizes the between-cluster variation and minimizes the within-cluster variation
(Vazquez & Sumner, 2012: 20).
Table 32: Variance Ratio Criterion for 2011 Sanitation
Number of clusters VRC wk
5 1329.82 -
6 1149.93 453.48
7 1423.53 -457.88
8 1239.25 58.81
9 1113.78 95.37
10 1083.69 198.10
11 1251.69 -
0
100 000
200 000
300 000
400 000
500 000
233 218 203 188 173 158 143 128 113 98 83 68 53 38 23 8
Co
-eff
icie
nts
Clusters
Scree Plot 2011 Sanitation

Univers
ity of
Cap
e Tow
n
August 2013 113
The variance test involves selecting the cluster with the smallest wk. The number of selected clusters
is 7, which was used in the k-means analysis.
Table 33: Cluster membership for sanitation 2011
Clusters
1 2 3 5 6 7
CPT EC132 BUF EC123 EC121 EC126
EC101 FS182 EC104 EC124 EC122 EC153
EC102 KZN261 EC105 EC127 EC135 EC442
EC103 KZN273 EC106 EC157 EC136 KZN213
EC107 LIM362 EC128 FS194 EC137 KZN214
EC108 NC064 EC134 KZN216 EC138 KZN211
EC109 NC066 ETH KZN212 EC141 KZN224
EC131 NC081 FS163 KZN285 EC154 KZN286
EC133 NW401 FS185 KZN245 EC155 KZN281
EC143
FS191 KZN253 EC156 KZN435
EC144
FS193 KZN263 EC444 KZN254
EKU
FS195 KZN291 KZN272 KZN294
FS161
FS196 KZN292 KZN275 KZN293
FS162
FS204 LIM334 KZN284 LIM332
FS164
GT483 LIM354 KZN262 LIM333
FS181
KZN222 LIM367 KZN265 LIM335
FS183
KZN223 MP303 KZN266 LIM343
FS184
KZN225 MP322 LIM331 LIM344
FS192
KZN232 NW372
LIM351
FS201
KZN234 NW382
LIM352
FS203
KZN252 NW383
LIM353
FS205
KZN282 NW384
LIM355
GT421
KZn432 NC452
LIM471
GT422
KZN433
LIM472
GT423
LIM341
LIM473
GT481
LIM361
LIM474
GT482
LIM364
LIM475
GT484
LIM365
MP315
JHB
MAN
MP316
KZN241
MP302
MP325
LIM366
MP304
NW371
MP305
MP312
NW375
MP306
MP321
NW381
MP307
MP323
NW385
MP311
NC074
NW394
MP313
NC076

Univers
ity of
Cap
e Tow
n
August 2013 114
Table 33 continued
Clusters
1 3
MP314
NC077 NC061
NC078
NC062
NC082 NC065
NC084
NC067
NC085 NC071
NC092
NC072
NC094 NC073
NW373
NC075
NW374 NC083
NW392
NC086
NW393 NC091
WC011
NC093 NC453 NMA NW396 NW402 NW403 NW404 TSH WC012 WC013 WC014 WC015 WC022 WC023 WC024 WC025 WC026 WC031 WC032 WC033 WC034 WC041 WC042 WC043 WC044 WC045 WC047 WC048
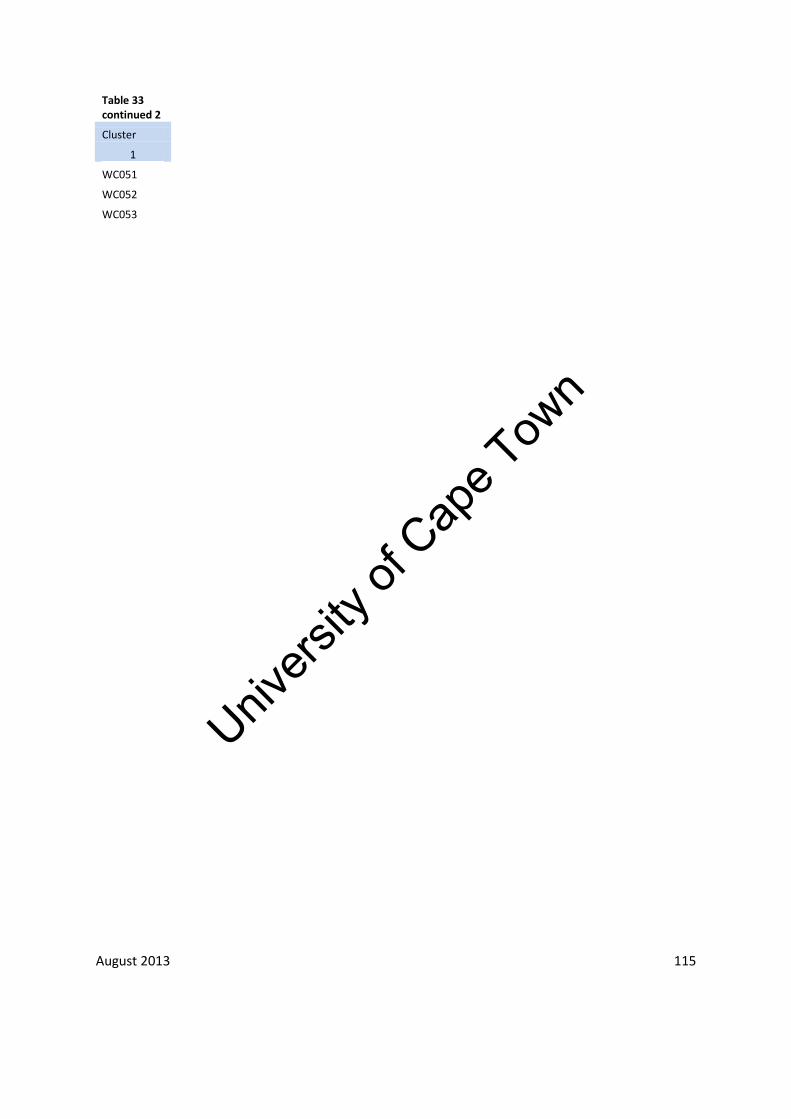
Univers
ity of
Cap
e Tow
n
August 2013 115
Table 33 continued 2
Cluster
1
WC051
WC052 WC053