Water Supply and Sanitation in Togo · Supply and Sanitation in Togo Turning Finance into Services...
32
An AMCOW Country Status Overview Water Supply and Sanitation in Togo Turning Finance into Services for 2015 and Beyond
Transcript of Water Supply and Sanitation in Togo · Supply and Sanitation in Togo Turning Finance into Services...

For enquiries, contact:Water and Sanitation Program–Africa RegionThe World Bank, Upper Hill RoadP.O. Box 30577, 00100, Nairobi, KenyaTel: +(254) 20 322 6300 E-mail: [email protected] site: www.wsp.org
An AMCOW Country Status Overview
Water Supply and Sanitation in TogoTurning Finance into Services for 2015 and Beyond

The first round of Country Status Overviews (CSO1) published in 2006 benchmarked the preparedness of sectors of 16 countries in Africa to meet the WSS MDGs based on their medium-term spending plans and a set of ‘success factors’ selected from regional experience. Combined with a process of national stakeholder consultation, this prompted countries to ask whether they had those ‘success factors’ in place and, if not, whether they should put them in place.
The second round of Country Status Overviews (CSO2) has built on both the method and the process developed in CSO1. The ‘success factors’ have been supplemented with additional factors drawn from country and regional analysis to develop the CSO2 scorecard. Together these reflect the essential steps, functions and results in translating finance into services through government systems—in line with Paris Principles for aid effectiveness. The data and summary assessments have been drawn from local data sources and compared with internationally reported data, and, wherever possible, the assessments have been subject to broad-based consultations with lead government agencies and country sector stakeholders, including donor institutions.
This second set of 32 Country Status Overviews (CSO2) on water supply and sanitation was commissioned by the African Ministers’ Council on Water (AMCOW). Development of the CSO2 was led by the World Bank administered Water and Sanitation Program (WSP) in collaboration with the African Development Bank (AfDB), the United Nations Children’s Fund (UNICEF), the World Bank and the World Health Organization (WHO).
This report was produced in collaboration with the Government of Togo and other stakeholders during 2009/10. Some sources cited may be informal documents that are not readily available.
The findings, interpretations, and conclusions expressed in this volume do not necessarily reflect the views of the collaborating institutions, their Executive Directors, or the governments they represent. The collaborating institutions do not guarantee the accuracy of the data included in this work. The boundaries, colors, denominations, and other information shown on any map in this work do not imply any judgment on the part of the collaborating institutions concerning the legal status of any territory or the endorsement or acceptance of such boundaries.
The material in this publication is copyrighted. Requests for permission to reproduce portions of it should be sent to [email protected]. The collaborating institutions encourage the dissemination of this work and will normally grant permission promptly. For more information, please visit www.amcow.net or www.wsp.org.
Photograph credits: Getty Images
© 2011 Water and Sanitation Program

1
Water Supply and Sanitation in TogoTurning Finance into Services for 2015 and Beyond
An AMCOW Country Status Overview

2
Strategic Overview
Since the early 1990s, Togo experienced a period of political instability which severely hampered the development of its water supply and sanitation infrastructure. Pro-active institutional reform of the water supply sector initiated in 1999, ongoing to date, is enabling the country to gradually get the sector back on track. The sector’s policy and regulatory framework is now being developed. Although still incomplete, particularly for sanitation, this framework has greatly improved over the last few years. In 2006 Togo put in place a national policy for water supply and sanitation in rural and semi-rural areas. In addition, there is a complementary integrated water resources management policy and strategy.
Nevertheless, Togo will not meet its Millennium Development Goal (MDG) targets. Overall the access rates are still very low. National data shows that only one-third of the population has access to an improved source of drinking water and to improved sanitation facilities.
To meet the MDG targets, this figure needs to increase twofold, yet the current development trends are not very encouraging. The overall service quality is below average, as all the subsectors suffer from severe lack of finance: the urban water supply subsector is not able to cover its operating costs through the tariff, nor is it able to attract external funding. The contribution of users and development partners to the rural water supply subsector
is also insufficient. Lastly, households’ limited ability to pay and limited hygiene awareness means households are not motivated to install their own sanitation facilities. The number and capacity of the sector stakeholders is too limited to offset this trend.
As far as financing is concerned, budget forecasts fall well below requirements. The allocation of funds still lacks transparency. Furthermore, the financial instability of services means that the opportunities for self-funded expansion are few and far between and are highly dependent upon ad hoc funding.
The main challenge now lies in continuing the institutional reform and overall improvement efforts within the sector. The ongoing reforms should enable effective implementation of investment plans, improved monitoring and coordination of stakeholder interventions, as well as domestic stakeholder capacity-building. Only once these conditions are met will Togo be able to attract increased commitments from international support agencies, thereby remedying the chronic underinvestment currently plaguing the sector.
This second AMCOW Country Status Overview (CSO2) has been produced in collaboration with the Government of Togo and other stakeholders.
An AMCOW Country Status Overview
2

3
Rural water supply• Improvethewayinwhichtheruralandsemi-urbanpolicyiscommunicated,asthereisstilllittleawarenessofthis
amongst stakeholders, and define strategies for its implementation. • Improvethelocalparticipationofcommunities,whoareoftenunawareoftheroleattributedtothemunderthe
national policy, meaning they are not systematically involved in projects.
Urban water supply• Clarifytheinstitutionalframeworkofthesubsectorwiththecreationofanasset-holdingcompany.• Mobilizeadditionalfinancialresourcestofundtheincreaseinproductioncapacity,theextensionofwatersupply
networks and promote affordable connections. • Reviewthetariffstructuretocreateatoolthat(a)guaranteesacostrecoveryforboththeoperatorandtheasset-
holding company; (b) reduces inequality through cross-subsidies and prevents water being wasted; (c) leads to financial sustainability within the subsector; and (d) is simple to set up.
3
Sectorwide• Finalize the institutional structure of the sector, particularly by integrating the decentralized local authorities,
nongovernmentalorganizations,andwaterusers’associations.• Developnationalfundingchannelsforallsectors,prioritizingsanitation.• Improvebudgetcontrolmechanismsbyensuringfinancialdataisconsistentandbyensuringthemajorityofdonor
financing is included in the state budget. • Putinplaceacoherentandcomprehensivesystemformonitoringsectoractivity(physicalandfinancial)soastobe
able to control and improve the effectiveness of public expenditure.
Agreed priority actions to tackle these challenges, and ensure finance is effectively turned into services, are:
Water Supply and Sanitation in Togo: Turning Finance into Services for 2015 and Beyond
Urban sanitation and hygiene• Clarifytheinstitutionallandscapeofthesectortoimproveitscoordination:addresstheissueofconflictingcontracting
authority responsibilities between the Directorate of Sanitation and the communes, appoint an institutional lead, and so on.
• Encouragepitemptyingservicesanddevelopsludgetreatmentfacilities.
Rural sanitation and hygiene• Onaninstitutionallevel,ensuresectorcoordinationbyclarifyingrolesandclearlydefininganinstitutionallead.• Adoptaclearandambitious investmentplanthatenablesadditionalfinancial resourcestobemobilizedtofund
subsidy mechanisms for infrastructure and awareness-raising. • Selecteffectivetoolsforthedevelopmentoflatrines:putapublicsubsidysysteminplaceand/orincreasepromotional
andawareness-raisingactivitiesand/ortheestablishmentofcreditsystems.

4

5
Acronyms and Abbreviations ........................................................................................................................... 6
1. Introduction .................................................................................................................................................... 7
2. Sector Overview: Coverage and Finance Trends ............................................................................................... 8
3. ReformContext:IntroducingtheCSO2Scorecard ......................................................................................... 11
4. Institutional Framework ................................................................................................................................ 13
5. Financing and its Implementation .................................................................................................................. 15
6. SectorMonitoringandEvaluation ................................................................................................................. 17
7. Subsector:RuralWaterSupply ...................................................................................................................... 18
8. Subsector: Urban Water Supply ..................................................................................................................... 20
9. Subsector:RuralSanitationandHygiene ....................................................................................................... 22
10. Subsector:UrbanSanitationandHygiene ...................................................................................................... 24
NotesandReferences ................................................................................................................................... 26
Contents

6
Acronyms and Abbreviations
AEP(A) WaterSupply(andSanitation)(Approvisionnement en eau potable (et assainissement))
AFD French Development Agency (Agence française de développement)
AfDB African Development BankAMCOW African Ministers’ Council on WaterCAPEX CapitalexpenditureCLTS Community-Led Total SanitationCSO2 Country Status Overview (second round)DAEP DirectorateofWaterSupply(Direction de
l’Approvisionnement en Eau Potable)DGEA GeneralDirectorateofWaterandSanitation
(Direction Générale de l’Eau et de l’Assainissement)
DHE DirectorateofWaterSupplyandEnergy(Direction de l’Hydraulique et de l’Energie)
DHV DirectorateofVillageWaterSupply(Direction de l’Hydraulique Villageoise)
DP Development partnerEU EuropeanUnionFODESEPA DevelopmentfundfortheWSSsectorin
urban areas (Fonds de développement du secteur de l’eau potable et de l’assainissement en milieu urbain)
GNI Gross national incomeIWRM IntegratedWaterResourcesManagementJMP JointMonitoringProgramme(UNICEF/WHO)MAEP MinistryofAgriculture,Livestockand
Fisheries (Ministère de l’Agriculture, de l’Élevage et de la Pêche)
MDG Millennium Development GoalMEAHV MinistryofWater,SanitationandVillageWater
Supply (Ministère de l’Eau de l’Assainissement et de l’Hydraulique Villageoise)
M&E Monitoringandevaluation
MERF MinistryoftheEnvironmentandForestResources(Ministère de l’Environnement et des Ressources Forestières)
MICS Multiple Indicator Cluster Survey MUH MinistryofUrbanDevelopmentand
Housing (Ministère de l’Urbanisme et de l’Habitat)
NGO NongovernmentalorganizationO&M Operation and maintenanceOPEX OperationsexpenditurePAP Priority Action Program
(Programme d’Actions Prioritaires)PANSEA NationalactionplanfortheWSSsector
(Plan d’Action National pour le Secteur de l’Eau et de l’Assainissement)
PIP Priority Investment Program (Programme d’Investissements Prioritaires)
PNHAT NationalHygieneandSanitationPolicyforTogo (Politique Nationale d’Hygiène et d’Assainissement au Togo)
PRSP-C (Complete)PovertyReductionStrategyPaper
RNET Togonationalwatercompany (Régie Nationale des Eaux du Togo)
RSH RuralsanitationandhygienesubsectorRWS RuralwatersupplysubsectorSSA Sub-Saharan AfricaTdE Togolesewatercompany
(Société Togolaise des Eaux)UNDP United Nations Development ProgrammeUNICEF UnitedNationsChildren’sFundUSH UrbansanitationandhygienesubsectorUWS Urban water supply subsectorWHO WorldHealthOrganizationWSP Water and Sanitation ProgramWSS Water Supply and Sanitation
Exchangerate:US$1=472.1863CFAFrancs.1
An AMCOW Country Status Overview

7
1. Introduction
The African Ministers’ Council on Water (AMCOW) commissioned the production of a second round of Country Status Overviews (CSOs) to better understand what underpins progress in water supply and sanitation and what its member governments can do to accelerate that progress across countries in Sub-Saharan Africa (SSA).2 AMCOW delegated this task to the World Bank’s Water and Sanitation Program and the African Development Bank who are implementing it inclosepartnershipwithUNICEFandWHOinover30countriesacrossSSA.ThisCSO2reporthasbeenproducedincollaborationwiththeGovernmentofTogoandotherstakeholdersduring2009/10. The analysis aims to help countries assess their own service delivery pathways for turning finance into water supply and sanitation services in each of four subsectors: rural and urban water supply, and rural and urban sanitation and hygiene. The CSO2 analysis has three main components: a review of past coverage; a costing model to assess the adequacy of future investments; and a scorecard which allows diagnosis of particular bottlenecks along the service delivery pathway. The CSO2’s contribution is to answer not only whether past trends and future finance are sufficient to meet sector targets, but what specific issues need to be addressed to ensure finance is effectively turned into accelerated coverage in water supply and sanitation. In this spirit, specific priority actions have been identified through consultation. A synthesis report,availableseparately,presentsbestpracticeandsharedlearningtohelprealizethesepriorityactions.
Water Supply and Sanitation in Togo: Turning Finance into Services for 2015 and Beyond

8
2. Sector Overview: Coverage and Finance Trends
Coverage: Assessing Past Progress
The unfavorable economic situation that has resulted from years of political crisis, added to the lack of international finance, is one of the reasons why the water supply and sanitation (WSS) access rates are so low. The current rate of progress is not encouraging and will not enable Togo to achieve the Millennium Development Goal (MDG) targets unless there is a dramatic change in pace. As can be seen in Table 1, there are significant differences between the data reported by sector authorities3 and that of the Joint
Monitoring Programme (JMP),4 partly because these two sources use different calculation methods. This report uses the JMP access rates published in the 2010 report,5 aimed mainly at providing regional comparisons. According to these two data sources, there needs to be a twofold (for water supply) or tenfold increase (for sanitation and hygiene) in progress if the MDG targets are to be met by 2015.
According to the JMP, to reach the MDG targets, Togo needs to guarantee access to drinking water to 75
An AMCOW Country Status Overview
Figure 1Progress in water supply and sanitation coverage
Sanitation 100%
80%
60%
40%
20%
0%1985 1990 1995 2000 2005 2010 2015 2020
Government estimates
JMP, improved
Government target
MDG target
Cov
erag
e
Water supply
100%
80%
60%
40%
20%
0%1985 1990 1995 2000 2005 2010 2015 2020
Government estimates
JMP, improved
Government target
MDG target
Cov
erag
e
Sources: JMP and national data.
Table 1Current and target access rates to water supply and sanitation services
Current access rate 2015 targets
JMP data (2008)
National data (2007)
JMP data National data
Water supply — all areas 60% 33% 75% 66%
Water supply — rural areas (including semi-rural) 41% 30% 68% 63%
Water supply — urban areas 87% 39% 90% 69%
Sanitation — all areas 12% 32% 57% 73%
Sanitation — rural areas (including semi-rural) 3% 10% 54% 61%
Sanitation — urban areas 24% 67% 63% 87%
Sources: JMP and national data.6

9
percent of its population, compared to the access rate in 2008 which stood at 60 percent. Togo also needs to provide access to improved sanitation facilities to 57 percent of its population, compared to an access rate of 12 percent in 2008 (see Table 1 and Figure 1). On average, 110,000 additional people have gained access to drinking water each year since 1990 compared to the 260,000 required going forward. As far as sanitation is concerned, the situation is even more acute as fewer than 14,000 additional people have gained access to improved sanitation facilities each year, whereas the requirement for reaching the MDG target stands at 505,000 going forward (37 times more).
Investment Requirements: Testing the Sufficiency of Finance
The investment requirements are considerably higher for the sanitation sector than for the water supply sector(US$386millioncomparedwithUS$204million);7 however, the prospects for investment are far better for water supply than for sanitation (60 percent of finance committed compared to 5 percent).8 All the investment requirements identified concern the construction and rehabilitation of infrastructure and do not include operation and maintenance (O&M) costs.
For drinking water, the tariff paid by users in both urban and rural areas is not sufficient to cover investment, meaning
that this investment has to be financed by the state with the support of development partners (DPs). With regard to this financing, the state and external support agencies’ commitments for the years to come stand at around US$17.4millionperyear,whichequatesto60percentoftheestimatedrequirement.However,thereisasignificantdifference between subsectors: of the US$16.4 millionrequired,US$14.5millionperyearhasbeencommittedforrural water supply, covering 88 percent of the requirement; incontrast,lessthanUS$3millionperyearoftheUS$12.8millionrequiredhasbeenmobilizedforurbanwatersupply,which equates to only 23 percent of the investment required (see Table 2).
As far as sanitation is concerned, the national policy does not give guidance on whether on-site sanitation should be subsidized.US$2.8millionisforecasteachyearforpublicinvestment within the sector; this is considerably lower thantheestimatedrequirementofUS$55.1million.ThefundingdeficitthereforestandsatUS$52.3millionperyear(see Figure 2 and Table 2). Although part of this financing could be taken on by households, by encouraging them to invest in the construction of their own latrines, it is unrealistic to expect families to fund these latrines in full. The costs pertaining to this sector should be met, at least in part, by the public authorities (regardless of the method chosen: contributing equipment, mobilizing awareness-raising teams, using community-led total sanitation, or CLTS, techniques, and so on).
Sanitation
0 20 40 60 80
RequiredCAPEX
US$million/year
PublicCAPEX(anticipated)
HouseholdCAPEX(assumed)
CAPEXdeficit
Water supply
Figure 2Required vs. anticipated (public) and assumed (household) expenditure for water
0 10 20 30 40 50
RequiredCAPEXRequired OPEX
US$million/year
PublicCAPEX(anticipated)
HouseholdCAPEX(assumed)
CAPEXdeficit
Source: CSO2 estimates.
Water Supply and Sanitation in Togo: Turning Finance into Services for 2015 and Beyond
Required OPEX
10
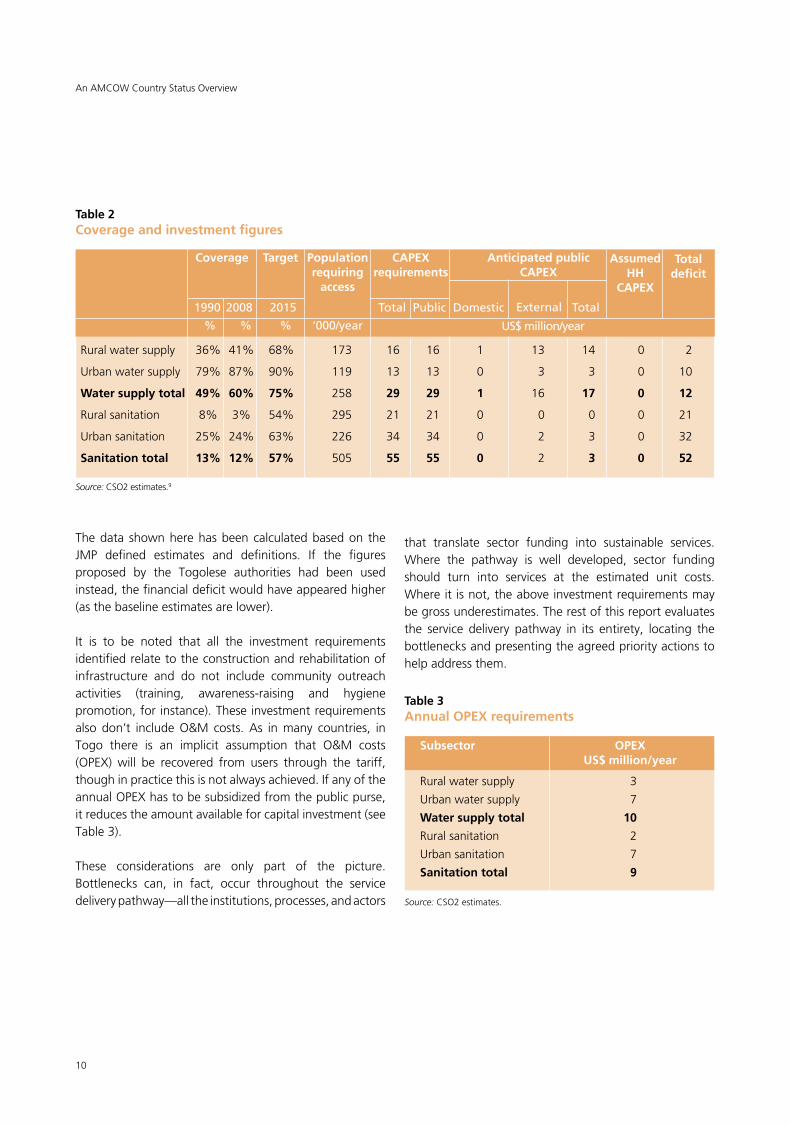
Table 3Annual OPEX requirements
Subsector OPEX US$ million/year
Ruralwatersupply 3
Urban water supply 7
Water supply total 10
Ruralsanitation 2
Urban sanitation 7
Sanitation total 9
Source: CSO2 estimates.
The data shown here has been calculated based on the JMP defined estimates and definitions. If the figures proposed by the Togolese authorities had been used instead, the financial deficit would have appeared higher (as the baseline estimates are lower).
It is to be noted that all the investment requirements identified relate to the construction and rehabilitation of infrastructure and do not include community outreach activities (training, awareness-raising and hygiene promotion, for instance). These investment requirements also don’t include O&M costs. As in many countries, in Togo there is an implicit assumption that O&M costs (OPEX) will be recovered from users through the tariff,though in practice this is not always achieved. If any of the annualOPEXhastobesubsidizedfromthepublicpurse,it reduces the amount available for capital investment (see Table 3).
These considerations are only part of the picture. Bottlenecks can, in fact, occur throughout the service delivery pathway—all the institutions, processes, and actors
An AMCOW Country Status Overview
Table 2Coverage and investment figures
Source: CSO2 estimates.9
Coverage Target Population CAPEX Anticipated public requiring requirements CAPEX access
1990 2008 2015 Total Public Domestic Total
% % % ‘000/year Ruralwatersupply 36% 41% 68% 173 16 16 1 13 14 0 2
Urban water supply 79% 87% 90% 119 13 13 0 3 3 0 10
Water supply total 49% 60% 75% 258 29 29 1 16 17 0 12
Ruralsanitation 8% 3% 54% 295 21 21 0 0 0 0 21
Urban sanitation 25% 24% 63% 226 34 34 0 2 3 0 32
Sanitation total 13% 12% 57% 505 55 55 0 2 3 0 52
US$ million/year
Total deficit
that translate sector funding into sustainable services. Where the pathway is well developed, sector funding should turn into services at the estimated unit costs. Where it is not, the above investment requirements may be gross underestimates. The rest of this report evaluates the service delivery pathway in its entirety, locating the bottlenecks and presenting the agreed priority actions to help address them.
External
Assumed HH
CAPEX

11
Water Supply and Sanitation in Togo: Turning Finance into Services for 2015 and Beyond
3. Reform Context: Introducing the CSO2 Scorecard
Since the early 1990s, Togo experienced a period of political instability which severely hampered the development of its water supply and sanitation infrastructure. Pro-active institutional reform of the water supply sector was initiated in 1999 and is still continuing today, enabling the country to gradually get the sector back on track (see Table 4). The sector’s policy and regulatory framework is now being developed. Although still incomplete, this framework has greatly improved over the last few years, which bodes well for the reform of the sector for the years to come.However, this reformprocesshas so faroverlooked sanitation, focusing instead on the water supply subsectors.
This brief introduction puts the service delivery pathway in context, which can then be explored in detail using the CSO2 scorecard, an assessment tool providing a snapshot of reform progress along the service delivery pathway. This scorecard looks at nine building blocks of the service delivery pathway, which correspond to specific functions classified in three categories: three functions that refer to enabling conditions for putting services in place (policy development, planning new undertakings, budgeting); three actions that relate to developing the service (expenditure of funds, equity in the use of these funds, service output) and three functions that relate to sustaining these services (facility maintenance, expansion of infrastructure, use of the service).10Eachbuildingblockis assessed against specific indicators and scored from 1 (poor) to 3 (excellent) accordingly.
The scorecard results for Togo show that the performance of the WSS sector falls within the average of other low-income countries with a gross national income (GNI) belowUS$500percapita(WorldBankAtlasMethod)fordeveloping and sustaining services. As far as enabling conditions are concerned, Togo’s results are slightly below those of its peer group countries (see Figure 3).
Since 2006, Togo has had a National Policy in place for water supply and sanitation in rural and semi-rural areas that serves to guide interventions within the sector. It is based on the following fundamental principles: (a) water
supply, sanitation, and health cannot be separated; (b) the water service includes a sanitation component; (c) a participatory approach; (d) a demand-driven approach; (e) a program-approach, as opposed to a project-approach that only provides ad hoc responses to demand with no overall vision; and (f) a gender-sensitive approach. The national policy document clearly sets out the division of roles and responsibilities between each stakeholder, from centraltodecentralizedlevel.Itshouldbenotedthatthisdocument focuses more on issues related to water supply than those of sanitation.
In addition to this document, there is also a National Policy andStrategyforIntegratedWaterResourcesManagement(IWRM) document that forms the second part of thenational policy for the WSS sector. This document, approved in 2007, sets out a two-phase action plan for managing waterresourcesinaccordancewithIWRMprinciples.
Both aNationalHygiene and Sanitation Policy for Togo(PNHAT:Politique Nationale d’Hygiène et d’Assainissement pour le Togo) and a strategic implementation plan were
Figure 3Average scorecard results for enabling, developing, and sustaining service delivery, and peer-group comparison
Enabling
Sustaining Developing
Togo average scores
Averages,LICs,GNIp.p.<=US$500
Source: CSO2 scorecard.

12
developed in 2001, but these documents were never adopted by the government. In 2009, the ministry in charge of health undertook to revisit the 2001 document, with the support of the United Nations Children’s Fund (UNICEF).Thenationalpolicywasapprovedataworkshopin November 2009 and is shortly due to be adopted by the government. More policy direction is still needed on whetherandhowtosubsidizehouseholdsanitation.
AspartoftheongoingIWRMprocess,theNationalWaterPolicy is currently being developed within the General Directorate of Water and Sanitation (DGEA). This taskshould (a) develop policies that are as yet undefined (WSS in urban areas, for example) and group all existing subsector policies together in one document based on a clearly stated vision; and (b) set out the directions and strategic approaches required for implementing thispolicy,whichwill thenformthebasisofthe IWRMaction plan.
TheaimsoftheIWRMActionPlan(PAGIRE-TOGO),whichis also under development, are to (a) set out the sector strategies for implementing the national water policy, based on the directions and strategic approaches defined in the policy itself; (b) list the anticipated results, actions,
An AMCOW Country Status Overview
and sector activities within a logical framework; (c) set out the budget forecast and financing strategy; and (d) define the implementation methods (pilot, phases, monitoring and evaluation, risk factors, timeline, and so on).
Lastly,aWSSSectorActionPlan(PANSEA:Plan d’Action du Secteur Eau et Assainissement), a synthesis of the main sector program documents (in particular, the 2007 MDG ActionPlanandPAGIRE),wasproducedatthebeginningof2010 with assistance from the United Nations Development Programme (UNDP); this is due to be presented to all main national and international partners at a sector conference planned for the second half of 2011.
Table 4 provides a summary of the main steps taken as part of the WSS sector reform process in Togo. Sections 4 to 6 then highlight progress and challenges across three thematic areas—the institutional framework, finance and monitoring and evaluation (M&E)—benchmarkingTogo against its peer countries based on a grouping by gross national income (GNI). The related indicators are extracted from the scorecard and presented in charts at the beginning of each section. The scorecards for each subsector are presented in their entirety in Sections 7 to 10.
Table 4Key dates in the reform of the sector in Togo
Year Event
12/65 Creationofthewatercompany,Régie Nationale des Eaux du Togo(RNET).
10/80 Creationof theDirectorateofWater Supply andEnergy (DHE:Direction de l’Hydraulique et de l’Energie), todayknownastheGeneralDirectorateofWaterandSanitation(DGEA:Direction Générale de l’Eau et de l’Assainissement).
12/90 RNETbecomesastate-ownedcompany.
10/01 Publicationofthelastinterministerialdecreeontariffadjustmentsforthewatersupplyserviceinurbanareas.
11/03 Creationofadevelopmentfundforthewatersupplyandsanitationsectorinurbanareas(FODESEPA).
2006–07 Signature of the Global Political Accord (Accord Politique Global, 08/06), establishment of a Government of NationalUnion,andorganizationofanticipatedlegislativeelections(10/07):resumptionofcooperationwithdevelopment partners.
08/08 Launchof urbanwater supply subsector reforms aimed at creating an asset-holding company (Société de Patrimoine) and restructuring the Société Togolaise des Eaux(TdE)asaleaseoperatingcompany.
11/09 Approvalof theNationalHygieneandSanitationPolicy forTogo (PNHAT:Politique Nationale d’Hygiène et d’Assainissement au Togo).
11/09 AdoptionbythegovernmentofabillpertainingtotheWaterLaw.
12/09 Adoptionbythegovernmentofabillpertainingtotheorganizationofthewatersupplypublicserviceandthedomestic wastewater sewerage system public service.

13
Water Supply and Sanitation in Togo: Turning Finance into Services for 2015 and Beyond
4. Institutional Framework
The WSS sector in Togo is managed by public agencies and other institutions that mainly come under the Ministry ofWater,Sanitation,andVillageWaterSupply(MEAHV:Ministère de l’Eau, de l’Assainissement et de l’Hydraulique Villageoise),theMinistryofHealth(Ministère de la Santé), the Ministry of the Environment and Forest Resources(MERF:Ministère de l’Environnement et des Ressources Forestières), the Ministry of Urban Development and Housing(MUH:Ministère de l’Urbanisme et de l’Habitat), and the Ministry of Agriculture, Livestock, and Fisheries (MAEP:Ministère de l’Agriculture, de l’Élevage et de la Pêche).ItisworthnotingthatthecreationoftheMEAHVin May 2009 sent out a strong political message: it is the first time that a ministry has been specifically dedicated to water supply and sanitation in Togo (see Figure 4).
The WSS sector is currently managed by (a) Société Togolaise des Eaux (TdE) in urban areas (subprefectureandprefectureadministrativecenters); and (b)MEAHV’sGeneral Directorate of Water and Sanitation (DGEA:Direction Générale de l’Eau et de l’Assainissement) for rural and semi-urban areas.
The TdE is the company authorized to provide watersupply services in urban areas. It is responsible for meeting the demand for drinking water within the 22 centers that are equipped with the appropriate infrastructure of the 36 urban centers in the country: Lomé and 35 prefecture administrative centers, irrespective of size.The 14 other centers are being temporarily managed by theMEAHV through itsDirectorate ofWater Supply
Priority actions for institutional framework
• Finalize the institutional structure of the sector, particularly by integrating the decentralized local authorities, NGOs and water users’ associations.
• Ensureongoingreformsarecompletedandpromotetheir implementation (dissemination/information,regulation, and so on).
Figure 4Institutional roles and relationships within the WSS sector
MINISTRY OF WATER, SANITATION AND VILLAGE WATER SUPPLY
Directorate General of Water and Sanitation (DGEA)
DirectorateofWaterSupply(DAEP)
Mission: UrbanareasnotservedbyTdE
andsemi-urbanareas
Directorate of Water Resources PlanningandManagement(DPGRE)
Mission:KnowledgeofresourcesandIWRM
Mission:Operation of 22 urban centers in
the country with WSS.
Delegatedmanagementforallstudiesandworks relating to the renewal, rehabilitation, anddevelopmentofWSSinfrastructurein itsareaofoperation(whileawaitingthecreationofanasset-holdingcompany).
OperationofLome’sembryoniccollectivesanitation network.
DirectorateofSanitation(DA)
Mission: Collectivesanitation(rainwaterand
wastewaterinthesystem)
Directorate of VillageWaterSupply(DHV)
Mission: Rural areas
Togolese Water Utility (TdE)

14
(DAEP:Direction de l’Approvisionnement en Eau Potable), which is responsible for urban and semi-urban areas.
According to the Togolese Government, semi-urban areas are those towns with fewer than 1,500 inhabitants, not including the prefecture administrative centers. There are between 400 and 500 semi-urban centers in Togo where drinking water requirements are met through two types of technology: a series of standalone water points (the case in 20 centers) and small piped systems (in 81 centers).
Ruralareasareallthosenotconsideredtobeeitherurbanor semi-urban. TheMEAHV is responsible for providingdrinking water to rural areas through the Directorate of Village Water Supply (DHV: Direction de l’Hydraulique Villageoise).
As far as management of the sanitation sector is concerned, this is currently undertaken by a multitude of actors and a concerted planning effort is still required to restructure the subsectors’ institutional framework. The main stakeholders are:
• MEAHV,throughitsDirectorateofSanitation,whichis responsible for the sewerage systems: storm-water drainage in urban areas, planning and building infrastructure, contracting authority for sewerage system wastewater management.
• The Ministry of Health, through its Sanitation andEnvironmentalHealthDivision(DirectorateofPrimaryHealthCare/GeneralDirectorateofHealth).
• TdE,whichoperatesLomé’srudimentarywastewatersewerage system, which is over 50 years old and consists of around 242 connections.
In addition to these central public bodies, it is important tohighlighttheincreasingroleofthedecentralizedlocalauthorities. In the WSS sector, article 53 of the law of March 2007 pertaining to decentralization and localliberties (Law No 2007–011 of 13 March 2007) states that the commune (local authority) is responsible for (a) consultation on plans for water supply networks; (b) the construction of standpipes, wells and boreholes within the commune; (c) the collection and treatment of wastewater; (d) the management and maintenance of standpipes,
wells, boreholes and reservoirs, the distribution of drinking water; and (e) the adoption of health and hygiene measures within the commune’s service area, andpreventingunhygienicpractices.Decentralizationhasnot yet been implemented in Togo, however, so many of these responsibilities remain purely theoretical.
Lastly, there are also other important, non public stakeholders active in the sector: non governmental organizations (NGOs) andwater users’ associations, forinstance, who manage facilities at local level in conjunction with the communes and the local authorities.
In conclusion, the reforms of the last decade within the water supply sector have led to the creation of a clear and increasingly better defined institutional landscape, whereas for sanitation and hygiene the assessment remains more mixed. The water supply sector is in the midst of reform,predominantlyaspartoftheIWRMprocessandof implementing the 2008–11 investment program to improve water supply in the town of Lomé. Overall, the scorecard results relating to the institutional framework of the WSS sector in Togo are well below the average of the country’s economic peer group (see Figure 5).
An AMCOW Country Status Overview
Figure 5Scorecard indicator scores relating to institutional framework compared to peer group11
Togo average scores
Averages,LICs,GNIp.p.<=US$500
Source: CSO2 scorecard.
RWS
RSH
USH UWS

15
Water Supply and Sanitation in Togo: Turning Finance into Services for 2015 and Beyond
As far as investment planning is concerned, the process ofdevelopingthePovertyReductionStrategyPaper(PRSP)that started in Togo in February 2001 led to the adoption of an interim document in March 2008, followed by a complete document that was approved in April 2009 (CompletePRSPorPRSP-C).Atthesametime,theAugust2007 report produced following consultation on the MDG targets in Togo, undertaken in partnership with the UNDP and presented in the form of an Action Plan, currently serves as the reference for WSS sector investment.
ThisreportprovidedtheinspirationforthePRSP-CandthePAP (Priority Action Plan) 2009–2011, which was approved
5. Financing and its Implementation
Priority actions for financing and its implementation
• Develop national funding channels for all sectors, prioritizing sanitation.
• Improvebudgetcontrolmechanismsbyharmonizingtheavailablefinancialdataandby improvingthemonitoringofthebudgetutilizationcycle.
• Improvethewayinwhichnationalbudgetplanningincorporatesinternationalcooperationtoensurethatthemajorityofdonorfinancingisincludedinthestatebudget.
• Clarifyhowfundingistobematchedtoeachsubsectortopromotearefinedapproach.
• Ensurepriorityisgiventodirectingfundingtowardsthesanitationsubsector.
at the end of 2009. In addition, the UNDP is currently assisting with the development of a National action plan fortheWSSsector(PANSEA:Plan d’Actions National pour le Secteur de l’Eau et de l’Assainissement), which should form the basis for financial planning within the sector. As far as investment requirements are concerned, the targets provided in the PRSP-C are only very general andmorein-depth work is currently being carried out to enable specific targets to be included in the PAP that are broken down both by subsector and by area.
In general, the scorecard results for financing the WSS sector are above the average of Togo’s peer group countries in all subsectors, with the exception of the urban water supply (UWS) subsector; here the results are similar to those of Togo’s economic peer group (see Figure 6).
As to budgeting and financing, the state has not been able to finance the sector for over 20 years now (see Figure 7). Tariffs, where these are in place, barely manage to cover operation and maintenance (O&M) costs. Local authorities, currently undergoing reorganization as partof the decentralization policy, are also unable to makesufficient funds available for financing the different services. Financing for the WSS sector is, therefore, provided by development partners (up to 93 percent, depending on the year). It is to be noted that donor investment is on the increase with several external support agencies now returning to Togo following several years of absence. In contrast, domestic commitments account for less than 1 percent of the state’s total budget.
Source: CSO2 scorecard.
Figure 6Scorecard indicator scores relating to financing, compared to peer group12
Togo average scores
Averages,LICs,GNIp.p.<=US$500
RWS
RSH
USH UWS

16
Furthermore, sector financing is being hampered by a lack of transparency and financial tracking in the allocation and management of resources coming from public funds. Although deconcentration is fairly advanced in Togo, the samecannotbesaidfordecentralization:actualtransferof the competencies and resources required for local management of WSS services has not yet taken place. It is important to highlight, however, that despite the Togolese municipalities’ chronic lack of financing, analysis of local authorities’ finances over the last few years attests to sizeableexpenditurehavingbeenmadewithinthesector.
With regard to budget headings, it is possible to clearly identify expenditure made within the water supply subsector. However, this is not the case for sanitationsubsector expenditure, as this is divided up within the MinistryofHealth.
The state budget also fails to list all investment expenditure. Whilst the Priority Investment Program (PIP: Programme d’Investissements Prioritaires) linked to each finance law appears to provide a comprehensive list of all domestic financing, the same cannot be said for donor funding.
An AMCOW Country Status Overview
Rural water supply:Total:$16,400,000
Percapita(new):$63
Urban water supply:Total:$12,800,000
Percapita(new):$71
Rural sanitation:Total:$20,800,000
Percapita(new):$66
Urban sanitation:Total:$34,400,000
Percapita(new):$121
Domestic anticipated investment
Externalplannedinvestment
Assumed household investment
Gap
Source: CSO2 estimates.
Figure 7Overall and per capita investment requirements and contribution of anticipated financing by source
With the exception of NGOs, whose interventions are usually off budget, there are a number of external support agenciesthatarenotincludedinthePIP,suchasUNICEF,theEuropeanUnion,UNDP,ortheAFD(Agence française de développement), who provide financing directly to theTdE.
As far as the allocation of funds is concerned, there are no allocation criteria in place for the different urban and rural subsectors. The 2007 MDG action plan and the PAP both make recommendations regarding priorities for investment, but they don’t list geographical or socioeconomic priorities. The percentage of financing utilizedvariesforeachsubsector,butanalysisofthelastthree years for which data is available shows that the overall rate is high.
Ahigherpercentageoffinanceisutilizedinthesanitationsubsector than in water supply. This is due to the fact that this mainly includes operating expenses, where finance is considerably better utilized (in particular for salaries,where100percentoffinancehasbeenutilizedoverthelast few years).

17
Water Supply and Sanitation in Togo: Turning Finance into Services for 2015 and Beyond
TheCSO2 scorecard shows that Togo’s results forM&Eare above the average of its peer group countries for the rural water supply and urban sanitation subsectors, yet below average for urban water supply and rural sanitation (see Figure 8). There is still no real sector review in Togo, although some elements of review are already in place. First, a review of DP expenditure is carried out annually by the Ministry of Cooperation based on a form sent to each stakeholder that aims to compare finance committed to finance utilized. A meeting is then heldeach year during which each stakeholder presents their budget implementation report and their action plan for the forthcoming year. Nevertheless, this exercise cannot be considered a true sector review as (a) it relates to all activities, not only those within the WSS sector; and (b) it only includes donor financing and this is neither compared nor consolidated with domestic funding.
6. Sector Monitoring and Evaluation
Priority actions for monitoring and evaluation
• Developtheexistingsectormonitoringtools.
• Designassessmentaidsforthesector,suchasbudgetanalysisreports.
• Putinplaceacoherentandcomprehensivesystemformonitoringphysicalandfinancialactivitiessoastobeabletocontrolandimprovetheeffectivenessofpublicexpenditure.
Second, the beginnings of a process to assess achievements within the sector has recently been put in place as part of the process tomonitor implementation of the PRSP:a performance assessment was carried out for the five priority sectors (which include water supply and sanitation) for the first time in 2009 and the findings were presented at national validation workshop held in December of that year. As the process is becoming increasingly established each year, it could potentially form the basis of a sector review.
There are currently no comprehensive budget implementation reports being produced. The production cycle is divided up amongst the different directorates, meaning there is no data available that can be easily analyzed at sector level. Froma technical perspective, atthe moment, there is no regular monitoring of progress made within the sector. The Water Supply and Sanitation Sector Committee was set up with the introduction of the PAPwiththeaimofconductingthisongoingM&Eactivity.However,thisisanadhoccommitteethatdoesnothavethenecessary resources to be made permanent. Consideration is currently being given to the creation of a monitoring unit within each technical ministry involved that would be responsible for regular monitoring and evaluation tasks.
The aim of the sector review is not only to review all activities actually carried out over the course of the year compared with those initially planned, but also to obtain new financial commitments from DPs. However, at themoment, there is not a coordinated sector framework in which to allocate contributions from the various DPs. This issue will be the focus of the next Sector Conference that iscurrentlybeingorganizedwiththeaidoftheUNDPandthat is to be held in the second half of 2011.
Figure 8Scorecard indicator scores relating to sector M&E, compared to peer group13
RWS
RSH
Togo average scores
Averages,LICs,GNIp.p.<=US$500
USHUWS
Source: CSO2 scorecard.

18
An AMCOW Country Status Overview
7. Subsector: Rural Water Supply
Priority actions for rural water supply
• Improvethewayinwhichtheruralandsemi-urbanpolicyiscommunicated,asthereisstilllittleawarenessofthisamongststakeholders,anddefinestrategiesforitsimplementation.
• Improvethelocalparticipationofcommunities,whoareoftenunawareoftheroleattributedtothemunderthenationalpolicy,meaningtheyarenotsystematicallyinvolvedinprojects.
Nonetheless,RWSisthesubsectorwiththehighestlevelsoffinancialcommitments:anaverageofUS$14.5millionper year has been obtained for the period between 2009 and 2015, which covers 88 percent of requirements (see Figure10).ThedeficitthereforestandsatUS$2millionperyear.Once theO&McostsofUS$3millionper yearareadded to this (see Table 3), the total funding deficit comes toUS$5million.
The CSO2 scorecard, shown in Figure 11, uses a simple color code to indicate the performance of each component: green signifies that building blocks are largely in place, acting as a driver on service delivery (score higher than 2), yellow indicates building blocks that are a drag on service delivery and require attention (score between 1 and 2) and red means that building blocks are inadequate,
According to the JMP, 41 percent of Togo’s rural population had access to drinking water in 2008; according to the national data, however, this figure is 30 percent. As can be seen in Figure 9, progress of the subsector is very slow. Analysis of the progress in access rates over the last few years has shown that the current pace of development, although not far behind, is failing to keep up with the rate of population growth.
Between 1990 and 2008, around 30,000 additional people in rural areas obtained access to drinking water each year. In order for the MDG target for the rural water supply (RWS)subsectortobemet,173,000additionalpeoplewillneed to be provided with access each year between 2009 and 2015, which is over five times more than in previous years.
Figure 9Rural water supply coverage
100%
80%
60%
40%
20%
0%1985 1990 1995 2000 2005 2010 2015 2020
Government estimates
JMP, improved
Government target
JMP, piped
Sources: JMP and national data.
Figure 10Rural water supply investment requirements
0 5 10 15 20 25
RequiredCAPEX Required OPEX
US$million/year
PublicCAPEX(anticipated) HouseholdCAPEX(assumed)
CAPEXdeficit
Source: CSO2 estimates.
Cov
erag
e

19
Water Supply and Sanitation in Togo: Turning Finance into Services for 2015 and Beyond
constituting both a barrier to service delivery and a priority for reform (score lower than 1).
Despite the high levels of financing mobilized fromdevelopment partners, the performance of the subsector remains mixed (see Figures 11 and 12). For instance, due to delays in disbursement and implementation, there has been no domestic funding invested in the subsector for two consecutive years. When the financing from the budget is actuallymadeavailable,however,thepercentageutilizedis very high.
It is unlikely that Togo will meet its MDG targets for the RWS subsector due to the low amounts of financingactually disbursed by the state; the poor investment capacities seen at local level, of both public and private stakeholders; the continuing lack of sufficient involvement of communities in planning and managing facilities; the issues associated with maintenance and supply; and the lackofeffectiveM&Etools.
Figure 12Average RWS scorecard scores for enabling, developing, and sustaining service delivery, and peer-group comparison
Enabling
Togo average scores
Averages,LICs,GNIp.p.<=US$500
Sustaining Developing
Source: CSO2 scorecard.
Figure 11Rural water supply scorecard
EnablingPolicy
2 1.5 3 1.5 2 2 0 0.5
Planning Budget Expenditure Equity Output Maintenance Expansion
1.5
Use
Developing Sustaining
Source: CSO2 scorecard.

20
According to the JMP, 87 percent of Togo’s urban population had access to drinking water in 2008. National stakeholders consider this over-optimistic agreeing on a rate of 39 percent. Nevertheless, if the JMP trend is to be believed, this is the subsector where the situation is least acute. While the rate at which the subsector is progressing is barely extending coverage it is just keeping pace with population growth. Were the current rate of progress to be doubled, it would be possible for Togo to meet the MDG target for urban water supply.
Between 1990 and 2008, 80,000 people per year obtained access to drinking water in urban areas. Between 2009 and 2015, for the subsector target to be reached, a further 120,000 people will need to be provided with access each year. This means expanding the service at one-and-
8. Subsector: Urban Water Supply
Priority actions for urban water supply
• Clarifytheinstitutionalframeworkofthesubsectorwiththecreationofanasset-holdingcompany.
• Mobilizeadditionalfinancialresourcestofundtheincreaseinproductioncapacity,theextensionofwatersupplynetworksandpromoteaffordableconnections.
• Review the tariff structure to create a tool that (a) guarantees a cost recovery for both the operatorandtheasset-holdingcompany;(b)reducesinequalitythroughcross-subsidiesandpreventswaterbeingwasted;(c)leadstofinancialsustainabilitywithinthesubsector;and(d)issimpletosetup.
a-halftimesthecurrentrate.However,oftheestimatedrequirementofUS$13millionperyear for the2009–15period,onlyUS$3million,lessthanaquarter,hassofarbeen committed (see Figure 14). The deficit therefore stands at US$10 million per year, or US$70 million intotal.OnceO&McostsofUS$7millionperyearareaddedto this (see Table 3), the total funding deficit comes to US$119million.
Ever since its creation, the TdE has found itself in anuncertain financial situation. The tariffs charged are not high enough to cover its operating costs. As a result, its financial sustainability is not assured and its own resources insufficient to cover service extensions. There is still no comprehensive investment plan in place, despite the fact that developing an investment plan is listed as one of TdE’s priority objectives. Moreover, existing planning
An AMCOW Country Status Overview
Figure 13Urban water supply coverage
100%
80%
60%
40%
20%
0%1985 1990 1995 2000 2005 2010 2015 2020
Sources: JMP and national data.
Figure 14Urban water supply investment requirements
Cov
erag
e
Government estimates
JMP, improved
Government target
JMP, piped
0 5 10 15 20 25
RequiredCAPEX RequiredOPEX
US$million/year
PublicCAPEX(anticipated)
CAPEXdeficit
Source: CSO2 estimates.

21
Figure 15Urban water supply scorecard
EnablingPolicy
0.5 1 0.5 3 0 1 1 2 2
Planning Budget Expenditure Equity Output Maintenance Expansion Use
Developing Sustaining
Source: CSO2 scorecard.
Water Supply and Sanitation in Togo: Turning Finance into Services for 2015 and Beyond
activities focus on extensions rather than on renewing or rehabilitating the existing infrastructure, as no complete inventory of assets has been carried out. This inventory is currentlyintheprocessofbeingsetupwithintheTdE.
The main bottlenecks hindering the achievement of the subsector targets are, therefore (a) the financial problems experiencedbyboththeTdEandthestateinextendingthedistribution networks while, at the same time, ensuring that the connection fee remains affordable; and (b) the current level of the average tariff that is barely sufficient to cover operating costs, let alone the cost of investment.
These various obstacles explain why the scorecard results for the subsector are so low, particularly the enabling conditions for putting services in place (policy development and budgeting) (see Figures 15 and 16).
Figure 16Average UWS scorecard scores for enabling, developing, and sustaining service delivery, and peer group comparison
Enabling
Togo average scores
Averages,LICs,GNIp.p.<=US$500
Sustaining Developing
Source: CSO2 scorecard.

22
An AMCOW Country Status Overview
According to the JMP, only 3 percent of Togo’s rural population has access to ‘improved’ sanitation (2008 data); whereas the national data gives an estimate of 10 percent (data from the 2007 MDG Plan) (see Figure 17). As in many countries in the subregion, compared to water supply, there has been very little focus on providing access to sanitation in Togo and rural sanitation is, without doubt, the most neglected of the four subsectors. Between 1990 and 2008, for example, nearly 6,000 people per year lost access to improved sanitation facilities. For the MDG targets to be met, around 295,000 people living in rural areas need to be provided with access to sanitation each year between 2009 and 2015: this means radically reversing the current trend, with a 50-fold increase in coverage.
At present, the investment committed represents less
9. Subsector: Rural Sanitation and Hygiene
Priority actions for rural sanitation and hygiene
• Onaninstitutionallevel,ensuresectorcoordinationbyclarifyingrolesandclearlydefininganinstitutionallead.
• Adoptaclearandambitiousinvestmentplanthatenablesadditionalfinancialresourcestobemobilizedtofundsubsidymechanismsforinfrastructureandawareness-raising.
• Selecteffectivetoolsforthedevelopmentoflatrines:putapublicsubsidysysteminplaceand/orincreasepromotionalandawareness-raisingactivitiesand/ortheestablishmentofcreditsystems.
than1percentof theestimatedUS$21millionperyearrequired to meet the subsector targets (see Figure 18). There is, therefore, a funding deficit of US$145millionthat needs to be overcome between 2009 and 2015. OnceO&McostsofUS$2millionperyearareaddedtothis(seeTable3),thetotalfundingdeficitcomestoUS$159million. The lack of an investment plan to coordinate and consolidate interventions is one of the reasons why the rural, and urban, sanitation subsector is so chronically underfinanced.
Partners wishing to invest in the sector are directed towardsthe2009–2013NationalHealthcareDevelopmentPlan (Plan National de Développement Sanitaire), recently developedbytheMinistryofHealth.Thisisacontinuationof the previous healthcare plan that came to an end in
Figure 18Rural sanitation investment requirements
0 5 10 15 20 25
RequiredCAPEX
Required OPEX
US$million/year
PublicCAPEX(anticipated) HouseholdCAPEX(assumed)
CAPEXdeficit
Source: CSO2 estimates.
Figure 17Rural sanitation coverage
100%
80%
60%
40%
20%
0%1985 1990 1995 2000 2005 2010 2015 2020
Government estimates
JMP, improved
Government target
JMP, improved + shared
Sources: JMP and national data.
Cov
erag
e

23
Water Supply and Sanitation in Togo: Turning Finance into Services for 2015 and Beyond
Figure 20Average RSH scorecard scores for enabling, developing, and sustaining service delivery, and peer-group comparison
Enabling
Togo average scores
Averages,LICs,GNIp.p.<=US$500
Sustaining Developing
Source: CSO2 scorecard.
2006 and contains a hygiene and sanitation component. However,interventionsarestillnotalwaysalignedtothisplan. Development is due to begin soon on a five-year National Hygiene and Sanitation Program that shouldresolve this issue.
The funding deficit is also due to the limited ability of households to pay for sanitation facilities. Very fewhouseholds have invested in sanitation and community-based projects depend on subsidies to pay for certain parts of the infrastructure, but this subsidy policy has not been widely implemented.
As a result, the performance of the subsector is below the average of Togo’s peer group countries as far as enabling conditions and developing the service are concerned. The scorecard results are, however, above the peer group average for sustaining services, due mainly to the positive performance of the rural sanitation markets (the supply chain and the capacities of the private sector) (see Figures 19 and 20).
Figure 19Rural sanitation and hygiene scorecard
EnablingPolicy
1.5 1 0 2 0 1 3
Planning Budget Expenditure Equity Output Markets
0 1
Uptake Use
Developing Sustaining
Source: CSO2 scorecard.

24
According to the JMP, 24 percent of Togo’s urban population has access to ‘improved’ sanitation (2008 data). The access rate is significantly higher in the capital, Lomé, than in other urban centers. Furthermore, coverage is increasing at a rate that is far slower than that of population growth (see Figure 21).
Between 1990 and 2008, around 20,000 additional people each year obtained access to improved sanitation facilities in urban areas. To achieve the MDG targets for the subsector, however, this figure needs to increase to over 226,000 per year between 2009 and 2015. This corresponds to an 11-fold increase in the current rate of service extension. The main issues are not in implementation, but rather upstream, caused by a severe lack of finance (see Figure 22).
The investment requirement isestimatedtobeUS$34.3
10. Subsector: Urban Sanitation and Hygiene
Priority actions for urban sanitation and hygiene
• Clarifytheinstitutionallandscapeofthesectortoimproveitscoordination:addresstheissueofconflictingcontractingauthorityresponsibilitiesbetweentheDirectorateofSanitationandthecommunes,appointaninstitutionallead,etc.;
• Encouragepitemptyingservicesanddevelopsludgetreatmentfacilities.
million per year, or US$240million in total (see Figure22). This is the subsector for which the largest amounts of finance are required: one-and-a-half times greater than the finance required for the rural sanitation subsector and higher than the investment requirements for the whole watersupplysubsector.However,theinvestmentalreadycommitted is nowhere near enough to meet the subsector target, as it equates to less than 8 percent of the estimated requirement.This leavesashortfallofUS$32millionperyear, orUS$224million in total thatneeds tobemadeupbetween2009and2015.OnceO&McostsofUS$7million per year are added to this (see Table 3), the total fundingdeficitcomestoUS$273million.
Although there is a high percentage of finance utilizedwithin the subsector, absolutely nothing has been allocated to investment out of the national budget for
Figure 22Urban sanitation investment requirements14
0 20 40 60
RequiredCAPEXRequired OPEX
US$million/year
Source: CSO2 estimates.
Figure 21Urban sanitation coverage
100%
80%
60%
40%
20%
0%1985 1990 1995 2000 2005 2010 2015 2020
Government estimates
JMP, improved
Government target
JMP, improved + shared
Sources: JMP and national data.
Cov
erag
e
PublicCAPEX(anticipated) HouseholdCAPEX(assumed)
CAPEXdeficit
An AMCOW Country Status Overview

25
Water Supply and Sanitation in Togo: Turning Finance into Services for 2015 and Beyond
the last three years (investment recorded under domestic financingcorrespondstoinvestmentmadefromtheTdE’sown funds for the sewerage system and communes, not to funding from the state budget).
The Sanitation Master Plan for Lomé was updated in 2004 but its recommendations have never been implemented. The other towns in Togo do not yet have sanitation master plans in place. The pit emptying market in urban areas has some private pit emptying companies in operation, mainlyinLomé.However,thevacuumtrucksareinverypoor condition and there is no way of treating the sludge once it has been collected. As in the rural sanitation subsector, there is no official subsidy policy in place for on-site sanitation, other than some actions that contribute materials. The situation as regards handwashing is equally concerning for urban as it is for rural areas: handwashing is either inadequate (no soap) or not practiced at all.
Overall, the performance of the subsector is similar to that of Togo’s economic peer group countries (see Figure 24), with below-average results for enabling conditions (policy framework) and sustaining services (using the service).
Figure 24Average USH scorecard scores for enabling, developing, and sustaining service delivery, and peer-group comparison
Enabling
Togo average scores
Averages,LICs,GNIp.p.<=US$500
Sustaining Developing
Sources: CSO2 scorecard.
Figure 23Urban sanitation and hygiene scorecard
EnablingPolicy
0.5 1 1 3 0 1.5 1 0 1
Planning Budget Expenditure Equity Output Markets Uptake Use
Developing Sustaining
Source: CSO2 scorecard.

26
• This slight difference can be explained by the fact thatthis CSO2 report (a) focuses on equipment expenditure; (b) adopts a more limited definition of the WSS sector (excludingIWRM,storm-waterdrainageandsolidwaste);and (c) is based on the JMP access rate data which is more optimistic than the coverage rates given in the MDG report.
In contrast, the Priority Action Program (PAP), a three-year rolling action plan annexed to the complete Poverty ReductionStrategyPaper(PRSP-C),offersadifferentview:in its reference scenario (based on priority programs and on the likelihood of finding resources), sector requirements (as understood by this CSO2 report) are estimated to stand at around US$75 million for 2009–2011, or an annualrequirement of US$25 million, giving a total of overUS$176millionforthe2009–2015period;thealternativescenario, based on the assumption that all international commitments made during the G8 summit in Gleneagles in 2005 will be respected, is more ambitious and estimates therequirementtobeUS$90millionfor2009–2011,givingatotalofUS$211millionforthe2009–2015period.
The aim of the PAP is not, however, to estimate requirements but rather to ensure priorities are aligned to future funding streams to enable their implementation. It is logical, therefore, that the financing is separated.
8 The finance committed was identified by the CSO2 consultant using the Priority Investment Programs and data provided by the external support agencies.
9 Due to rounding, subsector figures may not sum to totals.
10 The CSO2 scorecard methodology and its structure are detailed in the regional synthesis report.
11 The relevant indicators are as follows. All subsectors: targets inthenationaldevelopmentplanorthePRSP;subsectorpolicies agreed and approved. RWS/UWS: institutionalrolesdefined.RSH/USH:institutionalleadappointed.
An AMCOW Country Status Overview
1 Global Economic Monitor, The World Bank, 2009average.
2 The first round of CSOs was carried out in 2006 covering 16 countriesandissummarizedinthereport,Getting Africa On-Track to Meet the MDGs on Water and Sanitation.
3 Data from the ‘MDG Action Plan’ study conducted in 2007, which was approved by the Togolese authorities and acts as reference for the sector. For sanitation, the study uses data from MICS3 (2006).
4 The following data is taken from the UNICEF/WHOJoint Monitoring Programme (JMP) for Water Supply and Sanitation,which analyzes national householddatato produce statistics. It is to be noted that these figures are fiercely contested by national stakeholders for some subsectors.
5 UNICEF/WHO Joint Monitoring Programme (2010),Progress on Sanitation and Drinking Water: 2010 Update. The same source is used for Sections 7 to 10. JMP estimates are based on a linear regression of nationally representative household surveys undertaken in Togo since 1990, including the latest MICS (2006).
6 See note 2. The same sources are used for Figure 1 and for all other figures pertaining to subsector coverage in Sections 7 to 10.
7 As a comparison, the requirements estimated here are coherent with previous estimates:
• This CSO2 report calculates the total investmentrequirement to be US$590 million between 2009 and2015 (brokendownasUS$204million forwater supplyandUS$386millionforsanitation);
• The 2007 report regarding consultation on the MDGwater supply and sanitation targets estimated the overall investment requirementsup to2015ataroundUS$690million(brokendownasUS$355millionforwatersupplyandUS$335millionforsanitation);and
Notes and References

27
Water Supply and Sanitation in Togo: Turning Finance into Services for 2015 and BeyondWater Supply and Sanitation in Togo: Turning Finance into Services for 2015 and Beyond
12 The relevant indicators are as follows. All subsectors: programmatic Sector-Wide Approach; investment program based on MDG needs assessment; sufficient finance to meet the MDG; percent of official donor commitments utilized;percentofdomesticcommitmentsutilized.
13 The relevant indicators are as follows. All subsectors: annual review setting new undertakings; subsector spend identifiable in budget (UWS: including recurrent subsidies);budgetcomprehensivelycoversdomestic/donorfinance; standards and definitions used for household
surveys consistent with JMP. RWS/RSH: domestic/donorexpenditure reported. UWS: audited accounts and balance sheetsfromutilities.RWS/RSH:periodicanalysisofequitycriteria by CSOs and government. UWS: pro-poor plans developed and implemented by utilities. RWS/UWS:nationally consolidated reporting of output. RSH/USH:monitoring of quantity and quality of uptake relative to promotion and subsidy efforts.
14 See note 9 and Section 2: ‘Investment Requirements:Testing the Sufficiency of Finance’.

Notes

The first round of Country Status Overviews (CSO1) published in 2006 benchmarked the preparedness of sectors of 16 countries in Africa to meet the WSS MDGs based on their medium-term spending plans and a set of ‘success factors’ selected from regional experience. Combined with a process of national stakeholder consultation, this prompted countries to ask whether they had those ‘success factors’ in place and, if not, whether they should put them in place.
The second round of Country Status Overviews (CSO2) has built on both the method and the process developed in CSO1. The ‘success factors’ have been supplemented with additional factors drawn from country and regional analysis to develop the CSO2 scorecard. Together these reflect the essential steps, functions and results in translating finance into services through government systems—in line with Paris Principles for aid effectiveness. The data and summary assessments have been drawn from local data sources and compared with internationally reported data, and, wherever possible, the assessments have been subject to broad-based consultations with lead government agencies and country sector stakeholders, including donor institutions.
This second set of 32 Country Status Overviews (CSO2) on water supply and sanitation was commissioned by the African Ministers’ Council on Water (AMCOW). Development of the CSO2 was led by the World Bank administered Water and Sanitation Program (WSP) in collaboration with the African Development Bank (AfDB), the United Nations Children’s Fund (UNICEF), the World Bank and the World Health Organization (WHO).
This report was produced in collaboration with the Government of Togo and other stakeholders during 2009/10. Some sources cited may be informal documents that are not readily available.
The findings, interpretations, and conclusions expressed in this volume do not necessarily reflect the views of the collaborating institutions, their Executive Directors, or the governments they represent. The collaborating institutions do not guarantee the accuracy of the data included in this work. The boundaries, colors, denominations, and other information shown on any map in this work do not imply any judgment on the part of the collaborating institutions concerning the legal status of any territory or the endorsement or acceptance of such boundaries.
The material in this publication is copyrighted. Requests for permission to reproduce portions of it should be sent to [email protected]. The collaborating institutions encourage the dissemination of this work and will normally grant permission promptly. For more information, please visit www.amcow.net or www.wsp.org.
Photograph credits: Getty Images
© 2011 Water and Sanitation Program

For enquiries, contact:Water and Sanitation Program–Africa RegionThe World Bank, Upper Hill RoadP.O. Box 30577, 00100, Nairobi, KenyaTel: +(254) 20 322 6300 E-mail: [email protected] site: www.wsp.org
An AMCOW Country Status Overview
Water Supply and Sanitation in TogoTurning Finance into Services for 2015 and Beyond