Water Supply and Sanitation in Tanzania - Home | WSP · Water Supply and Sanitation in Tanzania:...
36
Water Supply and Sanitation in Tanzania Turning Finance into Services for 2015 and Beyond An AMCOW Country Status Overview
Transcript of Water Supply and Sanitation in Tanzania - Home | WSP · Water Supply and Sanitation in Tanzania:...
Water Supply and Sanitation in TanzaniaTurning Finance into Services for 2015 and Beyond
An AMCOW Country Status Overview
The first round of Country Status Overviews (CSO1) published in 2006 benchmarked the preparedness of sectors of 16 countries in Africa to meet the WSS MDGs based on their medium-term spending plans and a set of ‘success factors’ selected from regional experience. Combined with a process of national stakeholder consultation, this prompted countries to ask whether they had those ‘success factors’ in place and, if not, whether they should put them in place.
The second round of Country Status Overviews (CSO2) has built on both the method and the process developed in CSO1. The ‘success factors’ have been supplemented with additional factors drawn from country and regional analysis to develop the CSO2 scorecard. Together these reflect the essential steps, functions and results in translating finance into services through government systems—in line with Paris Principles for aid effectiveness. The data and summary assessments have been drawn from local data sources and compared with internationally reported data, and, wherever possible, the assessments have been subject to broad-based consultations with lead government agencies and country sector stakeholders, including donor institutions.
This second set of 32 Country Status Overviews (CSO2) on water supply and sanitation was commissioned by the African Ministers’ Council on Water (AMCOW). Development of the CSO2 was led by the World Bank administered Water and Sanitation Program (WSP) in collaboration with the African Development Bank (AfDB), the United Nations Children’s Fund (UNICEF), the World Bank and the World Health Organization (WHO).
This report was produced in collaboration with the Government of Tanzania and other stakeholders during 2009/10. Some sources cited may be informal documents that are not readily available.
The findings, interpretations, and conclusions expressed in this volume do not necessarily reflect the views of the collaborating institutions, their Executive Directors, or the governments they represent. The collaborating institutions do not guarantee the accuracy of the data included in this work. The boundaries, colors, denominations, and other information shown on any map in this work do not imply any judgment on the part of the collaborating institutions concerning the legal status of any territory or the endorsement or acceptance of such boundaries.
The material in this publication is copyrighted. Requests for permission to reproduce portions of it should be sent to [email protected] The collaborating institutions encourage the dissemination of this work and will normally grant permission promptly. For more information, please visit www.amcow.net or www.wsp.org
Photograph credits: WaterAid
© 2011 Water and Sanitation Program
1
Water Supply and Sanitation in Tanzania: Turning Finance into Services for 2015 and Beyond
Water Supply and Sanitation in TanzaniaTurning Finance into Services for 2015 and Beyond
An AMCOW Country Status Overview
2
An AMCOW Country Status Overview
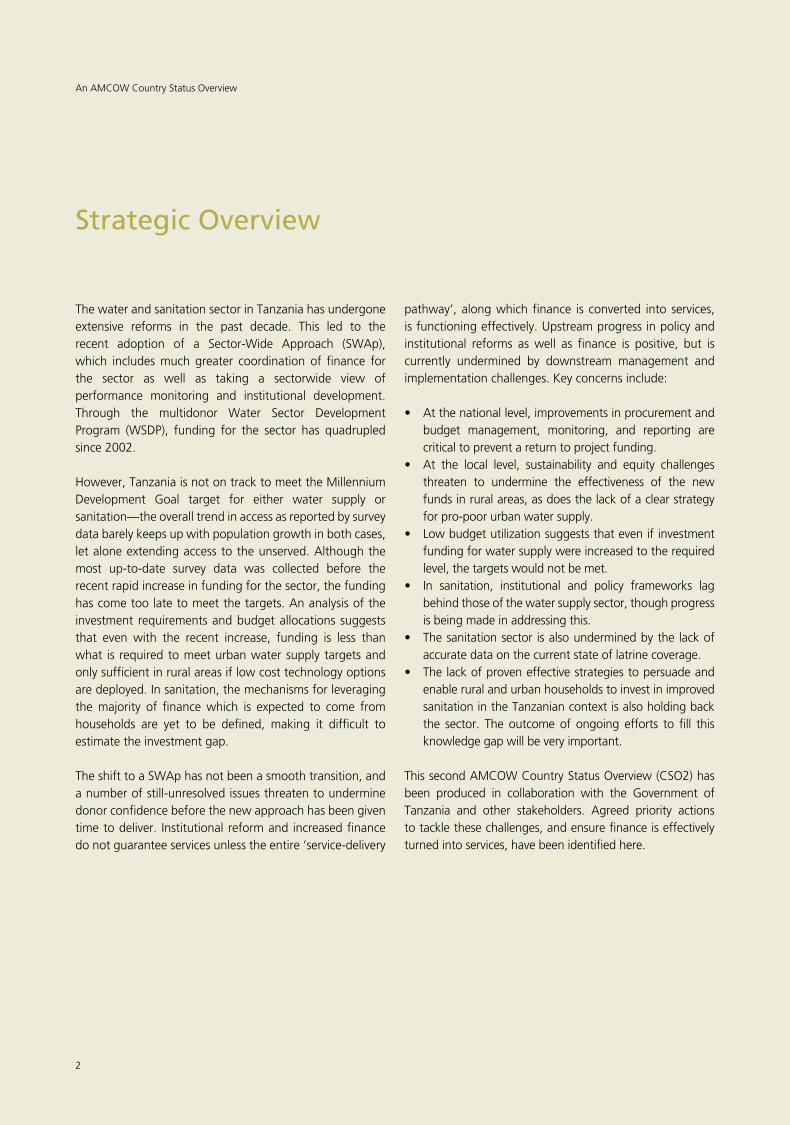
Strategic Overview
The water and sanitation sector in Tanzania has undergone extensive reforms in the past decade. This led to the recent adoption of a Sector-Wide Approach (SWAp), which includes much greater coordination of finance for the sector as well as taking a sectorwide view of performance monitoring and institutional development. Through the multidonor Water Sector Development Program (WSDP), funding for the sector has quadrupled since 2002.
However, Tanzania is not on track to meet the Millennium Development Goal target for either water supply or sanitation—the overall trend in access as reported by survey data barely keeps up with population growth in both cases, let alone extending access to the unserved. Although the most up-to-date survey data was collected before the recent rapid increase in funding for the sector, the funding has come too late to meet the targets. An analysis of the investment requirements and budget allocations suggests that even with the recent increase, funding is less than what is required to meet urban water supply targets and only sufficient in rural areas if low cost technology options are deployed. In sanitation, the mechanisms for leveraging the majority of finance which is expected to come from households are yet to be defined, making it difficult to estimate the investment gap.
The shift to a SWAp has not been a smooth transition, and a number of still-unresolved issues threaten to undermine donor confidence before the new approach has been given time to deliver. Institutional reform and increased finance do not guarantee services unless the entire ‘service-delivery
pathway’, along which finance is converted into services, is functioning effectively. Upstream progress in policy and institutional reforms as well as finance is positive, but is currently undermined by downstream management and implementation challenges. Key concerns include:
• Atthenationallevel,improvementsinprocurementandbudget management, monitoring, and reporting are critical to prevent a return to project funding.
• At the local level, sustainability and equity challengesthreaten to undermine the effectiveness of the new funds in rural areas, as does the lack of a clear strategy for pro-poor urban water supply.
• Lowbudgetutilizationsuggeststhatevenifinvestmentfunding for water supply were increased to the required level, the targets would not be met.
• In sanitation, institutional and policy frameworks lagbehind those of the water supply sector, though progress is being made in addressing this.
• Thesanitationsector isalsounderminedbythe lackofaccurate data on the current state of latrine coverage.
• Thelackofproveneffectivestrategiestopersuadeandenable rural and urban households to invest in improved sanitation in the Tanzanian context is also holding back the sector. The outcome of ongoing efforts to fill this knowledge gap will be very important.
This second AMCOW Country Status Overview (CSO2) has been produced in collaboration with the Government of Tanzania and other stakeholders. Agreed priority actions to tackle these challenges, and ensure finance is effectively turned into services, have been identified here.
An AMCOW Country Status Overview
2
3
Water Supply and Sanitation in Tanzania: Turning Finance into Services for 2015 and BeyondWater Supply and Sanitation in Tanzania: Turning Finance into Services for 2015 and Beyond
3
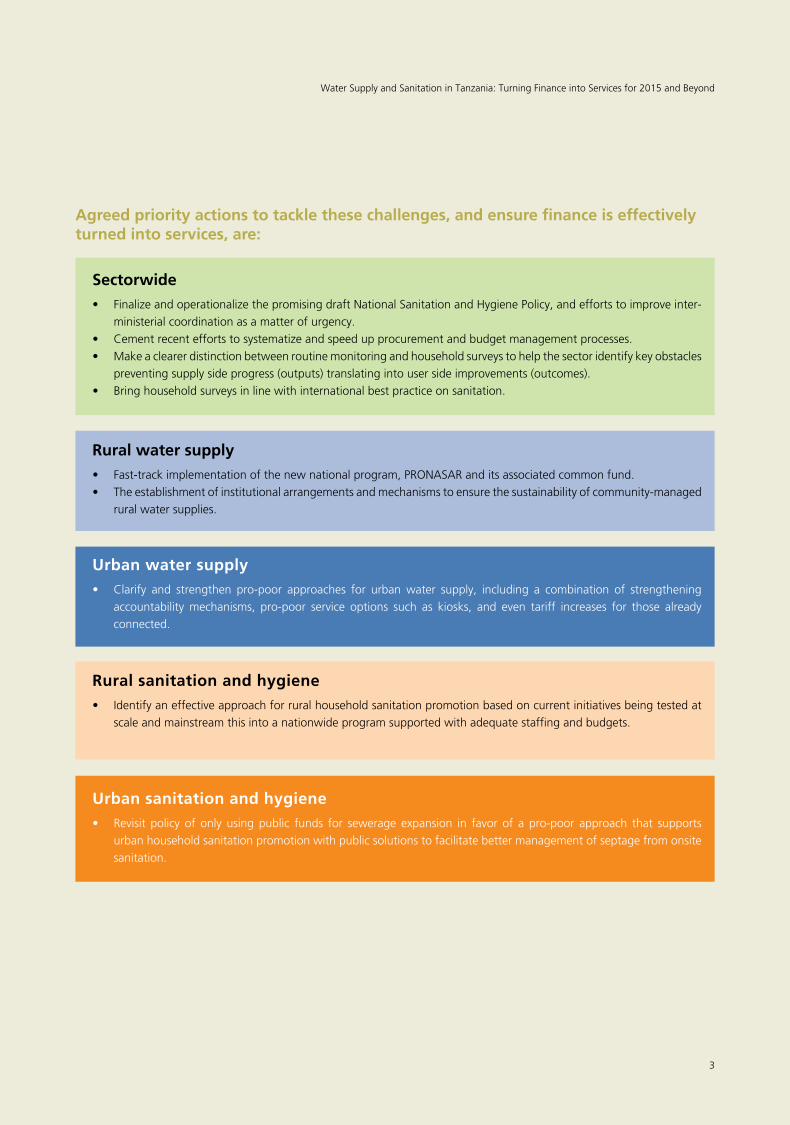
Rural water supply• Fast-trackimplementationofthenewnationalprogram,PRONASARanditsassociatedcommonfund.• Theestablishmentofinstitutionalarrangementsandmechanismstoensurethesustainabilityofcommunity-managed
rural water supplies.
Urban water supply• Clarify and strengthen pro-poor approaches for urbanwater supply, including a combination of strengthening
accountability mechanisms, pro-poor service options such as kiosks, and even tariff increases for those already connected.
Urban sanitation and hygiene• Revisit policy of only usingpublic funds for sewerage expansion in favor of a pro-poor approach that supports
urban household sanitation promotion with public solutions to facilitate better management of septage from onsite sanitation.
Rural sanitation and hygiene• Identifyaneffectiveapproachforruralhouseholdsanitationpromotionbasedoncurrentinitiativesbeingtestedat
scale and mainstream this into a nationwide program supported with adequate staffing and budgets.
Sectorwide• FinalizeandoperationalizethepromisingdraftNationalSanitationandHygienePolicy,andeffortstoimproveinter-
ministerial coordination as a matter of urgency.• Cementrecenteffortstosystematizeandspeedupprocurementandbudgetmanagementprocesses.• Makeaclearerdistinctionbetweenroutinemonitoringandhouseholdsurveystohelpthesectoridentifykeyobstacles
preventing supply side progress (outputs) translating into user side improvements (outcomes).• Bringhouseholdsurveysinlinewithinternationalbestpracticeonsanitation.
Agreed priority actions to tackle these challenges, and ensure finance is effectively turned into services, are:
4
An AMCOW Country Status Overview
5
Water Supply and Sanitation in Tanzania: Turning Finance into Services for 2015 and Beyond
Acronyms and Abbreviations ........................................................................................................................... 6
1. Introduction .................................................................................................................................................... 7
2. Sector Overview: Coverage and Finance Trends ............................................................................................... 8
3. ReformContext:IntroducingtheCSO2Scorecard ......................................................................................... 11
4. Institutional Framework ................................................................................................................................ 13
5. Financing and its Implementation .................................................................................................................. 15
6. Sector Monitoring and Evaluation ................................................................................................................. 18
7. Subsector:RuralWaterSupply ...................................................................................................................... 20
8. Subsector: Urban Water Supply ..................................................................................................................... 23
9. Subsector:RuralSanitationandHygiene ....................................................................................................... 25
10. Subsector: Urban Sanitation and Hygiene ...................................................................................................... 27
NotesandReferences ................................................................................................................................... 29
Contents
6
An AMCOW Country Status Overview
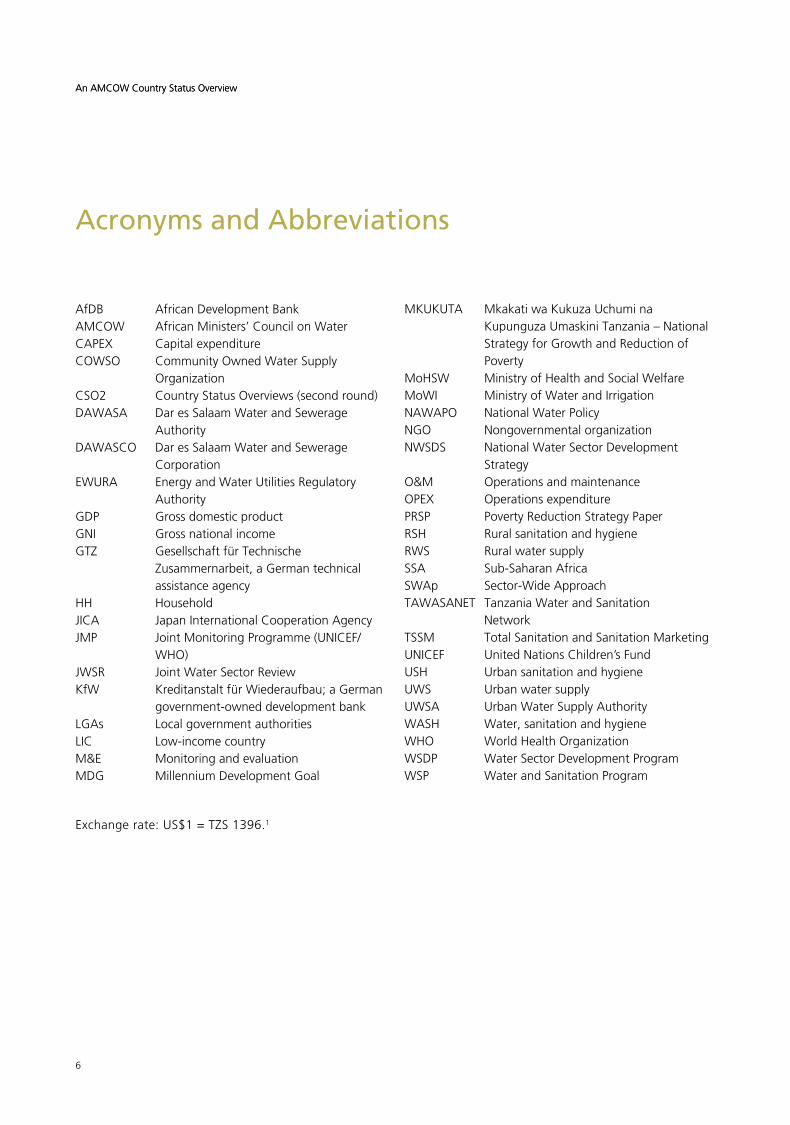
Acronyms and Abbreviations
AfDB African Development BankAMCOW African Ministers’ Council on WaterCAPEX Capital expenditureCOWSO Community Owned Water Supply
OrganizationCSO2 Country Status Overviews (second round)DAWASA Dar es Salaam Water and Sewerage
AuthorityDAWASCO Dar es Salaam Water and Sewerage
CorporationEWURA EnergyandWaterUtilitiesRegulatory
AuthorityGDP Gross domestic productGNI GrossnationalincomeGTZ Gesellschaft für Technische
Zusammernarbeit, a German technical assistance agency
HH HouseholdJICA Japan International Cooperation AgencyJMP JointMonitoringProgramme(UNICEF/
WHO)JWSR JointWaterSectorReviewKfW Kreditanstalt für Wiederaufbau; a German
government-owned development bankLGAs LocalgovernmentauthoritiesLIC Low-incomecountryM&E Monitoring and evaluationMDG Millennium Development Goal
MKUKUTA Mkakati wa Kukuza Uchumi na KupunguzaUmaskiniTanzania–NationalStrategyforGrowthandReductionofPoverty
MoHSW Ministry of Health and Social WelfareMoWI Ministry of Water and IrrigationNAWAPO NationalWaterPolicyNGO NongovernmentalorganizationNWSDS NationalWaterSectorDevelopment
StrategyO&M Operations and maintenanceOPEX Operations expenditurePRSP PovertyReductionStrategyPaperRSH RuralsanitationandhygieneRWS RuralwatersupplySSA Sub-Saharan AfricaSWAp Sector-Wide ApproachTAWASANET TanzaniaWaterandSanitation
NetworkTSSM Total Sanitation and Sanitation MarketingUNICEF UnitedNationsChildren’sFundUSH Urban sanitation and hygieneUWS Urban water supplyUWSA Urban Water Supply AuthorityWASH Water, sanitation and hygieneWHO World Health OrganizationWSDP Water Sector Development ProgramWSP Water and Sanitation Program
Exchange rate: US$1 = TZS 1396.1
An AMCOW Country Status Overview
7
Water Supply and Sanitation in Tanzania: Turning Finance into Services for 2015 and Beyond
1. Introduction
The African Ministers’ Council on Water (AMCOW) commissioned the production of a second round of Country Status Overviews (CSOs) to better understand what underpins progress in water supply and sanitation and what its member governments can do to accelerate that progress across countries in Sub-Saharan Africa (SSA).2 AMCOW delegated this task to the World Bank’s Water and Sanitation Program (WSP) and the African Development Bank (AfDB), which are implementingitinclosepartnershipwithUNICEFandtheWHOinover30countriesacrossSSA.ThisCSO2reporthasbeenproducedincollaborationwiththeGovernmentofTanzaniaandotherstakeholdersduring2009/10.
The analysis aims to help countries assess their own service delivery pathways for turning finance into water supply and sanitation services in each of four subsectors: rural and urban water supply, and rural and urban sanitation and hygiene. The CSO2 analysis has three main components: a review of past coverage; a costing model to assess the adequacy of future investments; and a scorecard which allows diagnosis of particular bottlenecks along the service delivery pathway. The CSO2’s contribution is to answer not only whether past trends and future finance are sufficient to meet sector targets, but what specific issues need to be addressed to ensure finance is effectively turned into accelerated coverage in water supply and sanitation. In this spirit, specific priority actions have been identified through consultation. A synthesis report, available separately, presents best practice and shared learning to help realize these priority actions.
8
An AMCOW Country Status Overview
2. Sector Overview: Coverage and Finance Trends
Coverage: Assessing Past Progress
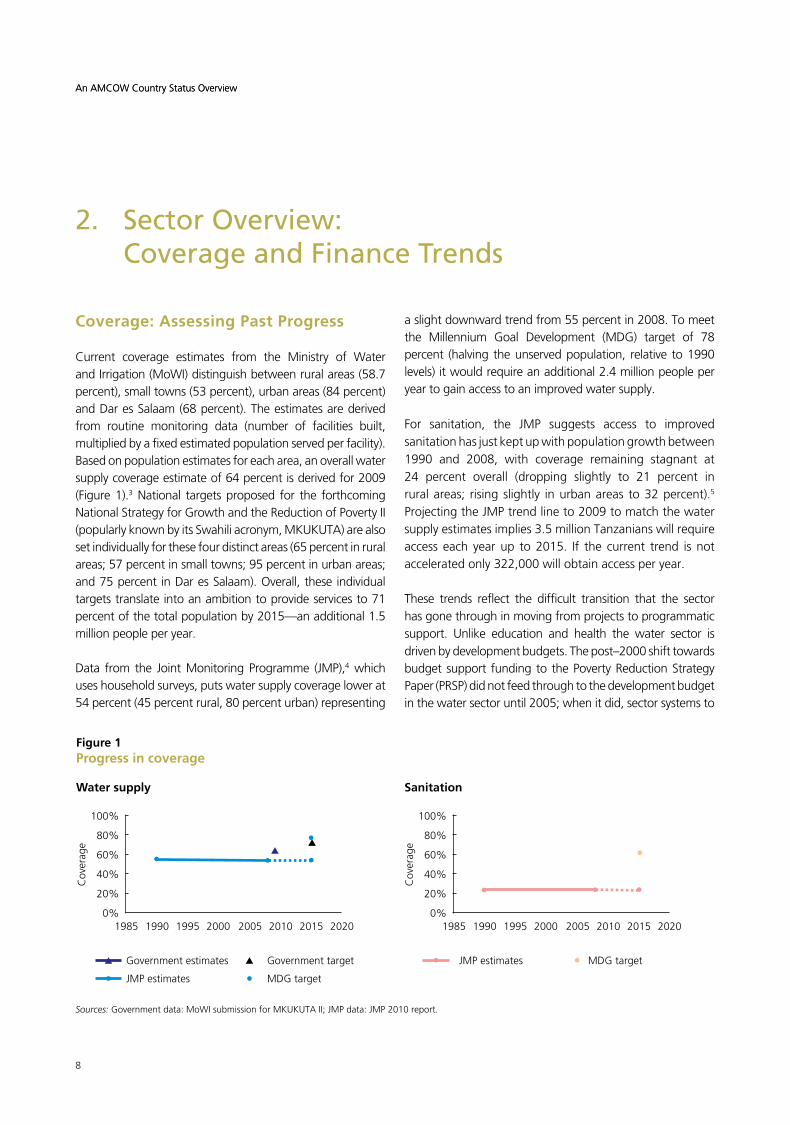
Current coverage estimates from the Ministry of Water and Irrigation (MoWI) distinguish between rural areas (58.7 percent), small towns (53 percent), urban areas (84 percent) and Dar es Salaam (68 percent). The estimates are derived from routine monitoring data (number of facilities built, multiplied by a fixed estimated population served per facility). Based on population estimates for each area, an overall water supply coverage estimate of 64 percent is derived for 2009 (Figure 1).3National targetsproposed for the forthcomingNationalStrategyforGrowthandtheReductionofPovertyII(popularly known by its Swahili acronym, MKUKUTA) are also set individually for these four distinct areas (65 percent in rural areas; 57 percent in small towns; 95 percent in urban areas; and 75 percent in Dar es Salaam). Overall, these individual targets translate into an ambition to provide services to 71 percent of the total population by 2015—an additional 1.5 million people per year.
Data from the Joint Monitoring Programme (JMP),4 which uses household surveys, puts water supply coverage lower at 54 percent (45 percent rural, 80 percent urban) representing
Sanitation
100%
80%
60%
40%
20%
0%1985 1990 1995 2000 2005 2010 2015 2020
JMP estimates MDG target
Cov
erag
e
Water supply
Figure 1Progress in coverage
100%
80%
60%
40%
20%
0%1985 1990 1995 2000 2005 2010 2015 2020
Government estimates
JMP estimates
Government target
MDG target
Cov
erag
e
Sources: Government data: MoWI submission for MKUKUTA II; JMP data: JMP 2010 report.
An AMCOW Country Status Overview
a slight downward trend from 55 percent in 2008. To meet the Millennium Goal Development (MDG) target of 78 percent (halving the unserved population, relative to 1990 levels) it would require an additional 2.4 million people per year to gain access to an improved water supply.
For sanitation, the JMP suggests access to improved sanitation has just kept up with population growth between 1990 and 2008, with coverage remaining stagnant at 24 percent overall (dropping slightly to 21 percent in rural areas; rising slightly in urban areas to 32 percent).5 Projecting the JMP trend line to 2009 to match the water supply estimates implies 3.5 million Tanzanians will require access each year up to 2015. If the current trend is not accelerated only 322,000 will obtain access per year.
These trends reflect the difficult transition that the sector has gone through in moving from projects to programmatic support. Unlike education and health the water sector is driven by development budgets. The post–2000 shift towards budgetsupport fundingtothePovertyReductionStrategyPaper(PRSP)didnotfeedthroughtothedevelopmentbudgetin the water sector until 2005; when it did, sector systems to
9
Water Supply and Sanitation in Tanzania: Turning Finance into Services for 2015 and Beyond
equitably allocate and decentralize spending had to be put in place. In 2007, as the culmination of several years of sector reforms, a comprehensive sectorwide plan, the Water Sector Development Program (WSDP) 6, was launched for investing in water supply and sanitation infrastructure, with almost US$1 billion finance over five years from the World Bank, AfDB, German and Dutch governments, and the Government of Tanzania. The scale of finance available for the sector is vastly greater than the funding that was previously available, giving reason to hope that coverage trends will soon improve.
Investment Requirements: Testing the Sufficiency of Finance
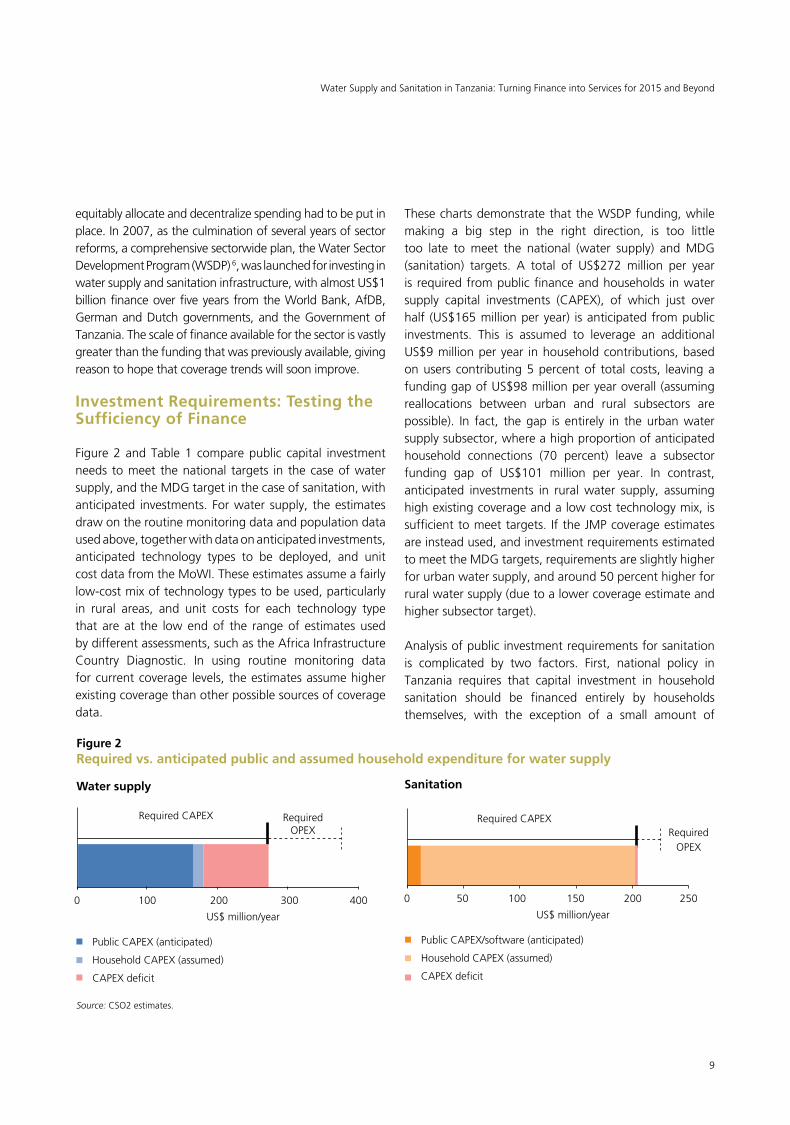
Figure 2 and Table 1 compare public capital investment needs to meet the national targets in the case of water supply, and the MDG target in the case of sanitation, with anticipated investments. For water supply, the estimates draw on the routine monitoring data and population data used above, together with data on anticipated investments, anticipated technology types to be deployed, and unit cost data from the MoWI. These estimates assume a fairly low-cost mix of technology types to be used, particularly in rural areas, and unit costs for each technology type that are at the low end of the range of estimates used by different assessments, such as the Africa Infrastructure Country Diagnostic. In using routine monitoring data for current coverage levels, the estimates assume higher existing coverage than other possible sources of coverage data.
Sanitation
0 50 100 150 200 250
RequiredCAPEXRequired
OPEX
US$million/year
PublicCAPEX/software(anticipated)
Household CAPEX (assumed)
CAPEX deficit
Water supply
Figure 2Required vs. anticipated public and assumed household expenditure for water supply
0 100 200 300 400
RequiredCAPEX Required OPEX
US$million/year
Public CAPEX (anticipated)
Household CAPEX (assumed)
CAPEX deficit
Source: CSO2 estimates.
These charts demonstrate that the WSDP funding, while making a big step in the right direction, is too little too late to meet the national (water supply) and MDG (sanitation) targets. A total of US$272 million per year is required from public finance and households in water supply capital investments (CAPEX), of which just over half (US$165 million per year) is anticipated from public investments. This is assumed to leverage an additional US$9 million per year in household contributions, based on users contributing 5 percent of total costs, leaving a funding gap of US$98 million per year overall (assuming reallocations between urban and rural subsectors are possible). In fact, the gap is entirely in the urban water supply subsector, where a high proportion of anticipated household connections (70 percent) leave a subsector funding gap of US$101 million per year. In contrast, anticipated investments in rural water supply, assuming high existing coverage and a low cost technology mix, is sufficient to meet targets. If the JMP coverage estimates are instead used, and investment requirements estimated to meet the MDG targets, requirements are slightly higher for urban water supply, and around 50 percent higher for rural water supply (due to a lower coverage estimate and higher subsector target).
Analysis of public investment requirements for sanitation is complicated by two factors. First, national policy in Tanzania requires that capital investment in household sanitation should be financed entirely by households themselves, with the exception of a small amount of
10
An AMCOW Country Status Overview
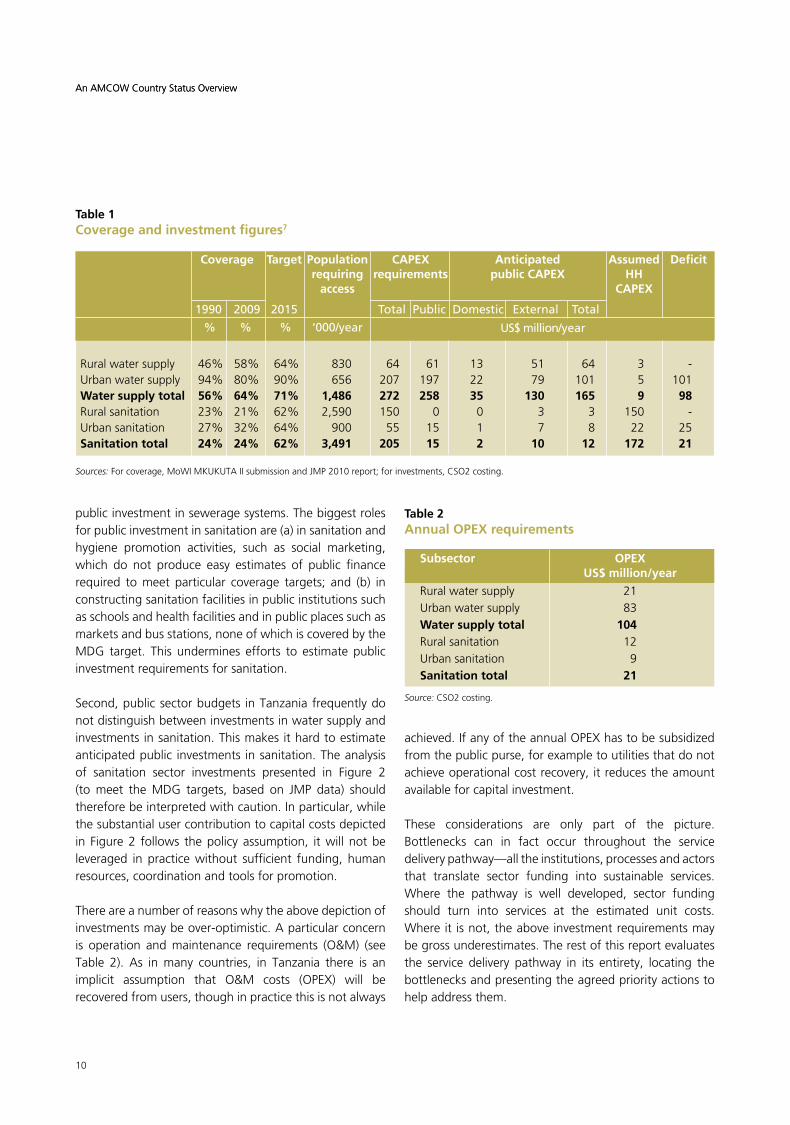
Table 2Annual OPEX requirements
Subsector OPEX US$ million/year
Ruralwatersupply 21Urban water supply 83Water supply total 104Ruralsanitation 12Urban sanitation 9Sanitation total 21
Source: CSO2 costing.
public investment in sewerage systems. The biggest roles for public investment in sanitation are (a) in sanitation and hygiene promotion activities, such as social marketing, which do not produce easy estimates of public finance required to meet particular coverage targets; and (b) in constructing sanitation facilities in public institutions such as schools and health facilities and in public places such as markets and bus stations, none of which is covered by the MDG target. This undermines efforts to estimate public investment requirements for sanitation.
Second, public sector budgets in Tanzania frequently do not distinguish between investments in water supply and investments in sanitation. This makes it hard to estimate anticipated public investments in sanitation. The analysis of sanitation sector investments presented in Figure 2 (to meet the MDG targets, based on JMP data) should therefore be interpreted with caution. In particular, while the substantial user contribution to capital costs depicted in Figure 2 follows the policy assumption, it will not be leveraged in practice without sufficient funding, human resources, coordination and tools for promotion.
There are a number of reasons why the above depiction of investments may be over-optimistic. A particular concern is operation and maintenance requirements (O&M) (see Table 2). As in many countries, in Tanzania there is an implicit assumption that O&M costs (OPEX) will be recovered from users, though in practice this is not always
An AMCOW Country Status Overview
achieved. If any of the annual OPEX has to be subsidized from the public purse, for example to utilities that do not achieve operational cost recovery, it reduces the amount available for capital investment.
These considerations are only part of the picture. Bottlenecks can in fact occur throughout the service delivery pathway—all the institutions, processes and actors that translate sector funding into sustainable services. Where the pathway is well developed, sector funding should turn into services at the estimated unit costs. Where it is not, the above investment requirements may be gross underestimates. The rest of this report evaluates the service delivery pathway in its entirety, locating the bottlenecks and presenting the agreed priority actions to help address them.
Table 1Coverage and investment figures7
Coverage Target Population CAPEX Anticipated Assumed Deficit requiring requirements public CAPEX HH access CAPEX
1990 2009 2015 Total Public Domestic External Total
% % % ‘000/year
Ruralwatersupply 46% 58% 64% 830 64 61 13 51 64 3 -Urban water supply 94% 80% 90% 656 207 197 22 79 101 5 101Water supply total 56% 64% 71% 1,486 272 258 35 130 165 9 98Ruralsanitation 23% 21% 62% 2,590 150 0 0 3 3 150 -Urban sanitation 27% 32% 64% 900 55 15 1 7 8 22 25Sanitation total 24% 24% 62% 3,491 205 15 2 10 12 172 21
US$ million/year
Sources: For coverage, MoWI MKUKUTA II submission and JMP 2010 report; for investments, CSO2 costing.
11
Water Supply and Sanitation in Tanzania: Turning Finance into Services for 2015 and Beyond
3. Reform Context: Introducing the CSO2 Scorecard
Tanzania’s socialist past delivered both positive and negative results in the water and sanitation sector. On the positive side, the high profile Mtu ni Afya public education campaign led to the widespread construction of basic household latrines, to the extent that Tanzania still has very high coverage of basic household latrines compared to elsewhere in Africa. However, in water supply, free water policies undermined sustainability and contributed, along with broader economic stagnation, to chronic underinvestment in both expansion and maintenance.
The first National Water Policy, adopted in 1991, wasthe start of a long process of reforms to address the shortcomings of the previous system and build donor confidence. User charges were introduced along with the establishment of urban utilities, designed to be self-financing. This included an ultimately unsuccessful attempt at introducing private sector participation to the running of Dar es Salaam’s water supply in 2003. A second NationalWaterPolicy(NAWAPO)8 was adopted in 2002, strengthening provisions for cost recovery and introducing stronger pro-poor rhetoric.
Since 2005, a Sector-Wide Approach (SWAp) has been adopted, represented most particularly by the WSDP.9 This multidonor program aims to improve coordination and increase national ownership of water sector investments and has attracted commitments worth US$951 million over five years from the World Bank and AfDB, German, Dutch and French governments, the US Millennium Challenge Corporation, and the Government of Tanzania. Finance for the sector has more than quadrupled since 2002 as a result.10 Alongside the increased finance, the SWAp includes efforts to improve sector performance monitoring and strengthen sector capacity.
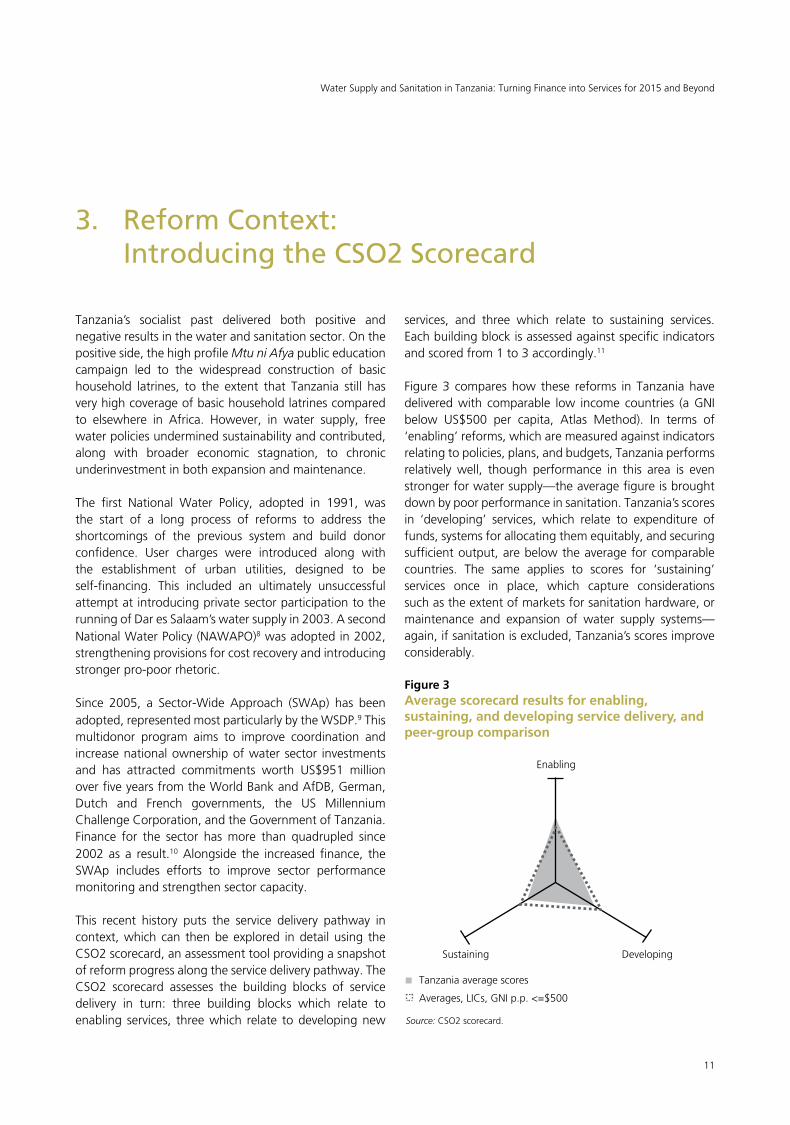
This recent history puts the service delivery pathway in context, which can then be explored in detail using the CSO2 scorecard, an assessment tool providing a snapshot of reform progress along the service delivery pathway. The CSO2 scorecard assesses the building blocks of service delivery in turn: three building blocks which relate to enabling services, three which relate to developing new
services, and three which relate to sustaining services. Each building block is assessed against specific indicators and scored from 1 to 3 accordingly.11
Figure 3 compares how these reforms in Tanzania have deliveredwith comparable low income countries (aGNIbelow US$500 per capita, Atlas Method). In terms of ‘enabling’ reforms, which are measured against indicators relating to policies, plans, and budgets, Tanzania performs relatively well, though performance in this area is even stronger for water supply—the average figure is brought down by poor performance in sanitation. Tanzania’s scores in ‘developing’ services, which relate to expenditure of funds, systems for allocating them equitably, and securing sufficient output, are below the average for comparable countries. The same applies to scores for ‘sustaining’ services once in place, which capture considerations such as the extent of markets for sanitation hardware, or maintenance and expansion of water supply systems—again, if sanitation is excluded, Tanzania’s scores improve considerably.
Figure 3Average scorecard results for enabling, sustaining, and developing service delivery, and peer-group comparison
Enabling
Sustaining Developing
Tanzania average scores
Averages,LICs,GNIp.p.<=$500
Source: CSO2 scorecard.
12
An AMCOW Country Status Overview
Sections 4 to 6 highlight progress and challenges across three thematic areas—the institutional framework, finance, and monitoring and evaluation (M&E)—benchmarking Tanzania against its peer countries based on a grouping by
gross national income. The related indicators are extracted from the scorecard and presented in charts at the beginning of each section. The scorecards for each subsector are presented in their entirety in sections 7 to 10.
An AMCOW Country Status Overview
Table 3Key dates in the reform of the sector in Tanzania
Year Event
1970s High profile Mtu ni Afya campaign on sanitation
1970s–80s Top-down, free water approach to water supply
1991 FirstNationalWaterPolicy,introducingusercharges
2001 Legislationforanindependentutilityregulatorpassed
2002 NationalWaterPolicy(NAWAPO)adopted
2002 RuralWaterSupplyandSanitationProgramlaunched
2003 LeasingofDaresSalaamwatersupplytoprivatesectorcompany
2005 RenationalizationofDaresSalaamwatersupply
2005 NationalWaterSectorDevelopmentStrategy(NWSDS)developed
2007 LaunchoftheWaterSectorDevelopmentProgram($951millionoverfiveyears)
2008 ApprovalofNWSDS
2009 NewwaterlegislationpassedbyParliament
13
Water Supply and Sanitation in Tanzania: Turning Finance into Services for 2015 and Beyond
4. Institutional Framework
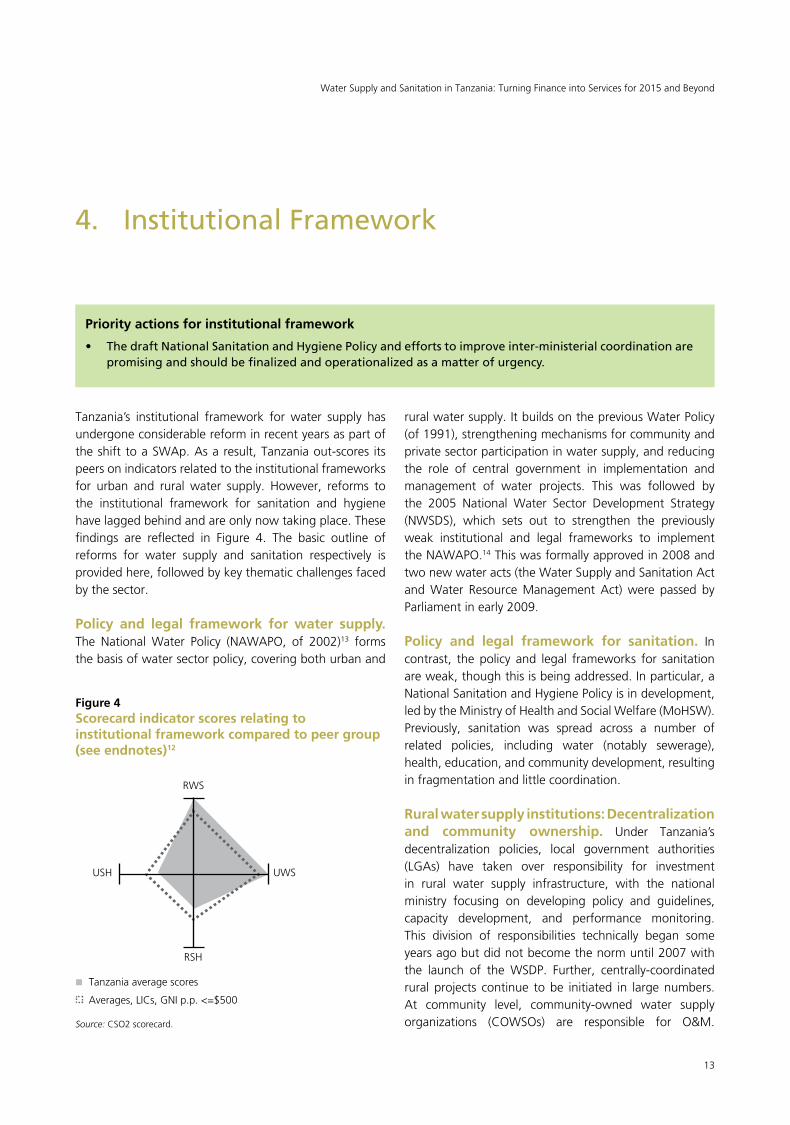
Tanzania’s institutional framework for water supply has undergone considerable reform in recent years as part of the shift to a SWAp. As a result, Tanzania out-scores its peers on indicators related to the institutional frameworks for urban and rural water supply. However, reforms to the institutional framework for sanitation and hygiene have lagged behind and are only now taking place. These findings are reflected in Figure 4. The basic outline of reforms for water supply and sanitation respectively is provided here, followed by key thematic challenges faced by the sector.
Policy and legal framework for water supply. The NationalWater Policy (NAWAPO, of 2002)13 forms the basis of water sector policy, covering both urban and
rural water supply. It builds on the previous Water Policy (of 1991), strengthening mechanisms for community and private sector participation in water supply, and reducing the role of central government in implementation and management of water projects. This was followed by the 2005 National Water Sector Development Strategy(NWSDS), which sets out to strengthen the previouslyweak institutional and legal frameworks to implement theNAWAPO.14 This was formally approved in 2008 and two new water acts (the Water Supply and Sanitation Act andWater ResourceManagement Act)were passed byParliament in early 2009.
Policy and legal framework for sanitation. In contrast, the policy and legal frameworks for sanitation are weak, though this is being addressed. In particular, a NationalSanitationandHygienePolicyisindevelopment,led by the Ministry of Health and Social Welfare (MoHSW). Previously, sanitation was spread across a number of related policies, including water (notably sewerage), health, education, and community development, resulting in fragmentation and little coordination.
Rural water supply institutions: Decentralization and community ownership. Under Tanzania’s decentralization policies, local government authorities (LGAs) have taken over responsibility for investmentin rural water supply infrastructure, with the national ministry focusing on developing policy and guidelines, capacity development, and performance monitoring. This division of responsibilities technically began some years ago but did not become the norm until 2007 with the launch of the WSDP. Further, centrally-coordinated rural projects continue to be initiated in large numbers. At community level, community-owned water supply organizations (COWSOs) are responsible for O&M.
Figure 4Scorecard indicator scores relating to institutional framework compared to peer group (see endnotes)12
Tanzania average scores
Averages,LICs,GNIp.p.<=$500
Source: CSO2 scorecard.
RWS
RSH
USH UWS
Priority actions for institutional framework
• ThedraftNationalSanitationandHygienePolicyandeffortstoimproveinter-ministerialcoordinationarepromisingandshouldbefinalizedandoperationalizedasamatterofurgency.
14
An AMCOW Country Status Overview
COWSOs can take a number of different forms, including water user groups and private companies, and are to be established and registered as independent legal entities. However, in practice, many village water committees (the previous water supply authority at village level, formed as part of village government) remain in place and continue to be formed in some cases. Furthermore, the registration of COWSOs is complex and time consuming and many therefore remain unregistered.15
Urban water supply: Uncertain steps to privatization. Urban water supply authorities (UWSAs) have responsibility for water supply, regulated by an independent regulator, the Energy and Water Utilities Regulatory Authority (EWURA). There is some minorduplication of responsibilities between the recently formed independent regulator, EWURA, and MoWI,with the ministry continuing to perform some roles that fitmorenaturallywithEWURA,suchasmonitoringandreporting. UWSAs are theoretically autonomous entities being strengthened for privatization, though the majority remain highly dependent on operational subsidies from central or local government.16 Dar es Salaam has been managed separately due mainly to its size. A failed attempt at leasing the water supply operation in 200317 has left the city with two publicly-owned entities, an asset holding agency (DAWASA, Dar es Salaam Water and Sewerage Corporation) and an operating authority (DAWASCO, Dar es Salaam Water and Sewerage Authority), which coexist in an often uneasy relationship. The future remains unclear, with talk of merging DAWASA and DAWASCO taking place alongside discussion about reprivatizing DAWASCO.
Small towns: Creating viable service providers. The status of small town utilities is currently in flux, with concerns about their financial viability leading to efforts to cluster several small town utilities together with a larger, better-established UWSA. This is being resisted by
UWSAs in both small and large towns and the future of this approach remains unclear.18
Household sanitation: Steps towards institutional clarity at national level. Institutional roles and responsibilities for household sanitation are much less clearly defined. At national policy-making level, the MoHSW has the mandate for coordination of sanitation policy and finance matters, but the practice is less clear-cut. The MoWI has responsibility for sewerage, and the majority of aid finance for household sanitation is bundled together with finance for water supply and therefore flows through the MoWI’s budgets. There have been some recent efforts to improve coordination in the sanitation sectoraspartoftheworktodevelopaNationalSanitationand Hygiene Policy. This brings together the Ministries of Health and Water with Education and Vocational Training andthePrimeMinister’sOfficeforRegionalAdministrationand LocalGovernment, including the development of amultiministerial Memorandum of Understanding outlining their respective roles and responsibilities.
Aid coordination: Continuing the positive developments. Since 2004, the main donors in Tanzania’s water sector have improved their coordination greatly, with the German development agencies KfW and GTZ playing leading roles alongside the World Bank; andAfDB, theNetherlands, andFrance supporting theresulting SWAp. This culminated in the development of a SWAp and the WSDP. The majority of the sector’s major donors are either pooling funds in the sector basket funding mechanism or coordinating their funding closely with other donors while providing earmarked funds for particular projects or subsectors. This is a significant improvement since five years previously, when almost all donor finance for the sector was provided as project funding. There is an active Development Partner Group for Water, which acts as the main forum for coordinating donor activities.
An AMCOW Country Status Overview
15
Water Supply and Sanitation in Tanzania: Turning Finance into Services for 2015 and Beyond
Priority actions for financing and its implementation
• Theshiftfromprojectfundingtoasectorwideapproachisnotasmoothprocessanditisnotyetcertainthat the sector will emerge from the transition without losing the trust of some key donors. Cementing recentimprovementstoprocurementandbudgetmanagementwillbecritical.
• Moresystematicuseofdataonaccessandinfrastructureinplanningandbudgetallocationswouldhelpovercomethepresentequitychallengesandresultinmoreefficientuseofresources.
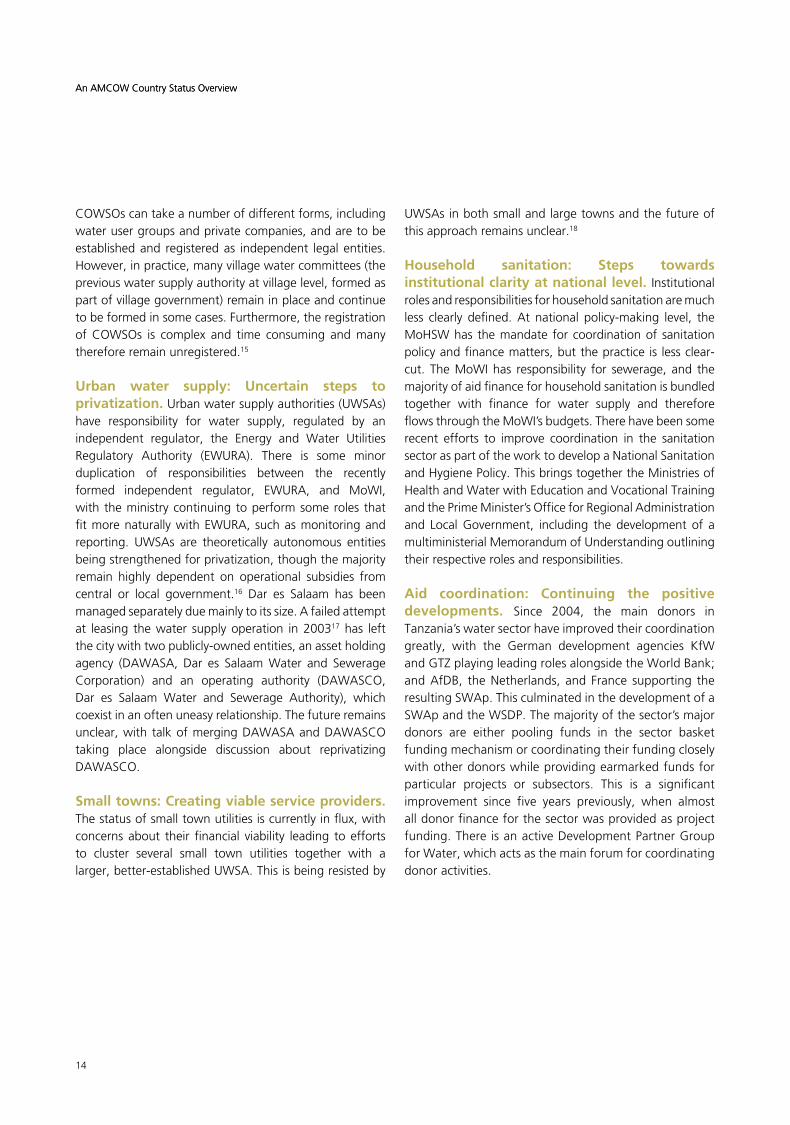
The WSDP represents a quadrupling of finance for the sector—a major accomplishment—though managing these funds effectively, efficiently, and equitably remains challenging. Furthermore, financing for sanitation remains opaque, hard to distinguish from finance for water supply and split between multiple agencies. As a result, and as shown in Figure 5, Tanzania out-scores its peers in terms of finance for water supply, though not for sanitation and hygiene.
5. FinancinganditsImplementation
Planning: Tighter linking of inputs, outputs, and need. The sector’s investment plan, the WSDP, has its own targets and is therefore not directly based either on national (MKUKUTA) or international (MDG) targets. Furthermore, the WSDP’s targets (and costing) are based on routine monitoring figures while MDG monitoring draws on household surveys. Similarly, operational planning processes depend on routine monitoring data. In rural water supply, this is operationalized through a formula-based allocation system, though this is not fully implemented.20 In urban water supply, service delivery data is used for planning, though not systematically. It is also becoming widely accepted that routine monitoring data for both urban and rural water supply is based on flawed assumptions, though there are currently efforts under way in both urban and rural water supply to improve the quality of routine monitoring data.21
Budgeting: Quantity. The WSDP represents a 400 percent increase in funding for Tanzania’s water sector.22 Even this increase, however, does not appear to be sufficient to meet the sector targets. However, increasing funding further is not likely to close the gap as absorption capacity is already insufficient to keep pace with the increases.
Equity: Fairer allocations to subnational level. Public funding for water sector investments is allocated using a combination of formulae and less systematic approaches. The division of funding between urban and rural water supply is made at the political level,
Figure 5Scorecard indicator scores relating to financing and its implementation, compared to peer group19
Tanzania average scores
Averages,LICs,GNIp.p.<=$500
Source: CSO2 scorecard.
RWS
RSH
USH UWS
16
An AMCOW Country Status OverviewAn AMCOW Country Status Overview
with lobbying from civil society (supported by donors) having recently reduced a considerable bias in favor of urban investments.23 In urban water supply, there is no national formula-based allocation system to utilities for either capital or operational subsidy. The ministry has a set of criteria for allocating investment funds to utilities, though these criteria are not used systematically. A formulasystem, linked to theLocalGovernmentCapitalGrant means allocations within the rural water supply subsector are more systematic, which has brought about a major improvement in equity between districts,24 though deviations from the formula system remain common.25
Equity: Local participation. At a local level, the allocation of resources to projects in specific rural communities within a district is intended to be based on a combination of need (as demonstrated by current levels of access) and demand (as demonstrated through the bottom up planning process). However, recent evidence suggests that in practice, allocations are targeted at wealthier, more politically connected, less remote and better-served communities.26 Furthermore, though there is no systematic research available, there is widespread anecdotal evidence that investment allocations within urban areas are also targeted at wealthier communities.
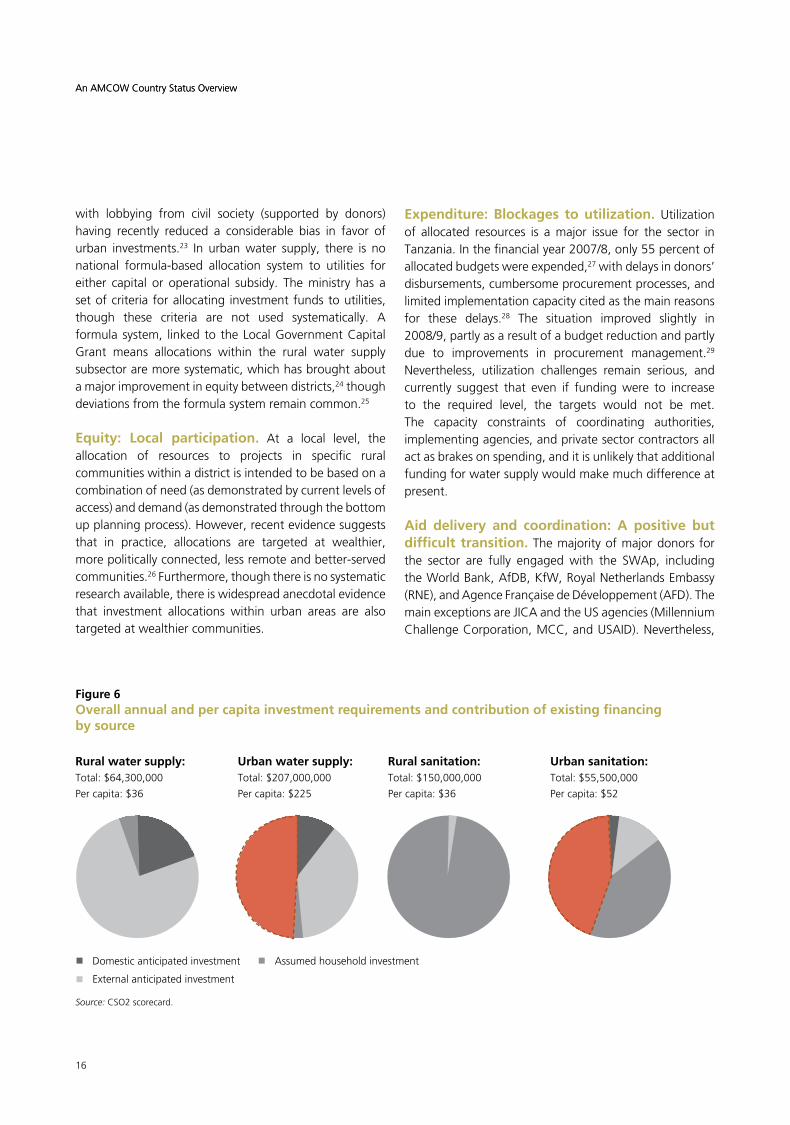
Rural water supply:Total: $64,300,000
Per capita: $36
Urban water supply:Total: $207,000,000
Per capita: $225
Rural sanitation:Total: $150,000,000
Per capita: $36
Urban sanitation:Total: $55,500,000
Per capita: $52
Domestic anticipated investment
External anticipated investment
Assumed household investment
Source: CSO2 scorecard.
Expenditure: Blockages to utilization. Utilization of allocated resources is a major issue for the sector in Tanzania.Inthefinancialyear2007/8,only55percentofallocated budgets were expended,27 with delays in donors’ disbursements, cumbersome procurement processes, and limited implementation capacity cited as the main reasons for these delays.28 The situation improved slightly in 2008/9,partlyasaresultofabudgetreductionandpartlydue to improvements in procurement management.29 Nevertheless, utilization challenges remain serious, andcurrently suggest that even if funding were to increase to the required level, the targets would not be met. The capacity constraints of coordinating authorities, implementing agencies, and private sector contractors all act as brakes on spending, and it is unlikely that additional funding for water supply would make much difference at present.
Aid delivery and coordination: A positive but difficult transition. The majority of major donors for the sector are fully engaged with the SWAp, including theWorldBank,AfDB,KfW,RoyalNetherlandsEmbassy(RNE),andAgenceFrançaisedeDéveloppement(AFD).Themain exceptions are JICA and the US agencies (Millennium ChallengeCorporation,MCC,andUSAID).Nevertheless,
Figure 6Overall annual and per capita investment requirements and contribution of existing financing by source
17
Water Supply and Sanitation in Tanzania: Turning Finance into Services for 2015 and Beyond
this approach is not seen by donors or government as perfect; the shift from project funding to the WSDP has not been easy. The ministry’s new role as coordinator (rather than implementer) requires a different skill-set and different thinking. This transition has contributed to the slow pace of implementation and is affecting the quality of planning, monitoring and reporting in a way that is leaving some donors dissatisfied. Some are beginning to
lose faith in the approach, while others see the challenges more as growing pains, which will take time to overcome, but worth waiting for on the basis that once new systems and capacities are in place, national ownership and accountability will be substantially stronger than would be the case under a return to project financing. This is a particular concern as the initial five-year period of the WSDP comes to an end.
18
An AMCOW Country Status Overview
Performance monitoring in Tanzania is benefiting from the shift to thinking at sectorwide level. This has drawn attention to inconsistencies and inaccuracies in existing monitoring and reporting mechanisms. As in other areas, water supply out-scores sanitation, where less work has gone into improving monitoring systems.
Performance monitoring: Improving consistency. Performance monitoring in the sector has been recognized as a weak point, resulting in the commissioning in 2009 of a
6. SectorMonitoringandEvaluation
review of the sector’s performance monitoring framework and systems. Significant weaknesses highlighted by the review include the inconsistency of household surveys with MDG definitions for ‘improved’ sanitation, the over-reliance on routine monitoring data for water supply that depend upon flawed assumptions, and the slow pace of efforts to improve routine monitoring systems for rural water supply.31
Accountability: Improving consultation. Annual JointWaterSectorReviews (JWSRs)have takenplace inTanzania since 2006. At each review, an annual sector performance report has been presented and priority actions for the coming year discussed and agreed. It has quickly become a key event in the annual calendar, the focus of considerably civil society lobbying and increasingly substantive debate. The equity reports (discussed in the final paragraph of this section) and engagement from the sectorcivilsocietynetwork,TAWASANET,withtheJWSRsare evidence that the forum acts as an accountability mechanism. As a more open forum than any other decision-making process in the sector, it is more easily accessible to civil society groups.
Accountability: Reporting and supervision. The qualityofreportspresentedtotheJWSRshasvaried.Themost recent report (for 2008/9)32 was considered to be an improvement on previous years, though this did not includereportingonexpenditureversusbudget.Reportsin all years have included nationally consolidated reports of sector outputs, though not consistently disaggregated
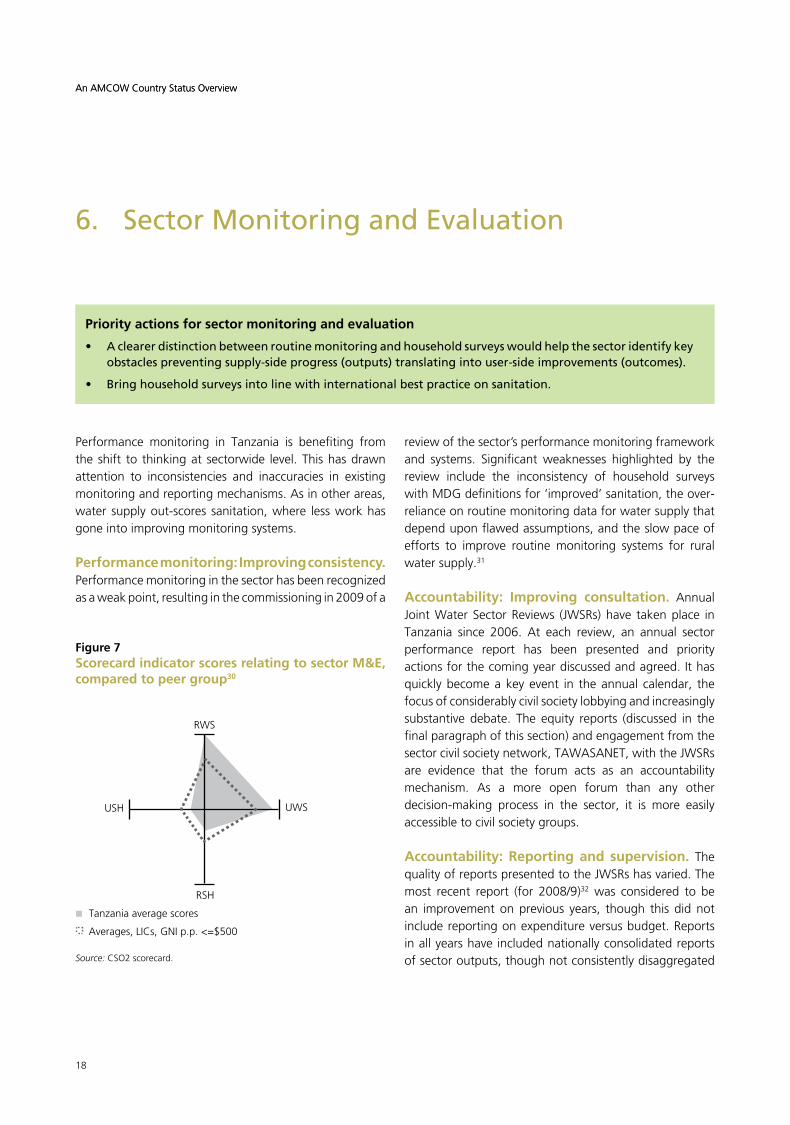
Figure 7Scorecard indicator scores relating to sector M&E, compared to peer group30
RWS
RSH
Tanzania average scores
Averages,LICs,GNIp.p.<=$500
USH UWS
Source: CSO2 scorecard.
An AMCOW Country Status Overview
Priority actions for sector monitoring and evaluation
• Aclearerdistinctionbetweenroutinemonitoringandhouseholdsurveyswouldhelpthesectoridentifykeyobstaclespreventingsupply-sideprogress(outputs)translatingintouser-sideimprovements(outcomes).
• Bringhouseholdsurveysintolinewithinternationalbestpracticeonsanitation.
19
Water Supply and Sanitation in Tanzania: Turning Finance into Services for 2015 and Beyond
by utility and district. Similarly, the quality of discussion andoutputsoftheJWSRshasvaried,thoughonapositivetrajectory. A complementary process of twice-annual WSDP Supervision Missions has been in place since the WSDP was launched in 2007. The September–October 2009 Mission was, for the first time, timed to coincide with the JWSR. This has the positive effect of reducingduplication of dialog, but also took the final process of annualpriority-settingawayfromthemorepublic JWSRforum and into a closed door meeting, potentially reducing accountability.
Accountability: Independent reporting on equity. The2007JWSRmandatedthe recently formedcivilsocietynetwork,TAWASANET,toprepareanequitymonitoring strategy and report for the sector. This report was presented at the 2008 review,33 stimulating some debate on the equity-orientation of the sector and resultinginthemandatebeingextendedtoTAWASANETto prepare an annual equity report as a recurring feature offutureJWSRs.Thesecondsuchreportwaspresentedatthe2009JWSR.34
20
An AMCOW Country Status Overview
7. Subsector:RuralWaterSupply
Priority actions for rural water supply
• The increased fundingavailable for ruralwater supply shouldbeallocatedmoreefficiently, includingthroughmoresystematicuseofdata.Thisappliesbothnationally,wheretheallocationformulashouldbe applied in full, and at local level, where equity considerations should be given greaterweight inplanning.
• Developandimplementacomprehensivestrategytoaddressthepoorsustainabilityrecordofruralwaterprojects, including through strengtheningmonitoringof functionality andexploring thepossibility ofcreatingafundingwindowforrehabilitationofruralwatersupplyinfrastructure.
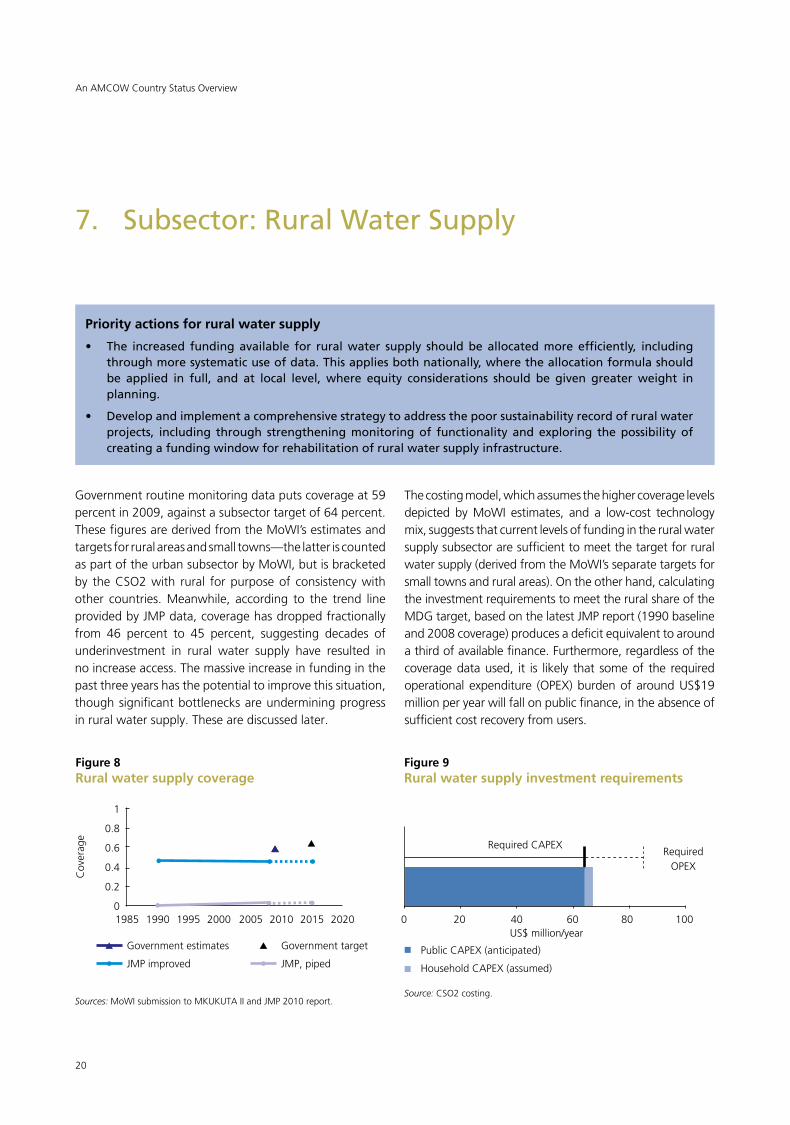
The costing model, which assumes the higher coverage levels depicted by MoWI estimates, and a low-cost technology mix, suggests that current levels of funding in the rural water supply subsector are sufficient to meet the target for rural water supply (derived from the MoWI’s separate targets for small towns and rural areas). On the other hand, calculating the investment requirements to meet the rural share of the MDG target, based on the latest JMP report (1990 baseline and 2008 coverage) produces a deficit equivalent to around a third of available finance. Furthermore, regardless of the coverage data used, it is likely that some of the required operational expenditure (OPEX) burden of around US$19 million per year will fall on public finance, in the absence of sufficient cost recovery from users.
Government routine monitoring data puts coverage at 59 percent in 2009, against a subsector target of 64 percent. These figures are derived from the MoWI’s estimates and targets for rural areas and small towns—the latter is counted as part of the urban subsector by MoWI, but is bracketed by the CSO2 with rural for purpose of consistency with other countries. Meanwhile, according to the trend line provided by JMP data, coverage has dropped fractionally from 46 percent to 45 percent, suggesting decades of underinvestment in rural water supply have resulted in no increase access. The massive increase in funding in the past three years has the potential to improve this situation, though significant bottlenecks are undermining progress in rural water supply. These are discussed later.
Figure 8Rural water supply coverage
1
0.8
0.6
0.4
0.2
01985 1990 1995 2000 2005 2010 2015 2020
Government estimates
JMP improved
Government target
JMP, piped
Sources: MoWI submission to MKUKUTA II and JMP 2010 report.
Figure 9Rural water supply investment requirements
0 20 40 60 80 100
RequiredCAPEXRequired
OPEX
US$million/year
Public CAPEX (anticipated)
Household CAPEX (assumed)
Source: CSO2 costing.
Cov
erag
e
21
Water Supply and Sanitation in Tanzania: Turning Finance into Services for 2015 and Beyond
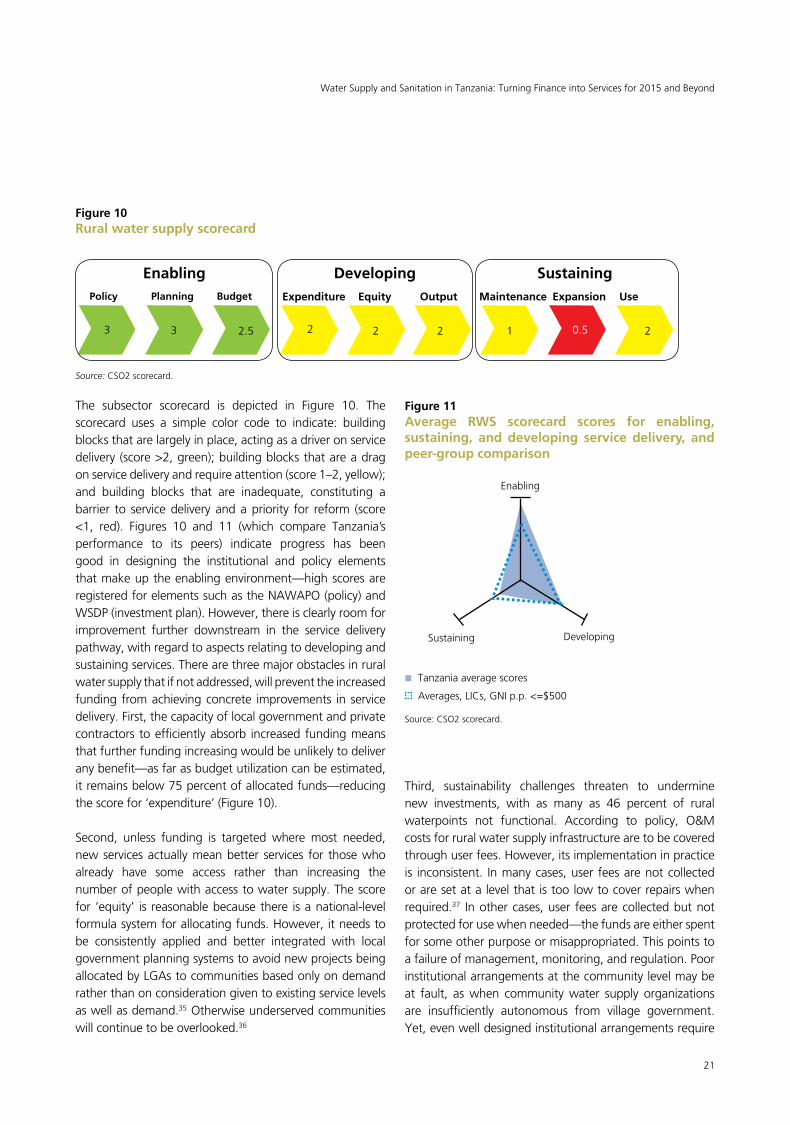
Figure 10Rural water supply scorecard
The subsector scorecard is depicted in Figure 10. The scorecard uses a simple color code to indicate: building blocks that are largely in place, acting as a driver on service delivery (score >2, green); building blocks that are a drag on service delivery and require attention (score 1–2, yellow); and building blocks that are inadequate, constituting a barrier to service delivery and a priority for reform (score <1, red). Figures 10 and 11 (which compare Tanzania’sperformance to its peers) indicate progress has been good in designing the institutional and policy elements that make up the enabling environment—high scores are registeredforelementssuchastheNAWAPO(policy)andWSDP (investment plan). However, there is clearly room for improvement further downstream in the service delivery pathway, with regard to aspects relating to developing and sustaining services. There are three major obstacles in rural water supply that if not addressed, will prevent the increased funding from achieving concrete improvements in service delivery. First, the capacity of local government and private contractors to efficiently absorb increased funding means that further funding increasing would be unlikely to deliver any benefit—as far as budget utilization can be estimated, it remains below 75 percent of allocated funds—reducing the score for ‘expenditure’ (Figure 10).
Second, unless funding is targeted where most needed, new services actually mean better services for those who already have some access rather than increasing the number of people with access to water supply. The score for ‘equity’ is reasonable because there is a national-level formula system for allocating funds. However, it needs to be consistently applied and better integrated with local government planning systems to avoid new projects being allocatedbyLGAstocommunitiesbasedonlyondemandrather than on consideration given to existing service levels as well as demand.35 Otherwise underserved communities will continue to be overlooked.36
Third, sustainability challenges threaten to undermine new investments, with as many as 46 percent of rural waterpoints not functional. According to policy, O&M costs for rural water supply infrastructure are to be covered through user fees. However, its implementation in practice is inconsistent. In many cases, user fees are not collected or are set at a level that is too low to cover repairs when required.37 In other cases, user fees are collected but not protected for use when needed—the funds are either spent for some other purpose or misappropriated. This points to a failure of management, monitoring, and regulation. Poor institutional arrangements at the community level may be at fault, as when community water supply organizations are insufficiently autonomous from village government. Yet, even well designed institutional arrangements require
Figure 11Average RWS scorecard scores for enabling, sustaining, and developing service delivery, and peer-group comparison
EnablingPolicy
3 3 2.5 2 2 2 1 0.5 2
Planning Budget Expenditure Equity Output Maintenance Expansion Use
Developing Sustaining
Enabling
Tanzania average scores
Averages,LICs,GNIp.p.<=$500
Sustaining Developing
Source: CSO2 scorecard.
Source: CSO2 scorecard.
22
An AMCOW Country Status OverviewAn AMCOW Country Status Overview
some form of outside monitoring and regulation. District government is mandated to perform this backstopping and oversight role, but there is no systematic approach to doing so,38 and recurrent funding lags well behind the recent increases in development funding. These challenges result in an a modest score for maintenance, and the lack of funding and support has even more serious implications for expansion of rural water supply schemes, which registers the lowest score of all.
Ensuring that community water supply organizations are autonomous of village local government has been recognized as a key component of ensuring sustainability
and encouraging expansion. However, while new institutional arrangements have been prescribed by the NWSDSandtherecentWaterSupplyandSanitationAct,implementation remains patchy. Village water committees, formed as part of village government, remain common and continue to be formed in some cases, despite policy and legislation calling for more autonomous arrangements. Where more autonomous entities have been formed, protecting their independence by ensuring that they are legally registered has been a time-consuming exercise. The recent legislation simplifies the process by enabling registration at district rather than national level, though this has yet to be implemented.
23
Water Supply and Sanitation in Tanzania: Turning Finance into Services for 2015 and Beyond
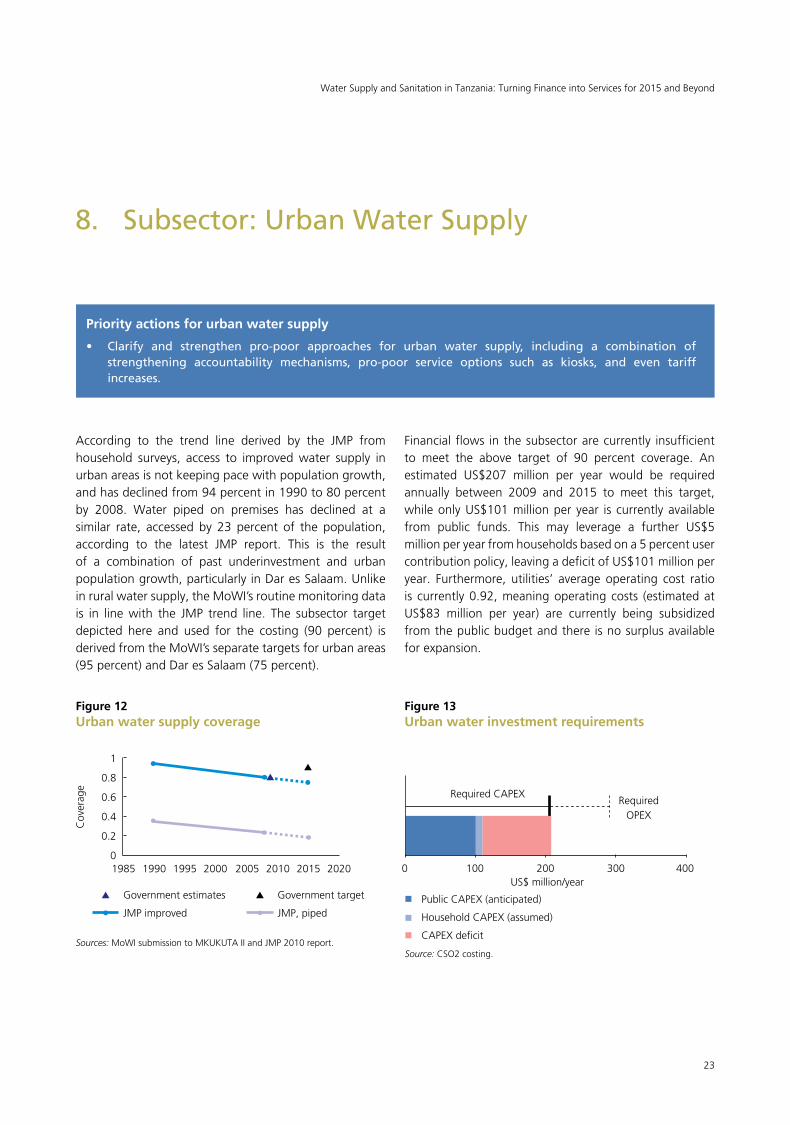
According to the trend line derived by the JMP from household surveys, access to improved water supply in urban areas is not keeping pace with population growth, and has declined from 94 percent in 1990 to 80 percent by 2008. Water piped on premises has declined at a similar rate, accessed by 23 percent of the population, according to the latest JMP report. This is the result of a combination of past underinvestment and urban population growth, particularly in Dar es Salaam. Unlike in rural water supply, the MoWI’s routine monitoring data is in line with the JMP trend line. The subsector target depicted here and used for the costing (90 percent) is derived from the MoWI’s separate targets for urban areas (95 percent) and Dar es Salaam (75 percent).
8. Subsector:UrbanWaterSupply
Priority actions for urban water supply
• Clarify and strengthen pro-poor approaches for urban water supply, including a combination ofstrengthening accountability mechanisms, pro-poor service options such as kiosks, and even tariffincreases.
Financial flows in the subsector are currently insufficient to meet the above target of 90 percent coverage. An estimated US$207 million per year would be required annually between 2009 and 2015 to meet this target, while only US$101 million per year is currently available from public funds. This may leverage a further US$5 million per year from households based on a 5 percent user contribution policy, leaving a deficit of US$101 million per year. Furthermore, utilities’ average operating cost ratio is currently 0.92, meaning operating costs (estimated at US$83 million per year) are currently being subsidized from the public budget and there is no surplus available for expansion.
Figure 12Urban water supply coverage
1
0.8
0.6
0.4
0.2
01985 1990 1995 2000 2005 2010 2015 2020
Government estimates
JMP improved
Government target
JMP, piped
Sources: MoWI submission to MKUKUTA II and JMP 2010 report.
Cov
erag
e
Figure 13Urban water investment requirements
0 100 200 300 400
RequiredCAPEXRequired
OPEX
US$million/year
Public CAPEX (anticipated)
Household CAPEX (assumed)
CAPEX deficit
Source: CSO2 costing.
24
An AMCOW Country Status Overview
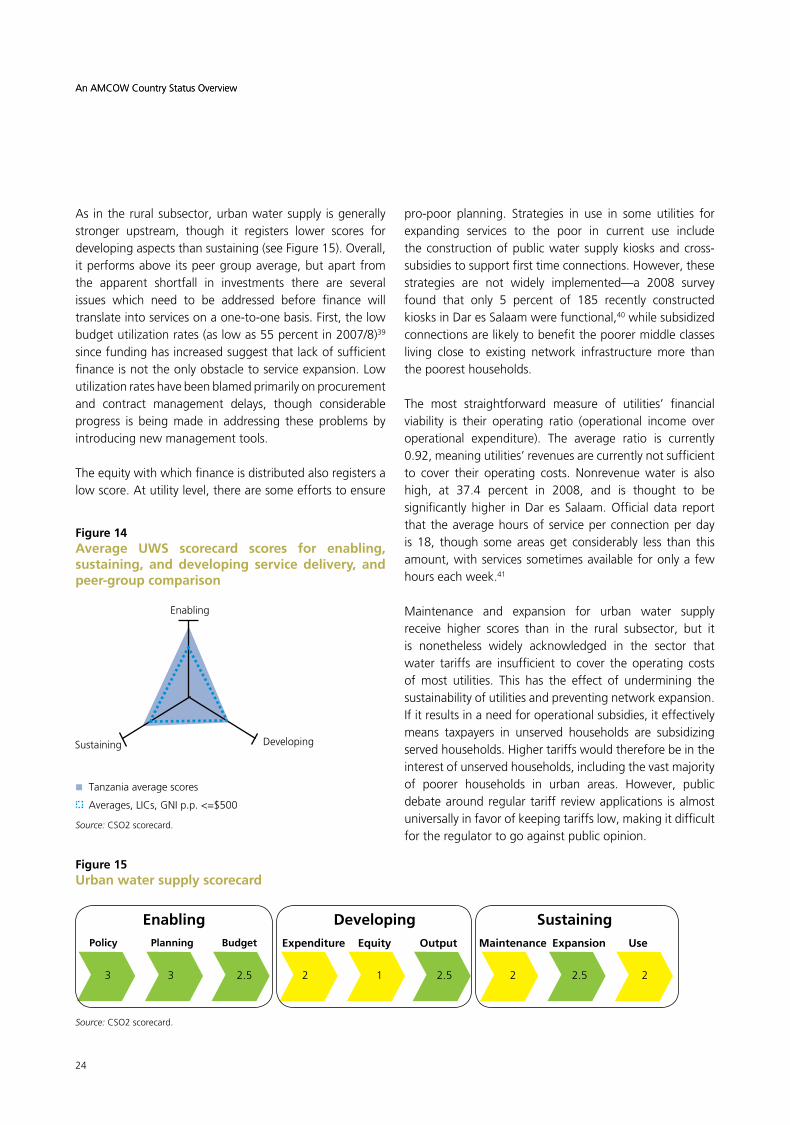
As in the rural subsector, urban water supply is generally stronger upstream, though it registers lower scores for developing aspects than sustaining (see Figure 15). Overall, it performs above its peer group average, but apart from the apparent shortfall in investments there are several issues which need to be addressed before finance will translate into services on a one-to-one basis. First, the low budgetutilizationrates(aslowas55percentin2007/8)39 since funding has increased suggest that lack of sufficient financeisnottheonlyobstacletoserviceexpansion.Lowutilization rates have been blamed primarily on procurement and contract management delays, though considerable progress is being made in addressing these problems by introducing new management tools.
The equity with which finance is distributed also registers a low score. At utility level, there are some efforts to ensure
pro-poor planning. Strategies in use in some utilities for expanding services to the poor in current use include the construction of public water supply kiosks and cross-subsidies to support first time connections. However, these strategies are not widely implemented—a 2008 survey found that only 5 percent of 185 recently constructed kiosks in Dar es Salaam were functional,40 while subsidized connections are likely to benefit the poorer middle classes living close to existing network infrastructure more than the poorest households.
The most straightforward measure of utilities’ financial viability is their operating ratio (operational income over operational expenditure). The average ratio is currently 0.92, meaning utilities’ revenues are currently not sufficient to cover their operating costs. Nonrevenuewater is alsohigh, at 37.4 percent in 2008, and is thought to be significantly higher in Dar es Salaam. Official data report that the average hours of service per connection per day is 18, though some areas get considerably less than this amount, with services sometimes available for only a few hours each week.41
Maintenance and expansion for urban water supply receive higher scores than in the rural subsector, but it is nonetheless widely acknowledged in the sector that water tariffs are insufficient to cover the operating costs of most utilities. This has the effect of undermining the sustainability of utilities and preventing network expansion. If it results in a need for operational subsidies, it effectively means taxpayers in unserved households are subsidizing served households. Higher tariffs would therefore be in the interest of unserved households, including the vast majority of poorer households in urban areas. However, public debate around regular tariff review applications is almost universally in favor of keeping tariffs low, making it difficult for the regulator to go against public opinion.
Figure 15Urban water supply scorecard
EnablingPolicy
3 3 2.5 2 1 2.5 2 2.5 2
Planning Budget Expenditure Equity Output Maintenance Expansion Use
Developing Sustaining
Source: CSO2 scorecard.
Figure 14Average UWS scorecard scores for enabling, sustaining, and developing service delivery, and peer-group comparison
Enabling
Tanzania average scores
Averages,LICs,GNIp.p.<=$500
Sustaining Developing
Source: CSO2 scorecard.
An AMCOW Country Status Overview
25
Water Supply and Sanitation in Tanzania: Turning Finance into Services for 2015 and Beyond
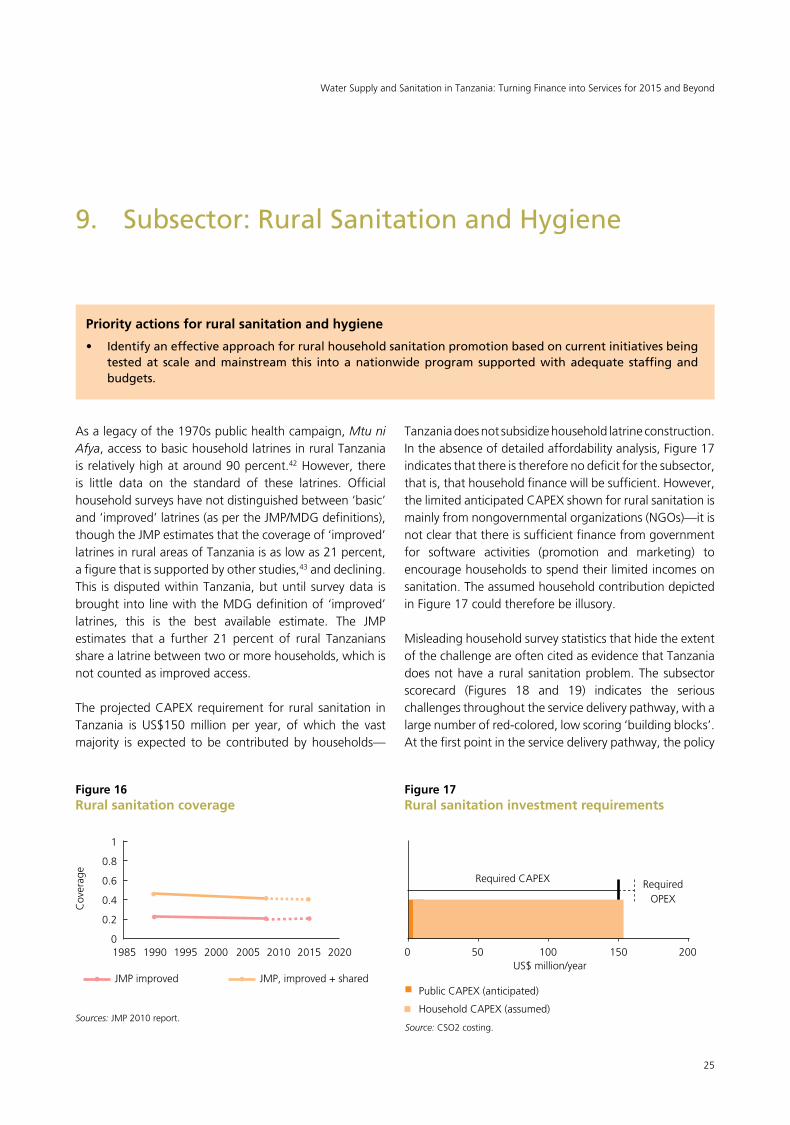
As a legacy of the 1970s public health campaign, Mtu ni Afya, access to basic household latrines in rural Tanzania is relatively high at around 90 percent.42 However, there is little data on the standard of these latrines. Official household surveys have not distinguished between ‘basic’ and‘improved’latrines(aspertheJMP/MDGdefinitions),though the JMP estimates that the coverage of ‘improved’ latrines in rural areas of Tanzania is as low as 21 percent, a figure that is supported by other studies,43 and declining. This is disputed within Tanzania, but until survey data is brought into line with the MDG definition of ‘improved’ latrines, this is the best available estimate. The JMP estimates that a further 21 percent of rural Tanzanians share a latrine between two or more households, which is not counted as improved access.
The projected CAPEX requirement for rural sanitation in Tanzania is US$150 million per year, of which the vast majority is expected to be contributed by households—
9. Subsector:RuralSanitationandHygiene
Priority actions for rural sanitation and hygiene
• Identifyaneffectiveapproachforruralhouseholdsanitationpromotionbasedoncurrentinitiativesbeingtestedat scaleandmainstream this intoanationwideprogram supportedwithadequate staffingandbudgets.
Tanzania does not subsidize household latrine construction. In the absence of detailed affordability analysis, Figure 17 indicates that there is therefore no deficit for the subsector, that is, that household finance will be sufficient. However, the limited anticipated CAPEX shown for rural sanitation is mainlyfromnongovernmentalorganizations(NGOs)—itisnot clear that there is sufficient finance from government for software activities (promotion and marketing) to encourage households to spend their limited incomes on sanitation. The assumed household contribution depicted in Figure 17 could therefore be illusory.
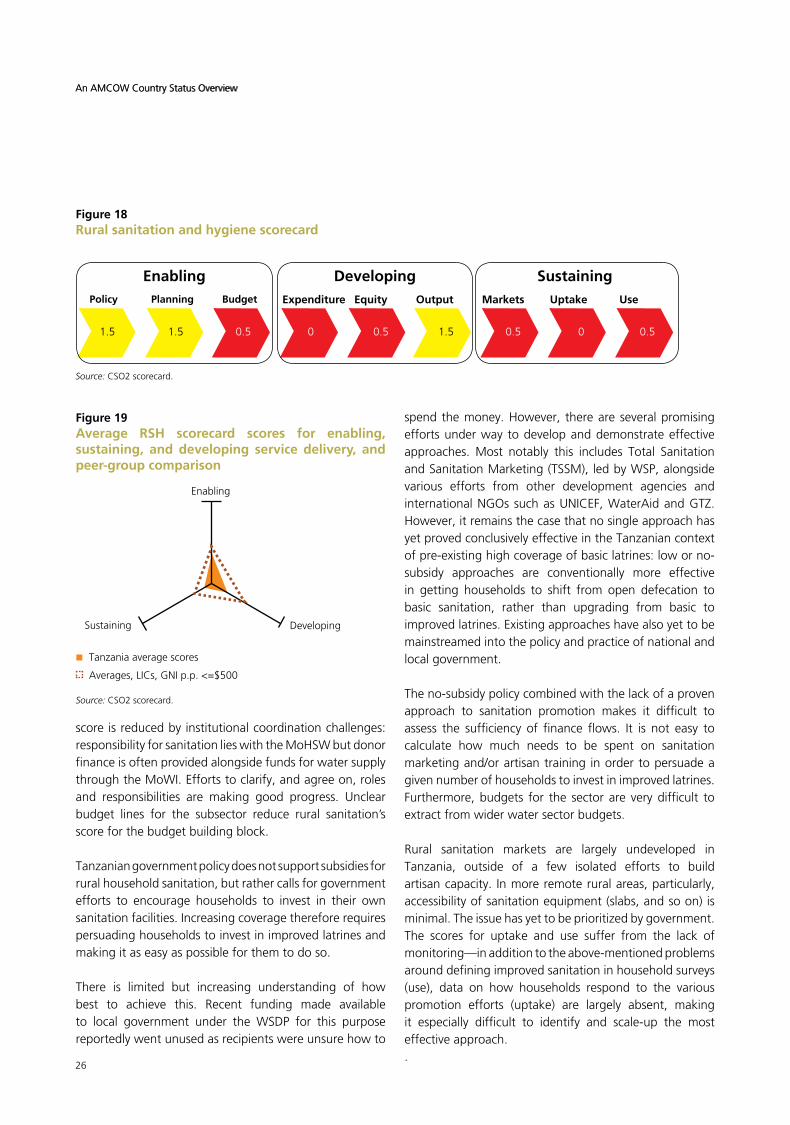
Misleading household survey statistics that hide the extent of the challenge are often cited as evidence that Tanzania does not have a rural sanitation problem. The subsector scorecard (Figures 18 and 19) indicates the serious challenges throughout the service delivery pathway, with a large number of red-colored, low scoring ‘building blocks’. At the first point in the service delivery pathway, the policy
Figure 17Rural sanitation investment requirements
0 50 100 150 200
RequiredCAPEX Required OPEX
US$million/year
Public CAPEX (anticipated)
Household CAPEX (assumed)
Source: CSO2 costing.
Figure 16Rural sanitation coverage
1
0.8
0.6
0.4
0.2
01985 1990 1995 2000 2005 2010 2015 2020
JMP improved JMP, improved + shared
Sources: JMP 2010 report.
Cov
erag
e
26
An AMCOW Country Status Overview
score is reduced by institutional coordination challenges: responsibility for sanitation lies with the MoHSW but donor finance is often provided alongside funds for water supply through the MoWI. Efforts to clarify, and agree on, roles and responsibilities are making good progress. Unclear budget lines for the subsector reduce rural sanitation’s score for the budget building block.
Tanzanian government policy does not support subsidies for rural household sanitation, but rather calls for government efforts to encourage households to invest in their own sanitation facilities. Increasing coverage therefore requires persuading households to invest in improved latrines and making it as easy as possible for them to do so.
There is limited but increasing understanding of how best to achieve this. Recent funding made availableto local government under the WSDP for this purpose reportedly went unused as recipients were unsure how to
Figure 19Average RSH scorecard scores for enabling, sustaining, and developing service delivery, and peer-group comparison
spend the money. However, there are several promising efforts under way to develop and demonstrate effective approaches. Most notably this includes Total Sanitation and Sanitation Marketing (TSSM), led by WSP, alongside various efforts from other development agencies and internationalNGOssuchasUNICEF,WaterAidandGTZ.However, it remains the case that no single approach has yet proved conclusively effective in the Tanzanian context of pre-existing high coverage of basic latrines: low or no-subsidy approaches are conventionally more effective in getting households to shift from open defecation to basic sanitation, rather than upgrading from basic to improved latrines. Existing approaches have also yet to be mainstreamed into the policy and practice of national and local government.
The no-subsidy policy combined with the lack of a proven approach to sanitation promotion makes it difficult to assess the sufficiency of finance flows. It is not easy to calculate how much needs to be spent on sanitation marketingand/orartisantraining inordertopersuadeagiven number of households to invest in improved latrines. Furthermore, budgets for the sector are very difficult to extract from wider water sector budgets.
Rural sanitation markets are largely undeveloped inTanzania, outside of a few isolated efforts to build artisan capacity. In more remote rural areas, particularly, accessibility of sanitation equipment (slabs, and so on) is minimal. The issue has yet to be prioritized by government. The scores for uptake and use suffer from the lack of monitoring—in addition to the above-mentioned problems around defining improved sanitation in household surveys (use), data on how households respond to the various promotion efforts (uptake) are largely absent, making it especially difficult to identify and scale-up the most effective approach..
Figure 18Rural sanitation and hygiene scorecard
Enabling
Tanzania average scores
Averages,LICs,GNIp.p.<=$500
Sustaining Developing
Source: CSO2 scorecard.
EnablingPolicy
1.5 1.5 0.5 0 0.5 1.5 0.5 0 0.5
Planning Budget Expenditure Equity Output Markets Uptake Use
Developing Sustaining
Source: CSO2 scorecard.
An AMCOW Country Status Overview
27
Water Supply and Sanitation in Tanzania: Turning Finance into Services for 2015 and Beyond
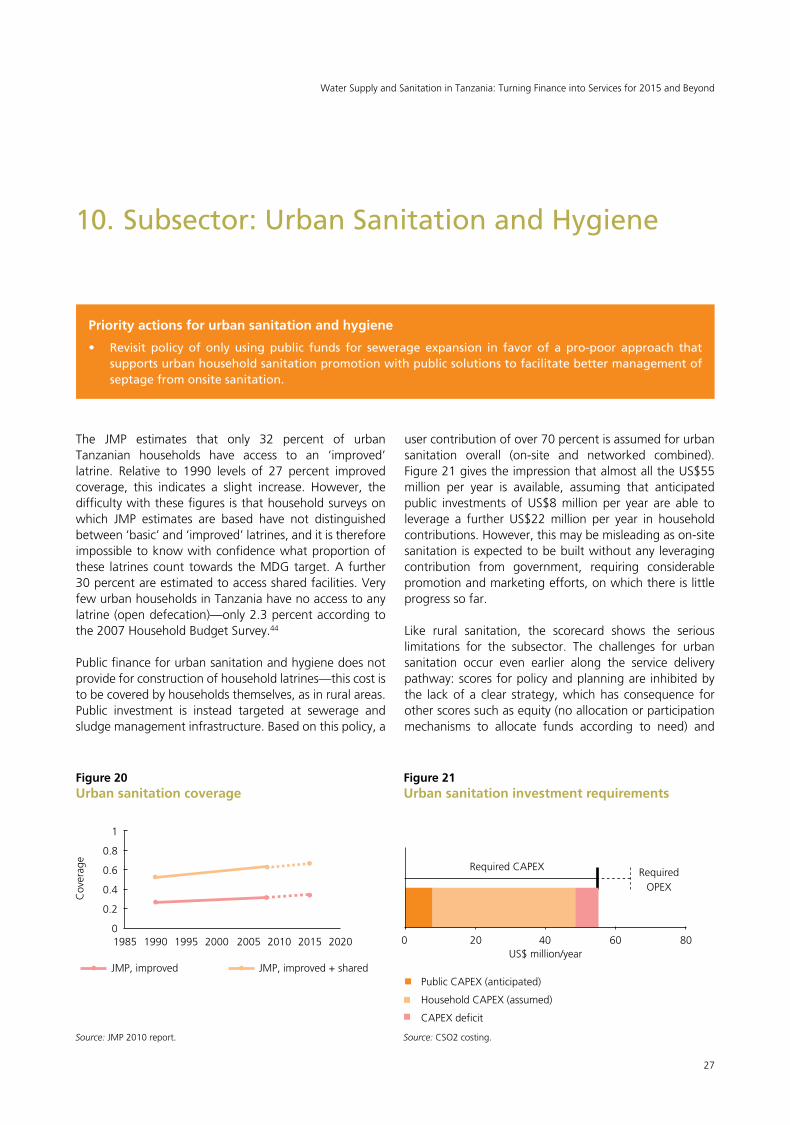
The JMP estimates that only 32 percent of urban Tanzanian households have access to an ‘improved’ latrine. Relative to 1990 levels of 27 percent improvedcoverage, this indicates a slight increase. However, the difficulty with these figures is that household surveys on which JMP estimates are based have not distinguished between ‘basic’ and ‘improved’ latrines, and it is therefore impossible to know with confidence what proportion of these latrines count towards the MDG target. A further 30 percent are estimated to access shared facilities. Very few urban households in Tanzania have no access to any latrine (open defecation)—only 2.3 percent according to the 2007 Household Budget Survey.44
Public finance for urban sanitation and hygiene does not provide for construction of household latrines—this cost is to be covered by households themselves, as in rural areas. Public investment is instead targeted at sewerage and sludge management infrastructure. Based on this policy, a
10.Subsector:UrbanSanitationandHygiene
Priority actions for urban sanitation and hygiene
• Revisit policy of only usingpublic funds for sewerage expansion in favor of a pro-poor approach thatsupportsurbanhouseholdsanitationpromotionwithpublicsolutionstofacilitatebettermanagementofseptagefromonsitesanitation.
user contribution of over 70 percent is assumed for urban sanitation overall (on-site and networked combined). Figure 21 gives the impression that almost all the US$55 million per year is available, assuming that anticipated public investments of US$8 million per year are able to leverage a further US$22 million per year in household contributions. However, this may be misleading as on-site sanitation is expected to be built without any leveraging contribution from government, requiring considerable promotion and marketing efforts, on which there is little progress so far.
Like rural sanitation, the scorecard shows the seriouslimitations for the subsector. The challenges for urban sanitation occur even earlier along the service delivery pathway: scores for policy and planning are inhibited by the lack of a clear strategy, which has consequence for other scores such as equity (no allocation or participation mechanisms to allocate funds according to need) and
Figure 21Urban sanitation investment requirements
0 20 40 60 80
RequiredCAPEX Required OPEX
US$million/year
Public CAPEX (anticipated)
Household CAPEX (assumed)
CAPEX deficit
Source: CSO2 costing.
Figure 20Urban sanitation coverage
1
0.8
0.6
0.4
0.2
01985 1990 1995 2000 2005 2010 2015 2020
JMP, improved JMP, improved + shared
Source: JMP 2010 report.
Cov
erag
e
28
An AMCOW Country Status Overview
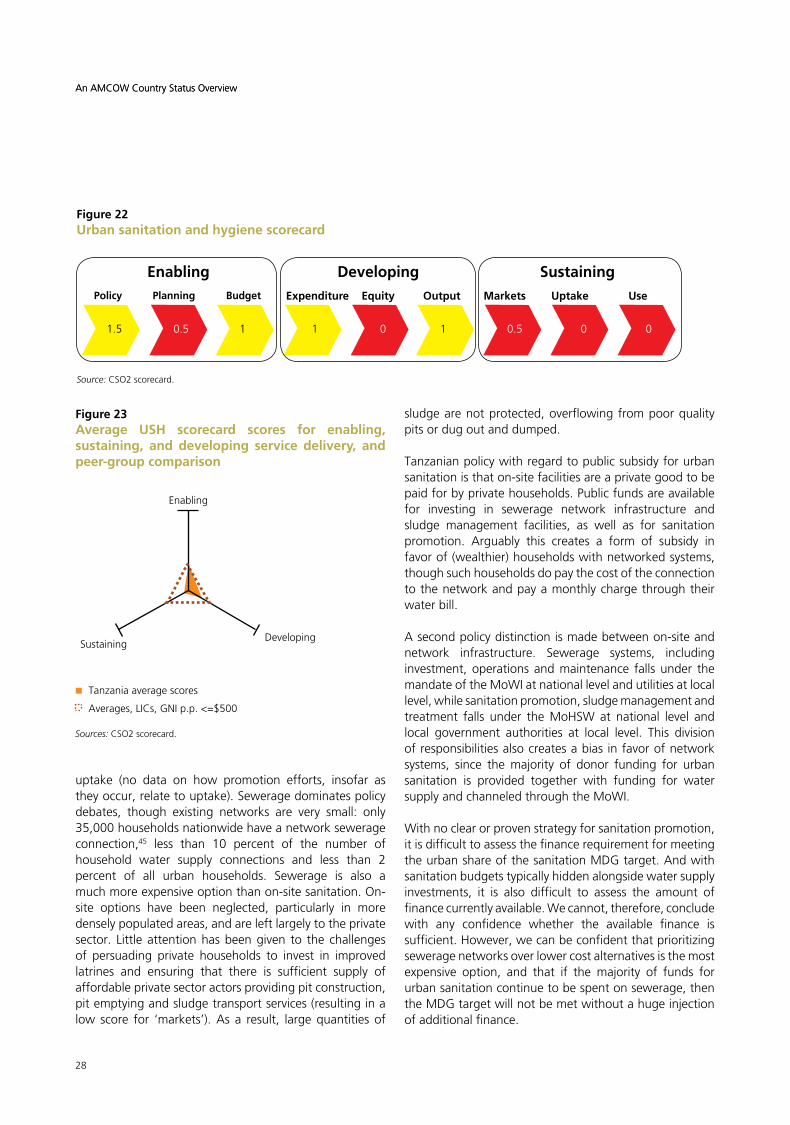
uptake (no data on how promotion efforts, insofar as they occur, relate to uptake). Sewerage dominates policy debates, though existing networks are very small: only 35,000 households nationwide have a network sewerage connection,45 less than 10 percent of the number of household water supply connections and less than 2 percent of all urban households. Sewerage is also a much more expensive option than on-site sanitation. On-site options have been neglected, particularly in more densely populated areas, and are left largely to the private sector. Littleattentionhasbeengiven to the challengesof persuading private households to invest in improved latrines and ensuring that there is sufficient supply of affordable private sector actors providing pit construction, pit emptying and sludge transport services (resulting in a low score for ‘markets’). As a result, large quantities of
sludge are not protected, overflowing from poor quality pits or dug out and dumped.
Tanzanian policy with regard to public subsidy for urban sanitation is that on-site facilities are a private good to be paid for by private households. Public funds are available for investing in sewerage network infrastructure and sludge management facilities, as well as for sanitation promotion. Arguably this creates a form of subsidy in favor of (wealthier) households with networked systems, though such households do pay the cost of the connection to the network and pay a monthly charge through their water bill.
A second policy distinction is made between on-site and network infrastructure. Sewerage systems, including investment, operations and maintenance falls under the mandate of the MoWI at national level and utilities at local level, while sanitation promotion, sludge management and treatment falls under the MoHSW at national level and local government authorities at local level. This division of responsibilities also creates a bias in favor of network systems, since the majority of donor funding for urban sanitation is provided together with funding for water supply and channeled through the MoWI.
With no clear or proven strategy for sanitation promotion, it is difficult to assess the finance requirement for meeting the urban share of the sanitation MDG target. And with sanitation budgets typically hidden alongside water supply investments, it is also difficult to assess the amount of finance currently available. We cannot, therefore, conclude with any confidence whether the available finance is sufficient. However, we can be confident that prioritizing sewerage networks over lower cost alternatives is the most expensive option, and that if the majority of funds for urban sanitation continue to be spent on sewerage, then the MDG target will not be met without a huge injection of additional finance.
Figure 22Urban sanitation and hygiene scorecard
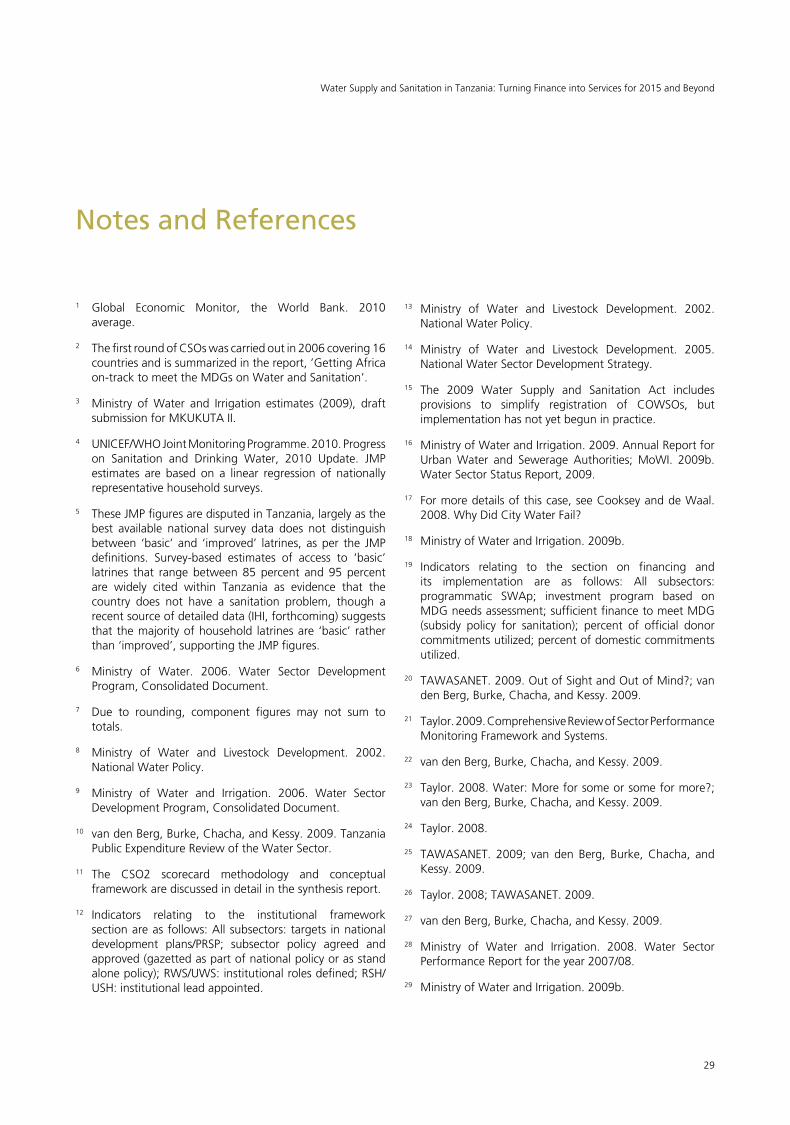
Figure 23Average USH scorecard scores for enabling, sustaining, and developing service delivery, and peer-group comparison
EnablingPolicy
1.5 0.5 1 1 0 1 0.5 0 0
Planning Budget Expenditure Equity Output Markets Uptake Use
Developing Sustaining
Enabling
Tanzania average scores
Averages,LICs,GNIp.p.<=$500
SustainingDeveloping
Sources: CSO2 scorecard.
Source: CSO2 scorecard.
An AMCOW Country Status Overview
29
Water Supply and Sanitation in Tanzania: Turning Finance into Services for 2015 and Beyond
1 Global Economic Monitor, the World Bank. 2010 average.
2 The first round of CSOs was carried out in 2006 covering 16 countries and is summarized in the report, ’Getting Africa on-track to meet the MDGs on Water and Sanitation’.
3 Ministry of Water and Irrigation estimates (2009), draft submission for MKUKUTA II.
4 UNICEF/WHOJointMonitoringProgramme.2010.Progresson Sanitation and Drinking Water, 2010 Update. JMP estimates are based on a linear regression of nationally representative household surveys.
5 These JMP figures are disputed in Tanzania, largely as the best available national survey data does not distinguish between ‘basic’ and ‘improved’ latrines, as per the JMP definitions. Survey-based estimates of access to ‘basic’ latrines that range between 85 percent and 95 percent are widely cited within Tanzania as evidence that the country does not have a sanitation problem, though a recent source of detailed data (IHI, forthcoming) suggests that the majority of household latrines are ‘basic’ rather than ‘improved’, supporting the JMP figures.
6 Ministry of Water. 2006. Water Sector Development Program, Consolidated Document.
7 Due to rounding, component figures may not sum to totals.
8 Ministry of Water and Livestock Development. 2002.NationalWaterPolicy.
9 Ministry of Water and Irrigation. 2006. Water Sector Development Program, Consolidated Document.
10 van den Berg, Burke, Chacha, and Kessy. 2009. Tanzania PublicExpenditureReviewoftheWaterSector.
11 The CSO2 scorecard methodology and conceptual framework are discussed in detail in the synthesis report.
12 Indicators relating to the institutional framework section are as follows: All subsectors: targets in national development plans/PRSP; subsector policy agreed andapproved (gazetted as part of national policy or as stand alonepolicy);RWS/UWS:institutionalrolesdefined;RSH/USH: institutional lead appointed.
NotesandReferences
13 Ministry of Water and Livestock Development. 2002.NationalWaterPolicy.
14 Ministry of Water and Livestock Development. 2005.NationalWaterSectorDevelopmentStrategy.
15 The 2009 Water Supply and Sanitation Act includes provisions to simplify registration of COWSOs, but implementation has not yet begun in practice.
16 MinistryofWaterandIrrigation.2009.AnnualReportforUrban Water and Sewerage Authorities; MoWI. 2009b. WaterSectorStatusReport,2009.
17 For more details of this case, see Cooksey and de Waal. 2008. Why Did City Water Fail?
18 Ministry of Water and Irrigation. 2009b.
19 Indicators relating to the section on financing and its implementation are as follows: All subsectors: programmatic SWAp; investment program based on MDG needs assessment; sufficient finance to meet MDG (subsidy policy for sanitation); percent of official donor commitments utilized; percent of domestic commitments utilized.
20 TAWASANET.2009.OutofSightandOutofMind?;vanden Berg, Burke, Chacha, and Kessy. 2009.
21 Taylor.2009.ComprehensiveReviewofSectorPerformanceMonitoring Framework and Systems.
22 van den Berg, Burke, Chacha, and Kessy. 2009.
23 Taylor. 2008. Water: More for some or some for more?; van den Berg, Burke, Chacha, and Kessy. 2009.
24 Taylor. 2008.
25 TAWASANET. 2009; van den Berg, Burke, Chacha, andKessy. 2009.
26 Taylor.2008;TAWASANET.2009.
27 van den Berg, Burke, Chacha, and Kessy. 2009.
28 Ministry of Water and Irrigation. 2008. Water Sector PerformanceReportfortheyear2007/08.
29 Ministry of Water and Irrigation. 2009b.

An AMCOW Country Status Overview
30 Indicators relating to the sector M&E section are as follows: All subsectors: annual review setting new undertakings; subsector spend identifiable in budget (UWS: inc. recurrent subsidies);budgetcomprehensivelycoversdomestic/donorfinance;RWS,RSH,andUSH:domestic/donorexpenditurereported; UWS: audited accounts and balance sheets from utilities; RWS, RSH, and USH: periodic analysis ofequity criteria by CSOs and government; UWS: pro-poor plansdevelopedandimplementedbyutilities;RWS/UWS:nationally consolidated reporting of output; RSH/USH:monitoring of quantity and quality of uptake relative to promotion and subsidy efforts; all subsectors: questions and choice options in household surveys consistent with MDG definitions.
31 Taylor. 2009.
32 Ministry of Water and Irrigation. 2009b.
33 Taylor. 2008.
34 TAWASANET.2009.
35 TAWASANET.2009.
36 Taylor. 2008.
37 WaterAid Tanzania. 2009. Management for sustainability: Practical lessons from three studies on the management of rural water supply schemes.
38 WaterAid Tanzania. 2009.
39 van den Berg, Burke, Chacha, and Kessy. 2009.
40 Mfungo and Taylor. 2008. Mapping public water kiosks in Dar es Salaam.
41 Ministry of Water and Irrigation. 2009b.
42 NBS.2009.2007HouseholdBudgetSurvey.
43 IHI (forthcoming). Baseline Study for UNICEF/GoTinterventions in the seven learning districts (and six non-learning districts).
44 NBS.2009.
45 MoWI. 2009b.
30

Notes

Notes

For enquiries, contact:Water and Sanitation Program–Africa RegionThe World Bank, Upper Hill RoadP.O. Box 30577, 00100, Nairobi, KenyaTel : +(254) 20 322 6300 E-mail : [email protected] site : www.wsp.org